Embed Size (px)
Citation preview

Steel Lake/ Star Lake Area: 026
Residential Revalue for 2018 Assessment Roll
Department of Assessments Setting values, serving the community, and pursuing excellence
500 Fourth Avenue, ADM-AS 0708 Seattle, WA 98104-2384
OFFICE (206) 296-7300 FAX (206) 296-0595
Email: [email protected] http://www.kingcounty.gov/assessor/

Area 026 1
2018 Annual Update Department of Assessments
Department of Assessments
500 Fourth Avenue, ADM-AS-0708
Seattle, WA 98104-2384
OFFICE: (206) 296-7300 FAX (206) 296-0595
Email: [email protected]
http://www.kingcounty.gov/assessor/
Dear Property Owners,
Our field appraisers work hard throughout the year to visit properties in neighborhoods across King County. As a
result, new commercial and residential valuation notices are mailed as values are completed. We value your
property at its “true and fair value” reflecting its highest and best use as prescribed by state law (RCW 84.40.030;
WAC 458-07-030).
We continue to work hard to implement your feedback and ensure we provide you accurate and timely
information. We have made significant improvements to our website and online tools to make interacting with us
easier. The following report summarizes the results of the assessments for your area along with a map.
Additionally, I have provided a brief tutorial of our property assessment process. It is meant to provide you with
the background information about our process and the basis for the assessments in your area.
Fairness, accuracy and transparency set the foundation for effective and accountable government. I am pleased to
continue to incorporate your input as we make ongoing improvements to serve you. Our goal is to ensure every
taxpayer is treated fairly and equitably.
Our office is here to serve you. Please don’t hesitate to contact us if you ever have any questions, comments or
concerns about the property assessment process and how it relates to your property.
In Service,
John Wilson
King County Assessor
John Wilson Assessor

Area 026 2
2018 Annual Update Department of Assessments
How Property Is Valued
King County along with Washington’s 38 other counties use mass appraisal techniques to value all real property each year for property assessment purposes.
What Are Mass Appraisal Techniques?
In King County the Mass Appraisal process incorporates statistical testing, generally accepted valuation methods, and a set of property characteristics for approximately 700,000 residential, commercial and industrial properties. More specifically for residential property, we break up King County into 86 residential market areas and annually develop market models from the sale of properties using multiple regression statistical tools. The results of the market models are then applied to all similarly situated homes within the same appraisal area.
Are Properties Inspected? All property in King County is physically inspection at least once during each six year cycle. Each year our appraisers inspect a different geographic area. An inspection is frequently an external observation of the property to confirm whether the property has changed by adding new improvements or shows signs of deterioration more than normal for the property’s age. From the property inspections we update our property assessment records for each property. In cases where an appraiser has a question, they will approach the residence front door to make contact with the property owner or leave a card requesting the taxpayer contact them.
RCW 84.40.025 - Access to property
For the purpose of assessment and valuation of all taxable property in each county, any real or personal property in each county shall be subject to visitation, investigation, examination, discovery, and listing at any reasonable time by the county assessor of the county or by any employee thereof designated for this purpose by the assessor. In any case of refusal to such access, the assessor shall request assistance from the department of revenue which may invoke the power granted by chapter 84.08 RCW.
How Are Property Sales Used? For the annual revaluation of residential properties, three years of sales are analyzed with the sales prices time adjusted to January 1 of the current assessment year. Sales prices are adjusted for time to reflect that market prices change over time. During an increasing market, older sales prices often understate the current market value. Conversely, during downward (or recessionary) markets, older sales prices may overstate a property’s value on January 1 of the assessment year unless sales are time adjusted. Hence time adjustments are an important element in the valuation process.
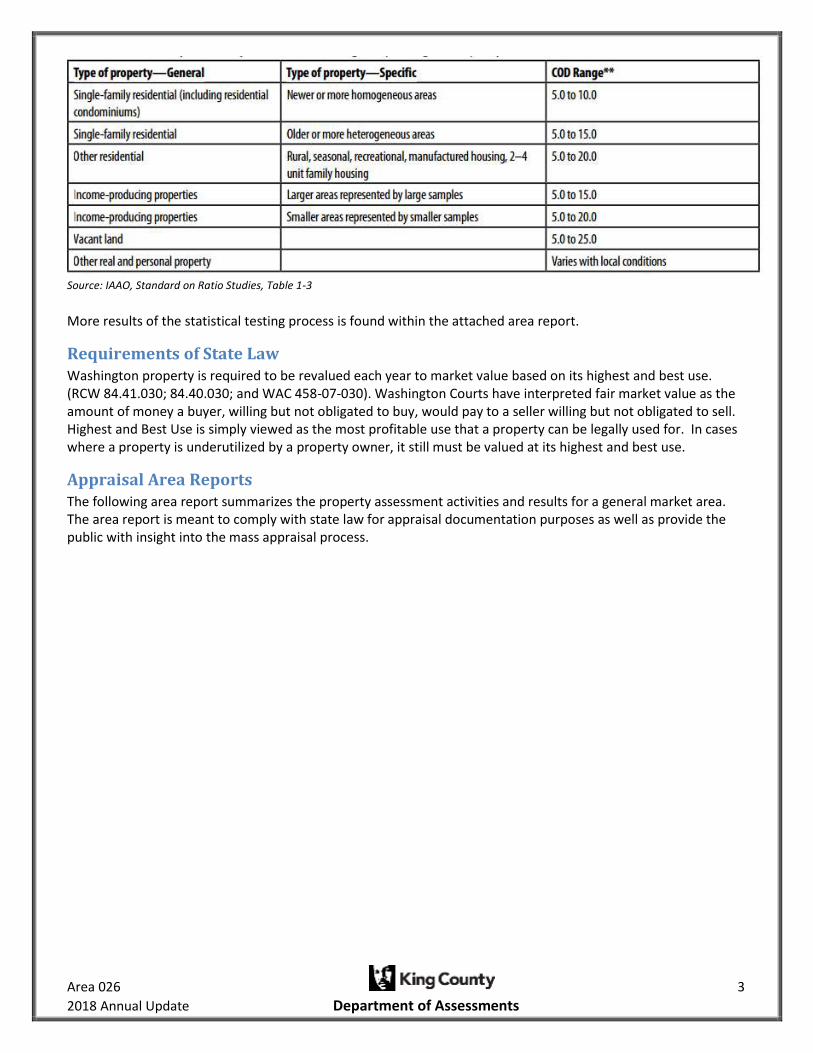
How is Assessment Uniformity Achieved? We have adopted the Property Assessment Standards prescribed by the International Association of Assessing Officers that may be reviewed at www.IAAO.org. As part of our valuation process statistical testing is performed by reviewing the uniformity of assessments within each specific market area, property type, and quality grade or residence age. More specifically Coefficients of Dispersion (aka COD) are developed that show the uniformity of predicted property assessments. We have set our target CODs using the standards set by IAAO which are summarized in the following table:
Area 026 3
2018 Annual Update Department of Assessments
Source: IAAO, Standard on Ratio Studies, Table 1-3
More results of the statistical testing process is found within the attached area report.
Requirements of State Law Washington property is required to be revalued each year to market value based on its highest and best use. (RCW 84.41.030; 84.40.030; and WAC 458-07-030). Washington Courts have interpreted fair market value as the amount of money a buyer, willing but not obligated to buy, would pay to a seller willing but not obligated to sell. Highest and Best Use is simply viewed as the most profitable use that a property can be legally used for. In cases where a property is underutilized by a property owner, it still must be valued at its highest and best use.
Appraisal Area Reports The following area report summarizes the property assessment activities and results for a general market area. The area report is meant to comply with state law for appraisal documentation purposes as well as provide the public with insight into the mass appraisal process.

Area 026 4
2018 Annual Update Department of Assessments
Department of Assessments King County Administration Bldg. 500 Fourth Avenue, ADM-AS-0708 Seattle, WA 98104-2384
Steel Lake/ Star Lake – Area 026 2018 Assessment Roll Year
Recommendation is made to post values for Area 026 to the 2019 tax roll:
02/22/2018
Appraiser II: Adam Neel Date
02-28-18
SW District Senior Appraiser: Randy Raven Date
2/28/18
Residential Division Director: Debra S. Prins Date
This report is hereby accepted and the values described in the attached documentation for
Area 026 should be posted to the 2019 tax roll.
5/11/2018
John Wilson, King County Assessor Date
John Wilson Assessor

Area 026 5
2018 Annual Update Department of Assessments
Executive Summary Steel Lake/ Star Lake - Area 026
Annual Update Characteristics Based Market Adjustment for 2018 Assessment Roll
Appraisal Date: 1/1/2018 Previous Physical Inspection: 2016 Number of Improved Sales: 802 Range of Sale Dates: 1/1/2015 – 12/31/2017 Sales were time adjusted to 1/1/2018
Sales - Improved Valuation Change Summary:
Land Improvements Total Mean Sale Price Ratio COD
2017 Value $99,700 $229,600 $329,300 5.70%
2018 Value $99,700 $262,400 $362,100 $393,100 92.5% 5.61%
$ Change +$0 +$32,800 +$32,800
% Change +0.0% +14.3% +10.0%
Coefficient of Dispersion (COD) is a measure of the uniformity of the predicted assessed values for properties within this geographic area. The 2018 COD of 5.61% is an improvement from the previous COD of 5.70%. The lower the COD, the more uniform are the predicted assessed values. Assessment standards prescribed by the International Association of Assessing Officers identify that the COD in rural or diverse neighborhoods should be no more than 20%. The resulting COD meets or exceeds the industry assessment standards.
Population - Improved Valuation Change Summary:
Land Improvements Total
2017 Value $100,200 $220,700 $320,900
2018 Value $100,200 $254,000 $354,200
$ Change +$0 +$33,300 +$33,300
% Change +0.0% +15.1% +10.4%
Number of one to three unit residences in the population: 5,922
Summary of Findings: The analysis for this area consisted of a general review of applicable characteristics, such
as: grade, age, condition, stories, living area, views, waterfront, lot size, land problems and neighborhoods. The
analysis results showed that one characteristic-based variable needed to be included in the valuation formula in
order to improve the uniformity of assessments throughout the area. Homes built or renovated after 1999, were
generally at higher assessment levels than the rest of the population, requiring a lesser upward adjustment. This
annual update valuation model corrects for these strata differences.

Area 026 6
2018 Annual Update Department of Assessments
Area 026 - Overview Map
All maps in this document are subject to the following disclaimer: The information included on this map has been compiled by King County staff from a variety of sources and is subject to change without notice. King County makes no representations or warranties, express or implied, as to accuracy, completeness, timeliness, or
rights to the use of such information. King County shall not be liable for any general, special, indirect, incidental, or consequential damages including, but not limited to, lost revenues or lost profits resulting from the use or misuse of the information contained on this map. Any sale of this map or information on this map is
prohibited except by written permission of King County
Area 026 7
2018 Annual Update Department of Assessments
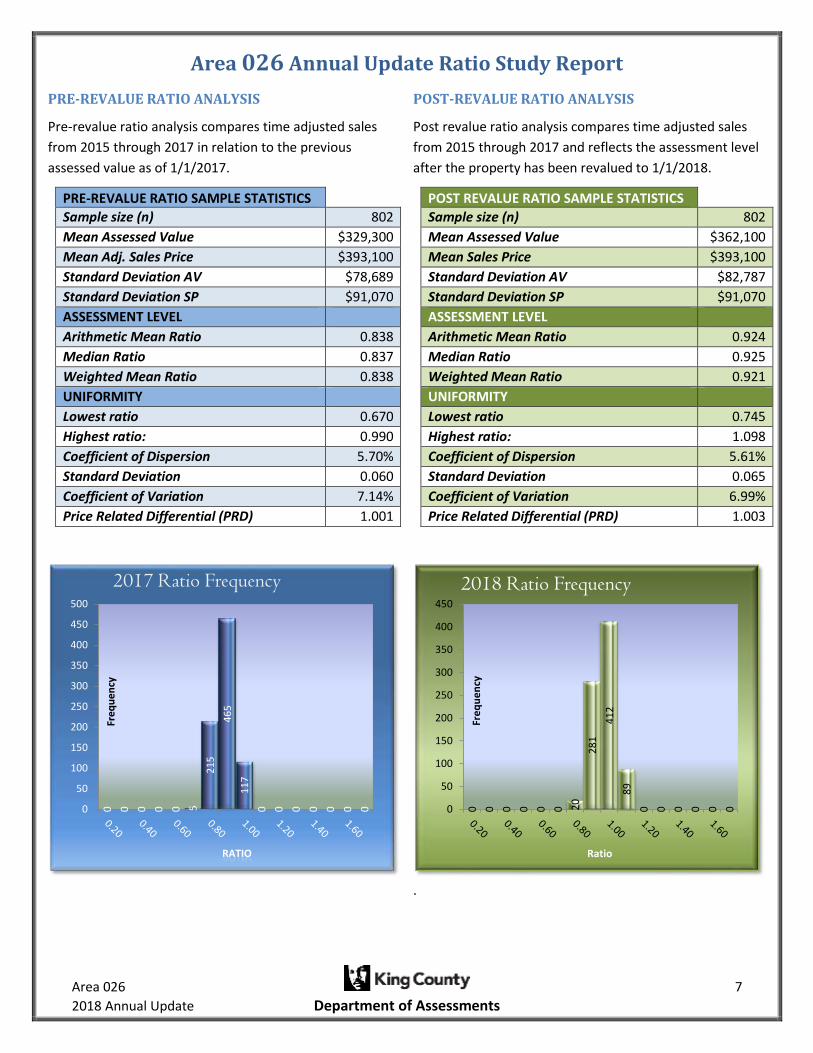
Area 026 Annual Update Ratio Study Report
PRE-REVALUE RATIO ANALYSIS
Pre-revalue ratio analysis compares time adjusted sales
from 2015 through 2017 in relation to the previous
assessed value as of 1/1/2017.
PRE-REVALUE RATIO SAMPLE STATISTICS
Sample size (n) 802
Mean Assessed Value $329,300
Mean Adj. Sales Price $393,100
Standard Deviation AV $78,689
Standard Deviation SP $91,070
ASSESSMENT LEVEL
Arithmetic Mean Ratio 0.838
Median Ratio 0.837
Weighted Mean Ratio 0.838
UNIFORMITY
Lowest ratio 0.670
Highest ratio: 0.990
Coefficient of Dispersion 5.70%
Standard Deviation 0.060
Coefficient of Variation 7.14%
Price Related Differential (PRD) 1.001
POST-REVALUE RATIO ANALYSIS
Post revalue ratio analysis compares time adjusted sales
from 2015 through 2017 and reflects the assessment level
after the property has been revalued to 1/1/2018.
POST REVALUE RATIO SAMPLE STATISTICS
Sample size (n) 802
Mean Assessed Value $362,100
Mean Sales Price $393,100
Standard Deviation AV $82,787
Standard Deviation SP $91,070
ASSESSMENT LEVEL
Arithmetic Mean Ratio 0.924
Median Ratio 0.925
Weighted Mean Ratio 0.921
UNIFORMITY
Lowest ratio 0.745
Highest ratio: 1.098
Coefficient of Dispersion 5.61%
Standard Deviation 0.065
Coefficient of Variation 6.99%
Price Related Differential (PRD) 1.003
.
0 0 0 0 0 5
21
5
46
5
11
7
0 0 0 0 0 0 00
50
100
150
200
250
300
350
400
450
500
Fre
qu
en
cy
RATIO
2017 Ratio Frequency
0 0 0 0 0 0 20
28
1
41
2
89
0 0 0 0 0 00
50
100
150
200
250
300
350
400
450
Fre
qu
en
cy
Ratio
2018 Ratio Frequency
Area 026 8
2018 Annual Update Department of Assessments
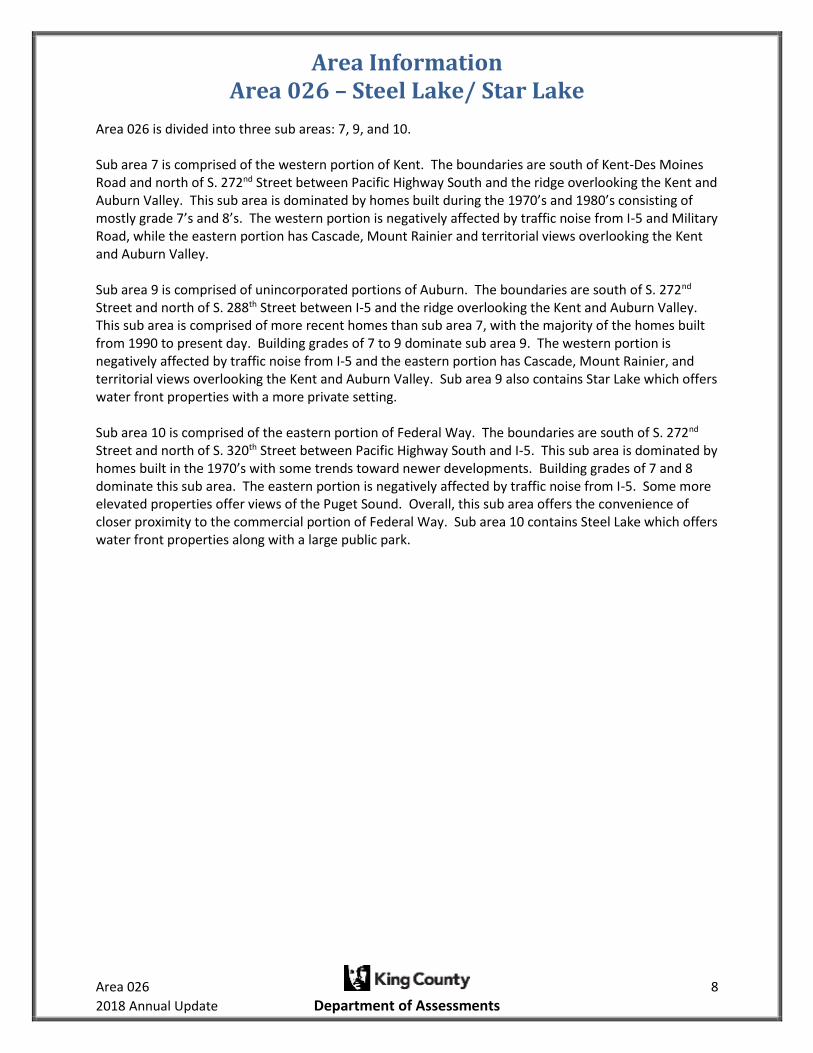
Area Information Area 026 – Steel Lake/ Star Lake
Area 026 is divided into three sub areas: 7, 9, and 10. Sub area 7 is comprised of the western portion of Kent. The boundaries are south of Kent-Des Moines Road and north of S. 272nd Street between Pacific Highway South and the ridge overlooking the Kent and Auburn Valley. This sub area is dominated by homes built during the 1970’s and 1980’s consisting of mostly grade 7’s and 8’s. The western portion is negatively affected by traffic noise from I-5 and Military Road, while the eastern portion has Cascade, Mount Rainier and territorial views overlooking the Kent and Auburn Valley. Sub area 9 is comprised of unincorporated portions of Auburn. The boundaries are south of S. 272nd Street and north of S. 288th Street between I-5 and the ridge overlooking the Kent and Auburn Valley. This sub area is comprised of more recent homes than sub area 7, with the majority of the homes built from 1990 to present day. Building grades of 7 to 9 dominate sub area 9. The western portion is negatively affected by traffic noise from I-5 and the eastern portion has Cascade, Mount Rainier, and territorial views overlooking the Kent and Auburn Valley. Sub area 9 also contains Star Lake which offers water front properties with a more private setting. Sub area 10 is comprised of the eastern portion of Federal Way. The boundaries are south of S. 272nd Street and north of S. 320th Street between Pacific Highway South and I-5. This sub area is dominated by homes built in the 1970’s with some trends toward newer developments. Building grades of 7 and 8 dominate this sub area. The eastern portion is negatively affected by traffic noise from I-5. Some more elevated properties offer views of the Puget Sound. Overall, this sub area offers the convenience of closer proximity to the commercial portion of Federal Way. Sub area 10 contains Steel Lake which offers water front properties along with a large public park.

Area 026 9
2018 Annual Update Department of Assessments
Area 026 - Model Adjustments 1-3 Unit Residences
2018 Total Value = 2017 Total Value + Overall (+/-) Characteristic Adjustments
Standard Area Adjustment # Parcels Adjusted % of Population +11.28% 5,161 87%
Due to truncating the coefficient values used to develop the percentages and further rounding of the
percentages in this table, the results you will obtain are an approximation of adjustment achieved in
production.
The percentages listed in the following table are total adjustments, not additive adjustments.
Model Variable Adj % # Sales # in Pop % Rep
New Year Built/ Renovated +6.78% 163 761 21%
There were no properties that would receive a multiple variable adjustment.
Generally, Homes built or renovated after 1999 were at a higher assessment level than the rest of the
population, requiring a lesser upward adjustment. This model corrects for these strata differences.
Area 026 10
2018 Annual Update Department of Assessments
Annual Update Process
Effective Date of Appraisal: January 1, 2018 Date of Appraisal Report: February 22, 2018
Sales Screening for Improved Parcel Analysis In order to ensure that the Assessor’s analysis of sales of improved properties best reflects the market value of the majority of the properties within an area, non-typical properties must be removed so a representative sales sample can be analyzed to determine the new valuation level. The following list illustrates examples of non-typical properties which are removed prior to the beginning of the analysis.
1. Vacant parcels 2. Mobile Home parcels 3. Multi-Parcel or Multi Building parcels 4. New construction where less than a 100% complete house was assessed for 2017 5. Existing residences where the data for 2017 is significantly different than the data for 2018 due
to remodeling 6. Parcels with improvement values, but no characteristics 7. Parcels with either land or improvement values of $25,000 or less posted for the 2017
Assessment Roll 8. Short sales, financial institution re-sales and foreclosure sales verified or appearing to be not at
market (Available sales and additional Area information can be viewed from sales lists, eSales and Localscape)
Land Update
Analysis indicates land values are at or below current market levels as of 1/1/2018. No additional adjustment to land value is required.
Improved Parcel Update
The analysis for this area consisted of a general review of applicable characteristics, such as: grade, age,
condition, stories, living area, views, waterfront, lot size, land problems and neighborhoods. The analysis
results showed that one characteristic-based variable needed to be included in the valuation formula in
order to improve the uniformity of assessments throughout the area. Homes built or renovated after
1999, were generally at higher assessment levels than the rest of the population, requiring a lesser
upward adjustment. This annual update valuation model corrects for these strata differences.
With the exception of real property mobile home parcels and parcels with “accessory only” improvements, the new recommended values on all improved parcels were based on the analysis of the 802 useable residential sales in the area. Sales used in the valuation model were time adjusted to January 1, 2018. The chosen adjustment model was developed using multiple regression. An explanatory adjustment table is included in this report. The derived adjustment formula is:
Area 026 11
2018 Annual Update Department of Assessments
2018 Total Value = 2017 Total Value *(1-0.075)/ (.831217140645766 + 0.0350400112258751 * NewYrBltRen) The resulting total value is truncated to the next $1,000, then:
2018 Improvements Value = 2018 Total Value minus 2018 Land Value
Mobile Home Update
There were an insufficient number of mobile home sales (8) within Area 026; therefore, mobile homes received the Total % Change indicated by the sales sample as reflected on the Executive Summary page of +10.0%. The adjustment formula is:
2018 Total Value = 2017 Total Value * 1.100 2018 Improvements Value = 2018 Total Value minus 2018 Land Value
Results
The assessment level target for all areas in King County, including this area, is 0.925. The actual assessment level for this area is 0.925. The standard statistical measures of valuation performance are all within the IAAO recommended range of 0.90 to 1.10. Application of these recommended values for the 2018 assessment year (taxes payable in 2019) results in an average total change from the 2017 assessments of +10.4%. This increase is due partly to market changes over time and the previous assessment levels. Note: Additional information may reside in the Assessor’s Real Property Database, Assessor’s procedures, Revalue Plan, separate studies, and statutes.
Exceptions:
If multiple houses exist on a parcel, the Total % Change indicated by the sales sample is used to arrive at the new total value (Previous Year Land Value + Previous Year Improvement Value) * 1.100.
If the site is improved with a house and mobile home, the formula derived from the house is used to arrive at new total value.
If “accessory improvements only”, 2018 Land Value + (Previous Year Improvement Value * 1.00).
If adjusted land value falls < $1,000, then land value = $1,000 or previous, whichever is less.
* adjusted improvement value falls < $10,000, then improvement value = $10,000 or previous, whichever is less.
If land value <= $10,000 no adjustment is applied.
If improvements and accessories <= $10,000 no further adjustment applied.
If vacant parcel (no improvement value), the land adjustment applies.
If a parcel is coded “non-perc” (sewer system=3 or 4), there is no change from previous land value.
If a parcel is coded “unbuildable” = 1, there is no change from previous land value.
If a parcel is coded water district private restricted, or public restricted, there is no change from previous land value.
If an improvement is coded “% net condition” or is in “poor” condition, then there is no change from previous improvement value, only the land adjustment applies.
Any properties excluded from the annual up-date process are noted in RealProperty.
*Amended 8/24/2018

Area 026 12
2018 Annual Update Department of Assessments
Sales Sample Representation of Population Year Built or Renovated
Sales Sample
Year Built/Ren Frequency % Sales Sample
1900-1909 0 0.00%
1910-1919 1 0.12%
1920-1929 1 0.12%
1930-1939 8 1.00%
1940-1949 7 0.87%
1950-1959 59 7.36%
1960-1969 292 36.41%
1970-1979 114 14.21%
1980-1989 96 11.97%
1990-1999 68 8.48%
2000-2009 84 10.47%
2010-2017 72 8.98%
802
Population
Year Built/Ren Frequency % Population
1900-1909 1 0.02%
1910-1919 7 0.12%
1920-1929 10 0.17%
1930-1939 48 0.81%
1940-1949 121 2.04%
1950-1959 482 8.14%
1960-1969 2,235 37.74%
1970-1979 939 15.86%
1980-1989 820 13.85%
1990-1999 555 9.37%
2000-2009 514 8.68%
2010-2017 190 3.21%
5,922
Sales of new homes built over the last few years are over represented in this sample.
This is a common occurrence due to the fact that most new homes will sell shortly after completion. This
over representation was found to have statistical significance and results are reflected in the model.
0.00%
5.00%
10.00%
15.00%
20.00%
25.00%
30.00%
35.00%
40.00%
Year Built/ Renovate
% Sales Sample
% Population
Area 026 13
2018 Annual Update Department of Assessments
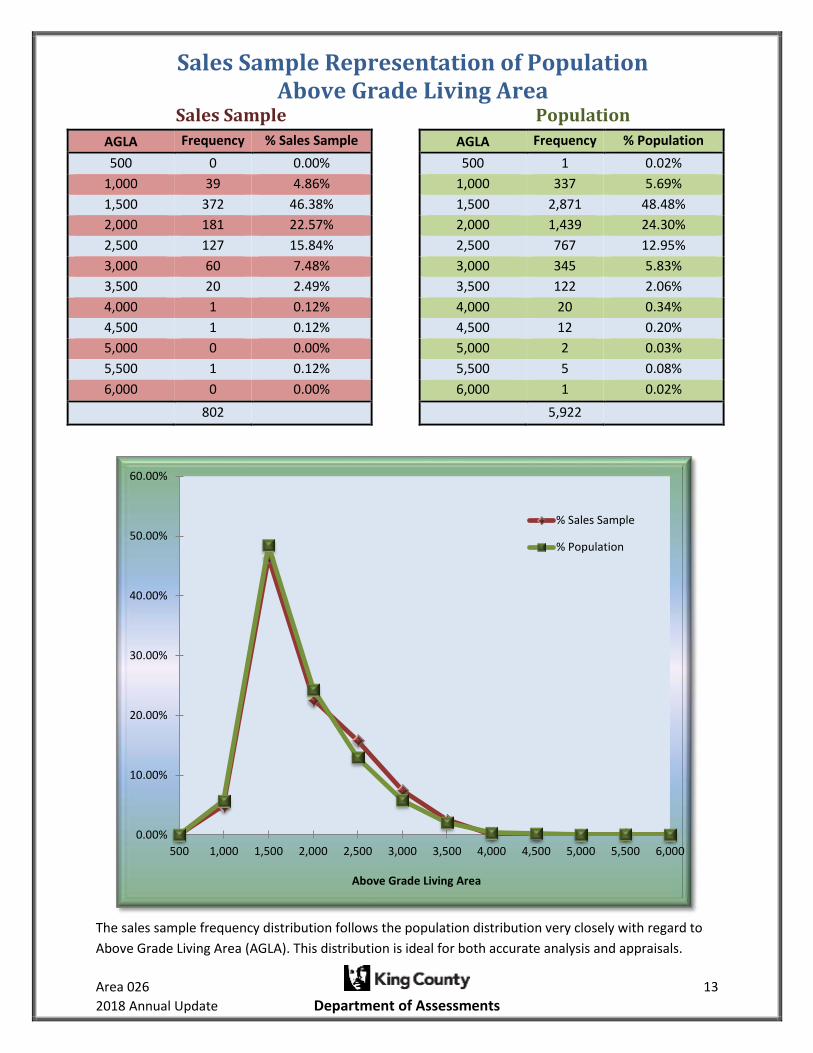
Sales Sample Representation of Population Above Grade Living Area
Sales Sample
AGLA Frequency % Sales Sample
500 0 0.00%
1,000 39 4.86%
1,500 372 46.38%
2,000 181 22.57%
2,500 127 15.84%
3,000 60 7.48%
3,500 20 2.49%
4,000 1 0.12%
4,500 1 0.12%
5,000 0 0.00%
5,500 1 0.12%
6,000 0 0.00%
802
Population
AGLA Frequency % Population
500 1 0.02%
1,000 337 5.69%
1,500 2,871 48.48%
2,000 1,439 24.30%
2,500 767 12.95%
3,000 345 5.83%
3,500 122 2.06%
4,000 20 0.34%
4,500 12 0.20%
5,000 2 0.03%
5,500 5 0.08%
6,000 1 0.02%
5,922
The sales sample frequency distribution follows the population distribution very closely with regard to
Above Grade Living Area (AGLA). This distribution is ideal for both accurate analysis and appraisals.
0.00%
10.00%
20.00%
30.00%
40.00%
50.00%
60.00%
500 1,000 1,500 2,000 2,500 3,000 3,500 4,000 4,500 5,000 5,500 6,000
Above Grade Living Area
% Sales Sample
% Population

Area 026 14
2018 Annual Update Department of Assessments
Sales Sample Representation of Population Building Grade
Sales Sample
Grade Frequency % Sales Sample
1 0 0.00%
2 0 0.00%
3 0 0.00%
4 1 0.12%
5 1 0.12%
6 36 4.49%
7 431 53.74%
8 279 34.79%
9 50 6.23%
10 3 0.37%
11 1 0.12%
12 0 0.00%
13 0 0.00%
802
Population
Grade Frequency % Population
1 0 0.00%
2 0 0.00%
3 0 0.00%
4 8 0.14%
5 27 0.46%
6 231 3.90%
7 3,497 59.05%
8 1,793 30.28%
9 321 5.42%
10 40 0.68%
11 5 0.08%
12 0 0.00%
13 0 0.00%
5,922
The sales sample frequency distribution follows the population distribution very closely with regard to
Building Grades. This distribution is ideal for both accurate analysis and appraisals.
0.00%
10.00%
20.00%
30.00%
40.00%
50.00%
60.00%
70.00%
1 2 3 4 5 6 7 8 9 10 11 12 13Grade
% Sales Sample
% Population

Area 026 15
2018 Annual Update Department of Assessments
Area 026 Market Value Changes Over Time
In a changing market, recognition of a sales trend to adjust a population of sold properties to a common date is required to allow for value differences over time between a range of sales dates and the assessment date. The following chart shows the % time adjustment required for sales to reflect the indicated market value as of the assessment date, January 1, 2018. For example, a sale of $475,000 which occurred on October 1, 2016 would be adjusted by the time trend factor of 1.115, resulting in an adjusted value of $529,000 ($475,000 * 1.115=$529,625) – truncated to the nearest $1000.
SaleDate Adjustment (Factor) Equivalent Percent
1/1/2015 1.360 36.0%
2/1/2015 1.346 34.6%
3/1/2015 1.334 33.4%
4/1/2015 1.320 32.0%
5/1/2015 1.307 30.7%
6/1/2015 1.293 29.3%
7/1/2015 1.281 28.1%
8/1/2015 1.268 26.8%
9/1/2015 1.255 25.5%
10/1/2015 1.243 24.3%
11/1/2015 1.231 23.1%
12/1/2015 1.219 21.9%
1/1/2016 1.208 20.8%
2/1/2016 1.196 19.6%
3/1/2016 1.186 18.6%
4/1/2016 1.175 17.5%
5/1/2016 1.164 16.4%
6/1/2016 1.154 15.4%
7/1/2016 1.144 14.4%
8/1/2016 1.134 13.4%
9/1/2016 1.124 12.4%
10/1/2016 1.115 11.5%
11/1/2016 1.105 10.5%
12/1/2016 1.096 9.6%
1/1/2017 1.087 8.7%
2/1/2017 1.079 7.9%
3/1/2017 1.071 7.1%
4/1/2017 1.063 6.3%
5/1/2017 1.055 5.5%
6/1/2017 1.047 4.7%
7/1/2017 1.040 4.0%
8/1/2017 1.033 3.3%
9/1/2017 1.026 2.6%
10/1/2017 1.019 1.9%
11/1/2017 1.012 1.2%
12/1/2017 1.006 0.6%
1/1/2018 1.000 0.0%
Area 026 16
2018 Annual Update Department of Assessments
The time adjustment formula for Area 026 is: (.831217140645766 + 0.0350400112258751 * 0.2032419 - 0.000163268205012085 * SaleDay + 1.02580404196826E-07 * SaleDaySq) / (.831217140645766 + 0.0350400112258751 * 0.2032419) SaleDay = SaleDate - 43101
SaleDaySq = (SaleDate – 43101)^2

Area 026 17
2018 Annual Update Department of Assessments
Area 026 Housing Profile
Grade 4/ Year Built 1948/ Total Living Area 600sf
Grade 6/ Year Built 1957/ Total Living Area 1,140sf
Grade 8/ Year Built 1993/ Total Living Area 2,140sf
Grade 5/ Year Built 1945/ Total Living Area 800sf
Grade 7/ Year Built 1978/ Total Living Area 2,020sf
Grade 9/ Year Built 1995/ Total Living Area 2,730sf

Area 026 18
2018 Annual Update Department of Assessments
Grade 10/ Year Built 1990/ Total Living Area 3,920sf Grade 11/ Year Built 2007/ Total Living Area 5,440sf

Area 026 19
2018 Annual Update Department of Assessments
Glossary for Improved Sales
Condition: Relative to Age and Grade 1= Poor Many repairs needed. Showing serious deterioration. 2= Fair Some repairs needed immediately. Much deferred maintenance. 3= Average Depending upon age of improvement; normal amount of upkeep for the age of the home. 4= Good Condition above the norm for the age of the home. Indicates extra attention and care has been taken to maintain. 5= Very Good Excellent maintenance and updating on home. Not a total renovation.
Residential Building Grades Grades 1 - 3 Falls short of minimum building standards. Normally cabin or inferior structure. Grade 4 Generally older low quality construction. Does not meet code. Grade 5 Lower construction costs and workmanship. Small, simple design. Grade 6 Lowest grade currently meeting building codes. Low quality materials, simple designs. Grade 7 Average grade of construction and design. Commonly seen in plats and older subdivisions. Grade 8 Just above average in construction and design. Usually better materials in both the exterior and interior finishes. Grade 9 Better architectural design, with extra exterior and interior design and quality. Grade 10 Homes of this quality generally have high quality features. Finish work is better, and more design quality is seen in the floor plans and larger square footage. Grade 11 Custom design and higher quality finish work, with added amenities of solid woods, bathroom fixtures and more luxurious options. Grade 12 Custom design and excellent builders. All materials are of the highest quality and all conveniences are present. Grade 13 Generally custom designed and built. Approaching the Mansion level. Large amount of highest quality cabinet work, wood trim and marble; large entries.

Area 026 20
2018 Annual Update Department of Assessments
Uniform Standards of Professional Appraisal Practice Compliance
Client and Intended Use of the Appraisal:
This mass appraisal report is intended for use by the public, King County Assessor and other agencies or departments administering or confirming ad valorem property taxes. Use of this report by others for other purposes is not intended by the appraiser. The use of this appraisal, analyses and conclusions is limited to the administration of ad valorem property taxes in accordance with Washington State law. As such it is written in concise form to minimize paperwork. The assessor intends that this report conform to the Uniform Standards of Professional Appraisal Practice (USPAP) requirements for a mass appraisal report as stated in USPAP SR 6-8. To fully understand this report the reader may need to refer to the Assessor’s Property Record Files, Assessors Real Property Data Base, separate studies, Assessor’s Procedures, Assessor’s field maps, Revalue Plan and the statutes. The purpose of this report is to explain and document the methods, data and analysis used in the revaluation of King County. King County is on a six year physical inspection cycle with annual statistical updates. The revaluation plan is approved by Washington State Department of Revenue. The Revaluation Plan is subject to their periodic review.
Definition and date of value estimate:
Market Value
The basis of all assessments is the true and fair value of property. True and fair value means market value (Spokane etc. R. Company v. Spokane County, 75 Wash. 72 (1913); Mason County Overtaxed, Inc. v. Mason County, 62 Wn. 2d (1963); AGO 57-58, No. 2, 1/8/57; AGO 65-66, No. 65, 12/31/65). The true and fair value of a property in money for property tax valuation purposes is its “market value” or amount of money a buyer willing but not obligated to buy would pay for it to a seller willing but not obligated to sell. In arriving at a determination of such value, the assessing officer can consider only those factors which can within reason be said to affect the price in negotiations between a willing purchaser and a willing seller, and he must consider all of such factors. (AGO 65,66, No. 65, 12/31/65) Retrospective market values are reported herein because the date of the report is subsequent to the effective date of valuation. The analysis reflects market conditions that existed on the effective date of appraisal.
Highest and Best Use
RCW 84.40.030
All property shall be valued at one hundred percent of its true and fair value in money and assessed on the same basis unless specifically provided otherwise by law.
An assessment may not be determined by a method that assumes a land usage or highest and best use not permitted, for that property being appraised, under existing zoning or land use planning ordinances or statutes or other government restrictions.
WAC 458-07-030 (3) True and fair value -- Highest and best use.

Area 026 21
2018 Annual Update Department of Assessments
Unless specifically provided otherwise by statute, all property shall be valued on the basis of its highest and best use for assessment purposes. Highest and best use is the most profitable, likely use to which a property can be put. It is the use which will yield the highest return on the owner's investment. Any reasonable use to which the property may be put may be taken into consideration and if it is peculiarly adapted to some particular use, that fact may be taken into consideration. Uses that are within the realm of possibility, but not reasonably probable of occurrence, shall not be considered in valuing property at its highest and best use.
If a property is particularly adapted to some particular use this fact may be taken into consideration in estimating the highest and best use. (Samish Gun Club v. Skagit County, 118 Wash. 578 (1922)) The present use of the property may constitute its highest and best use. The appraiser shall, however, consider the uses to which similar property similarly located is being put. (Finch v. Grays Harbor County, 121 Wash. 486 (1922)) The fact that the owner of the property chooses to use it for less productive purposes than similar land is being used shall be ignored in the highest and best use estimate. (Samish Gun Club v. Skagit County, 118 Wash. 578 (1922)) Where land has been classified or zoned as to its use, the county assessor may consider this fact, but he shall not be bound to such zoning in exercising his judgment as to the highest and best use of the property. (AGO 63-64, No. 107, 6/6/64)
Date of Value Estimate
RCW 84.36.005 All property now existing, or that is hereafter created or brought into this state, shall be subject to assessment and taxation for state, county, and other taxing district purposes, upon equalized valuations thereof, fixed with reference thereto on the first day of January at twelve o'clock meridian in each year, excepting such as is exempted from taxation by law.
RCW 36.21.080
The county assessor is authorized to place any property that is increased in value due to construction or alteration for which a building permit was issued, or should have been issued, under chapter 19.27, 19.27A, or 19.28 RCW or other laws providing for building permits on the assessment rolls for the purposes of tax levy up to August 31st of each year. The assessed valuation of the property shall be considered as of July 31st of that year.
Reference should be made to the property card or computer file as to when each property was valued. Sales consummating before and after the appraisal date may be used and are analyzed as to their indication of value at the date of valuation. If market conditions have changed then the appraisal will state a logical cutoff date after which no market date is used as an indicator of value.

Area 026 22
2018 Annual Update Department of Assessments
Property Rights Appraised: Fee Simple
Wash Constitution Article 7 § 1 Taxation:
All taxes shall be uniform upon the same class of property within the territorial limits of the authority levying the tax and shall be levied and collected for public purposes only. The word "property" as used herein shall mean and include everything, whether tangible or intangible, subject to ownership. All real estate shall constitute one class.
Trimble v. Seattle, 231 U.S. 683, 689, 58 L. Ed. 435, 34 S. Ct. 218 (1914)
…the entire [fee] estate is to be assessed and taxed as a unit…
Folsom v. Spokane County, 111 Wn. 2d 256 (1988)
…the ultimate appraisal should endeavor to arrive at the fair market value of the property as if it were an unencumbered fee…
The Dictionary of Real Estate Appraisal, 3rd Addition, Appraisal Institute.
Absolute ownership unencumbered by any other interest or estate, subject only to the limitations imposed by the governmental powers of taxation, eminent domain, police power, and escheat.
Assumptions and Limiting Conditions:
1. No opinion as to title is rendered. Data on ownership and legal description were obtained from public records. Title is assumed to be marketable and free and clear of all liens and encumbrances, easements and restrictions unless shown on maps or property record files. The property is appraised assuming it to be under responsible ownership and competent management and available for its highest and best use.
2. No engineering survey has been made by the appraiser. Except as specifically stated, data relative to size and area were taken from sources considered reliable, and no encroachment of real property improvements is assumed to exist.
3. No responsibility for hidden defects or conformity to specific governmental requirements, such as fire, building and safety, earthquake, or occupancy codes, can be assumed without provision of specific professional or governmental inspections.
4. Rental areas herein discussed have been calculated in accord with generally accepted industry standards.
5. The projections included in this report are utilized to assist in the valuation process and are based on current market conditions and anticipated short term supply demand factors. Therefore, the projections are subject to changes in future conditions that cannot be accurately predicted by the appraiser and could affect the future income or value projections.
6. The property is assumed uncontaminated unless the owner comes forward to the Assessor and provides other information.
7. The appraiser is not qualified to detect the existence of potentially hazardous material which may or may not be present on or near the property. The existence of such substances may have an effect on the value of the property. No consideration has been given in this analysis to any potential diminution in value should such hazardous materials be found (unless specifically noted). We urge the taxpayer to retain an expert in the field and submit data affecting value to the assessor.
8. No opinion is intended to be expressed for legal matters or that would require specialized investigation or knowledge beyond that ordinarily employed by real estate appraisers, although such matters may be discussed in the report.

Area 026 23
2018 Annual Update Department of Assessments
9. Maps, plats and exhibits included herein are for illustration only, as an aid in visualizing matters discussed within the report. They should not be considered as surveys or relied upon for any other purpose.
10. The appraisal is the valuation of the fee simple interest. Unless shown on the Assessor’s parcel maps, easements adversely affecting property value were not considered.
11. An attempt to segregate personal property from the real estate in this appraisal has been made. 12. Items which are considered to be “typical finish” and generally included in a real property transfer, but
are legally considered leasehold improvements are included in the valuation unless otherwise noted. 13. The movable equipment and/or fixtures have not been appraised as part of the real estate. The
identifiable permanently fixed equipment has been appraised in accordance with RCW 84.04.090 and WAC 458-12-010.
14. I have considered the effect of value of those anticipated public and private improvements of which I have common knowledge. I can make no special effort to contact the various jurisdictions to determine the extent of their public improvements.
15. Exterior inspections were made of all properties in the physical inspection areas (outlined in the body of the report) however; due to lack of access and time few received interior inspections.
Scope of Work Performed:
Research and analyses performed are identified in the body of the revaluation report. The assessor has no access to title reports and other documents. Because of legal limitations we did not research such items as easements, restrictions, encumbrances, leases, reservations, covenants, contracts, declarations and special assessments. Disclosure of interior home features and, actual income and expenses by property owners is not a requirement by law therefore attempts to obtain and analyze this information are not always successful. The mass appraisal performed must be completed in the time limits indicated in the Revaluation Plan and as budgeted. The scope of work performed and disclosure of research and analyses not performed are identified throughout the body of the report.

Area 026 24
2018 Annual Update Department of Assessments
Certification:
I certify that, to the best of my knowledge and belief:
The statements of fact contained in this report are true and correct
The report analyses, opinions, and conclusions are limited only by the reported assumptions and limiting conditions and are my personal, impartial, and unbiased professional analyses, opinions, and conclusions.
I have no present or prospective interest in the property that is the subject of this report and no personal interest with respect to the parties involved.
I have no bias with respect to the property that is the subject of this report or to the parties involved.
My engagement in this assignment was not contingent upon developing or reporting predetermined results.
My compensation for completing this assignment is not contingent upon the development or reporting of predetermined value or direction in value that favors the cause of the client, the amount of the value opinion, the attainment of a stipulated result, or the occurrence of a subsequent event directly related to the intended use of this appraisal.
My analyses, opinions, and conclusions were developed, and this report has been prepared, in conformity with the Uniform Standards of Professional Appraisal Practice.
The area(s) physically inspected for purposes of this revaluation are outlined in the body of this report.
The individuals listed below were part of the “appraisal team” and provided significant real property appraisal assistance to the person signing this certification. Any services regarding the subject area performed by the appraiser within the prior three years, as an appraiser or in any other capacity is listed adjacent their name.
None Any services regarding the subject area performed by me within the prior three years, as an appraiser or in any other capacity is listed below: To the best of my knowledge the following services were performed by me within the subject area in the last three years:
Annual Update Model Development and Report Preparation Data Collection Sales Verification Appeals Response Preparation / Review Appeal Hearing Attendance Physical Inspection Model Development and Report Preparation Land and total Valuation New Construction Evaluation
02/22/2018
Appraiser II Date

Area 026 25
2018 Annual Update Department of Assessments
Department of Assessments King County Administration Bldg. 500 Fourth Avenue, ADM-AS-0708 Seattle, WA 98104-2384 (206) 296-7300 FAX (206) 296-0595
Email: [email protected]
As we start preparations for the 2018 property assessments, it is helpful to remember that the mission and work of the Assessor’s Office sets the foundation for efficient and effective government and is vital to ensure adequate funding for services in our communities. Maintaining the public’s confidence in our property tax system requires that we build on a track record of fairness, equity, and uniformity in property assessments. Though we face ongoing economic challenges, I challenge each of us to seek out strategies for continuous improvement in our business processes. Please follow these standards as you perform your tasks.
Use all appropriate mass appraisal techniques as stated in Washington State Laws, Washington State Administrative Codes, Uniform Standards of Professional Appraisal Practice (USPAP), and accepted International Association of Assessing Officers (IAAO) standards and practices.
Work with your supervisor on the development of the annual valuation plan and develop the scope of work for your portion of appraisal work assigned, including physical inspections and statistical updates of properties;
Where applicable, validate correctness of physical characteristics and sales of all vacant and improved properties.
Appraise land as if vacant and available for development to its highest and best use. The improvements are to be valued at their contribution to the total in compliance with applicable laws, codes and DOR guidelines. The Jurisdictional Exception is applied in cases where Federal, State or local laws or regulations preclude compliance with USPAP;
Develop and validate valuation models as delineated by IAAO standards: Standard on Mass Appraisal of Real Property and Standard on Ratio Studies. Apply models uniformly to sold and unsold properties, so that ratio statistics can be accurately inferred to the entire population.
Time adjust sales to January 1, 2018 in conformance with generally accepted appraisal practices.
Prepare written reports in compliance with USPAP Standard 6 for Mass Appraisals. The intended users of your appraisals and the written reports include the public, Assessor, the Boards of Equalization and Tax Appeals, and potentially other governmental jurisdictions. The intended use of the appraisals and the written reports is the administration of ad valorem property taxation.
Thank you for your continued hard work on behalf of our office and the taxpayers of King County. Your dedication to accurate and fair assessments is why our office is one of the best in the nation. John Wilson King County Assessor
John Wilson Assessor