Embed Size (px)
Citation preview

Steel Industry Restructuring and Location
by
Frank Giarratani Professor of Economics
Department of Economics
Ravi Madhavan Professor of Business Administration
Joseph M. Katz Graduate School of Business
and
Gene Gruver Professor of Economics
Department of Economics
Center for Industry Studies University of Pittsburgh Pittsburgh, PA 15260
May 7, 2012
Chapter contribution for Frank Giarratani, Geoffrey Hewings, and Philip McCann, Editors, Handbook of Economic Geography and Industry Studies, Edward Elgar Publishing, forthcoming.

1
1. Introduction
Steel matters. As a material, it is critical to the infrastructure of economic
development and the consumer durables and capital goods that fuel that
development. As an industry, nations have used steel manufacturing as an
instrument of economic, social, and regional policies. As an industrial base for
regional economies, the steel industry has helped to define the character and
identity of great cities. By examining critical periods of restructuring in this
industry, the role of economic geography as a competitive factor is readily
exposed. Moreover, the consequences of industry restructuring play out
dramatically in terms of the well being of regions. Whether examining the
competitive factors linked to location or their consequences for regions, an
important basis for explanation is to be found in steelmaking technology and
related costs. The analysis offered in this chapter links technology-based
competition, demand patterns, and managerial agency to describe and
explain the process of restructuring in the American and global steel
industries in terms of their economic geography.
Our analysis begins with a very brief explanation about how steel is made in
order to help focus attention on some basic locational factors in the industry
and provide a basis for explaining the relationship between alternative
technologies and competition among steel firms. With this understanding, our
analysis is framed by reference to long trends in industry restructuring as they
play out for the geography of production in the United States. Subsequent
sections of the chapter address the consequences of restructuring in terms of
its spatial and regional dimensions. Our thesis is that technology-based
competition, demand patterns, and managerial agency have been the primary
drivers of the steel industry’s fundamental restructuring. There are two related
parts to our story: First, in Sections 2-6, we describe the transformation of the
American steel industry in terms of the shift from the dominance of integrated

2
steel to that of minimills. This shift in industry dominance was accompanied
by a geographical shift away from the historical core of steel production in the
Midwest to new locations closer to the growing markets of the South and
Southwest. We argue that this dual shift was driven by an interlinked set of
drivers, with technology-enabled changes in competition and the geographic
displacement of demand being primary. The technology effects manifested
themselves via two distinct pathways: changes in cost structure brought about
by scrap-based steel production, and impact on competition between
minimills and integrated producers. However, the visible hand of managerial
agency (Chandler 1993) also played a role, in that decisions and investments
by minimill managers - as well as by their counterparts in the integrated mills -
served to hasten the shift.
Next, in Sections 7-9, we describe the transformation of the global steel
industry – still under way - in terms of the shift in production and demand from
the Triad regions (North America, Europe and Japan) to the rest of the world,
and the rise of the steel multinational corporation (MNC) mainly through
mergers and acquisitions (M&A) deals. This shift, in turn, was driven by the
same set of three factors, prime among them being changes in demand
patterns (manifested in the rise of China) and managerial innovation
facilitated by new information technologies. The technology driver in this
instance was not a production technology, but rather advanced information
systems that greatly increased the geographical distance over which steel
enterprises could be effectively managed. Managerial agency was manifested
this time in aggressive growth-seeking by steel firm managers, as they
engaged in global M&A and other expansion efforts, in many cases newly
energized by worldwide liberalization and privatization trends. Thus, the
dramatic restructuring of the steel industry in the United States and globally
can be interpreted through the lens of technology-based competition, demand
patterns, and managerial agency.

3
2. Making steel
In many parts of the world, and certainly in the popular image, steelmaking is
defined by massive plant complexes that process material, beginning with
iron ore, into semi-finished steel products that are sold to other manufacturers
or service centers for further processing. This image is true for part of the
industry, but a competing recycling technology also helps to define the
modern steel industry – especially in United States, where more than one-half
of all manufactured steel results from recycling ferrous scrap.
The concept of vertical integration in the steel industry was pioneered by
Andrew Carnegie in the late nineteenth century. In 1890, the Carnegie Steel
Company already included substantial holdings in coal, the primary energy
source of steelmaking at that time, and Carnegie began to move, slowly at
first, to acquire interests in the other key raw material – iron ore (Wall 1989, p.
587). By the end of that century, Carnegie Steel also tied materials acquisition
to manufacturing with its own extensive railroad interests (Wall 1989, p. 623).
Today, the concept of an “integrated” steel company no longer relates to
complete ownership in materials, transportation, and manufacturing, as it did
for Carnegie. However, the fundamental process of integrated steelmaking
remains largely unchanged in the sense that mill complexes include materials
processing, iron making, and steelmaking. Figure 1 shows a simple
schematic of the integrated steelmaking process. The actual conversion of
iron ore takes place in a “blast furnace” that uses coke as a reduction agent
and basic source of energy. The ore used in the blast furnace takes one of
two forms: (1) pellets that are produced near the iron mine or (2) “sinter”
produced at the steel mill by heating finely crushed iron ore along with coke
powder and limestone (Hall 1997, p. 4-5). However, iron pellets are by far the
largest form of iron used today in integrated mills (USGS 1998). Blast
furnaces are closed pressurized vessels that are designed to run continuously

4
for years at time. Depending on its design, the capacity of a blast furnace
may be 1.5 million or more than 3 million tons per year, and scale economies
in such furnaces are critically important. The crude “pig iron” produced in this
process is transferred in molten form to the integrated mill’s steelmaking
operations, where carbon levels are reduced in a Basic Oxygen Furnace or
“BOF”. In turn, while still in molten form, steel is moved in ladles from the
BOF to “secondary” steelmaking facilities where steel chemistries and carbon
content can be tightly controlled for specific end uses. Steel takes its first solid
form in continuous casting operations, where the cast product is committed to
flat shapes (slabs used to make steel sheet or plates) or long shapes (billets
or blooms, which have cross sections that are more nearly square or round).
[Figure 1 here]
The contrast between an integrated steel process and the alternative steel
recycling process, which relies on the electric arc furnace (EAF), is dramatic,
both in terms of complexity and, typically, the scale of operations. As shown
in Figure 2, this alternative technology is much more direct. EAFs use post-
consumer scrap metal such as old automobiles and appliances and scrap
metal cast off in the manufacturing of steel products of many kinds. By
melting the scrap metal from such sources, EAF producers recover steel that
can be used to compete directly with ore-based mills.
[Figure 2 here]
The growth of electric furnace steelmaking in North America began to
increase dramatically in the 1970’s, and this was coincident with very
important efficiency gains in this technology. See Barnett and Crandall (1986,
56-57). The price of scrap metal was very low at that time, and it gave scrap-
based producers a significant cost advantage in certain product lines. In the
decades to follow, the scale of many electric furnaces in terms of annual

5
capacities increased to over one million tons, which approaches the low-end
of the capacity range of integrated steelmaking. Moreover, as experience has
increased with electric furnaces and technologies have advanced, it has
become common for the furnace “charge” or input mix to include directly
reduced iron (DRI) or pig iron. Input substitution between ferrous scrap and
DRI or pig iron has greatly increased the product range of EAF producers by
allowing them to more closely control the level of impurities in the scrap-
based steels they produce.
3. Long trends in industry restructuring
Perspective on developments in steel technologies, like the advancement of
electric furnace steel production, and the competitive forces that they help to
shape can be gained by reference to long trends in the economic geography
of American steel production. The historical geographic core of steel
production in the United States is defined by three state-based districts: (1)
Pennsylvania, including, of course, Pittsburgh, where integrated steelmaking
began in the United States, (2) Illinois-Indiana, where Chicago-Gary is, by far,
the largest production center, and (3) Ohio, especially areas bordering the
Great Lakes near Cleveland. The overriding core-periphery trend in
American steel production is unambiguous: Table 1 shows that the historical
core region’s share of total steel production has declined monotonically for
many decades, as population and overall American manufacturing activity
shifted southward and westward. However, while this trend in steel production
is evident, the factors underlying it have evolved in terms of technology and
the nature of competition.
In the years immediately after World War II, explanation for the historical core
region’s declining share meant, in practical terms, explaining why
Pennsylvania, and Pittsburgh in particular, was losing its share of national
steel production. As indicated in Table 1, from 1940 to 1970 the historical

6
core region’s share of steel production declined from 72 percent to 62
percent, with Pennsylvania accounting for seven points of the ten-point
decline over this thirty-year period.
[Table 1 here]
Pittsburgh’s early advantage in American steelmaking in the middle- to late-
19th Century was found in its proximity to Western Pennsylvania’s coal
resources as well as the market position that Pittsburgh enjoyed when
railroad systems began to move westward. Pittsburgh’s distance from the
source of the other great transferrable resource needed in steel production –
iron ore – was of little disadvantage when integrated steelmaking began.
North American iron ore travels primarily by boat or barge from mining areas
in Michigan and Minnesota, and the transportation cost differentials related to
iron ore simply did not offset the enormous advantage that Pittsburgh enjoyed
by its proximity to metallurgical coking coal (Pittsburgh Regional Planning
Association 1963, p. 262). The other major steel producing regions at the time
in Ohio and Illinois-Indiana – all located on the Great Lakes – had superior
water access to iron ore, but suffered relative to Pittsburgh in their proximity
to sources of coking coal.
Based on this historical advantage, explanations for Pennsylvania’s relative
decline focused on two sources: (a) changes in technology that reduced
locational cost advantage in Eastern production centers, and (b) changes in
the spatial distribution of the market. Isard and Capron (1948) explain the
cost side by very substantial progress in fuel efficiencies that reduced the
amount of coke required in blast furnaces to produce pig iron. This weakened
the advantage of production centers, like Pittsburgh, that are located close to
sources of coking coal. See, also, Pittsburgh Regional Planning Association
(1963, p. 273). The market disadvantage of production centers in
Pennsylvania and other Eastern regions also is recognized as an important

7
locational consideration by Isard and Capron (1948, p. 126) and by Pittsburgh
Regional Planning Association (1963, p. 278). Later, Hekman (1978) argues
that changes in the geographic distribution of the market are the most
important basis for explaining changes in the distribution of steel production
among regions.
An argument also can be made that the effect of market growth on steel plant
capacities in the Midwest was enhanced by the weakening and ultimate
demise of basing-point pricing in the steel industry. Under basing-point
pricing, steel customers pay the F.O.B price at a given steel plant plus
transportation costs from a pre-determined geographic basing point to the
customer’s plant location. Pittsburgh pricing, which prevailed until an F.T.C.
ruling in 1924, set the transport costs on the basis of the customer’s distance
from Pittsburgh – regardless of where the steel was actually produced. After
that date the number of basing points used by the industry expanded to
include Chicago and other cities (Rogers 2009, p. 66), but the practice was
not entirely eliminated until 1948 (Marengo 1955, p. 509). The ability of
Pittsburgh mills to compete in markets located at the periphery of its market
region was eroded when other cities were included in the multiple basing-
point system. As the system was eliminated those other cities also lost the
implicit market protection offered by this system. Consequently, the
competitive position of steel plants located in distant regions was enhanced in
geographic markets adjacent to their operations because of lower
transportation costs, and the lower cost of delivered steel in these markets
facilitated growth in steel consuming operations.
While these geographic shifts were taking place after World War II, major
investment decisions were undertaken by steel makers in the United States
and abroad that would profoundly affect the competitive balance among firms
in years to come. The Basic Oxygen Furnace (BOF) – which is today
standard technology – emerged in the 1950s to compete with the dominant

8
technology of that time, the Open Hearth (OH) furnace. Major expansions in
steelmaking capacity were made in the United States, Europe, and Japan in
the immediate post-war period. Throughout the 1950s, investments in new
capacity in the United States were being made in OH furnaces – over thirty-
nine million net tons of OH capacity were added during that decade out of a
total U.S. capacity of 139 million tons (Hall 1997, p. 40). In contrast, European
and Japanese steel makers invested in the emerging technology, BOF. A
decade later, it was apparent that the BOF was superior, and OH furnaces
began to be phased out of production worldwide.
Many factors, including investments in OH furnaces, combined during the
1950’s and the 1960’s to weaken the competiveness of integrated steel
makers in the United States, and this long saga is well documented
elsewhere. See, for example, Tiffany (1988). Among these factors, labor
issues were very important. In effect, the large integrated steel firms
purchased labor peace at a very high price in the sense that negotiated labor
settlements built-in substantial cost disadvantages based on hourly rates,
work rules, and retirement benefits (Hoerr 1988, 77-81; Hall 1997, 45-49).
“Big steel” emerged from all of this as being especially vulnerable to
competition from foreign producers, and in 1960, the United States – still a
major world producer – became a net importer of raw steel. In addition,
anemic growth in steel demand after World War II along with the maturation
of infrastructure investment in the United States limited the opportunity to
build new plants embodying new technology, without the closure of existing
integrated mills. See Barnett and Crandall (1986, p. 97) for documentation
concerning steel demand during this period.
Ironically, the replacement of OH furnaces with BOF’s also helped to spur the
growth of a new set of domestic competitors for U.S. integrated steel
producers. The OH technology, which accounted for the largest share of steel
production in the United States through the 1960s, could accept up to fifty

9
percent ferrous scrap in the furnace charge. While superior in other ways,
BOF’s by comparison could accept only much smaller amounts of scrap
metal, and relied much more heavily on the pig iron generated by blast
furnaces. Thus, replacement of OH furnaces by BOF’s in the 1960’s drove
down the market price of ferrous scrap. Small, independent steel producers
emerged in the United States to take advantage of low scrap prices by using
EAF technology, and these American “minimills” would reshape the economic
geography of steel production in North America.
Also in the 1950’s, concern by integrated steel firms with the depletion of
high-grade iron ore deposits stimulated major investments that further tied
integrated firms to ore-based technologies. Costly investments were made in
“pelletizing” operations that could bring low-grade ores up to the high iron
content levels necessary for steelmaking. In addition, integrated firms
invested heavily to secure access to high-grade ores, especially in Canada
and South America (Hall 1997, p. 39). As a consequence of these locationally
fixed investments integrated firms were less able to respond to opportunities
presented by emerging scrap-based furnace production.
In addition to the technological and economic factors discussed so far,
managerial factors also played a key role. Christensen (2000) has provided
rich analysis of key managerial factors that may have differentiated between
minimills and integrated producers in terms of their response to EAF
technology. In Christensen’s (2000) account, EAF technology was a
“disruptive technology” – one key characteristic of which is that, at its
inception, it is markedly inferior to prevailing technologies. In the case of EAF
steelmaking, as indicated earlier, it was initially hard to control the chemical
qualities of the steel produced, because the scrap that went into the furnace
often varied in its metallurgical composition. Thus, the only markets open to
EAF products were low-end applications, such as construction re-bar. In
contrast, more demanding applications such as automotive steel required

10
more precise control of chemical qualities. Focusing on their high-value
added customers, integrated producers chose to cede the lower-end markets
to minimills employing EAF technology. Given their lower cost structure,
minimill companies were able to serve even the lower end markets profitably.
However, a crucial characteristic of disruptive technology is that it gets better
over time (Christensen, 2000). Bolstered by their profits, and incentivized by
the prospect of moving upmarket, minimills like Nucor and Chaparral worked
hard to improve steel quality, as well as invested in the equipment to make
larger shapes. By the mid-1980s, they had captured not only the entire rebar
market, but also the lion’s share of the market for bars, rods and angles.
Once again, constrained by their cost disadvantages and by the preferences
of their existing customers, integrated producers retrenched from those
markets, now reduced to flat steel products that demanded the highest levels
of purity, Christensen’s (2000) analysis brings to light the process through
which rational managerial decisions in response to real technological,
economic and customer pressures led to the ascendancy of the minimill.
4. Technology-based competition and industry restructuring
The profound effect of the minimill phenomenon on the economic geography
of American steel manufacturing is revealed by reference to the long trends
shown in Table 1. In the thirty-year period from 1970 to 2000, the historical
core region’s share of national steel production declined by a further 10
percentage points, just as it had in the previous thirty-year period. In the more
recent period, however, integrated steel makers were challenged by
competitors on two fronts, domestic and foreign, and Pennsylvania’s declining
share shows the consequences. By the end of the 20th Century, a steel era
had ended, as Pennsylvania’s share of national steel production declined
from 23 percent to seven percent, and at the same time, rough parity in

11
regional shares between the historical core and other regions made moot the
very concept of core-periphery distinctions.
The ascendance of EAF technology is evident in Table 2, which shows
average annual steel production in the United States by furnace type for
recent decades. EAF steel production doubled from the decade of the 1960s
to the 1970s, and has continued a trajectory of steady growth to the present
day – now accounting for well over fifty percent of raw steel production in the
United States. Open Hearth (OH) technology – which was the focus of
immediate post-war investments by US integrated steel producers – was
phased out rapidly and replaced by BOF technology in the 1960s and 1970s.
By the 1980s, OH furnaces were clearly obsolete. Perhaps the most
dramatic change revealed by Table 2 is the major decline observed in total
steel production from the 1970s to the 1980s – all of which is accounted for
by integrated steel firms.
[Table 2 here]
The restructuring in the steel industry that is implied by these data – decline
by ore-based integrated firms and growth by scrap-based EAF firms – has
had a profound effect on the economic geography of steel production in the
United States. The 1981-1982 economic recession experienced in the United
States triggered a series of major plant closures and capacity adjustments
that reflected long-term strategic decisions by integrated steelmakers. In
1974 forty-five ore-based plants produced non-specialty steel in the United
States, and by 1991, ore-based capacity had been eliminated in twenty-two of
these plants (Beeson and Giarratani 1998, p. 425). Most of the plants
involved were permanently closed; four remained open, but only with EAF
capacity. Mirroring the production data presented in Table 2, the capacity of
ore-based steel plants in the United States also has dropped very
substantially in recent periods. From 1974 to 1991, total ore-based furnace

12
capacity in the United States decreased from 140.5 million tons per year to 76
million tons per year, a decline of 45.9 percent (Beeson and Giarratani 1998,
p. 435).
Figure 3 shows the way that these reductions played out in terms of the
spatial distribution of ore-based steelmaking capacity in United States by
focusing on total BOF capacity in state-based regions during the 1970s,
1980s, and 1990s. Sharp declines in northeastern regions (Region 4 and
Region 10) and in the West (Region 9) contrast vividly with relatively stable
capacity in other places, especially in the upper Midwest (Region 1, Region 2,
and Region 3).
[Figure 3 here.]
The observed geographic patterns of ore-based capacity change are best
understood in terms of a partitioning of the product markets for steel. As
explained by Ahlbrandt, Fruehan and Giarratani (1996) in the process of
restructuring, ore-based integrated producers largely focused the capacity of
their plants toward flat products (steel slabs) and eliminated their capacities to
produce long products (steel billets and blooms). At the time of this
partitioning, with a very small number of exceptions, the product range of EAF
plants was limited to the billets and blooms necessary to fashion products like
construction beams, steel rods, and reinforcement bars. The cost advantage
of EAF producers forced ore-based integrated producers out of these
markets, except in circumstances where the ore-based firm produced bars or
other long products with special characteristics in term of hardness or other
attributes that were beyond the metallurgical range of EAF mills. Also recall
the previous discussion of EAF technology as a “disruptive” force
(Christensen 2000) that triggered managerial responses eventually leading to
such partitioning. See Barnett and Crandall (1986) as well for corroborative
detail. Inter-firm competition is not static, however, and the relentless

13
incursion of EAF producers into the markets served by integrated firms
continues to the present day.
The location of automobile plants and auto parts suppliers was an important
consideration in restructuring by integrated steelmakers. In the 1980’s, EAF
producers had limited or no access to the markets for automotive steel, and
BOF producers made capacity decisions accordingly. Plant locations in
Illinois-Indiana and Ohio served the strategic needs of integrated producers
and the evidence for this is clear in Figure 3. The very dramatic declines in
BOF capacities in Pennsylvania and other states are a consequence of exit
by integrated firms from the markets for long products, and growth or stability
in BOF capacities elsewhere are a consequence of the focus by integrated
firms on the markets for flat products – especially, steel sheet that is shipped
in coils to manufacture automobiles and other goods (Beeson and Giarratani
1998).
5. Steel minimills and industry restructuring
While transport costs on materials and finished products are important in
determining the profitability of steel minimills in the same way that these
factors are important to integrated mills, the basic transferrable input used by
minimills – ferrous scrap – is much more widely distributed than the iron ore
and coking coal required by integrated mills. This suggests that regions where
ferrous scrap is in surplus would be especially attractive minimill locations,
given the proximity of a plant location to product markets. It also suggests that
transportation infrastructure – rail networks and barge access for scrap,
trucking for finished steel – will be important factors in plant location.
Substantial electricity is required for scrap-based steel production, and the
price of electricity also is a key locational factor.

14
Figure 4 shows the capacity of scrap-based steel production (EAF producers)
in state-based regions during the 1970s, 1980s, and 1990s. In sharp contrast
to the pattern observed for ore-based steel production (BOF producers),
scrap-based plant capacity is widely dispersed and steady or growing in most
regions. Very substantial decade-to-decade growth is found several regions,
and especially in the southern and southeastern states. See Region 7 and
Region 8.
[Figure 4 here.]
The contrast in locational patterns for ore-based and scrap-based producers
is displayed vividly in Figure 5, which maps specific plant locations for each
technology in 2003.
[Figure 5 here.]
One remarkable implication of EAF capacity growth is that it has changed the
very concept of a “steel” region in the United States. For most readers, the
fact that the northeast corner of Arkansas, a very rural state, is home to one
of the largest steel producing counties in the United States would come as a
great surprise. Yet, this location along the Mississippi River can claim two
large scrap-based EAF steel mills and has a total steelmaking capacity that is
greater than the current steelmaking capacity in all of Pennsylvania.
Moreover, the plant capacity in Arkansas was built on two green field sites
with one start-up in 1987, Nucor-Yamato Steel Company in Blytheville AR,
and a second start-up in 1992, Nucor Steel’s facility in Hickman AR. In order
to understand this phenomenon fully, it is important to appreciate the process
by which scrap-based EAF producers emerged as formidable competitors
with ore-based integrated mills.

15
Although electric furnace steel production has a much longer history, the
beginning of the market insurgence by steel minimills in the United States can
be dated to late 1950s and early 1960s when a small number of firms used
the cost advantages they enjoyed from scrap-based manufacturing to
produce reinforcement bars for concrete used in the construction industry
(Hall 1997, p. 154-157). The plants involved were often at the periphery of
market areas served by integrated steel producers and were buffered from
competition by advantage in transportation costs (Barnett and Crandall 1886,
p. 19). In these locations, minimills enjoyed very significant advantage in
production cost: ferrous scrap was abundant, easily accessible, and available
at low prices; EAF mills had very low capital costs relative to integrated mills;
and electricity costs were low (Ahlbrandt, Fruehan, and Giarratani 1996) in
the peripheral locations. These advantages, most particularly low capital
costs, allowed minimills to exploit highly local markets for steel products in
small scale plants.
The most formidable challenges to ore-based producers began in the latter
part of the 1960s and the 1970s, when minimill producers began taking
advantage of their success by reinvesting profits to replicate successful mills
within a multi-plant firm structure. Florida Steel Corporation began this
pattern, while retaining its focus on producing steel products for local
construction markets (Hall 1997, p. 158-159). Nucor Steel was among the
market entrants that followed the multi-plant pattern, but along with several
other minimill producers, Nucor began to scale up plant capacities, extend its
product range beyond construction steels, and serve much wider market
areas (Barnett and Crandall 1986, p. 19). Expansion in scale, product range,
and geographic markets placed EAF producers like Nucor in direct
competition with integrated firms, and continuously improving EAF
technologies added to the advantage of these insurgent firms over time.
Beeson and Giarratani (1998) provide statistical evidence linking reductions in

16
ore-based capacities across space and the closure of integrated plant directly
to this minimill challenge.
The transformation of minimills from small scale plants serving local markets
to larger scale plants serving broad markets explains the patterns observed in
Figure 4, and is plainly evident in Table 3, which documents the size
distribution of minimills in 1978 and 2003. Over this period, the number of
minimills increased by nearly fifty percent and total minimill capacity tripled.
Median plant capacity ratchets up from 350 thousand tons per year in 1978 to
750 thousand tons per year in 2003, and average plant capacity begins to
approach one million tons by the end of the period. Indeed, in 2003, nearly
one-third of existing “minimills” have an annual capacity of one million or more
tons.
[Table 3 here.]
6. Minimill cost advantage
An important part of the cost advantage enjoyed by minimills was their early
adoption of continuous casting technology. In most modern mills, steel takes
its first solid form only as it passes from secondary steelmaking operations in
a mill through a continuous caster. The earlier technology required pouring
molten steel into casts to create “ingots” that could be placed in inventory for
later use. Transforming ingots into billets, blooms, or slabs required re-
melting before further processing in separate rolling mills. The costs of capital
and energy required for ingot casting and re-melting are very substantial, and
continuous casting is much more cost effective.
Scrap-based minimills began adopting continuous casting in the early 1960s,
and the technology quickly became standard for minimills as EAF capacity
expanded. By comparison, integrated mills adopted the technology only with

17
a very substantial time lag, due, in part, to the challenges imposed by casting
slabs at large volume (Warren 2001, p. 256). Further, integrated producers
may have experienced “lock-in” effects from the geometry of their prior
commitments: e.g., at its Mon Valley plant, US Steel was constrained by the
need to work with a furnace and a rolling mill situated ten miles apart – a
configuration consistent with existing casting technology (Ghemawat 1997).
The net result of this difference in adoption rates was a direct cost savings for
minimills that may have approached $40-$50 per ton of steel (Rogers 2009,
p. 132).
Beyond this direct cost-savings per ton, continuous casting technology also
was a linchpin for the introduction of modern manufacturing techniques to the
American steel industry. Ahlbrandt, Fruehan, and Giarratani (1996, 89-90)
explain that by investing simultaneously in continuous casting technology,
human capital, and human resource practices that encourage the
decentralization of decision making on the shop floor, steel manufacturers
were taking advantage of important complementarities that had a tremendous
impact on productivity. The basis for these gains was laid out clearly by
Womack, Jones, and Roos (1990). In this widely read book on the automobile
industry, the authors show how the elimination of inventories in production
lines enables a process of “lean manufacturing” that provides a basis for
substantial efficiency gains and quality improvements. The introduction of
continuous casting in the steel industry had exactly these effects, and by
doing so it enhanced the importance of human resource considerations in
plant location decisions.
The importance of human resources in the link between technology and
production efficiency is highlighted by the experience of Nucor Steel, which
has served as a model for many other firms in the way that it ties together
technology, human resources, and the process of production to enhance its
competitiveness (Ghemawat 1995, 1997). The heart of Nucor’s labor model

18
is a pay-for-performance system keyed to quality-based production, but this is
imbedded in a much larger corporate culture that decentralizes decision
making and encourages a get-it-done approach to problem solving
(Ahlbrandt, Fruehan, and Giarratani 1996, 74-78). Nucor is not the only
steelmaker with these characteristics, but its influence on the industry has
been very important, and the kind of “high-performance” workplace that Nucor
and other firms apply can result in substantial productivity gains (Ichniowski,
Shaw and Prennushi, 1997).
Minimill producers striving to implement Nucor-like work systems place a
premium on labor flexibility in terms of cross-skilling. For example, most of
these firms rely on a very limited number of job categories so that workers in
a given category have and use a number of different skills across a wide
range of tasks. On a given day one worker might spend part of the day
monitoring process controls and another part of the same day in maintenance
activities. Because of the emphasis on decentralization in decision making,
problem solving is valued and encouraged. This labor model encourages
minimills to seek locations for new plants where workers could be trained in a
flexible work environment. While many minimills are non-union and others
are unionized, the spatial distribution of these producers strongly favors right-
to-work states.
The management of human resources was not the only area in which
minimills followed sophisticated approaches that enhanced their competitive
advantage. Staying with the example of Nucor, another key factor was
efficient management of capital, which was critical in the capital-intensive
steel industry (Ghemawat 1997). During its period of growth, Nucor
demonstrated a cadence of building or rebuilding one plant a year, acting as
its own general contractor in each instance. This approach provided not only
significant knowledge spillovers in between plant construction and operations,
but also superior capital efficiency – allowing Nucor to build its first thin-slab
19
caster for an investment estimated to be 25% less than it would have cost
rivals, and to achieve operating break-even a year and half sooner
(Ghemawat 1997).
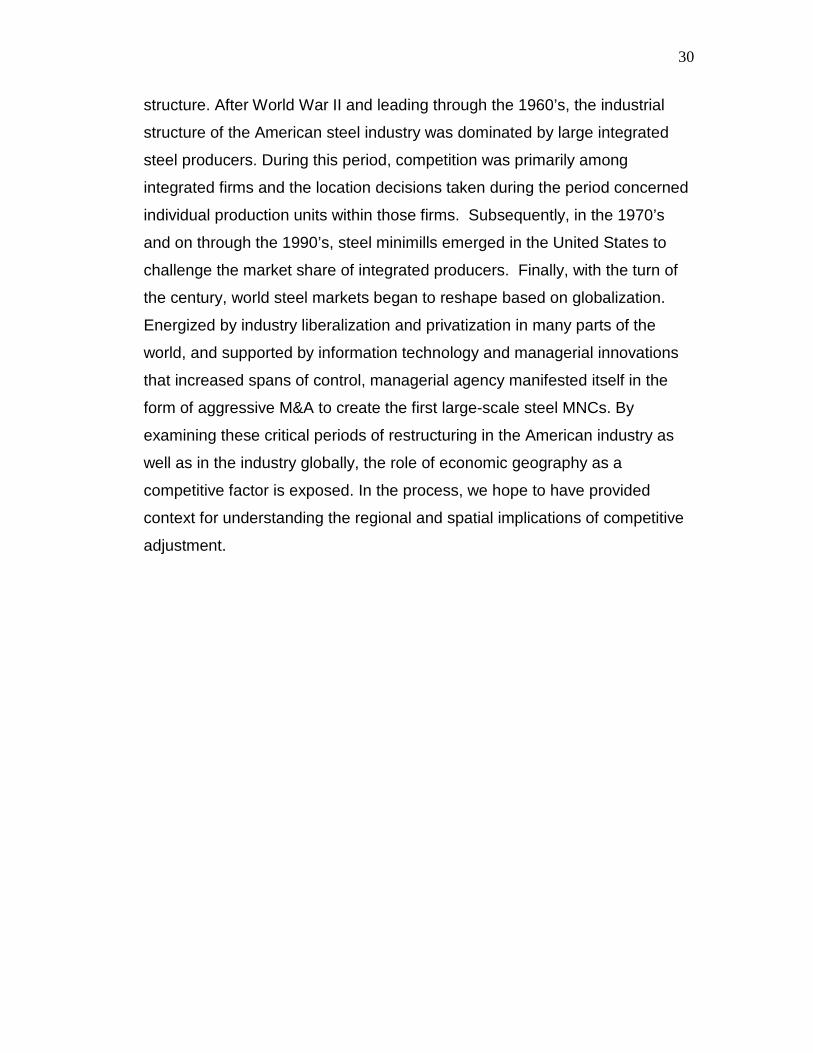
In addition to labor factors, the locational cost advantage of EAF mills
depends especially on the availability and price of ferrous scrap – the primary
transferrable input for EAF steel making. Figure 6 shows clearly the cost
advantage enjoyed by minimills away from the core Northeast and Midwest.
Along with lower electricity prices – pointed out earlier – this factor further
reinforced the attractiveness of production locations in what was previously
the periphery.
[Figure 6 here.]
A summary of our key arguments is appropriate as we conclude this part of
the chapter. Over the decades, the regional structure of the American steel
industry changed drastically as a result of three interacting drivers. The
evolution of EAF technology changed the relative cost positions of industry
players, propelling significant growth for mini-mills. Economic growth in the
South led to new markets for steel in areas away from the traditional industrial
clusters of the Midwest, and minimills were able to situate themselves closer
to those markets. Managerial agency intervened in the form of aggressive
growth-seeking by minimill firms such as Nucor, and a corresponding
tendency on the part of integrated producers to retrench away from markets
that were targeted by the minimills. Thus, technology-based competition,
demand shifts and managerial agency worked jointly to bring about the
regional shifts we described in the American steel industry.
In order to provide the global context to our story, we now turn to the
restructuring of the world steel industry. In addition to merely providing
context, however, we find that the same three drivers may explain the global
restructuring that is currently under way. Demand shifts away from the Triad

20
markets (US, Japan and the European Community), new information
technologies that facilitate worldwide managerial coordination, and
aggressive managers seeking to reconfigure the industry to their own
advantage – our analysis shows these to be drivers of the steel industry’s
globalization, much as they were in the case of the American steel industry.
7. The global dispersion of demand
Observers have noted three eras in the history of the global steel industry
(e.g., Laplace Conseil 2003) – the pre-War national era, the period from the
Second World War to the 1970s oil crisis, and the period since 1973, which is
often viewed as culminating in the globalization of the steel industry. Two key
developments underlying the globalization of the industry were liberalization
(the freeing of political and strategic restrictions) and the attendant
privatization of steel companies. Historically, governments around the world
tended to heavily support their domestic steel producers, reflecting both
concerns about preserving employment in a sector with powerful labor
unions, and the entrenched view that the steel industry was “strategic” for
industrial and military reasons. In the 1980s, 60% of the world’s steelmaking
capacity was government-owned (Wall Street Journal 2005). Subsequently,
however, reflecting the zeitgeist of liberalization as well as inability to continue
to bear the economic costs of inefficient government-owned plants, much of
this capacity was privatized – bringing government ownership down to 40% of
capacity by 2005 (Wall Street Journal 2005). In the Triad nations, where
government ownership was less of a factor, bankruptcy restructuring
facilitated the shedding of legacy costs, such as pension obligations, leading
quickly to the emergence of a robust global market for steel assets.
While the large-scale liberation of steel companies from government
ownership and/or political strictures that kept them domestic was an important
factor, however, the globalization of the industry is most apparent if we

21
examine changes in the global demand pattern. In 1960, the United States
accounted for 26% of world steel markets, and the Triad nations for 56%
(Old, 1985). Parallel to the “core to periphery” shift noted earlier within the
American steel industry, the world industry has undergone a massive
structural shift in terms of the geographic location of steel production. (See
Figures 7 and 8].
[Figures 7 and 8 here]
Two observations are worth making here. Figure 7 demonstrates compellingly
that Asia is now the center of gravity of steel production, accounting for over
60% of all steel produced. Figure 8 breaks down the Asia numbers even
further, pinpointing simultaneously, the relatively stable role of Japan, the
massive growth in China, and the significant room for growth in India. The
well-known geo-economic shifts that comprise the slowing of growth in the
Triad and the emergence of growth markets elsewhere (e.g., the BRIC
nations) are clearly the fundamental drivers of the shift toward regions that
were hitherto peripheral. In particular, it is useful to note one factor that is
here to stay: steel intensity declines in the developed world. Crude steel
consumption has stabilized at 400 kg per capita in the developed world – with
low population growth and the shift to service-based economies, this steel
intensity is not expected to increase. In contrast, however, China’s steel
consumption in 2010 was 450 kg per capita, and rising, driven by huge
investments in infrastructure. Nor is China’s hunger for steel expected to slow
down any time soon, as suggested by two yardsticks (BHPBilliton 2012):
First, China’s car penetration density in 2010 was 32 cars per thousand
persons, compared to 423 in the United States. Second, China has only 32
square meters of urban residential floor space per capita, compared to 73 in
the United States.

22
The second observation is that, important as China is, this is not entirely a
China story: the rest of the developing world (ex-China) consumed over 400m
tones of steel in 2010, and the 2000-2010 CAGR was 5.6%. (Arcelor Mittal
2011). That there is even more room for growth outside China is illustrated by
comparing steel intensity numbers. India, lagging behind China on
infrastructure investment and industrialization, consumed 60 kg per capita.
The comparable number for other developing countries (apart from China and
India) was 102 kg per capita. With a population base of nearly 5.5 billion, and
driven by industrialization and urbanization, thus, the emerging markets are
where the demand and demand growth are expected to be. For a firm-level
illustration: At Arcelor Mittal, which is the world’s largest steel producer, over
1/3 of current shipments go to the emerging markets (Arcelor Mittal 2011).
8. The emergence of the steel MNC
Accompanying the demand and production shifts from the Triad nations to the
emerging markets noted above is the emergence of the steel MNC. Unlike
similar or related industries such as Aluminum or mining, both of which
witnessed the emergence of MNCs decades ago, steel companies are
latecomers to multinational operations. In fact, it was the merger of three
European national steelmakers to create Arcelor in 2001 that heralded the
rise of the large-scale MNC in the steel industry. The adoption of the MNC
form can be seen as a natural response to the industry dynamics noted
earlier: The large increased demand in China/ Asia combined with the
importance of operating on a global scale (global customers and global
competition) led to the pressure for consolidation in a fragmented industry
(IBM 2007). Given the powerful economic rationale against creating new
capacity in many regions of the world, M&A were the primary means of global
expansion for the established steelmakers. Figures 9 and 10 lay out the
extent and impact of M&A activity in the global steel industry.

23
[Figures 9 and 10 here]
At its peak in 2006-2007, the steel industry witnessed a total of 323 M&A
transactions over the two years, with a peak in dollar value of close to US$ 79
billion in 2006 (Figure 9). Although the number and size of deals has declined
since then, the pace of consolidation continues. Figure 10 demonstrates that
the rankings of the top steel producers have been routinely upset by
consolidation deals. For example, Arcelor became the world’s Number One
steelmaker in 2001 as a direct result of the merger that created it. Similarly,
NKK of Japan climbed from the 8th position in 2002 to 4th (as JFE) upon its
merger with Kawasaki Steel. The appearance of new Chinese steelmakers on
the Top Ten list is also directly attributable to M&A transactions.
Figure 10 also reminds us that, despite the considerable consolidation that
has taken place, the steel industry remains highly fragmented. The total share
of production accounted for by the Top Ten (i.e., C10) has barely changed
during this period, in fact declining slightly to 0.24 in 2010 from 0.25 in 2000.
By way of a rough comparison, the top five iron ore producers accounted for
over 40% of the iron ore market (PwC 2004).
One important implication of the cross-border M&A phenomenon was that
foreign ownership of steelmaking assets became reality, a far cry from the
past preoccupation with domestic ownership of an industry that was widely
held to be strategic in nature. At one point, it was estimated that foreign
steelmakers owned 42% of steel capacity in the NAFTA region (Blume,
2008).
Thus, M&A played a critical role as an instrument of corporate initiative that
fundamentally reshaped the industry and impelled the emergence of the steel
MNC. We view the prevalence of M&A in this context as an expression of
managerial agency that took place in the context of demand shifts, but was

24
distinct from it. A counterexample serves to make this point: Tiffany (1987)
has noted that US Steel did not pursue the clear opportunity to expand in
Europe when that continent’s steel plants lay in shambles at the end of the
First World War. Tiffany (1987) attributes this to a judgment on the part of
Wall Street financiers, the potential providers of expansion capital, that there
were greater profits to be made by lending directly to Europeans to rebuild
their own industry than by supporting US Steel’s expansion. In such a view,
managerial judgment may have led to the path not taken (of
internationalization). However, in the late 1990s and then the 2000s, steel
industry managers arrived at a different conclusion, and that has clearly led to
a different set of outcomes.
It should also be noted that the M&A transactions did not emerge only from
established steel companies from the prior core, i.e., developed world
companies. In fact, arguably, one of the key instigators of the industry
consolidation wave was a virtual outsider, Laxmi Nivas Mittal, who got his
start running a small mini-mill in Indonesia (Ghemawat & Madhavan 2011).
Developed world steelmakers have indeed accounted for many large cross-
border deals. However, steel producers from the emerging markets have also
been active players – e.g., Tata Steel’s acquisition of Corus in 2007, and
Gerdau’s transactions in North America. Kumar & Chadha (2009) provide a
useful comparative analysis of Indian and Chinese outward FDI in the steel
industry. The trend in domestic M&A is also similarly represented across the
key nations. In China, for example, the fragmentation of the steel industry,
with its implications for efficiency and competitiveness, is a matter of great
concern to policy makers. In 2008, China’s top ten domestic steelmakers
accounted for 42.5% of total output (i.e., C10 = 42.5). According to the
Chinese government’s 2005 Development Policies for the Iron and Steel
Industry, the target C10 for 2020 is over 70 (KPMG 2009).

25
One key aspect of the evolution of the steel industry relates to its interface
with the mining industry. With the growth in demand for steel inputs such as
iron ore and coal, as well as the increasing concentration in the mining sector,
it’s clear that ensuring access to raw materials is a key concern for
steelmakers. One outcome has been vertical integration: Indeed, much of the
value that Mittal saw in acquiring post-Soviet steel mills may have been in the
captive mines that came with the factories rather than in their steelmaking
capacity Ghemawat (2007). This dialectical dynamic comprising concentrated
market power on the part of the miners and the search for mineral self-
sufficiency on the part of steelmakers will have interesting results – e.g., more
direct attempts to buy up mines, such as Arcelor Mittal’s 2011 attempt to gain
control of Macarthur Coal, and the emergence of “haves” and “have-nots” in
the steel industry in terms of mineral self-sufficiency (Lichtenstein, 2011) -
with attendant implications for valuation differentials that may in turn drive
further merger activity.
In our description of structural changes in the US steel industry, technology
played a key role – minimills employed scrap-based production technology to
direct great competitive pressure at integrated producers. Interestingly,
technology plays a parallel role in the ongoing restructuring of the global steel
industry, although with an important difference. The US domestic story
recounted earlier was driven by production technology, i.e., the rise of EAF
production. In the globalization case, we propose that it was not production
technology, but rather supporting organizational technologies that mattered –
specifically, sophisticated information technology tools that triggered
managerial innovations and in turn facilitated the creation and ongoing
management of the MNC form. Two examples serve to illustrate:
ThyssenKrupp’s use of networked computer systems to bring about global
integration, Arcelor Mittal’s coordination of inter-regional demand patterns
through advanced information systems.

26
In ThyssenKrupp’s case, we see how high-technology communication tools
make possible a production chain that is dispersed over three continents
(Wall Street Journal 2010). ThyssenKrupp is a pioneer in stitching together a
truly global steel supply chain, with a plant in Sepetiba, Brazil making steel
slabs, which are then rolled and treated in Alabama for higher-value added
applications. A small team based in Rotterdam uses networked computer
systems to coordinate customer orders, slab production, and further
processing efficiently. ThyssenKrupp sees itself as a “virtual integrated steel
mill” (Wall Street Journal 2010). Industry accounts suggest that the company
has been able to create significant efficiencies in production and logistics cost
by virtue of this networking technology.
In Arcelor Mittal’s case, evidence suggests that significant managerial
attention and the effective use of information systems (including knowledge
transfer) have allowed it to leverage its resources globally as well as to
respond in nuanced ways to regional differences market needs. At the time of
their merger in 2006, there was a significant difference in technological
capability between Arcelor and Mittal Steel. While Arcelor and Mittal Steel
were roughly the same size, Arcelor’s annual R&D outlay was more than 10
times that of Mittal Steel, with the result that Mittal mills tended to lag their
Arcelor counterparts in efficiency, reliability, and quality of steel
(BusinessWeek 2010). When you have a global company that demonstrates
such stark differences in technology levels, leveraging advanced technology
from the better units to the other units represents “low hanging fruit,” as
compared to developing new technology. As evidence, consider how Arcelor
Mittal’s 2006 Activity Report (Arcelor Mittal 2006) opens its description of
R&D accomplishments (page 61): “The merger has added a new dimension
to the R&D effort by widening the range of potential applications for existing
technical know-how and permitting the better use of this expanded R&D
resource in order to accelerate project work.” A more graphic explanation of
the technology transfer process is provided by Business Week (2010):

27
“To tap into that expertise, Burns Harbor recently dispatched a team of
engineers to Sidmar, Arcelor's crown jewel, in Ghent, Belgium. The idea
was to figure out why, with the exact same inputs, the Europeans were
able to squeeze about 7% more steel out of their mills than the U.S. plants
could. The Americans relished the candlelight dinners in the old quarter of
Ghent, but they were even more wowed by the advanced technology and
shop-floor know-how they saw in Belgium. Now, they're gearing up to use
a Sidmar device called a bomb that can be plunged into molten steel to
sample its chemical properties and detect imperfections early on. The
Mittals are pushing for just that sort of knowledge exchange across the
company's global network, from Brazil to Kazakhstan. The many cultures
now under the Arcelor Mittal flag provide "an inexhaustible source of
competitive advantage," says Greg Ludkovsky, the company's chief
technology officer for the Americas.””
The main point here is that the Arcelor Mittal merger resulted in a much larger
platform of application sites over which existing technologies could be
leveraged. In other words, absent the merger, each of these technologies
would have suffered from a much smaller scope of application, thus reducing
the return on investment for that particular technology.
A second aspect with regard to technology in the case of Arcelor Mittal is
represented by the company’s approach to balancing global scale with
responsiveness to local pressures. One specific instance: Demand and
product requirements for steel vary across markets, and Arcelor Mittal needed
to view demand regionally in order to optimize production and customer
service. However, internal data on approx. 200,000 customers were scattered
across 30+ systems. With IBM’s help, Arcelor Mittal developed an integrated
system that provides managers with a unified view of regional patterns in
demand. (IBM 2010).

28
To summarize the second part of our story, we propose that the geographic
restructuring of the global steel industry should be understood in terms of the
rise of steel production and consumption in the emerging markets as well as
the rise of the steel MNC. The drivers of this fundamental shift, it turns out,
are the same three drivers we noted earlier in the American industry’s case:
technology-based competition (although this time with a focus on information
technology, not steel production techniques), demand shifts, and managerial
agency.
9. Patterns in the restructuring of the industry.
Before concluding the Chapter, we would like to point out two features of the
regional restructuring that we have described in the US steel industry and in
the global industry. The first feature can be summarized as a shift from the
“Core-Periphery” model to one of “multipolarity.” The second feature can be
summarized as a regional model of globalization. Below, we briefly discuss
each in turn.
In both the US domestic industry and at the global level, our analysis
suggests the relative decline of the hitherto core and the ascendancy of the
periphery. However, even more fundamentally, the data and trends perhaps
suggest the irrelevance of the core-periphery model itself. Specifically, what
we see is not merely a switch in the roles or the emergence of new cores and
new peripheries, but rather a new structure in which different regions are
much more equally balanced. Although it might appear that China is the new
core and all other regions are peripheries, the steel intensity trends noted
earlier suggest that this is not sustainable beyond the medium term. As
emerging nations other than China gain speed on their own industrialization
trajectories, we are likely to see greater balance across the regions. More
important, assessed through the lens of global reach and strategic capability

29
of its steel companies, it is hard to describe China as the core. As a rough
illustration, the companies in the list of Top ten steel producers in 2010 (see
Figure 10) represent China (3 companies), Japan (2 companies) and Europe,
South Korea, India, United States, and Brazil (1 company each). This raises
the intriguing possibility that, rather than the core-periphery model,
multipolarity may be more suitable as a descriptor of the global steel industry
of the future.
Experience also suggests that the globalization of the steel industry has not
followed a “flat earth” model, in which patterns of competition are uniform, but
rather a “semiglobalization” model (Ghemawat 2007) that is much more
nuanced and complex. Despite the growth of China and importance of steel
MNCs, steel markets continue to be regional rather than frictionlessly global.
A significant portion of steel exports consists of regional exports, and a steel
producer in Germany is more likely to be in direct competition with a rival in
Poland rather than in Brazil. Ghemawat (2007) points out that regionally
focused strategies are a discrete family of strategies that need to complement
local and global initiatives. From the steel industry’s standpoint, this
exacerbates the organizational complexity associated with global footprints –
in that strong regional hubs need to be created, with technological and
managerial support for extensive knowledge-sharing both regionally and inter-
regionally. Policymakers should take note as well – keeping up with the
industry’s restructuring implies developing new global approaches as well as
closer regional coordination.
10. Summary and conclusions
In this chapter, we proposed technology-based competition, demand patterns,
and managerial agency as explanatory variables for the process of
restructuring in the American steel industry in terms of its economic
geography and in the context of sweeping changes in the industry’s global
30
structure. After World War II and leading through the 1960’s, the industrial
structure of the American steel industry was dominated by large integrated
steel producers. During this period, competition was primarily among
integrated firms and the location decisions taken during the period concerned
individual production units within those firms. Subsequently, in the 1970’s
and on through the 1990’s, steel minimills emerged in the United States to
challenge the market share of integrated producers. Finally, with the turn of
the century, world steel markets began to reshape based on globalization.
Energized by industry liberalization and privatization in many parts of the
world, and supported by information technology and managerial innovations
that increased spans of control, managerial agency manifested itself in the
form of aggressive M&A to create the first large-scale steel MNCs. By
examining these critical periods of restructuring in the American industry as
well as in the industry globally, the role of economic geography as a
competitive factor is exposed. In the process, we hope to have provided
context for understanding the regional and spatial implications of competitive
adjustment.

31
References
Ahlbrandt, Roger S., Richard Fruehan, and Frank Giarratani (1996), The
Renaissance of American Steel: Lessons for Managers in Competitive
Industries, New York, NY, USA: Oxford University Press.
American Iron and Steel Institute (various years), Annual Statistical Report,
Washington, D.C., USA: American Iron and Steel Institute.
Arcelor Mittal (2006), “Activity Report 2006.”
Arcelor Mittal (2011), Untitled Presentation at the Citi Metals and Mining
Nordic Symposium, December 6, 2011. Available online at
http://www.arcelormittal.com/corp/~/media/Files/A/ArcelorMittal/investo
rs/presentations/investor-conference/2011/2011-12-Citi-Stockholm,
last accessed May 7, 2012.
Barnett, Donald F., and Robert W. Crandall (1986), Up from the Ashes: The
Rise of the Steel Minimill in the United States, Washington, DC, USA:
The Brookings Institution.
Beeson, Patricia, and Frank Giarratani (1998), “Spatial Aspects of Capacity
Change by U.S. Integrated Steel Producers,” Journal of Regional
Science, 38: 425-444.
BHPBilliton (2012), “BHP Billiton Iron Ore – Growth and Outlook.” Investor
presentation made on March 20, 2012. Available online at
http://www.bhpbilliton.com/home/investors/reports/Documents/2012/12
0320_AJMConference.pdf, last accessed May 7, 2012.
Blume, Rick (2008). “In the grip of globalization.” BCMC 2008 Educational
programs presentation, available online at
http://2009.bcmcshow.com/images/2008/080910%20Blume%20presen
tation.pdf, last accessed May 7, 2012.
BusinessWeek (2010), “Mittal & Son: An Inside Look at the Dynasty that
Dominates Steel.” Available online at
http://www.businessweek.com/magazine/content/07_16/b4030001.htm
, last accessed May 7, 2012.

32
Center for Industry Studies (2003), US Steel Plant Database, Pittsburgh, PA,
USA: University of Pittsburgh.
Chandler, Alfred D. (1993). The Visible Hand: The Managerial Revolution in
American Business. Cambridge, MA, Belknap Press.
Christensen, Clayton M. (2000). The Innovator's Dilemma. New York, Harper.
Ghemawat, Pankaj (1995), "Competitive Advantage and Internal
Organization: Nucor Revisited," Journal of Economics & Management
Strategy, 3 (4): 685-717.
Ghemawat, Pankaj (1997). Games Businesses Play: Cases and Models.
Cambridge, MA, MIT Press.
Ghemawat, Pankaj (2007). Redefining Global Strategy: Crossing Borders in a
World Where Differences Still Matter. Boston, MA, Harvard Business
School Press.
Ghemawat, Pankaj and Ravi Madhavan (2011). “Mittal Steel in 2006:
Changing the Steel Game,” HBSP Case PG0002-PDF-ENG.
Hall, Christopher G. L. (1997), Steel Phoenix: The Fall and Rise of the U.S.
Steel Industry, New York, NY, USA: St. Martin’s Press.
Hekman, John S. (1978), “An Analysis of the Changing Location of Iron and
Steel Production in the Twentieth Century,” American Economic
Review, 68: 123-133.
Hoerr, John P. (1988), And the Wolf Finally Came, Pittsburgh, PA, USA:
University of Pittsburgh Press.
IBM (2007), “Beyond the Familiar: Global Integration for Metals, Mining and
Forest and Paper Companies.” IBM Institute for Business Value report,
available online at http://www-
935.ibm.com/services/us/gbs/bus/pdf/g510-7885-
00_beyondfamiliar.pdf, last accessed May 7, 2012.
IBM (2010), “Arcelor Mittal,” IBM Software Information Management case
Study. Available online at
ftp://public.dhe.ibm.com/common/ssi/ecm/en/imc14604usen/IMC14604
USEN.PDF, last accessed May 7, 2012.

33
Ichniowski, Casey, Kathryn Shaw, and Giovanna Prennushi (1997), “The
Effects of Human Resource Practices on Productivity: A Study of Steel
Finishing Lines,” American Economic Review, 87 (3): 291-313.
Isard, Walter, and William M. Capron (1949), “The Future Locational Pattern
of Iron and Steel Production in the United States,” Journal of Political
Economy, 57: 119-133.
KPMG (2009), “China’s Iron and Steel Industry Amid the Financial Crisis.”
Available online at
http://www.kpmg.com/Global/en/IssuesAndInsights/ArticlesPublications
/Documents/China-Iron-and-Steel-Industry.pdf, last accessed May 7,
2012.
Kumar, Nagesh, and Alka Chadha (2009), “India’s Outward Foreign Direct
Investments in Steel Industry in a Chinese Comparative Perspective.”
Industrial and Corporate Change, 18(2): 249-267
Laplace Conseil (2003), “The Steel Industry Globalization Trends: Abstract of
Presentation to LME Members.” Available online at
http://www.laplaceconseil.com/LaplaceConseil/htdocs/admin/upload//Fi
le/LME%20Steel%20Globalization%20Trends.pdf, last accessed April
28, 2012.
Lichtenstein, John (2011). “Global Steel’s Strategic Imperatives,” Remarks at
Steel Success Strategies Conference XXVI. Available online at
http://www.accenture.com/SiteCollectionDocuments/PDF/Accenture-
Global-Steels-Strategic-Imperatives.pdf, last accessed May 7, 2012.
Marengo, Louis (1955), “The Basing Point Decisions and the Steel Industry,”
American Economic Review, 45 (2): 509-522.
Old, Bruce S. (1985), “The Competitive Status of the U. S. Steel Industry: A
Study of the Influences of Technology in Determining International
Industrial Competitive Advantage.” Washington, DC: National
Academies.

34
Pittsburgh Regional Planning Association (1963), Region in Transition: Report
of the Economic Study of the Pittsburgh, Volume 1, Pittsburgh, PA,
USA: University of Pittsburgh Press.
PwC Price Waterhouse Coopers (2004), “Forging Ahead: Mergers and
Acquisitions Activity in the Global Metals Industry, 2004.”
Rogers, Robert P. (2009), An Economic History of the American Steel
Industry, New York, NY, USA: Routledge.
Tiffany, Paul A. (1987). Opportunity denied: The abortive attempt to
internationalize the American steel industry, 1903-1929. Working
paper, The Wharton School, University of Pennsylvania.
Tiffany, Paul A. (1988), The Decline of American Steel: How Management,
Labor, and Government Went Wrong, New York, NY, USA: Oxford
University Press.
U.S. Geological Survey, USGS (1998), Minerals Information: Iron Ore
Statistical Compendium, Washington, D.C., USA: U.S. Geological
Survey. URL:
http://minerals.er.usgs.gov/minerals/pubs/commodity/iron_ore/stat/
Wall, Joseph Frazier (1989), Andrew Carnegie, Pittsburgh, PA, USA:
University of Pittsburgh Press.
Wall Street Journal (2005), “Mittal Steel plans plant in India after buying part
of Chinese firm.” October 5, 2005, p. B3J.
Wall Street Journal (2010), “Thyssen’s High-Tech Relay; Steelmaker Uses
Computer Networks to Coordinate Operations on Three Continents.”
Available online at
http://professional.wsj.com/article/SB100014240527487046818045760
17692241019246.html?mod=googlenews_wsj&mg=reno-wsj, last
accessed May 7, 2012.
Warren, Kenneth (2001), Big Steel: The First Century of the United States
Steel Corporation, 1901-2001, Pittsburgh, PA, USA: University of
Pittsburgh Press.

35
Womack, James P., Daniel T. Jones, and Daniel Roos (1990), The Machine
that Changed the World, New York, NY, USA: Rawson Associates.

36
Figure 1
Integrated Steelmaking Schematic
Ore Coal Coke
Blast Furnace
Basic Oxygen Furnace
Secondary Steel making
Continuous Casting
Iron Making
Steel Making
Scrap metal
Pig Iron

37
Figure 2
Electric Arc Furnace Steelmaking Schematic
Ferrous Scrap
Electric Arc Furnace
Continuous Casting
Steel Making
Pig Iron
Directly Reduced
Iron
Secondary Steel making

38
Table 1
Regional Percentage Shares of U.S. Steel Production, 1940 – 2008
OH
PA
IL-IN
Historical
Core Region
Sub-total
All Other
States
Total
1940 21 30 21 72 28 100%
1950 19 28 20 68 32 100%
1960 17 24 22 64 36 100%
1970 16 23 23 62 38 100%
1980 14 21 26 61 39 100%
1990 17 12 29 58 42 100%
2000 16 7 29 52 48 100%
2008 15 6 29 50 50 100%
Source: American Iron and Steel Institute (various years), Annual Statistical Report, Washington, D.C., USA: American Iron and Steel Institute.

39
Table 2
Steel Production by Furnace Type: Average Annual Production for Each Decade, 1960s - 2000s
(Millions of Net Tons)
Open Hearth
Basic Oxygen
Electric Arc
Total
(All Furnaces)
1960-69 82.3* 24.4 13.0 119.7
1970-79 30.0 76.3 26.3 132.6
1980-89 6.9 56.0 31.3 94.2
1990-99 0.5 59.1 41.8 101.4
2000-08 0.0 49.7 55.7 105.4
*Note: Includes a small amount of production from Bessemer furnaces, which were completely decommissioned in the United States by 1968. Source: American Iron and Steel Institute (various years), Annual Statistical Report, Washington, D.C., USA: American Iron and Steel Institute.

40
Figure 3
Basic Oxygen Furnace (BOF) Capacity in State-based Regions: Annual Average Capacity in each Decade, 1970s, 1980s, and 1990s
(Millions of Tons)
Source: Center for Industry Studies, US Steel Plant Database, Pittsburgh, PA, USA: University of Pittsburgh.

41
Figure 4
Electric Arc Furnace (EAF) Capacity in State-based Regions: Annual Average Capacity in each Decade, 1970s, 1980s, and 1990s
(Millions of Tons)
Source: Center for Industry Studies, US Steel Plant Database, Pittsburgh, PA, USA: University of Pittsburgh.

42
Figure 5
Location of Steel Plants in the United States, 2003
Source: Center for Industry Studies, US Steel Plant Database, Pittsburgh, PA, USA: University of Pittsburgh.

43
Table 3
Size Distribution of U.S. Steel Minimills by Plant Capacity, 1978 and 2003
Plant Capacity (Thousands of Tons)
1978 (Number of
Minimill Plants)
2003 (Number of
Minimill Plants)
1,000 or more 3 22
800 – 999 4 10
600 – 799 4 15
400 – 599 9 13
200 – 399 13 4
Less than 200 11 1
Total number of minimill
plants
44 65
Total minimill plant capacity 20,293 61,089
Average minimill plant
capacity
461 940
Median minimill plant
capacity
350 750
Source: Center for Industry Studies, US Steel Plant Database, Pittsburgh, PA, USA: University of Pittsburgh.
44
Figure 6
Regional Price Differentials Based on the RMDAS™ Ferrous Scrap Price Index: Monthly Price for Prompt Industrial Composite, 2006
(Delivered Price – U.S. Weighted Average)
Source: Management Science Associates’ (MSA) Raw Material Data Aggregation Service™ (RMDAS): http://rmdasindex.msa.com/

45
Figure 7
The Shift to Asia: Crude Steel Production Share Across World Regions
Source: World Steel Association

46
Figure 8
The Rise of China: Crude Steel Production Share in Key Markets
Source: World Steel Association

47
Figure 9
M&A Deal Activity in the Global Steel Industry
Source: pwc Metal Deals: Forging Ahead, various annual issues

Figure 10
How Megadeals Reshaped Industry Leadership: Top 10 Steel Producers (Million Metric Tonnes)
* indicates a steelmaker that improved its Top 10 standing by means of major acquisition(s) in that year
Source: World Steel Association