Embed Size (px)
Citation preview

Initiation and establishment of the industry
Pakistan is amongst the various underdeveloped countries and still in it’s developing
phase. The political instability of the country and uncertain law and order situation has
always dented the industrialization and development significantly. The steel sector plays
a vital role in the infrastructure development of the country but unfortunately our nation
has been deprived of a large scale and outpacing steel sector ever since. As reported by
Pakistan Steel Melters Association, the initial idea for the domestic iron and steel
industry was put forward in the first five year plan (1955—1960) of Pakistan but the first
feasibility for having a domestic iron and steel industry was approved eleven years later
in 1971 in the form of “Pakistan Steel Mill” when the GOP of the time took seriously that
continuous imports of iron and steel will drastically hurt the fiscal deficit of the country.
Later, in December 1973 with due techno-assistance of USSR the foundation stone was
laid for the Pakistan Steel Mills Corporation (Pvt.) Ltd. in South East of Karachi in close
proximity to Port Qasim. The production capacity of Pakistan Steel Mills was expandable
upto 3 Million Metric Tons per annum. This kick started the industrialization phase and
sooner more private companies came into existence standing as competitors to the
largest capacity of Pakistan.
The smoothly operating PSM (which was solely producing around more than 1 MT tons
of the country’s total steel output) could not survive long due to negligence &
mismanagement of the executives. On June 10th 2015, the tandems of the huge capacity
of PSM abruptly ceased operations owing to gas supply cut by SSGC on account of its un
cleared dues of approximately PKR 35bn.
The unanimous production halts and difficulties PSM faced let the competitors i.e.
MUGHAL, ASTL, ISL and etc. reap its market share although the capacities of these listed
companies are far less than the PSM.
Industry Overview
The steel sector is counted amongst the various sectors that contribute to the GDP of
Pakistan significantly. As reported by SBP, the Pakistan steel industry produces ~ 6 million
metric tones of steel annually which depicts the growth prospects of construction
material sector. Likewise cements this industry is also dependent upon the infrastructure
development and “PSDB (Public Sector Development Budgets)”.
The steel sector of Pakistan has always been subject to various challenges and therefore
could not reap margins like other businesses. Our industry materially relies on steel scrap
(imported) which is why the imports lead to squeeze out the margins as exchange rate
parity applies. The alternative source for steel scrap is the ship-breaking yard of Gadani
which is facing many challenges already and due to its downfall our steel industry
substantially relies on imports only.
Please refer to the last page for important disclosures
Source: Company Accounts, Nael Research
STEEL INDUSTRY OF PAKISTAN Dec 28th, 2016
STEEL INITIATION EQUITY RESEARCH, REP—099
VIBRANT GROWTH PROSPECTS AMIDST CHALLANEGES
Taha Rehman AC
[email protected] (+92-21) 32461812-13 (Ext.) 140
150
250
350
450
550
650
750
850
FY09 FY10 FY11 FY12 FY13 FY14 FY15 FY16
Rebars Scrap
Historical Prices (USD/ton)
Fig: 9
Source: Herald/Dawn, Nael Research
Master Plan Of Steel Mill Township, Karachi Fig: 1
http:jamapunji.pk/

2
Source: Pak Steel, Nael Research
The dumping of steel in Pakistan by China & the Free — Trade Agreements have also
materially injured the sector, as cheaply priced steel is dumped in Pakistan snatching the
market share of the local producers. Alongside this drastic issue that we face in our
domestic market our exports are deteriorating too as China i.e. the largest producer and
consumer of steel & other metallurgies of the world has captured the foreign markets as
well. The rankings for the production output clearly indicates the huge gap between
China and several other nations ranked as top 10. Even the 2nd top producer of Steel in
the world i.e. Japan is way below (-717% ) in comparison to China.
This outlier put forward the extreme competitive advantage strategy and barrier for new
entrants in the global market China has shaped.
Product Portfolio of the Industry
The Pakistan Steel Industry supplies steel in a diversified product mix inclusive of Billets,
Re-bars, Galvanized Steel, HoT & Cold Rolled Coils and etc.
CAPITAL (PVT) LTD NAEL
Pakistan Steel Sector
PRODUCT PORTFOLIO OF THE STEEL INDUSTRY
Sr. No. Finished Products Unsorted Products By - Products
1 Billets HR Pig Iron
2 Re-bars CR Hard Coke
3 Hot Rolled GP -
4 Cold Rolled - -
5 Galvanized - -
Rank Nation Output (MnT)
1 China 70.65
2 Japan 8.648
3 India 8.059
4 United States 6.748
5 Russia 6.012
6 South Korea 5.43
7 Germany 3.811
8 Turkey 2.729
9 Brazil 2.506
10 Ukraine 2.173
WORLD STEEL RANKING 2016
Source: seasi.com/SEASI, Nael Research

3
MUGHAL IRON & STEEL (MUGHAL)
COVERAGE INITIATION
COMPANY DATA
52-week Price Range (PKR) 99.59—57.88
No. of Shares Outstanding (mn) 125.80
P/B (x) 1.95
EV/Ebitda (x) 7.18
Market Cap (PKRmn) 10,787
Market Cap (USDmn) 102.91
Free Float (%) 24 %
Year End Jun
KATS Code MUGHAL
Source: KSE
RELATIVE TO KSE—100
Source: Company Accounts, NAEL Research
Source: PSX, Nael Research
EQUITY RESEARCH
MN
We initiate our coverage on MUGHAL with ‘BUY’ rating: Our Jun-17 DCF based
price target of PKR 113/sh implies 32% upside potential from current price levels
of PKR 85/sh.
Demand room due to materialization of CPEC: MUGHAL currently operates at
capacity utilization of 75% for its rolling mill and 64% for the melt-shop
respectively (FY16). This implies a room for uptick in capacity utilization owing to
I) Increase in demand of billets and re-bars.
II) Pending CPEC projects to be materialized in the near future.
Price uptick & Variations :
I) Regulatory Duty replaced from 15% to 30% on re-bars..
III) Upsurge in steel prices post Gadani incident
Re—Commencement of 9.3MW Gas Power plant: Mughal steel has a slightly
diversified energy mix as the company uses power from internal generation from
its 9.3MW Gas power plant.
I) We have incorporated the impact of the 9.3MW Gas fired power plant in our
model at a lower utilization level.
II) This can add up to PKR 2.25/sh in the earnings of the company in FY17E
annualized.
Conversion of Bar Mill into Tandem & Installation of induction furnaces:
Successfully this year MUGHAL was able to modify its bar mill converting it into a
tandem mill which would charge in further efficiencies as tandem allows rolling in
one pass...
Investment Risk: Key risks to our investment thesis are 1) Price volatility 2) Surge
in steel scrap prices 3) Decline in local demand 4) FTA with China & 5)
Privatization of PSM .
FY17 FY18 FY19 FY20 FY21
EPS 11.86 12.39 15.26 15.67 15.45
BV/sh 43.95 51.38 61.14 70.24 79.63
P/Ex 7.23 6.92 5.62 5.47 5.55
DPS 5.00 5.00 5.50 6.50 6.00
EBITDA/sh 20.5 20.2 24.3 24.9 24.5
EBITDA Margin (%) 12% 11% 12% 12% 11%
ROA 18% 18% 19% 18% 16%
ROE 29% 26% 26% 23% 20%
Gross Margin (%) 14% 13% 14% 13% 12%
Net Profit Margin (%) 7% 7% 8% 7% 7%
FINANCIAL HIGHLIGHTS
BUY
Price Target : PKR 113/sh
0
1
2
3
4
5
6
7
8
9
10
80
130
180
230
280
330Volume MUGHAL KSE - 100

4
Valuation
We initiate our coverage on MUGHAL with ‘BUY’ recommendation using discounted free
cash flow method. We have used Free Cash Flow to Firm methodology to derive the
intrinsic value of MUGHAL at PKR 113/sh. The following assumptions have been
incorporated to arrive at our target price.
Terminal growth rate of 4%
Risk free rate of 7.8% (10yr PIB)
Market Risk Premium of 6% & Adjusted Beta of 1.17 (using 1yr)
Based on above assumptions, MUGHAL’s Jun-17 PT is reckoned at PKR 113/share,
offering material upside potential of 32% from the LDCP & Dividend Yield (%) of 5.8%.
Company Overview
MUGHAL steel is a Lahore based company having its plant and factory in Shiekhupura
District of Punjab. The entity got it self listed at PSX recently in 2015 after a successful
IPO.
The company is specialized in producing billets, re-bars, hot -rolled steel and unsorted
end cuts. In FY16A the company showed a growth of 13.4%YoY in comparison to FY15A
reporting net profit of PKR 893mn. The net turnover of the firm grew by noteworthy 55%
YoY in FY16A clocking in at PKR 12.24bn owing to outpacing local demand.
Alongside a significant growth in turnover MUGHAL also managed to retain its gross
margins at stagnant 11% although price fluctuations in Steel Scrap were also witnessed in
the international market. We observe MUGHAL as a strong participant of the industry
owing to its significant capacity to produce 688k tons from its rolling mill and 546k tons
from the melt-shop.
If the outlook for demand remains steady MUGHAL can efficiently utilize its capacity to
cater the surging appetite of consumption of the steel in the country.
CAPITAL (PVT) LTD NAEL
Valuation FY17E FY18E FY19E FY20E FY21E
WACC 12% 11% 11% 11% 11%
FCFF 928 904 1,430 1,404 1,511
PV of FCFF 928 813 1,162 1,020 978
Debt 4,232 4,196 4,196 4,188 4,180
PV of FCFF 4,901
Terminal Value 20,982
PV of Terminal Value 13,580
Enterprise Value 18,481
PV of Debt 4,232
Equity Value 14,249
Target Price 06/30/2017 113
Current Price 85
Upside 32%
# of shares 126
Pakistan Steel Sector : Mughal Iron & Steel
MUGHAL: P/Ex Band Analysis Figure: B
Source: Nael Research
0
20
40
60
80
100
120
4QFY15 1QFY16 2QFY16 3QFY16 4QFY16 1QFY17
Actual Price 2 4
6 8 10
12
PT Sensitivity
Source: Nael Research
Risk free rate
6.8
7.3
7.8
8.3
8.8
Growth rate %
2% 99 94 89 84 80
3% 112 106 100 94 89
4% 129 121 113 106 100
5% 152 141 131 122 114
6% 185 169 155 143 133
Figure: A

5
Total Plant Capacity
Investment Argument
Our investment view on MUGHAL is based on improving cost efficiencies and growth in
earnings for FY17E-FY19E based on following fundamentals alongside a few risk factors
and challenges the industry may face:
Demand room due to materialization of CPEC
MUGHAL currently operates at capacity utilization of 75% for its rolling mill and 64% for
the melt-shop respectively (FY16A). This implies a room for uptick in capacity utilization
owing to
increase in demand of billets and re-bars
the pending CPEC projects to be materialized
Based on current financials, we don’t expect the company to plan any expansionary
project soon.
Price uptick & variations
Anti—dumping Duty expected to be imposed on dumped steel/ Re– bars
from China :
Price variance is a key factor in the steel sector as margins are squeezed and even little
fluctuations in the prices cause material impact on the earnings/margins. Recently NTC
has took the plea for imposition of the anti—dumping duty on steel reinforcing bars
(Rebars) and the decision is predicted to materialize in the near future. We assume that
increasing the duty on imported steel will provide room for evolution of the domestic
steel industry and might discourage the imports, creating positive grounds for major
players inclusive of MUGHAL & ASTL.
Current structure of duties i.e. Regulatory Duty & Custom Duty levied on the steel
products is displayed in Fig 2 & 3. (RD on rebars was 15% previously and now it has
been increased to 30%)
Upsurge in re-bars prices post Gadani incident
The ship-breaking yard at Gadani is considerably an alternative source of raw material
for the Pakistan’s steel industry in the form of scrap/billets. Recently, due to an incident
at Gadani the commercial activities were ceased at the ship-breaking yard as fire blew
post explosion in a ship which was being dismantled. The incident’s impact was
immediately witnessed by the industry as the steel prices surged upto ~ 15,000/ton
post suspension of commercial activities at the ship breaking yard.
We expect this to stimulate the earnings and help the steel players to retain margins .
CAPITAL (PVT) LTD NAEL
Fig: 1.1
Source: Company Accounts, Nael Research
RD Composition Fig: 2
Source: Industry Sources, Nael Research
Mn Tons
Price/ ton Billets Re-bars
Grade 60 - 73,000
Grade 6 & 7 74,000 -
Grade 9 75,000 -
Source: Company Accounts/Pak Steel, Nael Research
CD Composition Fig: 3
Source: Industry Sources, Nael Research
Pakistan Steel Sector : Mughal Iron & Steel
Scrap, 5%
Billets, 15%
Rebars, 30%
Scrap Billets Rebars
0%
5%
10%
15%
20%
25%
30%
35%
Scrap, 3%
Billets, 6%
Rebars, 5%
Scrap Billets Rebars
0%
1%
2%
3%
4%
5%
6%
7%
688,000
56%
546,000
44%-
100,000
200,000
300,000
400,000
500,000
600,000
700,000
800,000
Capacity 100%
Re- rolling Melting

6
Re-commencement of 9.3MW Gas fired power plant
Mughal steel has a slightly diversified energy mix as the company uses power from
internal generation from its 9.3MW Gas power plant along side the grid to lit the
electric furnace. Recently, through a notice the firm announced that their gas fired
power plant has started commencing operations again. This gas fired power plant was
un-operational previously due to non-availability of gas in the vicinity of the plant and
factory.
However, being skeptical and conservative we have incorporated the impact of the
9.3MW Gas fired power plant in our model at a lower utilization level. We believe that
re-commencement and continuous operations can add up to PKR 2.25/sh in the
earnings of the company in FY17E (annualized) pulling the gross margins up to 14% in
FY17E from 11% of FY16A .
New coal gasification plant to act as an energy alternative:
The company has invested in procurement of the first ever coal gasification power plant
in the country. Once the Coal gasification plant comes online MUGHAL will be able to
produce clean syngas from the plant which could be used as an alternative of natural
gas (the availability of which is an issue in the region where the plant lies) in the heating
process.
The company has already incurred the CAPEX in this regard but not declared the time
frame yet as to when the plant shall be procured and start commencing operations,
therefore we have not incorporated its impact in our model.
The Sahiwal Coal Power Project
The Mughal Iron & Steel’s plant lies at a distance of 17Km from the Shiekhupura road in
Lahore. The ideal geo-graphical position has given MUGHAL an advantage to supply
steel bars to the New Sahiwal Coal Power Project which is under construction at Sahiwal
just 3 hours away by road from Shiekhupura’s plant location (Refer Figure.6).
This project is supposed to add up to the company’s turnover somehow as its 2nd phase
is to start up soon this year.
Conversion of Bar Mill into Tandem & Installation of induction furnaces
Successfully this year MUGHAL was able to modify its bar mill converting it into a
tandem which would charge in further efficiencies as tandem allows rolling in one pass
unlike an old rolling mill in which rolling is done in several passes.
The old girder mill was also modified into direct rolling through proper installation of
induction furnaces. The new “Direct Rolling” will enable the company to produce the
girder directly from scrap and thus save the energy and production cost as re-heating
furnaces for re-heating billets would not be needed.
CAPITAL (PVT) LTD NAEL
Production Outlook
Source: Company Accounts, Nael Research
Fig: 5
MT
Source: Company Accounts, Nael Research
MUGHAL’s D/A & D/E Fig: 7
Source: Company’s Account, Nael Research
-
100,000
200,000
300,000
400,000
500,000
600,000
FY15 FY16 FY17E FY18E FY19E FY20E FY21E
Production Requirement
0%
10%
20%
30%
40%
50%
60%
70%
80%
FY15A FY16A FY17E FY18E FY19E
D/A D/E
0%
2%
4%
6%
8%
10%
12%
14%
16%
FY15A FY16A FY17E FY18E
GP Margins NP Margins
Margins Fig: 4
Source: Maps, Nael Research
Ideal geographical location Fig: 6
Pakistan Steel Sector : Mughal Iron & Steel
7 CAPITAL (PVT) LTD NAEL
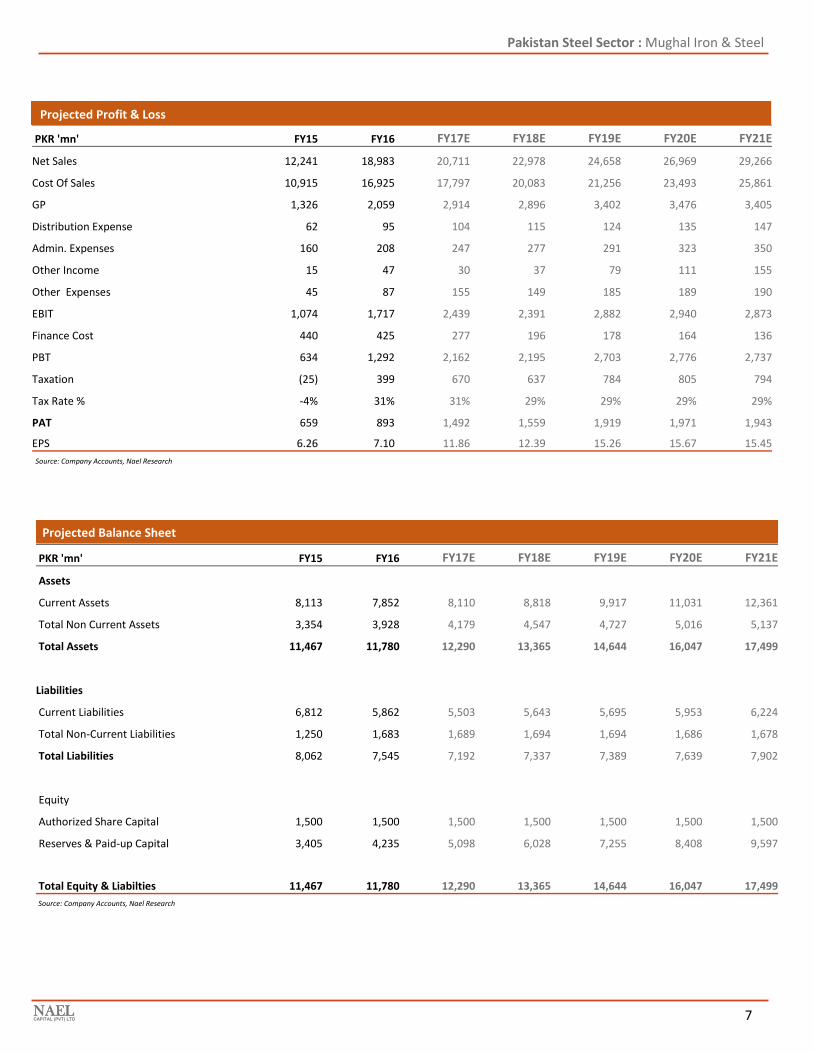
PKR 'mn' FY15 FY16 FY17E FY18E FY19E FY20E FY21E
Net Sales 12,241 18,983 20,711 22,978 24,658 26,969 29,266
Cost Of Sales 10,915 16,925 17,797 20,083 21,256 23,493 25,861
GP 1,326 2,059 2,914 2,896 3,402 3,476 3,405
Distribution Expense 62 95 104 115 124 135 147
Admin. Expenses 160 208 247 277 291 323 350
Other Income 15 47 30 37 79 111 155
Other Expenses 45 87 155 149 185 189 190
EBIT 1,074 1,717 2,439 2,391 2,882 2,940 2,873
Finance Cost 440 425 277 196 178 164 136
PBT 634 1,292 2,162 2,195 2,703 2,776 2,737
Taxation (25) 399 670 637 784 805 794
Tax Rate % -4% 31% 31% 29% 29% 29% 29%
PAT 659 893 1,492 1,559 1,919 1,971 1,943
EPS 6.26 7.10 11.86 12.39 15.26 15.67 15.45
PKR 'mn' FY15 FY16 FY17E FY18E FY19E FY20E FY21E
Assets
Current Assets 8,113 7,852 8,110 8,818 9,917 11,031 12,361
Total Non Current Assets 3,354 3,928 4,179 4,547 4,727 5,016 5,137
Total Assets 11,467 11,780 12,290 13,365 14,644 16,047 17,499
Liabilities
Current Liabilities 6,812 5,862 5,503 5,643 5,695 5,953 6,224
Total Non-Current Liabilities 1,250 1,683 1,689 1,694 1,694 1,686 1,678
Total Liabilities 8,062 7,545 7,192 7,337 7,389 7,639 7,902
Equity
Authorized Share Capital 1,500 1,500 1,500 1,500 1,500 1,500 1,500
Reserves & Paid-up Capital 3,405 4,235 5,098 6,028 7,255 8,408 9,597
Total Equity & Liabilties 11,467 11,780 12,290 13,365 14,644 16,047 17,499
Projected Balance Sheet
Projected Profit & Loss
Source: Company Accounts, Nael Research
Source: Company Accounts, Nael Research
Pakistan Steel Sector : Mughal Iron & Steel

8
MN
AMRELI STEELS LIMITED (ASTL)
COVERAGE INITIATION
BUY
Price Target : PKR 84.40/sh
COMPANY DATA
52-week Price Range (PKR) 76.92—44.21
No. of Shares Outstanding (mn) 297.01
P/B (x) 2.12
EV/Ebitda (x) 12.9
Market Cap (PKRmn) 19,977
Market Cap (USDmn) 190.5
Free Float (%) 25 %
Year End Jun
KATS Code ASTL
Source: KSE
RELATIVE TO KSE—100
Source: Company Accounts, Nael Research
Source: PSX, Nael Research
EQUITY RESEARCH
We initiate our coverage on ASTL with ‘BUY’ rating: Our Jun-17 DCF based price
target of PKR 84.4/sh implies 25% upside potential from current price levels of
PKR 67/sh.
Robust turnover growth on account of demand boom: We envisage ASTL
amongst the major beneficiaries to reap benefits from the demand boom in the
industry post expansion, owing to;
1. Urbanization leading to increased infrastructure development
2. Higher utilization of PSDB (Public Sector Development Budget)
3. Manifestation of CPEC.
New 100% Equity Financed Rolling Capacity at Dhabeji: The current position of
the industry proposes vibrant growth prospects as infrastructural development is
at its peak. To create further room to produce and cater the demand ASTL is
currently in the process of expanding its rolling mill capacity of Dhabeji by 300k
tons & Melt Shop by 150k tons per annum …
Dhabeji’s Plant proximity to Port—Qasim: The Dhabeji Plant of the rolling
capacity of ASTL which currently stands at 180k tons per annum enjoys the
advantage of its closer proximity to the Port Muhammad Bin Qasim. The plant lies
only 25.4km (38mins drive) away from Port Muhammad Bin Qasim...
Change in duties structure to add value: … The change in the duty structure/anti-
dumping imposition on re-bars will discourage imports of re-bars and will provide
good selling grounds to our domestic producers including ASTL ...
Investment Risk: Key risks to our investment thesis are 1) Further delays in
expansion 2) Surge in steel scrap prices 3) Decline in local demand 4) FTA with
China & 5) Privatization of PSM .
FINANCIAL HIGHLIGHTS
FY17E FY18E FY19E FY20E FY21E
EPS 4.29 8.55 9.98 11.18 11.19
DPS 2.00 4.50 4.50 5.00 5.00
P/Ex 15.73 7.90 6.76 6.04 6.03
BV/sh 32.74 41.69 48.17 55.58 61.68
EBITDA/sh 8.00 14.12 16.32 18.10 18.20
EBIDTA Margin (%) 18% 26% 25% 25% 23%
ROA 16% 21% 20% 18% 16%
ROE 13% 24% 24% 23% 21%
Gross Margin (%) 19% 29% 28% 28% 25%
Net Profit Margin (%) 10% 16% 16% 16% 14%
0
1
2
3
4
5
6
7
8
9
60
70
80
90
100
110
120
130
140
150
160Volume ASTL KSE - 100

9
Valuation
We initiate our coverage on ASTL with ‘BUY’ recommendation using discounted free cash
flow method. We have used Free Cash Flow to Equity methodology to derive the
intrinsic value of ASTL at PKR 84.4/sh. The following assumptions have been incorporated
to arrive at our target price.
Terminal growth rate of 4%
Risk free rate of 7.8% (10yr PIB)
Market Risk Premium of 6% & Adjusted Beta of 1.08 (using 1yr)
Based on above assumptions, ASTL’s Jun-17 PT is reckoned at PKR 84.4/share, offering
25% upside potential from the LDCP and DY(%) of 2.98%.
Company Overview
ASTL is a Karachi based steel company having its plant & factory located in the vicinity of
Dhabeji, Thatta & Site Industrial area of Karachi. The company is one of the largest
manufacturers of steel re-enforcement bars aka (Rebars) in the steel sector of Pakistan.
Previously being a private limited company, ASTL recently got itself listed on the Stock
Exchange of Pakistan via successful IPO. The company reported a profit of PKR 1.2bn in
FY16A depicting a growth of 26%YoY in comparison to the previous financial year despite
a sharp decline in the revenues of the company by -14%YoY.
The decline in the sales of the company was mainly attributable to a decline in the
volumetric sales as well as the price of re-bars. The cheap imported re-bars hurt the
market share of ASTL as buyers turned down being a little price concerned and ASTL had
to slash its prices to regain its market share, which the company efficiently and
effectively did.
CAPITAL (PVT) LTD NAEL
Pakistan Steel Sector : Amreli Steels Limited
Source: Company Accounts, Nael Research
Valuation FY17E FY18E FY19E FY20E FY21E
PV of FCFE 277 1,974 1,911 1,821 1,742
Cost Of Equity 14% 14% 14% 14% 14%
PV of FCFE 7,448
Terminal Value 30,054
PV of Terminal Value 17,621
Equity Value 25,068
Target Price 6/30/2017
84.40
Current Price 67.00
Upside 25%
# of shares 297.01
MUGHAL: P/Ex Band Analysis Figure: B
Source: Nael Research
0.00
10.00
20.00
30.00
40.00
50.00
60.00
70.00
2QFY16 3QFY16 4QFY16 1QFY17
Actual Price 2 4
6 8 10
12
PT Sensitivity
Source: Nael Research
Risk free rate
6.8 7.3 7.8 8.3 8.8
Growth rate %
2% 81 77 74 71 68
3% 86 82 79 75 72
4% 94 89 84 80 77
5% 103 96 91 87 82
6% 114 107 100 94 89
Figure: A

10
Before Expansion
Capacity Utilization Levels
Investment Argument
Our investment view on ASTL is based on improving margins and growth in earnings for
FY18E-FY21E owing to mentioned fundamentals and factors:
Robust turnover growth on account of demand boom
ASTL currently operates at a capacity utilization of 83% for its rolling mill and 84% for its
melting capacity respectively (FY16A) which prompts an alert for further growth
expectations with the current capacity. We envisage ASTL amongst the major
beneficiaries to reap benefits from the demand boom in the industry post expansion,
owing to:
1. Urbanization leading to increased infrastructure development
2. Higher utilization of PSDB (Public Sector Development Budget)
3. Manifestation of CPEC
ASTL is currently in the process of expanding its Dhabeji rolling capacity and billet
manufacturing capacity to maintain market share and stay as an active participant of
the industry, the new rolling capacity is expected to come online by the 2nd quarter of
FY18E.
New 100% Equity Financed Rolling Capacity at Dhabeji
The current position of the industry proposes vibrant growth prospects as
infrastructural development is at its peak. To create further room to produce and cater
the demand ASTL is currently in the process of expanding its rolling mill capacity of
Dhabeji by 300,000 tons & Melt Shop by 150,000 tons per annum. The said project of
the rolling capacity is 100 percent equity financed and costs around PKR 3.4bn i.e. 11.4/
sh. The new expansion will take the current rolling capacity to 480,000 tons per annum.
As reported by the company, the plant is expected to come online from 2nd quarter of
FY18E, therefore we have incorporated its impact in our model from the said quarter of
FY18E. Once the plant is operational we expect the revenues to grow 48% CAGR (FY17E-
FY19E).
Dhabeji’s Plant proximity to Port—Qasim
The Dhabeji Plant of the rolling capacity of ASTL which currently stands at 180k tons per
annum enjoys the advantage of its closer proximity to the Port Muhammad Bin Qasim.
The plant lies only 25.4km (38mins drive) away from Port Muhammad Bin Qasim.
As the whole industry inclusive of ASTL is solely relying on the imports of RM i.e. scrap
the distance of ASTL to Port Qasim adds value to the company in regards of freight—in
cost efficiencies. Although it is known that this may not add a material impact on the
transportation expenses of the company but will some how benefit in terms of
efficiencies the company achieve via timely and quick supply of RM form the port to
the plant.
Imposition of Anti-dumping: Investigation in process by NTC
As mentioned earlier, NTC has taken the plea of levying Anti—dumping on imported re-
bars. The change in the duty structure will discourage imports of steel products from
China and will provide good selling grounds to our domestic producers specially ASTL
i.e. one of the largest re-bars manufacturer.
CAPITAL (PVT) LTD NAEL
Fig: 1.1
Source: Company Accounts, Nael Research
Plant Capacity Fig: 2
Source: Company Accounts, Nael Research
Dhabeji Plant to Port Qasim Fig: 3
Source: GoogleMaps, Nael Research
40%
50%
60%
70%
80%
90%
100%
FY12A FY13A FY14A FY15A FY16A
Rolling Mill Melting
Post Expansion
Pakistan Steel Sector : Amreli Steels Limited
-
100,000
200,000
300,000
400,000
500,000
600,000
FY16A FY18E
Rolling Mill Melting

11 CAPITAL (PVT) LTD NAEL
Projected Balance Sheet
Projected Profit & Loss
Source: Company Accounts, Nael Research
Source: Company Accounts, Nael Research
PKR 'mn' FY15A FY16A FY17E FY18E FY19E FY20E FY21E
Net Sales 14,414 12,400 12,908 15,890 19,043 21,384 23,671
Cost Of Sales 11,899 9,608 10,395 11,262 13,651 15,302 17,686
GP 2,514 2,792 2,514 4,628 5,392 6,082 5,984
Distribution Expense 229 216 131 185 208 247 215
Admin. Expenses 281 341 209 299 333 402 345
Other Income 35 15 16 20 24 27 29
Other Expenses 100 165 164 323 384 443 409
EBIT 1,940 2,085 2,026 3,840 4,491 5,016 5,044
Finance Cost 668 336 205 214 257 274 309
PBT 1,272 1,749 1,820 3,626 4,234 4,742 4,735
Taxation 261 470 546 1,088 1,270 1,422 1,411
Tax Rate % 20% 27% 30% 30% 30% 30% 30%
PAT 1,011 1,279 1,274 2,539 2,964 3,319 3,324
EPS 4.54 4.31 4.29 8.55 9.98 11.18 11.19
PKR 'mn' FY15A FY16A FY17E FY18E FY19E FY20E FY21E
Total Current Assets 4,589 8,150 8,094 11,846 15,083 18,020 20,835
Total Non Current Assets 7,674 8,615 7,954 7,662 7,372 7,061 6,735
Total Assets 12,262 16,765 16,048 19,508 22,455 25,081 27,570
Current Liabilities 4,236 4,339 3,355 4,157 5,180 5,602 6,280
Total Non-Current Liabilities 4,074 3,566 3,152 4,608 4,906 5,275 5,247
Total Liabilities 8,310 7,905 6,507 8,765 10,085 10,877 11,527
Equity
Authorized Share Capital 500 500 500 500 500 500 500
Reserves & Paid-up Capital 3,952 8,861 9,541 10,743 12,370 14,204 16,043
Total Equity & Liabilities 12,262 16,765 16,048 19,508 22,455 25,081 27,570
Pakistan Steel Sector : Amreli Steels Limited

12
INTERNATIONAL STEELS LIMITED (ISL)
COVERAGE INITIATION
COMPANY DATA
52-week Price Range (PKR) 96.66—23.34
No. of Shares Outstanding (mn) 435
P/B (x) 4.38
EV/Ebitda (x) 11.3
Market Cap (PKRmn) 42,738.7
Market Cap (USDmn) 407.7
Free Float (%) 40 %
Year End Jun
KATS Code ISL
Source: KSE
RELATIVE TO KSE—100
Source: Company Accounts, NAEL Research
Source: PSX, Nael Research
EQUITY RESEARCH
We initiate our coverage on ISL with ‘BUY’ rating: Our Jun-17 DCF based price
target of PKR 123/sh implies 27% upside potential from current price levels of PKR
97/sh.
Under-utilized Capacity after expansion to break the streak: Recently, after
the successful expansion of the company’s galvanizing capacity from 150k tons
per annum to 462k tons per annum (+208% Addition) and Cold Rolled Steel
capacity to 550k tons per annum from 250k tons (+120% Addition) in FY16A..
1. Going concern auto industry pulling CRC demand : … surge in auto
production units can pull up the demand for CRC (Cold Rolled Steel) as it is
consumed as a major RM by the auto industry. (Refer Fig. 1.2 on Pg. 14)
Penetrating into a new export region i.e Indonesia: … ISL recently penetrated
into another export region as reported in the recent interim report of the
company. Besides South Africa and Middle East, ISL now export to ‘Indonesia’ as
well.
Revision of duties on Cold Rolled & Galvanizing Steel The free—trade agreement
(FTA) with china is crucially damaging the local industry and its producers. The
company has already pledged to NTC for the revision of duty structure on Cold
Rolled Steel and Galvanizing Steel …
Debt Structure: The firm has an ideal debt/equity structure as weightage for debt
is 36% and the rest is equity. Although, this also pops an alert for the investors if
in near future the Discount rate % hikes.
Investment Risk: Key risks to our investment thesis are 1) Price volatility of HRC &
CRC 2) Surge in steel scrap prices 3) Decline in local demand/ Demise of the
Automobile Industry 4) FTA with China & 5) Surge in discount rate.
FINANCIAL HIGHLIGHTS
FY17E FY18E FY19E FY20E FY21E
EPS 6.67 7.43 9.91 11.71 13.46
BV/sh 22.5 23.4 25.7 29.6 35.8
P/Ex 14.77 13.26 9.94 8.41 7.32
DPS 3.00 3.25 4.50 5.25 6.25
EBITDA/sh 12.9 13.9 17.3 19.7 21.9
EBITDA Margin (%) 21% 19% 21% 21% 21%
ROA 23% 23% 28% 29% 28%
ROE 37% 34% 36% 35% 33%
Gross Margin (%) 20% 18% 21% 21% 21%
Net Profit Margin (%) 11% 10% 12% 12% 13%
BUY
Price Target : PKR 123/sh
0
1
2
3
4
5
6
7
8
9
10
0
50
100
150
200
250
300
350
400Turnover ISL KSE - 100
MN

13
Valuation
We initiate our coverage on ISL with ‘BUY’ recommendation using discounted free cash
flow method. We have used Free Cash Flow to Firm methodology to derive the intrinsic
value of ISL at PKR 123/sh. The following assumptions have been incorporated to arrive
at our target price.
Terminal growth rate of 4%
Risk free rate of 7.8% (10yr PIB)
Market Risk Premium of 6% & Beta of 0.83 (using 5yr)
Based on above assumptions, ISL’s Jun-17 PT is anticipated at PKR 123/share, offering
27% upside potential from the LDCP and DY(%) of 3%.
Company Overview
International Steels Limited is a Karachi based company having its plant and factory in
Landhi Industrial Area, Karachi. The firm is specialized in the production of Hot & Cold
Rolled Coils and Galvanized Steel. ISL is a subsidiary of International Industries Limited
(INIL) and the first and only company in Pakistan that manufacture Color Coated Steel in
the country.
The Financial Year of 2016 turned out to be extremely fruitful for the company as the
firm extensively outperformed in terms of margins and profitability. Although globally
the steel prices tightened but yet ISL managed to maintain its turnover growth alongside
showing a robust growth in the earnings by 483%YoY that clocked at PKR 1.17bn in
FY16A.
The GP margins of ISL almost doubled surging to 14% from 8% of FY15A, whereas the net
profit margins propelled to 6% in FY16A against 1% of the previous year (FY15A). We eye
International Steels Limited as the top participant in the industry which is expected to
increase its market share with its diversified product portfolio and best quality.
CAPITAL (PVT) LTD NAEL
Galvanized
Coils
Cold Rolled
Coils
Colored Coils
End Cuts
Bi - Product
Zinc
Product Portfolio Fig: 3
Source: Company Accounts, Nael Research
Pakistan Steel Sector : International Steels Limited
Source: Company Accounts, Nael Research
Valuation FY17E FY18E FY19E FY20E FY21E
WACC 10% 10% 11% 12% 12%
FCFF 2,193 3,198 4,406 4,899 5,843
PV of FCFF 2,193 2,899 3,578 3,530 3,710
Debt 10,312 8,655 6,719 4,872 3,230
PV of FCFF 15,910
Terminal Value 75,704
PV of Terminal Value 48,065
Ent. Value 63,975
PV of Debt 10,312
Equity Value 53,663
Target Price 6/30/2017
123
Current Price 97
Upside 27%
# of shares 435
ISL: P/Ex Band Analysis
Source: Company Accounts, Nael Research
-40.00
-20.00
0.00
20.00
40.00
60.00
80.00
100.00
120.00
Actual Price 3 5 7 9 11 13
PT Sensitivity
Source: Nael Research
Risk free rate
6.8 7.3 7.8 8.3 8.8
Growth rate %
2% 112 105 100 94 89
3% 125 117 110 104 98
4% 142 132 123 116 108
5% 165 152 140 130 122
6% 196 178 163 150 139
Figure: A

14
KTons
Total Plant Capacity
Investment Argument
Our investment view on ISL is based on the company’s significant growth in margins and
earnings & the capacity expansions that will add value:
Under-utilized Capacity after expansion to break the streak
Recently, after the successful expansion of the company’s galvanizing capacity from
150k tons per annum to 462k tons per annum (+208% Addition) and Cold Rolled Steel
capacity to 550k tons per annum from 250k tons per annum (+120% Addition) in FY16A,
we expect that the company has sufficient unutilized capacity which can add up
immense value in terms of turnover through the surging demand.
1. ISL is currently operating at a plant utilization of 67% and 55% for its Rolling and
Galvanizing Capacity Respectively. The Hot dip galvanized steel (HDGS) holds
almost 61% of the company’s total product portfolio concentration being the most
sold product of the company, whereas CRC (Cold Rolled Coils) holds ~ 33% as it is
the second most sold product of the company.
2. The capacity additions in the similar lines can bode well, catering the demand
boom created by growing economy on account of urbanization and CPEC (China
Pakistan Economic Corridor) whereas surge in auto production units can pull up the
demand for CRC (Cold Rolled Steel) as it is consumed as a major RM by the auto
sector. (Refer Fig. 1.2)
Penetrating into a new export region i.e Indonesia
ISL is amongst those manufacturers in Pakistan which has a good export footprint
globally. Despite the challenges every local producer faces in exports having China as
the leader of the market on account of its surplus capacity, ISL recently penetrated into
another export region as reported in the recent interim report of the company. Besides
South Africa and Middle East, ISL now exports to ‘Indonesia’ as well.
Revision of duties on Cold Rolled Coils & Galvanizing Steel
The free—trade agreement (FTA) with china is crucially damaging the local industry and
its producers. The company has already pledged to NTC for the revision of duty
structure on Cold Rolled Steel and Galvanizing Steel. The decision is still withheld by
NTC and the award is not issued as yet.
The firm is expecting a preliminary relief on galvanized sheets and coils, once the
decision is finalized for the duties on galvanized steel and CRC.
Refer Fig. 2 which depicts the price trend of HRC i.e. used as a raw material in producing
CRC. The prices of both HRC & CRC touched a low of USD 355/ton and USD 399/ton
respectively in 2015. The prices seem to be stabilize nearer to USD 450/ton in FY17E
and if they remain within this range ISL will have a positive impact on its earnings.
Debt Structure
The firm has an ideal debt/equity structure as weightage for debt is 36% and the rest is
equity. Although, this also pops an alert for the investors if in near future the Discount
rate % hikes.
Currently the discount rate % hovers around 5.75% on account of which the interest
burden currently is mild.
CAPITAL (PVT) LTD NAEL
Fig: 1.1
Source: Company Accounts, Nael Research
HRC & CRC Price Trend (USD/ton)
Source: Bloomberg, Nael Research
Mn Tons
Total Capitalization Weight % Fig: 3
Source: Company Accounts, Nael Research
-
100,000
200,000
300,000
400,000
500,000
600,000
FY15A FY16A
Cold Rolled Sheets Galvanising
36%
64%
Debt Equity
Pakistan Steel Sector : International Steels Limited
Cold Rolled Steel Vs. Auto Production Units Fig: 1.2
Source: Company Accounts, Nael Research
Units (Mn)
Fig: 2
-
50
100
150
200
250
300
350
400
-
200
400
600
800
1,000
1,200
1,400
1,600
1,800
FY12 FY13 FY14 FY15 FY16
Cold Rolled Steel Auto Production
200.00
300.00
400.00
500.00
600.00
700.00
800.00
2011 2012 2013 2014 2015 2016
CRC HRC

15 CAPITAL (PVT) LTD NAEL
Projected Balance Sheet
Projected Profit & Loss
Source: Company Accounts, Nael Research
Source: Company Accounts, Nael Research
Pakistan Steel Sector : International Steels Limited
PKR 'mn' FY15 FY16 FY17E FY18E FY19E FY20E FY21E
Net Sales 17,938 20,499 27,196 31,853 36,256 41,342 46,364
Cost Of Sales 16,453 17,586 21,856 26,002 28,787 32,837 36,775
GP 1,485 2,913 5,339 5,851 7,469 8,505 9,589
Distribution Expense 168 161 109 144 170 149 168
Admin. Expenses 168 207 192 219 244 219 243
Other Income 137 106 129 140 157 178 208
Other Expenses 22 265 372 455 632 753 891
EBIT 1,264 2,386 4,795 5,174 6,580 7,563 8,494
Finance Cost 1,028 732 710 622 506 388 245
PBT 236 1,654 4,085 4,552 6,074 7,174 8,249
Taxation 34 476 1,185 1,320 1,761 2,081 2,392
Tax Rate % 14% 29% 29% 29% 29% 29% 29%
PAT 202 1,179 2,900 3,232 4,313 5,094 5,856
EPS 0.46 2.71 6.67 7.43 9.91 11.71 13.46
PKR 'mn' FY15 FY16 FY17E FY18E FY19E FY20E FY21E
Current Assets 6,742 8,364 12,789 14,048 15,558 17,733 20,649
Total Non Current Assets 12,333 12,620 13,174 13,031 12,842 12,678 12,298
Total Assets 19,075 20,984 25,963 27,078 28,400 30,411 32,948
Current Liabilities 7,412 8,961 11,838 12,544 12,882 13,167 13,030
Total Non-Current Liabilities 6,685 5,855 6,361 4,952 3,581 2,497 2,033
Total Liabilities 14,097 14,816 18,200 17,497 16,463 15,664 15,063
Equity
Authorized Share Capital 5,000 5,000 5,000 5,000 5,000 5,000 5,000
Reserves & Paid-up Capital 4,978 6,168 7,764 9,582 11,937 14,747 17,885
Total Equity & Liabilties 19,075 20,984 25,963 27,078 28,400 30,411 32,948

16
Key Risks
Price volatility of steel prices
Price volatility remains a downside risk to our target price owing to past trends seen.
Subject to fluctuations of international steel FG prices positive/negative impacts on the
scrip’s price target can be witnessed of any particular company as it creates panic
amongst investors’.
Surge in international scrap prices
The subject companies are significantly dependent upon steel scrap as it is the major
RM consumed by our steel sector. Gross margins maintained and may erode with
increase in scrap & iron ore prices. At macro level, current scenario support the
companies where retail prices are kept constant and input prices are on bearish trend.
The commodity super cycle poses a threat.
Decline in local demand & PSDB
The only driver of steel volumes under current scenario is supported by local demand.
Likewise cement the exports of steel are also deteriorating as China and Ukraine has
captured the export markets.
Our construction material industry relies on PSBD (Public Sector Development Budget),
which notifies that decline in PSDB allocation can impact on the subject companies
revenues.
Free—Trade Agreements with China
China has been dumping its steel in the form of scrap, re-bars and billets since ages. This
has caused a material threat to the domestic producers. If this continues it proposes a
direct threat to the local market and its players as margins are already squeezed.
Privatization of PSM & Re-commencement of Operations
The largest steel and iron capacity of Pakistan i.e. Pakistan Steel Mills which is at halt
and not commencing operations since June 2015. The capacity is expandable up to 3
million metric tons and if by any means re—commence operations in the near future
will hurt the turnover of MUGHAL, ASTL, ISL and etc. by reaping their market share.
Peer Comparison
Absolute Return %
On the basis of absolute return approach from Dec ‘15—Dec ‘16, we have witnessed
that ISL has succeeded its two competitors i.e. MUGHAL & ASTL rigorously in terms of
price gains from December 2015 to December 2016 showing a robust absolute return of
270%. (Refer Figure: B)
Our June’17E Price target of PKR 123/sh depicts ISL as our top pick in the sector
currently.
CAPITAL (PVT) LTD NAEL
22% 29%
270%
MUGHAL ASTL ISL
MUGHAL ASTL ISL
Source: Nael Research
Absolute Return % (Dec 15— Dec 16) Figure: B
Source: Nael Research
Steel Price Volatility (2011— 2016)
200.00
300.00
400.00
500.00
600.00
700.00
800.00
2011 2012 2013 2014 2015 2016
CRC HRC
Galvanise Sheet Rebar
Scarp

17 NAEL CAPITAL (PVT) LTD
Disclosure Related to Author The analyst mentioned on the cover of this report, primarily involved in the preparation of this report, certifies that (1) the views expressed in this report accurately reflect his/her personal views about all of the subject companies/securities and (2) no part of his/her compensation was, is or will be directly or indirectly related to the specific recommendations or views expressed in this report. Disclaimer The report has been prepared by Nael Capital (Pvt.) Ltd and is for information purpose only. The information and opinions contained herein have been compiled or arrived at, based upon information obtained from sources, believed to be reliable and in good faith. Such information has not been independently verified and no guaranty, representation or warranty, expressed or implied is made as to its accuracy, completeness or correctness. All such information and opinions are subject to change without notice. Descriptions of any company or companies or their securities mentioned herein are not intended to be complete and this document is not, and should not be consulted as, an offer, or solicitation of an offer, to buy or sell any securities or other financial instruments. Research Dissemination Policy Nael Capital (Pvt.) Ltd. endeavors to make all reasonable efforts to disseminate research to all eligible clients in a timely manner through either physical or electronic distribution such as mail, fax and/or email. Nevertheless, not all clients may receive the material at the same time. Company Specific Disclosures Nael Capital (Pvt.) Ltd. as per the applicable law or regulation, prohibits its respective directors, officers, representatives, employees and/or related persons to make a purchase and/or sale, or offer to make a purchase and/or sale of any such securities or other financial instruments during the restricted period specified in the company policy. Other Important Disclosures Foreign currency denominated securities is subject to exchange rate fluctuations which could have an adverse effect on their value or price, or the income
derived from them. In addition, investors in securities such as ADRs, the values of which are influenced by foreign currencies effectively assume currency risk.
Stock Recommendation Return
BUY > 15%
HOLD > -15% to < 15%
SELL < -15%
© Copyright 2016, Nael Capital (Pvt.) Ltd. All rights reserved
Chief Executive Officer
Ashraf Bava, CFA
Equity Sales
Muhammad Shakeel, Director Equity Sales
Nasir Muqeet, Institutional Sales
Irshad Ul Haq Khan, Institutional Sales
Research
Taha Rehman, Research Analyst
(92-21) 32461812-13 [email protected]
(92-21) 32461819-22
(92-21) 32461819-22
(92-21) 32461819-22
(92-21) 32461812-13


![Mughal Recovered]](https://img.pdfslide.us/doc/110x75/577d22811a28ab4e1e978d6d/mughal-recovered.jpg)