Embed Size (px)
Citation preview
Steel Diaphragm Innovation
Initiative, Year 5, Final
Report
R E S E A R C H R E P O R T R P 2 1 - 0 4
M a r c h 2 0 2 1
American Iron and Steel Institute
rese
arc
h r
ep
ort
Steel Diaphragm Innovation Initiative, Year 5, Final Report i
DISCLAIMER
The material contained herein has been developed by researchers based on their research findings and is for general information only. The information in it should not be used without first securing competent advice with respect to its suitability for any given application. The publication of the information is not intended as a representation or warranty on the part of the American Iron and Steel Institute or of any other person named herein, that the information is suitable for any general or particular use or of freedom from infringement of any patent or patents. Anyone making use of the information assumes all liability arising from such use.
Copyright 2021 American Iron and Steel Institute
Steel Diaphragm Innovation Initiative –2020, Year 5, Final Report
1
Year 5 Final Report (1 Jan 2020 – 31 December 2020)
Authors:
Lead Investigators Matt Eatherton, Sam Easterling, Jerry Hajjar, Ben Schafer
Research Faculty and Staff, Postdoctoral Scholars Shahab Torabian, Kyle Coleman
Graduate Students Robert Bailey Bond, Nicholas Evans Briggs, Astrid Winther Fischer,
Hamid Foroughi, Raul Avellaneda Ramirez, Gengrui Wei
SDIISteel Diaphragm Innovation Initiative

Steel Diaphragm Innovation Initiative –2020, Year 5, Final Report
2
SDII Information The Steel Diaphragm Innovation Initiative (SDII) is a multi-year industry-academic partnership to advance the seismic performance of steel floor and roof diaphragms utilized in steel buildings through better understanding of diaphragm-structure interaction, new design approaches, and new three-dimensional modeling tools that provided enhanced capabilities to designers utilizing steel diaphragms in their building systems. SDII was created through collaboration between the American Iron and Steel Institute and the American Institute of Steel Construction with contributions from the Steel Deck Institute, the Metal Building Manufacturers Association, and the Steel Joist Institute in partnership with the Cold-Formed Steel Research Consortium; including, researchers from Johns Hopkins University, Virginia Tech, Northeastern University, and Walter P Moore. CFSRC Information The Cold-Formed Steel Research Consortium (CFSRC) is a multi-institute consortium of university researchers dedicated to providing world-leading research that enables structural engineers and manufacturers to realize the full potential of structures utilizing cold-formed steel. More information can be found at www.cfsrc.org. All CFSRC reports are hosted permanently by the Johns Hopkins University library in the DSpace collection:
https://jscholarship.library.jhu.edu/handle/1774.2/40427. Complete list of SDII Participants Lead Investigators Matt Eatherton, Sam Easterling (SDII Year 2-), Jerry Hajjar, Cris Moen, (SDII Year 1), Rafael Sabelli, Ben Schafer Research Faculty and Staff, Postdoctoral Scholars Kyle Coleman (SDII Year 2-), David Padilla-Llano (SDII Year 1 and 2), Shahab Torabian Graduate Students Pat O’Brien (SDII Year 1 and 2), Shaoning Li (SDII Year 2), Astrid Winther Fischer (SDII Year 2-), Basit Qayyum (SDII Year 2 and 3), Nicholas Evans Briggs (Year 3-) Hamid Foroughi (SDII Year 3-), Mithila Bhagavathi Madhavan (SDII Year 3-4), Raul Avellaneda Ramirez (SDII Year 3-), Yifei Shi (SDII Year 3), Gengrui Wei (SDII Year 3-), Robert Bailey Bond (SDII Year 4-), Colin Hug (SDII Year 4)
Steel Diaphragm Innovation Initiative –2020, Year 5, Final Report
3
1 Summary The Steel Diaphragm Innovation Initiative (SDII) is a multi-year industry-academic-government partnership to advance the seismic performance of steel floor and roof diaphragms utilized in steel buildings. This report provides a final report for Year 5 of the overall 5-year SDII plan. Contributions in the final 12 months (1 Jan. 2020 – 31 Dec. 2020) include the following highlights. Innovation and Practice:
• Adoption in ASCE 7 of new provisions for bare steel deck including methods for buildings with rigid walls and flexible diaphragms, alternative diaphragm design with Rs, and special seismic detailing (following on from successful adoption in NEHRP and AISI S400).
• Adoption in ASCE7 of new provisions for concrete-filled steel deck alternative diaphragm design (Rs) procedures (following on from successful adoption in NEHRP).
• Adoption in AISI S310 of new provisions for strength of concrete-filled steel deck.
• Finalization in AISC 342 of new procedures for bare and concrete-filled steel deck diaphragms that recognize inelasticity and AISI S310 for strength.
• Adoption in AISC 360 (approved in current AISC ballot, closeout of AISC 360 balloting has not yet happened) of the use of AISI S310 for strength of concrete-filled steel deck.
• Evolution of fuse and leaf-spring concepts for dedicated and controlled energy dissipation in large concrete-filled steel deck diaphragms in preparation for proof-of-concept testing.
Experiments:
• Completed concrete-filled steel deck cyclic cantilever diaphragm tests. These tests provide experimental support for concrete-filled steel deck strength provisions being developed for the next code cycle in AISI S310 and ductility/seismic detailing provisions for the next code cycle of AISC 341 and 342.
• Completed design, detailing, and acquiring steel for full building bay diaphragm tests which will complete in 2021 and be provided as an addendum to this report.
Modeling:
• Completed a report summarizing the seismic performance of 1-12 story steel-framed buildings with buckling restrained braced frames demonstrating that the use of diaphragms designed with the alternative method and Rs=2.0 for concrete-filled steel deck and Rs=2.5 for bare steel deck is appropriate for this building system.
• Completed a parallel modeling effort on concentric braced frames, demonstrating that the alternative diaphragm design method with appropriate Rs provides improved prediction of diaphragm design forces in these building systems leading to acceptable collapse probabilities when compared with traditional design.
• Completed extensive single story and multiple story mass-spring model studies that definitively explore interaction between yielding in walls and diaphragms and evaluates methods currently available to designers for force prediction and ductility demands.
• Completed optimization effort that provides optimized steel deck layouts, even for plan-irregular buildings, with marked performance improvements over conventional design.
Steel Diaphragm Innovation Initiative –2020, Year 5, Final Report
4
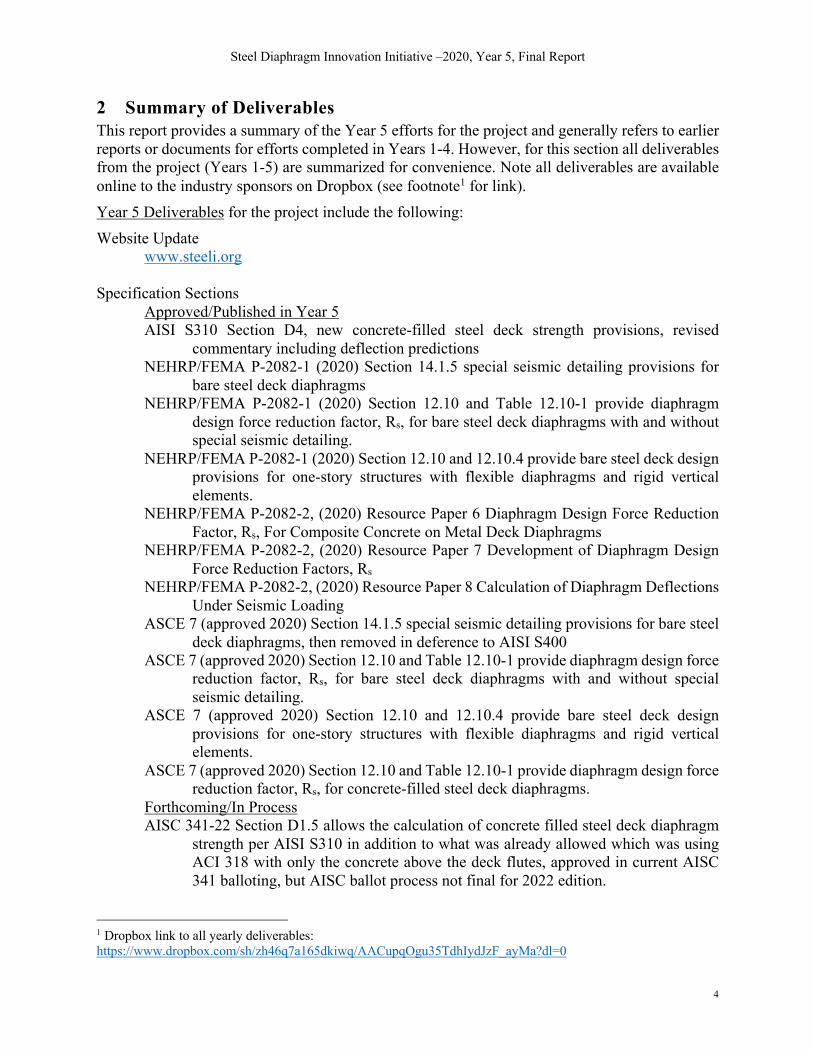
2 Summary of Deliverables This report provides a summary of the Year 5 efforts for the project and generally refers to earlier reports or documents for efforts completed in Years 1-4. However, for this section all deliverables from the project (Years 1-5) are summarized for convenience. Note all deliverables are available online to the industry sponsors on Dropbox (see footnote1 for link). Year 5 Deliverables for the project include the following: Website Update
www.steeli.org Specification Sections Approved/Published in Year 5
AISI S310 Section D4, new concrete-filled steel deck strength provisions, revised commentary including deflection predictions
NEHRP/FEMA P-2082-1 (2020) Section 14.1.5 special seismic detailing provisions for bare steel deck diaphragms
NEHRP/FEMA P-2082-1 (2020) Section 12.10 and Table 12.10-1 provide diaphragm design force reduction factor, Rs, for bare steel deck diaphragms with and without special seismic detailing.
NEHRP/FEMA P-2082-1 (2020) Section 12.10 and 12.10.4 provide bare steel deck design provisions for one-story structures with flexible diaphragms and rigid vertical elements.
NEHRP/FEMA P-2082-2, (2020) Resource Paper 6 Diaphragm Design Force Reduction Factor, Rs, For Composite Concrete on Metal Deck Diaphragms
NEHRP/FEMA P-2082-2, (2020) Resource Paper 7 Development of Diaphragm Design Force Reduction Factors, Rs
NEHRP/FEMA P-2082-2, (2020) Resource Paper 8 Calculation of Diaphragm Deflections Under Seismic Loading
ASCE 7 (approved 2020) Section 14.1.5 special seismic detailing provisions for bare steel deck diaphragms, then removed in deference to AISI S400
ASCE 7 (approved 2020) Section 12.10 and Table 12.10-1 provide diaphragm design force reduction factor, Rs, for bare steel deck diaphragms with and without special seismic detailing.
ASCE 7 (approved 2020) Section 12.10 and 12.10.4 provide bare steel deck design provisions for one-story structures with flexible diaphragms and rigid vertical elements.
ASCE 7 (approved 2020) Section 12.10 and Table 12.10-1 provide diaphragm design force reduction factor, Rs, for concrete-filled steel deck diaphragms.
Forthcoming/In Process AISC 341-22 Section D1.5 allows the calculation of concrete filled steel deck diaphragm
strength per AISI S310 in addition to what was already allowed which was using ACI 318 with only the concrete above the deck flutes, approved in current AISC 341 balloting, but AISC ballot process not final for 2022 edition.
1 Dropbox link to all yearly deliverables: https://www.dropbox.com/sh/zh46q7a165dkiwq/AACupqOgu35TdhIydJzF_ayMa?dl=0

Steel Diaphragm Innovation Initiative –2020, Year 5, Final Report
5
AISC 342 Chapter G Diaphragms, approved in 2019 covering bare and concrete-filled steel deck diaphragm modeling and acceptance criteria that allow for inelastic diaphragm response, AISC re-opened AISC 342 to coordinate with ASCE 41 so potentially additional comments to be received.
Journal Papers
Published/Accepted Eatherton, M.R., O’Brien, P.E., and Easterling, W.S. (2020) “An Examination of Ductility
and Seismic Diaphragm Design Force Reduction Factors for Steel Deck and Composite Diaphragms” Journal of Structural Engineering, Vol. 146, No. 11.
Submitted Fischer, A.W. and B.W. Schafer, Wall-Diaphragm Interactions in Seismic Response of
Single-Story Building Systems, submitted to Elsevier, Engineering Structures, May 2020.
Forthcoming Avellaneda, R.E., Eatherton, M.R., Easterling, W.S., Hajjar, J.F., and Schafer B.W. (2021
expected). “Experimental Behavior of Concrete on Steel Deck Cantilever Diaphragms” to be submitted to Journal of Structural Engineering.
Bond, R., Avellaneda, R.E., Eatherton, M.R., Easterling, W.S., Schafer, B.W., Hajjar, J.F. (expected 2021). “Strength of shear studs in concrete-filled steel deck.” To be submitted to Journal of Structural Engineering.
Briggs, N. Coleman, K., R., Avellaneda, R.E., Eatherton, M.R., Easterling, W.S., Schafer, B.W., Hajjar, J.F. (expected 2021). “Cyclic experimental performance of shear studs in concrete-filled steel deck.” To be submitted to Journal of Structural Engineering.
Fischer, A.W. and B.W. Schafer, (2021 expected) “Wall-Diaphragm Interactions in Seismic Response of Multi-Story Building Systems.” To be submitted to Earthquake Engineering & Structural Dynamics.
Fischer, A.W., Ferrari, F., Guest, J.K., Schafer, B.W. (2021 expected). “Nonlinear Performance of Topology Optimized of Steel Deck Building Diaphragms.” to be submitted to Engineering Structures
Fischer, A.W., Guest, J.K., Schafer, B.W. (2021 expected). “Topology Optimization of Steel Deck Building Diaphragms.” to be submitted to Journal of Constructional Steel Research
Foroughi, H., Torabian, S., Schafer, B.W., Wei, G., and Eatherton, M.R. (2021 expected). “Seismic Behavior of Concentric Braced Frame Buildings Including Diaphragm Inelasticity”, to be submitted to Engineering Structures.
Padilla-Llano, D., Eatherton, M.R., Easterling, W.S., Schafer, B.W., Hajjar, J.F. (expected 2021). “Computationally efficient fracture modeling of steel structures.” To be submitted to Journal of Structural Engineering.
Wei, G., Eatherton, M.R., Foroughi, H., and Schafer, B.W. (2021 expected). “Seismic Behavior of Buckling Restrained Braced Frame Buildings Including Diaphragm Inelasticity”, to be submitted to Journal of Constructional Steel Research.
Wei, G., Eatherton, M.R., Schafer, B.W., and Seek, M. (2021 expected) “Evaluating the Use of Standing Seam Roof as Beam Lateral Bracing”, to be submitted to Engineering Structures

Steel Diaphragm Innovation Initiative –2020, Year 5, Final Report
6
Wei, G., Foroughi, H., Eatherton, M.R., and Schafer, B.W. (2021 expected). “Evaluating Seismic Diaphragm Design Approaches that Consider Inelasticity”, to be submitted to Journal of Structural Engineering.
Student Dissertations
Forthcoming Avellaneda, R.E. (2021) Experimental Evaluation of Concrete Filled Steel Deck
Diaphragms for Seismic Actions, Ph.D. Dissertation, Virginia Tech, expected December 2021
Fischer, A.W. (2021) Optimization and interaction of steel diaphragms in building system seismic response. Ph.D. Dissertation, Johns Hopkins University, Expected August 2021.
Foroughi, H. (2021) Seismic Performance of Concentrically Braced Steel Buildings Including Influence of Diaphragms. Ph.D. Dissertation, Johns Hopkins University, Expected February 2021.
Wei, G. (2021) Computational Study on the Behavior of Steel Buildings Considering Diaphragm Inelasticity, Ph.D. Dissertation, Virginia Tech, Expected December 2021
Formal Technical Reports2
SDII Technical Reports Wei, G., Eatherton, M.R., Foroughi, H., Torabian, S., and Schafer, B.W. (2020). Seismic
Behavior of Steel BRBF Buildings Including Consideration of Diaphragm Inelasticity, Cold-Formed Steel Research Consortium Report Series, Report Number CFSRC R-2020-03. http://jhir.library.jhu.edu/handle/1774.2/62366
Wei, G., Schafer, B.W., Seek, M., Eatherton, M.R. (2020). Experimental Study on the in-plane behavior of standing seam roof assembly and its use in lateral bracing of rafters. Cold-Formed Steel Research Consortium Report Series, Report Number CFSRC R-2020-01. http://jhir.library.jhu.edu/handle/1774.2/62114
Forthcoming SDII Technical Reports Avellaneda, R.E., Eatherton, M.R., Easterling, W.S., Hajjar, J.F., and Schafer B.W. (2021
expected). “Experimental Investigation of Concrete on Steel Deck Diaphragms using Cantilever Diaphragm Tests” Cold-Formed Steel Research Consortium Report Series, Report Number CFSRC R-2021-02.
Foroughi, H., Torabian, S., Wei, G., Eatherton, M.R., Easterling, W.S., Hajjar, J.F., and Schafer B.W. (2021 expected). “Seismic Behavior of Steel Concentrically Braced Frame Buildings Including Consideration of Diaphragm Inelasticity” Cold-Formed Steel Research Consortium Report Series, Report Number CFSRC R-2021-01.
SDII Progress Reports Eatherton et al. (2020) Steel Diaphragm Innovation Initiative, Year 5, Progress Report,
June 2020, 79 pp. Eatherton et al. (2020) Steel Diaphragm Innovation Initiative, Year 5, Final Report, June
2020, 101 pp. (this report)
2 DSpace at the Johns Hopkins University libraries provides a permanent and reference-able source for SDII reports as a part of the CFSRC reports library: https://jscholarship.library.jhu.edu/handle/1774.2/40428

Steel Diaphragm Innovation Initiative –2020, Year 5, Final Report
7
Conference Papers Published Wei, G., Schafer, B.W., Seek, M., and Eatherton, M.R. (2020) “Lateral Bracing of Beams
Provided by Standing Seam Roof System: Concepts and Case Study” Proceedings of the Annual Stability Conference Structural Stability Research Council
Foroughi, H., Wei, G., Torabian, S., Eatherton, M.R., Schafer, B.W. (2020). “Seismic response predictions from 3D steel braced frame building simulations” Proceedings of the Annual Stability Conference Structural Stability Research Council
Eatherton, M.R., Schafer, B.W., Hajjar, J.F., Easterling, W.S., Avellaneda Ramirez, R.E., Wei, G., Foroughi, H., Torabian, S., Fischer, A.W., Briggs, N.E., Madhaven, M.B., and Coleman, K. (2020) “Considering Ductility in The Design of Bare Deck and Concrete on Metal Deck Diaphragms” 17th World Conference on Earthquake Engineering, 17WCEE Sendai, Japan
Fischer, A.W. Guest, J.K., Schafer, B.W. (2020) “Topology Optimization of Cold-Formed Steel Deck Diaphragms with Irregularities”, Cold-Formed Steel Research Consortium (CFSRC) Colloquium – October 20-22, 2020
Accepted (Not Yet Published) Avellaneda, R.E., Eatherton, M.R., and Easterling, W.S. (2021) “Behavior of Concrete
Filled Steel Deck Composite Diaphragms Using Various Types of Steel Reinforcing”, 9th International Conference on Composite Construction in Steel and Concrete, Stromberg, Germany, July 26-30.
Briggs, N. E., Bond, R. B., Madhavan, M., Padilla-Llano, D. A., Coleman, K., Hug, C., Schafer, B. W., Eatherton, M. R., Easterling, W. S., and Hajjar, J. F. (2021) “Cyclic Behavior of Composite Connections in Composite Floor Diaphragms” IX Connections AISC – ECCS Workshop on Connections in Steel Structures
Briggs, N. E., Coleman, K., Schafer, B. W., Eatherton, M. R., Easterling, W. S., and Hajjar, J. F. (2021) “Cyclic Behavior of Composite Connections in Full-Scale Experimental Composite Floor Diaphragm Test” 9th International Conference on Composite Construction in Steel and Concrete
Abstract Accepted Fischer, A.W., Ferrari, F., Guest, J.K. and B.W. Schafer, “Design of Orthotropic Steel
Diaphragms for Improved Building Stability Through Topology Optimization”, SSRC, 2021.
Conference and Other Presentations
Presentations Eatherton, M.R., Wei, G., Schafer, B.W., and Seek, M. (2020) “Using Standing Seam Roof
to Brace Rafters” MBMA Research Symposium, February 26, 2020, San Antonio, Texas.
Schafer, B.W. (2020) “System Reliability and Seismic Research Update” MBMA Research Symposium, February 26, 2020, San Antonio, Texas.
Fischer, A.W. Force and Ductility Demands Found in Parametric Study of Inelastic Time History Analysis of Single-Story Mass-Spring Model, Cold-Formed Steel Research Consortium (CFSRC) Summer Symposium – May 26-27, 2020, https://cfsrc.org/2020/05/27/sharing-success-at-cfsrc-symposium/
Steel Diaphragm Innovation Initiative –2020, Year 5, Final Report
8
Foroughi, H. Seismic Response of Steel Diaphragm for 3D Archetype Buildings with SCBF: Bare Deck vs. Composite Deck, Cold-Formed Steel Research Consortium (CFSRC) Summer Symposium – May 26-27, 2020, https://cfsrc.org/2020/05/27/sharing-success-at-cfsrc-symposium/
Wei, G. Experimental Study on the In-plane behavior of Standing Seam Roof Assembly and Its Use in Lateral Bracing of Rafters, Cold-Formed Steel Research Consortium (CFSRC) Summer Symposium – May 26-27, 2020, https://cfsrc.org/2020/05/27/sharing-success-at-cfsrc-symposium/
Fischer, A.W. Topology Optimization of Cold-Formed Steel Deck Diaphragms with Irregularities, Cold-Formed Steel Research Consortium (CFSRC) Consortium Colloquium – October 20-22, 2020,
Other Related Reports
Schafer, B.W. (2020) Conversion of rod brace testing into models. Addendum to Foroughi et al. 2018 - Strength and stiffness of metal building rod brace anchor connections, CFSRC R-2018-03, http://jhir.library.jhu.edu/handle/1774.2/58584.
Steel Diaphragm Innovation Initiative –2020, Year 5, Final Report
9
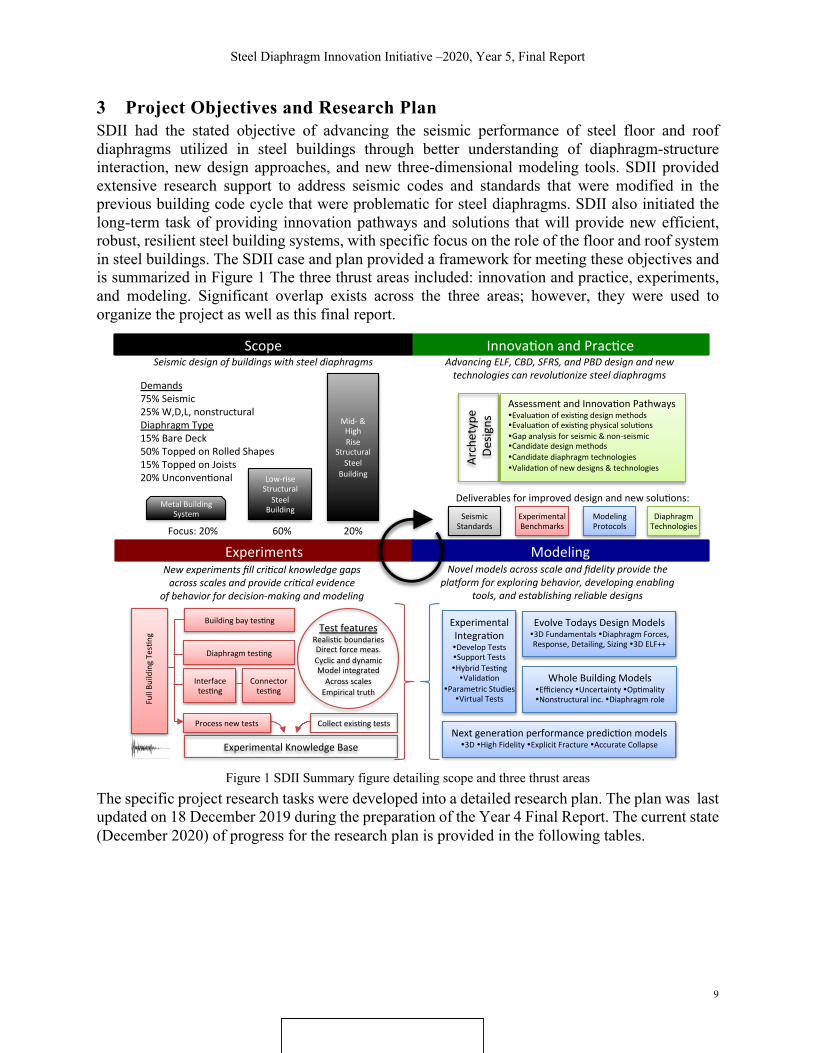
3 Project Objectives and Research Plan SDII had the stated objective of advancing the seismic performance of steel floor and roof diaphragms utilized in steel buildings through better understanding of diaphragm-structure interaction, new design approaches, and new three-dimensional modeling tools. SDII provided extensive research support to address seismic codes and standards that were modified in the previous building code cycle that were problematic for steel diaphragms. SDII also initiated the long-term task of providing innovation pathways and solutions that will provide new efficient, robust, resilient steel building systems, with specific focus on the role of the floor and roof system in steel buildings. The SDII case and plan provided a framework for meeting these objectives and is summarized in Figure 1 The three thrust areas included: innovation and practice, experiments, and modeling. Significant overlap exists across the three areas; however, they were used to organize the project as well as this final report.
Figure 1 SDII Summary figure detailing scope and three thrust areas
The specific project research tasks were developed into a detailed research plan. The plan was last updated on 18 December 2019 during the preparation of the Year 4 Final Report. The current state (December 2020) of progress for the research plan is provided in the following tables.
SeismicStandards
ELFEquiv.LateralForce
�Diaphragmforces�DiaphragmroleinsystemR,Cd,Ωo�Torsionandin-planes=ffness�Boundaryelementdesign
SFRSSeismicForceRes.Sys.�DiaphragmasSFRS�Exis=ngSystemsdetailingreq.�NewSystemdesigndetailingreq.
CBDCapacityBasedDesign�Fusesindiaphragm�Mul=plefuses�Redundancyinnon-fuseelements�Consistentrelia-bilityacrosssys.
NEWAISI400
PBDPerform.BasedDesign�PerformanceObj.�Perf.predic=on&levelsofanalysis3DELF(m..)3DPushover(TypI…)3DTimehist.(hyst)
ASCE7
ASCE41AISC341 AISI310AISI400 NEW
AISC341
Deliverables
3DBuilding�Mul=-scalemul=-fidelity3D�Validatedexamples&“R”impact
SteelDiaphragmInnova=onIni=a=ve(SDII)Advancingseismicstructuralrobustnessandresilienceofbuildingsthroughinnova=onsinsteeldiaphragms
ImprovedDiaphragmDetails�Modeling&exper.understandingofcurrentsystems�Detailchangesanddesignmethodsforimprovements�Experimentalevidenceofdesiredbehavior
NewDiaphragmSystem�Definedobjec=vesandhypothesesforperformance�Mul=-scalemodelinganddemonstra=onofbehavior�Experimentalverifica=onupthroughfull-scale
Non-structural�Energy�FirstCost�Acous=c�LifeCycle�Vibra=on�Const.=me
DiaphragmTechnologies
Op=miza=on�min$,s.t.δ,f,…�LCAalterna=ves�Resilience,Robustness..
Innova=onandPrac=ce
Experiments Modeling
Directlyimprovingtheprac=ceBuilding-readyinnova=onsthatgrowmarkets
MetalBuildingSystem
Low-riseStructuralSteel
Building
Mid-&HighRise
StructuralSteel
Building
Focus:20%60%20%
Demands75%Seismic25%W,D,L,nonstructuralDiaphragmType15%BareDeck50%ToppedonRolledShapes15%ToppedonJoists20%Unconven=onal
16June2016updated
Scope
NewexperimentsfillcriCcalknowledgegapsacrossscalesandprovidecriCcalevidence
ofbehaviorfordecision-makingandmodeling
NovelmodelsacrossscaleandfidelityprovidetheplaHormforexploringbehavior,developingenabling
tools,andestablishingreliabledesigns
AdvancingELF,CBD,SFRS,andPBDdesignandnewtechnologiescanrevoluConizesteeldiaphragms
Seismicdesignofbuildingswithsteeldiaphragms
SeismicStandards
ModelingProtocols
DiaphragmTechnologies
Archetype
Designs AssessmentandInnova=onPathways
�Evalua=onofexis=ngdesignmethods�Evalua=onofexis=ngphysicalsolu=ons�Gapanalysisforseismic&non-seismic�Candidatedesignmethods�Candidatediaphragmtechnologies�Valida=onofnewdesigns&technologies
Deliverablesforimproveddesignandnewsolu=ons:
TeamandPartners:
P.O. Box 25Fox River Grove, IL 60021
Phone: (847) 458-4647Fax: (847) 458-4648
A RATIONAL APPROACH TO
Copyright 1992 (Rev. 1997)All rights reserved
Prepared ByPhilip Levine
Larry D. Luttrell, Ph.D, P.E.
STEEL DECK CORROSION PROTECTION
ExperimentalBenchmarks
TestBenchmarks
DiaphragmTests�Impactofrealis=cboundarycond.�Evidenceofrealizedk,V,µ,etc.�IntegratedfullresponseBuildingPerformance�Groundtruthfor3Dbehavior�Proofofconceptfortechnologies�Realprotocols&implementa=on
Advancingsolu=onswithconfidence
Diaphragm++�Integratedconn.&supportdetails�ExplicitFracture�3Dready
ModelingProtocolsGuidance,protocolsandnewtools
ExperimentalKnowledgeBase
Collectexis=ngtests
TestfeaturesRealis=cboundariesDirectforcemeas.CyclicanddynamicModelintegratedAcrossscalesEmpiricaltruth
FullBu
ildingTes=ng
Buildingbaytes=ng
Processnewtests
Diaphragmtes=ng
Interfacetes=ng
Connectortes=ng
EvolveTodaysDesignModels�3DFundamentals�DiaphragmForces,Response,Detailing,Sizing�3DELF++
Nextgenera=onperformancepredic=onmodels�3D�HighFidelity�ExplicitFracture�AccurateCollapse
WholeBuildingModels�Efficiency�Uncertainty�Op=mality�Nonstructuralinc.�Diaphragmrole
ExperimentalIntegra=on�DevelopTests�SupportTests�HybridTes=ng�Valida=on
�ParametricStudies�VirtualTests
Steel Diaphragm Innovation Initiative –2020, Year 5, Final Report
10
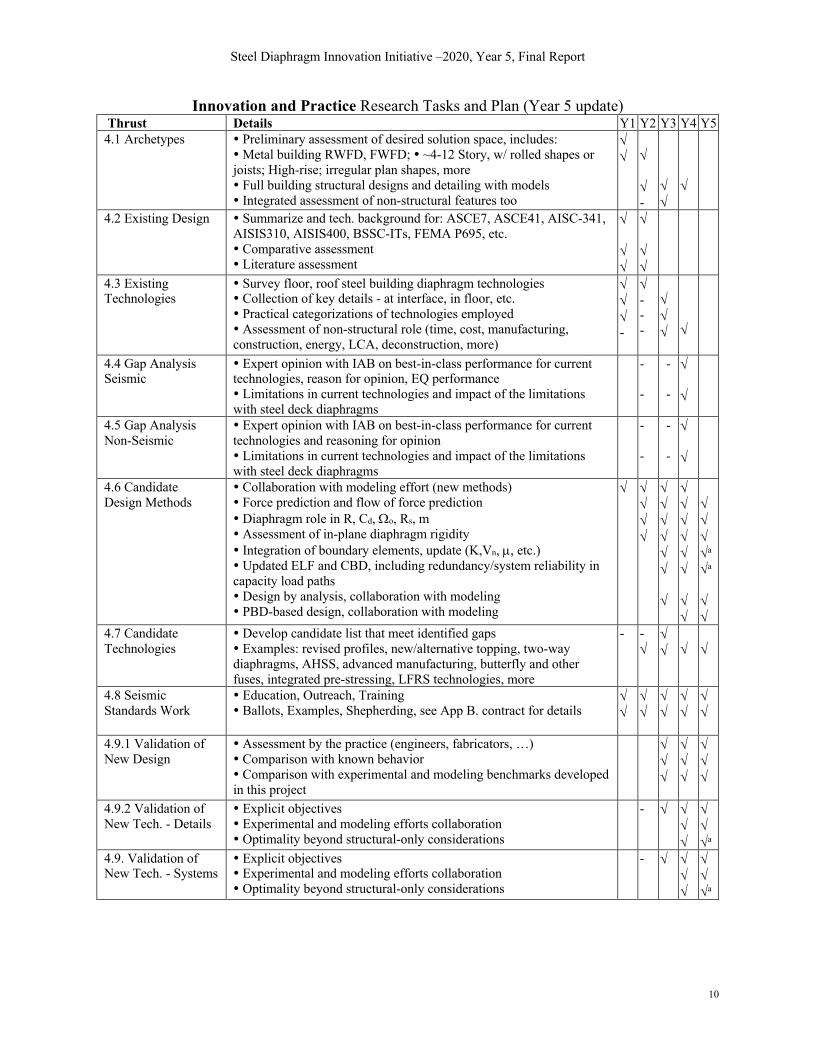
Innovation and Practice Research Tasks and Plan (Year 5 update) Thrust Details Y1 Y2 Y3 Y4 Y5 4.1 Archetypes � Preliminary assessment of desired solution space, includes:
� Metal building RWFD, FWFD; � ~4-12 Story, w/ rolled shapes or joists; High-rise; irregular plan shapes, more � Full building structural designs and detailing with models � Integrated assessment of non-structural features too
Ö Ö
Ö Ö -
Ö Ö
Ö
4.2 Existing Design � Summarize and tech. background for: ASCE7, ASCE41, AISC-341, AISIS310, AISIS400, BSSC-ITs, FEMA P695, etc. � Comparative assessment � Literature assessment
Ö Ö Ö
Ö Ö Ö
4.3 Existing Technologies
� Survey floor, roof steel building diaphragm technologies � Collection of key details - at interface, in floor, etc. � Practical categorizations of technologies employed � Assessment of non-structural role (time, cost, manufacturing, construction, energy, LCA, deconstruction, more)
Ö Ö Ö -
Ö - - -
Ö Ö Ö
Ö
4.4 Gap Analysis Seismic
� Expert opinion with IAB on best-in-class performance for current technologies, reason for opinion, EQ performance � Limitations in current technologies and impact of the limitations with steel deck diaphragms
- -
- -
Ö Ö
4.5 Gap Analysis Non-Seismic
� Expert opinion with IAB on best-in-class performance for current technologies and reasoning for opinion � Limitations in current technologies and impact of the limitations with steel deck diaphragms
- -
- -
Ö Ö
4.6 Candidate Design Methods
� Collaboration with modeling effort (new methods) � Force prediction and flow of force prediction � Diaphragm role in R, Cd, Wo, Rs, m � Assessment of in-plane diaphragm rigidity � Integration of boundary elements, update (K,Vn, µ, etc.) � Updated ELF and CBD, including redundancy/system reliability in capacity load paths � Design by analysis, collaboration with modeling � PBD-based design, collaboration with modeling
Ö
Ö Ö Ö Ö
Ö Ö Ö Ö Ö Ö Ö
Ö Ö Ö Ö Ö Ö Ö Ö
Ö Ö Ö Öa Öa Ö Ö
4.7 Candidate Technologies
� Develop candidate list that meet identified gaps � Examples: revised profiles, new/alternative topping, two-way diaphragms, AHSS, advanced manufacturing, butterfly and other fuses, integrated pre-stressing, LFRS technologies, more
- - Ö
Ö Ö
Ö
Ö
4.8 Seismic Standards Work
� Education, Outreach, Training � Ballots, Examples, Shepherding, see App B. contract for details
Ö Ö
Ö Ö
Ö Ö
Ö Ö
Ö Ö
4.9.1 Validation of New Design
� Assessment by the practice (engineers, fabricators, …) � Comparison with known behavior � Comparison with experimental and modeling benchmarks developed in this project
Ö Ö Ö
Ö Ö Ö
Ö Ö Ö
4.9.2 Validation of New Tech. - Details
� Explicit objectives � Experimental and modeling efforts collaboration � Optimality beyond structural-only considerations
- Ö
Ö Ö Ö
Ö Ö Öa
4.9. Validation of New Tech. - Systems
� Explicit objectives � Experimental and modeling efforts collaboration � Optimality beyond structural-only considerations
- Ö
Ö Ö Ö
Ö Ö Öa

Steel Diaphragm Innovation Initiative –2020, Year 5, Final Report
11
Experiments Research Tasks and Plan (year 5 update**) Thrust Details Y1 Y2 Y3 Y4 Y5 5.1 Existing Tests
� Collection of available steel diaphragm and related testing, including historical SDI testing, etc. � Summary of existing benchmark tests and findings � Assessment of test needs, prioritization, fine-tuning of test plan
Ö Ö -
Ö -
Ö
5.2 Test Technologies
� Investigation of novel direct force measurement � Investigation of photogrammetry and related methods for better tracking deformations across large complex tests � Formal hybrid testing considerations for diaphragms
- Ö
- Ö
Ö Ö
Ö
Ö
5.3 Connector Tests
� Existing tests, needs, test protocols, test plan, sensor plan � Characterization for seismic design properties � Char. for modeling: phenomenological & high fidelity � Exploration of novel direct force measurements � TESTING: Iteration and exploration of improved connectors
- Ö Ö Ö - Ö
Ö Ö Ö
Ö
5.4 Interface Tests
� Survey of interface/collector details & sub-systems � Development and selection of testing method & objective � Needs assessment, test protocols, test plan, sensor plan � Characterization for basic seismic design � Characterization for advanced and building modeling � TESTING: Iteration & exploration of improved interface details
Ö Ö
Ö Ö Ö - -
Ö Ö Ö Ö Ö Ö
Ö Ö Ö
Ö
5.5 Diaphragm Tests
� Examination of existing, past, and novel diaphragm tests � Survey of typical diaphragms aligned with project scope � Development and selection of testing method & objective � Test protocols, test plan, sensor plan � Characterization for basic seismic design & adv. modeling � Detailed collaboration with modeling team � TESTING: Iteration and exploration of improved diaphragms � First level validation of new details and systems
Ö -
Ö Ö Ö Ö Ö
Ö Ö Ö Ö
Ö Ö Ö Ö
Ö Ö
5.6 Building Bay Tests *
� Development of test schema aligned with archetypes � Development of facilities requirements � Development of knowledge acquisition case for testing � Formal test matrix, load protocols, sensor plan, test plan � Secure funding with partners and iteration on goals � Fabrication, erection, testing, de-construction � Characterization and knowledge acquisition
- Ö Ö Ö
Ö Ö Ö Ö
Ö - -
X* X*
5.6 Full Building Tests **
� Test schema, facilities req, case statement, test plans � Align testing around high-level goals for existing systems and for new details and diaphragm systems of high promise � Secure funding with partners and iteration on goals � Fabrication, erection, testing, de-construction, processing, � Leverage validation efforts for models & seismic standards
- X X
X X X
X X X
X X X
5.7 Test Database
� Populate existing knowledge in practice-useable form � Expand test database with project specific testing � Database for push-out tests with steel deck and fill
Ö
Ö Ö
Ö Ö
Ö
Ö
5.8 Standards � Translate testing advances into standards Ö Ö Öa 5.9 Outreach & Training
� Collaborate with partners, leverage interest for URM STEM opportunities, directly reach out to practice
Ö
Ö
Ö Ö Ö

Steel Diaphragm Innovation Initiative –2020, Year 5, Final Report
12
Modeling Research Tasks and Plan (year 5 update**) Thrust Details Y1 Y2 Y3 Y4 Y5 6.1 Conventional Design Models
� Summarize models using in existing design � Investigate fundamental 3D response in reduced DOF models and bound diaphragm demands and impact on response (Rs v R) � Explore hand/analytical solutions to evolve current constructs in ELF and other models in use today � Explore 3D for ELF, pushover, etc. used in design � Develop improvements to conventional models for diaph. design
Ö Ö Ö -
Ö Ö Ö Ö -
Ö Ö Ö Ö
Ö Ö
Ö Ö
6.2 Modeling for Experimental Program
� Support testing rig development, expected behavior, targeting testing objectives, test and sensor plans across all scales: connectors to full buildings. � Hybrid testing, hybrid sensors, support for testing technologies used to reveal new behavior � Calibration/validation across scales for models � Parametric studies and extrapolation beyond tests
- -
- - -
Ö Ö Ö Ö
Ö Ö Ö Ö
Ö Ö Öa
6.3 Diaphragm Models
� Develop specific high-fidelity models of existing and new � Integrate next generation fracture and other features into diaphragm high fidelity models � Explicitly study impact of realistic boundary conditions, connectors, etc. on diaphragm response � Provide validated modeling protocols, including modeling diaphragms at different fidelities
Ö Ö
Ö Ö Ö
Ö Ö Ö Ö
Ö X* Öa
6.4 Whole Building Models
� Develop IDA appropriate whole building models of archetype buildings, perform assessment (including P695) � Explicitly explore potential diaphragm response changes on whole building performance � Demonstrate impact of experimental information on changes in whole building response prediction � Develop models for full-scale building testing that allow meaningful experimental exploration of diaphragms � Archetype evaluation and processing
Ö Ö Ö
Ö Ö Ö
Ö Ö Ö Ö Ö
Ö Ö Ö
6.5 Next-generation Models
� Expand explicit fracture modeling without pre-existing flaws to steel diaphragms and validate against tests � Provide large scale models that incorporate geometric and material nonlinearity and fracture limit states for true prediction of building response under extreme loads � Establish robust criteria for failure prediction of steel buildings to advance improved IDA results � Model candidate details and new diaphragm systems to assess and improve potential new technologies.
Ö
Ö -
Ö Ö Ö Ö
Ö Ö Ö Ö
X* X*
6.6 Non-Structural Models
� Development of high throughput means of assessment for non-structural features, including: Energy, acoustic, vibration, fire, first cost, LCC, construction time, others, consider BIM-based workflow
-
-
Ö
Ö
Öa
6.7 Optimization Model
� Development of multi-objective optimization framework � Seismic and non-seismic objectives & constraints � Integration of structural and non-structural models � Assessment of existing and candidate solutions � Propagation of tool for decision-making
- - -
Ö Ö -
Ö Ö Ö Ö
Ö Ö Ö Öa

Steel Diaphragm Innovation Initiative –2020, Year 5, Final Report
13
TABLE NOTES a Intended tasks for this item completed, but aspects of this item remain for future work and should be considered if additional research is to be conducted on seismic performance of steel deck diaphragm systems. * This item is part of the No Cost Extension, primarily for closure of efforts at Northeastern which are inclusive of final implementation of the next-generation steel and concrete fracture modeling, and completion of the building bay tests. These items will be closed out in an Addendum to this report to be provided by 31 December 2021. ** Larger scale testing requires external funding; the reader is reminded these parts of the original plan only fully possible with added funds. Table Symbols: Ö = task completed as intended in the designated period - = originally planned task, but deferred (if red then the deferral occurred in this reporting period) X = planned task, not yet completed (if red then this is a newly planned task in this reporting period) (blank) = no activity planned for this task in this period
Acronyms, Abbreviations, Selected Terms Symbols ++ = signifies “more” or “and beyond”
$ = dollars/cost V or Vn = shear strength W = Wind load Wo = seismic response modification coefficient, overstrength factor d = deflection µ = ductility Cd = seismic response modification coefficient for deflection D = Dead Load f = force k = stiffness L = Live Load m = ASCE41-based seismic response modification coefficient R = seismic response modification coefficient for demands Rs = seismic response modification coefficient for diaphragm demands
Acronyms 3D = Three-dimensional AHSS = Advanced High Strength Steel (e.g. steels in automotive with Fy=1000MPa [145 ksi]) BIM = Building Information Modeling CBD = Capacity Based Design DOF = Degrees of Freedom ELF = Equivalent Lateral Force FWFD = Flexible wall flexible diaphragm building (e.g. metal bldg..w/ bare steel walls & roof) IDA = Incremental Dynamic Analysis LFRS = Lateral Force Resisting System PBD = Performance Based Design RWFD = Rigid wall flexible diaphragm building (e.g. bldg. w/ precast walls and bare steel deck) SDII = Steel Diaphragm Innovation Initiative SFRS = Seismic Force Resisting System URM STEM = Underrepresented minorities science technology engineering and math
Abbreviations hyst = hysteretic Min = Minimize s.t. = subject to (as in the constraints on a minimization) Typ I = ASCE41-based definition of force-deflection response for nonlinear elements
Selected Terms Fidelity = Level of complexity in a model (high = very detailed such as shell finite elements, low = 1 DOF springs or similar modeling)
Across scales = modeling at different physical scales (small = fracture, or connector, large = whole building)
Steel Diaphragm Innovation Initiative –2020, Year 5, Final Report
14
4 Innovation and Practice: Year 5 This report is organized in alignment with the project research tasks outlined in Section 3. Thus, the report sections detail Year 5 efforts within each task. If the task is complete, or planned Year 5 work is minimal, this is noted in the update on the given task. The lead researcher on any given task, typically one of the student investigators, is listed in the section heading for each task.
4.1 Archetypes (Torabian et al.)
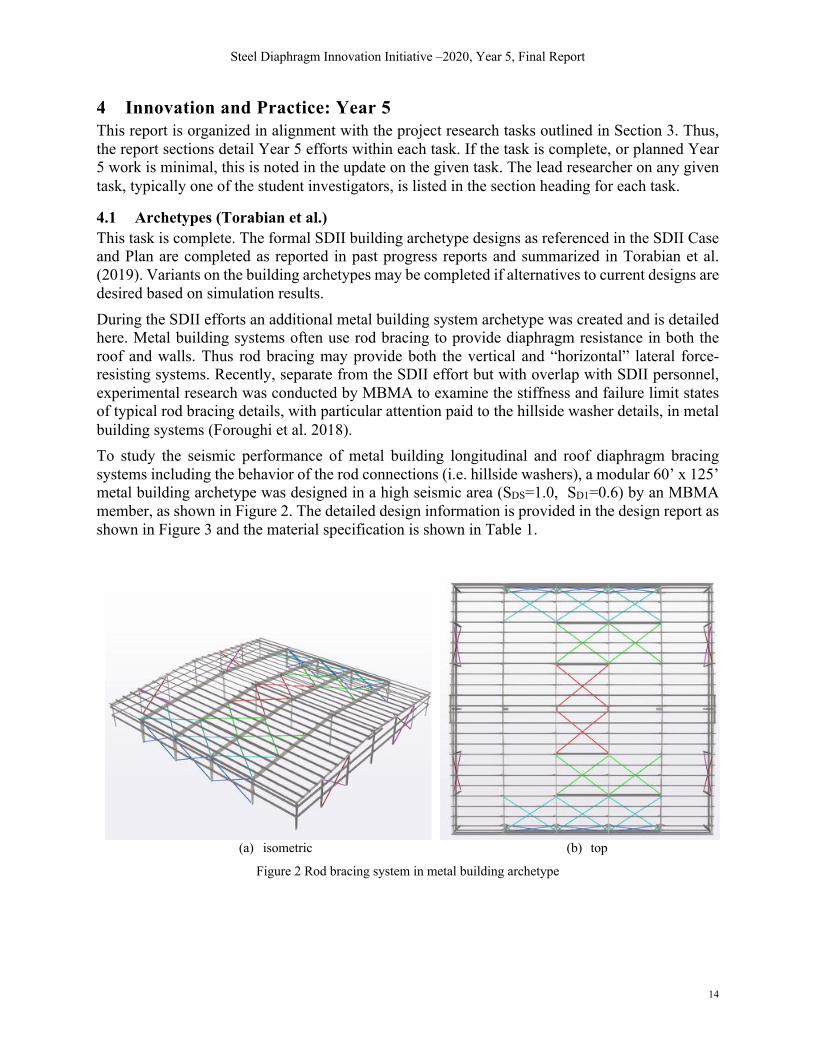
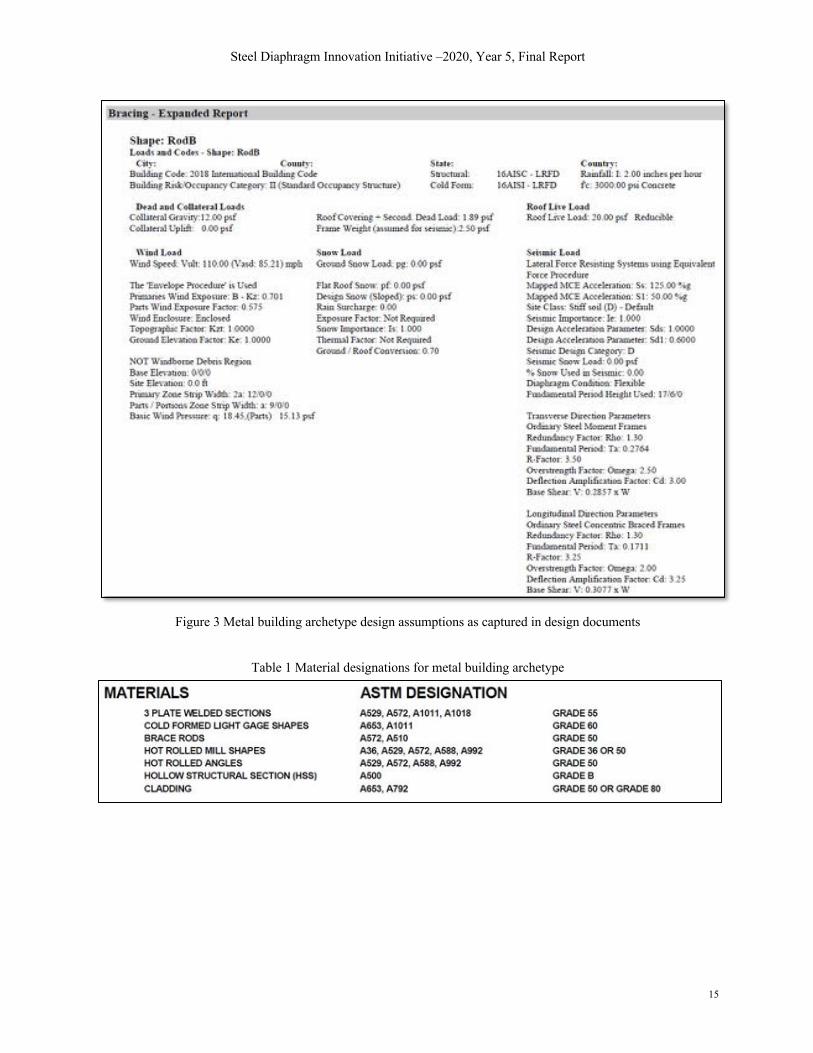
This task is complete. The formal SDII building archetype designs as referenced in the SDII Case and Plan are completed as reported in past progress reports and summarized in Torabian et al. (2019). Variants on the building archetypes may be completed if alternatives to current designs are desired based on simulation results. During the SDII efforts an additional metal building system archetype was created and is detailed here. Metal building systems often use rod bracing to provide diaphragm resistance in both the roof and walls. Thus rod bracing may provide both the vertical and “horizontal” lateral force-resisting systems. Recently, separate from the SDII effort but with overlap with SDII personnel, experimental research was conducted by MBMA to examine the stiffness and failure limit states of typical rod bracing details, with particular attention paid to the hillside washer details, in metal building systems (Foroughi et al. 2018). To study the seismic performance of metal building longitudinal and roof diaphragm bracing systems including the behavior of the rod connections (i.e. hillside washers), a modular 60’ x 125’ metal building archetype was designed in a high seismic area (SDS=1.0, SD1=0.6) by an MBMA member, as shown in Figure 2. The detailed design information is provided in the design report as shown in Figure 3 and the material specification is shown in Table 1.
(a) isometric (b) top
Figure 2 Rod bracing system in metal building archetype
Steel Diaphragm Innovation Initiative –2020, Year 5, Final Report
15
Figure 3 Metal building archetype design assumptions as captured in design documents
Table 1 Material designations for metal building archetype
Steel Diaphragm Innovation Initiative –2020, Year 5, Final Report
16
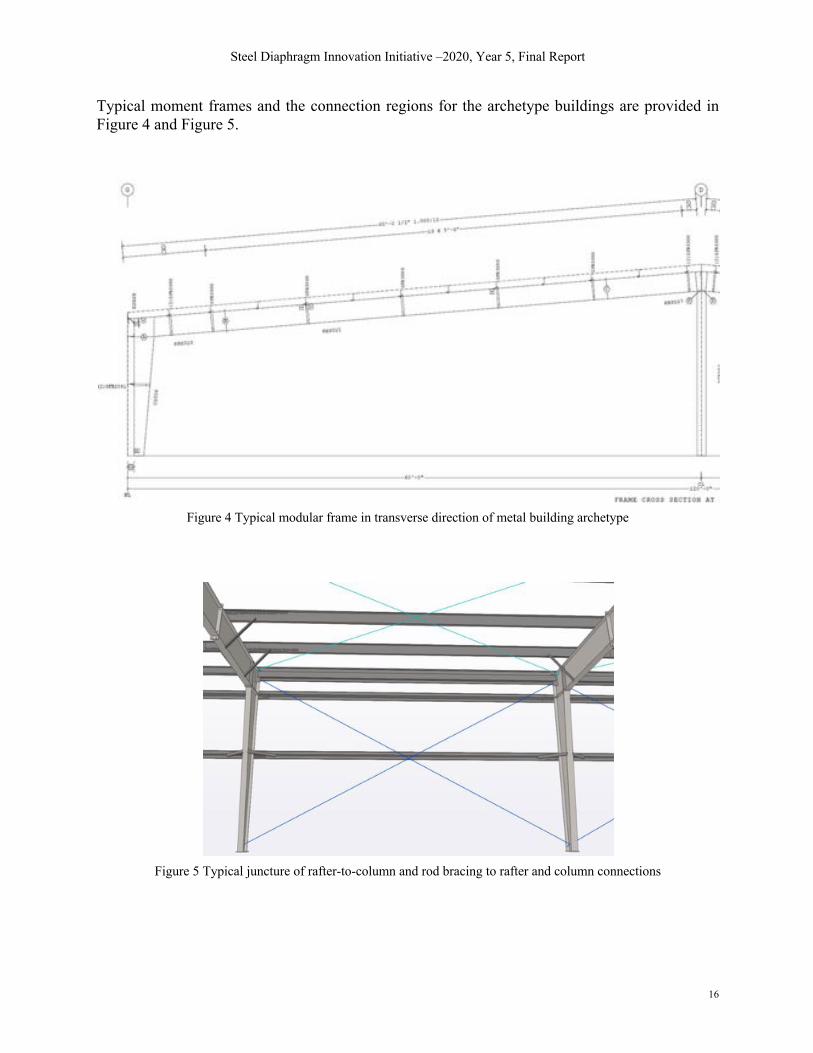
Typical moment frames and the connection regions for the archetype buildings are provided in Figure 4 and Figure 5.
Figure 4 Typical modular frame in transverse direction of metal building archetype
Figure 5 Typical juncture of rafter-to-column and rod bracing to rafter and column connections
Steel Diaphragm Innovation Initiative –2020, Year 5, Final Report
17
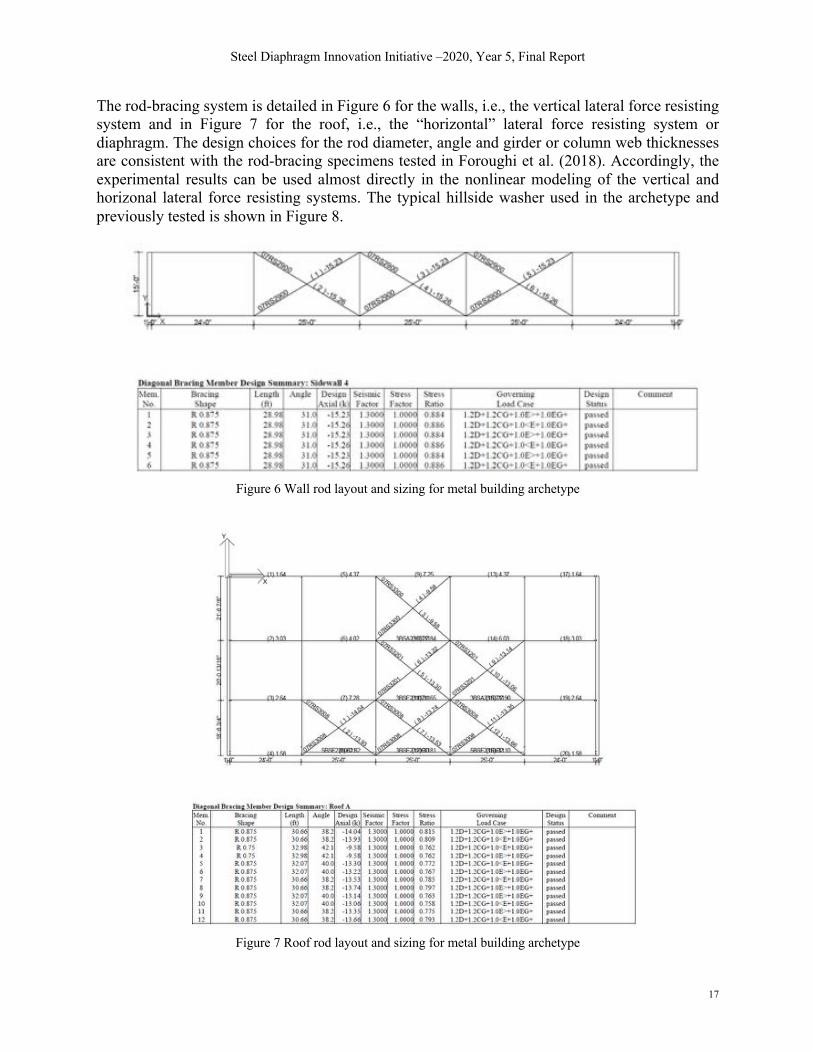
The rod-bracing system is detailed in Figure 6 for the walls, i.e., the vertical lateral force resisting system and in Figure 7 for the roof, i.e., the “horizontal” lateral force resisting system or diaphragm. The design choices for the rod diameter, angle and girder or column web thicknesses are consistent with the rod-bracing specimens tested in Foroughi et al. (2018). Accordingly, the experimental results can be used almost directly in the nonlinear modeling of the vertical and horizonal lateral force resisting systems. The typical hillside washer used in the archetype and previously tested is shown in Figure 8.
Figure 6 Wall rod layout and sizing for metal building archetype
Figure 7 Roof rod layout and sizing for metal building archetype

Steel Diaphragm Innovation Initiative –2020, Year 5, Final Report
18
Figure 8 Typical hillside washer detail for rod-brace systems based on rod diameter
The through fastened roof (TRF) system shown in Figure 9 is potentially an alternative diaphragm element in metal building systems, though typically it is not designed for this purpose. Dynamic seismic analysis of the archetype system can potentially shed light on the interaction of the rod-bracing system with the TRF system and can help with considering the effect of TRF in the diaphragm design of metal building systems.
Figure 9 Typical through fastened panel detailing for roof and walls.
Steel Diaphragm Innovation Initiative –2020, Year 5, Final Report
19
4.2 Existing Design (Schafer et al.)
This task is complete. Existing design methods have been studied in detail in the SDII project. For example, see the formal report in the Year 1 deliverables on existing design. Insofar as the SDII Case and Plan work item is concerned this item is complete. Nonetheless, even as new design alternatives are explored, existing design is always being assessed. For example, the building archetypes of the previous section are designed both to existing design and proposed alternatives; the testing considers both existing and new designs in its development; and the building models are created such that they can interrogate existing design as well as new alternatives. Gaps and issues with existing design methodologies are covered through the “Gap Analysis” in the SDII Case and Plan and these are summarized in Section 4.3.3.
4.3 Existing Technology (Schafer et al.)
This task is complete. SDII Case and Plan, Innovation and Practice, Task 3, is the survey, categorization, and assessment of existing steel diaphragm technology. This work has been embedded within the development of the SDII building archetypes (selection of deck types and detailing, surveys of commonly used solutions), collection of all available existing/relevant test data, and selection of test matrices for bare deck steel-to-steel shear specimens as well as cyclic push-out tests and the full-scale concrete-filled steel deck diaphragm tests. These test selections were designed to reflect common and/or best practices with existing technologies and are summarized further in Section 5.
4.3.1 Survey, Categorization, and Assessment (Fischer et al.)
This task was completed in Year 3 and is incorporated into the optimization tasks of Section 6.7. The SDII workshop (Schafer et al. 2019) also provided additional related information. Specifically, the detailed survey results in the Appendix of the workshop were useful – these findings were incorporated into the gap analysis of sections/tasks 4.4 and 4.5 of this report.
4.3.2 Maintenance of SDII Cantilever Database (Wei et al.)
The SDII Cantilever Database remains unchanged from the previous report other than a formal journal publication based on the database (Eatherton et al. 2020). Extensive application of the cantilever database is provided in previous reports. The cantilever diaphragm tests currently being conducted (Section 5.5) are also added to the database as they are completed.
4.3.3 Maintenance and Application of SDII Shear Connector Database (Bond et al.)
The SDII shear connector database is complete. An assessment of the SDII Shear Connector Database is complete and will be submitted for publication this winter. The database includes hundreds of push-out tests from the literature as well as monotonic and cyclic push-out tests being conducted as part of the SDII research (see testing in Section 5.4). Push-out tests included in the database possess either perpendicular or parallel deck, with studs of ¾” diameter or less, or solid slabs, with studs of 1” diameter or less. A detailed examination of test-to-predicted ratios for current strength prediction models utilizing specimens in the database and consideration of two new strength prediction models are complete. The new strength prediction model will also be verified with composite beams tests from the literature. Specifically, concrete-filled steel composite deck specimens with deck ribs oriented perpendicular to the composite member with ¾” diameter studs that were welded through the deck and monotonically loaded are included in the following summary of the work.
Steel Diaphragm Innovation Initiative –2020, Year 5, Final Report
20
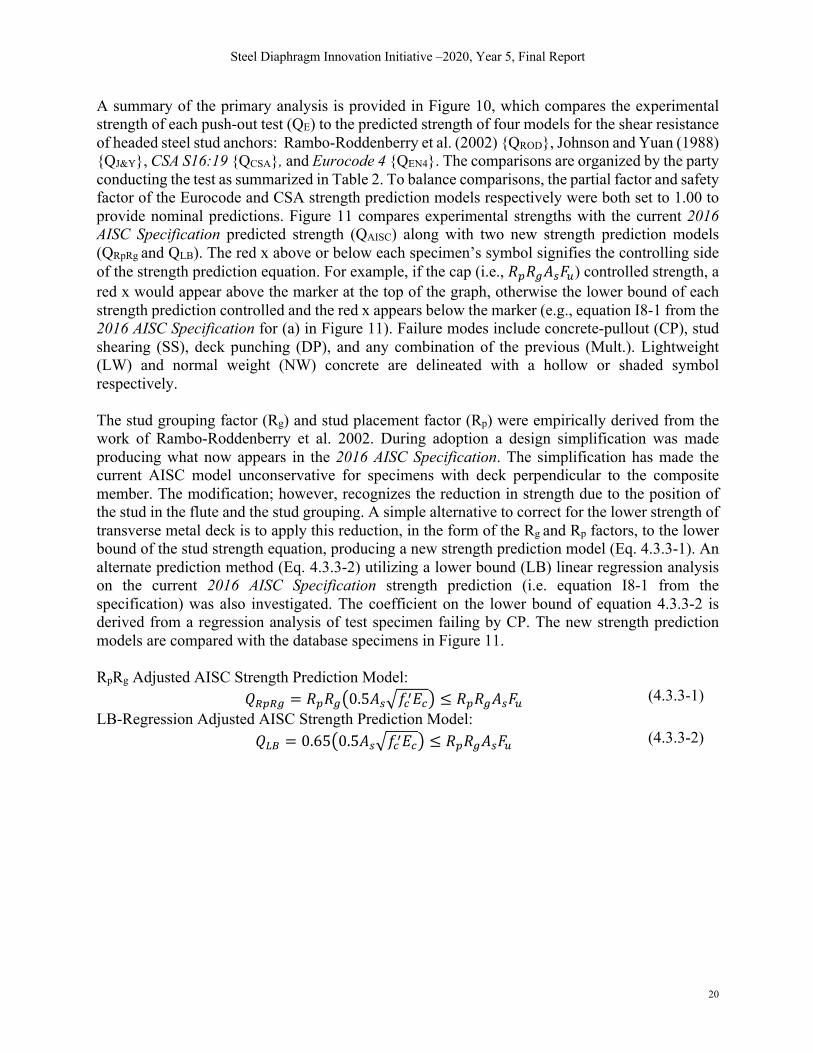
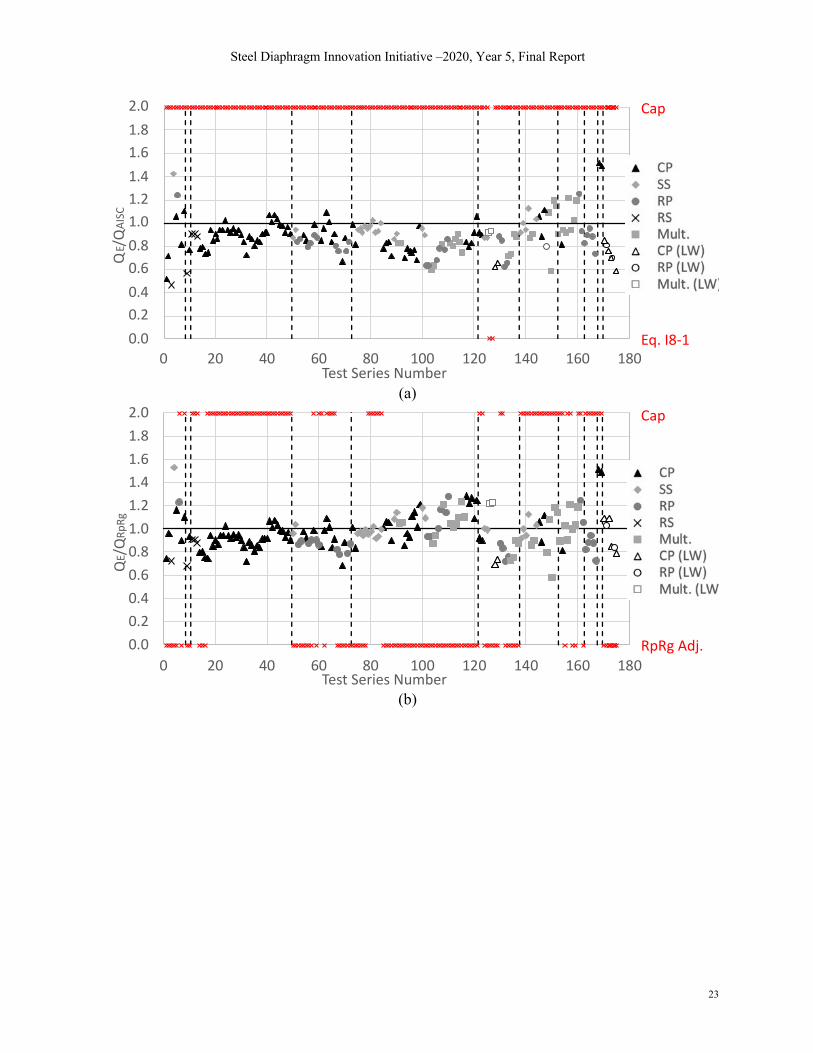
A summary of the primary analysis is provided in Figure 10, which compares the experimental strength of each push-out test (QE) to the predicted strength of four models for the shear resistance of headed steel stud anchors: Rambo-Roddenberry et al. (2002) {QROD}, Johnson and Yuan (1988) {QJ&Y}, CSA S16:19 {QCSA}, and Eurocode 4 {QEN4}. The comparisons are organized by the party conducting the test as summarized in Table 2. To balance comparisons, the partial factor and safety factor of the Eurocode and CSA strength prediction models respectively were both set to 1.00 to provide nominal predictions. Figure 11 compares experimental strengths with the current 2016 AISC Specification predicted strength (QAISC) along with two new strength prediction models (QRpRg and QLB). The red x above or below each specimen’s symbol signifies the controlling side of the strength prediction equation. For example, if the cap (i.e., !!!""##$) controlled strength, a red x would appear above the marker at the top of the graph, otherwise the lower bound of each strength prediction controlled and the red x appears below the marker (e.g., equation I8-1 from the 2016 AISC Specification for (a) in Figure 11). Failure modes include concrete-pullout (CP), stud shearing (SS), deck punching (DP), and any combination of the previous (Mult.). Lightweight (LW) and normal weight (NW) concrete are delineated with a hollow or shaded symbol respectively. The stud grouping factor (Rg) and stud placement factor (Rp) were empirically derived from the work of Rambo-Roddenberry et al. 2002. During adoption a design simplification was made producing what now appears in the 2016 AISC Specification. The simplification has made the current AISC model unconservative for specimens with deck perpendicular to the composite member. The modification; however, recognizes the reduction in strength due to the position of the stud in the flute and the stud grouping. A simple alternative to correct for the lower strength of transverse metal deck is to apply this reduction, in the form of the Rg and Rp factors, to the lower bound of the stud strength equation, producing a new strength prediction model (Eq. 4.3.3-1). An alternate prediction method (Eq. 4.3.3-2) utilizing a lower bound (LB) linear regression analysis on the current 2016 AISC Specification strength prediction (i.e. equation I8-1 from the specification) was also investigated. The coefficient on the lower bound of equation 4.3.3-2 is derived from a regression analysis of test specimen failing by CP. The new strength prediction models are compared with the database specimens in Figure 11. RpRg Adjusted AISC Strength Prediction Model: $%!%" = !!!"&0.5"#*+&',&- ≤ !!!""##$ (4.3.3-1)
LB-Regression Adjusted AISC Strength Prediction Model: $() = 0.65&0.5"#*+&',&- ≤ !!!""##$ (4.3.3-2)

Steel Diaphragm Innovation Initiative –2020, Year 5, Final Report
21
(a)
(b)
0.0
0.2
0.4
0.6
0.8
1.0
1.2
1.4
1.6
1.8
2.0
0 20 40 60 80 100 120 140 160 180
QE/
QRO
D
Test Series Number
CP
SS
RP
RS
Mult.
CP(LW)RP(LW)
0.0
0.2
0.4
0.6
0.8
1.0
1.2
1.4
1.6
1.8
2.0
0 20 40 60 80 100 120 140 160 180
QE/
QJ&
Y
Test Series Number
CP
SS
RP
RS
Mult.
CP(LW)RP(LW)

Steel Diaphragm Innovation Initiative –2020, Year 5, Final Report
22
(c)
(d)
Figure 10 Test-to-predicted graphs for (a) Rambo-Roddenberry et al. (2002), (b) Johnson and Yuan (1988), (c) CSA S16:19 Specification (d) Eurocode 4 Specification
0.0
0.2
0.4
0.6
0.8
1.0
1.2
1.4
1.6
1.8
2.0
0 20 40 60 80 100 120 140 160 180
QE/
QCS
A
Test Series Number
CP
SS
RP
RS
Mult.
CP(LW)RP(LW)
0.0
0.2
0.4
0.6
0.8
1.0
1.2
1.4
1.6
1.8
2.0
0 20 40 60 80 100 120 140 160 180
QE/
QEN
4
Test Series Number
CP
SS
RP
RS
Mult.
CP(LW)RP(LW)
Steel Diaphragm Innovation Initiative –2020, Year 5, Final Report
23
(a)
(b)
Cap
Eq. I8-10.00.20.40.60.81.01.21.41.61.82.0
0 20 40 60 80 100 120 140 160 180
QE/
QAISC
Test Series Number
Cap
RpRg Adj.0.0
0.2
0.4
0.6
0.8
1.0
1.2
1.4
1.6
1.8
2.0
0 20 40 60 80 100 120 140 160 180
QE/
QRp
Rg
Test Series Number

Steel Diaphragm Innovation Initiative –2020, Year 5, Final Report
24
(c)
Figure 11 Test-to-predicted graphs for (a) 2016 AISC Specification, (b) RpRg Adjusted AISC, (c) LB-Regression Adjusted AISC.
Table 2 Reference and Test Series Number
Reference First Test Series Number Last Test Series Number Hawkins & Mitchel, 1987 1 8
Jayas & Hosain, 1988* 9 10 Lloyd & Wright, 1990* 11 49
Sublett et al., 1992* 50 72 Lyons et al., 1994 73 121
Johnson & Yuan, 1998 122 137 Rambo-Roddenberry et al., 2002 138 152
Ernst et al., 2006 153 162 DISSCO, 2017 163 167 Lim et al., 2020 168 169
Briggs et al., 2021 170 175 * nominal steel stud strength (Fu) used in calculations
Table 3 provides a summary of the test-to-predicted ratios for the considered strength prediction models. Rambo-Rodenberry’s model possess relatively good correlation, but was not fully adopted by AISC. Based on failure mode mechanics models, the Johnson and Yuan method was found to be too complex to readily implement in design, requiring a prediction of the failure mode, but noted to possess relatively good correlation with test data. The RpRg adjusted AISC and LB-regression adjusted AISC strength prediction models are presented as viable alternatives for strength prediction of shear headed stud anchors influenced by perpendicular metal deck.
Cap
LB-Reg Adj.0.0
0.2
0.4
0.6
0.8
1.0
1.2
1.4
1.6
1.8
2.0
0 20 40 60 80 100 120 140 160 180
QE/
QLB
Test Series Number

Steel Diaphragm Innovation Initiative –2020, Year 5, Final Report
25
Table 3 Test-to-predicted ratio per each strength prediction model QE/QAISC QE/QROD QE/QCSA QE/QEN4 QE/QJ&Y QE/QRpRg QE/QLB
Average 0.87 1.01 0.81 1.14 0.96 0.97 1.00 Max 1.51 1.79 1.91 2.22 1.61 1.53 1.76 Min 0.48 0.62 0.35 0.54 0.59 0.58 0.54
Stdev 0.16 0.19 0.23 0.29 0.16 0.16 0.18 C.O.V. 0.18 0.18 0.28 0.26 0.16 0.16 0.18
4.4 Gap Analysis – Seismic (Schafer et al.)
This task is complete, see Progress report 3 and the SDII workshop summary (Schafer et al. 2019) as summarized in the Year 4 Final Report (Eatherton et al. 2019).
4.5 Gap Analysis – Non-Seismic (Schafer et al.)
This task is complete, see Progress report 3 and the SDII workshop summary (Schafer et al. 2019) as summarized in the Year 4 Final Report (Eatherton et al. 2019).
4.6 Candidate Design Methods (Schafer et al.)
This task is complete. The SDII team evaluated a large number of potential new and improved design methods. Section 4.8 provides a summary of design methods that were adopted by codes and standards during the life of the SDII effort. SDII research is also providing the underlying data and analysis for the next code cycle including improved strength provisions for concrete-filled steel deck with reinforcing steel, improved strength provisions for composite shear studs, improved guidance for seismic detailing of concrete-filled steel deck, improvements to the ASCE 7 alternative diaphragm (Rs) method, and more. SDII has also provided research that can be used to evaluate more radical departures from current design methodologies.
4.7 Candidate Technologies (Hajjar et al.)
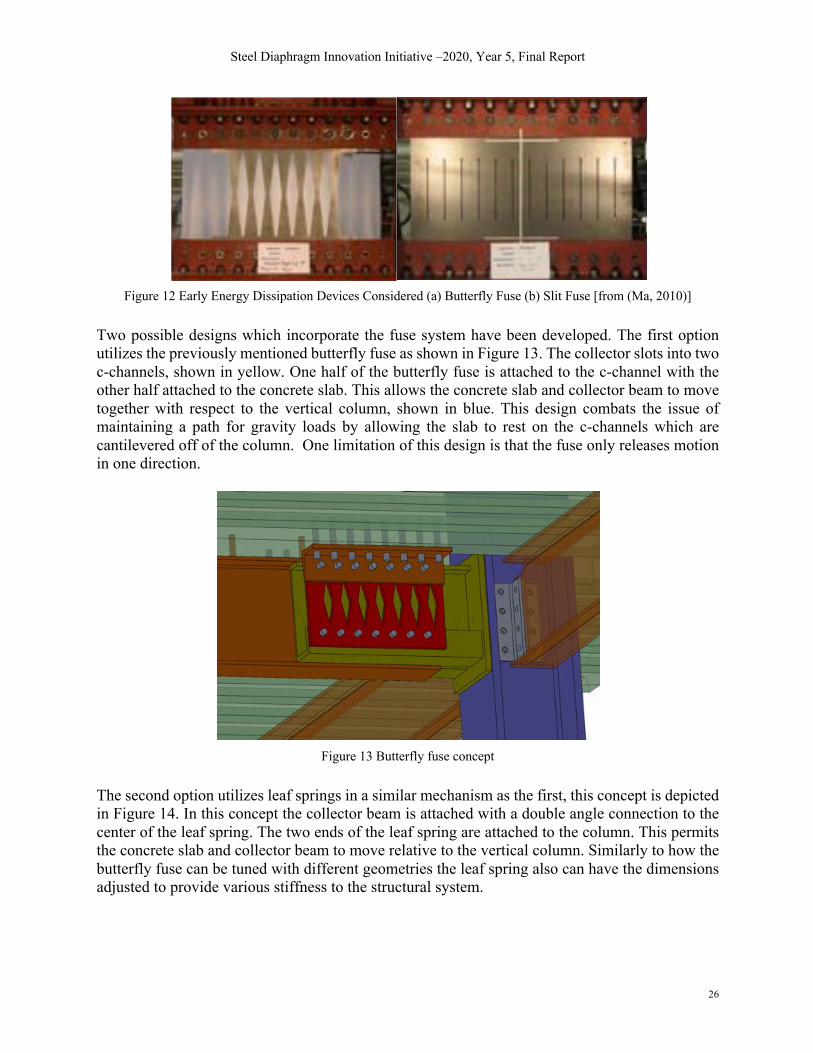
Several novel concepts have been researched, reviewed and evaluated for their use as structural elements with high degrees of energy dissipation (e.g., butterfly cut steel plates, honeycomb or foamed steel components, and others) in the chords or collectors of steel diaphragm systems. The potential of these systems is significant, but so are the changes required in conventional framing to adapt these fixtures into one of the main structural systems of a building. Several prototype fuses were considered, and a literature review was completed to understand prior research in this area. Some of the energy dissipation devices considered were butterfly fuses and slit fuses, as shown in Figure 4. This system localizes the interface between the horizontal and vertical portions of the lateral force resisting system through the fuse and would require a supporting structure to maintain a path for the gravity loads. In addition, a fire stop would have to be provided in diaphragm systems which have a structural break for incorporating a fuse.
Steel Diaphragm Innovation Initiative –2020, Year 5, Final Report
26
Figure 12 Early Energy Dissipation Devices Considered (a) Butterfly Fuse (b) Slit Fuse [from (Ma, 2010)]
Two possible designs which incorporate the fuse system have been developed. The first option utilizes the previously mentioned butterfly fuse as shown in Figure 13. The collector slots into two c-channels, shown in yellow. One half of the butterfly fuse is attached to the c-channel with the other half attached to the concrete slab. This allows the concrete slab and collector beam to move together with respect to the vertical column, shown in blue. This design combats the issue of maintaining a path for gravity loads by allowing the slab to rest on the c-channels which are cantilevered off of the column. One limitation of this design is that the fuse only releases motion in one direction.
Figure 13 Butterfly fuse concept
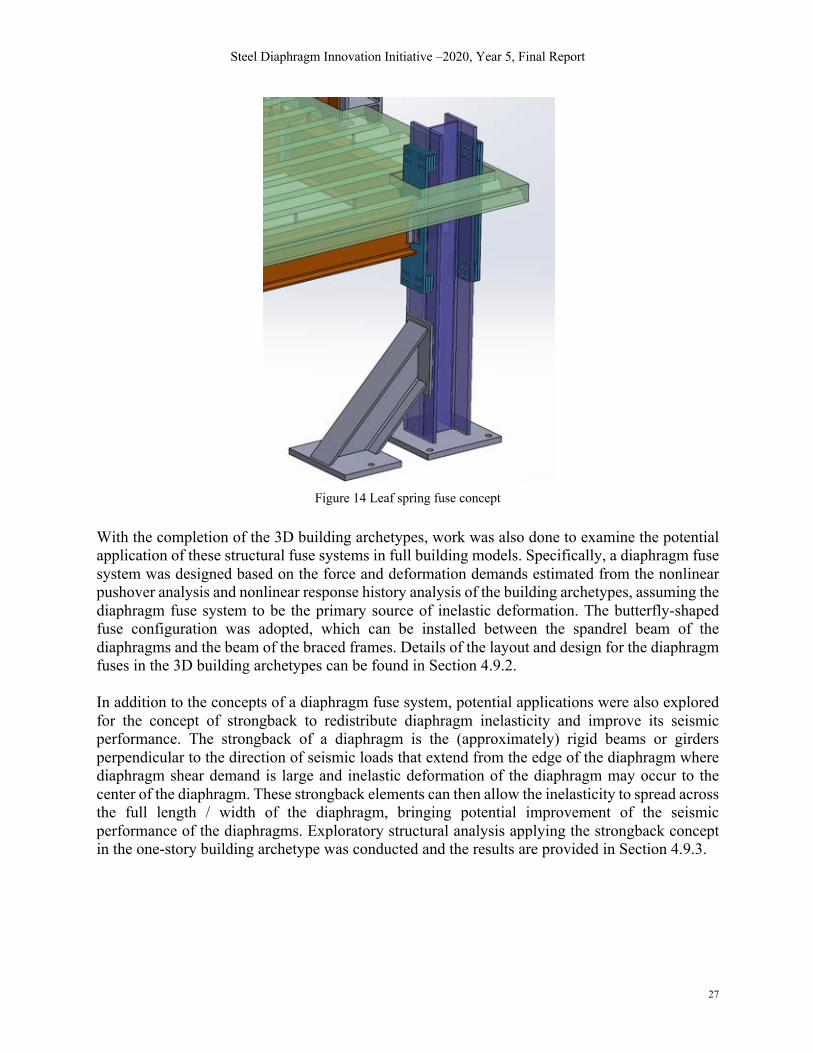
The second option utilizes leaf springs in a similar mechanism as the first, this concept is depicted in Figure 14. In this concept the collector beam is attached with a double angle connection to the center of the leaf spring. The two ends of the leaf spring are attached to the column. This permits the concrete slab and collector beam to move relative to the vertical column. Similarly to how the butterfly fuse can be tuned with different geometries the leaf spring also can have the dimensions adjusted to provide various stiffness to the structural system.
Steel Diaphragm Innovation Initiative –2020, Year 5, Final Report
27
Figure 14 Leaf spring fuse concept
With the completion of the 3D building archetypes, work was also done to examine the potential application of these structural fuse systems in full building models. Specifically, a diaphragm fuse system was designed based on the force and deformation demands estimated from the nonlinear pushover analysis and nonlinear response history analysis of the building archetypes, assuming the diaphragm fuse system to be the primary source of inelastic deformation. The butterfly-shaped fuse configuration was adopted, which can be installed between the spandrel beam of the diaphragms and the beam of the braced frames. Details of the layout and design for the diaphragm fuses in the 3D building archetypes can be found in Section 4.9.2. In addition to the concepts of a diaphragm fuse system, potential applications were also explored for the concept of strongback to redistribute diaphragm inelasticity and improve its seismic performance. The strongback of a diaphragm is the (approximately) rigid beams or girders perpendicular to the direction of seismic loads that extend from the edge of the diaphragm where diaphragm shear demand is large and inelastic deformation of the diaphragm may occur to the center of the diaphragm. These strongback elements can then allow the inelasticity to spread across the full length / width of the diaphragm, bringing potential improvement of the seismic performance of the diaphragms. Exploratory structural analysis applying the strongback concept in the one-story building archetype was conducted and the results are provided in Section 4.9.3.

Steel Diaphragm Innovation Initiative –2020, Year 5, Final Report
28
4.8 Seismic Standards Work (Schafer et al.) A summary of SDII related diaphragm standards work in year 5 include the following. BSSC IT9, BSSC PUC: Developed and shepherded new bare steel deck diaphragm provisions (RWFD, Rs, seismic detailing) into NEHRP 2020. Developed and shepherded new concrete-filled steel design diaphragm provisions (Rs) into Part III of NEHRP 2020. Mitigated the extension of FEMA P695 as a complete method for diaphragm assessment in paper on Rs determination provided in Part III of NEHRP 2020. Supported creation of a Part III resource paper for diaphragm deflection provided in Part III of NEHRP 2020. Successfully halted proposal in BSSC IT9 to effectively eliminate the use of traditional (i.e., ASCE 7-10) diaphragm design methods for bare steel deck. AISI: AISI S400: finalized (passed) seismic detailing provisions for bare steel deck diaphragms. AISI S310: finalized (passed) new provisions for the strength prediction of concrete-filled steel deck diaphragms. Have developed draft recommendations for reinforced concrete-filled steel deck. AISC: AISC 342/ASCE 41. New provisions for bare steel deck and concrete-filled steel deck developed and included in final passed version of AISC 342. AISC 360/AISC 341 working with AISC TC9 passed ballot on improvements to existing diaphragm design provisions that enable AISI S310 for strength calculations and clarify application of steel deck diaphragm. Working with AISC TC5 on potential improvements to shear stud design strength expressions for next cycle. ASCE: ASCE 7. Provided supporting materials for new bare steel deck diaphragm provisions which have been adopted by ASCE 7 based on previous NEHRP/BSSC work. This included new Rs values for bare still deck diaphragms, new Rdiaph values for bare steel deck diaphragms employed in rigid wall flexible diaphragm buildings, and adoption of AISI S400 for special seismic detailing. Provided supporting materials for new concrete-filled steel deck Rs provisions, which were also adopted into ASCE 7. ASCE 41. Participating in transfer of new AISC 342 provisions to ASCE 41. The new diaphragm provisions are a significant departure from the elastic requirements in past practice and provide significant expansion for retrofit and evaluation.
4.9 Validation of New Design and Technology
The last three tasks in the SDII Case and Plan, Innovation and Practice area, all relate to validation of new design and technology. All these validation efforts began in Year 3 and continue through Years 4 and 5 of the SDII effort. In general the validation steps for SDII design oriented work include: (a) internal research assessment by academic team, (b) practice oriented assessment by Sabelli, (c) presentation and review to SDII Industry Steering Group, (d) presentation to relevant standards group (at AISI, AISC, BSSC, etc.), (e) presentation to academic technical community (conferences), (f) formal documentation to technical literature (journals), (g) design proposal to relevant standards group (ballots) and voting. In addition, we have also performed (h) validation with key constituents in seismic structural engineering with the SDII January 2019 workshop. At any time, multiple iterations may occur within this process.
4.9.1 Validation of New Design (Schafer et al.)
Examples of new design methods undergoing validation include the suite of new provisions for bare steel deck and concrete-filled steel deck diaphragms related to ASCE7, NEHRP 2020, AISC 341, AISI S400 and AISI S310. This effort has undergone steps (a)-(e) & (g)-(h) in the list above. With (f) under review. Newer ideas, such as alternative force prediction methods for diaphragms
Steel Diaphragm Innovation Initiative –2020, Year 5, Final Report
29
are at the beginning stages of validation (a)-(c), while more mature ideas are already passed through code committees (g) and moving to technology transfer.
4.9.2 Validation of New Technology – Diaphragm Fuses (Wei/Eatherton et al.)
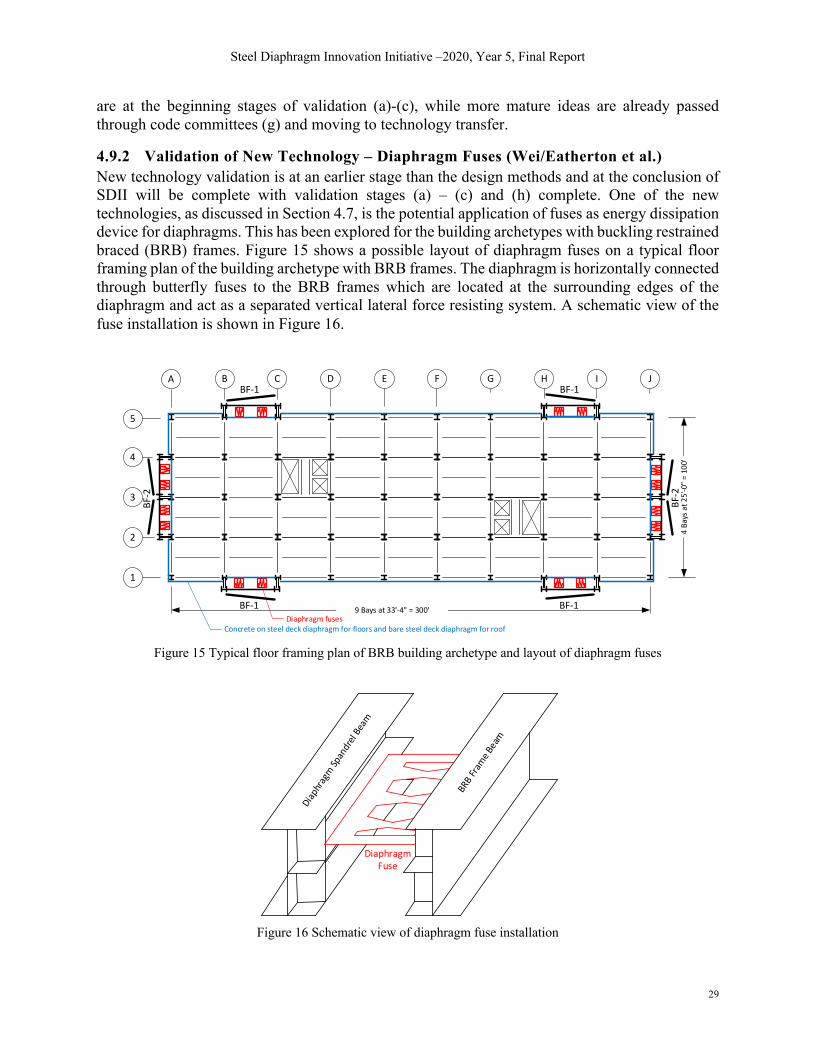
New technology validation is at an earlier stage than the design methods and at the conclusion of SDII will be complete with validation stages (a) – (c) and (h) complete. One of the new technologies, as discussed in Section 4.7, is the potential application of fuses as energy dissipation device for diaphragms. This has been explored for the building archetypes with buckling restrained braced (BRB) frames. Figure 15 shows a possible layout of diaphragm fuses on a typical floor framing plan of the building archetype with BRB frames. The diaphragm is horizontally connected through butterfly fuses to the BRB frames which are located at the surrounding edges of the diaphragm and act as a separated vertical lateral force resisting system. A schematic view of the fuse installation is shown in Figure 16.
Figure 15 Typical floor framing plan of BRB building archetype and layout of diaphragm fuses
Figure 16 Schematic view of diaphragm fuse installation
A B C D E F G H I J
1
2
3
4
5
9 Bays at 33'-4" = 300'
4 Ba
ys a
t 25'
-0" =
100
'
BF-2
Concrete on steel deck diaphragm for floors and bare steel deck diaphragm for roofDiaphragm fuses
BF-1 BF-1
BF-1 BF-1
BF-2
DiaphragmFuse

Steel Diaphragm Innovation Initiative –2020, Year 5, Final Report
30
The diaphragms fuses can be designed based on the force and deformation demands estimated from the nonlinear pushover analysis and nonlinear response history analysis of the building archetypes, assuming the diaphragm fuse system to be the primary source of inelastic deformation. The force demand of the diaphragm fuse can be approximated by the diaphragm seismic design force without considering the minimum threshold of 0.2 ∙ 2*+ ∙ 3, ∙ 4!- (see ASCE 7-16 Section 12.10). For the deformation demand of the diaphragm fuse, it can be estimated based on the inelastic deformation of the building archetype at a target 3% drift from the nonlinear pushover analysis, assuming the braced frames remain elastic while all the inelasticity is forced into the diaphragm fuses (as shown in Figure 17). Table 4 provides an example of the force and deformation demands for the diaphragm fuse design of the 4-story BRB building archetype. Based on the demands, the design details of these fuses are shown in Figure 18. Figure 19 shows the load-deformation curve of a butterfly fuse specimen tested by Ma et al. (2010), which can potentially be viable for such application.
Figure 17 Pushover curve for BRB building archetype (without diaphragm fuses)
Table 4 Example force and deformation demands for fuse design of 4-story BRB building archetype
Fuse Design Force Demand (kip) Deformation Demand* (in.) 1 (Roof) 60 12.5
2 (Level 2) 60 6 3 (Level 3-4) 90 11
!!"#$%& = !'%&*+,- − !,+*.-/+"0&

Steel Diaphragm Innovation Initiative –2020, Year 5, Final Report
31
Figure 18 Example diaphragm fuse design for 4-story BRB building archetype
Figure 19 Load-deformation curve of butterfly fuse [from (Ma et al, 2010)]
4.9.3 Validation of New Technology – Strongback (Wei/Eatherton et al.)
Efforts were also made to explore the novel application of a strongback in diaphragm systems to improve their seismic performance. As shown in Figure 20, the strongback of a diaphragm is the elements with high rigidity that are perpendicular to the direction of seismic loads and extend from the edge of the diaphragm, where diaphragm shear demand is large and inelastic deformation of the diaphragm may occur, to the center of the diaphragm. The goal of including these elements in the diaphragm is to spread the localized inelasticity across the full length / width of the diaphragm.

Steel Diaphragm Innovation Initiative –2020, Year 5, Final Report
32
Figure 20 Schematic view of diaphragm strongback
Nonlinear response history analysis was conducted on the one-story BRB building archetype with a strongback on the bare steel deck roof, similar to the analyses presented in Section 6.4.1. Various lengths of the strongback elements were considered in the study. The collapse probabilities of the building models with different diaphragm strongback options are provided in Table 5. It can be observed that compared to the baseline models without diaphragm strongback, including diaphragm strongback with a width of two bays on the roof of the building results in increased collapse probabilities, while increasing the width of the diaphragm strongback element to three bays can reduce the collapse probabilities, and the reduction is even more obvious when the strongback extends across the full length of the building. These results demonstrate the potential application of diaphragm strongback in improving the seismic performance of the diaphragms and reducing the risk of building collapse. The results also demonstrate that the design must be conducted with care for the solution to definitively improve performance.
Table 5 Collapse probability of 1-story BRB building archetype with different diaphragm strongback options
Length of Diaphragm Strongback Element
Collapse Probability DE MCE ACMR10%
No Strongback 0 4.5% 29.5% Width of 2 Bays 0 22.7% 52.3% Width of 3 Bays 0 2.3% 25.0%
Full Building Length 0 0 11.4%

Steel Diaphragm Innovation Initiative –2020, Year 5, Final Report
33
5 Experiments: Progress in Year 5 Experiments are an important component of the SDII effort. The team has previously conducted and reported on experiments on connectors, monotonic pushout tests, cyclic pushout tests, cyclic full-scale concrete-filled steel deck diaphragm tests, and monotonic standing seam panel diaphragm tests. In the following our reporting on SDII testing is organized in alignment with the tasks as detailed for Experiments in the SDII Case and Plan. Note, consistent with the project Research Plan tables in Section 3 SDII testing is complete, except for the full bay testing to be conducted at Northeastern University in a no cost extension year for the SDII project.
5.1 Existing Tests (Schafer et al.)
SDII Case and Plan, Experiments, Task 1, is complete. The existing data has been used to assess behavior and develop and calibrate new analysis and design methods. In addition, the existing data identified key holes in connector, interface, and diaphragm-level testing. These holes are all being addressed through SDII test programs as described herein.
5.2 Test Technologies (Eatherton et al.)
Various test technologies have been investigated, applied, and evaluated for use in large scale testing of diaphragms as described in past progress reports. Some of these approaches to measuring force, displacement, and cracking were especially useful in producing information about test specimen behavior that would not otherwise have been apparent, while other approaches were not as successful. The list below gives a brief summary of new testing approaches applied in the experimental programs, particularly in the cantilever concrete-filled steel deck diaphragm testing program and the cyclic pushout testing program. Other technologies were evaluated but not applied, such as hybrid simulation, for which it was decided that consistent cyclic loading protocols would provide more useful data. The large-scale test at Northeastern will also apply some of these test approaches. Test technologies that have been explored and used during the course of this project include:
1. For the cantilever concrete-filled steel deck diaphragm tests, a high-resolution picture was created by photo stitching together approximately 100 localized pictures. It is possible to zoom in and view relatively small cracks with these high-resolution pictures which are approximately 500 Megapixels. These photos also allowed the creation of detailed crack maps.
2. Groups of strain gages were used in cyclic pushout tests and in the cantilever diaphragm tests to determine not only the distribution of load among studs, but also whether a failure was associated with concrete or a shear failure of the stud itself. This was accomplished through a combination of strain gages on the steel beam and strain gages on the headed shear studs.
3. For the cantilever concrete-filled steel deck diaphragm tests, a method was developed to measure in-plane shear angle (shear angle is equal to displacement divided by the specimen span) that corrects for out of plane motion of the slab. This was necessary to obtain accurate measurements of diaphragm stiffness because concrete-filled steel deck diaphragms are so stiff that even small out-of-plane motion of the loaded end can cause error in the shear angle measurement.

Steel Diaphragm Innovation Initiative –2020, Year 5, Final Report
34
4. For one of the cantilever concrete-filled steel deck diaphragm tests, digital image correlation (DIC) was used to examine the local strain field on the side of the steel loading beam and the edge of the concrete as the concrete around the shear studs failed. The application of this noncontact measurements system was greatly limited by the constraints of the system used, specifically that the field of view was relatively small. However, the results were promising in terms of identifying cracks that were not visually observable. This test technology would be best applied with a DIC system with a field of view large enough to capture the entire specimen.
5. Early attempts were made to monitor deformation of concrete-filled steel deck diaphragm specimens using three-dimensional (3D) point clouds created from a large set of digital images (a form of photogrammetry). However, the 3D point clouds, while useful for capturing the deformed shape, were found to have insufficient resolution for capturing individual cracks or crack patterns.
Figure 21 Example of a Crack Map for Specimen 2/4-4-L-NF-DT After Diagonal Tension Cracking
5.3 Connector Tests (Schafer et al.)
This task is complete. Steel-to-steel connectors play an important role in the performance of bare steel deck diaphragms. A significant testing program was completed on these connectors and the results summarized in the Year 3 Report. This testing led directly to the design method and special seismic detailing developed for bare steel deck adopted by AISC 342, approved by the BSSC PUC for NEHRP, balloted and approved for AISI S400, adopted in ASCE 7 and soon under consideration at ASCE 41. Connectors in concrete-filled deck, such as headed shear studs, involve more complex interactions between the deck and fill as well as the stud and fill. Testing these conditions requires more complex configurations, and are termed “Interface Tests” in this effort and summarized in Section 5.4

Steel Diaphragm Innovation Initiative –2020, Year 5, Final Report
35
5.4 Interface Tests
5.4.1 Monotonic composite shear connectors (Avellaneda et al.)
For each concrete-filled steel deck, cantilever diaphragm specimen (Section 5.5) an accompanying set of monotonic push-out tests has been performed. Each set of push-out tests used the same material, deck, and concrete thickness as the corresponding cantilever diaphragm test. Table 6 describes the set of monotonic push-out specimens. The push-out tests with deck oriented perpendicular to the direction of load include configurations with studs in both the “strong” and “weak” positions. Table 6 describes the set of monotonic push-out specimens.
Table 6 Test Matrix for Shear Stud Push-out Tests for SDII
Testing Series Specimen Stud Position Concrete Type Number of Studs 2/4-4-L-NF S1-SG Strong LW 4
S2 Strong LW 4 W1 Weak LW 4
W2-SG Weak LW 4 SR1-SG Strong LW 4
SR2 Strong LW 4 SM1 Strong LW 2 SM2 Strong LW 2 SL1 Strong LW 4 SL2 Strong LW 4
3/6.25-4-L-NF S1 Strong LW 4 S2 Strong LW 4 S3 Strong LW 4
SR1-SG Strong LW 4 SR2 Strong LW 4 SR3 Strong LW 4 W1 Weak LW 4 W2 Weak LW 4 W3 Weak LW 4
3/7.5-4-N-NF S1 Strong NW 4 S2-SG Strong NW 4
SR1-SG Strong NW 4 SR2 Strong NW 4 SM1 Strong NW 2 SM2 Strong NW 2 W1 Weak NW 4
W2-SG Weak NW 4 3/6.25-4-L-NF-P S1 Strong LW 2
S2 Strong LW 2 W1 Weak LW 2 W2 Weak LW 2 P1 Deck Parallel LW 2 P2 Deck Parallel LW 2
3-7.5-4-N-NF-P S1 Strong NW 2 S2 Strong NW 2 S3 Strong NW 2 W1 Weak NW 2 W2 Weak NW 2 W3 Weak NW 2
Steel Diaphragm Innovation Initiative –2020, Year 5, Final Report
36
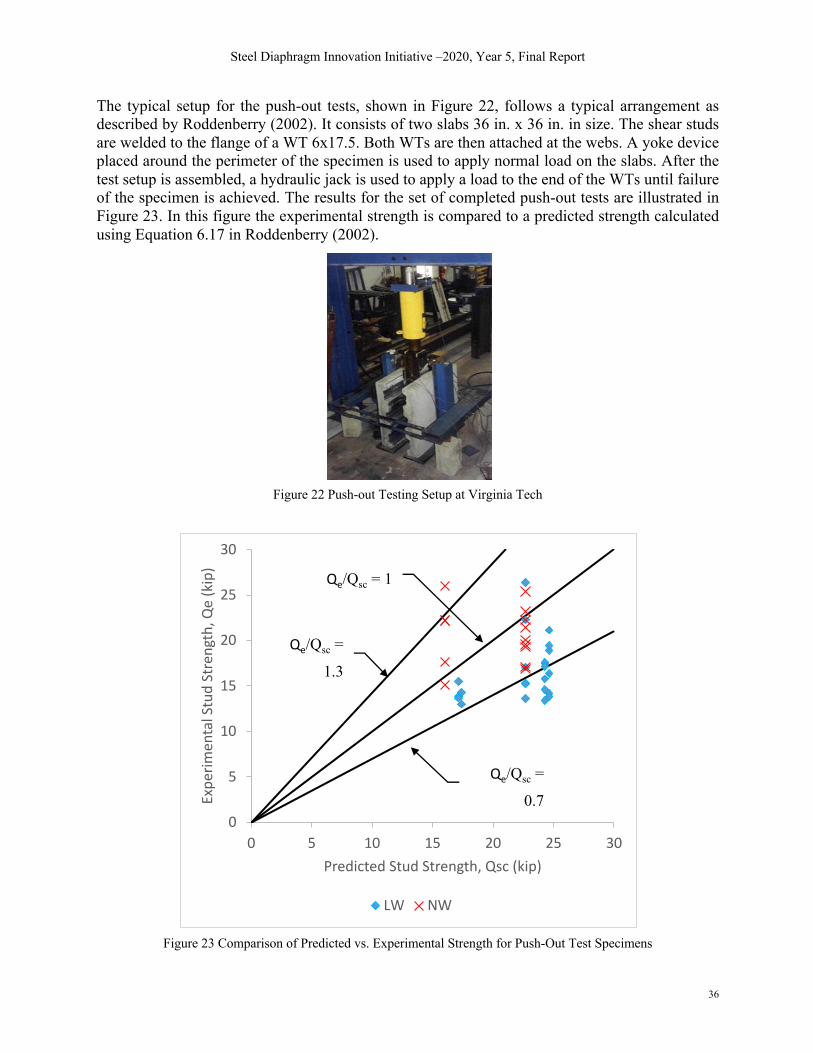
The typical setup for the push-out tests, shown in Figure 22, follows a typical arrangement as described by Roddenberry (2002). It consists of two slabs 36 in. x 36 in. in size. The shear studs are welded to the flange of a WT 6x17.5. Both WTs are then attached at the webs. A yoke device placed around the perimeter of the specimen is used to apply normal load on the slabs. After the test setup is assembled, a hydraulic jack is used to apply a load to the end of the WTs until failure of the specimen is achieved. The results for the set of completed push-out tests are illustrated in Figure 23. In this figure the experimental strength is compared to a predicted strength calculated using Equation 6.17 in Roddenberry (2002).
Figure 22 Push-out Testing Setup at Virginia Tech
Figure 23 Comparison of Predicted vs. Experimental Strength for Push-Out Test Specimens
0
5
10
15
20
25
30
0 5 10 15 20 25 30
Expe
rim
enta
l Stu
d St
reng
th, Q
e (k
ip)
Predicted Stud Strength, Qsc (kip)
LW NW
Qe/Qsc = 1
Qe/Qsc =
1.3
Qe/Qsc =
0.7

Steel Diaphragm Innovation Initiative –2020, Year 5, Final Report
37
5.4.2 Cyclic composite shear connectors (Briggs et al.)
A series of cyclic push-out tests and a new testing rig for performing such tests has been developed as described in this section. The cyclic composite shear connector test consists of a composite specimen that was cycled using hydraulic actuators in displacement control as depicted in Figure 24. Both monotonic and cyclic tests were performed. The monotonic tests provide a point of reference between current tests and past monotonic tests, direct one-to-one comparison to companion cyclic tests, and are necessary to get target displacement for the cyclic loading protocol.
Figure 24 Cyclic composite shear connector test setup
A full test matrix of all sixteen push-out tests conducted to study the cyclic performance of composite shear connectors is presented in Table 7. Varied parameters include, deck orientation, concrete density, slab position, stud grouping and location, and the loading protocol. The variation in design of these specimens was done to span all common configurations used in practice. Full dimensioned drawings of each specimen will be available in the forthcoming technical report. All of these experiments were tested in the same rig presented in Figure 24. Three hydraulic actuators were used to test the specimens, two framed into the steel beam horizontally and acted in anti-symmetry to push and pull the steel beam thus separating it from the restrained concrete. The third hydraulic actuator applied downward force on the specimen above the shear studs. This was to prevent the concrete slab from buckling upwards, a common failure mechanism that was present in other experimental push-out tests from the literature. This failure mechanism has been deemed by many researchers to be unrealistic and thus was eliminated by this applied load equal to ten percent of the expected ultimate strength of each respective specimen.

Steel Diaphragm Innovation Initiative –2020, Year 5, Final Report
38
Table 7 Push-out Test Matrix
For these sixteen push-out tests the ultimate capacity as well as the failure mechanism were of primary interest. Using this new horizontal testing rig successfully eliminated undesirable failure mechanisms observed in previous work, particularly slab buckling. The downward load applied onto the top of the concrete slab successfully restrained these sixteen specimens from experiencing slab buckling. Additionally, the horizontal load in this setup is applied to the steel beam at the top of the section, directly where the concrete meets the steel. This significantly limits the eccentricity in the system especially compared to past designs. It is likely that eccentricity would contribute to the undesirable slab buckling failure mechanism. The ultimate strength results are presented in Table 8 where they are subsequently compared to the expected strength as predicted by the AISC 360-16 Eqn. 5.4.2-1, for each respective specimen. The strength performance of the specimens against AISC 360-16 was also of significant interest. It was found that per the AISC 360-16 design equations the test to predicted strength ratio was generally less than one when using nominal material properties. These ratios decreased further when the measured material properties were used. Extensive research has been conducted into the past empirical formulation of AISC’s shear stud strength equation as well as the strength provision used in other countries. This research has been applied to determine the performance of past push-out tests throughout the literature compared to various current strength equations (See Section 4.3.3). This information will provide the necessary context for these sixteen push-out tests.
$. = 0.5"#/*+&',& ≤ !"!!"#/#$ Eqn. 5.4.2-1 Also from the results presented in Table 8 it can be seen that for these sixteen tests the cap portion of Eqn. 5.4.2-1 controlled the expected strength in all cases. This was not by design, rather this arose following our design of these specimens to represent common cases used by the industry. Additionally, note that the cyclic tests highlighted in blue each contain an East and West direction designation. An ultimate strength was obtained from the experimental results for both of these
P1 Perpendicular Lightweight Center One @ 12" O.C. All strong MonotonicP2 Perpendicular Lightweight Center One @ 12" O.C. All weak MonotonicP3 Perpendicular Lightweight Center One @ 12" O.C. All Weak CyclicP4 Perpendicular Lightweight Center One @ 12" O.C. 50-50 MonotonicP5 Perpendicular Lightweight Center One @ 12" O.C. 50-50 CyclicP6 Perpendicular Lightweight Center Two @ 12" O.C. All strong MonotonicP7 Perpendicular Lightweight Center Two @ 12" O.C. All weak MonotonicP8 Perpendicular Lightweight Center Two @ 12" O.C. All Weak CyclicP9 Perpendicular Lightweight Center Two @ 12" O.C. 50-50 MonotonicP10 Perpendicular Lightweight Center Two @ 12" O.C. 50-50 CyclicP11 Parallel Lightweight Center One @ 12" O.C. Alternate sides MonotonicP12 Parallel Lightweight Center One @ 12" O.C. Alternate sides CyclicP13 Parallel Normal-weight Center One @ 12" O.C. Alternate sides MonotonicP14 Parallel Normal-weight Center One @ 12" O.C. Alternate sides CyclicP15 Parallel Lightweight Edge One @ 12" O.C. Alternate sides MonotonicP16 Parallel Lightweight Edge One @ 12" O.C. Alternate sides Cyclic
LoadingTest # DeckOrientation
Concrete Weight
Slab Position
Stud Grouping
Stud Location
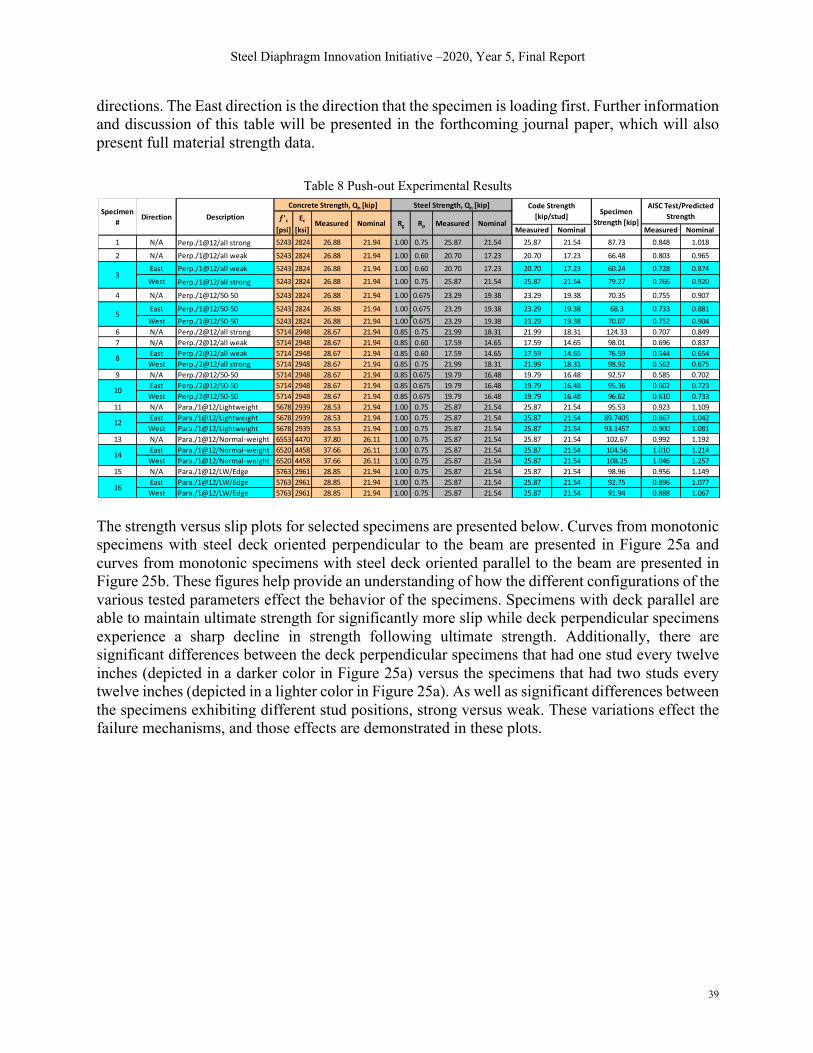
Steel Diaphragm Innovation Initiative –2020, Year 5, Final Report
39
directions. The East direction is the direction that the specimen is loading first. Further information and discussion of this table will be presented in the forthcoming journal paper, which will also present full material strength data.
Table 8 Push-out Experimental Results
The strength versus slip plots for selected specimens are presented below. Curves from monotonic specimens with steel deck oriented perpendicular to the beam are presented in Figure 25a and curves from monotonic specimens with steel deck oriented parallel to the beam are presented in Figure 25b. These figures help provide an understanding of how the different configurations of the various tested parameters effect the behavior of the specimens. Specimens with deck parallel are able to maintain ultimate strength for significantly more slip while deck perpendicular specimens experience a sharp decline in strength following ultimate strength. Additionally, there are significant differences between the deck perpendicular specimens that had one stud every twelve inches (depicted in a darker color in Figure 25a) versus the specimens that had two studs every twelve inches (depicted in a lighter color in Figure 25a). As well as significant differences between the specimens exhibiting different stud positions, strong versus weak. These variations effect the failure mechanisms, and those effects are demonstrated in these plots.
Measured Nominal Measured Nominal1 N/A Perp./1@12/all strong 5243 2824 26.88 21.94 1.00 0.75 25.87 21.54 25.87 21.54 87.73 0.848 1.0182 N/A Perp./1@12/all weak 5243 2824 26.88 21.94 1.00 0.60 20.70 17.23 20.70 17.23 66.48 0.803 0.965
East Perp./1@12/all weak 5243 2824 26.88 21.94 1.00 0.60 20.70 17.23 20.70 17.23 60.24 0.728 0.874West Perp./1@12/all strong 5243 2824 26.88 21.94 1.00 0.75 25.87 21.54 25.87 21.54 79.27 0.766 0.920
4 N/A Perp./1@12/50-50 5243 2824 26.88 21.94 1.00 0.675 23.29 19.38 23.29 19.38 70.35 0.755 0.907East Perp./1@12/50-50 5243 2824 26.88 21.94 1.00 0.675 23.29 19.38 23.29 19.38 68.3 0.733 0.881West Perp./1@12/50-50 5243 2824 26.88 21.94 1.00 0.675 23.29 19.38 23.29 19.38 70.07 0.752 0.904
6 N/A Perp./2@12/all strong 5714 2948 28.67 21.94 0.85 0.75 21.99 18.31 21.99 18.31 124.33 0.707 0.8497 N/A Perp./2@12/all weak 5714 2948 28.67 21.94 0.85 0.60 17.59 14.65 17.59 14.65 98.01 0.696 0.837
East Perp./2@12/all weak 5714 2948 28.67 21.94 0.85 0.60 17.59 14.65 17.59 14.65 76.59 0.544 0.654West Perp./2@12/all strong 5714 2948 28.67 21.94 0.85 0.75 21.99 18.31 21.99 18.31 98.92 0.562 0.675
9 N/A Perp./2@12/50-50 5714 2948 28.67 21.94 0.85 0.675 19.79 16.48 19.79 16.48 92.57 0.585 0.702East Perp./2@12/50-50 5714 2948 28.67 21.94 0.85 0.675 19.79 16.48 19.79 16.48 95.36 0.602 0.723West Perp./2@12/50-50 5714 2948 28.67 21.94 0.85 0.675 19.79 16.48 19.79 16.48 96.62 0.610 0.733
11 N/A Para./1@12/Lightweight 5678 2939 28.53 21.94 1.00 0.75 25.87 21.54 25.87 21.54 95.53 0.923 1.109East Para./1@12/Lightweight 5678 2939 28.53 21.94 1.00 0.75 25.87 21.54 25.87 21.54 89.7405 0.867 1.042West Para./1@12/Lightweight 5678 2939 28.53 21.94 1.00 0.75 25.87 21.54 25.87 21.54 93.1457 0.900 1.081
13 N/A Para./1@12/Normal-weight 6553 4470 37.80 26.11 1.00 0.75 25.87 21.54 25.87 21.54 102.67 0.992 1.192East Para./1@12/Normal-weight 6520 4458 37.66 26.11 1.00 0.75 25.87 21.54 25.87 21.54 104.56 1.010 1.214West Para./1@12/Normal-weight 6520 4458 37.66 26.11 1.00 0.75 25.87 21.54 25.87 21.54 108.25 1.046 1.257
15 N/A Para./1@12/LW/Edge 5763 2961 28.85 21.94 1.00 0.75 25.87 21.54 25.87 21.54 98.96 0.956 1.149East Para./1@12/LW/Edge 5763 2961 28.85 21.94 1.00 0.75 25.87 21.54 25.87 21.54 92.75 0.896 1.077West Para./1@12/LW/Edge 5763 2961 28.85 21.94 1.00 0.75 25.87 21.54 25.87 21.54 91.94 0.888 1.067
Nominal
Code Strength [kip/stud]
14
16
3
5
8
10
12
AISC Test/Predicted StrengthSpecimen
# Direction Description SpecimenStrength [kip]f 'c
[psi]Ec
[ksi]
Concrete Strength, Qn [kip]
Measured Nominal Rg Rp
Steel Strength, Qn [kip]
Measured
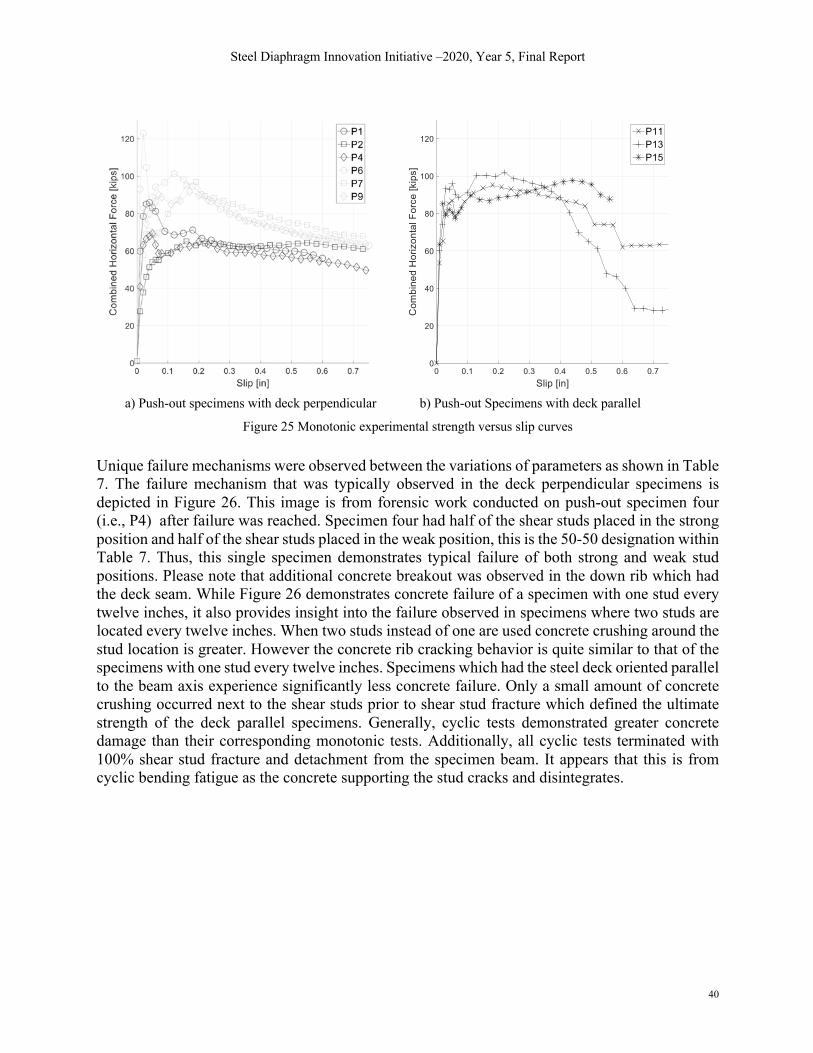
Steel Diaphragm Innovation Initiative –2020, Year 5, Final Report
40
a) Push-out specimens with deck perpendicular b) Push-out Specimens with deck parallel
Figure 25 Monotonic experimental strength versus slip curves
Unique failure mechanisms were observed between the variations of parameters as shown in Table 7. The failure mechanism that was typically observed in the deck perpendicular specimens is depicted in Figure 26. This image is from forensic work conducted on push-out specimen four (i.e., P4) after failure was reached. Specimen four had half of the shear studs placed in the strong position and half of the shear studs placed in the weak position, this is the 50-50 designation within Table 7. Thus, this single specimen demonstrates typical failure of both strong and weak stud positions. Please note that additional concrete breakout was observed in the down rib which had the deck seam. While Figure 26 demonstrates concrete failure of a specimen with one stud every twelve inches, it also provides insight into the failure observed in specimens where two studs are located every twelve inches. When two studs instead of one are used concrete crushing around the stud location is greater. However the concrete rib cracking behavior is quite similar to that of the specimens with one stud every twelve inches. Specimens which had the steel deck oriented parallel to the beam axis experience significantly less concrete failure. Only a small amount of concrete crushing occurred next to the shear studs prior to shear stud fracture which defined the ultimate strength of the deck parallel specimens. Generally, cyclic tests demonstrated greater concrete damage than their corresponding monotonic tests. Additionally, all cyclic tests terminated with 100% shear stud fracture and detachment from the specimen beam. It appears that this is from cyclic bending fatigue as the concrete supporting the stud cracks and disintegrates.
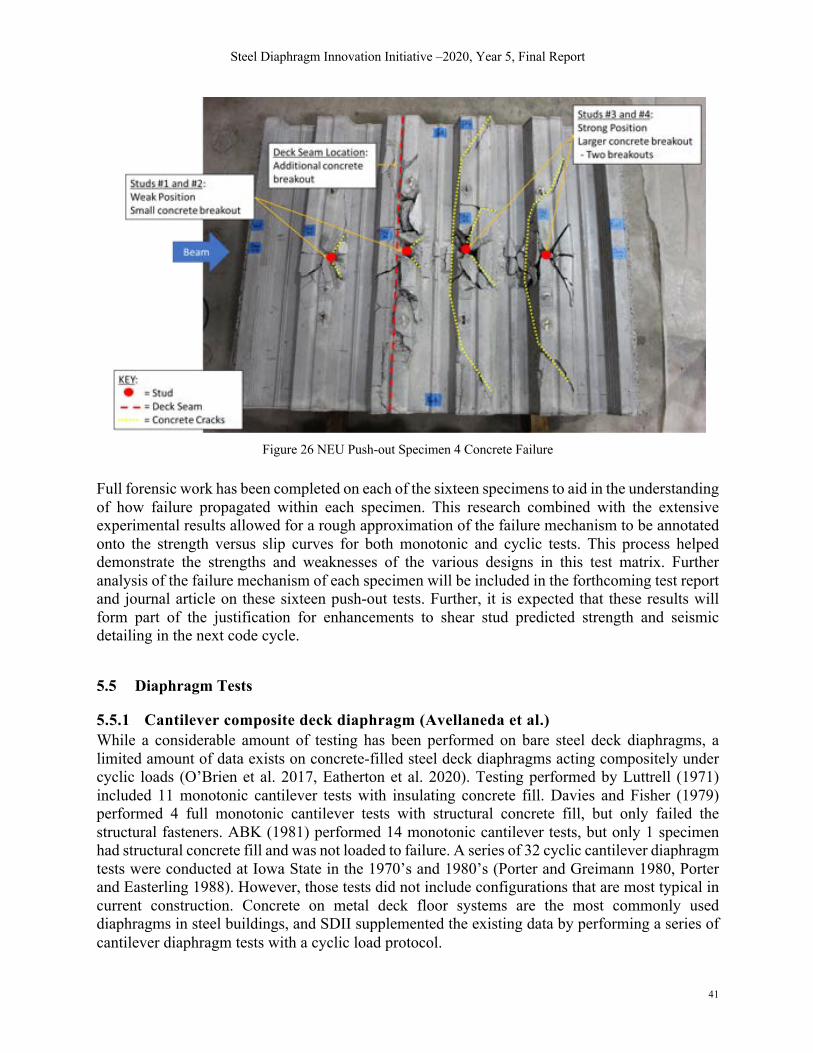
Steel Diaphragm Innovation Initiative –2020, Year 5, Final Report
41
Figure 26 NEU Push-out Specimen 4 Concrete Failure
Full forensic work has been completed on each of the sixteen specimens to aid in the understanding of how failure propagated within each specimen. This research combined with the extensive experimental results allowed for a rough approximation of the failure mechanism to be annotated onto the strength versus slip curves for both monotonic and cyclic tests. This process helped demonstrate the strengths and weaknesses of the various designs in this test matrix. Further analysis of the failure mechanism of each specimen will be included in the forthcoming test report and journal article on these sixteen push-out tests. Further, it is expected that these results will form part of the justification for enhancements to shear stud predicted strength and seismic detailing in the next code cycle.
5.5 Diaphragm Tests
5.5.1 Cantilever composite deck diaphragm (Avellaneda et al.)
While a considerable amount of testing has been performed on bare steel deck diaphragms, a limited amount of data exists on concrete-filled steel deck diaphragms acting compositely under cyclic loads (O’Brien et al. 2017, Eatherton et al. 2020). Testing performed by Luttrell (1971) included 11 monotonic cantilever tests with insulating concrete fill. Davies and Fisher (1979) performed 4 full monotonic cantilever tests with structural concrete fill, but only failed the structural fasteners. ABK (1981) performed 14 monotonic cantilever tests, but only 1 specimen had structural concrete fill and was not loaded to failure. A series of 32 cyclic cantilever diaphragm tests were conducted at Iowa State in the 1970’s and 1980’s (Porter and Greimann 1980, Porter and Easterling 1988). However, those tests did not include configurations that are most typical in current construction. Concrete on metal deck floor systems are the most commonly used diaphragms in steel buildings, and SDII supplemented the existing data by performing a series of cantilever diaphragm tests with a cyclic load protocol.
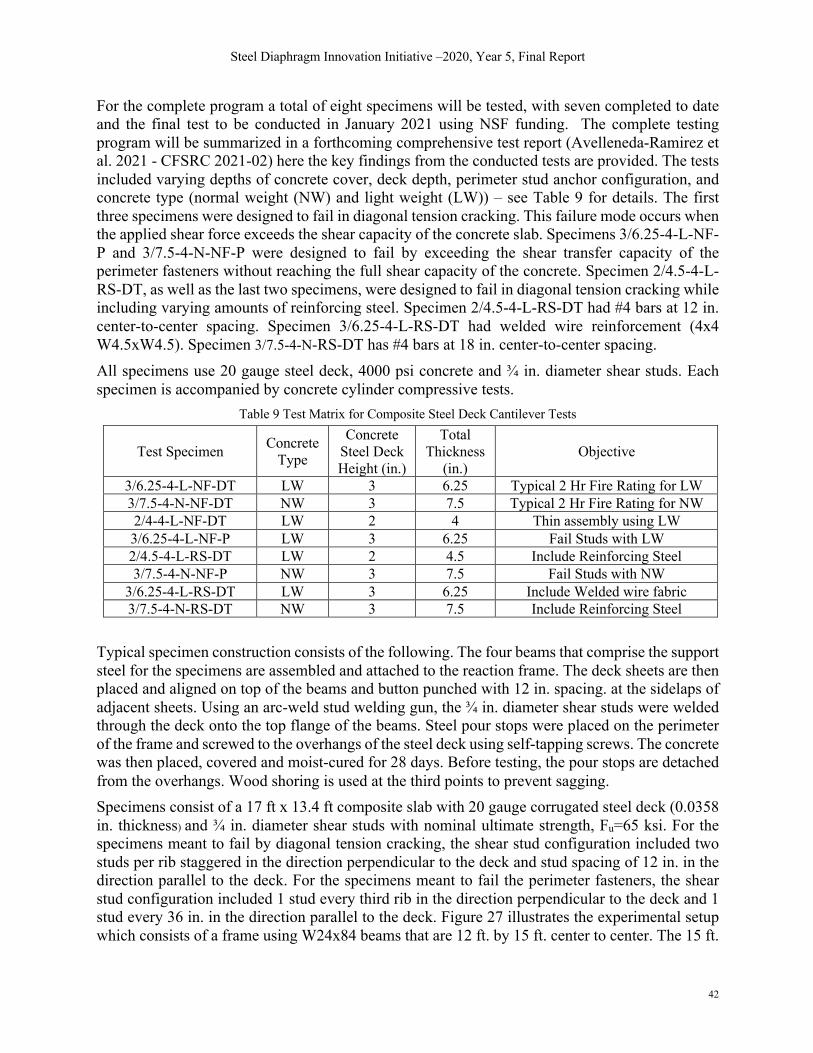
Steel Diaphragm Innovation Initiative –2020, Year 5, Final Report
42
For the complete program a total of eight specimens will be tested, with seven completed to date and the final test to be conducted in January 2021 using NSF funding. The complete testing program will be summarized in a forthcoming comprehensive test report (Avelleneda-Ramirez et al. 2021 - CFSRC 2021-02) here the key findings from the conducted tests are provided. The tests included varying depths of concrete cover, deck depth, perimeter stud anchor configuration, and concrete type (normal weight (NW) and light weight (LW)) – see Table 9 for details. The first three specimens were designed to fail in diagonal tension cracking. This failure mode occurs when the applied shear force exceeds the shear capacity of the concrete slab. Specimens 3/6.25-4-L-NF-P and 3/7.5-4-N-NF-P were designed to fail by exceeding the shear transfer capacity of the perimeter fasteners without reaching the full shear capacity of the concrete. Specimen 2/4.5-4-L-RS-DT, as well as the last two specimens, were designed to fail in diagonal tension cracking while including varying amounts of reinforcing steel. Specimen 2/4.5-4-L-RS-DT had #4 bars at 12 in. center-to-center spacing. Specimen 3/6.25-4-L-RS-DT had welded wire reinforcement (4x4 W4.5xW4.5). Specimen 3/7.5-4-N-RS-DT has #4 bars at 18 in. center-to-center spacing. All specimens use 20 gauge steel deck, 4000 psi concrete and ¾ in. diameter shear studs. Each specimen is accompanied by concrete cylinder compressive tests.
Table 9 Test Matrix for Composite Steel Deck Cantilever Tests
Test Specimen Concrete Type
Concrete Steel Deck Height (in.)
Total Thickness
(in.) Objective
3/6.25-4-L-NF-DT LW 3 6.25 Typical 2 Hr Fire Rating for LW 3/7.5-4-N-NF-DT NW 3 7.5 Typical 2 Hr Fire Rating for NW 2/4-4-L-NF-DT LW 2 4 Thin assembly using LW 3/6.25-4-L-NF-P LW 3 6.25 Fail Studs with LW 2/4.5-4-L-RS-DT LW 2 4.5 Include Reinforcing Steel 3/7.5-4-N-NF-P NW 3 7.5 Fail Studs with NW
3/6.25-4-L-RS-DT LW 3 6.25 Include Welded wire fabric 3/7.5-4-N-RS-DT NW 3 7.5 Include Reinforcing Steel
Typical specimen construction consists of the following. The four beams that comprise the support steel for the specimens are assembled and attached to the reaction frame. The deck sheets are then placed and aligned on top of the beams and button punched with 12 in. spacing. at the sidelaps of adjacent sheets. Using an arc-weld stud welding gun, the ¾ in. diameter shear studs were welded through the deck onto the top flange of the beams. Steel pour stops were placed on the perimeter of the frame and screwed to the overhangs of the steel deck using self-tapping screws. The concrete was then placed, covered and moist-cured for 28 days. Before testing, the pour stops are detached from the overhangs. Wood shoring is used at the third points to prevent sagging. Specimens consist of a 17 ft x 13.4 ft composite slab with 20 gauge corrugated steel deck (0.0358 in. thickness) and ¾ in. diameter shear studs with nominal ultimate strength, Fu=65 ksi. For the specimens meant to fail by diagonal tension cracking, the shear stud configuration included two studs per rib staggered in the direction perpendicular to the deck and stud spacing of 12 in. in the direction parallel to the deck. For the specimens meant to fail the perimeter fasteners, the shear stud configuration included 1 stud every third rib in the direction perpendicular to the deck and 1 stud every 36 in. in the direction parallel to the deck. Figure 27 illustrates the experimental setup which consists of a frame using W24x84 beams that are 12 ft. by 15 ft. center to center. The 15 ft.

Steel Diaphragm Innovation Initiative –2020, Year 5, Final Report
43
dimension was selected to accommodate five deck sheet widths and be consistent with past testing while the 12 ft. dimension was chosen based on space considerations in the testing laboratory.
Figure 27 Experimental Setup
The cyclic loading protocol is based on FEMA 461, Section 2.9.1, and includes at least six cycles before reaching the elastic limit. The elastic limit is calculated as a ratio of the predicted ultimate strength, Eq. (5.5-1), to the predicted stiffness, Eq. (5.5-2). It was verified afterwards that this approach resulted in more than six cycles of loading before reaching the elastic limit. The loading protocol includes two cycles for every displacement step with a 40% increase in amplitude between displacement steps. The loading is implemented using two actuators working in tandem. One actuator is displacement controlled while the force in the second is constrained to be force dependent on the master actuator. An array of string potentiometers (Figure 28) was used to collect displacement data from the specimens. Shear angle is calculated per AISI S907-13 using diagonal measurements of string potentiometers 1 and 5. The placement of the instrumentation along the depth of the specimen is outlined in Figure 29.
Figure 28 Instrumentation Setup
W 24x84 (2 studs at 12 in.)
W 2
4x84
(Stu
ds a
t 12
in.)
Deck Direction
15 ft.
12 ft.
17 ft.
13.3 ft.
W 2
4x84
(Stu
ds a
t 12
in.)
W 24x84 (2 studs at 12 in.)Master Actuator in
Displacement Control
Slave Actuator in Force Control
Stud spacing equal to approximately 36 in. for specimens designed to fail the perimeter fasteners

Steel Diaphragm Innovation Initiative –2020, Year 5, Final Report
44
(a) (b)
Figure 29 Instrumentation Detail: (a) typical configuration, (b) specimens 3/7.5-4-N-NF-DT and 2/4-4-L-NF-DT Eq. (5.5-1) was used to predict the concrete contribution to the shear strength of the cantilever diaphragm specimens using measured concrete strength. This equation is obtained from O’Brien et al. (2017) as a proposed modification to existing AISI S310 equations for composite diaphragm strength and were recently adopted in AISI S310 for its next edition. The proposed modification has been validated using past testing data with an average measured to predicted strength ratio of 1.08 and a standard deviation of 0.10 based on 15 specimens (O’Brien et al. 2017).
5& = 6 ∙ 7 ∙ 8, ∙ 9*+&' ;7<=+8 > (5.5-1)
where, λ = lightweight factor (1 for NW, 0.75 for LW) k= concrete strength factor, (0.0032) te = equivalent total transformed concrete thickness, (inch) b = unit width, (12 in.) fc' = Concrete Strength (psi) Eq. (5.5-2) is used to calculate a prediction for shear stiffness of composite diaphragms and was based on the equation from O’Brien et al. (2017).
?' = @ ∙ 8,*f0' ;7<=<B > (5.5-2)
where, 8, = Effective concrete thickness, (in.)
@ = 4.8 +&' = Concrete Strength (psi)
Top Layer of Diagonal String Potentiometers
Mid Layer of Diagonal String Potentiometers
Bottom Layer of Diagonal String Potentiometers
Section A-A Uplift Laser Sensor

Steel Diaphragm Innovation Initiative –2020, Year 5, Final Report
45
5.5.1.1 Summary of Results
A brief summary of the results is presented below. A detailed presentation of the results is provided in the forthcoming report (Avellaneda-Ramirez et al 2021). The predictions of ultimate strength and results for the specimens tested to date are summarized in Table 10. A graphical representation of the results is presented in Figure 30. The load-deformation plots for the specimens tested to date are presented in Figure 31, note different vertical scales are used across the plots.
Table 10 Summary of Strength and Stiffness Predictions and Results
Test Specimen Predicted Strength (kip)
Experimental Strength (kip)
3/6.25-4-L-NF-DT 136 139 3/7.5-4-N-NF-DT 226 230 2/4-4-L-NF-DT 86 134 3/6.25-4-L-NF-P 77 60.5 2/4.5-4-L-RS-DT 285 264 3/7.5-4-N-NF-P 84.9 84.7
3/6.25-4-L-RS-DT 200.9 200.3
Figure 30 Comparison of Predicted vs. Experimental Strength for Cantilever Diaphragm Specimens
0
50
100
150
200
250
300
0 50 100 150 200 250 300
Expe
rimen
tal S
hear
Str
engt
h (k
ip)
Predicted Shear Strength (kip)
Exp./Pred. =
1

Steel Diaphragm Innovation Initiative –2020, Year 5, Final Report
46
a) 3/6.25-4-L-NF-DT b) 3/7.5-4-N-NF-DT
c) 2/4-4-L-NF-DT d) 3/6.25-4-L-NF-P
e) 2/4.5-4-N-RS-DT f) 3/7.5-4-N-NF-P

Steel Diaphragm Innovation Initiative –2020, Year 5, Final Report
47
g) 3/6.25-4-L-RS-DT Figure 31 Load Deformation Plots of Cantilever Diaphragm Specimens
5.5.2 Standing seam roof testing (Wei et al.)
The standing seam roof (SSR) system is the most commonly used roof system for metal buildings due to its superior durability, water tightness, and energy efficiency. In this type of system, SSR panels attach to Z-shaped or C-shaped cold-formed steel purlins with clips, and the purlins are in turn connected to rafters (i.e. roof beams) comprised of welded 3-plate steel sections. For the design of the rafters against lateral torsional buckling, bottom flange braces provide torsional bracing to the rafter and the SSR system provides some additional lateral bracing. However, the degree to which the SSR system can restrain the rafter against lateral movement has not previously been studied. The objective of this study is to quantify the in-plane strength and stiffness of the SSR system and identify how this can be used to provide lateral bracing to the rafter. A total of 11 full-scale standing seam roof specimens were tested to investigate the effects of different standing seam roof configurations (SSR panel type, clip type, thermal insulation, and purlin spacing) on the in-plane stiffness and strength of the SSR system. The resulting stiffness and peak strength of the specimens were tabulated and compared for different SSR configurations. Results showed that the in-plane load-deformation behavior of SSR systems was governed by clip deformations and that variations in the type of SSR panel or clip can have a major impact on the strength and stiffness of the specimens. A specimen with vertical rib panels was shown to have 16 times more stiffness than a similar specimen with trapezoidal rib panels because the vertical ribs restrain the clip deformation. However, even a small standoff was found to reduce the stiffness of vertical rib SSR assemblies with more than three-fold drop in stiffness as the standoff was increased from no standoff to 0.4 in. Trapezoidal rib SSR assemblies had consistent strength stiffness with fixed clips having standoff from 0 or 0.5 in., but with floating clips the stiffness decreased with increasing standoff. Addition of blanket insulation and thermal blocks were found to result in 60% to 350% increase in stiffness. A method for using these experimental results in calculations of required bracing for metal building rafters was developed. An example is also provided which demonstrates that the SSR roof can contribute to bracing of the rafter and may reduce spacing or size of discrete torsional braces.

Steel Diaphragm Innovation Initiative –2020, Year 5, Final Report
48
Since detailed information about this study was presented in prior progress reports, only a summary is provided in this progress report. The final report on this work is complete and publicly available at the CFSRC DSpace library collection: Wei et al. (2020a).
5.6 Building Bay/Full Building Tests (Briggs et al.)
SDII Case and Plan, Experiments, Tasks 6 and 7, are focused on large scale testing. Outside funding was not secured for a full building test; however, the SDII team is conducting a large scale cyclic test of a full building bay at the labs in Northeastern. This test rounds out the diaphragm testing pursued by SDII by including many of the features of actual building construction that are not captured in traditional diaphragm testing. The tests proposed in this section use cyclic loading of the entire floor framing, thus providing response of a complete floor system. In addition, such testing provides the opportunity for future investigation into integrating energy dissipating fuses in the chords and collectors. The monotonic and cyclic push-out tests provided the baseline understanding of shear stud performance as the integral component in composite steel deck diaphragms. Currently the team has fully designed the test and ordered the components. This test will be conducted in 2021 as part of a no cost extension for the SDII effort and will be summarized in an addendum to this report in December 2021. The design of this specimen was informed by our extensive cantilever diaphragm database, recent SDII cantilever diaphragm testing, monotonic and cyclic push-out experiments and the SDII building archetypes. The full-scale diaphragm bay specimen has been designed to emulate a portion of these well informed building archetypes. Through mirroring member sizes, shear stud configuration and size, deck geometry, reinforcement pattern, and lateral force resisting system (LFRS) flexibility, a specimen has been designed that represents much of the current composite floor diaphragms built today. The specimen consists of one 20 foot by 28 foot bay spanning between four W14x176 columns, as shown in Figure 32. Each column has two braces at their base. The perimeter of the diaphragm will have two collectors made from W18x35’s spanning the shorter edge of the specimen and two chords made from W21x62’s. There are three W21x62 girders running parallel to the collectors. Lastly there are four W16x26 beams which run parallel to the chords. These sizes were chosen through use of the SDII building archetypes. This helps to ensure that the specimen represents common construction practices and that the building will exemplify normal building behavior.
Figure 32 Full-scale diaphragm specimen plan and isometric views
Steel Diaphragm Innovation Initiative –2020, Year 5, Final Report
49
The specimen will include 3 in. high steel deck with 3.25 in. of lightweight concrete above the deck. Welded wire reinforcement, 6x6 – W2.1/W2.1, is used throughout the slab, additional reinforcement is only included in the edge overhangs and surrounding the columns. The shear studs used are 0.75 in. in diameter and 4.5 in. long. The studs along the collector were designed with a spacing of 24 in. such that the stud strength has a comparable strength to the diaphragm shear strength. This 24 in. stud spacing along the collector is relatively wide, but common in practice. In the tests the slab may also bear against the columns, thus failure in diaphragm shear (diagonal tension cracking in the concrete) not at the shear studs is the expected failure mode. The diaphragm specimen is situated between two pairs of actuators. On the left of Figure 32 two large actuators will be moving in the same direction as the two medium sized actuators shown on the right of the figure. By having the actuator pairs work together in antisymmetric a greater load is able to be applied to the specimen. Due to the cyclic nature of the load application the actuator requires the ability to impose compressive and tensile loads on the specimen. The actuators act on the line of intersection between the concrete slab and the top of flange surface on the chords. In compression the two distribution beams apply load to both the chord and the concrete. In tension the distribution beams pull on the chord to assist in applying tension to the concrete slab the two distribution beams are connected with reinforcement through the slab. The results from this experiment will provide valuable insight into the cyclic force flows and progression of damage in typical composite steel deck diaphragms subjected to seismic loads, including the cyclic behavior of the crucial composite interface between the deck and the collectors. Additionally, this experiment will allow the characterization of diaphragm ductility considering full floor framing rather than in isolation, an integral purpose of this multi-institutional project, in order to validate and improve ductility-based diaphragm design provisions. Additionally, following the completion of this experiment, there are further research opportunities to design and optimize composite steel deck diaphragms under seismic loads.
5.7 Test Database (Schafer et al.)
SDII Case and Plan, Experiments, Task 5.7 is complete and detailed in Sections 4.3.1 and 4.3.1.
5.8 Test Standards (Eatherton et al.)
As part of the Seismic Standards work of Section 4.8 the team has also supported the development of improved test standards. This includes high level support such as the transition of the AISI Test Standards from prescriptive details to performance objectives with deemed to comply example details, and more low level objectives: introducing cyclic test standards for bare steel deck connections. In addition, we are using our test experience to support the creation and refinement of test standards for monotonic push-out testing, cyclic push-out testing and cyclic cantilever diaphragm testing with concrete-filled steel deck specimens. The conventional monotonic push-out test setup was identified as an area where further advancements are necessary since this test setup can be sensitive to uneven loading, setup imperfections, unrealistic failure modes, and lower bound behavior between multiple studs in two slabs. Members of the team are helping in the creation of a push-out testing standard aimed at standardizing best practices, while lessons learned in the development of the cyclic pushout test setup can also inform a next generation of stud connector testing standards. The objective of these efforts is to provide a level playing field amongst solutions and a clear path for innovative proprietary solutions in steel deck diaphragms.
Steel Diaphragm Innovation Initiative –2020, Year 5, Final Report
50
5.9 Outreach & Training (Eatherton et al.)
During this reporting period and beyond the end of the official SDII project period, the project team continues to have an ongoing commitment to outreach and training, with emphasis on presenting results to the practicing structural engineering community, training students through participation in research activities, and adding diaphragm-related course content to engineering classes. During this reporting period, approximately 8 undergraduate and 7 graduate students participated in this research. These students, like past students involved in the project, are being beneficially exposed to structural engineering with an emphasis on steel construction solutions. A diaphragm learning module that was created in past reporting periods has been implemented multiple times in graduate level Seismic Design and Intermediate Steel Design courses at Virginia Tech. During this reporting period, the pandemic changed the way the project team presented the results of the research to the practicing engineering community with some limited opportunities to present in person such as the MBMA Research Symposium and the CFSRC Research Symposium, but other opportunities to circulate research results in conference proceedings. Several presentations are being planned for conferences beyond the end of the project period. Several journal articles are under way and will be finalized beyond the life of the project. In addition the team is planning to provide proposals for SDII-related technology transfer to the industry association partners as well as interested third parties: e.g., ATC, FEMA, NIST.
5.9.1 Coordination with Fleischman collector testing (Schafer et al.)
Throughout the life of the SDII project we collaborated and coordinated with Fleischman, Uang, Ricles, and Sause’s NSF project on collectors. We hosted updates of their project on our website and we had a joint session at the 2019 Structures Congress. We will continue to work with them beyond the life of the SDII project as their work and SDII’s work continues to work into standards and practice.
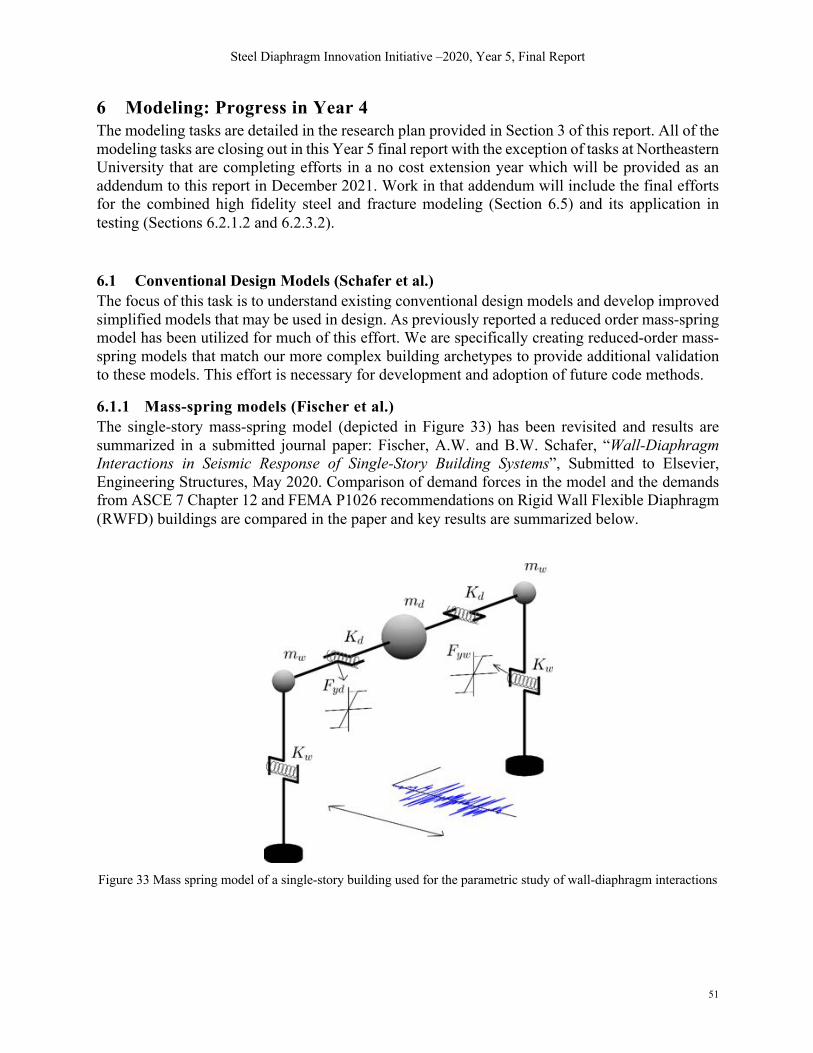
Steel Diaphragm Innovation Initiative –2020, Year 5, Final Report
51
6 Modeling: Progress in Year 4 The modeling tasks are detailed in the research plan provided in Section 3 of this report. All of the modeling tasks are closing out in this Year 5 final report with the exception of tasks at Northeastern University that are completing efforts in a no cost extension year which will be provided as an addendum to this report in December 2021. Work in that addendum will include the final efforts for the combined high fidelity steel and fracture modeling (Section 6.5) and its application in testing (Sections 6.2.1.2 and 6.2.3.2).
6.1 Conventional Design Models (Schafer et al.)
The focus of this task is to understand existing conventional design models and develop improved simplified models that may be used in design. As previously reported a reduced order mass-spring model has been utilized for much of this effort. We are specifically creating reduced-order mass-spring models that match our more complex building archetypes to provide additional validation to these models. This effort is necessary for development and adoption of future code methods.
6.1.1 Mass-spring models (Fischer et al.)
The single-story mass-spring model (depicted in Figure 33) has been revisited and results are summarized in a submitted journal paper: Fischer, A.W. and B.W. Schafer, “Wall-Diaphragm Interactions in Seismic Response of Single-Story Building Systems”, Submitted to Elsevier, Engineering Structures, May 2020. Comparison of demand forces in the model and the demands from ASCE 7 Chapter 12 and FEMA P1026 recommendations on Rigid Wall Flexible Diaphragm (RWFD) buildings are compared in the paper and key results are summarized below.
Figure 33 Mass spring model of a single-story building used for the parametric study of wall-diaphragm interactions
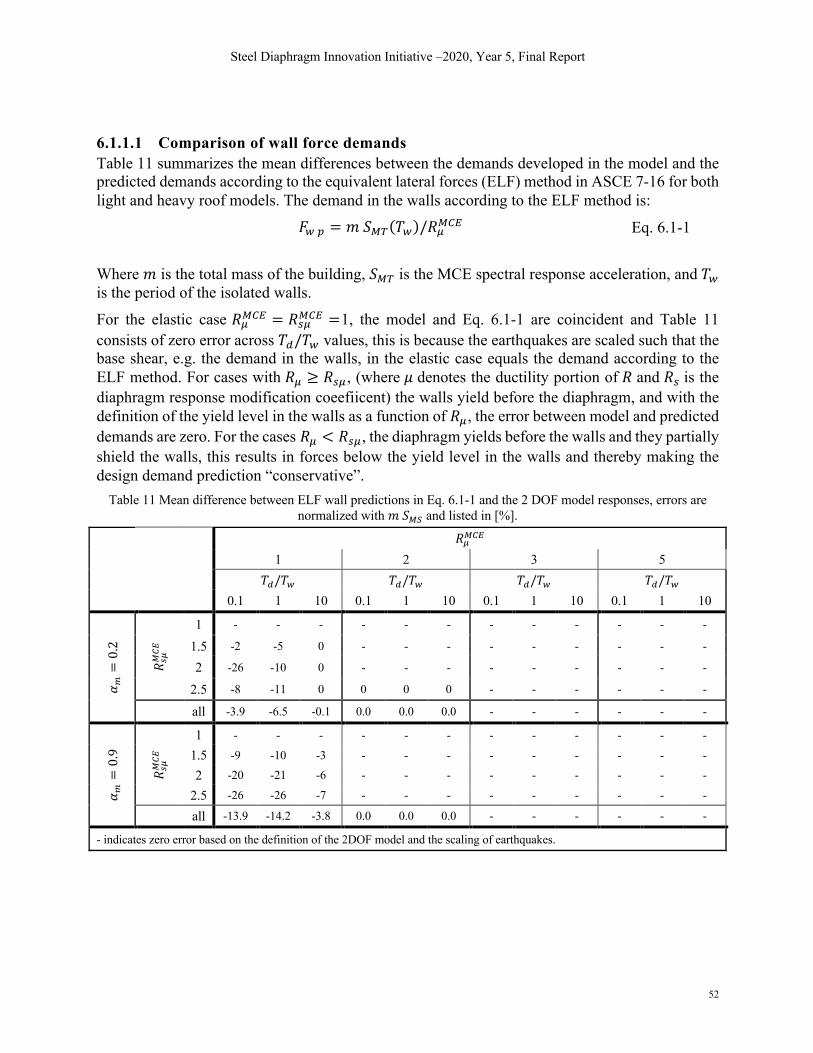
Steel Diaphragm Innovation Initiative –2020, Year 5, Final Report
52
6.1.1.1 Comparison of wall force demands
Table 11 summarizes the mean differences between the demands developed in the model and the predicted demands according to the equivalent lateral forces (ELF) method in ASCE 7-16 for both light and heavy roof models. The demand in the walls according to the ELF method is: #1! = @234(D1)/!5367 Eq. 6.1-1
Where @ is the total mass of the building, 234 is the MCE spectral response acceleration, and D1 is the period of the isolated walls. For the elastic case !5367 = !#5367 =1, the model and Eq. 6.1-1 are coincident and Table 11 consists of zero error across D8/D1 values, this is because the earthquakes are scaled such that the base shear, e.g. the demand in the walls, in the elastic case equals the demand according to the ELF method. For cases with !5 ≥ !#5, (where H denotes the ductility portion of ! and !# is the diaphragm response modification coeefiicent) the walls yield before the diaphragm, and with the definition of the yield level in the walls as a function of !5, the error between model and predicted demands are zero. For the cases !5 < !#5, the diaphragm yields before the walls and they partially shield the walls, this results in forces below the yield level in the walls and thereby making the design demand prediction “conservative”.
Table 11 Mean difference between ELF wall predictions in Eq. 6.1-1 and the 2 DOF model responses, errors are normalized with !#!" and listed in [%].
$#!$% 1 2 3 5 %&/%' %&/%' %&/%' %&/%' 0.1 1 10 0.1 1 10 0.1 1 10 0.1 1 10
' (=0.2
$ )#!$%
1 - - - - - - - - - - - -
1.5 -2 -5 0 - - - - - - - - -
2 -26 -10 0 - - - - - - - - -
2.5 -8 -11 0 0 0 0 - - - - - -
all -3.9 -6.5 -0.1 0.0 0.0 0.0 - - - - - -
' (=0 .9
$ )#!$%
1 - - - - - - - - - - - -
1.5 -9 -10 -3 - - - - - - - - -
2 -20 -21 -6 - - - - - - - - -
2.5 -26 -26 -7 - - - - - - - - -
all -13.9 -14.2 -3.8 0.0 0.0 0.0 - - - - - -
- indicates zero error based on the definition of the 2DOF model and the scaling of earthquakes.

Steel Diaphragm Innovation Initiative –2020, Year 5, Final Report
53
6.1.1.2 Comparison of diaphragm force demands
The diaphragm demands developed in the model are compared to three different prediction methods: The ELF method and the alternative method in ASCE 7-16, and the FEMA P1026 RWFD method. The three methods simplify as follows for a single-story building: #8!7(9 =@8 234(D1)/!5367 Eq. 6.1-2
#8!:;< = max
⎣⎢⎢⎢⎡ 234(D1)!5 !#5
@8
0.32 23+!#5@8⎦
⎥⎥⎥⎤ Eq. 6.1-3
#8!=>?@A = @8 234(D8)/!#5367 Eq. 6.1-4
Where @8 is the mass of the diaphragm, and 23+ is the plateau of the MCE curve. Additionally, #8!7(9 is bounded between 0.2@823+ and 0.4@823+ , and #8!:;< is bounded with a lower bound of 0.2@823+ . Table 12 provides the mean difference between model and predicted demands in the diaphragm. Similar levels of accuracy are found for both the ELF method and the alternative method: They are most accurate for rigid diaphragms (D8/D1 = 0.1 ) and overly conservative for flexible diaphragms (D8/D1 = 10). The FEMA P1026 method provides the most accurate predictions for flexible (light) diaphragms (D8/D1 = 10 , VB = 0.2 ), and the least accurate for rigid diaphragms. Special care is needed for diaphragms with period similar to the wall period (D8/D1 = 1), were all three methods underpredict the demand forces. Table 12 Summarized mean difference between the method for diaphragm predictions in Eq. 6.1-2 – Eq. 6.1-4 and the 2 DOF model responses for both light and heavy roof models, errors normalized with !#!" and listed in [%].
'( = 0.2 '( = 0.9
%&/%' %&/%'
0.1 1 10 all 0.1 1 10 all
ELF -& − -&+%,-!#!"
$)#!$%
1 1 12 -4 3.2 4 11 -11 1.6
1.5 1 10 -5 2.1 0 7 -13 -2.0
2 0 7 -5 0.6 -3 2 -16 -5.9
2.5 -1 5 -5 -0.3 -6 -2 -18 -8.7
all 0.2 8.7 -4.7 1.4 -1.1 4.3 -14.4 -3.7
Alternative -& − -&+./0!#!"
$)#!$%
1 -1 10 -7 0.6 -8 -1 -23 -10.2
1.5 0 10 -5 1.8 -1 6 -15 -3.3
2 1 8 -4 1.5 1 6 -12 -1.9
2.5 0 6 -4 0.9 0 3 -12 -3.3
all 0.0 8.5 -4.9 1.2 -2.1 3.4 -15.4 -4.7
FEMA P-1026 -& − -&+12345
!#!"
$)#!$%
1 -10 6 -1 -1.6 -47 -19 6 -20.0
1.5 -6 7 0 0.2 -29 -7 6 -10.3
2 -3 7 0 1.0 -16 -1 5 -4.2
2.5 -2 6 0 1.1 -11 1 4 -2.3
all -5.4 6.3 -0.3 0.2 -26.2 -6.6 5.2 -9.2
Steel Diaphragm Innovation Initiative –2020, Year 5, Final Report
54
6.1.1.3 Multi-story mass-spring model
The single-story mass spring model is expanded to a multi-story mass-spring model in this section. The lateral stiffness variation across the height has an impact on the results, therefore variation of stiffness and mass across the height of the multi-story mass-spring models is based on the variations found in the archetype models developed by Foroughi and Wei, (see Section 6.4). 6.1.1.4 Stiffness of walls and diaphragms in archetype models
To calibrate the multi-story mass-spring models and to ensure realistic comparison to time-history results for the archetype building models developed by Wei and Foroughi (see Section 6.4), an investigation of the stiffness variation in both the diaphragm and walls across the height of the building is performed. Elastic eigen analysis on the building models with traditional design (see Section 6.4) results in the first building period (DC) listed in Table 13. The first isolated vertical period (D1) is found by increasing the stiffness of the diaphragm decks, and the sizes of beams and girders inside the building model, this provides close to rigid diaphragm action, which defines the isolated vertical period (D1). Additionally, for the BRB building models, the end conditions of the beams and girders are changed to continuous end conditions which further stiffens the diaphragm. Eigen analysis of the rigid diaphragm models provide the first eigen period for the isolated walls (D1), listed in Table 13. Estimating the isolated diaphragm period (D8) is done by restraining the wall deflections, such that only the diaphragm is activated in the elastic eigen analysis. The original diaphragm, beams and girders sizing are used in determining D8. Estimations of the elastic wall and diaphragm stiffnesses are completed with static equilibrium of models where nodes are restrained against translational movements such that only isolated deformations in the floor of interest are allowed. Determining the wall stiffness, the floors above and below the floor of interest are restrained, concentrated loads are applied at the locations of the braced walls, and the diaphragms, beams and girders are modeled as rigid (described above). The elastic deformation is recorded and the stiffness of floor < is found as: W1D' = X
2Y Eq. 6.1-5
where X is the total load applied and Y is the displacement at the location of the braced frame on floor <. These stiffnesses are the entries in the diagonal of the stiffness matrix. The actual wall stiffnesses are found with the following relations: W1D = W1D' − W1(DF>) for< < B
W1. = W1.' for< = B Eq. 6.1-6
where B is the number of stories in the building model. The diaphragm stiffness is determined using the same restrains to the entire floors above and below the floor of interest, in addition the nodes at the end of the diaphragm (short direction) are restrained. Load is applied proportionally to the shape of the first eigenmode on the floor of interest. The diaphragm stiffness is determined as: W8D =
XY Eq. 6.1-7
where X is the total load applied on the diaphragm and Y is the displacement at the middle of the diaphragm.

Steel Diaphragm Innovation Initiative –2020, Year 5, Final Report
55
Table 13 Stiffness estimates for the walls and diaphragms for each story in the OCBF and BRB SDII archetype building models. And first mode periods for the building and the isolated wall period (i.e. rigid diaphragm).
CBF BRB
Building Model fl
oor %6
[0] %'[0]
%&7 [0]
2'7 3456057 8
2&7 3456057 8
%6[0]
%'[0]
%&7 [0]
2'7 3456057 8
2&7 3456057 8
1-story BD1 1 0.72 0.30 0.67 758.9 91.3 1.00 0.49 0.78 259.4 70.1
1-story CD2 1 0.56 0.36 0.36 1047.0 709.0 0.61 0.43 0.45 686.2 428.9
4-story
1
0.81 0.56
0.30 3051.7 1071.8
1.17 0.68
0.35 2225.6 784.6
2 0.28 3107.8 1231.3 0.34 1965.1 854.4
3 0.30 2440.8 1068.4 0.36 1603.2 713.9
4 0.40 1356.1 292.5 0.67 669.3 99.5
8-story
1
1.35 1.03
0.28 3200.8 1300.5
1.84 1.20
0.32 2492.2 982.1
2 0.25 4474.2 1641.4 0.30 3137.9 1172.6
3 0.26 4249.6 1504.3 0.31 3113.1 1076.3
4 0.27 4013.0 1414.3 0.33 2654.0 965.4
5 0.28 3174.5 1324.8 0.34 2158.8 883.2
6 0.29 2629.5 1233.1 0.36 1585.2 799.7
7 0.29 2062.6 1117.7 0.39 1261.7 657.9
8 0.45 1332.8 266.5 0.61 439.0 135.2
12-story
1
1.97 1.38
0.24 5213.6 1891.3
2.38 1.50
0.25 3612.9 1680.6
2 0.21 5902.2 2437.9 0.22 4864.2 2149.1
3 0.22 5721.9 2226.0 0.23 4909.3 1936.2
4 0.24 5035.7 1960.3 0.25 4137.9 1663.2
5 0.25 4821.7 1762.8 0.27 4075.9 1455.6
6 0.26 4356.5 1609.9 0.29 3504.8 1276.8
7 0.27 4248.1 1493.0 0.30 3213.2 1148.2
8 0.28 3898.6 1403.7 0.32 2739.6 1030.8
9 0.28 3127.9 1326.7 0.33 2260.8 946.9
10 0.29 2509.2 1253.9 0.35 1714.7 862.7
11 0.30 2403.4 1185.7 0.38 1231.0 721.0
12 0.47 1314.6 249.8 0.60 444.8 145.8 1 BD=Bare deck 2 CD=Composite deck
The estimated stiffnesses for wall (W1D) and diaphragm (W8D) are listed in Table 13 for each story for the different building models, along with the first building period (DC), the first isolated wall period (D1) and the isolated diaphragm periods for each floor (D8D). In Figure 34 the variation of the wall and diaphragm stiffness across the height are illustrated for the models, together with stiffness determined from the isolated wall and diaphragm periods. Based on the variation of the wall stiffness across the height illustrated in Figure 34a and Figure 34c, the wall stiffnesses are approximated with a linear variation across the height by the following equation: 9D = 1 − 0.308(< − B) Eq. 6.1-8 2W1D = 79D Eq. 6.1-9

Steel Diaphragm Innovation Initiative –2020, Year 5, Final Report
56
Where k is the wall stiffness at the top floor and is defined from the wall period (explained below) and 9D is the stiffness variation. The diaphragm stiffnesses is assumed to be constant for the typical floors and half the stiffness for the roof diaphragm. The approximated stiffness for both walls and diaphragm is depicted in Figure 34 with solid lines.
Figure 34 Variation of wall and diaphragm stiffness across the height for both the OCBF and BRB building models.

Steel Diaphragm Innovation Initiative –2020, Year 5, Final Report
57
6.1.1.5 Multi-story mass-spring model setup
The multi-story mass-spring building model of B-stories is represented with B single-story models (single-story portrayed in Figure 33) connected to form a multi-story model, as depicted in Figure 35. The model is composed of 3B lumped masses and 4B connecting springs.
Figure 35 Mass spring model of a multi-story building used for the parametric study of wall-diaphragm interactions.
The typical floor mass is constant across the height @D = @ for < ∈ [1, B − 1], where B denotes the number of floors in the building and @ is the weight of a typical floor, while the roof mass is half the weight of a typical floor @. = @/2. The lumped masses in the model are defined from a mass ratio, VB, and from the total mass of floor <, @D: @8D = VB@D Eq. 6.1-10 @1D =
(1 − VB)2 @D Eq. 6.1-11
Similar to the single-story model, the spring stiffnesses are defined from the period of the isolated vertical and horizontal structure. Where, D1 is the first period of vibration for the structure with rigid diaphragms (W8D = ∞), and D8 is the period of vibration for the structure when the walls are

Steel Diaphragm Innovation Initiative –2020, Year 5, Final Report
58
rigid (W1D = ∞ ). The diaphragm stiffness is defined from D8 , assuming the period of the diaphragms are constant across the height of the building:
W8D = 2 ; cD8
>@@8D Eq. 6.1-12
The stiffness of the roof diaphragm is selected as half the stiffness of a typical floor diaphragm in these building models. Defining the wall stiffness from the isolated wall period D1, the eigen value problem has to be solved. The stiffness of the walls can be expressed as: W1 = >
@7[9>9@9H …9.], where 9D are
the stiffness factor for floor < found in Eq. 6.1-8. The mass distributions across the floors are: [@>@@@H …@.] = @[111 … 1/2] . Setting up matrices for the masses and the wall stiffnesses:
e = @ef = @
⎣⎢⎢⎢⎡ 1 1 1
⋱ 1/2⎦
⎥⎥⎥⎤ Eq. 6.1-12
h = 7hf = 7
⎣⎢⎢⎢⎡9> + 9@ −9@
9@ + 9H −9H −9H 9H + 9I
⋱
⋱9@ + 9H 9@ + 9H 9@ + 9H
⋱ −9.−9. 9. ⎦
⎥⎥⎥⎤ Eq. 6.1-13
The eigenvalue problem is converted into a unitless problem and solved: (h − j1@e)k = 0 Eq. 6.1-14a &hf7 − j1@ef @-k = 0 Eq. 6.1-14b
lhf − j1@@7 ef mk = 0 Eq. 6.1-14c
&hf − jn1@ef -k = 0 Eq. 6.1-14d
Where hf , ef are unitless stiffness and mass matrices of the model and jn1 = j1*@/7 is the unitless eigenfrequency of the system with rigid diaphragms. From Eq. 6.1-14d jn1 can be determined and the stiffness can be established with expression for the unitless eigenfrequency: 7 = lJ8
JK8m@@ Eq. 6.1-15
Where j1 is the eigen frequency of the isolated walls, which is related to the wall period: j1 =2c/D1:
7 = ; 2cD1 jn1
>@
@ Eq. 6.1-16
The wall stiffness can then be determined by:
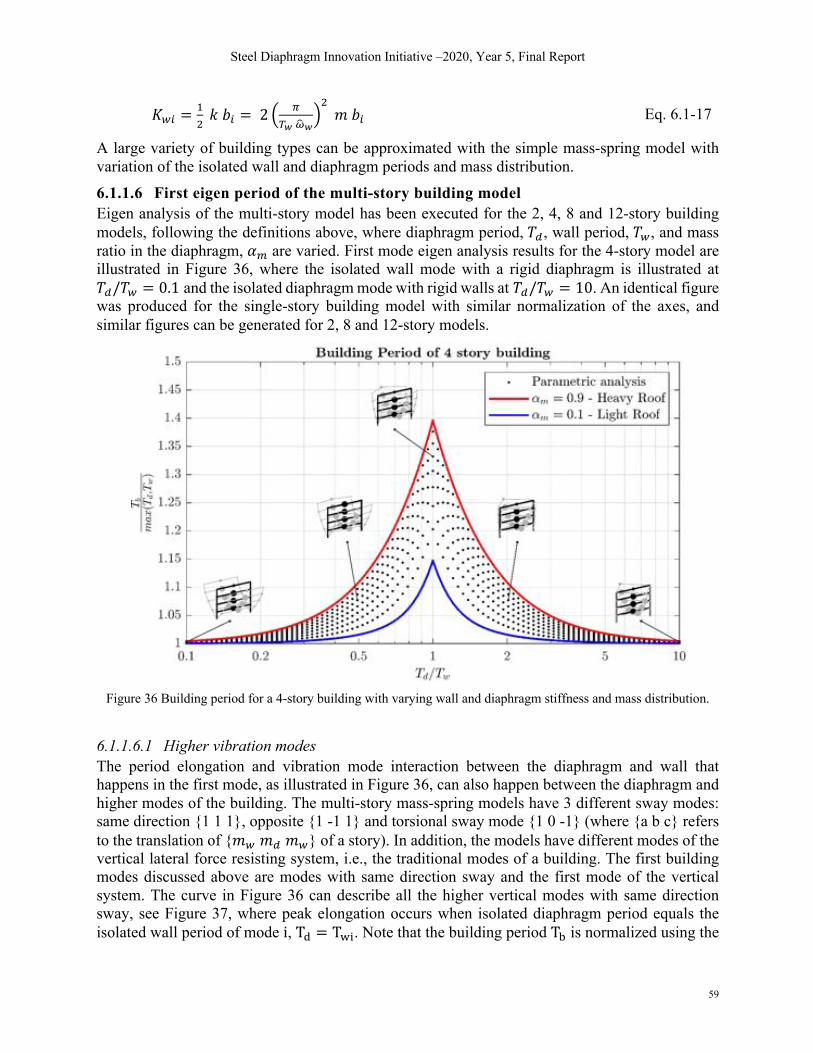
Steel Diaphragm Innovation Initiative –2020, Year 5, Final Report
59
W1D = >@79D = 2 l L
48JK8m@@9D Eq. 6.1-17
A large variety of building types can be approximated with the simple mass-spring model with variation of the isolated wall and diaphragm periods and mass distribution. 6.1.1.6 First eigen period of the multi-story building model
Eigen analysis of the multi-story model has been executed for the 2, 4, 8 and 12-story building models, following the definitions above, where diaphragm period, D8, wall period, D1, and mass ratio in the diaphragm, VB are varied. First mode eigen analysis results for the 4-story model are illustrated in Figure 36, where the isolated wall mode with a rigid diaphragm is illustrated at D8/D1 = 0.1 and the isolated diaphragm mode with rigid walls at D8/D1 = 10. An identical figure was produced for the single-story building model with similar normalization of the axes, and similar figures can be generated for 2, 8 and 12-story models.
Figure 36 Building period for a 4-story building with varying wall and diaphragm stiffness and mass distribution.
6.1.1.6.1 Higher vibration modes The period elongation and vibration mode interaction between the diaphragm and wall that happens in the first mode, as illustrated in Figure 36, can also happen between the diaphragm and higher modes of the building. The multi-story mass-spring models have 3 different sway modes: same direction {1 1 1}, opposite {1 -1 1} and torsional sway mode {1 0 -1} (where {a b c} refers to the translation of {@1 @8 @1} of a story). In addition, the models have different modes of the vertical lateral force resisting system, i.e., the traditional modes of a building. The first building modes discussed above are modes with same direction sway and the first mode of the vertical system. The curve in Figure 36 can describe all the higher vertical modes with same direction sway, see Figure 37, where peak elongation occurs when isolated diaphragm period equals the isolated wall period of mode i, TM = TNO. Note that the building period TP is normalized using the
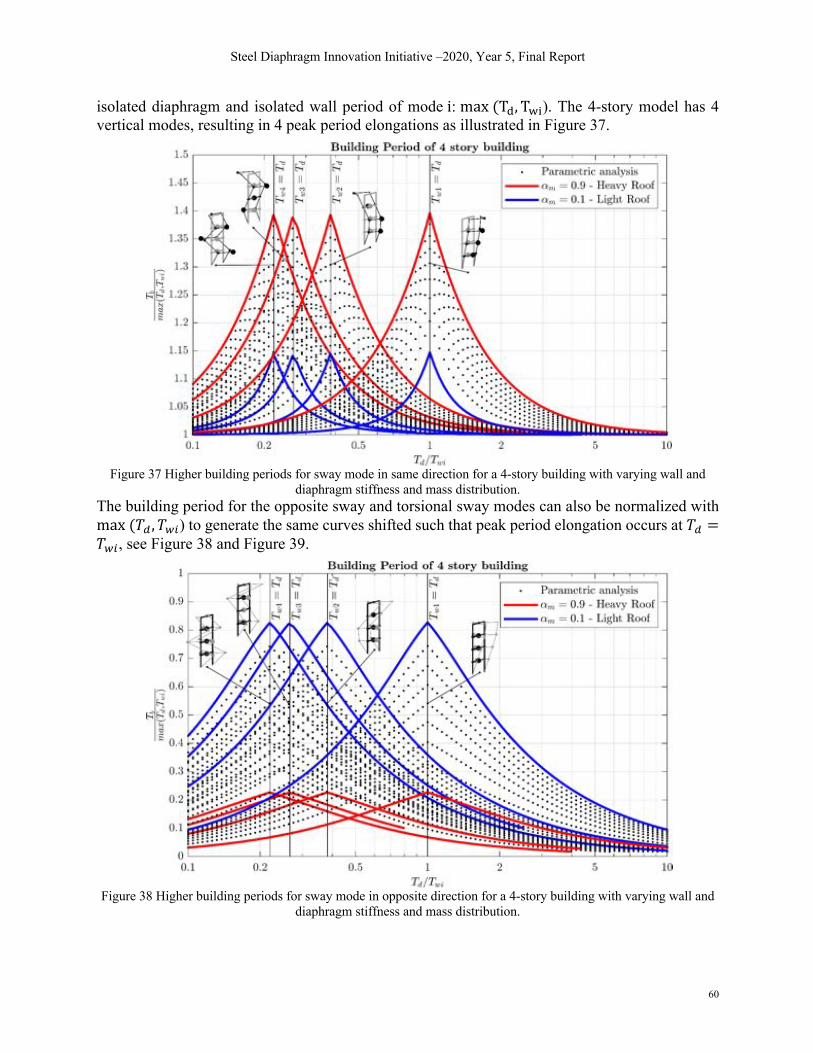
Steel Diaphragm Innovation Initiative –2020, Year 5, Final Report
60
isolated diaphragm and isolated wall period of mode i: max(TM, TNO). The 4-story model has 4 vertical modes, resulting in 4 peak period elongations as illustrated in Figure 37.
Figure 37 Higher building periods for sway mode in same direction for a 4-story building with varying wall and
diaphragm stiffness and mass distribution. The building period for the opposite sway and torsional sway modes can also be normalized with max(D8 , D1D) to generate the same curves shifted such that peak period elongation occurs at D8 =D1D, see Figure 38 and Figure 39.
Figure 38 Higher building periods for sway mode in opposite direction for a 4-story building with varying wall and
diaphragm stiffness and mass distribution.

Steel Diaphragm Innovation Initiative –2020, Year 5, Final Report
61
Figure 39 Higher building periods for torsional mode for a 4-story building with varying wall and diaphragm
stiffness and mass distribution. 6.1.1.7 Elastic response of SDII CBF model
A series of 96,800 elastic and 1,452,000 inelastic time history analyses have been executed in OpenSEES, to examine the response in 1, 2, 4, 8 and 12-story mass-spring models with varying characterics across 22 scaled earthquake record sets. The ground motions are scaled such that the elastic response of the base shear equals the MCE level design spectra in ASCE 7-10. In the following, attention will be drawn on a few selected models that represent the characteristics of the SDII CBF building models, found in Section 6.1.1.4. The matched characteristic values for the buildings and the parameteric study are listed in Table 14.
Table 14 CBF building models characteristics
99 9:/99 :;4 story 0.6 0.5 0.9
8 story 1.0 0.2 0.9
12 story 1.4 0.2 0.9 The mean elastic forces across the 44 ground motions and the standard deviation along the height of the 4, 8 and 12-story CBF models are illustrated in Figure 40 and Figure 41 with colored solid lines and shaded areas. The predicted design forces according to ASCE 7-16 are indicated with black solid lines, using ELF for the vLFRS and the alternative design method for the diaphragm forces. The predicted and model wall forces in Figure 40 are in reasonable agreement, in general the ELF method is slightly conservative in its force predictions for the lower half of the buildings, while higher mode effects cause increased force demands in the upper part of the 8 and 12-story models, which is not accounted for in the ELF method. Figure 41 illustrates the diaphragm forces extracted from the model and the alternative force predictions and the lower and upper bound of the traditional diaphragm design method are

Steel Diaphragm Innovation Initiative –2020, Year 5, Final Report
62
indicated with the light grey area. It is worth noting, the bounds of [0.20.4]4!-23+ are unconversative and the alternative method (indicated with black) are unconversative for the predictions of the elastic diaphragm forces in these building models.
Figure 40 Mean and one standard deviation wall forces from the mass-spring models, and the predicted wall
force according to ASCE 7-16 ELF method.
Figure 41 Mean and one standard deviation wall forces from the mass-spring models, ASCE 7-16 alternative diaphragm design method and the upper and lower
bounds for the traditional diaphragm design.
6.1.1.7.1 Elastic Wall Response If we move on from specific building examples (e.g., SDII CBF models) and examine the larger selection of building models in the analysis, we can see trends of the wall behavior as wall and diaphragm stiffness is varied, see Figure 42. In the figure, the wall force distributions are depicted for 3 different wall periods and 3 different diaphragm-to-wall periods. In Table 15, the difference between the models and ELF predictions for the heavy floor models are listed, colored cells contain the unconservative force predictions. Observe from both the table and figure that the force predictions for stiff walls (D1 = 0.1q) are conservative for models with any diaphragm stiffness. However, the ELF method underestimates the wall forces in the upper stories for models with D1 > 0.1q and rigid diaphragms (D8/D1 < 1). In general, the ELF method predicts the wall forces fairly accurately.

Steel Diaphragm Innovation Initiative –2020, Year 5, Final Report
63
Figure 42 Elastic wall forces from mass-spring model and the ELF predictions for building models with heavy floor
'( = 0.9.
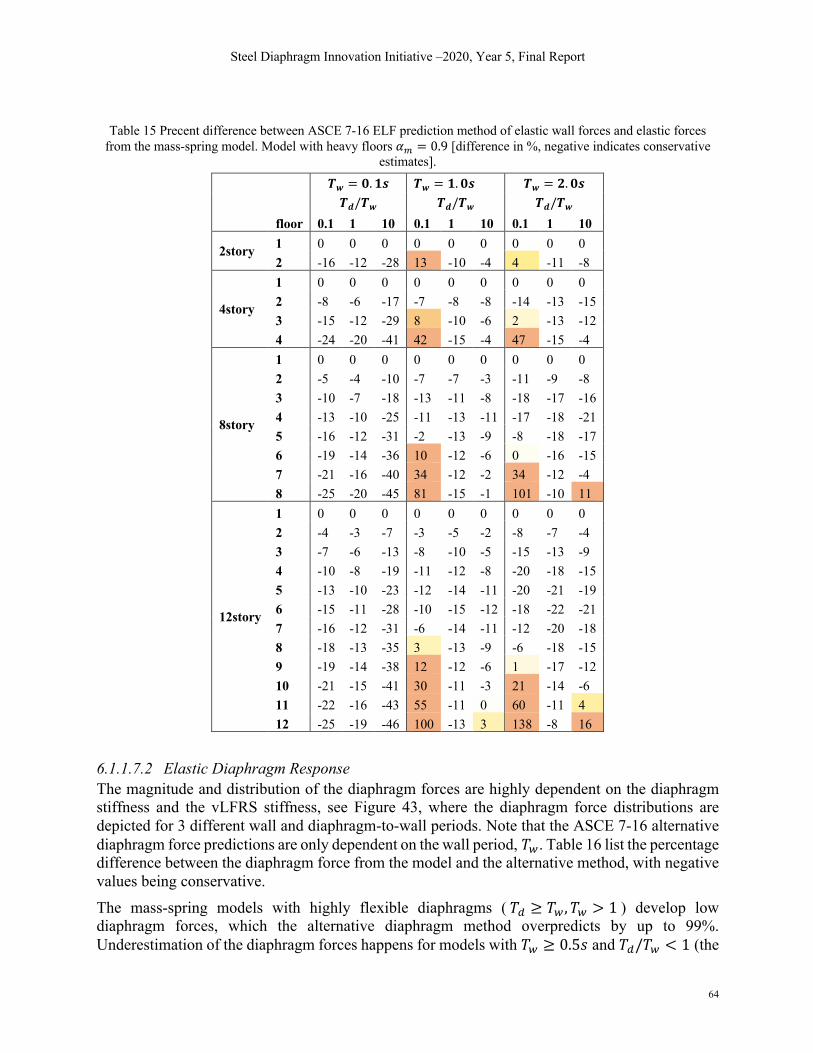
Steel Diaphragm Innovation Initiative –2020, Year 5, Final Report
64
Table 15 Precent difference between ASCE 7-16 ELF prediction method of elastic wall forces and elastic forces
from the mass-spring model. Model with heavy floors '( = 0.9 [difference in %, negative indicates conservative estimates].
99 = ;. <= 99 = <. ;= 99 = >. ;= 9:/99 9:/99 9:/99 floor 0.1 1 10 0.1 1 10 0.1 1 10
2story 1 0 0 0 0 0 0 0 0 0
2 -16 -12 -28 13 -10 -4 4 -11 -8
4story
1 0 0 0 0 0 0 0 0 0
2 -8 -6 -17 -7 -8 -8 -14 -13 -15
3 -15 -12 -29 8 -10 -6 2 -13 -12
4 -24 -20 -41 42 -15 -4 47 -15 -4
8story
1 0 0 0 0 0 0 0 0 0
2 -5 -4 -10 -7 -7 -3 -11 -9 -8
3 -10 -7 -18 -13 -11 -8 -18 -17 -16
4 -13 -10 -25 -11 -13 -11 -17 -18 -21
5 -16 -12 -31 -2 -13 -9 -8 -18 -17
6 -19 -14 -36 10 -12 -6 0 -16 -15
7 -21 -16 -40 34 -12 -2 34 -12 -4
8 -25 -20 -45 81 -15 -1 101 -10 11
12story
1 0 0 0 0 0 0 0 0 0
2 -4 -3 -7 -3 -5 -2 -8 -7 -4
3 -7 -6 -13 -8 -10 -5 -15 -13 -9
4 -10 -8 -19 -11 -12 -8 -20 -18 -15
5 -13 -10 -23 -12 -14 -11 -20 -21 -19
6 -15 -11 -28 -10 -15 -12 -18 -22 -21
7 -16 -12 -31 -6 -14 -11 -12 -20 -18
8 -18 -13 -35 3 -13 -9 -6 -18 -15
9 -19 -14 -38 12 -12 -6 1 -17 -12
10 -21 -15 -41 30 -11 -3 21 -14 -6
11 -22 -16 -43 55 -11 0 60 -11 4
12 -25 -19 -46 100 -13 3 138 -8 16 6.1.1.7.2 Elastic Diaphragm Response The magnitude and distribution of the diaphragm forces are highly dependent on the diaphragm stiffness and the vLFRS stiffness, see Figure 43, where the diaphragm force distributions are depicted for 3 different wall and diaphragm-to-wall periods. Note that the ASCE 7-16 alternative diaphragm force predictions are only dependent on the wall period, D1. Table 16 list the percentage difference between the diaphragm force from the model and the alternative method, with negative values being conservative. The mass-spring models with highly flexible diaphragms ( D8 ≥ D1 , D1 > 1 ) develop low diaphragm forces, which the alternative diaphragm method overpredicts by up to 99%. Underestimation of the diaphragm forces happens for models with D1 ≥ 0.5q and D8/D1 < 1 (the

Steel Diaphragm Innovation Initiative –2020, Year 5, Final Report
65
upper right subfigures in Figure 43), where the alternative prediction method underestimates the forces with up to 200% for the heavy floor models. The alternative design method predicts the diaphragm forces reasonably for stiff walls (D1 = 0.1q) and for semi-rigid diaphragms (D8 = D1). The ELF diaphragm force is strictly bounded by an upper and lower bound, which is illustrated with the grey areas in Figure 43. Observe that only models with D8/D1 = 1, and D1 = 2q do the bounds become effective estimates for the elastic diaphragm force. (The bounds thus require some inelasticity/ductility in the system to be relevant). Lastly, the 8 and 12-story SDII building models have D1 = [1.0q, 1.5q] with D8/D1~0.2 which puts them in the category of overly unconservative elastic force predictions and the 4-story SDII building models are also unconservative.
Figure 43 Elastic diaphragm forces from mass-spring model and the ASCE 7-16 alternative method force
predictions for building models with heavy floors '( = 0.9.

Steel Diaphragm Innovation Initiative –2020, Year 5, Final Report
66
Table 16 Precent difference between ASCE 7-16 alternative diaphragm method of elastic diaphragm forces and elastic forces from the mass-spring model. Model with heavy floors '( = 0.9 [difference in %, negative indicates
conservative estimates]. 99 = ;. <= 99 = <. ;= 99 = >. ;= 9:/99 9:/99 9:/99 floor 0.1 1 10 0.1 1 10 0.1 1 10
2story 1 4 6 21 9 -3 -89 -11 -25 -98 2 -6 3 -15 36 14 -91 37 13 -97
4story 1 12 21 52 79 23 -87 68 -13 -98 2 5 11 16 72 3 -89 80 -16 -98 3 -1 7 -9 41 15 -90 72 8 -97 4 -10 0 -26 74 5 -92 66 -18 -98
8story 1 27 55 88 103 66 -86 108 -2 -98 2 17 29 56 133 28 -87 130 -13 -98 3 9 16 30 115 9 -88 133 -16 -98 4 4 11 12 98 2 -89 126 -15 -98 5 1 8 -2 96 4 -89 153 -11 -98 6 -2 7 -13 74 13 -90 155 6 -97 7 -6 4 -24 67 10 -92 67 -13 -98 8 -13 -3 -33 102 -6 -93 81 -38 -99
12story 1 37 76 106 111 85 -85 106 2 -98 2 26 48 78 135 53 -86 130 -7 -98 3 17 30 54 146 29 -87 155 -13 -98 4 11 20 36 136 13 -87 157 -17 -98 5 6 14 22 122 5 -88 166 -18 -98 6 3 11 10 109 2 -89 157 -17 -98 7 1 9 1 110 2 -89 177 -15 -97 8 -1 8 -7 101 5 -90 191 -10 -97 9 -2 7 -14 91 12 -90 199 3 -97 10 -4 7 -21 82 13 -91 138 -3 -98 11 -8 3 -29 79 4 -93 68 -26 -98 12 -14 -3 -35 119 -7 -94 105 -41 -99
6.1.1.8 Inelastic Response
For the inelastic response of the mass-spring models the 3 SDII CBF building examples listed in Table 14 are used to study the results. The mean and +/- one standard deviation wall forces across the height of the 4, 8 and 12-story models are depicted in Figure 44 along with the ELF predictions for the models. The results in the upper left subfigure represents the elastic case with !5367 =!#5367 = 1 . The top row of subfigures is for models with elastic diaphragm !#5367 = 1 with increasing inelasticity in the walls going left to right and the leftmost column of subfigures signifies models with elastic walls !5367 = 1 with increasing levels of inelasticity in the diaphragm going down through the subfigures.
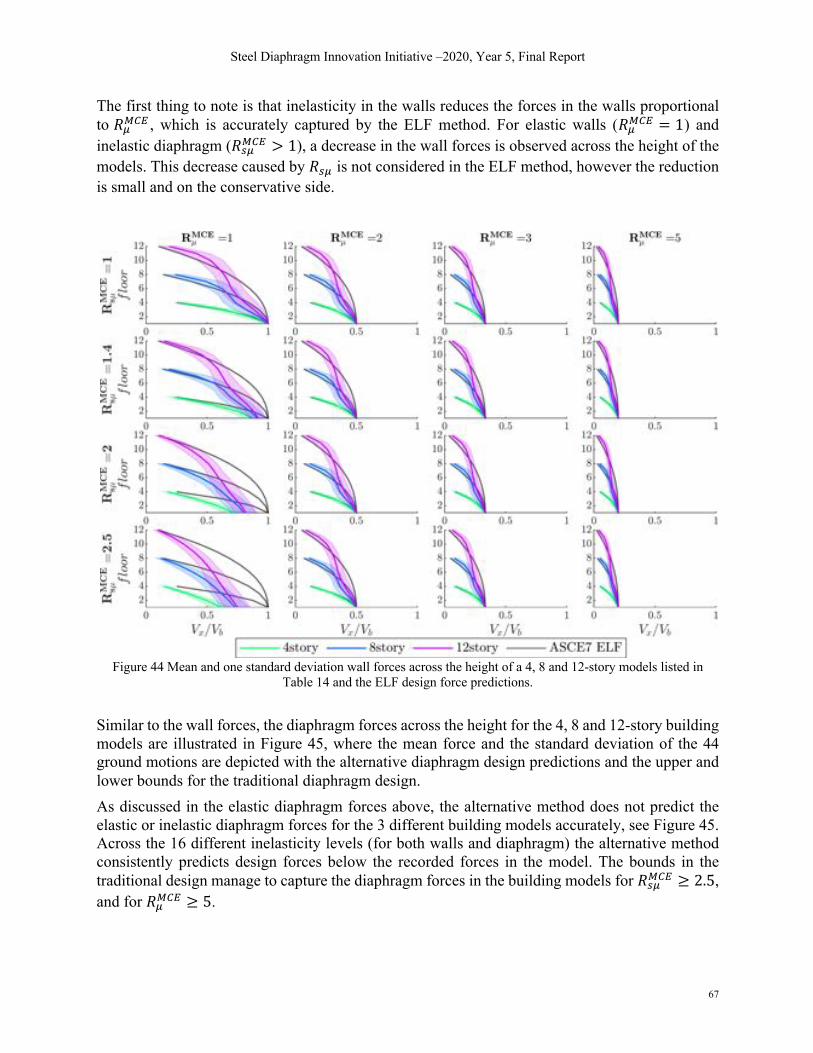
Steel Diaphragm Innovation Initiative –2020, Year 5, Final Report
67
The first thing to note is that inelasticity in the walls reduces the forces in the walls proportional to !5367 , which is accurately captured by the ELF method. For elastic walls (!5367 = 1) and inelastic diaphragm (!#5367 > 1), a decrease in the wall forces is observed across the height of the models. This decrease caused by !#5 is not considered in the ELF method, however the reduction is small and on the conservative side.
Figure 44 Mean and one standard deviation wall forces across the height of a 4, 8 and 12-story models listed in
Table 14 and the ELF design force predictions. Similar to the wall forces, the diaphragm forces across the height for the 4, 8 and 12-story building models are illustrated in Figure 45, where the mean force and the standard deviation of the 44 ground motions are depicted with the alternative diaphragm design predictions and the upper and lower bounds for the traditional diaphragm design. As discussed in the elastic diaphragm forces above, the alternative method does not predict the elastic or inelastic diaphragm forces for the 3 different building models accurately, see Figure 45. Across the 16 different inelasticity levels (for both walls and diaphragm) the alternative method consistently predicts design forces below the recorded forces in the model. The bounds in the traditional design manage to capture the diaphragm forces in the building models for !#5367 ≥ 2.5, and for !5367 ≥ 5.
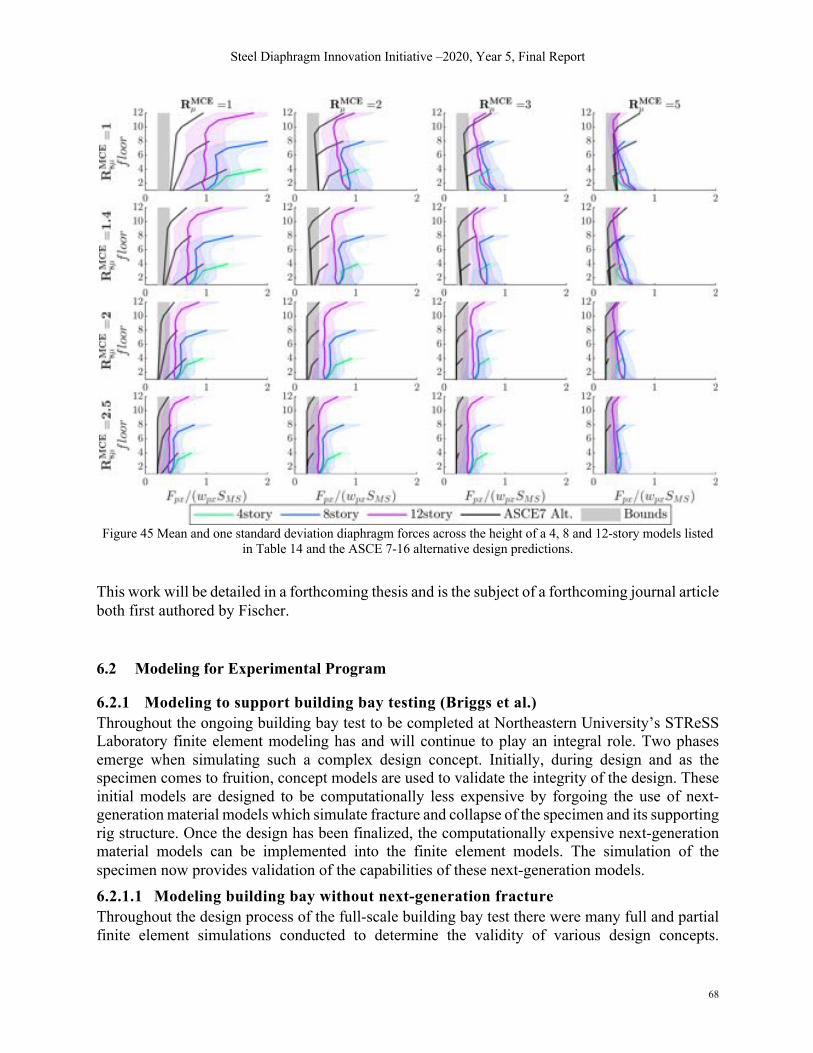
Steel Diaphragm Innovation Initiative –2020, Year 5, Final Report
68
Figure 45 Mean and one standard deviation diaphragm forces across the height of a 4, 8 and 12-story models listed
in Table 14 and the ASCE 7-16 alternative design predictions. This work will be detailed in a forthcoming thesis and is the subject of a forthcoming journal article both first authored by Fischer.
6.2 Modeling for Experimental Program
6.2.1 Modeling to support building bay testing (Briggs et al.)
Throughout the ongoing building bay test to be completed at Northeastern University’s STReSS Laboratory finite element modeling has and will continue to play an integral role. Two phases emerge when simulating such a complex design concept. Initially, during design and as the specimen comes to fruition, concept models are used to validate the integrity of the design. These initial models are designed to be computationally less expensive by forgoing the use of next-generation material models which simulate fracture and collapse of the specimen and its supporting rig structure. Once the design has been finalized, the computationally expensive next-generation material models can be implemented into the finite element models. The simulation of the specimen now provides validation of the capabilities of these next-generation models. 6.2.1.1 Modeling building bay without next-generation fracture
Throughout the design process of the full-scale building bay test there were many full and partial finite element simulations conducted to determine the validity of various design concepts.
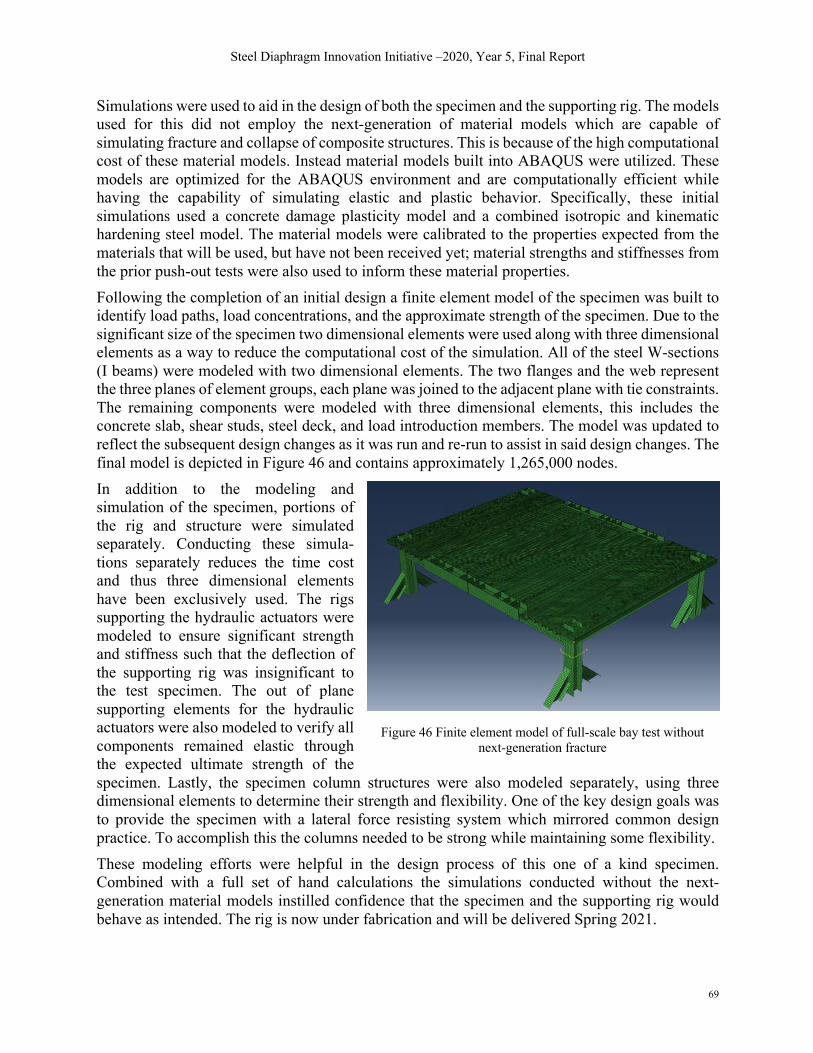
Steel Diaphragm Innovation Initiative –2020, Year 5, Final Report
69
Simulations were used to aid in the design of both the specimen and the supporting rig. The models used for this did not employ the next-generation of material models which are capable of simulating fracture and collapse of composite structures. This is because of the high computational cost of these material models. Instead material models built into ABAQUS were utilized. These models are optimized for the ABAQUS environment and are computationally efficient while having the capability of simulating elastic and plastic behavior. Specifically, these initial simulations used a concrete damage plasticity model and a combined isotropic and kinematic hardening steel model. The material models were calibrated to the properties expected from the materials that will be used, but have not been received yet; material strengths and stiffnesses from the prior push-out tests were also used to inform these material properties. Following the completion of an initial design a finite element model of the specimen was built to identify load paths, load concentrations, and the approximate strength of the specimen. Due to the significant size of the specimen two dimensional elements were used along with three dimensional elements as a way to reduce the computational cost of the simulation. All of the steel W-sections (I beams) were modeled with two dimensional elements. The two flanges and the web represent the three planes of element groups, each plane was joined to the adjacent plane with tie constraints. The remaining components were modeled with three dimensional elements, this includes the concrete slab, shear studs, steel deck, and load introduction members. The model was updated to reflect the subsequent design changes as it was run and re-run to assist in said design changes. The final model is depicted in Figure 46 and contains approximately 1,265,000 nodes. In addition to the modeling and simulation of the specimen, portions of the rig and structure were simulated separately. Conducting these simula-tions separately reduces the time cost and thus three dimensional elements have been exclusively used. The rigs supporting the hydraulic actuators were modeled to ensure significant strength and stiffness such that the deflection of the supporting rig was insignificant to the test specimen. The out of plane supporting elements for the hydraulic actuators were also modeled to verify all components remained elastic through the expected ultimate strength of the specimen. Lastly, the specimen column structures were also modeled separately, using three dimensional elements to determine their strength and flexibility. One of the key design goals was to provide the specimen with a lateral force resisting system which mirrored common design practice. To accomplish this the columns needed to be strong while maintaining some flexibility. These modeling efforts were helpful in the design process of this one of a kind specimen. Combined with a full set of hand calculations the simulations conducted without the next-generation material models instilled confidence that the specimen and the supporting rig would behave as intended. The rig is now under fabrication and will be delivered Spring 2021.
Figure 46 Finite element model of full-scale bay test without next-generation fracture
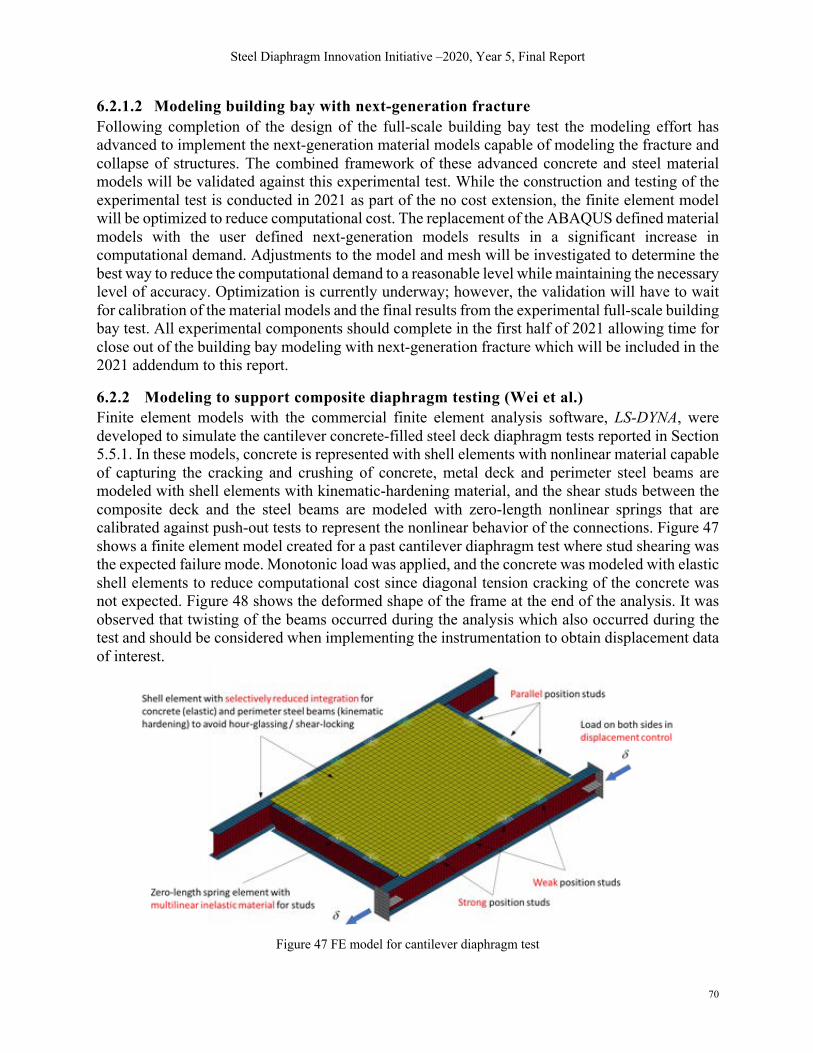
Steel Diaphragm Innovation Initiative –2020, Year 5, Final Report
70
6.2.1.2 Modeling building bay with next-generation fracture
Following completion of the design of the full-scale building bay test the modeling effort has advanced to implement the next-generation material models capable of modeling the fracture and collapse of structures. The combined framework of these advanced concrete and steel material models will be validated against this experimental test. While the construction and testing of the experimental test is conducted in 2021 as part of the no cost extension, the finite element model will be optimized to reduce computational cost. The replacement of the ABAQUS defined material models with the user defined next-generation models results in a significant increase in computational demand. Adjustments to the model and mesh will be investigated to determine the best way to reduce the computational demand to a reasonable level while maintaining the necessary level of accuracy. Optimization is currently underway; however, the validation will have to wait for calibration of the material models and the final results from the experimental full-scale building bay test. All experimental components should complete in the first half of 2021 allowing time for close out of the building bay modeling with next-generation fracture which will be included in the 2021 addendum to this report.
6.2.2 Modeling to support composite diaphragm testing (Wei et al.)
Finite element models with the commercial finite element analysis software, LS-DYNA, were developed to simulate the cantilever concrete-filled steel deck diaphragm tests reported in Section 5.5.1. In these models, concrete is represented with shell elements with nonlinear material capable of capturing the cracking and crushing of concrete, metal deck and perimeter steel beams are modeled with shell elements with kinematic-hardening material, and the shear studs between the composite deck and the steel beams are modeled with zero-length nonlinear springs that are calibrated against push-out tests to represent the nonlinear behavior of the connections. Figure 47 shows a finite element model created for a past cantilever diaphragm test where stud shearing was the expected failure mode. Monotonic load was applied, and the concrete was modeled with elastic shell elements to reduce computational cost since diagonal tension cracking of the concrete was not expected. Figure 48 shows the deformed shape of the frame at the end of the analysis. It was observed that twisting of the beams occurred during the analysis which also occurred during the test and should be considered when implementing the instrumentation to obtain displacement data of interest.
Figure 47 FE model for cantilever diaphragm test

Steel Diaphragm Innovation Initiative –2020, Year 5, Final Report
71
Figure 48 Deformed shape of the frame at the end of the analysis (utilized to fine tune measurement program)
6.2.3 Modeling to support cyclic push-out testing (Briggs et al.)
High fidelity simulations of the cyclic and monotonic push-out testing of Section 5.4.2 have been investigated both with and without the inclusion of the next-generation material models capable of simulation fracture and collapse of composite, steel and concrete, structures. Simulations done without the next-generation material models were used to assist in the design of the push-out test specimens and the supporting rig structure. Once the specimens were assembled and testing had begun, the next-generation material models were implemented in the finite element push-out test models to increase the accuracy of the simulations. This increased accuracy allowed for the comparison between the simulated and experimental results, with the objective that the next-generation material model framework could be validated against these experimental monotonic and cyclic push-out tests. 6.2.3.1 Modeling push-out without next-generation fracture
During the design of the push-out test experiments finite element models were used to assess the efficacy of various designs. These models forwent the next-generation material models in lieu of built-in ABAQUS material models for the sake of computational efficiency. At a time when the design was fluid and dynamic, computationally faster models were of key importance. While the built-in material models are not as advanced as the next-generation models, they still simulate elastic and plastic behavior with accuracy. The simulations demonstrated how the force flowed through the testing rig and specimen and what the expected failure mechanism of the specimen would be. This information was extremely useful as the research team made adjustments to the specimen and the supporting rig structure, optimizing the structure to produce a realistic and representative behavior when tested.

Steel Diaphragm Innovation Initiative –2020, Year 5, Final Report
72
6.2.3.2 Modeling push-out with next-generation fracture
We aim to create a high-fidelity simulation of the cyclic push-out tests with geometric and material nonlinearity inclusive of fracture in both the steel and concrete. This objective was pursued following the completion of the push-out specimen design. This was done by implementing the high fidelity, user-defined material models into the finite element models that were generated during the modeling effort of the push-out tests without next-generation fracture. The implementation of these next-generation models which have the capability of simulating fracture leads to higher computational cost. To remedy this work was performed to reduce the computational cost of the models without sacrificing accuracy. Computational cost was decreased by implementation of a line of symmetry, the use of mass-scaling, mesh density optimization, and the omission of next-generation material models from elastic elements. These adjustments can be seen in Figure 49 which depicts the finite element model for push-out test P4 (note for ease of viewing the model has been reflected over the line of symmetry). Following the completion of all sixteen experimental tests the experimental results were compared to simulation results from the corresponding finite element simulations. Previous reports have highlighted the progress and the difficulties that the team has been met with when attempting to validate the next-generation material model framework against these experimental composite, steel and concrete, tests. While the failure mode and load propagation through the specimen match what was observed in the experimental tests there are still discrepancies between the simulated and experimental results. Recent adjustments to the mass scaling and the loading rate of the simulated finite element model have greatly improved the results, leading to less dynamic effects which were artificially inflating the ultimate strength of the specimens.
The remaining error is believed to be due to inaccuracies in the calibration of the user defined material fracture model parameters. Each material used in the model needs to have material parameters calibrated to its specific properties. This has been done for the common structural steel, A992, used in the specimen, but for other types of steel approximations have been used. There are three steel variants used within these specimens and these appear in the various components: shear studs, steel deck, and common structural steel. Ancillary coupons are being manufactured to test and further calibrate the steel deck, however of particular concern is the assumptions used in the shear stud material parameters. This is for two reasons; first because the shear studs contribute extensively to the strength and behavior of the specimen, and second because the shear stud metal is significantly different from the other metals that have been calibrated using this material model. There are more than twenty material parameters which govern the elastic, plastic, and fracture mechanics of the material in the finite element model. While many metals behave identically within their elastic region, they can behave quite differently in their plastic and fracture regions. Thus, as is further outlined in section 6.5.1, an extensive array of ancillary specimens machined from the shear stud material have been created to calibrate the next-generation material parameters to reflect the behavior of shear studs. This calibration effort is exhaustive and is intended to yield
Figure 49 Finite element model of push-out test P4

Steel Diaphragm Innovation Initiative –2020, Year 5, Final Report
73
robust material parameters for shear studs which can then the calibrated to match different heats of shear studs that represent small changes and adjustments to the specific strength of the studs used in a particular test. Once all materials are fully calibrated, the validation effort will be resumed. Full close out of this research activity will be provided in the 2021 addendum.
6.3 Diaphragm Models (Schafer et al.)
SDII Case and Plan, Modeling, Task 3 focuses on the development of improved diaphragm modeling and the application of these models in predictions of diaphragm and building system performance. Final efforts in this regard are summarized here.
6.3.1 Bare deck diaphragm modeling in related RWFD effort (Schafer et al.)
As previously reported, Schafer (2019) provides a multi-scale modeling protocol for bare steel deck diaphragms that was used in part to validate new design procedures for bare steel deck that previously passed BSSC/NEHRP and AISI S400, and now in this reporting period was adopted by ASCE7. This work will also be provided in the updated version of FEMA P-1026.
6.3.2 Modeling diaphragms for whole building models (Wei and Foroughi et al.)
For whole building models’ efficient solutions are needed for the diaphragm. Over the course of the SDII efforts a number of alternatives were investigated including plate/shell elements for the diaphragm. Ultimately it was determined that the key nonlinearity to capture was the in-plane shear response. Limited to this deformation simpler models are possible and ultimately the long-used approach of 1D truss elements for the in-plane shear diaphragm behavior was selected. This is similar to using nonlinear trusses for a braced frame, but here oriented horizontally. The in-plane shear load-deformation behavior of a diaphragm is typically obtained through cantilever diaphragm tests in which a steel deck diaphragm with or without concrete fill is supported with one edge fixed and the parallel edge subjected to a shear loading (Figure 50a). Using the force-displacement data from these types of tests, computational models with diagonal nonlinear truss elements of unit cross-section area (Figure 50b) were calibrated to capture the in-plane shear behavior of the diaphragm tests. All connections were models as pinned, and the perimeter framing beams were modeled as nonlinear beam-column elements with kinematic hardening material and with the same size of cross sections as the test. Figure 51 shows the meshing of diaphragms in the computational models of the archetype buildings. The dimension of a diaphragm unit in the mesh is 200 in. × 150 in., which is similar in scale to the test specimens used for calibration. The SDII cantilever diaphragm test database was utilized to select appropriate test specimens (O’Brien et al. 2017, Eatherton et al. 2020). For a typical bare steel deck roof diaphragm Specimen 33 with 20-gauge 1.5 in. deep B-deck and employing PAFs for the structural connectors and screws for the sidelap connections, based on testing of Martin (2002), was found to have sufficient design strength to match the roof demands, or otherwise scaled, and is herein denoted as SP1. For the alternative design 1 (“elastic” with Rs =1) in the 8 and 12 story archetype buildings with SCBF as the lateral force resisting system, SP1 bare steel deck (or more precisely PAF structural connectors with sidelap fasteners) is not sufficient for the roof demand. To have sufficient design strength to match the roof demands for those archetypes, specimen 12 with 22-gauge 1.5 in. deep B-deck and welded sidelaps is chosen based on the testing of Essa et al. (2003) herein denoted as SP2.

Steel Diaphragm Innovation Initiative –2020, Year 5, Final Report
74
For a typical concrete-filled steel deck SDII test specimen 3/6.25-4-L-NF-DT which consisted of 3 in. deck, with lightweight concrete fill and 6.25 in. total thickness from Avellaneda et al (2019), herein denoted as SP3 was selected as the baseline specimen.
(a) Schematic view of SP2 test setup (b) Computational model
Figure 50 Test setup and computational model of cantilever diaphragm test
Figure 51 Diaphragm meshing in computational models of archetype buildings
As is shown in Figure 52, the Pinching4 material model in OpenSees was used for the truss elements. This material model is capable of capturing the hysteretic pinching, cyclic strength degradation, and cyclic stiffness degradation behavior of diaphragms. Material parameters for the Pinching4 model, including backbone stresses and strains and cyclic strength and stiffness degradation parameters, were calibrated through a six-step optimization algorithm to achieve an optimal match between hysteretic response from the simulation and test that minimizes the selected objective functions as detailed in Wei et al. (2020a).
W 24x84 (2 studs at 12 in.)
W 2
4x84
(Stu
ds a
t 12
in.)
Deck Direction
15 ft
12 ft
17 ft
13 ft - 4 in.
W 2
4x84
(Stu
ds a
t 12
in.)
W 24x84 (2 studs at 12 in.)Master Actuator in
Displacement Control
Slave Actuator in Force Control

Steel Diaphragm Innovation Initiative –2020, Year 5, Final Report
75
Figure 52 Pinching4 material model
Table 17 shows the resulting values of the Pinching4 material model parameters for the three selected diaphragm specimens. It should be noted that the dimensions of the archetype building diaphragm units do not coincide with those of the test specimens, and therefore the backbone parameters were modified accordingly so that the diaphragm shear strength per unit length is consistently represented. A comparison of the hysteretic response from the calibrated diaphragm simulation and that from the experiment is shown in Figure 53.
Table 17 Calibrated Pinching4 Material Model Parameters
Test Backbone Pinching Strength
Degradation Stiffness Degradation Energy Dissipation
(MPa)
(MPa)
(MPa)
(MPa)
gF1 gF2 gF3 gF4 gFlim gK1, gD1
gK2, gD2
gK3, gD3
gK4, gD4
gKlim, gDlim
gE
SP1
0.0008,
152.9
(22.18 ksi)
0.0017,
199.2
(28.89 ksi)
0.0033,
211.6
(30.69 ksi)
0.0053,
165.3
(23.97 ksi)
0.20,
0.35
0.20,
0.35
0.10,
0.12 0 0.35 0 0.70 0.90
0,
0
0,
0.50
0,
0
0,
0.75
0,
0.90 4.31
SP2 0.0009,
40.0
(5.80 ksi)
0.0015,
53.6
(7.77 ksi)
0.0041,
64.0
(9.28 ksi)
0.0073,
29.7
(4.31 ksi)
0.05,
0.35
0.28,
0.35
0.12,
0.12 0 0.45 0.0 0.50 0.87
0.32,
0.00
0.60,
0.38
0.52,
0.00
1.52,
0.00
1.07,
1.08 2.02
SP3
0.0005,
437.6
(63.46 ksi)
0.0006,
526.8
(76.41 ksi)
0.0014,
740.5
(107.4 ksi)
0.014,
333.2
(48.33 ksi)
-0.06,
-0.06
0.12,
0.12
0.11,
0.11 0 0.83 0.0 0.46 0.33
1.09,
0.14
0.76,
0.47
0.32,
0.12
0.75,
0.10
1.04,
0.61 4.29
(a) (b) (c)
Figure 53 Hysteretic response of diaphragm from experiment and simulation: (a) SP1, (b) SP2, (c) SP3
ε1,σ 1 ε2 ,σ 2 ε3,σ 3 ε4 ,σ 4rΔ+ ,
rΔ−
rp+ ,
rp−
uΔ+ ,
uΔ−

Steel Diaphragm Innovation Initiative –2020, Year 5, Final Report
76
Table 18 provides the diaphragm demands and designs using ASD for the BRB archetype buildings, where u is the shear demand per unit width of the diaphragm, Ω is the safety factor for ASD (Ω =1.5), and u/ is the allowable strength of the diaphragm given by the manufacturer based on the resulting design as described in the notes of Table 18. For the models of the same archetype building with different diaphragm designs that are not a perfect match with past testing, the same Pinching4 model parameters were used except that the backbone stresses were scaled so that the peak strength exactly equals the expected nominal strength of the diaphragm from design. In this case, no overstrength of the diaphragm is considered. The expected nominal strength is calculated with prediction equations to the best knowledge of the authors. For bare steel deck diaphragm, DDM04 (Luttrell et al., 2015) and AISI 310-16 are used to calculate the nominal strength. For concrete on steel deck diaphragm, the nominal strength is determined as the lesser of the strength associated with concrete slab diagonal tension cracking limit state calculated with the newly adopted equations (for AISI S310 2022 edition) from O’Brien et al 2017, in addition to the contribution of reinforcing steel which is calculated with ACI 318-14; and the strength associated with the perimeter fastener limit state calculated per AISC 360-16. The expected nominal strength and scale factors are given in Table 19, where u!Q,8 is the expected nominal strength of the diaphragm design, and u,-! is the peak strength from hysteretic curve.
Table 18 Diaphragm Demands and Design BRB Archetype
Archetype Building ?(kip/ft)
?/Ω(kip/ft)
Diaphragm Design ?< (kip/ft)
1-story (bare steel deck roof)
Traditional / Alternative 2 1.31 0.87 Bare Deck 1* 1.04 Alternative 1 2.10 1.40 Bare Deck 2* 1.73
1-story (comp. deck roof)
Traditional / Alternative 2 2.67 1.78 Composite 1* 1.81 Alternative 1 4.27 2.85 Composite 2* 3.70
4-story
Traditional / Alternative 2
Roof 1.31 0.87 Bare Deck 1 1.04 Levels 1-3 2.62 1.75 Composite 1 1.81
Alternative 1 Roof 2.10 1.40 Bare Deck 2 1.73 Levels 1-3 4.25-4.89 3.26 Composite 2 3.70
8-story
Traditional / Alternative 2
Roof 1.31 0.87 Bare Deck 1 1.04 Levels 1-7 2.62 1.75 Composite 1 1.81
Alternative 1 Roof 2.10 1.40 Bare Deck 2 1.73 Levels 1-7 4.19-5.06 3.37 Composite 2 3.70
12-story
Traditional / Alternative 2
Roof 1.31 0.87 Bare Deck 1 1.04 Levels 1-11 2.62 1.75 Composite 1 1.81
Alternative 1 Roof 2.10 1.40 Bare Deck 2 1.73 Levels 1-11 4.19-5.12 3.41 Composite 2 3.70
*: Details of the diaphragm design are given as follows.
Bare Deck 1: 18 gage HSB®-36-SS steel deck, 36/7/4 #12 screw pattern at supports, #10@6" sidelap attachments.
Bare Deck 2: 16 gage HSB®-36-SS steel deck, 36/7/4 #12 screw pattern at supports, #10@4" sidelap attachments.
Composite 1: Verco W3 Formlok with 3.25" thick lightweight concrete cover (6.25" total thickness, fc' = 3 ksi), WWF 6×6 –
W2.0×W2.0, 3/4" studs at 18" spacing maximum
Composite 2: Verco W3 Formlok with 3.25" thick lightweight concrete cover (6.25" total thickness, fc' = 3 ksi), WWF 6×6 –
W5.5×W5.5, 3/4" studs at 12" spacing maximum

Steel Diaphragm Innovation Initiative –2020, Year 5, Final Report
77
Table 19 Diaphragm Nominal Strength and Backbone Stress Scale Factors for BRB Archetype
Archetype Building ?+=>&
(kip/ft) Limit State of ?+=>&
?>?+ (kip/ft)
Limit State of ?>?+ Scale Factor
1-story (bare steel deck roof)
Trad. / Alt. 2 2.18 connection 2.41 sidelap fastener 0.906 Alt. 1 3.50 connection 2.41 sidelap fastener 1.452
1-story (comp. deck roof)
Trad. / Alt. 2 11.40 connection 9.55 sidelap fastener 1.194 Alt. 1 16.79 connection 9.55 sidelap fastener 1.758
4-story
Trad. / Alt. 2
Roof 2.18 connection 2.41 sidelap fastener 0.906 Levels 1-3 11.40 perim. fastener 9.55 diag. tension crack. 1.194
Alt. 1 Roof 3.50 connection 2.41 sidelap fastener 1.452
Levels 1-3 16.79 diag. tension crack. 9.55 diag. tension crack. 1.758
8-story
Trad. / Alt. 2
Roof 2.18 connection 2.41 sidelap fastener 0.906 Levels 1-7 11.40 perim. fastener 9.55 diag. tension crack. 1.194
Alt. 1 Roof 3.50 connection 2.41 sidelap fastener 1.452
Levels 1-7 16.79 diag. tension crack. 9.55 diag. tension crack. 1.758
12-story
Trad. / Alt. 2
Roof 2.18 connection 2.41 sidelap fastener 0.906 Levels 1-11 11.40 perim. fastener 9.55 diag. tension crack. 1.194
Alt. 1 Roof 3.50 connection 2.41 sidelap fastener 1.452
Levels 1-11 16.79 diag. tension crack. 9.55 diag. tension crack. 1.758 The limit states that control the nominal strength calculation and the experimental strength are also provided in Table 19. Where possible the experimental limit state matches, when a match was not possible it was assumed the selected limit state would provide a conservative approximation of the actual post-peak response. Similar scale factors are provided for the diaphragms designed for the SCBF archetype building in the mid-year SDII Progress Report for Year 5, and will be summarized in the forthcoming SCBF modeling report (Foroughi et al. 2021, CFSRC R-2021-01).
6.4 Whole Building Models
6.4.1 Multi-story building model of SDII BRB archetype building (Wei et al.)
The effort of assessing the seismic performance of the SDII BRB archetype buildings using nonlinear 3D models has been completed. The final report on this work was made publicly available at the CFSRC DSpace library collection hosted at Johns Hopkins (Wei et al. 2020b), whereas a series of journal articles are currently being drafted and soon to be published. A brief summary of the study is also provided as follows. A series of 1, 4, 8, and 12-story archetype buildings with buckling restrained braced frames (BRBF) were designed to the current U.S. building code with three different diaphragm designs: a traditional design that uses conventional diaphragm design forces, an alternative design that uses the seismic demand calculated assuming some diaphragm ductility (values proposed for future editions of the building code of Rs = 2 for concrete on steel deck floor diaphragms and 2.5 for bare steel deck roof diaphragms) which ended up the same as the traditional design, and an alternative design with diaphragm demands assuming no diaphragm ductility (Rs = 1.0). Using material models calibrated against test data for diaphragms and buckling restrained braces (BRB), 3D computational models with material and geometric nonlinearity were created. These models were used to conduct modal analyses to study their modal properties, nonlinear pushover analyses to investigate their static behavior, and nonlinear response history analyses to evaluate their seismic performance.
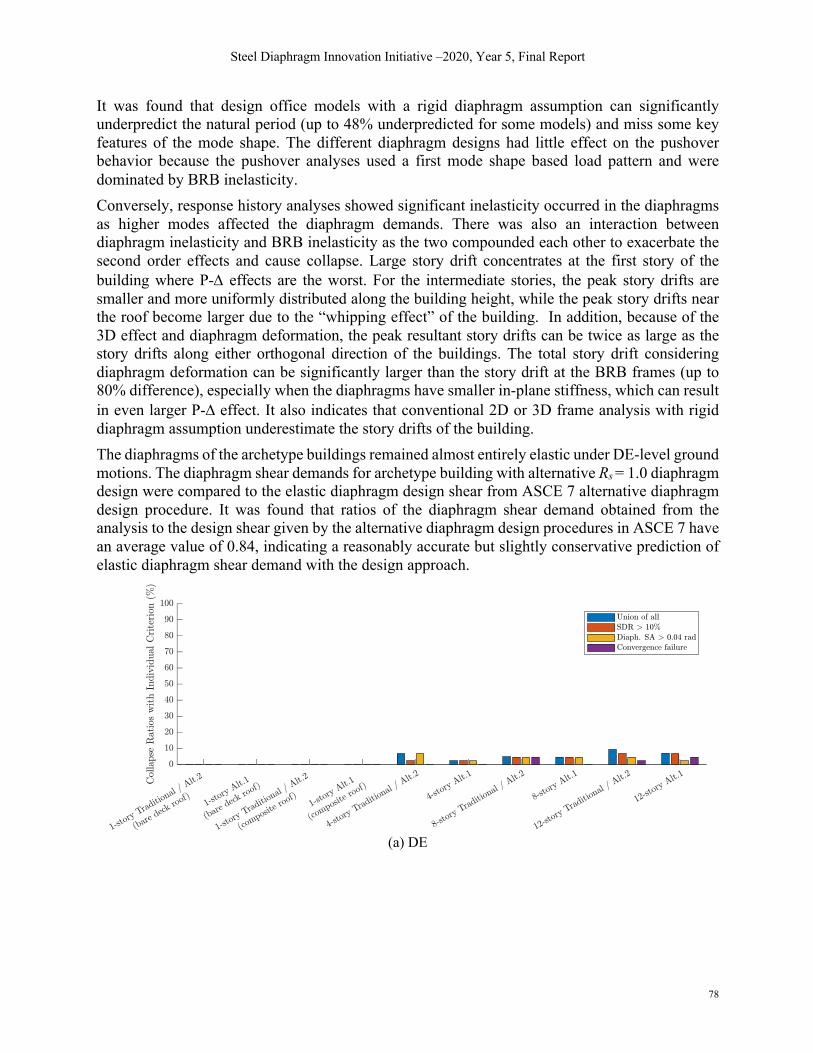
Steel Diaphragm Innovation Initiative –2020, Year 5, Final Report
78
It was found that design office models with a rigid diaphragm assumption can significantly underpredict the natural period (up to 48% underpredicted for some models) and miss some key features of the mode shape. The different diaphragm designs had little effect on the pushover behavior because the pushover analyses used a first mode shape based load pattern and were dominated by BRB inelasticity. Conversely, response history analyses showed significant inelasticity occurred in the diaphragms as higher modes affected the diaphragm demands. There was also an interaction between diaphragm inelasticity and BRB inelasticity as the two compounded each other to exacerbate the second order effects and cause collapse. Large story drift concentrates at the first story of the building where P-D effects are the worst. For the intermediate stories, the peak story drifts are smaller and more uniformly distributed along the building height, while the peak story drifts near the roof become larger due to the “whipping effect” of the building. In addition, because of the 3D effect and diaphragm deformation, the peak resultant story drifts can be twice as large as the story drifts along either orthogonal direction of the buildings. The total story drift considering diaphragm deformation can be significantly larger than the story drift at the BRB frames (up to 80% difference), especially when the diaphragms have smaller in-plane stiffness, which can result in even larger P-D effect. It also indicates that conventional 2D or 3D frame analysis with rigid diaphragm assumption underestimate the story drifts of the building. The diaphragms of the archetype buildings remained almost entirely elastic under DE-level ground motions. The diaphragm shear demands for archetype building with alternative Rs = 1.0 diaphragm design were compared to the elastic diaphragm design shear from ASCE 7 alternative diaphragm design procedure. It was found that ratios of the diaphragm shear demand obtained from the analysis to the design shear given by the alternative diaphragm design procedures in ASCE 7 have an average value of 0.84, indicating a reasonably accurate but slightly conservative prediction of elastic diaphragm shear demand with the design approach.
(a) DE
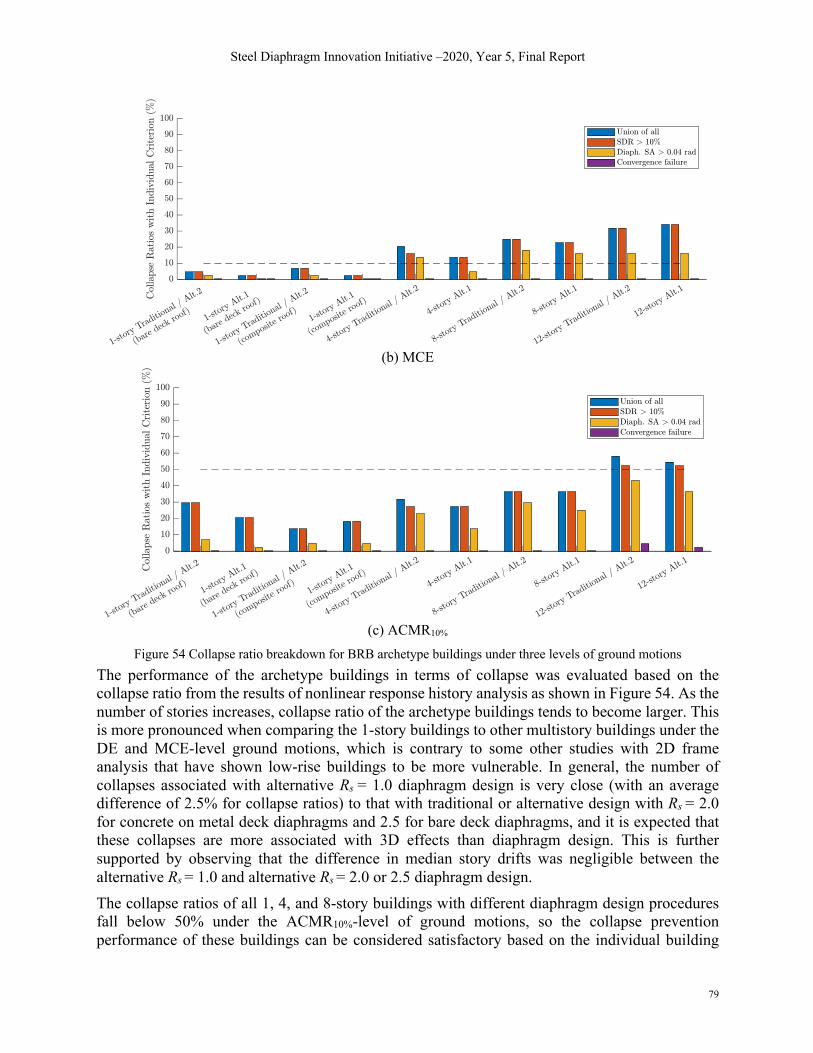
Steel Diaphragm Innovation Initiative –2020, Year 5, Final Report
79
(b) MCE
(c) ACMR10%
Figure 54 Collapse ratio breakdown for BRB archetype buildings under three levels of ground motions
The performance of the archetype buildings in terms of collapse was evaluated based on the collapse ratio from the results of nonlinear response history analysis as shown in Figure 54. As the number of stories increases, collapse ratio of the archetype buildings tends to become larger. This is more pronounced when comparing the 1-story buildings to other multistory buildings under the DE and MCE-level ground motions, which is contrary to some other studies with 2D frame analysis that have shown low-rise buildings to be more vulnerable. In general, the number of collapses associated with alternative Rs = 1.0 diaphragm design is very close (with an average difference of 2.5% for collapse ratios) to that with traditional or alternative design with Rs = 2.0 for concrete on metal deck diaphragms and 2.5 for bare deck diaphragms, and it is expected that these collapses are more associated with 3D effects than diaphragm design. This is further supported by observing that the difference in median story drifts was negligible between the alternative Rs = 1.0 and alternative Rs = 2.0 or 2.5 diaphragm design. The collapse ratios of all 1, 4, and 8-story buildings with different diaphragm design procedures fall below 50% under the ACMR10%-level of ground motions, so the collapse prevention performance of these buildings can be considered satisfactory based on the individual building
Steel Diaphragm Innovation Initiative –2020, Year 5, Final Report
80
evaluation criteria in the FEMA P695 methodology. For the 12-story buildings with overall collapse ratio equal to 56% which is slightly larger than 50%, there is only 4% difference between the collapse ratio associated with traditional / alternative Rs = 2.0 or 2.5 diaphragm design and that associated with the alternative Rs = 1.0 design. Therefore, it is concluded that the alternative diaphragm design procedure with proposed Rs values (Rs = 2 for composite deck diaphragms and Rs = 2.5 for bare deck diaphragms) did not have a significant adverse effect on seismic performance of the considered BRBF buildings compared to Rs = 1.0, and thus these Rs values may be reasonable for use in design of these types of structures. However, it should also be noted that due to the 3D effect in the analysis with the consideration of diaphragm nonlinearity in this study, there are more collapses than expected for multistory buildings under the DE and MCE-level ground motions, with the average collapse ratios equal to 6% and 25%, respectively. Future study is desired to further understand the behavior of 3D models that consider diaphragm deformations as compared to the more widely used 2D frame analyses, to investigate the 3D effect on the evaluation of seismic performance of buildings, and to define appropriate performance objectives for the evaluation measures such as collapse ratios. The final report on this work is complete and publicly available (Wei et al. 2020b).
6.4.2 Multi-story building model of SDII CBF archetype building (Foroughi et al.)
To explore the impact of different diaphragm design procedures on the seismic performance of building systems, a computational study using three-dimensional (3D) building models that capture nonlinear diaphragm behavior and its interaction with the nonlinear vertical LFRS was conducted. A series of 1, 4, 8, and 12-story archetype buildings with Special Concentrically Braced Frames (SCBFs) for the vertical system and four different designs for the diaphragms was completed. The effort parallels the BRBF studies summarized in the previous section and is based on the previously designed SDII archetype buildings. The final summary report for this work is forthcoming (Foroughi et al. 2021) key results and findings are summarized here. For the SCBF buildings modal analysis, nonlinear static pushover analyses, and nonlinear response history analyses using 44 ground motion records scaled to three hazard levels were performed to investigate the behavior and seismic performance. The SCBF archetypes were designed to the current U.S. building code with four different diaphragm designs: (a) a traditional design that uses conventional diaphragm design forces from ASCE 7, (b) a design that uses the seismic demand calculated from the alternative diaphragm design method first adopted in ASCE 7-16 and which assumes some diaphragm ductility based on values proposed by SDII (Eatherton et al. 2020, Schafer 2019) and adopted in the next edition of ASCE 7 of Rs = 2 for concrete-filled steel deck diaphragms and !# = 2.5 for bare steel deck roof diaphragms, and (c) designs with the alternative diaphragm design method of ASCE 7 but assuming quasi-elastic behavior and Rs = 1.0, and (d) designs with the alternative diaphragm design method of ASCE 7, but with a high level of diaphragm ductility with Rs = 3.0.
The objectives of this SCBF building study include: 1) to examine the effect of diaphragms on the dynamic properties of buildings, 2) to understand the extents of diaphragm inelasticity at specified diaphragm hazard levels, 3) to investigate the probability of collapse for buildings designed using different diaphragm design approaches, and 4) to evaluate whether the use of proposed values of Rs for bare steel deck roof diaphragms and concrete-filled steel deck floor diaphragms have a significant effect on the seismic behavior of buildings.
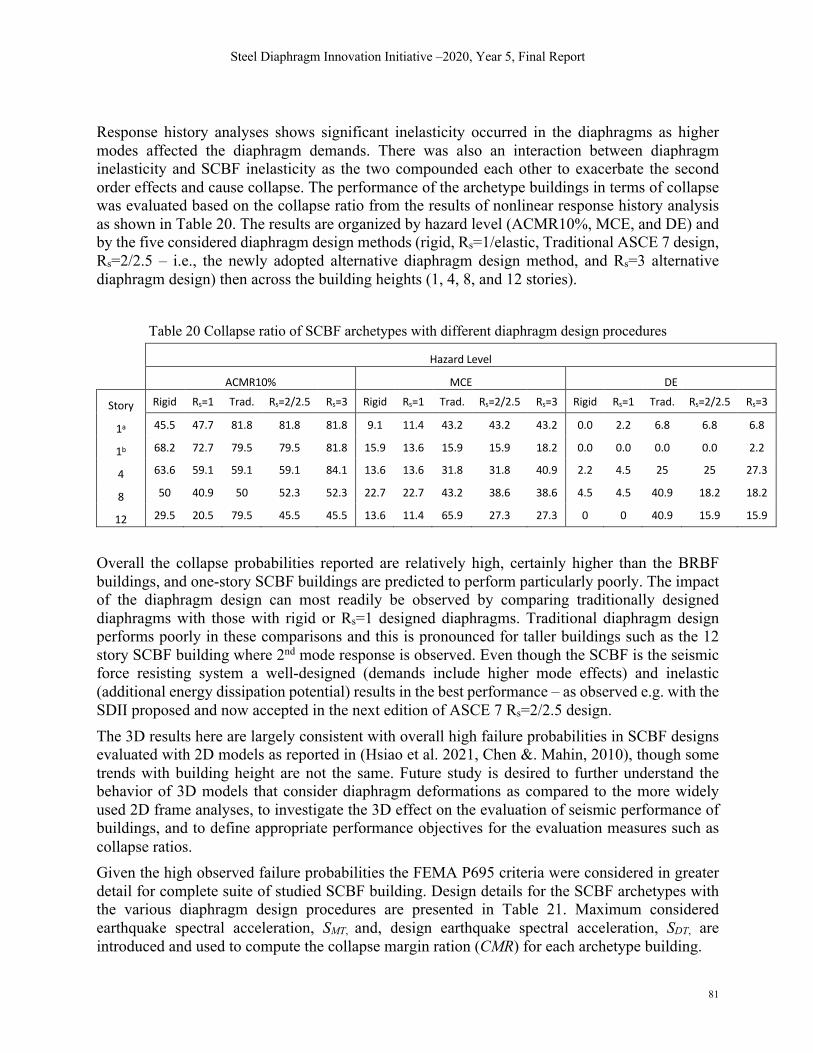
Steel Diaphragm Innovation Initiative –2020, Year 5, Final Report
81
Response history analyses shows significant inelasticity occurred in the diaphragms as higher modes affected the diaphragm demands. There was also an interaction between diaphragm inelasticity and SCBF inelasticity as the two compounded each other to exacerbate the second order effects and cause collapse. The performance of the archetype buildings in terms of collapse was evaluated based on the collapse ratio from the results of nonlinear response history analysis as shown in Table 20. The results are organized by hazard level (ACMR10%, MCE, and DE) and by the five considered diaphragm design methods (rigid, Rs=1/elastic, Traditional ASCE 7 design, Rs=2/2.5 – i.e., the newly adopted alternative diaphragm design method, and Rs=3 alternative diaphragm design) then across the building heights (1, 4, 8, and 12 stories).
Table 20 Collapse ratio of SCBF archetypes with different diaphragm design procedures
Hazard Level
ACMR10% MCE DE
Story Rigid Rs=1 Trad. Rs=2/2.5 Rs=3 Rigid Rs=1 Trad. Rs=2/2.5 Rs=3 Rigid Rs=1 Trad. Rs=2/2.5 Rs=3
1a 45.5 47.7 81.8 81.8 81.8 9.1 11.4 43.2 43.2 43.2 0.0 2.2 6.8 6.8 6.8
1b 68.2 72.7 79.5 79.5 81.8 15.9 13.6 15.9 15.9 18.2 0.0 0.0 0.0 0.0 2.2
4 63.6 59.1 59.1 59.1 84.1 13.6 13.6 31.8 31.8 40.9 2.2 4.5 25 25 27.3
8 50 40.9 50 52.3 52.3 22.7 22.7 43.2 38.6 38.6 4.5 4.5 40.9 18.2 18.2
12 29.5 20.5 79.5 45.5 45.5 13.6 11.4 65.9 27.3 27.3 0 0 40.9 15.9 15.9
Overall the collapse probabilities reported are relatively high, certainly higher than the BRBF buildings, and one-story SCBF buildings are predicted to perform particularly poorly. The impact of the diaphragm design can most readily be observed by comparing traditionally designed diaphragms with those with rigid or Rs=1 designed diaphragms. Traditional diaphragm design performs poorly in these comparisons and this is pronounced for taller buildings such as the 12 story SCBF building where 2nd mode response is observed. Even though the SCBF is the seismic force resisting system a well-designed (demands include higher mode effects) and inelastic (additional energy dissipation potential) results in the best performance – as observed e.g. with the SDII proposed and now accepted in the next edition of ASCE 7 Rs=2/2.5 design. The 3D results here are largely consistent with overall high failure probabilities in SCBF designs evaluated with 2D models as reported in (Hsiao et al. 2021, Chen &. Mahin, 2010), though some trends with building height are not the same. Future study is desired to further understand the behavior of 3D models that consider diaphragm deformations as compared to the more widely used 2D frame analyses, to investigate the 3D effect on the evaluation of seismic performance of buildings, and to define appropriate performance objectives for the evaluation measures such as collapse ratios. Given the high observed failure probabilities the FEMA P695 criteria were considered in greater detail for complete suite of studied SCBF building. Design details for the SCBF archetypes with the various diaphragm design procedures are presented in Table 21. Maximum considered earthquake spectral acceleration, SMT, and, design earthquake spectral acceleration, SDT, are introduced and used to compute the collapse margin ration (CMR) for each archetype building.

Steel Diaphragm Innovation Initiative –2020, Year 5, Final Report
82
Table 21 Maximum considered earthquake spectral acceleration (SMT) and design earthquake spectral
acceleration (SDT) 1-storya 1-storyb 2.4-story 8-story 12-story
T0 0.110 0.110 0.110 0.110 0.110
Ts 0.552 0.552 0.552 0.552 0.552
TL 8.000 8.000 8.000 8.000 8.000
T 0.203 2.0.304 0.538 0.895 1.209
SMS 1.545 1.545 1.545 1.545 1.545
SM1 0.854 0.854 0.854 0.854 0.854
SMT 1.545 1.545 1.586 0.954 0.706
SDT 1.030 1.030 1.058 0.636 0.471
Based on FEMA P695, total system collapse uncertainty (wtotal) is computed to reflect the contribution of uncertainty to the variability of collapse capacity of SCBF archetypes. Overstrength (%), and period-based ductility ('T) are calculated according to the nonlinear pushover static analysis (Foroughi et al. 2021). Moreover, record-to-record uncertainty (wRTR) is introduced in Table 22 with assuming the quality ratings for design requirements, test data, and numerical modeling were all quantified as ‘B-Good’. Table 22 Computed overstrength (%), period-based ductility ('T), record-to-record uncertainty ((RTR) and
total system collapse uncertainty ((total)
Rs = 1 Traditional Rs = 2/2.5 Rs = 3
Story ! "T #RTR #total ! "T #RTR #total ! "T #RTR #total ! "T #RTR #total
1a 3.04 2.70 0.37 0.506 1.85 2.40 0.34 0.485 1.85 2.40 0.34 0.485 3.04 2.40 0.34 0.485
1b 4.59 8.80 0.40 0.529 2.20 5.83 0.40 0.529 4.58 5.74 0.40 0.529 2.21 6.50 0.40 0.529
4 1.96 4.11 0.40 0.529 1.98 3.51 0.40 0.529 1.98 3.51 0.40 0.529 1.94 3.80 0.40 0.529
8 2.37 3.25 0.40 0.529 2.36 3.39 0.40 0.529 2.36 3.39 0.40 0.529 2.36 3.39 0.40 0.529
12 2.31 2.55 0.35 0.492 2.30 2.86 0.38 0.514 2.30 2.86 0.38 0.514 2.30 2.86 0.38 0.514
Mean 2.85 4.28 0.517 2.14 3.60 0.517 2.61 3.58 0.517 2.37 3.79 0.517
Following the underlying assumptions of the FEMA P695 procedure, lognormally distributed CDF plots are fit for all conducted analyses based on the DE, MCE and ACMR10% failure probabilities in Figure 55. From the fitted CDF’s the spectral acceleration at 50% probability of collapse, SCT, is determined. In addition, spectral shape adjustment factor, SSF, is computed based on period-based ductility (HT) and maximum seismic criteria, SDC Dmax. Collapse margin ratio (CMR) is then computed as the ratio of SCT and the MCE spectral acceleration value SMT. The adjusted collapse margin ratio (ACMR) is obtained by multiplying the SSF and CMR values and considering the 3D modeling factor. To calculate the acceptable values of the adjusted collapse margin ratio, the total system collapse uncertainty (wtotal) is needed. From wtotal, the collapse probability of 10% and 20% for all archetypes with different diaphragm design procedures are computed.

Steel Diaphragm Innovation Initiative –2020, Year 5, Final Report
83
Figure 55 Lognormal CDF distribution of collapse capacity for archetypes with different diaphragm designs
With this information evaluation of the SCBF archetypes both individually and as a collection can be completed per FEMA P695 and is provided in Table 23. Based on FEMA P695 methodology, the collapse performance objectives could be defined as: (1) collapse probability of 20% (ACMR20%) for all individual archetypes and, (2) a collapse probability of 10% (ACMR10%) for the average of the performance groups. These values are shaded for comparison in Table 23.
0 2 4 6 8 10Spectral Acceleration, (ST)
0
0.2
0.4
0.6
0.8
1
Col
laps
e Pr
obab
ility
1-story (BD) (Traditional)
SCT = 1.72
SMT = 1.55
CMR = 1.11
SSF = 1.15
ACMR = 1.53
ACMR10% = 1.86
ACMR20% = 1.5
0 2 4 6 8 10Spectral Acceleration, (ST)
0
0.2
0.4
0.6
0.8
1
Col
laps
e Pr
obab
ility
1-story (BD) (Rs =1)
SCT = 2.72
SMT = 1.55
CMR = 1.76
SSF = 1.16
ACMR = 2.45
ACMR10% = 1.91
ACMR20% = 1.53
0 2 4 6 8 10Spectral Acceleration, (ST)
0
0.2
0.4
0.6
0.8
1
Col
laps
e Pr
obab
ility
1-story (BD) (Rs = 2/2.5)
SCT = 1.72
SMT = 1.55
CMR = 1.11
SSF = 1.15
ACMR = 1.53
ACMR10% = 1.86
ACMR20% = 1.5
0 2 4 6 8 10Spectral Acceleration, (ST)
0
0.2
0.4
0.6
0.8
1
Col
laps
e Pr
obab
ility
1-story (BD) (Rs=3)
SCT = 1.72
SMT = 1.55
CMR = 1.11
SSF = 1.15
ACMR = 1.53
ACMR10% = 1.86
ACMR20% = 1.5
0 2 4 6 8 10Spectral Acceleration, (ST)
0
0.2
0.4
0.6
0.8
1
Col
laps
e Pr
obab
ility
1-story (CD) (Traditional)
SCT = 1.78
SMT = 1.55
CMR = 1.15
SSF = 1.27
ACMR = 1.75
ACMR10% = 1.97
ACMR20% = 1.56
0 2 4 6 8 10Spectral Acceleration, (ST)
0
0.2
0.4
0.6
0.8
1
Col
laps
e Pr
obab
ility
1-story (CD) (Rs =1)
SCT = 1.86
SMT = 1.55
CMR = 1.21
SSF = 1.33
ACMR = 1.93
ACMR10% = 1.97
ACMR20% = 1.56
0 2 4 6 8 10Spectral Acceleration, (ST)
0
0.2
0.4
0.6
0.8
1
Col
laps
e Pr
obab
ility
1-story (CD) (Rs = 2/2.5)
SCT = 1.77
SMT = 1.55
CMR = 1.15
SSF = 1.27
ACMR = 1.75
ACMR10% = 1.97
ACMR20% = 1.56
0 2 4 6 8 10Spectral Acceleration, (ST)
0
0.2
0.4
0.6
0.8
1
Col
laps
e Pr
obab
ility
1-story (CD) (Rs=3)
SCT = 1.74
SMT = 1.55
CMR = 1.13
SSF = 1.29
ACMR = 1.75
ACMR10% = 1.97
ACMR20% = 1.56
0 2 4 6 8 10Spectral Acceleration, (ST)
0
0.2
0.4
0.6
0.8
1
Col
laps
e Pr
obab
ility
4-story (Traditional)
SCT = 2.03
SMT = 1.59
CMR = 1.28
SSF = 1.2
ACMR = 1.84
ACMR10% = 1.97
ACMR20% = 1.56
0 2 4 6 8 10Spectral Acceleration, (ST)
0
0.2
0.4
0.6
0.8
1
Col
laps
e Pr
obab
ility
4-story (Rs =1)
SCT = 2.23
SMT = 1.59
CMR = 1.41
SSF = 1.22
ACMR = 2.06
ACMR10% = 1.97
ACMR20% = 1.56
0 2 4 6 8 10Spectral Acceleration, (ST)
0
0.2
0.4
0.6
0.8
1
Col
laps
e Pr
obab
ility
4-story (Rs = 2/2.5)
SCT = 2.03
SMT = 1.59
CMR = 1.28
SSF = 1.2
ACMR = 1.84
ACMR10% = 1.97
ACMR20% = 1.56
0 2 4 6 8 10Spectral Acceleration, (ST)
0
0.2
0.4
0.6
0.8
1
Col
laps
e Pr
obab
ility
4-story (Rs=3)
SCT = 1.55
SMT = 1.59
CMR = 0.98
SSF = 1.15
ACMR = 1.35
ACMR10% = 1.97
ACMR20% = 1.56
0 2 4 6 8 10Spectral Acceleration, (ST)
0
0.1
0.2
0.3
0.4
0.5
0.6
0.7
0.8
Col
laps
e Pr
obab
ility
8-story (Traditional)SCT = 1.38
SMT = 0.95
CMR = 1.44
SSF = 1.22
ACMR = 2.11
ACMR10% = 1.97
ACMR20% = 1.56
0 2 4 6 8 10Spectral Acceleration, (ST)
0
0.2
0.4
0.6
0.8
1
Col
laps
e Pr
obab
ility
8-story (Rs =1)
SCT = 1.39
SMT = 0.95
CMR = 1.46
SSF = 1.2
ACMR = 2.1
ACMR10% = 1.97
ACMR20% = 1.56
0 2 4 6 8 10Spectral Acceleration, (ST)
0
0.2
0.4
0.6
0.8
1
Col
laps
e Pr
obab
ility
8-story (Rs = 2/2.5)
SCT = 1.12
SMT = 0.95
CMR = 1.17
SSF = 1.21
ACMR = 1.7
ACMR10% = 1.97
ACMR20% = 1.56
0 2 4 6 8 10Spectral Acceleration, (ST)
0
0.2
0.4
0.6
0.8
1
Col
laps
e Pr
obab
ility
8-story (Rs=3)
SCT = 1.12
SMT = 0.95
CMR = 1.17
SSF = 1.21
ACMR = 1.7
ACMR10% = 1.97
ACMR20% = 1.56
0 2 4 6 8 10Spectral Acceleration, (ST)
0
0.2
0.4
0.6
0.8
1
Col
laps
e Pr
obab
ility
12-story (Traditional)
SCT = 0.55
SMT = 0.71
CMR = 0.77
SSF = 1.3
ACMR = 1.2
ACMR10% = 1.93
ACMR20% = 1.54
0 2 4 6 8 10Spectral Acceleration, (ST)
0
0.2
0.4
0.6
0.8
1
Col
laps
e Pr
obab
ility
12-story (Rs =1)
SCT = 1.52
SMT = 0.71
CMR = 2.16
SSF = 1.29
ACMR = 3.34
ACMR10% = 1.88
ACMR20% = 1.51
0 2 4 6 8 10Spectral Acceleration, (ST)
0
0.2
0.4
0.6
0.8
1
Col
laps
e Pr
obab
ility
12-story (Rs = 2/2.5)
SCT = 1
SMT = 0.71
CMR = 1.42
SSF = 1.29
ACMR = 2.2
ACMR10% = 1.93
ACMR20% = 1.54
0 2 4 6 8 10Spectral Acceleration, (ST)
0
0.2
0.4
0.6
0.8
1
Col
laps
e Pr
obab
ility
12-story (Rs=3)
SCT = 1.03
SMT = 0.71
CMR = 1.45
SSF = 1.29
ACMR = 2.24
ACMR10% = 1.93
ACMR20% = 1.54
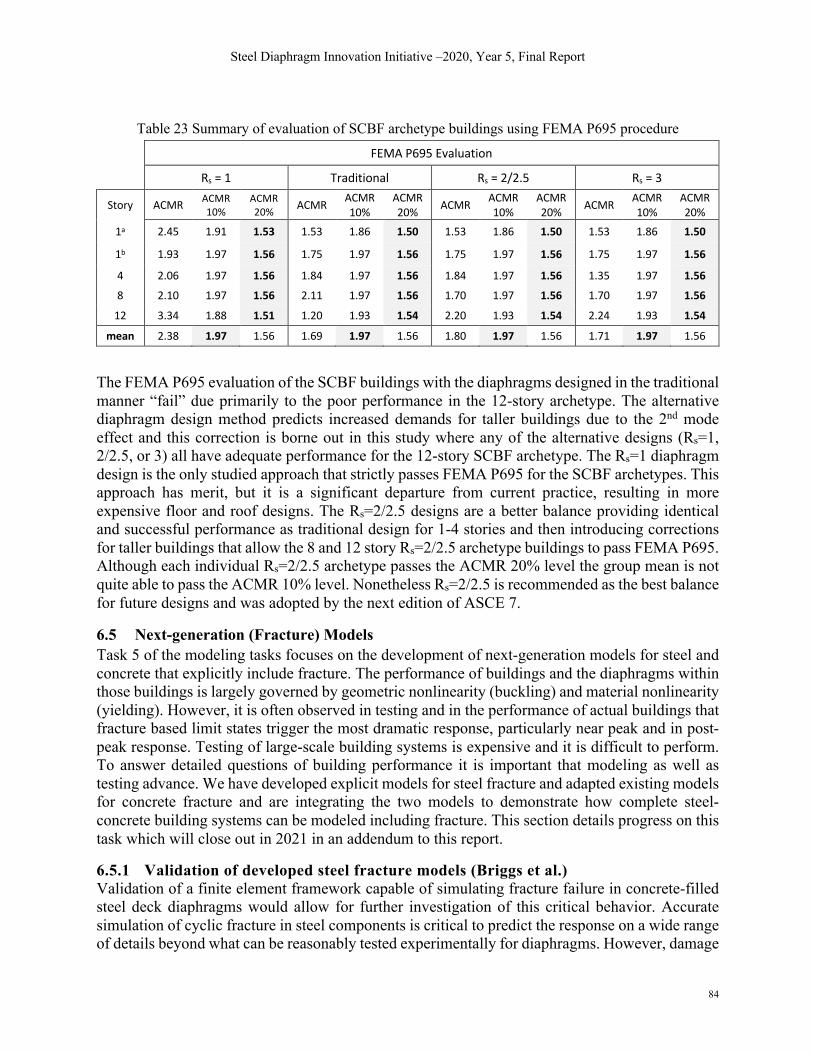
Steel Diaphragm Innovation Initiative –2020, Year 5, Final Report
84
Table 23 Summary of evaluation of SCBF archetype buildings using FEMA P695 procedure FEMA P695 Evaluation
Rs = 1 Traditional Rs = 2/2.5 Rs = 3
Story ACMR ACMR10%
ACMR20% ACMR
ACMR10%
ACMR20%
ACMR ACMR10%
ACMR20%
ACMR ACMR10%
ACMR20%
1a 2.45 1.91 1.53 1.53 1.86 1.50 1.53 1.86 1.50 1.53 1.86 1.50
1b 1.93 1.97 1.56 1.75 1.97 1.56 1.75 1.97 1.56 1.75 1.97 1.56
4 2.06 1.97 1.56 1.84 1.97 1.56 1.84 1.97 1.56 1.35 1.97 1.56 8 2.10 1.97 1.56 2.11 1.97 1.56 1.70 1.97 1.56 1.70 1.97 1.56
12 3.34 1.88 1.51 1.20 1.93 1.54 2.20 1.93 1.54 2.24 1.93 1.54 mean 2.38 1.97 1.56 1.69 1.97 1.56 1.80 1.97 1.56 1.71 1.97 1.56
The FEMA P695 evaluation of the SCBF buildings with the diaphragms designed in the traditional manner “fail” due primarily to the poor performance in the 12-story archetype. The alternative diaphragm design method predicts increased demands for taller buildings due to the 2nd mode effect and this correction is borne out in this study where any of the alternative designs (Rs=1, 2/2.5, or 3) all have adequate performance for the 12-story SCBF archetype. The Rs=1 diaphragm design is the only studied approach that strictly passes FEMA P695 for the SCBF archetypes. This approach has merit, but it is a significant departure from current practice, resulting in more expensive floor and roof designs. The Rs=2/2.5 designs are a better balance providing identical and successful performance as traditional design for 1-4 stories and then introducing corrections for taller buildings that allow the 8 and 12 story Rs=2/2.5 archetype buildings to pass FEMA P695. Although each individual Rs=2/2.5 archetype passes the ACMR 20% level the group mean is not quite able to pass the ACMR 10% level. Nonetheless Rs=2/2.5 is recommended as the best balance for future designs and was adopted by the next edition of ASCE 7.
6.5 Next-generation (Fracture) Models
Task 5 of the modeling tasks focuses on the development of next-generation models for steel and concrete that explicitly include fracture. The performance of buildings and the diaphragms within those buildings is largely governed by geometric nonlinearity (buckling) and material nonlinearity (yielding). However, it is often observed in testing and in the performance of actual buildings that fracture based limit states trigger the most dramatic response, particularly near peak and in post-peak response. Testing of large-scale building systems is expensive and it is difficult to perform. To answer detailed questions of building performance it is important that modeling as well as testing advance. We have developed explicit models for steel fracture and adapted existing models for concrete fracture and are integrating the two models to demonstrate how complete steel-concrete building systems can be modeled including fracture. This section details progress on this task which will close out in 2021 in an addendum to this report.
6.5.1 Validation of developed steel fracture models (Briggs et al.) Validation of a finite element framework capable of simulating fracture failure in concrete-filled steel deck diaphragms would allow for further investigation of this critical behavior. Accurate simulation of cyclic fracture in steel components is critical to predict the response on a wide range of details beyond what can be reasonably tested experimentally for diaphragms. However, damage

Steel Diaphragm Innovation Initiative –2020, Year 5, Final Report
85
and fracture in steel structures subjected to cyclic loading localizes at discrete locations and the damage accumulation process and fracture propagation depends on the explicit details of the affected structural components. Additionally, the failure modes of the shear studs and damage progression in diaphragms is complex and the ability to capture these features is vital for accurate results.
Figure 56 Coupon Specimen Geometries
To capture the complex cyclic failure of the shear studs in the next generation models we will be using a user defined material model previously created and outlined for this project. This model has been calibrated and validated for use in simulating fracture of common bolt and structural steels with extremely high fidelity. However before the model can be used in the simulation of composite steel deck diaphragms it must be calibrated to accurately represent the shear stud material, ASTM A29 Grade 1015 steel. Based on the past calibration method for this model an exhaustive procedure will be followed. Tensile coupon specimens of various geometries, shown in Figure 56, have been designed based upon Smith et al. (2014) such that upon fracture these specimens will encompass a wide range of lode angle parameter and triaxiality values. These two variables govern fracture of the material in this user defined model, and thus by encompassing these two variables in their feasible ranges a full depiction of the materials fracture properties will be captured. Figure 57 shows the lode angle parameter and triaxiality value of each specimen at initiation of fracture. Each of these unique geometry specimens will be subjected to a set of six loading protocols which consist of a variety of cyclic and monotonic loadings to improve the robustness of the material parameters. With sixteen unique geometries and six loading protocols there are a total of 96 unique tests. Each of which will be tested experimentally and simulated using a finite element model of the specimen. During the past year the modeling and simulation method for each of these specimens was optimized to provide accurate results at a computationally efficient cost. Currently, the final finite element models from the set of 96 tests are being built and the experimental coupons are being tested. When all of the experimental results have been collected optimization will be used to determine the shear stud material parameters which provide the best match between the simulated and experimental results for all of these specimens. Through this calibration process more accurate results will be obtained from the finite element simulations.

Steel Diaphragm Innovation Initiative –2020, Year 5, Final Report
86
Once the parameters for this material model have been calibrated for the shear stud material, they can then be used in further finite element simulations which involve shear studs.
Figure 57 Ancillary steel coupons for particle swarm optimization
The calibration of these material parameters will be done in the first three months of this project’s no cost extension. This will allow ample time to implement the calibrated material model into other simulation activities, such as the push-out test and full-scale diaphragm simulations utilizing the next-generation fracture models. Documentation of the results of this calibration will be included in the 2021 addendum to this final report.
6.5.2 Application of concrete fracture models in ABAQUS (Briggs et al.)
A high-fidelity concrete damage plasticity model developed by Gargari and Koutromanos (2016) has been adopted for concrete modeling in the SDII project. The model combines an elastoplastic formulation with a non-associative flow rule for the compression regime, and a rotating smeared crack model for the tension regime. The model was calibrated using single element analyses on cubes under uniaxial compression and tension for normal weight concrete and light weight concrete. Experiments on concrete structural components including reinforced concrete columns and beam-column joints were simulated in ABAQUS to validate the performance of the model under different stress states. The model accurately describes concrete damage and cracking in different stress conditions except cases with high stress triaxiality. This is because the model does not limit the development of compressive strength along the hydrostatic axis. Such a high triaxiality stress state can be observed in the concrete around the shear studs and the metal deck in the SDII pushout experiments. A modified concrete model was formulated that integrates the concrete damage plasticity model developed by Moharrami and Koutromanos (2016) with a standard two-invariant CAP model developed by Sandler et al. (1971). Figure 58 shows the shape of the new advanced concrete model in 3D space. The yield function of the advanced concrete model consists of two parts, a failure envelope and a cap surface. In the original form developed by Sandler and Rubin (1979), the two surfaces function together and have a smooth transition surface. However, in this model, the two parts function independently and the transition between them is determined by the variable k. The value of k, known as the hardening variable, is the threshold pressure value, beyond which the CAP surface is activated. Kappa (k) is a function of the plastic volumetric strain developed due to CAP yielding. The k function evolves

Steel Diaphragm Innovation Initiative –2020, Year 5, Final Report
87
with the accumulation of plastic strain. To ensure that the CAP surface does not affect the behavior of concrete under biaxial and triaxial conditions with low confining pressure, a minimum value of k is specified by the user as function of f’c, the uniaxial compressive strength of concrete.
Figure 58 Visualization of concrete model in 3D space
The model is implemented in a UMAT in FORTRAN and compiled into ABAQUS. The calibration of the model has been carried out using elementary simulations of pure hydrostatic compression tests from the literature. Table 24 shows the calibrated parameters of the CAP surface used in the calibration tests and Figure 59 shows the results of the calibration tests.
Table 24 Calibrated parameters of the CAP surface
Figure 59 shows that the advanced concrete model with the CAP works well in cases of pure hydrostatic loading. Further validation of the model is performed against experimental tests on concrete cylinders with other triaxial loading as shown in Figure 60. This high fidelity concrete model has been calibrated to both the lightweight and normal weight concrete used in the experimental push-out tests and has been implemented as part of the next-generation modeling of these experiments. This calibration is performed based on data obtained from experimental compression and splitting tensile tests performed on concrete cylinders from the same concrete
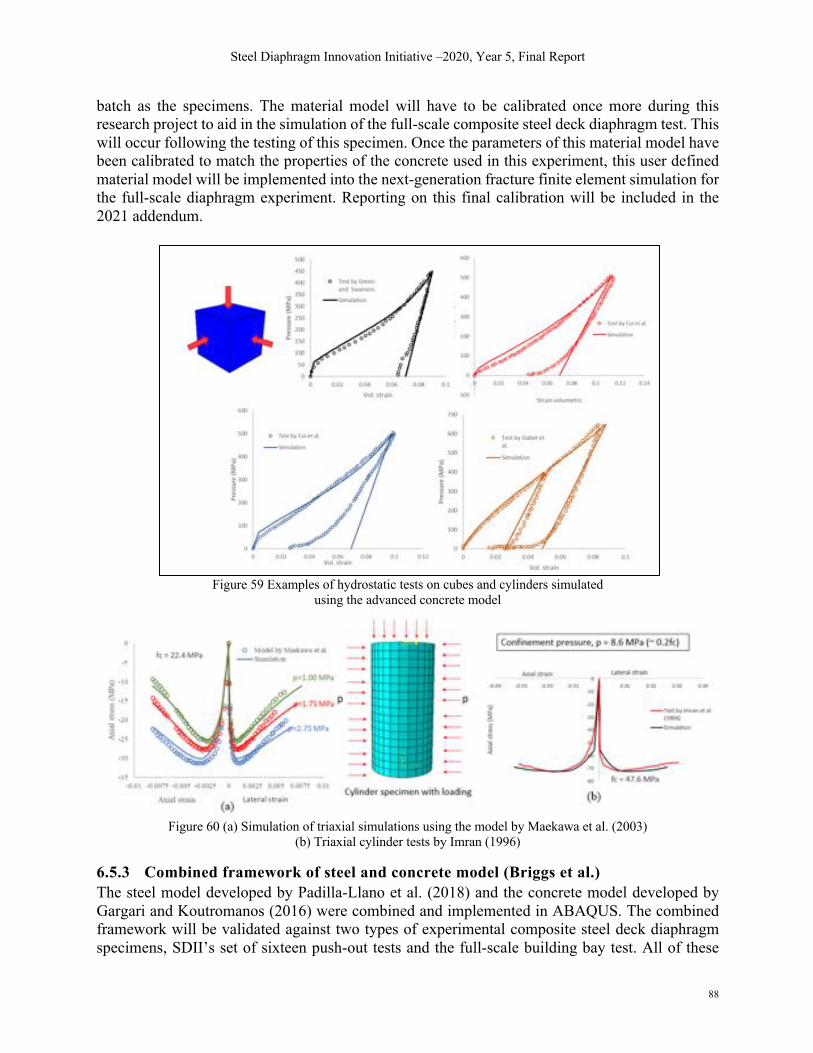
Steel Diaphragm Innovation Initiative –2020, Year 5, Final Report
88
batch as the specimens. The material model will have to be calibrated once more during this research project to aid in the simulation of the full-scale composite steel deck diaphragm test. This will occur following the testing of this specimen. Once the parameters of this material model have been calibrated to match the properties of the concrete used in this experiment, this user defined material model will be implemented into the next-generation fracture finite element simulation for the full-scale diaphragm experiment. Reporting on this final calibration will be included in the 2021 addendum.
Figure 59 Examples of hydrostatic tests on cubes and cylinders simulated
using the advanced concrete model
Figure 60 (a) Simulation of triaxial simulations using the model by Maekawa et al. (2003)
(b) Triaxial cylinder tests by Imran (1996)
6.5.3 Combined framework of steel and concrete model (Briggs et al.)
The steel model developed by Padilla-Llano et al. (2018) and the concrete model developed by Gargari and Koutromanos (2016) were combined and implemented in ABAQUS. The combined framework will be validated against two types of experimental composite steel deck diaphragm specimens, SDII’s set of sixteen push-out tests and the full-scale building bay test. All of these
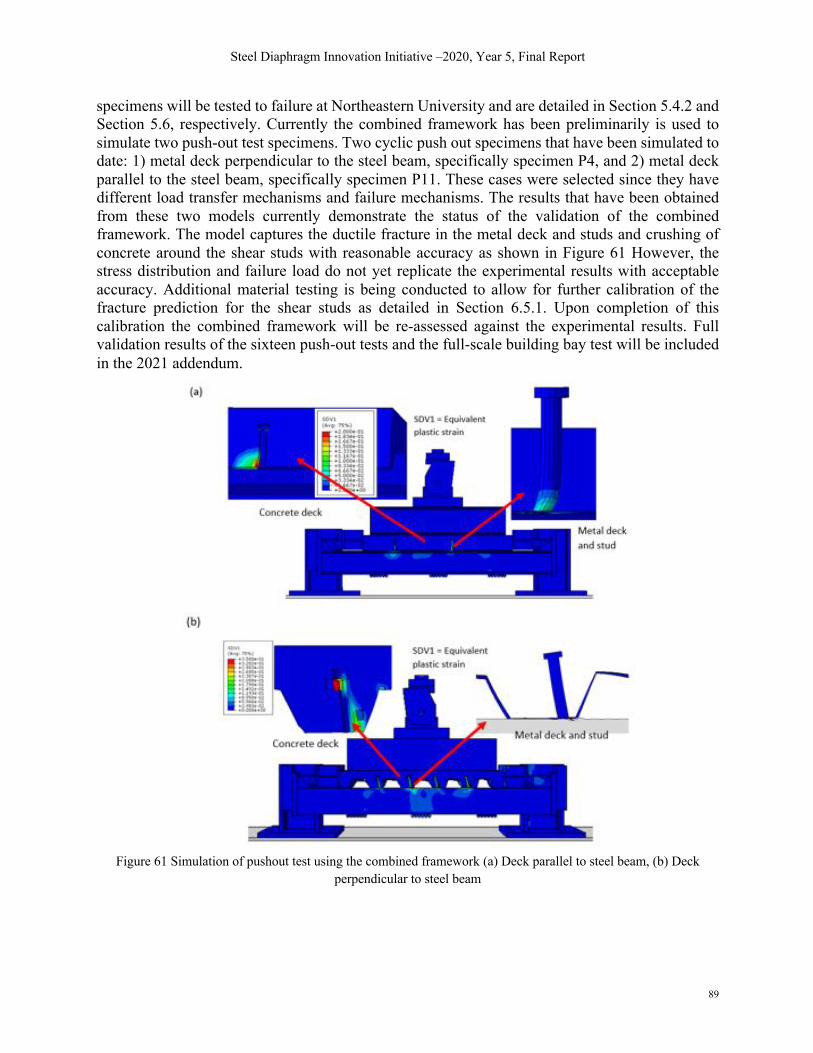
Steel Diaphragm Innovation Initiative –2020, Year 5, Final Report
89
specimens will be tested to failure at Northeastern University and are detailed in Section 5.4.2 and Section 5.6, respectively. Currently the combined framework has been preliminarily is used to simulate two push-out test specimens. Two cyclic push out specimens that have been simulated to date: 1) metal deck perpendicular to the steel beam, specifically specimen P4, and 2) metal deck parallel to the steel beam, specifically specimen P11. These cases were selected since they have different load transfer mechanisms and failure mechanisms. The results that have been obtained from these two models currently demonstrate the status of the validation of the combined framework. The model captures the ductile fracture in the metal deck and studs and crushing of concrete around the shear studs with reasonable accuracy as shown in Figure 61 However, the stress distribution and failure load do not yet replicate the experimental results with acceptable accuracy. Additional material testing is being conducted to allow for further calibration of the fracture prediction for the shear studs as detailed in Section 6.5.1. Upon completion of this calibration the combined framework will be re-assessed against the experimental results. Full validation results of the sixteen push-out tests and the full-scale building bay test will be included in the 2021 addendum.
Figure 61 Simulation of pushout test using the combined framework (a) Deck parallel to steel beam, (b) Deck
perpendicular to steel beam

Steel Diaphragm Innovation Initiative –2020, Year 5, Final Report
90
6.5.4 Application of next-generation modeling (Hajjar et al.)
Currently the next-generation fracture models for steel and concrete have been developed and implemented. Final calibration of the steel model for the shear stud material used is pending. Thus the validation of the combined framework in comparison to the experimental push-out tests has been delayed. However, validation of the next-generation modeling against the full-scale building bay diaphragm experiment is set to occur shortly after the experiment itself is complete. The validation of the combined framework against the set of sixteen push-out tests will also occur at this time. A comprehensive summary of this validation will be provided in the 2021 addendum. This calibration and validation will allow this next-generation modeling to provide an extensive understanding of composite steel deck diaphragm behavior that extends past the limited experimental test that have been done. The wide applicability and utility of this next-generation framework lends itself to inform research, design, codes, and standard.
6.6 Non-Structural Models (Fischer et al.)
The SDII Workshop report (Schafer et al. 2019) provides direct comment on the importance of non-structural diaphragm response. The SDII Year 4 Final report provide completed work on defining non-structural models (Eatherton et al. 2019). The non-structural modeling efforts are embedded in the optimization efforts and are now complete.
6.7 Optimization Model (Fischer et al.)
Using topology optimization on diaphragm designs, the design can potentially move away from traditional design using chords and collectors, and instead integrate the chords and collectors into the diaphragm design itself. Steel deck diaphragms are highly orthotropic due to the corrugated steel sheet, and they are usually placed with the same orientation across the diaphragm; however, in the optimization pursued here the decks can be placed independently of deck type and orientation. Most recent work is summarized in Fischer, et al. (2020): Topology Optimization of Cold-Formed Steel Deck Diaphragms with Irregularities, Cold-Formed Steel Research Consortium (CFSRC) Colloquium. The optimization formulation focuses on maximum stiffness (with minimal material), this is equivalent to the minimum compliance formulation for a 2D continuum problem, using rectangular four node plane stress elements. Minimizing the external work of the two applied load cases with an upper bound of available material is expressed as follows:
min12
, = -34 .3 +-54 .5 0. 2.3.+ − -+ = 4 56" 7""∈7
− 8 ≤ 0
6#+% ≤ 6" ≤ 1∀= ∈ ?−@2 ≤ B" ≤ @
2∀= ∈ ?
Eq. 6.6-1
where design variable x, and y, are the material concentration and the material orientation in element z. {D is the applied load vector for load case <, |D denotes the nodal displacements for load case < , and the global stiffness matrix h is assembled from element stiffness matrices h, . u,
denotes the element volume, and the available volume of material in the domain is denoted 5.

Steel Diaphragm Innovation Initiative –2020, Year 5, Final Report
91
Imposed on the design variables x, and y, are a neighborhood filter, that applies a dependency from neighboring elements within a radius of }BD., such that elements near solid elements will tend to become a solid itself and vice-a-versa. The element material “concentration”, ~,, and the material orientation, �, are a function of the weight function and the design variable H,.
~, = ∑ HD 4(ÅD − Å,)DRS@
∑ 4(ÅD − Å,)DRS@
�, = ∑ yDD∈S@ w(xD − x,)∑ w(xD − x,)D∈S@
Eq. 6.6-2
The weighting function is defined as a linear weight function depending on the distance from the element:
48(ÅD − Å,) = É}BD. − ‖ÅD − Å,‖
}BD.if<ÖÜ,
0 otherwiseã Eq. 6.6-3
The neighborhood set is defined as: <ÖÜ, <+‖ÅD − Å,‖ ≤ }BD. Eq. 6.6-4
Strengths and stiffnesses of bare steel diaphragm decks are based on the database in SDI’s DDM04, which provides extensive strength tables with over 65,000 different deck configurations for use in design. The equivalent flat plate elastic moduli for orthotropic corrugated plates are estimated with Xia and Friswell (2012) alongside the formulas in AISI S310 for shear strength and stiffness. An approximation of the tabled strength and stiffness values as a linear function of variable å is illustrated in Figure 62. The equivalent Young’s modulus parallel to the corrugations, ,>' , is the strong axis of the deck, while ,@' which is perpendicular to the corrugations is the weak axis, ?′ is the shear stiffness and 5 is the shear strength of the deck.
Figure 62 Stiffness functions fitted to database of bare steel deck diaphragms.
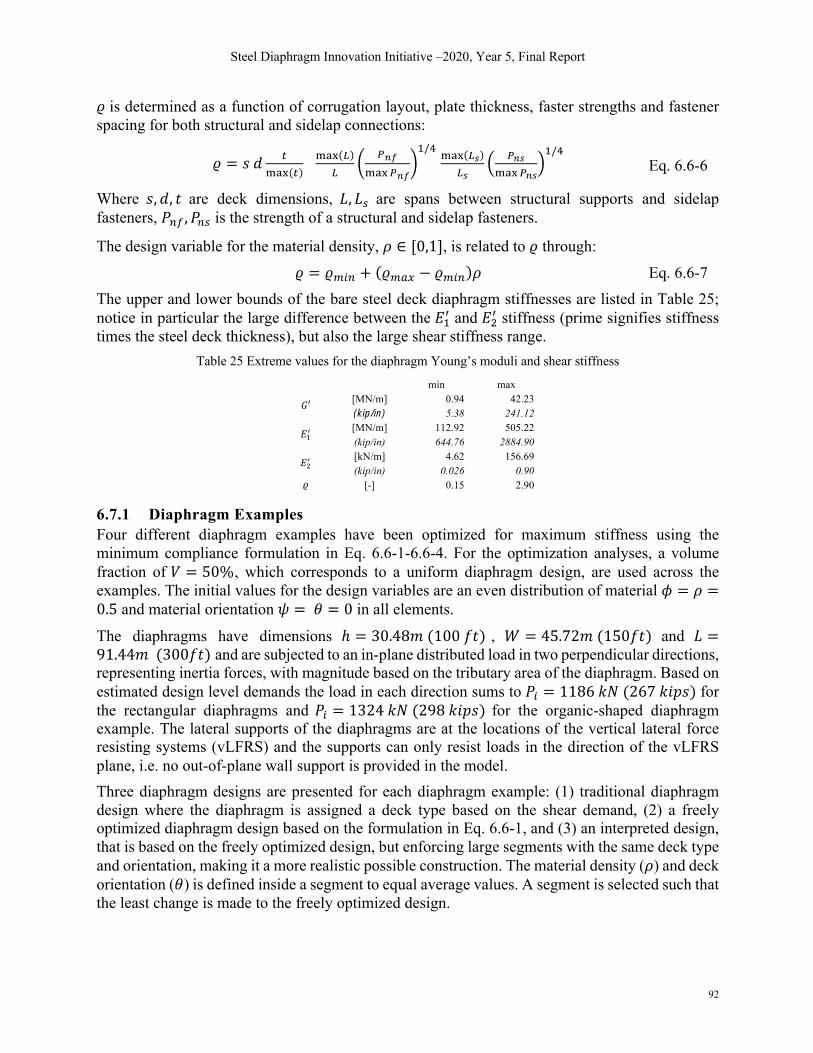
Steel Diaphragm Innovation Initiative –2020, Year 5, Final Report
92
å is determined as a function of corrugation layout, plate thickness, faster strengths and fastener spacing for both structural and sidelap connections:
å = qé <UVW(<)
UVW(()(
; =ABUVW=AB
>>/I
UVW((C)(C
l =ACUVW=AC
m>/I
Eq. 6.6-6
Where q, é, 8 are deck dimensions, è, è# are spans between structural supports and sidelap fasteners, X.Y , X.# is the strength of a structural and sidelap fasteners.
The design variable for the material density, ~ ∈ [0,1], is related to å through: å = åBD. + (åB/- − åBD.)~ Eq. 6.6-7
The upper and lower bounds of the bare steel deck diaphragm stiffnesses are listed in Table 25; notice in particular the large difference between the ,>' and ,@' stiffness (prime signifies stiffness times the steel deck thickness), but also the large shear stiffness range.
Table 25 Extreme values for the diaphragm Young’s moduli and shear stiffness
min max
8′ [MN/m] 0.94 42.23 (kip/in) 5.38 241.12
:!" [MN/m] 112.92 505.22 (kip/in) 644.76 2884.90
:#" [kN/m] 4.62 156.69 (kip/in) 0.026 0.90
; [-] 0.15 2.90
6.7.1 Diaphragm Examples
Four different diaphragm examples have been optimized for maximum stiffness using the minimum compliance formulation in Eq. 6.6-1-6.6-4. For the optimization analyses, a volume fraction of 5 = 50%, which corresponds to a uniform diaphragm design, are used across the examples. The initial values for the design variables are an even distribution of material x = ~ =0.5 and material orientation y = � = 0 in all elements. The diaphragms have dimensions ℎ = 30.48@(100+8) , í = 45.72@(150+8) and è =91.44@(300+8) and are subjected to an in-plane distributed load in two perpendicular directions, representing inertia forces, with magnitude based on the tributary area of the diaphragm. Based on estimated design level demands the load in each direction sums to XD = 11867Ü(2677<=q) for the rectangular diaphragms and XD = 13247Ü(2987<=q) for the organic-shaped diaphragm example. The lateral supports of the diaphragms are at the locations of the vertical lateral force resisting systems (vLFRS) and the supports can only resist loads in the direction of the vLFRS plane, i.e. no out-of-plane wall support is provided in the model. Three diaphragm designs are presented for each diaphragm example: (1) traditional diaphragm design where the diaphragm is assigned a deck type based on the shear demand, (2) a freely optimized diaphragm design based on the formulation in Eq. 6.6-1, and (3) an interpreted design, that is based on the freely optimized design, but enforcing large segments with the same deck type and orientation, making it a more realistic possible construction. The material density (~) and deck orientation (�) is defined inside a segment to equal average values. A segment is selected such that the least change is made to the freely optimized design.

Steel Diaphragm Innovation Initiative –2020, Year 5, Final Report
93
Table 26 Objective function values for the diaphragm design examples
Optimized
design Traditional
design Interpreted
design
SDII [kN m] 64 3447 243
[kips ft] 47 2542 179
SDII with cutout [kN m] 104 4274 459
[kips ft] 77 3152 338
Organic perimeter [kN m] 171 10602 704
[kips ft] 126 7818 519
Organic internal [kN m] 58 5080 522
[kips ft] 43 3747 385
6.7.1.1 Example SDII Archetype
The simple diaphragm inspired by the SDII archetype building, see Figure 63a, is optimized for loads in only the x-direction Figure 63b, only in the y-direction Figure 63c, and for loads in both directions simultaneously, Figure 63d. The shades of grey indicate the deck type in terms of the ~ value, with white being ~ = 0 (minimum stiffness, å = 0.15) and black for ~ = 1(maximum stiffness,å = 2.90) and for each element the material orientation, �,, is depicted as a short red line in the ,>' (strong) direction. The layouts in Figure 63 do not include a neighborhood filter (Eq. 6.6-2) in the optimization setup, which is obvious from the checkerboard pattern that the optimized solutions generate. Including a neighborhood dependency can reduce the checkerboard patterns and provide clearer load paths as discussed next.
(a)
(b)
(c) (d)
Figure 63 Simple diaphragm (a) setup, (b) optimized solution for loads only in x-direction, (c) optimized solution for loads only in y-direction, and (d) optimized solution for loads in both directions
An optimized design, including a neighborhood dependency with a radius of 3 elements, is illustrated in Figure 64a, for loads in both directions. It is worth noting, that the checkerboard patterns are reduced and that areas have the same orientation and material density, but more intermediate material densities are needed in this design. The optimized design has some features
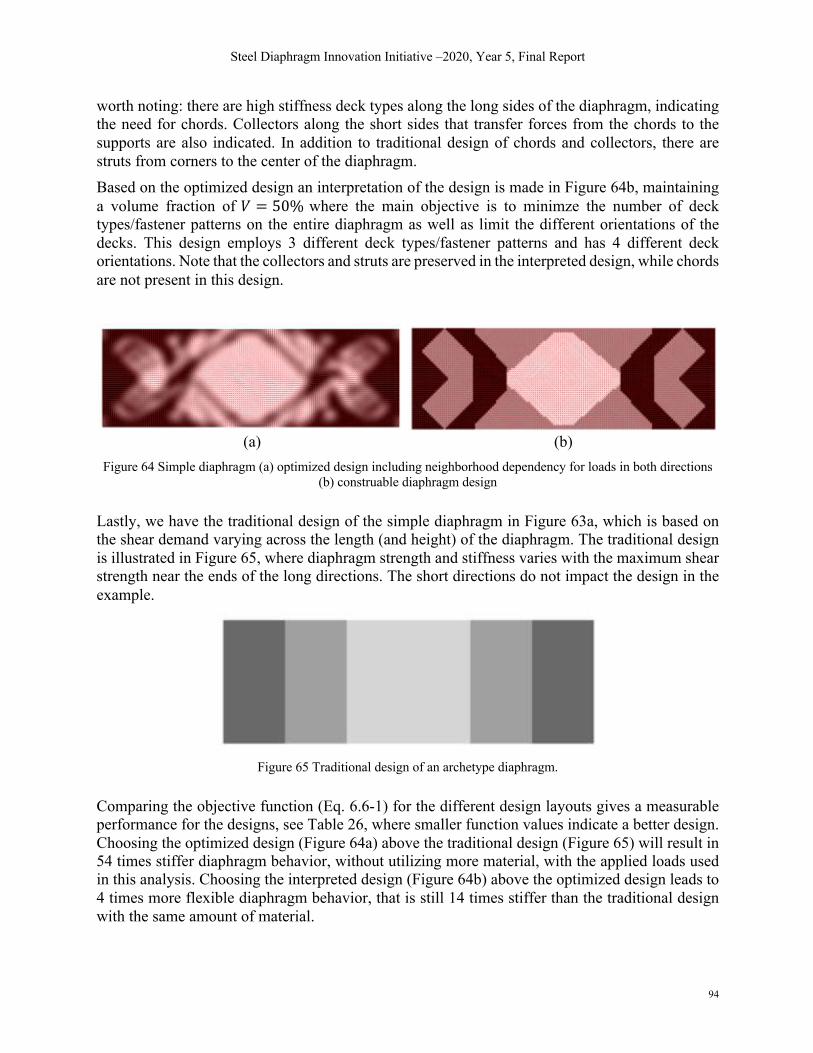
Steel Diaphragm Innovation Initiative –2020, Year 5, Final Report
94
worth noting: there are high stiffness deck types along the long sides of the diaphragm, indicating the need for chords. Collectors along the short sides that transfer forces from the chords to the supports are also indicated. In addition to traditional design of chords and collectors, there are struts from corners to the center of the diaphragm. Based on the optimized design an interpretation of the design is made in Figure 64b, maintaining a volume fraction of 5 = 50% where the main objective is to minimze the number of deck types/fastener patterns on the entire diaphragm as well as limit the different orientations of the decks. This design employs 3 different deck types/fastener patterns and has 4 different deck orientations. Note that the collectors and struts are preserved in the interpreted design, while chords are not present in this design.
(a)
(b)
Figure 64 Simple diaphragm (a) optimized design including neighborhood dependency for loads in both directions (b) construable diaphragm design
Lastly, we have the traditional design of the simple diaphragm in Figure 63a, which is based on the shear demand varying across the length (and height) of the diaphragm. The traditional design is illustrated in Figure 65, where diaphragm strength and stiffness varies with the maximum shear strength near the ends of the long directions. The short directions do not impact the design in the example.
Figure 65 Traditional design of an archetype diaphragm.
Comparing the objective function (Eq. 6.6-1) for the different design layouts gives a measurable performance for the designs, see Table 26, where smaller function values indicate a better design. Choosing the optimized design (Figure 64a) above the traditional design (Figure 65) will result in 54 times stiffer diaphragm behavior, without utilizing more material, with the applied loads used in this analysis. Choosing the interpreted design (Figure 64b) above the optimized design leads to 4 times more flexible diaphragm behavior, that is still 14 times stiffer than the traditional design with the same amount of material.

Steel Diaphragm Innovation Initiative –2020, Year 5, Final Report
95
6.7.1.2 Example – SDII Archetype with Cutout
Figure 66a is the SDII archetype example modified to now include an opening/cut-out in the diaphragm. The location of the opening is based on the bay spacing for the gravity system and could be interpreted as an atrium or other large opening. The cutout location does interfere with the strut structure indicated in Figure 64a for the solution without a cutout. The traditional design in Figure 66b is designed with a higher deck stiffness around the cutout to accommodate the larger shear stresses caused by the cutout. A lower deck stiffness is chosen for the rest of the diaphragm, compared to Figure 65, to maintain a 50% “volume fraction”. The optimized design (Figure 66c) has indication of a chord along the long sides of the diaphragm and collectors at the ends, similar to the optimized design in Figure 64a. And the end away from the cutout has struts going from the corners to the diaphragm center, similar to the ones in Figure 64a. The cutout results in struts all around the cutout to transfer forces from the chord to the support. The interpreted design in Figure 66d is reinforcing the cutout with stiff deck types orienting at 45° around the cutout and with a stiffer collector at the end away from the cutout. In between, low stiffness deck types are chosen with orientation beneficial to the diaphragm. This design is 4 times less stiff than the more complex optimized design (Figure 66c) but 9 times stiffer than the traditional design (Figure 66b).
(a)
(b)
(c)
(d)
Figure 66 Diaphragm example based on SDII archetype building models with cutout. a) diaphragm layout, b) classic design of diaphragm, c) freely optimized diaphragm, and d) interpreted optimized diaphragm design.
6.7.1.3 Example – Organic Shape with Perimeter Supports
An organic plan shaped building is subjected to investigation, to see how the deck placement and orientation can improve the overall stiffness of the diaphragm and explore the application of the methodology to more complex geometries. The lateral supports are located on the perimeter of this diaphragm, see Figure 67a, and the load is a function of the depth/width of the diaphragm.

Steel Diaphragm Innovation Initiative –2020, Year 5, Final Report
96
Visible in all three design layouts, traditional (Figure 67b), optimized (Figure 67c), and interpreted (Figure 67d) is a high demand for stiffness and strength along the entire perimeter. For the optimized and the interpreted designs, transfer “beams” are crossing the middle of the diaphragm. The optimized design is about 62 times stiffer than the traditional design and the interpreted design is about 15 times stiffer than the traditional design.
(a)
(b)
(c)
(d)
Figure 67 Diaphragm example based on an organic shape with supports at the boundary. a) diaphragm layout, b) classic design of diaphragm, c) freely optimized diaphragm, and d) interpreted optimized diaphragm design.
6.7.1.4 Example – Organic Shape with Internal Supports
Figure 68a illustrates the same organic shape with internal lateral supports for the diaphragm. If framed in steel such organic shapes usually still have a rectilinear framing plan internally and thus the vertical lateral force resisting systems are likely internal, and not only on the perimeter. The change of support locations changes the optimized design considerably from Figure 67c to Figure 68c. The optimized design in Figure 68c demands more stiffness near the internal supports and less stiffness at boundary, this feature is preserved in the interpreted design in Figure 68d. The traditional design in Figure 68b has a low shear demand cross the domain due to the location of the supports, this results in an almost uniform design with highest demands at the support locations. The interpreted design is about 10 times stiffer than the traditional design in Figure 68b. The optimized design is about 88 times stiffer than the traditional design.

Steel Diaphragm Innovation Initiative –2020, Year 5, Final Report
97
a)
b)
c)
d)
Figure 68 Diaphragm example based on an organic shape with internal supports. a) diaphragm layout, b) classic design of diaphragm, c) freely optimized diaphragm, and d) interpreted optimized diaphragm design.
The topology optimization solutions provided here suggest, particularly for roofs, that unconventional roof framing and deck layouts could lead to significant improvements for in-plane resistance. This work will be further detailed in 2021 in Fischer’s Ph.D. thesis and forthcoming journal articles.
Steel Diaphragm Innovation Initiative –2020, Year 5, Final Report
98
7 Conclusions SDII has been a unique partnership between industry, academia, and government that provided significant benefits and output for all parties involved. Now at the end of Year 5, with only a no cost extension remaining on limited activities in 2021, we can already see how the research developed by the team has had, and will continue to have, significant impact on the nation’s codes and standards. As summarized herein, passed and in-process ballots during the SDII efforts impacting the following standards: NEHRP, ASCE 7, ASCE 41, AISC 342, AISC 341, AISC 360, AISI S310, and AISI S400. These efforts expanded the capabilities of structural engineers to successfully employ steel in seismic diaphragm systems in essentially any situation. Underpinning the activities in codes and standards was a robust team of researchers that advanced our knowledge through experiments and modeling, and focused on innovations in steel diaphragm systems. Experiments at SDII even in Year 5 have added substantially to our knowledge of the cyclic performance of concrete-filled steel deck diaphragms. At the 2019 SDII workshop reinforced concrete-filled steel deck diaphragm performance was brought under question. Already SDII tests are showing the benefits of such reinforcement – along with challenges such as new limits states and greater attention needed to perimeter details. Engineering design will be appreciably improved through this SDII research well into the next code cycle as well. The modern development of seismic standards relies extensively on simulations to examine the adequacy of proposed design methods. Such simulations must be able to incorporate all expected nonlinearities to collapse if an efficient prediction of seismic response is desired. To this end, the SDII team expanded its building archetype designs, and the related building simulations. Having now performed 1000’s of nonlinear time history analyses of 3D steel buildings we can observe key interactions between vertical and horizontal lateral force resisting systems, and have validated the alternative diaphragm design procedure with Rs=2.0 for concrete-filled steel deck and Rs=2.5 for bare steel deck in buckling restrained braced frames and concentric braced frames. Our modeling has opened up new avenues of inquiry for seismic 3D building performance, and provides a solid means to help advance our understanding of buildings where both the vertical lateral force resisting system and the diaphragm compete in the response. SDII delivered impactful changes for current design and re-seeded the fields to provide for a successful future for steel diaphragm systems. The team is proud of its work and enjoyed sharing findings with sponsors, fellow researchers, standards committees, engineers, and wider audiences. We look forward to transitioning the SDII effort to technology transfer as engineers can now take advantage of the advances secured in next and future editions of our codes and standards.

Steel Diaphragm Innovation Initiative –2020, Year 5, Final Report
99
8 Acknowledgments The SDII team would like to thank its sponsors: AISI, AISC, SDI, SJI, MBMA and NSF. Further, we would like to thank staff and support of these organizations for their assistance with Industry Steering Group meetings, BSSC meetings, ASCE 7 meetings and the like. Also, several undergraduates and other students at Virginia Tech, Northeastern, and Johns Hopkins have participated in small aspects of the project but also are not formally on the SDII team – their work and efforts are also appreciated. Any typos, opinions, findings, recommendations or other material within are those of the authors and do not necessarily reflect the views of the sponsors.
References Note, codes and standards are generally referenced by their ANSI designation, but not all formally listed in references. ABK (1981), Methodology for Mitigation of Seismic Hazards in Existing Unreinforced Masonry Buildings:
Diaphragm Testing, Topical Report 09, Report Number ABK-TR-03, December 1981 ASCE 7-16, "Minimum Design Loads and Associated Criteria for Buildings and Other Structures," American Society
of Civil Engineers, Reston, Virginia, 2016. Avellaneda Ramirez, R.E., Easterling, W. S., Schafer, B.W., Hajjar, J.F., and Eatherton, M.R. (2019) “Cyclic Testing
of Composite Concrete on Steel deck Diaphragms Undergoing Diagonal Tension Cracking”, 12th Canadian Conference on Earthquake Engineering, Chateau Frontenac, Quebec, QC.
Bendsøe, M. & Sigmund, O., 2002. Topology Optimization - Theory, Methods and Applications, s.l.: Springer Verlag. Canadian Standards Association (2014). CSA S16: 19, Design of Steel Structures, Toronto, Canada. Chen, C. H., & Mahin, S. (2010). Example collapse performance evaluation of steel concentrically braced systems.
In 9th US National and 10th Canadian Conference on Earthquake Engineering 2010, Including Papers from the 4th International Tsunami Symposium (pp. 3976-3985).
Davies, J.M. and J. Fisher (1979) “The Diaphragm Action of Composite Slabs” Proceedings of the Inst. of Civil Engineers, Part 2, Vol. 67, pp. 891-906.
Easterling, W. S., Gibbings, D. R., and Murray, T. M. (1993). “Strength of Shear Studs in Steel Deck on Composite Beams and Joists.” Engineering Journal, AISC, 30(2), 44-55.
EN 1994-1-1 (2004) (English): Eurocode 4: Design of composite steel and concrete structures – Part 1-1: General rules and rules for buildings [Authority: The European Union Per Regulation 305/2011, Directive 98/34/EC, Directive 2004/18/EC]
Ernst, S. (2006). “Factors Affecting the Behaviour of the Shear Connection of Steel-Concrete Composite Beams.” Thesis, Sydney, Australia.
Essa, H. S., Tremblay, R., & Rogers, C. A. (2003). Behavior of roof deck diaphragms under quasistatic cyclic loading. Journal of Structural Engineering, 129(12), 1658-1666.
Fell, B.V., Kanvinde, A.M., Deierlein, G.G., Myers, A.T. (2009). “Experimental investigation of inelastic cyclic buckling and fracture of steel braces.” Journal of structural engineering, 135(1) 19-32.
FEMA P-1026, "Seismic Design of Rigid Wall-Flexible Diaphragm Buildings: An Alternate Procedure," Federal Emergency Management Agency, Washington, DC, 2015.
Foroughi, H., Ji, C., Schafer, B.W., Moen, C.D. (2018) “Strength and stiffness of metal building rod brace anchor connections” CFSRC Report, 2018-01. http://jhir.library.jhu.edu/handle/1774.2/58584
Foroughi, H., Schafer, B.W., Torabian, S., Eatherton, M.R. (2020) “Seismic Behavior of Steel SCBF Buildings Including Consideration of Diaphragm Inelasticity.”, CFSRC Report, (Under Preparation).
Foroughi, H., Schafer, B.W., Torabian, S., Eatherton, M.R. (2021) “Seismic Behavior of Steel SCBF Buildings Including Consideration of Diaphragm Inelasticity.”, CFSRC Report, (Under Preparation).
Gargari, M. M. (2016). “Development of Novel Computational Simulation Tools to Capture the Hysteretic Response and Failure of Reinforced Concrete Structures under Seismic Loads” (Doctoral dissertation). Retrieved from Virginia Polytechnic Institute and State University Doctoral Dissertations Collection. [13144].
Guest, J., 2009. Topology Optimization with Multiple Phase Projection. Computational Methods Applied Mechanical Engineering, pp. 123-135.

Steel Diaphragm Innovation Initiative –2020, Year 5, Final Report
100
Hsiao, P. C., Lehman, D. E., & Roeder, C. W. (2013). Evaluation of the response modification coefficient and collapse potential of special concentrically braced frames. Earthquake engineering & structural dynamics, 42(10), 1547-1564.
Imran, I., and Pantazopoulou, S. J. (1996). "Experimental Study of Plain Concrete under Triaxial Stress." ACI
Materials Journal 93.6 (1996): 589-601. Web. Imran, I., and Pantazopoulou, S. J. (2001). “Plasticity model for concrete under triaxial compression.” Journal of
Engineering Mechanics, 127(3), 281-290. Jayas, B. S., and Hosain, M. U. (1989). “Behavior of Headed Studs in Composite Beams: Full-Size Tests.” Can. J.
Civ. Eng., 16(5), 712-724. Johnson, R. P., and Yuan, H. (1997). “Resistance of Stud Shear Connectors in Troughs of Profiled Sheeting.”
Research Report CE 55, February, University of Warwick, U.K. Lawson, R. M., Aggelopoulos, E., Obiala, R., Hanus, F., Odenbreit, C., Nellinger, S., … Sheehan, T. (2017).
“Development of Improved Shear Connection Rules in Composite Beams (DISCCO).” European Commission. https://doi.org/10.2777/1186
Lim, O. K., Choi, S., Kang, S., Kwon, M., & Choi, J. Y. (2020). “Fire performance of headed shear studs in profiled steel sheeting.” Journal of Constructional Steel Research, 164, 105791. https://doi.org/10.1016/j.jcsr.2019.105791
Lloyd, R. M., and Wright, H. D. (1990). “Shear Connection Between Composite Slabs and Steel Beams.” J. Construct. Steel Research, 15(2), 255-285.
Luttrell, L., Mattingly, J., Schultz, W., and Sputo, T., (2015). Steel Deck Institute diaphragm design manual - 4th Edition, (DDM04). Glenshaw, Pennsylvania.
Luttrell, L.D. (1971), “Shear Diaphragms with Lightweight Concrete Fill,” International Specialty Conference on
Cold-Formed Steel Structures, Rolla, MO. Lyons, J. C., Easterling, W. S. and Murray, T. M. (1994). “Strength of Welded Shear Studs.” Report No. CE/VPI-
ST 94/07. Virginia Polytechnic Institute and State University, Blacksburg, VA. Ma, X., Borchers, Pena, A., Krawinkler, Deierlein, G. (2010). Design and behavior of steel shear plates with openings
as energy-dissipating fuses. John A. Blume Earthquake Engineering Center Technical Report,(173). Maekawa, K., Pinanmas, A., Okamura, H. (2003). Nonlinear mechanics of reinforced concrete, Spon Press, New
York, NY. Martin, É. (2002). Inelastic response of steel roof deck diaphragms under simulated dynamically applied seismic
loading. Master’s thesis, Ecole Polytechnique de Montreal. Moharrami, M., and Koutromanos, I. (2016). “Triaxial Constitutive Model for Concrete under Cyclic Loading.”
Journal of Structural Engineering, 142(7), 4016039. O'Brien, P., Eatherton, M. R., & Easterling, W. S. (2017). “Characterizing the load-deformation behavior of steel deck
diaphragms using past test data.” CFSRC Report, https://jscholarship.library.jhu.edu/handle/1774.2/40633 Ollgaard, J. G., Slutter, R. G., Fisher, J. W., “Shear strength of stud connectors in lightweight and normal weight
concrete.” Engineering Journal, AISC, 8(2), 55-64. Padilla-Llano David A., Hajjar Jerome F., Eatherton Matthew R and Schafer Benjamin W. (2018), “Cyclic fracture
simulation framework for modeling collapse in steel structures”, Eleventh U.S. National Conference on Popov, E. P., Black, R. G. (1981). “Steel struts under severe cyclic loadings.”, Journal of the Structural Division,
107(9) 1857-1881. Porter, M.L. and Greimann, L.F. (1980), Seismic Resistance of Composite Floor Diaphragms, Final Report, ISU-ERI-
Ames-80133, Project 1270, Engineering Research Institute Report, Iowa State University. Porter, M.L. and W.S. Easterling (1988), “Behavior, Analysis, and Design of Steel-Deck-Reinforced Concrete
Diaphragms,” Final Report, ISU-ERI-Ames-88305, Project 1636, Engineering Research Institute Report, Iowa State University.
Rambo-Roddenberry, M. D., and Easterling, W. S. (2002). “Behavior and Strength of Welded Stud Shear Connectors.” dissertation, Blacksburg, VA.
Roddenberry, M.R., Lyons, J.C., Easterling, W.S. and Murray, T.M. (2002b), “Performance and Strength of Welded Shear Studs,” Composite Construction in Steel and Concrete IV,J.F. Hajjar, M. Hosain, W.S. Easterling and B.M. Shahrooz (eds.), ASCE, Reston, VA, pp.458–469.
Sandler, S. and D. Rubin (1979), "An Algorithm and a Modular Subroutine for the Cap Model”. International Journal for Numerical and Analytical Methods in Geomechanics, Vol 3.173-186 (1979)
Sandler, S., DiMaggio, L., and Baladi, Y. (1971), “A Generalized Cap Model for Geological Materials”. National Technical Information Service U. S. Department of Commerce, Report Num. DNA 3143T
Schafer, B.W. (2019). Research on the Seismic Performance of Rigid Wall Flexible Diaphragm Buildings with Bare Steel Deck Diaphragms. CFSRC Report. R-2019- 02 ttp://jhir.library.jhu.edu/handle/1774.2/60360.
Steel Diaphragm Innovation Initiative –2020, Year 5, Final Report
101
Schafer, B.W., Easterling, W.S., Sabelli, R., Eatherton, M.R., Hajjar, J.F. (2019). “Steel Diaphragm Innovation Initiative Workshop Report.” CFSRC-R-2019-03. http://jhir.library.jhu.edu/handle/1774.2/60359.
Smith, C., Deierlein, G., Kanvinde, A. (2014). A Stress-Weighted Damage Model for Ductile Fracture Initiation in Structural Steel Under Cyclic Loading and Generalized Stress States. John A. Blume Earthquake Engineering Technical Report 187. Stanford Digital Repository, 2014.
Steel Construction Manual Fifteenth Edition, (2015). American Institute of Steel Construction, Chicago, IL. Sublett, C. N., Easterling, W. S. and Murray, T. M. (1992). “Strength of Welded Headed Studs in Ribbed Metal Deck
on Composite Joists.” Report No. CE/VPI-ST 92-03. Virginia Polytechnic Institute and State University, Blacksburg, VA.
Svandberg, K., 1987. The method of moving asymptotes—a new method for structural optimization, s.l.: Int. J. Numer. Methods Eng., 24, 359–373.
Torabian, S., Eatherton, M.R., Easterling, W.S., Hajjar, J.F., Schafer, B.W. (2019). “SDII Building Archetype Design v2.0” CFSRC-R-2019-04. http://jhir.library.jhu.edu/handle/1774.2/62106.
Wei, G., Schafer, B. W., Seek, M., & Eatherton, M. R. (2020a). “Experimental Study on the in-plane behavior of standing seam roof assembly and its use in lateral bracing of rafters.” CFSRC Report, https://jscholarship.library.jhu.edu/handle/1774.2/62114
Wei, G., Eatherton, M.R., Schafer, B.W. (2020b). “2020)” Seismic Behavior of Steel BRBF Buildings Including Consideration of Diaphragm Inelasticity”, CFSRC Report R-2020-04, http://jhir.library.jhu.edu/handle/1774.2/62366
Xia, Y. and M. Friswell (2012). "Equivalent Models of Corrugated Panels," International Journal of Solids and Structures, 49, 1453-1462, 2012
Re
se
arc
h R
ep
ort
RP
-21
-04
American Iron and Steel Institute
25 Massachusetts Avenue, NW
Suite 800
Washington, DC 20001
www.steel.org