Embed Size (px)
Citation preview

Scientific, Technical and Economic Committee for Fisheries (STECF)
Review of scientific advice for 2015 -
part I Advice on stocks in the Baltic Sea
(STECF-14-10)
This report was reviewed by the STECF by written procedure in June 2014
Edited by Tiit Raid & Hendrik Doerner
Report EUR 26669 EN

European Commission
Joint Research Centre
Institute for the Protection and Security of the Citizen
Contact information
STECF secretariat
Address: Maritime Affairs Unit, Via Enrico Fermi 2749, 21027 Ispra VA, Italy
E-mail: [email protected]
Tel.: 0039 0332 789343
Fax: 0039 0332 789658
https://stecf.jrc.ec.europa.eu/home http://ipsc.jrc.ec.europa.eu/ http://www.jrc.ec.europa.eu/
Legal Notice
Neither the European Commission nor any person acting on behalf of the Commission is responsible for the use which might be made of this publication.
This report does not necessarily reflect the view of the European Commission and in no way anticipates the Commission’s future policy in this area.
Europe Direct is a service to help you find answers to your questions about the European Union
Freephone number (*): 00 800 6 7 8 9 10 11
(*) Certain mobile telephone operators do not allow access to 00 800 numbers or these calls may be billed.
A great deal of additional information on the European Union is available on the Internet. It can be accessed through the Europa server http://europa.eu/
JRC 90504
EUR 26669 EN
ISBN 978-92-79-38470-7
ISSN 1831-9424
doi:10.2788/83919
Luxembourg: Publications Office of the European Union, 2014
© European Union, 2014
Reproduction is authorised provided the source is acknowledged
How to cite this report: Scientific, Technical and Economic Committee for Fisheries (STECF) – Review of scientific advice for 2015 - part I - Advice on stocks in the Baltic Sea (STECF-14-10). 2014. Publications Office of the European Union, Luxembourg, EUR 26669 EN, JRC 90504, 41 pp.
Printed in Italy

- 3 -
SCIENTIFIC, TECHNICAL AND ECONOMIC COMMITTEE FOR FI SHERIES (STECF)
Review of scientific advice for 2015 - part I
Advice on stocks in the Baltic Sea (STECF-14-10)
THIS REPORT WAS ISSUED BY WRITTEN PROCEDURE IN JUNE 2014
Table of Contents
1. Background ................................................................................................................... 5
2. Terms of reference ........................................................................................................ 5
3. Introduction ................................................................................................................... 6
4. STECF Review of ICES Advice on Resources in the Baltic Sea ................................. 6
4.1. Brill (Scophthalmus rhombus) in the 3Baltic Sea (Subdivisions 22-32) ...................... 6
4.2. Cod (Gadus morhua) in the Baltic Sea (Subdivisions 22-24) ...................................... 7
4.3. Cod (Gadus morhua) in the Baltic Sea (Subdivisions 25-32) ...................................... 9
4.4. Dab (Limanda limanda) in the Baltic Sea (Subdivisions 22-32) ................................ 12
4.5. Flounder (Platichthys flesus) – IIIbcd (EU zone), Baltic Sea ..................................... 13
4.5.1.4.5.1.4.5.1.4.5.1. Flounder in Subdivisions 22 and 23 (Belts and Sound).............................................. 13
4.5.2.4.5.2.4.5.2.4.5.2. Flounder in Subdivisions 24–25 (Southern Baltic Sea) .............................................. 14
4.5.3.4.5.3.4.5.3.4.5.3. Flounder in Subdivisions 26 and 28 (Eastern Gotland and Gulf of Gdansk) ............. 16
4.5.4.4.5.4.4.5.4.4.5.4. Flounder in Subdivisions 27 and 29–32 (Northern Baltic Sea) .................................. 17
4.6. Herring (Clupea harengus) in Divisions IIIbcd, Baltic Sea ....................................... 18
4.6.1.4.6.1.4.6.1.4.6.1. Herring (clupea harengus) in Division IIIa and Subdivision 22 – 24. ........................ 19
4.6.2.4.6.2.4.6.2.4.6.2. Herring (Clupea harengus) in Subdivisions 25-29 (excluding Gulf of Riga) and 32. 21
4.6.3.4.6.3.4.6.3.4.6.3. Herring (Clupea harengus) in the Gulf of Riga. ......................................................... 23
4.6.4.4.6.4.4.6.4.4.6.4. Herring (Clupea harengus) in Subdivision 30, Bothnian Sea ..................................... 25
4.6.5.4.6.5.4.6.5.4.6.5. Herring (Clupea harengus) in Subdivsion. 31 ............................................................ 26
4.7. Plaice (Pleuronectes platessa) in the Baltic Sea (Subdivisions 22-32) ...................... 27
4.7.1.4.7.1.4.7.1.4.7.1. Plaice (Pleuronectes platessa) in the Kattegat and subdivisions 22 and 23. ............... 27
4.7.2.4.7.2.4.7.2.4.7.2. Plaice (Pleuronectes platessa) in subdivisions 24 to 32. ............................................. 29
- 4 -
4.7.3.4.7.3.4.7.3.4.7.3. Advice for plaice (Pleuronectes platessa) in subdivisions 22 to 32. ........................... 30
4.8. Salmon (Salmo salar) in the Baltic Sea, Div. IIIb,c,d (Main Basin and Gulf of Bothnia, Sub-div. 22-31) ........................................................................................................... 31
4.9. Salmon (Salmo salar) in the Baltic Sea, Gulf of Finland (Sub-div. 32) ..................... 33
4.10. Sea trout (Salmo trutta) in the Baltic Sea (Sub-div. 22-32)........................................ 34
4.11. Sprat (Sprattus sprattus) in IIIbcd, Baltic Sea (Sub-div. 22-32) ................................ 35
4.12. Turbot (Psetta maxima) in the Baltic Sea (Subdivisions 22-32) ................................ 37
5. List of STECF members ............................................................................................. 38
- 5 -
1.1.1.1. BACKGROUND
According to Article 2 of Commission Decision 629 of 26 August 2005 establishing a Scientific, Technical and Economic Committee for Fisheries, STECF shall provide annual advice on the situation of fishery resources relevant to the EU. The first part of the stock advice focuses on stocks and associated fisheries in the Baltic Sea.
2.2.2.2. TERMS OF REFERENCE
The STECF is requested to review and comment on the scientific advice for the Baltic Sea stocks released by ICES in 2014 in particular for the stocks specified below. The text of previous STECF reviews of stocks for which no updated advice is available shall be retained in the report in order to facilitate easy reference and consultation.
STECF is requested, in particular, to highlight any inconsistencies between the assessment results and the advice delivered by the scientific advisory committees of ICES.
As regards advice for the Baltic stocks, STECF is requested to advise on:
(a) commercial catch levels for 2015excluding the share of the Russian Federation for the stocks concerned that, based on single stock assessments, result in a fishing mortality rate that restores and maintains all stocks above levels capable of producing MSY by 2015. The catch levels for stocks subject to the landing obligation should reflect the catches instead of landings. Those stocks for which catch levels are advised shall be clearly mentioned;
(b) possible changes to the commercial catch levels referred to in a) by taking into account biological interactions among the stocks, and;
(c) possible spatial measures supporting the MSY objectives taking into account the biological interactions between the stocks concerned;
(d) effort levels expressed in number of days-at-sea in cod fishery, as well as other measures to protect cod spawners within certain subdivisions.
In the absence of appropriate scientific criteria or analyses, STECF should advise on the catch levels that are predicted to maintain stocks above the previously-defined Bpa levels.
It has been agreed between the DG Mare and the STECF that the opinion of the STECF plenary on scientific advice to be reviewed for Baltic Sea stocks will be delivered through a written procedure and should have to be provided to the Commission by 6 June 2014.
Baltic Sea stocks o Stocks of
� Cod in subdivisions 22-24

- 6 -
� Cod in subdivisions 25-32 � Herring in ICES division IIIa & subdivisions 22-24 � Herring in subdivisions 25-29 (excluding Gulf of Riga) & 32 � Herring in the Gulf of Riga � Herring in subdivision 30 (Bothnian Sea) � Herring in subdivision 31 (Bothnian Bay) � Sprat in subdivisions 22-32 � Flounder � Plaice in subdivisions 22-32 � Dab � Turbot in subdivisions 22-32 � Brill in subdivisions 22-32 � Salmon in subdivisions 22-31 (Main basin & Gulf of Riga) � Salmon in subdivision 32 (Gulf of Finland) � Sea trout
3.3.3.3. INTRODUCTION
This report represents the STECF review of advice for stocks of interest to the European Union in the Baltic Sea.
In undertaking the review, STECF has consulted the most recent reports on stock assessments and advice from ICES and has attempted to summarise them in a common format.
For data-limited stocks for which an abundance index is available, ICES has used a harvest control rule based on an index-adjusted status quo catch to provide catch advice for 2015. The advice is based on a comparison of the two most recent index values with the three preceding values, combined with recent catch or landings data.
Regarding the requested to advice on commercial catch levels for 2015 excluding the share of the Russian Federation for the stocks concerned STECF notes that Russia and EU in 2010 agreed on the sharing of the TAC’s for salmon and sprat. STECF has for these stocks provided catch options excluding the Russian share. For the other shared stocks STECF has no information on the Russian quotas for 2015 and has therefore not been able to advice on the catch levels excluding the Russian share.
As a result of the introduction of the landing obligation in the Baltic Sea with effect from 1 January 2015, ICES has introduced two new terms to its catch advice; wanted catch and unwanted catch. “Wanted catch” is used to describe fish that would be landed in the absence of the EU landing obligation. “Unwanted catch” refers to the component that was previously discarded..
This report was prepared in draft under ad hoc contract and reviewed by the STECF by written procedure. STECF acknowledges the efforts of contracted experts Tiit Raid and Ari Leskelä in preparing the draft report for review.
4.4.4.4. STECF REVIEW OF ICES ADVICE ON RESOURCES IN THE BALTIC SEA
4.1.4.1.4.1.4.1. Brill ( Scophthalmus rhombus) in the 3Baltic Sea (Subdivisions 22-32)
FISHERIES: The brill fishery is carried out mainly by Denmark in Subdivision 22. Total reported landings have fluctuated between 1 and 160 t.

- 7 -
SOURCE OF MANAGEMENT ADVICE: The management advisory body is ICES.
REFERENCE POINTS: There are no reference points proposed for brill in the Baltic.
STOCK STATUS:
The survey data indicate an increasing trend in stock size in 2009- 2011, but low stock size in 2012-2013. The average stock size indicator (number hour–1) in the last two years (2012–2013) has decreased by 41% from the value of the three previous years (2009–2011).
MANAGEMENT AGREEMENT: No management objectives have been defined for this stock.
RECENT MANAGEMENT ADVICE: New data (landings and survey) available for this stock do not change the perception of the stock. Therefore, the advice for this fishery in 2015 is the same as the advice for 2014 (see ICES, 2013): “Based on ICES approach to data-limited stocks, ICES advises that catches should be no more than 29 tonnes. All catches are assumed to be landed.”
Additional considerations: The advice is based on a combined abundance index from two surveys, used as an indicator of stock size. The uncertainty associated with the index values is not available, but the index is considered uncertain due to the low catch rate in the surveys.
STECF COMMENTS: STECF agrees with the ICES advice.
4.2.4.2.4.2.4.2. Cod (Gadus morhua) in the Baltic Sea (Subdivisions 22-24)
FISHERIES: Cod in the Western Baltic (Subdivisions 22-24) is exploited predominantly by Denmark and Germany, with smaller catches taken by Sweden and Poland. The main part of the catch is taken by trawls and gillnets. Western Baltic cod is usually taken in mixed demersal fisheries. In Subdivision 22, different flatfish species (flounder, plaice, dab, and turbot) are caught together with cod; in Subdivision 24, flounder is the main by-catch species, at least in some periods. Landings have in recent years been between 14,000 and 24,000 t with the lowest value of the time series in 2010. Total catch in 2013 is estimated to 17,500 t. of which 13,000 t where commercial landings, 2,100 t discards and 2,300 t recreational catch.
SOURCE OF MANAGEMENT ADVICE: The main management advisory body is ICES. The advice is based on an age-based assessment using commercial as well as survey data using the SAM assessment model.
REFERENCE POINTS:
(last changed in: 2013)
MANAGEMENT AGREEMENT: The EC agreed on a management plan for cod in the Baltic Sea in September 2007 (EC 1098/2007). For Western Baltic cod the aim is to reach a fishing mortality rate at levels no lower than 0.6. This should be reached by fixing the TAC consistent with

- 8 -
an annual reduction in F by 10% and by annually reducing the total number of days a vessel can fish in the area by 10 % until the target F of 0.6 has been reached. The plan sets a maximum change of 15% of the TAC between consecutive years, unless the fishing mortality is estimated to be higher than 1. In addition to the rules for setting the TAC and fishing effort the plan includes a number of control provisions and only two types of trawls (since January 2010: BACOMA with 120 mm square mesh panel and T90 with 120 mm mesh) are allowed in the cod trawl fishery. High-grading is prohibited in all Baltic fisheries since January 2010.
STOCK STATUS:
Fishing pressure 2011 2012 2013
MSY (FMSY) Above target Precautionary approach (Fpa,Flim) Undefined
Management plan (FMGT ) Above target
Stock size 2012 2013 2014
MSY (Btrigger) Below trigger Precautionary approach (Bpa,Blim) Increased risk
Management plan (SSBMGT ) Undefined
SSB has been relatively stable since 2000, and mostly below Bpa. F (reference age range 3–5) in 2013 is estimated to be above FMSY. The 2012 and 2013 year-classes are above the estimates for 2004-2011 year classes and still below the long term average.
RECENT MANAGEMENT ADVICE:
ICES advises on the basis of the MSY approach that the total commercial catches should be no more than 8,793 tonnes in 2015. Measures should be implemented to protect the local spawners in Subdivision 22.
Management plan approach: Following the agreed EU management plan implies a reduction of 10% in total fishing mortality, when fishing mortality is above 0.6, which corresponds to a total F of 0.77. Applying ICES standard forecast approach this corresponds to a TAC (commercial catch) of 21,037 tonnes in 2015. Assuming that the unwanted catches and recreational fisheries rates remain unchanged from the average value in 2011–2013, this implies commercial wanted catches of 19,140 tonnes. This is expected to lead to an SSB of 50,736 tonnes in 2016. Due to the risk of having overestimated the fishing possibilities in the outlook for 2015 (and subsequent years) ICES does not consider the plan is precautionary and is basing the advice on the MSY approach and not on the management plan. Following the long-term target of the agreed EU management plan (F = 0.6), corresponds to a TAC (commercial catch) of 17,065 tonnes in 2015. Given that the unwanted catches and recreational fisheries rates remain unchanged from the average value in 2011–2013, this implies commercial wanted catches of 15,546 tonnes. This is expected to lead to an SSB of 54,566 tonnes on 2016.
MSY approach: Following the ICES MSY approach implies fishing mortality to be reduced to FMSY (0.26). This is estimated to result in total catches of no more than 10 196 tonnes in 2015 using ICES standard catch forecast approach. This is expected to lead to an SSB of 62,797 tonnes in 2016.

- 9 -
Assuming that the unwanted catches and recreational fisheries rates remain unchanged from the average value in 2011–2013, this implies commercial wanted catches of no more than 8010 tonnes and total commercial catch of no more than 8,793 tonnes. Because of the likely overestimation of catches in the outlook for 2015 it is likely that the resulting F following a total catch of 10,196 tonnes in 2015 will be higher than 0.26. ICES, however, considers that the advised catch will result in a reduction in F relative to the current F.
Precautionary approach: As there is no Fpa defined for this stock, the catch corresponding to the precautionary approach cannot be calculated. Bpa is 36,400 tonnes, and all options in the outlook table will result in an SSB above Bpa in 2016.
Additional considerations. Different reproductive units in Subdivision 22 and 24 exist; the cod spawning in Subdivision 22 belongs to the western Baltic cod biological population while the cod in Subdivision 24 contains a mixture of cod of eastern and western origin. The following information suggests that to avoid concentration of the fishery in Subdivision 22 specific measures are needed to reduce the risk of local depletion of the western Baltic population spawning in Subdivision 22:
• The status of the population in Subdivision 22 has been poor for several years; • Cod in Subdivision 22 have higher mean weight and quality compared to cod in
Subdivision 24, and are therefore more attractive for the fisheries ; • The harvest rate (landings/ SSB) in Subdivision 22 has not shown a significant decline
since 2000 and is currently estimated higher than in Subdivision 24. ICES recommends reducing the catches in Subdivision 22, specifically at spawning time in the first quarter. There are several possible approaches to reducing fishing mortality for the spawners in Subdivision 22:
a) a temporal and spatial spawning closure in Subdivision 22, with the appropriate timing (i.e. February–April) and area (deeper than 20 m);
b) a separate (sub-)TAC for Subdivision 22 (as for the Downs component in North Sea herring);
c) additional effort restrictions in Subdivision 22.
STECF COMMENTS: STECF agrees with ICES advice that on the basis of the MSY approach total commercial catches should be no more than 8,793 t in 2015. STECF notes that the provisions of Council Regulation (EC) No 1098/2007 prescribe a target F of F=0.6 which implies a TAC (commercial catch) for 2015 of 17,065 t. If the unwanted catches and recreational fisheries rates remain unchanged from the average value in 2011-2013, this implies commercial wanted catches of 15,546 tonnes. This is expected to lead to an increase in SSB to 54,566 tonnes in 2016.
4.3.4.3.4.3.4.3. Cod (Gadus morhua) in the Baltic Sea (Subdivisions 25-32)
FISHERIES: Cod in the Eastern Baltic (Subdivisions 25-32) is exploited predominantly by Poland, Sweden, and Denmark, the remaining catches taken by Latvia, Lithuania, Russia, Germany, Finland, and Estonia. Cod is taken primarily by trawlers and gill-netters.
The reported landings for the years 1992–1995 are known to be incorrect due to incomplete reporting and these landings have therefore been estimated. In this period, unreported and misreported catches were between about 7% and 38% of reported landings.

- 10 -
Estimates are available for under reporting since 2000 from a range of industry and enforcement sources. These indicate that catches in 2000 to 2007 have been around 32 - 45% higher than the reported figures. Since 2008 unreported landings have been reduced to less than 7 % of reported landings. There is no indication of unreported landings in 2013. Landings have fluctuated between 42,000 t and 392,000 t over the whole time series, starting in 1965. Total catch in 2013 is estimated to 36,400 t, where 86% are landings (17% by gill-netters and long liners, 83% by trawlers) and 14% discards. SOURCE OF MANAGEMENT ADVICE: The main management advisory body is ICES. The advice is based on an age-based assessment using commercial and survey data.
REFERENCE POINTS:
(Last changed in: 2013)
MANAGEMENT AGREEMENT: The EC agreed on a management plan for cod in the Baltic Sea in September 2007. For Eastern Baltic cod the aim is to reach a fishing mortality rate no lower than 0.3. This should be reached by fixing the TAC consistent with an annual reduction in F by 10% and by annually reducing the total number of days a vessel can fish in the area by 10 % until the target F of 0.3 has been reached. The plan sets a maximum change of 15% of the TAC between consecutive years, unless the fishing mortality is estimated to be higher than 1.
In addition to the rules for setting the TAC and fishing effort the plan includes a number of control provisions and only two types of trawls (since March 2010: BACOMA with 120 mm square mesh panel and T90 with 120 mm mesh) are allowed in the cod trawl fishery. High-grading is prohibited in all Baltic fisheries since January 2010.
STOCK STATUS: Fishing pressure
2011–2013 MSY (FMSY) Unknown Precautionary approach (Fpa,Flim) Unknown
Qualitative evaluation Stable at low level
Stock size 2009–2014
MSY (Btrigger) Unknown Precautionary approach (Bpa,Blim) Unknown
Qualitative evaluation
Decreasing

- 11 -
Cpue from the Baltic International Trawl survey (BITS) of fish larger and equal to 30 cm are assumed as a proxy for SSB and have decreased since 2011. The average SSB proxy in the last two years (2013–2014) is 46% lower than the SSB index in the three previous years (2010–2012). The harvest rate has declined as is stable since 2009.
RECENT MANAGEMENT ADVICE : ICES advises on the basis of the data-limited approach that catches should be no more than 29,085 tonnes. ICES advises the implementation of a spatial management plan for the clupeid stocks in Subdivisions 25–26.
ICES approach to data-limited stocks: For stocks for which a biomass index is available, ICES uses as harvest control rule, an index-adjusted status quo catch. The advice is based on a comparison of the two most recent index values with the three preceding values, combined with recent catch or landings data. Knowledge about the exploitation status also influences the advised catch. For this stock, the spawning stock biomass index is estimated to have decreased by more than 20% between 2010–2012 (average of the three years) and 2013–2014 (average of the two years). This implies a decrease in catches of 20% in relation to last year’s (2013) catches (36,356 tonnes), corresponding to catches of no more than 29,085 tonnes in 2015. Assuming the same discard rates as last year, this implies wanted catches of no more than 25,071 tonnes. Taking the reduced growth into account, the estimated harvest rate (HR) is low compared to values from a decade ago. The HR also appears to be relatively stable and the estimated fishing effort for this stock does not show any significant trend; ICES therefore considers that there are no immediate concerns regarding the exploitation rate. Catches were substantially reduced last year (−39%), well below the advice, and this reduction will act in a similar way to the precautionary buffer. Due to both the low exploitation and recent 39% reduction in catch it is considered that an additional 20% precautionary buffer reduction is not required. The present advice is based on an assessment that ICES considers only as an interim solution.
Management plan: ICES has evaluated the management plan in 2009 and considers it to be in accordance with the precautionary approach. It should, however, be noted that there is a large difference between the FMSY and the target F in the management plan, regardless of the different reference age. ICES also notes that the agreed multi-annual plan was developed under the assumption of unchanged growth. The most recent information shows that this assumption is no longer valid. For that reason, ICES has not used the EU agreed multi-annual plan as basis for advice.
MSY approach: Not available Precautionary approach: Not available
Multispecies considerations: Fishing on the prey stocks herring and sprat will influence the food availability for cod and thereby the level of cod cannibalism and cod yield. Previously, the applied F for the prey species (in the range of 0.25–0.35; ICES, 2013b) was considered to only marginally affect the long-term yield of cod. In the absence of an analytical assessment for cod, ICES is unable to update this information. Additional considerations: No analytical assessment can be presented

- 12 -
for this stock. Therefore, no forecast can be presented and due to the perception of the stock having changed, ICES is in the process of benchmarking in the near future.
STECF COMMENTS: STECF agrees with ICES interim advice.
However, STECF notes that the basis for the 2015 advice has changed compared to previous years. This is due to a number of issues which makes the results of the 2014 analytical assessment particularly uncertain. ICES considers that one the main issue in the assessment is represented by inconsistencies in age reading and this will be tackled in autumn 2014 by an ad-hoc ICES initiative. The assessment results also indicate a large retrospective patterns for F and SSB, which renders them unsuitable as a basis for providing catch advice. Moreover, unexpected and sudden changes have been observed in the stock, notably poor growth and condition factor. Such changes are likely to impair the basic assumptions of traditional analytical assessment models such as catchability. Therefore, as an interim measure, ICES has adopted the data limited approach to providing advice for 2015.
STECF notes that ICES is likely to revisit the assessment later in 2014, which may result in different advice on catch levels for 2015 and that a benchmark assessment is also likely to be scheduled for 2015.
4.4.4.4.4.4.4.4. Dab (Limanda limanda) in the Baltic Sea (Subdivisions 22-32)
FISHERIES: The total landings of dab have been fluctuating between 1,000 t and 1,900 t. since 2003. Landings in 2013 were 1,384 t. Discards are known to take place and are considered substantial but could not be quantified. The highest landings are observed in Subdivision 22. The main dab landings are reported by Denmark (Subdivision 22 and 24) and Germany (mainly in Subdivision 22). The dab are mostly landed as by-catch in the directed cod fishery. The trawl fishery targeting dab was started in Subdivision 22 in 2003. SOURCE OF MANAGEMENT ADVICE: The management advisory body is ICES.
REFERENCE POINTS: No reference points are defined for dab in the Baltic.
STOCK STATUS:
Fishing pressure 2011–2013
MSY (FMSY) Unknown Precautionary approach (Fpa,Flim) Unknown
Qualitative evaluation Insufficient information
Stock size
2009–2013 MSY (Btrigger) Unknown Precautionary approach (Bpa,Blim) Unknown
Qualitative evaluation Stable at high level
The stock size indicator from surveys has increased by a factor of three since 2002. The average stock size indicator in the last two years (2012–2013) is 3% higher than in the three previous years (2009–2011). MANAGEMENT OBJECTIVES: No management objectives have been defined for this stock.

- 13 -
RECENT MANAGEMENT ADVICE: ICES advises on the basis of the data-limited approach, but cannot quantify the resulting catches. The implied landings should be no more than 1,428 tonnes. ICES approach to the data-limited stocks: For data-limited stocks for which a biomass index is available, ICES uses as harvest control rule an index-adjusted status-quo catch. The advice is based on a comparison of the two most recent index values with the three preceding values, combined with recent catch or landings data. Knowledge about the exploitation status also influences the advised catch. For this stock the biomass index is estimated to have increased by 3% between 2009–2011 (average of the three years) and 2012–2013 (average of the two years). This implies an increase of catches of at most 3% in relation to last year’s (2013) catches, corresponding to landings of no more than 1,428 tonnes. Considering that, even though exploitation status is unknown, the effort in the main fisheries has decreased (STECF, 2013, Figure 8.3.4.2). Furthermore, the biomass has increased three fold since 2002; therefore, no additional precautionary reduction is needed. Discards are known to be substantial but the data are insufficient to estimate a discard proportion that could be applied to give catch advice. STECF COMMENTS: STECF agrees with the ICES advice.
4.5.4.5.4.5.4.5. Flounder (Platichthys flesus) – IIIbcd (EU zone), Baltic Sea
This is the first time ICES gives advice for four flounder stocks: flounder in the Subdivisions 22-23; 24-25; 26-28, and 27-32. Previously, the ICES advice concerned the flounder in Subdivisions 22-32.
4.5.1.4.5.1.4.5.1.4.5.1. Flounder in Subdivisions 22 and 23 (Belts and Sound)
FISHERIES: ICES Subdivision 22 is the main fishing area for this stock with Denmark and Germany (50% and 49%, respectively) being the main fishing countries. Subdivision 23 is only of minor importance (around 10% of the total landings of the stock).
Flounder are caught mostly by trawlers and gill-netters. Active gears provide most of the landings in Subdivision 22 (ca. 70%). In Subdivision 23, passive gears provide around 85% of total flounder landings (for Swedish fleet 98-100%) in this area. Flounder is caught as a by-catch species in fisheries targeting cod (i.e. mostly trawlers) and in a mixed flatfish fishery (i.e. mostly gill-netters). Total catches (2013) are unknown, official landings 1454 t (mainly trawl gear). Discards are known to take place and are considered to be large but could not be quantified.
SOURCE OF MANAGEMENT ADVICE: The main management advisory body is ICES.
REFERENCE POINTS: No reference points have been proposed for the flounder stocks in the Baltic.
- 14 -
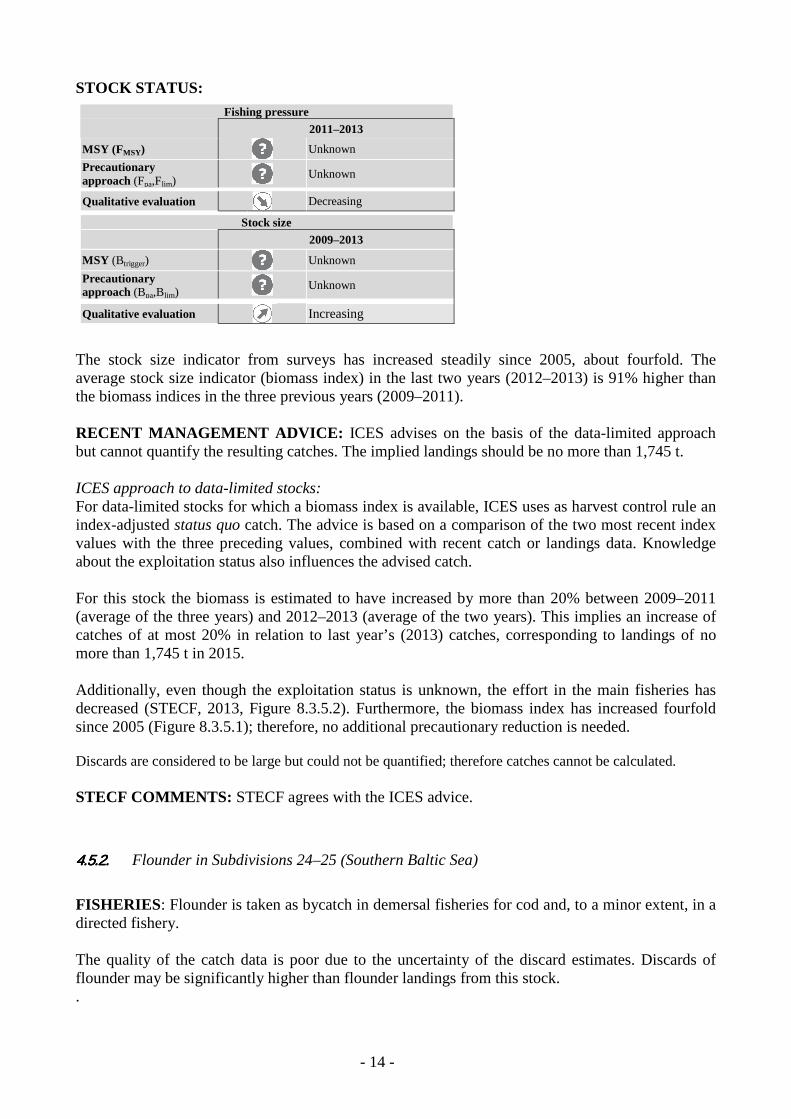
STOCK STATUS: Fishing pressure
2011–2013 MSY (FMSY) Unknown Precautionary approach (Fpa,Flim) Unknown
Qualitative evaluation Decreasing
Stock size 2009–2013
MSY (Btrigger) Unknown Precautionary approach (Bpa,Blim) Unknown
Qualitative evaluation Increasing
The stock size indicator from surveys has increased steadily since 2005, about fourfold. The average stock size indicator (biomass index) in the last two years (2012–2013) is 91% higher than the biomass indices in the three previous years (2009–2011). RECENT MANAGEMENT ADVICE: ICES advises on the basis of the data-limited approach but cannot quantify the resulting catches. The implied landings should be no more than 1,745 t. ICES approach to data-limited stocks: For data-limited stocks for which a biomass index is available, ICES uses as harvest control rule an index-adjusted status quo catch. The advice is based on a comparison of the two most recent index values with the three preceding values, combined with recent catch or landings data. Knowledge about the exploitation status also influences the advised catch. For this stock the biomass is estimated to have increased by more than 20% between 2009–2011 (average of the three years) and 2012–2013 (average of the two years). This implies an increase of catches of at most 20% in relation to last year’s (2013) catches, corresponding to landings of no more than 1,745 t in 2015. Additionally, even though the exploitation status is unknown, the effort in the main fisheries has decreased (STECF, 2013, Figure 8.3.5.2). Furthermore, the biomass index has increased fourfold since 2005 (Figure 8.3.5.1); therefore, no additional precautionary reduction is needed. Discards are considered to be large but could not be quantified; therefore catches cannot be calculated. STECF COMMENTS: STECF agrees with the ICES advice.
4.5.2.4.5.2.4.5.2.4.5.2. Flounder in Subdivisions 24–25 (Southern Baltic Sea)
FISHERIES: Flounder is taken as bycatch in demersal fisheries for cod and, to a minor extent, in a directed fishery. The quality of the catch data is poor due to the uncertainty of the discard estimates. Discards of flounder may be significantly higher than flounder landings from this stock. .
- 15 -
In the Subdivisions 24 and 25, Poland, Denmark and Germany are the main fishing nations. Polish contribution increased from the 90’s together with increase of total landings, and was in recent years about 80%. Flounder landings are dominated by active gears, taking in average 70% of total landings in both Subdivisions. Total catch (2013) is unknown. Official landings were 14,300 t (mainly demersal trawl fishery). Discards are known to take place and are considered substantial but could not be quantified. SOURCE OF MANAGEMENT ADVICE: The main management advisory body is ICES.
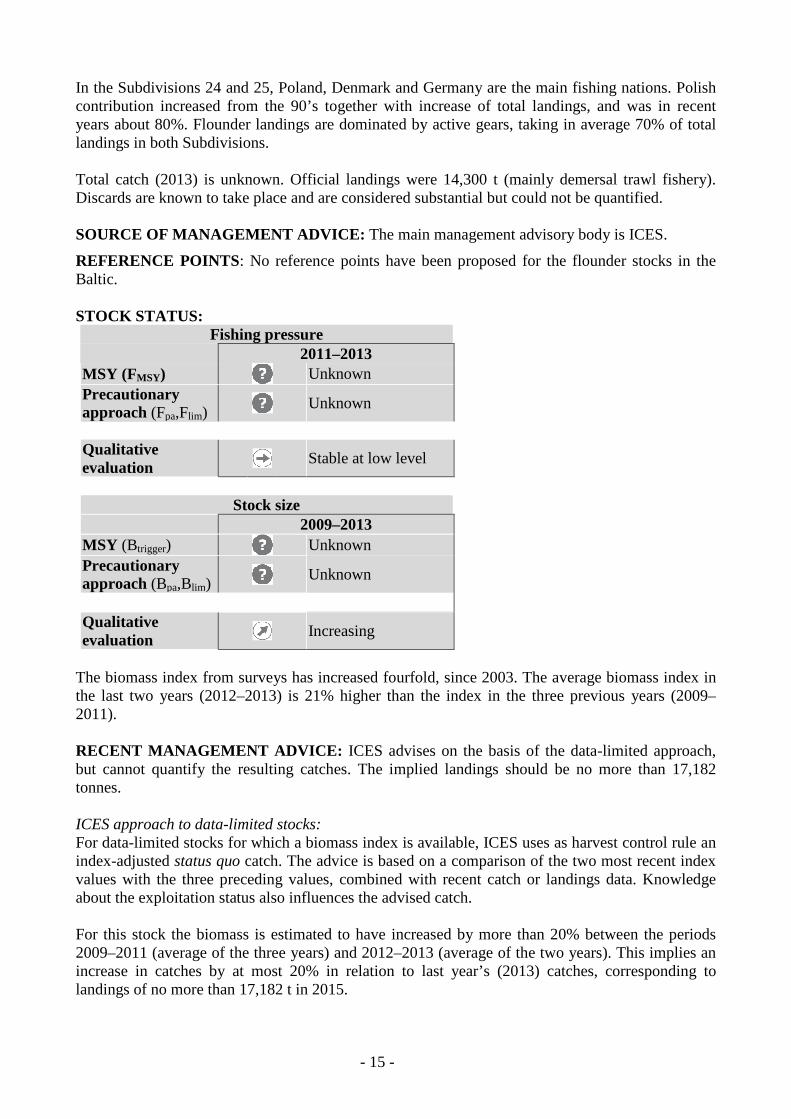
REFERENCE POINTS: No reference points have been proposed for the flounder stocks in the Baltic. STOCK STATUS:
Fishing pressure 2011–2013
MSY (FMSY) Unknown Precautionary approach (Fpa,Flim) Unknown
Qualitative evaluation Stable at low level
Stock size
2009–2013 MSY (Btrigger) Unknown Precautionary approach (Bpa,Blim) Unknown
Qualitative evaluation Increasing
The biomass index from surveys has increased fourfold, since 2003. The average biomass index in the last two years (2012–2013) is 21% higher than the index in the three previous years (2009–2011). RECENT MANAGEMENT ADVICE: ICES advises on the basis of the data-limited approach, but cannot quantify the resulting catches. The implied landings should be no more than 17,182 tonnes. ICES approach to data-limited stocks: For data-limited stocks for which a biomass index is available, ICES uses as harvest control rule an index-adjusted status quo catch. The advice is based on a comparison of the two most recent index values with the three preceding values, combined with recent catch or landings data. Knowledge about the exploitation status also influences the advised catch. For this stock the biomass is estimated to have increased by more than 20% between the periods 2009–2011 (average of the three years) and 2012–2013 (average of the two years). This implies an increase in catches by at most 20% in relation to last year’s (2013) catches, corresponding to landings of no more than 17,182 t in 2015.

- 16 -
Additionally, even though the exploitation status is unknown, the effort in the main fisheries has decreased (STECF, 2013, Figures 8.3.6.2 and 8.3.6.3). Furthermore, the biomass index has increased fourfold since 2005 ; therefore, no additional precautionary reduction is needed. Discards are considered to be large but could not be quantified; therefore catches cannot be calculated. STECF COMMENTS: STECF agrees with the ICES advice.
4.5.3.4.5.3.4.5.3.4.5.3. Flounder in Subdivisions 26 and 28 (Eastern Gotland and Gulf of Gdansk)
FISHERIES: Flounder is taken as bycatch in demersal fisheries and, to a minor extent, in a directed fishery. The main countries landing flounder from Subdivisions 26 and 28 are Russia, Poland, Latvia and Lithuania. Denmark and Sweden discard most of their flounder catches. In the previous years the Polish fishery was mainly a gillnet fishery along the coast whereas the Russian, Latvian and Lithuanian landings were bycatches mainly in a bottom trawl mix-fishery. Discard patterns are heterogeneous between fleets and vessels, and even in individual hauls from the same vessel and trip. Discards of flounder may be significantly higher than flounder landings. Total catch (2013) is unknown. Official landings were 5,100 t (mainly taken as bycatch in the demersal trawl fishery). Discards are known to take place and are considered substantial but could not be quantified. SOURCE OF MANAGEMENT ADVICE: The main management advisory body is ICES.
REFERENCE POINTS: No reference points have been proposed for the flounder stocks in the Baltic. STOCK STATUS:
Fishing pressure 2011–2013
MSY (FMSY) Unknown Precautionary approach (Fpa,Flim) Unknown
Qualitative evaluation Increasing
Stock size
2009–2013 MSY (Btrigger) Unknown Precautionary approach (Bpa,Blim) Unknown
Qualitative evaluation Decreasing
The stock size indicator from surveys has been decreasing. The average stock size indicator in the last two years (2012–2013) is 26% lower than the abundance indices in the three previous years (2009–2011).
- 17 -
RECENT MANAGEMENT ADVICE: ICES advises on the basis of the data-limited approach but cannot quantify the resulting catches. The implied landings should be no more than 3,257 t. ICES approach to data-limited stocks: For data-limited stocks for which a biomass index is available, ICES uses as harvest control rule an index-adjusted status quo catch. The advice is based on a comparison of the two most recent index values with the three preceding values, combined with recent catch or landings data. Knowledge about the exploitation status also influences the advised catch. For this stock the biomass is estimated to have decreased by more than 20% between 2009–2011 (average of the three years) and 2012–2013 (average of the two years). This implies a decrease in catch by at least 20 % in relation to the last year’s (2013) catch, corresponding to landings of no more than 4,071 tonnes. Even though the effort in Subdivisions 25, 26, 27 and 28.2 shows a long term decreasing trend (STECF, 2013; Figure 8.3.6.2), the area specific effort (Subdivisions 26 and 28) (ICES, 2014b; Figure 8.3.6.3) has increased in 2013. Therefore, ICES advises that catches should decrease by a further 20% as a precautionary buffer. This results in landing of no more than 3,257 tonnes in 2015. Discards are considered to be large but could not be quantified; therefore catches cannot be calculated. STECF COMMENTS: STECF agrees with the ICES advice.
4.5.4.4.5.4.4.5.4.4.5.4. Flounder in Subdivisions 27 and 29–32 (Northern Baltic Sea)
FISHERIES: Flounder is taken both as by-catch in demersal fisheries and in a directed fishery. Landings mainly originate from passive gears such as gillnets. Discard patterns are unknown. In Estonia, discards are not allowed. Flounder in the northern Baltic Sea is also caught to a great extent in recreational fishery; estimates from surveys collated by ICES suggest recreational landings of around 30% of the total landings. Total catch (2013) is unknown, official landings were 236 t: (85% with passive gear, 15% with active gear. Discards are known to take place but could not be quantified. SOURCE OF MANAGEMENT ADVICE: The main management advisory body is ICES.
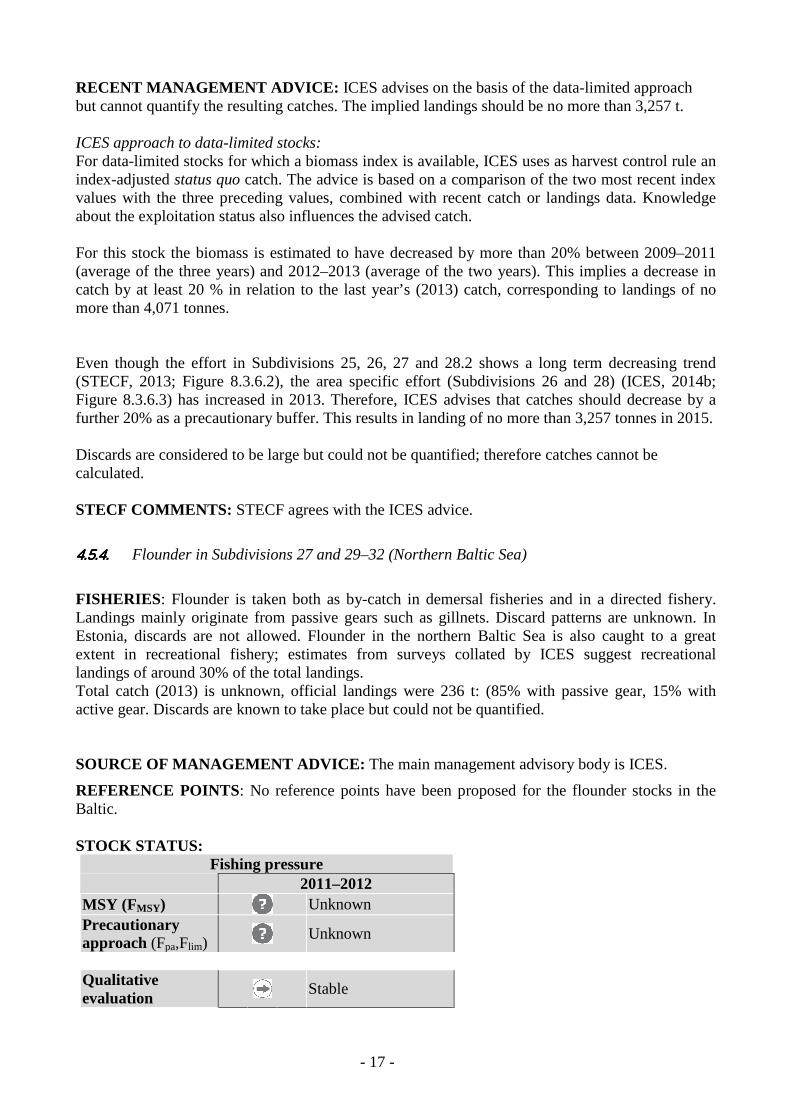
REFERENCE POINTS: No reference points have been proposed for the flounder stocks in the Baltic. STOCK STATUS:
Fishing pressure 2011–2012
MSY (FMSY) Unknown Precautionary approach (Fpa,Flim) Unknown
Qualitative evaluation Stable

- 18 -
Stock size 2009–2013
MSY (Btrigger) Unknown Precautionary approach (Bpa,Blim) Unknown
Qualitative evaluation Increasing
The combined stock size indicator from several national surveys conducted in Subdivisions 27, 29 and 32 in the last two years (2012–2013) is 49% higher than the biomass indices in the three previous years (2009–2011). RECENT MANAGEMENT ADVICE: ICES advices on the basis of the data-limited approach but cannot quantify the resulting catches. The implied commercial landings should be no more than 228 t. ICES approach to data-limited stocks: For data-limited stocks for which a biomass index is available, ICES uses as harvest control rule an index-adjusted status quo catch. The advice is based on a comparison of the two most recent index values with the three preceding values, combined with recent catch or landings data. Knowledge about the exploitation status also influences the advised catch. For this stock the biomass is estimated to have increased by more than 20% between 2009–2011 (average of the three years) and 2012–2013 (average of the two years). This implies an increase of catches of at most 20% in relation to the last year’s (2013) catches, corresponding to commercial landings of no more than 284 t. Considering that the exploitation status is unknown, ICES advises that landings should decrease by an additional 20% as a precautionary buffer. This results in commercial landings of no more than 228 t in 2015. Discards are known to take place but could not be quantified; therefore total commercial catches cannot be calculated. Recreational catches are uncertain, therefore total catches cannot be calculated. STECF COMMENTS: STECF agrees with the ICES advice.
4.6.4.6.4.6.4.6. Herring ( Clupea harengus) in Divisions IIIbcd, Baltic Sea
The present ICES stock assessment units of Baltic herring and the corresponding management units are shown in the text table below: Herring Stock Assessment Units
Management Areas
Herring in division IIIa and subdivisions 22-24 Subdivisions 22 – 24 Division IIIa
Subdivisions 25 – 29 (excluding Gulf of Riga) and 32
Subdivisions 25,26,27,29, 32 and 28.2
Gulf of Riga Herring (subdivision 28.1) Subdivision 28.1 (Gulf of Riga)

- 19 -
Herring in subdivision 30 Subdivisions 30-31
Herring in Subdivision 31 Subdivisions 30-31
4.6.1.4.6.1.4.6.1.4.6.1. Herring (clupea harengus) in Division IIIa and Subdivision 22 – 24.
FISHERIES: Herring of this stock of spring spawners are taken in the North-eastern part of the North Sea, Division IIIa and Sub-divisions 22–24. Division IIIa has directed fisheries by trawlers and purse seiners and by-catches in the small mesh trawl fisheries for sprat, Norway pout and sandeel, while Sub-divisions 22–24 have directed trawl, gillnet and trap net fisheries. The catches of herring taken in the Skagerrak and the Kattegat consist of mixture of autumn spawners from the North Sea stock and spring spawners from the area and from the western Baltic. Landings decreased from 107,000 t in 2002 to 28,000 t in 2011, the lowest level in the time series. Landings in 2013 were 44,000 t. The proportion of the total catch of the spring spawner stock taken in the western Baltic has varied between 42 and 63% since 2002 with an average of 53%.
Of the total catch, 12% is taken with passive gear (mainly gillnets), which is only used in Subdivisions 22–24. The remaining 88% is taken by active gear (mainly pelagic trawl). No quantitative discard information was reported to ICES within the data submission cycle in 2014. However, for two fisheries (active and passive) from Germany, landing about a quarter of the annual WBSS catch it is reported that no discards have been detected by observers or harbour sampling programs. There are indications that discarding and/or slipping of herring in the sprat fishery may have increased in recent years, however, the amount cannot be quantified. Nevertheless, the herring by-catch ceiling for these fleets was not reached in recent years and it appears unlikely that the potential discarding and/or slipping is higher than the bycatch ceiling. Misreporting by the C-fleet in Division IIIa is assumed to have ceased since 2009 due to national regulations.
Two TACs are set for Division IIIa. One covering the catches taken in fisheries using nets with a mesh size equal to or larger than 32 mm (target herring fishery) and one for fisheries using nets with a mesh size smaller than 32 mm (by-catch fishery). The TACs comprises both the autumn- and spring-spawning stocks in the area.
The TAC for the North Sea is based on the advice for the autumn spawners and does not take into account the likely catches of spring spawners.
EU and Norway have agreed that 50% of the quotas for the target herring fishery in Division IIIa can be fished in the North Sea.
Landings in 2013 by area, fishery and stock are shown in the table below (WBSS: Western Baltic spring spawners; NSAS: North Sea autumn spawners.
Area where WBSS are caught
Fleet Fishery WBSS 2013
landings
NSAS 2013
landings
Division IIIa
C* Directed herring fisheries with purse-seiners and trawlers.
16 597 t 11 768 t
D* Bycatches of herring caught in the small-mesh fisheries.
1 277 t 1 599 t
Subdivisions 22–24
F* All herring fisheries in Subdivisions 22–24. 25 504 t -
Division IVa East
A Directed herring fisheries with purse-seiners and trawlers.
452 t -

- 20 -
SOURCE OF MANAGEMENT ADVICE: The main management advisory body is ICES. The analytical assessment of the spring spawners in IIIa and western Baltic is based on catch data, two acoustic indices and a larvae survey index.
REFERENCE POINTS:
(Last changed in 2013) STOCK STATUS:
Fishing pressure 2011 2012 2013
MSY (FMSY) Above target Precautionary approach (Fpa,Flim) Undefined
Stock size
2012 2013 2014 MSY (Btrigger) Above trigger Precautionary approach (Bpa,Blim)
Full reproductive capacity
SSB reached the lowest point in the time-series in 2011 and is above MSY Btrigger in 2014. Fishing mortality has been at its lowest in the recent years, but was still above FMSY in 2013. The stock appears to remain in a low production period. RECENT MANAGEMENT ADVICE : ICES advises on the basis of the MSY approach that wanted catch1 in 2015 should be no more than 44,439 tonnes. The resulting total catch cannot be quantified as discard data are not fully available. This advice applies to the wanted catch of western Baltic spring spawners in Divisions IVa east, IIIa, and Subdivisions 22–24.
MSY approach: Following ICES MSY approach implies a fishing mortality reduced to 0.28 in 2015, which results in landings of no more than 44,439 t in 2015 from the whole distribution area. This is expected to lead to an SSB of 155,000 t in 2016. ICES cannot quantify catches as there is insufficient information available to determine the extent of discarding that may be taking place.
Management plans:
1 “Wanted catch” is used to describe fish that would be landed in the absence of the EU landing obligation. The “unwanted
catch” refers to the component that was previously discarded.

- 21 -
There is no management plan for the entire stock, but a management strategy was adopted for the human consumption fishery in IIIa, which is a part of the distribution area of this stock (EU–Norway, 2014). According to this rule, the TAC for IIIa (C-fleet) is calculated from the sum of 3.5% of the agreed TAC (A-fleet) based on the 2014 NSAS LTMP and 41% of the MSY-based ICES advice on WBSS. For 2015, this translates into 33,807 t (3.5% of 445,329 t = 15,587 t plus 41% of 44,439 t= 18,220 t). However, the variation of the TAC between years is limited to ±15. A 15% reduction of 46, 800 t (2014 TAC) is 39,780 t. The IIIa TAC rule implies that 50% of the advised MSY catch from the WBSS is set as TAC for SD 22-24 (22,220 t), and that 50% of the IIIa TAC will be caught in the North Sea. ICES has not evaluated the rule and therefore continues to advise on the MSY approach.
STECF COMMENTS: STECF agrees with the ICES advice. STECF notes that the above advised catch limits include a predicted catch of Western Baltic/ IIIa spring spawners of 452 t in the eastern part of Division IVa. This indicates that the catch of Western Baltic/IIIa spring spawners from Division IIIa and Western Baltic (subdivisions 22-24) should be limited to 43,987 t.
Assuming a fifty-fifty allocation of the advised catch of Western Baltic spring spawners (43,987 t) between Divisions IIIa and IVa and the Western Baltic and taking into account catches by fishery of North Sea autumn spawners in Division IIIa, STECF advises that catches of herring from Division IIIa and Subdivisions 22- 24 for 2014 should not exceed the following: Management unit Advised catch
2014, t Predicted catch by stock, t WBSS NSAS
Division IIIA target herring fishery
35,033 20,454 14,601
Division IIIA by-catch fishery
3,531 1,540 1,991
Subdivisions 22 to 24
21,994 21,994 0
STECF underlines that the predicted catch by stock is based on the assumption that the advised catch for Division IIIa is taken from Division IIIa and that no quota is transferred from Division IIIa to the North Sea.
4.6.2.4.6.2.4.6.2.4.6.2. Herring (Clupea harengus) in Subdivisions 25-29 (excluding Gulf of Riga) and 32.
FISHERIES: All the countries surrounding the Baltic, exploit the herring in these areas as part of fishery mixed with sprat. Over the last 30 years, landings of herring have decreased from a peak of 369,000 tonnes in 1974 to 91,592 tonnes in 2005. Total catches of the Central Baltic stock (2013) were 100,954 t (mainly pelagic trawl). Central Baltic herring catches from the Central Baltic area were 96,900 t. Discards are considered to be negligible.
SOURCE OF MANAGEMENT ADVICE: The main management advisory body is ICES. The assessment is based on catch data and on an international acoustic survey. Natural mortality is derived from a multispecies model. Recruitment estimates for forecasts are based on the acoustic survey. Catches of Central Baltic spring-spawning herring taken in the Gulf of Riga are included in the assessment.
REFERENCE POINTS:

- 22 -
(Last changed in: 2013)
STOCK STATUS:
Fishing pressure 2011 2012 2013
MSY (FMSY) Below target Precautionary approach (Fpa,Flim) Harvested sustainably
Stock size 2012 2013 2014
MSY (Btrigger) Above trigger Precautionary approach (Bpa,Blim) Full reproductive capacity
SSB declined until 2001 and then increased, and has been above MSY Btrigger since 2006. Fishing mortality increased until 2000, and then decreased, and has been below FMSY since 2003.
RECENT MANAGEMENT ADVICE: ICES advises on the basis of the MSY approach that catches in 2015 should be no more than 193,000 t. This applies to all catches from the stock in the Central Baltic Sea and Gulf of Riga. ICES advises the implementation of a spatial management plan for the clupeid stocks in Subdivisions 25–26. MSY approach: Following the ICES MSY approach implies fishing mortality at FMSY = 0.26, which implies catches of no more than 193,000 kt. This is expected to lead to an SSB of 685,000 t in 2016. Following the ICES MSY approach implies fishing mortality at FMSY = 0.26, which implies catches of no more than 193,000 t. All catches are assumed to be landed. This is expected to lead to an SSB of 685,000 t in 2016. Precautionary approach: F must be at least 12% lower than Fpa to increase SSB to Bpa in 2016, which implies catches of no more than 266,000 t. Multispecies considerations: Herring multispecies FMSY given as one value does not exist in a multispecies context, as the natural mortality of herring depends on the population size of the other stocks in the Baltic. Long-term yield of herring (estimated from the SMS model) is determined more by the population size of its predator cod than by the F (in the range of 0.25–0.35) on herring itself. The multispecies FMSY
(0.25-0.35) values for herring used in the outlook table give the highest long-term yields, based on a biomass of cod that is associated with fishing mortality on cod in the range of 0.4–0.6. See ICES
- 23 -
(2013b) for details on how the multispecies FMSY used in the outlook table was derived. Fishing at multispecies FMSY is within the range of 0.25 – 0.35, which would give catches in 2015 within the range of 187,000-259,000 t and SSB in 2016 within the range of 609,000-693,000 t. STECF COMMENTS : STECF agrees with the ICES assessment of the state of the stock and the advised forecast catch options for 2015.
STECF notes that the advice provided by ICES is referring to the stock and not to management area. Therefore in the herring TAC for the Sub-divisions 25-27, 28.2, 29&32 the average catches of this stock in Sub-division 28.1 (4,700 t)should be excluded and the average catches of Gulf of Riga herring taken outside the Gulf of Riga in Sd 28.2 (220 t) should be included. Respective calculations are given in the table below.
Taking into account the above mentioned issues STECF has revised the advised catch options provided by ICES and advises on the basis of the MSY approach that catches in 2015 should be no more than 185,520 t.
Table. Setting of herring catch limits by management area in Sub-divisions 25-27, 28.2, 29&32. Management area
Stock advice Average 5 year catch taken outside management area
Average 5 year catch of another stock taken in the management area
Management area advice
Sd 25-27, 28.2, 29&32 193,000 t 4,700 t 220 t 188,520 t
4.6.3.4.6.3.4.6.3.4.6.3. Herring (Clupea harengus) in the Gulf of Riga.
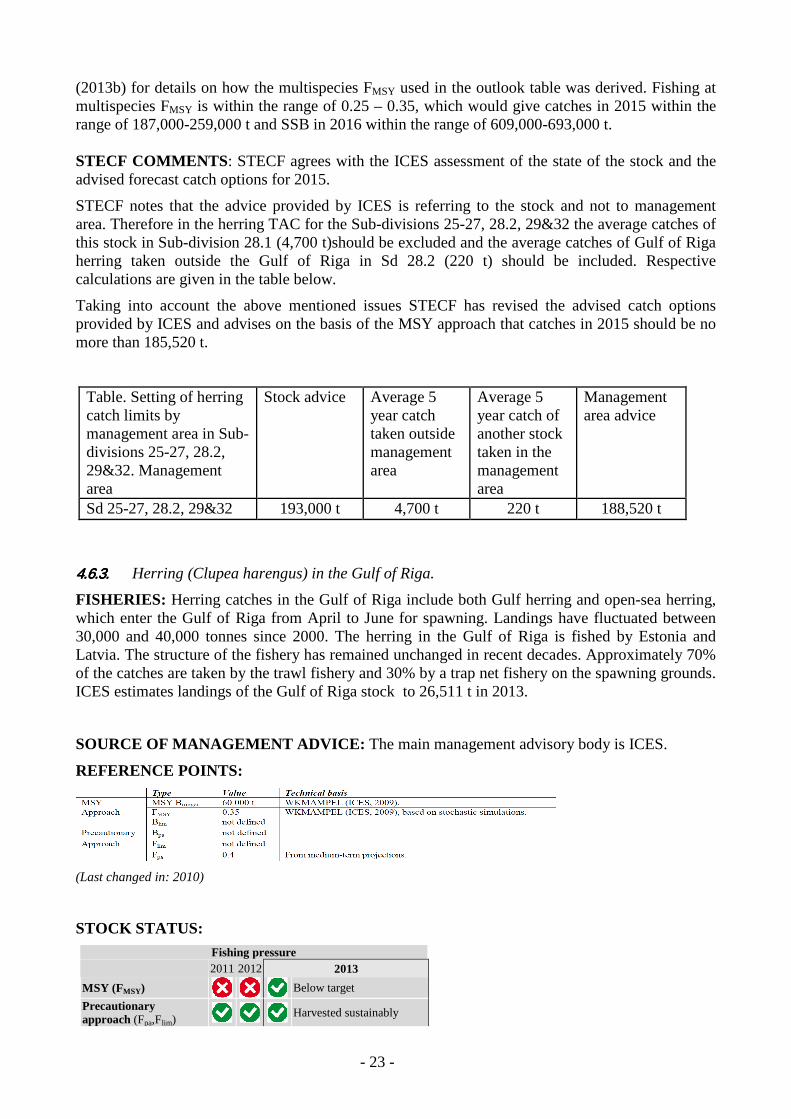
FISHERIES: Herring catches in the Gulf of Riga include both Gulf herring and open-sea herring, which enter the Gulf of Riga from April to June for spawning. Landings have fluctuated between 30,000 and 40,000 tonnes since 2000. The herring in the Gulf of Riga is fished by Estonia and Latvia. The structure of the fishery has remained unchanged in recent decades. Approximately 70% of the catches are taken by the trawl fishery and 30% by a trap net fishery on the spawning grounds. ICES estimates landings of the Gulf of Riga stock to 26,511 t in 2013.
SOURCE OF MANAGEMENT ADVICE: The main management advisory body is ICES.
REFERENCE POINTS:
(Last changed in: 2010)
STOCK STATUS: Fishing pressure
2011 2012 2013 MSY (FMSY) Below target Precautionary approach (Fpa,Flim) Harvested sustainably

- 24 -
Stock size 2012 2013 2014
MSY (Btrigger) Above trigger Precautionary approach (Bpa,Blim) Undefined
Following high recruitment, SSB increased in the late 1980s and is estimated to be above the MSY Btrigger since. The 2010 year class is poor while 2011and 2012 year classes are well above average. F has been fluctuating between Fpa and FMSY since 2008 and is estimated to be below FMSY in 2013.
RECENT MANAGEMENT ADVICE: ICES advises on the basis of the MSY approach that catches in 2015 should be no more than 34,300 t. This applies to all catches from the stock in Subdivisions 28.1 and 28.2 MSY approach: Following the ICES MSY approach implies fishing at F = 0.35, which corresponds to catches no more than 34,300 t in 2015. This is expected to lead to an SSB of 107,500 t in 2016. Precautionary approach: The fishing mortality in 2015 should be no more than Fpa, corresponding to catches of less than 38,300 t in 2015. This is expected to lead to an SSB of 102,900 t in 2016. Additional considerations: ICES recommends that activities that have a negative impact on the spawning habitat of herring, such as extraction of marine aggregates and construction on the spawning grounds, should not occur.
STECF COMMENTS: STECF agrees with the ICES assessment of the state of the stock and the advised forecast catch options for 2015 STECF notes that the advice provided by ICES is referring to the stock and not to management area. Therefore in the Gulf of Riga herring TAC the average catches of open sea herring in the Gulf of Riga (4,700 t) should be included and the average catches of Gulf of Riga herring taken outside the Gulf of Riga (220 t) should be excluded. Respective calculations are given in the table below.
Taking into account the abovementioned issues and following ICES MSY approach STECF advises that catches in 2015 should be no more than 38,780 t. (see table below). All catches are assumed to be landed.
Table. Setting of herring catch limits by management area in Sub-division 28.1.
Table. Setting of herring catch limits by management area in Sub-division 28.1. Stock
Stock advice Average 5 year catch taken outside management area
Average 5year catch of another stock taken in the management area
Management area advice
Sd 28.1 34,300 t 220 t 4,700 t 38,780 t
- 25 -
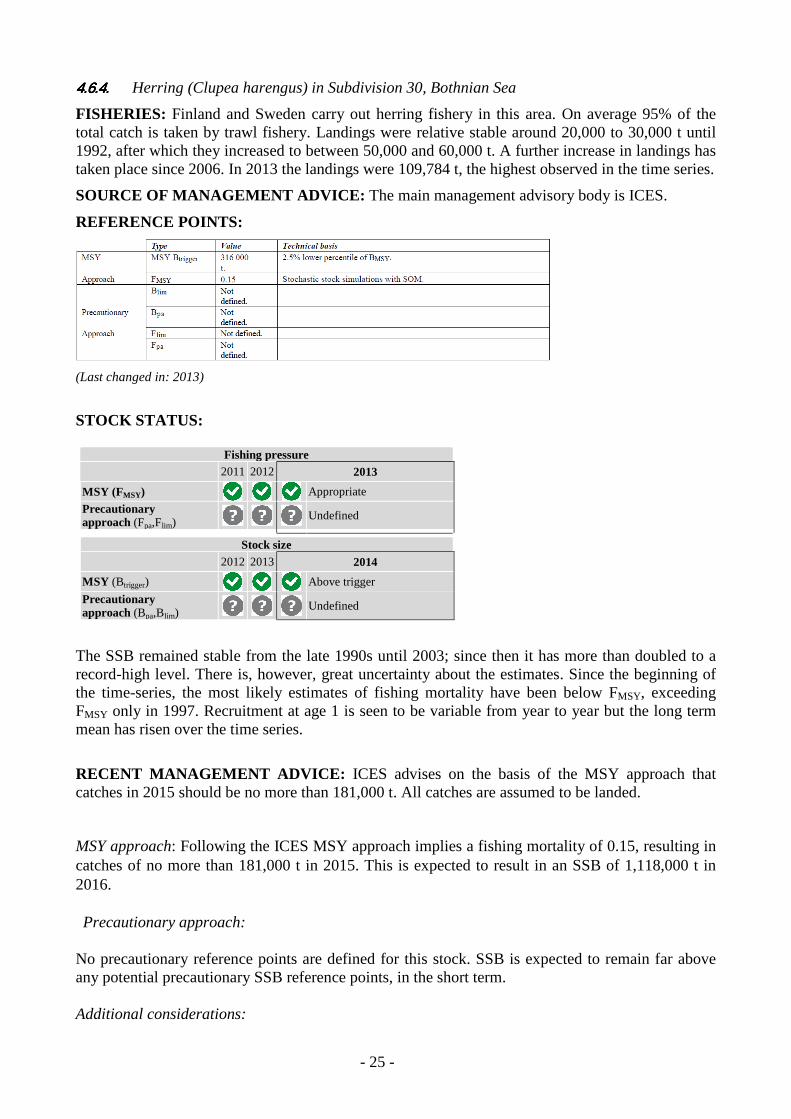
4.6.4.4.6.4.4.6.4.4.6.4. Herring (Clupea harengus) in Subdivision 30, Bothnian Sea
FISHERIES: Finland and Sweden carry out herring fishery in this area. On average 95% of the total catch is taken by trawl fishery. Landings were relative stable around 20,000 to 30,000 t until 1992, after which they increased to between 50,000 and 60,000 t. A further increase in landings has taken place since 2006. In 2013 the landings were 109,784 t, the highest observed in the time series.
SOURCE OF MANAGEMENT ADVICE: The main management advisory body is ICES.
REFERENCE POINTS:
(Last changed in: 2013)
STOCK STATUS:
Fishing pressure 2011 2012 2013
MSY (FMSY) Appropriate Precautionary approach (Fpa,Flim) Undefined
Stock size 2012 2013 2014
MSY (Btrigger) Above trigger Precautionary approach (Bpa,Blim) Undefined
The SSB remained stable from the late 1990s until 2003; since then it has more than doubled to a record-high level. There is, however, great uncertainty about the estimates. Since the beginning of the time-series, the most likely estimates of fishing mortality have been below FMSY, exceeding FMSY only in 1997. Recruitment at age 1 is seen to be variable from year to year but the long term mean has risen over the time series.
RECENT MANAGEMENT ADVICE: ICES advises on the basis of the MSY approach that catches in 2015 should be no more than 181,000 t. All catches are assumed to be landed.
MSY approach: Following the ICES MSY approach implies a fishing mortality of 0.15, resulting in catches of no more than 181,000 t in 2015. This is expected to result in an SSB of 1,118,000 t in 2016. Precautionary approach: No precautionary reference points are defined for this stock. SSB is expected to remain far above any potential precautionary SSB reference points, in the short term. Additional considerations:

- 26 -
ICES recommends that activities that have a negative impact on the spawning habitat of herring, such as extraction of marine aggregates and construction on the spawning grounds, should not occur.
STECF COMMENTS: STECF agrees with the ICES assessment of the state of the stock and the advised forecast catch options for 2015.
STECF notes that the TAC for herring in the Bothnian Bay covers Subdivisions 30 and 31 and should be set in accordance with the combined advice given for the two herring stocks in the area. The advised catch of herring in subdivision 31 in 2015 is 5,534 t (see section 4.6.5 Herring in Subdivision 31).
Based on the above considerations and STECF advises that catches in 2015 for subdivisions 30 and 31 should be no more than 186,534 t. All catches are assumed to be landed.
4.6.5.4.6.5.4.6.5.4.6.5. Herring (Clupea harengus) in Subdivsion. 31
FISHERIES: Trawl fisheries account for the main part of the total catches. Normally the trawl fishing season begins in late April and ends before the spawning season in late May to July. It resumes in August/September and continues, until the ice cover appears, usually in early November. Catches in 2013were 4,612 t. Discards are negligible. tonnes.
SOURCE OF MANAGEMENT ADVICE: The main management advisory body is ICES.
REFERENCE POINTS: No reference points are agreed for the stock.
STOCK STATUS: Fishing pressure
2011–2013 MSY (FMSY) Unknown Precautionary approach (Fpa,Flim) Unknown
Qualitative evaluation Increasing
Stock size 2009–2013
MSY (Btrigger) Unknown Precautionary approach (Bpa,Blim) Unknown
Qualitative evaluation Increasing
An exploratory assessment shows that SSB in the last two years (2012–2013) is 72% higher than the average of the three previous years (2009–2011). The fishing mortality has shown a decreasing trend in 2004-2010, and increased in 2011-2012. Abundant year classes have appeared in 2010-2012.
RECENT MANAGEMENT ADVICE: Based on ICES approach to data-limited stocks, ICES advises that catches should be no more than 5,534 tonnes.
ICES approach to data-limited stocks:
In cases where a biomass index is available for data-limited stocks, ICES uses as harvest control rule an index-adjusted status quo catch. The advice is based on a comparison of the two most recent

- 27 -
index values with the three preceding values, combined with recent catch or landings data. Knowledge about the exploitation status also influences the advised catch. For this stock the SSB from the exploratory assessment is estimated to have increased by more than 20% between the average of 2009–2011 (three years) and the average of 2012–2013 (two years). This implies an increase of catches of at most 20% in relation of the last year’s (2013) catches, corresponding to catches of no more than 5,534 tonnes in 2015. Considering that the SSB increase is more than 50%, therefore no additional precautionary reduction is needed. Additional considerations : ICES recommends that activities that have a negative impact on the spawning habitat of herring, such as extraction of marine aggregates and construction on the spawning grounds, should not occur. The continuous decline in fishing effort is probably independent of stock development and related to socio-economic factors. STECF COMMENTS: STECF agrees with the ICES assessment of the state of the stock and the advised forecast catch option for 2015.
The STECF advice on catch limits for subdivisions 30 is given in section 4.6.4 of this report.
4.7.4.7.4.7.4.7. Plaice (Pleuronectes platessa) in the Baltic Sea (Subdivisions 22-32)
ICES assess Baltic plaice as two stocks, one distributed in subdivisions 24 to 32 and one in the Kattegat and subdivisions 22 and 23. This means that there is a mismatch between the assessment areas and the TAC management areas.
STECF has reviewed the two assessments and based on the two catch forecasts and the historical distribution of landings, STECF provides an advice on landing limits for 2015 for subdivisions 22 to 32.
4.7.1.4.7.1.4.7.1.4.7.1. Plaice (Pleuronectes platessa) in the Kattegat and subdivisions 22 and 23.
FISHERIES: In Subdivision (SD) 22 plaice is mostly taken in mixed fisheries together with cod. In the Kattegat plaice is almost exclusively a bycatch in the combined Nephrops–sole fishery. Historical information on discard ratio in the Skagerrak and the Kattegat is around 15–25% in weight.
Total catch (2013) = 3,360 tonnes, where total landings = 1,955 tonnes (62% active gears and 38% passive gears), total discard estimate by ICES is 1,405 tonnes (≈1% from passive and 99 %from active gears).
The distribution of landings by area in the period 2002 to 2011 is given in section 4.7.3.
SOURCE OF MANAGEMENT ADVICE: The management advisory body is ICES.

- 28 -
REFERENCE POINTS:
Type Value Technical basis MSY MSY Btrigger Undefined. Approach FMSY 0.25 FMSY for neighbouring North Sea stock. Since selectivity in Kattegat
is towards larger fish (discards are considerably lower) this proxy is considered conservative and in the range of other possible proxies.
Precautionary Not defined approach
STOCK STATUS: Fishing pressure
2011–2013 MSY (FMSY) Unknown Precautionary approach (Fpa,Flim) Unknown
Qualitative evaluation Below poss. reference points
Stock size 2010–2014
MSY (Btrigger) Unknown Precautionary approach (Bpa,Blim) Unknown
Qualitative evaluation Increasing
The exploratory assessment shows that fishing mortality has dropped since 2008, and SSB has been increasing since 2009. The SSB in the last two years (2012–2013) is 129% higher than the average of the three previous years (2009–2011). Fishing mortality is likely to be below any potential reference points. MANAGEMENT OBJECTIVES: No management objectives have been defined for this stock. RECENT MANAGEMENT ADVICE : ICES advises on the basis of the data-limited approach that catches in 2015 should be no more than 4,031 tonnes. If unwanted catch2 rates do not change from the 2013 ratio, this implies wanted catch of no more than 2,626 t. ICES approach to data-limited stocks. For data-limited stocks for which a biomass index is available as, ICES uses as harvest control rule an index-adjusted status-quo catch. The advice is based on a comparison of the two most recent index values with the three preceding values, combined with recent catch or landings data. Knowledge about the exploitation status also influences the advised catch. For this stock, the biomass from the exploratory assessment is estimated to have increased by more than 20% between the average of 2010–2012 (three years) and the average of 2013–2014 (two years). This implies an increase of catches of at most 20% in relation to last year's (2013) catches, corresponding to catches in 2015 of no more than 4,031 t. Assuming the same discard rates as last year, this implies wanted catches of no more than 2,626 t.
2 “Wanted catch” is used to describe fish that would be landed in the absence of the EU landing obligation. The “unwanted
catch” refers to the component that was previously discarded.

- 29 -
Considering that biomass has increased more than 50% and fishing mortality is below the possible FMSY proxy no additional precautionary reduction is needed. STECF COMMENTS: STECF agrees with ICES advice. The STECF advice on landing limits for subdivisions 22 to 32 is given in section 4.7.3 of this report.
4.7.2.4.7.2.4.7.2.4.7.2. Plaice (Pleuronectes platessa) in subdivisions 24 to 32.
FISHERIES: Plaice is mainly caught in the area of Arkona and Bornholm basin (Subdivisions 24 and 25). ICES Subdivision 24 is the main fishing area with Denmark and Germany being the main fishing countries. Subdivision 25 is the second most important fishing area. Denmark, Sweden and Poland are the main fishing countries there. Minor catches occur in the rest of the Eastern Baltic.
Total catch (2013) is unknown. Official landings 738 t (mainly demersal trawl fishery). Discards are known to take place and are considered substantial but cannot be quantified.
SOURCE OF MANAGEMENT ADVICE: The management advisory body is ICES.
REFERENCE POINTS: There are no reference points proposed for plaice in the Baltic.
STOCK STATUS: Fishing pressure
2011–2013 MSY (FMSY) Unknown Precautionary approach (Fpa,Flim) Unknown
Qualitative evaluation Decreasing
Stock size 2012–2014
MSY (Btrigger) Unknown Precautionary approach (Bpa,Blim) Unknown
Qualitative evaluation Increasing
The stock size indicator from surveys has increased steadily since the early 2000s about five fold. The average stock size indicator in the last two years (2012–2013) is 43% higher than the abundance indices in the three previous years (2009–2011).
MANAGEMENT OBJECTIVES: No management objectives have been defined for this stock. RECENT MANAGEMENT ADVICE : ICES advises on the basis of the data-limited approach, but cannot quantify the resulting catches. The implied wanted catches3 should be no more than 886 tonnes. ICES approach to data-limited stocks In cases where an abundance index is available for data-limited stocks, ICES uses as harvest control rule an index-adjusted status quo catch. The advice is based on a comparison of the two most recent
3 “Wanted catch” is used to describe fish that would be landed in the absence of the EU landing obligation. The “unwanted
catch” refers to the component that was previously discarded.
- 30 -
index values with the three preceding values, combined with recent catch or landings data. Knowledge about the exploitation status also influences the advised catch. For this stock the abundance is estimated to have increased by more than 20% between 2009–2011 (average of the three years) and 2012–2013 (average of the two years). This implies an increase of catches of at most 20% in relation to last year’s (2013) catches, corresponding to wanted catch of no more than 886 t in 2015. Additionally, the exploitation status is unknown but the effort in the main fisheries has decreased (STECF 2013, Figure 8.3.15.2; ICES, 2014b, Figure 8.3.15.3). Furthermore, the abundance has increased five fold since 2003; therefore, no additional precautionary reduction is needed. Discards are known to be substantial, but data are insufficient to estimate a discard proportion that could be applied to give catch advice. STECF COMMENTS: STECF agrees with the ICES advice.
The STECF advice on landing limits for subdivisions 22 to 32 is given in section 4.7.3 of this report.
4.7.3.4.7.3.4.7.3.4.7.3. Advice for plaice (Pleuronectes platessa) in subdivisions 22 to 32.
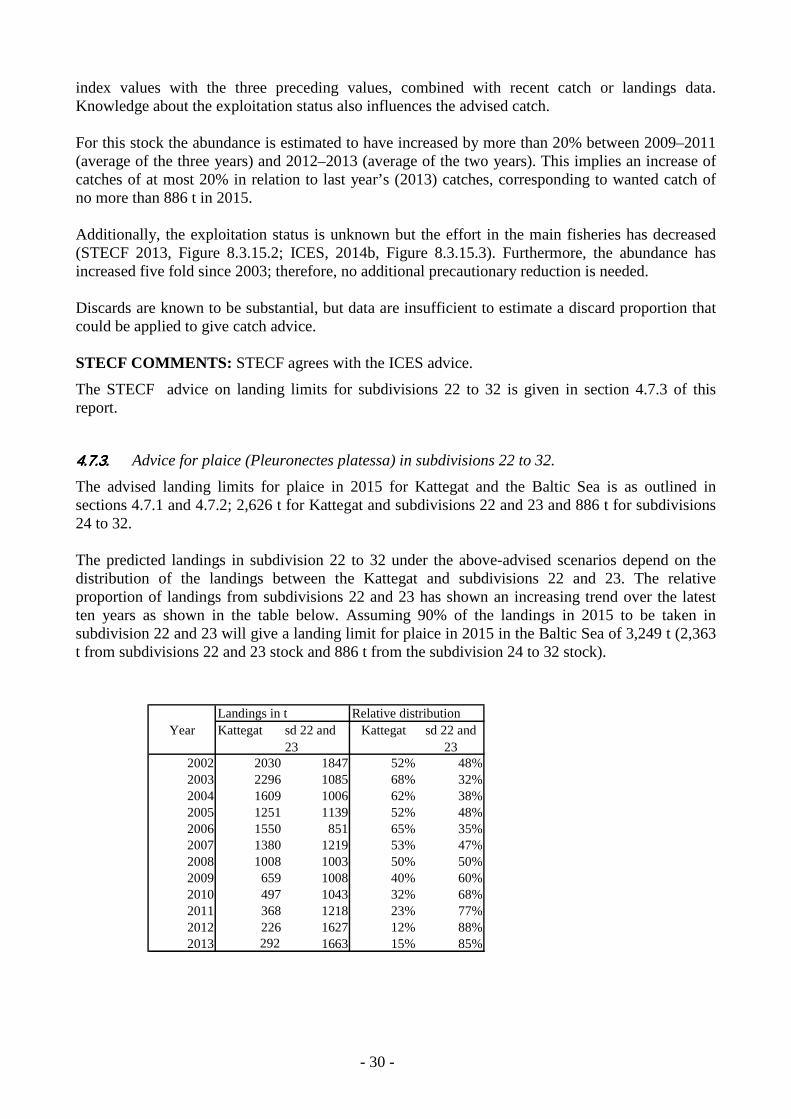
The advised landing limits for plaice in 2015 for Kattegat and the Baltic Sea is as outlined in sections 4.7.1 and 4.7.2; 2,626 t for Kattegat and subdivisions 22 and 23 and 886 t for subdivisions 24 to 32. The predicted landings in subdivision 22 to 32 under the above-advised scenarios depend on the distribution of the landings between the Kattegat and subdivisions 22 and 23. The relative proportion of landings from subdivisions 22 and 23 has shown an increasing trend over the latest ten years as shown in the table below. Assuming 90% of the landings in 2015 to be taken in subdivision 22 and 23 will give a landing limit for plaice in 2015 in the Baltic Sea of 3,249 t (2,363 t from subdivisions 22 and 23 stock and 886 t from the subdivision 24 to 32 stock).
Landings in t Relative distribution Year sd 22 and
23 Kattegat sd 22 and
23 2002 1847 52% 48%2003 1085 68% 32%2004 1006 62% 38%2005 1139 52% 48%2006 851 65% 35%2007 1219 53% 47%2008 1003 50% 50%2009 1008 40% 60%2010 1043 32% 68%2011 1218 23% 77%2012 1627 12% 88%2013 292 1663 15% 85%
368226
13801008659497
2296160912511550
Kattegat
2030
- 31 -
4.8.4.8.4.8.4.8. Salmon (Salmo salar) in the Baltic Sea, Div. IIIb,c,d (Main Basin and Gulf of Bothnia, Sub-div. 22-31)
FISHERIES: Reported total landings in the Baltic Sea (including recreational fishery) declined from 5,636 t in 1990 to 881 t in 2010. Since then landings have increased and were 1,004 tons in 2013. The decline has been largest in the offshore fishery where reported landings in 2013 were 210 t. Landings from coastal fisheries were 450 t in 2013, which is 34 % of the catches in 1990. River catches have shown no clear trend with reported landings in 2013 of 260 t. 80 % of the EC quota for 2013 was landed.
Unreported and misreported catches are estimated to be 18% and discards are estimated to be 5% of the total catches (including recreational and river catches).
The catch decrease since 1990 is largely explained by quota and national restrictions, increased seal damage to catches and gear and declining effort mainly in the offshore fishery caused by a drift net ban since Jan 2008 and also by market restrictions related to high dioxin content in some countries. The nominal catch in the offshore fishery was 37,000 fish in 2013.
There has been an increase in the proportion of wild salmon in catches, relative to reared salmon, which reflects the increased wild smolt production.
SOURCE OF MANAGEMENT ADVICE: The main management advisory body is ICES.
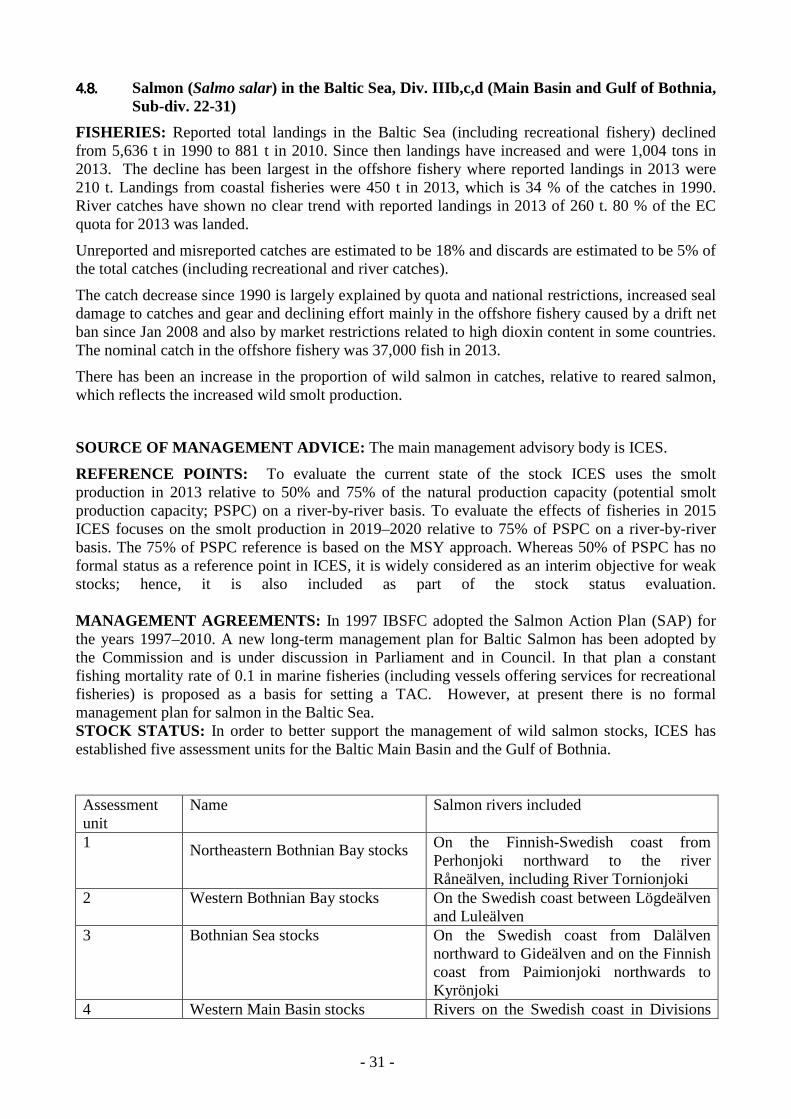
REFERENCE POINTS: To evaluate the current state of the stock ICES uses the smolt production in 2013 relative to 50% and 75% of the natural production capacity (potential smolt production capacity; PSPC) on a river-by-river basis. To evaluate the effects of fisheries in 2015 ICES focuses on the smolt production in 2019–2020 relative to 75% of PSPC on a river-by-river basis. The 75% of PSPC reference is based on the MSY approach. Whereas 50% of PSPC has no formal status as a reference point in ICES, it is widely considered as an interim objective for weak stocks; hence, it is also included as part of the stock status evaluation. MANAGEMENT AGREEMENTS: In 1997 IBSFC adopted the Salmon Action Plan (SAP) for the years 1997–2010. A new long-term management plan for Baltic Salmon has been adopted by the Commission and is under discussion in Parliament and in Council. In that plan a constant fishing mortality rate of 0.1 in marine fisheries (including vessels offering services for recreational fisheries) is proposed as a basis for setting a TAC. However, at present there is no formal management plan for salmon in the Baltic Sea. STOCK STATUS: In order to better support the management of wild salmon stocks, ICES has established five assessment units for the Baltic Main Basin and the Gulf of Bothnia. Assessment unit
Name Salmon rivers included
1 Northeastern Bothnian Bay stocks On the Finnish-Swedish coast from Perhonjoki northward to the river Råneälven, including River Tornionjoki
2 Western Bothnian Bay stocks On the Swedish coast between Lögdeälven and Luleälven
3 Bothnian Sea stocks On the Swedish coast from Dalälven northward to Gideälven and on the Finnish coast from Paimionjoki northwards to Kyrönjoki
4 Western Main Basin stocks Rivers on the Swedish coast in Divisions

- 32 -
25–29 5 Eastern Main Basin stocks Estonian, Latvian, Lithuanian, and Polish
rivers Of the 29 rivers assessed by ICES, the probability of having reached 50% of the PSPC in 2013 is above 70% for ten rivers, between 30% and 70% for eleven rivers, and below 30% for eight rivers. The probability of having reached 75% of PSPC in 2013 is above 70% for only two of the 29 rivers. The target is more likely to be met in productive rivers especially in the Northern Baltic Sea area while the status of less productive wild stocks in other areas remains poor.
The current smolt production is a result of the spawning run several years ago. The relatively weak spawning migrations in 2010 and 2011, followed by the very strong spawning run in 2012 and 2013, will likely result in reduced smolt production in the near future followed by a marked increase in smolt production.
The total wild smolt production has increased almost tenfold in assessment units 1–2 since 1997. In assessment unit 3 the smolt production has remained at the same level, and in assessment unit 4 a slightly decreasing trend in smolt production has been observed during the period. Smolt production in assessment unit 5 has been low and without any signs of improvement. Wild smolt production of assessment units 1 to 4 combined is now estimated to be 70% of the potential total smolt production. Smolt production is still low in rivers where salmon were extirpated and are now being reintroduced.
The harvest rate (catch relative to abundance) of salmon has decreased considerably since the beginning of the 1990s. In 2008, when the driftnet ban was implemented, the offshore harvest rate went down strongly. However, exploitation in the longline fishery increased rapidly from 2008 and the offshore harvest rate in 2010 was close to the harvest rate for offshore fisheries in the early and mid-2000s. Since then, the harvest rate in the offshore fishery has again declined and is now even lower than in 2008. The harvest rate in the coastal fishery shows an overall declining trend, reaching the lowest value in 2013.
The post-smolt survival is a key factor influencing the abundance and development of salmon stocks. It has declined from the late 1980s until the mid-2000s. However, since then there have been some indications of improvement. Especially the post-smolt survival of the 2010 smolt cohort seems to have been higher than the last years’ average.
RECENT MANAGEMENT ADVICE: ICES advises on the basis of the MSY approach that total commercial sea catch in 2015 should not exceed 116,000 salmon. Applying the same proportions estimated to have occurred in 2013, this catch would be split as follows: 11% unwanted catch (previously referred to as discards) and 89% wanted catch (this 89% would, in turn, be split into 68% reported, 10% unreported, and 11% misreported). Setting a TAC under a discard ban needs to take account of wanted and unwanted catch. In setting the TAC, consideration should also be given to expected unreporting and misreporting levels in 2015. ICES advises that management of salmon fisheries should be based on the status of individual river stocks. Fisheries on mixed stocks that cannot target only river stocks with a healthy status, present particular threats to stocks that do not have a healthy status. Effort in such fisheries should be reduced. Fisheries in open sea areas or coastal waters are more likely to pose a threat to depleted stocks than fisheries in estuaries and rivers. Salmon stocks in the rivers Rickleån and Öreälven in the Gulf of Bothnia, Emån in southern Sweden, and in several rivers in the southeastern Main Basin are especially weak. These stocks
- 33 -
need longer-term stock-specific rebuilding measures, including fisheries restrictions in estuaries and rivers, habitat restoration, and removal of physical barriers. In order to maximize the potential recovery of these stocks, further decreases in exploitation are required along their feeding and spawning migration routes at sea. The offshore fishery in the Main Basin catches all weak salmon stocks on their feeding migration. The coastal fishery catches weak stocks from northern rivers when the salmon pass the Åland Sea and the Gulf of Bothnia on their spawning migration. STECF COMMENTS: STECF agrees with the ICES advice that total commercial sea catch (including both wanted and unwanted catch together with misreported and unreported catch) in 2015 should not exceed 116,000 salmon. According to the sharing agreement between Russia and EU the Russian share of the TAC should be 1.9%. Excluding the Russian share would result in a catch level in 2015 of no more than 113,796 salmon.
STECF notes, that this scenario would result in a high probability of a further increase in smolt production in the majority of the assessed salmon stocks.
In 2013, 11% of the commercial salmon catches in SD 22-31 were discarded and 21% were unreported or misreported. STECF notes, that the obligation to land all catches will come into force in Baltic salmon fisheries 1st January 2015. The previously discarded part of the catch, like undersized salmon or salmon partly eaten by seals may be partly or totally landed as unwanted catch. STECF further notes, that the estimated misreporting and unreporting has been constantly decreasing since 2010, possibly due to enhanced fisheries control in the Baltic salmon fisheries. If this trend continues, the assumption that unreporting and misreporting in 2015 would be in the same level as in 2013 will not hold.
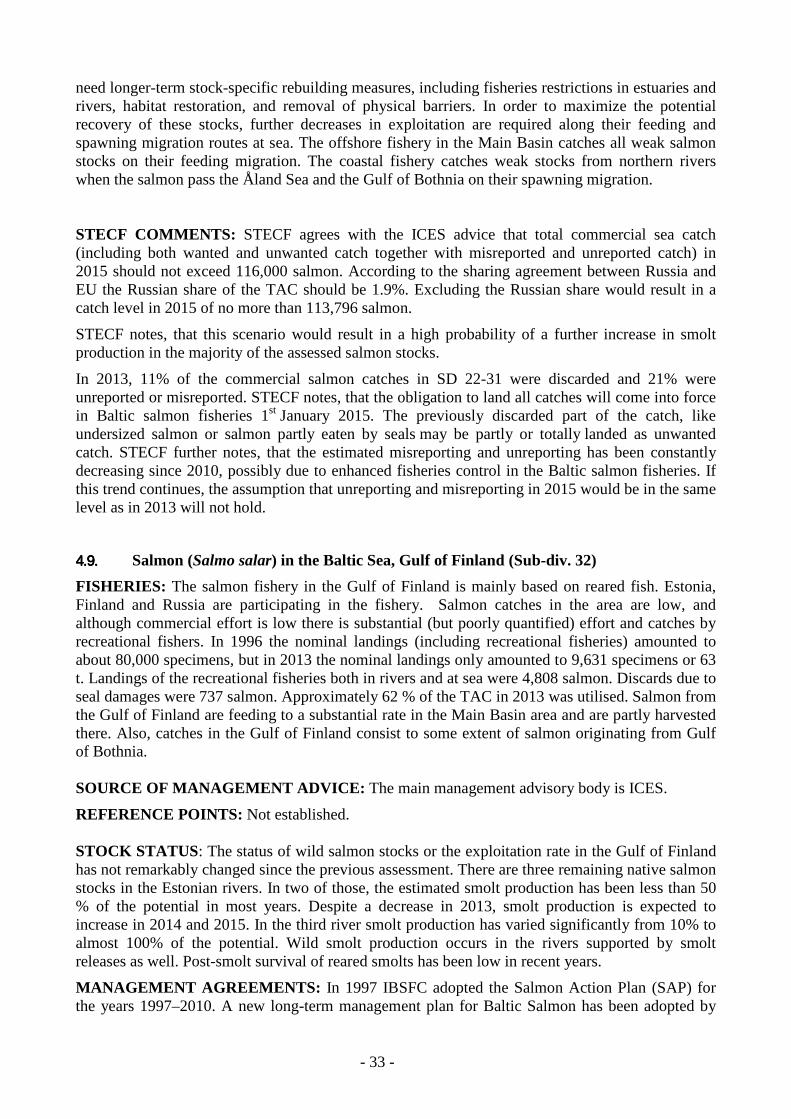
4.9.4.9.4.9.4.9. Salmon (Salmo salar) in the Baltic Sea, Gulf of Finland (Sub-div. 32)
FISHERIES: The salmon fishery in the Gulf of Finland is mainly based on reared fish. Estonia, Finland and Russia are participating in the fishery. Salmon catches in the area are low, and although commercial effort is low there is substantial (but poorly quantified) effort and catches by recreational fishers. In 1996 the nominal landings (including recreational fisheries) amounted to about 80,000 specimens, but in 2013 the nominal landings only amounted to 9,631 specimens or 63 t. Landings of the recreational fisheries both in rivers and at sea were 4,808 salmon. Discards due to seal damages were 737 salmon. Approximately 62 % of the TAC in 2013 was utilised. Salmon from the Gulf of Finland are feeding to a substantial rate in the Main Basin area and are partly harvested there. Also, catches in the Gulf of Finland consist to some extent of salmon originating from Gulf of Bothnia. SOURCE OF MANAGEMENT ADVICE: The main management advisory body is ICES.
REFERENCE POINTS: Not established. STOCK STATUS: The status of wild salmon stocks or the exploitation rate in the Gulf of Finland has not remarkably changed since the previous assessment. There are three remaining native salmon stocks in the Estonian rivers. In two of those, the estimated smolt production has been less than 50 % of the potential in most years. Despite a decrease in 2013, smolt production is expected to increase in 2014 and 2015. In the third river smolt production has varied significantly from 10% to almost 100% of the potential. Wild smolt production occurs in the rivers supported by smolt releases as well. Post-smolt survival of reared smolts has been low in recent years.
MANAGEMENT AGREEMENTS: In 1997 IBSFC adopted the Salmon Action Plan (SAP) for the years 1997–2010. A new long-term management plan for Baltic Salmon has been adopted by

- 34 -
the Commission and is under discussion in Parliament and in Council. In that plan a constant fishing mortality rate of 0.1 in marine fisheries (including vessels offering services for recreational fisheries) is proposed as a basis for setting a TAC. However, at present there is no formal management plan for salmon in the Baltic Sea. RECENT MANAGEMENT ADVICE: ICES advises on the basis of precautionary considerations that effort in fisheries catching salmon in Subdivision 32 should not increase. Assuming that the amount of reared salmon released in 2014 is similar to previous years, this corresponds to a total commercial sea catch in 2015 not exceeding 11, 800 salmon. Applying the same proportions estimated to have occurred in 2013, this catch would be split as follows: 11% unwanted catch (previously referred to as discards) and 89% wanted catch (this 89% would, in turn, be split into 81% reported and 8% unreported). Setting a TAC under a discard ban needs to take account of wanted and unwanted catch. In setting the TAC, consideration should also be given to expected unreporting levels in 2015. ICES advises that there should be no fishery targeting wild salmon from the Gulf of Finland. In addition, improved measures to reduce potential bycatch of wild salmon in other fisheries should be considered. Such measures should include relocation of coastal fisheries away from sites likely to be on the migration paths of Gulf of Finland wild salmon, relocation of fisheries away from rivers and rivers mouths supporting wild stocks, and protection of wild salmon (from poaching) when they return to rivers. Effort in the salmon fishery in the Main Basin (Subdivisions 24–29) should not increase, as wild salmon from the Gulf of Finland use the Main Basin as a feeding area.
STECF COMMENTS: STECF agrees with the ICES advice that total commercial sea catch (including both wanted and unwanted catch together with misreported and unreported catch) in 2015 should not exceed 11,800 salmon.
According to the sharing agreement between Russia and EU the Russian share of the TAC should be 9.3%. Excluding the Russian share would result in a catch level in 2015 of no more than 10,703 salmon.
STECF notes that the obligation to land all catches will come into force in Baltic salmon fisheries 1st January 2015. The previously discarded part of the catch, like undersized salmon or salmon partly eaten by seals may be partly or totally landed as unwanted catch.
4.10.4.10.4.10.4.10. Sea trout (Salmo trutta) in the Baltic Sea (Sub-div. 22-32)
FISHERIES: Most of the sea trout catches are taken as a by-catch in other fisheries. Off-shore migrating sea trout stocks are to a large extent taken as a by-catch in the salmon fishery, whereas those which migrate shorter distances are caught in fisheries targeting whitefish, pikeperch, and perch. Nominal commercial sea trout landings have been decreasing since 2002, from 1,051 t in 2002 to 212 t in 2013. Commercial catches in 2013 decreased 25 % compared to 2012 and were lowest since the early 1980’s. Ban on driftnets (from Jan 2008) had a significant effect especially on Polish sea trout catches which were reduced from 525 t in 2007 to 172 t in 2008. Since then the Polish catches increased again to 454 t in 2010 due to increase in longline fisheries, but decreased again to 95.2 t in 2013. The Polish sea trout catch may be overestimated due to misreporting salmon as sea trout.
Sea trout catch in the recreational fishery in not exactly known. In spite of figures being uncertain, the share of recreational fishery constitutes a significant part of the total catch. The estimated recreational catch from both rivers and sea in 2012 was 386 t.

- 35 -
SOURCE OF MANAGEMENT ADVICE: The main management advisory body is ICES.
REFERENCE POINTS: Not established. STOCK STATUS: New available data (landings and surveys) did not change the perception of the sea trout stocks in the Baltic Sea. The Baltic Sea contains approximately 1,000 sea trout stocks. The status of these populations is very variable; a few populations appear to be in a good state, whereas many populations especially in the Gulf of Bothnia and Gulf of Finland appear to be weak. MANAGEMENT AGREEMENTS: There are no management agreements or TAC set for the sea trout. Community and national regulations include inter alia minimum landing size, local and seasonal closures, and minimum mesh sizes for gillnet fishery.
RECENT MANAGEMENT ADVICE: New available data (landings and surveys) did not change the perception of the sea trout stocks in the Baltic Sea. Therefore, the advice for 2015 is the same as the advice for 2014: ICES advises on the basis of precautionary considerations that exploitation rates in the Gulf of Bothnia (ICES Subdivisions 30 and 31) and the Gulf of Finland (ICES Subdivision 32) should be reduced to safeguard the remaining wild sea trout populations in the region, both locally and on their migration routes. Additional management measures for Subdivisions 30–32 should be considered, in particular to address bycatch of sea trout. These could include minimum mesh size for gillnets, effort limitations, fishing bans at river mouths, minimum legal landing sizes, and closures in time and space. Existing fishing restrictions in ICES Subdivisions 22–29 (for example closed season, fishing bans at river mouths, minimum landing size, and minimum mesh sizes) should be maintained. Habitat improvements by restoration are needed and accessibility to spawning and rearing areas should be improved in many Baltic Sea trout rivers. STECF COMMENTS: STECF agrees with the ICES advice.
STECF notes that no TAC is set for sea trout in the Baltic Sea and most of the catch is taken as bycatch in fisheries targeting other species. Therefore exploitation rates are most effectively reduced by fishing restrictions and management measures such as those described in the ICES advice.
4.11.4.11.4.11.4.11. Sprat (Sprattus sprattus) in IIIbcd, Baltic Sea (Sub-div. 22-32)
FISHERIES: All countries surrounding the Baltic Sea report landings of sprat. During the 1990s total catches increased considerably, from 86,000 t in the 1990 to 529,000 t in 1997. Since then there has been a decrease to 235,000t in 2012. Landings in 2013 were 272,400 t. Trawlers account for most of the catches. Varying amounts of herring are taken as by-catch in the fisheries for sprat.
SOURCE OF MANAGEMENT ADVICE: The main management advisory body is ICES. The age-structured assessment is based long-term catch data and three survey indices.
MANAGEMENT AGREEMENT: The IBSFC long-term management plan for the sprat stock was terminated in 2006, and has not been replaced.
REFERENCE POINTS:

- 36 -
(Last changed in: 2013)
STOCK STATUS:
Fishing pressure 2011 2012 2013
MSY (FMSY) Above target Precautionary approach (Fpa,Flim)
Increased risk
Stock size 2012 2013 2014
MSY (Btrigger) Above trigger Precautionary approach (Bpa,Blim) Full reproductive capacity
SSB has declined from a historical high in the late 1990s, and since 2002 has fluctuated around 1 million tonnes and remained above the MSY Btrigger. The fishing mortality in 2013 is above both FMSY and Fpa. None of the recent four year classes (2009–2012) are strong and the 2013 year class is estimated to be average.
RECENT MANAGEMENT ADVICE: ICES advises on the basis of the MSY approach that catches in 2015 should be no more than 222,000 t. ICES advise the implementation of a spatial management plan for the clupeid stocks in Subdivisions 25–26. MSY approach: Following the ICES MSY approach implies fishing mortality to be reduced to 0.29, which implies catches of no more than 222,000 t in 2015. This is expected to lead to an SSB of 877,000 t in 2016. Precautionary approach: The fishing mortality in 2015 should be no more than Fpa = 0.32, which implies catches of no more than 242,000 t. This is expected to keep SSB above Bpa in 2016. Multispecies considerations: Sprat multispecies FMSY given as one value does not exist in a multispecies context, as the natural mortality of sprat depends on the population size of the other stocks in the Baltic. Long-term yield of sprat (estimated from the SMS model) is more determined by the population size of its predator cod than the F (in the range 0.25–0.32) on sprat itself. The multispecies FMSY (0.25-0.32) values for sprat used in the outlook table give the highest long-term yield, given a biomass of cod associated with fishing mortality on cod that is in the range of 0.4–0.6. Fishing at multispecies FMSY is within the range of 0.25 – 0.32, which would give catches in

- 37 -
2015 within the range of 194,000 – 242,000 t and SSB in 2016 within the range of 854,000 – 907,000 t. Additional considerations: ICES recommends that a spatial management plan is developed for the clupeid stocks. The abundance of cod in Subdivisions 25–26 is high compared to other areas in the Baltic and cod growth is considered to be limited due to food availability. Sprat and herring are important food items for cod, but the present high biomass of the two prey stocks is mainly distributed outside the distribution area for cod. Any fishery on the two prey species in the main cod distribution area will potentially decrease the local prey density, which may lead to increased food deprivation for cod. The relative catch proportion of sprat in the main cod distribution area has since 2010 increased from 37% of the total catch to 47% in 2013. This increase in fishing pressure may exacerbate the food condition for cod as the availability decreases. Restrictions on sprat catches taken in the main cod area (Subdivisions 25–26) should be established. Redistribution of the fishery to the northern areas (Subdivisions 27–32) may also reduce the density-dependent effect, i.e. increase growth for the clupeids in the area. The exploitation of sprat will have to be reduced as the cod stock recovers, especially in Subdivision 25 where most of the cod biomass is presently distributed (Figure 8.3.18.4).
STECF COMMENTS: STECF agrees with the ICES advice.
According to the sharing agreement between Russia and EU the Russian share of the TAC should be 10.08%. Following the ICES MSY approach this would result in a catch level in 2015 excluding the Russian share of no more than 199,622 t.
4.12.4.12.4.12.4.12. Turbot ( Psetta maxima) in the Baltic Sea (Subdivisions 22-32)
FISHERIES: Turbot occurs mainly in the southern and western parts of the Baltic Proper. Therefore, most of the landings are reported for ICES Subdivisions 22-26. The total reported landings of turbot increased from 42 t to 1,210 t between 1965 and 1996. From that high level the landings have shown a decreasing trend. Landings in 2013 were 320 t. SOURCE OF MANAGEMENT ADVICE: The management advisory body is ICES.
REFERENCE POINTS: There are no reference points agreed for turbot in the Baltic.
STOCK STATUS: The survey data are very noisy, but there is no indication of a decline in stock size.
MANAGEMENT OBJECTIVES: No management objectives have been defined for this stock. RECENT MANAGEMENT ADVICE: New data (landings and survey) available for this stock do not change the perception of the stock. Therefore, the advice for this fishery in 2015 is the same as the advice for 2013 and 2014 (see ICES, 2012, 2013): "Based on the ICES approach for data-limited stocks, ICES advises that catches should be less than 220 tonnes". STECF COMMENTS: STECF agrees with ICES advice.

- 38 -
5.5.5.5. L IST OF STECF MEMBERS
1 - Information on STECF members and invited experts’ affiliations is displayed for information only. In some instances the details given below for STECF members may differ from that provided in Commission COMMISSION DECISION of 27 October 2010 on the appointment of members of the STECF (2010/C 292/04) as some members’ employment details may have changed or have been subject to organisational changes in their main place of employment. In any case, as outlined in Article 13 of the Commission Decision (2005/629/EU and 2010/74/EU) on STECF, Members of the STECF, invited experts, and JRC experts shall act independently of Member States or stakeholders. In the context of the STECF work, the committee members and other experts do not represent the institutions/bodies they are affiliated to in their daily jobs. STECF members and invited experts make declarations of commitment (yearly for STECF members) to act independently in the public interest of the European Union. STECF members and experts also declare at each meeting of the STECF and of its Expert Working Groups any specific interest which might be considered prejudicial to their independence in relation to specific items on the agenda. These declarations are displayed on the public meeting’s website if experts explicitly authorized the JRC to do so in accordance with EU legislation on the protection of personnel data. For more information: http://stecf.jrc.ec.europa.eu/adm-declarations 1 - Information on STECF members and invited experts’ affiliations is displayed for information only. In some instances the details given below for STECF members may differ from that provided in Commission COMMISSION DECISION of 27 October 2010 on the appointment of members of the STECF (2010/C 292/04) as some members’ employment details may have changed or have been subject to organisational changes in their main place of employment. In any case, as outlined in Article 13 of the Commission Decision (2005/629/EU and 2010/74/EU) on STECF, Members of the STECF, invited experts, and JRC experts shall act independently of Member States or stakeholders. In the context of the STECF work, the committee members and other experts do not represent the institutions/bodies they are affiliated to in their daily jobs. STECF members and invited experts make declarations of commitment (yearly for STECF members) to act independently in the public interest of the European Union. STECF members and experts also declare at each meeting of the STECF and of its Expert Working Groups any specific interest which might be considered prejudicial to their independence in relation to specific items on the agenda. These declarations are displayed on the public meeting’s website if experts explicitly authorized the JRC to do so in accordance with EU legislation on the protection of personnel data. For more information: http://stecf.jrc.ec.europa.eu/adm-declarations
Name Address1 Tel. Email
STECF members
Abella, J. Alvaro (vice-chair)
ARPAT – AREA MARE Agenzia Regionale per la Protezione Ambientale della Toscana Articolazione Funzionale RIBM Risorse Ittiche e Biodiversità Marina Via Marradi 114, 57126 Livorno – Italia
Tel. 0039-0555-3206956
Andersen, Jesper Levring (vice-chair)
Department of Food and Resource Economics (IFRO) Section for Environment and Natural Resources University of Copenhagen Rolighedsvej 25 1958 Frederiksberg Denmark
Tel.dir.: +45 35 28 68 92

- 39 -
Name Address1 Tel. Email
STECF members
Bailey, Nicholas Fisheries Research Services Marine Laboratory, P.O Box 101 375 Victoria Road, Torry Aberdeen AB11 9DB UK
Tel: +44 (0)1224 876544 Direct: +44 (0)1224 295398 Fax: +44 (0)1224 295511
[email protected] [email protected]
Bertignac, Michel Laboratoire de Biologie Halieutique IFREMER Centre de Brest BP 70 - 29280 Plouzane, France
tel : +33 (0)2 98 22 45 25 - fax : +33 (0)2 98 22 46 53
Cardinale, Massimiliano
Föreningsgatan 45, 330 Lysekil, Sweden
Tel: +46 523 18750 [email protected]
Casey, John (chair)
CEFAS Lowestoft Laboratory, Pakefield Road, Lowestoft Suffolk, UK NR33 0HT
Tel: +44 1502 52 42 51 Fax: +44 1502 52 45 11
Curtis, Hazel Sea Fish Industry Authority 18 Logie Mill Logie Green Road Edinburgh EH7 4HS
Tel: +44 (0)131 558 3331 Fax: +44 (0)131 558 1442
Delaney, Alyne Innovative Fisheries Management, -an Aalborg University Research Centre, Postboks 104, 9850 Hirtshals, Denmark
Tel.: +45 9940 3694 [email protected]
Daskalov, Georgi Laboratory of Marine Ecology, Institute of Biodiversity and Ecosystem Research, Bulgarian Academy of Sciences
Tel.: +359 52 646892 [email protected]
Döring, Ralf Thünen Bundesforschungsinstitut, für Ländliche Räume, Wald und Fischerei, Institut für Seefischerei - AG Fischereiökonomie, Palmaille 9, D-22767 Hamburg, Germany
Tel.: 040 38905-185 Fax.: 040 38905-263
Gascuel, Didier AGROCAMPUS OUEST 65 Route de Saint Brieuc, bat.4 CS 84215, F-35042 RENNES Cedex France
Tel:+33(0)2.23.48.55.34 Fax: +33(0)2.23.48.55.35
Graham, Norman
Marine Institute, Fisheries Science Services (FSS), Rinville, Oranmore, Co. Galway, Ireland
Tel: + 353(0) 91 87200 [email protected]
Garcia Rodriguez, Mariano
Instituto Español de Oceanografía, Servicios Centrales, Corazón de María 8, 28002, Madrid, Spain
Gustavsson, Tore Karl-Erik
Fiskeriverket, National Board of Fisheries, Ekonomi och personalenheten, Box 423, 401 26, Göteborg, Sverige
Tel 00-46-31-74-30-300 Fax 00-46-31-74-30-444

- 40 -
Name Address1 Tel. Email
STECF members
Jennings, Simon CEFAS Lowestoft Laboratory, Pakefield Road, Lowestoft Suffolk, UK NR33 0HT
Tel.: +44 1502562244 Fax: +44 1502513865
Kenny, Andrew CEFAS Lowestoft Laboratory, Pakefield Road, Lowestoft Suffolk, UK NR33 0HT
Tel.: +44 1502562244 Fax: +44 1502513865
Kraak, Sarah University College Cork Based at: Marine Institute, Rinville, Oranmore, Co Galway, Ireland
Tel: +353 (0)91 387392 Fax +353 (0)91 387201
Kuikka, Sakari University of Helsinki, Department of Environmental Sciences, P.O. Box 65 (Viikinkaari 1), FI-00014 University of Helsinki, FINLAND
Tel.: +358 50 3309233 Fax. +358-9-191 58754
Martin, Paloma CSIC Instituto de Ciencias del Mar Passeig Marítim, 37-49 08003 Barcelona Spain
Tel: 34.93.2309500 direct line : 34.93.2309552 Fax: 34.93.2309555
Malvarosa, Loretta NISEA S.c.a.r.l.
Murua, Hilario AZTI - Tecnalia / Unidad de Investigación Marina, Herrera kaia portualdea z/g 20110 Pasaia (Gipuzkoa), Spain
Tel: 0034 667174433 Fax: 94 6572555
Nord, Jenny Southeast Asian Fisheries Development Centre SEAFDEC
Nowakowski, Piotr
Maritime University of Szczecin. – Faculty of Food Science and Fisheries, Department of Fishing Technique, Szczecin
Prelezzo, Raul AZTI - Tecnalia / Unidad de Investigación Marina Txatxarramendi Ugartea z/g 48395 Sukarrieta (Bizkaia), Spain
Tel: 94 6029400 Ext: 406- Fax: 94 6870006
Sala, Antonello Fishing Technology Unit National Research Council (CNR) Institute of Marine Sciences (ISMAR) - Fisheries Section Largo Fiera della Pesca, 1 60125 Ancona - Italy
Tel: +39 071 2078841 Fax: +39 071 55313
Scarcella, Giuseppe
Environmental Management Unit National Research Council (CNR) Institute of Marine Sciences (ISMAR) - Fisheries Section Largo Fiera della Pesca, 1 60125 Ancona - ITaly
Tel: +39 071 2078846 Fax: +39 071 55313
Somarakis, Stylianos
Department of Biology University of Crete Vassilika Vouton P.O. Box 2208 71409 Heraklion Crete Greece
Tel.: +30 2610 394065, +30 6936566764

- 41 -
Name Address1 Tel. Email
STECF members
Stransky, Christoph
Thünen Institute [TI-SF] Federal Research Institute for Rural Areas, Forestry and Fisheries, Institute of Sea Fisheries, Palmaille 9, D-22767 Hamburg, Germany
Tel. +49 40 38905-228 Fax: +49 40 38905-263
Theret, Francois Scapêche 17 Bd Abbé Le Cam 56100 Lorient France
Ulrich, Clara DTU Aqua, National Institute of Aquatic Resources, Technical University of Denmark, Charlottenlund Slot, Jægersborg Allé 1, 2920 Charlottenlund, Denmark
Vanhee, Willy ILVO - Institute for Agricultural and Fisheries Research Unit Animal Sciences - Fisheries Ankerstraat 1, B-8400 Oostende, Belgium
Tel 00-32-59-34-22-55 Fax 00-32-59-33-06-29
van Oostenbrugge, Hans
Landbouw Economish Instituut- LEI, Fisheries Section, Burg. Patijnlaan 19 P.O.Box 29703 2502 LS The Hague The Netherlands
Tel:+31 (0)70 3358239 Fax: +31 (0)70 3615624
Hans.vanOostenbrugge@wur. Nl
External expert
Leskelä, Ari Finnish Game and Fisheries Research Institute, Yliopistokatu 6, FI-80100 Joensuu, FINLAND

European Commission
EUR 26669 EN – Joint Research Centre – Institute for the Protection and Security of the Citizen
Title: Scientific, Technical and Economic Committee for Fisheries (STECF) – Opinion by written procedure – Review of scientific advice for 2015- part I
– Advice on stocks in the Baltic Sea (STECF-14-10).
Author(s):
STECF members: Casey, J., Abella, J. A., Andersen, J., Bailey, N., Bertignac, M., Cardinale, M., Curtis, H., Daskalov, G., Delaney, A., Döring, R.,
Garcia Rodriguez, M., Gascuel, D., Graham, N., Gustavsson, T., Jennings, S., Kenny, A., Kraak, S., Kuikka, S., Malvarosa, L., Martin, P., Murua, H.,
Nord, J., Nowakowski, P., Prellezo, R., Sala, A., Scarcella, G., Somarakis, S., Stransky, C., Theret, F., Ulrich, C., Vanhee, W. & Van Oostenbrugge, H. External expert: Leskelä, A.
Luxembourg: Publications Office of the European Union
2014 –41 pp. – 21 x 29.7 cm
EUR – Scientific and Technical Research series – ISSN 1831-9424 (online), ISSN 1018-5593 (print)
ISBN 978-92-79-38470-7
doi:10.2788/83919
Abstract The scientific advice on the stocks and fisheries in the Baltic Sea in 2015 evaluated and endorsed by the Scientific, Technical and Economic Committee for Fisheries (STECF) by written procedure in June 2014 on a request by the European Commission.

How to obtain EU publications Our priced publications are available from EU Bookshop (http://bookshop.europa.eu), where you can place an order with the sales agent of your choice. The Publications Office has a worldwide network of sales agents. You can obtain their contact details by sending a fax to (352) 29 29-42758.
ISBN 978-92-79-38470-7 doi:10.2788/83919
As the Commission’s in-house science service, the Joint Research Centre’s mission is to provide EU policies with independent, evidence-based scientific and technical support throughout the whole policy cycle. Working in close cooperation with policy Directorates-General, the JRC addresses key societal challenges while stimulating innovation through developing new standards, methods and tools, and sharing and transferring its know-how with the Member States, the scientific community and international partners. ------------------------------------------------------------------------------------------------------------------------------- The Scientific, Technical and Economic Committee for Fisheries (STECF) has been established by the European Commission. The STECF is being consulted at regular intervals on matters pertaining to the conservation and management of living aquatic resources, including biological, economic, environmental, social and technical considerations.
LB-N
A-2
6669
-EN
-N