Embed Size (px)
Citation preview

StealthGas Inc.
4th Quarter 2012 Results
February 21st , 2013
CONSISTENCY & GREAT VALUE
Disclaimer
Forward-Looking Statements
This presentation contains forward-looking statements within the meaning of applicable federal securities laws. Such statements are based upon current expectations that involve risks and uncertainties. Any statements contained herein that are not statements of historical fact may be deemed to be forward-looking statements. For example, words such as “may,” “will,” “should,” “estimates,” “intends,” and similar expressions are intended to identify forward-looking statements. Actual results and the timing of certain events may differ significantly from the results discussed or implied in the forward-looking statements. Among the factors that might cause or contribute to such a discrepancy include, but are not limited to the risk factors described in the Company’s Registration Statement filed with the Securities and Exchange Commission, particularly those describing variations on charter rates and their effect on the Company’s revenues, net income and profitability as well as the value of the Company’s fleet.
1

Business Strategy Implementation
Consolidation and fleet renewal
Took delivery of 2 Newbuilding LPG carriers in January & June 2012
Sold 2 LPG carriers in 2012
Acquired 4 Newbuilding LPG carriers to be delivered in 2014 & 2015
Moderate Leverage Q4 2012 net debt to capitalization: 46.4%
Visible Revenue Stream – Consistency
75% of voyage days fixed for FY 2013
42% of voyage days fixed for FY 2014
Modern Fleet Our fleet average age is 10.9 years
Close Customer Relations High quality customer base – low counterparty risk
Cost-Efficient Operations
Consistent Breakeven
Net Income Breakeven of $5,824 per day in Q4 2012 (net on interest rate swaps), compared to $5,991 per day in Q3 2012 to $5,816 in Q2 2012
and $5,847 in Q1 2012.
Share Repurchases 15 million share repurchase program, 1.8 million shares since the program’s inception (cost $8.5 million).
Business Strategy
2

Fleet Development
Newbuilding program of 12 LPG carriers completed with the 2 latest deliveries in 2012
Remaining newbuilding acquisitions have committed financing
With $45mil cash and 3 unencumbered vessels + leverage = $120mil dry powder
3

Fleet Employment Profile
4
Financial Highlights
5
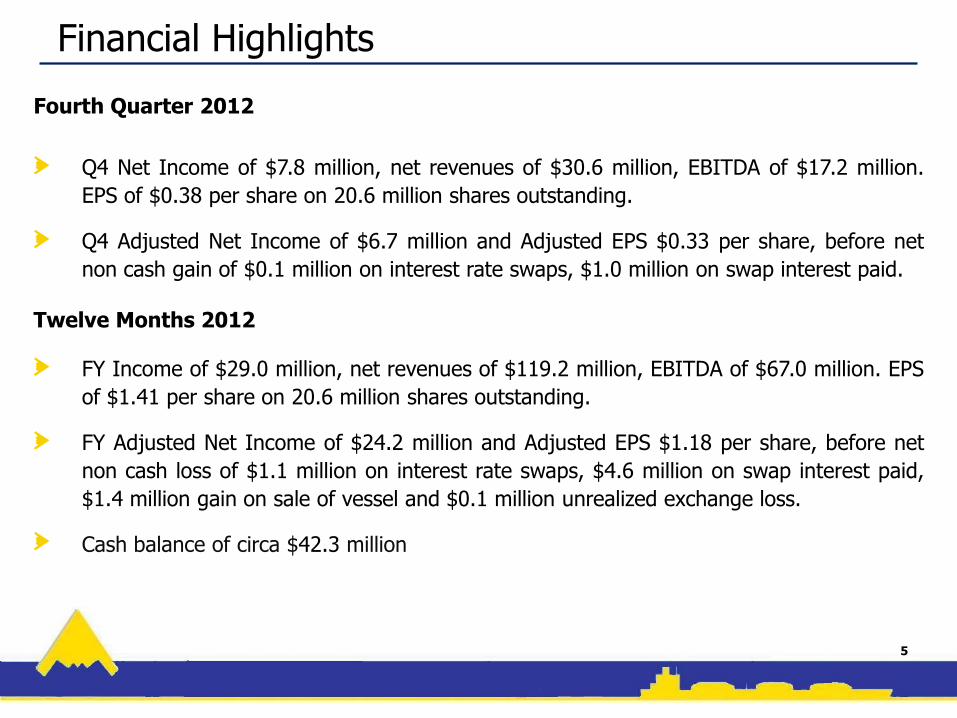
Fourth Quarter 2012
Q4 Net Income of $7.8 million, net revenues of $30.6 million, EBITDA of $17.2 million.
EPS of $0.38 per share on 20.6 million shares outstanding.
Q4 Adjusted Net Income of $6.7 million and Adjusted EPS $0.33 per share, before net
non cash gain of $0.1 million on interest rate swaps, $1.0 million on swap interest paid.
Twelve Months 2012
FY Income of $29.0 million, net revenues of $119.2 million, EBITDA of $67.0 million. EPS
of $1.41 per share on 20.6 million shares outstanding.
FY Adjusted Net Income of $24.2 million and Adjusted EPS $1.18 per share, before net
non cash loss of $1.1 million on interest rate swaps, $4.6 million on swap interest paid,
$1.4 million gain on sale of vessel and $0.1 million unrealized exchange loss.
Cash balance of circa $42.3 million

2012 Income Statement
6
In US$ 000, except per share amounts
Q4 2011 Q4 2012 FY 2011 FY 2012
Net Revenues $28,884 $30,586 $118,281 $119,213
Voyage Costs 4,733 3,856 17,829 12,704
Running Costs 7,766 7,734 36,558 30,592
Operating Income 6,784 9,845 19,826 39,291
Net Income 4,446 7,759 8,550 28,958
Net Income, adjusted 3,438 6,709 11,631 24,177
EBITDA 13,614 17,200
44,539 66,922
EPS 0.22 0.38
0.41 1.41
EPS, adjusted 0.17 0.33 0.56 1.18
Number of Shares, diluted 20,552,568 20,552,568 20,909,154 20,552,568

Balance Sheet
7
December 31, December 31,
2011 2012
Cash and Cash Equivalents incl. restricted 51,793,666 50,913,655
Current Assets excl. cash 5,106,792 6,649,752
Vessels held for sale 921,285 --
Advances for vessels under construction 22,347,811 19,321,045
Vessels, net 613,832,973 634,634,671
Other assets 1,707,624 1,519,908
Total Assets 695,710,151 713,039,031
Current portion of long term debt 33,166,887 35,787,544
Current portion of long term debt associated with vessel held for sale 791,823 --
Current Liabilities 22,142,145 20,021,170
Long Term Debt 317,109,471 309,564,768
Other Liabilities 9,401,798 5,632,107
Stockholders' Equity 313,098,027 342,033,442
Total Liabilities and Stockholders Equity 695,710,151 713,039,031

2012 Operating Highlights
8
Fleet Data & Daily Results
* Assuming no vessels on Bareboat Charter
Fleet Data Q4 2011 Q4 2012 FY 2011 FY 2012
Average number of vessels in fleet 37.0 37.0 37.6 36.9
Period end number of vessels in fleet 37 37 37 37
Total calendar days for fleet 3,404 3,404 13,716 13,494
Total voyage days for fleet 3,262 3,401 13,368 13,342
Fleet utilization 95.8% 99.9% 97.5% 98.9%
Total charter days for fleet 2,647 2,817 10,455 11,531
Total spot market days for fleet 615 584 2,913 1,811
Fleet operational utilization 90.5% 95.5% 89.7% 95.4%
Average Daily Results (in $) Q4 2011 Q4 2012 FY 2011 FY 2012
Time Charter Equivalent – TCE $8,882* $9,532 * $8,827* $9,700 *
Vessel Operating Expenses 4,018* 3,889* 4,342* 4,056*
Management Fees 319 325 347 320
General & Administrative Expenses 198 202 193 210
Total Vessel Operating Expenses 4,216* 4,091* 4,535* 4,266*

Financial Estimator 2013
9
Contracted Revenues $78 million
Non contracted Voyage days 3,800 days
Drydock Expenses 5 vessels during the year
Interest & Swaps (cash portion) $8.5 million interest $2.5million swaps
Operating Expenses $8 million per quarter
Depreciation $29.3 million
Average Rate $11,000 $12,000 $13,000
EBITDA 82million 97million 112million
EBITDA Estimates if all the LPG vessels in the fleet were chartered at the TC rate below:

Charter Market Rate Indicator (12 Month TCs)
Source: Lorentzen & Stemoco
10
Q3 2012 Average
Q4 2012 Average
Q1 2013 Forecast
3,200 CBM S/R 267,300 260,385 255,000
3,500 CBM P/R 241,730 234,615 237,500
5,000 CBM P/R 306,920 290,000 290,000
6,000 CBM 435,000 435,000 440,000
15,000 CBM 650,000 650,000 750,000
35,000 CBM 805,770 801,923 825,000
60,000 CBM 950,000 921,154 900,000
78,000 CBM 1,077,000 959,615 775,000

Global Seaborne LPG Trade
11
Seaborne LPG trade grew by ~ 8-10% in 2012 driven by demand from emerging economies.
Total seaborne trade for 2013 is expected to increase by 16% from 2010 and come to 100.6mmt; it is
expected to rise by at least ~5% annually through 2016.
Asian imports rose by ~12% in 2012, contributing to 90% of the growth in LPG seaborne trade.
Source: Global Insight, Danish Ship Finance, DVB & Clarckson

US LPG Trade
12
2012, was the first time the US LPG exports exceeded its imports since 1973; it is expected to exceed 5mmt in 2013 against 3.7mmt in 2012 and before reaching 7mmt in 2014.
The new era of shale gas boom in the US is a game changer. The USCG confirmed pressurized owners would be able to load Propane in the US. This could lead to the strategic development of several smaller export terminals in the US to supply Latin America and the Caribbean market which to a great extent have pressurized receiving terminals.
Source: Bloomberg, Pareto, Poten & Partners

LPG Major Trades
13
The Middle East remained the single largest contributor to growth in total LPG exports in 2012, with
an increase of LPG supply for exports by 8%.
LPG in the US is cheaper than the biggest suppliers in the Middle East, which account for ~35mmt a
year of the estimated 85mtt global seaborne trade. With strong growth in US NGL production from
shale ahead, the export capacity in the US is expected to rise to 12mmt in 2015 from 5mmt now.

An overloaded orderbook in mainstream segments But not in the LPG space
* Includes all LPG Carriers size categories
15
LPG orderbook still remains smaller than other shipping segments with a limited fleet
growth of pressurized vessels for 2012 and a negative fleet growth from 2013 onwards.
StealthGas is in a position to take advantage of positive market dynamics.
25%24%
19% 19%
12% 12%
0%
5%
10%
15%
20%
25%
30%
LNG Offshore Drybulk Container Crude Tankers LPG

3000-8000 cbm Fleet Development Vs. TC Rates/Earnings*
•TC equivalent spot earnings are assessed average earnings in the spot market excluding waiting time. Yearly average
•Fleet growth excl. Chinese fleet, assuming 30 year scrap age by end 2013.
Source: Inge Steensland AS 16
-5%
0%
5%
10%
-
100
200
300
400
500
600
20
00
20
01
20
02
20
03
20
04
20
05
20
06
20
07
20
08
20
09
20
10
20
11
20
12
20
13
20
14
20
15
Flee
t gr
ow
th in
% (
bar
s)
TC e
qu
iv. s
po
t ea
rnin
gsTC
rat
es in
USD
10
00
's p
er m
on
th (
lines
)
Overall 3000-7999 fleet growth SR 3000-7999 fleet growth
SR 6500 cbm TCE SR 3500 cbm 1yr TC
PR 3500 cbm 1yr TC East
INGE STEENSLAND AS

Valuations comparison
Based on Seaborne Capital Advisors February 7th 2012. For StealthGas, based on company’s estimates. 17
Company P/NAV P/EPS 2012
GASLOG (GLOG) 505.5 % 62.6x
GOLAR LNG (GNLG) 178 % 24.3x
SCORPIO TANKERS (STNG) 176.1 % NA
CAPITAL PRODUCT PARTNERS (CPLP) 254.5 % NA
TSAKOS ENERGY NAVIGATION (TNP) 247.1 % NA
TEEKAY TANKERS (TNK) 162.3 % NA
STEALTHGAS (GASS) 75 % 7.7x
Shipping companies listed in the US listed operating in different sectors such as gas, tankers and drybulk,
are trading well above net asset values. Although there may be a variety of reasons for that, we believe there
are no other US listed company operating in a sector that has better fundamentals than our LPG sector; and
yet our stock continues to trade far below our net asset value.

Contacts
Company Contact: Konstantinos Sistovaris Visit our Website at: Chief Financial Officer www.stealthgas.com StealthGas Inc. 011-30-210-6250-001 E-mail: [email protected] www.stealthgas.com
Weekly LPG Market Report
updated every Monday
Comprehensive Investor
Relations Information
18