Embed Size (px)
Citation preview
NASA TECHNICAL NOTE N A S A TfJ e, 1
658-
STEADY-STATE ELECTRICAL PERFORMANCE OF A 480-HERTZ BRAYTON CYCLE TURBOALTERNATOR AND CONTROLS
by Martin E. ViaZgora and Dennis A. Perx
Lewis Research Center *L
CZeveZand, Ohio 4. I 7
N A T I O N A L A E R O N A U T I C S A N D SPACE A D M I N I S T R A T I O N W A S H I N G T O N , D. C . F E B R U A R Y 1970
https://ntrs.nasa.gov/search.jsp?R=19700009928 2020-04-10T20:15:07+00:00Z
TECH LIBRARY KAFB, NM
lllllllllllllllllllllllllllllllllllllllllllll 0332483
1. Report No. 2. Government Accession No.
NASA TN D-5658 I 4. T i t l e and Subtit le STEADY-STATE ELECTRICAL
PERFORMANCE O F A 400-HERTZ BRAYTON CYCLE TURBOALTERNATOR AND CONTROLS
7. Author(s)
Martin E. Valgora and Dennis A. P e r z 9. Performing Organization Name ond Address
Lewis Research Center National Aeronautics and Space Administration Cleveland, Ohio 44135
12. Sponsoring Agency Name ond Address
National Aeronautics and Space Administration Washington, D. C. 20546
15. Supplementary Notes
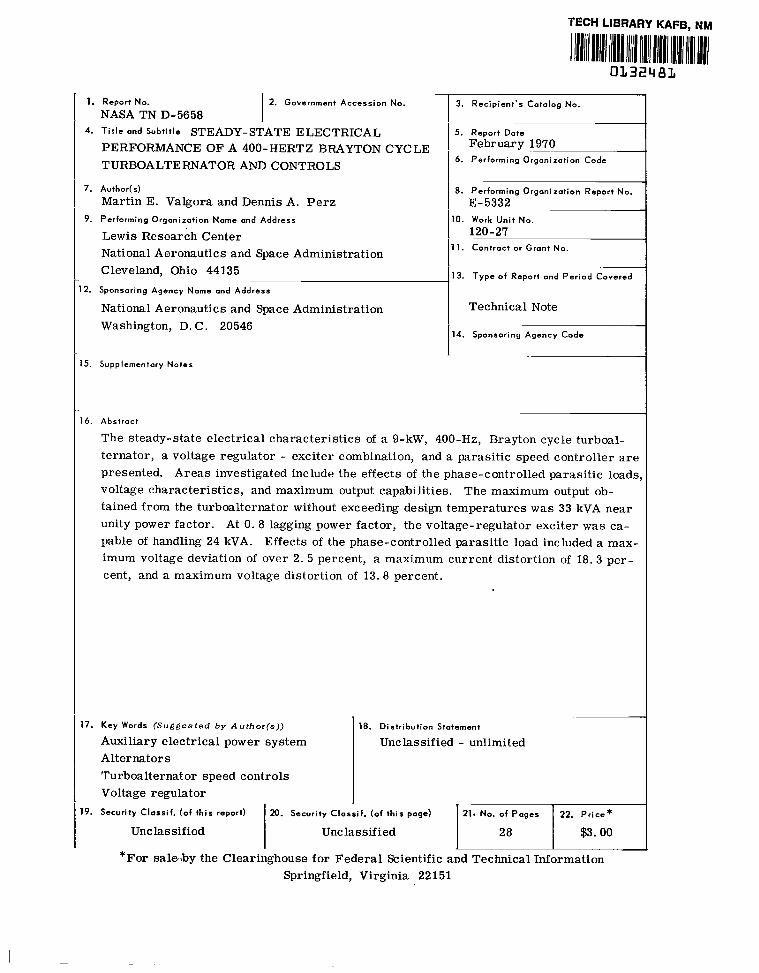
16. Abstract
The steady-state e lec t r ica l charac te r i s t ics of a 9-kW,
~
3. Recipient ’s Cotolog Nc
5. Report Date February 1970
6. Performing Orgonizatio
8. Performing Orgonizotio
E-5332 0. Work Unit No.
120-27 1. Contract or Grant No.
13. Type o f Report and P e
Technical Note
14. Sponsoring Agency Co
400-Hz, Brayton cycle ternator , a voltage regulator - exci ter combination, and a parasi t ic speed con presented. A r e a s investigated include the effects of the phase-controlled para voltage charac te r i s t ics , and maximum output capabilities. The maximum out] tained from the turboalternator without exceeding design t empera tu res was 33 unity power factor . At 0. 8 lagging power factor , the voltage-regulator excite] pable of handling 24 kVA. Effects of the phase-controlled parasi t ic load i n c h imum voltage deviation of over 2. 5 percent, a maximum current distortion of cent, and a maximum voltage distortion of 13.8 percent.
17. Key Words (Sugges ted b y Aufhorrs)) 18. Distr ibut ion Stotement
Auxiliary e lec t r ica l power system Unclassified - unlimited Alternators Turboalternator speed controls Voltage regulator
19. Security Clossif. (o f th is report) 20. Security Clossi f . (of th is page) 21. No. o f Pages 22.
Unclassified Unclassified 1 28
STEADY-STATE ELECTRICAL PERFORMANCE OF A 400-HERTZ
BRAYTON CYCLE TURBOALTERNATOR AND CONTROLS
by M a r t i n E. Valgora and Denn is A. Perz
Lewis Research Center
SUMMARY
The steady-state electrical characteristics of a 9-kilowatt, 400-hertz Brayton cycle turboalternator, a voltage regulator - exciter combination, and a parasitic speed controller a r e presented. Areas investigated include the effects of the phase-controlled parasitic loads, voltage characteristics, and maximum output capabilities. In general, the operation of the three components as a system w a s satisfactory. The maximum output obtained from the turboalternator without exceeding design temperatures w a s 33 kilovolt-amperes near unity power factor. At 0. 8 lagging power factor, the voltage regulator - exciter w a s capable of handling 24 kilovolt-amperes. Effects of the phase-controlled parasitic load included a maximum voltage deviation of over 2. 5 percent, a maximum current distortion of 18.3 percent, and a maximum voltage distortion of 13.8 percent.
1 NTR0DUCTION
This report presents the steady-state electrical operating characteristics as determined experimentally of a 9-kilowatt, 400-hertz Brayton cycle turboalternator and electrical controls. This turboalternator is suitable for use in a two-shaft Brayton cycle space power system (refs. 1 to 3). The electrical system tested consisted of a turboalternator, a voltage regulator - exciter combination, and a parasitic-loading speed controller, as required for the complete power system.
The turboalternator and voltage regulator - exciter were furnished to the NASA Lewis Research Center under contract NAS 3-6013 by Pratt and Whitney Aircraft. The General Electric Company designed and fabricated the alternator and voltage-regulator exciter (ref. 4). The parasitic speed controller w a s designed and built at the NASA Lewis Research Center.
--
Prior to the testing reported herein, each of these components w a s individually evaluated experimentally. An experimental alternator, which w a s an electromagnetic equivalent of the turboalternator, w a s tested at Lewis (ref. 5). This experimental alternator had oil-lubricated bearings, whereas the turboalternator reported on herein had gas-lubricated bearings. This bearing change is a factor that modified the leakage flux and wil l be discussed. In addition, component testing w a s performed at Lewis on breadboard versions of the voltage regulator - exciter and parasitic speed controller (refs. 6 to 8). On completion of these tests, the gas-bearing turboalternator was tested with the same voltage regulator - exciter and parasitic speed controller tested earlier.
In general, this report is limited to the steady-state electrical characteristics of these components operating together as a system at design conditions, However, some overload limits were investigated and a r e reported. Two methods of speed control were used, allowing a comparison of performance with linear and with nonlinear loads. (A linear load is herein defined as one that has a constant impedance with variations in voltage and time. ) Results of the turboalternator testing are compared with data obtained from similar testing of the experimental alternator.
The test results a r e grouped into three sections: (1) effects of the parasitic speed controller, (2) voltage characteristics, and (3) maximum output capability of components.
APPARATUS
Brayton Cycle Components
GenerB1. - The components developed under the Brayton cycle program and discussed in this report a r e the turboalternator, the voltage regulator - exciter, and the parasitic speed controller.
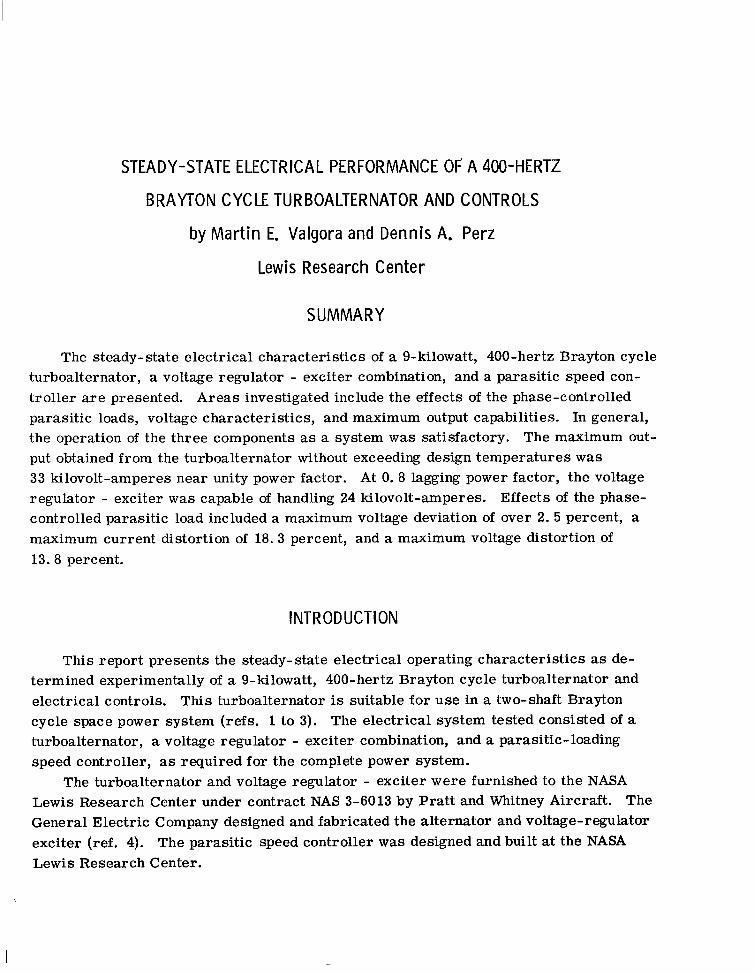
These three components operating together a r e referred to as the electrical system. A schematic diagram of the experimental circuit used, including test components, is shown in figure 1.
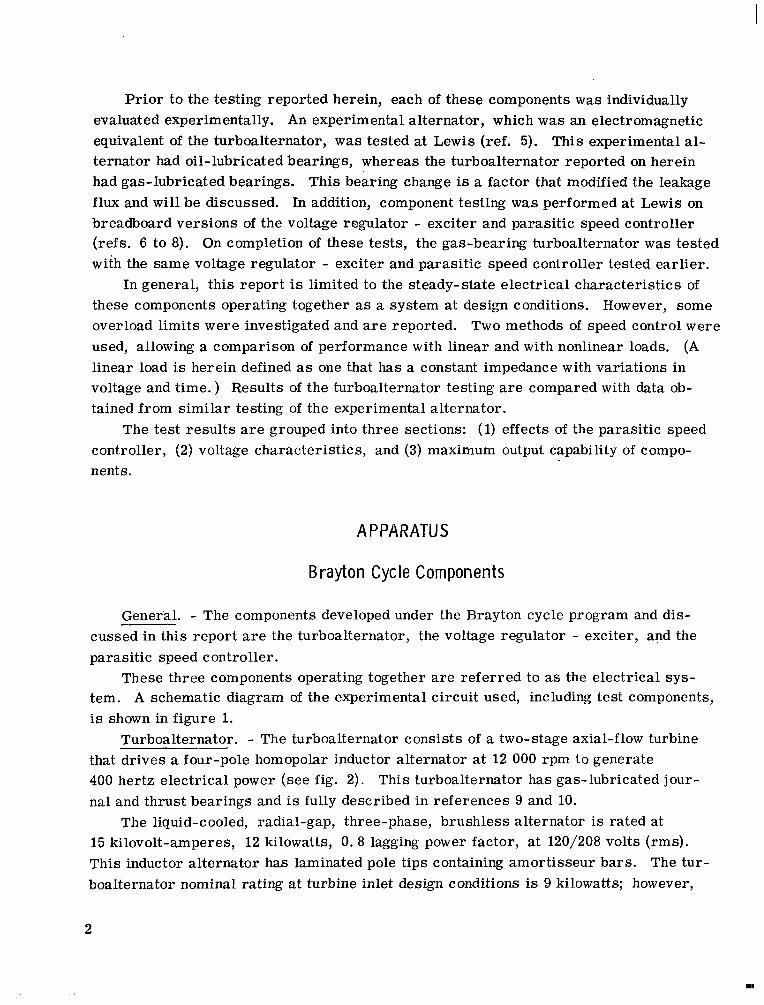
Turboalternator. - The turboalternator consists of a two-stage axial-flow turbine that drives a four-pole homopolar inductor alternator at 12 000 rpm to generate 400 hertz electrical power (see fig. 2). This turboalternator has gas-lubricated journal and thrust bearings and is fully described in references 9 and 10.
The liquid-cooled, radial-gap, three-phase, brushless alternator is rated at 15 kilovolt-amperes, 12 kilowatts, 0. 8 lagging power factor, at 120/208 volts (rms). This inductor alternator has laminated pole tips containing amortisseur bars. The turboalternator nominal rating at turbine inlet design conditions is 9 kilowatts; however,
2
Tur -b ine
1 Alter--^I-.. I1 ''dLur I l e x i i t e r I
;I
I -y 4I
U s e h dIIOaa
To faci l i ty argon compressor and heater
Turb ine Turb ine bypass contro l
exhaust --..'--I 1
16_ _ _ _ _ _ _ -1 t I I
. .......... IA Ammeter W Wattmeter f Frequency meter A M Amplitude modulation meter
Figure 1. -Test setup.
v
-67--3664 Figure 2. - Turboalternator.
3
36-in. (91-cm) overal l length -
Gas flow
Turb ine
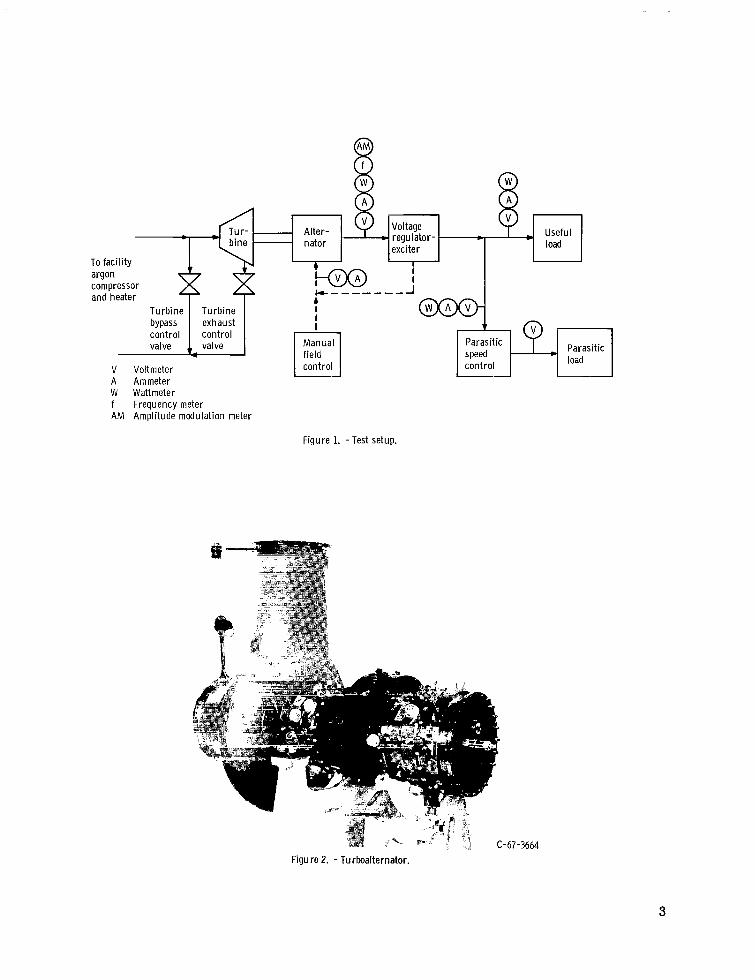
Figure 3. - Cross-sectional view of turboalternator.
in order t o be conservative the alternator w a s designed for 12 kilowatts. This design resulted in low losses and maximum efficiency in the 9- to 10-kilowatt output range (see ref. 5).
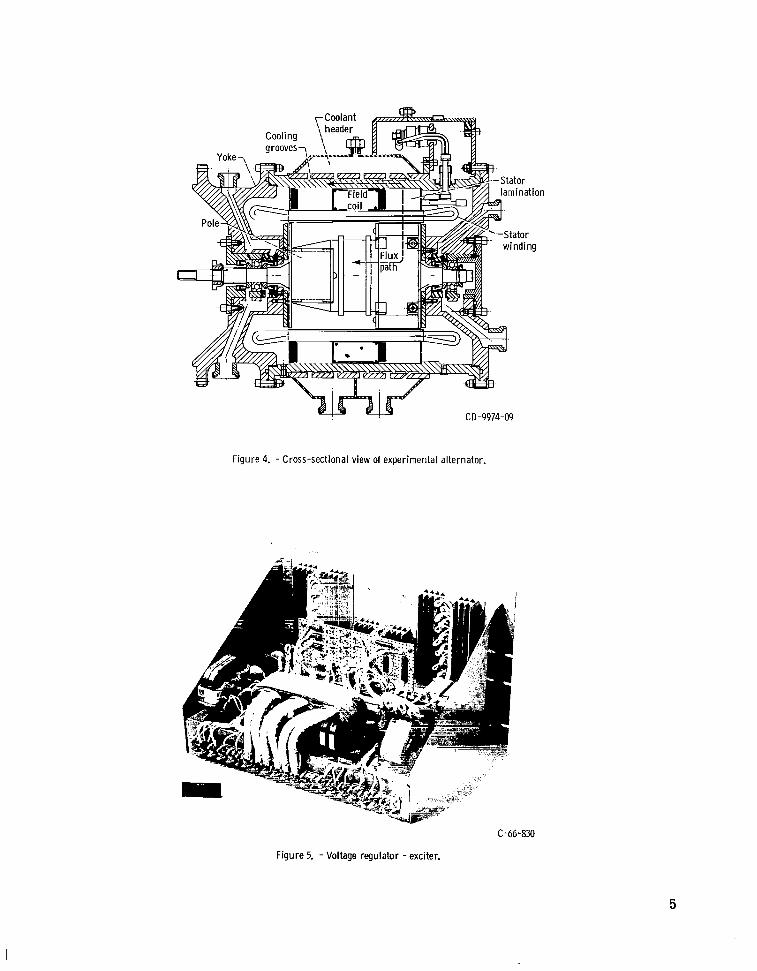
Cross-sectional views of the turboalternator and experimental alternator appear in figures 3 and 4, which illustrate the differences in rotor geometries. These differences a r e discussed later in the section Excitation requirements.
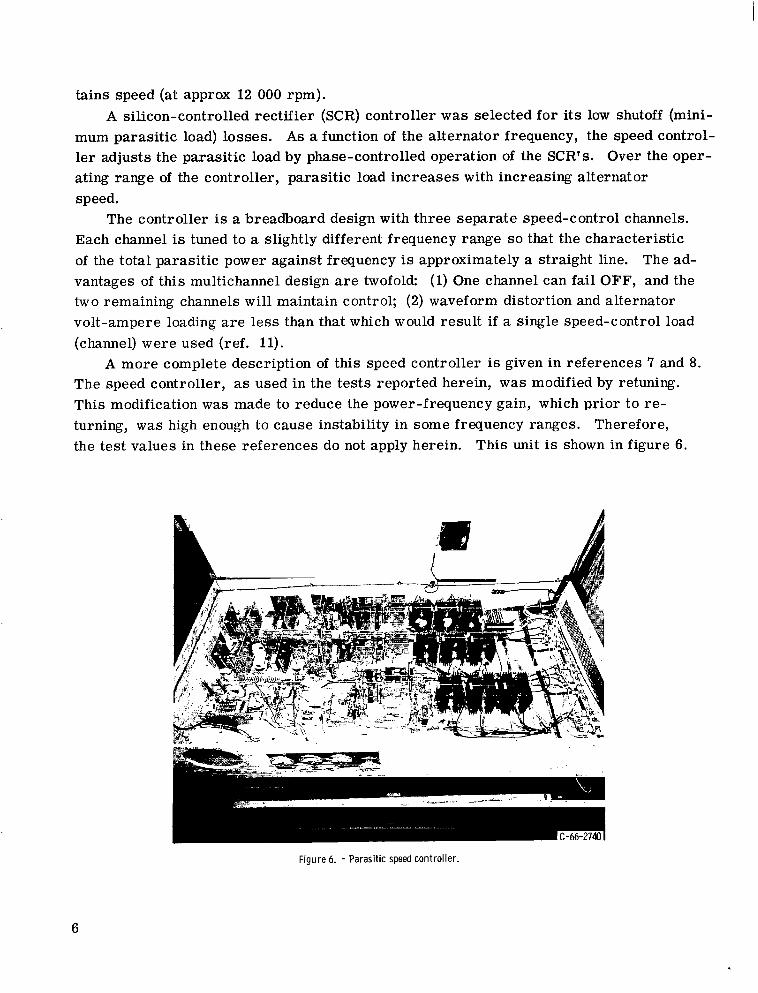
- - exciter.Voltage regulator --~ - - ~- The breadboard voltage regulator - exciter used for this testing is shown in figure 5. This static regulator uses both voltage and current feedback to
(1) Regulate the voltage at the useful load (2) Limit the highest phase load voltage to 132 volts (3) Supply field current during short-circuit conditions A complete description of this regulator with resul ts of preliminary testing is given
in reference 6. Parasitic-load speed controller. - Speed regulation is achieved in this Brayton_ _
-.
power system by adjusting the electrical output to balance a constant turboalternator input. The turboalternator output is absorbed by two distinct loads: the useful load (which includes all systems and equipment designated as part of an assigned mission), and the parasitic load. The parasitic load is used to compensate for variations in the useful load. Since turbine input power is fixed, a constant turboalternator load main
4
CD-9974-09
Figure 4. - Cross-sectional view of experimental alternator.
C-66-8%
Figure 5. - Voltage regulator -exciter.
5
tains speed (at approx 12 000 rpm). A silicon-controlled rectifier (SCR)controller was selected for its low shutoff (mini
mum parasitic load) losses. As a function of the alternator frequency, the speed controller adjusts the parasitic load by phase-controlled operation of the SCR's. Over the operating range of the controller, parasitic load increases with increasing alternator speed.
The controller is a breadboard design with three separate speed-control channels. Each channel is tuned to a slightly different frequency range s o that the characteristic of the total parasitic power against frequency is approximately a straight line. The advantages of this multichannel design a r e twofold (1)One channel can fail OFF, and the two remaining channels wil l maintain control; (2) waveform distortion and alternator volt-ampere loading are l e s s than that which would result if a single speed-control load (channel) were used (ref. 11).
A more complete description of this speed controller is given in references '7 and 8. The speed controller, as used in the tes ts reported herein, w a s modified by retuning. This modification was made to reduce the power-frequency gain, which prior to r e turning, w a s high enough to cause instability in some frequency ranges. Therefore, the test values in these references do not apply herein. This unit is shown in figure 6.
Figure 6. - Parasitic speed control ler.
6

Auxiliary Equipment and Instrumentation
The useful load bank, parasitic load bank, contactors, switches, and wiring are standard commercial types. The useful load bank has variable resistance and inductive reactance, whereas the parasitic load has variable resistance only. An auxiliary direct-current power supply w a s used to supply field excitation current when the capacity of the voltage regulator - exciter w a s exceeded during overload tests.
Because of the distorted waveforms that were encountered, all instruments used were the wide-frequency-range t rue- rms electronic type. The ac voltage and current signals were converted by solid-state thermocouple-type converters t o direct current that w a s measured with digital voltmeters. Power w a s measured by electronic electrodynamometer converters supplying dc signals to the digital voltmeters. A comprehensive description of the turboalternator instrumentation is given in reference 9. In addition, the instruments used for measurement of total harmonic distortion a r e described in reference 12. Detailed instrument specifications used in this tes t a r e given in table I.
Test Facility
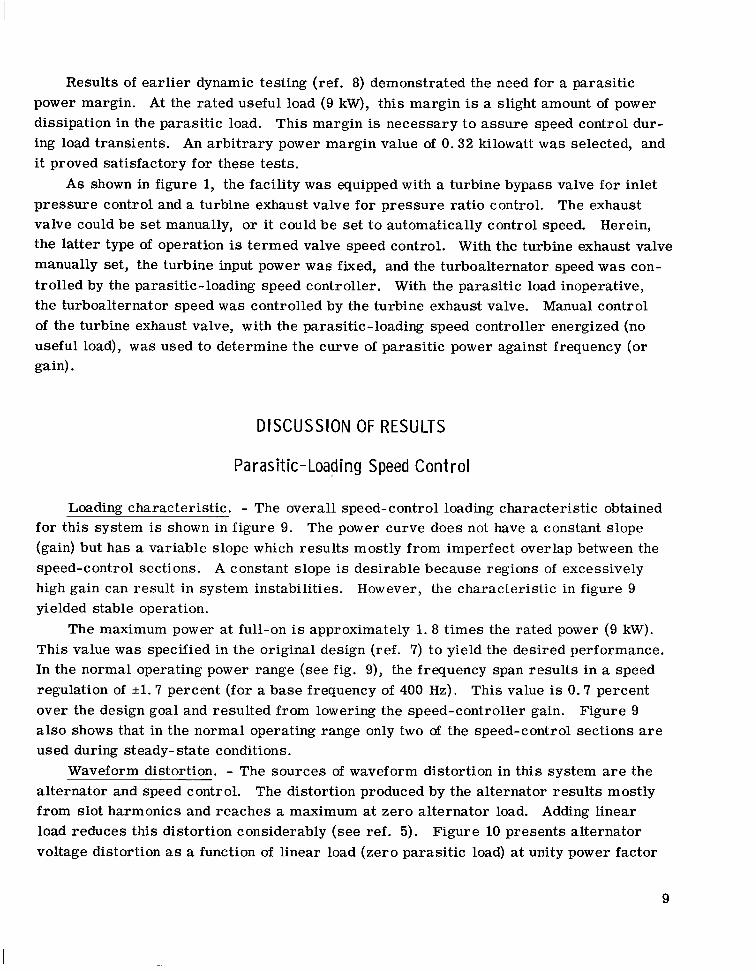
The facility use@to tes t the Brayton cycle components includes a motor-driven compressor to supply pressurized argon gas and an electric heater to produce rated turbine inlet temperature. In addition, the valves shown in figure 1 a r e provided for turbine input power control and serve as an alternate means of controlling turboalternator speed. This facility is more fully described in references 9 and 10.
The turboalternator mounted in the test facility is shown in figure 7, and the control-room instrumentation and controls a r e shown in figure 8.
TEST PROCEDURE
The experimental data discussed herein a r e measurements made of the test system operating at both design and off -design conditions. Design turbine inlet conditions were applied t o the turboalternator. Under these conditions, the total useful load power w a s varied from 0 to 9 kilowatts and 1.0 to-0. 8 lagging power factor for both balanced and unbalanced loads. The total load applied to the alternator ranged from 8.8 kilowatts at 0. 8 lagging power factor to 9 .2 kilowatts at unity power factor. (Throughout this report, no leading power factor loads are encountered, therefore, the te rm lagging wi l l be omitted. )
7
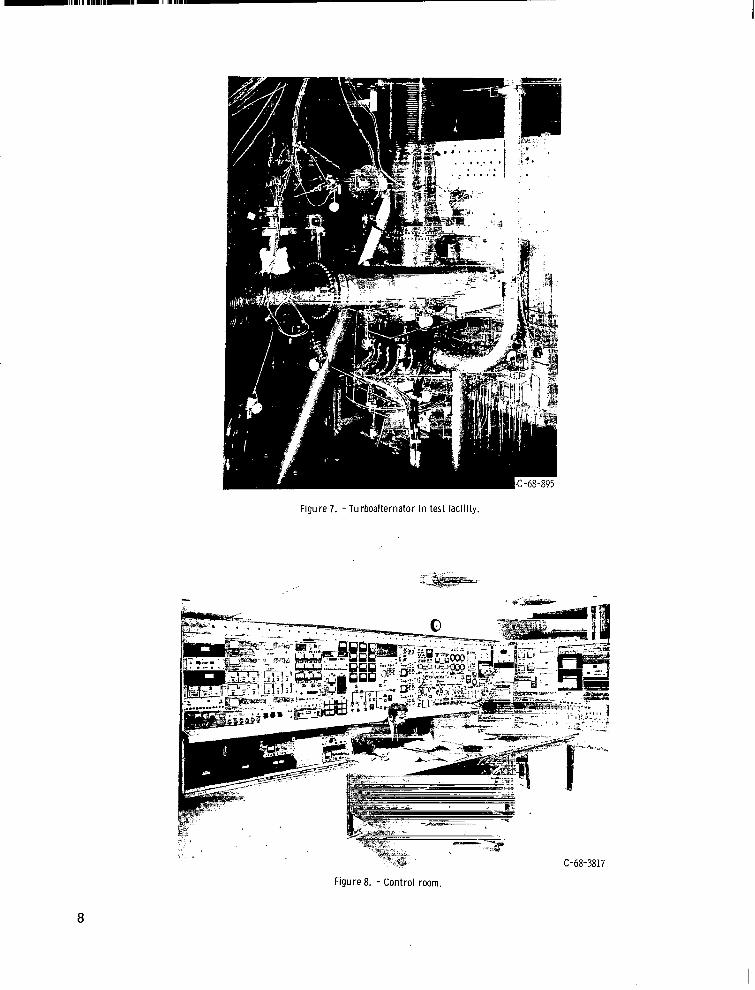
Figure 7. - Turboalternator in test facil i ty.
C-68-3817
Figure 8. - Control room.
8
Results of ear l ier dynamic testing (ref. 8) demonstrated the need for a parasitic power margin. At the rated useful load (9 kW), this margin is a slight amount of power dissipation in the parasitic load. This margin is necessary to assure speed control during load transients. An arbi t rary power margin value of 0.32 kilowatt w a s selected, and it proved satisfactory for these tests.
As shown in figure 1, the facility w a s equipped with a turbine bypass valve for inlet p ressure control and a turbine exhaust valve for pressure ratio control. The exhaust valve could be se t manually, or it could be set to automatically control speed. Herein, the latter type of operation is termed valve speed control. With the turbine exhaust valve manually set, the turbine input power was fixed, and the turboalternator speed was controlled by the parasitic-loading speed controller. With the parasitic load inoperative, the turboalternator speed w a s controlled by the turbine exhaust valve. Manual control of the turbine exhaust valve, with the parasitic-loading speed controller energized (no useful load), w a s used to determine the curve of parasitic power against frequency (or gain).
DISCUSSION OF RESULTS
Parasitic-Loading Speed Cont ro l
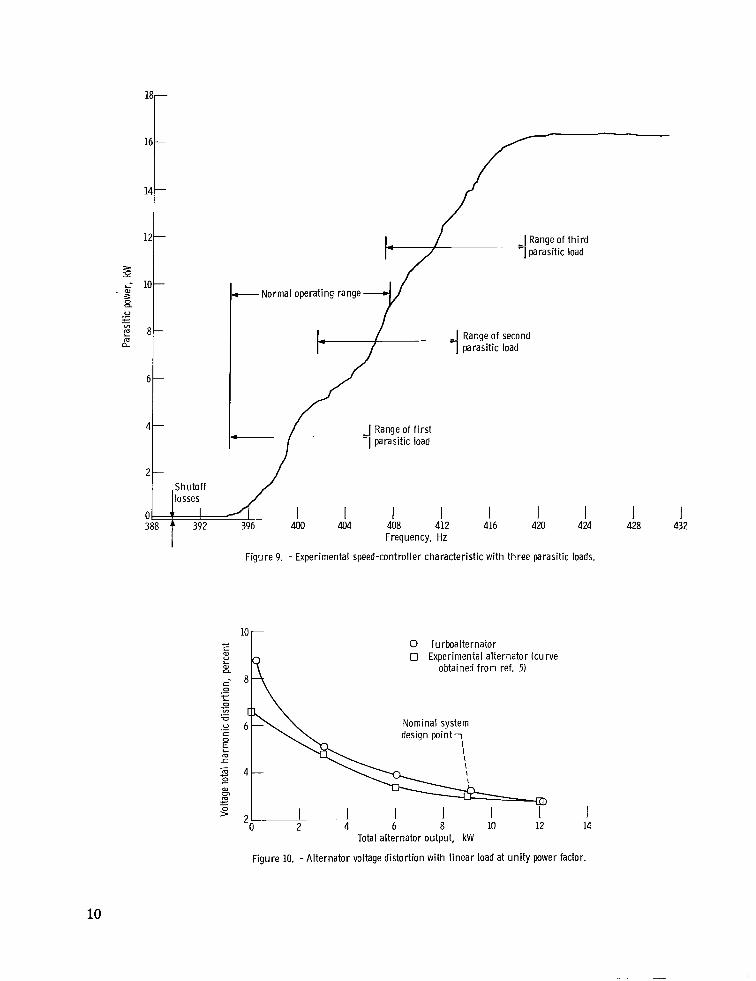
Loading characteristic. - The overall speed-control loading characteristic obtained for this system is shown in figure 9. The power curve does not have a constant slope (gain) but has a variable slope which results mostly from imperfect overlap between the speed-control sections. A constant slope is desirable because regions of excessively high gain can result in system instabilities. However, the characteristic in figure 9 yielded stable operation.
The maximum power at full-on is approximately 1.8 t imes the rated power (9 kW). This value w a s specified in the original design (ref. 7) to yield the desired performance. In the normal operating power range (see fig. 9), the frequency span results in a speed regulation of *l.7 percent (for a base frequency of 400 Hz). This value is 0.7 percent over the design goal and resulted from lowering the speed-controller gain. Figure 9 a l so shows that in the normal operating range only two of the speed-control sections a r e used during steady-state conditions.
Waveform distortion. - The sources of waveform distortion in this system are the alternator and speed control. The distortion produced by the alternator resul ts mostly from slot harmonics and reaches a maximum at zero alternator load. Adding linear load reduces this distortion considerably (see ref. 5). Figure 10 presents alternator voltage distortion as a function of linear load (zero parasitic load) at unity power factor
9
c
a,
t
c
-16
-14
-12
B -i 10
4-- Normal operating range. EB
8
6
4 - J Range of f i r s t
2 -Shutoff losses
0 . ! I I 388 f
I 392 428 432
Frequency, Hz
Figure 9. - Experimental speed-controller characterist ic w i th th ree parasitic loads.
l o r c 0 Turboalternator a,
2 0 Experimental alternator (curve a. obtained f rom ref. 5)
0 g YI.-V
.-U Nominal system t "I desiqn p o i n t 10
E m
I 14
Figure 10. -A l te rna to r voltage distort ion wi th l inear load at u n i t y power factor.
10
0 Useful load voltage 0 Al ternator c u r r e n t 0 Useful load voltage 0 Al ternator c u r r e n t
I I I I I I I I d 0 1 2 3 4 5 6 7 8 9
Parasit ic load, kW
Figure 11. -Waveform distort ion variat ion w i th parasitic load. Unity-power factor usefu l load.
for both the turboalternator and the experimental alternator. The turboalternator distortion decreases from about 9.0 percent at zero load to about 3.0 percent at 9 kilowatts. The data at the 9-kilowatt point agree well with the data obtained from the experimental alternator.
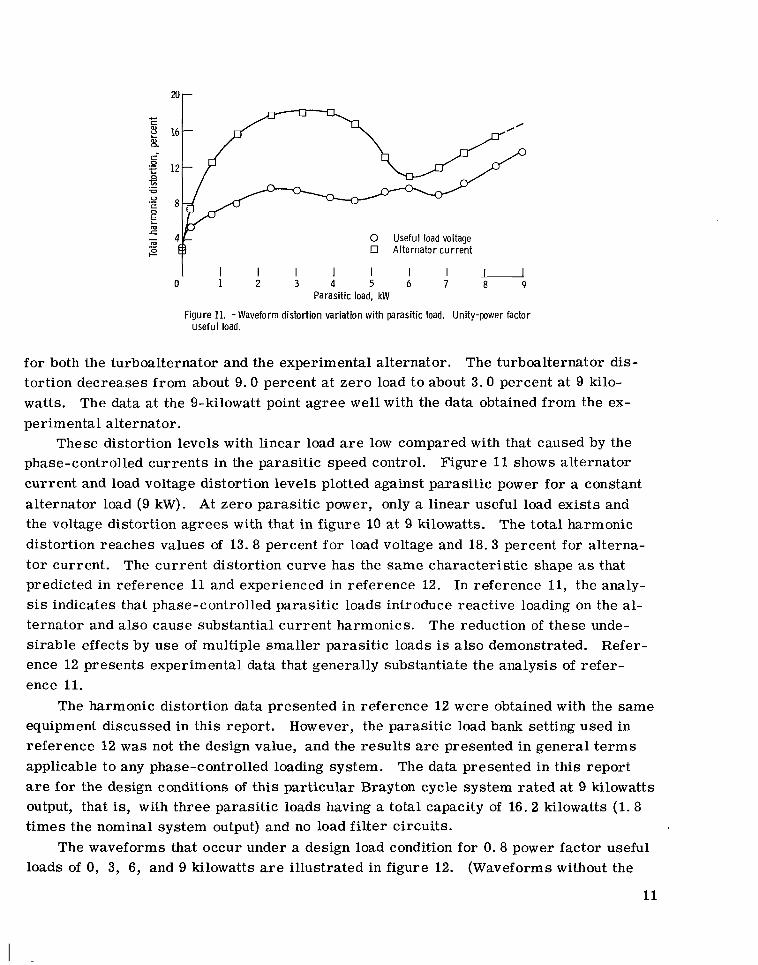
These distortion levels with linear load a r e low compared with that caused by the phase-controlled currents in the parasitic speed control. Figure 11 shows alternator current and load voltage distortion levels plotted against parasitic power for a constant alternator load (9 kW). At zero parasitic power, only a linear useful load exists and the voltage distortion agrees with that in figure 10 at 9 kilowatts. The total harmonic distortion reaches values of 13. 8 percent for load voltage and 18.3 percent for alternator current. The current distortion curve has the same characteristic shape as that predicted in reference 11 and experienced in reference 12. In reference 11, the analysis indicates that phase-controlled parasitic loads introduce reactive loading on the alternator and also cause substantial current harmonics. The reduction of these undesirable effects by use of multiple smaller parasitic loads is also demonstrated. Reference 12 presents experimental data that generally substantiate the analysis of reference 11.
The harmonic distortion data presented in reference 12 were obtained with the same equipment discussed in this report. However, the parasitic load bank setting used in reference 12 w a s not the design value, and the resul ts a r e presented in general t e rms applicable to any phase-controlled loading system. The data presented in this report are for the design conditions of this particular Brayton cycle system rated at 9 kilowatts output, that is, with three parasitic loads having a total capacity of 16.2 kilowatts (1.8 t imes the nominal system output) and no load fi l ter circuits.
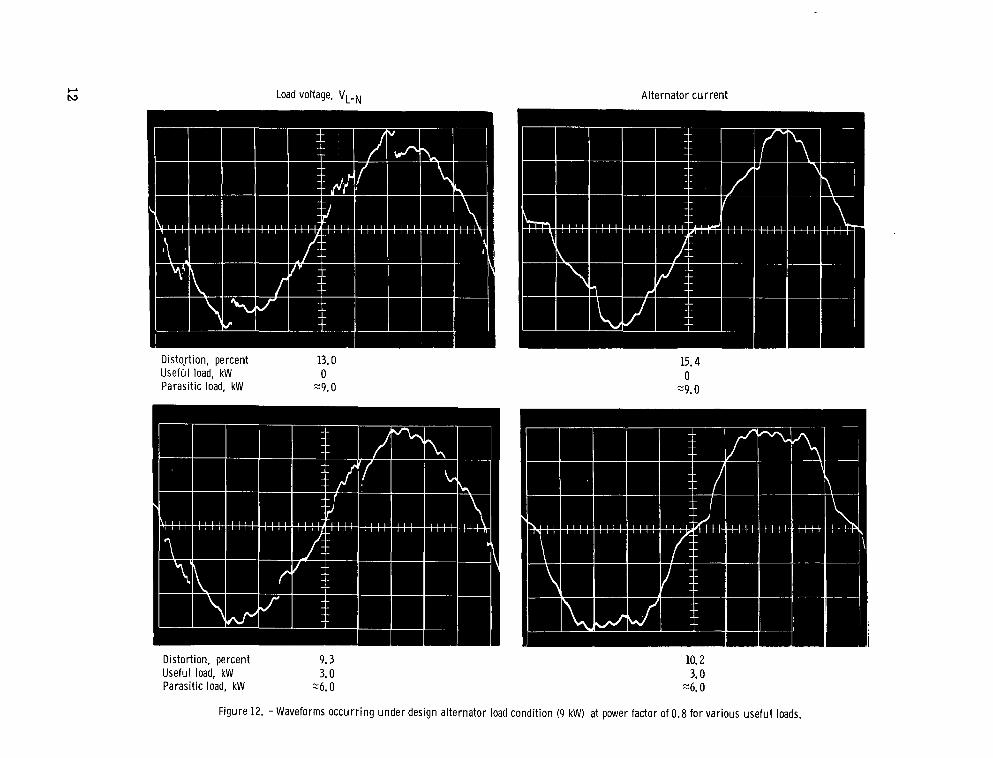
The waveforms that occur under a design load condition for 0.8 power factor useful loads of 0, 3, 6, and 9 kilowatts a r e illustrated in figure 12. (Waveforms without the
11
CL hl Load voltage, VL+, A l t e r n a t o r c u r r e n t
D is tq r t i on , percent 13.0 15.4 UseflSI load, kW 0 0 Paras i t i c load, kW "9.0 "9.0
Distor t ion, pe rcen t 9.3 10.2 Use fu l load, kW 3.0 3.0 Paras i t i c load, kW "6.0 "6.0
F igu re 12. - Waveforms o c c u r r i n g u n d e r des ign a l t e r n a t o r load cond i t i on (9 kW) a t power factor of 0.8 f o r va r ious u s e f u l loads.
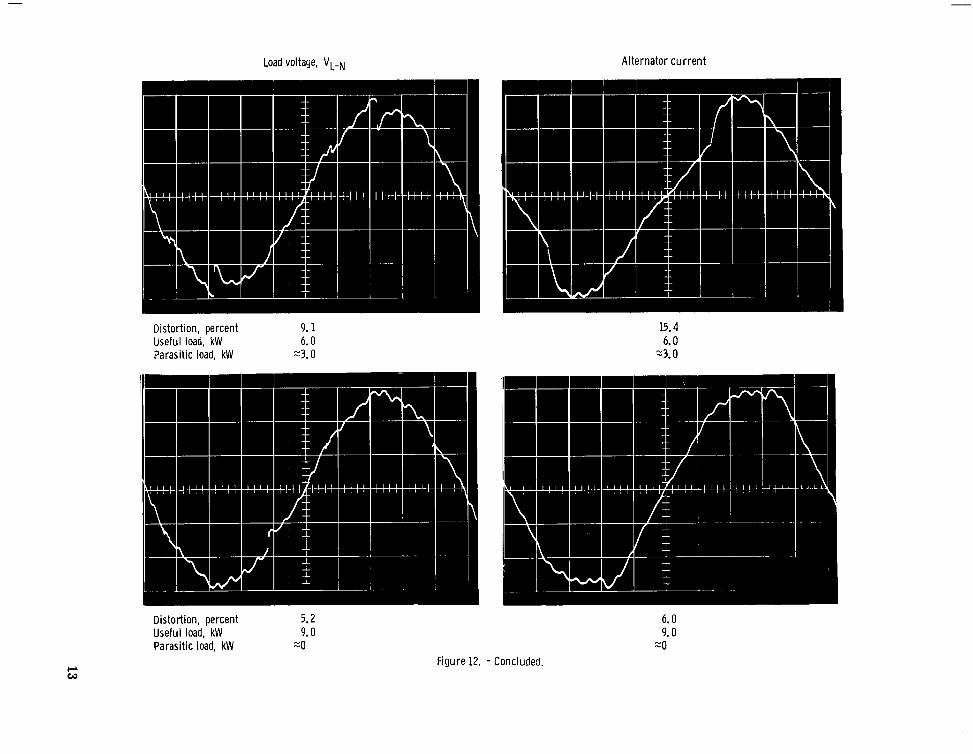
Load voltage, VLeN A l te rna to r c u r r e n t
Dis tor t ion, percent 9.1 15.4 Useful load, kW 6.0 6.0 Paras i t ic load, kW -3.0 -3.0
Distort ion, percent 5.2 6.0 Useful load, kW 9.0 9.0 Paras i t ic load, kW “0 “0
F F igu re 12. - Concluded.
W
L
parasitic speed control are depicted in ref. 5.) In figure 12, the small ripple resul ts from the slot harmonics generated by the alternator. The sharp notches are caused by increased voltage drops across the alternator internal impedance when the silicon-controlled rectifiers fire. The voltage distortion values generally agree with the unity power factor data in figure 11, but the current distortion values are lower. This current distortion reduction results from the lower power factor (0.8)linear load that introduces a higher percentage of linear load current into the waveform. The higher linear current lowers the distorting effect of the parasitic load. Also, the useful load current phase shift wil l produce a slightly different wave shape than would result at unity power factor. The reduction of alternator current distortion with reduced useful load power factor is discussed in references 11and 12.
Volt-ampere loading. - Phase-controlled parasitic loads impose an inductive characterist ic and consequent increased volt-ampere loading in turboalternators. This additional reactive loading resul ts primarily because the fundamental of the phase-controlled current lags the alternator voltage. These reactive volt-amperes increase the losses of the alternator and thereby decrease i ts efficiency. They can also require an increase in machine size without a corresponding increase in power output capacity.
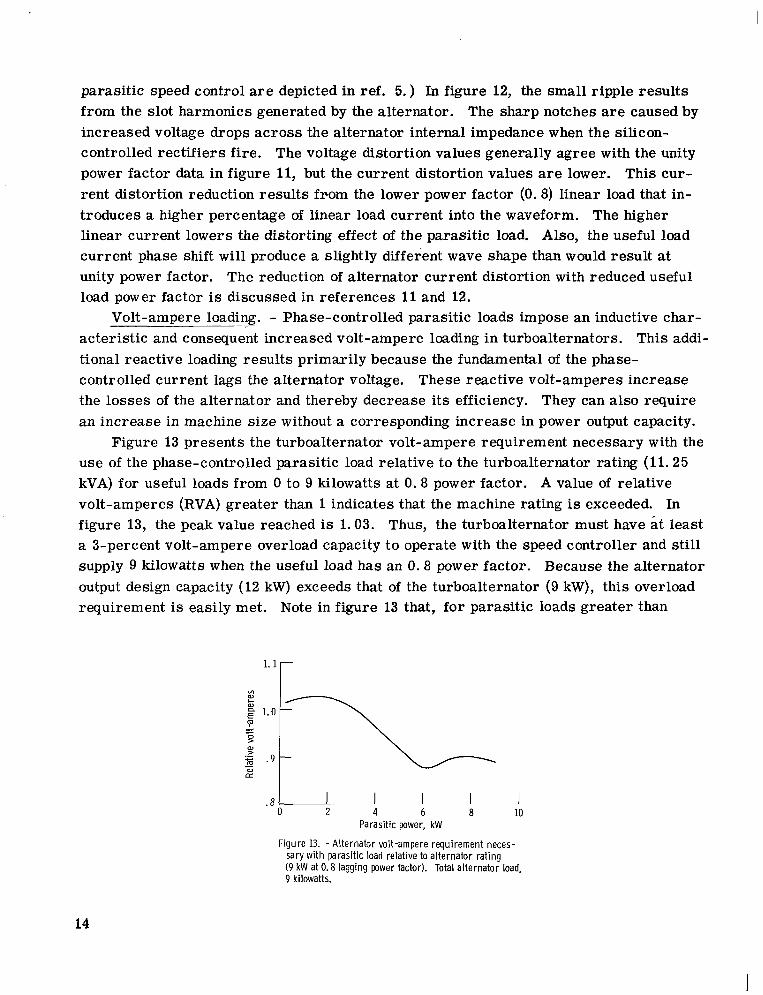
Figure 13 presents the turboalternator volt-ampere requirement necessary with the use of the phase-controlled parasitic load relative to the turboalternator rating (11.25 kVA) for useful loads from 0 to 9 kilowatts at 0.8 power factor. A value of relative volt-amperes (RVA) greater than 1indicates that the machine rating is exceeded. In figure 13, the peak value reached is 1.03. Thus, the turboalternator must have at least a 3-percent volt-ampere overload capacity to operate with the speed controller and still supply 9 kilowatts when the useful load has an 0.8 power factor. Because the alternator output design capacity (12 kW) exceeds that of the turboalternator (9 kW), this overload requirement is easily met. Note in figure 13 that, for parasitic loads greater than
maa
E" 1.0 m
. 8 rr I I I 0 2 4 6 8 10
Parasitic power, kW
Figure 13. -A l ternator volt-ampere requirement necessary wi th parasitic load relative to alternator ra t ing (9 kW at 0.8 lagging power factor). Total alternator load, 9 kilowatts.
14
3 kilowatts, the volt-ampere loading is lower than the machine rating (RVA < 1.0). This effect occurs because the power factor of the parasitic load is greater than 0. 8 in this range. This characteristic agrees with previous studies of phase-controlled parasitic loads (refs. 11 and 12).
Parasitic-load unbalance. - Because of hardware variations in the output silicon--
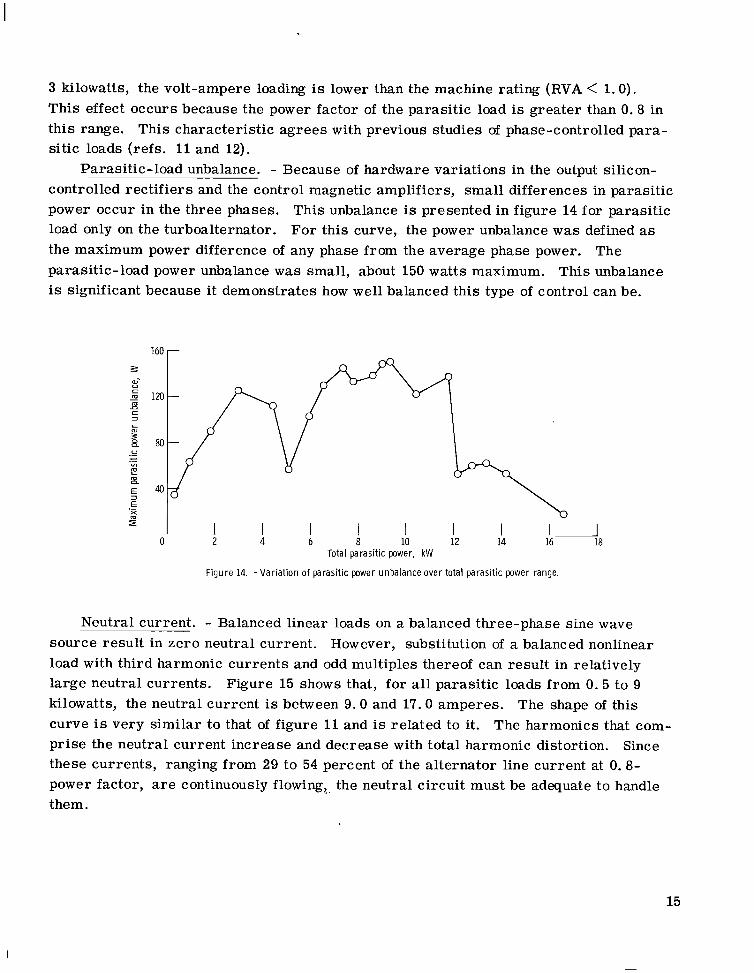
controlled rectifiers and the control magnetic amplifiers, small differences in parasitic power occur in the three phases. This unbalance is presented in figure 14 for parasitic load only on the turboalternator. For this curve, the power unbalance w a s defined as the maximum power difference of any phase from the average phase power. The parasitic-load power unbalance w a s small, about 150 wat t s maximum. This unbalance is significant because it demonstrates how well balanced this type of control can be.
160 r
Total parasitic power, kW
Figure 14. -Var ia t ion of parasitic power unbalance over total parasitic power range.
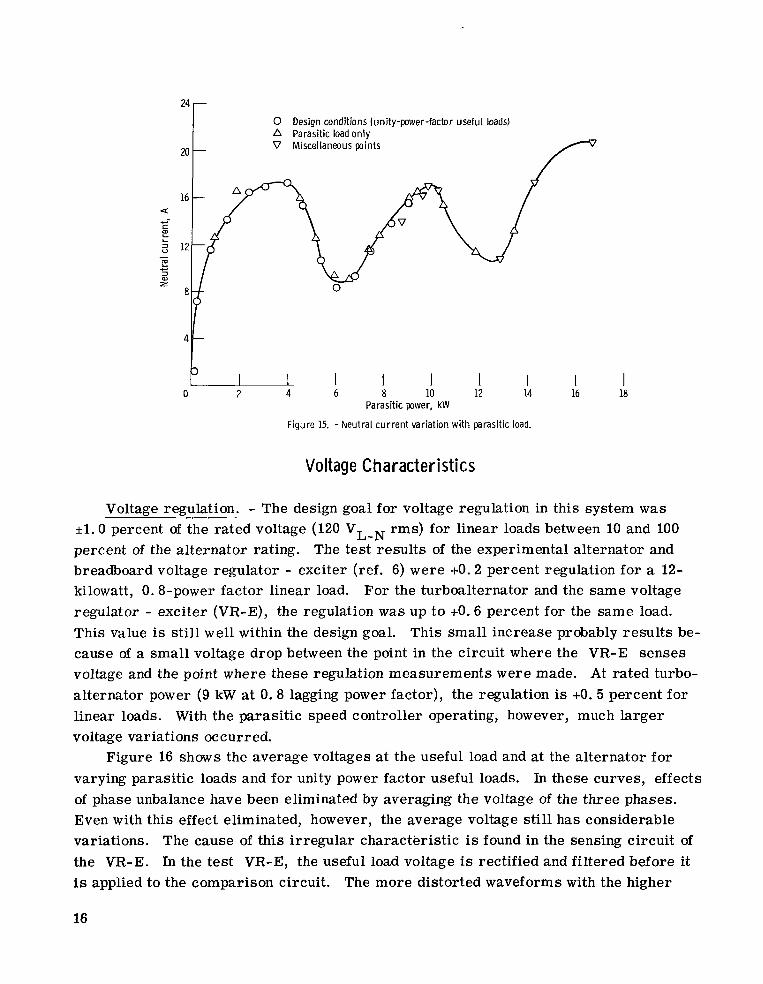
Neutral current. - Balanced linear loads on a balanced three-phase sine wave source result in zero neutral current. However, substitution of a balanced nonlinear load with third harmonic currents and odd multiples thereof can result in relatively large neutral currents. Figure 15 shows that, for all parasitic loads from 0.5 to 9 kilowatts, the neutral current is between 9 .0 and 17.0 amperes. The shape of this curve is very similar to that of figure 11 and is related to it. The harmonics that comprise the neutral current increase and decrease with total harmonic distortion. Since these currents, ranging from 29 to 54 percent of the alternator line current at 0.8power factor, a r e continuously flowing,, the neutral circuit must be adequate to handle them.
15
-- L
3
24
0 Design condit ions (unity-power-factor use fu l loads) a Parasit ic load on ly
20 V Miscellaneous points
16 a e alL
2 12-2 c a z
8
Parasit ic power, kW
Figure 15. -Neu t ra l c u r r e n t variat ion w i th parasitic load.
Voltage Character ist ics
Voltage regulation. - The design goal for voltage regulation in this system w a s-_-51.0 percent of the rated voltage (120 VL rms) for linear loads between 10 and 100 percent of the alternator rating. The test resul ts of the experimental alternator and breadboard voltage regulator - exciter (ref. 6) were +O. 2 percent regulation for a 12kilowatt, 0.8-power factor linear load. For the turboalternator and the same voltage regulator - exciter (VR-E), the regulation w a s up t o +O. 6 percent for the same load. This value is sti l l wel l within the design goal. This small increase probably resul ts because of a small voltage drop between the point in the circuit where the VR-E senses voltage and the point where these regulation measurements were made. At rated turbo-alternator power (9 kW at 0.8 lagging power factor), the regulation is +O. 5 percent for linear loads. With the parasitic speed controller operating, however, much larger voltage variations occurred.
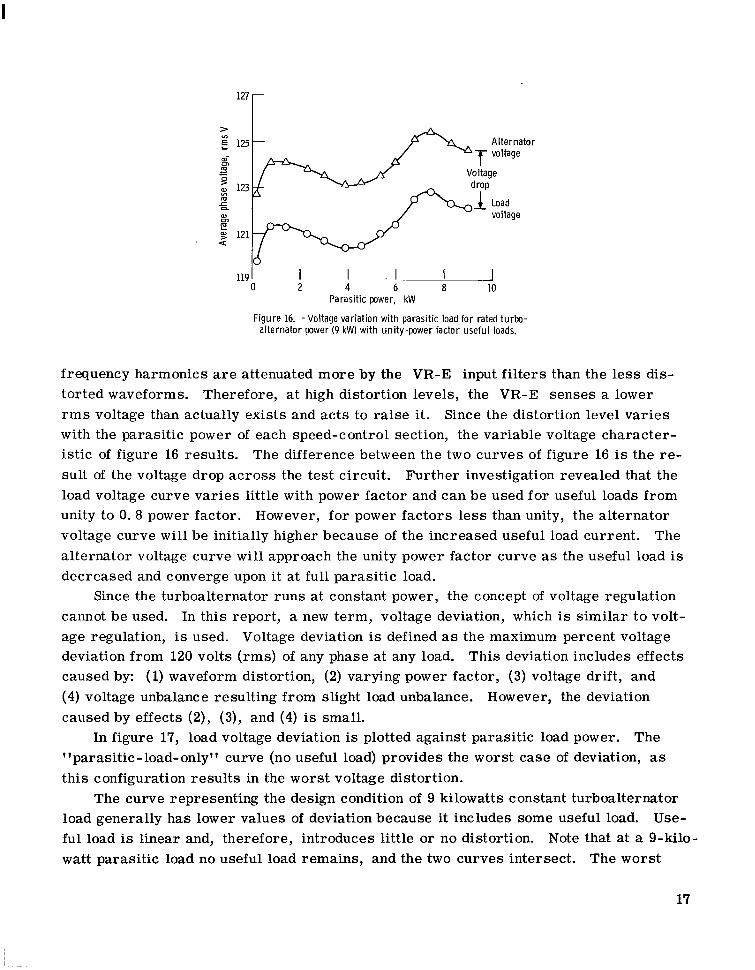
Figure 16 shows the average voltages at the useful load and at the alternator for varying parasitic loads and fo r unity power factor useful loads. In these curves, effects of phase unbalance have been eliminated by averaging the voltage of the three phases. Even with this effect eliminated, however, the average voltage still has considerable variations. The cause of this irregular characteristic is found in the sensing circuit of the VR-E. In the test VR-E, the useful load voltage is rectified and filtered before it is applied to the comparison circuit. The more distorted waveforms with the higher
16
m
> VI
125 Alternator voltage
mm -c e2 123 VI m r, Load a, voltagem e g 121 a
Parasitic power, kW
Figure 16. -Voltage variat ion wi th parasit ic load fo r rated turbo-alternator power (9 kW) w i th unity-power factor usefu l loads.
frequency harmonics a r e attenuated more by the VR-E input f i l ters than the less distorted waveforms. Therefore, a t high distortion levels, the VR-E senses a lower r m s voltage than actually exists and acts to ra ise it. Since the distortion level var ies with the parasitic power of each speed-c ontrol section, the variable voltage characteristic of figure 16 results. The difference between the two curves of figure 16 is the re sult of the voltage drop across the test circuit. Further investigation revealed that the load voltage curve var ies little with power factor and can be used for useful loads from unity to 0.8 power factor. However, for power factors less than unity, the alternator voltage curve wi l l be initially higher because of the increased useful load current. The alternator voltage curve wi l l approach the unity power factor curve as the useful load is decreased and converge upon it at full parasitic load.
Since the turboalternator runs at constant power, the concept of voltage regulation cannot be used. In this report, a new term, voltage deviation, which is similar to voltage regulation, is used. Voltage deviation is defined as the maximum percent voltage deviation from 120 volts (rms) of any phase at any load. This deviation includes effects caused by: (1)waveform distortion, (2) varying power factor, (3) voltage drift, and (4) voltage unbalance resulting from slight load unbalance. However, the deviation caused by effects (2), (3), and (4) is small.
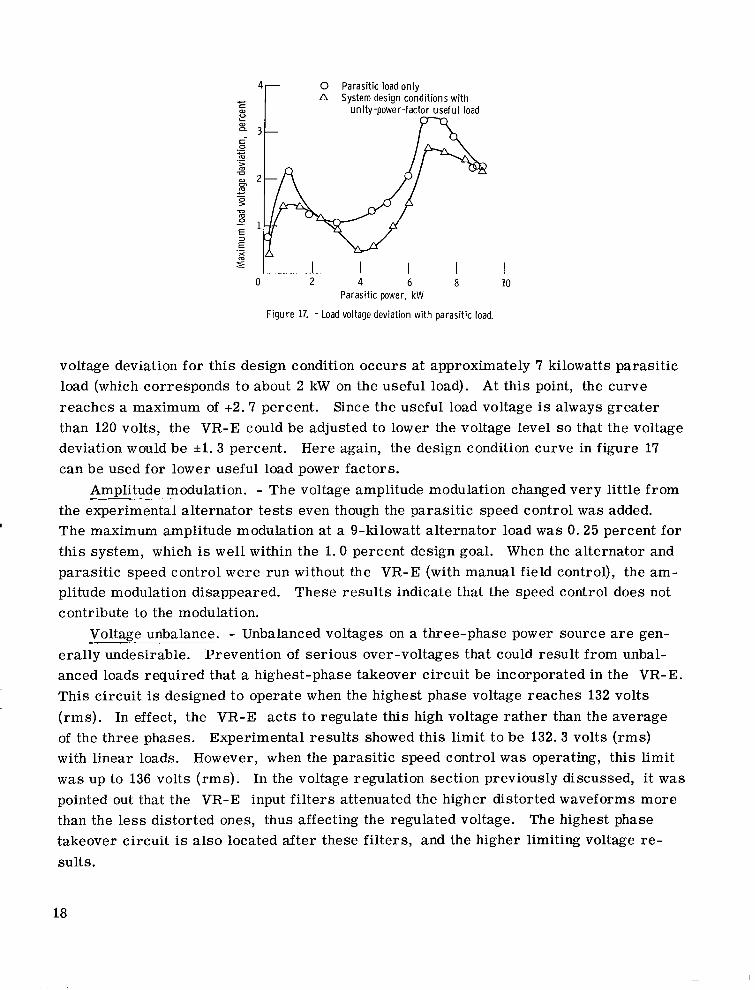
In figure 17, load voltage deviation is plotted against parasitic load power. The ?'parasitic-load-only" curve (no useful load) provides the worst case of deviation, as this configuration resul ts in the worst voltage distortion.
The curve representing the design condition of 9 kilowatts constant turboalternator load generally has lower values of deviation because it includes some useful load. Useful load is linear and, therefore, introduces little or no distortion. Note that at a 9-kilowatt parasitic load no useful load remains, and the two curves intersect. The worst
17
c L
c
m
0
-0
4 0 Parasitic load on ly c A System design condit ions w i th 0) unity-power-factor usefu l load ual n 3 .-0 c m.t U - 2 m r>
m
" 1E 3 .-E x
2 I 0 2 4 6 a 10
Parasitic power, kW
Figure 17. -Load voltage deviation wi th parasit ic load.
voltage deviation for this design condition occurs at approximately 7 kilowatts parasitic load (which corresponds to about 2 kW on the useful load). At this point, the curve reaches a maximum of +2.7 percent. Since the useful load voltage is always greater than 120 volts, the VR-E could be adjusted to lower the voltage level so that the voltage deviation would be *l.3 percent. Here again, the design condition curve in figure 17 can be used for lower useful load power factors.
-Amplitude modulation. - The voltage amplitude modulation changed very little from the experimental alternator tes ts even though the parasitic speed control w a s added. The maximum amplitude modulation at a 9-kilowatt alternator load w a s 0 . 2 5 percent for this system, which is well within the 1.0 percent design goal. When the alternator and parasitic speed control were run without the VR-E (with manual field control), the amplitude modulation disappeared. These results indicate that the speed control does not contribute to the modulation.
Voltage unbalance. - Unbalanced voltages on a three-phase power source a r e generally undesirable. Prevention of serious over-voltages that could result from unbalanced loads required that a highest-phase takeover circuit be incorporated in the VR-E. This circuit is designed to operate when the highest phase voltage reaches 132 volts ( rms) . In effect, the VR-E ac ts to regulate this high voltage rather than the average of the three phases. Experimental results showed this limit to be 132 .3 volts (rms) with linear loads. However, when the parasitic speed control w a s operating, this limit w a s up to 136 volts ( rms) . In the voltage regulation section previously discussed, it w a s pointed out that the VR-E input f i l ters attenuated the higher distorted waveforms more than the less distorted ones, thus affecting the regulated voltage. The highest phase takeover circuit is also located after these filters, and the higher limiting voltage results.
18
----
---
lor Curve 1
2 3
Experimental alternator w i th l inear Pload (data f rom ref. 5) Turboalternator w i th parasitic load 'ATurboalternator wi th l inear load / /
I I I I I I I 2 0 . 4 .8 1.2 1.6 2.0 2.4 2.8 3.2 3.6 4.0
Useful load, kW
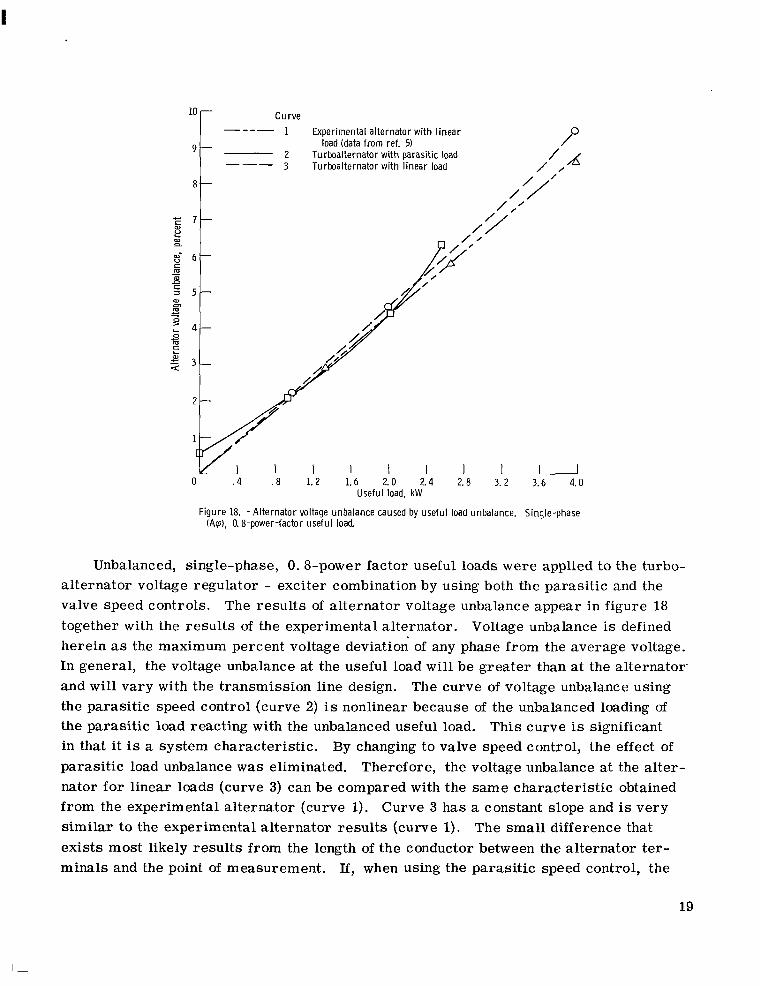
Figure 18. -A l te rna to r voltage unbalance caused by useful load unbalance. Single-phase (Ap), 0.8-power-factor useful l o a d
Unbalanced, single-phase, 0.8-power factor useful loads were applied to the turbo-alternator voltage regulator - exciter combination by using both the parasitic and the valve speed controls. The resul ts of alternator voltage unbalance appear in figure 18 together with the resul ts of the experimental alternator. Voltage unbalance is defined herein as the maximum percent voltage deviation of any phase from the average voltage. In general, the voltage unbalance at the useful load wi l l be greater than at the alternator-and wil l vary with the transmission line design. The curve of voltage unbalance using the parasitic speed control (curve 2) is nonlinear because of the unbalanced loading of the parasitic load reacting with the unbalanced useful load. This curve is significant in that it is a system characteristic. By changing to valve speed control, the effect of parasitic load unbalance w a s eliminated. Theref ore, the voltage unbalance at the alternator for linear loads (curve 3) can be compared with the same characteristic obtained from the experimental alternator (curve 1). Curve 3 has a constant slope and is very similar to the experimental alternator resul ts (curve 1). The small difference that exists most likely resul ts from the length of the conductor between the alternator terminals and the point of measurement. If, when using the parasit ic speed control, the
19
I I I I Ill llIlll111lll111lllIlllllll I1 II IIIIIIII
single-phase useful load had been on one of the other two phases, the curve would have been just slightly different because the parasitic power unbalance (fig. 14) is small.
The voltage unbalance caused by two-phase useful loads was investigated for both the parasitic and valve speed controls and was just slightly lower than that of the single-phase cases. Therefore, only single-phase cases were presented.
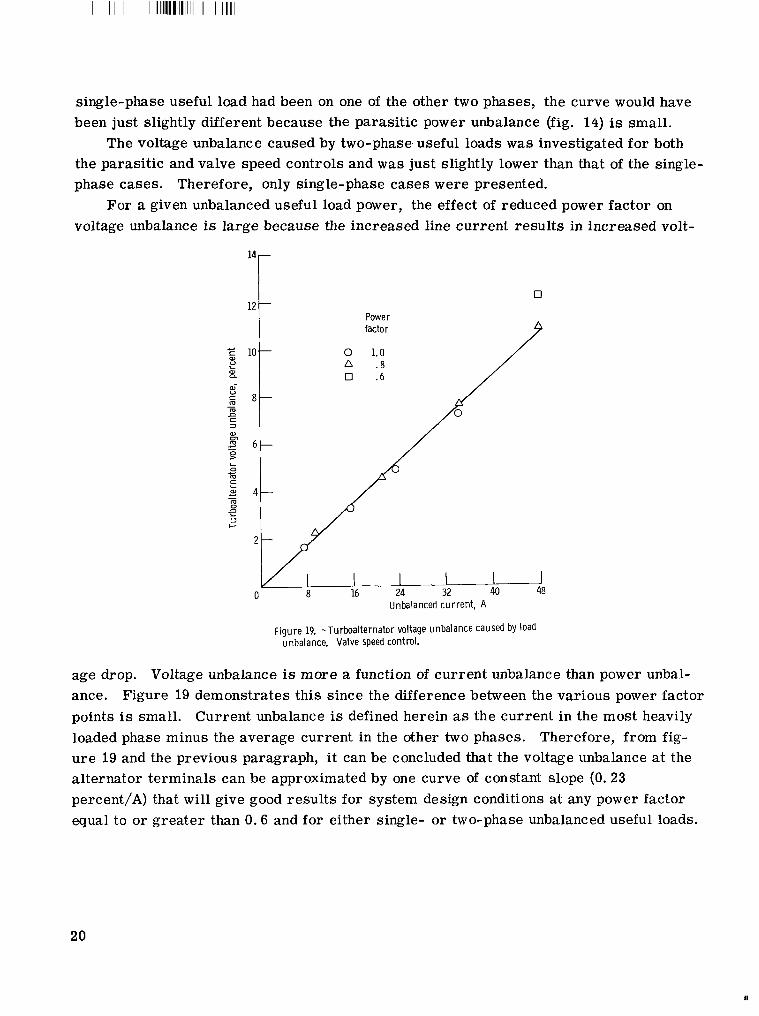
For a given unbalanced useful load power, the effect of reduced power factor on voltage unbalance is large because the increased line current resul ts in increased volt
0 12l ( 1
Power factor 9
0 1.0 A .8 0 .6
8 16n L L - L J - - J 24 32 40 48
Unbalanced cur ren t , A
Figure 19. -Turboal ternator voltage unbalance caused by load unbalance. Valve speed control.
age drop. Voltage unbalance is more a function of current unbalance than power unbalance. Figure 19 demonstrates this since the difference between the various power factor points is small. Current unbalance is defined herein as the current in the most heavily loaded phase minus the average current in the other two phases. Therefore, from figu r e 19 and the previous paragraph, i t can be concluded that the voltage unbalance at the alternator terminals can be approximated by one curve of constant slope (0.23 percent/A) that wil l give good results for system design conditions at any power factor equal to or greater than 0.6 and for either single- or two-phase unbalanced useful loads.
20
-. .... . ...-. .
0verIoad Characteris tics
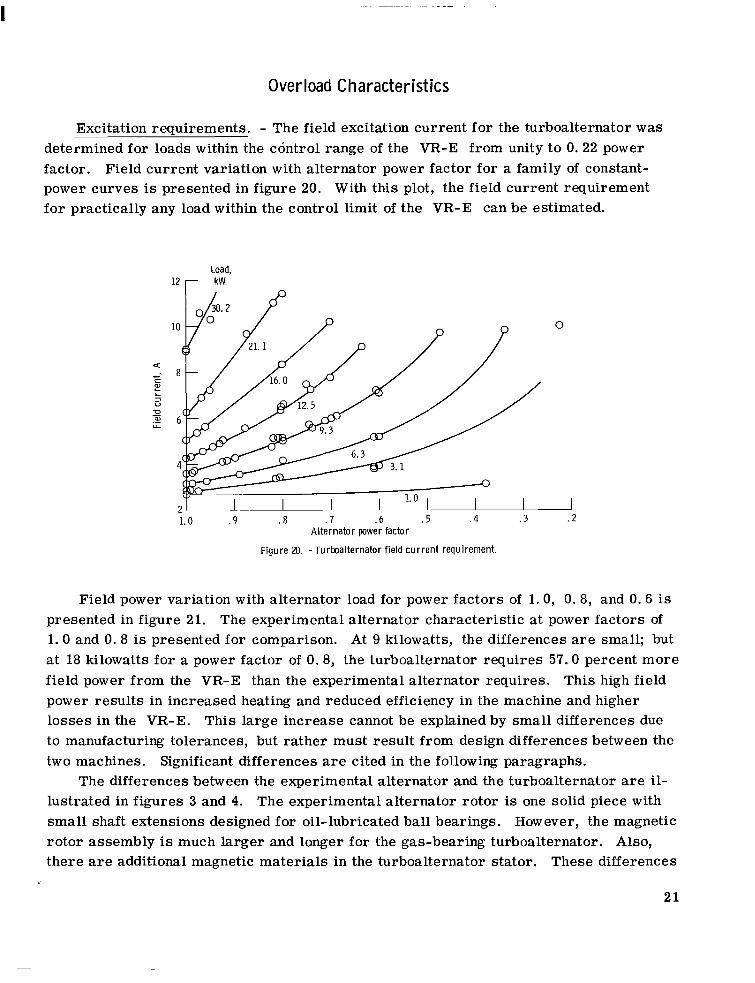
Excitation requirements. - The field excitation current for the turboalternator w a s determined for loads within the control range of the VR-E from unity to 0.22 power factor. Field current variation with alternator power factor for a family of constant-power curves is presented in figure 20. With this plot, the field current requirement for practically any load within the control limit of the VR-E can be estimated.
Load, kW
1.0 .9 .8 .7 .6 . 5 . 4 . 3 . 2 A l ternator power factor
F igure 20. - Tur toa l ternator f ie ld c u r r e n t requirement.
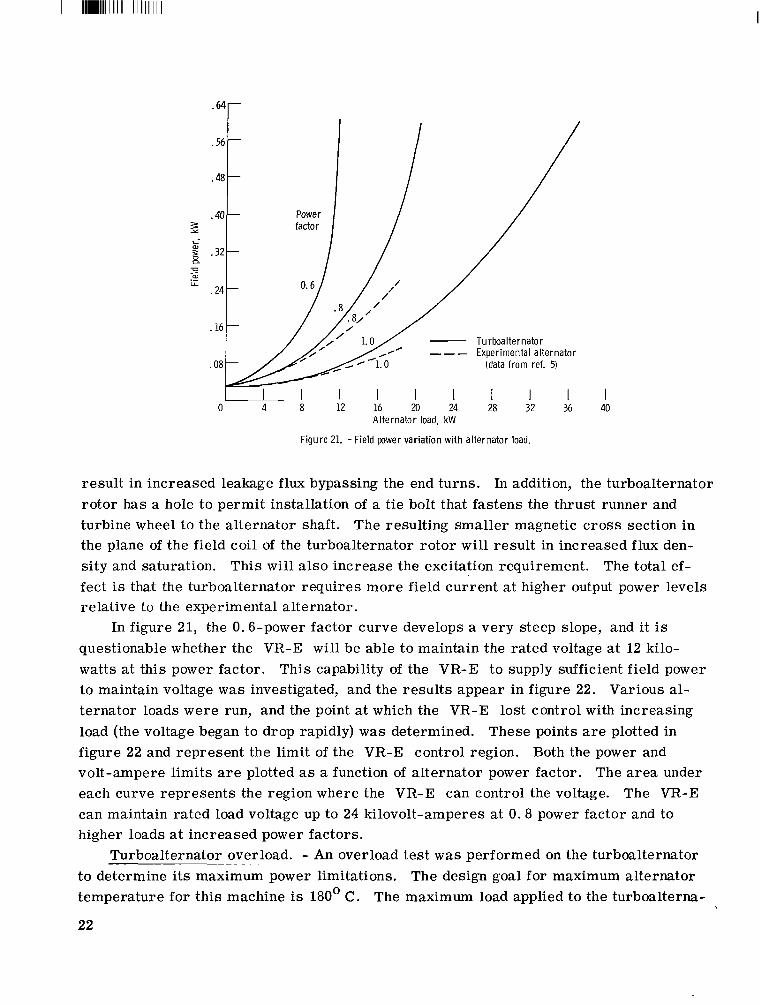
Field power variation with alternator load for power factors of 1.0, 0.8, and 0.6 is presented in figure 21. The experimental alternator characteristic at power factors of 1.0 and 0.8 is presented for comparison. At 9 kilowatts, the differences a r e small; but at 18 kilowatts for a power factor of 0.8, the turboalternator requires 57.0 percent more field power from the VR-E than the experimental alternator requires. This high field power results in increased heating and reduced efficiency in the machine and higher losses in the VR-E. This large increase cannot be explained by small differences due to manufacturing tolerances, but rather must result from design differences between the two machines. Significant differences a r e cited in the following paragraphs.
The differences between the experimental alternator and the turboalternator are illustrated in figures 3 and 4. The experimental alternator rotor is one solid piece with small shaft extensions designed for oil- lubricated ball bearings. How ever, the magnetic rotor assembly is much larger and longer for the gas-bearing turboalternator. Also, there are additional magnetic materials in the turboalternator stator. These differences
21
I Il1111111IIIIIII IllIlllIlIll Ill I I
I 40
Al ternator load, kW
Figure 21. -F ie ld power variat ion w i th alternator load.
result in increased leakage flux bypassing the end turns. In addition, the turboalternator rotor has a hole to permit installation of a tie bolt that fastens the thrust runner and turbine wheel to the alternator shaft. The resulting smaller magnetic c ross section in the plane of the field coil of the turboalternator rotor wil l result in increased flux density and saturation. This wil l a lso increase the excitation requirement. The total effect is that the turboalternator requires more field current a t higher output power levels relative to the experimental alternator.
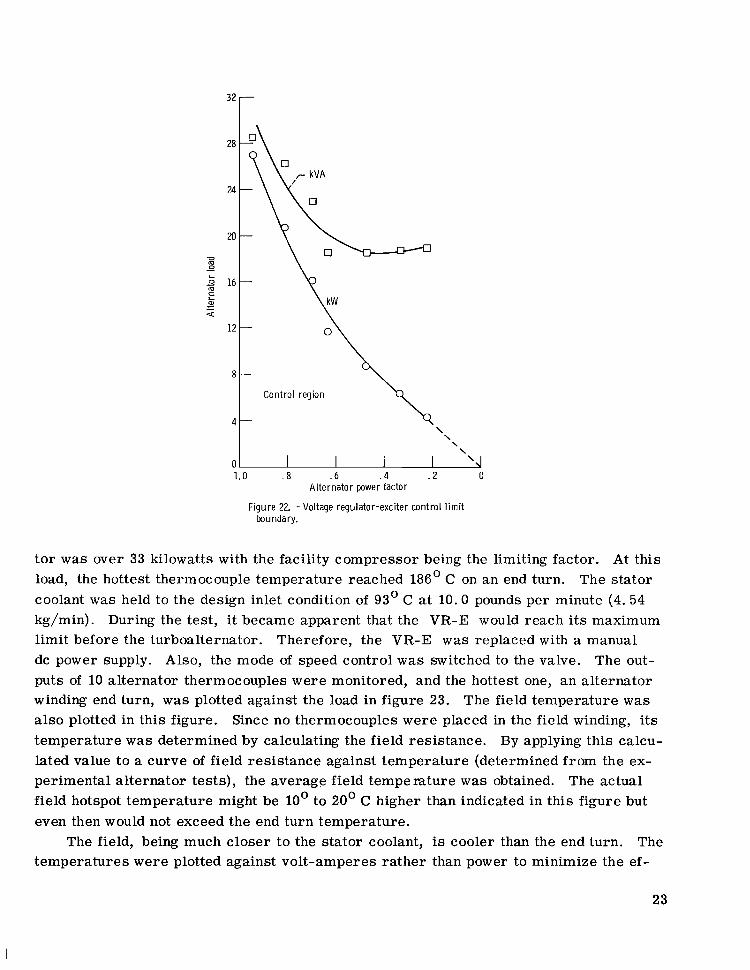
In figure 21, the 0.6-power factor curve develops a very steep slope, and it is questionable whether the VR-E wi l l be able to maintain the rated voltage a t 12 kilowatts a t this power factor. This capability of the VR-E to supply sufficient field power to maintain voltage w a s investigated, and the resul ts appear in figure 22. Various alternator loads were run, and the point at which the VR-E lost control with increasing load (the voltage began to drop rapidly) w a s determined. These points a r e plotted in figure 22 and represent the limit of the VR-E control region. Both the power and volt-ampere limits are plotted as a function of alternator power factor. The a rea under each curve represents the region where the VR-E can control the voltage. The VR-E can maintain rated load voltage up to 24 kilovolt-amperes a t 0.8 power factor and to higher loads a t increased power factors.
Turboalternator overload. - An overload test w a s performed on the turboalternator to determine its maximum power limitations. The design goal for maximum alternator temperature for this machine is 180' C. The maximum load applied to the turboalterna
22
m 0
32
28
24
x m -L
S 16 m E a,1 a
1;
E
4
c 1.0 . a .6 . 4 . 2 0
Al ternator power factor
Figure 22. - Voltage regulator-exciter control l i m i t boundary.
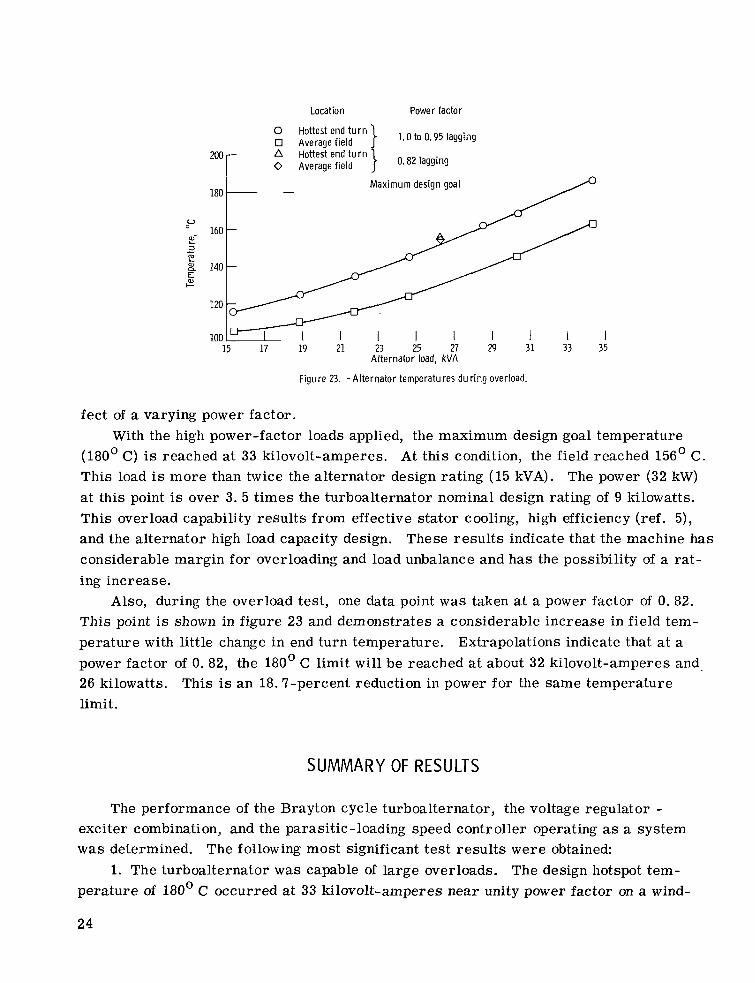
tor w a s over 33 kilowatts with the facility compressor being the limiting factor. At this load, the hottest thermocouple temperature reached 186' C on an end turn. The stator coolant w a s held to the design inlet condition of 93' C at 10.0 pounds per minute (4.54 kg/min). During the test, it became apparent that the VR-E would reach i t s maximum limit before the turboalternator. Therefore, the VR-E w a s replaced with a manual dc power supply. Also, the mode of speed control w a s switched to the valve. The outputs of 10 alternator thermocouples were monitored, and the hottest one, an alternator winding end turn, w a s plotted against the load in figure 23. The field temperature w a s a lso plotted in this figure. Since no thermocouples were placed in the field winding, i ts temperature w a s determined by calculating the field resistance. By applying this calculated value to a curve of field resistance against temperature (determined from the experimental alternator tests) , the average field tempe mture w a s obtained. The actual field hotspot temperature might be 10' to 20' C higher than indicated in this figure but even then would not exceed the end turn temperature.
The field, being much closer to the stator coolant, is cooler than the end turn. The temperatures were plotted against volt-amperes ra ther than power to minimize the ef
23
Location Power factor
Hottest end turn } 1.0 to 0.95 lagging0 Averaqe field A Hottesi end turn 0 Average field 0.82 lagging
Maximum design goal
I I 1 I 1 1 I 1 15 17 19 21 23 25 27 29 31 33 35
Al ternator load, kVA
Figure 23. -A l te rna to r temperatures d u r i n g overload.
feet of a varying power factor. With the high power-factor loads applied, the maximum design goal temperature
(180' C) is reached at 33 kilovolt-amperes. At this condition, the field reached 156' C. This load is more than twice the alternator design rating (15 kVA). The power (32 kW) a t this point is over 3. 5 t imes the turboalternator nominal design rating of 9 kilowatts. This overload capability resul ts from effective stator cooling, high efficiency (ref. 5), and the alternator high load capacity design. These resul ts indicate that the machine has considerable margin for overloading and load unbalance and has the possibility of a rating increase.
Also, during the overload test, one data point w a s taken a t a power factor of 0.82. This point i s shown in figure 23 and demonstrates a considerable increase in field temperature with little change in end turn temperature. Extrapolations indicate that at a power factor of 0. 82, the 180' C limit wi l l be reached a t about 32 kilovolt-amperes and26 kilowatts. This is an 18.7-percent reduction in power for the same temperature limit.
SUMMARY OF RESULTS
The performance of the Brayton cycle turboalternator, the voltage regulator -exciter combination, and the parasitic-loading speed controller operating as a system w a s determined. The following most significant test resul ts were obtained
1. The turboalternator was capable of large overloads. The design hotspot temperature of 180' C occurred a t 33 kilovolt-amperes near unity power factor on a wind
24
ing end turn, while the field reached an average temperature of 156' C. 2. The voltage regulator - exciter w a s unable to operate within the desired value of
*l.0 percent because of waveform distortion problems caused by the parasitic speed control. The sensing circuit receives a signal that has been attenuated by f i l ters and acts to ra ise the line voltage. Voltage deviation of over 2. 5 percent occurs. The highest-phase voltage limit circuit w a s also affected by waveform distortion and permitted load voltages up to 136 volts to occur.
3. The voltage regulator - exciter w a s capable of sustaining substantial overload. Control w a s maintained up to 24 kilovolt-amperes at 0.8 lagging power factor.
4. High waveform distortion of alternator current and load voltage w a s experienced. Maximum values were 18.3 percent current and 13. 8 percent voltage distortion. These high distortions principally resulted from the phase-controlled parasitic-load speed control used.
5. Most test results were in good agreement with individual component results previously determined, except a t high power levels. The turboalternator field required 57.0 percent more excitation power at double rated load (18 kW a t 0.8 lagging power factor) than indicated by the tes ts of the experimental alternator alone. This increase resulted from magnetic effects from integration of the alternator with the turbine and gas bearings.
6. Large values of neutral current occurred for balanced loads and ranged from 29 to 54 percent of the rated line current (31.2 A).
Lewis Research Center, National Aeronautics and Space Administration,
Cleveland, Ohio, November 7, 1969, 120-27.
REFERENCES
1. Bernatowicz, Daniel T. : NASA Solar Brayton Cycle Studies. Presented at the Symposium on Solar Dynamic Systems, Solar and Mechanical Working Groups of the Interagency Advanced Power Group, Washington, D. C . , Sept. 24-25, 1963.
2. Klann, John L. : 2 to 10 Kilowatt Solar o r Radioisotope Brayton Power System. Intersociety Energy Conversion Engineering Conference. Vol. 1. IEEE, 1968, pp. 407-415.
3. Corcoran, Charles S.; and Yeager, LeRoy J. : Summary of Electrical Component Development for a 400-Hertz Brayton Energy Conversion System. NASA TN D-4874, 1968.
25
I
11111111Il1111Ill I I1 Ill1 lIll11l111
4. Dryer, A. M. ; et al. : Alternator and Voltage Regulator-Exciter for a Brayton Cycle Space Power System. Vol. 1 - Alternator and Voltage Regulator-Exciter Design and Development. Rep. GE-A69-003, General Electric Co., May 1969.
5. Edkin, Richard A. ; Valgora, Martin E. ; and Perz, Dennis A. : Performance Characteristics of 15 kVA Homopolar Inductor Alternator for 400 Hertz Brayton Cycle Space-Power System. NASA TN D-4698, 1968.
6. Bollenbacher, Gary; Edkin, Richard A. ; and Perz, Dennis A. : Experimental Evaluation of a Voltage Regulator - Exciter fo r a 15-Kilovolt-Ampere Brayton Cycle Alternator. NASA TN D-4697, 1968.
7. Word, John L. ; Fischer, Raymond L. E. ; and Ingle, Bill D. : Static Parasitic Speed Controller for Brayton-Cycle Turboalternator. NASA TN D-4176, 1967.
8. Fischer, Raymond L. E. ; and Droba, Darryl J. : Dynamic Characteristics of Parasitic-Loading Speed Controller for 10-Kilowatt Brayton Cycle Turboalternator. NASA TM X-1456, 1968.
9. Wood, James C. ; et al. : Preliminary Performance Characteristics of a Gas-Bearing Turboalternator. NASA TM X-1820, 1969.
10. Wood, James C. ; Valgora, Martin E. ; and Tryon, Henry B. : Hot Performance Characteristics of a Gas Bearing Brayton Cycle Turboalternator. Presented at the AIChE Intersociety Energy Conversion Engineering Conference, Washington, D. C. , Sept. 21-26, 1969.
11. Gilbert, Leonard J. : Reduction of Apparent-Power Requirement of Phase-Controlled Parasitically Loaded Turboalternator by Multiple Parasitic Loads. NASA TN D-4302, 1968.
12. Perz, Dennis A. ; Valgora, Martin E. : Experimental Evaluation of Volt-Ampere Loading and Output Distortion for a Turboalternator with Multiple Load Phase-Controlled Parasitic Speed Controller. NASA TN D-5603, 1969.
26
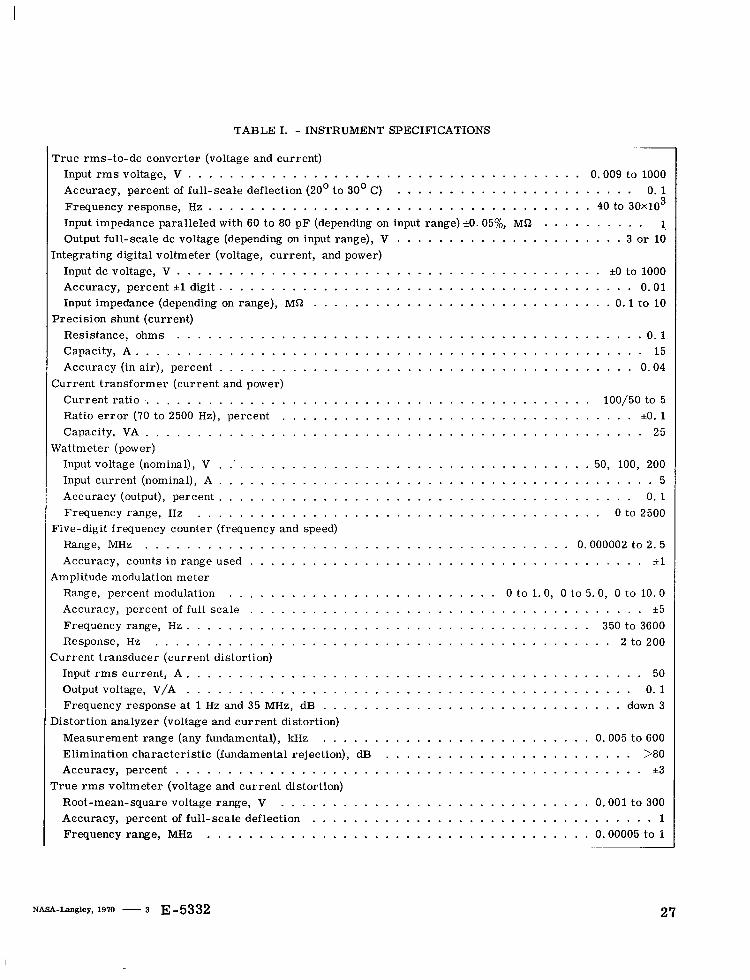
TABLE I. .INSTRUMENT SPECIFICATIONS ~
True rms-to-dc converter (voltage and current) Input r m s voltage. V . . . . . . . . . . . . . . . . . . . . . . . . . . . . . . . Accuracy. percent of full-scale deflection (20' to 30' C) . . . . . . . . . . . Frequency response. Hz . . . . . . . . . . . . . . . . . . . . . . . . . . . . . Input impedance paralleled with 60 to 80 pF (depending on input range) *O .05%. Output full-scale dc voltage (depending on input range). V . . . . . . . . . . .
Integrating digital voltmeter (voltage. current. and power) Input dc voltage. V . . . . . . . . . . . . . . . . . . . . . . . . . . . . . . . . Accuracy. percent i1 digit . . . . . . . . . . . . . . . . . . . . . . . . . . . . Input impedance (depending on range). Mi2 . . . . . . . . . . . . . . . . . . .
Precision shunt (current) Resistance. ohms . . . . . . . . . . . . . . . . . . . . . . . . . . . . . . . . Capacity. A . . . . . . . . . . . . . . . . . . . . . . . . . . . . . . . . . . . . Accuracy (in air). percent . . . . . . . . . . . . . . . . . . . . . . . . . . . .
Current transformer (current and power) Current ratio . . . . . . . . . . . . . . . . . . . . . . . . . . . . . . . . . . . . Ratio e r r o r (70 to 2500 Hz). percent . . . . . . . . . . . . . . . . . . . . . . Capacity. VA . . . . . . . . . . . . . . . . . . . . . . . . . . . . . . . . . . .
Wattmeter (power) Input voltage (nominal). V . . . . . . . . . . . . . . . . . . . . . . . . . . . . . Input current (nominal). A . . . . . . . . . . . . . . . . . . . . . . . . . . . . Accuracy (output). percent . . . . . . . . . . . . . . . . . . . . . . . . . . . . Frequency range. Hz . . . . . . . . . . . . . . . . . . . . . . . . . . . . . .
Five-digit frequency counter (frequency and speed) Range. MHz . . . . . . . . . . . . . . . . . . . . . . . . . . . . . . . . . . .
. . . . . . . 0.009 to 1000
. . . . . . . . . . . . 0 .1
. . . . . . . . 40 to 3 0 ~ 1 0 ~
Mi2 . . . . . . . . . . 1. . . . . . . . . . . .3 or 10
. . . . . . . . . i o to 1000
. . . . . . . . . . . . 0.01
. . . . . . . . . . 0.1 to 10
. . . . . . . . . . . . .0 . 1
. . . . . . . . . . . . . 15
. . . . . . . . . . . . 0.04
. . . . . . . . 100/50 to 5
. . . . . . . . . . . . i o . l
. . . . . . . . . . . . . 25
. . . . . . . . 50. 100. 200
. . . . . . . . . . . . . . 5
. . . . . . . . . . . . 0 .1
. . . . . . . . . 0 to 2500
0.000002 to 2.5 Accuracy. counts in range used . . . . . . . . . . . . . . . . . . . . . . . . . . . . . . . . . . . . . . *1
Amplitude modulation meter Range. percent modulation . . . . . . . . . . . . . . . . . . . . . . . . . . 0 to 1.0, 0 to 5.0, 0 to 10.0 Accuracy. percent of full scale . . . . . . . . . . . . . . . . . . . . . . . . . . . . . . . . . . . . . . *5 Frequency range. Hz . . . . . . . . . . . . . . . . . . . . . . . . . . . . . . . . . . . . . . . 350to3600 Response. Hz . . . . . . . . . . . . . . . . . . . . . . . . . . . . . . . . . . . . . . . . . . . . 2 t o 2 0 0
Current transducer (current distortion) Input r m s current. A . . . . . . . . . . . . . . . . . . . . . . . . . . . . . . . . . . . . . . . . . . . . 50 Output voltage. V/A . . . . . . . . . . . . . . . . . . . . . . . . . . . . . . . . . . . . . . . . . . . 0 .1 Frequency response at 1 Hz and 35 MHz. dB . . . . . . . . . . . . . . . . . . . . . . . . . . . . . d0wn3
Distortion analyzer (voltage and current distortion) Measurement range (any fundamental). kHz . . . . . . . . . . . . . . . . . . . . . . . . . . 0.005 to 600 Elimination characteristic (fundamental rejection). dB . . . . . . . . . . . . . . . . . . . . . . . . >80 Accuracy. percent . . . . . . . . . . . . . . . . . . . . . . . . . . . . . . . . . . . . . . . . . . . . . 13
True r m s voltmeter (voltage and current distortion) Root-mean-square voltage range. V . . . . . . . . . . . . . . . . . . . . . . . . . . . . . . 0.001 t o 300 Accuracy. percent of full-scale deflection . . . . . . . . . . . . . . . . . . . . . . . . . . . . . . . . . Frequency range. MHz . . . . . . . . . . . . . . . . . . . . . . . . . . . . . . . . . . . . .
NASA.Lang1ey. 1970 -3 E-5332 27

NATIONAL AND SPACE ADMINISTRATIONAERONAUTICS WASHINGTON, D. C. 20545
OFFICIAL BUSINESS FIRST CLASS MAIL
POSTAGE A N D FEES PAID NATIONAL AERONAUTICS A .
SP* pr ' DMINISTRATION
POSTI\.IASTER: If Undeliverable (Section 15: Postal Manual 1 Do Not Retu
"The nesoizaicticnl aizd space nrtii'ities of the United Stntes shnll be coudiected so ns t o co?ztsibicte . . . t o the expnnsio-ra of biiiiiaiz kizozuledge of phenoiiieitn in the nt iiiosphese nizd space. The Administrntion shrill pro+dc f o r the widest psncticnhle nizd npproprinte disseniimtion of iuf oriiintioiz coiiceraing its nctii'ities nad the wsrclts theseof .'*
-NATIONALAERONAUTICSAND SPACE ACT OF 19%
NASA SCIE.N'TIFIG AND TECHNICAL PUBLICATIONS
TECHNICAL REPORTS: Scientific and technical information considered important, complete, and a lasting contribution to existing knowledge.
TECHNICAL NOTES: Information less broad in scope but nevertheless of importance as a contribution to existing knowledge.
TECHNICAL MEMORANDUMS : Information receiving limited distribution because of preliminary data, security classification, or other reasons.
CONTRACTOR REPORTS: Scientific and technical information generated under a NASA contract or grant and considered an important contribution to existing knowledge.
TECHNICAL TRANSLATIONS: Information published in a foreign language considered to merit NASA distribution in English.
SPECIAL PUBLICATIONS: Information derived from or of value to NASA activities. Publications include conference proceedings, monographs, data compilations, handbooks, sourcebooks, and special bibliographies.
TECHNOLOGY UTILIZATION PUBLICATIONS: Information on technology ~iscdby NASA that may be of particular interest in commercial and other non-aerospace :ipplicationq. Publications include Tech Briefs, ~ L c l , n o l o g y Utiliz,,tion Reports and Notes, and Technology Surveys.
Details on the availability of these publications may be obtained from:
SCIENTIFIC AND TECHNICAL INFORMATION DIVISION
NATIONAL AERONAUTICS AND SPACE ADMINISTRATION Washington, D.C. 20546