Embed Size (px)
Citation preview

STAYING THE COURSE WITH
FOCUS & TENACITY
ASL
MARINE HOLDINGS LTD.
ASL MarineANNUAL REPORT 2015
ASL MARINE HOLDINGS LTD.Company Registration No. 200008542N
19 Pandan Road Singapore 609271Tel: (65) 6264 3833, Fax: (65) 6268 0274
Web: www.aslmarine.com
AS
L M
AR
INE H
OLD
ING
S LT
D.
An
nu
al Rep
ort 2
01
5
2 Business Overview
7 Breakdown of Revenue
8 Performance
10 Results at a Glance
12 Group Structure
14 Founder’s Message
15 Chairman’s Message
19 Operations and Financial Review
21 Board of Directors
Always striving for long-term growth despite challenges, ASL Marine continues to focus on harnessing the business fundamentals and enduring strengths that have helped us to stay resilient over the years.
Contents
24 Senior Management
26 Corporate Governance Report
49 Disclosure Guide on Governance Practices
58 Risk Management Strategies
59 Financial Statements
170 Analysis of Shareholdings
172 Notice of Annual General Meeting
Proxy Form
Corporate Information
ASL Marine is a vertically-integrated marine services group principally engaged in shipbuilding, shiprepair and conversion, shipchartering, marine engineering and other marine related services, catering to customers from Asia Pacific, South Asia, Europe, Australia and the Middle East.
Listed on Singapore Stock Exchange since 2003, ASL Marine Holdings Ltd. has over the years grown into one of the region’s key players in the marine services sector.
Today, ASL Marine owns and operates five shipyards in Singapore, Batam (Indonesia) and Guangdong (China), providing a comprehensive range of marine engineering services spanning myriad sector / industries. It has a large fleet of over 200 vessels and staff strength of 338 employees as of June 2015.
CORPORATE INFORMATION
Board Of Directors
Executive DirectorsAng Kok Tian(Chairman and Managing Director)Ang Ah Nui(Deputy Managing Director)Ang Kok EngAng Kok Leong
Non-Executive and Independent DirectorsAndre Yeap Poh LeongChristopher Chong Meng TakTan Sek Khee
Audit CommitteeChristopher Chong Meng Tak (Chairman)Andre Yeap Poh LeongTan Sek Khee
Nominating CommitteeAndre Yeap Poh Leong (Chairman)Christopher Chong Meng TakTan Sek Khee
Remuneration CommitteeTan Sek Khee (Chairman)Andre Yeap Poh LeongChristopher Chong Meng Tak
Company SecretaryAng Iris
Investor Relations ASL Marine Holdings [email protected]
Financial PR Pte [email protected]
Registered Office19 Pandan RoadSingapore 609271Telephone: (65) 6264 3833 Facsimile: (65) 6268 0274Email: [email protected]: www.aslmarine.com
Incorporation DataPlace of Incorporation: SingaporeDate of Incorporation: 4 October 2000Co. Reg. No. 200008542N
Share ListingASL Marine Holdings Ltd.’s shares are listed and traded on the Main Board of the Singapore Exchange Securities Trading Limited since March 2003
Share Registrar M & C Services Private Limited112 Robinson Road #05-01Singapore 068902Telephone: (65) 6227 6660Facsimile: (65) 6225 1452
AuditorsErnst & Young LLPCertified Public AccountantsOne Raffles QuayNorth Tower, Level 18Singapore 048583 Partner-In-Charge: Adrian Koh(appointed since the financial year ended 30 June 2015)
Principal BankersDBS Bank LtdOversea-Chinese Banking
Corporation LimitedUnited Overseas Bank Limited
resilienceis reinforced by strong drive.
Operating on a solid business platform, we will enhance our ability to withstand volatility in our markets.
Our
AS
L M
arin
e H
old
ing
s Lt
d.
/Ann
ual R
epor
t 20
15
1
BUSINESS OVERVIEW
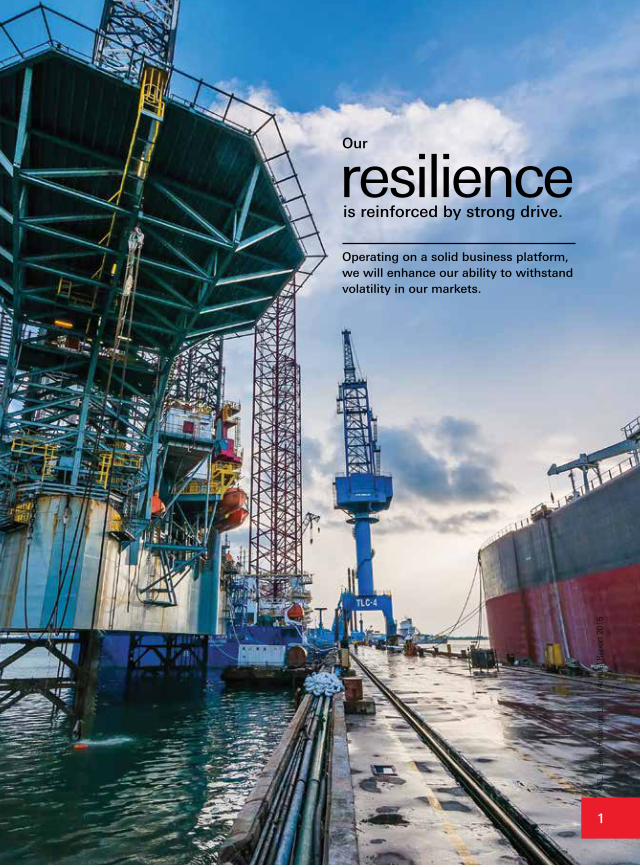
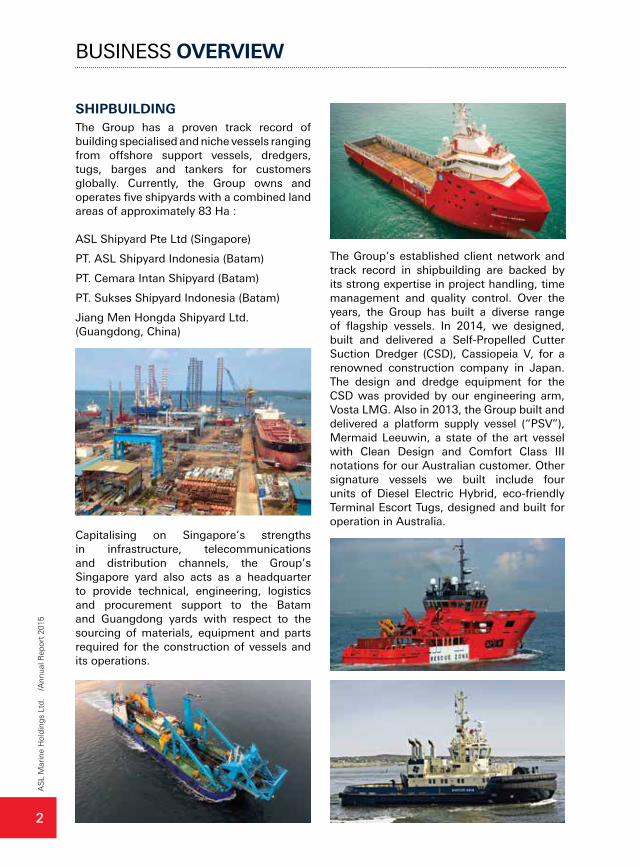
SHIPBUILDINGThe Group has a proven track record of building specialised and niche vessels ranging from offshore support vessels, dredgers, tugs, barges and tankers for customers globally. Currently, the Group owns and operates five shipyards with a combined land areas of approximately 83 Ha :
ASL Shipyard Pte Ltd (Singapore)
PT. ASL Shipyard Indonesia (Batam)
PT. Cemara Intan Shipyard (Batam)
PT. Sukses Shipyard Indonesia (Batam)
Jiang Men Hongda Shipyard Ltd. (Guangdong, China)
Capitalising on Singapore’s strengths in infrastructure, telecommunications and distribution channels, the Group’s Singapore yard also acts as a headquarter to provide technical, engineering, logistics and procurement support to the Batam and Guangdong yards with respect to the sourcing of materials, equipment and parts required for the construction of vessels and its operations.
The Group’s established client network and track record in shipbuilding are backed by its strong expertise in project handling, time management and quality control. Over the years, the Group has built a diverse range of flagship vessels. In 2014, we designed, built and delivered a Self-Propelled Cutter Suction Dredger (CSD), Cassiopeia V, for a renowned construction company in Japan. The design and dredge equipment for the CSD was provided by our engineering arm, Vosta LMG. Also in 2013, the Group built and delivered a platform supply vessel (“PSV”), Mermaid Leeuwin, a state of the art vessel with Clean Design and Comfort Class III notations for our Australian customer. Other signature vessels we built include four units of Diesel Electric Hybrid, eco-friendly Terminal Escort Tugs, designed and built for operation in Australia.
AS
L M
arin
e H
old
ing
s Lt
d.
/Ann
ual R
epor
t 20
15
2
BUSINESS OVERVIEW
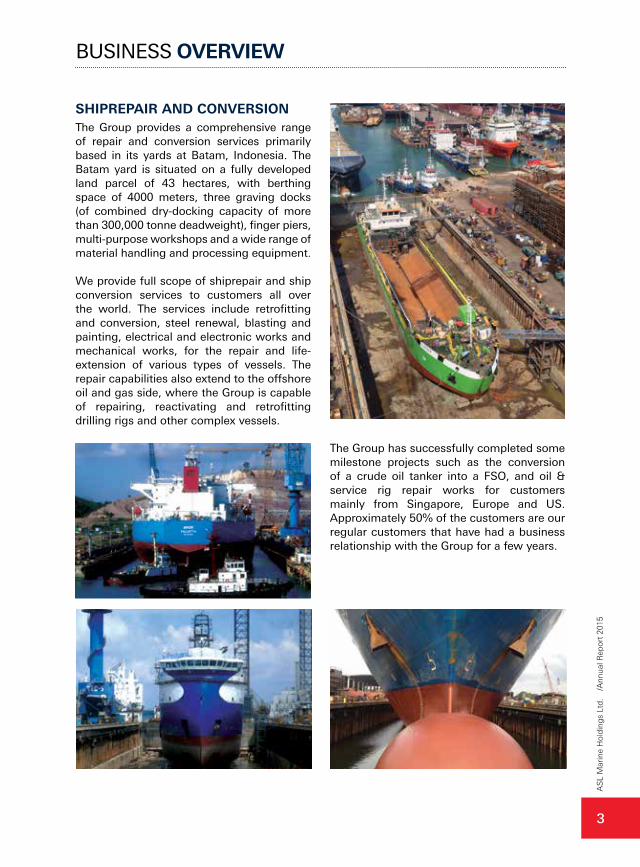
SHIPREPAIR AND CONVERSIONThe Group provides a comprehensive range of repair and conversion services primarily based in its yards at Batam, Indonesia. The Batam yard is situated on a fully developed land parcel of 43 hectares, with berthing space of 4000 meters, three graving docks (of combined dry-docking capacity of more than 300,000 tonne deadweight), finger piers, multi-purpose workshops and a wide range of material handling and processing equipment.
We provide full scope of shiprepair and ship conversion services to customers all over the world. The services include retrofitting and conversion, steel renewal, blasting and painting, electrical and electronic works and mechanical works, for the repair and life-extension of various types of vessels. The repair capabilities also extend to the offshore oil and gas side, where the Group is capable of repairing, reactivating and retrofitting drilling rigs and other complex vessels.
The Group has successfully completed some milestone projects such as the conversion of a crude oil tanker into a FSO, and oil & service rig repair works for customers mainly from Singapore, Europe and US. Approximately 50% of the customers are our regular customers that have had a business relationship with the Group for a few years.
AS
L M
arin
e H
old
ing
s Lt
d.
/Ann
ual R
epor
t 20
15
3
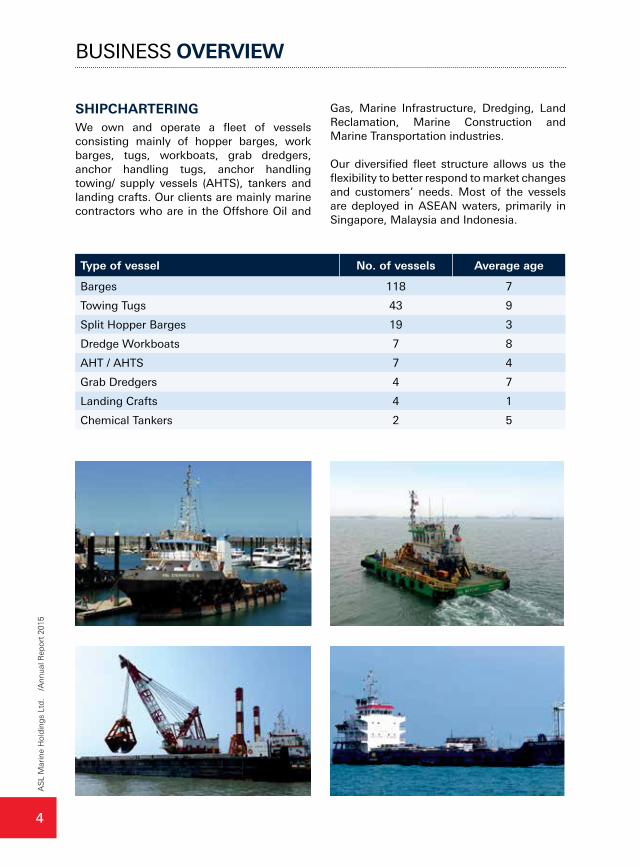
SHIPCHARTERINGWe own and operate a fleet of vessels consisting mainly of hopper barges, work barges, tugs, workboats, grab dredgers, anchor handling tugs, anchor handling towing/ supply vessels (AHTS), tankers and landing crafts. Our clients are mainly marine contractors who are in the Offshore Oil and
Type of vessel No. of vessels Average age
Barges 118 7
Towing Tugs 43 9
Split Hopper Barges 19 3
Dredge Workboats 7 8
AHT / AHTS 7 4
Grab Dredgers 4 7
Landing Crafts 4 1
Chemical Tankers 2 5
BUSINESS OVERVIEW
Gas, Marine Infrastructure, Dredging, Land Reclamation, Marine Construction and Marine Transportation industries.
Our diversified fleet structure allows us the flexibility to better respond to market changes and customers’ needs. Most of the vessels are deployed in ASEAN waters, primarily in Singapore, Malaysia and Indonesia.
AS
L M
arin
e H
old
ing
s Lt
d.
/Ann
ual R
epor
t 20
15
4
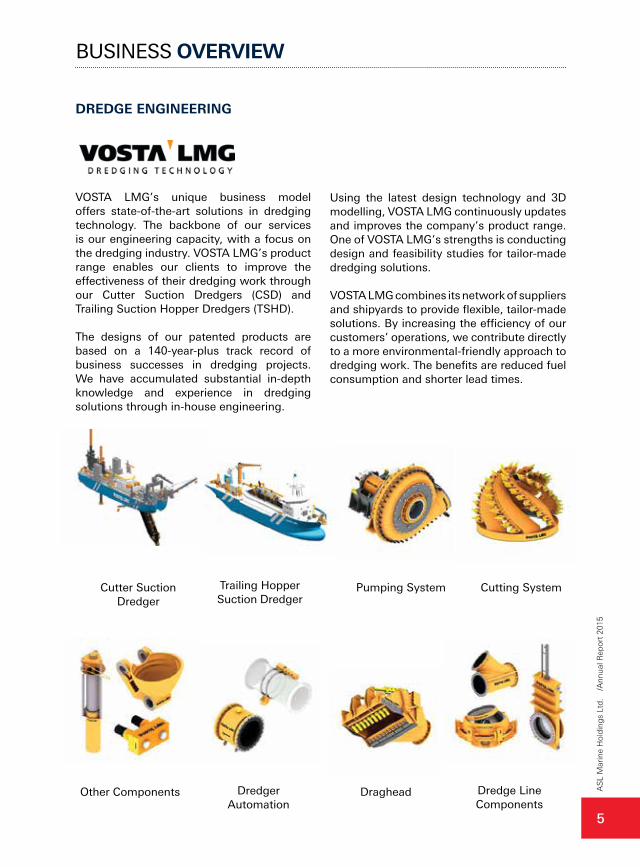
DREDGE ENGINEERING
VOSTA LMG’s unique business model offers state-of-the-art solutions in dredging technology. The backbone of our services is our engineering capacity, with a focus on the dredging industry. VOSTA LMG’s product range enables our clients to improve the effectiveness of their dredging work through our Cutter Suction Dredgers (CSD) and Trailing Suction Hopper Dredgers (TSHD).
The designs of our patented products are based on a 140-year-plus track record of business successes in dredging projects. We have accumulated substantial in-depth knowledge and experience in dredging solutions through in-house engineering.
Using the latest design technology and 3D modelling, VOSTA LMG continuously updates and improves the company’s product range. One of VOSTA LMG’s strengths is conducting design and feasibility studies for tailor-made dredging solutions.
VOSTA LMG combines its network of suppliers and shipyards to provide flexible, tailor-made solutions. By increasing the efficiency of our customers’ operations, we contribute directly to a more environmental-friendly approach to dredging work. The benefits are reduced fuel consumption and shorter lead times.
Cutter SuctionDredger
Trailing HopperSuction Dredger
Pumping System Cutting System
Dredge LineComponents
DredgerAutomation
DragheadOther Components
BUSINESS OVERVIEW
AS
L M
arin
e H
old
ing
s Lt
d.
/Ann
ual R
epor
t 20
15
5
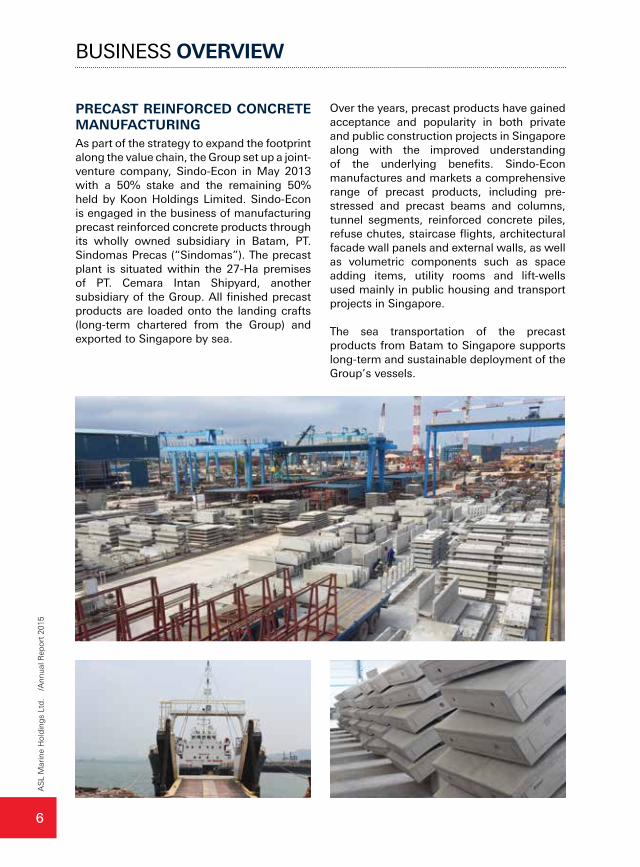
PRECAST REINFORCED CONCRETE MANUFACTURINGAs part of the strategy to expand the footprint along the value chain, the Group set up a joint-venture company, Sindo-Econ in May 2013 with a 50% stake and the remaining 50% held by Koon Holdings Limited. Sindo-Econ is engaged in the business of manufacturing precast reinforced concrete products through its wholly owned subsidiary in Batam, PT. Sindomas Precas (“Sindomas”). The precast plant is situated within the 27-Ha premises of PT. Cemara Intan Shipyard, another subsidiary of the Group. All finished precast products are loaded onto the landing crafts (long-term chartered from the Group) and exported to Singapore by sea.
Over the years, precast products have gained acceptance and popularity in both private and public construction projects in Singapore along with the improved understanding of the underlying benefits. Sindo-Econ manufactures and markets a comprehensive range of precast products, including pre-stressed and precast beams and columns, tunnel segments, reinforced concrete piles, refuse chutes, staircase flights, architectural facade wall panels and external walls, as well as volumetric components such as space adding items, utility rooms and lift-wells used mainly in public housing and transport projects in Singapore.
The sea transportation of the precast products from Batam to Singapore supports long-term and sustainable deployment of the Group’s vessels.
BUSINESS OVERVIEWA
SL
Mar
ine
Hol
din
gs
Ltd
. /A
nnua
l Rep
ort
2015
6
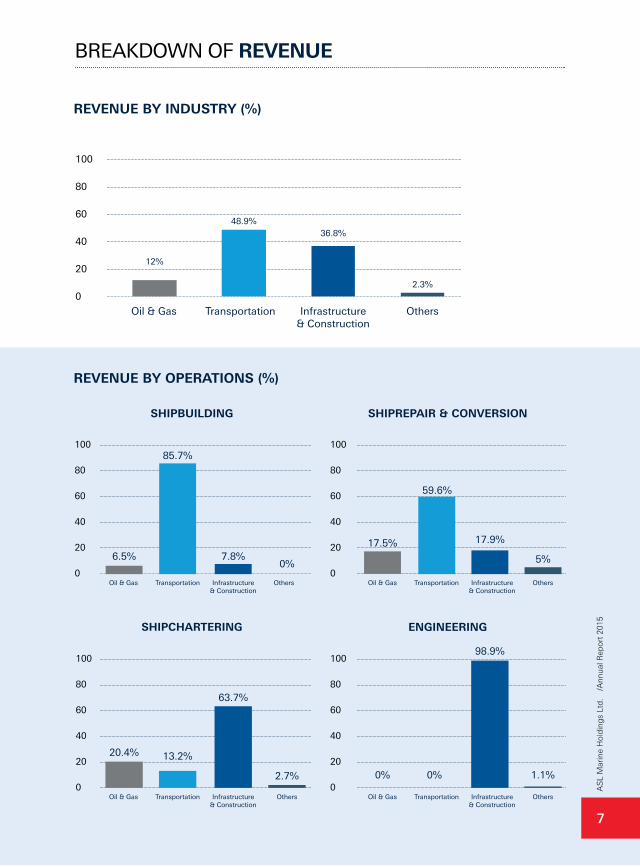
BREAKDOWN OF REVENUE
REVENUE BY INDUSTRY (%)
REVENUE BY OPERATIONS (%)
Oil & Gas
Oil & Gas
Oil & Gas
Oil & Gas
Oil & Gas
12%
0% 0%
98.9%
0%
48.9%
Transportation
Transportation
Transportation
Transportation
Transportation
36.8%
Infrastructure & Construction
Infrastructure & Construction
Infrastructure & Construction
Infrastructure & Construction
Infrastructure & Construction
2.3%
Others
Others
Others
Others
Others
100
80
60
40
20
0
100
80
60
40
20
0
100
80
60
40
20
0
100
80
60
40
20
0
100
80
60
40
20
0
6.5%
85.7%
7.8%17.5%
59.6%
17.9%
5%
20.4% 13.2%
63.7%
2.7% 1.1%
SHIPBUILDING SHIPREPAIR & CONVERSION
ENGINEERINGSHIPCHARTERING
AS
L M
arin
e H
old
ing
s Lt
d.
/Ann
ual R
epor
t 20
15
7
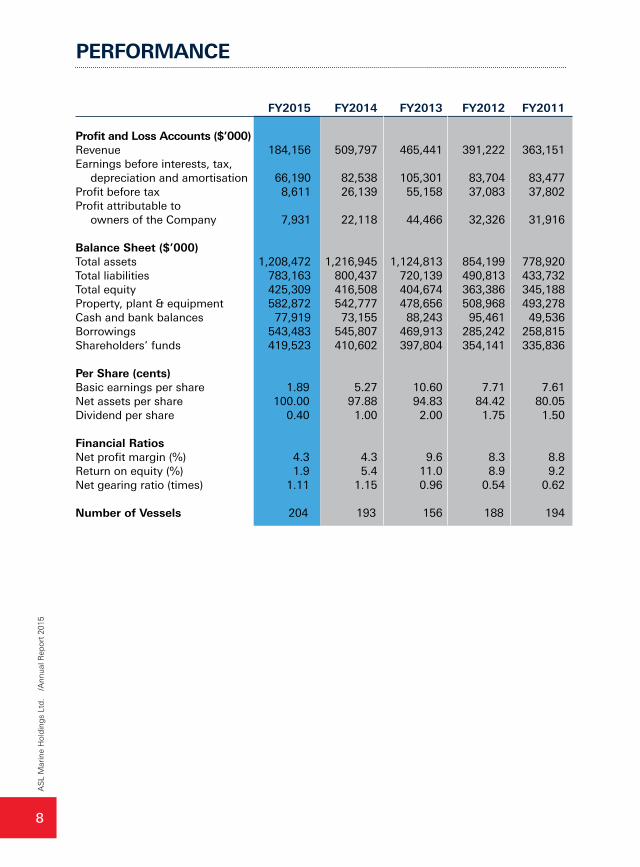
PERFORMANCE
FY2015 FY2014 FY2013 FY2012 FY2011 Profit and Loss Accounts ($’000) Revenue 184,156 509,797 465,441 391,222 363,151Earnings before interests, tax, depreciation and amortisation 66,190 82,538 105,301 83,704 83,477Profit before tax 8,611 26,139 55,158 37,083 37,802Profit attributable to owners of the Company 7,931 22,118 44,466 32,326 31,916 Balance Sheet ($’000) Total assets 1,208,472 1,216,945 1,124,813 854,199 778,920Total liabilities 783,163 800,437 720,139 490,813 433,732Total equity 425,309 416,508 404,674 363,386 345,188Property, plant & equipment 582,872 542,777 478,656 508,968 493,278Cash and bank balances 77,919 73,155 88,243 95,461 49,536Borrowings 543,483 545,807 469,913 285,242 258,815Shareholders’ funds 419,523 410,602 397,804 354,141 335,836 Per Share (cents) Basic earnings per share 1.89 5.27 10.60 7.71 7.61 Net assets per share 100.00 97.88 94.83 84.42 80.05 Dividend per share 0.40 1.00 2.00 1.75 1.50 Financial Ratios Net profit margin (%) 4.3 4.3 9.6 8.3 8.8 Return on equity (%) 1.9 5.4 11.0 8.9 9.2 Net gearing ratio (times) 1.11 1.15 0.96 0.54 0.62 Number of Vessels 204 193 156 188 194
AS
L M
arin
e H
old
ing
s Lt
d.
/Ann
ual R
epor
t 20
15
8
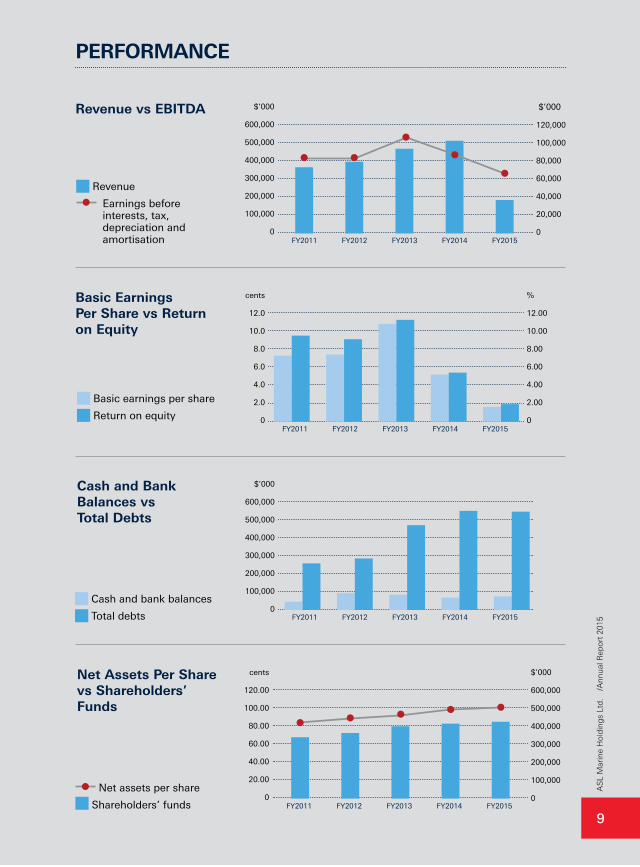
PERFORMANCE
Revenue vs EBITDA
Basic Earnings Per Share vs Return on Equity
Revenue
Earnings before interests, tax, depreciation and amortisation
Basic earnings per share
Return on equity
$’000
600,000
500,000
400,000
300,000
200,000
100,000
0
$’000
120,000
100,000
80,000
60,000
40,000
20,000
0FY2011 FY2012 FY2013 FY2014 FY2015
cents
12.0
10.0
8.0
6.0
4.0
2.0
0
%
12.00
10.00
8.00
6.00
4.00
2.00
0FY2011 FY2012 FY2013 FY2014 FY2015
$’000
600,000
500,000
400,000
300,000
200,000
100,000
0FY2011 FY2012 FY2013 FY2014 FY2015
cents
120.00
100.00
80.00
60.00
40.00
20.00
0
$’000
600,000
500,000
400,000
300,000
200,000
100,000
0FY2011 FY2012 FY2013 FY2014 FY2015
Cash and Bank Balances vs Total Debts
Net Assets Per Share vs Shareholders’ Funds
Cash and bank balances
Total debts
Net assets per share
Shareholders’ funds
AS
L M
arin
e H
old
ing
s Lt
d.
/Ann
ual R
epor
t 20
15
9
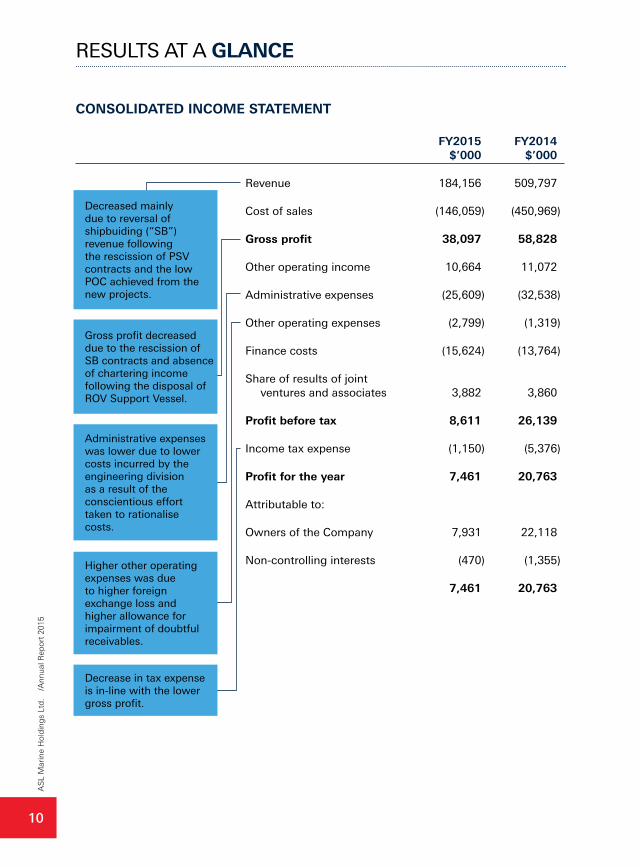
CONSOLIDATED INCOME STATEMENT
FY2015 FY2014 $’000 $’000
Revenue 184,156 509,797
Cost of sales (146,059) (450,969)
Gross profit 38,097 58,828
Other operating income 10,664 11,072
Administrative expenses (25,609) (32,538)
Other operating expenses (2,799) (1,319)
Finance costs (15,624) (13,764)
Share of results of joint ventures and associates 3,882 3,860
Profit before tax 8,611 26,139
Income tax expense (1,150) (5,376) Profit for the year 7,461 20,763
Attributable to:
Owners of the Company 7,931 22,118
Non-controlling interests (470) (1,355)
7,461 20,763
RESULTS AT A GLANCE
Decreased mainly due to reversal of shipbuiding (“SB”) revenue following the rescission of PSV contracts and the low POC achieved from the new projects.
Gross profit decreased due to the rescission of SB contracts and absence of chartering income following the disposal of ROV Support Vessel.
Administrative expenses was lower due to lower costs incurred by the engineering division as a result of the conscientious effort taken to rationalise costs.
Higher other operating expenses was due to higher foreign exchange loss and higher allowance for impairment of doubtful receivables.
Decrease in tax expense is in-line with the lower gross profit.
AS
L M
arin
e H
old
ing
s Lt
d.
/Ann
ual R
epor
t 20
15
10
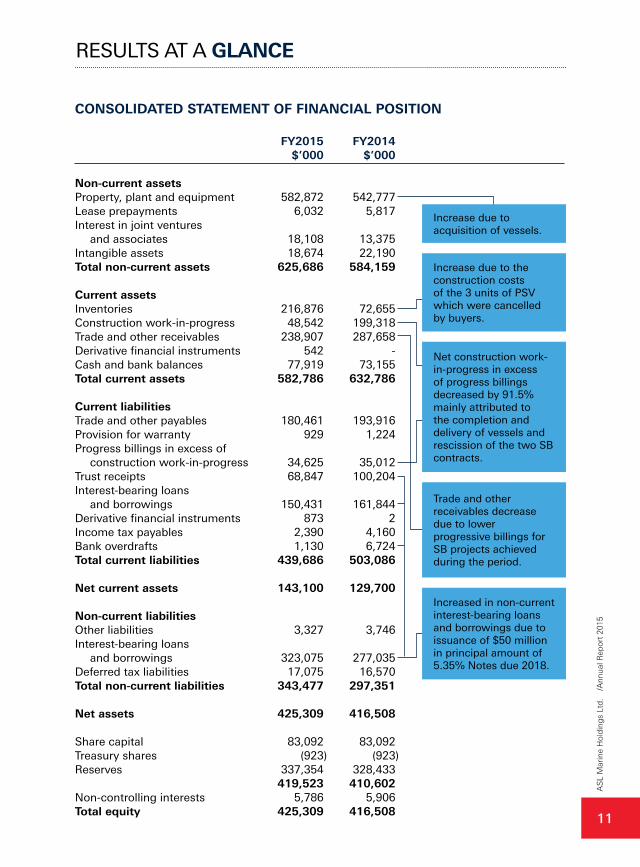
CONSOLIDATED STATEMENT OF FINANCIAL POSITION
FY2015 FY2014 $’000 $’000
Non-current assetsProperty, plant and equipment 582,872 542,777 Lease prepayments 6,032 5,817 Interest in joint ventures and associates 18,108 13,375 Intangible assets 18,674 22,190 Total non-current assets 625,686 584,159 Current assets Inventories 216,876 72,655 Construction work-in-progress 48,542 199,318 Trade and other receivables 238,907 287,658 Derivative financial instruments 542 - Cash and bank balances 77,919 73,155 Total current assets 582,786 632,786 Current liabilities Trade and other payables 180,461 193,916 Provision for warranty 929 1,224 Progress billings in excess of construction work-in-progress 34,625 35,012 Trust receipts 68,847 100,204 Interest-bearing loans and borrowings 150,431 161,844 Derivative financial instruments 873 2 Income tax payables 2,390 4,160 Bank overdrafts 1,130 6,724 Total current liabilities 439,686 503,086 Net current assets 143,100 129,700 Non-current liabilities Other liabilities 3,327 3,746 Interest-bearing loans and borrowings 323,075 277,035 Deferred tax liabilities 17,075 16,570 Total non-current liabilities 343,477 297,351 Net assets 425,309 416,508 Share capital 83,092 83,092 Treasury shares (923) (923)Reserves 337,354 328,433 419,523 410,602 Non-controlling interests 5,786 5,906 Total equity 425,309 416,508
RESULTS AT A GLANCE
Increase due to acquisition of vessels.
Increase due to the construction costs of the 3 units of PSV which were cancelled by buyers.
Net construction work-in-progress in excess of progress billings decreased by 91.5% mainly attributed to the completion and delivery of vessels and rescission of the two SB contracts.
Trade and other receivables decrease due to lower progressive billings for SB projects achieved during the period.
Increased in non-current interest-bearing loans and borrowings due to issuance of $50 million in principal amount of 5.35% Notes due 2018.
AS
L M
arin
e H
old
ing
s Lt
d.
/Ann
ual R
epor
t 20
15
11
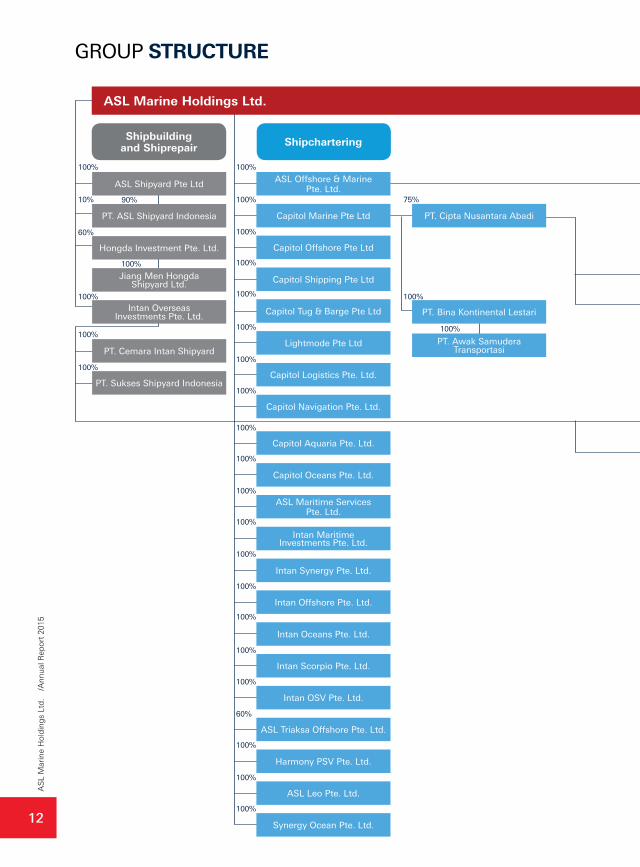
GROUP STRUCTURE
100%
90%
100% 100%
100% 75%
100%
100%
100%
100%
100%
100%
100%
100%
100%
100%
100%
100%
100%
60%
100%
100%
100%
100%
100%
100%
100%
60%
100%
100%
100%
10%
Shipchartering
PT. Cipta Nusantara Abadi
PT. Awak Samudera Transportasi
PT. Bina Kontinental Lestari
ASL Offshore & Marine Pte. Ltd.
Capitol Marine Pte Ltd
Capitol Shipping Pte Ltd
Capitol Offshore Pte Ltd
Capitol Logistics Pte. Ltd.
Lightmode Pte Ltd
Capitol Tug & Barge Pte Ltd
Capitol Aquaria Pte. Ltd.
ASL Maritime Services Pte. Ltd.
Capitol Oceans Pte. Ltd.
Intan Maritime Investments Pte. Ltd.
Capitol Navigation Pte. Ltd.
Intan Offshore Pte. Ltd.
Intan Scorpio Pte. Ltd.
Intan Oceans Pte. Ltd.
Intan OSV Pte. Ltd.
Intan Synergy Pte. Ltd.
Harmony PSV Pte. Ltd.
Synergy Ocean Pte. Ltd.
ASL Leo Pte. Ltd.
ASL Triaksa Offshore Pte. Ltd.
Shipbuilding and Shiprepair
ASL Shipyard Pte Ltd
PT. ASL Shipyard Indonesia
Jiang Men Hongda Shipyard Ltd.
Hongda Investment Pte. Ltd.
PT. Sukses Shipyard Indonesia
PT. Cemara Intan Shipyard
Intan Overseas Investments Pte. Ltd.
ASL Marine Holdings Ltd.
AS
L M
arin
e H
old
ing
s Lt
d.
/Ann
ual R
epor
t 20
15
12
100%
36%
50%
49%
50%
5%90%
100%
44.5% 100%
100%
100%
100%
100%100%
100%100%
100%
100%
100%
100%
100%
100%
100%
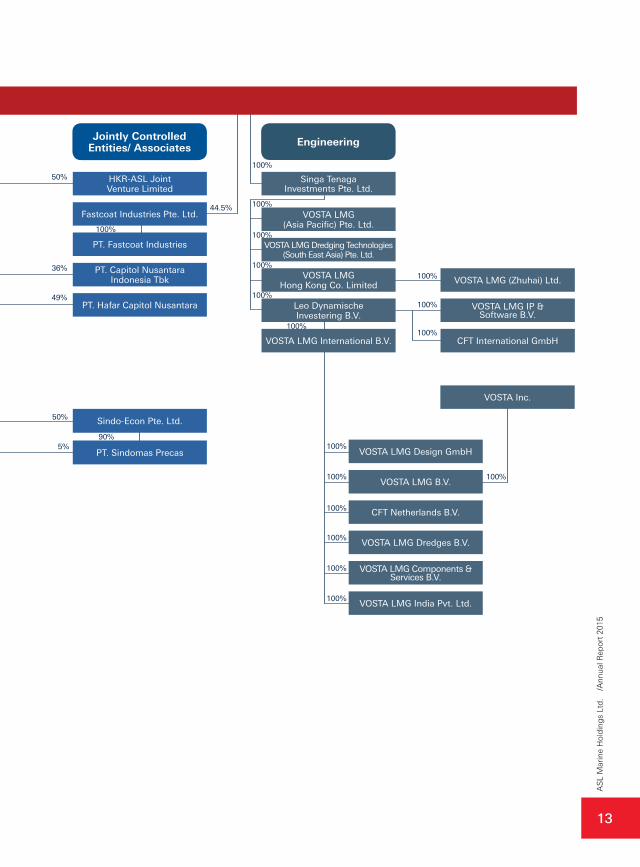
Engineering
Singa Tenaga Investments Pte. Ltd.
VOSTA LMG Dredging Technologies (South East Asia) Pte. Ltd.
VOSTA LMG (Asia Pacific) Pte. Ltd.
VOSTA LMG International B.V.
Leo Dynamische Investering B.V.
VOSTA LMG Hong Kong Co. Limited
CFT International GmbH
VOSTA LMG IP & Software B.V.
VOSTA LMG (Zhuhai) Ltd.
VOSTA Inc.
VOSTA LMG India Pvt. Ltd.
VOSTA LMG B.V.
VOSTA LMG Dredges B.V.
CFT Netherlands B.V.
VOSTA LMG Components & Services B.V.
VOSTA LMG Design GmbH
Jointly Controlled Entities/ Associates
Fastcoat Industries Pte. Ltd.
HKR-ASL Joint Venture Limited
PT. Capitol Nusantara Indonesia Tbk
PT. Fastcoat Industries
PT. Hafar Capitol Nusantara
PT. Sindomas Precas
Sindo-Econ Pte. Ltd.
ASL Marine Holdings Ltd.
AS
L M
arin
e H
old
ing
s Lt
d.
/Ann
ual R
epor
t 20
15
13
FOUNDER’S MESSAGE
Dear Shareholders,
Few people anticipated the length, severity and the profound impact that the decline of oil prices had on the entire oil and gas, and offshore and marine industries since July 2014. As a long-standing business with a history of over 40 years, I am glad that ASL Marine has developed a diversified business model, grown into a strong and resilient entity, and has stood the test of the volatile market again.
I would like to thank all our management team and staff for their commitment and persistence in getting the best results in a deteriorated business environment. My appreciation also goes to our business partners and customers for their trust in us, and to our board of directors for their valuable input over the past year.
Our new financial year has unfolded with great uncertainties brought by the market, but we have seen tough times before and we have gone through a few of these. I have faith that our organization and our people are adept enough to deal with the uncertainties and challenges. Once the industry recovers, ASL Marine will emerge as an even stronger player in the industry, and continue to deliver long-term return to our shareholders.
Ang Sin LiuFounder and Advisor
“ I have faith that our organization and our people are adept enough to deal with the uncertainties and challenges. Once the industry recovers, ASL Marine will emerge as an even stronger player in the industry, and continue to deliver long-term return to our shareholders.“
AS
L M
arin
e H
old
ing
s Lt
d.
/Ann
ual R
epor
t 20
15
14
CHAIRMAN’S MESSAGE
Dear Shareholders,
The year has seen calamitous declines in shipping rates. The Baltic Dry Index (“BDI”), which is an aggregate of freight rates for dry commodities namely iron ore, coals and grains, at one stage appeared to be in free fall. In the first 4 months of 2015 alone the BDI fell 65%, after already having fallen by over 85% from its 2008 peak. As these rates are the prices that our clients receive, the fall has impacted the global shipbuilding and to a lesser extent the ship repair industry significantly.
Four years ago, anticipating such a decline, we shifted our focus from vessels linked to the BDI to vessels used by the oil & gas industry particularly the production part of this industry (E&P companies). Whilst the move was strategically correct, the recent sharp declines in oil prices has resulted in equally sharp declines in the charter rates of both oil and gas carriers. According to the RS Platou LNG Spot and 12-month charter rates, which were both above US$140,000, are now below US$60,000 per day.
“ I would like to express my sincere gratitude to our business partners, customers and bankers for their trust and support. I must also thank ASL Marine’s Board of Directors for their help in shaping our strategy, for their commitment and strong stance on governance.”
AS
L M
arin
e H
old
ing
s Lt
d.
/Ann
ual R
epor
t 20
15
15
CHAIRMAN’S MESSAGE
In the light of this industry wide disaster, the financial performance that we present in these accounts, whilst not good, are very credible. For instance, we achieved FY2015 revenue of S$184.2 million. Equally we made a profit being a FY2015 net profit attributable to shareholders of S$7.9 million.
We have been able to achieve this by focusing on a few key strategies for the year. This includes focusing on the more stable and lower credit risk that is shiprepair and conversion, emphasizing our strength and investing in dredge engineering vessels (we are providing a significant number of vessels for the Megaport project) and working towards maximizing shipcharter utilization. Needless to say cost rationalization has also gone to the top of our list.
A REVIEW OF BUSINESS SEGMENTS ShipbuildingIt has been a particularly tough year for our shipbuilding business, primarily due to the weak business cycle and the oversupply in the global shipping market. Specifically, the lower revenue for the shipbuilding segment was due to a few reasons, 1) the percentage of completion for our orderbook backlog has resulted in lower revenue recognized for the financial year, 2) the S$95 million reversal on the shipbuilding revenue following the rescission of the two OSV shipbuilding contracts in December 2014, and 3) our conscious decision not to take excess risk in order taking. The sharp and prolonged decline in oil prices, coupled with the lower demand for bulk commodities and hence for shipping have resulted in fewer shipbuilding orders. While competition became fierce, we decided not to quote at a loss, or take on significant additional risk just to secure new build orders.
Nonetheless, there has been some encouraging progress. During FY2015, we secured new shipbuilding contracts worth approximately S$140 million for the construction of a series of tugs and barges. These vessels will be specially designed and built for overseas customers engaged in the mining and marine infrastructure industries. As of June 30, 2015, the Group has an outstanding shipbuilding order book from external customers of approximately S$356 million for 20 vessels, comprising AHTS, tug, barge, Seismic Support Vessel and tanker. These vessels will be progressively delivered to the customers up to the first quarter of FY2018.
Currently, we have 4 units of AHTS in our Build-to-Stock (BTS) program. These 4 AHTS are being constructed in our shipyards in Batam and China and are expected to be completed between March and October 2016. We are actively looking for buyer and chaterer for these 4 vessels. In view of the weak demand for OSV, we will not continue with the BTS program until the market improved in future.
Shiprepair and ConversionShiprepair and Conversion segment has performed in line with our expectation, given the depressed global shipping market. There were fewer high-value jobs during the year; however, owing to the demand for mandatory repair and docking of vessels, our extensive shipyard facilities and resources, our excellent track record in work execution and delivery, and the stable client network, we delivered stable revenue with improved profit margin. The low oil price has impacted our order intake of oil rigs and OSVs. More OSVs are being “cold stacked” and we expect the hit rate for tender for repair and conversion of OSV to be low in the next financial year.
AS
L M
arin
e H
old
ing
s Lt
d.
/Ann
ual R
epor
t 20
15
16
CHAIRMAN’S MESSAGE
ShipcharteringShipchartering segment as a whole has been stable despite the adversity in the offshore oil and gas market, supported by our diversified fleet structure. As at June 30, 2015, our fleet comprises 204 vessels (consists mainly of flat top work barges, crane barges, split hopper barges, tugs, dredge workboat, landing crafts, tankers, and OSV). While chartering revenue from offshore support vessels were lower for the year, non-offshore vessels, such as landing crafts, tugs and barges all delivered higher revenue, as they are mainly deployed in the domestic and regional marine infrastructure and construction projects (such as land reclamation, dredging and port construction) and transportation businesses (mainly the transportation of precast reinforced concrete products used in the domestic construction industry). Demand for these vessels is less sensitive to the low oil price and the declined offshore oil and gas support market. In addition, our chartering business benefited from the competitive logistic costs brought by the lower oil prices.
We have made substantial effort in securing new chartering order book. As at June 30 2015, the Group had an outstanding order book of approximately S$57 million for long-term shipchartering contracts.
Dredge EngineeringOur Dredge Engineering business (Vosta LMG) was in a way negatively impacted by the fewer dredgers’ newbuild projects. The dredging and land reclamation sector has been relatively quiet over the last one year. Prices of newbuild dredgers were extremely competitive and we do not foresee any improvement in current financial year. On an encouraging note, we saw higher demand and orders for Vosta LMG dredge components and services. The demand for our cutter head and cutter teeth, ball joints, dredge control system and engineering services remained healthy.
Precast Reinforced Concrete ProductsNotably, our 50% joint venture, Sindo-Econ Group, has delivered remarkable performance for the year, supported by higher sales in precast reinforced concrete products. The demand for precast products is expected to be supported by the domestic public housing development program such as the roll-out of new Build-to-Order flats as well as MRT tunneling works, and further contribute to the Group’s financial performance in the future. The precast production plant is located in our subsidiary shipyard in Batam (PT. Cemara Intan Shipyard) and equipped with a roll-on / roll-off ramp, purposed built for loading and discharging of cargoes. The finished precast products are shipped out from Batam by our landing crafts. The charter of our landing crafts provides a long-term sustainable income for our chartering division.
Financial Highlight Our diversified business model and fleet structure have enabled us to generate a relatively healthy operating cashflow of S$124.8 million, even as the market remained challenging. The Group had a net asset value per share of 100.00 Singapore cents as at June 30, 2015, compared to 97.88 Singapore cents as at June 30, 2014. For FY2015, the Group reported earnings per share of 1.89 Singapore cents, compared to 5.27 Singapore cents for FY2014. The Group proposed a cash dividend of 0.4 Singapore cents for FY2015, representing a dividend payout of 21%.
AS
L M
arin
e H
old
ing
s Lt
d.
/Ann
ual R
epor
t 20
15
17
CHAIRMAN’S MESSAGE
Outlook According to U.S. Energy Information Administration (“EIA”), the Brent crude oil price is projected at average $54 per barrel in 2015 and $59 per barrel in 2016. However, it also highlighted that the “projection remains subject to significant uncertainties as the oil market moves toward balance”, and “the oil market faces a host of uncertainties heading into 2016 including the pace and volume at which Iranian oil reenters the market, the strength of oil consumption growth, and the responsiveness of non-OPEC production to low oil prices.” Subsequent to this forecast and in August, Goldman Sachs trimmed their forecast for West Texas from US$57/bbl to US$45/bbl and a warning that it could touch US$20/bbl. Even if oil prices did not fall, the uncertainties will weigh on the capital expenditure budgeting of the E&P companies. Consequently, we do not expect the upstream activities to resume to its previous level as seen in early 2014 very soon.
While this means further challenges ahead, at this time our outstanding order books for shipbuilding and shipchartering remain healthy, offering earnings visibility. In addition, we are hopeful that the existing and upcoming major infrastructure projects in Singapore are going to require more work in land reclamation, dredging and port construction, and these projects are expected to benefit our chartering, precast products and dredge engineering business. We have also seen an increase in business enquiries for repair of bulkers, tankers and other types of commercial vessels, thanks to low oil price.
Barring any unforeseen circumstances, the Board expects the Group to remain profitable for the financial year 2016.
Appreciation My deepest appreciation goes to all our management and employees for their loyalty and dedication over this most challenging of years. I would like to express my sincere gratitude to our business partners, customers and bankers for their trust and support. I must also thank ASL Marine’s Board of Directors for their help in shaping our strategy, for their commitment and strong stance on governance. Last but not least, we are grateful to our shareholders for your continued trust in us. For all our stakeholder’s, we will strive to drive ASL Marine through the challenges ahead to deliver optimal performance in the medium and long term.
Ang Kok TianChairman and Managing Director
AS
L M
arin
e H
old
ing
s Lt
d.
/Ann
ual R
epor
t 20
15
18
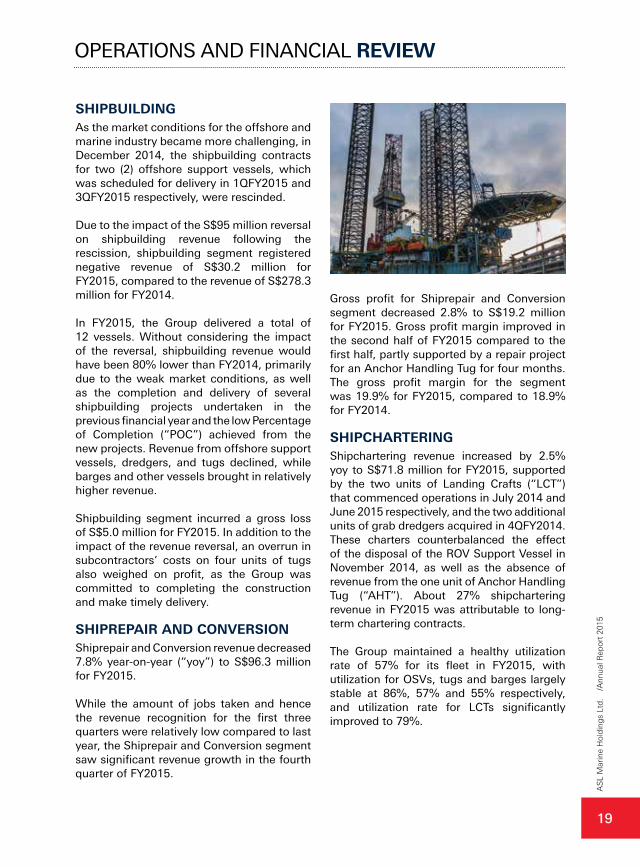
SHIPBUILDING As the market conditions for the offshore and marine industry became more challenging, in December 2014, the shipbuilding contracts for two (2) offshore support vessels, which was scheduled for delivery in 1QFY2015 and 3QFY2015 respectively, were rescinded.
Due to the impact of the S$95 million reversal on shipbuilding revenue following the rescission, shipbuilding segment registered negative revenue of S$30.2 million for FY2015, compared to the revenue of S$278.3 million for FY2014.
In FY2015, the Group delivered a total of 12 vessels. Without considering the impact of the reversal, shipbuilding revenue would have been 80% lower than FY2014, primarily due to the weak market conditions, as well as the completion and delivery of several shipbuilding projects undertaken in the previous financial year and the low Percentage of Completion (“POC”) achieved from the new projects. Revenue from offshore support vessels, dredgers, and tugs declined, while barges and other vessels brought in relatively higher revenue.
Shipbuilding segment incurred a gross loss of S$5.0 million for FY2015. In addition to the impact of the revenue reversal, an overrun in subcontractors’ costs on four units of tugs also weighed on profit, as the Group was committed to completing the construction and make timely delivery.
SHIPREPAIR AND CONVERSION Shiprepair and Conversion revenue decreased 7.8% year-on-year (“yoy”) to S$96.3 million for FY2015.
While the amount of jobs taken and hence the revenue recognition for the first three quarters were relatively low compared to last year, the Shiprepair and Conversion segment saw significant revenue growth in the fourth quarter of FY2015.
Gross profit for Shiprepair and Conversion segment decreased 2.8% to S$19.2 million for FY2015. Gross profit margin improved in the second half of FY2015 compared to the first half, partly supported by a repair project for an Anchor Handling Tug for four months. The gross profit margin for the segment was 19.9% for FY2015, compared to 18.9% for FY2014.
SHIPCHARTERING Shipchartering revenue increased by 2.5% yoy to S$71.8 million for FY2015, supported by the two units of Landing Crafts (“LCT”) that commenced operations in July 2014 and June 2015 respectively, and the two additional units of grab dredgers acquired in 4QFY2014. These charters counterbalanced the effect of the disposal of the ROV Support Vessel in November 2014, as well as the absence of revenue from the one unit of Anchor Handling Tug (“AHT”). About 27% shipchartering revenue in FY2015 was attributable to long-term chartering contracts.
The Group maintained a healthy utilization rate of 57% for its fleet in FY2015, with utilization for OSVs, tugs and barges largely stable at 86%, 57% and 55% respectively, and utilization rate for LCTs significantly improved to 79%.
OPERATIONS AND FINANCIAL REVIEW
AS
L M
arin
e H
old
ing
s Lt
d.
/Ann
ual R
epor
t 20
15
19
OPERATIONS AND FINANCIAL REVIEW
Shipchartering segment reported gross profit of S$10.4 million for FY2015, as compared to S$17.7 million for FY2014. Gross profit margin for the shipchartering segment decreased from 25.3% to 14.4% yoy as a result of the change in vessel mix.
ENGINEERING Engineering revenue reported revenue of S$46.3 million for FY2015, 18.8% lower compared to that of FY2014. Both New Buildings and Components revenue decreased due to fewer New Buildings projects undertaken and few orders for spare parts and cutting/coupling products received from customers in FY2015. Engineering segment generated S$13.6 million gross profit in the financial year, a decrease of 5% yoy, while gross profit margin improved from 25.1% for FY2014 to 29.3% for FY2015 supported by better margin achieved from Components business.
SUBSIDIARIES AND JOINT VENTURES In September 2014, the Company has incorporated two wholly-owned subsidiaries, ASL Leo Pte. Ltd. (“ASLL”) and Harmony PSV Pte. Ltd. (“HPSV”). In April 2015, the Company has incorporated one wholly-owned subsidiary, Synergy Ocean Pte. Ltd. (“SO”). All the three companies are engaged in freight water transport and ship management services.
The 50% joint venture, Sindo-Econ Group, contributed profit of S$2.4 million to the Group for FY2015, contributed by higher sales in concrete precast operations. Together with our two associate companies, our joint venture and associate companies contributed profit of S$3.9 million to the Group.
FINANCIAL REVIEW Group reported revenue of S$184.2 million for FY2015, a 64% decline yoy. Gross profit was S$38.1 million, a decline of 35% yoy.
Group reported net profit attributable to shareholders of S$7.9 million for FY2015, compared to S$22.1 million for FY2014. Earnings per share were 1.89 Singapore cents for FY2015 compared to 5.27 Singapore cents for FY2014. Group proposed a cash dividend of 0.4 Singapore cents per share, representing a dividend payout of 21%.
On October 1, 2014, the Group issued S$50 million in principal amount of 5.35 per cent notes due 2018, under the Company’s S$500 million multicurrency debt issuance programme, for the financing of the working capital and capital expenditure requirements of the Company and its subsidiaries and the refinancing of the existing borrowings of the Group.
AS
L M
arin
e H
old
ing
s Lt
d.
/Ann
ual R
epor
t 20
15
20
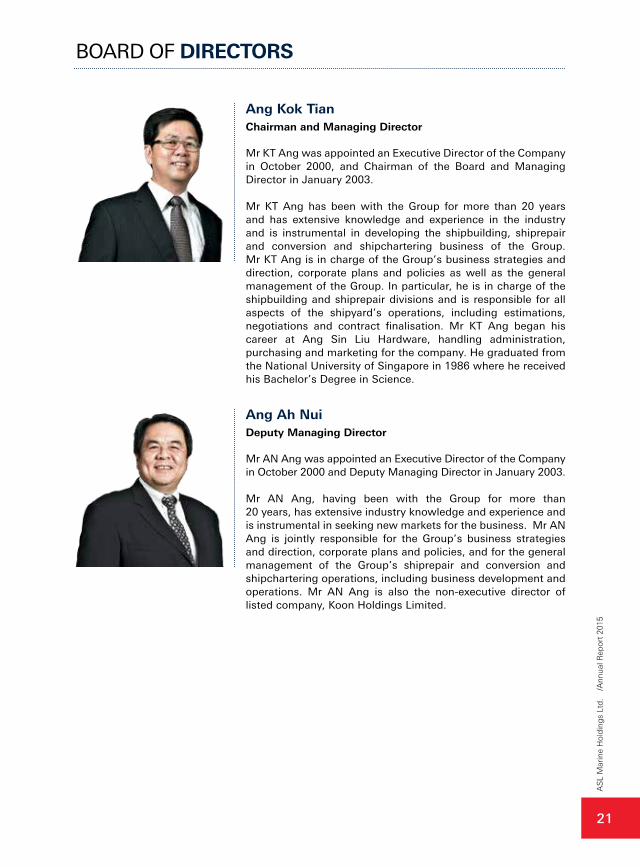
Ang Ah NuiDeputy Managing Director
Mr AN Ang was appointed an Executive Director of the Company in October 2000 and Deputy Managing Director in January 2003.
Mr AN Ang, having been with the Group for more than 20 years, has extensive industry knowledge and experience and is instrumental in seeking new markets for the business. Mr AN Ang is jointly responsible for the Group’s business strategies and direction, corporate plans and policies, and for the general management of the Group’s shiprepair and conversion and shipchartering operations, including business development and operations. Mr AN Ang is also the non-executive director of listed company, Koon Holdings Limited.
Ang Kok TianChairman and Managing Director
Mr KT Ang was appointed an Executive Director of the Company in October 2000, and Chairman of the Board and Managing Director in January 2003.
Mr KT Ang has been with the Group for more than 20 years and has extensive knowledge and experience in the industry and is instrumental in developing the shipbuilding, shiprepair and conversion and shipchartering business of the Group. Mr KT Ang is in charge of the Group’s business strategies and direction, corporate plans and policies as well as the general management of the Group. In particular, he is in charge of the shipbuilding and shiprepair divisions and is responsible for all aspects of the shipyard’s operations, including estimations, negotiations and contract finalisation. Mr KT Ang began his career at Ang Sin Liu Hardware, handling administration, purchasing and marketing for the company. He graduated from the National University of Singapore in 1986 where he received his Bachelor’s Degree in Science.
BOARD OF DIRECTORS
AS
L M
arin
e H
old
ing
s Lt
d.
/Ann
ual R
epor
t 20
15
21
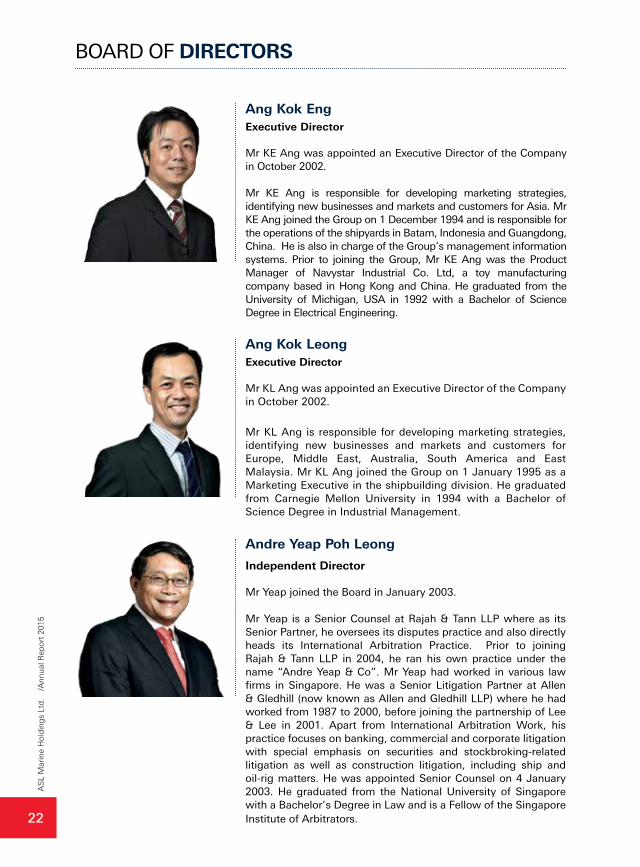
Ang Kok Eng Executive Director
Mr KE Ang was appointed an Executive Director of the Company in October 2002.
Mr KE Ang is responsible for developing marketing strategies, identifying new businesses and markets and customers for Asia. Mr KE Ang joined the Group on 1 December 1994 and is responsible for the operations of the shipyards in Batam, Indonesia and Guangdong, China. He is also in charge of the Group’s management information systems. Prior to joining the Group, Mr KE Ang was the Product Manager of Navystar Industrial Co. Ltd, a toy manufacturing company based in Hong Kong and China. He graduated from the University of Michigan, USA in 1992 with a Bachelor of Science Degree in Electrical Engineering.
Ang Kok LeongExecutive Director
Mr KL Ang was appointed an Executive Director of the Company in October 2002.
Mr KL Ang is responsible for developing marketing strategies, identifying new businesses and markets and customers for Europe, Middle East, Australia, South America and East Malaysia. Mr KL Ang joined the Group on 1 January 1995 as a Marketing Executive in the shipbuilding division. He graduated from Carnegie Mellon University in 1994 with a Bachelor of Science Degree in Industrial Management.
Andre Yeap Poh Leong
Independent Director
Mr Yeap joined the Board in January 2003.
Mr Yeap is a Senior Counsel at Rajah & Tann LLP where as its Senior Partner, he oversees its disputes practice and also directly heads its International Arbitration Practice. Prior to joining Rajah & Tann LLP in 2004, he ran his own practice under the name “Andre Yeap & Co”. Mr Yeap had worked in various law firms in Singapore. He was a Senior Litigation Partner at Allen & Gledhill (now known as Allen and Gledhill LLP) where he had worked from 1987 to 2000, before joining the partnership of Lee & Lee in 2001. Apart from International Arbitration Work, his practice focuses on banking, commercial and corporate litigation with special emphasis on securities and stockbroking-related litigation as well as construction litigation, including ship and oil-rig matters. He was appointed Senior Counsel on 4 January 2003. He graduated from the National University of Singapore with a Bachelor’s Degree in Law and is a Fellow of the Singapore Institute of Arbitrators.
BOARD OF DIRECTORSA
SL
Mar
ine
Hol
din
gs
Ltd
. /A
nnua
l Rep
ort
2015
22
Christopher Chong Meng TakIndependent Director
Mr Chong joined the Board in January 2006.
Mr Chong is a partner of ACH Investments Pte Ltd, a corporate advisory firm regulated by the Monetary Authority of Singapore. He is currently an independent director at 30 June 2015 of 5 other public companies including: Cedar Strategic Holdings Ltd, Singapore O&G Ltd; Ying Li International Real Estate Limited listed on the SGX-ST; and GLG Corp Ltd; and Koon Holdings Limited listed on the Australian Stock Exchange. Mr Chong is also a Director and/or an adviser to several private companies, significant Asian families and to regulatory branches of the Singapore Government.
Mr Chong has significant experience in capital markets, securities law, corporate governance and corporate affairs. Prior to co-founding ACH Investments Pte Ltd, he was a multi-award winning analyst and the managing director of HSBC Securities (Singapore) Pte Ltd, formerly known as HSBC James Capel Securities (Singapore) Pte Ltd, and prior to this was an executive director of UOB Kay Hian Holdings Ltd, formerly known as Kay Hian James Capel Ltd.
Mr Chong holds a Bachelor of Science degree in Economics (1st Honours) from the University College of Wales and a Master of Business Administration degree from the London Business School. He is a member of the Institute of Chartered Accountants of Scotland, a Fellow of the Australian Institute of CPAs, a Fellow of the Hong Kong Institute of Certified Public Accountants, a Fellow of the Singapore Institute of Directors, a Fellow of the Australian Institute of Company Directors and a Master Stockbroker of the Stockbrokers Association of Australia.
Tan Sek KheeIndependent Director
Mr Tan Sek Khee joined the Board in January 2014.
Mr Tan is currently an Independent Director of both SGX listed Europtronic Group and Ying Li International Real Estate Limited. Mr Tan is also currently an Executive Director of several private companies in Singapore, Indonesia, Thailand and China. Mr Tan brings to the Group extensive experience in general management, business development, marketing, procurement and logistics. He has more than 30 years of corporate and business experience in Singapore, Indonesia, Thailand and China.
Mr Tan graduated with a Bachelor Degree of Commerce from Nanyang University in 1979. He is also a registered member of Singapore Institute of Directors.
BOARD OF DIRECTORS
AS
L M
arin
e H
old
ing
s Lt
d.
/Ann
ual R
epor
t 20
15
23
SENIOR MANAGEMENT
Ang IrisChief Financial Officer and Company Secretary
Iris joined the Group in December 2011 and is responsible for all accounting, financial and treasury management functions, including matters relating to the Company’s debt and equity fund raising, managing investor relations and corporate secretarial functions of the Group. Iris has over 10 years of experience in finance and accounting. Iris holds a professional qualification from the Association of Chartered Certified Accountants and is a fellow member of the Institute of Singapore Chartered Accountants. Prior to joining the Group, she was the Chief Financial Officer of a few Singapore Exchange Main Board listed companies.
Tay Kes SiongGeneral Manager (Shipchartering)
Capt. Tay joined the Group in October 2002 and is responsible for managing the shipping operations of the Group, including marketing, overall fleet scheduling, maintenance, crew management, shipping agencies, freight forwarding and freight documentation.
Capt. Tay has more than 30 years of experience in the shipping and marine industry. Prior to joining the Group, Capt. Tay was a Marine Surveyor and a Director of Marine Management Surveyors and Services Pte Ltd which engaged in marine and cargo surveys, consultancy, sea trials, compass adjustments, pre-purchase inspections, shipping agencies, forwarding and crew management.
AS
L M
arin
e H
old
ing
s Lt
d.
/Ann
ual R
epor
t 20
15
24
26 Corporate Governance Report 49 Disclosure Guide on
Governance Practices
58 Risk Management Strategies
GOVERNANCE FINANCIAL STATEMENTS
59 Directors’ Report
64 Statement by Directors
65 Independent Auditor’s Report
67 Statements of Financial Position
69 Consolidated Income Statement
70 Consolidated Statement of Comprehensive Income
71 Statements of Changes in Equity
74 Consolidated Statement of Cash Flows
76 Notes to the Financial Statements
AS
L M
arin
e H
old
ing
s Lt
d.
/Ann
ual R
epor
t 20
15
25
CORPORATE GOVERNANCE REPORT
The Board of Directors (the “Board”) of ASL Marine Holdings Ltd. (the “Company”) is committed to maintaining a high standard of corporate governance.
This report covers the Company’s corporate governance practices for the financial year ended 30 June 2015 with specific reference made to the principles and guidelines of the Code of Corporate Governance 2012 (the “Code”) issued on 2 May 2012.
The Board is pleased to confirm that the Company has complied with the Code, save for deviation with reference to Guideline 3.1 (Chairman and CEO should be separate persons) which is explained in this report and the Board will be appointing an Independent Chairman (compliance with Guideline 3.1 and succession planning) by 31 October 2017, the transition period granted by the Monetary Authority of Singapore.
BOARD MATTERS
The Board’s Conduct of Affairs
Principle 1: Every company should be headed by an effective Board to lead and control the company. The Board is collectively responsible for the long-term success of the company. The Board works with management to achieve this objective and management remains accountable to the Board.
The primary function of the Board is to protect the assets and to enhance the long-term value of the Company for its shareholders. Besides carrying out its statutory responsibilities, the Board oversees the businesses and affairs of the Group. It reviews and advises on overall strategies, policies and objectives, sets goals, supervises management, monitors business performance and goals achievement. The Board also oversees the processes of evaluating the adequacy of internal controls, risk management, financial reporting and compliance and assumes responsibility for overall corporate governance of the Group. Each director is expected, in the course of carrying out his duties, to exercise independent judgment and act in good faith in the best interests of the Company.
The Board’s approval is required for matters such as the Group’s financial plans and annual budget, acceptance of bank facilities, major investment and divestment proposals, material acquisitions and disposal of assets, interested person transactions of a material nature and release of the Group’s quarterly and full year financial results to the Singapore Exchange Securities Trading Limited (“SGX-ST”). Apart from matters that specifically require the Board’s approval, the Board approves transactions exceeding certain threshold limits and delegates authority for transactions below those limits to management so as to optimise operational efficiency.
To assist the Board in the execution of its responsibilities and to provide independent oversight of management, various Board Committees, namely the Audit Committee (“AC”), Nominating Committee (“NC”) and Remuneration Committee (“RC”), have been constituted with clear written terms of reference. These Committees are made up solely of independent directors and the effectiveness of each Committee is constantly monitored by the Board.
No new director was appointed by the Company during the financial year ended 30 June 2015. For new appointments to the Board, the newly-appointed director will be given a formal letter setting out his duties and obligations. The newly appointed director will be briefed by the lead independent director and management and provided with a director’s folder containing
AS
L M
arin
e H
old
ing
s Lt
d.
/Ann
ual R
epor
t 20
15
26
CORPORATE GOVERNANCE REPORT
materials relating to the Group’s businesses and governance practices. All directors are also invited to visit the yards and meet with middle management to gain a better understanding of the Group’s business operations. To keep pace with regulatory changes, the director’s own initiatives are supplemented from time to time with information, updates and sponsored seminars conducted by external professionals, including any changes in legislation and financial reporting standards, government policies and regulations and guidelines from SGX-ST that affect the Company and/or the directors in discharging their duties.
During the year, selected members of the Board attended seminars on “KPMG Global Real Estate & Construction Conference”, “Introduction to Minerals Industry in China”, “Singapore Director Briefing: Riding the Flow of Global Capital”, “Scotiabank & Howard Weil - Energy in the Americas”, “Integrated Reporting: An Audit Committee Perspective”, “Commodities Breakfast Seminar” and “Impact of Shale Gas on LNG Developments and Pricing”, among others, organised by the Scotiabank, Singapore Institute of Directors, Australian Institute of Company Directors, SGX-ST, Holman Fenwick Willan, other professional bodies and on line courses. Directors, in particular independent directors, are also encouraged to read and to engage in informal discussions on subjects which are relevant to the Company. In aggregate, members of the Board spend over 35 hours on such events.
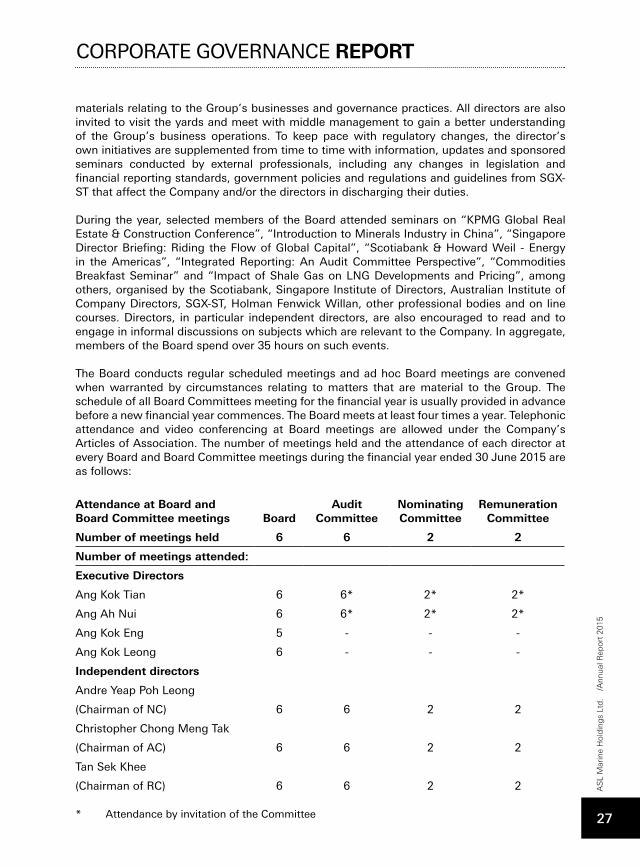
The Board conducts regular scheduled meetings and ad hoc Board meetings are convened when warranted by circumstances relating to matters that are material to the Group. The schedule of all Board Committees meeting for the financial year is usually provided in advance before a new financial year commences. The Board meets at least four times a year. Telephonic attendance and video conferencing at Board meetings are allowed under the Company’s Articles of Association. The number of meetings held and the attendance of each director at every Board and Board Committee meetings during the financial year ended 30 June 2015 are as follows:
Attendance at Board and Board Committee meetings Board
Audit Committee
Nominating Committee
Remuneration Committee
Number of meetings held 6 6 2 2
Number of meetings attended:
Executive Directors
Ang Kok Tian 6 6* 2* 2*
Ang Ah Nui 6 6* 2* 2*
Ang Kok Eng 5 - - -
Ang Kok Leong 6 - - -
Independent directors
Andre Yeap Poh Leong
(Chairman of NC) 6 6 2 2
Christopher Chong Meng Tak
(Chairman of AC) 6 6 2 2
Tan Sek Khee
(Chairman of RC) 6 6 2 2
* Attendance by invitation of the Committee
AS
L M
arin
e H
old
ing
s Lt
d.
/Ann
ual R
epor
t 20
15
27
Board Composition and Guidance
Principle 2: There should be a strong and independent element on the Board, which is able to exercise objective judgment on corporate affairs independently, in particular, from management and 10% shareholders. No individual or small group of individuals should be allowed to dominate the Board’s decision making.
The Board comprises seven directors, three of whom are independent directors. The independent directors make up more than one-third of the Board thus providing an independent element on the Board capable of exercising independent judgment on corporate affairs of the Group and provide management with a diverse and objective perspective to enable balanced and well-considered decisions to be made. The NC determines, on an annual basis, the independence of each independent director based on the guidelines provided in the Code as one who has no relationship with any of the substantial shareholders of the Company, the Company, its related companies or its officers that could interfere, or be reasonably perceived to interfere, with the exercise of the director’s independent business judgment in the conduct of the Company’s affairs.
The Board considers the current Board size and composition appropriate for the nature and scope of the Group’s operations. The Board will continue to review its Board size and composition taking into consideration recommendations of the Corporate Governance Council as and when announced.
Among the directors are business leaders, financial and legal professionals who possess the relevant expertise and skill sets for effective decision-making. One of our independent directors whilst never having held an executive position with a ship builder and ship repairer, has over 20 years’ experience analysing, reviewing and advising companies in such businesses. The profiles of the directors are set out on pages 21 to 23 of this Annual Report. The combined business, management, finance, strategic planning and professional experience, knowledge and expertise of the directors provide the necessary core competencies for the Board to effectively lead and manage the Group’s businesses and operations.
The independent directors participate actively during Board meetings. In addition to providing constructive advice to management on pertinent issues affecting the affairs and business of the Group, they also review management’s performance in meeting goals and objectives of the Group’s business segments. The Company has benefited from management’s access to its directors for guidance and exchange of views both within and outside of the meetings of the Board and Board Committees. The independent directors communicate amongst themselves and with the Company’s auditors and senior managers. The Company co-ordinates informal meetings for independent directors to meet without the presence of the executive directors and/or management, where necessary.
CORPORATE GOVERNANCE REPORTA
SL
Mar
ine
Hol
din
gs
Ltd
. /A
nnua
l Rep
ort
2015
28
Chairman and Chief Executive Officer
Principle 3: There should be a clear division of responsibilities between the leadership of the Board and the executives responsible for managing the company’s business. No one individual should represent a considerable concentration of power.
Mr Ang Kok Tian is both the Chairman of the Board and the Managing Director of the Company. Mr Ang Kok Tian is involved in the day-to-day running of the Group; he leads management in setting marketing strategies and objectives and ensures accurate, adequate and timely flow of information between the Board, management and shareholders of the Company. He facilitates constructive discussions between the Board and management and encourages their effective contributions. Whilst the independent directors of the Company possess the relevant expertise and experience in their respective professional fields, none have had significant hands-on experience in the marine industry. Consequently, and given the volatility and challenges of the marine industry, they are of the view that it is in the best interests of the Group to have a Chairman so that the Board can have the benefit of a Chairman who is knowledgeable about the marine industry and the businesses of the Group and is thereby better able to guide discussions and ensures that the Board is properly briefed in a timely manner on pertinent issues and developments. The Chairman takes a leading role in ensuring the Company’s compliance with corporate governance guidelines with the full support of the directors, Company Secretary and management.
Mr Ang Kok Tian is supported by Mr Ang Ah Nui, the Deputy Managing Director on the setting of business strategies and managing the day-to-day operations of the Group. In the absence of Mr Ang Kok Tian, Mr Ang Ah Nui would stand in as the acting Managing Director to ensure continuity of the business operations of the Company.
Our independent director, Mr Christopher Chong Meng Tak has been appointed as lead independent director to coordinate the activities of the independent directors and act as principal liaison between the independent directors and Chairman on sensitive issues. The lead independent director is also available to shareholders where they have concerns, for which contact through the normal channels of the Chairman and Managing Director has failed to resolve or for which such contact is inappropriate.
All major decisions made by the Board are subject to majority approval of the Board and are reviewed by the Board Committees, whose members comprise only independent directors of the Company. Mr Ang Kok Tian’s performance and remuneration are reviewed by the NC and RC respectively, whose members comprise only independent directors of the Company. The Board believes that there are adequate safeguards in place to ensure an appropriate balance of power and authority within the spirit of good corporate governance.
CORPORATE GOVERNANCE REPORT
AS
L M
arin
e H
old
ing
s Lt
d.
/Ann
ual R
epor
t 20
15
29
Board Membership
Principle 4: There should be a formal and transparent process for the appointment and re-appointment of directors to the Board.
The Board established the NC in March 2003 which currently consists of three independent directors, namely, Mr Andre Yeap Poh Leong, Mr Christopher Chong Meng Tak and Mr Tan Sek Khee. Mr Andre Yeap Poh Leong is the Chairman of the NC and he is not associated in any way with the substantial shareholders of the Company.
The operations of the NC are regulated by its terms of reference, which were approved and are subject to periodic review by the Board. The functions of the NC include making recommendations to the Board on all appointments and re-appointments/re-elections of directors taking into consideration the mix of expertise, skills and attributes of the directors for meeting the business and governance needs of the Group. The NC is also tasked to assess the independence of the directors annually.
For appointment of new directors to the Board if a vacancy arises, the NC will, in consultation with the Board, evaluate and determine the selection criteria with due consideration to the mix of skills, knowledge and experience of the existing Board. The selection criterion includes integrity, diversity of competencies, expertise and financial literacy. The NC’s selection process involves the evaluation of the existing strength and capabilities of the Board and determines the desirable competencies for a particular appointment, seek suitably qualified candidates widely, review and undertake background checks on the resumes received, short-list and interview candidates including a briefing of the duties required to ensure that there are no expectations gap and the level of commitment required. The NC will seek candidates widely and beyond persons directly known to the directors and is empowered to engage professional search firms and also give due consideration to candidates identified by any person. The NC will interview all potential candidates in frank and detailed meetings and make recommendations to the Board for approval.
Every year, the NC reviewed and affirmed the independence of the Company’s independent directors. Each director is required to complete a Director’s Independence Checklist on an annual basis to confirm his independence. The checklist is drawn up based on the guidelines provided in the Code and requires each director to assess whether he considers himself independent despite not being involved in any of the relationships identified in the Code. The checklist requires each director to disclose any relationship which would interfere or be reasonably perceived to interfere with the exercise of independent judgment in carrying out the functions as an independent director of the Company. Amongst the items included in the checklist are disclosure pertaining to any employment including compensation received from the Company or any of its related corporations, relationship to an executive director of the Company, its related corporations or its 10% shareholders, immediate family members employed by the Company or any of its related corporations as senior executive officer whose remuneration is determined by the RC, shareholding or partnership or directorship (including those held by immediate family members) in an organisation to which the Company or any of its subsidiaries made, or from which the Company or its subsidiaries received, significant payments in the current or immediate past financial year. The NC will then review the checklist completed by each director to determine whether the director is independent.
CORPORATE GOVERNANCE REPORTA
SL
Mar
ine
Hol
din
gs
Ltd
. /A
nnua
l Rep
ort
2015
30
For the year under review, the NC has ascertained and is satisfied with the independence of the Company’s independent directors.
Mr Andre Yeap Poh Leong has served on the Board for more than 10 years while Mr Christopher Chong Meng Tak served more than 9 years from the date of their first election. The Board recognises the valuable contribution of its independent directors who over time have developed in-depth knowledge of the Group’s businesses and operations. The independent directors do not exercise management functions in the Group, they ensure that key issues and decisions made are constructively challenged and thoroughly reviewed and monitor the performance of management in meeting agreed goals and objectives. For this reason, the Board has not set a fixed term of office for each of its independent directors as the Board believes that their tenure would not materially interfere with their ability to exercise independent judgment and act in the best interests of the Group and its shareholders. Having said this, the NC pays special attention to directors whose terms exceed 9 years to determine if there is any impairment with respect to their independence and if no rotation occurs will the Board and the Company suffer from the lack of renewal.
All directors are required to declare their Board representations. With the exception of Mr Tan Sek Khee and Mr Christopher Chong Meng Tak who respectively holds two and four concurrent directorships in other companies that have a primary listing on SGX-ST, the remaining five directors hold not more than two concurrent directorships in other listed companies in SGX-ST. For the year under review, the NC is satisfied that Mr Tan Sek Khee and Mr Christopher Chong Meng Tak, notwithstanding their multiple board appointments, have given adequate time and attention to the affairs of the Group to discharge their duties as director of the Company through their attendance at meetings of the Board and Board Committees.
Pursuant to Article 91 of the Company’s Articles of Association, every director (other than the Managing or Joint Managing Director) shall retire from office once every three years and for this purpose, one-third of the Board are to retire from office by rotation and be subject to re-election at the Company’s annual general meeting (“AGM”). In addition, Article 97 of the Company’s Articles of Association provides that a newly appointed director must retire and submit himself for re-election at the next AGM following his appointment. Thereafter, he is subject to re-election at least once in every three years.
At the forthcoming AGM, Mr Ang Kok Eng and Mr Andre Yeap Poh Leong will be retiring by rotation pursuant to Article 91 of the Company’s Articles of Association. Both of them, being eligible for re-election, has offered themselves for re-election.
Both Mr Chong and Mr Tan do not have any relationship including immediate family relationship with the Directors, the Company or its 10% shareholders while Mr Ang and the other Executive Directors are brothers and is deemed to have an interest in the shares held by the other.
CORPORATE GOVERNANCE REPORT
AS
L M
arin
e H
old
ing
s Lt
d.
/Ann
ual R
epor
t 20
15
31
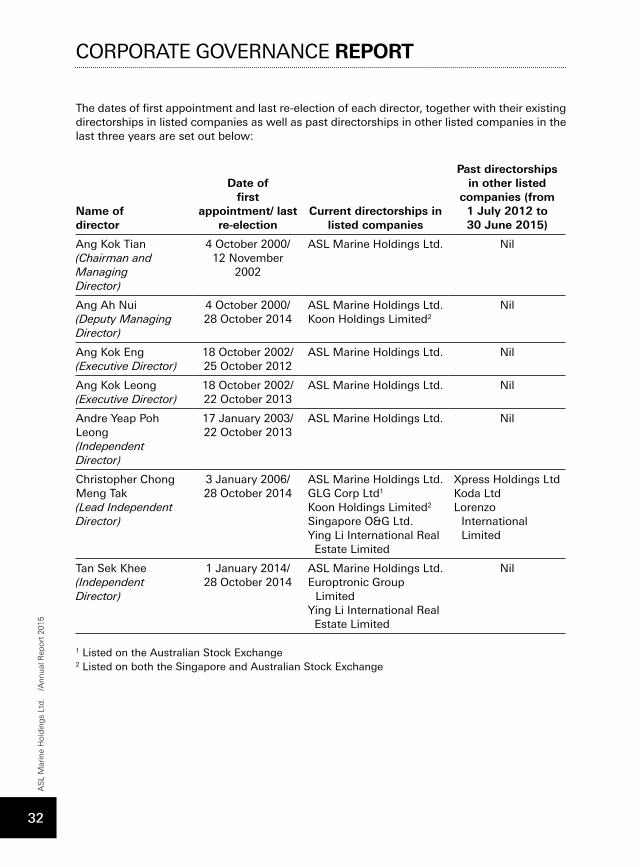
The dates of first appointment and last re-election of each director, together with their existing directorships in listed companies as well as past directorships in other listed companies in the last three years are set out below:
Name of director
Date of first
appointment/ last re-election
Current directorships in listed companies
Past directorships in other listed
companies (from 1 July 2012 to 30 June 2015)
Ang Kok Tian(Chairman and ManagingDirector)
4 October 2000/ 12 November
2002
ASL Marine Holdings Ltd. Nil
Ang Ah Nui(Deputy Managing Director)
4 October 2000/ 28 October 2014
ASL Marine Holdings Ltd. Koon Holdings Limited2
Nil
Ang Kok Eng(Executive Director)
18 October 2002/ 25 October 2012
ASL Marine Holdings Ltd. Nil
Ang Kok Leong(Executive Director)
18 October 2002/ 22 October 2013
ASL Marine Holdings Ltd. Nil
Andre Yeap Poh Leong(Independent Director)
17 January 2003/ 22 October 2013
ASL Marine Holdings Ltd. Nil
Christopher Chong Meng Tak(Lead Independent Director)
3 January 2006/ 28 October 2014
ASL Marine Holdings Ltd. GLG Corp Ltd1 Koon Holdings Limited2
Singapore O&G Ltd.Ying Li International Real Estate Limited
Xpress Holdings LtdKoda LtdLorenzo
International Limited
Tan Sek Khee(Independent Director)
1 January 2014/28 October 2014
ASL Marine Holdings Ltd.Europtronic Group
LimitedYing Li International Real Estate Limited
Nil
1 Listed on the Australian Stock Exchange2 Listed on both the Singapore and Australian Stock Exchange
CORPORATE GOVERNANCE REPORTA
SL
Mar
ine
Hol
din
gs
Ltd
. /A
nnua
l Rep
ort
2015
32
Board Performance
Principle 5: There should be a formal annual assessment of the effectiveness of the Board as a whole and its board committees and the contribution by each director to the effectiveness of the Board.
The NC assesses the performance and effectiveness of the Board as a whole as well as the contribution of individual directors to the effectiveness of the entire Board. The assessment process involves both a qualitative and quantitative assessment. The qualitative assessment is undertaken by the independent directors in the form of a discussion between themselves only. The quantitative assessment involves scoring a pre-agreed weighted score card against various criteria. This process ensures that the overall evaluation is undertaken against a set of objective, quantitative and qualitative performance criteria that had been proposed by the NC and approved by the Board.
During the financial year under review, a Board Evaluation Questionnaire is circulated and completed collectively by members of NC to assess the overall effectiveness of the Board. The performance criteria includes the evaluation of 1) the size and composition of the Board, 2) the Board’s access to information, 3) the Board process, 4) the Board’s accountability and performance in relation to discharging its principal functions and responsibilities and 5) the Board’s standards of conduct. The collective evaluation is then presented to the Board to highlight areas of strength and weakness and the Board acts on the evaluation to ensure continuous improvement of the Board. Based on the overall assessment for FY2015, the Board was effective as a whole.
Financial targets such as return on assets, return-on-equity and the Company’s share price performance vis-à-vis the Singapore Straits Times Index and a benchmark index of its industry peers are also considered. The Board, however, notes that the financial indicators set out in the Code provide only a snapshot of the Company’s performance, and do not fully reflect on-going risk or measure the sustainable long-term wealth and value creation of the Company.
Individual director’s performance is evaluated annually and informally by the NC and the Chairman. In assessing the individual director’s performance, the NC takes into consideration the individual director’s industry knowledge, functional expertise, contribution, attendance at meetings of the Board or Board Committees and workload requirements.
To focus directors and in particular the independent director’s mind on adding value to shareholders, the independent directors are encouraged to own shares in the Company. Currently, only one of the independent directors own shares in the Company.
CORPORATE GOVERNANCE REPORT
AS
L M
arin
e H
old
ing
s Lt
d.
/Ann
ual R
epor
t 20
15
33
Access to Information
Principle 6: In order to fulfill their responsibilities, directors should be provided with complete, adequate and timely information prior to Board meetings and on an on-going basis so as to enable them to make informed decisions to discharge their duties and responsibilities.
All directors have unrestricted access to the Company’s records and information. The Board members receive detailed quarterly management reports and budget variance reports of the Group and all major divisions of the Group to enable them to oversee the Group’s financial and operational performance as well as analysts’ reports to keep them apprised of analysts’ views on the Company, the Company’s performance and market expectations. The Board members also receive relevant information and comprehensive analysis furnished by management pertaining to matters to be brought before the Board for discussion and decision. The independent directors, on an ad hoc basis, speak directly and privately to the Chief Financial Officer of the Company concerning financial matters of the Group. The AC Chair and the Chief Financial Officer speak regularly and spoke at least 12 times last year. The independent directors also, on an ad hoc basis, speak directly and privately to other members of the Company concerning other matters of the Group. The independent directors have spoken many times to the officer in charge of Vosta in the past year.
The Board and the Board Committees are furnished with complete and adequate information in a timely manner to enable full deliberation on the issues to be considered at the respective meetings. Board papers with sufficient background and explanatory information are circulated at least three days before each meeting. From time to time, managerial staff, lawyers, the Company’s auditors or external consultants engaged on specific projects are invited to attend the Board and Board Committee’ meetings so as to provide additional insight into the matters for discussions.
The Board organises offsite meetings which are designed to focus on strategic issues, risk and medium and longer term direction of the Group. At these meetings, the independent directors are updated with industry trends and developments, government and international policies and opportunities and threats that the Group face. The Board then weights up options and sets or revises growth targets and risk levels.
The Board has separate and independent access to the management and Company Secretary at all times in carrying out their duties. The directors, in furtherance of their duties, are entitled to take independent professional advice at the expense of the Company when necessary. The Company Secretary assists the Chairman to ensure good information flows within the Board and Board Committees as well as between the management and the independent directors. The Company Secretary also assists the Board on compliance with regulatory requirements as well as professional development as required.
The Company Secretary attends all Board and Board Committee meetings of the Company and ensures that Board procedures are followed and that applicable statutory and regulatory rules and regulations are complied with. The appointment and removal of the Company Secretary are subject to the approval of the Board.
CORPORATE GOVERNANCE REPORTA
SL
Mar
ine
Hol
din
gs
Ltd
. /A
nnua
l Rep
ort
2015
34
REMUNERATION MATTERS
Procedures for Developing Remuneration Policies
Principle 7: There should be a formal and transparent procedure for developing policy on executive remuneration and for fixing the remuneration packages of individual directors. No director should be involved in deciding his own remuneration.
The Board established the RC in March 2003 which currently consists of three independent directors, namely, Mr Tan Sek Khee, Mr Andre Yeap Poh Leong and Mr Christopher Chong Meng Tak. Mr Tan Sek Khee is the Chairman of the RC. In discharging their duties, the members have access to advice from the internal human resources personnel, and if required, advice from external experts. The operations of the RC are regulated by its terms of reference, which were approved and are subject to periodic review by the Board.
The RC recommends, in consultation with the Chairman of the Board, a framework of remuneration policies for key management personnel and directors serving on the Board and Board Committees, and determines specifically the remuneration package for each executive director of the Company. The RC covers all aspects of remuneration including but not limited to directors’ fees, salaries, allowances, bonuses, grant of share options and performance shares as well as benefits in kind. In addition, the RC also reviews the remuneration of key management personnel. The RC’s recommendations are submitted for endorsement by the entire Board. No director is involved in deciding his own remuneration.
Other than the payment in lieu of notice in the event of termination, there were no termination, retirement and post-employment benefits granted under the executive directors’ and key management personnel’s contracts of service.
The RC administers both the ASL Employee Share Option Scheme (“ESOS”) approved on 23 January 2003 and the ASL Marine Performance Shares Scheme (“PSS”) adopted at the Extraordinary General Meeting (“EGM”) held on 20 July 2007, in accordance with the rules of the ESOS and PSS. Upon adoption of the ASL Employee Share Option Scheme 2012 (ASL ESOS 2012) at the EGM held on 25 October 2012, the existing ESOS was terminated.
The RC determines and approves the allocation of the share options, the date of grant and the price thereof under the ASL ESOS 2012. There were no share options granted during the financial year under the ASL ESOS 2012 and the executive directors are not eligible to participate in the ASL ESOS 2012. Details of the ASL ESOS 2012 are set out on pages 61 and 62 of this Annual Report.
As at the end of the financial year, there were no shares issued under the PSS. Details of the PSS are set out on page 62 of this Annual Report.
CORPORATE GOVERNANCE REPORT
AS
L M
arin
e H
old
ing
s Lt
d.
/Ann
ual R
epor
t 20
15
35
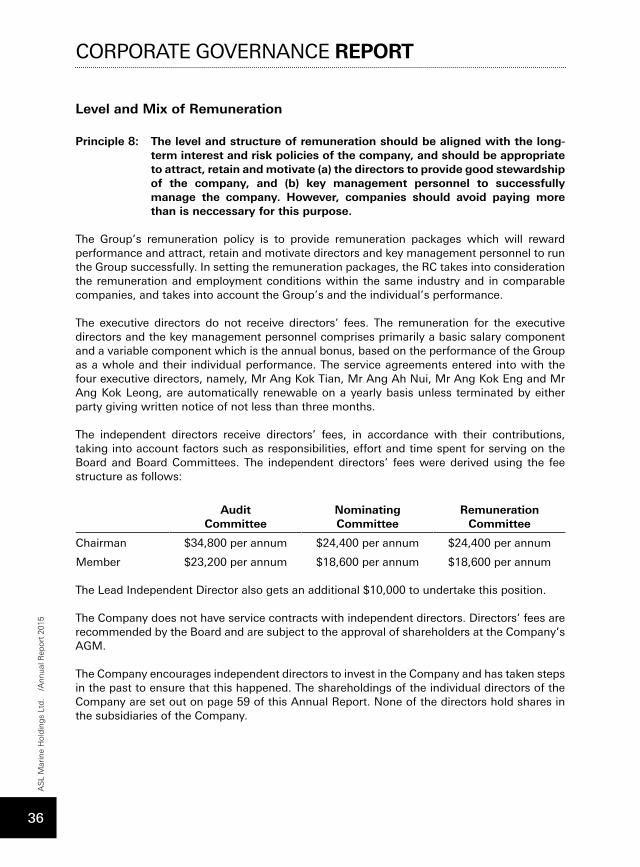
Level and Mix of Remuneration
Principle 8: The level and structure of remuneration should be aligned with the long-term interest and risk policies of the company, and should be appropriate to attract, retain and motivate (a) the directors to provide good stewardship of the company, and (b) key management personnel to successfully manage the company. However, companies should avoid paying more than is neccessary for this purpose.
The Group’s remuneration policy is to provide remuneration packages which will reward performance and attract, retain and motivate directors and key management personnel to run the Group successfully. In setting the remuneration packages, the RC takes into consideration the remuneration and employment conditions within the same industry and in comparable companies, and takes into account the Group’s and the individual’s performance.
The executive directors do not receive directors’ fees. The remuneration for the executive directors and the key management personnel comprises primarily a basic salary component and a variable component which is the annual bonus, based on the performance of the Group as a whole and their individual performance. The service agreements entered into with the four executive directors, namely, Mr Ang Kok Tian, Mr Ang Ah Nui, Mr Ang Kok Eng and Mr Ang Kok Leong, are automatically renewable on a yearly basis unless terminated by either party giving written notice of not less than three months.
The independent directors receive directors’ fees, in accordance with their contributions, taking into account factors such as responsibilities, effort and time spent for serving on the Board and Board Committees. The independent directors’ fees were derived using the fee structure as follows:
Audit Committee
Nominating Committee
Remuneration Committee
Chairman $34,800 per annum $24,400 per annum $24,400 per annum
Member $23,200 per annum $18,600 per annum $18,600 per annum
The Lead Independent Director also gets an additional $10,000 to undertake this position.
The Company does not have service contracts with independent directors. Directors’ fees are recommended by the Board and are subject to the approval of shareholders at the Company’s AGM.
The Company encourages independent directors to invest in the Company and has taken steps in the past to ensure that this happened. The shareholdings of the individual directors of the Company are set out on page 59 of this Annual Report. None of the directors hold shares in the subsidiaries of the Company.
CORPORATE GOVERNANCE REPORTA
SL
Mar
ine
Hol
din
gs
Ltd
. /A
nnua
l Rep
ort
2015
36
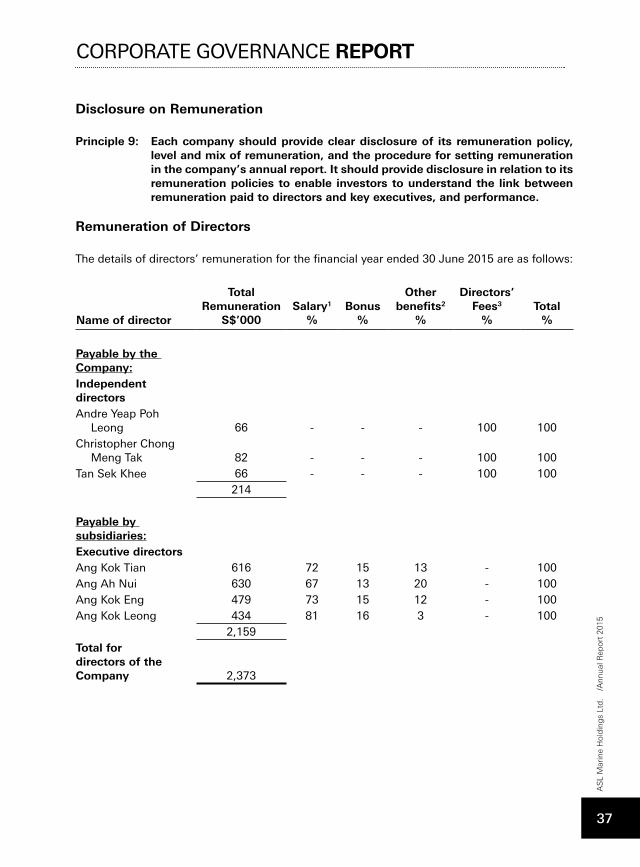
Disclosure on Remuneration
Principle 9: Each company should provide clear disclosure of its remuneration policy, level and mix of remuneration, and the procedure for setting remuneration in the company’s annual report. It should provide disclosure in relation to its remuneration policies to enable investors to understand the link between remuneration paid to directors and key executives, and performance.
Remuneration of Directors
The details of directors’ remuneration for the financial year ended 30 June 2015 are as follows:
Name of director
Total Remuneration
S$’000Salary1
%Bonus
%
Other benefits2
%
Directors’ Fees3
%Total
%
Payable by the Company:Independent directorsAndre Yeap Poh Leong 66 - - - 100 100Christopher Chong Meng Tak 82 - - - 100 100Tan Sek Khee 66 - - - 100 100
214
Payable by subsidiaries:Executive directorsAng Kok Tian 616 72 15 13 - 100Ang Ah Nui 630 67 13 20 - 100Ang Kok Eng 479 73 15 12 - 100Ang Kok Leong 434 81 16 3 - 100
2,159Total for directors of the Company 2,373
CORPORATE GOVERNANCE REPORT
AS
L M
arin
e H
old
ing
s Lt
d.
/Ann
ual R
epor
t 20
15
37
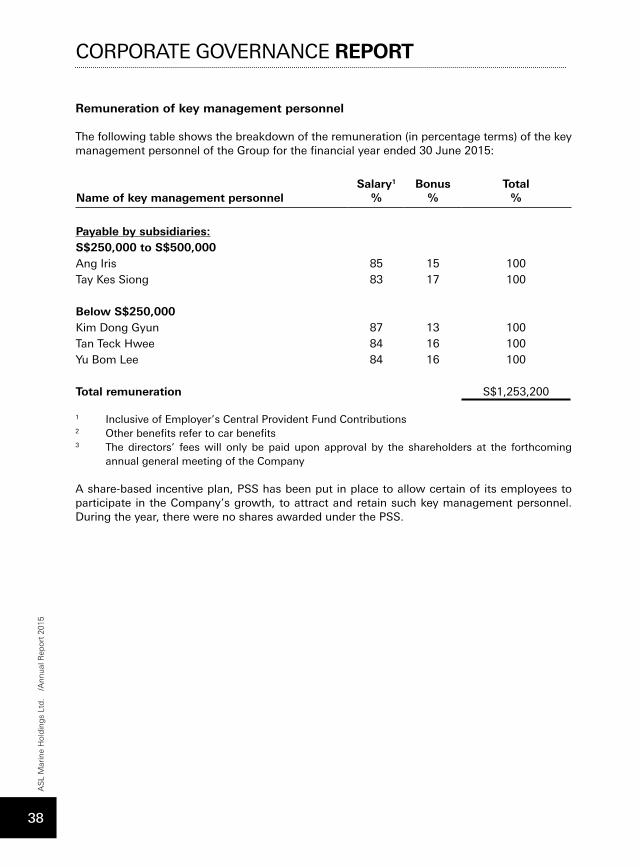
Remuneration of key management personnel
The following table shows the breakdown of the remuneration (in percentage terms) of the key management personnel of the Group for the financial year ended 30 June 2015:
Name of key management personnelSalary1
%Bonus
%Total
%
Payable by subsidiaries:S$250,000 to S$500,000Ang Iris 85 15 100Tay Kes Siong 83 17 100
Below S$250,000Kim Dong Gyun 87 13 100Tan Teck Hwee 84 16 100Yu Bom Lee 84 16 100
Total remuneration S$1,253,200
1 Inclusive of Employer’s Central Provident Fund Contributions2 Other benefits refer to car benefits 3 The directors’ fees will only be paid upon approval by the shareholders at the forthcoming
annual general meeting of the Company
A share-based incentive plan, PSS has been put in place to allow certain of its employees to participate in the Company’s growth, to attract and retain such key management personnel. During the year, there were no shares awarded under the PSS.
CORPORATE GOVERNANCE REPORTA
SL
Mar
ine
Hol
din
gs
Ltd
. /A
nnua
l Rep
ort
2015
38
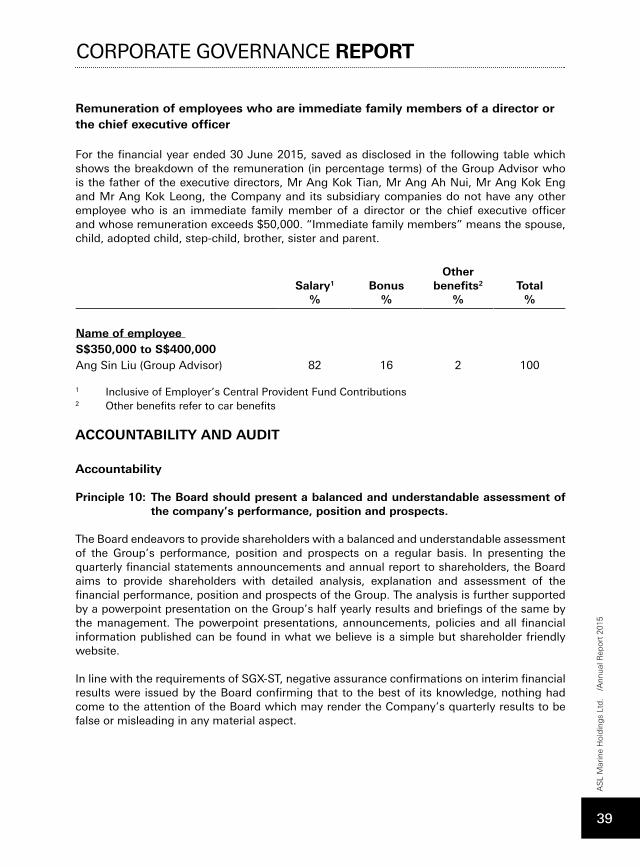
Remuneration of employees who are immediate family members of a director or the chief executive officer
For the financial year ended 30 June 2015, saved as disclosed in the following table which shows the breakdown of the remuneration (in percentage terms) of the Group Advisor who is the father of the executive directors, Mr Ang Kok Tian, Mr Ang Ah Nui, Mr Ang Kok Eng and Mr Ang Kok Leong, the Company and its subsidiary companies do not have any other employee who is an immediate family member of a director or the chief executive officer and whose remuneration exceeds $50,000. “Immediate family members” means the spouse, child, adopted child, step-child, brother, sister and parent.
Salary1
%Bonus
%
Other benefits2
%Total
%
Name of employee S$350,000 to S$400,000Ang Sin Liu (Group Advisor) 82 16 2 100
1 Inclusive of Employer’s Central Provident Fund Contributions2 Other benefits refer to car benefits
ACCOUNTABILITY AND AUDIT
Accountability
Principle 10: The Board should present a balanced and understandable assessment of the company’s performance, position and prospects.
The Board endeavors to provide shareholders with a balanced and understandable assessment of the Group’s performance, position and prospects on a regular basis. In presenting the quarterly financial statements announcements and annual report to shareholders, the Board aims to provide shareholders with detailed analysis, explanation and assessment of the financial performance, position and prospects of the Group. The analysis is further supported by a powerpoint presentation on the Group’s half yearly results and briefings of the same by the management. The powerpoint presentations, announcements, policies and all financial information published can be found in what we believe is a simple but shareholder friendly website.
In line with the requirements of SGX-ST, negative assurance confirmations on interim financial results were issued by the Board confirming that to the best of its knowledge, nothing had come to the attention of the Board which may render the Company’s quarterly results to be false or misleading in any material aspect.
CORPORATE GOVERNANCE REPORT
AS
L M
arin
e H
old
ing
s Lt
d.
/Ann
ual R
epor
t 20
15
39
RISK MANAGEMENT AND INTERNAL CONTROLS
Principle 11: The Board is responsible for the governance of risk. The Board should ensure that management maintains a sound system of risk management and internal controls to safeguard shareholders’ interests and the company’s assets, and should determine the nature and extent of the significant risks which the Board is willing to take in achieving its strategic objectives.
The Group has a system of internal control designed to provide reasonable assurance with respect to the safeguarding of assets and maintaining proper accounting records to ensure that financial information used for financial reporting are reliable. The system of internal control is based within a wider framework that attempts to optimise the balance between growth or return and related risks. More specifically, the Board attempts to:
(a) Align risk with its medium and longer term business strategy. The Board thus sets the overall risk appetite which the internal auditors and internal controls monitor;
(b) Preselect risk response. For each major risk or risk category, the Board decides whether to avoid, reduce, share or accept the risk. The internal auditors and internal controls are there to ensure that the system does not deliberately or inadvertently circumvent or override this decision;
(c) Reducing operational surprises and losses;
(d) Identifying cross border and cross business risk and such are risks which are not normally within the scope or control of day-to-day management; and
(e) Improving the use of capital and resources.
However, the Board recognises that no internal control system could provide absolute assurance against the occurrence of material errors, poor judgment in decision-making, human errors, losses, fraud or other irregularities. The internal control system is designed to manage rather than eliminate the risk of failure to achieve the business objectives.
The internal and external auditors conducted annual review of the effectiveness of the Group’s key internal controls, including financial, operational, policy, compliance and information technology controls and risk management. Any material non-compliance or internal control weaknesses and recommendations for improvements are reported to the AC. A copy of the internal audit report has been issued to the relevant departments for their follow-up actions and the improvement measures are closely monitored and reviewed by the AC.
For the purpose of the Board expressing its opinion and in line with the Committee of Sponsoring Organizations of the Treadway Commission (“COSO”) Internal Controls Integrated Framework, “internal controls” is broadly defined as “a process effected by an entity’s board of directors and other personnel, designed to provide reasonable assurance regarding the achievement of objectives in the following categories:
(a) effectiveness and efficiency of operations;(b) reliability of financial reporting; and(c) compliance with applicable laws and regulations.
CORPORATE GOVERNANCE REPORTA
SL
Mar
ine
Hol
din
gs
Ltd
. /A
nnua
l Rep
ort
2015
40
The first category addresses an entity’s basic business objectives, including performance and profitability goals and safeguarding of assets. The second category relates to the preparation of reliable published financial statements, including quarterly and full year financial reports and financial information derived from such statements, reported publicly. The third category deals with complying with those laws and regulations to which the entity is subjected to.
The Group’s approach to risk management with a brief description of the nature and extent of its risk exposures are set out on page 58 of this Annual Report.
Key Operational Risks
The Board is aware of the operational risks that may adversely affect the Group’s operating results if any of these risk factors and uncertainties develops into actual events. The Board believes that the Group’s key operational risks are as follows:
Macro Economic RiskThe Group’s business is sensitive to global economic conditions. The global economic slowdown has resulted in weak charter rates for certain categories of vessels. This in turn affects the demand for new ship building, conversions and to a lesser extent repairs.
Change in Customers’ Ordering Pattern As a result of recent market uncertainties, the Group’s clients may place fewer orders or may downsize the ships they wish to be built or converted or delay their order or act in some other manner which adversely affects our revenues or timing of the revenue recognition.
Cancellation RiskWhen market conditions are weak, there is possibility that clients may cancel signed orders. Any cancellation may affect our cash flow position, revenue or profit.
Increasing Credit RiskWhilst the Group’s current bad debts experience is minimal, the risk associated with credit is rising as a result of recent market uncertainties. The Group recorded a provision for doubtful debts of $0.6 million in FY2015.
Working Capital The Group enjoys good relations with its bankers. To date, the Group has not experienced any contraction in its banking facilities or lines. However, and in the event the Group does suffer a reduction in its banking lines and/or facilities, it may have to reduce the amount of business it undertakes as ship building, conversion and ship owning are capital and/or cash flow intensive activities.
Supply Disruption RiskThe Group is very reliant on its suppliers including specialist engineering suppliers, labor suppliers and other suppliers. If there is a disruption in supply, such as a delay in the arrival of design plans or specialist equipment or a labor strike, the Group’s business will be affected.
Operational Health & Safety Risk The Group has a good operational health and safety track record. But like all businesses, if there is a major accident, the Group’s business could be adversely affected.
CORPORATE GOVERNANCE REPORT
AS
L M
arin
e H
old
ing
s Lt
d.
/Ann
ual R
epor
t 20
15
41
Changes in Legislation (Indonesia)A significant part of the Group’s facilities are in Batam, Indonesia. The business environment in Indonesia is good and as has been the case for the last 8 years is getting even better. However, if there is a reversal in this trend for political or other reasons, the Group’s business may be adversely affected.
Currency RiskForeign currency exchange effects could be volatile. Examples include changes in the S$ against the US$, Euro and Indonesian Rupiah. Whilst the Group tries to bill in S$, the world quotes in US$ and many specialist equipments is priced in Euro.
CEO AND CFO CERTIFICATION OF FINANCIAL STATEMENTS
The Board has received assurance from the Managing Director and the Chief Financial Officer that:
(a) the financial records of the Group have been properly maintained and the financial statements for the year ended 30 June 2015 give a true and fair view, in all material respects, of the Group’s operations and finances; and
(b) the risk management and internal control systems (other than the subsidiary – VOSTA LMG acquired in FY2013) are operating effectively in all material respects given its current business environment. Certain internal control weakness that the external auditors become aware of during the course of their audit for the financial year ended 30 June 2015 have been communicated to the AC. Management will follow up on the external auditors’ recommendations in effort to strengthen the internal control system in VOSTA LMG.
Based on the 1) framework of management controls in place, 2) reviews conducted by the internal auditors and external auditors on the internal controls maintained by the Group and 3) assurance from the Managing Director and Chief Financial Officer at the direction of the Board, the Board, with the concurrence of the AC, after carrying out an independent review, is of the opinion that the Group’s system of internal controls that were in place as at 30 June 2015, addressing financial, operational, compliance, risk management systems and information technology risks, were adequate.
Audit Committee
Principle 12: The Board should establish an Audit Committee (“AC”) with written terms of reference which clearly set out its authority and duties.
The Board established the AC in March 2003 which currently consists of three independent directors, namely, Mr Christopher Chong Meng Tak, Mr Andre Yeap Poh Leong and Mr Tan Sek Khee. Mr Christopher Chong Meng Tak is the Chairman of the AC. The Board is of the opinion that the members of the AC have considerable legal, tax and financial management expertise and also business experience with which to discharge their duties. The operations of the AC are regulated by its terms of reference, which were approved and are subject to periodic review by the Board. The AC meets at least four times a year.
CORPORATE GOVERNANCE REPORTA
SL
Mar
ine
Hol
din
gs
Ltd
. /A
nnua
l Rep
ort
2015
42
The duties of the AC include reviewing with the internal auditors, external auditors and management, the Group’s policies and control procedures, interested person transactions, as well as any financial information presented to shareholders. Specifically, the AC:
- reviews the audit plan and results of external audit, the cost effectiveness of the audit, the independence and objectivity of the external auditors and the nature and extent of non-audit services provided by the external auditors;
- reviews the quarterly results announcements before submission to the Board for adoption;
- reviews the audited annual financial statements of the Group, accounting principles and policies thereto and management of financial matters before endorsement by the Board;
- reviews the internal audit plan, the adequacy of the internal control procedures and their evaluation of the effectiveness of the internal control systems, including financial, operational, compliance and information technology controls and risk management;
- reviews findings and recommendations of the internal and external auditors and evaluation of the internal control systems of the Group and related management responses and actions to correct any deficiencies;
- reviews the co-operation given by the Company’s officers to the internal and external auditors;
- recommends to the Board on the appointment, re-appointment and removal of external auditors and approves their fees for shareholders’ approval; and
- reviews interested person transactions in accordance with the requirements of the SGX-ST Listing Manual.
The AC has explicit authority to investigate any matter within the scope of its duties and is authorised to obtain independent professional advice. It has full access to and co-operation of the management and reasonable resources to enable it to discharge its duties properly. It also has full discretion to invite any executive director or any other person to attend its meetings. The AC meets with the internal and external auditors separately, at least once a year, without the presence of management to review any areas of audit concern. Individual members of the AC also engage the internal and external auditors separately in ad hoc meetings.
For the financial year under review, the AC has reviewed the non-audit services provided by the Company’s external auditors, which comprised attestation services required under the Approved International Shipping Enterprise Scheme. The AC is satisfied that their independence and objectivity have not been impaired by the provision of those services. The fees payable to the external auditors in respect of audit and non-audit services, are set out on page 140 of this Annual Report.
In the presentations of annual audit plan and full year results by the external auditors in AC meetings, an overview of changes in accounting standards, laws and regulations was covered. From time to time, the management will brief the directors at Board meetings when there are changes in regulations and/or accounting standards which may have an impact on the financial statements. The Company Secretary informs the directors of upcoming conferences and seminars relevant to their roles as directors and members of Board Committees.
The AC has recommended to the Board the re-appointment of Ernst & Young LLP as the Company’s external auditors at the forthcoming AGM. There is no member of the AC who was a former partner or director of the Company’s existing auditing firm.
The Group has complied with Rule 712 and Rule 715 read with Rule 716 of the SGX-ST Listing Manual in relation to its auditing firms.
CORPORATE GOVERNANCE REPORT
AS
L M
arin
e H
old
ing
s Lt
d.
/Ann
ual R
epor
t 20
15
43
WHISTLE-BLOWING POLICY
The Company has put in place a whistle-blowing policy and procedures duly endorsed by the AC, where employees of the Group may, anonymously and in confidence, raise concerns about possible corporate improprieties in financial reporting or other matters such as suspected fraud, corruption, dishonest practices etc. to the designated persons. All reports including unsigned reports, reports weak in details and verbal reports are considered. To ensure independent investigation into such matters and for appropriate follow up action, all whistle-blowing reports are reviewed by the Lead Independent Director, AC and the Board. In the event that the report is about a director, that director shall not be involved in the review and any decisions with respect to that report. The policy aims to encourage the reporting of such matters in good faith, with the confidence that any employees making such reports will be treated fairly and be protected from reprisal. Details of the whistle-blowing policy have been made available to all employees. There were no reports received through the Company’s whistle-blowing mechanism during the financial year under review.
Internal Audit
Principle 13: The company should establish an effective internal audit function that is adequately resourced and independent of the activities it audits.
The role of the internal auditors is to assist the AC to ensure that the Group maintains a sound system of internal controls by regular monitoring of key controls and procedures, ensuring their effectiveness and undertaking investigations as directed by the AC.
The Group outsources its internal audit function to a professional service firm, BDO LLP in January 2012, who is independent of the Company’s business activities. An audit plan over a 3 year audit cycle that is approved by the AC that covers the Group’s main business processes of its major subsidiaries has been approved and adopted. Summary of findings and recommendations are discussed at the AC meetings and the status of implementation of the actions agreed by management is tracked and reported to the AC. BDO LLP reports directly to the AC on audit matters and the Chief Financial Officer on administrative matters.
The Standards for the Professional Practice of Internal Auditing set by the Institute of Internal Auditors are used as a reference and guide by the Company’s internal auditors. The annual conduct of audit by the internal auditors assesses the effectiveness of the Group’s internal control procedures and provides reasonable assurance to the AC that the Group’s risk management, controls and governance processes are adequate and effective.
The AC will also assess the effectiveness of the internal audit, on an annual basis, by examining the scope of the internal audit work and its independence, the internal auditor’s report and its relationship with the external auditor.
COMMUNICATION WITH SHAREHOLDERS
Shareholder rights
Principle 14: Companies should treat all shareholders fairly and equitably, and should recognize, protect and facilitate the exercise of shareholders’ rights, and continually review and update such governance arrangements.
CORPORATE GOVERNANCE REPORTA
SL
Mar
ine
Hol
din
gs
Ltd
. /A
nnua
l Rep
ort
2015
44
Communication with Shareholders
Principle 15: Companies should actively engage their shareholders and put in place an investor relations policy to promote regular, effective and fair communication with shareholders.
The Board is mindful of its obligations to provide timely disclosure of material information presented in a fair and objective manner to shareholders and investors. The communications with shareholders and investors are carried out through various channels including the annual report, quarterly financial statements announcements including powerpoint presentations (for half yearly results only), press releases, announcements on important developments and material information on the performance of the Group through SGXNET and the Company’s website, www.aslmarine.com.
The Company announces the date of the release of its quarterly results at least two weeks prior to the date of announcement through SGXNET. On the day of results announcement, the accompanying press release and presentation slides (for half yearly results only) are released onto the SGXNET website. In addition, results briefings by management are also held for analysts in conjunction with the release of the Company’s half-year and full year results announcements. From time to time, the management participates in road shows and holds meetings with investors and analysts to explain the financial results and provide insight to the development and outlook of the industry. Where there is inadvertent disclosure made to a selected group, the Company will ensure the same disclosure is made publicly available to all others as promptly as possible.
The Company also engages an external investor relation consultancy firm to support the Group in promoting communication with shareholders and investment community.
All shareholders will receive the annual report of the Company with notice of AGM by post and publication in the newspapers within the mandatory period. The shareholders can also access information on the Group at the Company’s website which provides, inter alia, all publicly disclosed financial information, corporate announcements, press releases, annual reports and profile of the Group.
CORPORATE GOVERNANCE REPORT
AS
L M
arin
e H
old
ing
s Lt
d.
/Ann
ual R
epor
t 20
15
45
Conduct of shareholder meetings
Principle 16: Companies should encourage greater shareholder participation at general meetings of shareholders, and allow shareholders the opportunity to communicate their views on various matters affecting the company.
All registered shareholders are invited to participate and given the right to vote on resolutions at general meetings. Every matter requiring shareholders’ approval is proposed as a separate resolution. Each item of special business included in the notice of the meeting is accompanied, where appropriate, by an explanation for the proposed resolution. Proxy form is sent with notice of general meeting to all shareholders. If any shareholder is unable to attend the general meeting in person, he is allowed to appoint up to two proxies to attend and vote on his behalf at the meeting through proxy forms sent in advance. The Company also allows CPF investors to attend general meetings as observers. Voting in absentia by mail, facsimile or e-mail is currently not allowed as such voting methods would need to be cautiously evaluated for feasibility to ensure that there is no compromise to the integrity of the information and the authenticity of the shareholders’ identity. The results of all AGMs and EGMs are disclosed by way of an announcement through SGXNET.
In consideration of the dilution impact to shareholders, the Company has voluntarily reduced the limit for non-pro rata shares issue from 20% to 15% of the total number of issued shares in the capital of the Company with effect from 2010 AGM.
The Board, Chairman of the AC, NC, RC and management are present at the Company’s general meeting to address questions that shareholders may have concerning the Group. The Company’s external auditors are also present to address any relevant queries relating to the conduct of the audit and the preparation and content of the auditors’ report. The Company usually hosts a buffet and drinks for shareholders after the AGM so that they have a further opportunity to communicate their views and discuss on affairs of the Group with the Board and management after the meeting.
The Company acknowledges that voting by poll is integral in the enhancement of corporate governance and lead to greater transparency of the level of support for each resolution. The Board would adhere to the requirements of the Listing Manual where all resolutions are to be voted by poll at general meetings held on or after 1 August 2015.
VOLUNTARY LIMITS
The Company voluntarily limits the percentage of the enlarged share capital to be offered by way of a private placement or such other way except on a pro-rata basis to all shareholders to between 10-15%.
CORPORATE GOVERNANCE REPORTA
SL
Mar
ine
Hol
din
gs
Ltd
. /A
nnua
l Rep
ort
2015
46
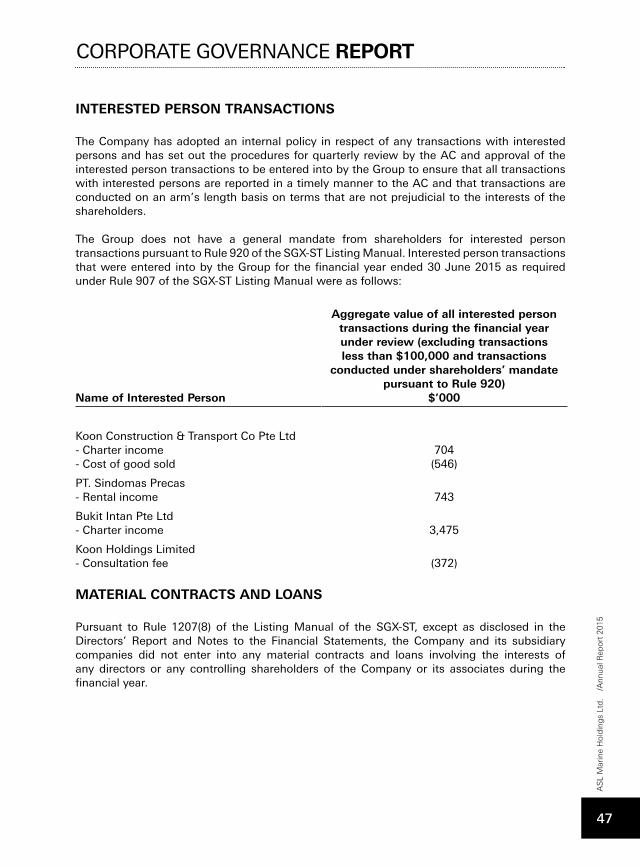
INTERESTED PERSON TRANSACTIONS
The Company has adopted an internal policy in respect of any transactions with interested persons and has set out the procedures for quarterly review by the AC and approval of the interested person transactions to be entered into by the Group to ensure that all transactions with interested persons are reported in a timely manner to the AC and that transactions are conducted on an arm’s length basis on terms that are not prejudicial to the interests of the shareholders.
The Group does not have a general mandate from shareholders for interested person transactions pursuant to Rule 920 of the SGX-ST Listing Manual. Interested person transactions that were entered into by the Group for the financial year ended 30 June 2015 as required under Rule 907 of the SGX-ST Listing Manual were as follows:
Name of Interested Person
Aggregate value of all interested person transactions during the financial year under review (excluding transactions less than $100,000 and transactions
conducted under shareholders’ mandate pursuant to Rule 920)
$’000
Koon Construction & Transport Co Pte Ltd - Charter income- Cost of good sold
704(546)
PT. Sindomas Precas - Rental income 743
Bukit Intan Pte Ltd - Charter income 3,475
Koon Holdings Limited - Consultation fee (372)
MATERIAL CONTRACTS AND LOANS
Pursuant to Rule 1207(8) of the Listing Manual of the SGX-ST, except as disclosed in the Directors’ Report and Notes to the Financial Statements, the Company and its subsidiary companies did not enter into any material contracts and loans involving the interests of any directors or any controlling shareholders of the Company or its associates during the financial year.
CORPORATE GOVERNANCE REPORT
AS
L M
arin
e H
old
ing
s Lt
d.
/Ann
ual R
epor
t 20
15
47
DIVIDEND POLICY
While the Company has not formally instituted a dividend policy, it has a good track record of paying annual dividends to shareholders. In proposing any dividend payout and/or determining the form, frequency and/or the amount of such dividend payout, the Board will take into account, inter alia, the Group’s financial position, retained earnings, results of operation and cash flow, the Group’s expected working capital requirements, the Group’s expected capital expenditure and future expansion and investment plans and other funding requirements, general economic conditions and other internal or external factors that may have an impact on the business or financial performance and position of the Group.
DEALINGS IN SECURITIES
The Company has complied with and adopted policies in line with Rule 1207(19) of the SGX-ST Listing Manual on dealings in the Company’s securities. The Company’s internal compliance code provides guidance to its officers and employees with regard to dealings in the Company’s securities. The Group’s officers and employees are prohibited from dealing in the Company’s securities while in possession of unpublished price-sensitive information of the Group, as well as during the periods commencing two weeks before the announcement of the Company’s quarterly results and one month before the announcement of the Company’s full year results and ending on the date of the announcement of the relevant results. The Group’s officers and employees are also discouraged from dealing in the Company’s securities on short-term considerations.
All directors are required to seek Board’s approval before trading in the Company’s shares.
CORPORATE GOVERNANCE REPORTA
SL
Mar
ine
Hol
din
gs
Ltd
. /A
nnua
l Rep
ort
2015
48
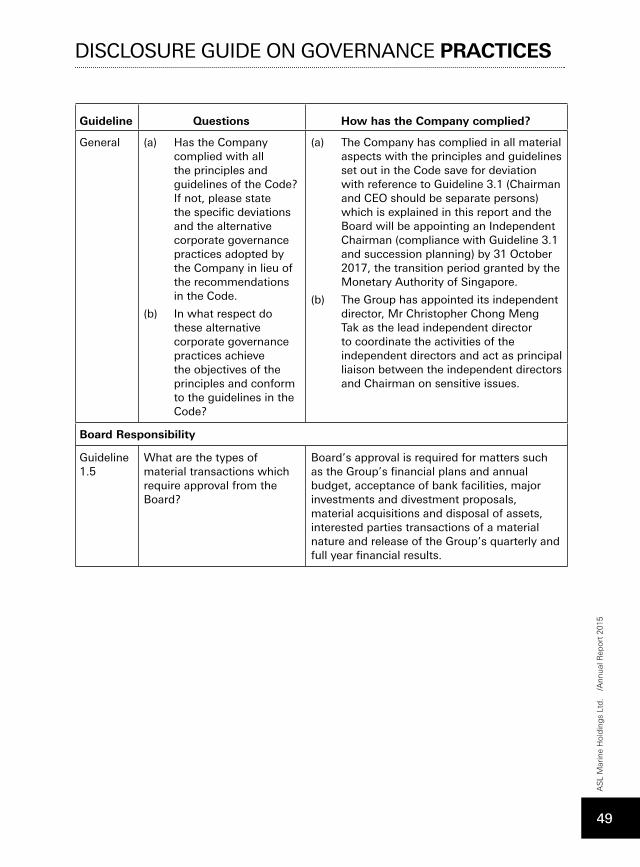
Guideline Questions How has the Company complied?
General (a) Has the Company complied with all the principles and guidelines of the Code? If not, please state the specific deviations and the alternative corporate governance practices adopted by the Company in lieu of the recommendations in the Code.
(b) In what respect do these alternative corporate governance practices achieve the objectives of the principles and conform to the guidelines in the Code?
(a) The Company has complied in all material aspects with the principles and guidelines set out in the Code save for deviation with reference to Guideline 3.1 (Chairman and CEO should be separate persons) which is explained in this report and the Board will be appointing an Independent Chairman (compliance with Guideline 3.1 and succession planning) by 31 October 2017, the transition period granted by the Monetary Authority of Singapore.
(b) The Group has appointed its independent director, Mr Christopher Chong Meng Tak as the lead independent director to coordinate the activities of the independent directors and act as principal liaison between the independent directors and Chairman on sensitive issues.
Board Responsibility
Guideline 1.5
What are the types of material transactions which require approval from the Board?
Board’s approval is required for matters such as the Group’s financial plans and annual budget, acceptance of bank facilities, major investments and divestment proposals, material acquisitions and disposal of assets, interested parties transactions of a material nature and release of the Group’s quarterly and full year financial results.
DISCLOSURE GUIDE ON GOVERNANCE PRACTICES
AS
L M
arin
e H
old
ing
s Lt
d.
/Ann
ual R
epor
t 20
15
49
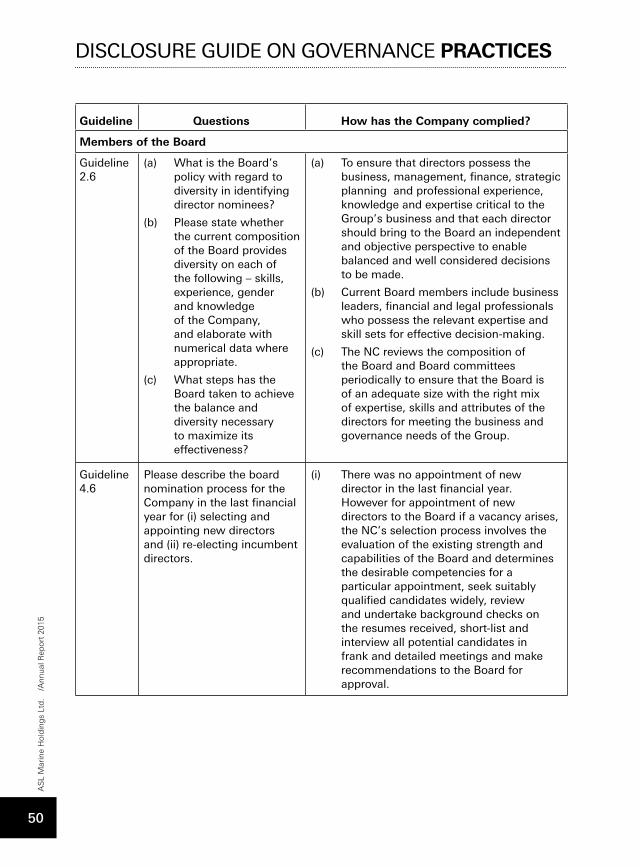
Guideline Questions How has the Company complied?
Members of the Board
Guideline 2.6
(a) What is the Board’s policy with regard to diversity in identifying director nominees?
(b) Please state whether the current composition of the Board provides diversity on each of the following – skills, experience, gender and knowledge of the Company, and elaborate with numerical data where appropriate.
(c) What steps has the Board taken to achieve the balance and diversity necessary to maximize its effectiveness?
(a) To ensure that directors possess the business, management, finance, strategic planning and professional experience, knowledge and expertise critical to the Group’s business and that each director should bring to the Board an independent and objective perspective to enable balanced and well considered decisions to be made.
(b) Current Board members include business leaders, financial and legal professionals who possess the relevant expertise and skill sets for effective decision-making.
(c) The NC reviews the composition of the Board and Board committees periodically to ensure that the Board is of an adequate size with the right mix of expertise, skills and attributes of the directors for meeting the business and governance needs of the Group.
Guideline 4.6
Please describe the board nomination process for the Company in the last financial year for (i) selecting and appointing new directors and (ii) re-electing incumbent directors.
(i) There was no appointment of new director in the last financial year. However for appointment of new directors to the Board if a vacancy arises, the NC’s selection process involves the evaluation of the existing strength and capabilities of the Board and determines the desirable competencies for a particular appointment, seek suitably qualified candidates widely, review and undertake background checks on the resumes received, short-list and interview all potential candidates in frank and detailed meetings and make recommendations to the Board for approval.
DISCLOSURE GUIDE ON GOVERNANCE PRACTICESA
SL
Mar
ine
Hol
din
gs
Ltd
. /A
nnua
l Rep
ort
2015
50
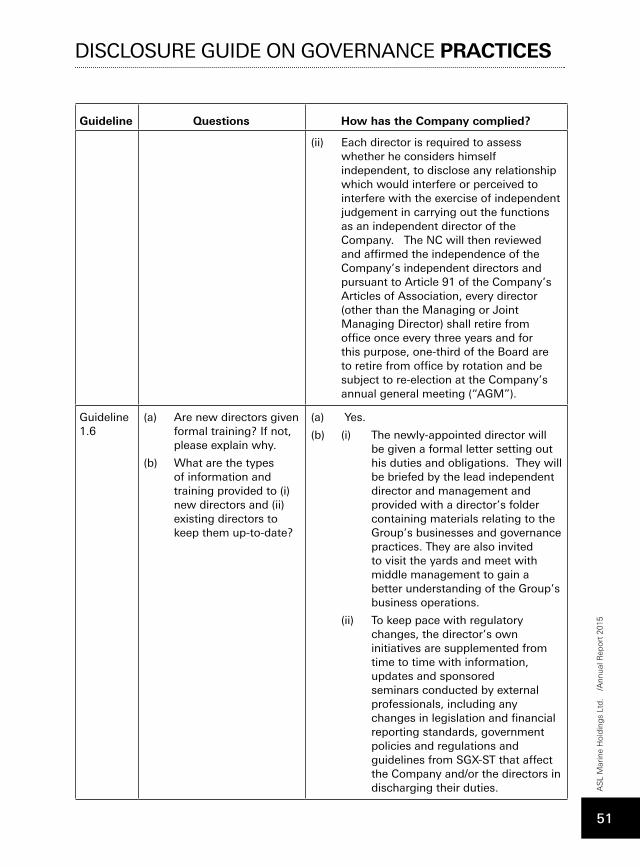
Guideline Questions How has the Company complied?
(ii) Each director is required to assess whether he considers himself independent, to disclose any relationship which would interfere or perceived to interfere with the exercise of independent judgement in carrying out the functions as an independent director of the Company. The NC will then reviewed and affirmed the independence of the Company’s independent directors and pursuant to Article 91 of the Company’s Articles of Association, every director (other than the Managing or Joint Managing Director) shall retire from office once every three years and for this purpose, one-third of the Board are to retire from office by rotation and be subject to re-election at the Company’s annual general meeting (“AGM”).
Guideline 1.6
(a) Are new directors given formal training? If not, please explain why.
(b) What are the types of information and training provided to (i) new directors and (ii) existing directors to keep them up-to-date?
(a) Yes.
(b) (i) The newly-appointed director will be given a formal letter setting out his duties and obligations. They will be briefed by the lead independent director and management and provided with a director’s folder containing materials relating to the Group’s businesses and governance practices. They are also invited to visit the yards and meet with middle management to gain a better understanding of the Group’s business operations.
(ii) To keep pace with regulatory changes, the director’s own initiatives are supplemented from time to time with information, updates and sponsored seminars conducted by external professionals, including any changes in legislation and financial reporting standards, government policies and regulations and guidelines from SGX-ST that affect the Company and/or the directors in discharging their duties.
DISCLOSURE GUIDE ON GOVERNANCE PRACTICES
AS
L M
arin
e H
old
ing
s Lt
d.
/Ann
ual R
epor
t 20
15
51
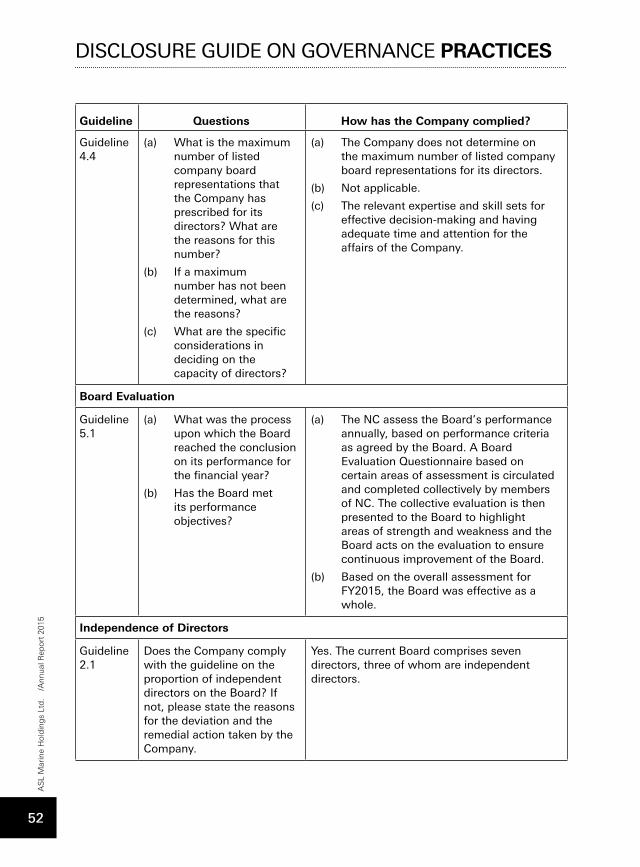
Guideline Questions How has the Company complied?
Guideline 4.4
(a) What is the maximum number of listed company board representations that the Company has prescribed for its directors? What are the reasons for this number?
(b) If a maximum number has not been determined, what are the reasons?
(c) What are the specific considerations in deciding on the capacity of directors?
(a) The Company does not determine on the maximum number of listed company board representations for its directors.
(b) Not applicable.
(c) The relevant expertise and skill sets for effective decision-making and having adequate time and attention for the affairs of the Company.
Board Evaluation
Guideline 5.1
(a) What was the process upon which the Board reached the conclusion on its performance for the financial year?
(b) Has the Board met its performance objectives?
(a) The NC assess the Board’s performance annually, based on performance criteria as agreed by the Board. A Board Evaluation Questionnaire based on certain areas of assessment is circulated and completed collectively by members of NC. The collective evaluation is then presented to the Board to highlight areas of strength and weakness and the Board acts on the evaluation to ensure continuous improvement of the Board.
(b) Based on the overall assessment for FY2015, the Board was effective as a whole.
Independence of Directors
Guideline 2.1
Does the Company comply with the guideline on the proportion of independent directors on the Board? If not, please state the reasons for the deviation and the remedial action taken by the Company.
Yes. The current Board comprises seven directors, three of whom are independent directors.
DISCLOSURE GUIDE ON GOVERNANCE PRACTICESA
SL
Mar
ine
Hol
din
gs
Ltd
. /A
nnua
l Rep
ort
2015
52
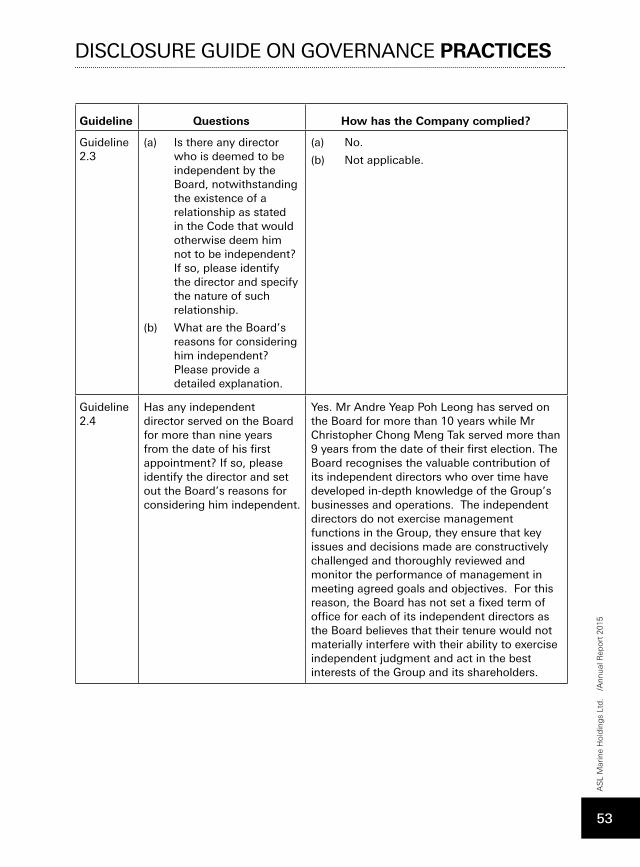
Guideline Questions How has the Company complied?
Guideline 2.3
(a) Is there any director who is deemed to be independent by the Board, notwithstanding the existence of a relationship as stated in the Code that would otherwise deem him not to be independent? If so, please identify the director and specify the nature of such relationship.
(b) What are the Board’s reasons for considering him independent? Please provide a detailed explanation.
(a) No.
(b) Not applicable.
Guideline 2.4
Has any independent director served on the Board for more than nine years from the date of his first appointment? If so, please identify the director and set out the Board’s reasons for considering him independent.
Yes. Mr Andre Yeap Poh Leong has served on the Board for more than 10 years while Mr Christopher Chong Meng Tak served more than 9 years from the date of their first election. The Board recognises the valuable contribution of its independent directors who over time have developed in-depth knowledge of the Group’s businesses and operations. The independent directors do not exercise management functions in the Group, they ensure that key issues and decisions made are constructively challenged and thoroughly reviewed and monitor the performance of management in meeting agreed goals and objectives. For this reason, the Board has not set a fixed term of office for each of its independent directors as the Board believes that their tenure would not materially interfere with their ability to exercise independent judgment and act in the best interests of the Group and its shareholders.
DISCLOSURE GUIDE ON GOVERNANCE PRACTICES
AS
L M
arin
e H
old
ing
s Lt
d.
/Ann
ual R
epor
t 20
15
53
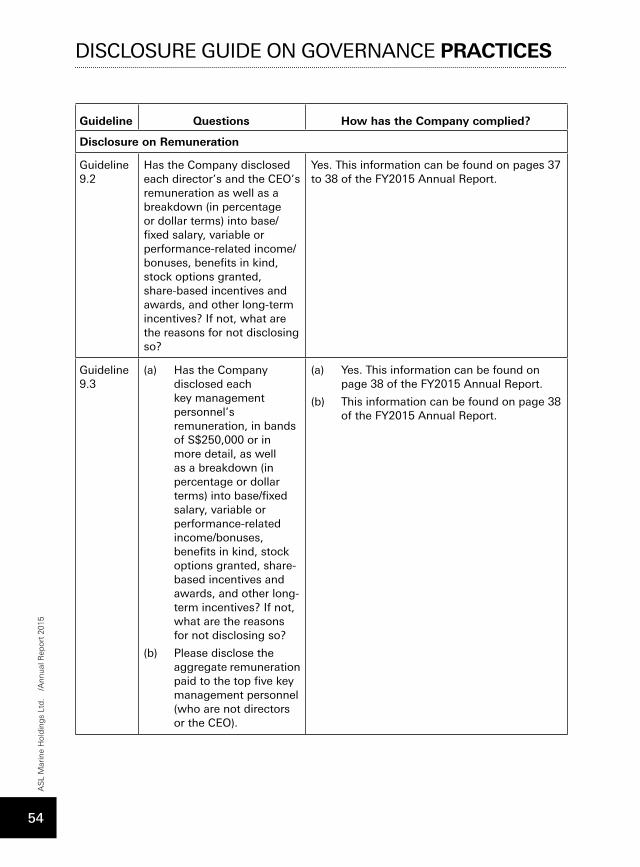
Guideline Questions How has the Company complied?
Disclosure on Remuneration
Guideline 9.2
Has the Company disclosed each director’s and the CEO’s remuneration as well as a breakdown (in percentage or dollar terms) into base/fixed salary, variable or performance-related income/bonuses, benefits in kind, stock options granted, share-based incentives and awards, and other long-term incentives? If not, what are the reasons for not disclosing so?
Yes. This information can be found on pages 37 to 38 of the FY2015 Annual Report.
Guideline 9.3
(a) Has the Company disclosed each key management personnel’s remuneration, in bands of S$250,000 or in more detail, as well as a breakdown (in percentage or dollar terms) into base/fixed salary, variable or performance-related income/bonuses, benefits in kind, stock options granted, share-based incentives and awards, and other long-term incentives? If not, what are the reasons for not disclosing so?
(b) Please disclose the aggregate remuneration paid to the top five key management personnel (who are not directors or the CEO).
(a) Yes. This information can be found on page 38 of the FY2015 Annual Report.
(b) This information can be found on page 38 of the FY2015 Annual Report.
DISCLOSURE GUIDE ON GOVERNANCE PRACTICESA
SL
Mar
ine
Hol
din
gs
Ltd
. /A
nnua
l Rep
ort
2015
54
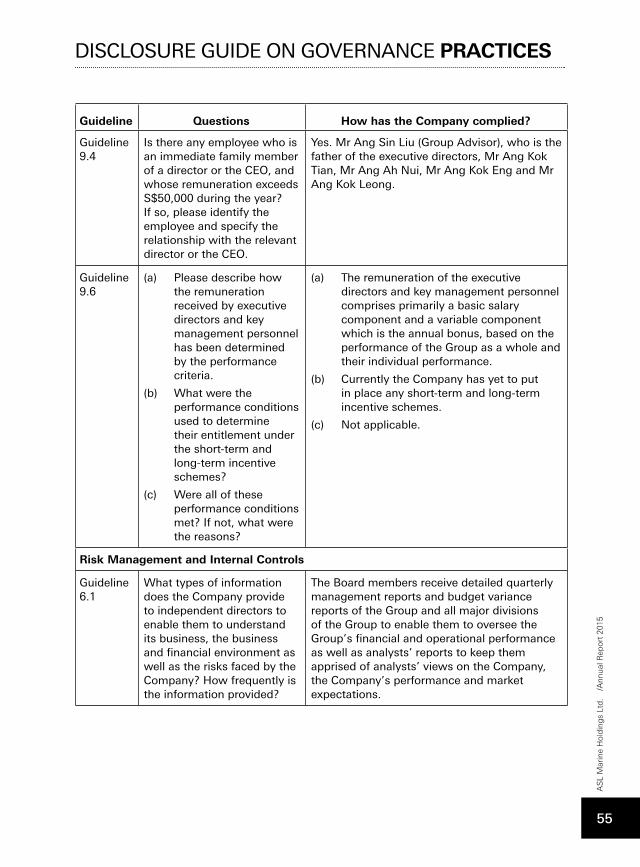
Guideline Questions How has the Company complied?
Guideline 9.4
Is there any employee who is an immediate family member of a director or the CEO, and whose remuneration exceeds S$50,000 during the year? If so, please identify the employee and specify the relationship with the relevant director or the CEO.
Yes. Mr Ang Sin Liu (Group Advisor), who is the father of the executive directors, Mr Ang Kok Tian, Mr Ang Ah Nui, Mr Ang Kok Eng and Mr Ang Kok Leong.
Guideline 9.6
(a) Please describe how the remuneration received by executive directors and key management personnel has been determined by the performance criteria.
(b) What were the performance conditions used to determine their entitlement under the short-term and long-term incentive schemes?
(c) Were all of these performance conditions met? If not, what were the reasons?
(a) The remuneration of the executive directors and key management personnel comprises primarily a basic salary component and a variable component which is the annual bonus, based on the performance of the Group as a whole and their individual performance.
(b) Currently the Company has yet to put in place any short-term and long-term incentive schemes.
(c) Not applicable.
Risk Management and Internal Controls
Guideline 6.1
What types of information does the Company provide to independent directors to enable them to understand its business, the business and financial environment as well as the risks faced by the Company? How frequently is the information provided?
The Board members receive detailed quarterly management reports and budget variance reports of the Group and all major divisions of the Group to enable them to oversee the Group’s financial and operational performance as well as analysts’ reports to keep them apprised of analysts’ views on the Company, the Company’s performance and market expectations.
DISCLOSURE GUIDE ON GOVERNANCE PRACTICES
AS
L M
arin
e H
old
ing
s Lt
d.
/Ann
ual R
epor
t 20
15
55
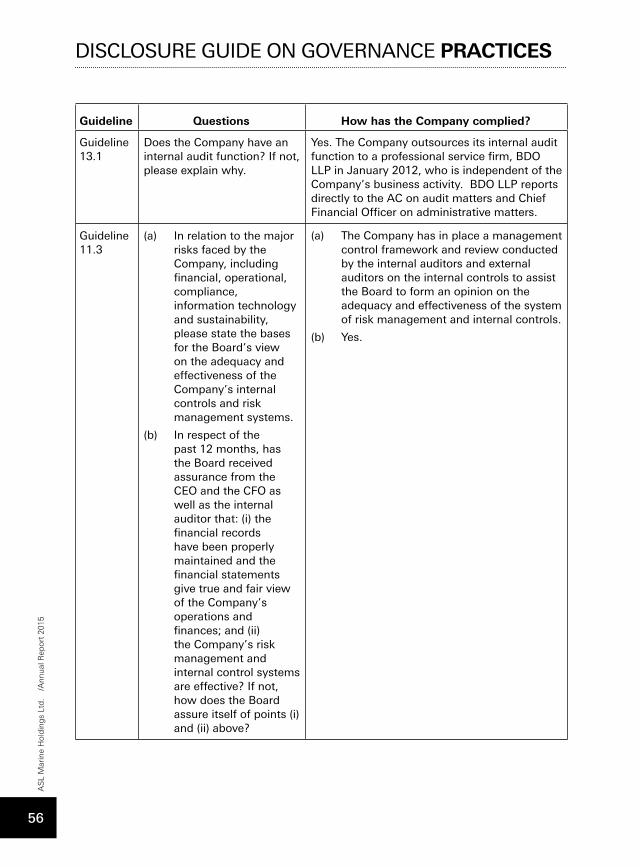
Guideline Questions How has the Company complied?
Guideline 13.1
Does the Company have an internal audit function? If not, please explain why.
Yes. The Company outsources its internal audit function to a professional service firm, BDO LLP in January 2012, who is independent of the Company’s business activity. BDO LLP reports directly to the AC on audit matters and Chief Financial Officer on administrative matters.
Guideline 11.3
(a) In relation to the major risks faced by the Company, including financial, operational, compliance, information technology and sustainability, please state the bases for the Board’s view on the adequacy and effectiveness of the Company’s internal controls and risk management systems.
(b) In respect of the past 12 months, has the Board received assurance from the CEO and the CFO as well as the internal auditor that: (i) the financial records have been properly maintained and the financial statements give true and fair view of the Company’s operations and finances; and (ii) the Company’s risk management and internal control systems are effective? If not, how does the Board assure itself of points (i) and (ii) above?
(a) The Company has in place a management control framework and review conducted by the internal auditors and external auditors on the internal controls to assist the Board to form an opinion on the adequacy and effectiveness of the system of risk management and internal controls.
(b) Yes.
DISCLOSURE GUIDE ON GOVERNANCE PRACTICESA
SL
Mar
ine
Hol
din
gs
Ltd
. /A
nnua
l Rep
ort
2015
56
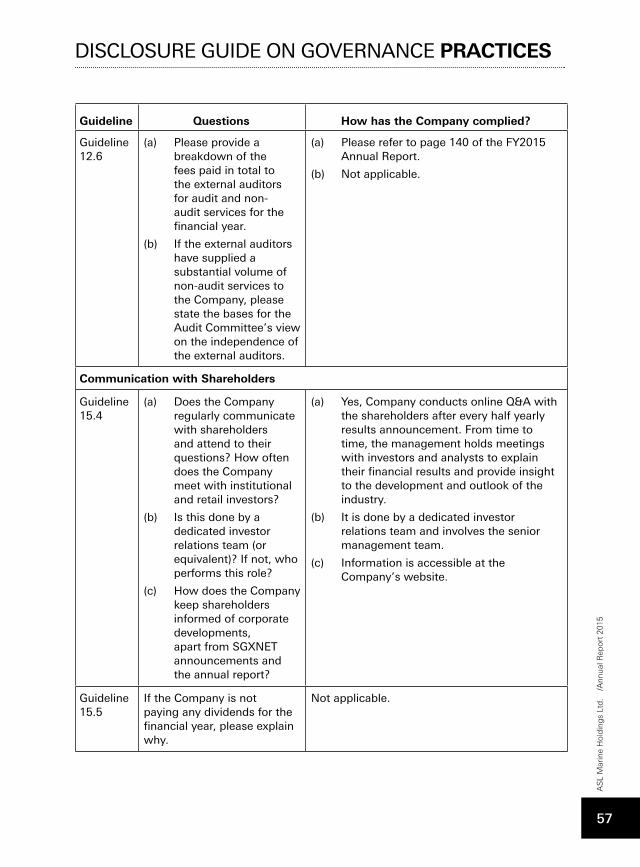
Guideline Questions How has the Company complied?
Guideline 12.6
(a) Please provide a breakdown of the fees paid in total to the external auditors for audit and non-audit services for the financial year.
(b) If the external auditors have supplied a substantial volume of non-audit services to the Company, please state the bases for the Audit Committee’s view on the independence of the external auditors.
(a) Please refer to page 140 of the FY2015 Annual Report.
(b) Not applicable.
Communication with Shareholders
Guideline 15.4
(a) Does the Company regularly communicate with shareholders and attend to their questions? How often does the Company meet with institutional and retail investors?
(b) Is this done by a dedicated investor relations team (or equivalent)? If not, who performs this role?
(c) How does the Company keep shareholders informed of corporate developments, apart from SGXNET announcements and the annual report?
(a) Yes, Company conducts online Q&A with the shareholders after every half yearly results announcement. From time to time, the management holds meetings with investors and analysts to explain their financial results and provide insight to the development and outlook of the industry.
(b) It is done by a dedicated investor relations team and involves the senior management team.
(c) Information is accessible at the Company’s website.
Guideline 15.5
If the Company is not paying any dividends for the financial year, please explain why.
Not applicable.
DISCLOSURE GUIDE ON GOVERNANCE PRACTICES
AS
L M
arin
e H
old
ing
s Lt
d.
/Ann
ual R
epor
t 20
15
57
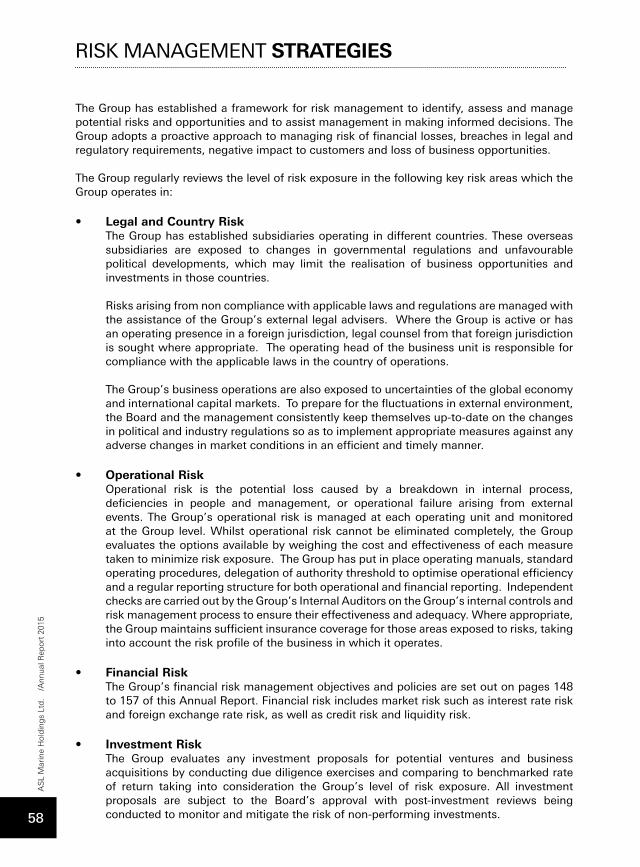
RISK MANAGEMENT STRATEGIES
The Group has established a framework for risk management to identify, assess and manage potential risks and opportunities and to assist management in making informed decisions. The Group adopts a proactive approach to managing risk of financial losses, breaches in legal and regulatory requirements, negative impact to customers and loss of business opportunities.
The Group regularly reviews the level of risk exposure in the following key risk areas which the Group operates in:
• Legal and Country RiskThe Group has established subsidiaries operating in different countries. These overseas subsidiaries are exposed to changes in governmental regulations and unfavourable political developments, which may limit the realisation of business opportunities and investments in those countries.
Risks arising from non compliance with applicable laws and regulations are managed with the assistance of the Group’s external legal advisers. Where the Group is active or has an operating presence in a foreign jurisdiction, legal counsel from that foreign jurisdiction is sought where appropriate. The operating head of the business unit is responsible for compliance with the applicable laws in the country of operations.
The Group’s business operations are also exposed to uncertainties of the global economy and international capital markets. To prepare for the fluctuations in external environment, the Board and the management consistently keep themselves up-to-date on the changes in political and industry regulations so as to implement appropriate measures against any adverse changes in market conditions in an efficient and timely manner.
• Operational RiskOperational risk is the potential loss caused by a breakdown in internal process, deficiencies in people and management, or operational failure arising from external events. The Group’s operational risk is managed at each operating unit and monitored at the Group level. Whilst operational risk cannot be eliminated completely, the Group evaluates the options available by weighing the cost and effectiveness of each measure taken to minimize risk exposure. The Group has put in place operating manuals, standard operating procedures, delegation of authority threshold to optimise operational efficiency and a regular reporting structure for both operational and financial reporting. Independent checks are carried out by the Group’s Internal Auditors on the Group’s internal controls and risk management process to ensure their effectiveness and adequacy. Where appropriate, the Group maintains sufficient insurance coverage for those areas exposed to risks, taking into account the risk profile of the business in which it operates.
• Financial RiskThe Group’s financial risk management objectives and policies are set out on pages 148 to 157 of this Annual Report. Financial risk includes market risk such as interest rate risk and foreign exchange rate risk, as well as credit risk and liquidity risk.
• Investment RiskThe Group evaluates any investment proposals for potential ventures and business acquisitions by conducting due diligence exercises and comparing to benchmarked rate of return taking into consideration the Group’s level of risk exposure. All investment proposals are subject to the Board’s approval with post-investment reviews being conducted to monitor and mitigate the risk of non-performing investments.
AS
L M
arin
e H
old
ing
s Lt
d.
/Ann
ual R
epor
t 20
15
58
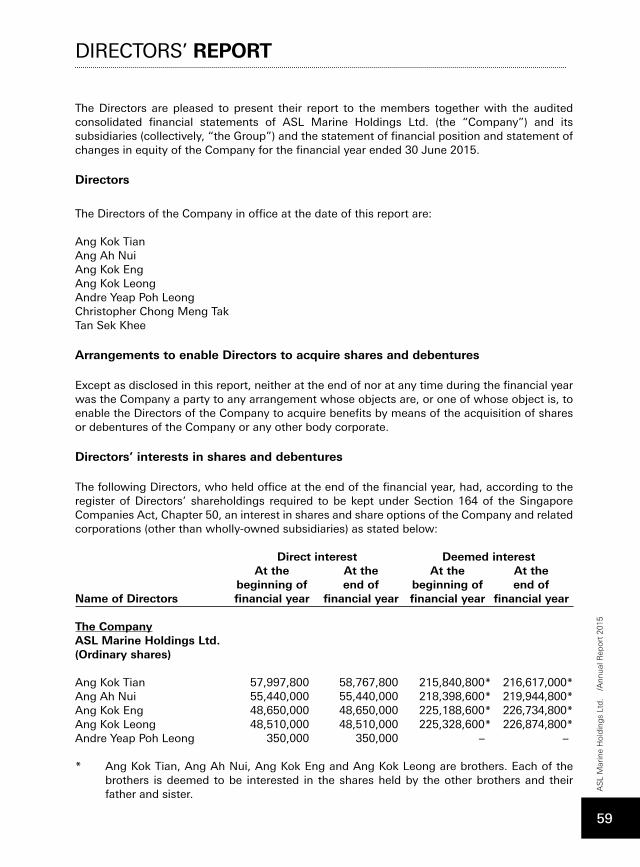
DIRECTORS’ REPORT
The Directors are pleased to present their report to the members together with the audited consolidated financial statements of ASL Marine Holdings Ltd. (the “Company”) and its subsidiaries (collectively, “the Group”) and the statement of financial position and statement of changes in equity of the Company for the financial year ended 30 June 2015.
Directors
The Directors of the Company in office at the date of this report are:
Ang Kok TianAng Ah NuiAng Kok EngAng Kok LeongAndre Yeap Poh LeongChristopher Chong Meng TakTan Sek Khee
Arrangements to enable Directors to acquire shares and debentures
Except as disclosed in this report, neither at the end of nor at any time during the financial year was the Company a party to any arrangement whose objects are, or one of whose object is, to enable the Directors of the Company to acquire benefits by means of the acquisition of shares or debentures of the Company or any other body corporate.
Directors’ interests in shares and debentures
The following Directors, who held office at the end of the financial year, had, according to the register of Directors’ shareholdings required to be kept under Section 164 of the Singapore Companies Act, Chapter 50, an interest in shares and share options of the Company and related corporations (other than wholly-owned subsidiaries) as stated below:
Direct interest Deemed interest At the At the At the At the beginning of end of beginning of end of Name of Directors financial year financial year financial year financial year
The Company ASL Marine Holdings Ltd.(Ordinary shares) Ang Kok Tian 57,997,800 58,767,800 215,840,800* 216,617,000*Ang Ah Nui 55,440,000 55,440,000 218,398,600* 219,944,800*Ang Kok Eng 48,650,000 48,650,000 225,188,600* 226,734,800*Ang Kok Leong 48,510,000 48,510,000 225,328,600* 226,874,800*Andre Yeap Poh Leong 350,000 350,000 – –
* Ang Kok Tian, Ang Ah Nui, Ang Kok Eng and Ang Kok Leong are brothers. Each of the brothers is deemed to be interested in the shares held by the other brothers and their father and sister. A
SL
Mar
ine
Hol
din
gs
Ltd
. /A
nnua
l Rep
ort
2015
59
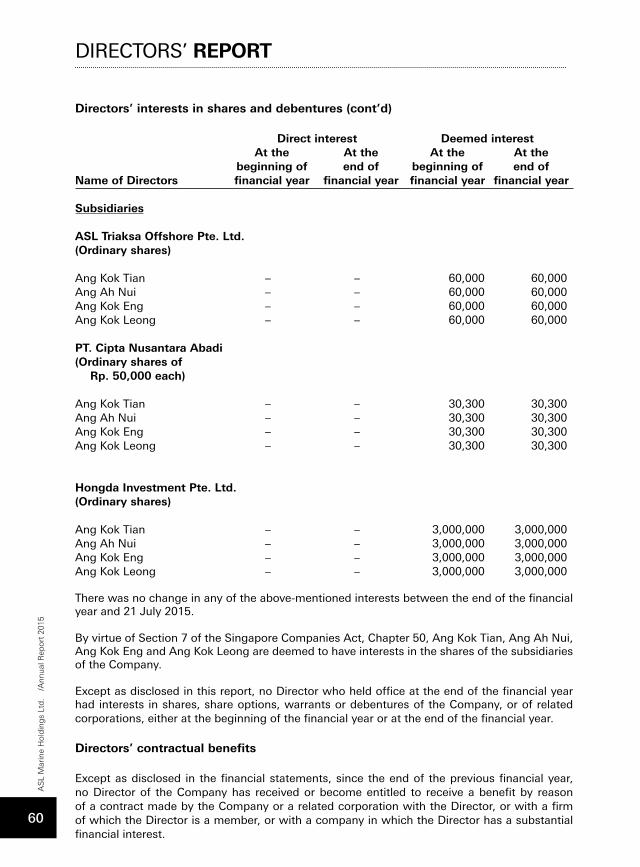
DIRECTORS’ REPORT
Directors’ interests in shares and debentures (cont’d)
Direct interest Deemed interest At the At the At the At the beginning of end of beginning of end of Name of Directors financial year financial year financial year financial year Subsidiaries ASL Triaksa Offshore Pte. Ltd.(Ordinary shares) Ang Kok Tian – – 60,000 60,000Ang Ah Nui – – 60,000 60,000Ang Kok Eng – – 60,000 60,000Ang Kok Leong – – 60,000 60,000 PT. Cipta Nusantara Abadi(Ordinary shares of
Rp. 50,000 each)
Ang Kok Tian – – 30,300 30,300Ang Ah Nui – – 30,300 30,300Ang Kok Eng – – 30,300 30,300Ang Kok Leong – – 30,300 30,300 Hongda Investment Pte. Ltd.(Ordinary shares) Ang Kok Tian – – 3,000,000 3,000,000Ang Ah Nui – – 3,000,000 3,000,000Ang Kok Eng – – 3,000,000 3,000,000Ang Kok Leong – – 3,000,000 3,000,000
There was no change in any of the above-mentioned interests between the end of the financial year and 21 July 2015.
By virtue of Section 7 of the Singapore Companies Act, Chapter 50, Ang Kok Tian, Ang Ah Nui, Ang Kok Eng and Ang Kok Leong are deemed to have interests in the shares of the subsidiaries of the Company.
Except as disclosed in this report, no Director who held office at the end of the financial year had interests in shares, share options, warrants or debentures of the Company, or of related corporations, either at the beginning of the financial year or at the end of the financial year.
Directors’ contractual benefits
Except as disclosed in the financial statements, since the end of the previous financial year, no Director of the Company has received or become entitled to receive a benefit by reason of a contract made by the Company or a related corporation with the Director, or with a firm of which the Director is a member, or with a company in which the Director has a substantial financial interest.
AS
L M
arin
e H
old
ing
s Lt
d.
/Ann
ual R
epor
t 20
15
60
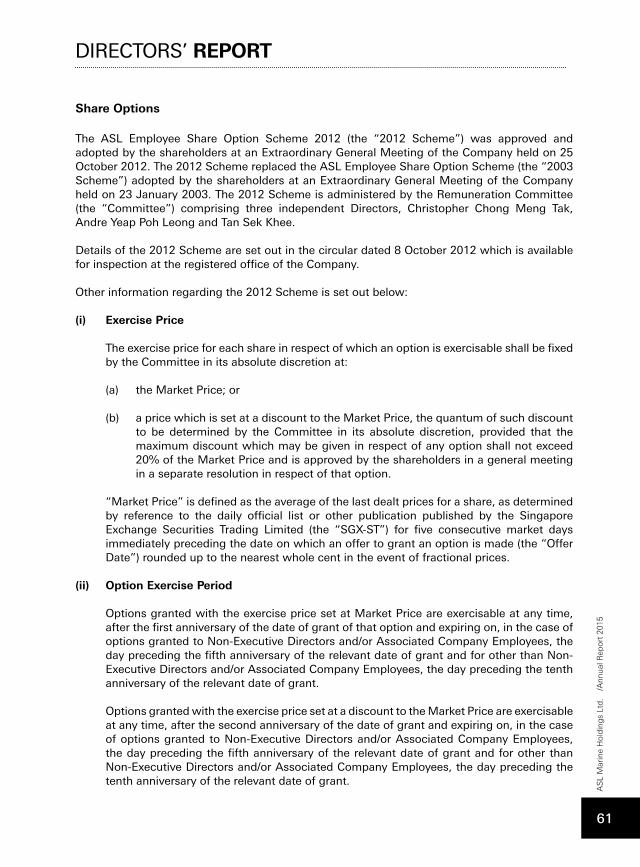
Share Options
The ASL Employee Share Option Scheme 2012 (the “2012 Scheme”) was approved and adopted by the shareholders at an Extraordinary General Meeting of the Company held on 25 October 2012. The 2012 Scheme replaced the ASL Employee Share Option Scheme (the “2003 Scheme”) adopted by the shareholders at an Extraordinary General Meeting of the Company held on 23 January 2003. The 2012 Scheme is administered by the Remuneration Committee (the “Committee”) comprising three independent Directors, Christopher Chong Meng Tak, Andre Yeap Poh Leong and Tan Sek Khee.
Details of the 2012 Scheme are set out in the circular dated 8 October 2012 which is available for inspection at the registered office of the Company.
Other information regarding the 2012 Scheme is set out below:
(i) Exercise Price
The exercise price for each share in respect of which an option is exercisable shall be fixed by the Committee in its absolute discretion at:
(a) the Market Price; or
(b) a price which is set at a discount to the Market Price, the quantum of such discount to be determined by the Committee in its absolute discretion, provided that the maximum discount which may be given in respect of any option shall not exceed 20% of the Market Price and is approved by the shareholders in a general meeting in a separate resolution in respect of that option.
“Market Price” is defined as the average of the last dealt prices for a share, as determined by reference to the daily official list or other publication published by the Singapore Exchange Securities Trading Limited (the “SGX-ST”) for five consecutive market days immediately preceding the date on which an offer to grant an option is made (the “Offer Date”) rounded up to the nearest whole cent in the event of fractional prices.
(ii) Option Exercise Period
Options granted with the exercise price set at Market Price are exercisable at any time, after the first anniversary of the date of grant of that option and expiring on, in the case of options granted to Non-Executive Directors and/or Associated Company Employees, the day preceding the fifth anniversary of the relevant date of grant and for other than Non-Executive Directors and/or Associated Company Employees, the day preceding the tenth anniversary of the relevant date of grant.
Options granted with the exercise price set at a discount to the Market Price are exercisable at any time, after the second anniversary of the date of grant and expiring on, in the case of options granted to Non-Executive Directors and/or Associated Company Employees, the day preceding the fifth anniversary of the relevant date of grant and for other than Non-Executive Directors and/or Associated Company Employees, the day preceding the tenth anniversary of the relevant date of grant.
DIRECTORS’ REPORT
AS
L M
arin
e H
old
ing
s Lt
d.
/Ann
ual R
epor
t 20
15
61
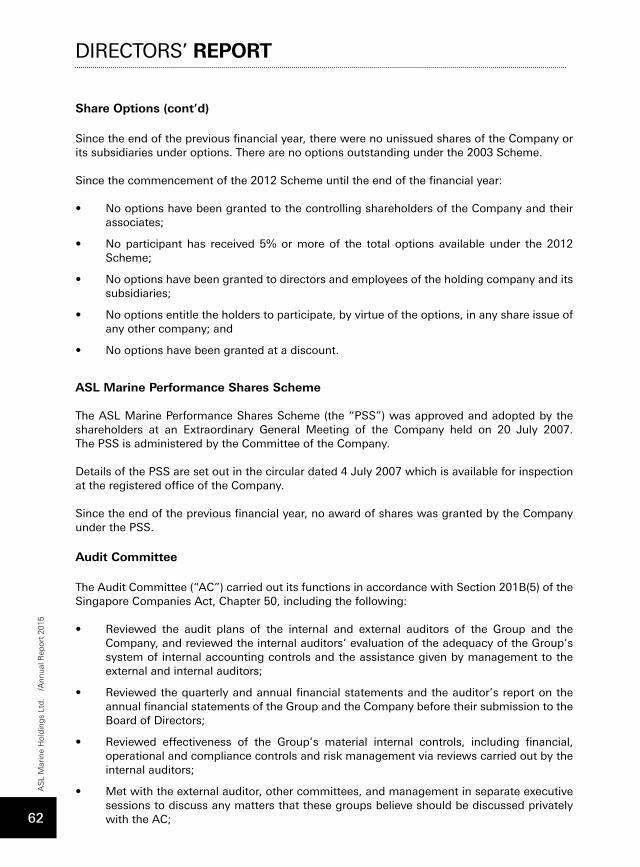
Share Options (cont’d)
Since the end of the previous financial year, there were no unissued shares of the Company or its subsidiaries under options. There are no options outstanding under the 2003 Scheme.
Since the commencement of the 2012 Scheme until the end of the financial year:
• No options have been granted to the controlling shareholders of the Company and their associates;
• No participant has received 5% or more of the total options available under the 2012 Scheme;
• No options have been granted to directors and employees of the holding company and its subsidiaries;
• No options entitle the holders to participate, by virtue of the options, in any share issue of any other company; and
• No options have been granted at a discount.
ASL Marine Performance Shares Scheme
The ASL Marine Performance Shares Scheme (the “PSS”) was approved and adopted by the shareholders at an Extraordinary General Meeting of the Company held on 20 July 2007. The PSS is administered by the Committee of the Company.
Details of the PSS are set out in the circular dated 4 July 2007 which is available for inspection at the registered office of the Company.
Since the end of the previous financial year, no award of shares was granted by the Company under the PSS.
Audit Committee
The Audit Committee (“AC”) carried out its functions in accordance with Section 201B(5) of the Singapore Companies Act, Chapter 50, including the following:
• Reviewed the audit plans of the internal and external auditors of the Group and the Company, and reviewed the internal auditors’ evaluation of the adequacy of the Group’s system of internal accounting controls and the assistance given by management to the external and internal auditors;
• Reviewed the quarterly and annual financial statements and the auditor’s report on the annual financial statements of the Group and the Company before their submission to the Board of Directors;
• Reviewed effectiveness of the Group’s material internal controls, including financial, operational and compliance controls and risk management via reviews carried out by the internal auditors;
• Met with the external auditor, other committees, and management in separate executive sessions to discuss any matters that these groups believe should be discussed privately with the AC;
DIRECTORS’ REPORTA
SL
Mar
ine
Hol
din
gs
Ltd
. /A
nnua
l Rep
ort
2015
62
Audit Committee (cont’d)
• Reviewed legal and regulatory matters that may have a material impact on the financial statements, related compliance policies and programmes and any reports received from regulators;
• Reviewed the cost effectiveness and the independence and objectivity of the external auditor;
• Reviewed the nature and extent of non-audit services provided by the external auditor;
• Recommended to the Board of Directors the external auditor to be nominated, approved the compensation of the external auditor and reviewed the scope and results of the audit;
• Reported actions and minutes of the AC to the Board of Directors with such recommendations as the AC considered appropriate; and
• Reviewed interested person transactions in accordance with the requirements of the SGX-ST’s Listing Manual.
The AC, having reviewed all non-audit services provided by the external auditor to the Group, is satisfied that the nature and extent of such services would not affect the independence of the external auditor. The AC has also conducted a review of interested person transactions.
The AC convened four meetings during the year with full attendance from all members. The AC has also met with internal and external auditors, without the presence of the Company’s management, at least once a year.
Further details regarding the AC are disclosed in the Report on Corporate Governance.
Auditor
Ernst & Young LLP have expressed their willingness to accept re-appointment as auditor.
On behalf of the Board of Directors:
.......................................................Ang Kok TianDirector
.......................................................Ang Ah NuiDirector
Singapore 2 October 2015
DIRECTORS’ REPORT
AS
L M
arin
e H
old
ing
s Lt
d.
/Ann
ual R
epor
t 20
15
63
STATEMENT BY DIRECTORS
We, Ang Kok Tian and Ang Ah Nui, being two of the Directors of ASL Marine Holdings Ltd., do hereby state that, in the opinion of the Directors,
(i) the accompanying statements of financial position, consolidated income statement, consolidated statement of comprehensive income, statements of changes in equity, and consolidated statement of cash flows together with notes thereto are drawn up so as to give a true and fair view of the financial position of the Group and of the Company as at 30 June 2015 and of the financial performance, changes in equity and cash flows of the Group and the changes in equity of the Company for the year ended on that date; and
(ii) at the date of this statement, there are reasonable grounds to believe that the Company will be able to pay its debts as and when they fall due.
On behalf of the Board of Directors:
.......................................................Ang Kok TianDirector
.......................................................Ang Ah NuiDirector
Singapore 2 October 2015
AS
L M
arin
e H
old
ing
s Lt
d.
/Ann
ual R
epor
t 20
15
64
Report on the Financial Statements
We have audited the accompanying financial statements of ASL Marine Holdings Ltd. (the “Company”) and its subsidiaries (collectively, the “Group”) set out on pages 67 to 169, which comprise the statements of financial position of the Group and the Company as at 30 June 2015, the statements of changes in equity of the Group and the Company and the consolidated income statement, consolidated statement of comprehensive income and consolidated statement of cash flows of the Group for the year then ended, and a summary of significant accounting policies and other explanatory information.
Management’s Responsibility for the Financial Statements
Management is responsible for the preparation of financial statements that give a true and fair view in accordance with the provisions of the Singapore Companies Act, Chapter 50 (the “Act”) and Singapore Financial Reporting Standards, and for devising and maintaining a system of internal accounting controls sufficient to provide a reasonable assurance that assets are safeguarded against loss from unauthorised use or disposition; and transactions are properly authorised and that they are recorded as necessary to permit the preparation of true and fair financial statements and to maintain accountability of assets.
Auditor’s Responsibility
Our responsibility is to express an opinion on these financial statements based on our audit. We conducted our audit in accordance with Singapore Standards on Auditing. Those standards require that we comply with ethical requirements and plan and perform the audit to obtain reasonable assurance about whether the financial statements are free from material misstatement.
An audit involves performing procedures to obtain audit evidence about the amounts and disclosures in the financial statements. The procedures selected depend on the auditor’s judgement, including the assessment of the risks of material misstatement of the financial statements, whether due to fraud or error. In making those risk assessments, the auditor considers internal control relevant to the entity’s preparation of financial statements that give a true and fair view in order to design audit procedures that are appropriate in the circumstances, but not for the purpose of expressing an opinion on the effectiveness of the entity’s internal control. An audit also includes evaluating the appropriateness of accounting policies used and the reasonableness of accounting estimates made by management, as well as evaluating the overall presentation of the financial statements.
We believe that the audit evidence we have obtained is sufficient and appropriate to provide a basis for our audit opinion.
INDEPENDENT AUDITOR’S REPORTTo the Members of ASL Marine Holdings Ltd.
AS
L M
arin
e H
old
ing
s Lt
d.
/Ann
ual R
epor
t 20
15
65
Opinion
In our opinion, the consolidated financial statements of the Group and the statement of financial position and statement of changes in equity of the Company are properly drawn up in accordance with the provisions of the Act and Singapore Financial Reporting Standards so as to give a true and fair view of the financial position of the Group and of the Company as at 30 June 2015 and of the financial performance, changes in equity and cash flows of the Group and the changes in equity of the Company for the year ended on that date.
Report on Other Legal and Regulatory Requirements
In our opinion, the accounting and other records required by the Act to be kept by the Company and by those subsidiaries incorporated in Singapore of which we are the auditors have been properly kept in accordance with the provisions of the Act.
Ernst & Young LLPPublic Accountants andChartered Accountants
Singapore2 October 2015
INDEPENDENT AUDITOR’S REPORTTo the Members of ASL Marine Holdings Ltd.
AS
L M
arin
e H
old
ing
s Lt
d.
/Ann
ual R
epor
t 20
15
66
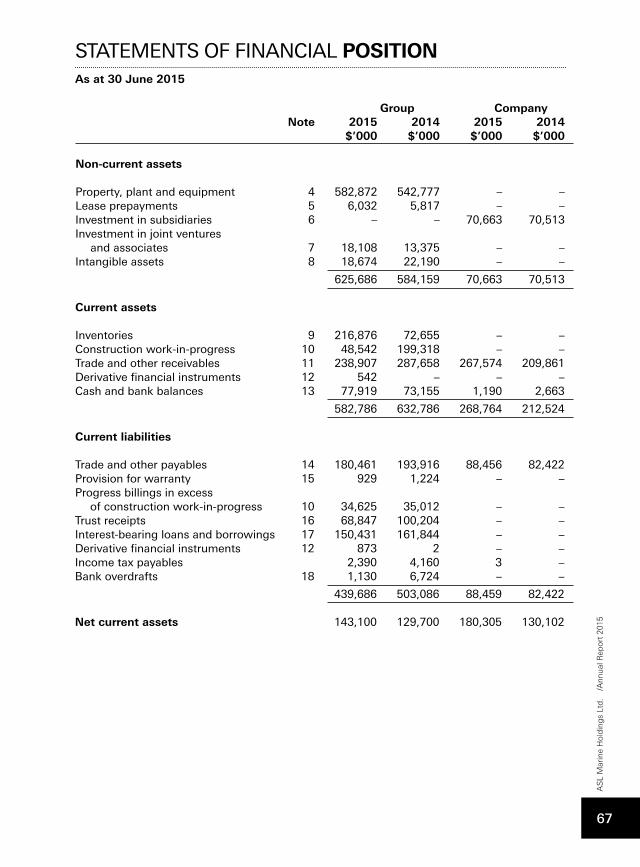
Group Company Note 2015 2014 2015 2014 $’000 $’000 $’000 $’000 Non-current assets Property, plant and equipment 4 582,872 542,777 – –Lease prepayments 5 6,032 5,817 – –Investment in subsidiaries 6 – – 70,663 70,513Investment in joint ventures and associates 7 18,108 13,375 – –Intangible assets 8 18,674 22,190 – –
625,686 584,159 70,663 70,513 Current assets Inventories 9 216,876 72,655 – –Construction work-in-progress 10 48,542 199,318 – –Trade and other receivables 11 238,907 287,658 267,574 209,861Derivative financial instruments 12 542 – – –Cash and bank balances 13 77,919 73,155 1,190 2,663
582,786 632,786 268,764 212,524 Current liabilities Trade and other payables 14 180,461 193,916 88,456 82,422Provision for warranty 15 929 1,224 – –Progress billings in excess of construction work-in-progress 10 34,625 35,012 – –Trust receipts 16 68,847 100,204 – –Interest-bearing loans and borrowings 17 150,431 161,844 – –Derivative financial instruments 12 873 2 – –Income tax payables 2,390 4,160 3 –Bank overdrafts 18 1,130 6,724 – –
439,686 503,086 88,459 82,422 Net current assets 143,100 129,700 180,305 130,102
STATEMENTS OF FINANCIAL POSITIONAs at 30 June 2015
AS
L M
arin
e H
old
ing
s Lt
d.
/Ann
ual R
epor
t 20
15
67
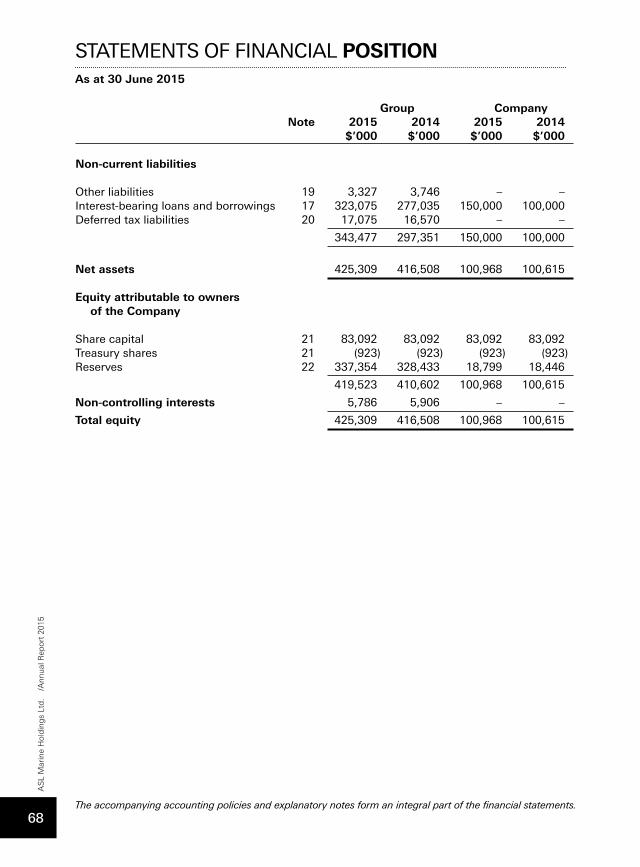
Group Company Note 2015 2014 2015 2014 $’000 $’000 $’000 $’000 Non-current liabilities Other liabilities 19 3,327 3,746 – –Interest-bearing loans and borrowings 17 323,075 277,035 150,000 100,000Deferred tax liabilities 20 17,075 16,570 – –
343,477 297,351 150,000 100,000
Net assets 425,309 416,508 100,968 100,615 Equity attributable to owners of the Company Share capital 21 83,092 83,092 83,092 83,092Treasury shares 21 (923) (923) (923) (923)Reserves 22 337,354 328,433 18,799 18,446
419,523 410,602 100,968 100,615
Non-controlling interests 5,786 5,906 – –
Total equity 425,309 416,508 100,968 100,615
STATEMENTS OF FINANCIAL POSITIONAs at 30 June 2015
The accompanying accounting policies and explanatory notes form an integral part of the financial statements.
AS
L M
arin
e H
old
ing
s Lt
d.
/Ann
ual R
epor
t 20
15
68
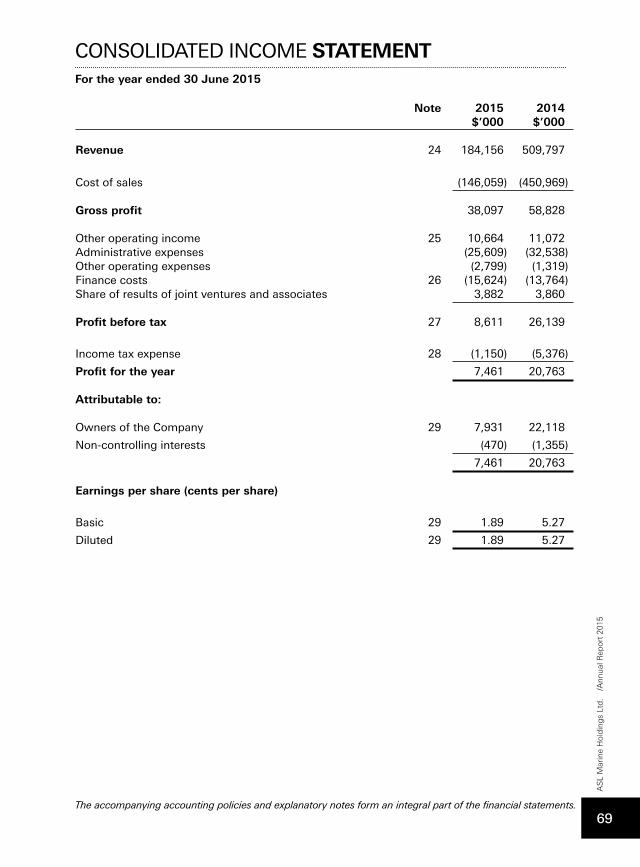
CONSOLIDATED INCOME STATEMENTFor the year ended 30 June 2015
The accompanying accounting policies and explanatory notes form an integral part of the financial statements.
Note 2015 2014 $’000 $’000 Revenue 24 184,156 509,797
Cost of sales (146,059) (450,969) Gross profit 38,097 58,828 Other operating income 25 10,664 11,072Administrative expenses (25,609) (32,538)Other operating expenses (2,799) (1,319)Finance costs 26 (15,624) (13,764)Share of results of joint ventures and associates 3,882 3,860 Profit before tax 27 8,611 26,139
Income tax expense 28 (1,150) (5,376)
Profit for the year 7,461 20,763 Attributable to: Owners of the Company 29 7,931 22,118
Non-controlling interests (470) (1,355)
7,461 20,763 Earnings per share (cents per share)
Basic 29 1.89 5.27
Diluted 29 1.89 5.27
The accompanying accounting policies and explanatory notes form an integral part of the financial statements.
AS
L M
arin
e H
old
ing
s Lt
d.
/Ann
ual R
epor
t 20
15
69
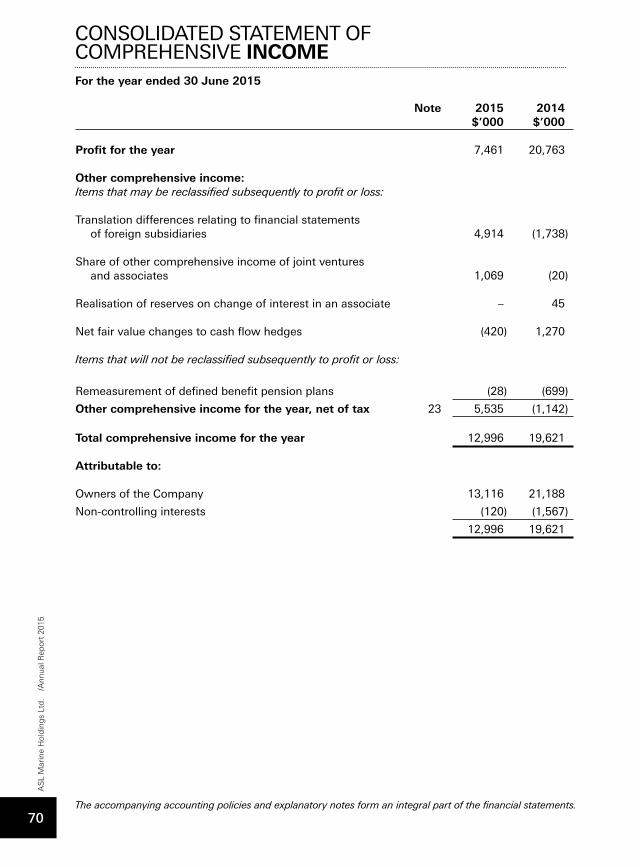
Note 2015 2014 $’000 $’000 Profit for the year 7,461 20,763 Other comprehensive income: Items that may be reclassified subsequently to profit or loss: Translation differences relating to financial statements of foreign subsidiaries 4,914 (1,738)
Share of other comprehensive income of joint ventures and associates 1,069 (20)
Realisation of reserves on change of interest in an associate – 45
Net fair value changes to cash flow hedges (420) 1,270 Items that will not be reclassified subsequently to profit or loss:
Remeasurement of defined benefit pension plans (28) (699)
Other comprehensive income for the year, net of tax 23 5,535 (1,142) Total comprehensive income for the year 12,996 19,621 Attributable to: Owners of the Company 13,116 21,188
Non-controlling interests (120) (1,567)
12,996 19,621
The accompanying accounting policies and explanatory notes form an integral part of the financial statements.
CONSOLIDATED STATEMENT OFCOMPREHENSIVE INCOMEFor the year ended 30 June 2015
AS
L M
arin
e H
old
ing
s Lt
d.
/Ann
ual R
epor
t 20
15
70
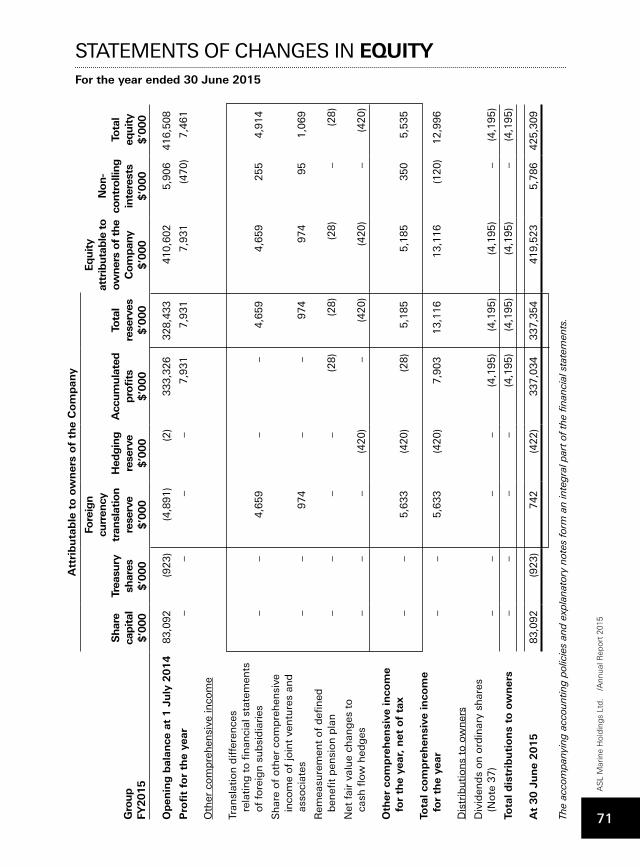
The accompanying accounting policies and explanatory notes form an integral part of the financial statements.
Att
rib
uta
ble
to o
wn
ers
of
the
Com
pan
y
Gro
up
FY2015
Shar
eca
pital
$’0
00
Trea
sury
shar
es$’0
00
Fore
ign
cu
rren
cy
tran
slat
ion
re
serv
e$’0
00
Hed
gin
g
rese
rve
$’0
00
Acc
um
ula
ted
pro
fits
$’0
00
Tota
l re
serv
es$’0
00
Equity
attr
ibuta
ble
to
owner
s of
the
Com
pan
y$’0
00
Non-
contr
olli
ng
in
tere
sts
$’0
00
Tota
l eq
uity
$’0
00
Op
enin
g b
alan
ce a
t 1
Ju
ly 2
01
48
3,0
92
(92
3)
(4,8
91)
(2)
333,3
26
328,4
33
410,6
02
5,9
06
416,5
08
Pro
fit
for
the
year
–
–
–
–
7,9
31
7,9
31
7,9
31
(470)
7,4
61
Oth
er c
om
pre
hen
sive
inco
me
Tran
slat
ion
diff
eren
ces
rela
tin
g t
o fi
nan
cial
sta
tem
ents
o
f fo
reig
n s
ub
sid
iari
es
–
–4,6
59
–
–
4,6
59
4,6
59
255
4,9
14
Sh
are
of
oth
er c
om
pre
hen
sive
inco
me
of
join
t ve
ntu
res
and
as
soci
ates
–
–
974
–
–
974
974
95
1,0
69
Rem
easu
rem
ent
of
defi
ned
ben
efit
pen
sio
n p
lan
–
–
–
–
(28)
(28)
(28)
–
(28)
Net
fai
r va
lue
chan
ges
to
cash
flow
hed
ges
–
–
–
(420)
–
(420)
(420)
–
(420)
Oth
er c
om
pre
hen
sive
in
com
e fo
r th
e ye
ar,
net
of
tax
–
–
5,6
33
(420)
(28)
5,1
85
5,1
85
350
5,5
35
Tota
l co
mp
reh
ensi
ve in
com
efo
r th
e ye
ar
–
–5,6
33
(420)
7,9
03
13,1
16
13,1
16
(120)
12,9
96
Dis
trib
uti
on
s to
ow
ner
s
Div
iden
ds
on
ord
inar
y sh
ares
(No
te 3
7)
–
–
–
–
(4,1
95)
(4,1
95)
(4,1
95)
–
(4,1
95)
Tota
l d
istr
ibu
tion
s to
ow
ner
s
–
–
–
–(4
,195)
(4,1
95)
(4,1
95)
–
(4,1
95)
At
30
Ju
ne
20
15
83
,09
2(9
23
)742
(422)
337,0
34
337,3
54
419,5
23
5,7
86
425,3
09
The
acco
mp
anyi
ng
acc
oun
ting
pol
icie
s an
d e
xpla
nat
ory
not
es f
orm
an
inte
gra
l par
t of
th
e fin
anci
al s
tate
men
ts.
STATEMENTS OF CHANGES IN EQUITY For the year ended 30 June 2015
AS
L M
arin
e H
old
ing
s Lt
d.
/Ann
ual R
epor
t 20
15
71
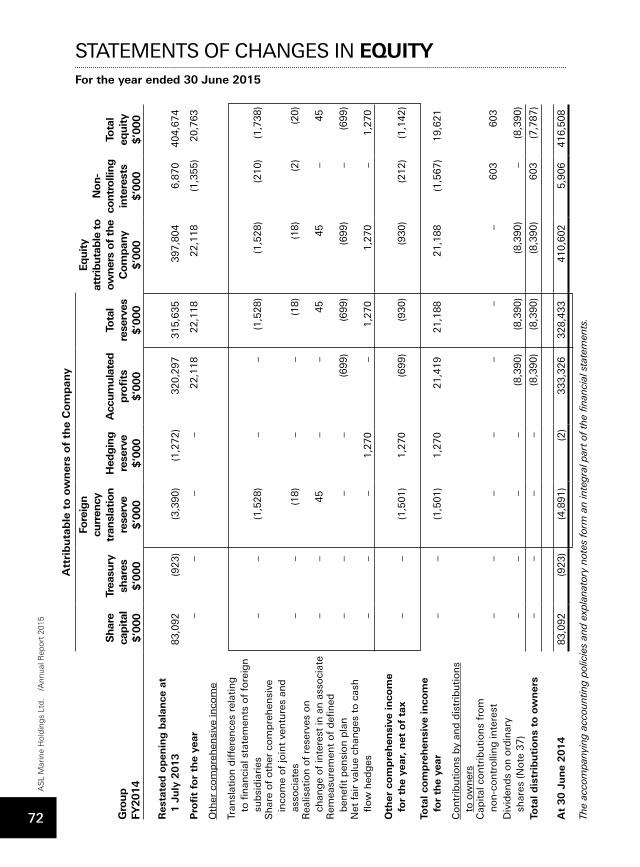
Att
rib
uta
ble
to o
wn
ers
of
the
Com
pan
y
Gro
up
FY2014
Shar
eca
pital
$’0
00
Trea
sury
shar
es$’0
00
Fore
ign
cu
rren
cy
tran
slat
ion
re
serv
e$’0
00
Hed
gin
g
rese
rve
$’0
00
Acc
um
ula
ted
pro
fits
$’0
00
Tota
l re
serv
es$’0
00
Equity
attr
ibuta
ble
to
owner
s of
the
Com
pan
y$’0
00
Non-
contr
olli
ng
in
tere
sts
$’0
00
Tota
l eq
uity
$’0
00
Res
tate
d o
pen
ing
bal
ance
at
1 J
uly
2013
83
,09
2(9
23
)(3
,39
0)
(1,2
72
)3
20
,29
73
15
,63
53
97
,80
46,8
70
404,6
74
Pro
fit
for
the
year
–
–
–
–
22
,11
82
2,1
18
22
,11
8(1
,355)
20,7
63
Oth
er c
om
pre
hen
sive
inco
me
Tran
slat
ion
diff
eren
ces
rela
tin
gto
fin
anci
al s
tate
men
ts o
f fo
reig
n
sub
sid
iari
es
–
–(1
,52
8)
–
–
(1,5
28
)(1
,52
8)
(210)
(1,7
38)
Sh
are
of
oth
er c
om
pre
hen
sive
inco
me
of
join
t ve
ntu
res
and
as
soci
ates
–
–
(18
)
–
–(1
8)
(18
)(2
)(2
0)
Rea
lisat
ion
of
rese
rves
on
chan
ge
of
inte
rest
in a
n a
sso
ciat
e
–
–4
5
–
–4
54
5
–45
Rem
easu
rem
ent
of
defi
ned
ben
efit
pen
sio
n p
lan
–
–
–
–
(69
9)
(69
9)
(69
9)
–
(699)
Net
fai
r va
lue
chan
ges
to
cas
hfl
ow h
edg
es
–
–
–1
,27
0
–1
,27
01
,27
0
–1,2
70
Oth
er c
om
pre
hen
sive
in
com
efo
r th
e ye
ar,
net
of
tax
–
–
(1,5
01
)1
,27
0(6
99
)(9
30
)(9
30
)(2
12)
(1,1
42)
Tota
l co
mp
reh
ensi
ve in
com
efo
r th
e ye
ar
–
–(1
,50
1)
1,2
70
21
,41
92
1,1
88
21
,18
8(1
,567)
19,6
21
Co
ntr
ibu
tio
ns
by
and
dis
trib
uti
on
sto
ow
ner
sC
apit
al c
on
trib
uti
on
s fr
om
no
n-c
on
tro
llin
g in
tere
st
–
–
–
–
–
–
–603
603
Div
iden
ds
on
ord
inar
ysh
ares
(N
ote
37)
–
–
–
–
(8,3
90
)(8
,39
0)
(8,3
90
)
–(8
,390)
Tota
l d
istr
ibu
tion
s to
ow
ner
s
–
–
–
–(8
,39
0)
(8,3
90
)(8
,39
0)
603
(7,7
87)
At
30 J
un
e 2014
83
,09
2(9
23
)(4
,89
1)
(2)
33
3,3
26
32
8,4
33
41
0,6
02
5,9
06
416,5
08
The
acco
mp
anyi
ng
acc
oun
ting
pol
icie
s an
d e
xpla
nat
ory
not
es f
orm
an
inte
gra
l par
t of
th
e fin
anci
al s
tate
men
ts.
STATEMENTS OF CHANGES IN EQUITYFor the year ended 30 June 2015
AS
L M
arin
e H
old
ing
s Lt
d.
/Ann
ual R
epor
t 20
15
72
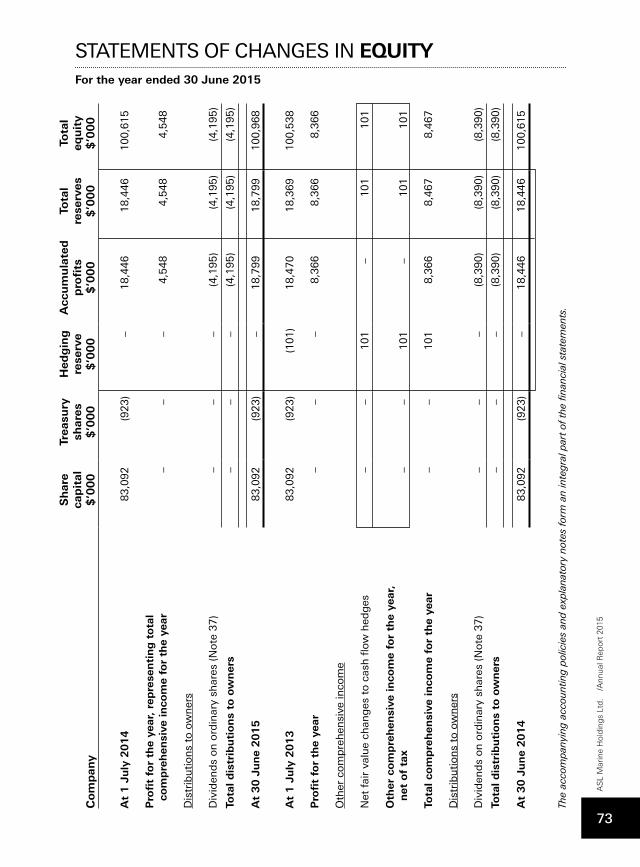
The
acco
mp
anyi
ng
acc
oun
ting
pol
icie
s an
d e
xpla
nat
ory
not
es f
orm
an
inte
gra
l par
t of
th
e fin
anci
al s
tate
men
ts.
Com
pan
y
Sh
are
cap
ital
$’0
00
Trea
sury
sh
ares
$’0
00
Hed
gin
g
rese
rve
$’0
00
Acc
um
ula
ted
p
rofi
ts$
’00
0
Tota
lre
serv
es$
’00
0
Tota
leq
uit
y$
’00
0
At
1 J
uly
20
14
83
,09
2(9
23
)
–1
8,4
46
18
,44
61
00
,61
5
Pro
fit
for
the
year
, re
pre
sen
tin
g t
ota
lco
mp
reh
ensi
ve in
com
e fo
r th
e ye
ar
–
–
–4
,54
84
,54
84
,54
8
Dis
trib
uti
on
s to
ow
ner
s
Div
iden
ds
on
ord
inar
y sh
ares
(N
ote
37)
–
–
–
(4,1
95
)(4
,19
5)
(4,1
95
)
Tota
l d
istr
ibu
tion
s to
ow
ner
s
–
–
–(4
,19
5)
(4,1
95
)(4
,19
5)
At
30
Ju
ne
20
15
83
,09
2(9
23
)
–1
8,7
99
18
,79
91
00
,96
8
At
1 J
uly
20
13
83
,09
2(9
23
)(1
01
)1
8,4
70
18
,36
91
00
,53
8
Pro
fit
for
the
year
–
–
–
8,3
66
8,3
66
8,3
66
Oth
er c
om
pre
hen
sive
inco
me
Net
fai
r va
lue
chan
ges
to
cas
h fl
ow h
edg
es
–
–1
01
–1
01
10
1
Oth
er c
om
pre
hen
sive
in
com
e fo
r th
e ye
ar,
net
of
tax
–
–
10
1–
10
11
01
Tota
l co
mp
reh
ensi
ve in
com
e fo
r th
e ye
ar
–
–1
01
8,3
66
8,4
67
8,4
67
Dis
trib
uti
on
s to
ow
ner
s
Div
iden
ds
on
ord
inar
y sh
ares
(N
ote
37)
–
–
–
(8,3
90
)(8
,39
0)
(8,3
90
)
Tota
l d
istr
ibu
tion
s to
ow
ner
s
–
–
–(8
,39
0)
(8,3
90
)(8
,39
0)
At
30
Ju
ne
20
14
83
,09
2(9
23
)
–1
8,4
46
18
,44
61
00
,61
5
STATEMENTS OF CHANGES IN EQUITY For the year ended 30 June 2015
AS
L M
arin
e H
old
ing
s Lt
d.
/Ann
ual R
epor
t 20
15
73
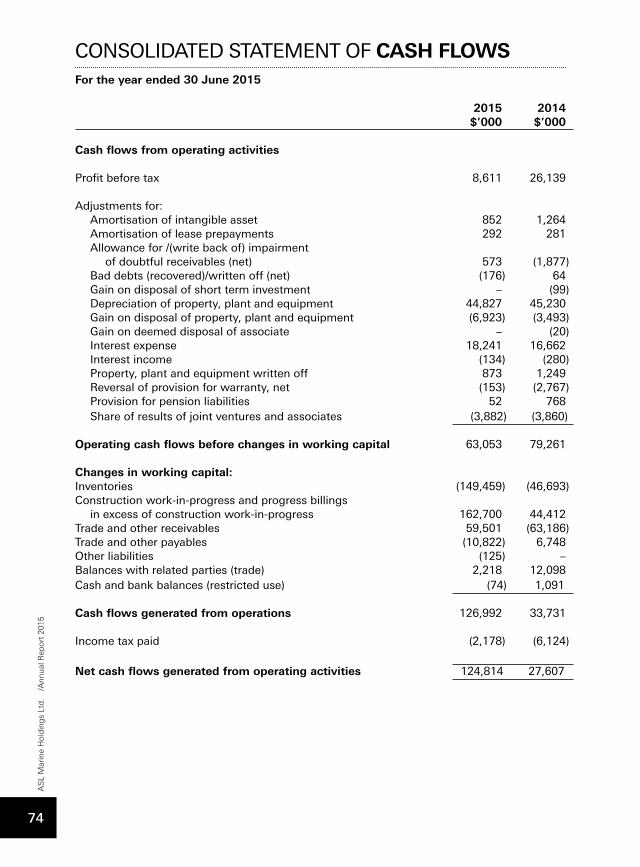
CONSOLIDATED STATEMENT OF CASH FLOWS For the year ended 30 June 2015
2015 2014 $’000 $’000 Cash flows from operating activities Profit before tax 8,611 26,139 Adjustments for:
Amortisation of intangible asset 852 1,264Amortisation of lease prepayments 292 281Allowance for /(write back of) impairment of doubtful receivables (net) 573 (1,877)Bad debts (recovered)/written off (net) (176) 64Gain on disposal of short term investment – (99)Depreciation of property, plant and equipment 44,827 45,230Gain on disposal of property, plant and equipment (6,923) (3,493)Gain on deemed disposal of associate – (20)Interest expense 18,241 16,662Interest income (134) (280)Property, plant and equipment written off 873 1,249Reversal of provision for warranty, net (153) (2,767)Provision for pension liabilities 52 768Share of results of joint ventures and associates (3,882) (3,860)
Operating cash flows before changes in working capital 63,053 79,261 Changes in working capital: Inventories (149,459) (46,693)Construction work-in-progress and progress billings in excess of construction work-in-progress 162,700 44,412Trade and other receivables 59,501 (63,186)Trade and other payables (10,822) 6,748Other liabilities (125) –Balances with related parties (trade) 2,218 12,098Cash and bank balances (restricted use) (74) 1,091 Cash flows generated from operations 126,992 33,731 Income tax paid (2,178) (6,124) Net cash flows generated from operating activities 124,814 27,607
AS
L M
arin
e H
old
ing
s Lt
d.
/Ann
ual R
epor
t 20
15
74
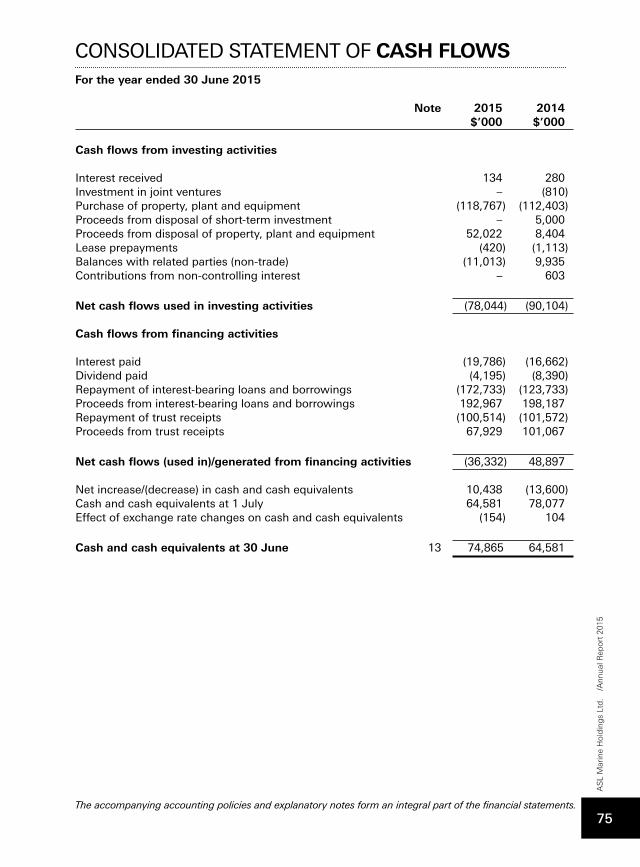
CONSOLIDATED STATEMENT OF CASH FLOWS For the year ended 30 June 2015
Note 2015 2014 $’000 $’000 Cash flows from investing activities Interest received 134 280Investment in joint ventures – (810)Purchase of property, plant and equipment (118,767) (112,403)Proceeds from disposal of short-term investment – 5,000Proceeds from disposal of property, plant and equipment 52,022 8,404Lease prepayments (420) (1,113)Balances with related parties (non-trade) (11,013) 9,935Contributions from non-controlling interest – 603
Net cash flows used in investing activities (78,044) (90,104) Cash flows from financing activities Interest paid (19,786) (16,662)Dividend paid (4,195) (8,390)Repayment of interest-bearing loans and borrowings (172,733) (123,733)Proceeds from interest-bearing loans and borrowings 192,967 198,187Repayment of trust receipts (100,514) (101,572)Proceeds from trust receipts 67,929 101,067 Net cash flows (used in)/generated from financing activities (36,332) 48,897 Net increase/(decrease) in cash and cash equivalents 10,438 (13,600)Cash and cash equivalents at 1 July 64,581 78,077Effect of exchange rate changes on cash and cash equivalents (154) 104 Cash and cash equivalents at 30 June 13 74,865 64,581
The accompanying accounting policies and explanatory notes form an integral part of the financial statements.
AS
L M
arin
e H
old
ing
s Lt
d.
/Ann
ual R
epor
t 20
15
75
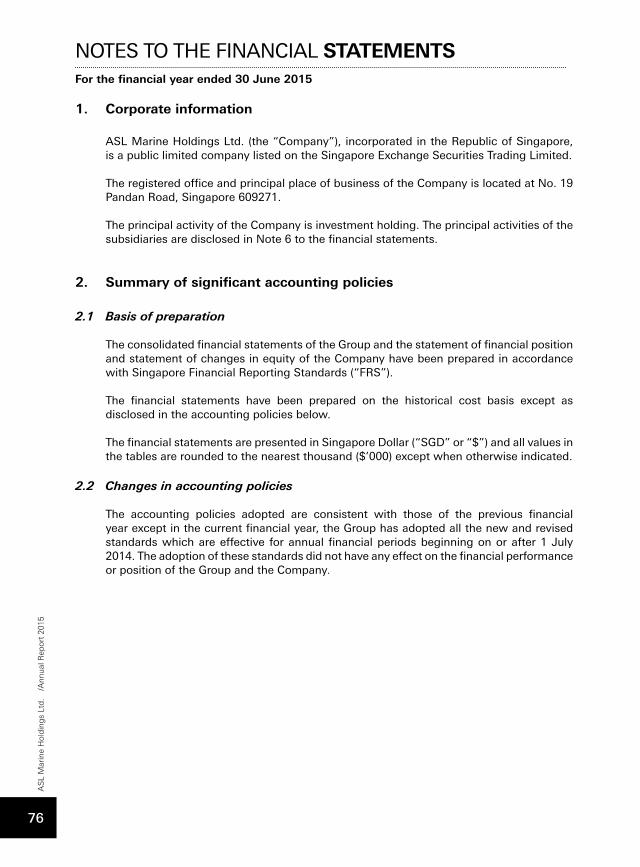
NOTES TO THE FINANCIAL STATEMENTSFor the financial year ended 30 June 2015
1. Corporate information
ASL Marine Holdings Ltd. (the “Company”), incorporated in the Republic of Singapore, is a public limited company listed on the Singapore Exchange Securities Trading Limited.
The registered office and principal place of business of the Company is located at No. 19 Pandan Road, Singapore 609271.
The principal activity of the Company is investment holding. The principal activities of the subsidiaries are disclosed in Note 6 to the financial statements.
2. Summary of significant accounting policies
2.1 Basis of preparation
The consolidated financial statements of the Group and the statement of financial position and statement of changes in equity of the Company have been prepared in accordance with Singapore Financial Reporting Standards (“FRS”).
The financial statements have been prepared on the historical cost basis except as disclosed in the accounting policies below.
The financial statements are presented in Singapore Dollar (“SGD” or “$”) and all values in the tables are rounded to the nearest thousand ($’000) except when otherwise indicated.
2.2 Changes in accounting policies
The accounting policies adopted are consistent with those of the previous financial year except in the current financial year, the Group has adopted all the new and revised standards which are effective for annual financial periods beginning on or after 1 July 2014. The adoption of these standards did not have any effect on the financial performance or position of the Group and the Company.
AS
L M
arin
e H
old
ing
s Lt
d.
/Ann
ual R
epor
t 20
15
76
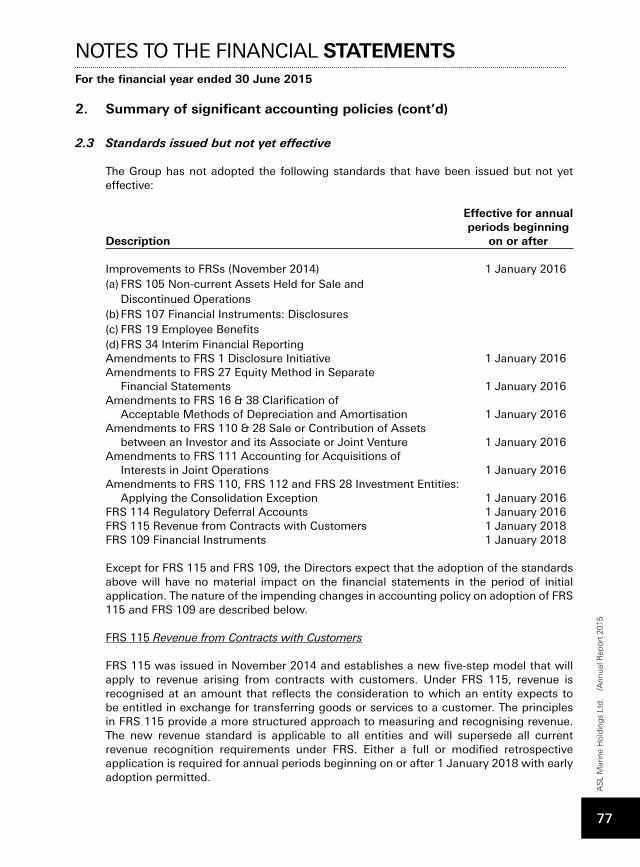
2. Summary of significant accounting policies (cont’d)
2.3 Standardsissuedbutnotyeteffective
The Group has not adopted the following standards that have been issued but not yet effective:
Effective for annual periods beginningDescription on or after
Improvements to FRSs (November 2014) 1 January 2016(a) FRS 105 Non-current Assets Held for Sale and
Discontinued Operations (b) FRS 107 Financial Instruments: Disclosures (c) FRS 19 Employee Benefits (d) FRS 34 Interim Financial Reporting Amendments to FRS 1 Disclosure Initiative 1 January 2016Amendments to FRS 27 Equity Method in Separate Financial Statements 1 January 2016Amendments to FRS 16 & 38 Clarification of Acceptable Methods of Depreciation and Amortisation 1 January 2016Amendments to FRS 110 & 28 Sale or Contribution of Assets between an Investor and its Associate or Joint Venture 1 January 2016Amendments to FRS 111 Accounting for Acquisitions of Interests in Joint Operations 1 January 2016Amendments to FRS 110, FRS 112 and FRS 28 Investment Entities: Applying the Consolidation Exception 1 January 2016FRS 114 Regulatory Deferral Accounts 1 January 2016FRS 115 Revenue from Contracts with Customers 1 January 2018FRS 109 Financial Instruments 1 January 2018
Except for FRS 115 and FRS 109, the Directors expect that the adoption of the standards above will have no material impact on the financial statements in the period of initial application. The nature of the impending changes in accounting policy on adoption of FRS 115 and FRS 109 are described below.
FRS 115 Revenue from Contracts with Customers
FRS 115 was issued in November 2014 and establishes a new five-step model that will apply to revenue arising from contracts with customers. Under FRS 115, revenue is recognised at an amount that reflects the consideration to which an entity expects to be entitled in exchange for transferring goods or services to a customer. The principles in FRS 115 provide a more structured approach to measuring and recognising revenue. The new revenue standard is applicable to all entities and will supersede all current revenue recognition requirements under FRS. Either a full or modified retrospective application is required for annual periods beginning on or after 1 January 2018 with early adoption permitted.
NOTES TO THE FINANCIAL STATEMENTSFor the financial year ended 30 June 2015
AS
L M
arin
e H
old
ing
s Lt
d.
/Ann
ual R
epor
t 20
15
77
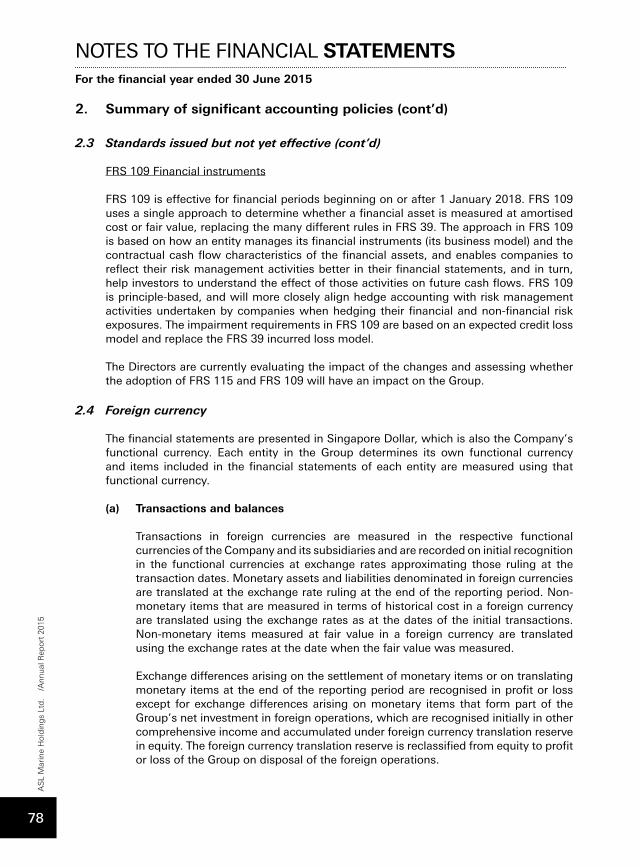
2. Summary of significant accounting policies (cont’d)
2.3 Standardsissuedbutnotyeteffective(cont’d)
FRS 109 Financial instruments
FRS 109 is effective for financial periods beginning on or after 1 January 2018. FRS 109 uses a single approach to determine whether a financial asset is measured at amortised cost or fair value, replacing the many different rules in FRS 39. The approach in FRS 109 is based on how an entity manages its financial instruments (its business model) and the contractual cash flow characteristics of the financial assets, and enables companies to reflect their risk management activities better in their financial statements, and in turn, help investors to understand the effect of those activities on future cash flows. FRS 109 is principle-based, and will more closely align hedge accounting with risk management activities undertaken by companies when hedging their financial and non-financial risk exposures. The impairment requirements in FRS 109 are based on an expected credit loss model and replace the FRS 39 incurred loss model.
The Directors are currently evaluating the impact of the changes and assessing whether the adoption of FRS 115 and FRS 109 will have an impact on the Group.
2.4 Foreign currency
The financial statements are presented in Singapore Dollar, which is also the Company’s functional currency. Each entity in the Group determines its own functional currency and items included in the financial statements of each entity are measured using that functional currency.
(a) Transactions and balances
Transactions in foreign currencies are measured in the respective functional currencies of the Company and its subsidiaries and are recorded on initial recognition in the functional currencies at exchange rates approximating those ruling at the transaction dates. Monetary assets and liabilities denominated in foreign currencies are translated at the exchange rate ruling at the end of the reporting period. Non-monetary items that are measured in terms of historical cost in a foreign currency are translated using the exchange rates as at the dates of the initial transactions. Non-monetary items measured at fair value in a foreign currency are translated using the exchange rates at the date when the fair value was measured.
Exchange differences arising on the settlement of monetary items or on translating monetary items at the end of the reporting period are recognised in profit or loss except for exchange differences arising on monetary items that form part of the Group’s net investment in foreign operations, which are recognised initially in other comprehensive income and accumulated under foreign currency translation reserve in equity. The foreign currency translation reserve is reclassified from equity to profit or loss of the Group on disposal of the foreign operations.
NOTES TO THE FINANCIAL STATEMENTSFor the financial year ended 30 June 2015
AS
L M
arin
e H
old
ing
s Lt
d.
/Ann
ual R
epor
t 20
15
78
2. Summary of significant accounting policies (cont’d)
2.4 Foreigncurrency(cont’d)
(b) Consolidated financial statements
For consolidation purpose, the assets and liabilities of foreign operations are translated into SGD at the exchange rates ruling at the end of the reporting period and their profit or loss are translated at the exchange rates prevailing at the date of the transactions. The exchange differences arising on the translation are recognised in other comprehensive income. On disposal of a foreign operation, the component of other comprehensive income relating to that particular foreign operation is recognised in profit or loss.
In the case of a partial disposal without loss of control of a subsidiary that includes a foreign operation, the proportionate share of the cumulative amount of the exchange differences are re-attributed to non-controlling interest and are not recognised in profit or loss. For partial disposals of associates or joint venture entities that are foreign operations, the proportionate share of the accumulated exchange differences is reclassified to profit or loss.
2.5 Basis of consolidation and business combinations
(a) Basis of consolidation
The consolidated financial statements comprise the financial statements of the Company and its subsidiaries as at the end of the reporting period. The financial statements of the subsidiaries used in the preparation of the consolidated financial statements are prepared for the same reporting date as the Company. Consistent accounting policies are applied to like transactions and events in similar circumstances.
All intra-group balances, income and expenses and unrealised gains and losses resulting from intra-group transactions and dividends are eliminated in full.
Subsidiaries are consolidated from the date of acquisition, being the date on which the Group obtains control, and continue to be consolidated until the date that such control ceases.
Losses within a subsidiary are attributed to the non-controlling interest even if that results in a deficit balance.
A change in the ownership interest of a subsidiary, without a loss of control, is accounted for as an equity transaction. If the Group loses control over a subsidiary, it:
• Derecognises the assets (including goodwill) and liabilities of the subsidiary at their carrying amounts at the date when control is lost;
• Derecognises the carrying amount of any non-controlling interest;
• Derecognises the cumulative translation differences recorded in equity;
NOTES TO THE FINANCIAL STATEMENTSFor the financial year ended 30 June 2015
AS
L M
arin
e H
old
ing
s Lt
d.
/Ann
ual R
epor
t 20
15
79
2. Summary of significant accounting policies (cont’d)
2.5 Basisofconsolidationandbusinesscombinations(cont’d)
(a) Basis of consolidation (cont’d)
• Recognises the fair value of the consideration received; • Recognises the fair value of any investment retained;
• Recognises any surplus or deficit in profit or loss;
• Reclassifies the Group’s share of components previously recognised in other comprehensive income to profit or loss or retained earnings, as appropriate.
(b) Business combinations and goodwill
Business combinations are accounted for by applying the acquisition method. Identifiable assets acquired and liabilities assumed in a business combination are measured initially at their fair values at the acquisition date. Acquisition-related costs are recognised as expenses in the periods in which the costs are incurred and the services are received.
Any contingent consideration to be transferred by the acquirer will be recognised at fair value at the acquisition date. Subsequent changes to the fair value of the contingent consideration which is deemed to be an asset or liability, will be recognised in profit or loss.
The Group elects for each individual business combination, whether non-controlling interest in the acquiree (if any), that are present ownership interests and entitle their holders to a proportionate share of net assets in the event of liquidation, is recognised on the acquisition date at fair value, or at the non-controlling interest’s proportionate share of the acquiree’s identifiable net assets. Other components of non-controlling interests are measured at their acquisition date fair value, unless another measurement basis is required by another FRS.
Any excess of the sum of the fair value of the consideration transferred in the business combination, the amount of non-controlling interest in the acquiree (if any), and the fair value of the Group’s previously held equity interest in the acquiree (if any), over the net fair value of the acquiree’s identifiable assets and liabilities is recorded as goodwill. The accounting policy for goodwill is set out in Note 2.11(a). In instances where the latter amount exceeds the former, the excess is recognised as gain on bargain purchase in profit or loss on the acquisition date.
Goodwill is initially measured at cost. Following initial recognition, goodwill is measured at cost less any accumulated impairment losses.
For the purpose of impairment testing, goodwill acquired in a business combination is, from the acquisition date, allocated to the Group’s cash-generating units that are expected to benefit from the synergies of the combination, irrespective of whether other assets or liabilities of the acquiree are assigned to those units.
NOTES TO THE FINANCIAL STATEMENTSFor the financial year ended 30 June 2015
AS
L M
arin
e H
old
ing
s Lt
d.
/Ann
ual R
epor
t 20
15
80
2. Summary of significant accounting policies (cont’d)
2.5 Basisofconsolidationandbusinesscombinations(cont’d)
(b) Business combinations and goodwill (cont’d)
The cash-generating units to which goodwill have been allocated is tested for impairment annually and whenever there is an indication that the cash-generating unit may be impaired. Impairment is determined for goodwill by assessing the recoverable amount of each cash-generating unit (or group of cash-generating units) to which the goodwill relates.
2.6 Transactions with non-controlling interests
Non-controlling interest represents the equity in subsidiaries not attributable, directly or indirectly, to owners of the Company.
Changes in the Company’s ownership interest in a subsidiary that do not result in a loss of control are accounted for as equity transactions. In such circumstances, the carrying amounts of the controlling and non-controlling interests are adjusted to reflect the changes in their relative interests in the subsidiary. Any difference between the amount by which the non-controlling interest is adjusted and the fair value of the consideration paid or received is recognised directly in equity and attributed to owners of the Company.
2.7 Subsidiaries
A subsidiary is an investee that is controlled by the Group. The Group controls an investee when it is exposed, or has rights, to the variable return from its involvement with the investee and has the ability to affect those returns through its power over the investee.
In the Company’s separate financial statements, investments in subsidiaries are accounted for at cost less impairment losses.
2.8 Joint arrangements A joint arrangement is a contractual arrangement whereby two or more parties have joint control. Joint control is the contractually agreed sharing of control of an arrangement, which exists only when decisions about the relevant activities require the unanimous consent of the parties sharing control.
A joint arrangement is classified either as joint operation or joint venture, based on the rights and obligations of the parties to the arrangement.
To the extent the joint arrangement provides the Group with rights to the assets and obligations for the liabilities relating to the arrangement, the arrangement is a joint operation. To the extent the joint arrangement provides the Group with rights to the net assets of the arrangement, the arrangement is a joint venture.
The Group recognises its interest in a joint venture as an investment and accounts for the investment using the equity method. The accounting policy for investment in joint ventures is set out in Note 2.9.
NOTES TO THE FINANCIAL STATEMENTSFor the financial year ended 30 June 2015
AS
L M
arin
e H
old
ing
s Lt
d.
/Ann
ual R
epor
t 20
15
81
2. Summary of significant accounting policies (cont’d)
2.9 Jointventuresandassociate
An associate is an entity over which the Group has the power to participate in the financial and operating policy decisions of the investee but does not have control or joint control of those policies.
The Group account for its investments in associates and joint ventures using the equity method from the date on which it becomes an associate or joint venture.
On acquisition of the investment, any excess of the cost of the investment over the Group’s share of the net fair value of the investee’s identifiable assets and liabilities is accounted as goodwill and is included in the carrying amount of the investment. Any excess of the Group’s share of the net fair value of the investee’s identifiable assets and liabilities over the cost of the investment is included as income in the determination of the entity’s share of the associate or joint venture’s profit or loss in the period in which the investment is acquired.
Under the equity method, the investment in associates or joint ventures are carried in the balance sheet at cost plus post-acquisition changes in the Group’s share of net assets of the associates or joint ventures. The profit or loss reflects the share of results of the operations of the associates or joint ventures. Distributions received from joint ventures or associates reduce the carrying amount of the investment. Where there has been a change recognised in other comprehensive income by the associates or joint ventures, the Group recognises its share of such changes in other comprehensive income. Unrealised gains and losses resulting from transactions between the Group and associate or joint venture are eliminated to the extent of the interest in the associates or joint ventures.
When the Group’s share of losses in an associate or joint venture equals or exceeds its interest in the associate or joint venture, the Group does not recognise further losses, unless it has incurred obligations or made payments on behalf of the associate or joint venture.
After application of the equity method, the Group determines whether it is necessary to recognise an additional impairment loss on the Group’s investment in associates or joint ventures. The Group determines at the end of each reporting period whether there is any objective evidence that the investment in the associate or joint venture is impaired. If this is the case, the Group calculates the amount of impairment as the difference between the recoverable amount of the associate or joint venture and its carrying value and recognises the amount in profit or loss.
The financial statements of the associates and joint ventures are prepared as the same reporting date as the Company. Where necessary, adjustments are made to bring the accounting policies in line with those of the Group.
In the Company’s separate financial statements, investments in joint ventures and associates are accounted for at cost less impairment losses.
NOTES TO THE FINANCIAL STATEMENTSFor the financial year ended 30 June 2015
AS
L M
arin
e H
old
ing
s Lt
d.
/Ann
ual R
epor
t 20
15
82
2. Summary of significant accounting policies (cont’d)
2.10 Property, plant and equipment
All items of property, plant and equipment are initially recorded at cost. Subsequent to recognition, property, plant and equipment are measured at cost less accumulated depreciation and any accumulated impairment losses. The cost includes the cost of replacing part of the property, plant and equipment and borrowing costs that are directly attributable to the acquisition, construction or production of a qualifying property, plant and equipment. The accounting policy for borrowing costs is set out in Note 2.19. The cost of an item of property, plant and equipment is recognised as an asset if, and only if, it is probable that future economic benefits associated with the item will flow to the Group and the cost of the item can be measured reliably.
Depreciation of an asset begins when it is available for use and is computed on a straight-line basis over the estimated useful lives of the assets as follows:
Leasehold property and buildings – 15 to 30 yearsDry docks, quays and ancillary – 8 to 20 yearsPlant and machinery – 3 to 30 yearsOffice equipment, furniture and fittings – 3 to 10 yearsVessels – 15 to 25 years Motor vehicles – 5 to 8 years
Vessels consist of tugs and other vessels and barges.
Assets under construction included in property, plant and equipment are not depreciated as these assets are not yet available for use.
The carrying values of property, plant and equipment are reviewed for impairment when events or changes in circumstances indicate that the carrying value may not be recoverable.
The residual value, useful life and depreciation method are reviewed at the end of each reporting period, and adjusted prospectively, if appropriate.
An item of property, plant and equipment is derecognised upon disposal or when no future economic benefits are expected from its use or disposal. Any gain or loss on derecognition of the asset is included in profit or loss in the year the asset is derecognised.
Fully depreciated assets are retained in the financial statements until they are no longer in use and no further charge for depreciation is made in respect of these assets.
2.11 Intangible assets
(a) Goodwill
Goodwill is initially measured at cost. Following initial recognition, goodwill is measured at cost less any accumulated impairment losses.
NOTES TO THE FINANCIAL STATEMENTSFor the financial year ended 30 June 2015
AS
L M
arin
e H
old
ing
s Lt
d.
/Ann
ual R
epor
t 20
15
83
2. Summary of significant accounting policies (cont’d)
2.11Intangibleassets(cont’d)
(a) Goodwill (cont’d)
For the purpose of impairment testing, goodwill acquired in a business combination is, from the acquisition date, allocated to each of the Group’s cash-generating units that are expected to benefit from the synergies of the combination, irrespective of whether other assets or liabilities of the acquiree are assigned to those units.
The cash-generating unit to which goodwill has been allocated is tested for impairment annually and whenever there is an indication that the cash-generating unit may be impaired. Impairment is determined for goodwill by assessing the recoverable amount of each cash-generating unit (or group of cash-generating units) to which the goodwill relates. Where the recoverable amount of the cash-generating unit is less than the carrying amount, an impairment loss is recognised in profit or loss. Impairment losses recognised for goodwill are not reversed in subsequent periods.
Where goodwill forms part of a cash-generating unit and part of the operation within that cash-generating unit is disposed of, the goodwill associated with the operation disposed of is included in the carrying amount of the operation when determining the gain or loss on disposal of the operation. Goodwill disposed of in this circumstance is measured based on the relative fair values of the operations disposed of and the portion of the cash-generating unit retained.
Goodwill and fair value adjustments arising on the acquisition of foreign operation are treated as assets and liabilities of the foreign operations and are recorded in the functional currency of the foreign operations and translated in accordance with the accounting policy set out in Note 2.4.
(b) Other intangible assets
Other intangible assets consist of patented technology, customer relationships, brand and order backlog.
Intangible assets acquired separately are measured initially at cost. The cost of intangible assets acquired in a business combination is their fair value as at the date of acquisition. Following initial acquisition, intangible assets are carried at cost less any accumulated amortisation and any accumulated impairment losses. Internally generated intangible assets, excluding capitalised development costs, are not capitalised and expenditure is reflected in profit or loss in the year in which the expenditure is incurred.
The useful lives of intangible assets are assessed as either finite or indefinite.
Intangible assets with finite useful lives are amortised over the estimated useful lives and assessed for impairment whenever there is an indication that the intangible asset may be impaired. The amortisation period and the amortisation method are reviewed at least at each financial year-end. Changes in the expected useful life or the expected pattern of consumption of future economic benefits embodied in the asset is accounted for by changing the amortisation period or method, as appropriate, and are treated as changes in accounting estimates.
NOTES TO THE FINANCIAL STATEMENTSFor the financial year ended 30 June 2015
AS
L M
arin
e H
old
ing
s Lt
d.
/Ann
ual R
epor
t 20
15
84
2. Summary of significant accounting policies (cont’d)
2.11Intangibleassets(cont’d)
(b) Other intangible assets (cont’d)
The amortisation expense on intangible assets with finite useful lives is recognised in profit or loss in the expense category consistent with the function of the intangible assets. Except for order backlog, which is amortised based on the pattern in which the asset’s future economic benefits are expected to be consumed, amortisation is calculated on a straight-line basis over the estimated useful lives of intangible assets as follows:
Patented technology – 15 yearsCustomer relationships – 25 yearsBrand – 5 years
Gains or losses arising from de-recognition of an intangible asset are measured as the difference between the net disposal proceeds and the carrying amount of the asset and are recognised in profit or loss when the asset is derecognised.
2.12 Lease prepayment
Leases of land under which the lessor has not transferred all the risks and rewards incidental to ownership are classified as operating leases and the payments made on acquiring the land-use right represent prepaid lease payments.
Lease prepayments for land-use right are initially measured at cost. Following initial recognition, they are amortised on a straight-line basis over the term of the respective lease.
2.13 Impairmentofnon-financialassets
The Group assesses at each reporting date whether there is an indication that an asset may be impaired. If any indication exists, or when annual impairment testing for an asset is required, the Group makes an estimate of the asset’s recoverable amount. An asset’s recoverable amount is the higher of an asset’s or cash-generating unit’s fair value less costs of disposal and its value in use and is determined for an individual asset, unless the asset does not generate cash inflows that are largely independent of those from other assets or groups of assets. Where the carrying amount of an asset or cash-generating unit exceeds its recoverable amount, the asset is considered impaired and is written down to its recoverable amount. In assessing value in use, the estimated future cash flows expected to be generated by the asset are discounted to their present value using a pre-tax discount rate that reflects current market assessments of the time value of money and the risks specific to the asset. In determining fair value less cost of disposal, recent market transactions are taken into account, if available. If no such transactions can be identified, an appropriate valuation model is used.
NOTES TO THE FINANCIAL STATEMENTSFor the financial year ended 30 June 2015
AS
L M
arin
e H
old
ing
s Lt
d.
/Ann
ual R
epor
t 20
15
85
2. Summary of significant accounting policies (cont’d)
2.13 Impairmentofnon-financialassets(cont’d)
The Group bases its impairment calculation on detailed budgets and forecast calculations which are prepared separately for each of the Group’s cash-generating units to which the individual assets are allocated. These budgets and forecast calculations generally covers a period of five years. For longer periods, a long-term growth rate is calculated and applied to project future cash flows after the fifth year.
Impairment losses of continuing operations are recognised in profit or loss in those expense categories consistent with the function of the impaired asset except for assets that are previously revalued where the revaluation was taken to other comprehensive income. In this case, the impairment is also recognised in other comprehensive income up to the amount of any previous revaluation. After the recognition of an impairment loss, the depreciation (amortisation) charge for the asset shall be adjusted in future periods to allocate the asset’s revised carrying amount, less its residual value (if any), on a systematic basis over its remaining useful life.
For assets excluding goodwill, an assessment is made at the end of each reporting period as to whether there is any indication that previously recognised impairment losses may no longer exist or may have decreased. If such indication exists, the Group estimates the asset’s or cash generating unit’s recoverable amount. A previously recognised impairment loss is reversed only if there has been a change in the estimates used to determine the asset’s recoverable amount since the last impairment loss was recognised. If that is the case, the carrying amount of the asset is increased to its recoverable amount. That increase cannot exceed the carrying amount that would have been determined, net of depreciation, had no impairment loss been recognised previously. Such reversal is recognised in profit or loss unless the asset is measured at revalued amount, in which case the reversal if treated as a revaluation increase. After such a reversal, the depreciation charge is adjusted in future periods to allocate the asset’s revised carrying amount, less any residual value, on a systematic basis over its remaining useful life.
2.14 Financial instruments
(a) Financial assets
Initial recognition and measurement
Financial assets are recognised when, and only when, the Group becomes a party to the contractual provisions of the financial instrument. The Group determines the classification of its financial assets at initial recognition.
When financial assets are recognised initially, they are measured at fair value, plus, in the case of financial assets not at fair value through profit or loss, directly attributable transaction costs.
NOTES TO THE FINANCIAL STATEMENTSFor the financial year ended 30 June 2015
AS
L M
arin
e H
old
ing
s Lt
d.
/Ann
ual R
epor
t 20
15
86
2. Summary of significant accounting policies (cont’d)
2.14 Financialinstruments(cont’d)
(a) Financial assets (cont’d)
Subsequent measurement
The subsequent measurement of financial assets depends on their classification as follows:
(i) Financialassetsatfairvaluethroughprofitorloss
Financial assets at fair value through profit or loss include financial assets held for trading. Financial assets are classified as held for trading if they are acquired for the purpose of selling or repurchasing in the near term. This category includes derivative financial instruments entered into by the Group that are not designated as hedging instruments in hedge relationships as defined by FRS 39. Derivatives, including separated embedded derivatives also classified as held for trading unless they are designated as effective hedging instruments.
Subsequent to initial recognition, financial assets at fair value through profit or loss are measured at fair value. Any gains or losses arising from changes in fair value of the financial assets are recognised in profit or loss. Net gains or net losses on financial assets at fair value through profit or loss include exchange differences, interest and dividend income.
(ii) Loansandreceivables
Non-derivative financial assets with fixed or determinable payments that are not quoted in an active market are classified as loans and receivables. Subsequent to initial recognition, loans and receivables are measured at amortised cost using the effective interest method, less impairment. Gains and losses are recognised in profit or loss when the loans and receivables are derecognised or impaired and through the amortisation process.
Derecognition
A financial asset is derecognised where the contractual right to receive cash flows from the asset has expired. On derecognition of a financial asset in its entirety, the difference between the carrying amount and the sum of the consideration received and any cumulative gain or loss that had been recognised in other comprehensive income is recognised in profit or loss.
Regular way purchase or sale of a financial asset
All regular way purchases and sales of financial assets are recognised or derecognised on the trade date i.e., the date that the Group commits to purchase or sell the asset. Regular way purchases or sales are purchases or sales of financial assets that require delivery of assets within the period generally established by regulation or convention in the marketplace concerned.
NOTES TO THE FINANCIAL STATEMENTSFor the financial year ended 30 June 2015
AS
L M
arin
e H
old
ing
s Lt
d.
/Ann
ual R
epor
t 20
15
87
2. Summary of significant accounting policies (cont’d)
2.14 Financialinstruments(cont’d)
(b) Financial liabilities
Initial recognition and measurement
Financial liabilities are recognised when, and only when, the Group becomes a party to the contractual provisions of the financial instrument. The Group determines the classification of its financial liabilities at initial recognition.
All financial liabilities are recognised initially at fair value plus in the case of financial liabilities not at fair value through profit or loss, directly attributable transaction costs.
Subsequent measurement
The measurement of financial liabilities depends on their classification as follows:
(i) Financialliabilitiesatfairvaluethroughprofitorloss
Financial liabilities at fair value through profit or loss include financial liabilities held for trading. Financial liabilities are classified as held for trading if they are acquired for the purpose of selling in the near term. This category includes derivative financial instruments entered into by the Group that are not designated as hedging instruments in hedge relationships. Separated embedded derivatives are also classified as held for trading unless they are designated as effective hedging instruments.
Subsequent to initial recognition, financial liabilities at fair value through profit or loss are measured at fair value. Any gains or losses arising from changes in fair value of the financial liabilities are recognised in profit or loss.
The Group has not designated any financial liabilities upon initial recognition at fair value through profit or loss.
(ii) Financialliabilitiesatamortisedcost
After initial recognition, financial liabilities that are not carried at fair value through profit or loss are subsequently measured at amortised cost using the effective interest rate method. Gains and losses are recognised in profit or loss when the liabilities are derecognised, and through the amortisation process.
Derecognition
A financial liability is derecognised when the obligation under the liability is discharged or cancelled or expires. When an existing financial liability is replaced by another from the same lender on substantially different terms, or the terms of an existing liability are substantially modified, such an exchange or modification is treated as a derecognition of the original liability and the recognition of a new liability, and the difference in the respective carrying amounts is recognised in profit or loss.
NOTES TO THE FINANCIAL STATEMENTSFor the financial year ended 30 June 2015
AS
L M
arin
e H
old
ing
s Lt
d.
/Ann
ual R
epor
t 20
15
88
2. Summary of significant accounting policies (cont’d)
2.14 Financialinstruments(cont’d)
(c) Offsetting of financial instruments
Financial assets and financial liabilities are offset and the net amount is presented in the balance sheets, when and only when, there is a current enforceable legal right to set off the recognised amounts and there is an intention to settle on a net basis, or to realise the assets and settle the liabilities simultaneously.
2.15 Cashandcashequivalents Cash and cash equivalents comprise cash at bank and on hand and demand deposits that are readily convertible to known amount of cash and which are subject to an insignificant risk of changes in value. These also include bank overdrafts that form an integral part of the Group’s cash management. Cash and cash equivalents carried in the statements of financial position are classified and accounted for as loans and receivables. The accounting policy for this category of financial assets is stated in Note 2.14(a)(ii).
2.16 Impairmentoffinancialassets
The Group assesses at each reporting date whether there is any objective evidence that a financial asset is impaired.
(a) Financial assets carried at amortised cost
For financial assets carried at amortised cost, the Group first assesses whether objective evidence of impairment exists individually for financial assets that are individually significant, or collectively for financial assets that are not individually significant. If the Group determines that no objective evidence of impairment exists for an individually assessed financial asset, whether significant or not, it includes the asset in a group of financial assets with similar credit risk characteristics and collectively assesses them for impairment. Assets that are individually assessed for impairment and for which an impairment loss is, or continues to be recognised are not included in a collective assessment of impairment. If there is objective evidence that an impairment loss on financial assets carried at amortised cost has been incurred, the amount of the loss is measured as the difference between the asset’s carrying amount and the present value of estimated future cash flows discounted at the financial asset’s original effective interest rate. If a loan has a variable interest rate, the discount rate for measuring any impairment loss is the current effective interest rate. The carrying amount of the asset is reduced through the use of an allowance account. The impairment loss is recognised in profit or loss.
NOTES TO THE FINANCIAL STATEMENTSFor the financial year ended 30 June 2015
AS
L M
arin
e H
old
ing
s Lt
d.
/Ann
ual R
epor
t 20
15
89
2. Summary of significant accounting policies (cont’d)
2.16 Impairmentoffinancialassets(cont’d)
(a) Financial assets carried at amortised cost (cont’d)
When the asset becomes uncollectible, the carrying amount of impaired financial assets is reduced directly or if an amount was charged to the allowance account, the amounts charged to the allowance account are written off against the carrying value of the financial asset.
To determine whether there is objective evidence that an impairment loss on financial assets has been incurred, the Group considers factors such as the probability of insolvency or significant financial difficulties of the debtor and default or significant delay in payments.
If in a subsequent period, the amount of the impairment loss decreases and the decrease can be related objectively to an event occurring after the impairment was recognised, the previously recognised impairment loss is reversed to the extent that the carrying value of the asset does not exceed its amortised cost at the reversal date. The amount of reversal is recognised in profit or loss.
(b) Financial assets carried at cost
If there is objective evidence (such as significant adverse changes in the business environment where the issuer operates, probability of insolvency or significant financial difficulties of the issuer) that an impairment loss on financial assets carried at cost had been incurred, the amount of the loss is measured as the difference between the asset’s carrying amount and the present value of estimated future cash flows discounted at the current market rate of return for a similar financial asset. Such impairment losses are not reversed in subsequent periods.
2.17 Inventories
Raw materials consist mainly of steel, consumables and other materials used for shipbuilding and shiprepair and conversion. Finished goods consist of component parts for trading purposes. These inventories are determined on a first-in-first-out basis and include all cost in bringing the stocks to their present location and condition. Net realisable value is the estimated selling price in the ordinary course of business less estimated costs of completion and the estimated costs necessary to make the sale, and after making due allowance for all damaged, obsolete and slow-moving items.
Work-in-progress comprises uncompleted shipbuilding projects. It is stated at the lower of cost and net realisable value. Cost is made up of material, direct labour, subcontractors’ costs, appropriate allocation of fixed and variable production overheads and other directly related expenses. Provision is made for anticipated losses, if any, on work-in progress when the possibility of loss is ascertained.
NOTES TO THE FINANCIAL STATEMENTSFor the financial year ended 30 June 2015
AS
L M
arin
e H
old
ing
s Lt
d.
/Ann
ual R
epor
t 20
15
90
2. Summary of significant accounting policies (cont’d)
2.18 Construction contracts
The Group principally operates fixed price contracts. Contract revenue and contract costs are recognised as revenue and expenses respectively by reference to the stage of completion of the contract activity at the end of the reporting period (the percentage of completion method), when the outcome of a construction contract can be estimated reliably.
The outcome of a construction contract can be estimated reliably when: (i) total contract revenue can be measured reliably; (ii) it is probable that the economic benefits associated with the contract will flow to the entity; (iii) the costs to complete the contract and the stage of completion can be measured reliably; and (iv) the contract costs attributable to the contract can be clearly identified and measured reliably so that actual contract costs incurred can be compared with prior estimates.
When the outcome of a construction contract cannot be estimated reliably (principally during early stages of a contract), contract revenue is recognised only to the extent of contract costs incurred that are likely to be recoverable and contract costs are recognised as expense in the period in which they are incurred.
An expected loss on the construction contract is recognised as an expense immediately when it is probable that total contract costs will exceed total contract revenue.
In applying the percentage of completion method, revenue recognised corresponds to the total contract revenue (as defined below) multiplied by the actual completion rate based on the proportion of total contract costs (as defined below) incurred to date to the estimated costs to complete.
Contract revenue - Contract revenue corresponds to the initial amount of revenue agreed in the contract and any variations in the contract work and claims to the extent that it is probable that they will result in revenue, and they can be reliably measured. A variation or a claim is recognised as contract revenue when it is probable that the customer will approve the variation or negotiations have reached an advanced stage such that it is probable that the customer will accept the claim.
Contract costs - Contract costs include costs that relate directly to the specific contract and costs that are attributable to contract activity in general and can be allocated to the contract. Costs that relate directly to a specific contract comprise: site labour costs (including site supervision); costs of materials used in construction; depreciation of equipment used on the contract; costs of design, and technical assistance that is directly related to the contract.
At the end of each reporting period, the aggregated costs incurred plus recognised profit (less recognised loss) on each contract is compared against the progress billings. Where costs incurred plus the recognised profits (less recognised losses) exceed progress billings, the balance is presented as construction work-in-progress. Where progress billings exceed costs incurred plus recognised profits (less recognised losses), the balance is presented as progress billings in excess of construction in work-in-progress.
NOTES TO THE FINANCIAL STATEMENTSFor the financial year ended 30 June 2015
AS
L M
arin
e H
old
ing
s Lt
d.
/Ann
ual R
epor
t 20
15
91
2. Summary of significant accounting policies (cont’d)
2.19 Borrowing costs
Borrowing costs are capitalised as part of the cost of a qualifying asset if they are directly attributable to the acquisition, construction or production of that asset. Capitalisation of borrowing costs commences when the activities to prepare the asset for its intended use or sale are in progress and the expenditures and borrowing costs are incurred. Borrowing costs are capitalised until the assets are substantially completed for their intended use or sale. All other borrowing costs are expensed in the period they occur. Borrowing costs consist of interest and other costs that an entity incurs in connection with the borrowing of funds.
2.20Provisions
(a) General
Provisions are recognised when the Group has a present obligation (legal or constructive) as a result of a past event, it is probable that an outflow of resources embodying economic benefits will be required to settle the obligation and the amount of the obligation can be estimated reliably.
Provisions are reviewed at the end of each reporting period and adjusted to reflect the current best estimate. If it is no longer probable that an outflow of economic resources will be required to settle the obligation, the provision is reversed. If the effect of the time value of money is material, provisions are discounted using a current pre-tax rate that reflects, where appropriate, the risks specific to the liability. Where discounting is used, the increase in the provision due to the passage of time is recognised as finance cost.
(b) Provision for liquidated damages
Provision for liquidated damages is made in respect of anticipated claims from customers on contracts of which deadlines are overdue or not expected to be completed on time in accordance with contractual obligations. The utilisation of provisions is dependent on the timing of claims.
(c) Provision for warranty
Provision for warranty represents the best estimate of the Group’s liability to repair vessels or replace affected parts during the warranty period. The provision is calculated based on past experience of the level of repairs and returns.
2.21Employeebenefits
(a) Defined contribution plans
The Group participates in the national pension schemes as defined by the laws of the countries in which it has operations. In particular, the Singapore companies in the Group make contributions to Central Provident Fund scheme in Singapore, a defined contribution pension scheme. Contributions to defined contribution pension schemes are recognised as an expense in the period in which the related service is performed.
NOTES TO THE FINANCIAL STATEMENTSFor the financial year ended 30 June 2015
AS
L M
arin
e H
old
ing
s Lt
d.
/Ann
ual R
epor
t 20
15
92
2. Summary of significant accounting policies (cont’d)
2.21 Employeebenefits(cont’d)
(b) Defined benefit plan
The net defined benefit liability or asset is the aggregate of the present value of the defined benefit obligation at the end of the reporting period reduced by the fair value of plan assets (if any), adjusted for any effect of limiting a net defined benefit asset to the asset ceiling. The asset ceiling is the present value of any economic benefits available in the form of refunds from the plan or reductions in future contributions to the plan.
The cost of providing benefits under the defined benefit plans is determined separately for each plan using the projected unit credit method.
Defined benefit costs comprise the following:- Service cost- Net interest on the net defined benefit liability or asset- Remeasurements of net defined benefit liability or asset
Service costs which include current service costs, past service costs and gains or losses on non-routine settlements are recognised as expense in profit or loss. Past service costs are recognised when plan amendment or curtailment occurs.
Net interest on the net defined benefit liability or asset is the change during the period in the net defined benefit liability or asset that arises from the passage of time which is determined by applying the discount rate based on high quality corporate bonds to the net defined benefit liability or asset. Net interest on the net defined benefit liability or asset is recognised as expense or income in profit or loss.
Remeasurements comprising actuarial gains and losses are recognised immediately in other comprehensive income in the period in which they arise. Remeasurements are recognised in retained earnings within equity and are not reclassified to profit or loss in subsequent periods.
The Group’s right to be reimbursed of some or all of the expenditure required to settle a defined benefit obligation is recognised as a separate asset at fair value when and only when reimbursement is virtually certain.
(c) Employee leave entitlements
Employee entitlements to annual leave are recognised as a liability when they are accrued to the employees. The undiscounted liability for leave expected to be settled wholly before twelve months after the end of the reporting period is recognised for services rendered by employees up to the end of the reporting period.
NOTES TO THE FINANCIAL STATEMENTSFor the financial year ended 30 June 2015
AS
L M
arin
e H
old
ing
s Lt
d.
/Ann
ual R
epor
t 20
15
93
2. Summary of significant accounting policies (cont’d)
2.21 Employeebenefits(cont’d)
(d) Employee share option plans
Employees (including non-executive Directors) of the Group and of the Company receive remuneration in the form of share options as consideration for services rendered. The cost of these equity-settled share based payment transactions with employees is measured by reference to the fair value of the options at the date on which the share options are granted which takes into account market conditions and non-vesting conditions. This cost is recognised in profit or loss, with a corresponding increase in the employee share option reserve, over the vesting period. The cumulative expense recognised for equity-settled transactions at the end of each reporting period until the vesting date reflects the extent to which the vesting period has expired and the Group’s best estimate of the number of options that will ultimately vest. The charge or credit to profit or loss for a period represents the movement in cumulative expense recognised as at the beginning and end of that period and is recognised in employee benefits expense.
No expense is recognised for options that do not ultimately vest, except for options where vesting is conditional upon a market or non-vesting condition, which are treated as vested irrespective of whether or not the market condition or non-vesting condition is satisfied, provided that all other performance and/or service conditions are satisfied. In the case where the option does not vest as the result of a failure to meet a non-vesting condition that is within the control of the Group or the employee, it is accounted for as a cancellation. In such case, the amount of the compensation cost that otherwise would be recognised over the remainder of the vesting period is recognised immediately in profit or loss upon cancellation.
The employee share option reserve is transferred to retained earnings upon expiry of the share options. When the options are exercised, the employee share option reserve is transferred to share capital if new shares are issued.
2.22 Leases
(a) As lessee
Finance leases which transfer to the Group substantially all the risks and rewards incidental to ownership of the leased item, are capitalised at the inception of the lease at the fair value of the leased asset or, if lower, at the present value of the minimum lease payments. Any initial direct costs are also added to the amount capitalised. Lease payments are apportioned between the finance charges and reduction of the lease liability so as to achieve a constant rate of interest on the remaining balance of the liability. Finance charges are charged to profit or loss. Contingent rents, if any, are charged as expenses in the periods in which they are incurred.
Capitalised leased assets are depreciated over the shorter of the estimated useful life of the asset and the lease term, if there is no reasonable certainty that the Group will obtain ownership by the end of the lease term.
NOTES TO THE FINANCIAL STATEMENTSFor the financial year ended 30 June 2015
AS
L M
arin
e H
old
ing
s Lt
d.
/Ann
ual R
epor
t 20
15
94
2. Summary of significant accounting policies (cont’d)
2.22 Leases(cont’d)
(a) As lessee (cont’d)
Operating lease payments are recognised as an expense in profit or loss on a straight-line basis over the lease term. The aggregate benefit of incentives provided by the lessor is recognised as a reduction of rental expense over the lease term on a straight-line basis.
(b) As lessor
Leases where the Group retains substantially all the risks and rewards of the ownership of the asset are classified as operating leases. Initial direct costs incurred in negotiating an operating lease are added to the carrying amount of the leased assets and are recognised over the lease term on the same basis as rental income. The accounting policy for rental income is set out in Note 2.23(c).
2.23 Revenue
Revenue is recognised to the extent that it is probable that the economic benefits will flow to the Group and the revenue can be reliably measured, regardless of when the payment is made. Revenue is measured at the fair value of consideration received or receivable, taking into account contractually defined terms of payment and excluding taxes or duty. The Group assess its revenue arrangements to determine if it is acting as principal or agent. The following specific recognition criteria must also be met before revenue is recognised:
(a) Shipbuilding and Engineering
Revenue from shipbuilding contracts and engineering contracts is recognised by reference to the percentage of completion at the end of the reporting period. The percentage of completion is measured by reference to the percentage of total costs incurred for work performed to date to estimated total costs for the contract. Where the outcome of a contract cannot be estimated reliably, revenue is recognised only to the extent of contract costs incurred that are likely to be recoverable.
(b) Shiprepair and conversion
Revenue from fabrication and outfitting works and conversion jobs and shiprepair contracts are recognised upon completion of work.
(c) Shipchartering and rental
Shipchartering revenue and rental income are recognised on a time proportion basis.
NOTES TO THE FINANCIAL STATEMENTSFor the financial year ended 30 June 2015
AS
L M
arin
e H
old
ing
s Lt
d.
/Ann
ual R
epor
t 20
15
95
2. Summary of significant accounting policies (cont’d)
2.23 Revenue(cont’d)
(d) Sale of goods
Revenue from sale of goods is recognised upon the transfer of significant risk and rewards of ownership of the goods to the customer, usually on delivery of goods. Revenue is not recognised to the extent where there are significant uncertainties regarding recovery of the consideration due, associated costs or the possible return of goods.
(e) Interest income
Interest income is recognised using the effective interest method.
(f) Dividend income
Dividend income is recognised when the Group’s right to receive payment is established.
2.24 Taxes
(a) Current income tax
Current income tax assets and liabilities for the current and prior periods are measured at the amount expected to be recovered from or paid to the taxation authorities. The tax rates and tax laws used to compute the amount are those that are enacted or substantively enacted at the end of the reporting period, in the countries where the Group operates and generates taxable income.
Current income taxes are recognised in profit or loss except to the extent that the tax relates to items recognised outside profit or loss, either in other comprehensive income or directly in equity. Management periodically evaluates positions taken in the tax returns with respect to situations in which applicable tax regulations are subject to interpretation and establishes provisions where appropriate.
(b) Deferred tax Deferred tax is provided using the liability method on temporary differences at the end of the reporting period between the tax bases of assets and liabilities and their carrying amounts for financial reporting purposes. Deferred tax liabilities are recognised for all temporary differences, except: • where the deferred tax liability arises from the initial recognition of goodwill or
of an asset or liability in a transaction that is not a business combination and, at the time of the transaction, affects neither the accounting profit nor taxable profit or loss; and
NOTES TO THE FINANCIAL STATEMENTSFor the financial year ended 30 June 2015
AS
L M
arin
e H
old
ing
s Lt
d.
/Ann
ual R
epor
t 20
15
96
2. Summary of significant accounting policies (cont’d)
2.24 Taxes(cont’d)
(b) Deferred tax (cont’d)
• in respect of taxable temporary differences associated with investments in subsidiaries, associates and interests in joint ventures, where the timing of the reversal of the temporary differences can be controlled and it is probable that the temporary differences will not reverse in the foreseeable future.
Deferred tax assets are recognised for all deductible temporary differences, the carry forward of unused tax credits and unused tax losses, to the extent that it is probable that taxable profit will be available against which the deductible temporary differences, and the carry forward of unused tax credits and unused tax losses can be utilised except:
• where the deferred tax asset relating to the deductible temporary difference
arises from the initial recognition of an asset or liability in a transaction that is not a business combination and, at the time of the transaction, affects neither the accounting profit nor taxable profit or loss; and
• in respect of deductible temporary differences associated with investments in
subsidiaries, associates and interests in joint ventures, deferred tax assets are recognised only to the extent that it is probable that the temporary differences will reverse in the foreseeable future and taxable profit will be available against which the temporary differences can be utilised.
The carrying amount of deferred tax assets is reviewed at the end of each reporting period and reduced to the extent that it is no longer probable that sufficient taxable profit will be available to allow all or part of the deferred tax asset to be utilised. Unrecognised deferred tax assets are reassessed at the end of each reporting period and are recognised to the extent that it has become probable that future taxable profit will allow the deferred tax asset to be recovered.
Deferred tax assets and liabilities are measured at the tax rates that are expected to apply in the year when the asset is realised or the liability is settled, based on tax rates (and tax laws) that have been enacted or substantively enacted at the end of each reporting period.
Deferred tax relating to items recognised outside profit or loss is recognised outside profit or loss. Deferred tax items are recognised in correlation to the underlying transaction either in other comprehensive income or directly in equity and deferred tax arising from a business combination is adjusted against goodwill on acquisition.
Deferred tax assets and deferred tax liabilities are offset, if a legally enforceable right exists to set off current income tax assets against current income tax liabilities and the deferred taxes relate to the same taxable entity and the same taxation authority.
NOTES TO THE FINANCIAL STATEMENTSFor the financial year ended 30 June 2015
AS
L M
arin
e H
old
ing
s Lt
d.
/Ann
ual R
epor
t 20
15
97
2. Summary of significant accounting policies (cont’d)
2.24 Taxes(cont’d)
(b) Deferred tax (cont’d)
Tax benefits acquired as part of a business combination, but not satisfying the criteria for separate recognition at that date, would be recognised subsequently if new information about facts and circumstances changed. The adjustment would either be treated as a reduction to goodwill (as long as it does not exceed goodwill) if it is incurred during the measurement period or in profit or loss.
(c) Sales tax Revenues, expenses and assets are recognised net of the amount of sales tax except: • where the sales tax incurred on a purchase of assets or services is not
recoverable from the taxation authority, in which case the sales tax is recognised as part of the cost of acquisition of the asset or as part of the expense item as applicable; and
• receivables and payables that are stated with the amount of sales tax included.
The net amount of sales tax recoverable from, or payable to, the taxation authority is included as part of receivables or payables in the statements of financial position.
2.25 Hedge accounting
The Group applies hedge accounting for certain hedging relationships which qualify for hedge accounting.
For purposes of hedge accounting, hedges are classified as • Fair value hedges when hedging the exposure to changes in the fair value of a
recognised asset or liability or an unrecognised firm commitment, that is attributable to a particular risk and could affect profit or loss; or
• Cash flow hedges when hedging exposure to variability in cash flows that is either attributable to a particular risk associated with a recognised asset or liability or a highly probable forecast transaction and could affect profit or loss.
At the inception of a hedge relationship, the Group formally designates and documents the hedge relationship to which the Group wishes to apply hedge accounting and the risk management objective and strategy for undertaking the hedge. The documentation includes identification of the hedging instrument, the hedged item or transaction, the nature of the risk being hedged and how the entity will assess the effectiveness of the changes in the hedging instrument’s fair value in offsetting the exposure to changes in the hedged item’s fair value or cash flows attributable to the hedged risk.
NOTES TO THE FINANCIAL STATEMENTSFor the financial year ended 30 June 2015
AS
L M
arin
e H
old
ing
s Lt
d.
/Ann
ual R
epor
t 20
15
98
2. Summary of significant accounting policies (cont’d)
2.25 Hedgeaccounting(cont’d)
Such hedges are expected to be highly effective in achieving offsetting changes in fair value or cash flows and are assessed on an ongoing basis to determine that they actually have been highly effective throughout the financial reporting periods for which they were designated.
Hedges which meet the strict criteria for hedge accounting are accounted as follows:
(a) Fair value hedges
The change in the fair value of a hedging derivative is recognised in profit or loss in finance costs. The change in the fair value of the hedged item attributable to the risk hedged is recorded as a part of the carrying value of the hedged item and is also recognised in profit or loss in finance costs.
For fair value hedges relating to items carried at amortised cost, the adjustment to carrying value is amortised through the profit or loss over the remaining term to maturity using the effective interest rate method.
Effective interest rate amortisation may begin as soon as an adjustment exists but no later than when the hedged item ceases to be adjusted for changes in its fair value attributable to the risk being hedged. If the hedged item is derecognised, the unamortised fair value is recognised immediately in profit or loss.
When an unrecognised firm commitment is designated as a hedged item, the subsequent cumulative change in the fair value of the firm commitment attributable to the hedged risk is recognised as an asset or liability with a corresponding gain or loss recognised in profit or loss.
The Group discontinues fair value hedge accounting if the hedging instrument expires or is sold, terminated or exercised, the hedge no longer meets the criteria for hedge accounting or the Group revokes the designation. Any adjustment to the carrying amount of a hedged financial instrument for which the effective interest method is used is amortised to profit or loss. The group has interest rate swap that is used as a hedge for the exposure of changes in the fair value of the floating rate portion of its secured loans. See Note 12 (ii) for more details.
(b) Cash flow hedges
The effective portion of the gain or loss on the hedging instrument is recognised directly in other comprehensive income in the hedging reserve, while any ineffective portion is recognised immediately in profit or loss in other expenses.
Amounts recognised as other comprehensive income are transferred to profit or loss when the hedged transaction affects profit or loss, such as when hedged financial income or financial expense is recognised or when a forecast sale or purchase occurs. Where the hedged item subsequently results in the recognition of a non-financial asset or liability, the amounts recognised as other comprehensive income are transferred to the initial carrying amount of the non-financial asset or liability.
NOTES TO THE FINANCIAL STATEMENTSFor the financial year ended 30 June 2015
AS
L M
arin
e H
old
ing
s Lt
d.
/Ann
ual R
epor
t 20
15
99
2. Summary of significant accounting policies (cont’d)
2.25 Hedgeaccounting(cont’d)
(b) Cash flow hedges (cont’d)
If the forecast transaction or firm commitment is no longer expected to occur, the cumulative gain or loss recognised in other comprehensive income are transferred to profit or loss. If the hedging instrument expires or is sold, terminated or exercised without replacement or rollover, or if its designation as a hedge is revoked, any cumulative gain or loss previously recognised in other comprehensive income remains in other comprehensive income until the forecast transaction occurs or firm commitment affects profit or loss.
The Group uses forward currency contracts as hedges of its exposure to foreign currency risk in its future anticipated income and expenditure. Refer to the Note 12(i) for more details.
2.26 Segment reporting
For management purposes, the Group is organised into operating segments based on their products and services. The segment results are regularly reviewed by management in order to allocate resources to the segments and to assess the segment performance. Additional disclosures on each of these segments are shown in Note 36, including the factors used to identify the reportable segments and the measurement basis of segment information.
2.27 Share capital and share issuance expenses
Proceeds from issuance of ordinary shares are recognised as share capital in equity. Incremental costs directly attributable to the issuance of ordinary shares are deducted against share capital.
2.28 Treasury shares
The Group’s own equity instruments, which are reacquired (treasury shares) are recognised at cost and deducted from equity. No gain or loss is recognised in profit or loss on the purchase, sale, issue or cancellation of the Group’s own equity instruments. Any difference between the carrying amount of treasury shares and the consideration received, if reissued, is recognised directly in equity. Voting rights related to treasury shares are nullified for the Group and no dividends are allocated to them respectively.
2.29 Contingencies
A contingent liability is:
(a) a possible obligation that arises from past events and whose existence will be confirmed only by the occurrence or non-occurrence of one or more uncertain future events not wholly within the control of the Group; or
NOTES TO THE FINANCIAL STATEMENTSFor the financial year ended 30 June 2015
AS
L M
arin
e H
old
ing
s Lt
d.
/Ann
ual R
epor
t 20
15
100
2. Summary of significant accounting policies (cont’d)
2.29 Contingencies(cont’d)
(b) a present obligation that arises from past events but is not recognised because:
(i) It is not probable that an outflow of resources embodying economic benefits will be required to settle the obligation; or
(ii) The amount of the obligation cannot be measured with sufficient reliability.
A contingent asset is a possible asset that arises from past events and whose existence will be confirmed only by the occurrence or non-occurrence of one or more uncertain future events not wholly within the control of the Group.
Contingent liabilities and assets are not recognised in the statement of financial position of the Group, except for contingent liabilities assumed in a business combination that are present obligations and which the fair values can be reliably determined.
2.30 Related parties
A related party is defined as follows:
(a) A person or a close member of that person’s family is related to the Group and Company if that person:
(i) Has control or joint control over the Company;
(ii) Has significant influence over the Company; or
(iii) Is a member of the key management personnel of the Group or Company or of a parent of the Company.
(b) An entity is related to the Group and the Company if any of the following conditions applies:
(i) The entity and the Company are members of the same group (which means that each parent, subsidiary and fellow subsidiary is related to the others).
(ii) One entity is an associate or joint venture of the other entity (or an associate or joint venture of a member of a group of which the other entity is a member).
(iii) Both entities are joint ventures of the same third party.
(iv) One entity is a joint venture of a third entity and the other entity is an associate of the third entity.
(v) The entity is a post-employment benefit plan for the benefit of employees of either the Company or an entity related to the Company. If the Company is itself such a plan, the sponsoring employers are also related to the Company.
NOTES TO THE FINANCIAL STATEMENTSFor the financial year ended 30 June 2015
AS
L M
arin
e H
old
ing
s Lt
d.
/Ann
ual R
epor
t 20
15
101
2. Summary of significant accounting policies (cont’d)
2.30 Relatedparties(cont’d)
(b) An entity is related to the Group and the Company if any of the following conditions applies: (cont’d)
(vi) The entity is controlled or jointly controlled by a person identified in (a).
(vii) A person identified in (a) (i) has significant influence over the entity or is a member of the key management personnel of the entity (or of a parent of the entity).
3. Significant accounting judgements and estimates
The preparation of the Group’s consolidated financial statements requires management to make judgements, estimates and assumptions that affect the reported amounts of revenues, expenses, assets and liabilities, and the disclosure of contingent liabilities at the end of each reporting period. These are assessed on an on-going basis and are based on experience and relevant factors, including expectations of future events that are believed to be reasonable under the circumstances. However, uncertainty about these assumptions and estimates could result in outcomes that require a material adjustment to the carrying amount of the asset or liability affected in the future periods.
3.1 Judgements made in applying accounting policies
In the process of applying the Group’s accounting policies, management has made the following judgements, which have the most significant effect on the amounts recognised in the consolidated financial statements:
Determination of functional currency
The Group measures foreign currency transactions in the respective functional currencies of the Company and its subsidiaries. In determining the functional currencies of the entities in the Group, judgement is required to determine the currency that mainly influences sales prices for goods and services and of the country whose competitive forces and regulations mainly determines the sales prices of its goods and services. The functional currencies of the entities in the Group are determined based on management’s assessment of the economic environment in which the entities operate and the entities’ process of determining sales prices.
3.2 Key sources of estimation uncertainty
The key assumptions concerning the future and other key sources of estimation uncertainty at the end of each reporting period are discussed below. The Group based its assumptions and estimates on parameters available when the financial statements were prepared. Existing circumstances and assumptions about future developments, however, may change due to market changes or circumstances arising beyond the control of the Group. Such changes are reflected in the assumption when they occur.
NOTES TO THE FINANCIAL STATEMENTSFor the financial year ended 30 June 2015
AS
L M
arin
e H
old
ing
s Lt
d.
/Ann
ual R
epor
t 20
15
102
3. Significant accounting judgements and estimates (cont’d)
3.2 Keysourcesofestimationuncertainty(cont’d)
(a) Useful lives of property, plant and equipment
The cost of property, plant and equipment is depreciated on a straight-line basis over their estimated economic useful lives. Management estimates the useful lives of these property, plant and equipment to be within 3 to 30 years. These are common life expectancies applied in the shipping industry. Changes in the expected level of usage and technological developments could impact the economic useful lives and the residual values of these assets, therefore future depreciation charges could be revised. The carrying amount of the Group’s property, plant and equipment is disclosed in Note 4.
Based on management’s estimates, a 5% difference in the expected useful lives of these assets would result in less than $2,363,000 (2014: less than $2,021,000) variance in the Group’s profit before tax for the financial year.
(b) Impairment of property, plant and equipment
The Group determines the recoverable amount of an asset or cash-generating unit based on the higher of its fair value less costs to sell and its value in use. When value in use calculation is undertaken, management estimates the expected future cash flows from the asset or cash-generating unit by applying a suitable discount rate to calculate the present value of those cash flows. When fair value less costs to sell is used, management engages the services of professional valuers to determine the fair values using valuation techniques which involve the use of estimates and assumptions which are reflective of current market conditions. The carrying amount of the Group’s property, plant and equipment is disclosed in Note 4.
(c) Useful lives of intangible assets
Intangible assets with definite useful lives are amortised on a straight-line basis over their estimated economic useful lives. Management estimates the useful lives of those intangible assets to be within 1 to 25 years. Changes in the expected returns of the intangible assets and technological development could impact the economic useful lives and the residual values of these intangible assets, therefore future amortisation charges could be revised.
Based on management’s estimates, a 5% difference in the expected useful lives of these assets would result in less than $41,000 (2014: less than $60,000) variance in the Group’s profit before tax for the financial year.
(d) Impairment of goodwill and intangible assets
Goodwill and intangible assets which are allocated to the same cash generating unit (“CGU”) are tested for impairment annually. The Group estimates the value in use if the CGU to where the goodwill and intangible assets is allocated. Estimating the value regulates the Group to make an estimate of the expected future cash flow from the call and also to choose a suitable discount rate in order to calculate the present value of those cash flows.
NOTES TO THE FINANCIAL STATEMENTSFor the financial year ended 30 June 2015
AS
L M
arin
e H
old
ing
s Lt
d.
/Ann
ual R
epor
t 20
15
103
3. Significant accounting judgements and estimates (cont’d)
3.2 Keysourcesofestimationuncertainty(cont’d)
(d) Impairment of goodwill and intangible assets (cont’d)
The impairment tests are sensitive to growth rate. Changes in these assumptions may result in changes in recoverable amounts. If management’s estimate of the forecasted growth rate to extrapolate cash flow projections beyond the five-year period decreased by a compound annual growth rate of 0.5% (2014: 1.5%), the recoverable amount would be reduced by $689,000 (2014: $195,000).
(e) Impairment of loans and receivables
The Group assesses at the end of each reporting period whether there is any objective evidence that a financial asset is impaired. To determine whether there is objective evidence of impairment, the Group considers factors such as the probability of insolvency or significant financial difficulties of the debtor and default or significant delay in payments.
Where there is objective evidence of impairment, the amount and timing of future cash flows are estimated based on historical loss experience for assets with similar credit risk characteristics. The carrying amount of the Group’s loans and receivables as at 30 June 2015 was $303,703,000 (2014: $349,363,000).
(f) Construction contracts
The Group recognises contract revenue by reference to the stage of completion of the contract activity at the end of each reporting period, when the outcome of a construction contract can be estimated reliably. The stage of completion is measured by reference to the proportion that contract costs incurred for work performed to date to the estimated total contract costs. Significant assumptions are required to estimate the total contract costs that will affect the stage of completion. In making these estimates, management has relied on its past experience and knowledge.
The carrying amounts of assets and liabilities arising from construction contracts at the end of each reporting period are disclosed in Note 10 to the financial statements. If the estimated total contract cost had been 5% higher than management estimate, the carrying amount of the assets and liabilities arising from construction contracts would have been $1,217,000 (2014: $18,475,000) lower and $436,000 (2014: $126,000) higher respectively. If the estimated total contract cost had been 5% lower than management estimate, the carrying amount of the assets and liabilities arising from construction contracts would have been $476,000 (2014: $21,441,000) higher and $1,422,000 (2014: $594,000) lower respectively.
Total contract revenue includes an estimation of the value of variation works amounting to $Nil (2014: $2,503,000) was taken into consideration in arriving at the estimated revenue of construction contracts. Any shortfall in recovery of this estimate will impact the results of the Group by the same quantum.
NOTES TO THE FINANCIAL STATEMENTSFor the financial year ended 30 June 2015
AS
L M
arin
e H
old
ing
s Lt
d.
/Ann
ual R
epor
t 20
15
104
3. Significant accounting judgements and estimates (cont’d)
3.2 Keysourcesofestimationuncertainty(cont’d)
(g) Income taxes
Uncertainties exist with respect to the interpretation of complex tax regulations and the amount and timing of future taxable income. Given the wide range of international business relationships and the long-term nature and complexity of existing contractual agreements, differences arising between the actual results and the assumptions made, or future changes to such assumptions, could necessitate future adjustments to tax provisions already recorded.
The Group establishes provisions, based on reasonable estimates, for possible consequences of audits by the tax authorities of the respective countries in which it operates. The amount of such provisions is based on various factors, such as experience of previous tax audits and differing interpretations of tax regulations by the taxable entity and the relevant tax authority. Such differences of interpretation may arise on a wide variety of issues depending on the conditions prevailing in the respective Group company’s domicile.
Deferred tax assets are recognised for all unused tax losses to the extent that it is probable that taxable profit will be available against which the losses can be utilised. Significant management judgement is required to determine the amount of deferred tax assets that can be recognised, based upon the likely timing and level of future taxable profits together with future tax planning strategies.
The carrying amount of the Group’s income tax payables and deferred tax liabilities at 30 June 2015 was $2,390,000 (2014: $4,160,000) and $17,075,000 (2014: $16,570,000) respectively.
(h) Employee benefits
The costs of defined benefit pension plans and the present value of the pension obligations are determined using actuarial valuations. The actuarial valuation involved making various assumptions which includes the determination of the discount rates, future salary increases, mortality age and future pension increases. Due to the complexity of the valuation, the underlying assumptions and its long-term nature, defined benefit obligations are sensitive to changes in these assumptions. All assumptions are reviewed at each reporting date. The net benefit liability as at 30 June 2015 is $3,242,000 (2014: $3,648,000). Further details are provided in Note 19.
NOTES TO THE FINANCIAL STATEMENTSFor the financial year ended 30 June 2015
AS
L M
arin
e H
old
ing
s Lt
d.
/Ann
ual R
epor
t 20
15
105
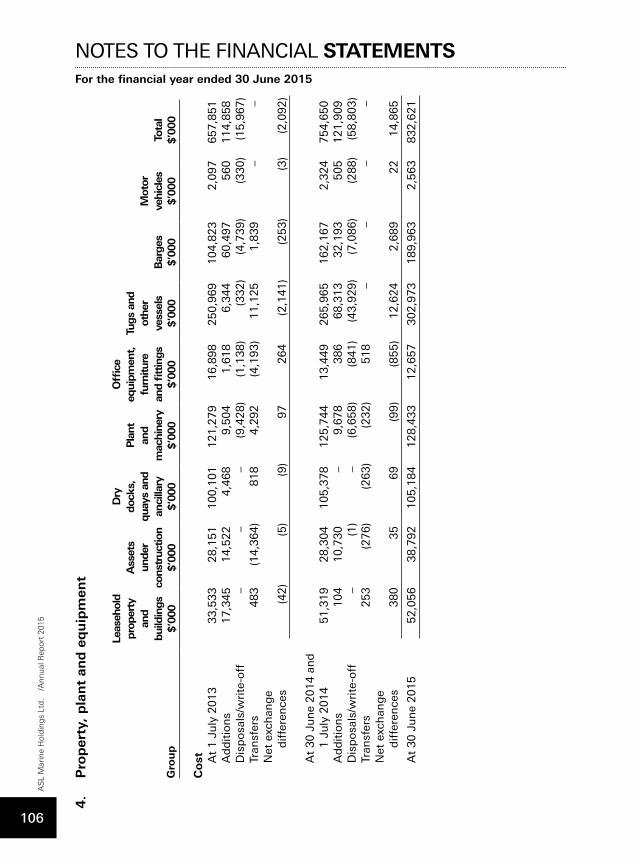
4.
Pro
per
ty, p
lan
t an
d e
qu
ipm
ent
Gro
up
Leas
ehol
d
prop
erty
an
d
build
ings
$’00
0
Ass
ets
unde
r co
nstr
uctio
n$’
000
Dry
do
cks,
qu
ays
and
an
cilla
ry$’
000
Pla
nt
and
m
achi
nery
$’00
0
Offi
ce
equi
pmen
t,
furn
iture
an
d fitt
ings
$’00
0
Tugs
and
ot
her
vess
els
$’00
0B
arge
s$’
000
Mot
or
vehi
cles
$’00
0To
tal
$’00
0
Cost
At
1 J
uly
20
13
33,5
33
28,1
51
100,1
01
121,2
79
16,8
98
250,9
69
104,8
23
2,0
97
657,8
51
Ad
dit
ion
s
17,3
45
14,5
22
4,4
68
9,5
04
1,6
18
6,3
44
60,4
97
560
114,8
58
Dis
po
sals
/wri
te-o
ff
– –
– (9
,428)
(1,1
38)
(332)
(4,7
39)
(330)
(15,9
67)
Tran
sfer
s
483
(14,3
64)
818
4,2
92
(4,1
93)
11,1
25
1,8
39
– –
Net
exc
han
ge
d
iffer
ence
s
(42)
(5)
(9)
97
264
(2,1
41)
(253)
(3)
(2,0
92)
A
t 3
0 J
un
e 2
014 a
nd
1
Ju
ly 2
01
4
51,3
19
28,3
04
105,3
78
125,7
44
13,4
49
265,9
65
162,1
67
2,3
24
754,6
50
Ad
dit
ion
s
104
10,7
30
– 9,6
78
386
68,3
13
32,1
93
505
121,9
09
Dis
po
sals
/wri
te-o
ff
– (1
) –
(6,6
58)
(841)
(43,9
29)
(7,0
86)
(288)
(58,8
03)
Tran
sfer
s
253
(276)
(263)
(232)
518
– –
– –
Net
exc
han
ge
d
iffer
ence
s
380
35
69
(99)
(855)
12,6
24
2,6
89
22
14,8
65
At
30
Ju
ne
20
15
52,0
56
38,7
92
105,1
84
128,4
33
12,6
57
302,9
73
189,9
63
2,5
63
832,6
21
NOTES TO THE FINANCIAL STATEMENTSFor the financial year ended 30 June 2015
AS
L M
arin
e H
old
ing
s Lt
d.
/Ann
ual R
epor
t 20
15
106
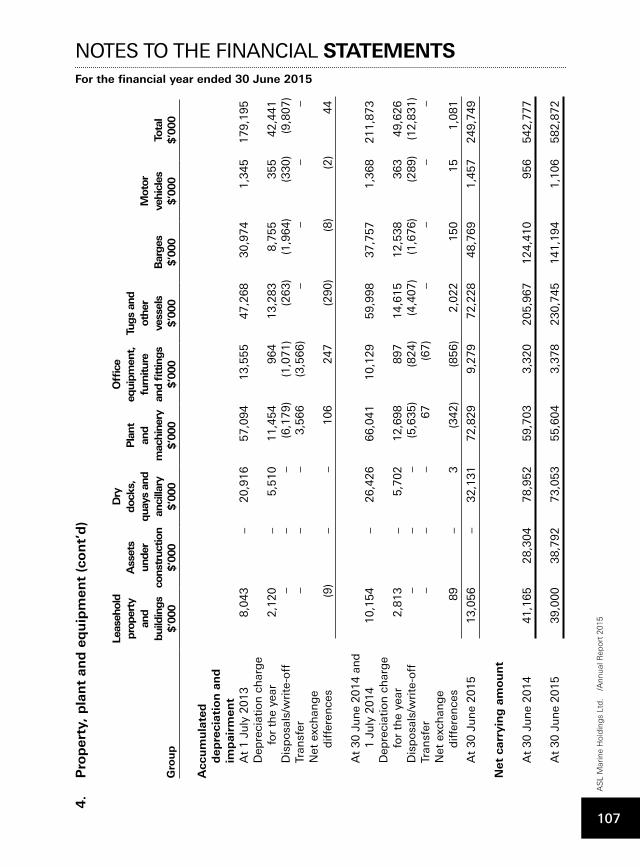
4.
Pro
per
ty, p
lan
t an
d e
qu
ipm
ent
(con
t’d
)
Gro
up
Leas
ehol
d
prop
erty
an
d
build
ings
$’00
0
Ass
ets
unde
r co
nstr
uctio
n$’
000
Dry
do
cks,
qu
ays
and
an
cilla
ry$’
000
Pla
nt
and
m
achi
nery
$’00
0
Offi
ce
equi
pmen
t,
furn
iture
an
d fitt
ings
$’00
0
Tugs
and
ot
her
vess
els
$’00
0B
arge
s$’
000
Mot
or
vehi
cles
$’00
0To
tal
$’00
0
A
ccu
mu
late
d
dep
reci
atio
n a
nd
im
pai
rmen
t
At
1 J
uly
20
13
8,0
43
– 20,9
16
57,0
94
13,5
55
47,2
68
30,9
74
1,3
45
179,1
95
Dep
reci
atio
n c
har
ge
f
or
the
year
2,1
20
– 5,5
10
11,4
54
964
13,2
83
8,7
55
355
42,4
41
Dis
po
sals
/wri
te-o
ff
– –
– (6
,179)
(1,0
71)
(263)
(1,9
64)
(330)
(9,8
07)
Tran
sfer
– –
– 3,5
66
(3,5
66)
– –
– –
Net
exc
han
ge
d
iffer
ence
s
(9)
– –
106
247
(290)
(8)
(2)
44
A
t 3
0 J
un
e 2
014 a
nd
1
Ju
ly 2
01
4
10,1
54
– 26,4
26
66,0
41
10,1
29
59,9
98
37,7
57
1,3
68
211,8
73
Dep
reci
atio
n c
har
ge
fo
r th
e ye
ar
2,8
13
– 5,7
02
12,6
98
897
14,6
15
12,5
38
363
49,6
26
Dis
po
sals
/wri
te-o
ff
– –
– (5
,635)
(824)
(4,4
07)
(1,6
76)
(289)
(12,8
31)
Tran
sfer
– –
– 67
(67)
– –
– –
Net
exc
han
ge
d
iffer
ence
s
89
– 3
(342)
(856)
2,0
22
150
15
1,0
81
At
30
Ju
ne
20
15
13,0
56
– 32,1
31
72,8
29
9,2
79
72,2
28
48,7
69
1,4
57
249,7
49
N
et c
arry
ing
am
ou
nt
A
t 3
0 J
un
e 2
014
41,1
65
28,3
04
78,9
52
59,7
03
3,3
20
205,9
67
124,4
10
956
542,7
77
A
t 3
0 J
un
e 2
015
39,0
00
38,7
92
73,0
53
55,6
04
3,3
78
230,7
45
141,1
94
1,1
06
582,8
72
NOTES TO THE FINANCIAL STATEMENTSFor the financial year ended 30 June 2015
AS
L M
arin
e H
old
ing
s Lt
d.
/Ann
ual R
epor
t 20
15
107
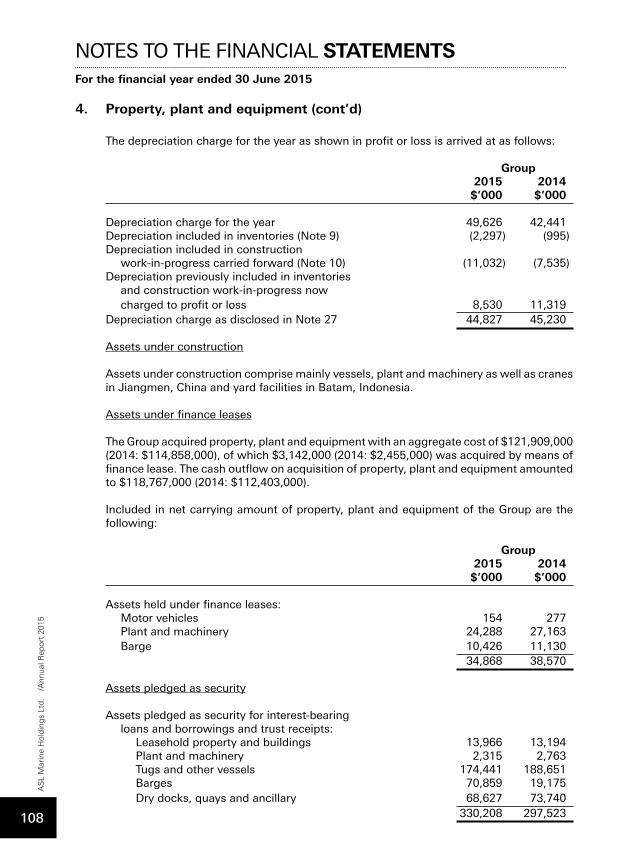
4. Property, plant and equipment (cont’d)
The depreciation charge for the year as shown in profit or loss is arrived at as follows:
Group 2015 2014 $’000 $’000 Depreciation charge for the year 49,626 42,441Depreciation included in inventories (Note 9) (2,297) (995)Depreciation included in construction work-in-progress carried forward (Note 10) (11,032) (7,535)Depreciation previously included in inventories and construction work-in-progress now charged to profit or loss 8,530 11,319Depreciation charge as disclosed in Note 27 44,827 45,230 Assets under construction
Assets under construction comprise mainly vessels, plant and machinery as well as cranes in Jiangmen, China and yard facilities in Batam, Indonesia.
Assets under finance leases
The Group acquired property, plant and equipment with an aggregate cost of $121,909,000 (2014: $114,858,000), of which $3,142,000 (2014: $2,455,000) was acquired by means of finance lease. The cash outflow on acquisition of property, plant and equipment amounted to $118,767,000 (2014: $112,403,000).
Included in net carrying amount of property, plant and equipment of the Group are the following:
Group 2015 2014 $’000 $’000 Assets held under finance leases: Motor vehicles 154 277 Plant and machinery 24,288 27,163 Barge 10,426 11,130 34,868 38,570 Assets pledged as security Assets pledged as security for interest-bearing loans and borrowings and trust receipts:
Leasehold property and buildings 13,966 13,194 Plant and machinery 2,315 2,763 Tugs and other vessels 174,441 188,651 Barges 70,859 19,175 Dry docks, quays and ancillary 68,627 73,740
330,208 297,523
NOTES TO THE FINANCIAL STATEMENTSFor the financial year ended 30 June 2015
AS
L M
arin
e H
old
ing
s Lt
d.
/Ann
ual R
epor
t 20
15
108
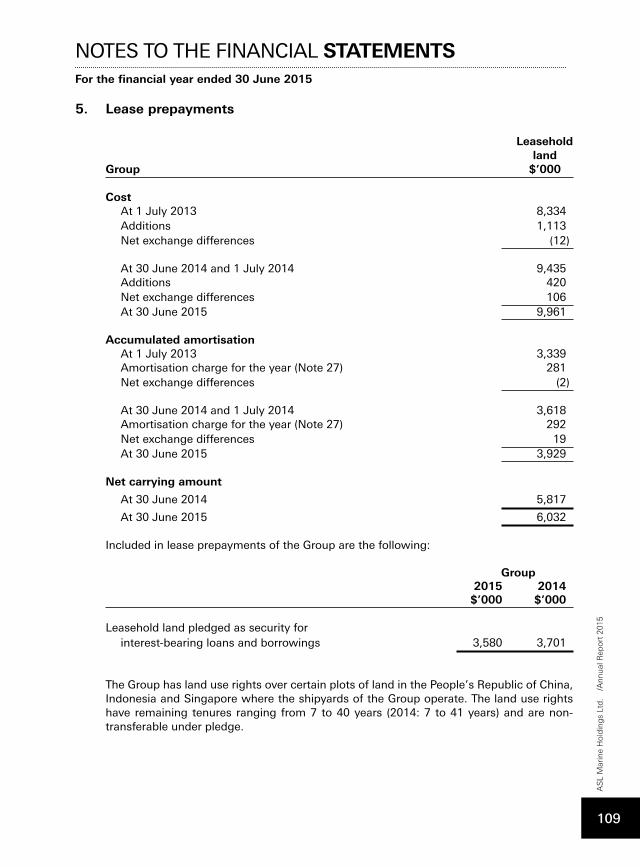
5. Lease prepayments
Leasehold landGroup $’000 Cost
At 1 July 2013 8,334Additions 1,113Net exchange differences (12) At 30 June 2014 and 1 July 2014 9,435Additions 420Net exchange differences 106At 30 June 2015 9,961
Accumulated amortisation
At 1 July 2013 3,339Amortisation charge for the year (Note 27) 281Net exchange differences (2) At 30 June 2014 and 1 July 2014 3,618Amortisation charge for the year (Note 27) 292Net exchange differences 19At 30 June 2015 3,929
Net carrying amount
At 30 June 2014 5,817
At 30 June 2015 6,032 Included in lease prepayments of the Group are the following:
Group 2015 2014 $’000 $’000 Leasehold land pledged as security for interest-bearing loans and borrowings 3,580 3,701
The Group has land use rights over certain plots of land in the People’s Republic of China, Indonesia and Singapore where the shipyards of the Group operate. The land use rights have remaining tenures ranging from 7 to 40 years (2014: 7 to 41 years) and are non-transferable under pledge.
NOTES TO THE FINANCIAL STATEMENTSFor the financial year ended 30 June 2015
AS
L M
arin
e H
old
ing
s Lt
d.
/Ann
ual R
epor
t 20
15
109
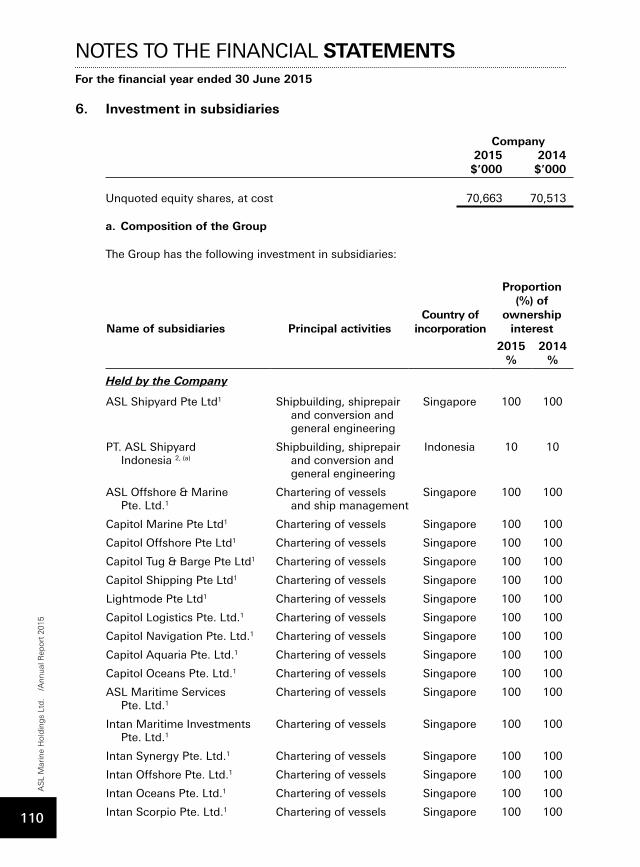
6. Investment in subsidiaries
Company 2015 2014 $’000 $’000 Unquoted equity shares, at cost 70,663 70,513 a. Composition of the Group
The Group has the following investment in subsidiaries:
Name of subsidiaries Principal activitiesCountry of
incorporation
Proportion (%) of
ownership interest
2015%
2014%
Held by the Company
ASL Shipyard Pte Ltd1 Shipbuilding, shiprepairand conversion and general engineering
Singapore 100 100
PT. ASL ShipyardIndonesia 2, (a)
Shipbuilding, shiprepairand conversion and general engineering
Indonesia 10 10
ASL Offshore & MarinePte. Ltd.1
Chartering of vesselsand ship management
Singapore 100 100
Capitol Marine Pte Ltd1 Chartering of vessels Singapore 100 100
Capitol Offshore Pte Ltd1 Chartering of vessels Singapore 100 100
Capitol Tug & Barge Pte Ltd1 Chartering of vessels Singapore 100 100
Capitol Shipping Pte Ltd1 Chartering of vessels Singapore 100 100
Lightmode Pte Ltd1 Chartering of vessels Singapore 100 100
Capitol Logistics Pte. Ltd.1 Chartering of vessels Singapore 100 100
Capitol Navigation Pte. Ltd.1 Chartering of vessels Singapore 100 100
Capitol Aquaria Pte. Ltd.1 Chartering of vessels Singapore 100 100
Capitol Oceans Pte. Ltd.1 Chartering of vessels Singapore 100 100
ASL Maritime ServicesPte. Ltd.1
Chartering of vessels Singapore 100 100
Intan Maritime InvestmentsPte. Ltd.1
Chartering of vessels Singapore 100 100
Intan Synergy Pte. Ltd.1 Chartering of vessels Singapore 100 100
Intan Offshore Pte. Ltd.1 Chartering of vessels Singapore 100 100
Intan Oceans Pte. Ltd.1 Chartering of vessels Singapore 100 100
Intan Scorpio Pte. Ltd.1 Chartering of vessels Singapore 100 100
NOTES TO THE FINANCIAL STATEMENTSFor the financial year ended 30 June 2015
AS
L M
arin
e H
old
ing
s Lt
d.
/Ann
ual R
epor
t 20
15
110
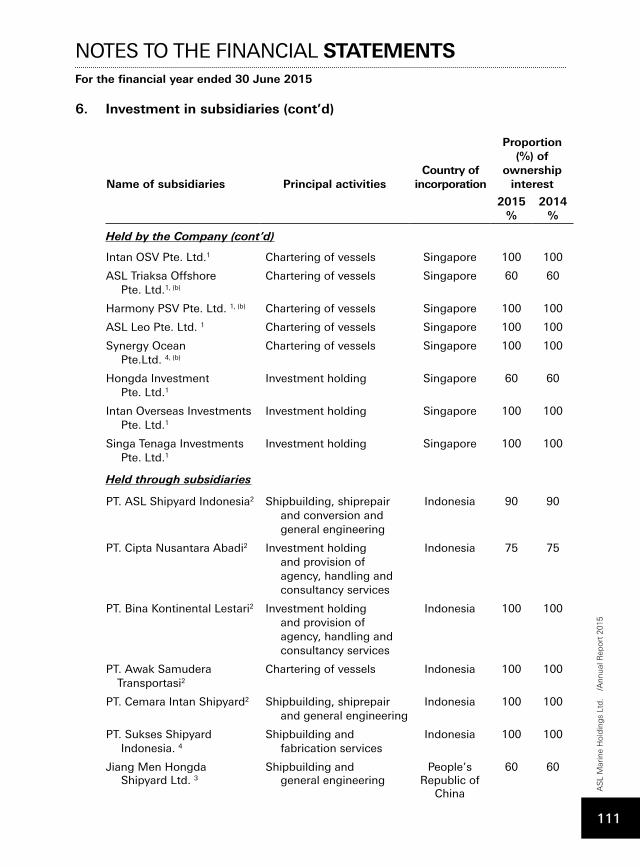
6. Investment in subsidiaries (cont’d)
Name of subsidiaries Principal activitiesCountry of
incorporation
Proportion (%) of
ownership interest
2015%
2014%
HeldbytheCompany(cont’d)
Intan OSV Pte. Ltd.1 Chartering of vessels Singapore 100 100
ASL Triaksa OffshorePte. Ltd.1, (b)
Chartering of vessels Singapore 60 60
Harmony PSV Pte. Ltd. 1, (b) Chartering of vessels Singapore 100 100
ASL Leo Pte. Ltd. 1 Chartering of vessels Singapore 100 100
Synergy OceanPte.Ltd. 4, (b)
Chartering of vessels Singapore 100 100
Hongda InvestmentPte. Ltd.1
Investment holding Singapore 60 60
Intan Overseas InvestmentsPte. Ltd.1
Investment holding Singapore 100 100
Singa Tenaga InvestmentsPte. Ltd.1
Investment holding Singapore 100 100
Held through subsidiaries
PT. ASL Shipyard Indonesia2 Shipbuilding, shiprepairand conversion and general engineering
Indonesia 90 90
PT. Cipta Nusantara Abadi2 Investment holdingand provision of agency, handling and consultancy services
Indonesia 75 75
PT. Bina Kontinental Lestari2 Investment holdingand provision of agency, handling and consultancy services
Indonesia 100 100
PT. Awak SamuderaTransportasi2
Chartering of vessels Indonesia 100 100
PT. Cemara Intan Shipyard2 Shipbuilding, shiprepairand general engineering
Indonesia 100 100
PT. Sukses ShipyardIndonesia. 4
Shipbuilding andfabrication services
Indonesia 100 100
Jiang Men HongdaShipyard Ltd. 3
Shipbuilding andgeneral engineering
People’s Republic of
China
60 60
NOTES TO THE FINANCIAL STATEMENTSFor the financial year ended 30 June 2015
AS
L M
arin
e H
old
ing
s Lt
d.
/Ann
ual R
epor
t 20
15
111
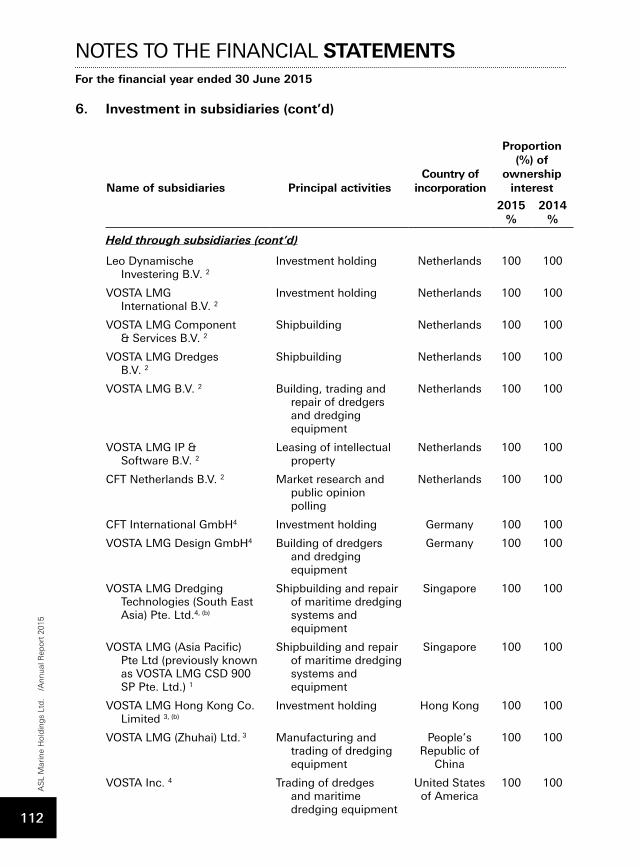
6. Investment in subsidiaries (cont’d)
Name of subsidiaries Principal activitiesCountry of
incorporation
Proportion (%) of
ownership interest
2015%
2014%
Heldthroughsubsidiaries(cont’d)
Leo DynamischeInvestering B.V. 2
Investment holding Netherlands 100 100
VOSTA LMGInternational B.V. 2
Investment holding Netherlands 100 100
VOSTA LMG Component& Services B.V. 2
Shipbuilding Netherlands 100 100
VOSTA LMG DredgesB.V. 2
Shipbuilding Netherlands 100 100
VOSTA LMG B.V. 2 Building, trading and repair of dredgers and dredging equipment
Netherlands 100 100
VOSTA LMG IP &Software B.V. 2
Leasing of intellectualproperty
Netherlands 100 100
CFT Netherlands B.V. 2 Market research and public opinion polling
Netherlands 100 100
CFT International GmbH4 Investment holding Germany 100 100
VOSTA LMG Design GmbH4 Building of dredgersand dredging equipment
Germany 100 100
VOSTA LMG DredgingTechnologies (South East Asia) Pte. Ltd.4, (b)
Shipbuilding and repair of maritime dredging systems and equipment
Singapore 100 100
VOSTA LMG (Asia Pacific)Pte Ltd (previously known as VOSTA LMG CSD 900 SP Pte. Ltd.) 1
Shipbuilding and repair of maritime dredging systems and equipment
Singapore 100 100
VOSTA LMG Hong Kong Co.Limited 3, (b)
Investment holding Hong Kong 100 100
VOSTA LMG (Zhuhai) Ltd. 3 Manufacturing and trading of dredging equipment
People’s Republic of
China
100 100
VOSTA Inc. 4 Trading of dredges and maritime dredging equipment
United States of America
100 100
NOTES TO THE FINANCIAL STATEMENTSFor the financial year ended 30 June 2015
AS
L M
arin
e H
old
ing
s Lt
d.
/Ann
ual R
epor
t 20
15
112
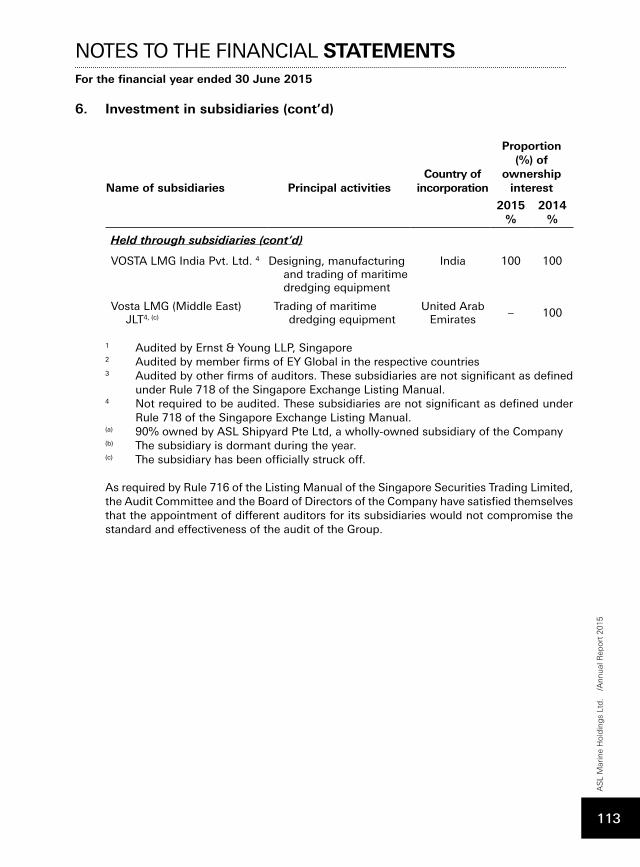
6. Investment in subsidiaries (cont’d)
Name of subsidiaries Principal activitiesCountry of
incorporation
Proportion (%) of
ownership interest
2015%
2014%
Heldthroughsubsidiaries(cont’d)
VOSTA LMG India Pvt. Ltd. 4 Designing, manufacturingand trading of maritime dredging equipment
India 100 100
Vosta LMG (Middle East)JLT4, (c)
Trading of maritimedredging equipment
United Arab Emirates
– 100
1 Audited by Ernst & Young LLP, Singapore2 Audited by member firms of EY Global in the respective countries3 Audited by other firms of auditors. These subsidiaries are not significant as defined
under Rule 718 of the Singapore Exchange Listing Manual.4 Not required to be audited. These subsidiaries are not significant as defined under
Rule 718 of the Singapore Exchange Listing Manual.(a) 90% owned by ASL Shipyard Pte Ltd, a wholly-owned subsidiary of the Company(b) The subsidiary is dormant during the year.(c) The subsidiary has been officially struck off.
As required by Rule 716 of the Listing Manual of the Singapore Securities Trading Limited, the Audit Committee and the Board of Directors of the Company have satisfied themselves that the appointment of different auditors for its subsidiaries would not compromise the standard and effectiveness of the audit of the Group.
NOTES TO THE FINANCIAL STATEMENTSFor the financial year ended 30 June 2015
AS
L M
arin
e H
old
ing
s Lt
d.
/Ann
ual R
epor
t 20
15
113
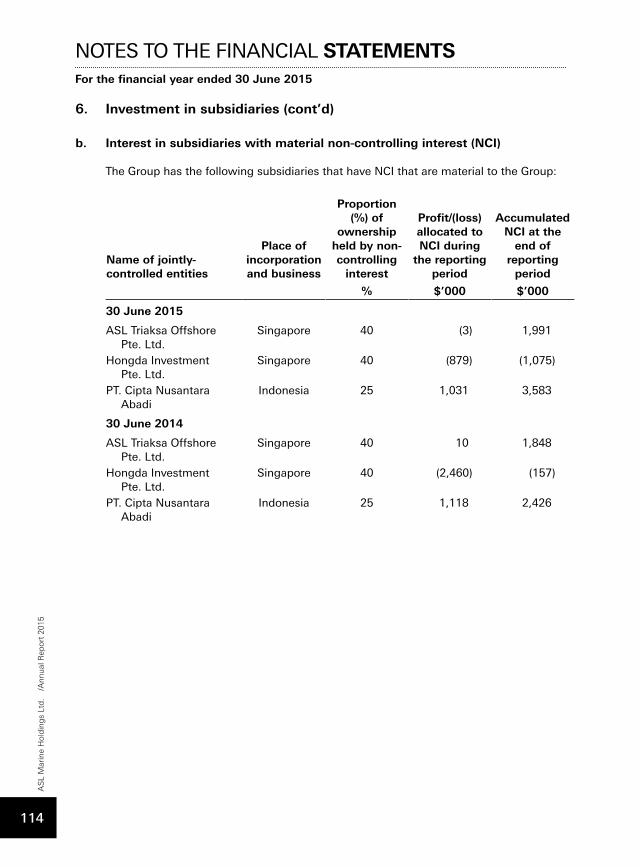
6. Investment in subsidiaries (cont’d)
b. Interest in subsidiaries with material non-controlling interest (NCI)
The Group has the following subsidiaries that have NCI that are material to the Group:
Name of jointly-controlled entities
Place of incorporation and business
Proportion (%) of
ownership held by non-controlling
interest
Profit/(loss) allocated to NCI during
the reporting period
Accumulated NCI at the
end of reporting
period
% $’000 $’000
30 June 2015
ASL Triaksa OffshorePte. Ltd.
Singapore 40 (3) 1,991
Hongda InvestmentPte. Ltd.
Singapore 40 (879) (1,075)
PT. Cipta NusantaraAbadi
Indonesia 25 1,031 3,583
30 June 2014
ASL Triaksa OffshorePte. Ltd.
Singapore 40 10 1,848
Hongda InvestmentPte. Ltd.
Singapore 40 (2,460) (157)
PT. Cipta NusantaraAbadi
Indonesia 25 1,118 2,426
NOTES TO THE FINANCIAL STATEMENTSFor the financial year ended 30 June 2015
AS
L M
arin
e H
old
ing
s Lt
d.
/Ann
ual R
epor
t 20
15
114
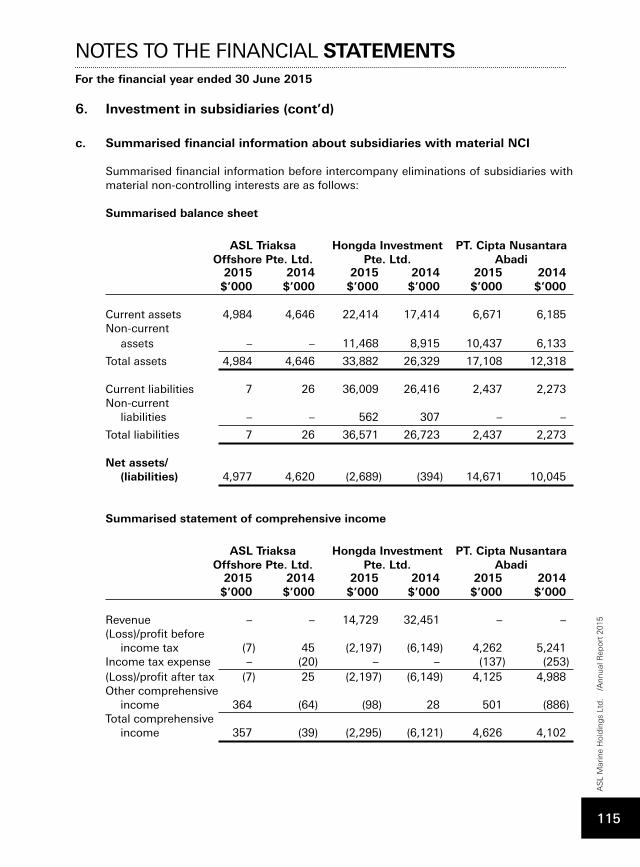
6. Investment in subsidiaries (cont’d)
c. Summarised financial information about subsidiaries with material NCI
Summarised financial information before intercompany eliminations of subsidiaries with material non-controlling interests are as follows:
Summarised balance sheet
ASL Triaksa Offshore Pte. Ltd.
Hongda Investment Pte. Ltd.
PT. Cipta Nusantara Abadi
2015 2014 2015 2014 2015 2014 $’000 $’000 $’000 $’000 $’000 $’000 Current assets 4,984 4,646 22,414 17,414 6,671 6,185Non-current assets – – 11,468 8,915 10,437 6,133
Total assets 4,984 4,646 33,882 26,329 17,108 12,318 Current liabilities 7 26 36,009 26,416 2,437 2,273Non-current liabilities – – 562 307 – –
Total liabilities 7 26 36,571 26,723 2,437 2,273 Net assets/ (liabilities) 4,977 4,620 (2,689) (394) 14,671 10,045
Summarised statement of comprehensive income
ASL Triaksa Offshore Pte. Ltd.
Hongda Investment Pte. Ltd.
PT. Cipta Nusantara Abadi
2015 2014 2015 2014 2015 2014 $’000 $’000 $’000 $’000 $’000 $’000
Revenue – – 14,729 32,451 – –(Loss)/profit before income tax (7) 45 (2,197) (6,149) 4,262 5,241Income tax expense – (20) – – (137) (253)(Loss)/profit after tax (7) 25 (2,197) (6,149) 4,125 4,988Other comprehensive income 364 (64) (98) 28 501 (886)Total comprehensive income 357 (39) (2,295) (6,121) 4,626 4,102
NOTES TO THE FINANCIAL STATEMENTSFor the financial year ended 30 June 2015
AS
L M
arin
e H
old
ing
s Lt
d.
/Ann
ual R
epor
t 20
15
115
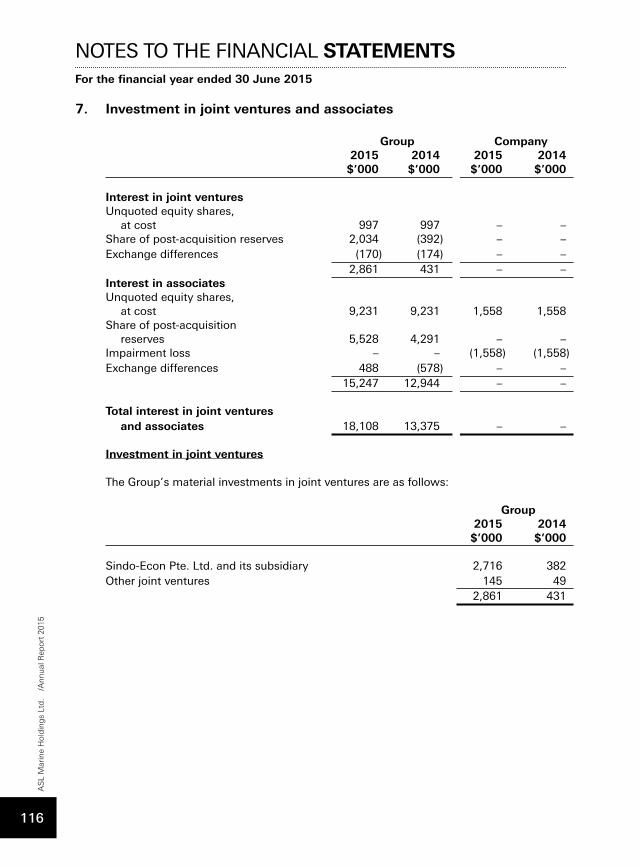
7. Investment in joint ventures and associates
Group Company 2015 2014 2015 2014 $’000 $’000 $’000 $’000 Interest in joint ventures Unquoted equity shares, at cost 997 997 – –Share of post-acquisition reserves 2,034 (392) – –Exchange differences (170) (174) – – 2,861 431 – –Interest in associates Unquoted equity shares, at cost 9,231 9,231 1,558 1,558Share of post-acquisition reserves 5,528 4,291 – –Impairment loss – – (1,558) (1,558)Exchange differences 488 (578) – – 15,247 12,944 – –
Total interest in joint ventures and associates 18,108 13,375 – – Investment in joint ventures
The Group’s material investments in joint ventures are as follows:
Group 2015 2014 $’000 $’000 Sindo-Econ Pte. Ltd. and its subsidiary 2,716 382Other joint ventures 145 49 2,861 431
NOTES TO THE FINANCIAL STATEMENTSFor the financial year ended 30 June 2015
AS
L M
arin
e H
old
ing
s Lt
d.
/Ann
ual R
epor
t 20
15
116
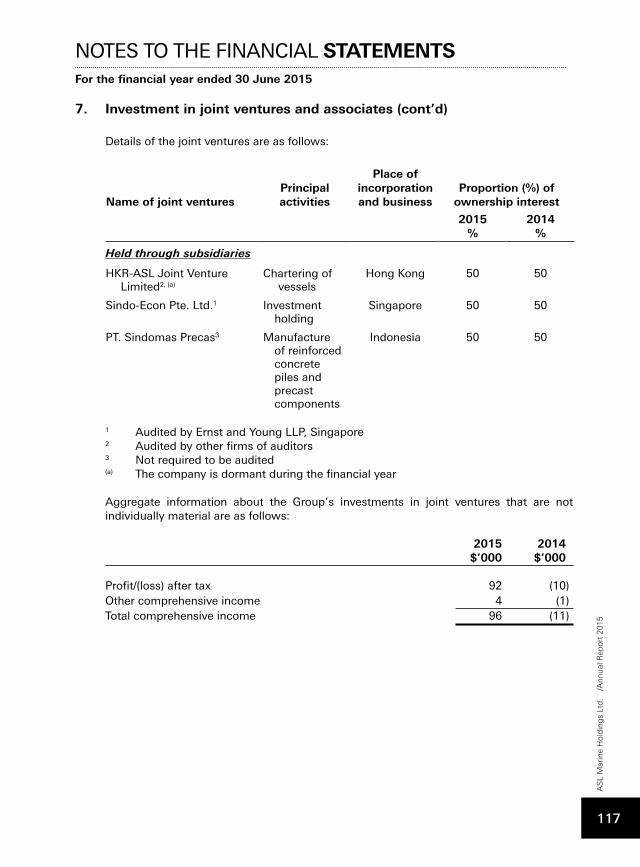
7. Investment in joint ventures and associates (cont’d)
Details of the joint ventures are as follows:
Name of joint venturesPrincipal activities
Place of incorporation and business
Proportion (%) of ownership interest
2015%
2014%
Held through subsidiaries
HKR-ASL Joint VentureLimited2, (a)
Chartering of vessels
Hong Kong 50 50
Sindo-Econ Pte. Ltd.1 Investment holding
Singapore 50 50
PT. Sindomas Precas3 Manufacture of reinforced concrete piles and precast components
Indonesia 50 50
1 Audited by Ernst and Young LLP, Singapore 2 Audited by other firms of auditors3 Not required to be audited(a) The company is dormant during the financial year
Aggregate information about the Group’s investments in joint ventures that are not individually material are as follows:
2015 2014 $’000 $’000 Profit/(loss) after tax 92 (10)Other comprehensive income 4 (1)Total comprehensive income 96 (11)
NOTES TO THE FINANCIAL STATEMENTSFor the financial year ended 30 June 2015
AS
L M
arin
e H
old
ing
s Lt
d.
/Ann
ual R
epor
t 20
15
117
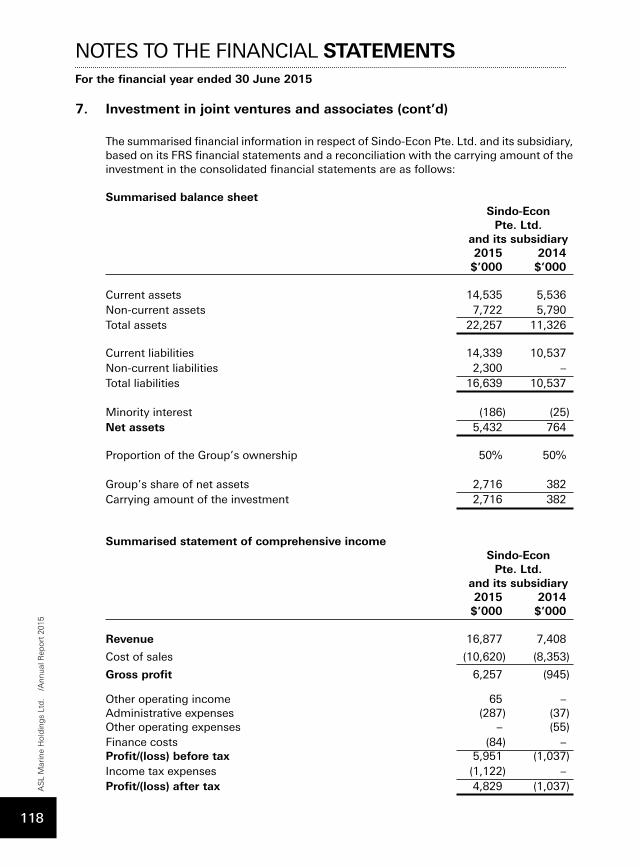
7. Investment in joint ventures and associates (cont’d)
The summarised financial information in respect of Sindo-Econ Pte. Ltd. and its subsidiary, based on its FRS financial statements and a reconciliation with the carrying amount of the investment in the consolidated financial statements are as follows:
Summarised balance sheet Sindo-Econ Pte. Ltd. and its subsidiary 2015 2014 $’000 $’000 Current assets 14,535 5,536Non-current assets 7,722 5,790Total assets 22,257 11,326 Current liabilities 14,339 10,537Non-current liabilities 2,300 –Total liabilities 16,639 10,537 Minority interest (186) (25)Net assets 5,432 764 Proportion of the Group’s ownership 50% 50% Group’s share of net assets 2,716 382Carrying amount of the investment 2,716 382
Summarised statement of comprehensive income Sindo-Econ Pte. Ltd. and its subsidiary 2015 2014 $’000 $’000
Revenue 16,877 7,408
Cost of sales (10,620) (8,353)
Gross profit 6,257 (945)
Other operating income 65 –Administrative expenses (287) (37)Other operating expenses – (55)Finance costs (84) –Profit/(loss) before tax 5,951 (1,037)Income tax expenses (1,122) –Profit/(loss) after tax 4,829 (1,037)
NOTES TO THE FINANCIAL STATEMENTSFor the financial year ended 30 June 2015
AS
L M
arin
e H
old
ing
s Lt
d.
/Ann
ual R
epor
t 20
15
118
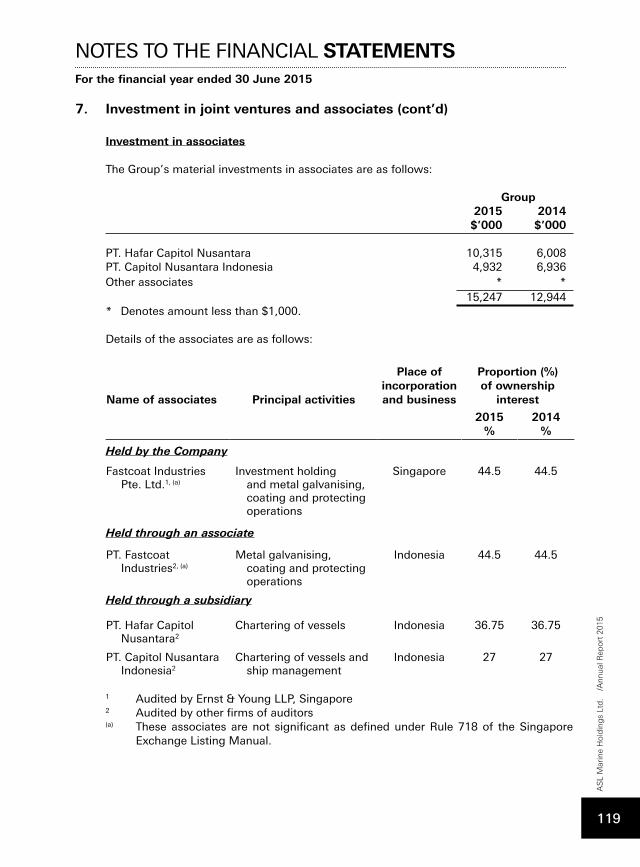
7. Investment in joint ventures and associates (cont’d)
Investment in associates
The Group’s material investments in associates are as follows:
Group 2015 2014 $’000 $’000 PT. Hafar Capitol Nusantara 10,315 6,008PT. Capitol Nusantara Indonesia 4,932 6,936Other associates * * 15,247 12,944* Denotes amount less than $1,000. Details of the associates are as follows:
Name of associates Principal activities
Place of incorporation and business
Proportion (%) of ownership
interest
2015%
2014%
Held by the Company
Fastcoat IndustriesPte. Ltd.1, (a)
Investment holding and metal galvanising, coating and protecting operations
Singapore 44.5 44.5
Held through an associate
PT. FastcoatIndustries2, (a)
Metal galvanising, coating and protecting operations
Indonesia 44.5 44.5
Held through a subsidiary
PT. Hafar CapitolNusantara2
Chartering of vessels Indonesia 36.75 36.75
PT. Capitol NusantaraIndonesia2
Chartering of vessels and ship management
Indonesia 27 27
1 Audited by Ernst & Young LLP, Singapore2 Audited by other firms of auditors(a) These associates are not significant as defined under Rule 718 of the Singapore
Exchange Listing Manual.
NOTES TO THE FINANCIAL STATEMENTSFor the financial year ended 30 June 2015
AS
L M
arin
e H
old
ing
s Lt
d.
/Ann
ual R
epor
t 20
15
119
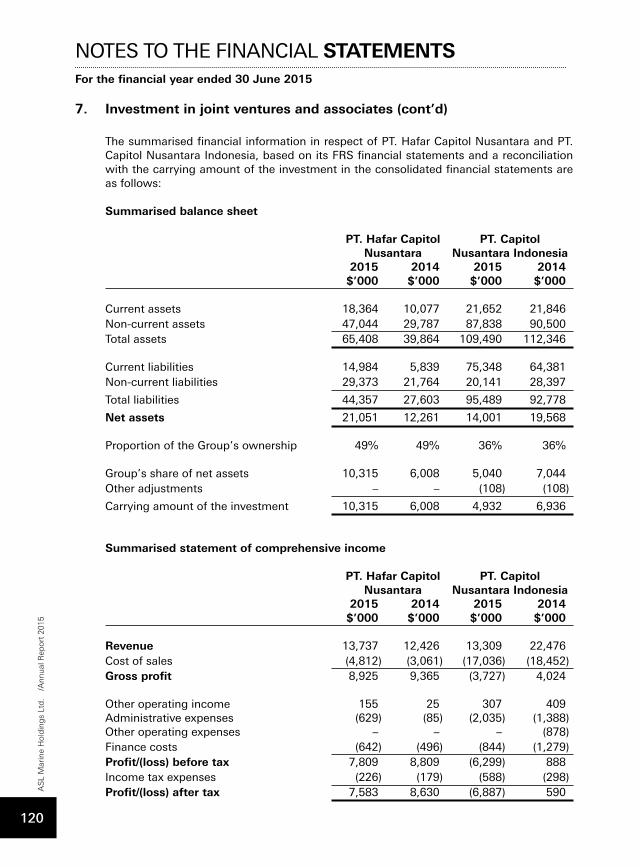
7. Investment in joint ventures and associates (cont’d)
The summarised financial information in respect of PT. Hafar Capitol Nusantara and PT. Capitol Nusantara Indonesia, based on its FRS financial statements and a reconciliation with the carrying amount of the investment in the consolidated financial statements are as follows:
Summarised balance sheet
PT. Hafar Capitol PT. Capitol Nusantara Nusantara Indonesia 2015 2014 2015 2014 $’000 $’000 $’000 $’000 Current assets 18,364 10,077 21,652 21,846Non-current assets 47,044 29,787 87,838 90,500Total assets 65,408 39,864 109,490 112,346 Current liabilities 14,984 5,839 75,348 64,381Non-current liabilities 29,373 21,764 20,141 28,397
Total liabilities 44,357 27,603 95,489 92,778
Net assets 21,051 12,261 14,001 19,568 Proportion of the Group’s ownership 49% 49% 36% 36% Group’s share of net assets 10,315 6,008 5,040 7,044Other adjustments – – (108) (108)
Carrying amount of the investment 10,315 6,008 4,932 6,936
Summarised statement of comprehensive income
PT. Hafar Capitol PT. Capitol Nusantara Nusantara Indonesia 2015 2014 2015 2014 $’000 $’000 $’000 $’000
Revenue 13,737 12,426 13,309 22,476Cost of sales (4,812) (3,061) (17,036) (18,452)Gross profit 8,925 9,365 (3,727) 4,024 Other operating income 155 25 307 409Administrative expenses (629) (85) (2,035) (1,388)Other operating expenses – – – (878)Finance costs (642) (496) (844) (1,279)Profit/(loss) before tax 7,809 8,809 (6,299) 888Income tax expenses (226) (179) (588) (298)Profit/(loss) after tax 7,583 8,630 (6,887) 590
NOTES TO THE FINANCIAL STATEMENTSFor the financial year ended 30 June 2015
AS
L M
arin
e H
old
ing
s Lt
d.
/Ann
ual R
epor
t 20
15
120
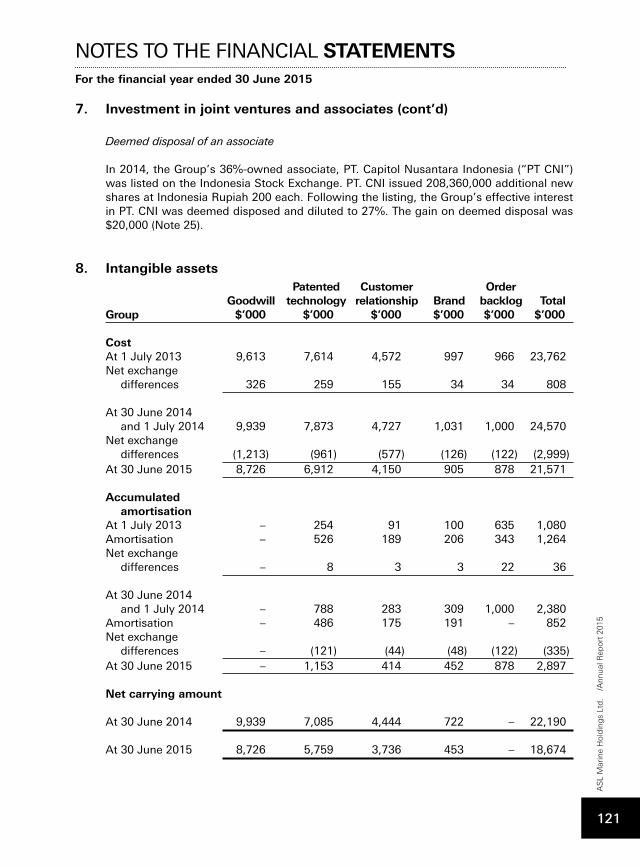
7. Investment in joint ventures and associates (cont’d)
Deemed disposal of an associate
In 2014, the Group’s 36%-owned associate, PT. Capitol Nusantara Indonesia (“PT CNI”) was listed on the Indonesia Stock Exchange. PT. CNI issued 208,360,000 additional new shares at Indonesia Rupiah 200 each. Following the listing, the Group’s effective interest in PT. CNI was deemed disposed and diluted to 27%. The gain on deemed disposal was $20,000 (Note 25).
8. Intangible assets Patented Customer Order Goodwill technology relationship Brand backlog TotalGroup $’000 $’000 $’000 $’000 $’000 $’000
Cost At 1 July 2013 9,613 7,614 4,572 997 966 23,762Net exchange differences 326 259 155 34 34 808 At 30 June 2014 and 1 July 2014 9,939 7,873 4,727 1,031 1,000 24,570Net exchange differences (1,213) (961) (577) (126) (122) (2,999)At 30 June 2015 8,726 6,912 4,150 905 878 21,571 Accumulated amortisation At 1 July 2013 – 254 91 100 635 1,080Amortisation – 526 189 206 343 1,264Net exchange differences – 8 3 3 22 36 At 30 June 2014 and 1 July 2014 – 788 283 309 1,000 2,380Amortisation – 486 175 191 – 852Net exchange differences – (121) (44) (48) (122) (335)At 30 June 2015 – 1,153 414 452 878 2,897 Net carrying amount At 30 June 2014 9,939 7,085 4,444 722 – 22,190 At 30 June 2015 8,726 5,759 3,736 453 – 18,674
NOTES TO THE FINANCIAL STATEMENTSFor the financial year ended 30 June 2015
AS
L M
arin
e H
old
ing
s Lt
d.
/Ann
ual R
epor
t 20
15
121
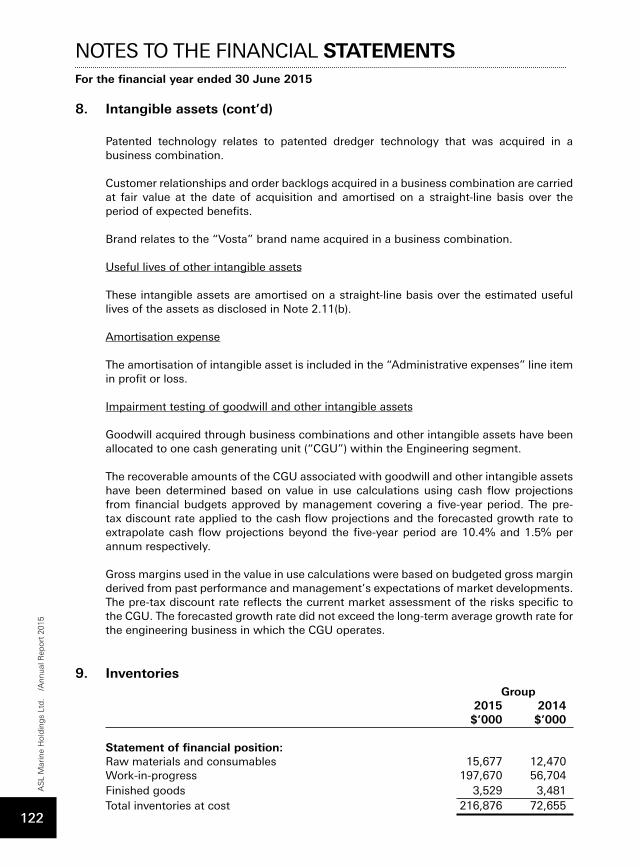
8. Intangible assets (cont’d)
Patented technology relates to patented dredger technology that was acquired in a business combination.
Customer relationships and order backlogs acquired in a business combination are carried at fair value at the date of acquisition and amortised on a straight-line basis over the period of expected benefits.
Brand relates to the “Vosta” brand name acquired in a business combination.
Useful lives of other intangible assets
These intangible assets are amortised on a straight-line basis over the estimated useful lives of the assets as disclosed in Note 2.11(b).
Amortisation expense
The amortisation of intangible asset is included in the “Administrative expenses” line item in profit or loss.
Impairment testing of goodwill and other intangible assets
Goodwill acquired through business combinations and other intangible assets have been allocated to one cash generating unit (“CGU”) within the Engineering segment.
The recoverable amounts of the CGU associated with goodwill and other intangible assets have been determined based on value in use calculations using cash flow projections from financial budgets approved by management covering a five-year period. The pre-tax discount rate applied to the cash flow projections and the forecasted growth rate to extrapolate cash flow projections beyond the five-year period are 10.4% and 1.5% per annum respectively.
Gross margins used in the value in use calculations were based on budgeted gross margin derived from past performance and management’s expectations of market developments. The pre-tax discount rate reflects the current market assessment of the risks specific to the CGU. The forecasted growth rate did not exceed the long-term average growth rate for the engineering business in which the CGU operates.
9. Inventories Group 2015 2014 $’000 $’000
Statement of financial position: Raw materials and consumables 15,677 12,470Work-in-progress 197,670 56,704Finished goods 3,529 3,481Total inventories at cost 216,876 72,655
NOTES TO THE FINANCIAL STATEMENTSFor the financial year ended 30 June 2015
AS
L M
arin
e H
old
ing
s Lt
d.
/Ann
ual R
epor
t 20
15
122
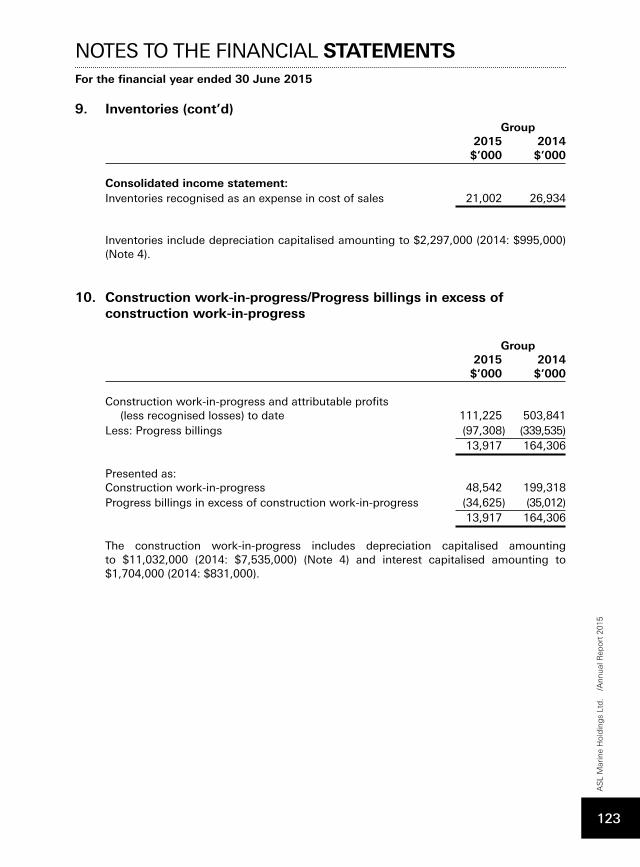
9. Inventories (cont’d) Group 2015 2014 $’000 $’000
Consolidated income statement: Inventories recognised as an expense in cost of sales 21,002 26,934
Inventories include depreciation capitalised amounting to $2,297,000 (2014: $995,000) (Note 4).
10. Construction work-in-progress/Progress billings in excess of construction work-in-progress
Group 2015 2014 $’000 $’000 Construction work-in-progress and attributable profits (less recognised losses) to date 111,225 503,841Less: Progress billings (97,308) (339,535) 13,917 164,306
Presented as: Construction work-in-progress 48,542 199,318Progress billings in excess of construction work-in-progress (34,625) (35,012) 13,917 164,306
The construction work-in-progress includes depreciation capitalised amounting to $11,032,000 (2014: $7,535,000) (Note 4) and interest capitalised amounting to $1,704,000 (2014: $831,000).
NOTES TO THE FINANCIAL STATEMENTSFor the financial year ended 30 June 2015
AS
L M
arin
e H
old
ing
s Lt
d.
/Ann
ual R
epor
t 20
15
123
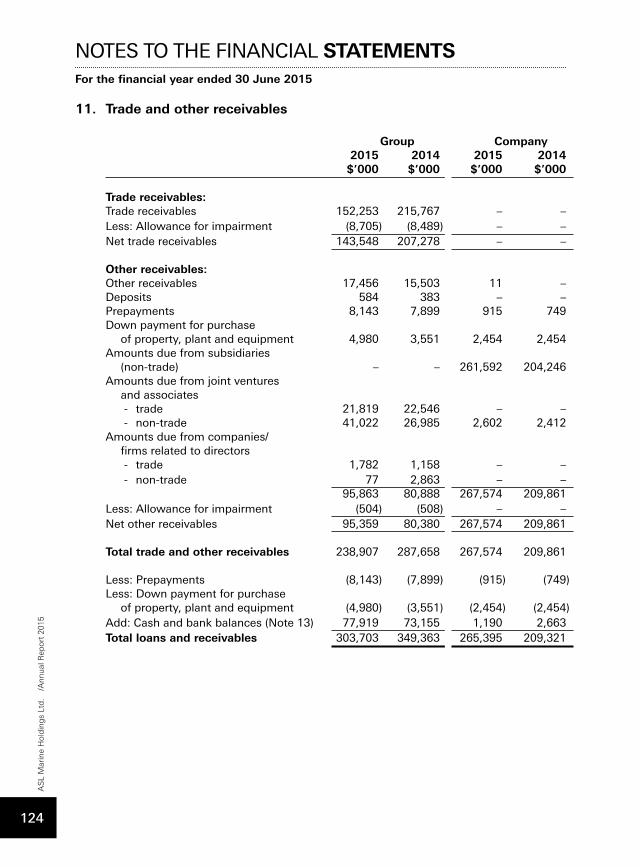
11. Trade and other receivables
Group Company 2015 2014 2015 2014 $’000 $’000 $’000 $’000 Trade receivables: Trade receivables 152,253 215,767 – –Less: Allowance for impairment (8,705) (8,489) – –Net trade receivables 143,548 207,278 – – Other receivables: Other receivables 17,456 15,503 11 –Deposits 584 383 – –Prepayments 8,143 7,899 915 749Down payment for purchase of property, plant and equipment 4,980 3,551 2,454 2,454Amounts due from subsidiaries (non-trade) – – 261,592 204,246Amounts due from joint ventures and associates - trade 21,819 22,546 – – - non-trade 41,022 26,985 2,602 2,412Amounts due from companies/ firms related to directors - trade 1,782 1,158 – – - non-trade 77 2,863 – – 95,863 80,888 267,574 209,861Less: Allowance for impairment (504) (508) – –Net other receivables 95,359 80,380 267,574 209,861 Total trade and other receivables 238,907 287,658 267,574 209,861 Less: Prepayments (8,143) (7,899) (915) (749)Less: Down payment for purchase of property, plant and equipment (4,980) (3,551) (2,454) (2,454)Add: Cash and bank balances (Note 13) 77,919 73,155 1,190 2,663Total loans and receivables 303,703 349,363 265,395 209,321
NOTES TO THE FINANCIAL STATEMENTSFor the financial year ended 30 June 2015
AS
L M
arin
e H
old
ing
s Lt
d.
/Ann
ual R
epor
t 20
15
124
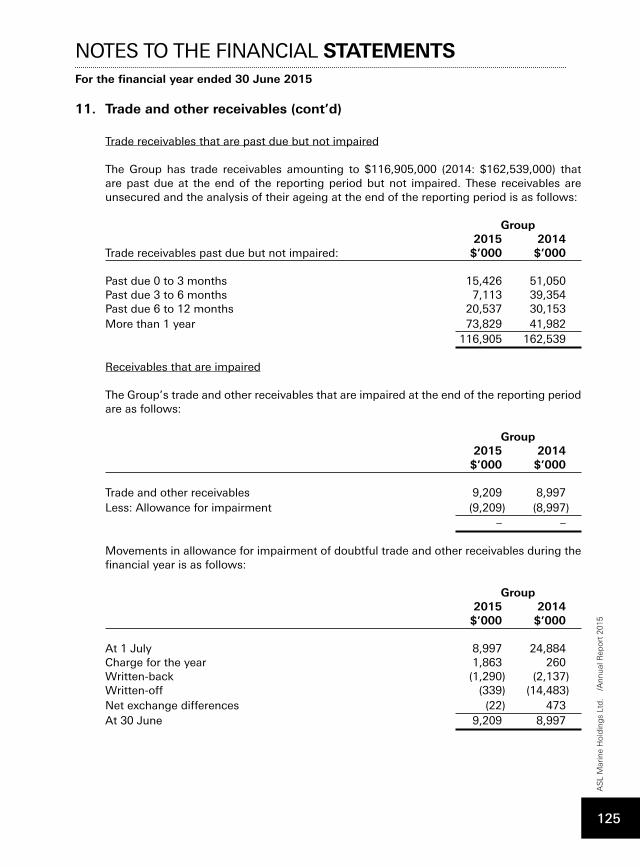
11. Trade and other receivables (cont’d)
Trade receivables that are past due but not impaired
The Group has trade receivables amounting to $116,905,000 (2014: $162,539,000) that are past due at the end of the reporting period but not impaired. These receivables are unsecured and the analysis of their ageing at the end of the reporting period is as follows:
Group 2015 2014Trade receivables past due but not impaired: $’000 $’000 Past due 0 to 3 months 15,426 51,050Past due 3 to 6 months 7,113 39,354Past due 6 to 12 months 20,537 30,153More than 1 year 73,829 41,982 116,905 162,539 Receivables that are impaired
The Group’s trade and other receivables that are impaired at the end of the reporting period are as follows:
Group 2015 2014 $’000 $’000 Trade and other receivables 9,209 8,997Less: Allowance for impairment (9,209) (8,997) – – Movements in allowance for impairment of doubtful trade and other receivables during the financial year is as follows:
Group 2015 2014 $’000 $’000 At 1 July 8,997 24,884Charge for the year 1,863 260Written-back (1,290) (2,137)Written-off (339) (14,483)Net exchange differences (22) 473At 30 June 9,209 8,997
NOTES TO THE FINANCIAL STATEMENTSFor the financial year ended 30 June 2015
AS
L M
arin
e H
old
ing
s Lt
d.
/Ann
ual R
epor
t 20
15
125
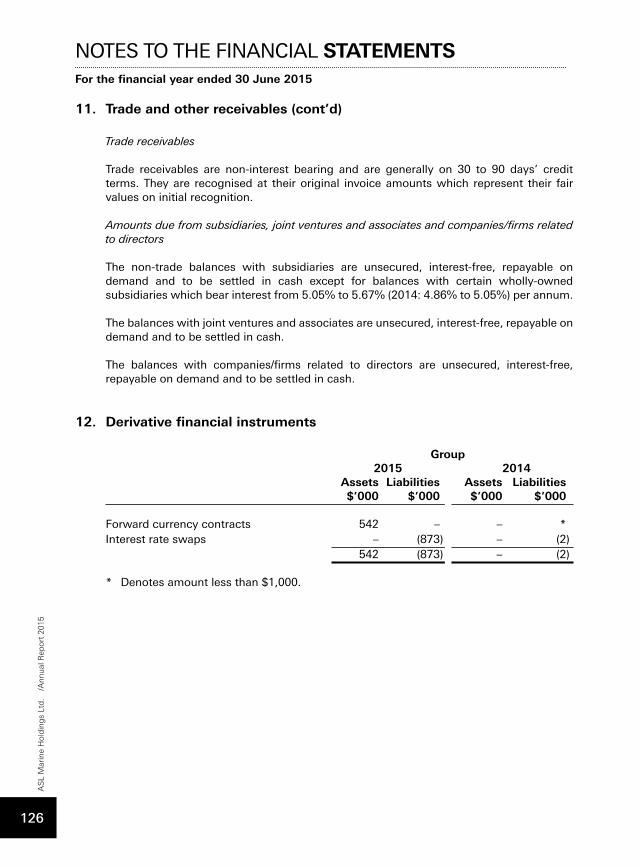
11. Trade and other receivables (cont’d)
Trade receivables
Trade receivables are non-interest bearing and are generally on 30 to 90 days’ credit terms. They are recognised at their original invoice amounts which represent their fair values on initial recognition.
Amounts due from subsidiaries, joint ventures and associates and companies/firms related to directors
The non-trade balances with subsidiaries are unsecured, interest-free, repayable on demand and to be settled in cash except for balances with certain wholly-owned subsidiaries which bear interest from 5.05% to 5.67% (2014: 4.86% to 5.05%) per annum.
The balances with joint ventures and associates are unsecured, interest-free, repayable on demand and to be settled in cash.
The balances with companies/firms related to directors are unsecured, interest-free, repayable on demand and to be settled in cash.
12. Derivative financial instruments
Group 2015 2014 Assets Liabilities Assets Liabilities $’000 $’000 $’000 $’000 Forward currency contracts 542 – – *Interest rate swaps – (873) – (2) 542 (873) – (2) * Denotes amount less than $1,000.
NOTES TO THE FINANCIAL STATEMENTSFor the financial year ended 30 June 2015
AS
L M
arin
e H
old
ing
s Lt
d.
/Ann
ual R
epor
t 20
15
126
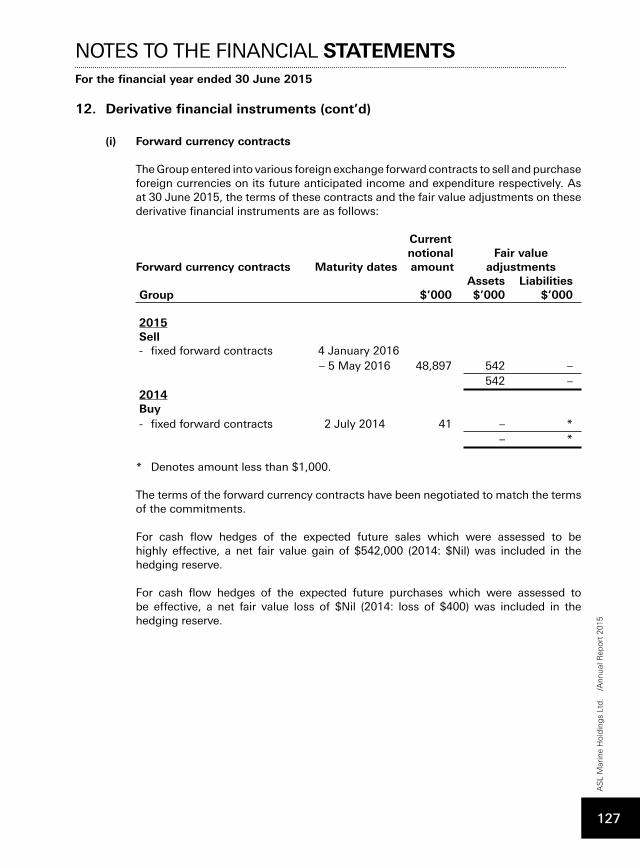
12. Derivative financial instruments (cont’d)
(i) Forward currency contracts
The Group entered into various foreign exchange forward contracts to sell and purchase foreign currencies on its future anticipated income and expenditure respectively. As at 30 June 2015, the terms of these contracts and the fair value adjustments on these derivative financial instruments are as follows: Current notional Fair valueForward currency contracts Maturity dates amount adjustments Assets Liabilities Group $’000 $’000 $’000 2015 Sell - fixed forward contracts 4 January 2016 – 5 May 2016 48,897 542 – 542 – 2014 Buy - fixed forward contracts 2 July 2014 41 – * – * * Denotes amount less than $1,000.
The terms of the forward currency contracts have been negotiated to match the terms of the commitments.
For cash flow hedges of the expected future sales which were assessed to be highly effective, a net fair value gain of $542,000 (2014: $Nil) was included in the hedging reserve.
For cash flow hedges of the expected future purchases which were assessed to be effective, a net fair value loss of $Nil (2014: loss of $400) was included in the hedging reserve.
NOTES TO THE FINANCIAL STATEMENTSFor the financial year ended 30 June 2015
AS
L M
arin
e H
old
ing
s Lt
d.
/Ann
ual R
epor
t 20
15
127
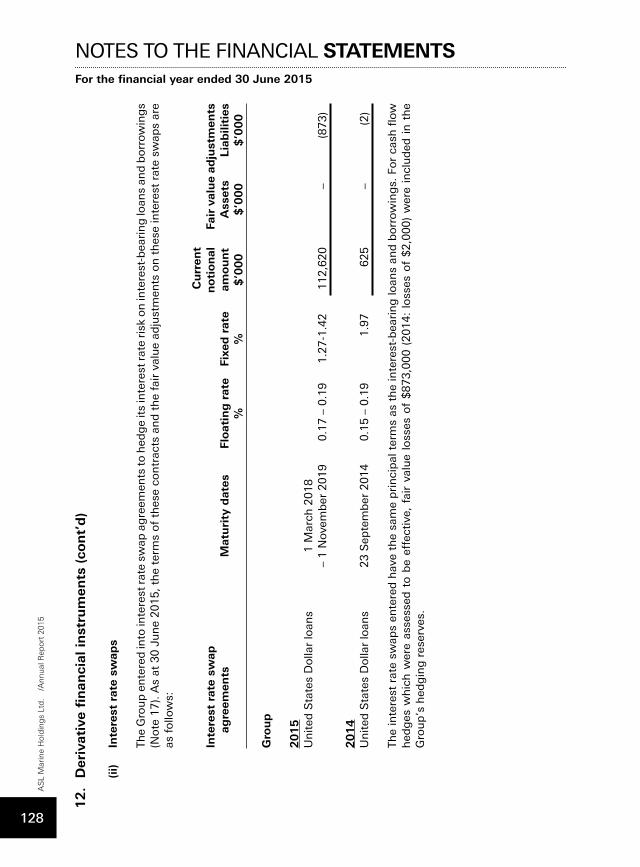
12.
Der
ivat
ive
fin
anci
al in
stru
men
ts (
con
t’d
)
(ii)
Inte
rest
rat
e sw
aps
The
Gro
up
en
tere
d in
to in
tere
st r
ate
swap
ag
reem
ents
to h
edg
e it
s in
tere
st r
ate
risk
on
inte
rest
-bea
rin
g lo
ans
and
bo
rrow
ing
s (N
ote
17
). A
s at
30 J
un
e 2015, th
e te
rms
of
thes
e co
ntr
acts
an
d t
he
fair
val
ue
adju
stm
ents
on
th
ese
inte
rest
rat
e sw
aps
are
as f
ollo
ws:
C
urr
ent
Inte
rest
rat
e sw
ap
n
oti
on
al
Fair
val
ue
adju
stm
ents
agre
emen
ts
Mat
uri
ty d
ates
Fl
oat
ing
rat
e Fi
xed
rat
e am
ou
nt
Ass
ets
Liab
iliti
es
%
%
$’0
00
$
’00
0
$’0
00
Gro
up
2015
Un
ited
Sta
tes
Do
llar
loan
s 1 M
arch
2018
– 1 N
ovem
ber
2019
0.1
7 –
0.1
9
1.2
7-1
.42
112,6
20
– (8
73)
2014
Un
ited
Sta
tes
Do
llar
loan
s 23 S
epte
mb
er 2
014
0.1
5 –
0.1
9
1.9
7
625
– (2
)
The
inte
rest
rat
e sw
aps
ente
red
hav
e th
e sa
me
pri
nci
pal
ter
ms
as t
he
inte
rest
-bea
rin
g lo
ans
and
bo
rrow
ing
s. F
or
cash
flow
h
edg
es w
hic
h w
ere
asse
ssed
to
be
effec
tive
, fa
ir v
alu
e lo
sses
of
$873,0
00 (
2014:
loss
es o
f $2,0
00)
wer
e in
clu
ded
in
th
e G
rou
p’s
hed
gin
g r
eser
ves.
NOTES TO THE FINANCIAL STATEMENTSFor the financial year ended 30 June 2015
AS
L M
arin
e H
old
ing
s Lt
d.
/Ann
ual R
epor
t 20
15
128
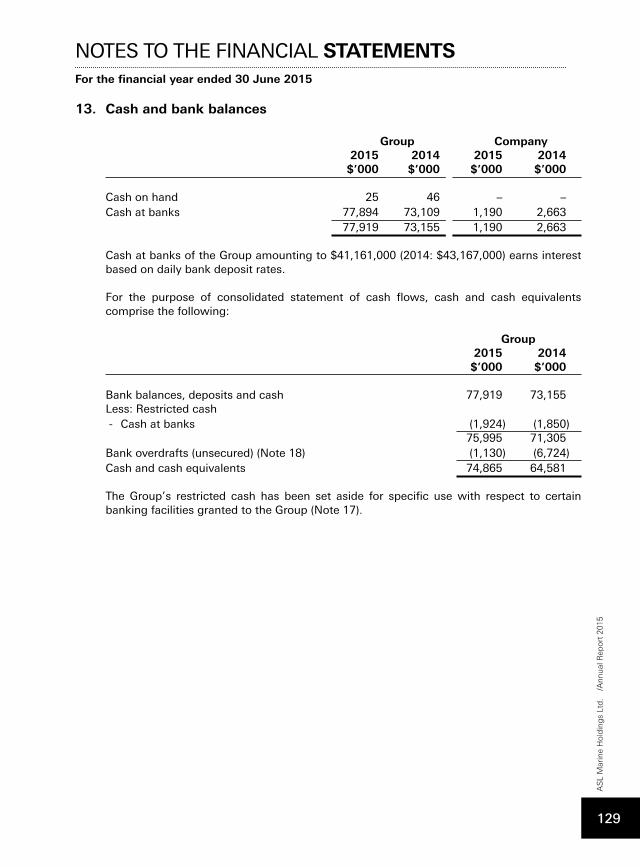
13. Cash and bank balances
Group Company 2015 2014 2015 2014 $’000 $’000 $’000 $’000 Cash on hand 25 46 – –Cash at banks 77,894 73,109 1,190 2,663 77,919 73,155 1,190 2,663
Cash at banks of the Group amounting to $41,161,000 (2014: $43,167,000) earns interest based on daily bank deposit rates.
For the purpose of consolidated statement of cash flows, cash and cash equivalents comprise the following:
Group 2015 2014 $’000 $’000 Bank balances, deposits and cash 77,919 73,155Less: Restricted cash - Cash at banks (1,924) (1,850) 75,995 71,305Bank overdrafts (unsecured) (Note 18) (1,130) (6,724)Cash and cash equivalents 74,865 64,581 The Group’s restricted cash has been set aside for specific use with respect to certain banking facilities granted to the Group (Note 17).
NOTES TO THE FINANCIAL STATEMENTSFor the financial year ended 30 June 2015
AS
L M
arin
e H
old
ing
s Lt
d.
/Ann
ual R
epor
t 20
15
129
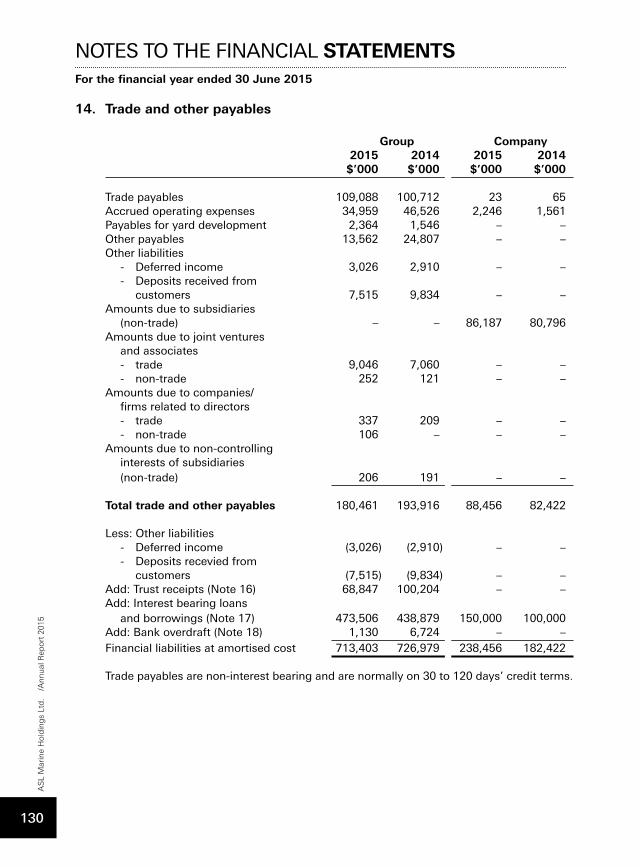
14. Trade and other payables
Group Company 2015 2014 2015 2014 $’000 $’000 $’000 $’000 Trade payables 109,088 100,712 23 65Accrued operating expenses 34,959 46,526 2,246 1,561Payables for yard development 2,364 1,546 – –Other payables 13,562 24,807 – –Other liabilities - Deferred income 3,026 2,910 – – - Deposits received from customers 7,515 9,834 – –Amounts due to subsidiaries (non-trade) – – 86,187 80,796Amounts due to joint ventures and associates - trade 9,046 7,060 – – - non-trade 252 121 – –Amounts due to companies/ firms related to directors - trade 337 209 – – - non-trade 106 – – –Amounts due to non-controlling interests of subsidiaries (non-trade) 206 191 – – Total trade and other payables 180,461 193,916 88,456 82,422 Less: Other liabilities - Deferred income (3,026) (2,910) – – - Deposits recevied from customers (7,515) (9,834) – –Add: Trust receipts (Note 16) 68,847 100,204 – –Add: Interest bearing loans and borrowings (Note 17) 473,506 438,879 150,000 100,000Add: Bank overdraft (Note 18) 1,130 6,724 – –Financial liabilities at amortised cost 713,403 726,979 238,456 182,422 Trade payables are non-interest bearing and are normally on 30 to 120 days’ credit terms.
NOTES TO THE FINANCIAL STATEMENTSFor the financial year ended 30 June 2015
AS
L M
arin
e H
old
ing
s Lt
d.
/Ann
ual R
epor
t 20
15
130
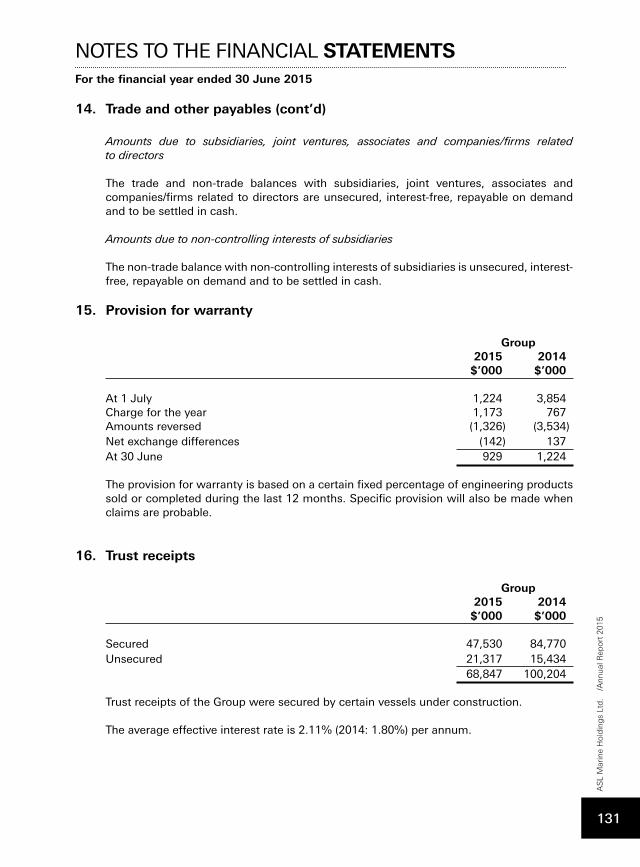
14. Trade and other payables (cont’d)
Amounts due to subsidiaries, joint ventures, associates and companies/firms related to directors
The trade and non-trade balances with subsidiaries, joint ventures, associates and companies/firms related to directors are unsecured, interest-free, repayable on demand and to be settled in cash.
Amounts due to non-controlling interests of subsidiaries
The non-trade balance with non-controlling interests of subsidiaries is unsecured, interest-free, repayable on demand and to be settled in cash.
15. Provision for warranty
Group 2015 2014 $’000 $’000 At 1 July 1,224 3,854Charge for the year 1,173 767Amounts reversed (1,326) (3,534)Net exchange differences (142) 137At 30 June 929 1,224 The provision for warranty is based on a certain fixed percentage of engineering products sold or completed during the last 12 months. Specific provision will also be made when claims are probable.
16. Trust receipts
Group 2015 2014 $’000 $’000 Secured 47,530 84,770Unsecured 21,317 15,434 68,847 100,204
Trust receipts of the Group were secured by certain vessels under construction.
The average effective interest rate is 2.11% (2014: 1.80%) per annum.
NOTES TO THE FINANCIAL STATEMENTSFor the financial year ended 30 June 2015
AS
L M
arin
e H
old
ing
s Lt
d.
/Ann
ual R
epor
t 20
15
131
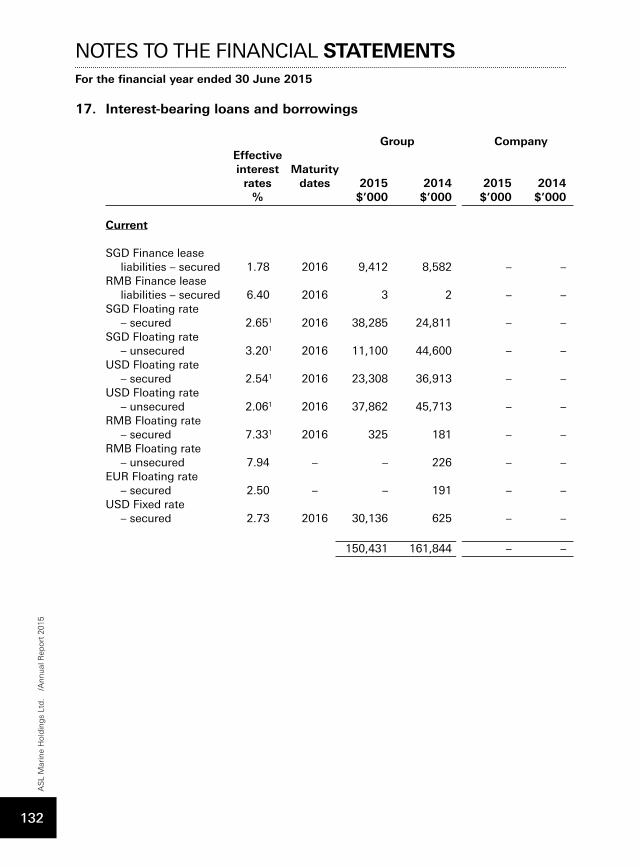
17. Interest-bearing loans and borrowings
Group Company Effective interest Maturity rates dates 2015 2014 2015 2014 % $’000 $’000 $’000 $’000 Current SGD Finance lease liabilities – secured 1.78 2016 9,412 8,582 – –RMB Finance lease liabilities – secured 6.40 2016 3 2 – –SGD Floating rate – secured 2.651 2016 38,285 24,811 – –SGD Floating rate – unsecured 3.201 2016 11,100 44,600 – –USD Floating rate – secured 2.541 2016 23,308 36,913 – –USD Floating rate – unsecured 2.061 2016 37,862 45,713 – –RMB Floating rate – secured 7.331 2016 325 181 – –RMB Floating rate – unsecured 7.94 – – 226 – –EUR Floating rate – secured 2.50 – – 191 – –USD Fixed rate – secured 2.73 2016 30,136 625 – – 150,431 161,844 – –
NOTES TO THE FINANCIAL STATEMENTSFor the financial year ended 30 June 2015
AS
L M
arin
e H
old
ing
s Lt
d.
/Ann
ual R
epor
t 20
15
132
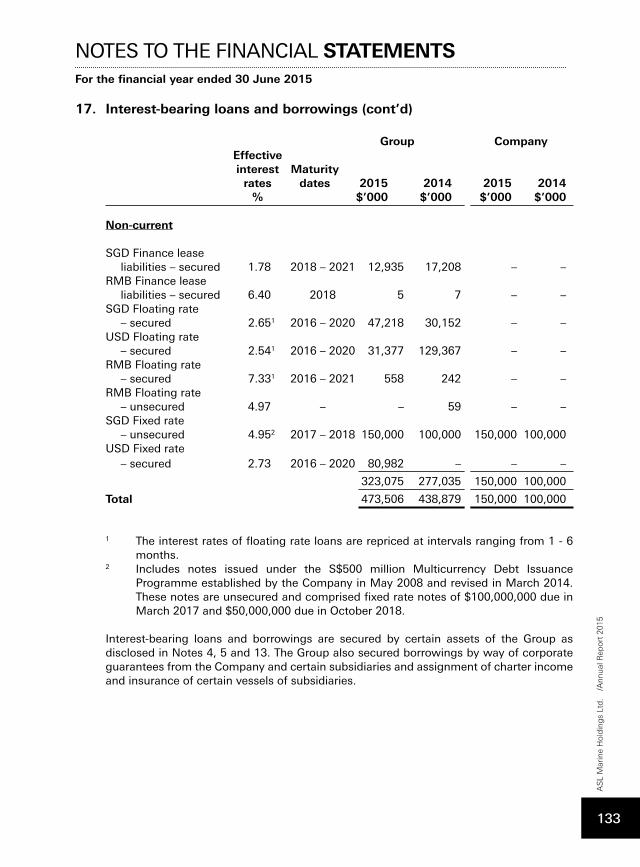
17. Interest-bearing loans and borrowings (cont’d)
Group Company Effective interest Maturity rates dates 2015 2014 2015 2014 % $’000 $’000 $’000 $’000 Non-current SGD Finance lease liabilities – secured 1.78 2018 – 2021 12,935 17,208 – –RMB Finance lease liabilities – secured 6.40 2018 5 7 – –SGD Floating rate – secured 2.651 2016 – 2020 47,218 30,152 – –USD Floating rate – secured 2.541 2016 – 2020 31,377 129,367 – –RMB Floating rate – secured 7.331 2016 – 2021 558 242 – –RMB Floating rate – unsecured 4.97 – – 59 – –SGD Fixed rate – unsecured 4.952 2017 – 2018 150,000 100,000 150,000 100,000USD Fixed rate – secured 2.73 2016 – 2020 80,982 – – –
323,075 277,035 150,000 100,000
Total 473,506 438,879 150,000 100,000
1 The interest rates of floating rate loans are repriced at intervals ranging from 1 - 6 months.
2 Includes notes issued under the S$500 million Multicurrency Debt Issuance Programme established by the Company in May 2008 and revised in March 2014. These notes are unsecured and comprised fixed rate notes of $100,000,000 due in March 2017 and $50,000,000 due in October 2018.
Interest-bearing loans and borrowings are secured by certain assets of the Group as disclosed in Notes 4, 5 and 13. The Group also secured borrowings by way of corporate guarantees from the Company and certain subsidiaries and assignment of charter income and insurance of certain vessels of subsidiaries.
NOTES TO THE FINANCIAL STATEMENTSFor the financial year ended 30 June 2015
AS
L M
arin
e H
old
ing
s Lt
d.
/Ann
ual R
epor
t 20
15
133
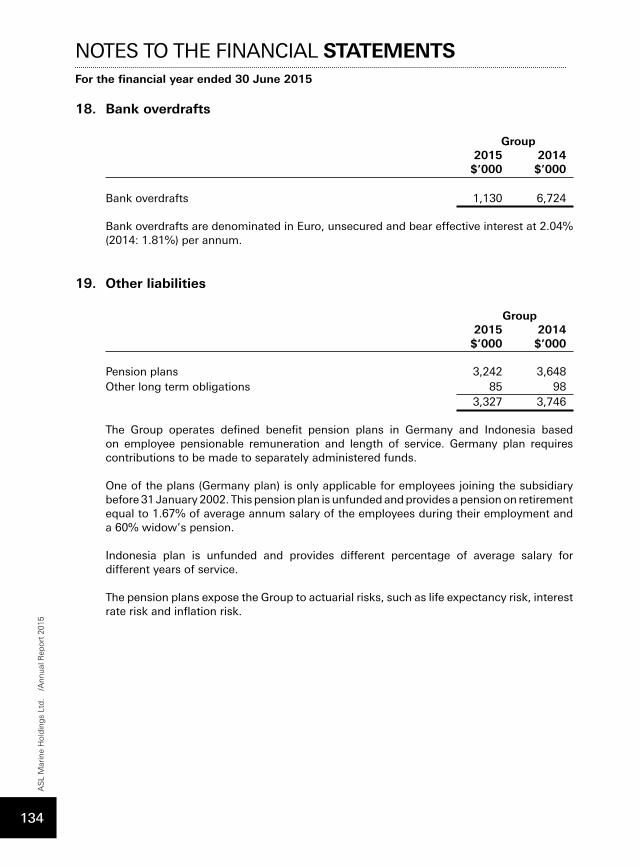
18. Bank overdrafts
Group 2015 2014 $’000 $’000 Bank overdrafts 1,130 6,724 Bank overdrafts are denominated in Euro, unsecured and bear effective interest at 2.04% (2014: 1.81%) per annum.
19. Other liabilities
Group 2015 2014 $’000 $’000 Pension plans 3,242 3,648Other long term obligations 85 98 3,327 3,746 The Group operates defined benefit pension plans in Germany and Indonesia based on employee pensionable remuneration and length of service. Germany plan requires contributions to be made to separately administered funds.
One of the plans (Germany plan) is only applicable for employees joining the subsidiary before 31 January 2002. This pension plan is unfunded and provides a pension on retirement equal to 1.67% of average annum salary of the employees during their employment and a 60% widow’s pension.
Indonesia plan is unfunded and provides different percentage of average salary for different years of service.
The pension plans expose the Group to actuarial risks, such as life expectancy risk, interest rate risk and inflation risk.
NOTES TO THE FINANCIAL STATEMENTSFor the financial year ended 30 June 2015
AS
L M
arin
e H
old
ing
s Lt
d.
/Ann
ual R
epor
t 20
15
134
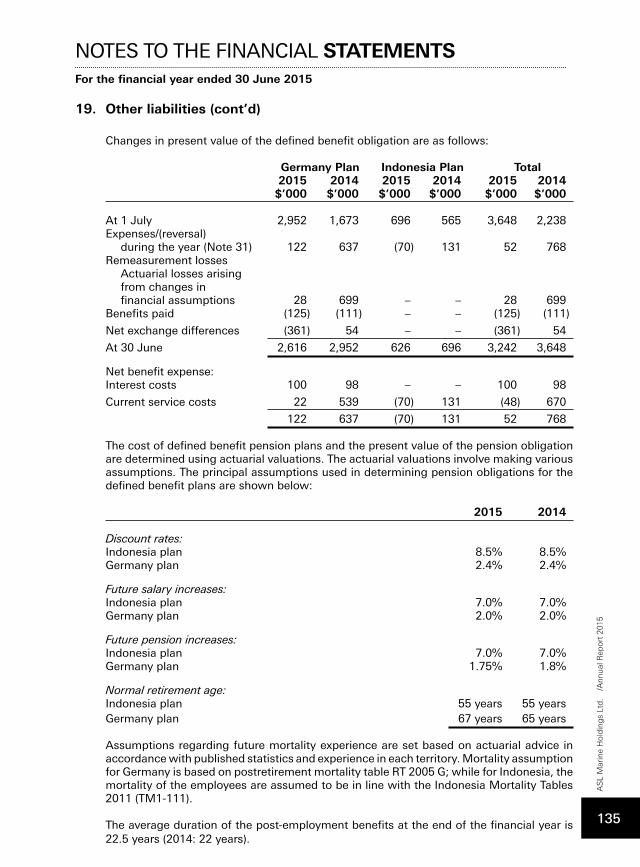
19. Other liabilities (cont’d)
Changes in present value of the defined benefit obligation are as follows:
Germany Plan Indonesia Plan Total 2015 2014 2015 2014 2015 2014 $’000 $’000 $’000 $’000 $’000 $’000 At 1 July 2,952 1,673 696 565 3,648 2,238Expenses/(reversal) during the year (Note 31) 122 637 (70) 131 52 768Remeasurement losses Actuarial losses arising from changes in financial assumptions 28 699 – – 28 699Benefits paid (125) (111) – – (125) (111)
Net exchange differences (361) 54 – – (361) 54
At 30 June 2,616 2,952 626 696 3,242 3,648 Net benefit expense: Interest costs 100 98 – – 100 98
Current service costs 22 539 (70) 131 (48) 670
122 637 (70) 131 52 768 The cost of defined benefit pension plans and the present value of the pension obligation are determined using actuarial valuations. The actuarial valuations involve making various assumptions. The principal assumptions used in determining pension obligations for the defined benefit plans are shown below:
2015 2014 Discount rates: Indonesia plan 8.5% 8.5%Germany plan 2.4% 2.4% Future salary increases: Indonesia plan 7.0% 7.0%Germany plan 2.0% 2.0% Future pension increases: Indonesia plan 7.0% 7.0%Germany plan 1.75% 1.8% Normal retirement age: Indonesia plan 55 years 55 yearsGermany plan 67 years 65 years
Assumptions regarding future mortality experience are set based on actuarial advice in accordance with published statistics and experience in each territory. Mortality assumption for Germany is based on postretirement mortality table RT 2005 G; while for Indonesia, the mortality of the employees are assumed to be in line with the Indonesia Mortality Tables 2011 (TM1-111).
The average duration of the post-employment benefits at the end of the financial year is 22.5 years (2014: 22 years).
NOTES TO THE FINANCIAL STATEMENTSFor the financial year ended 30 June 2015
AS
L M
arin
e H
old
ing
s Lt
d.
/Ann
ual R
epor
t 20
15
135
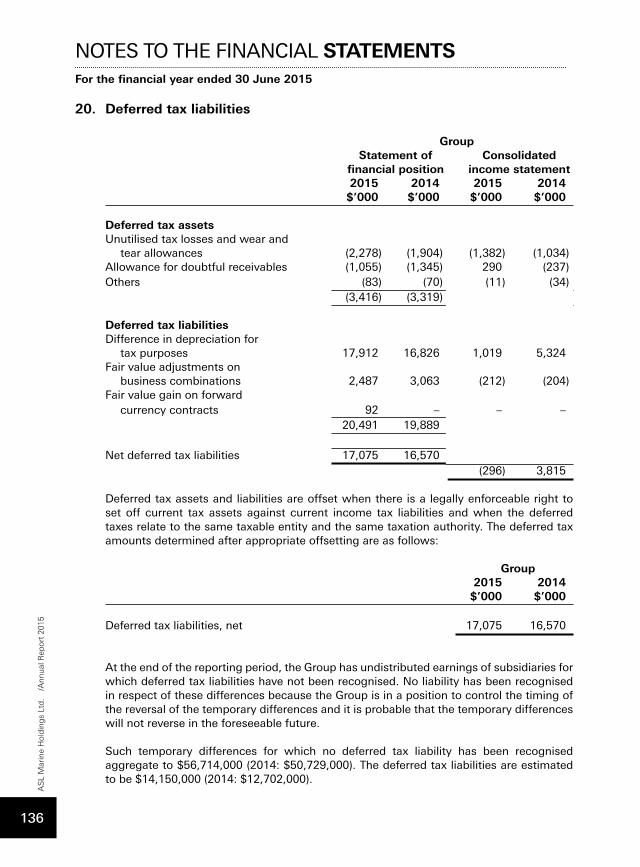
20. Deferred tax liabilities
Group Statement of Consolidated financial position income statement 2015 2014 2015 2014 $’000 $’000 $’000 $’000 Deferred tax assets Unutilised tax losses and wear and tear allowances (2,278) (1,904) (1,382) (1,034)Allowance for doubtful receivables (1,055) (1,345) 290 (237)Others (83) (70) (11) (34) (3,416) (3,319) Deferred tax liabilities Difference in depreciation for tax purposes 17,912 16,826 1,019 5,324Fair value adjustments on business combinations 2,487 3,063 (212) (204)Fair value gain on forward currency contracts 92 – – – 20,491 19,889 Net deferred tax liabilities 17,075 16,570 (296) 3,815 Deferred tax assets and liabilities are offset when there is a legally enforceable right to set off current tax assets against current income tax liabilities and when the deferred taxes relate to the same taxable entity and the same taxation authority. The deferred tax amounts determined after appropriate offsetting are as follows:
Group 2015 2014 $’000 $’000 Deferred tax liabilities, net 17,075 16,570
At the end of the reporting period, the Group has undistributed earnings of subsidiaries for which deferred tax liabilities have not been recognised. No liability has been recognised in respect of these differences because the Group is in a position to control the timing of the reversal of the temporary differences and it is probable that the temporary differences will not reverse in the foreseeable future.
Such temporary differences for which no deferred tax liability has been recognised aggregate to $56,714,000 (2014: $50,729,000). The deferred tax liabilities are estimated to be $14,150,000 (2014: $12,702,000).
NOTES TO THE FINANCIAL STATEMENTSFor the financial year ended 30 June 2015
AS
L M
arin
e H
old
ing
s Lt
d.
/Ann
ual R
epor
t 20
15
136
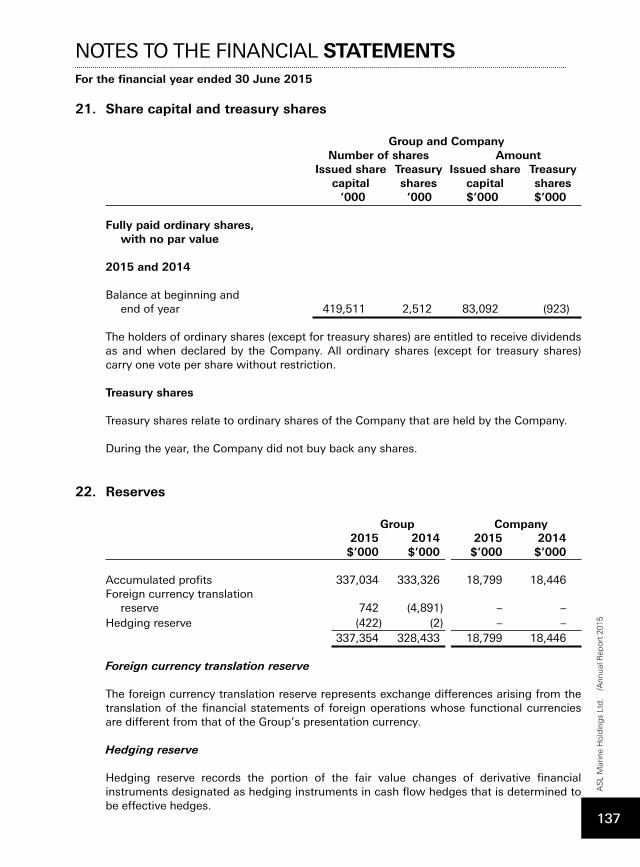
21. Share capital and treasury shares
Group and Company Number of shares Amount Issued share Treasury Issued share Treasury capital shares capital shares ’000 ’000 $’000 $’000 Fully paid ordinary shares, with no par value 2015 and 2014 Balance at beginning and end of year 419,511 2,512 83,092 (923) The holders of ordinary shares (except for treasury shares) are entitled to receive dividends as and when declared by the Company. All ordinary shares (except for treasury shares) carry one vote per share without restriction.
Treasury shares
Treasury shares relate to ordinary shares of the Company that are held by the Company.
During the year, the Company did not buy back any shares.
22. Reserves
Group Company 2015 2014 2015 2014 $’000 $’000 $’000 $’000 Accumulated profits 337,034 333,326 18,799 18,446Foreign currency translation reserve 742 (4,891) – –Hedging reserve (422) (2) – – 337,354 328,433 18,799 18,446
Foreigncurrencytranslationreserve
The foreign currency translation reserve represents exchange differences arising from the translation of the financial statements of foreign operations whose functional currencies are different from that of the Group’s presentation currency.
Hedgingreserve
Hedging reserve records the portion of the fair value changes of derivative financial instruments designated as hedging instruments in cash flow hedges that is determined to be effective hedges.
NOTES TO THE FINANCIAL STATEMENTSFor the financial year ended 30 June 2015
AS
L M
arin
e H
old
ing
s Lt
d.
/Ann
ual R
epor
t 20
15
137
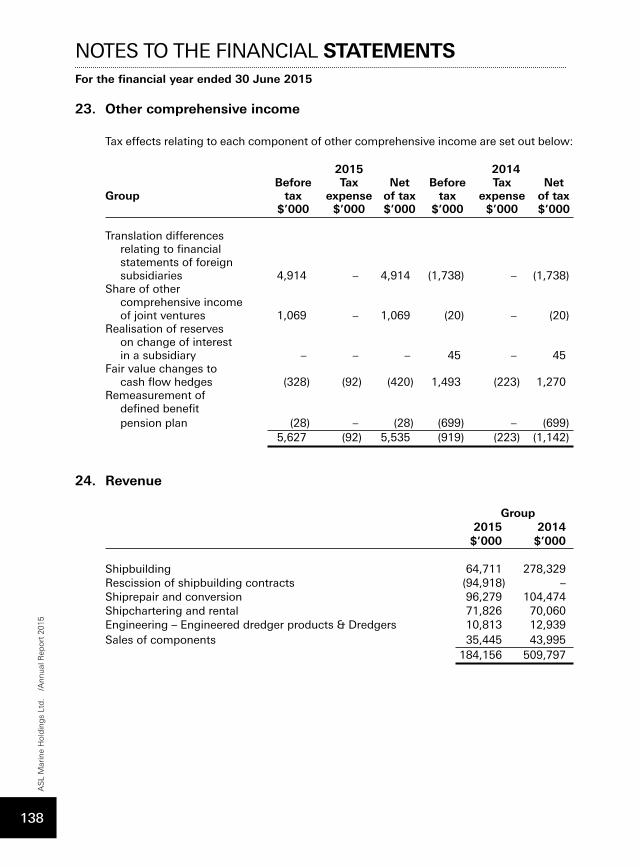
23. Other comprehensive income
Tax effects relating to each component of other comprehensive income are set out below:
2015 2014 Before Tax Net Before Tax NetGroup tax expense of tax tax expense of tax $’000 $’000 $’000 $’000 $’000 $’000 Translation differences relating to financial statements of foreign subsidiaries 4,914 – 4,914 (1,738) – (1,738)Share of other comprehensive income of joint ventures 1,069 – 1,069 (20) – (20)Realisation of reserves on change of interest in a subsidiary – – – 45 – 45Fair value changes to cash flow hedges (328) (92) (420) 1,493 (223) 1,270Remeasurement of defined benefit pension plan (28) – (28) (699) – (699) 5,627 (92) 5,535 (919) (223) (1,142)
24. Revenue
Group 2015 2014 $’000 $’000 Shipbuilding 64,711 278,329Rescission of shipbuilding contracts (94,918) –Shiprepair and conversion 96,279 104,474Shipchartering and rental 71,826 70,060Engineering – Engineered dredger products & Dredgers 10,813 12,939Sales of components 35,445 43,995 184,156 509,797
NOTES TO THE FINANCIAL STATEMENTSFor the financial year ended 30 June 2015
AS
L M
arin
e H
old
ing
s Lt
d.
/Ann
ual R
epor
t 20
15
138
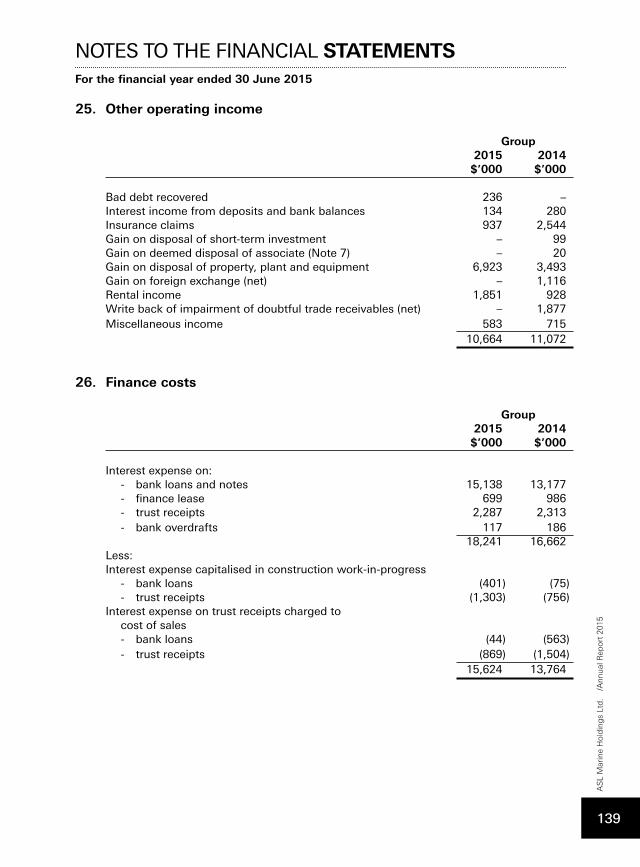
25. Other operating income
Group 2015 2014 $’000 $’000 Bad debt recovered 236 –Interest income from deposits and bank balances 134 280Insurance claims 937 2,544Gain on disposal of short-term investment – 99Gain on deemed disposal of associate (Note 7) – 20Gain on disposal of property, plant and equipment 6,923 3,493Gain on foreign exchange (net) – 1,116Rental income 1,851 928Write back of impairment of doubtful trade receivables (net) – 1,877Miscellaneous income 583 715 10,664 11,072
26. Finance costs
Group 2015 2014 $’000 $’000 Interest expense on: - bank loans and notes 15,138 13,177 - finance lease 699 986 - trust receipts 2,287 2,313 - bank overdrafts 117 186 18,241 16,662Less: Interest expense capitalised in construction work-in-progress - bank loans (401) (75) - trust receipts (1,303) (756)Interest expense on trust receipts charged to cost of sales - bank loans (44) (563) - trust receipts (869) (1,504) 15,624 13,764
NOTES TO THE FINANCIAL STATEMENTSFor the financial year ended 30 June 2015
AS
L M
arin
e H
old
ing
s Lt
d.
/Ann
ual R
epor
t 20
15
139
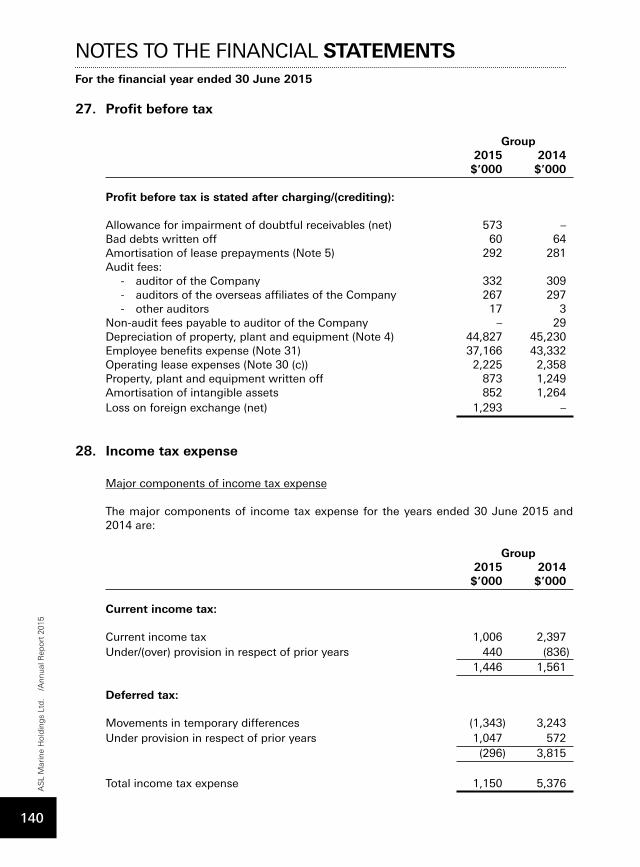
27. Profit before tax
Group 2015 2014 $’000 $’000
Profit before tax is stated after charging/(crediting): Allowance for impairment of doubtful receivables (net) 573 –Bad debts written off 60 64Amortisation of lease prepayments (Note 5) 292 281Audit fees: - auditor of the Company 332 309 - auditors of the overseas affiliates of the Company 267 297 - other auditors 17 3Non-audit fees payable to auditor of the Company – 29Depreciation of property, plant and equipment (Note 4) 44,827 45,230Employee benefits expense (Note 31) 37,166 43,332Operating lease expenses (Note 30 (c)) 2,225 2,358Property, plant and equipment written off 873 1,249Amortisation of intangible assets 852 1,264Loss on foreign exchange (net) 1,293 –
28. Income tax expense
Major components of income tax expense
The major components of income tax expense for the years ended 30 June 2015 and 2014 are:
Group 2015 2014 $’000 $’000 Current income tax: Current income tax 1,006 2,397Under/(over) provision in respect of prior years 440 (836) 1,446 1,561 Deferred tax: Movements in temporary differences (1,343) 3,243Under provision in respect of prior years 1,047 572 (296) 3,815
Total income tax expense 1,150 5,376
NOTES TO THE FINANCIAL STATEMENTSFor the financial year ended 30 June 2015
AS
L M
arin
e H
old
ing
s Lt
d.
/Ann
ual R
epor
t 20
15
140
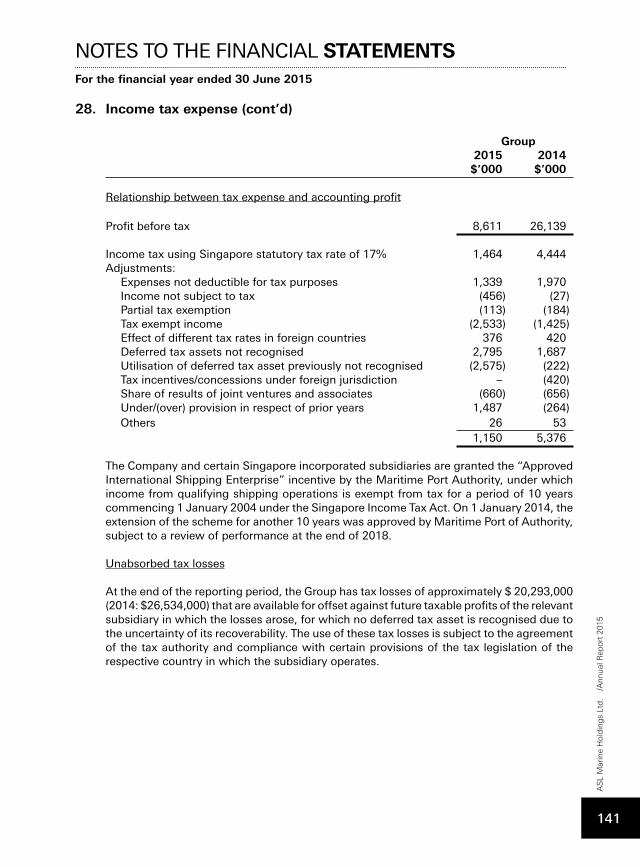
28. Income tax expense (cont’d)
Group 2015 2014 $’000 $’000 Relationship between tax expense and accounting profit Profit before tax 8,611 26,139 Income tax using Singapore statutory tax rate of 17% 1,464 4,444Adjustments: Expenses not deductible for tax purposes 1,339 1,970 Income not subject to tax (456) (27) Partial tax exemption (113) (184) Tax exempt income (2,533) (1,425) Effect of different tax rates in foreign countries 376 420 Deferred tax assets not recognised 2,795 1,687 Utilisation of deferred tax asset previously not recognised (2,575) (222) Tax incentives/concessions under foreign jurisdiction – (420) Share of results of joint ventures and associates (660) (656) Under/(over) provision in respect of prior years 1,487 (264) Others 26 53 1,150 5,376 The Company and certain Singapore incorporated subsidiaries are granted the “Approved International Shipping Enterprise” incentive by the Maritime Port Authority, under which income from qualifying shipping operations is exempt from tax for a period of 10 years commencing 1 January 2004 under the Singapore Income Tax Act. On 1 January 2014, the extension of the scheme for another 10 years was approved by Maritime Port of Authority, subject to a review of performance at the end of 2018.
Unabsorbed tax losses
At the end of the reporting period, the Group has tax losses of approximately $ 20,293,000 (2014: $26,534,000) that are available for offset against future taxable profits of the relevant subsidiary in which the losses arose, for which no deferred tax asset is recognised due to the uncertainty of its recoverability. The use of these tax losses is subject to the agreement of the tax authority and compliance with certain provisions of the tax legislation of the respective country in which the subsidiary operates.
NOTES TO THE FINANCIAL STATEMENTSFor the financial year ended 30 June 2015
AS
L M
arin
e H
old
ing
s Lt
d.
/Ann
ual R
epor
t 20
15
141
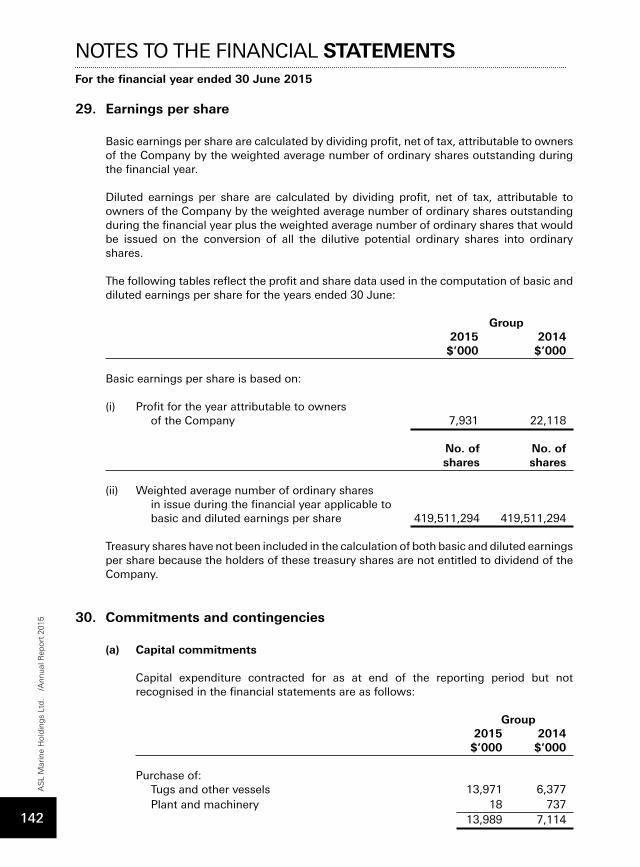
29. Earnings per share
Basic earnings per share are calculated by dividing profit, net of tax, attributable to owners of the Company by the weighted average number of ordinary shares outstanding during the financial year.
Diluted earnings per share are calculated by dividing profit, net of tax, attributable to owners of the Company by the weighted average number of ordinary shares outstanding during the financial year plus the weighted average number of ordinary shares that would be issued on the conversion of all the dilutive potential ordinary shares into ordinary shares.
The following tables reflect the profit and share data used in the computation of basic and diluted earnings per share for the years ended 30 June:
Group 2015 2014 $’000 $’000 Basic earnings per share is based on: (i) Profit for the year attributable to owners of the Company 7,931 22,118 No. of No. of shares shares
(ii) Weighted average number of ordinary shares in issue during the financial year applicable to basic and diluted earnings per share 419,511,294 419,511,294
Treasury shares have not been included in the calculation of both basic and diluted earnings per share because the holders of these treasury shares are not entitled to dividend of the Company.
30. Commitments and contingencies
(a) Capital commitments
Capital expenditure contracted for as at end of the reporting period but not recognised in the financial statements are as follows:
Group 2015 2014 $’000 $’000
Purchase of: Tugs and other vessels 13,971 6,377 Plant and machinery 18 737 13,989 7,114
NOTES TO THE FINANCIAL STATEMENTSFor the financial year ended 30 June 2015
AS
L M
arin
e H
old
ing
s Lt
d.
/Ann
ual R
epor
t 20
15
142
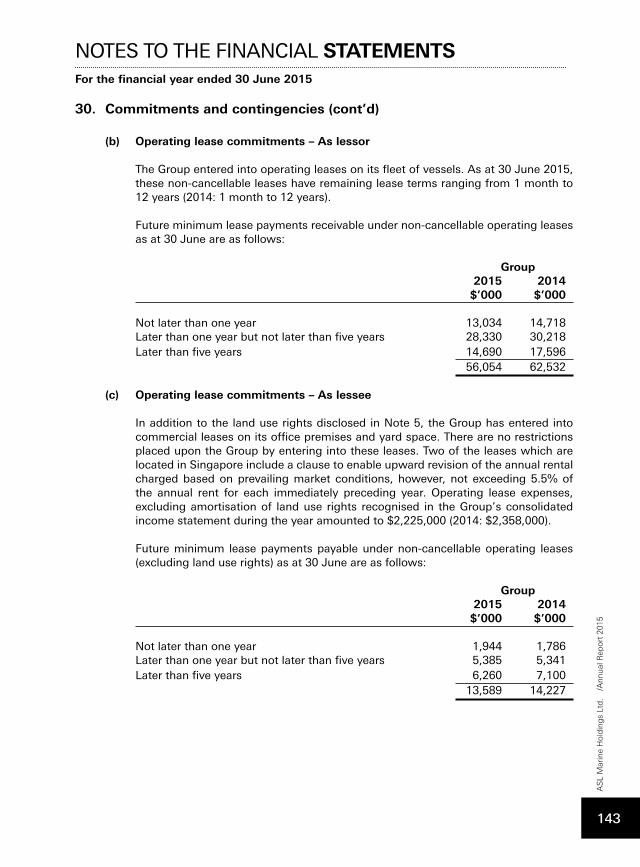
30. Commitments and contingencies (cont’d)
(b) Operating lease commitments – As lessor
The Group entered into operating leases on its fleet of vessels. As at 30 June 2015, these non-cancellable leases have remaining lease terms ranging from 1 month to 12 years (2014: 1 month to 12 years).
Future minimum lease payments receivable under non-cancellable operating leases as at 30 June are as follows:
Group 2015 2014 $’000 $’000
Not later than one year 13,034 14,718Later than one year but not later than five years 28,330 30,218Later than five years 14,690 17,596 56,054 62,532
(c) Operating lease commitments – As lessee
In addition to the land use rights disclosed in Note 5, the Group has entered into commercial leases on its office premises and yard space. There are no restrictions placed upon the Group by entering into these leases. Two of the leases which are located in Singapore include a clause to enable upward revision of the annual rental charged based on prevailing market conditions, however, not exceeding 5.5% of the annual rent for each immediately preceding year. Operating lease expenses, excluding amortisation of land use rights recognised in the Group’s consolidated income statement during the year amounted to $2,225,000 (2014: $2,358,000).
Future minimum lease payments payable under non-cancellable operating leases (excluding land use rights) as at 30 June are as follows:
Group 2015 2014 $’000 $’000
Not later than one year 1,944 1,786Later than one year but not later than five years 5,385 5,341Later than five years 6,260 7,100 13,589 14,227
NOTES TO THE FINANCIAL STATEMENTSFor the financial year ended 30 June 2015
AS
L M
arin
e H
old
ing
s Lt
d.
/Ann
ual R
epor
t 20
15
143
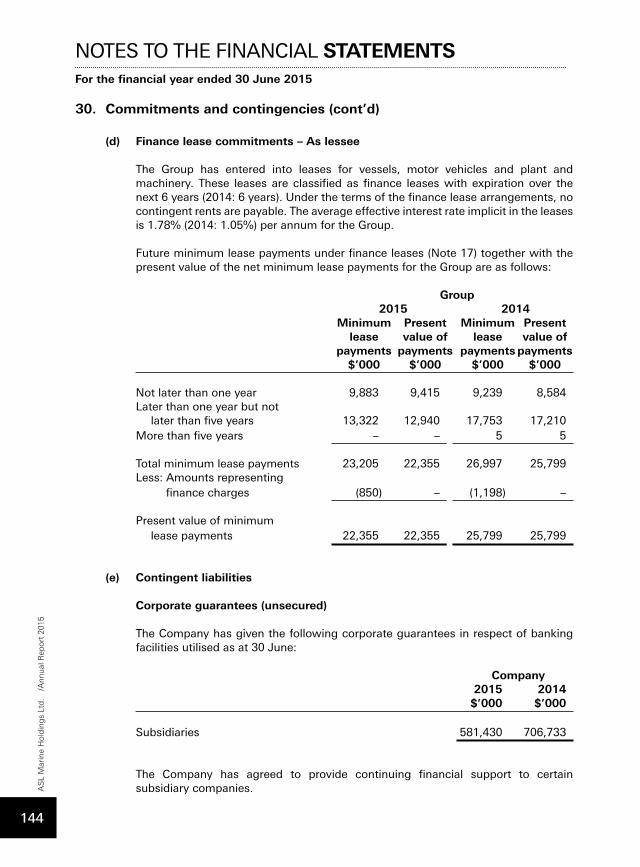
30. Commitments and contingencies (cont’d)
(d) Finance lease commitments – As lessee
The Group has entered into leases for vessels, motor vehicles and plant and machinery. These leases are classified as finance leases with expiration over the next 6 years (2014: 6 years). Under the terms of the finance lease arrangements, no contingent rents are payable. The average effective interest rate implicit in the leases is 1.78% (2014: 1.05%) per annum for the Group.
Future minimum lease payments under finance leases (Note 17) together with the present value of the net minimum lease payments for the Group are as follows:
Group 2015 2014 Minimum Present Minimum Present lease value of lease value of payments payments payments payments $’000 $’000 $’000 $’000 Not later than one year 9,883 9,415 9,239 8,584Later than one year but not later than five years 13,322 12,940 17,753 17,210More than five years – – 5 5 Total minimum lease payments 23,205 22,355 26,997 25,799Less: Amounts representing finance charges (850) – (1,198) – Present value of minimum lease payments 22,355 22,355 25,799 25,799
(e) Contingent liabilities
Corporate guarantees (unsecured)
The Company has given the following corporate guarantees in respect of banking facilities utilised as at 30 June:
Company 2015 2014 $’000 $’000
Subsidiaries 581,430 706,733
The Company has agreed to provide continuing financial support to certain subsidiary companies.
NOTES TO THE FINANCIAL STATEMENTSFor the financial year ended 30 June 2015
AS
L M
arin
e H
old
ing
s Lt
d.
/Ann
ual R
epor
t 20
15
144
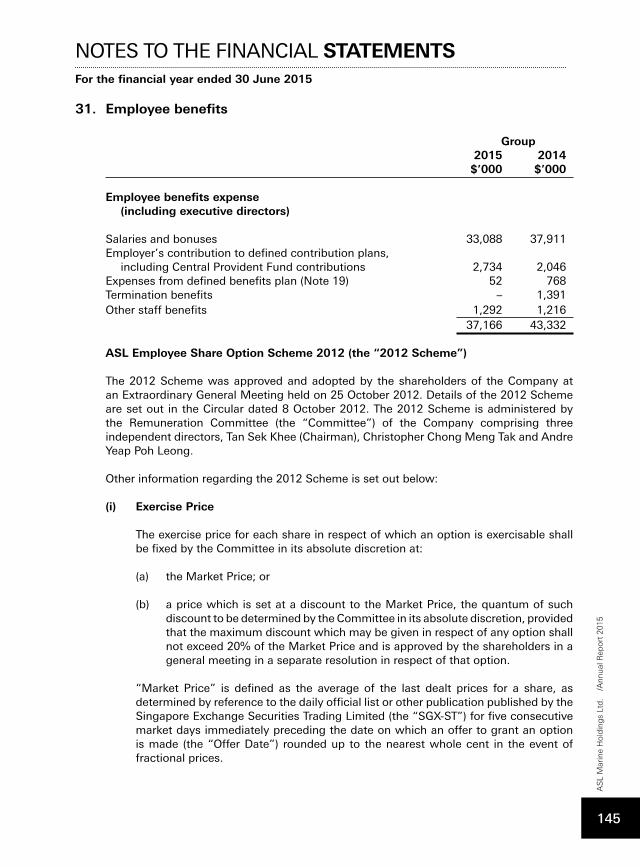
31. Employee benefits
Group 2015 2014 $’000 $’000 Employee benefits expense (including executive directors) Salaries and bonuses 33,088 37,911Employer’s contribution to defined contribution plans, including Central Provident Fund contributions 2,734 2,046Expenses from defined benefits plan (Note 19) 52 768Termination benefits – 1,391Other staff benefits 1,292 1,216 37,166 43,332
ASL Employee Share Option Scheme 2012 (the “2012 Scheme”)
The 2012 Scheme was approved and adopted by the shareholders of the Company at an Extraordinary General Meeting held on 25 October 2012. Details of the 2012 Scheme are set out in the Circular dated 8 October 2012. The 2012 Scheme is administered by the Remuneration Committee (the “Committee”) of the Company comprising three independent directors, Tan Sek Khee (Chairman), Christopher Chong Meng Tak and Andre Yeap Poh Leong. Other information regarding the 2012 Scheme is set out below:
(i) Exercise Price
The exercise price for each share in respect of which an option is exercisable shall be fixed by the Committee in its absolute discretion at:
(a) the Market Price; or
(b) a price which is set at a discount to the Market Price, the quantum of such discount to be determined by the Committee in its absolute discretion, provided that the maximum discount which may be given in respect of any option shall not exceed 20% of the Market Price and is approved by the shareholders in a general meeting in a separate resolution in respect of that option.
“Market Price” is defined as the average of the last dealt prices for a share, as determined by reference to the daily official list or other publication published by the Singapore Exchange Securities Trading Limited (the “SGX-ST”) for five consecutive market days immediately preceding the date on which an offer to grant an option is made (the “Offer Date”) rounded up to the nearest whole cent in the event of fractional prices.
NOTES TO THE FINANCIAL STATEMENTSFor the financial year ended 30 June 2015
AS
L M
arin
e H
old
ing
s Lt
d.
/Ann
ual R
epor
t 20
15
145
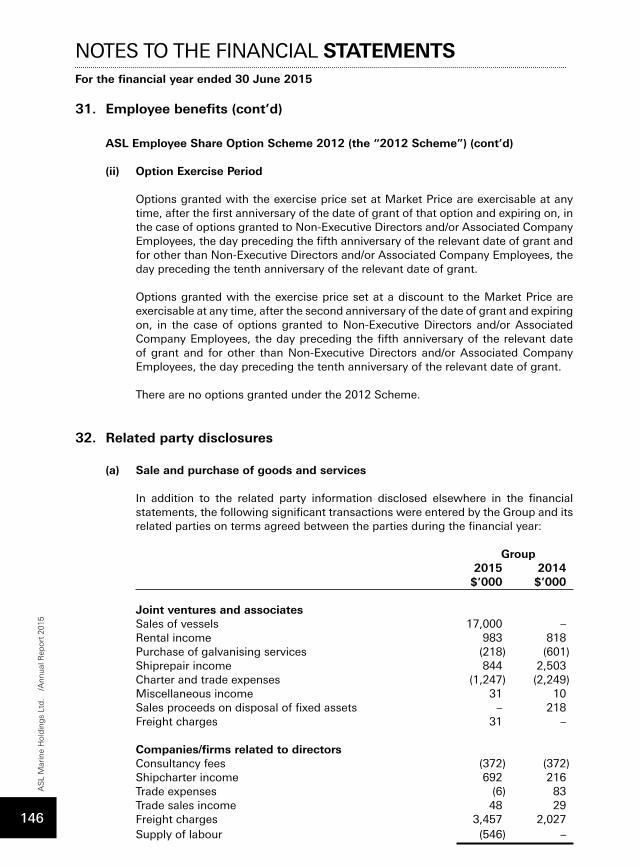
31. Employee benefits (cont’d)
ASL Employee Share Option Scheme 2012 (the “2012 Scheme”) (cont’d)
(ii) Option Exercise Period
Options granted with the exercise price set at Market Price are exercisable at any time, after the first anniversary of the date of grant of that option and expiring on, in the case of options granted to Non-Executive Directors and/or Associated Company Employees, the day preceding the fifth anniversary of the relevant date of grant and for other than Non-Executive Directors and/or Associated Company Employees, the day preceding the tenth anniversary of the relevant date of grant.
Options granted with the exercise price set at a discount to the Market Price are exercisable at any time, after the second anniversary of the date of grant and expiring on, in the case of options granted to Non-Executive Directors and/or Associated Company Employees, the day preceding the fifth anniversary of the relevant date of grant and for other than Non-Executive Directors and/or Associated Company Employees, the day preceding the tenth anniversary of the relevant date of grant.
There are no options granted under the 2012 Scheme.
32. Related party disclosures
(a) Sale and purchase of goods and services
In addition to the related party information disclosed elsewhere in the financial statements, the following significant transactions were entered by the Group and its related parties on terms agreed between the parties during the financial year:
Group 2015 2014 $’000 $’000 Joint ventures and associates Sales of vessels 17,000 –Rental income 983 818Purchase of galvanising services (218) (601)Shiprepair income 844 2,503Charter and trade expenses (1,247) (2,249)Miscellaneous income 31 10Sales proceeds on disposal of fixed assets – 218Freight charges 31 – Companies/firms related to directors Consultancy fees (372) (372)Shipcharter income 692 216Trade expenses (6) 83Trade sales income 48 29Freight charges 3,457 2,027Supply of labour (546) –
NOTES TO THE FINANCIAL STATEMENTSFor the financial year ended 30 June 2015
AS
L M
arin
e H
old
ing
s Lt
d.
/Ann
ual R
epor
t 20
15
146
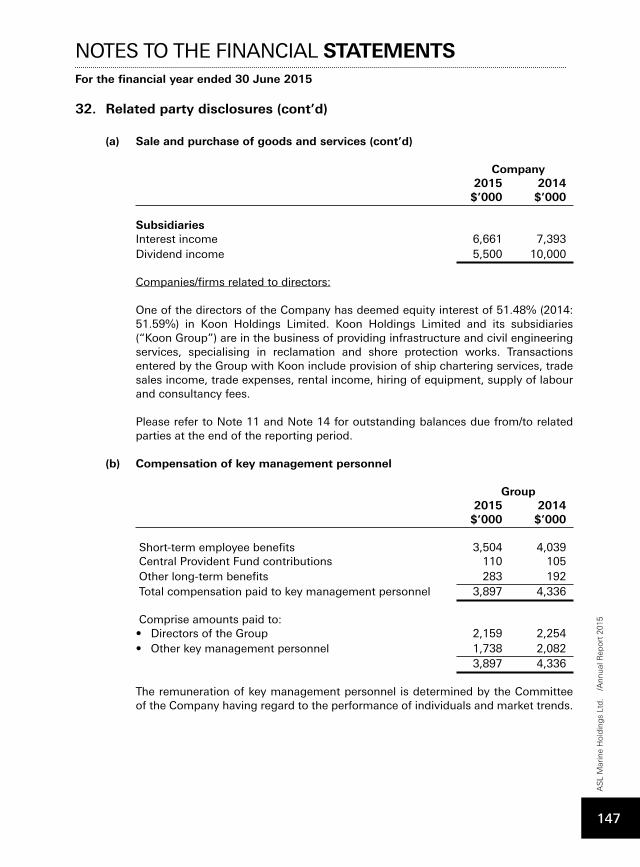
32. Related party disclosures (cont’d)
(a) Sale and purchase of goods and services (cont’d)
Company 2015 2014 $’000 $’000 Subsidiaries Interest income 6,661 7,393Dividend income 5,500 10,000 Companies/firms related to directors:
One of the directors of the Company has deemed equity interest of 51.48% (2014: 51.59%) in Koon Holdings Limited. Koon Holdings Limited and its subsidiaries (“Koon Group”) are in the business of providing infrastructure and civil engineering services, specialising in reclamation and shore protection works. Transactions entered by the Group with Koon include provision of ship chartering services, trade sales income, trade expenses, rental income, hiring of equipment, supply of labour and consultancy fees.
Please refer to Note 11 and Note 14 for outstanding balances due from/to related parties at the end of the reporting period.
(b) Compensation of key management personnel
Group 2015 2014 $’000 $’000
Short-term employee benefits 3,504 4,039 Central Provident Fund contributions 110 105 Other long-term benefits 283 192 Total compensation paid to key management personnel 3,897 4,336 Comprise amounts paid to: • Directors of the Group 2,159 2,254• Other key management personnel 1,738 2,082 3,897 4,336 The remuneration of key management personnel is determined by the Committee of the Company having regard to the performance of individuals and market trends.
NOTES TO THE FINANCIAL STATEMENTSFor the financial year ended 30 June 2015
AS
L M
arin
e H
old
ing
s Lt
d.
/Ann
ual R
epor
t 20
15
147
33. Financial risk management objectives and policies
The Group and the Company are exposed to financial risks arising from its operations and the use of financial instruments. The key financial risk includes market risk (interest rate risk and foreign currency risk), credit risk and liquidity risk arising from its business activities. The Group’s overall risk management strategy seeks to minimise the potential material adverse effects from these exposures. The Group uses financial instruments such as interest rate swaps and forward currency contracts to hedge certain financial risk exposures. It is the Group’s policy that no trading in derivative financial instruments shall be undertaken. Exposure to foreign currency risks is also hedged naturally where possible.
The Group’s policy on financial authority limit seeks to mitigate risks by setting out the threshold of approvals required for entry into contractual obligations and investments. The Board has overall responsibility for the establishment and oversight of the Group’s risk management framework. Risk management is carried out under policies approved by the Board. The Board reviews and approves policies for managing each of these risks and they are summarised below. There has been no change to the Group’s exposure to these financial risks or the manner in which it manages and measures the risks.
(a) Market risk
Market risk is the risk that changes in market prices, such as interest rates and foreign exchange rates will affect the Group’s income or the value of its holdings of financial instruments. The objective of market risk management is to manage and reduce market risk exposures within acceptable parameters.
(i) Interest rate risk
Interest rate risk is the risk that the fair value or future cash flows of the Group’s and the Company’s financial instruments will fluctuate because of changes in market interest rates. The Group’s exposures to interest rates relates primarily to interest-earning financial assets and interest-bearing financial liabilities, which includes bank balances and borrowings with financial institutions. The Group’s policy is to maintain an efficient and optimal interest cost structure using a mix of fixed and floating rate borrowings as well as long and short-term borrowings. The Group seeks to minimise its exposure to interest rate fluctuations through the use of interest rate swaps, where appropriate, over the duration of its borrowings. The Group classifies these interest rate swaps as cash flow hedges. The details of the interest rates relating to interest earning financial assets and interest bearing financial liabilities are disclosed in various notes to the financial statements.
NOTES TO THE FINANCIAL STATEMENTSFor the financial year ended 30 June 2015
AS
L M
arin
e H
old
ing
s Lt
d.
/Ann
ual R
epor
t 20
15
148
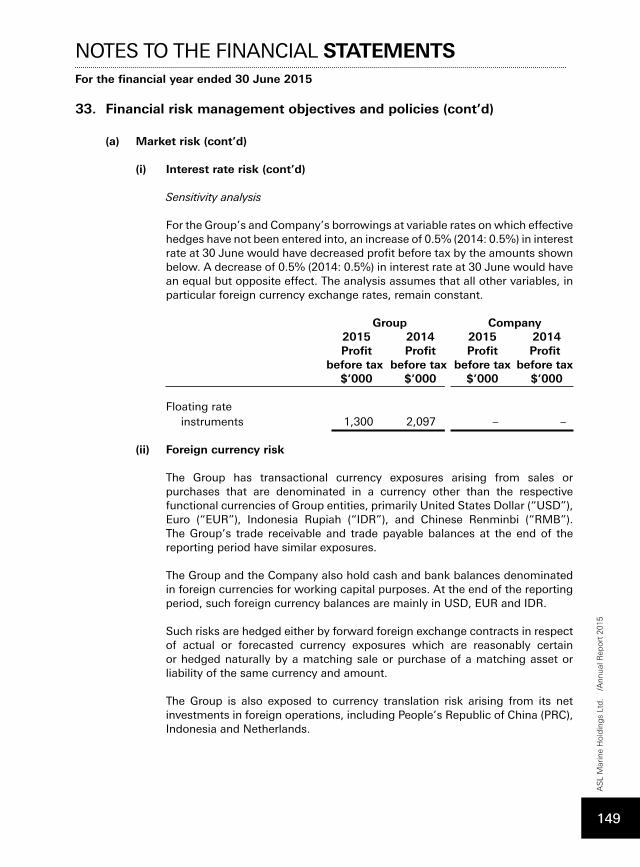
33. Financial risk management objectives and policies (cont’d)
(a) Market risk (cont’d)
(i) Interest rate risk (cont’d)
Sensitivity analysis
For the Group’s and Company’s borrowings at variable rates on which effective hedges have not been entered into, an increase of 0.5% (2014: 0.5%) in interest rate at 30 June would have decreased profit before tax by the amounts shown below. A decrease of 0.5% (2014: 0.5%) in interest rate at 30 June would have an equal but opposite effect. The analysis assumes that all other variables, in particular foreign currency exchange rates, remain constant.
Group Company 2015 2014 2015 2014 Profit Profit Profit Profit before tax before tax before tax before tax $’000 $’000 $’000 $’000 Floating rate
instruments 1,300 2,097 – – (ii) Foreign currency risk
The Group has transactional currency exposures arising from sales or purchases that are denominated in a currency other than the respective functional currencies of Group entities, primarily United States Dollar (“USD”), Euro (“EUR”), Indonesia Rupiah (“IDR”), and Chinese Renminbi (“RMB”). The Group’s trade receivable and trade payable balances at the end of the reporting period have similar exposures.
The Group and the Company also hold cash and bank balances denominated in foreign currencies for working capital purposes. At the end of the reporting period, such foreign currency balances are mainly in USD, EUR and IDR.
Such risks are hedged either by forward foreign exchange contracts in respect of actual or forecasted currency exposures which are reasonably certain or hedged naturally by a matching sale or purchase of a matching asset or liability of the same currency and amount.
The Group is also exposed to currency translation risk arising from its net investments in foreign operations, including People’s Republic of China (PRC), Indonesia and Netherlands.
NOTES TO THE FINANCIAL STATEMENTSFor the financial year ended 30 June 2015
AS
L M
arin
e H
old
ing
s Lt
d.
/Ann
ual R
epor
t 20
15
149
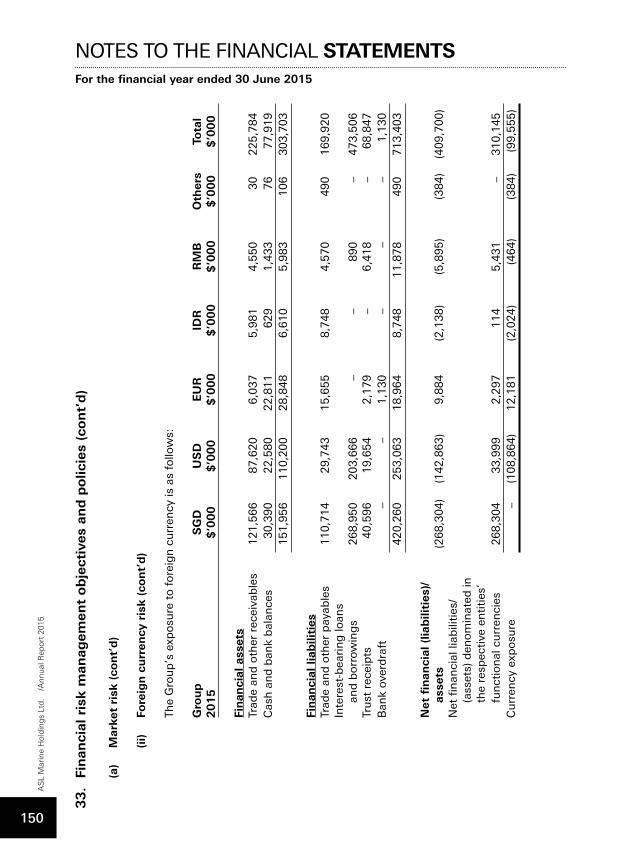
33.
Fin
anci
al r
isk m
anag
emen
t ob
ject
ives
an
d p
olic
ies
(con
t’d
)
(a)
Mar
ket
risk
(co
nt’
d)
(ii)
Fore
ign
cu
rren
cy r
isk (
con
t’d
)
The
Gro
up
’s e
xpo
sure
to
fo
reig
n c
urr
ency
is a
s fo
llow
s:
Gro
up
SG
D
US
D
EU
R
IDR
R
MB
O
ther
s To
tal
2015
$’0
00
$
’00
0
$’0
00
$
’00
0
$’0
00
$
’000
$
’00
0
Fi
nan
cial
ass
ets
Tr
ade
and
oth
er r
ecei
vab
les
121,5
66
87,6
20
6,0
37
5,9
81
4,5
50
30
225,7
84
Cas
h a
nd
ban
k b
alan
ces
30,3
90
22,5
80
22,8
11
629
1,4
33
76
77,9
19
151,9
56
110,2
00
28,8
48
6,6
10
5,9
83
106
303,7
03
Fin
anci
al lia
bili
ties
Trad
e an
d o
ther
pay
able
s
110,7
14
29,7
43
15,6
55
8,7
48
4,5
70
490
169,9
20
Inte
rest
-bea
rin
g lo
ans
and
bo
rrow
ing
s
268,9
50
203,6
66
– –
890
– 473,5
06
Tru
st r
ecei
pts
40,5
96
19,6
54
2,1
79
– 6,4
18
– 68,8
47
Ban
k ov
erd
raft
– –
1,1
30
– –
– 1,1
30
420,2
60
253,0
63
18,9
64
8,7
48
11,8
78
490
713,4
03
Net
fin
anci
al (
liab
iliti
es)/
asse
ts
(2
68,3
04)
(142,8
63)
9,8
84
(2,1
38)
(5,8
95)
(38
4)
(409,7
00)
Net
fin
anci
al li
abili
ties
/(a
sset
s) d
eno
min
ated
in
the
resp
ecti
ve e
nti
ties
’ fu
nct
ion
al c
urr
enci
es
268,3
04
33,9
99
2,2
97
114
5,4
31
– 310,1
45
Cu
rren
cy e
xpo
sure
– (1
08,8
64)
12,1
81
(2,0
24)
(464)
(384)
(99,5
55)
NOTES TO THE FINANCIAL STATEMENTSFor the financial year ended 30 June 2015
AS
L M
arin
e H
old
ing
s Lt
d.
/Ann
ual R
epor
t 20
15
150
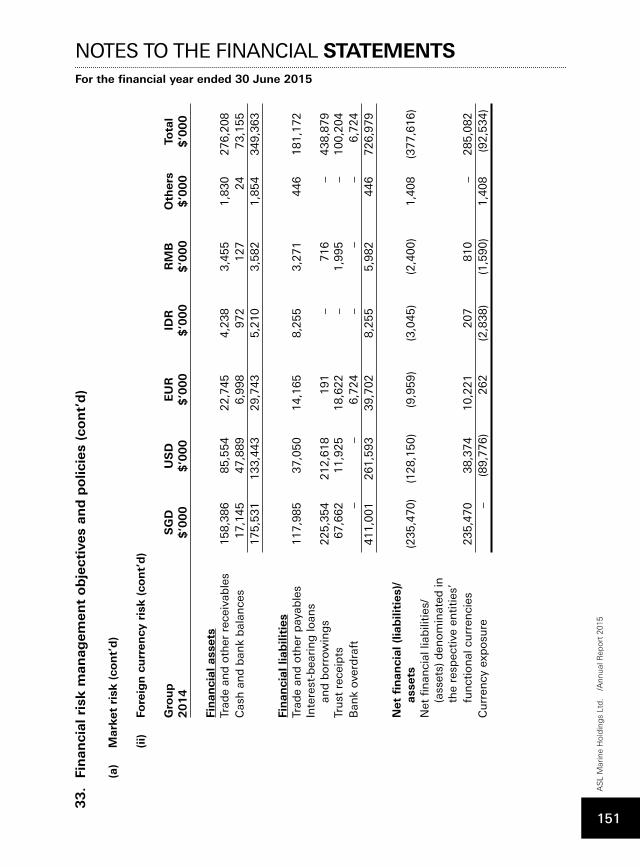
33.
Fin
anci
al r
isk m
anag
emen
t ob
ject
ives
an
d p
olic
ies
(con
t’d
)
(a)
Mar
ket
risk
(co
nt’
d)
(ii)
Fore
ign
cu
rren
cy r
isk (
con
t’d
)
Gro
up
SG
D
US
D
EU
R
IDR
R
MB
O
ther
s To
tal
2014
$’0
00
$
’00
0
$’0
00
$
’00
0
$’0
00
$
’000
$
’00
0
Fi
nan
cial
ass
ets
Tr
ade
and
oth
er r
ecei
vab
les
158,3
86
85,5
54
22,7
45
4,2
38
3,4
55
1,8
30
276,2
08
Cas
h a
nd
ban
k b
alan
ces
17,1
45
47,8
89
6,9
98
972
127
24
73,1
55
175,5
31
133,4
43
29,7
43
5,2
10
3,5
82
1,8
54
349,3
63
Fin
anci
al lia
bili
ties
Trad
e an
d o
ther
pay
able
s
117,9
85
37,0
50
14,1
65
8,2
55
3,2
71
446
181,1
72
Inte
rest
-bea
rin
g lo
ans
and
bo
rrow
ing
s
225,3
54
212,6
18
191
– 716
– 438,8
79
Tru
st r
ecei
pts
67,6
62
11,9
25
18,6
22
– 1,9
95
– 100,2
04
Ban
k ov
erd
raft
– –
6,7
24
– –
– 6,7
24
411,0
01
261,5
93
39,7
02
8,2
55
5,9
82
44
6
726,9
79
Net
fin
anci
al (
liab
iliti
es)/
asse
ts
(2
35,4
70)
(128,1
50)
(9,9
59)
(3,0
45)
(2,4
00)
1,4
08
(377,6
16)
Net
fin
anci
al li
abili
ties
/(a
sset
s) d
eno
min
ated
in
the
resp
ecti
ve e
nti
ties
’ fu
nct
ion
al c
urr
enci
es
235,4
70
38,3
74
10,2
21
207
810
– 285,0
82
Cu
rren
cy e
xpo
sure
– (8
9,7
76)
262
(2,8
38)
(1,5
90)
1,4
08
(92,5
34)
NOTES TO THE FINANCIAL STATEMENTSFor the financial year ended 30 June 2015
AS
L M
arin
e H
old
ing
s Lt
d.
/Ann
ual R
epor
t 20
15
151
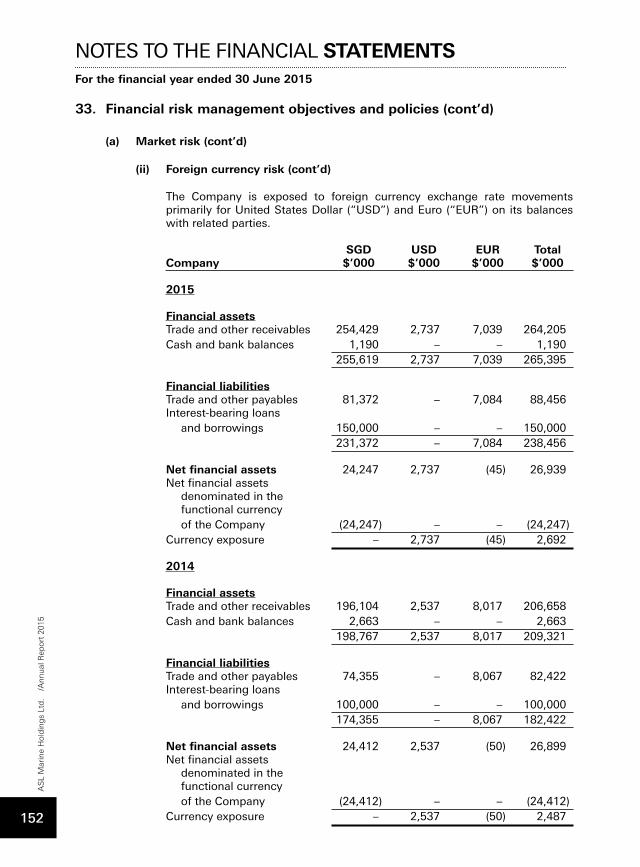
33. Financial risk management objectives and policies (cont’d)
(a) Market risk (cont’d)
(ii) Foreign currency risk (cont’d)
The Company is exposed to foreign currency exchange rate movements primarily for United States Dollar (“USD”) and Euro (“EUR”) on its balances with related parties.
SGD USD EUR TotalCompany $’000 $’000 $’000 $’000
2015 Financial assets Trade and other receivables 254,429 2,737 7,039 264,205Cash and bank balances 1,190 – – 1,190 255,619 2,737 7,039 265,395 Financial liabilities Trade and other payables 81,372 – 7,084 88,456Interest-bearing loans
and borrowings 150,000 – – 150,000 231,372 – 7,084 238,456 Net financial assets 24,247 2,737 (45) 26,939Net financial assets
denominated in thefunctional currencyof the Company (24,247) – – (24,247)
Currency exposure – 2,737 (45) 2,692 2014 Financial assets Trade and other receivables 196,104 2,537 8,017 206,658Cash and bank balances 2,663 – – 2,663 198,767 2,537 8,017 209,321 Financial liabilities Trade and other payables 74,355 – 8,067 82,422Interest-bearing loans
and borrowings 100,000 – – 100,000 174,355 – 8,067 182,422 Net financial assets 24,412 2,537 (50) 26,899Net financial assets
denominated in thefunctional currencyof the Company (24,412) – – (24,412)
Currency exposure – 2,537 (50) 2,487
NOTES TO THE FINANCIAL STATEMENTSFor the financial year ended 30 June 2015
AS
L M
arin
e H
old
ing
s Lt
d.
/Ann
ual R
epor
t 20
15
152
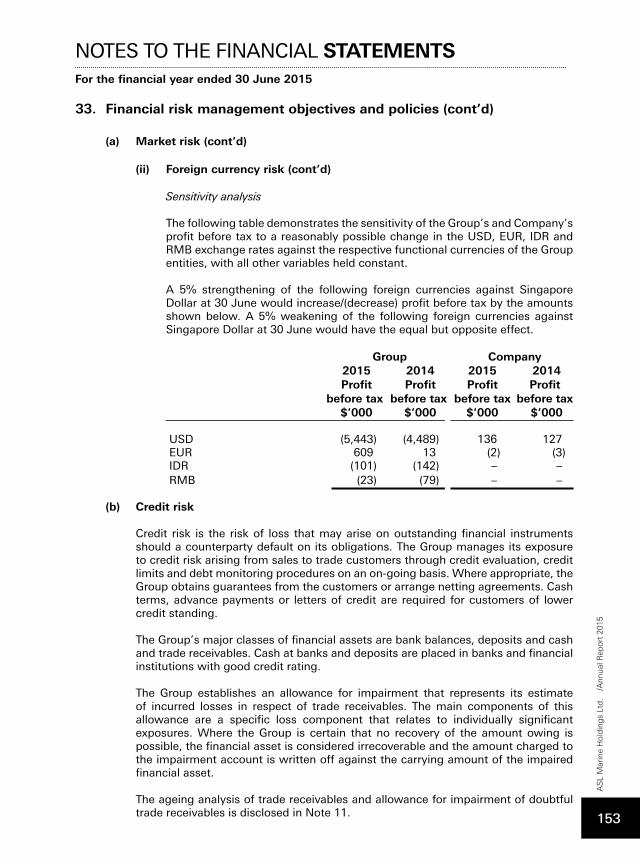
33. Financial risk management objectives and policies (cont’d)
(a) Market risk (cont’d)
(ii) Foreign currency risk (cont’d)
Sensitivity analysis
The following table demonstrates the sensitivity of the Group’s and Company’s profit before tax to a reasonably possible change in the USD, EUR, IDR and RMB exchange rates against the respective functional currencies of the Group entities, with all other variables held constant.
A 5% strengthening of the following foreign currencies against Singapore Dollar at 30 June would increase/(decrease) profit before tax by the amounts shown below. A 5% weakening of the following foreign currencies against Singapore Dollar at 30 June would have the equal but opposite effect.
Group Company 2015 2014 2015 2014 Profit Profit Profit Profit before tax before tax before tax before tax $’000 $’000 $’000 $’000 USD (5,443) (4,489) 136 127 EUR 609 13 (2) (3) IDR (101) (142) – – RMB (23) (79) – –
(b) Credit risk
Credit risk is the risk of loss that may arise on outstanding financial instruments should a counterparty default on its obligations. The Group manages its exposure to credit risk arising from sales to trade customers through credit evaluation, credit limits and debt monitoring procedures on an on-going basis. Where appropriate, the Group obtains guarantees from the customers or arrange netting agreements. Cash terms, advance payments or letters of credit are required for customers of lower credit standing.
The Group’s major classes of financial assets are bank balances, deposits and cash and trade receivables. Cash at banks and deposits are placed in banks and financial institutions with good credit rating.
The Group establishes an allowance for impairment that represents its estimate of incurred losses in respect of trade receivables. The main components of this allowance are a specific loss component that relates to individually significant exposures. Where the Group is certain that no recovery of the amount owing is possible, the financial asset is considered irrecoverable and the amount charged to the impairment account is written off against the carrying amount of the impaired financial asset.
The ageing analysis of trade receivables and allowance for impairment of doubtful trade receivables is disclosed in Note 11.
NOTES TO THE FINANCIAL STATEMENTSFor the financial year ended 30 June 2015
AS
L M
arin
e H
old
ing
s Lt
d.
/Ann
ual R
epor
t 20
15
153
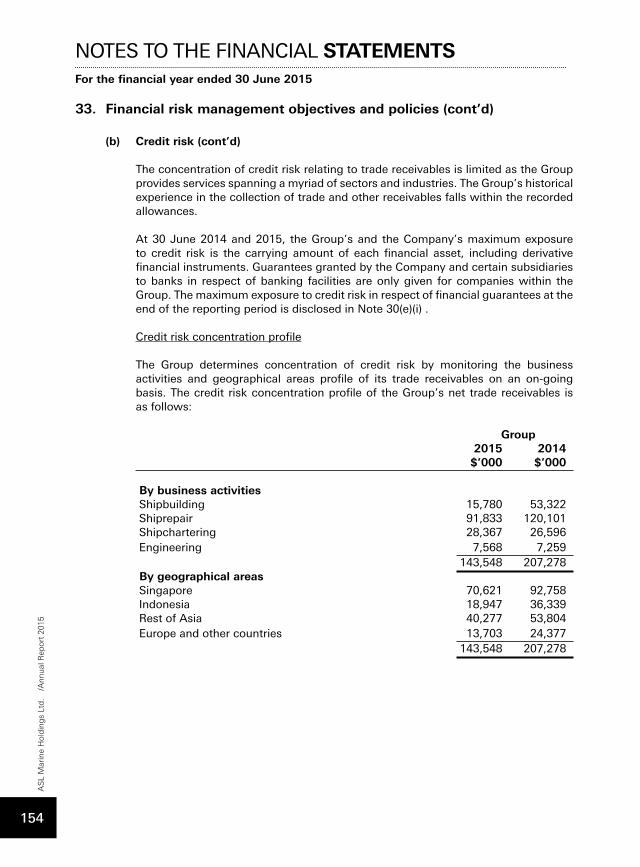
33. Financial risk management objectives and policies (cont’d)
(b) Credit risk (cont’d)
The concentration of credit risk relating to trade receivables is limited as the Group provides services spanning a myriad of sectors and industries. The Group’s historical experience in the collection of trade and other receivables falls within the recorded allowances.
At 30 June 2014 and 2015, the Group’s and the Company’s maximum exposure to credit risk is the carrying amount of each financial asset, including derivative financial instruments. Guarantees granted by the Company and certain subsidiaries to banks in respect of banking facilities are only given for companies within the Group. The maximum exposure to credit risk in respect of financial guarantees at the end of the reporting period is disclosed in Note 30(e)(i) .
Credit risk concentration profile
The Group determines concentration of credit risk by monitoring the business activities and geographical areas profile of its trade receivables on an on-going basis. The credit risk concentration profile of the Group’s net trade receivables is as follows:
Group 2015 2014 $’000 $’000 By business activities Shipbuilding 15,780 53,322 Shiprepair 91,833 120,101 Shipchartering 28,367 26,596 Engineering 7,568 7,259 143,548 207,278 By geographical areas Singapore 70,621 92,758 Indonesia 18,947 36,339 Rest of Asia 40,277 53,804 Europe and other countries 13,703 24,377 143,548 207,278
NOTES TO THE FINANCIAL STATEMENTSFor the financial year ended 30 June 2015
AS
L M
arin
e H
old
ing
s Lt
d.
/Ann
ual R
epor
t 20
15
154
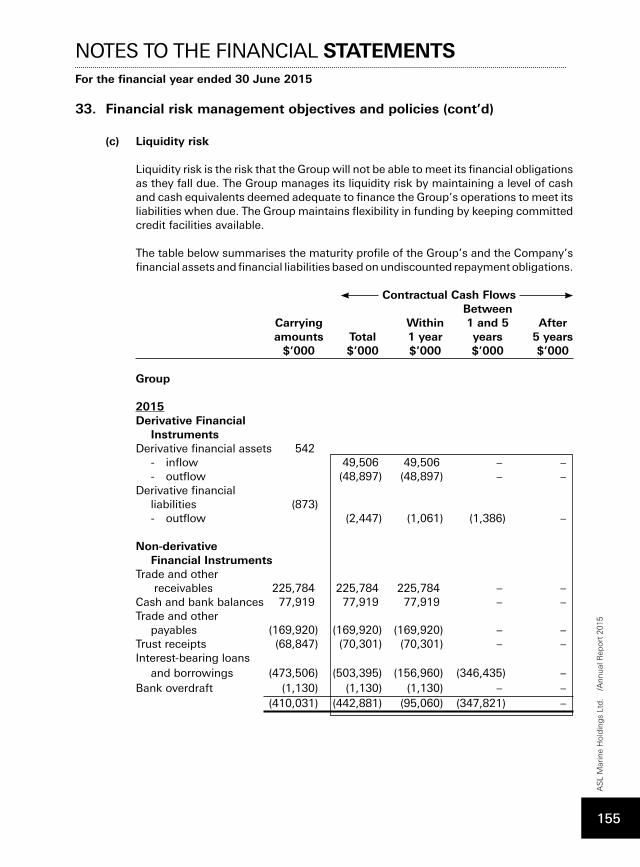
33. Financial risk management objectives and policies (cont’d)
(c) Liquidity risk
Liquidity risk is the risk that the Group will not be able to meet its financial obligations as they fall due. The Group manages its liquidity risk by maintaining a level of cash and cash equivalents deemed adequate to finance the Group’s operations to meet its liabilities when due. The Group maintains flexibility in funding by keeping committed credit facilities available.
The table below summarises the maturity profile of the Group’s and the Company’s financial assets and financial liabilities based on undiscounted repayment obligations.
Contractual Cash Flows Between Carrying Within 1 and 5 After amounts Total 1 year years 5 years $’000 $’000 $’000 $’000 $’000
Group 2015 Derivative Financial Instruments Derivative financial assets 542 - inflow 49,506 49,506 – – - outflow (48,897) (48,897) – –Derivative financial liabilities (873) - outflow (2,447) (1,061) (1,386) – Non-derivative Financial Instruments Trade and other receivables 225,784 225,784 225,784 – –Cash and bank balances 77,919 77,919 77,919 – –Trade and other payables (169,920) (169,920) (169,920) – –Trust receipts (68,847) (70,301) (70,301) – –Interest-bearing loans and borrowings (473,506) (503,395) (156,960) (346,435) –Bank overdraft (1,130) (1,130) (1,130) – – (410,031) (442,881) (95,060) (347,821) –
NOTES TO THE FINANCIAL STATEMENTSFor the financial year ended 30 June 2015
AS
L M
arin
e H
old
ing
s Lt
d.
/Ann
ual R
epor
t 20
15
155
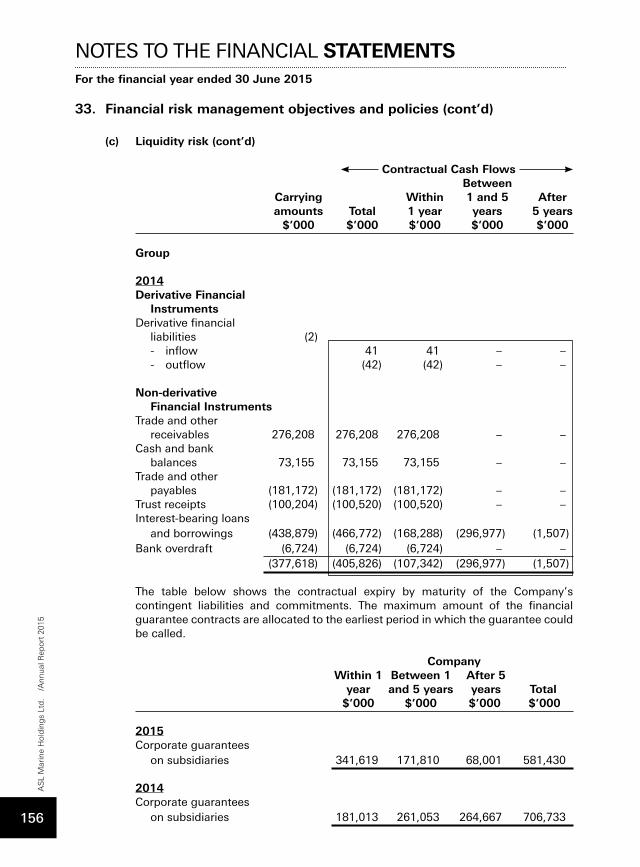
33. Financial risk management objectives and policies (cont’d)
(c) Liquidity risk (cont’d)
Contractual Cash Flows Between Carrying Within 1 and 5 After amounts Total 1 year years 5 years $’000 $’000 $’000 $’000 $’000
Group 2014 Derivative Financial Instruments Derivative financial liabilities (2) - inflow 41 41 – – - outflow (42) (42) – – Non-derivative Financial Instruments Trade and other receivables 276,208 276,208 276,208 – –Cash and bank balances 73,155 73,155 73,155 – –Trade and other payables (181,172) (181,172) (181,172) – –Trust receipts (100,204) (100,520) (100,520) – –Interest-bearing loans and borrowings (438,879) (466,772) (168,288) (296,977) (1,507)Bank overdraft (6,724) (6,724) (6,724) – – (377,618) (405,826) (107,342) (296,977) (1,507) The table below shows the contractual expiry by maturity of the Company’s contingent liabilities and commitments. The maximum amount of the financial guarantee contracts are allocated to the earliest period in which the guarantee could be called.
Company Within 1 Between 1 After 5 year and 5 years years Total $’000 $’000 $’000 $’000
2015 Corporate guarantees on subsidiaries 341,619 171,810 68,001 581,430 2014 Corporate guarantees on subsidiaries 181,013 261,053 264,667 706,733
NOTES TO THE FINANCIAL STATEMENTSFor the financial year ended 30 June 2015
AS
L M
arin
e H
old
ing
s Lt
d.
/Ann
ual R
epor
t 20
15
156
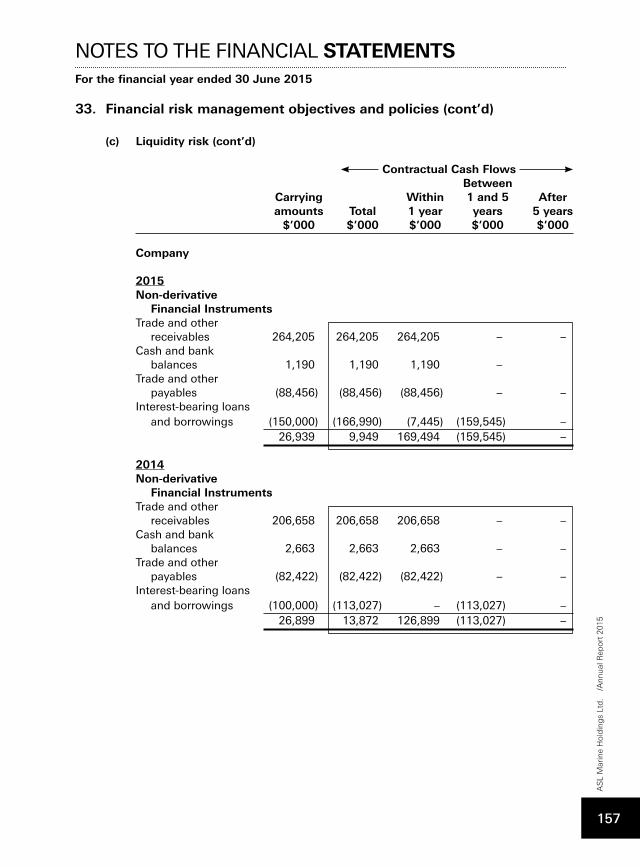
33. Financial risk management objectives and policies (cont’d)
(c) Liquidity risk (cont’d)
Contractual Cash Flows Between Carrying Within 1 and 5 After amounts Total 1 year years 5 years $’000 $’000 $’000 $’000 $’000
Company 2015 Non-derivative Financial Instruments Trade and other receivables 264,205 264,205 264,205 – –Cash and bank balances 1,190 1,190 1,190 – Trade and other payables (88,456) (88,456) (88,456) – –Interest-bearing loans and borrowings (150,000) (166,990) (7,445) (159,545) – 26,939 9,949 169,494 (159,545) – 2014 Non-derivative Financial Instruments Trade and other receivables 206,658 206,658 206,658 – –Cash and bank balances 2,663 2,663 2,663 – –Trade and other payables (82,422) (82,422) (82,422) – –Interest-bearing loans and borrowings (100,000) (113,027) – (113,027) – 26,899 13,872 126,899 (113,027) –
NOTES TO THE FINANCIAL STATEMENTSFor the financial year ended 30 June 2015
AS
L M
arin
e H
old
ing
s Lt
d.
/Ann
ual R
epor
t 20
15
157
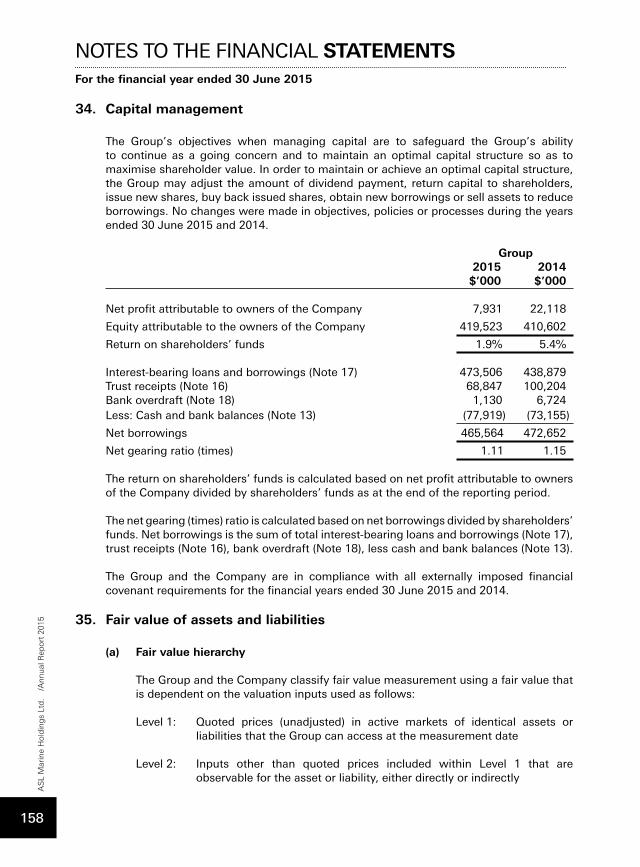
34. Capital management
The Group’s objectives when managing capital are to safeguard the Group’s ability to continue as a going concern and to maintain an optimal capital structure so as to maximise shareholder value. In order to maintain or achieve an optimal capital structure, the Group may adjust the amount of dividend payment, return capital to shareholders, issue new shares, buy back issued shares, obtain new borrowings or sell assets to reduce borrowings. No changes were made in objectives, policies or processes during the years ended 30 June 2015 and 2014.
Group 2015 2014 $’000 $’000 Net profit attributable to owners of the Company 7,931 22,118
Equity attributable to the owners of the Company 419,523 410,602
Return on shareholders’ funds 1.9% 5.4% Interest-bearing loans and borrowings (Note 17) 473,506 438,879Trust receipts (Note 16) 68,847 100,204Bank overdraft (Note 18) 1,130 6,724Less: Cash and bank balances (Note 13) (77,919) (73,155)
Net borrowings 465,564 472,652
Net gearing ratio (times) 1.11 1.15 The return on shareholders’ funds is calculated based on net profit attributable to owners of the Company divided by shareholders’ funds as at the end of the reporting period.
The net gearing (times) ratio is calculated based on net borrowings divided by shareholders’ funds. Net borrowings is the sum of total interest-bearing loans and borrowings (Note 17), trust receipts (Note 16), bank overdraft (Note 18), less cash and bank balances (Note 13).
The Group and the Company are in compliance with all externally imposed financial covenant requirements for the financial years ended 30 June 2015 and 2014.
35. Fair value of assets and liabilities
(a) Fair value hierarchy
The Group and the Company classify fair value measurement using a fair value that is dependent on the valuation inputs used as follows: Level 1: Quoted prices (unadjusted) in active markets of identical assets or
liabilities that the Group can access at the measurement date Level 2: Inputs other than quoted prices included within Level 1 that are
observable for the asset or liability, either directly or indirectly
NOTES TO THE FINANCIAL STATEMENTSFor the financial year ended 30 June 2015
AS
L M
arin
e H
old
ing
s Lt
d.
/Ann
ual R
epor
t 20
15
158
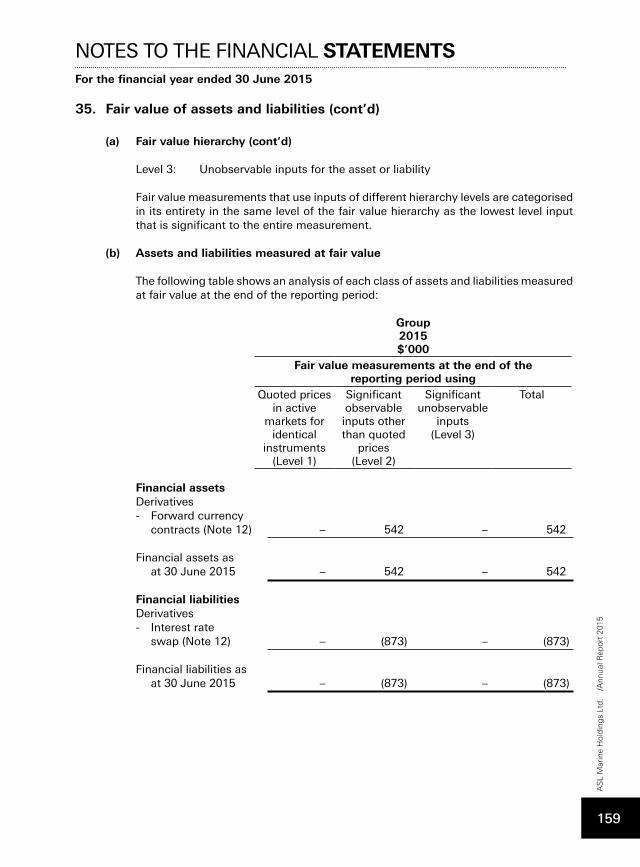
35. Fair value of assets and liabilities (cont’d)
(a) Fair value hierarchy (cont’d)
Level 3: Unobservable inputs for the asset or liability
Fair value measurements that use inputs of different hierarchy levels are categorised in its entirety in the same level of the fair value hierarchy as the lowest level input that is significant to the entire measurement.
(b) Assets and liabilities measured at fair value
The following table shows an analysis of each class of assets and liabilities measured at fair value at the end of the reporting period:
Group2015$’000
Fair value measurements at the end of the reporting period using
Quoted prices in active
markets for identical
instruments (Level 1)
Significant observable inputs other than quoted
prices (Level 2)
Significant unobservable
inputs (Level 3)
Total
Financial assets Derivatives - Forward currency contracts (Note 12) – 542 – 542 Financial assets as at 30 June 2015 – 542 – 542 Financial liabilities Derivatives - Interest rate swap (Note 12) – (873) – (873) Financial liabilities as at 30 June 2015 – (873) – (873)
NOTES TO THE FINANCIAL STATEMENTSFor the financial year ended 30 June 2015
AS
L M
arin
e H
old
ing
s Lt
d.
/Ann
ual R
epor
t 20
15
159
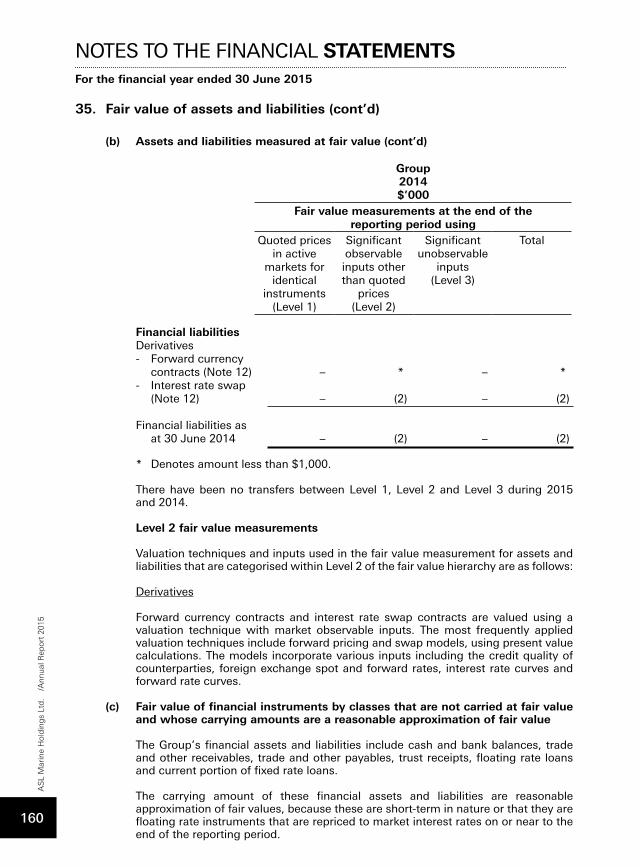
35. Fair value of assets and liabilities (cont’d)
(b) Assets and liabilities measured at fair value (cont’d)
Group2014$’000
Fair value measurements at the end of the reporting period using
Quoted prices in active
markets for identical
instruments (Level 1)
Significant observable inputs other than quoted
prices (Level 2)
Significant unobservable
inputs (Level 3)
Total
Financial liabilities Derivatives - Forward currency contracts (Note 12) – * – *- Interest rate swap (Note 12) – (2) – (2) Financial liabilities as at 30 June 2014 – (2) – (2) * Denotes amount less than $1,000.
There have been no transfers between Level 1, Level 2 and Level 3 during 2015 and 2014.
Level 2 fair value measurements
Valuation techniques and inputs used in the fair value measurement for assets and liabilities that are categorised within Level 2 of the fair value hierarchy are as follows:
Derivatives
Forward currency contracts and interest rate swap contracts are valued using a valuation technique with market observable inputs. The most frequently applied valuation techniques include forward pricing and swap models, using present value calculations. The models incorporate various inputs including the credit quality of counterparties, foreign exchange spot and forward rates, interest rate curves and forward rate curves.
(c) Fair value of financial instruments by classes that are not carried at fair value and whose carrying amounts are a reasonable approximation of fair value
The Group’s financial assets and liabilities include cash and bank balances, trade and other receivables, trade and other payables, trust receipts, floating rate loans and current portion of fixed rate loans.
The carrying amount of these financial assets and liabilities are reasonable approximation of fair values, because these are short-term in nature or that they are floating rate instruments that are repriced to market interest rates on or near to the end of the reporting period.
NOTES TO THE FINANCIAL STATEMENTSFor the financial year ended 30 June 2015
AS
L M
arin
e H
old
ing
s Lt
d.
/Ann
ual R
epor
t 20
15
160
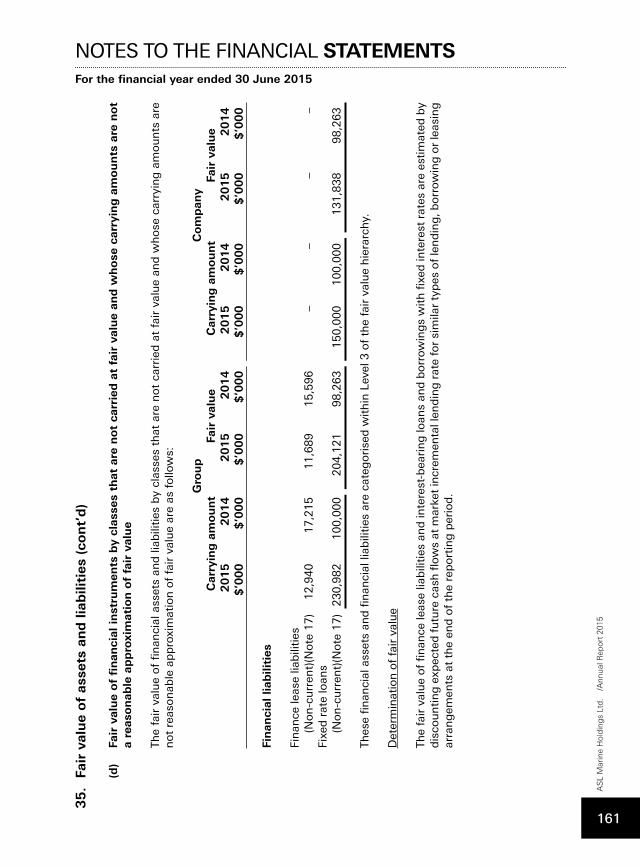
35.
Fair
val
ue
of
asse
ts a
nd
lia
bili
ties
(co
nt’
d)
(d)
Fair
val
ue
of
fin
anci
al in
stru
men
ts b
y cl
asse
s th
at a
re n
ot
carr
ied
at
fair
val
ue
and
wh
ose
car
ryin
g a
mou
nts
are
not
a re
ason
able
ap
pro
xim
atio
n o
f fa
ir v
alu
e
The
fair
val
ue
of
fin
anci
al a
sset
s an
d li
abili
ties
by
clas
ses
that
are
no
t ca
rrie
d a
t fa
ir v
alu
e an
d w
ho
se c
arry
ing
am
ou
nts
are
n
ot
reas
on
able
ap
pro
xim
atio
n o
f fa
ir v
alu
e ar
e as
fo
llow
s:
G
rou
p
Com
pan
y
Car
ryin
g a
mou
nt
Fair
val
ue
Car
ryin
g a
mou
nt
Fair
val
ue
2015
20
14
2
01
5
20
14
2
01
5
20
14
2
01
5
20
14
$’0
00
$’0
00
$
’00
0
$’0
00
$
’00
0
$’0
00
$
’00
0
$’0
00
Fin
anci
al lia
bili
ties
Fin
ance
leas
e lia
bili
ties
(N
on
-cu
rren
t)(N
ote
17)
12,9
40
17,2
15
11,6
89
15,5
96
– –
– –
Fixe
d r
ate
loan
s
(No
n-c
urr
ent)
(No
te 1
7)
230,9
82
100,0
00
204,1
21
98,2
63
150,0
00
100,0
00
131,8
38
98,2
63
Thes
e fi
nan
cial
ass
ets
and
fin
anci
al li
abili
ties
are
cat
ego
rise
d w
ith
in L
evel
3 o
f th
e fa
ir v
alu
e h
iera
rch
y.
Det
erm
inat
ion
of
fair
val
ue
The
fair
val
ue
of
fin
ance
leas
e lia
bili
ties
an
d in
tere
st-b
eari
ng
loan
s an
d b
orr
owin
gs
wit
h fi
xed
inte
rest
rat
es a
re e
stim
ated
by
dis
cou
nti
ng
exp
ecte
d f
utu
re c
ash
flow
s at
mar
ket
incr
emen
tal l
end
ing
rat
e fo
r si
mila
r ty
pes
of
len
din
g, b
orr
owin
g o
r le
asin
g
arra
ng
emen
ts a
t th
e en
d o
f th
e re
po
rtin
g p
erio
d.
NOTES TO THE FINANCIAL STATEMENTSFor the financial year ended 30 June 2015
AS
L M
arin
e H
old
ing
s Lt
d.
/Ann
ual R
epor
t 20
15
161
36. Segment reporting
Reporting format
The primary segment reporting format is determined to be business segments as the Group’s risks and rates of return are affected predominantly by differences in the products and services produced. Secondary information is reported geographically. The operating businesses are organised and managed separately according to the nature of the products and services provided, with each segment representing a strategic business unit that offers different products and serves different markets.
Business segments
The Group has the following five main business segments:
Shipbuilding : Construction of vessels
Shiprepair and conversion : Provision of shiprepair and related services
Shipchartering and rental : Provision for chartering of vessels, transportation services and rental of plant and machinery
Engineering : Provision of dredging engineering products and services
Investment holding : Investment holding
Geographical segments
The Group operates in Singapore, Indonesia, Rest of Asia, Europe and other countries. In presenting information on the basis of geographical segments, segment revenue is based on the countries in which customers are invoiced.
Assets and capital expenditure are attributed to the location of those assets.
Allocation basis and transfer pricing
Segment results, assets and liabilities include items directly attributable to a segment as well as those that can be allocated on a reasonable basis. Group financing (including finance costs) and income taxes are managed on a group basis and are not allocated to operating segments.
Transfer prices between business segments are set on an arm’s length basis in a manner similar to transactions with third parties. Segment revenue, expenses and results include transfers between business segments. These transfers are eliminated on consolidation.
NOTES TO THE FINANCIAL STATEMENTSFor the financial year ended 30 June 2015
AS
L M
arin
e H
old
ing
s Lt
d.
/Ann
ual R
epor
t 20
15
162
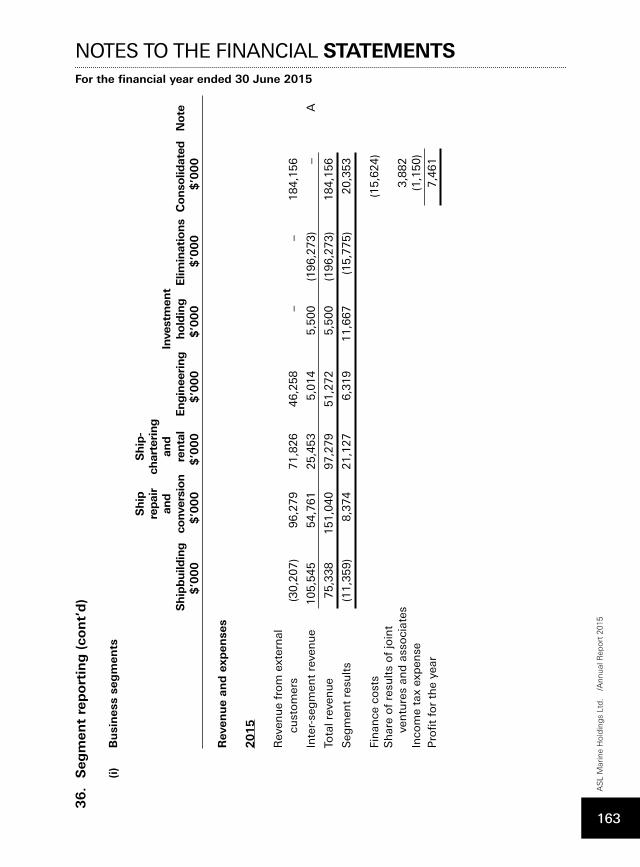
36.
Seg
men
t re
port
ing
(co
nt’
d)
(i)
B
usi
nes
s se
gm
ents
S
hip
S
hip
-
repai
r ch
arte
ring
an
d
and
In
vest
men
t
S
hip
build
ing
conve
rsio
n
renta
l Engin
eeri
ng
hold
ing
Elim
inat
ions
Conso
lidat
ed
Not e
$’0
00
$’0
00
$
’00
0
$’0
00
$
’00
0
$’0
00
$
’00
0
Rev
enu
e an
d e
xpen
ses
2015
R
even
ue
fro
m e
xter
nal
cu
sto
mer
s (3
0,2
07)
96,2
79
71,8
26
46,2
58
– –
184,1
56
Inte
r-se
gm
ent
reve
nu
e 105,5
45
54,7
61
25,4
53
5,0
14
5,5
00
(196,2
73)
– A
Tota
l rev
enu
e 75,3
38
151,0
40
97,2
79
51,2
72
5,5
00
(196,2
73)
184,1
56
Seg
men
t re
sult
s (1
1,3
59)
8,3
74
21,1
27
6,3
19
11,6
67
(15,7
75)
20,3
53
Fin
ance
co
sts
(15,6
24)
Sh
are
of
resu
lts
of
join
t
ven
ture
s an
d a
sso
ciat
es
3,8
82
Inco
me
tax
exp
ense
(1
,150)
Pro
fit
for
the
year
7,4
61
NOTES TO THE FINANCIAL STATEMENTSFor the financial year ended 30 June 2015
AS
L M
arin
e H
old
ing
s Lt
d.
/Ann
ual R
epor
t 20
15
163
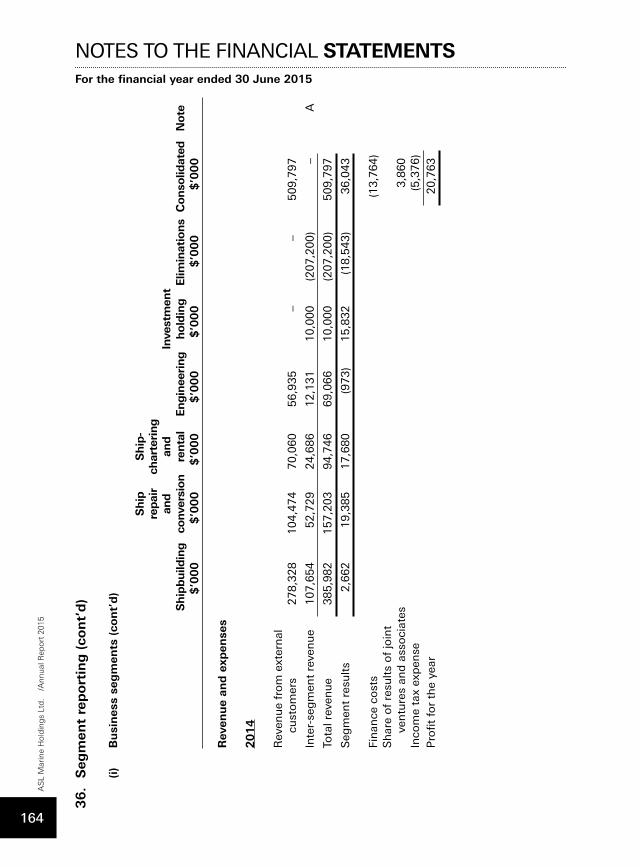
36.
Seg
men
t re
port
ing
(co
nt’
d)
(i)
B
usi
nes
s se
gm
ents
(co
nt’
d)
S
hip
S
hip
-
repai
r ch
arte
ring
an
d
and
In
vest
men
t
S
hip
build
ing
conve
rsio
n
renta
l Engin
eeri
ng
hold
ing
Elim
inat
ions
Conso
lidat
ed
Not e
$’0
00
$’0
00
$
’00
0
$’0
00
$
’00
0
$’0
00
$
’00
0
Rev
enu
e an
d e
xpen
ses
2014
R
even
ue
fro
m e
xter
nal
cu
sto
mer
s 278,3
28
104,4
74
70,0
60
56,9
35
– –
509,7
97
Inte
r-se
gm
ent
reve
nu
e 107,6
54
52,7
29
24,6
86
12,1
31
10,0
00
(207,2
00)
– A
Tota
l rev
enu
e 385,9
82
157,2
03
94,7
46
69,0
66
10,0
00
(207,2
00)
509,7
97
Seg
men
t re
sult
s 2,6
62
19,3
85
17,6
80
(973)
15,8
32
(18,5
43)
36,0
43
Fin
ance
co
sts
(13,7
64)
Sh
are
of
resu
lts
of
join
t
ven
ture
s an
d a
sso
ciat
es
3,8
60
Inco
me
tax
exp
ense
(5
,376)
Pro
fit
for
the
year
20,7
63
NOTES TO THE FINANCIAL STATEMENTSFor the financial year ended 30 June 2015
AS
L M
arin
e H
old
ing
s Lt
d.
/Ann
ual R
epor
t 20
15
164
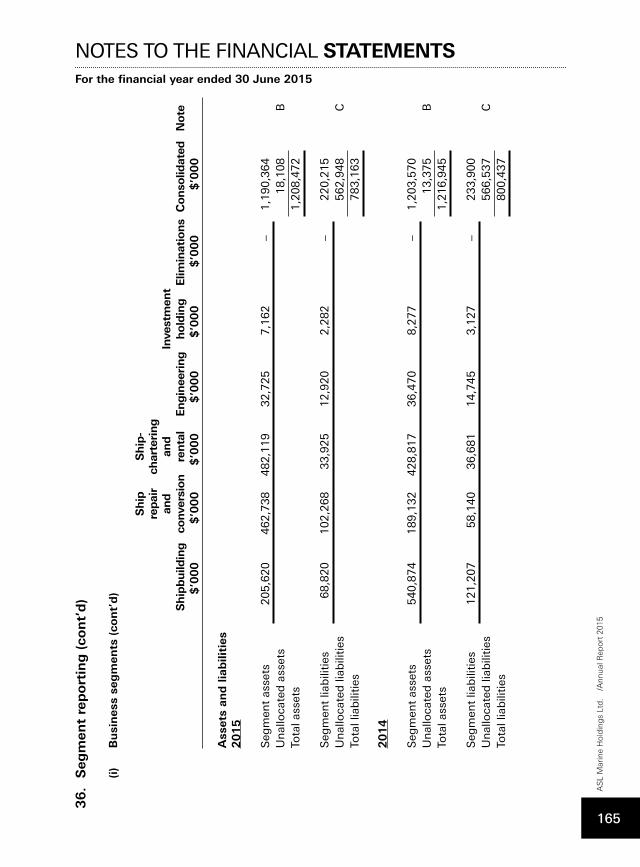
NOTES TO THE FINANCIAL STATEMENTSFor the financial year ended 30 June 2015
36.
Seg
men
t re
port
ing
(co
nt’
d)
(i)
B
usi
nes
s se
gm
ents
(co
nt’
d)
S
hip
S
hip
-
repai
r ch
arte
ring
an
d
and
In
vest
men
t
S
hip
build
ing
conve
rsio
n
renta
l Engin
eeri
ng
hold
ing
Elim
inat
ions
Conso
lidat
ed
Not e
$’0
00
$’0
00
$
’00
0
$’0
00
$
’00
0
$’0
00
$
’00
0
Ass
ets
and
lia
bili
ties
2015
Seg
men
t as
sets
205,6
20
462,7
38
482,1
19
32,7
25
7,1
62
– 1,1
90
,364
Un
allo
cate
d a
sset
s
18,1
08
BTo
tal a
sset
s
1,2
08
,472
Seg
men
t lia
bili
ties
68,8
20
102,2
68
33,9
25
12,9
20
2,2
82
– 220,2
15
Un
allo
cate
d li
abili
ties
562,9
48
CTo
tal l
iab
iliti
es
783,1
63
2014
Seg
men
t as
sets
540,8
74
18
9,1
32
428,8
17
36,4
70
8,2
77
– 1,2
03
,570
Un
allo
cate
d a
sset
s
13,3
75
BTo
tal a
sset
s
1,2
16
,945
Seg
men
t lia
bili
ties
121,2
07
58,1
40
36,6
81
14,7
45
3,1
27
– 233,9
00
Un
allo
cate
d li
abili
ties
566,5
37
CTo
tal l
iab
iliti
es
800,4
37
AS
L M
arin
e H
old
ing
s Lt
d.
/Ann
ual R
epor
t 20
15
165
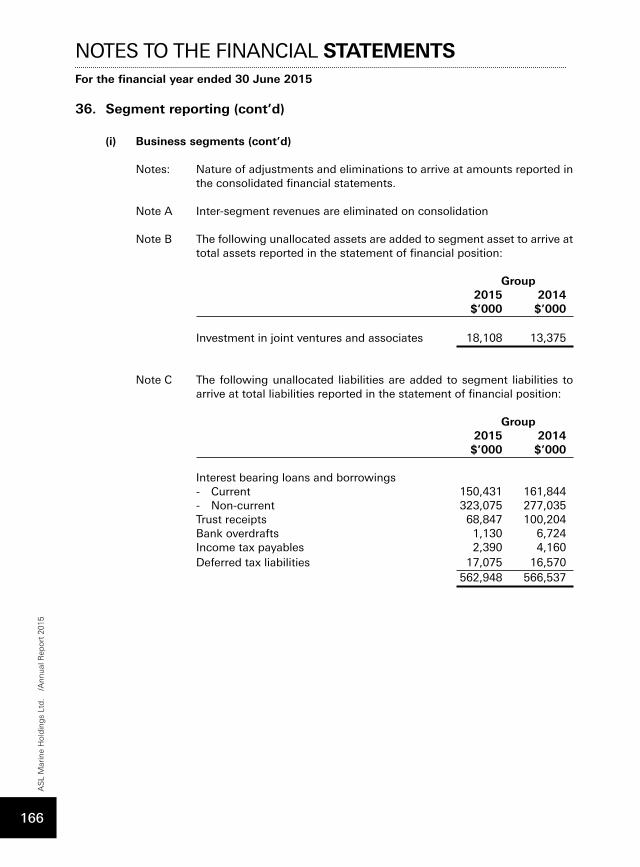
NOTES TO THE FINANCIAL STATEMENTSFor the financial year ended 30 June 2015
36. Segment reporting (cont’d)
(i) Business segments (cont’d)
Notes: Nature of adjustments and eliminations to arrive at amounts reported in the consolidated financial statements.
Note A Inter-segment revenues are eliminated on consolidation
Note B The following unallocated assets are added to segment asset to arrive at total assets reported in the statement of financial position:
Group 2015 2014
$’000 $’000
Investment in joint ventures and associates 18,108 13,375
Note C The following unallocated liabilities are added to segment liabilities to arrive at total liabilities reported in the statement of financial position:
Group 2015 2014
$’000 $’000
Interest bearing loans and borrowings - Current 150,431 161,844- Non-current 323,075 277,035Trust receipts 68,847 100,204Bank overdrafts 1,130 6,724Income tax payables 2,390 4,160Deferred tax liabilities 17,075 16,570 562,948 566,537
AS
L M
arin
e H
old
ing
s Lt
d.
/Ann
ual R
epor
t 20
15
166
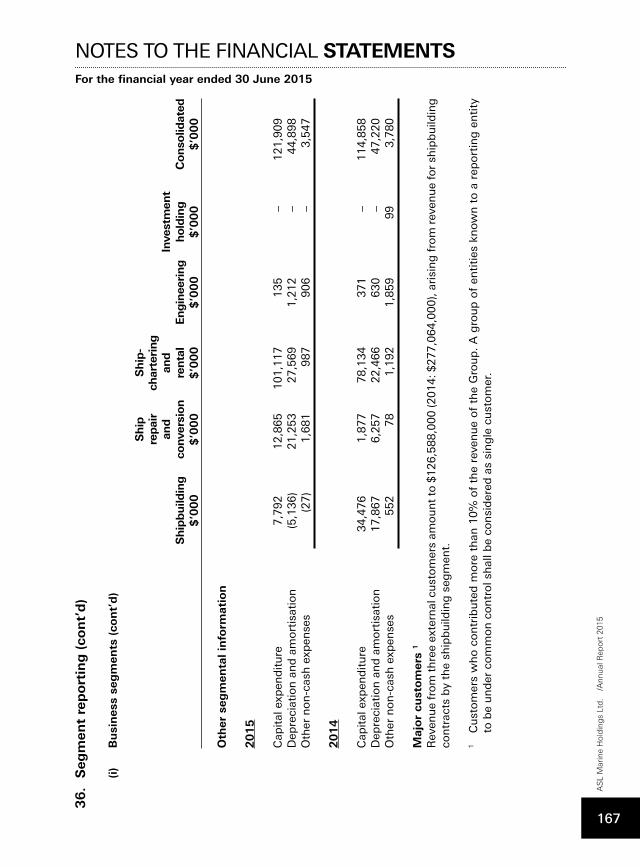
NOTES TO THE FINANCIAL STATEMENTSFor the financial year ended 30 June 2015
36.
Seg
men
t re
port
ing
(co
nt’
d)
(i)
B
usi
nes
s se
gm
ents
(co
nt’
d)
S
hip
S
hip
-
repai
r ch
arte
ring
an
d
and
In
vest
men
t
S
hip
build
ing
conve
rsio
n
renta
l Engin
eeri
ng
hold
ing
Conso
lidat
ed
$
’00
0
$’0
00
$
’00
0
$’0
00
$
’00
0
$’0
00
Oth
er s
egm
enta
l in
form
atio
n
2015
C
apit
al e
xpen
dit
ure
7
,792
12,8
65
101,1
17
135
– 121,9
09
Dep
reci
atio
n a
nd
am
ort
isat
ion
(5
,136)
21,2
53
27,5
69
1,2
12
– 44,8
98
Oth
er n
on
-cas
h e
xpen
ses
(27)
1,6
81
987
906
– 3,5
47
2014
C
apit
al e
xpen
dit
ure
34,4
76
1,8
77
78,1
34
371
– 114,8
58
Dep
reci
atio
n a
nd
am
ort
isat
ion
17,8
67
6,2
57
22,4
66
630
– 47,2
20
Oth
er n
on
-cas
h e
xpen
ses
552
78
1,1
92
1,8
59
99
3,7
80
Maj
or
cust
om
ers
1
Rev
enu
e fr
om
th
ree
exte
rnal
cu
sto
mer
s am
ou
nt
to $
126,5
88,0
00 (2
014: $
277,0
64,0
00),
ari
sin
g f
rom
rev
enu
e fo
r sh
ipb
uild
ing
co
ntr
acts
by
the
ship
bu
ildin
g s
egm
ent.
1
Cu
sto
mer
s w
ho
co
ntr
ibu
ted
mo
re t
han
10%
of
the
reve
nu
e o
f th
e G
rou
p.
A g
rou
p o
f en
titi
es k
now
n t
o a
rep
ort
ing
en
tity
to
be
un
der
co
mm
on
co
ntr
ol s
hal
l be
con
sid
ered
as
sin
gle
cu
sto
mer
.
AS
L M
arin
e H
old
ing
s Lt
d.
/Ann
ual R
epor
t 20
15
167
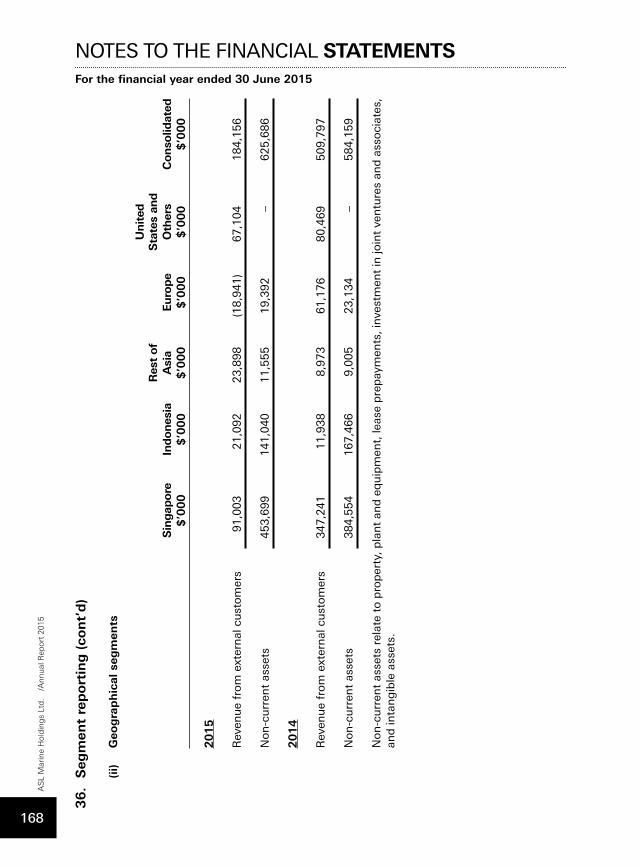
NOTES TO THE FINANCIAL STATEMENTSFor the financial year ended 30 June 2015
36.
Seg
men
t re
port
ing
(co
nt’
d)
(ii)
Geo
gra
ph
ical
seg
men
ts
Unit
ed
R
est
of
Sta
tes
and
Sin
gap
ore
In
dones
ia
Asi
a Euro
pe
Oth
ers
Conso
lidat
ed
$
’00
0
$’0
00
$
’00
0
$’0
00
$
’00
0
$’0
00
2015
R
even
ue
fro
m e
xter
nal
cu
sto
mer
s 91,0
03
21,0
92
23,8
98
(18,9
41)
67,1
04
184,1
56
N
on
-cu
rren
t as
sets
453,6
99
141,0
40
11,5
55
19,3
92
– 625,6
86
2014
R
even
ue
fro
m e
xter
nal
cu
sto
mer
s 347,2
41
11,9
38
8,9
73
61,1
76
80,4
69
509,7
97
N
on
-cu
rren
t as
sets
384,5
54
167,4
66
9,0
05
23,1
34
– 584,1
59
N
on
-cu
rren
t as
sets
rel
ate
to p
rop
erty
, pla
nt
and
eq
uip
men
t, le
ase
pre
pay
men
ts, i
nve
stm
ent
in jo
int
ven
ture
s an
d a
sso
ciat
es,
and
inta
ng
ible
ass
ets.
AS
L M
arin
e H
old
ing
s Lt
d.
/Ann
ual R
epor
t 20
15
168
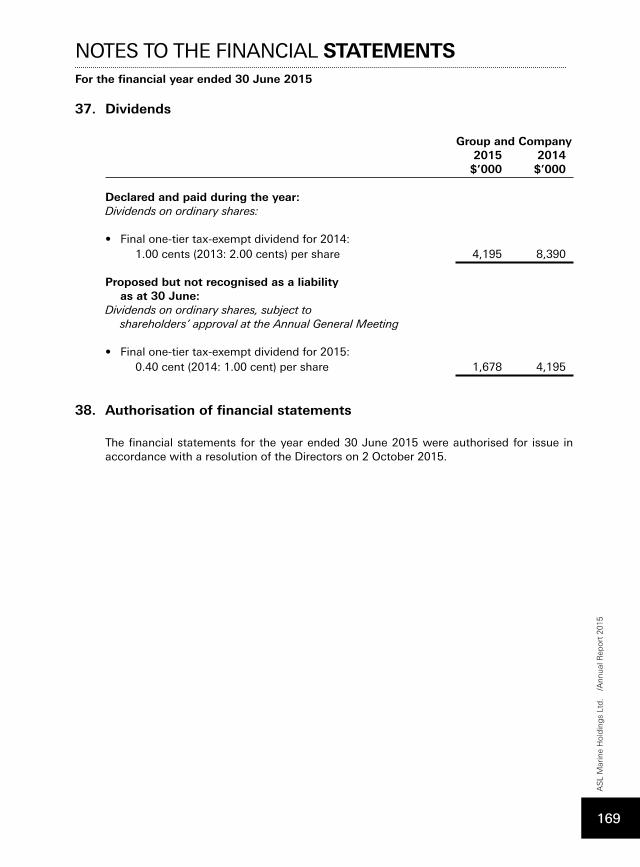
NOTES TO THE FINANCIAL STATEMENTSFor the financial year ended 30 June 2015
37. Dividends
Group and Company 2015 2014 $’000 $’000 Declared and paid during the year: Dividends on ordinary shares: • Final one-tier tax-exempt dividend for 2014: 1.00 cents (2013: 2.00 cents) per share 4,195 8,390 Proposed but not recognised as a liability as at 30 June: Dividends on ordinary shares, subject to shareholders’ approval at the Annual General Meeting • Final one-tier tax-exempt dividend for 2015: 0.40 cent (2014: 1.00 cent) per share 1,678 4,195
38. Authorisation of financial statements
The financial statements for the year ended 30 June 2015 were authorised for issue in accordance with a resolution of the Directors on 2 October 2015.
AS
L M
arin
e H
old
ing
s Lt
d.
/Ann
ual R
epor
t 20
15
169
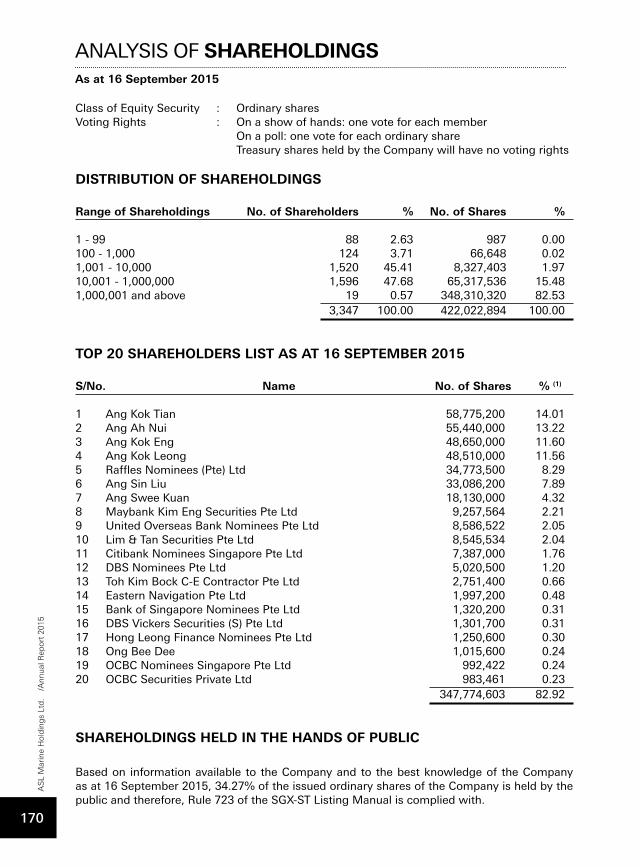
ANALYSIS OF SHAREHOLDINGSAs at 16 September 2015
Class of Equity Security : Ordinary sharesVoting Rights : On a show of hands: one vote for each member On a poll: one vote for each ordinary share Treasury shares held by the Company will have no voting rights DISTRIBUTION OF SHAREHOLDINGS
Range of Shareholdings No. of Shareholders % No. of Shares %
1 - 99 88 2.63 987 0.00100 - 1,000 124 3.71 66,648 0.021,001 - 10,000 1,520 45.41 8,327,403 1.9710,001 - 1,000,000 1,596 47.68 65,317,536 15.481,000,001 and above 19 0.57 348,310,320 82.53 3,347 100.00 422,022,894 100.00
TOP 20 SHAREHOLDERS LIST AS AT 16 SEPTEMBER 2015
S/No. Name No. of Shares % (1)
1 Ang Kok Tian 58,775,200 14.01 2 Ang Ah Nui 55,440,000 13.22 3 Ang Kok Eng 48,650,000 11.60 4 Ang Kok Leong 48,510,000 11.56 5 Raffles Nominees (Pte) Ltd 34,773,500 8.29 6 Ang Sin Liu 33,086,200 7.89 7 Ang Swee Kuan 18,130,000 4.32 8 Maybank Kim Eng Securities Pte Ltd 9,257,564 2.21 9 United Overseas Bank Nominees Pte Ltd 8,586,522 2.05 10 Lim & Tan Securities Pte Ltd 8,545,534 2.04 11 Citibank Nominees Singapore Pte Ltd 7,387,000 1.76 12 DBS Nominees Pte Ltd 5,020,500 1.20 13 Toh Kim Bock C-E Contractor Pte Ltd 2,751,400 0.66 14 Eastern Navigation Pte Ltd 1,997,200 0.48 15 Bank of Singapore Nominees Pte Ltd 1,320,200 0.31 16 DBS Vickers Securities (S) Pte Ltd 1,301,700 0.31 17 Hong Leong Finance Nominees Pte Ltd 1,250,600 0.30 18 Ong Bee Dee 1,015,600 0.24 19 OCBC Nominees Singapore Pte Ltd 992,422 0.24 20 OCBC Securities Private Ltd 983,461 0.23 347,774,603 82.92
SHAREHOLDINGS HELD IN THE HANDS OF PUBLIC
Based on information available to the Company and to the best knowledge of the Company as at 16 September 2015, 34.27% of the issued ordinary shares of the Company is held by the public and therefore, Rule 723 of the SGX-ST Listing Manual is complied with.
AS
L M
arin
e H
old
ing
s Lt
d.
/Ann
ual R
epor
t 20
15
170
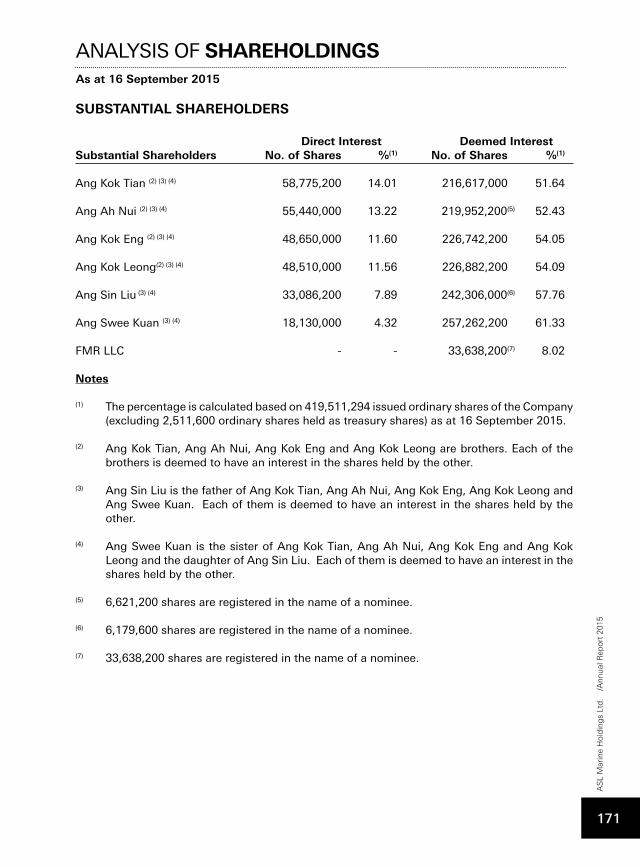
ANALYSIS OF SHAREHOLDINGSAs at 16 September 2015
SUBSTANTIAL SHAREHOLDERS
Direct Interest Deemed InterestSubstantial Shareholders No. of Shares %(1) No. of Shares %(1)
Ang Kok Tian (2) (3) (4) 58,775,200 14.01 216,617,000 51.64
Ang Ah Nui (2) (3) (4) 55,440,000 13.22 219,952,200(5) 52.43
Ang Kok Eng (2) (3) (4) 48,650,000 11.60 226,742,200 54.05
Ang Kok Leong(2) (3) (4) 48,510,000 11.56 226,882,200 54.09
Ang Sin Liu (3) (4) 33,086,200 7.89 242,306,000(6) 57.76
Ang Swee Kuan (3) (4) 18,130,000 4.32 257,262,200 61.33
FMR LLC - - 33,638,200(7) 8.02
Notes
(1) The percentage is calculated based on 419,511,294 issued ordinary shares of the Company (excluding 2,511,600 ordinary shares held as treasury shares) as at 16 September 2015.
(2) Ang Kok Tian, Ang Ah Nui, Ang Kok Eng and Ang Kok Leong are brothers. Each of the brothers is deemed to have an interest in the shares held by the other.
(3) Ang Sin Liu is the father of Ang Kok Tian, Ang Ah Nui, Ang Kok Eng, Ang Kok Leong and Ang Swee Kuan. Each of them is deemed to have an interest in the shares held by the other.
(4) Ang Swee Kuan is the sister of Ang Kok Tian, Ang Ah Nui, Ang Kok Eng and Ang Kok Leong and the daughter of Ang Sin Liu. Each of them is deemed to have an interest in the shares held by the other.
(5) 6,621,200 shares are registered in the name of a nominee.
(6) 6,179,600 shares are registered in the name of a nominee.
(7) 33,638,200 shares are registered in the name of a nominee.
AS
L M
arin
e H
old
ing
s Lt
d.
/Ann
ual R
epor
t 20
15
171
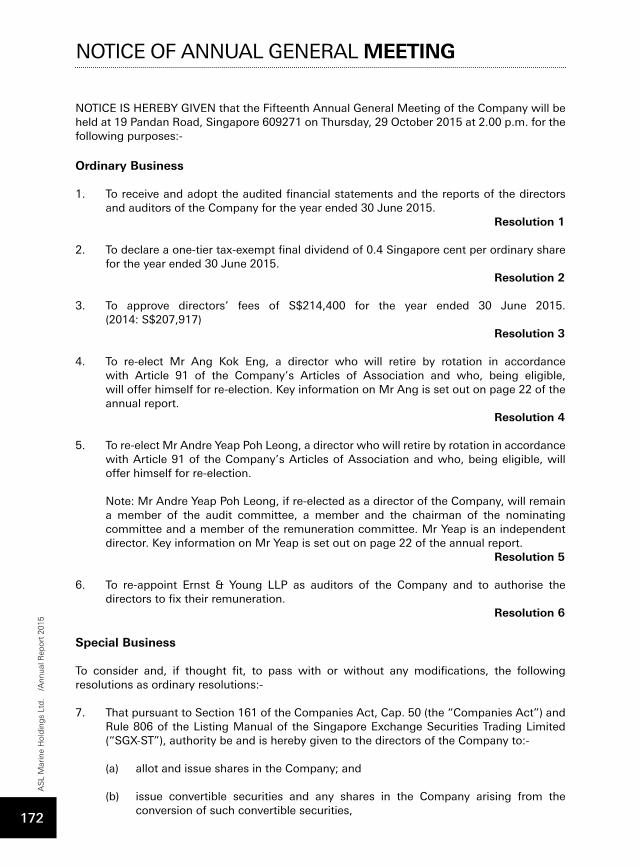
NOTICE IS HEREBY GIVEN that the Fifteenth Annual General Meeting of the Company will be held at 19 Pandan Road, Singapore 609271 on Thursday, 29 October 2015 at 2.00 p.m. for the following purposes:-
Ordinary Business
1. To receive and adopt the audited financial statements and the reports of the directors and auditors of the Company for the year ended 30 June 2015.
Resolution 1
2. To declare a one-tier tax-exempt final dividend of 0.4 Singapore cent per ordinary share for the year ended 30 June 2015.
Resolution 2
3. To approve directors’ fees of S$214,400 for the year ended 30 June 2015. (2014: S$207,917) Resolution 3
4. To re-elect Mr Ang Kok Eng, a director who will retire by rotation in accordance with Article 91 of the Company’s Articles of Association and who, being eligible, will offer himself for re-election. Key information on Mr Ang is set out on page 22 of the annual report.
Resolution 4
5. To re-elect Mr Andre Yeap Poh Leong, a director who will retire by rotation in accordance with Article 91 of the Company’s Articles of Association and who, being eligible, will offer himself for re-election.
Note: Mr Andre Yeap Poh Leong, if re-elected as a director of the Company, will remain a member of the audit committee, a member and the chairman of the nominating committee and a member of the remuneration committee. Mr Yeap is an independent director. Key information on Mr Yeap is set out on page 22 of the annual report. Resolution 5
6. To re-appoint Ernst & Young LLP as auditors of the Company and to authorise the
directors to fix their remuneration. Resolution 6
Special Business
To consider and, if thought fit, to pass with or without any modifications, the following resolutions as ordinary resolutions:-
7. That pursuant to Section 161 of the Companies Act, Cap. 50 (the “Companies Act”) and Rule 806 of the Listing Manual of the Singapore Exchange Securities Trading Limited (“SGX-ST”), authority be and is hereby given to the directors of the Company to:-
(a) allot and issue shares in the Company; and
(b) issue convertible securities and any shares in the Company arising from the conversion of such convertible securities,
NOTICE OF ANNUAL GENERAL MEETINGA
SL
Mar
ine
Hol
din
gs
Ltd
. /A
nnua
l Rep
ort
2015
172
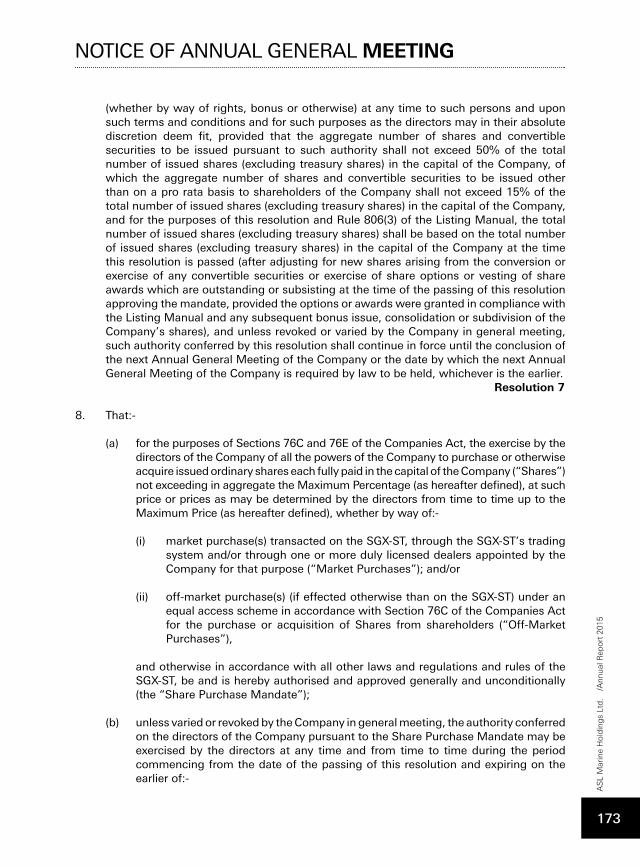
(whether by way of rights, bonus or otherwise) at any time to such persons and upon such terms and conditions and for such purposes as the directors may in their absolute discretion deem fit, provided that the aggregate number of shares and convertible securities to be issued pursuant to such authority shall not exceed 50% of the total number of issued shares (excluding treasury shares) in the capital of the Company, of which the aggregate number of shares and convertible securities to be issued other than on a pro rata basis to shareholders of the Company shall not exceed 15% of the total number of issued shares (excluding treasury shares) in the capital of the Company, and for the purposes of this resolution and Rule 806(3) of the Listing Manual, the total number of issued shares (excluding treasury shares) shall be based on the total number of issued shares (excluding treasury shares) in the capital of the Company at the time this resolution is passed (after adjusting for new shares arising from the conversion or exercise of any convertible securities or exercise of share options or vesting of share awards which are outstanding or subsisting at the time of the passing of this resolution approving the mandate, provided the options or awards were granted in compliance with the Listing Manual and any subsequent bonus issue, consolidation or subdivision of the Company’s shares), and unless revoked or varied by the Company in general meeting, such authority conferred by this resolution shall continue in force until the conclusion of the next Annual General Meeting of the Company or the date by which the next Annual General Meeting of the Company is required by law to be held, whichever is the earlier. Resolution 7
8. That:- (a) for the purposes of Sections 76C and 76E of the Companies Act, the exercise by the
directors of the Company of all the powers of the Company to purchase or otherwise acquire issued ordinary shares each fully paid in the capital of the Company (“Shares”) not exceeding in aggregate the Maximum Percentage (as hereafter defined), at such price or prices as may be determined by the directors from time to time up to the Maximum Price (as hereafter defined), whether by way of:-
(i) market purchase(s) transacted on the SGX-ST, through the SGX-ST’s trading system and/or through one or more duly licensed dealers appointed by the Company for that purpose (“Market Purchases”); and/or
(ii) off-market purchase(s) (if effected otherwise than on the SGX-ST) under an equal access scheme in accordance with Section 76C of the Companies Act for the purchase or acquisition of Shares from shareholders (“Off-Market Purchases”),
and otherwise in accordance with all other laws and regulations and rules of the SGX-ST, be and is hereby authorised and approved generally and unconditionally (the “Share Purchase Mandate”);
(b) unless varied or revoked by the Company in general meeting, the authority conferred
on the directors of the Company pursuant to the Share Purchase Mandate may be exercised by the directors at any time and from time to time during the period commencing from the date of the passing of this resolution and expiring on the earlier of:-
NOTICE OF ANNUAL GENERAL MEETING
AS
L M
arin
e H
old
ing
s Lt
d.
/Ann
ual R
epor
t 20
15
173
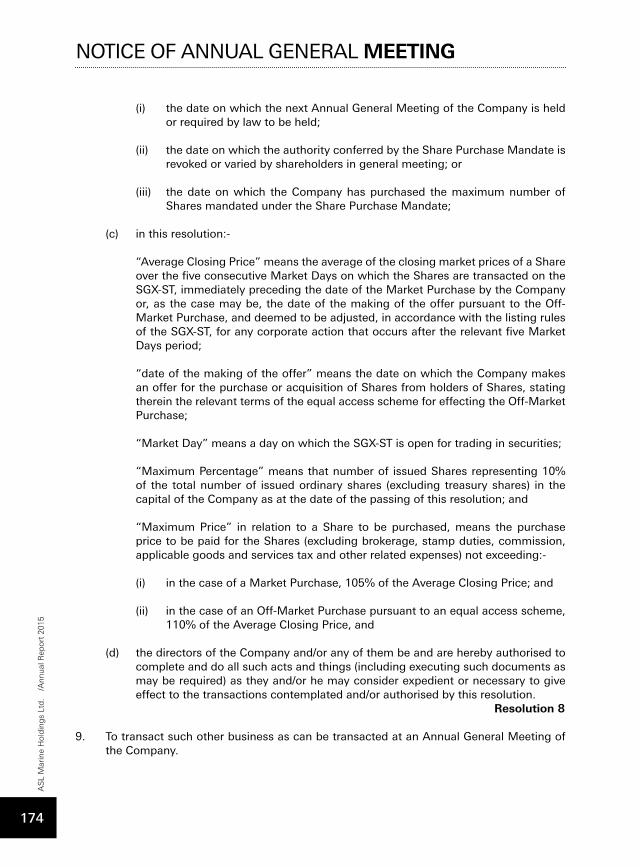
(i) the date on which the next Annual General Meeting of the Company is held or required by law to be held;
(ii) the date on which the authority conferred by the Share Purchase Mandate is
revoked or varied by shareholders in general meeting; or
(iii) the date on which the Company has purchased the maximum number of Shares mandated under the Share Purchase Mandate;
(c) in this resolution:-
“Average Closing Price” means the average of the closing market prices of a Share over the five consecutive Market Days on which the Shares are transacted on the SGX-ST, immediately preceding the date of the Market Purchase by the Company or, as the case may be, the date of the making of the offer pursuant to the Off-Market Purchase, and deemed to be adjusted, in accordance with the listing rules of the SGX-ST, for any corporate action that occurs after the relevant five Market Days period;
“date of the making of the offer” means the date on which the Company makes
an offer for the purchase or acquisition of Shares from holders of Shares, stating therein the relevant terms of the equal access scheme for effecting the Off-Market Purchase;
“Market Day” means a day on which the SGX-ST is open for trading in securities; “Maximum Percentage” means that number of issued Shares representing 10%
of the total number of issued ordinary shares (excluding treasury shares) in the capital of the Company as at the date of the passing of this resolution; and
“Maximum Price” in relation to a Share to be purchased, means the purchase
price to be paid for the Shares (excluding brokerage, stamp duties, commission, applicable goods and services tax and other related expenses) not exceeding:-
(i) in the case of a Market Purchase, 105% of the Average Closing Price; and (ii) in the case of an Off-Market Purchase pursuant to an equal access scheme,
110% of the Average Closing Price, and
(d) the directors of the Company and/or any of them be and are hereby authorised to complete and do all such acts and things (including executing such documents as may be required) as they and/or he may consider expedient or necessary to give effect to the transactions contemplated and/or authorised by this resolution.
Resolution 8
9. To transact such other business as can be transacted at an Annual General Meeting of the Company.
NOTICE OF ANNUAL GENERAL MEETINGA
SL
Mar
ine
Hol
din
gs
Ltd
. /A
nnua
l Rep
ort
2015
174
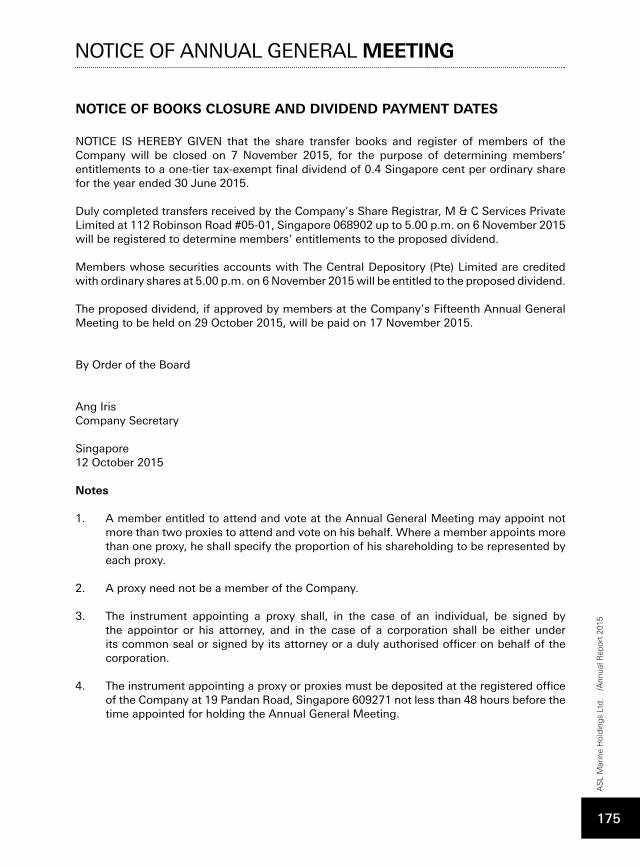
NOTICE OF BOOKS CLOSURE AND DIVIDEND PAYMENT DATES
NOTICE IS HEREBY GIVEN that the share transfer books and register of members of the Company will be closed on 7 November 2015, for the purpose of determining members’ entitlements to a one-tier tax-exempt final dividend of 0.4 Singapore cent per ordinary share for the year ended 30 June 2015.
Duly completed transfers received by the Company’s Share Registrar, M & C Services Private Limited at 112 Robinson Road #05-01, Singapore 068902 up to 5.00 p.m. on 6 November 2015 will be registered to determine members’ entitlements to the proposed dividend.
Members whose securities accounts with The Central Depository (Pte) Limited are credited with ordinary shares at 5.00 p.m. on 6 November 2015 will be entitled to the proposed dividend.
The proposed dividend, if approved by members at the Company’s Fifteenth Annual General Meeting to be held on 29 October 2015, will be paid on 17 November 2015.
By Order of the Board
Ang Iris Company Secretary
Singapore12 October 2015
Notes
1. A member entitled to attend and vote at the Annual General Meeting may appoint not more than two proxies to attend and vote on his behalf. Where a member appoints more than one proxy, he shall specify the proportion of his shareholding to be represented by each proxy.
2. A proxy need not be a member of the Company.
3. The instrument appointing a proxy shall, in the case of an individual, be signed by the appointor or his attorney, and in the case of a corporation shall be either under its common seal or signed by its attorney or a duly authorised officer on behalf of the corporation.
4. The instrument appointing a proxy or proxies must be deposited at the registered office of the Company at 19 Pandan Road, Singapore 609271 not less than 48 hours before the time appointed for holding the Annual General Meeting.
NOTICE OF ANNUAL GENERAL MEETING
AS
L M
arin
e H
old
ing
s Lt
d.
/Ann
ual R
epor
t 20
15
175
Explanatory Notes 1. The ordinary resolution proposed in resolution 7 above is to authorise the directors from
the date of the above meeting until the date of the next Annual General Meeting to allot and issue shares and convertible securities in the Company. The aggregate number of shares and convertible securities which the directors may allot and issue under this resolution shall not exceed 50% of the total number of issued shares (excluding treasury shares) in the capital of the Company at the time this resolution is passed. For allotments and issues of shares and convertible securities other than on a pro rata basis to all shareholders, the aggregate number of shares and convertible securities to be issued shall not exceed 15% of the total number of issued shares (excluding treasury shares) in the capital of the Company, at the time this resolution is passed.
2. The ordinary resolution proposed in resolution 8 above is to authorise the directors from
the date of the above meeting until the earliest of (i) the date on which the next Annual General Meeting of the Company is held or required by law to be held, (ii) the date on which the authority conferred by this mandate is revoked or varied by shareholders in general meeting, or (iii) the date on which the Company has purchased the maximum number of shares mandated under this mandate, to purchase or otherwise acquire issued ordinary shares in the capital of the Company by way of Market Purchases or Off-Market Purchases of up to 10% of the total number of issued ordinary shares (excluding treasury shares) in the capital of the Company. For more information on this resolution, please refer to the letter to shareholders dated 12 October 2015.
Personal Data Privacy
By attending, speaking and voting at the Annual General Meeting and/or any adjournment thereof and/or submitting an instrument appointing a proxy(ies) and/or representative(s) to attend, speak and vote at the Annual General Meeting and/or any adjournment thereof, a member of the Company (i) consents to the collection, use and disclosure by the Company (or its agents) of the member’s personal data and/or the member’s personal data of proxy(ies) and/or representative(s) so appointed for the purpose of the processing and administration by the Company (or its agents) for the Annual General Meeting (including any adjournment thereof) and the preparation and compilation of the attendance lists, minutes and other documents relating to the Annual General Meeting (including any adjournment thereof), and in order for the Company (or its agents) to comply with any applicable laws, listing rules, regulations and/or guidelines (collectively, the “Purposes”); (ii) warrants that where the member discloses the personal data of the member’s proxy(ies) and/or representative(s) to the Company (or its agents), the member has obtained the prior consent of such proxy(ies) and/or representative(s) for the disclosure of such personal data to the Company (or its agents) and the prior consent of such proxy(ies) and/or representative(s) for the collection, use and disclosure by the Company (or its agents) of the personal data of such proxy(ies) and/or representative(s) for the Purposes; (iii) warrants that where the member discloses the personal data of the member’s proxy(ies) and/or representative(s) to the Company (or its agents), such personal data is true, accurate, and complete; and (iv) agrees that the member will indemnify the Company in respect of any penalties, liabilities, claims, demands, losses and damages as a result of the member’s breach of the warranties herein.
NOTICE OF ANNUAL GENERAL MEETINGA
SL
Mar
ine
Hol
din
gs
Ltd
. /A
nnua
l Rep
ort
2015
176

This page has been intentionally left blank.

This page has been intentionally left blank.
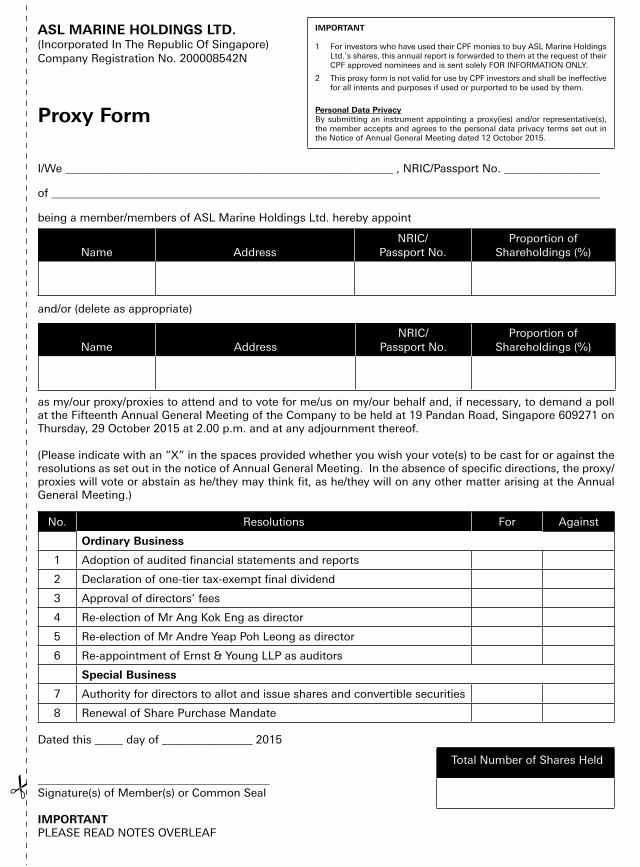
I/We __________________________________________________________ , NRIC/Passport No. _________________
of _________________________________________________________________________________________________
being a member/members of ASL Marine Holdings Ltd. hereby appoint
and/or (delete as appropriate)
as my/our proxy/proxies to attend and to vote for me/us on my/our behalf and, if necessary, to demand a poll at the Fifteenth Annual General Meeting of the Company to be held at 19 Pandan Road, Singapore 609271 on Thursday, 29 October 2015 at 2.00 p.m. and at any adjournment thereof.
(Please indicate with an “X” in the spaces provided whether you wish your vote(s) to be cast for or against the resolutions as set out in the notice of Annual General Meeting. In the absence of specific directions, the proxy/proxies will vote or abstain as he/they may think fit, as he/they will on any other matter arising at the Annual General Meeting.)
Dated this _____ day of ________________ 2015
_________________________________________ Signature(s) of Member(s) or Common Seal
IMPORTANTPLEASE READ NOTES OVERLEAF
Name AddressNRIC/
Passport No.Proportion of
Shareholdings (%)
No. Resolutions For Against
Ordinary Business
1 Adoption of audited financial statements and reports
2 Declaration of one-tier tax-exempt final dividend
3 Approval of directors’ fees
4 Re-election of Mr Ang Kok Eng as director
5 Re-election of Mr Andre Yeap Poh Leong as director
6 Re-appointment of Ernst & Young LLP as auditors
Special Business
7 Authority for directors to allot and issue shares and convertible securities
8 Renewal of Share Purchase Mandate
Name AddressNRIC/
Passport No.Proportion of
Shareholdings (%)
IMPORTANT 1 For investors who have used their CPF monies to buy ASL Marine Holdings
Ltd.’s shares, this annual report is forwarded to them at the request of their CPF approved nominees and is sent solely FOR INFORMATION ONLY.
2 This proxy form is not valid for use by CPF investors and shall be ineffective for all intents and purposes if used or purported to be used by them.
Personal Data PrivacyBy submitting an instrument appointing a proxy(ies) and/or representative(s), the member accepts and agrees to the personal data privacy terms set out in the Notice of Annual General Meeting dated 12 October 2015.
Total Number of Shares Held
ASL MARINE HOLDINGS LTD.(Incorporated In The Republic Of Singapore)Company Registration No. 200008542N
Proxy Form
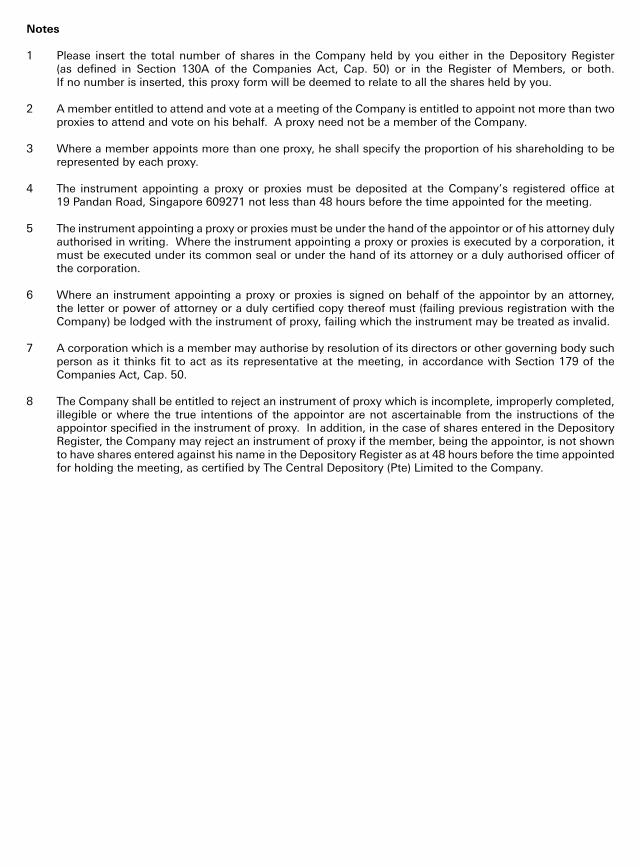
Notes
1 Please insert the total number of shares in the Company held by you either in the Depository Register (as defined in Section 130A of the Companies Act, Cap. 50) or in the Register of Members, or both. If no number is inserted, this proxy form will be deemed to relate to all the shares held by you.
2 A member entitled to attend and vote at a meeting of the Company is entitled to appoint not more than two proxies to attend and vote on his behalf. A proxy need not be a member of the Company.
3 Where a member appoints more than one proxy, he shall specify the proportion of his shareholding to be represented by each proxy.
4 The instrument appointing a proxy or proxies must be deposited at the Company’s registered office at 19 Pandan Road, Singapore 609271 not less than 48 hours before the time appointed for the meeting.
5 The instrument appointing a proxy or proxies must be under the hand of the appointor or of his attorney duly authorised in writing. Where the instrument appointing a proxy or proxies is executed by a corporation, it must be executed under its common seal or under the hand of its attorney or a duly authorised officer of the corporation.
6 Where an instrument appointing a proxy or proxies is signed on behalf of the appointor by an attorney, the letter or power of attorney or a duly certified copy thereof must (failing previous registration with the Company) be lodged with the instrument of proxy, failing which the instrument may be treated as invalid.
7 A corporation which is a member may authorise by resolution of its directors or other governing body such person as it thinks fit to act as its representative at the meeting, in accordance with Section 179 of the Companies Act, Cap. 50.
8 The Company shall be entitled to reject an instrument of proxy which is incomplete, improperly completed, illegible or where the true intentions of the appointor are not ascertainable from the instructions of the appointor specified in the instrument of proxy. In addition, in the case of shares entered in the Depository Register, the Company may reject an instrument of proxy if the member, being the appointor, is not shown to have shares entered against his name in the Depository Register as at 48 hours before the time appointed for holding the meeting, as certified by The Central Depository (Pte) Limited to the Company.
2 Business Overview
7 Breakdown of Revenue
8 Performance
10 Results at a Glance
12 Group Structure
14 Founder’s Message
15 Chairman’s Message
19 Operations and Financial Review
21 Board of Directors
Always striving for long-term growth despite challenges, ASL Marine continues to focus on harnessing the business fundamentals and enduring strengths that have helped us to stay resilient over the years.
Contents
24 Senior Management
26 Corporate Governance Report
49 Disclosure Guide on Governance Practices
58 Risk Management Strategies
59 Financial Statements
170 Analysis of Shareholdings
172 Notice of Annual General Meeting
Proxy Form
Corporate Information
ASL Marine is a vertically-integrated marine services group principally engaged in shipbuilding, shiprepair and conversion, shipchartering, marine engineering and other marine related services, catering to customers from Asia Pacific, South Asia, Europe, Australia and the Middle East.
Listed on Singapore Stock Exchange since 2003, ASL Marine Holdings Ltd. has over the years grown into one of the region’s key players in the marine services sector.
Today, ASL Marine owns and operates five shipyards in Singapore, Batam (Indonesia) and Guangdong (China), providing a comprehensive range of marine engineering services spanning myriad sector / industries. It has a large fleet of over 200 vessels and staff strength of 338 employees as of June 2015.
CORPORATE INFORMATION
Board Of Directors
Executive DirectorsAng Kok Tian(Chairman and Managing Director)Ang Ah Nui(Deputy Managing Director)Ang Kok EngAng Kok Leong
Non-Executive and Independent DirectorsAndre Yeap Poh LeongChristopher Chong Meng TakTan Sek Khee
Audit CommitteeChristopher Chong Meng Tak (Chairman)Andre Yeap Poh LeongTan Sek Khee
Nominating CommitteeAndre Yeap Poh Leong (Chairman)Christopher Chong Meng TakTan Sek Khee
Remuneration CommitteeTan Sek Khee (Chairman)Andre Yeap Poh LeongChristopher Chong Meng Tak
Company SecretaryAng Iris
Investor Relations ASL Marine Holdings [email protected]
Financial PR Pte [email protected]
Registered Office19 Pandan RoadSingapore 609271Telephone: (65) 6264 3833 Facsimile: (65) 6268 0274Email: [email protected]: www.aslmarine.com
Incorporation DataPlace of Incorporation: SingaporeDate of Incorporation: 4 October 2000Co. Reg. No. 200008542N
Share ListingASL Marine Holdings Ltd.’s shares are listed and traded on the Main Board of the Singapore Exchange Securities Trading Limited since March 2003
Share Registrar M & C Services Private Limited112 Robinson Road #05-01Singapore 068902Telephone: (65) 6227 6660Facsimile: (65) 6225 1452
AuditorsErnst & Young LLPCertified Public AccountantsOne Raffles QuayNorth Tower, Level 18Singapore 048583 Partner-In-Charge: Adrian Koh(appointed since the financial year ended 30 June 2015)
Principal BankersDBS Bank LtdOversea-Chinese Banking
Corporation LimitedUnited Overseas Bank Limited
STAYING THE COURSE WITH
FOCUS & TENACITY
ASL
MARINE HOLDINGS LTD.
ASL MarineANNUAL REPORT 2015
ASL MARINE HOLDINGS LTD.Company Registration No. 200008542N
19 Pandan Road Singapore 609271Tel: (65) 6264 3833, Fax: (65) 6268 0274
Web: www.aslmarine.com
AS
L M
AR
INE H
OLD
ING
S LT
D.
An
nu
al Rep
ort 2
01
5

![tenacity - Ascendas REIT · 2014-01-30 · tenacity A DecADe of enAbling businesses tenacity [/tr næs t /] a firmness of purpose; an unrelenting persistence. listen. Where once there](https://img.pdfslide.us/doc/110x75/5ec51754bc3561407b1c7d68/tenacity-ascendas-reit-2014-01-30-tenacity-a-decade-of-enabling-businesses-tenacity.jpg)