Embed Size (px)
Citation preview

Staying safe with money: the experience of older English speaking Victorians
Protecting Elders’ Assets Study
November 2010
Dr Jo Wainer
Ms Kei Owada
Dr Georgia Lowndes
Professor Peteris Darzins

Acknowledgements
This project is funded by State Trustees limited.
The study of Staying safe with money: the experience of older English speaking Victorianswas conducted on behalf of State Trustees limited by Monash University, Melbourne.
The report was written by Dr Jo Wainer, Dr Georgia Lowndes, Ms Kei Owada and Professor Peteris Darzins.
The report should be referenced as: Wainer J, Owada K, Lowndes G, and Darzins P (2010) Staying safe with money: the experience of older English speaking Victorians. Protecting Elders’ Assets Study. Monash University, Melbourne.
ISBN: 978-0-9802900-6-6 © State Trustees Limited
Published by Monash University Faculty of Medicine, Nursing and Health Sciences

3
Staying safe with money: the experience of older English speaking Victorians
Table of Contents
Glossary of general terms ......................................................................8
Glossary of statistical terms ....................................................................9
Executive Summary ..............................................................................10Current Financial Management Practice ............................................................................................... 11
Future Financial Management Practice ............................................................................................... 11
Awareness and Satisfaction with Support Services ............................................................................. 11
Awareness of Financial Elder Abuse ..................................................................................................... 11
Concluding Comments and Insights..................................................................................................... 12
1. Introduction ......................................................................................131.1 Protecting Elders’ Assets Study ..................................................................................................... 13
1.2 Context for the study ...................................................................................................................... 14
2. Aim ...................................................................................................16
3. Method .............................................................................................17
4. Demographics of respondents ..........................................................18
5. Financial elder abuse ........................................................................185.1 Misuse of powers of attorney ......................................................................................................... 19
5.2 Misuse by professionals ................................................................................................................. 19
5.3 Misuse by family ............................................................................................................................. 20
5.4 Misuse on the media and hearsay .................................................................................................. 20
6. Current practice in money management .......................................206.1 Will and Enduring Power of Attorney .............................................................................................. 20
6.2 Involvement of family in managing money ...................................................................................... 22
6.3 Interest and involvement of older people in day-to-day money management ............................... 22
6.4 Knowledge of help and support services ....................................................................................... 23
6.5 Services used to help with money management ............................................................................ 23
6.5.1 Influence of age on satisfaction with services ......................................................................... 24
6.5.2 Influence of gender on satisfaction with services .................................................................... 25
6.5.3 Influence of income level on satisfaction with services ............................................................. 25
6.6 Help with managing money ............................................................................................................ 25
7. Future Practice ................................................................................267.1 Anticipated sources of help as participants age ............................................................................. 26
7.2 Anticipated use of services ............................................................................................................. 27
8. Trouble with money ..........................................................................288.1 Risk factors for financial mismanagement ...................................................................................... 28
8.1.1 Diminished capacity ................................................................................................................ 28
8.1.2 Not asking for assistance ........................................................................................................ 28
8.1.3 New technology ...................................................................................................................... 28
8.2 Reducing risk of mismanagement of financial affairs ..................................................................... 29
8.3 Support needed for future financial security ................................................................................... 29
8.4 Pathway to protection ..................................................................................................................... 30

4
9. Discussion ........................................................................................319.1 Current financial practice ................................................................................................................ 31
9.2 Future financial practice .................................................................................................................. 33
9.3 Financial mismanagement .............................................................................................................. 34
10. Limitations ......................................................................................3610.1 Small sample ................................................................................................................................. 36
10.2 Low response rate and over-representation of men ..................................................................... 36
10.3 Composition of the sample - principally well, volunteer sample .................................................. 36
10.4 Qualitative examination limited by small number of Discussion groups ...................................... 36
10.5 Caution .......................................................................................................................................... 36
11. Future directions .............................................................................36
Appendix 1: Data Tables .......................................................................38
Appendix 2: References .......................................................................58

5
Staying safe with money: the experience of older English speaking Victorians
List of tablesTable 1: Sex distribution of Discussion Group participants ..................................................................... 18
Table 2: Satisfaction with services used to help manage money ............................................................ 24
Table 3: Satisfaction with services to manage money, older age groups compared with Survey respondents aged 65-74* ..................................................................................... 25
Table 4: Satisfaction with services to manage money, men compared with women* .............................. 25
Table 5: Satisfaction with services to manage money by income groups* .............................................. 25
Table 6: Q1.How would you rate your interest in managing your own financial affairs? .......................... 38
Table 7: Q1. Total, Mean, Standard Deviation, Minimum and Maximum ................................................. 38
Table 8: Q2.Do you have a will? ............................................................................................................ 38
Table 9: Q3.Do you have an Enduring Power of Attorney? .................................................................... 38
Table 10: Q4.Who did you appoint (EPA)? ............................................................................................. 38
Table 11: Q5.As you grow older who do you think will help you with paperwork, banking and bills? ...... 39
Table 12: Q6.Do you and your family mostly agree about how to manage your finances as you grow older?........................................................................................... 39
Table 13: Q7.How would you rate your awareness of the financial services available to support seniors in Victoria? ................................................................................. 39
Table 14: Q7.Total, Mean , Standard Deviation, Minimum and Maximum .............................................. 39
Table 15: Q8. Have you or will you use any of the services listed below to increase your skills or confidence in managing your financial affairs? ....................................................................... 40
Table 16: Q9.How would you rate your level of involvement in your day-to-day management of financial affairs such as paying bills and accessing money? ................................................... 40
Table 17: Q9.Total, Mean, Standard Deviation, Minimum and Maximum ................................................ 41
Table 18: Q10a. Do you use any of the following services to help you manage money (Family members)?........................................................................................ 41
Table 19: Q10a. Total, Mean, Standard Deviation, Minimum and Maximum ........................................... 41
Table 20: Q10b. Accountant ................................................................................................................ 41
Table 21: Q10b. Total, Mean, Standard Deviation, Minimum and Maximum ........................................... 41
Table 22: Q10c. Banks .......................................................................................................................... 42
Table 23: Q10c. Total, Mean, Standard Deviation, Minimum and Maximum ........................................... 42
Table 24: Q10d. Centrelink .................................................................................................................... 42
Table 25: Q10d. Total, Mean, Standard Deviation, Minimum and Maximum ........................................... 42
Table 26: Q10e. Financial advisers ........................................................................................................ 43
Table 27: Q10e. Total, Mean, Standard Deviation, Minimum and Maximum ........................................... 43
Table 28: Q10f. Guardianship service .................................................................................................... 43
Table 29: Q10f. Total, Mean, Standard Deviation, Minimum and Maximum ............................................ 43
Table 30: Q10g. State Trustees ............................................................................................................. 44
Table 31: Q10g. Total, Mean, Standard Deviation, Minimum and Maximum ........................................... 44
Table 32: Q10h. Share holders association .......................................................................................... 44
Table 33: Q10h. Total, Mean, Standard Deviation, Minimum and Maximum ........................................... 44
Table 34: Q10i. Taxation department .................................................................................................... 45
Table 35: Q10i. Total, Mean, Standard Deviation, Minimum and Maximum ............................................ 45
Table 36: Q10j. Veteran’s Affairs or Legacy ............................................................................................ 45
Table 37: Q10j. Total, Mean, Standard Deviation, Minimum and Maximum ............................................ 45
Table 38: Q10k. Other .......................................................................................................................... 46

6
Table 39: Q11a. Does anyone help with any of the following ways of managing your money (Paperwork)? ...................................................................................... 46
Table 40: Q11b.Paying bills ................................................................................................................... 46
Table 41: Q11c. Banking ....................................................................................................................... 46
Table 42: Q11d. Managing pension/ superannuation ............................................................................ 46
Table 43: Q11e. Property management ................................................................................................ 47
Table 44: Q11f. Accessing financial advice ............................................................................................ 47
Table 45: Q11g. Managing investments ............................................................................................... 47
Table 46: Q12. Did you obtain help from any of the following people? ................................................... 47
Table 47: Q13. As you grow older who do you think will help you with paperwork, banking and bills? .................................................................................................................. 48
Table 48: Q14. Who will you rely on to tell you if you are losing your capacity to make good decisions? ......................................................................................... 48
Table 49: Q16a. Are you aware of any examples of ‘financial elder abuse’? ........................................... 48
Table 50: Q16b. How serious would you rate the situation? .................................................................. 48
Table 51: Q17. How well would you rate your ability to recognise that financial abuse was happening to you or another person? ................................................................................... 49
Table 52: Q18. How common do you think financial elder abuse is in the community? .......................... 49
Table 53: Q19. Do you think anyone is mismanaging or exploiting your money? ................................... 49
Table 54: Q20. Do you plan to do anything to reduce the risk of someone accidently or deliberately mismanaging your finances?................................................................................ 49
Table 55: Q23. Age of Survey respondents .......................................................................................... 50
Table 56: Mean age .............................................................................................................................. 50
Table 57: Sex of Survey respondents ................................................................................................... 50
Table 58: Current working status of Survey respondents ...................................................................... 50
Table 59: Marital status of Survey respondents ..................................................................................... 50
Table 60: Number of children of Survey respondents have ................................................................... 51
Table 61: Mean, number of children of Survey respondents ................................................................. 51
Table 62: Living arrangements of Survey respondents .......................................................................... 51
Table 63: Income range of Survey respondents .................................................................................... 51
Table 64: Country of origin .................................................................................................................... 51
Table 65: A table of all the findings that are statistically significant ......................................................... 52
7
Staying safe with money: the experience of older English speaking Victorians
List of figuresFigure 1: Protecting Elders’ Assets Study research programme .........................................................................13
Figure 2: Survey response rate flow-chart ..........................................................................................................17
Figure 3: Age and Sex of Survey respondents ...................................................................................................18
Figure 4: Marital status of Survey respondents ...................................................................................................18
Figure 5: Living arrangement of Survey respondents compared with older Victorians ........................................18
Figure 6: Percentage of Survey respondents with EPA (financial) by age .............................................................20
Figure 7: Percentage of Survey respondents with will and EPA by age ...............................................................21
Figure 8: Percentage of children, spouse and other family appointed as EPA .....................................................21
Figure 9: Age by person appointed as attorney ..................................................................................................21
Figure 10: Sex by person appointed as attorney ................................................................................................22
Figure 11: Satisfaction with services used to help manage money .....................................................................24
Figure 12: Sources of advice about decision-making competency .....................................................................26
Figure 13: Sources of help as participants age ...................................................................................................26
Figure 14: Impact of age on expectation that family will help in the future ...........................................................26
Figure 15: Gender and expectation of who will help as they grow older .............................................................27
Figure 16: Gender difference for who will help with bills as they grow older ........................................................27
Figure 17: Options to increase financial skills ......................................................................................................27

8
Glossary of general terms Unless otherwise indicated these definitions are based on: Inquiry into powers of attorney. Final report of the Victorian Parliament Law Reform Committee. August 2010.
Age PensionThe Age Pension is a Centrelink payment which ensures that people who have reached retirement age have adequate income for their retirement1.
Capacity (as in capacity to make decisions) A person has capacity to make a decision if he or she has:
• the ability to understand the information relevant to making the decision;
• the ability to retain the relevant information;
• the ability to weigh up the relevant information; and
• the ability to communicate the decision in some way.
EPAEnduring power of attorney.
Enduring Power of Attorney (financial)A power of attorney made under part XIA of the Instruments Act 1958 (Vic). This power lasts or ‘endures’ when the principal has impaired decision-making capacity. A representative’s powers under an enduring power of attorney (financial) are generally characterised as financial and legal powers.
Enduring Power of Attorney (medical)A power of attorney made under section 5A of the Medical Treatment Act 1988 (Vic) which allows the representative to make decisions about the principal’s medical treatment.
Guardianship orderAn order made by the Victorian Civil and Administrative Tribunal (VCAT) appointing a guardian to make lifestyle and some health care decisions for a person with impaired decision-making capacity.
OPAThe Office of the Public Advocate.
POA A power of attorney. An arrangement by which a principal appoints a representative to make decisions on his or her behalf.
Represented person This term refers to a person who is subject to a guardianship or administration order under the
Guardianship and Administration Act 1986 (Vic)2.
1 Department of Health and Ageing. Aged Care Australia Website. Glossary.
Commonwealth of Australia. http://www.agedcareaustralia.gov.au/internet/
agedcare/publishing.nsf/Content/Glossary+Index+A accessed 28 September 2010
2 Victoria Law Reform Commission (2010). Guardianship Information Paper.
Victoria Law Reform Commission, Melbourne, State of Victoria, 2010.
http://www.lawreform.vic.gov.au/wps/wcm/connect/99f66c0041a1b1959ec8fe5c9
5479e66/Web_GuardianshipInforPaper_withcover.pdf?MOD=AJPERES accessed
28 September 2010
Substitute decision-makerA substitute decision-maker is a person who has legal authority to make decisions on behalf of someone else. Usually the law treats decisions of a substitute decision-maker as if they were made by the person themself3 .
WillA legal document that sets out how a person wishes their belongings to be distributed when they die4.
VCATThe Victorian Civil and Administrative Tribunal. This is a legal decision-making body, which is similar to a court but less formal. There are a number of different sections of VCAT, called ‘lists’ and these include the Guardianship List, which hears and decides upon applications made under the Guardianship and Administration Act 19865.
3 Victoria Law Reform Commission (2010). Guardianship Information Paper.
Victoria Law Reform Commission, Melbourne, State of Victoria, 2010. http://www.
lawreform.vic.gov.au/wps/wcm/connect/99f66c0041a1b1959ec8fe5c95479e66/
Web_GuardianshipInforPaper_withcover.pdf?MOD=AJPERES accessed 28
September 2010
4 Department of Health and Ageing. Aged Care Australia Website. Glossary.
Commonwealth of Australia. http://www.agedcareaustralia.gov.au/internet/
agedcare/publishing.nsf/Content/Glossary+Index+A accessed 28 September 2010
5 Victoria Law Reform Commission (2010). Guardianship Information Paper. Victoria
Law Reform Commission, Melbourne, State of Victoria, 2010.
http://www.lawreform.vic.gov.au/wps/wcm/connect/99f66c0041a1b1959ec8fe5c9
5479e66/Web_GuardianshipInforPaper_withcover.pdf?MOD=AJPERES accessed
28 September 2010

9
Staying safe with money: the experience of older English speaking Victorians
Glossary of statistical termsUnless otherwise indicated these statistical definitions are based on:
Last, John M. A Dictionary of Epidemiology. 4th edition. Oxford University Press, 2001.
Chi-square testA test for detecting whether two or more population distributions differ from one another.
IncidenceThe frequency with which something, such as a condition, appears in a particular population or area. In disease epidemiology, the incidence is the number of newly diagnosed cases during a specific time period. The incidence is distinct from the prevalence, which refers to the number of cases existing on a certain date6.
Likert scaleAn ordinal scale of responses to a question or statement ordered in a hierarchical sequence such as ‘strongly agree’ through to ‘no opinion’ through to ‘strongly disagree’ or a range such as ‘every day’ to ‘once a week’ to ‘monthly’.
Odds ratioThe odds ratio (OR) is a measure of association between characteristics measured in a cross-sectional survey. An odds ratio of 1.0 indicates a lack of association, and OR > 1 indicates that the characteristics tend to be co-incident, or to occur together. The matched odds ratio is a measure of the change in a characteristic over time. The matching is important when the same individuals have been measured at both time points. If the matched odds ratio is greater than 1.0, then the frequency of the characteristic has increased.
6 http://www.medterms.com accessed 6 October 2010.
Prevalence The prevalence of a condition in a population is defined as the total number of cases of the disease in the population at a given time, or the total number of cases in the population, divided by the number of individuals in the population. It is used as an estimate of how common a condition is within a population over a certain period of time.
P-valueThe probability that a test statistic would be as extreme as or more extreme than observed if the null hypothesis were true, that is, the probability that the observed result could have occurred by chance alone. Though the p-value is an arbitrarily set figure, most investigators use a p-value of 0.05 or 0.01, which is a 5% or 1% possibility that the result occurred by chance alone. At a p-value of less than 0.05 it is considered that the result was sufficiently unlikely to have occurred by chance to be designated as statistically significant.
Standard deviationA measure of dispersion or variation of a frequency distribution. While the mean tells where the values for a group are centred, the standard deviation is a summary of how widely dispersed the values are around this centre.
Statistical Significance Statistical methods allow an estimate to be made of the probability of the observed or greater degree of association between independent and dependent variables under the null hypothesis. From this estimate, in a sample of a given size, the statistical significance of a result can be stated, usually expressed as a p-value.
10
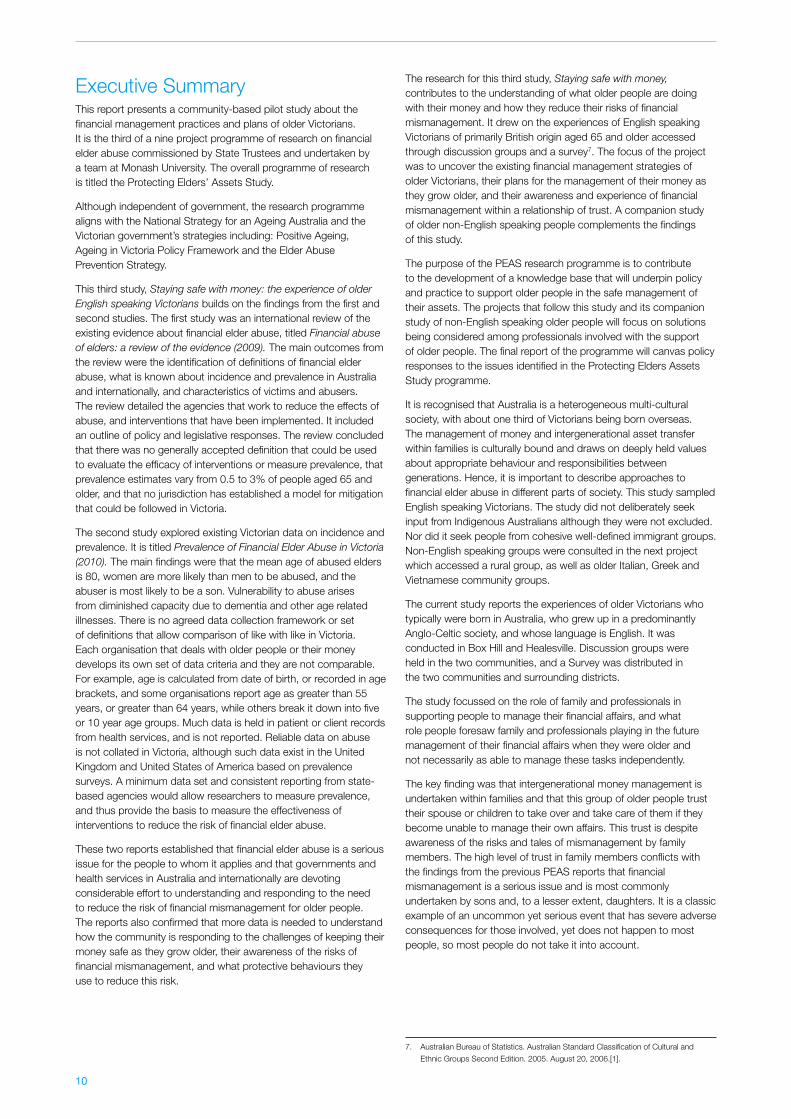
Executive SummaryThis report presents a community-based pilot study about the financial management practices and plans of older Victorians. It is the third of a nine project programme of research on financial elder abuse commissioned by State Trustees and undertaken by a team at Monash University. The overall programme of research is titled the Protecting Elders’ Assets Study.
Although independent of government, the research programme aligns with the National Strategy for an Ageing Australia and the Victorian government’s strategies including: Positive Ageing, Ageing in Victoria Policy Framework and the Elder Abuse Prevention Strategy.
This third study, Staying safe with money: the experience of older English speaking Victorians builds on the findings from the first and second studies. The first study was an international review of the existing evidence about financial elder abuse, titled Financial abuse of elders: a review of the evidence (2009). The main outcomes from the review were the identification of definitions of financial elder abuse, what is known about incidence and prevalence in Australia and internationally, and characteristics of victims and abusers. The review detailed the agencies that work to reduce the effects of abuse, and interventions that have been implemented. It included an outline of policy and legislative responses. The review concluded that there was no generally accepted definition that could be used to evaluate the efficacy of interventions or measure prevalence, that prevalence estimates vary from 0.5 to 3% of people aged 65 and older, and that no jurisdiction has established a model for mitigation that could be followed in Victoria.
The second study explored existing Victorian data on incidence and prevalence. It is titled Prevalence of Financial Elder Abuse in Victoria (2010). The main findings were that the mean age of abused elders is 80, women are more likely than men to be abused, and the abuser is most likely to be a son. Vulnerability to abuse arises from diminished capacity due to dementia and other age related illnesses. There is no agreed data collection framework or set of definitions that allow comparison of like with like in Victoria. Each organisation that deals with older people or their money develops its own set of data criteria and they are not comparable. For example, age is calculated from date of birth, or recorded in age brackets, and some organisations report age as greater than 55 years, or greater than 64 years, while others break it down into five or 10 year age groups. Much data is held in patient or client records from health services, and is not reported. Reliable data on abuse is not collated in Victoria, although such data exist in the United Kingdom and United States of America based on prevalence surveys. A minimum data set and consistent reporting from state-based agencies would allow researchers to measure prevalence, and thus provide the basis to measure the effectiveness of interventions to reduce the risk of financial elder abuse.
These two reports established that financial elder abuse is a serious issue for the people to whom it applies and that governments and health services in Australia and internationally are devoting considerable effort to understanding and responding to the need to reduce the risk of financial mismanagement for older people. The reports also confirmed that more data is needed to understand how the community is responding to the challenges of keeping their money safe as they grow older, their awareness of the risks of financial mismanagement, and what protective behaviours they use to reduce this risk.
The research for this third study, Staying safe with money, contributes to the understanding of what older people are doing with their money and how they reduce their risks of financial mismanagement. It drew on the experiences of English speaking Victorians of primarily British origin aged 65 and older accessed through discussion groups and a survey7. The focus of the project was to uncover the existing financial management strategies of older Victorians, their plans for the management of their money as they grow older, and their awareness and experience of financial mismanagement within a relationship of trust. A companion study of older non-English speaking people complements the findings of this study.
The purpose of the PEAS research programme is to contribute to the development of a knowledge base that will underpin policy and practice to support older people in the safe management of their assets. The projects that follow this study and its companion study of non-English speaking older people will focus on solutions being considered among professionals involved with the support of older people. The final report of the programme will canvas policy responses to the issues identified in the Protecting Elders Assets Study programme.
It is recognised that Australia is a heterogeneous multi-cultural society, with about one third of Victorians being born overseas. The management of money and intergenerational asset transfer within families is culturally bound and draws on deeply held values about appropriate behaviour and responsibilities between generations. Hence, it is important to describe approaches to financial elder abuse in different parts of society. This study sampled English speaking Victorians. The study did not deliberately seek input from Indigenous Australians although they were not excluded. Nor did it seek people from cohesive well-defined immigrant groups. Non-English speaking groups were consulted in the next project which accessed a rural group, as well as older Italian, Greek and Vietnamese community groups.
The current study reports the experiences of older Victorians who typically were born in Australia, who grew up in a predominantly Anglo-Celtic society, and whose language is English. It was conducted in Box Hill and Healesville. Discussion groups were held in the two communities, and a Survey was distributed in the two communities and surrounding districts.
The study focussed on the role of family and professionals in supporting people to manage their financial affairs, and what role people foresaw family and professionals playing in the future management of their financial affairs when they were older and not necessarily as able to manage these tasks independently.
The key finding was that intergenerational money management is undertaken within families and that this group of older people trust their spouse or children to take over and take care of them if they become unable to manage their own affairs. This trust is despite awareness of the risks and tales of mismanagement by family members. The high level of trust in family members conflicts with the findings from the previous PEAS reports that financial mismanagement is a serious issue and is most commonly undertaken by sons and, to a lesser extent, daughters. It is a classic example of an uncommon yet serious event that has severe adverse consequences for those involved, yet does not happen to most people, so most people do not take it into account.
7. Australian Bureau of Statistics. Australian Standard Classification of Cultural and
Ethnic Groups Second Edition. 2005. August 20, 2006.[1].

11
Staying safe with money: the experience of older English speaking Victorians
Awareness of Financial Elder AbuseParticipants generally did not believe financial elder abuse to be common in the community. They believed it was a serious issue, and that they could recognise a case when it was occurring. Few respondents could give an example of a case of financial elder abuse and those in the Discussion groups were uncomfortable talking about it and did not like the term “financial abuse”. They preferred to call it ‘mismanagement’.
Participants most commonly offered as risk factors for abuse dementia and ill health, loss of eyesight, misplaced and too much trust, and engaging with new banking technology.
Current Financial Management PracticeThe majority of respondents to the study had appointed an attorney under an Enduring Power of Attorney (financial). Importantly, older people in the study were more likely than the younger participants to have made an appointment of an attorney. Across all participants, adult children were the most frequently appointed attorney. Women were more likely than men to have appointed their adult children. Men had appointed their spouse as their attorney much more often than had women.
Participants in this study trusted that family members will do the right thing while assisting them with financial management. Despite this, there was some awareness among participants of the risk that there may be mismanagement of financial affairs when people are unable to oversee their affairs for themselves, including awareness that the risk may come from family members. This awareness sometimes resulted in risk management strategies such as appointing more than one child as attorney, but was unlikely to lead to the involvement of professionals to help manage their affairs.
Almost all the participants rated themselves as very interested and involved in the daily management of their financial affairs.
When support was needed with financial matters, family members were most frequently used. Financial advisors, banks and accountants were also cited as a source of support and there were high levels of satisfaction with the support provided. Of the support services currently utilised by participants, family members were rated as providing the most satisfactory level of support.
The most common tasks people had obtained assistance with were relatively complex tasks such as financial investments, pensions and superannuation. People on higher incomes were more likely to have sought professional help for their investments than people on lower incomes. Although few participants sought assistance with financial paperwork, those who did were significantly more likely to be women.
Future Financial Management Practice In order to provide timely and appropriate financial services to ageing Victorians it was important to ascertain how the participants in the study planned to manage their financial affairs if they became less capable of managing the tasks independently because of age related illness. Most participants reported that they would rely on family members to provide support with day-to-day financial management in the future. A large number of respondents reported that their financial security was essentially dependent on obtaining support from their family. Only 11% said they would seek support from professionals.
Most participants reported there was general agreement within their family about how their finances should be managed in the future. Twenty percent of participants acknowledged not having explicitly discussed the topic with family.
The majority of participants reported they did not plan on putting any additional strategies in place to protect themselves from future financial mismanagement or abuse. The majority had already appointed an Enduring Power of Attorney, 40% had already sought assistance from a financial advisor and the majority were already using or planning to use family members to provide them with financial management support in the future. Of those who suggested a strategy to reduce risk, the most common response was keeping a close eye on their bank account. When participants were offered a number of alternative strategies regarding how they might increase their confidence and skills in financial management practices, simply talking to family members was the most common option selected, as well as utilising professional or community based services, attending workshops or learning via the Internet.
Awareness and Satisfaction with Support ServicesTwo thirds of respondents reported having only some, little or no knowledge of services available to assist older Victorians with financial management. Low income participants tended to report more awareness of services than those with higher incomes. Only a limited number of services were identified by participants in the Discussion groups and they discussed a mixture of both good and bad experiences. They tended to talk favourably about accountants, and both accountants and financial advisors were used by respondents to the Survey, with satisfactory experiences.
Satisfaction with professional support services was found to some extent to be dependent on age, gender and socioeconomic level. In general, satisfaction was highest with accountants. Older people reported a higher level of satisfaction for Veterans Affairs and Legacy than did younger people in this study, and this may be due to older people being more familiar with these services. Overall satisfaction with professional services was high.

12
Concluding Comments and InsightsOverall the pilot study found that older English speaking Victorians are independently managing their daily finances and some seek support from family or financial advisors for complex tasks such as investments. They show a high degree of trust in family members and have most commonly granted them Enduring Power of Attorney. The majority intend to rely on family members to support them with financial management if they become less competent in the future. The majority had no plans to take any further action to protect their future financial wellbeing. Although they had limited understanding of the term financial elder abuse and felt uncomfortable discussing it, they believed they could recognise it when they saw it, and that it was serious. There was some willingness to engage with non-family support systems to reduce that risk.
The study suggested that women and the oldest people were more trusting of and reliant upon family, particularly children, to provide financial care than were men or younger old people.
The findings support the emphasis on self-management of the Australian National Strategy on an Ageing Australia (2001), and the Victorian Positive Ageing: a strategy for current and future Senior Victorians’ focus on improving community awareness of the need to support older people in managing their affairs, including awareness of risks of mismanagement.
This is a large pilot study, the findings are specific to the groups contributing to the study and its non-random nature means the results are not able to be generalised to the broader population of older people. Despite this there were sufficient respondents to allow for tests of statistical significance of the findings, and the data provide the best available information in Victoria about how older people are managing their money and planning to stay financially safe as they age.
The findings of this report will be tested in the next project, which is a consultation with older people from one rural and three non-English speaking communities. This companion consultation seeks answers to the same questions about how older people are managing their money, what their plans are for future financial management, and their awareness of, and management strategies to reduce their risk for, financial mismanagement.
13
Staying safe with money: the experience of older English speaking Victorians
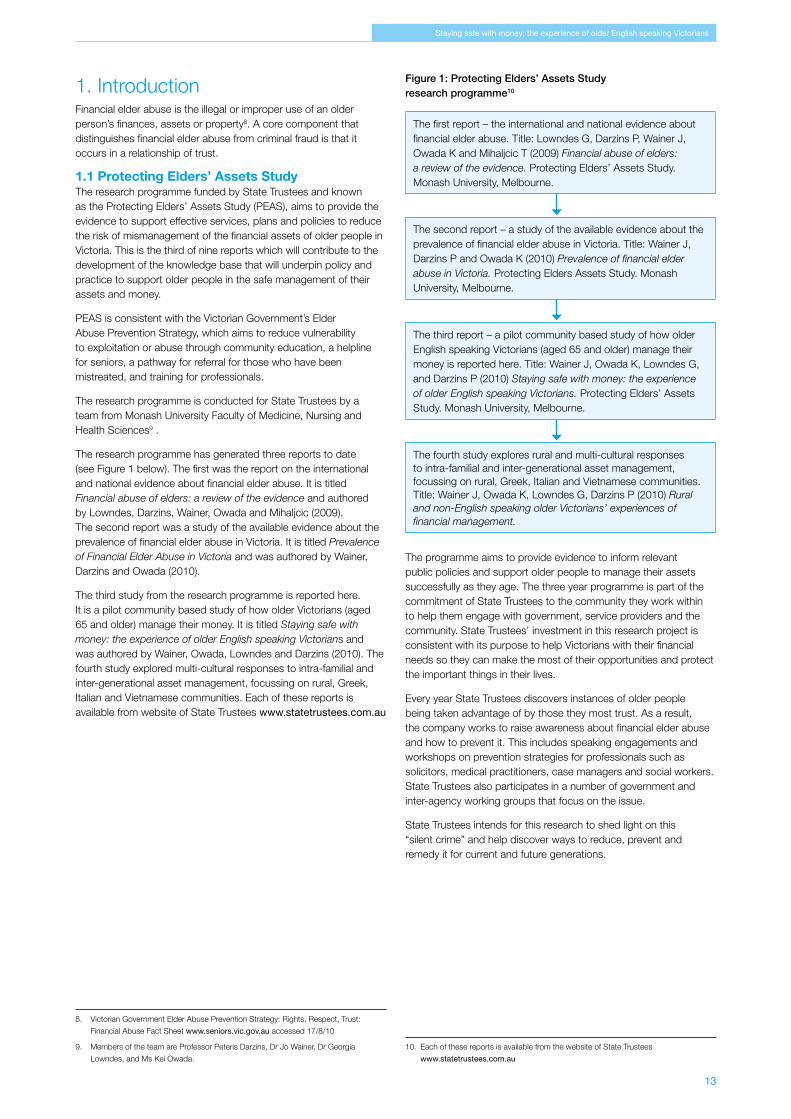
Figure 1: Protecting Elders’ Assets Study research programme10
The first report – the international and national evidence about financial elder abuse. Title: Lowndes G, Darzins P, Wainer J, Owada K and Mihaljcic T (2009) Financial abuse of elders: a review of the evidence. Protecting Elders’ Assets Study. Monash University, Melbourne.
The second report – a study of the available evidence about the prevalence of financial elder abuse in Victoria. Title: Wainer J, Darzins P and Owada K (2010) Prevalence of financial elder abuse in Victoria. Protecting Elders Assets Study. Monash University, Melbourne.
The third report – a pilot community based study of how older English speaking Victorians (aged 65 and older) manage their money is reported here. Title: Wainer J, Owada K, Lowndes G, and Darzins P (2010) Staying safe with money: the experience of older English speaking Victorians. Protecting Elders’ Assets Study. Monash University, Melbourne.
The fourth study explores rural and multi-cultural responses to intra-familial and inter-generational asset management, focussing on rural, Greek, Italian and Vietnamese communities. Title: Wainer J, Owada K, Lowndes G, Darzins P (2010) Rural and non-English speaking older Victorians’ experiences of financial management.
The programme aims to provide evidence to inform relevant public policies and support older people to manage their assets successfully as they age. The three year programme is part of the commitment of State Trustees to the community they work within to help them engage with government, service providers and the community. State Trustees’ investment in this research project is consistent with its purpose to help Victorians with their financial needs so they can make the most of their opportunities and protect the important things in their lives.
Every year State Trustees discovers instances of older people being taken advantage of by those they most trust. As a result, the company works to raise awareness about financial elder abuse and how to prevent it. This includes speaking engagements and workshops on prevention strategies for professionals such as solicitors, medical practitioners, case managers and social workers. State Trustees also participates in a number of government and inter-agency working groups that focus on the issue.
State Trustees intends for this research to shed light on this “silent crime” and help discover ways to reduce, prevent and remedy it for current and future generations.
10. Each of these reports is available from the website of State Trustees
www.statetrustees.com.au
1. IntroductionFinancial elder abuse is the illegal or improper use of an older person’s finances, assets or property8. A core component that distinguishes financial elder abuse from criminal fraud is that it occurs in a relationship of trust.
1.1 Protecting Elders’ Assets StudyThe research programme funded by State Trustees and known as the Protecting Elders’ Assets Study (PEAS), aims to provide the evidence to support effective services, plans and policies to reduce the risk of mismanagement of the financial assets of older people in Victoria. This is the third of nine reports which will contribute to the development of the knowledge base that will underpin policy and practice to support older people in the safe management of their assets and money.
PEAS is consistent with the Victorian Government’s Elder Abuse Prevention Strategy, which aims to reduce vulnerability to exploitation or abuse through community education, a helpline for seniors, a pathway for referral for those who have been mistreated, and training for professionals.
The research programme is conducted for State Trustees by a team from Monash University Faculty of Medicine, Nursing and Health Sciences9 .
The research programme has generated three reports to date (see Figure 1 below). The first was the report on the international and national evidence about financial elder abuse. It is titled Financial abuse of elders: a review of the evidence and authored by Lowndes, Darzins, Wainer, Owada and Mihaljcic (2009). The second report was a study of the available evidence about the prevalence of financial elder abuse in Victoria. It is titled Prevalence of Financial Elder Abuse in Victoria and was authored by Wainer, Darzins and Owada (2010).
The third study from the research programme is reported here. It is a pilot community based study of how older Victorians (aged 65 and older) manage their money. It is titled Staying safe with money: the experience of older English speaking Victorians and was authored by Wainer, Owada, Lowndes and Darzins (2010). The fourth study explored multi-cultural responses to intra-familial and inter-generational asset management, focussing on rural, Greek, Italian and Vietnamese communities. Each of these reports is available from website of State Trustees www.statetrustees.com.au
8. Victorian Government Elder Abuse Prevention Strategy: Rights, Respect, Trust:
Financial Abuse Fact Sheet www.seniors.vic.gov.au accessed 17/8/10
9. Members of the team are Professor Peteris Darzins, Dr Jo Wainer, Dr Georgia
Lowndes, and Ms Kei Owada.

14
financial elder abuse as a local, national and international issue that crosses nation-states and cultural boundaries. It is endemic and growing in importance as there are more older people needing assistance with living, and as there are more older people with considerable assets and incomes. In a time when it is increasingly difficult for younger people to buy their own homes, 85% of Victorians aged 75 and older own their own homes, free of mortgages15. Older people have assets worth plundering.
It may be astonishing that the misappropriation of the financial resources of older people is limited to an estimate of between 0.5-3% of people aged 65 or older16. However, this estimate is widely believed to be an under representation of the extent of the problem in society as the majority of cases go unreported to authorities. Our previous study on prevalence in Victoria demonstrated that most financial misdeeds were carried out by sons against their mothers although daughters and other family members were also implicated. The median age of older victims in that study was 80-81 years and one third were 85 years or older. Limited data suggested between one and two thirds were vulnerable to abuse due to diminished capacity for decision making resulting from dementia. Many untapped sources of data were identified among service providers17.
Promoting independence is central to social care policy in Australia18. Australians have been put on notice that reliance on the Age Pension is unlikely to sustain them in their post-earnings years19. Government-provided financial assistance in the form of Veterans or Age Pensions comprises a large, albeit declining, source of income for older people.
Government benefits, however, are declining as a share of older Australians’ incomes. Different sources of income – state/occupational/private pensions, investments and savings and the associated taxation policies – are all accompanied by complex rules and processes20.
In Victoria, 72% of people aged 65–84 are in receipt of a pension, and 56% of people aged 85 years and older receive a pension. It is not clear why there is such a large drop in the percentage of people receiving the Age Pension in the older age group. It is possible that the men die, leaving their widows with the family home that then puts them above the assets tests and out of eligibility for the pension21. In our largely urban society, where there is not a strong tradition for several generations of the extended family to live together in enmeshed lives, and where adult children live separately from their parents, older people have to fend for themselves. Financial assets are the key to the capacity of older people to look after themselves and their partners.
15. Ageing in Victoria: a plan for an age friendly society 2010-2020. Department of
Planning and Community Development, Office of Senior Victorians
http://www.seniors.vic.gov.au/Web19/osv/dvcosv.nsf/AllDocs/FE76E507747FFA7A
CA2577820026A1F1?OpenDocument accessed 26th August 2010.p. 61.
16. Wainer J, Darzins P, Owada K, (2010) Prevalence of financial elder abuse in Victoria
Monash University, Melbourne.
17. Wainer J, Darzins P, Owada K (2010) Prevalence of financial elder abuse in Victoria
Monash University, Melbourne.
18. Commonwealth of Australia (2001). National Strategy for an Ageing Australia: An Older
Australia, Challenges and Opportunities for all. October 2001. http://www.
longevity-international.com/assets/National%20Strategy%20for%20an%20
Ageing%20Australia.pdf accessed 30th September 2010..
19. Rosenman,L, & Scott W. (2009). Financing Old Age: Why is There Still Gender
Inequality? Australian Social Work, 62(2), 287-298.
20. Tilse C, Setterlund D, Wilson J and Rosenman L (2005a) Minding the money: a
growing responsibility for informal carers Ageing & Society 25, 2005, 215–227.
Cambridge University Press p 217
21. Ageing in Victoria: a plan for an age friendly society 2010-2020. Department of
Planning and Community Development, Office of Senior Victorians p 61
This third report, Staying safe with money: the experience of older English speaking Victorians, explores how Victorians plan to manage their assets as they grow older. It provides direct information about current activity and planning of older people as they consider financial management as they age. The study is based on data from three discussion groups with English speaking Victorians aged 65 years and older living in the Eastern and outer Eastern suburbs of Melbourne, as well as a 31 question survey completed by 410 older Victorians from the same area.
The report contributes to the evidence base to support State Trustees in their mission to promote ethical financial management and to protect older people from financial exploitation, and abuse of their financial assets.
This research is conducted within the context of the Victorian Government Positive Ageing strategy and the Elder Abuse Strategy11. The Strategy is funded with $5.9 million to implement 11 recommendations to mitigate the effect of elder abuse. It has four key initiatives, including a telephone helpline providing advocacy and support for older people12, a Practice Guide for agencies dealing with elder abuse13, professional educational material and financial literacy awareness raising for older people14, and education about elder abuse directed at the general population.
1.2 Context for the studyIn 2007, people aged 65 years and older made up 13% of Australia’s population. This proportion is projected to increase to 26% by 2051. There were 344,100 people aged 85 years and over in Australia at 30th June 2007, making up 1.6% of the population. This group is projected to grow, to 2%–3% by 2021. How we look after older people is already the single biggest health issue facing Australia in the 21st century.
The provision of income through the Age Pension and through compulsory and voluntary superannuation schemes is likely to be of great importance to, and even may come to substantially define the structure of, Australia’s overall financial sector.
Australians are living longer leading to a larger cohort of older people possibly requiring assistance to manage their financial assets. It is the purpose of State Trustees, among others, to provide this support. It remains to be determined what are the optimal structures and approaches to providing financial management assistance. At this stage the volume of possible need for assistance cannot be predicted with certainty. All that can be asserted confidently is that it seems likely there will be need for financial management assistance and the volume of this assistance is likely to grow. Reliable empirical research evidence regarding how older Victorians plan to manage their assets in the future will help the development and provision of optimal and timely support services. This would assist State Trustees and the Victorian Government, as well as other financial service providers, to plan for the future.
The previous studies in the PEAS research programme have listed some definitions of financial elder abuse, identified the impact on older people and canvassed prevention and intervention strategies implemented internationally. The review of the evidence identified
11. Office of Senior Victorians (2009) Rights. Respect. Trust: Victorian Government Elder
Abuse Preventions Strategy. www.seniors.vic.gov.au accessed 09/02/2010.
12. Seniors Rights Victoria www.seniorsrights.org.au accessed 20/01/2010.
13. Department of Human Services Aged Care Branch (2009) With respect to age – 2009
www.health.vic.gov.au/agedcare/policy/index.htm accessed 20/01/2010.
14. Office of Senior Victorians www.seniors.vic.gov.au/web19/0sv/dvcosv/
headingpagesdisplay/elder+abuse+prevention accessed 20/01/2010.

15
Staying safe with money: the experience of older English speaking Victorians
intergenerational asset transfer. All tasks require skills, motivation, confidence and cognitive ability. When any or all of these prerequisites reduce with age or ill-health, these tasks need to be co-managed by someone else. The evidence is that these tasks are usually handed over to a family member. In a large sample of older Australians, lack of confidence was identified as the major reason for older people obtaining assistance in managing their assets, particularly in their younger 65 to 79 year age group. Disability and ill health was the second most common reason 29.
In a large New Zealand study including one-to-one interviews and focus groups with older people who had and had not been abused, Peri et al. (2008) identified several important protective factors against elder abuse30. At the highest level, “Societal”, they noted the importance of “Education of financial needs of older people and Enduring Powers of Attorney31”. At the lowest level, “Individual”, they noted the importance of older people having a supportive family and peer network, being educated about their rights, being assertive, and using good effective coping strategies. The recommendation for widespread education and empowerment of older people is consistent with others in the field who recommend a preventative rather than reactive solution to the problem of financial elder abuse in the community.
Detection of people who engage in financial elder abuse is becoming more difficult. Financial abuse is the only form of abuse that can be carried out remotely from the older person. The emerging technologies of money management which rely on the world wide web, Short Messaging Services (SMS) texts and email communications allow people with knowledge of the older person’s affairs to manage those affairs without the older person knowing what they are doing, and without being in the presence of the older person32. This may be one factor involved in increased vulnerability for older people at a time of rapid technological change. It may also lead to more, rather than less, financial elder abuse in the future and may make it increasingly difficult for those who abuse trust to be detected.
Setterland et al (2005) have identified another important factor that could put some older people at increased risk of abuse, and that is unquestioning trust in their family members to competently manage their sometimes complex and messy financial affairs, and to manage them in a way consistent with the wishes of the older person, whether expressed explicitly or not expressed.
In many situations, assisting an older person with their financial affairs may be one component of informal care, which brings into play the stresses and rewards of the caring role. Attitudes to the use of an older person’s assets are likely to be shaped by the helper’s expectations of inter-generational exchanges, inheritance and retirement, as well as the need to provide for their own future care and accommodation33.
29. Tilse C, Setterlund D, Wilson J. and Rosenman L. (2005) Minding the money: a
growing responsibility for informal carers Ageing and Society, 25, 215-227.
30. Peri K, Fanslow J, Hand J. and Parsons J (2008) Elder abuse and neglect: Exploration
of risk and protective factors A Report for the families commission. Wellington,
Families Commission.
31. Enduring Power of Attorney
32. Setterland D, Tilse C, Wilson J, McCawley A-L and Rosenman L. (2007)
Understanding financial elder abuse in families : the potential of routine
activities theory Ageing & Society 27, pp599–614. Cambridge University Press,
United Kingdom.
33. Tilse C, Setterlund D, Wilson J and Rosenman L (2005a) Minding the money: a
growing responsibility for informal carers Ageing & Society 25, 2005, 215–227.
Cambridge University Press
It is critical that policy makers draw on the available evidence about what it takes to support older people in the safe management of their assets. Informed policies are likely to result in decreased financial elder abuse in the community.
One of the few conceptual models of financial elder abuse highlights the central role of the socio-cultural and policy context within which financial elder abuse occurs22. The full model is presented in our earlier review of the evidence23. The model draws attention to the importance of socio-cultural sub factors such as prevention strategies, reporting statutes, civil remedies, and legislative/policy trends. The authors of the model acknowledge a dearth of empirical research on the interplay between these macro-level factors and the prevalence of abuse in the community.
Few studies have specifically aimed to identify how older people (and their carers) can more successfully manage their financial assets. Tilse, Setterland and colleagues have pioneered this area of research in a series of Australian-based papers and have identified that:
The management task is confounded by the changing welfare policy and service context, a growing interest in inter-generational transfers, and conflicts between older people, their family members and the state in the use of an older person’s assets24.
This group have identified that policy often focuses too heavily on intervention, after abuse has been detected, rather than investing in the development of protection and prevention strategies, as well as increasing the autonomy of older people and supporting those non-professionals currently engaged in providing financial support to an older person25. They found the number of Australians assisting an older person with finances over a one year period was one in every four adults26. They recommend a multi-level (individual, family, social, cultural and service delivery/legal/financial systems) and multi-strategy response to support elders with financial asset management27.
Competing interests from the state, the market and the family regarding the appropriate use of these [financial] assets suggest that non-professional managers are assisting older people in a complex environment28.
They report that management of money to run a household comprises three distinct functions. The first are the everyday tasks such as obtaining cash, paying bills and keeping track of income and expenses. The second is management of the asset base that is required to fund retirement income, which includes the home and other property, cars, share portfolios and superannuation. The third money management task is planning for very old age and
22. Rabiner D, O’Keefe J, and Brown D (2004) A conceptual framework of financial
exploitation of older persons. Journal of Elder Abuse and Neglect, 16, 53-73.
23. Lowndes G, Darzins P, Wainer J, Owada K and Mihaljcic T (2009) Financial abuse of
elders: a review of the evidence Monash University, Melbourne p 13
24. Tilse C, Setterlund D, Wilson J and Rosenman L (2007) Managing the Financial
Assets of Older People: Balancing Independence and Protection British Journal
of Social Work, Oxford University Press
25. Tilse C, Wilson J, Setterlund D and Rosenman L (2007). The New Caring: Financial
Asset Management and Older People Annals of the New York Academy of Sciences
1114, 355-3561.
26. Tilse C, Setterlund D, Wilson J. and Rosenman L. (2005) Minding the money: a
growing responsibility for informal carers Ageing and Society, 25, 215-227
27. Tilse C, Setterlund D, Wilson J and Rosenman L (2007) Managing the Financial Assets
of Older People: Balancing Independence and Protection British Journal of Social
Work, Oxford University Press
28. Tilse C, Setterlund D, Wilson J. and Rosenman L. (2005) Minding the money: a
growing responsibility for informal carers Ageing and Society, 25, 215-227.

16
This Staying safe with money: the experience of older English speaking Victorians report provides further information about current activity and planning of older people as they consider financial management as they age.
2. AimThe aim of this study was to engage with older people to explore:
• current financial management practices
• expectations of and plans to protect their future financial security
• awareness and satisfaction with support services available to reduce their risk of abuse
• factors that mediate the relevancy of financial support services for this population
• awareness of financial abuse
A number of hypotheses were developed and tested through this project. Hypotheses were devised on the basis of previous studies in the PEAS research programme, other literature, and the clinical experience of the research team. Broadly, the study focussed on the role of family and professionals in supporting people to manage their financial affairs, and what role people foresaw family and professionals playing in the future management of their financial affairs when they were older and not necessarily as able to manage these tasks independently.
The theoretical model of elder abuse constructed by Rabiner et al (2004) and reported in the first PEAS study identified macro-level and micro-level factors that influence the occurrence of financial elder mismanagement or abuse38. The Staying safe with money study explored or tested several parts of the micro-level of their model, including status inequality through the variables of gender and wealth; relationship type through the variables describing dependence on family; and individual factors through the variables of age, sex, and income level.
The study also tested several findings from the community based study of elder abuse in Australia, conducted in Western Australia in 2007 by D’Aurizio39. These findings were that older people were more likely than younger people to trust family, and that older people were more likely than younger people to believe that EPAs are effective.
The hypotheses that guided the Staying safe with money study were:
1. The majority of older Victorians will foresee the need for help as they grow older and will have appointed an EPA (financial)
2. Most older people will rely primarily on their family for financial help
3. Older Victorians lack awareness of financial support services and are reluctant to use them
4. Most older Victorians have minimal understanding of financial elder abuse
5. The perceived relevance of financial support services depends on people’s age, gender and income
38. Lowndes G, Darzins P, Wainer J, Owada K and Mihaljcic T (2009) Financial abuse of
elders: a review of the evidence Protecting Elders’ Assets Study, Monash University,
Melbourne. p 13
39. D’Aurizio, T. (2007). Research into Community Attitudes to Elder Abuse in Western
Australia. Catalyse. Department for Communities, Government of Western Australia.
Setterland et al (2007) note that many older people have “unquestioning trust in family members to act appropriately”34
and that many family members have access to the details of their older relative’s financial management systems, such as Personal Identification Numbers (PIN), account numbers, and Enduring Powers of Attorney (EPA) 35. More than half (58%) of the 81 family members in their study who managed the older person’s assets said the older person made no attempt to oversee their management, mostly because of lack of capacity, and in one third of cases this was because records of financial transactions were not kept. Once an older person has sought assistance with paying bills, accessing their bank account and corresponding with accountants and solicitors, they are unable to oversee these activities because many are carried out in the invisible space of the internet.
They introduce the notion of the ‘capable guardian’, someone to watch over the older person. This ‘capable guardian’ is usually a family member. In their study one quarter of the asset managers interviewed, usually family members, said they were the sole person taking care of the older person, so there was no-one watching over what they did. They noted that:
The standard asset management tools, such as EPA, joint accounts and shared PINs, enabled and permitted both benign and abusive practices. p 610
The well-publicised collapse of several financial institutions in Victoria, as well as concerns raised about corporate funding, large executive salaries, ’kick-backs’ and trailing commissions paid to financial advisers is likely to have put doubt into people’s minds about the advisability of securing professional help to safely manage their assets. In a recent study exploring community attitudes toward financial elder abuse in Victoria, Mihaljcic & Lowndes (in press) found that a focus group of older adults believed corporate institutions and financial advisors were more likely to financially abuse older people than family members36. Older people may feel that there is no one more trustworthy, convenient and affordable than their own family when assistance is needed.
In a Western Australian study on community attitudes toward elder abuse using telephone survey methodology (n = 801), D’Aurizio (2007) found that 24% of participants aged 70 or older spontaneously mentioned family members as being potential perpetrators of elder abuse37. This finding was in contrast to the high degree of expressed trust in family reported in other studies. However, D’Aurizio asked respondents about perpetrators of elder abuse in general rather than specifically about financial abuse. Despite their finding, 89% of the respondents aged 50 or more (n=87) in the study had appointed a family member as their EPA (financial), suggesting that while some may not completely trust family members they may have appointed them as an EPA (financial) regardless, possibly because they have less trust in nonfamily members, lack knowledge of alternatives, or they feel that appointing someone outside the family could result in family conflict.
34. Setterlund, D., Tilse, C. and Wilson, J. 1999. Substitute Decision Making and
Older People. Trends and Issues in Crime and Criminal Justice 139, Australian
Institute of Criminology, Canberra.
35. Setterland D, Tilse C, Wilson J, McCawley A-L and Rosenman L. (2007)
Understanding financial elder abuse in families : the potential of routine
activities theory Ageing & Society 27, pp599–614. Cambridge University Press,
United Kingdom p 603
36. Mihaljcic T and Lowndes G. (2010) Individual and Community Attitudes Toward
Financial Elder Abuse (in press).
37. D’Aurizio, T. (2007). Research into Community Attitudes to Elder Abuse in
Western Australia. Catalyse. Department for Communities, Government of
Western Australia. P21.

17
Staying safe with money: the experience of older English speaking Victorians
The survey was sent out by the Box Hill Returned Soldiers’ League to 2200 members and associates in their region. More than 70% of the members were aged 65 years or older and so met the inclusion criteria for the study, and approximately 25% were female. In addition a small editorial piece was published in the Victorian edition of “The Senior” (a newspaper directed at older people). Sixty seven percent of the readership of The Senior is aged 65 or older and are thus in the target group. The article reported the fact of the study and asked interested people to contact the researchers for a copy of the survey. A small number of people responded to this article. The survey was also distributed to relevant organisations in the research communities.
There were no demographic data on the people who received the survey, apart from those sent out by the RSL, and it is thus not possible to compare the respondents with those who declined to take part. The survey participants were not identified to the researchers and no attempt was made to re-survey non-respondents. The distribution of the survey and response is detailed in Figure 2 below.
Figure 2: Survey response rate flow-chart
1884 surveys distributed• Box Hill RSL – 1550• Healesville Senior Citizens – 60• Healesville Griffin Park Retirement
Village – 25• Healesville Maroondah Retirement
Village – 25• Healesville Bowling Club – 10• Healesville Physiotherapy – 10• Healesville Probus Club – 10• Montrose Library and other branches
in Yarra Ranges – 80• Healesville Library – 10• House of Scotland, Balwyn – 10• Balwyn Evergreen Senior
Citizens Club – 87• Individual participant responded
to The Senior newspaper advertisement – 7
421 surveys received (22%)
11 participants were not eligible• 7 were under 65• 1 opted out• 3 replied with
a blank survey
410 surveys available for analysis (22%)
Notes from the discussions and free text responses from the Survey were entered into NVivo qualitative analysis software42. Survey data were entered into Epidata43. Qualitative data were analysed using NVivo, and quantitative data were analysed using Stata44 statistical analysis software.
The results of the study are considered in four parts. The first part documents the demographic characteristics of respondents to the Survey and the Discussion groups. The second part reports their awareness of financial elder abuse, the third part reports the current financial management practices employed by participants in the overall study. The fourth part reports the future plans for financial management as participants grow older and strategies to minimise risk.
42. NVivo QSR International www.qsrinternational.com
43. EpiData www.epidata.dk
44. Stata www.stata.com
This was a community-based pilot study of older English speaking Victorians (aged 65+ years) in two designated communities. The communities were Box Hill and Healesville. Discussion groups were held in the two communities, and a Survey was distributed in the two communities and surrounding districts. It is recognised that Australia has a heterogeneous multi-cultural society, with about a third of Victorians born overseas. Hence, it may be important to describe the approaches to financial elder abuse in the different parts of society. This study sampled English speaking Victorians. It did not seek input from Indigenous Australians or people from cohesive well-defined immigrant groups. Immigrant and rural groups were consulted in the next project, which accessed older Italian, Greek and Vietnamese community groups as well as older people from Gippsland. The current study aimed to describe the opinions and experiences of older Victorians who typically were born in Australia, who grew up in a predominantly Anglo-Celtic society, and whose language is English.
Management of money was considered to include control of or actions taken in managing money, decisions about financial assets, and use of financial assets. These included income and capital assets.
3. MethodEthics approval for the study was granted by Monash University.
Data were generated through three community based Discussion groups of older people (aged 65 and older), and from a survey of older people. One Discussion group was held at Healesville and two at Balwyn. A total of 24 people took part in the discussions, eight at Healesville, ten in the first Balwyn group and six in the second Balwyn group (see Table 1 on page 18). There were 14 women and 10 men involved in the Discussion groups.
The five questions that were explored with the Discussion groups were:
1. Whether you know anyone who has had trouble managing their money
2. What you know about help and support services to reduce the risk of getting into trouble with money
3. Your expectations of your own future financial security needs
4. What do you understand by the term ‘elder abuse’
5. What constitutes financial abuse
The discussions were digitally recorded with the consent of the participants and notes were taken at the time. A $20 gift voucher redeemable at a large supermarket chain was given to each participant as a thankyou for attending. The Discussion groups ran for approximately 60 minutes each.
In addition to Discussion groups we obtained data from a Survey of older people. The findings from the Discussion groups as well as the Review of the evidence40 report were used to generate the questionnaire. Additional input to developing the questionnaire was obtained from the work of Cheryl Tilse and colleagues in their work Minding the Money 200541. The survey contained both quantitative and qualitative questions.
40. Lowndes G, Darzins P, Wainer J, Owada K and Mihaljcic T (2009) Financial abuse
of elders: a review of the evidence Monash University, Melbourne pp 40
41. Tilse C, Setterlund D, Wilson J and Rosenman L (2005) Minding the money:
a growing responsibility for informal carers. Ageing and Society , 25. 215-227

18
Figure 5: Living arrangement of Survey respondents compared with older Victorians
Note: Total survey respondents n=391. The table is shown in Appendix 1.
A substantial majority of people were retired (88%) with six percent in paid employment and five percent in volunteer positions. Annual income was distributed evenly between the lowest ($0-$19,999) and the highest (more than $50,000) groupings. The mean income was in the high thirty thousands.
This survey was directed at English speaking Victorians and 83% were Australian born, 15% were from Europe, and 2% were from elsewhere.
Twenty four people took part in the Discussion Groups, 14 women and 10 men (see Table 1).
Table 1: Sex distribution of Discussion Group participants
Group Female Male
Group 1 8 2
Group 2 0 6
Group 3 6 2
Total 14 10
The age range of members of the Discussion Groups was 72 to 84 years old. All were Australian or European in origin.
5. Financial elder abuseMembers of the Discussion groups were asked what they understood by the term ‘elder abuse’. They generally had only a vague idea of what elder abuse was and struggled to give a definition. People seemed uncomfortable to speak about it, although some could provide examples of cases they knew about. These tended to involve family members but the public and others were also mentioned. One example was given of an older person attempting to raise money to live on by selling their home and receiving only half its value from the estate agent.
It is so easy to sign the document if you are a gentle person
When asked what other terms might be substituted people suggested ‘mismanagement’, ‘cruelty’, ‘got at by family’ and ‘elder neglect’. None of the participants were able to give examples of elder abuse apart from financial misappropriation or fraud. Some thought it might be ‘General community disregard for older people’, and all the examples given related to mismanagement or disputes about money. This included selling the family home and misuse of EPAs. ‘Read about it but never encountered it’ they said.
4. Demographics of respondentsThe survey was returned by 410 people, which was 22% of eligible participants (see Figure 2 above). The age of respondents ranged from 65 – 100, with a mean age of 78. There were 19 people aged 90 or older. The sex distribution of respondents was skewed to men, with 287 men (73%) and 107 women (27%) returning the survey (see Figure 3 below). This accurately reflects the skewed distribution of the survey, as one quarter of the RSL members were women.
Figure 3: Age and Sex of Survey respondents
Note: Total survey respondents with data on sex n=387; 65-79 years old Female n=49; 65-79 years old Male n=163; 80 years and older Female n=57; 80 years and older Male n=118. The table is shown in Appendix 1.
The majority of Survey respondents were either married or in a de facto relationship (59%), and 31% were widowed or a widower. 8% were divorced or separated and 2% had not been married (see Figure 4 below). Almost all had children (95%), with an average of 2.6 children, and the most common number was two. Most (59%) had either two or three children. These characteristics are consistent with those of the Victorian population of people aged 65 and older.
Figure 4: Marital status of Survey respondents
Note: Total survey respondents n=396; Married/ de facto n=233; Separated n=8; Divorced n=26; Widowed n=122; Never been married n=7. The table is shown in Appendix 1.
The majority were living with their partner (57%), 31% were living on their own, 5% were living with other family members and 2% were living in retirement villages or supported accommodation. A total of eight were living in a hostel or nursing home and another 16 were in a retirement village. One person was in hospital (see Figure 5 below).

19
Staying safe with money: the experience of older English speaking Victorians
Free text examples were given by respondents to the Survey of direct knowledge or experience of the misuse of the assets of older people by those they were entitled to trust. Twenty five instances were provided of this misuse. These are important stories. They are difficult to access and the older people who responded to the survey have given the gift of their knowledge and that gift will be described in detail to provide insight into what is happening in Victoria.
5. 1 Misuse of powers of attorneyThere were six examples of misuse of powers of attorney to take an older person’s money. In two of these the children with the power of attorney used the power to sell their parent’s house and take the money.
Sold mother’s house with power of attorney. Took $50,000 without mother’s permission. M6647
Children selling house when parent has given them Enduring Power of Attorney. M68
Another instance involved a child using up all their elderly parent’s money under the authority of a Power of Attorney. M75
Children were not the only people to abuse the power of attorney. In one instance it was a niece.
My cousin got our Auntie of 94 years to make her Power of Attorney, then she took her money. I was going to sell her house. I put her into care. F74
The implication is that the informant had to pay to get appropriate care for her aunt because her aunt’s assets had been stripped by her niece, even though the informant, at age 74, was herself in the older age group.
The most chilling example of misuse of powers of attorney was borderline between elder abuse and outright fraud.
Using money for gambling (by being Power of Attorney of person in old people’s home). M72
More detail is required to understand whether this occurred with one person only, or whether the gambler was able to use a privileged position in a nursing home to gain access to a number of older people and persuade them to give them power of attorney.
5.2 Misuse by professionalsThere were nine instances cited where various professionals were named as having misused the funds of older clients, and one event cited which may or may not have been misuse. In one instance it was a disabled person who transferred assets to a paid carer who sold up and left. Four involved wills:
Lawyer spent all of elderly widow’s money. He was executor of dead husband’s will. F66
A trusted friend (attorney, guardian) took widower with no family and unsound mind to a legal person to make a new will to the benefit of her family members. M77
Brother took my 100 year old mother to change will. F85
One involved a solicitor who used the trust money from a relative (M80). Another cited a trustee who took all the money and disposed of the assets (M83), while another was from a trustee company which sold the home and car of a client who went into care. It is not clear whether this was appropriate or not, although the informant was clearly distressed.
47. The age and sex of the person making the comment from the Survey is listed after
each quote, for example M66 means male, aged 66.
The Western Australian community survey found that 63% of people aged 70 or older and 57% of people aged in their sixties were aware of the term ‘elder abuse’ (note, this is not financial elder abuse)45.
Three quarters of respondents to the Survey were not aware of any examples of financial elder abuse. Of the 93 people (23% of whole sample) who said they were aware of examples, 62% (n= 55) said it was very serious, and 19% (n=17) said it was not serious. The remainder, 19%, said it was moderately serious. People on lower incomes were more likely than people on higher incomes to be aware of financial elder abuse, although the results were not statistically significant (p=0.20). Of those who reported that they were aware of examples of financial abuse (24%), participants in the lowest income band were four times as likely as participants with an income of $40,000-$50,000 to report that financial abuse is serious (OR 4.2, p=0.03, 95% CI 1.2 to 15.2). This finding is statistically significant.
Income level did not affect the self-rated ability of respondents to recognise that financial elder abuse was happening to them.
On the whole Survey respondents were confident they would be able to recognize financial elder abuse if it were happening to them or another person. Eighty percent rated as high or very high their ability to recognize financial elder abuse, even though it was not considered to be common. There was no difference between women and men in their perceived ability to recognise financial elder abuse. However there was a statistically significant difference between the oldest group of Survey participants and the youngest group. Participants aged 85 years and older were nearly twice as likely as participants aged 65 to 74 years old to report a higher level of ability to recognise that financial elder abuse was happening to themselves or another person (OR 1.8, p=0.03, 95% CI 1.1 to 3.0). This finding was statistically significant. There was no statistically significant relationship between income level and perceived ability to identify risk of financial abuse46.
Only 18% of people thought financial elder abuse in the community was common, and only n=2 said they thought it might be happening to them. Women were more likely than men to say that financial elder abuse is common and the difference was statistically significant (p=0.01). There was no statistically significant difference between different age groups in the perception of how common financial elder abuse is. However income level made a difference. People with incomes of $20,000–$30,000 were twice as likely as participants on the lowest income to report that financial abuse in the community is common (OR 2.5, p=0.01, 95% CI 1.3 to 4.6). Participants on the highest incomes were also twice as likely as participants on the lowest income to report that financial abuse in the community is common (OR 2.3, p=0.02, 95% CI 1.1 to 4.6). These findings are statistically significant.
A majority of respondents (57%) were not planning to do anything to reduce their risk of financial mismanagement, 18% were planning to do something, and the remainder were not sure. There was no statistically significant difference between women and men in their plans to reduce their risk of abuse.
45. D’Aurizio (2007) Research into Community Attitudes to Elder Abuse in Western
Australia by Catalyse for the Department for Communities, Government of Western
Australia, p19.
46. Ibid pp. 25,26

20
EPA abuse was described by Discussion group members as both legal and greedy.
One of the informants works with a charity. He said they had a case of an elderly widow who had trouble making ends meet so she sold her home and moved in with her daughter. The daughter put so many limitations on her she had to leave yet no longer had assets with which to house herself. The charity was able to get her a government house she could afford.
A reverse type of mistreatment was described by participants as cases where a son/daughter looks after their parents for years, and when the parent dies, the siblings come in and take all the money, which the informants believed is common. They also mentioned the case of an aunt who spent $3 million in 4 years after her husband died as she was developing dementia. People came and asked her for money and she had no-one to protect her from her own decisions.
5.4 Misuse on the media and hearsaySix percent of Survey respondents were aware of instances of mismanagement of older people’s money from the media and from hearsay. Twenty two people nominated media outlets as their source of knowledge, and five quoted other sources.
6. Current practice in money management
The study set out to test the hypothesis that the majority of Survey respondents and members of the Discussion groups anticipate that they may need assistance with their financial affairs in the future and will have signed a will and appointed an EPA (financial). Information was also sought about the extent of engagement with daily management of money and financial affairs and sources of support for this involvement, if support were necessary.
6.1 Will and Enduring Power of AttorneyNinety six percent of respondents to the Survey had a will, and almost all of the participants in the Discussion groups had a will (23 out of 24; 94%). Several members of the Discussion groups noted that they had a will that needed to be updated.
Among the respondents to the Survey, 69% had an EPA (financial). Older people were more likely to have an EPA than younger people (see Figure 6 below).
Figure 6: Percentage of Survey respondents with EPA (financial) by age
Note: Total 65-74 years old n=139 (Has EPA n=76); 75-84 years old n=150 (Has EPA n=115); 85years old and older n=98 (Has EPA n=76). The table is shown in Appendix 1.
Advice from financial advisors was believed to be misuse in two instances, where the advisor either appeared motivated more by fees than return to the client, or did not advise their client when the investment was doing badly.
5.3 Misuse by familyOur Survey respondents provided 11 instances where family members had misused the money of older people. Wills and powers of attorney were used in some cases to facilitate this, as indicated above. Other mechanisms were the use of the older person’s money for the benefit of the younger generation, the signing of blank cheques, withholding the use of assets for the benefit of the older person, or living rent free.
Mother used grandmother’s money F68
Daughter would not place mother, who was unable to care for herself, in nursing home to avoid selling house to pay deposit. M71
There was one case where the purpose was to support the costs of gambling. In another it was the grandchildren who were taking advantage of their grandmother.
Members of the Discussion groups also gave examples of financial elder abuse. On the whole participants had heard some of the public discussion about financial elder abuse.
One participant had been exposed to training in how to identify and respond to elder abuse as part of her volunteer position with Meals on Wheels. Some were able to identify situations which they thought qualified as abuse:
• If the family put the older person in a nursing home even if they did not want to go
• One participant identified that she thought she was being mismanaged by her family. A woman in her eighties was invited by her daughter to sell her house and move in with the daughter. The trade off was that she would be looked after and the daughter would receive a carer’s allowance. The older woman sold her house, $150,000 of the money from her home went into her daughter’s house and the title to the house was in the name of the daughter and granddaughter. The daughter has not delivered on her promise of care, makes her mother pay board, will not put up the funds to buy her a place in a nursing home, and the older woman feels trapped and very unhappy. Her other daughter is her advocate, and is also very upset about the way it has worked out.
• Another participant described the situation of a friend whose family decided she could not live on her own and arranged for her to spend two weeks at a time with each of them. This was distressingly disruptive yet no workable alternative was identified.
On the other side of the ledger participants noted that older people can become possessive, uncooperative and difficult to live with and transfer to a nursing home may be the only way to manage this without significant disruption to the extended family.
Participants said they had heard of cases where children convinced parents to go into a nursing home, and then sold the family home and took the money. Internet banking makes financial mismanagement more difficult to avoid because someone can steal the PIN and get access to the account and take the money. They believed this was criminal.

21
Staying safe with money: the experience of older English speaking Victorians
Figure 8: Percentage of children, spouse and other family appointed as EPA
Note: Total Survey respondents n=280 (Child n=171; Spouse n=62; Other family n=33; Other n=14); Total D’Aurizio’s n=87. The table is shown in Appendix 1.
The PEA Study found that older people were more likely to appoint one of their children as their EPA than were younger people. The age of Survey respondents was divided into three approximately equal groups, 65-74, 75-84, and 85 and older, and correlated with the person appointed as Attorney. The results are in Figure 9 below.
Figure 9: Age by person appointed as attorney
Note: Total 65-74 years old n=76 (Spouse n=29; Child n=37; Other family n=5; Professionals n=5); 75-84 years old n=115 (Spouse n=26; Child n=68; Other family n=18; Professionals n=3); 85years old and older n=76 (Spouse n=6; Child n=57; Other family n=8; Professionals n=5). The table is shown in Appendix 1.
From Figure 9, it is apparent that the younger age group (65-74) was more likely than the older aged respondents to appoint a spouse as attorney, while older people were more likely to appoint their children. The results were statistically significant (p=0.00). There was no consistent relationship between age and the use of professionals as attorneys.
A similar trend is reflected in the sex difference in the appointment of an Attorney. Women were much more likely than men to appoint their child to this role. Using sex as the predictor variable and person appointed as attorney as the outcome variable, a Chi-square test was applied to the frequency table. No attempt was made to control for the effect of age. The result showed that 78% of women appointed one or more of their children, compared with 53% of men (see Figure 10 below). There was no sex difference in the appointment of other family members (11% cf 12%) or professionals (5% for each sex) as attorney.
While nearly everyone had a will, the older age groups were more likely than younger respondents to say they have both a will and an EPA (see Figure 7 below).
Figure 7: Percentage of Survey respondents with will and EPA by age
Note: Total 65-74 years old n=139 (Has will and EPA n=75; Has EPA but no will n=1; Has will but no EPA n=53; Has no EPA no will n=10); 75-84 years old n=150 (Has will and EPA n=115; Has EPA but no will n=0; Has will but no EPA n=30; Has no EPA no will n=5); 85years old and older n=97 (Has will and EPA n=75; Has EPA but no will n=0; Has will but no EPA n=22; Has no EPA no will n=0). The table is shown in Appendix 1.
Survey participants who were aged 75 years and older were more likely to report that they have an EPA than those who were aged between 65 to 74 years old. The results are statistically significant at the 95% level of confidence (p=0.00).
Logistic regression showed that participants aged 85 years and older were almost three times as likely to report that they have an Enduring Power of Attorney (financial) than participants aged 65 to 74 years old (OR 2.9, p=0.00, 95% CI 1.6 to 5.2). It showed that participants aged 75 to 84 years old were two and a half times as likely to report that they have an Enduring Power of Attorney (financial) than participants aged 65 to 74 years old (OR 2.6, p=0.00, 95%CI 1.5 to 4.3). Both these age differences are statistically significant.
The oldest women were more likely than the oldest men to have an EPA. Ninety six percent of women aged 85-100 had an EPA compared with 72% of men and this was statistically significant (p=0.02) using a frequency table and Chi-square test of significance. A logistic regression found that women were one and a half times more likely than men to report that they have an Enduring Power of Attorney (financial), after adjusting for age, and that this is statistically significant (OR 1.7, p=0.05, 95% CI: 1.0 - 2.9).
The Protecting Elders Assets Study anticipated that the majority of Survey respondents would rely primarily on family rather than professionals to assist them to manage their financial affairs if they become less capable with illnesses related to age. Of the 280 people in the PEA Study who had an EPA, 61% had appointed one or more of their children, 22% appointed their spouse, 12% another family member, and 5% appointed a professional to hold this role. In D’Aurizio’s study 74% of people older than 50 who had prepared an EPA appointed one or more of their children, and 15% appointed a spouse (see Figure below). This was despite approximately one quarter of her older participants being aware that sons and daughters may be the perpetrators of elder abuse (not specifically financial abuse). Fewer than 4% of her older group thought that spouses were likely to abuse an older person.

22
Survey participants who were older than 85 years were four times more likely to be satisfied with the help from family members to manage their money than those who were aged between 65 to 74 years old (OR 3.91, p=0.00, 95% CI 1.8 – 8.3). This finding is statistically significant although the wider confidence interval suggests it needs to be confirmed with a study with larger numbers of people older than 84.
This finding of age difference in satisfaction with the help provided by family members holds true when respondents are divided into two age groups, those who are younger or equal to or older than 85. Older people were more than two and a half times as likely as younger people to be satisfied with family help to manage their money (OR 2.66, p=0.01, 95% CI 1.4 – 5.2). This finding is statistically significant.
Talking with family was also the most frequently nominated strategy to increase skills and confidence for managing financial affairs in the future. Of the 336 Survey respondents who answered this question 82% said they would talk with their family49.
6.3 Interest and involvement of older people in day-to-day money management
Survey respondents described themselves as both interested and involved in the day-to-day management of their financial affairs. Respondents indicated they were very interested in managing their financial affairs. The mean rating was 6.4 on a seven point Likert scale of interest in managing their own financial affairs, where 0 is not interested at all, and 7 is very interested. Only eight percent of responses rated lower than five on the scale, and 72% rated themselves at seven. An ordered logistic regression controlling for gender demonstrated that men were slightly more interested in managing their financial affairs than women although the results were not statistically significant (OR 1.3, p=0.29, CI 0.8 – 2.2).
Survey respondents were also very involved in managing their money, with 84% saying they were very involved in managing their money, and fewer than five percent indicating they were not involved. The mean level of involvement was 6.5 on a Likert scale of 0-7 where 0 was no participation at all and 7 was full participation in managing their own finances. Ninety three percent rated themselves at five or above, including 80% who gave themselves the top rating of seven. Examples of daily money management included paying bills and accessing money.
In an ordered regression controlled for gender, women were 14% less likely than men to rate themselves as fully participating in managing their own finances (OR 0.86). This is not statistically significant, although it supports the hypothesis that women are less involved than men in managing their financial affairs.
An ordered regression controlled for income demonstrated that Survey respondents of all income levels were equally involved in day-to-day management of their financial affairs. The hypothesis that people with higher incomes are more involved with day-to-day management of their financial affairs is not supported.
49. These strategies are reported in more detail in Table 19, page 33.
Figure 10: Sex by person appointed as attorney
Note: Total Female n=83; Male n=185. The table is shown in Appendix 1.
Most of the Discussion group participants (14 out of 24 – 58%) had an Enduring Power of Attorney (financial) and a majority (16 out of 24 – 67%) also had an EPA (medical). Discussion group participants were likely to have these documents in a designated place and to have advised family members where they were, and to have lodged a copy with their solicitor. Some had them buried in a bottom drawer and not readily accessible in the event they were needed in a medical emergency.
Some of the participants were unclear about the difference between an EPA (financial) and a will or an EPA (medical). This raises the question about how much they understood about the documents they were signing at the time they did so.
6.2 Involvement of family in managing moneyThe Survey sought information about the level of agreement within families concerning how finances should be managed as the donors of the power grow older. Four hundred responses were obtained to the question about whether there was agreement within the family. Three quarters of respondents (74%) reported there was agreement, and nearly 20% reported it had not been discussed. Only two percent reported that there was no agreement. There was no difference between men and women in their response to this question.
The study also explored whether older people prefer family rather than professional help to manage their affairs when they become less confident to do it themselves. Forty two percent of Survey respondents said they currently turn to family for help with managing their money, and they are very satisfied with the help they receive. Satisfaction was rated from 1–7, the mean satisfaction with family was 6 (SD 1.4).
The older participants were more satisfied with family help than the younger ones. Survey participants who were aged between 75 to 84 years were twice as likely to report satisfaction with the help from family members to manage their money than those who were aged between 65 to 74 years old (OR 2.16, p=0.03, 95% CI 1.1 – 4.3)48. This finding is statistically significant.
48. The ordinal logistic regression method was used to investigate the relationship
between the ordinal outcome variable, use of family to help them manage their money,
and the predictor variable of age. Age was divided into 3 categories. The outcome
variable for participants’ satisfaction was measured on an ordered, categorical, and
7-point Likert scale with 0 is “very unsatisfied” and 7 is “extremely satisfied”. The odds
ratio (OR) is calculated to report a measure of association between characteristics
measured in a survey.

23
Staying safe with money: the experience of older English speaking Victorians
7. Legacy and Veterans’ Affairs were nominated as a source of advice by one participant, as was the ABC local radio.
8. Several people suggested that existing organisations, including the tax department and Centrelink, were in the ideal position to offer advice on a fee for service basis.
9. Formal guardianship was nominated by one man. He knew of an instance when an older woman developed dementia and was unable to manage her affairs. Her son was appointed as guardian by the guardianship court50, which required that he report annually on how he administered her estate and was accountable. This was given as an example of the system working well.
Not all the members were able to respond to this question, some had no knowledge or experience of any support systems, and made their own way through the maze of retirement income management without formal guidance. Some questioned how you manage your affairs if you have a serious mental illness or incapacity.
6.5 Services used to help with money management
The services that people actually use to help manage their money were identified from the Discussion groups and listed in the Survey as family, accountant, banks, Centrelink, financial advisers, guardianship services, State Trustees, share holder associations, the tax department, and Veterans Affairs. The number of people who said they used any of these services ranged from 21 (guardianship) to 173 (family). The most frequent responses were for family (n=173), financial advisers (n=170) and banks (n=159), followed by accountants (n=119) and Veteran’s Affairs (n=56). The least likely to be used were guardianship services (n=21), share holders associations (n=22) and State Trustees (n=26). Stockbrokers, superannuation fund and RSL welfare were nominated under ‘other’ (see Table 2 below).
Satisfaction with these services varied in line with their popularity. Respondents who said they had used a service were asked to rank satisfaction on a 7 point Likert scale and responses ranged from a mean of 1.8 to a mean of 6.0.
50. It is probable that he meant the Victorian Civil and Administrative
Tribunal Guardianship list.
6.4 Knowledge of help and support servicesThis question was designed to gain insight into the resources that older people use to help them manage their funds as they grow older.
Most Survey respondents claimed they had some knowledge (26%) or considered themselves to be very knowledgeable (36%) about the financial services available to seniors in Victoria, although a quarter (25%) said that they had no or little knowledge. An ordered logistic regression test for differences between men and women, and younger and older respondents, found no differences that were either important or statistically significant. Women and men were equally likely to be aware of what financial supports were available, and younger and older respondents were also equally aware of available supports. People on low incomes were somewhat more likely to be aware of financial services available to support seniors in Victoria. Participants with an income between $0-19,999 were 1.7 times as likely (OR 1.7, p=0.09, 95% CI 0.9 to 3.2) as participants with an income of more than $50,000 to report a higher level of their awareness of the financial services. This finding was close to being statistically significant.
Participants in the Discussion groups responded with examples of resources they had used or heard of. They varied in their apparent interest and skill levels in financial management, and in the complexity of their affairs. Members of the groups suggested a fairly limited range of support services. Trustee companies were mentioned in two groups, and only one group mentioned family. There was a mixture of opinions about the different services although all groups mentioned accountants and talked about them in a generally favourable light.
Some participants were acutely interested in financial management, enjoyed it and spoke with authority about their affairs. Others were frank in their dislike of financial matters. One person commented that “I hate it (managing money), I can’t even balance a cheque book”.
Sources of advice nominated by participants were as follows:
1. Three participants nominated accountants as their source of advice and help. They were experienced as approachable and providing practical advice.
2. Banks and Centrelink were helpful.
3. Some participants found it difficult to understand the system and even with help from Centrelink were confused about the difference between concession and full pension.
4. One daughter had been a help with finances.
5. Financial advisers were nominated as a source of help. There was anxiety about their fee structures and whether their advice served the needs of the client or attracted the most income for the advisor. Two said they obtained useful advice from their financial advisor “Everyone who gives advice does so so that money comes back to them”.
6. Trustee companies were nominated by four people as being a source of support. Experiences were variable, from ‘very good’, ‘responsible, honest and helpful’ to ‘slow in paying’ and ‘difficult’ when administering the will.
State Trustees are responsible and honest and helpful.

24
Members of the Discussion groups had both good and bad experiences with services to help with managing their money. They mentioned family as the primary help. Other services which were mentioned positively were Veteran’s Affairs and Legacy which ‘provide advice on managing, lend money and give some too if it is needed’. Others were happy with the services provided by accountants and financial advisors, who provided ‘approachable, practical advice’, although several were bitter about the charging of commissions and advisors supporting investments that provided the greatest commission to themselves. Others mentioned poor investment advice, were critical that an accountant had failed to obtain the $900 from the Rudd Government stimulus package. Others had been advised to invest in Pyramid, the failed Geelong finance company, and had been wary of such investments ever since. One woman commented that State Trustees had handled her mother’s will and several mentioned trustee companies in general.
6.5.1 Influence of age on satisfaction with services
A number of services were used by people who took part in the Survey to help them manage their money (see Table 18 to Table 38 in Appendix 1). Satisfaction with the services was higher for the middle and older age groups compared with the younger age group, for most services. Odds Ratios were calculated to test the strength of the relationship between satisfaction and age. Some of the relationships with age were statistically significant at the 95% confidence level demonstrating that the findings were unlikely to be due to chance.
The services with the statistically significant highest level of satisfaction for the middle and older age groups, compared with the youngest age group, are described in Table 3 below.
Figure 11: Satisfaction with services used to help manage money
Note: Total Family n=173; Financial advisor n=170;.Banks n=159; Accountant n=119; Centrelink n=101; Veteran’s Affairs or Legacy n=56; Taxation Department n=41; State Trustees n=41; Share holders n=22;
Guardianship services n=21.
Family were nominated as both the most common source of help in managing money, and the most satisfactory. The mean satisfaction with family was 6.0 on a scale of 0–7. The next most satisfactory source of help was that provided by accountants (mean of 5.4) and financial advisers (mean of 5.1). Centrelink, banks and the tax department were used by people as a routine part of managing their affairs. There was an above average level of satisfaction for two of these services (mean of 4.9 for Centrelink, and a mean of 4.9 for banks) and below average (mean of 3.5) for the tax department. Some services, such as Veteran’s Affairs and Centrelink, were only available to eligible people.
Service Number who used service
Percentage of the overall number of respondents to the question(N=410)
Mean satisfaction on scale of 0-7
Family 173 42% 6
Financial advisor 170 41% 5.1
Banks 159 39% 4.9
Accountant 119 29% 5.4
Centrelink 101 25% 4.9
Veteran’s Affairs or Legacy 56 14% 4.3
Taxation Department 41 10% 3.5
State Trustees 26 6% 1.9
Share holders association 22 5% 2.05
Guardianship services 21 5% 1.76
These results are also reported below in graphic form for easier reference (see Figure 11 below).
Table 2: Satisfaction with services used to help manage money

25
Staying safe with money: the experience of older English speaking Victorians
financial advisors. These findings are statistically significant.
There was no significant relationship between gender and satisfaction with other services to manage money.
6.5.3 Influence of income level on satisfaction with services
An ordered logistic regression comparing levels of satisfaction with services to help manage money was conducted, with five grades of income level (see Table 5 below). These were $0-19,999 (n=64), $20,000-30,000 (n=99), $30,000-39,999 (n=61), $40,000-$50,000 (n=65), and more than $50,000 (n=66).
Table 5: Satisfaction with services to manage money by income groups*
Service Odds Ratio
P value 95% Confidence Interval (CI)
Family (lowest income cf median income)
3.6 0.02 1.2 to 10.4
Financial advisors (<$30,000 cf >$30,000)
2.1 0.02 1.1 to 3.8
*Findings are statistically significant
Respondents on the lowest income were more than three times (OR 3.6) as likely as those on the median income to be satisfied with the services provided by family members. The wide confidence interval suggests that these findings should be interpreted cautiously. People on the lower income band, when income was tested as a binary variable, reported they were twice as likely (OR 2.1) to be satisfied with financial advisors than people on higher incomes.
Income level was not linked to satisfaction with any of the other services used to help manage money.
6.6 Help with managing moneyThere were an average of 364 responses to the questions exploring the types of money management functions with which Survey respondents obtain help. The range was 339 to 376 responses, and people could respond to all or some of the questions. The ways of managing money that were listed were paperwork, paying bills, banking, managing pension or superannuation, property management, accessing financial advice, and managing investments.
Survey respondents were most likely to obtain help with managing investments (41%), and pension or superannuation (32%). They were least likely to seek help with property management (14%), banking (16%) or paying bills (17%). One third of respondents sought help accessing financial advice (36%).
In the only statistically significant sex difference in help with managing money that was detected, women were more likely than men to report help with paperwork. Thirty two percent of women reported obtaining help compared with 21% of men (p=0.01). This finding is not controlled for the effect of age.
Higher income people were statistically significantly more likely to obtain help with managing their investments than lower income people (p=0.01).
Two hundred and nineteen people nominated who they obtained help from to manage their money. The most common response was from professionals (47% of those who obtained help), children (35%), and other family (14%). Friends and neighbours were rarely involved (1%).
Table 3: Satisfaction with services to manage money, older age groups compared with Survey respondents aged 65-74 *
Service Odds Ratio
P value 95% Confidence Interval (CI)
Family (75-84 years) 2.17 0.03 1.1-4.3
Family (85+ years) 3.91 0.00 1.8-8.3
Financial advisors (75-84 years)
2.11 0.02 1.2-3.9
Banks (85+ years) 2.8 0.00 1.4-5.8
Veteran’s Affairs and Legacy (85+ years)
3.9 0.02 1.2-12.4
*Findings are statistically significant
The two services with the highest level of satisfaction among the older respondents were the family, and Veteran’s Affairs and Legacy. The results of this analysis demonstrate the great importance of disaggregating older age groups into different age cohorts. In the same way that common sense suggests that young adults may differ from middle aged adults in important ways it can be seen this is no less true of older adults. Aggregating all people aged 65 and older results in loss of information. Important differences between different groups of older people are lost.
6.5.2 Influence of gender on satisfaction with services
Women and men live different life courses, and these differences can be measured by examining the data to see how men and women respond. This gender analysis is an essential part of understanding the data because where women and men have different experiences and this is not examined, their different experiences may lead to misunderstanding the data. Data analysis which does not disaggregate the findings by gender runs the risk of reporting experiences which are not real, as neither men nor women have them, it just appears that they have the same experience because that is all that is expected and tested for.
The following section of the PEAS report disaggregates by gender the data on satisfaction with services to help manage money. It is known that age and gender interact, especially in older age groups because women live longer than men. This analysis controls for the effect of age when assessing the effect of gender.
Using gender as the predictor variable an ordered logistic regression was run to compare the answers of men and women to the question about satisfaction with services to help manage money, to test for difference, and whether any differences that did exist were statistically significant (see Table 4 below).
Table 4: Satisfaction with services to manage money, men compared with women*
Service Odds Ratio
P value 95% Confidence Interval (CI)
Family 2.7 p=0.00 1.3 to 5.6
Financial advisors 2.1 p=0.03 1.1 to 4.2
*Findings are statistically significant
The regression found that women were nearly three times (OR 2.7) more likely than men to report a higher level of satisfaction with “Family members”, after adjusting for age, and women were twice as likely (OR 2.1) as men to report a higher level of satisfaction with

26
The Other category included mention of State Trustees. When children and other family are added together 86% think their family will help them with paperwork, banking and paying bills as they grow older, and 12% will rely on professionals. There was no gender difference in these responses.
When spouse was included as an option for this question, 23% said a spouse would help, and only 54% thought it would be one of their children.
Older people were more likely than younger respondents to say they anticipate their children will help with paying bills and other money management tasks in the future (See Figure 14 below).
Figure 14: Impact of age on expectation that family will help in the future
Note: Total n=355: 65-74 years old n=125; 75-84 years old n=138; 85 years and older n=92. The table is shown in Appendix 1.
Of respondents aged 85–100, 96% said they think family members (children, grandchildren, others) will help with money tasks, compared with 86% of respondents aged 65–74.
Overall, more participants in all 3 age groups reported that they think “family” will help with them with paperwork, banking and bills than “professionals”. Participants who were 85 and older were more likely to report that they think “family” will help them with paperwork, banking and bills than those who are aged between 65 to 84 years old. A correlation between the predictor variable, age (in 3 categories) and the dependent variable (who will help, divided into family or professionals) showed that the relationship was statistically significant (p=0.05).
When ‘family’ was divided into ‘children’ and ‘spouse’, more participants in all 3 age groups reported that they think “children” will help with them with paperwork, banking and bills than “spouse” or “professionals”. Participants who were 85 and older were more likely to report that they think “children” will help them with paperwork, banking and bills than those who are aged between 65 to 84 years old. The finding is statistically significant (p=0.00). This is likely to be a reflection of the death of spouses, and consequent increasing reliance on children, as people grow older.
A majority of women and men think their children will help them as they grow older although women were much more likely than men to think this (see Figure 15 below). Women were less likely than men to nominate a spouse (13% compared with 34%) and more likely to nominate their children (80% compared with 58%). The gender difference is statistically significant (p=0.00).
7. Future Practice Having established how older people were managing their money and the services they relied on, the next section explores their plans for money management as they grow older. They anticipated that their doctor and their family would advise them if they were losing capacity to make good decisions (see Figure 12 below). Fewer than 20 people (5%) nominated someone other than family or general practitioner as the person they would rely on to tell them if they were losing the capacity to make good decisions.
Figure 12: Sources of advice about decision-making competency
Note: Total n=383 (Family n=170; GP and family n=149; General Practitioner n=45; Other professionals n=13; Friends/neighbours n=6). The table is shown in Appendix 1.
A question raised in the Discussion Group was ‘How do I know when I am not making good decisions? Other members of the group responded that they would rely on their family or their doctor to let them know if they were losing capacity. Some thought that their accountant would let them know when preparing tax returns, and yet poor decisions could be made between those annual meetings. The general agreement was to rely on family members and the general practitioner, in that order, and ‘Talk to your GP about your own mental status’.
7.1 Anticipated sources of help as participants age
The future thinking about managing money reflects the findings about how Survey participants were managing their affairs in 2010, with an even more pronounced reliance on family. Participants were asked who they thought would help them with paperwork, banking and paying bills as they grew older, and were prompted to choose between children, other family, professionals, or friends/neighbours. Three quarters nominated children (which may include grandchildren) and 11% nominated professionals (see Figure 13 below).
Figure 13: Sources of help as participants age
Note: Total n=392 (Children n=294; Other family n=43; Professionals n=45; Friends/neighbours n=8; Other n=2). The table is shown in Appendix 1.

27
Staying safe with money: the experience of older English speaking Victorians
a financial advisor (47%). This may have included accountants as they were not listed separately. Nearly a third of people would consult a lawyer (31%) and 22% would contact Seniors Rights Victoria. Workshops and web based training attracted up to 17% support. Trustee companies, including State Trustees, would be approached by 10% of people.
Women were more likely than men to say they would approach Seniors Rights Victoria (27% compared with 20%) and men were more likely than women to employ a financial advisor (51% compared with 36%) and a trustee company such as State Trustees (12% compared with 6%) as seen in Figure 17 below.
Figure 17: Options to increase financial skills
Note: Total Talk with family Women n=77; Men n=214; Discussion with friends Women n=41; Men n=130; Employ financial advisor Women n=32; Men=127; Discuss with lawyer Women n=23; Men n=77; Contact Seniors Rights Victoria Women n=22; Men n=46; World Wide Web based training Women n=14; Men n=43; Workshops at a local club Women n=16; Men n=37; Workshop at Senior Citizens clubs Women n=8; Men n=30; Talk with a trustee company such as State Trustees Women n=5; Men n=27. The table
is shown in Appendix 1.
Women and men were most likely to use family members and friends to increase their skills or confidence, and nearly a fifth would attend workshops or web based training, with no gender difference in likelihood of using this type of skill development.
Men were twice as likely as women to report that they will ‘employ a financial advisor” to increase their skills or confidence in managing their financial affairs, after adjusting for age (OR 1.9, p=0.01, 95% CI 1.2 to 3.2). This difference is statistically significant.
Men were also nearly one and half times more likely than women to discuss financial affairs with a lawyer, although the finding is not statistically significant (OR 1.4, p=0.23, 95% CI 0.8 to 2.5). Men were twice as likely as women to talk with a trustee company although this is not statistically significant (OR 2.1, p=0.16, 95% CI 0.8 to 5.7).
Women were one and a half times more likely than men, in an ordered logistic regression controlled for age, to report that they will contact Seniors Rights Victoria to increase their skills in managing their financial affairs (OR = 1.58, p=0.14, 95%CI: 0.9 to 2.9). This finding is not statistically significant, however the direction of effect is important.
The likelihood of using the other options for increasing skills was not affected by age or gender.
Figure 15: Gender and expectation of who will help as they grow older
Note: Total n=322: Female n=92; Male n=230. The table is shown in Appendix 1.
Women and men were equally likely to nominate a professional as the person who will help them as they grow older when they have the option of nominating a spouse. If they do not have that option, and the choice is between family and professionals, then women (93%) are more likely than men (88%) to nominate family, although the great majority of both men and women think family will help them (see Figure 16 below). There is no significant gender difference in responses to who will help with paying bills as they grow older.
Figure 16: Gender difference for who will help with bills as they grow older
Note: Total n=359: Female n=96; Male n=263. The table is shown in Appendix 1.
These responses to anticipated future sources of help reflect, and accentuate, the age and gender differences in the person whom Survey participants have actually appointed as their attorney. Whichever way this question is examined, the strong preference and experience is that family are and will be the main sources of support in managing daily financial matters, and that older age, and projection into the future, increases this reliance on family.
7.2 Anticipated use of servicesSurvey respondents were asked what services they will use to improve their skills or confidence in managing their financial affairs. Three hundred and thirty six people responded to this question. The options were: world wide web based training; workshops at senior citizens clubs; workshops at a local club; discussion with friends; employ a financial advisor; discuss with a lawyer; talk with a trustee company; talk with your family; contact Seniors Rights Victoria; or other. They were not mutually exclusive and people could (and did) nominate more than one source of advice they would turn to in order to increase their skills.
Talking with family was the most frequently nominated strategy to increase skills and confidence. Eighty two percent of Survey respondents said they would do this. Discussion with friends was the second most common choice (51%), followed by employing
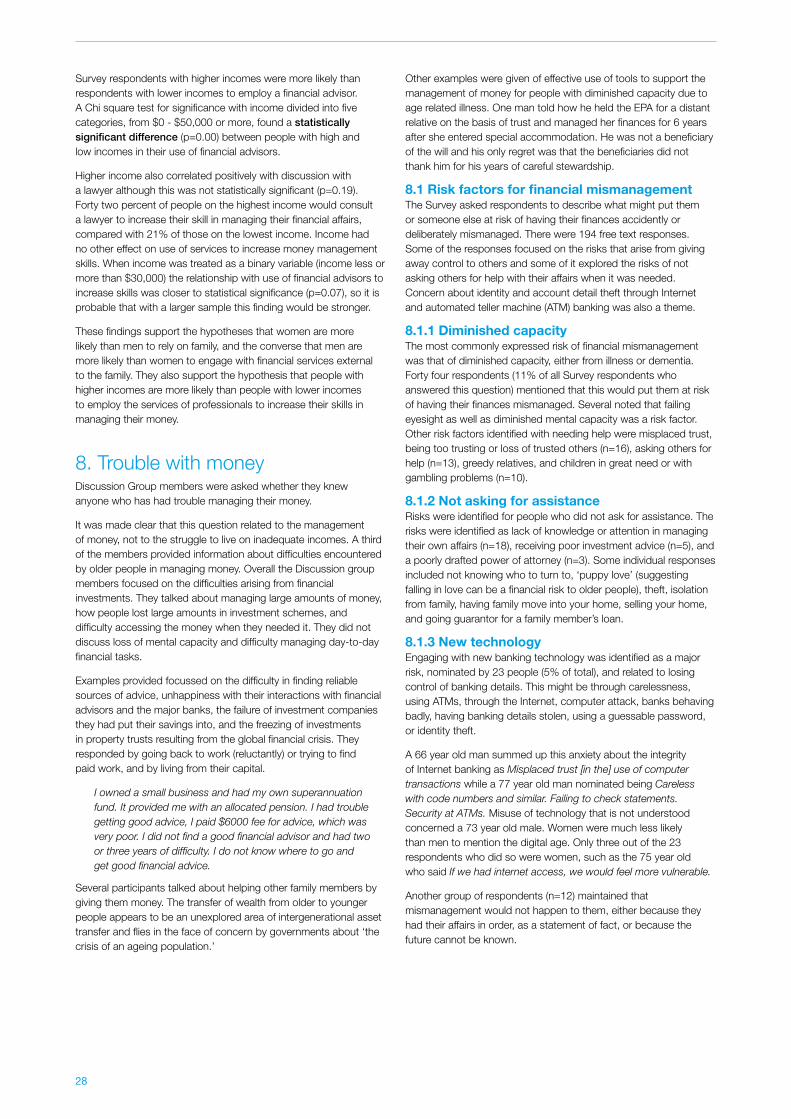
28
Other examples were given of effective use of tools to support the management of money for people with diminished capacity due to age related illness. One man told how he held the EPA for a distant relative on the basis of trust and managed her finances for 6 years after she entered special accommodation. He was not a beneficiary of the will and his only regret was that the beneficiaries did not thank him for his years of careful stewardship.
8.1 Risk factors for financial mismanagementThe Survey asked respondents to describe what might put them or someone else at risk of having their finances accidently or deliberately mismanaged. There were 194 free text responses. Some of the responses focused on the risks that arise from giving away control to others and some of it explored the risks of not asking others for help with their affairs when it was needed. Concern about identity and account detail theft through Internet and automated teller machine (ATM) banking was also a theme.
8.1.1 Diminished capacityThe most commonly expressed risk of financial mismanagement was that of diminished capacity, either from illness or dementia. Forty four respondents (11% of all Survey respondents who answered this question) mentioned that this would put them at risk of having their finances mismanaged. Several noted that failing eyesight as well as diminished mental capacity was a risk factor. Other risk factors identified with needing help were misplaced trust, being too trusting or loss of trusted others (n=16), asking others for help (n=13), greedy relatives, and children in great need or with gambling problems (n=10).
8.1.2 Not asking for assistanceRisks were identified for people who did not ask for assistance. The risks were identified as lack of knowledge or attention in managing their own affairs (n=18), receiving poor investment advice (n=5), and a poorly drafted power of attorney (n=3). Some individual responses included not knowing who to turn to, ‘puppy love’ (suggesting falling in love can be a financial risk to older people), theft, isolation from family, having family move into your home, selling your home, and going guarantor for a family member’s loan.
8.1.3 New technologyEngaging with new banking technology was identified as a major risk, nominated by 23 people (5% of total), and related to losing control of banking details. This might be through carelessness, using ATMs, through the Internet, computer attack, banks behaving badly, having banking details stolen, using a guessable password, or identity theft.
A 66 year old man summed up this anxiety about the integrity of Internet banking as Misplaced trust [in the] use of computer transactions while a 77 year old man nominated being Careless with code numbers and similar. Failing to check statements. Security at ATMs. Misuse of technology that is not understood concerned a 73 year old male. Women were much less likely than men to mention the digital age. Only three out of the 23 respondents who did so were women, such as the 75 year old who said If we had internet access, we would feel more vulnerable.
Another group of respondents (n=12) maintained that mismanagement would not happen to them, either because they had their affairs in order, as a statement of fact, or because the future cannot be known.
Survey respondents with higher incomes were more likely than respondents with lower incomes to employ a financial advisor. A Chi square test for significance with income divided into five categories, from $0 - $50,000 or more, found a statistically significant difference (p=0.00) between people with high and low incomes in their use of financial advisors.
Higher income also correlated positively with discussion with a lawyer although this was not statistically significant (p=0.19). Forty two percent of people on the highest income would consult a lawyer to increase their skill in managing their financial affairs, compared with 21% of those on the lowest income. Income had no other effect on use of services to increase money management skills. When income was treated as a binary variable (income less or more than $30,000) the relationship with use of financial advisors to increase skills was closer to statistical significance (p=0.07), so it is probable that with a larger sample this finding would be stronger.
These findings support the hypotheses that women are more likely than men to rely on family, and the converse that men are more likely than women to engage with financial services external to the family. They also support the hypothesis that people with higher incomes are more likely than people with lower incomes to employ the services of professionals to increase their skills in managing their money.
8. Trouble with moneyDiscussion Group members were asked whether they knew anyone who has had trouble managing their money.
It was made clear that this question related to the management of money, not to the struggle to live on inadequate incomes. A third of the members provided information about difficulties encountered by older people in managing money. Overall the Discussion group members focused on the difficulties arising from financial investments. They talked about managing large amounts of money, how people lost large amounts in investment schemes, and difficulty accessing the money when they needed it. They did not discuss loss of mental capacity and difficulty managing day-to-day financial tasks.
Examples provided focussed on the difficulty in finding reliable sources of advice, unhappiness with their interactions with financial advisors and the major banks, the failure of investment companies they had put their savings into, and the freezing of investments in property trusts resulting from the global financial crisis. They responded by going back to work (reluctantly) or trying to find paid work, and by living from their capital.
I owned a small business and had my own superannuation fund. It provided me with an allocated pension. I had trouble getting good advice, I paid $6000 fee for advice, which was very poor. I did not find a good financial advisor and had two or three years of difficulty. I do not know where to go and get good financial advice.
Several participants talked about helping other family members by giving them money. The transfer of wealth from older to younger people appears to be an unexplored area of intergenerational asset transfer and flies in the face of concern by governments about ‘the crisis of an ageing population.’

29
Staying safe with money: the experience of older English speaking Victorians
My 2 sons are quite capable of taking care of my affairs M86
My daughter helps me, so I didn’t need anyone else F83
My son and daughter will help take care of my affairs F66
The sense that ‘I didn’t need anyone else’ because a daughter or son would assist in taking care of their affairs would seem to preclude any intervention by non-family members. There is no hint of the impact these arrangements will have on the younger generation which is doing the caring.
Several respondents nominated their spouse as the person who would step in if needed, supported if necessary by their children.
Very capable and aware spouse, children willing to take care if need. M80
I am fortunate to have a fine daughter and husband who will always care for me F84
Their presence seems to relieve the older person of having to think any further about how they will manage as they become older and possibly less capable.
Some participants detailed the mechanism by which financial management would occur, in large part through the use of powers of attorney, or in consultation with professionals. They have put in place the legal structure to allow their son or daughter to manage their affairs on their behalf and appear confident that the outcome will be a good one.
Family members (son and daughter) acting under powers of attorney both financial and medical. F82
We work together as a family (4 children) and I hope that between them, with one as financial attorney, that all will be well. Another 2 of the children have a medical power of attorney (one is a doctor) F78
I hope we have covered with my daughter and the professionals we have chosen. F75
The remaining respondents indicated that they were anticipating needing help and support in a general sense, or more specifically help to pay the bills and manage daily financial tasks, or with investment advice. Some specified using powers of attorney or trustee companies.
Thirty respondents said they needed ‘someone to help take care of their affairs’. Some specified that they wanted their affairs ‘fully managed’, some wanted ‘general help’, and a man in his late sixties wanted ‘Someone reliable and at reasonable cost’. There was some overlap in this group with those who specified they wanted ‘help to pay bills’.
Twenty one people nominated bill paying as an issue. This included internet banking, banking cheques, and day-to-day advice.
The instruments nominated to help with managing their financial affairs focused on powers of attorney, and the use of professionals. Twenty two respondents (5%) declared they had granted power of attorney, mostly to their children.
I presently have in place a financial Power of Attorney and a medical Power of Attorney. This has been in place for a number of years as I am 89 and vision impaired. M89
Several were able to state that seeking support was in anticipation of ‘intellectual deficiency’ M84, and others suggested a power of attorney would supplement personal care to be provided in a nursing home.
8.2 Reducing risk of mismanagement of financial affairs
There were 53 written responses to the Survey question about what participants planned to do to reduce risk of mismanagement of their finances. This was 13% of respondents. The four main strategies they identified were to:
1. Keep a close eye on their account
2. Discuss the issue with their family
3. Appoint joint powers of attorney
4. Seek the advice of professionals such as lawyers and accountants.
Most of the nine people who planned to keep a close eye on their accounts were men (6 out of 9), and they ranged in age from 68 to 92. Men were less likely than women to discuss the issue with their family (6 out of 8, - note that men comprised 3/4 of the respondents to the survey) and they ranged in age from 69 to 87. Joint powers of attorney was the strategy of choice for three women out of the seven who plan to do this, and the age range for this protective behaviour was 66 to 89. Six people (two women) would seek the advice of a professional and they ranged in age from 70 to 84.
Four people said they would consult a trustee company and two were going to rely on family.
Six respondents were determined to stay in control either by living longer, keeping details of their accounts secret, or restricting access to their accounts. This strategy, and that of keeping a close eye on their accounts, does not take into account the possibility of diminished capacity.
8.3 Support needed for future financial securityMost of the Survey participants (224 out of 416) answered the free text question about what was needed for future financial security in case they cannot manage themselves. The majority of responses (137 out of 224) were that future financial security depended on ‘family’, in one form or another. Family included primarily daughters, sons, sons and daughters-in-law, and wives, in that order.
The feeling generated by these responses was one of both relief and pride that the respondent had family they could rely on, sometimes supported by powers of attorney or professionals.
The generic term ‘family’ was the most commonly used. It seemed to be the fact of the relationship, rather than the detail, that mattered.
My family help me with any problems F85
I am lucky to have a caring family F86
At the age of 85, I feel capable of managing ok, if I can’t the family will look after that for me M85
When family members were specified it was most often daughters and sons who were named. The strength in these relationships lies in their unquestioning trust, pride in their children and confidence that their children have both the skills and the intention to be able to help.
My elder daughter has my Power of Attorney and helps me now M92
My wife and I have 2 sons and 2 daughters, they will assist 87M
My daughters take care of my affairs F87
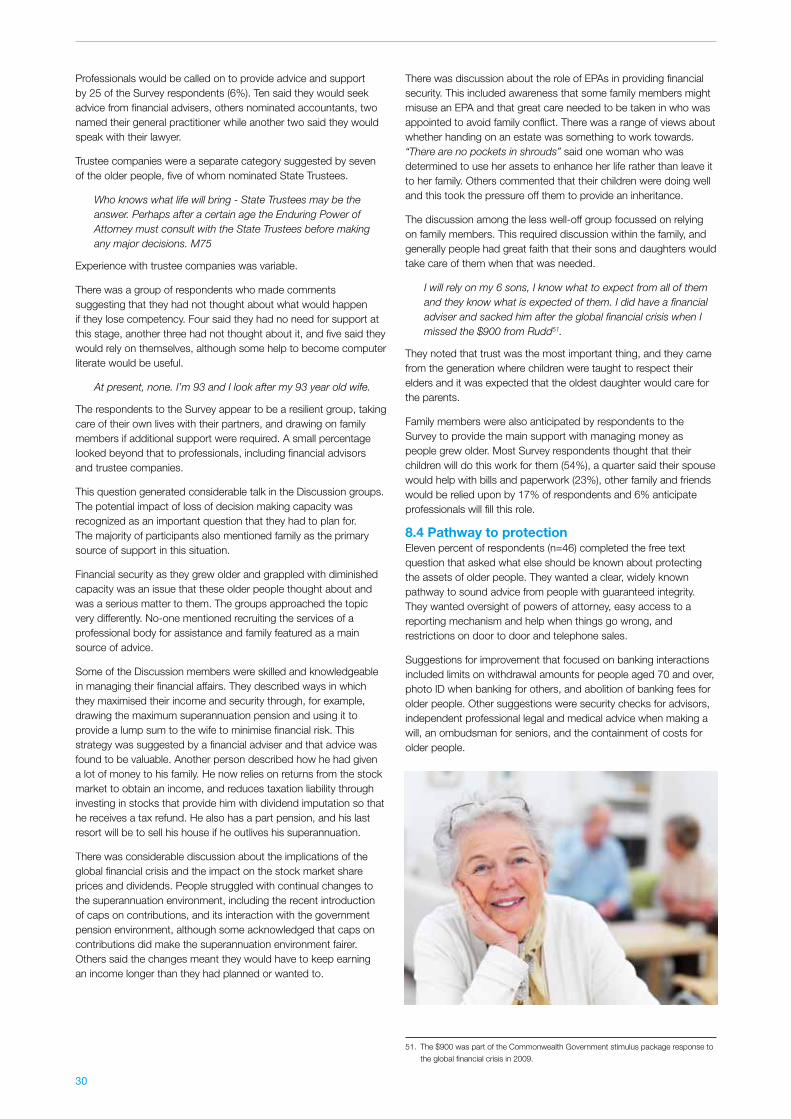
30
There was discussion about the role of EPAs in providing financial security. This included awareness that some family members might misuse an EPA and that great care needed to be taken in who was appointed to avoid family conflict. There was a range of views about whether handing on an estate was something to work towards. “There are no pockets in shrouds” said one woman who was determined to use her assets to enhance her life rather than leave it to her family. Others commented that their children were doing well and this took the pressure off them to provide an inheritance.
The discussion among the less well-off group focussed on relying on family members. This required discussion within the family, and generally people had great faith that their sons and daughters would take care of them when that was needed.
I will rely on my 6 sons, I know what to expect from all of them and they know what is expected of them. I did have a financial adviser and sacked him after the global financial crisis when I missed the $900 from Rudd51.
They noted that trust was the most important thing, and they came from the generation where children were taught to respect their elders and it was expected that the oldest daughter would care for the parents.
Family members were also anticipated by respondents to the Survey to provide the main support with managing money as people grew older. Most Survey respondents thought that their children will do this work for them (54%), a quarter said their spouse would help with bills and paperwork (23%), other family and friends would be relied upon by 17% of respondents and 6% anticipate professionals will fill this role.
8.4 Pathway to protectionEleven percent of respondents (n=46) completed the free text question that asked what else should be known about protecting the assets of older people. They wanted a clear, widely known pathway to sound advice from people with guaranteed integrity. They wanted oversight of powers of attorney, easy access to a reporting mechanism and help when things go wrong, and restrictions on door to door and telephone sales.
Suggestions for improvement that focused on banking interactions included limits on withdrawal amounts for people aged 70 and over, photo ID when banking for others, and abolition of banking fees for older people. Other suggestions were security checks for advisors, independent professional legal and medical advice when making a will, an ombudsman for seniors, and the containment of costs for older people.
51. The $900 was part of the Commonwealth Government stimulus package response to
the global financial crisis in 2009.
Professionals would be called on to provide advice and support by 25 of the Survey respondents (6%). Ten said they would seek advice from financial advisers, others nominated accountants, two named their general practitioner while another two said they would speak with their lawyer.
Trustee companies were a separate category suggested by seven of the older people, five of whom nominated State Trustees.
Who knows what life will bring - State Trustees may be the answer. Perhaps after a certain age the Enduring Power of Attorney must consult with the State Trustees before making any major decisions. M75
Experience with trustee companies was variable.
There was a group of respondents who made comments suggesting that they had not thought about what would happen if they lose competency. Four said they had no need for support at this stage, another three had not thought about it, and five said they would rely on themselves, although some help to become computer literate would be useful.
At present, none. I’m 93 and I look after my 93 year old wife.
The respondents to the Survey appear to be a resilient group, taking care of their own lives with their partners, and drawing on family members if additional support were required. A small percentage looked beyond that to professionals, including financial advisors and trustee companies.
This question generated considerable talk in the Discussion groups. The potential impact of loss of decision making capacity was recognized as an important question that they had to plan for. The majority of participants also mentioned family as the primary source of support in this situation.
Financial security as they grew older and grappled with diminished capacity was an issue that these older people thought about and was a serious matter to them. The groups approached the topic very differently. No-one mentioned recruiting the services of a professional body for assistance and family featured as a main source of advice.
Some of the Discussion members were skilled and knowledgeable in managing their financial affairs. They described ways in which they maximised their income and security through, for example, drawing the maximum superannuation pension and using it to provide a lump sum to the wife to minimise financial risk. This strategy was suggested by a financial adviser and that advice was found to be valuable. Another person described how he had given a lot of money to his family. He now relies on returns from the stock market to obtain an income, and reduces taxation liability through investing in stocks that provide him with dividend imputation so that he receives a tax refund. He also has a part pension, and his last resort will be to sell his house if he outlives his superannuation.
There was considerable discussion about the implications of the global financial crisis and the impact on the stock market share prices and dividends. People struggled with continual changes to the superannuation environment, including the recent introduction of caps on contributions, and its interaction with the government pension environment, although some acknowledged that caps on contributions did make the superannuation environment fairer. Others said the changes meant they would have to keep earning an income longer than they had planned or wanted to.

31
Staying safe with money: the experience of older English speaking Victorians
majority of older individuals believed that an EPA would protect them (D’Aurizio, 2007). It is likely that respondents in this study made their EPA appointments on the basis that they believed this action would provide them with some protection in the future. This is supported by the finding that the majority of participants had no further plans to increase their future financial security. EPA is a relatively new concept in our society and the widespread appointment of attorneys demonstrated in this study does show that people realise that at some point in the future they may be vulnerable and may need someone to assist them.
Some people in the Discussion groups were unclear about the difference between medical and financial EPA and their will. This is a common experience for clinicians and the difference between these documents (and the appointed Executor of a will) is so important that failure to appreciate the difference raises concerns about how many people in the community erroneously believe they have appointed a financial EPA. It highlights the importance of standardising the process by which the capacity of individuals to appoint a financial EPA is assessed by witnesses at the time of the appointment.
The second hypothesis was that the majority of Victorians would prefer family members over professionals to assist them to manage their financial affairs should they become less competent in the future. This hypothesis was supported . The overwhelming majority indicated that family would be their primary source of support for day-to-day assistance with finances if they needed assistance, with only 12% nominating professional services. Similarly, talking to family was the most commonly selected way people would improve their various skills and confidence. Sixty one percent of respondents with an EPA appointed one or more of their children, 22% appointed their spouse, 12% another family member, and 5% a professional. Similarly, in the study by D’Aurizio (2007), 74% of people older than 50 who had prepared an EPA appointed one or more of their children, and only 15% had appointed a spouse.
In the current study, older people were statistically more likely than the younger respondents to have appointed adult children as their EPA. These findings are consistent with the probable death of spouses with increasing age, and a consequent shift of sources of support from partner to children.
In addition, the old old (aged 85 and more) in the current study were nearly twice as likely to appoint a professional to the role of Attorney (7%) than the middle age group respondents (3%), although the youngest age group was just as likely as the oldest age group to appoint professionals. These proportions are consistent with the percentage of respondents who did not have children (5%), and it is possible that professionals are used primarily by those without family to fill the role.
Gender was also found to be a factor in determining who people appointed as EPA. Women were statistically more likely than men to appoint adult children as EPA, while men were more likely to appoint their spouse. The discrepancy is most likely explained by the earlier age of death of men combined with their older age at marriage, which means older women are less likely than older men to have a (cognitively intact) spouse to appoint as attorney. It is also likely to reflect the greater role of women in maintaining family connection over their lifetime compared with that of men, so that women have enduring relationships with their children. These findings are also consistent with D’Aurizio (2007) who found that for people older than 50 years, women were much more likely than men to appoint a son or daughter as attorney, and less likely to
9. DiscussionThe Victorian Government’s Elder Abuse Strategic Implementation Plan 2006–2009 had as one of its four major goals, “increasing awareness, support and information for older people in need of assistance” (Office of Senior Victorians, 2007). The mismanagement of the financial assets of older people makes up half of the abuse of older people, and appears to be a relatively unreported form of abuse in the community. The broad aim of the current study was to provide some foundation for planning regarding the development of appropriate and timely financial support services for older Victorians, as a measure for reducing the incidence of both obvious cases of elder financial mismanagement as well as the less severe but potentially more common cases of financial mismanagement of older peoples’ assets. This study is the first to investigate the current practices and future financial management strategies of older Victorians. While the Victorian Government promotes education and research over legislative reform as key ways to reduce elder abuse issues in our community (Slipper, 2007), this research could be used in the future to facilitate any development of public policy aiming to protect older people from financial abuse.
More specific aims of the study were to gather qualitative and quantitative data regarding older English speaking Victorians’:
• awareness of financial abuse
• current financial management practices
• expectations of and plans to protect their future financial security
• awareness and satisfaction with support services available to reduce their risk of abuse
• factors that mediate the relevancy of financial support services for this population
In addition to the aims listed above, the study tested several hypotheses of interest that were generated from the PEAS research programme, previous literature and clinical experience of the research team.
9.1 Current financial practiceThe study sought to ascertain what strategies older Victorians had in place to assist them to manage their financial affairs, and to gauge their degree of interest and involvement in day-to-day financial management. It is recognised that financial management can be complex and not all older people have the skills, capacity or inclination to ensure that their money is managed wisely or that it lasts until they die. This may apply particularly where one member of a couple, usually the husband in the current generation of older people, has had the responsibility for managing finances and he dies. His widow may have no experience of financial decision-making and be at considerable risk of making decisions that do not benefit her, or of having others do so with her assets. It is also acknowledged that people have the right to make unsound decisions about their lives52.
The first hypothesis was that the majority of respondents would have already appointed an EPA (financial). This hypothesis was supported as the majority of Survey respondents (69%) and members of the Discussion groups (58%) had appointed an EPA (financial). Age was found to be an important factor with those older than 84 years nearly three times as likely as those aged 65-84 years to have made an appointment. Although this study did not explicitly ask respondents whether they believed an EPA would protect them from abuse, previous researchers have found that the
52. Department of Human Services Aged Care Branch (2009) With respect to age – 2009
www.health.vic.gov.au/agedcare/policy/index.htm accessed 20/1/2010

32
Previous literature has found widespread disagreement between husbands and wives, and attorneys with a medical EPA and their donors, on many sensitive issues when both are interviewed separately. People in this study who reported they had not discussed managing finances with their family were at risk of not having their wishes taken into account by their attorney, and many more respondents could be at risk through erroneously thinking their family implicitly understand how they want their finances managed in the future without having regular explicit discussions or any written instructions.
Perceived agreement does not necessarily mean that an attorney would choose the ‘correct’ course of action if an issue were to arise in the future where the attorney was required to make a decision on behalf of the donor. A program to encourage donors of powers of attorney to discuss how the attorney should respond to common events, and initial that this discussion has taken place, may help attorneys to carry out their duties. Government and trustee companies could make available fact sheets describing common scenarios that occur in the management of financial affairs, and helpful and dangerous ways to deal with them55. This could be made available as part of the booklets containing Enduring Power of Attorney and Guardianship forms.
The third hypothesis was that the majority of respondents to the Survey would report a high level of interest and involvement in managing their day-to-day financial affairs. This was strongly supported by the data. Respondents tended to rate themselves as very interested and very involved in the day-to-day management of their financial affairs (mean rating of 6.4 on 7 point scale). It was anticipated that women would be less likely than men to be engaged in managing their own finances. There was no statistically significant effect of age, gender or income level on how interested or involved respondents were in day-to-day money management.
Tilse et al (2005a) identified that lack of confidence is a major reason why older people hand over management of their financial affairs to others. This question was not explicitly considered in the PEA Study, however the evidence of a high level of interest and involvement in managing their money by respondents suggests that most are not suffering from lack of confidence in all but the most complex areas of their financial management as discussed below.
In terms of current support with money management, approximately 40% of the survey respondents reported seeking help from family members and a similar percentage was found for those using financial advisors. The most commonly used professional services were financial advisors, banks and accountants. The tasks that people most commonly sought help for were managing investments (41%), followed by managing pensions and superannuation (32%). More than one third of respondents sought help accessing financial advice (36%). They were least likely to seek help with property management (14%), banking (16%) or paying bills (17%).
These results show that people in this study are currently interested and involved in managing their own financial affairs and many have sought out additional assistance to help them manage some of the more complex financial tasks such as managing investments. Family members are relied on as frequently as financial advisors to assist with support for these complex tasks. However, further analysis demonstrated that satisfaction with this support was higher for that received from family than it was from professionals. Of the professional supports used, satisfaction was found to be highest for accountants in both the Surveys and Discussion groups.
55. It is noted that State Trustees have developed such Fact Sheets and they are available
on their website, at www.statetrustees.com.au
appoint their spouse53. Men in that study were also less likely than women to appoint a daughter as attorney.
People in all age groups showed great reluctance to employ professionals as attorneys. It is possible that older people might be more comfortable having their children take or mismanage a portion of their money through misuse of powers of attorney, rather than giving control to strangers. They may fear that ceding control to non-family might result in them losing the ability to take back control, or access their money in non-approved ways if they need it. It may also reveal money management practices in the family that are not strictly legal, or may have the appearance of not being so. The appointment of professionals may also be interpreted as a slur on the integrity or capability of family members and avoided for that reason.
This study did not specifically address whether older people think that the holders of an EPA can be potential financial abusers, or the risks of appointing an EPA. However when asked to provide examples of misuse of the money of older people six Survey respondents nominated misuse of powers of attorney as one mechanism for how it is accomplished, and 11 named family members as the people who mismanaged the older person’s money. Members of the Discussion groups mentioned examples of attorneys mismanaging the finances of the donor (the parent) and they believed that EPAs should be monitored. This shows there was some awareness that there are risks associated with appointing family members as attorneys.
In the Discussion groups, participants revealed that a trustworthy family relationship is a source of pride and comfort. The details of care do not seem to be important as the relationship is assumed to be strong enough to cover all eventualities. There is a sense also of relief, that whatever the future holds, strong family bonds will protect the older person so that ‘all will be well’. For this English speaking group of respondents, blood is thicker than water and if at all possible family business will stay within the family. There was little awareness that children, particularly sons, have been identified as the major perpetrators of mismanagement of older peoples’ assets54.
The widespread use of family members as financial attorneys highlights the importance of explicit discussion of the future financial management wishes of donors with their family members who hold the EPA, and with other family members too if conflict is to be avoided. We investigated how often respondents believed their family understood how they wanted their finances managed in the future in the event the donor could not manage the task themselves. The study found that three quarters of respondents (74%) believed there was agreement within their family regarding how their finances should be managed. Only 18% reported they had not discussed it with their family. The high level of perceived family agreement about how to manage their finances as they age potentially provides a solid foundation for encouraging the effective use of EPAs within families. However, it is important to note that respondents only reported believing there was agreement within their family and it is not clear whether this agreement has come from explicit discussion or whether there is an implicit understanding of general agreement with the family due to shared ideals, morals and values.
53. D’Aurizio (2007) Research into Community Attitudes to Elder Abuse in Western
Australia by Catalyse for the Department for Communities, Government of Western
Australia, p14. It should be noted that in her Table 3, percentages exceeded 100.
54. Wainer J, Darzins P, Owada K (2010) Prevalence of financial elder abuse in Victoria
Monash University, Melbourne

33
Staying safe with money: the experience of older English speaking Victorians
There is a sense in reports of other studies that older people have nowhere to turn for support other than family. Widely reported failings of the financial services industry and large institutions have cast a cloud over the trust that older people put in professionals and those who set themselves up to provide financial services as a private business. The PEA Study confirmed this level of suspicion for professional and business services, although it did identify a high level of use and satisfaction with some non-family services. These included accountants, Centrelink, banks, financial advisors and Veterans’ Affairs and Legacy.
The fourth aim of the study was to investigate what factors mediate the relevance of support services to older Victorians, with a focus on age, gender and income.
Effect of age
It was anticipated that older people would prefer family rather than professionals to help to manage their affairs if they become less competent as a result of illnesses that become more common with age. This hypothesis was supported. Older people were more likely than younger respondents to say they anticipate their children will help with paying bills and other money management tasks in the future. Older participants were also more satisfied with family help than the younger ones when using two age groups, younger than 85, or 85 and older.
Older people were significantly more likely than the younger participants in the study to both have an enduring power of attorney, and to employ professionals to hold their power of attorney. The oldest age group were more likely to be satisfied with services provided by banks, and to predict they would rely on their children, rather than other family as they grew older, and less likely to employ financial advisors or use the world wide web to increase their skills in financial management. People in the middle age range, 75-84, were more likely to be satisfied with the services of financial advisors than the younger age group. Respondents aged 85 and older were more likely than those of a younger age to be satisfied with the services of Veterans Affairs and Legacy. Age had no other significant effect on the tendency of respondents to seek out professional support services or their satisfaction with services they have previously used.
Effect of gender
The importance of understanding the impact of gender is described in the Victorian Government’s Ageing in Victoria: a plan for an age friendly society.
Men and women experience ageing differently. Women’s longer life expectancy means many more women live alone in later life. They may need to develop their ability to manage finances and may benefit from opportunities for community participation. Men may experience a loss of employment related social networks in retirement. They are less likely than women to regularly use health services, and may benefit from healthy living strategies and having more social opportunities56.
It was anticipated that women would be more likely than men to trust their children to manage their affairs. This hypothesis was supported. Women were statistically significantly more likely to appoint their child to the role of attorney than were men. Women were three times more likely to be satisfied with help from family members than men were.
56. Ageing in Victoria: a plan for an age friendly society 2010-2020. Department of
Planning and Community Development, Office of Senior Victorians p.59 http://www.
seniors.vic.gov.au/Web19/osv/dvcosv.nsf/AllDocs/FE76E507747FFA7ACA2577820
026A1F1?OpenDocument accessed 26th August 2010.
Some age difference was found for level of satisfaction with professional support services. The older survey respondents reported being most satisfied with support received from family and from Veterans Affairs and Legacy. Given that older age is a predictor of disability and cognitive decline, it is important that some of the main support services for people aged older than 64 are delivering satisfactory services to the old old.
9.2 Future financial practiceMore than half of the survey respondents reported that they did not plan to do anything further to reduce their risk of financial mismanagement, 18% were planning to do something, and the remainder were not sure. Of those who did suggest ways that to protect their finances in the future, the most common responses were to:
1. keep a close eye on their account
2. discuss the issue with their family
3. appoint joint powers of attorney
4. seek the advice of professionals such as lawyers and accountants.
When asked how they could upskill or increase their confidence to manage their finances in the future from a list of possible options including family, workshops, and internet based training, the majority of survey respondents reported they had or would use talking to their family members as an option as mentioned earlier. Consulting a financial advisor or lawyer were the next most common responses.
One strategy that older people could employ to reduce their risk of future financial mismanagement is to seek out, be aware of, and potentially utilise financial support services available in the community. The fifth hypothesis of this study was that older Victorians would lack awareness of what financial support services are available to them and many would report reluctance to use such resources in preference to using family members. This hypothesis was supported. Approximately one third of respondents reported very high knowledge of financial services available to older people in Victoria, one third had some knowledge, and around a third reported very little or no knowledge. Analysis by gender and age found no differences between men and women, or older and younger respondents that were either important or statistically significant.
When asked to project themselves into the future and predict who would help them with paperwork, banking and bills as they grow older, Survey respondents shifted their focus away from professional supports to their family. The support needed for future financial security was named as dependence on ‘family’, in one form or another. Family included primarily daughters, sons, sons and daughters-in-law, and wives, in that order. Eighty six percent said they thought their family would help them with paperwork, banking and paying bills as they grow older, and 12% will rely on professionals. There was no gender difference in these responses.
Discussion group participants tended to be aware of a limited number of services available in the community. When asked what strategies they would use to support their own future security needs they did not identify these same professional services. This suggests they either do not see these services as being a protective mechanism against potential abuse, or they do not believe that they personally require such professional support, possibly because they have family on whom they can rely instead.

34
another person. Eighty percent rated as high or very high their ability to recognize financial elder abuse, even though it was not considered to be common. They believed it to be a serious issue. It is unclear whether participants’ confidence in recognising elder abuse is related to the seriousness of behaviours they consider to be “abusive”.
There was a statistically significant difference between the oldest group of Survey participants and the youngest group, with the oldest group more likely to say they were able to recognise abuse than younger people. There was no difference between women and men in their perceived ability to recognise financial elder abuse.
People on the lowest incomes rated financial elder abuse as more serious than those on higher incomes. People with incomes of $20,000-$30,000 were twice as likely as participants on the lowest incomes to report that financial abuse in the community is common. Participants on the highest incomes were also twice as likely as participants on the lowest incomes to report that financial abuse in the community is common.
Several risk factors for financial abuse were identified. They included diminished capacity, failing eyesight, not asking for help from the right people, and risks posed by new financial management technology including internet banking. Setterland, Tilse et al (2007) have identified the risks that arise from the use of new technologies in financial management of the affairs of ordinary people. These include internet banking, use of ATMs, and identification through PINs. These financial instruments make family financial management easier, and they also add to the risk of mismanagement. Respondents to the PEA Study were aware of the risks of banking in the ethereal realm of the internet and their vulnerability once they have provided their PIN and account details to a support person. Some had developed strategies to deal with this such as regular inspection of transactions and statements.
Study participants reported they wanted a clear, widely known pathway to sound advice from people with guaranteed integrity. They wanted oversight of powers of attorney, easy access to a reporting mechanism and help when things go wrong, and restrictions on door to door and telephone sales.
This study both confirms some and challenges other findings from previous community studies in Australia. The work in Queensland by Setterland, Tilse and colleagues has demonstrated the wide spread responsibility of family members for supporting their parents as they grow older, and this includes managing their financial affairs. The Protecting Elders Assets Study confirms that reliance on family for financial management when faced with diminished capacity is the overwhelming preference, and plan, of older Victorians. The community study in Western Australia by D’Aurizo was less clear about the role of family in providing financial support, and her
Men were more likely to use external services to increase money management skills. Women were twice as satisfied as men with family support and financial advisors. A majority of women and men think their children will help them as they grow older although women were much more likely than men to think this.
Effect of income
It was anticipated that people with lower incomes would be more likely than people with higher incomes to rely on family members to manage their affairs as they grow older and less able to manage for themselves because of age related illnesses. This hypothesis was supported by the findings that higher income people were more likely to use external services to increase money management skills, and lower income people reported higher satisfaction with services provided by family members.
Higher income people were also more likely to obtain help managing investments than low income people and to be satisfied with the services provided by their accountants. Lowest income people were more likely to be satisfied with services provided by family members and to be satisfied with services provided by financial advisors. People on low incomes were more likely than people on higher incomes to be aware of financial services available to support older people in Victoria.
Studies by Tilse and colleagues have indicated that people of lower income are less likely to utilise financial support services on the basis that they believe they do not have enough money to warrant the expenses associated with using the service. However, other research has suggested that people of lower income are more likely to fall victim to abuse than wealthy people, and due to the smaller size of their assets they may need a larger proportion of their financial assets to fund their future care needs than wealthy people.
Survey respondents of all income levels were equally involved in the day-to-day management of their financial affairs.
9.3 Financial mismanagementThe final aim of the study was to explore older Victorians awareness of financial elder abuse in the community. We hypothesised that the majority of older Victorians would report a low awareness of what constitutes financial elder abuse, however they will rate the incidence as being relatively frequent and serious. This two-part hypothesis was both supported and not supported.
Members of the Discussion groups found the term ‘financial elder abuse’ uncomfortable to speak about and preferred the term ‘financial mismanagement’. They had a vague idea what elder abuse was and struggled to give a definition. Challenges with creating a definition for the term financial elder abuse are discussed in the literature broadly57. It appears that the term has not become resonant in the community and understandably many are unclear what the term means, and unwilling to identify with it.
Some of the Discussion group participants were able to provide examples of mismanagement of money. Examples tended to involve an EPA and family members. Three quarters of respondents to the Survey were not aware of any examples of financial elder abuse. Of the 93 people who said they were aware of examples, sixty two percent (n= 55) said it was very serious, and 19% (n=17) said it was not serious. The remainder, 19%, said it was moderately serious.
Despite not necessarily understanding the term financial elder abuse, Survey respondents were confident they would be able to recognize financial elder abuse if it were happening to them or
57. Lowndes G, Darzins P, Wainer J, Owada K and Mihaljcic T (2009) Financial abuse of
elders: a review of the evidence Monash University, Melbourne

35
Staying safe with money: the experience of older English speaking Victorians
There is a vulnerability to mismanagement of the financial affairs of older people identified through this data. The 18% of people who said they had not discussed managing finances with their family are at risk of not having their wishes taken into account by their attorney if the attorney is a family member, and the five percent who either disagree or only agree sometimes are at additional risk.
The findings from this project in the Protecting Elders Assets Study strongly support the idea that policy should be directed toward supporting older people in what they do. Given that older age is a predictor of disability and cognitive decline, it is important that some of the main support services for people aged older than 64 are delivering satisfactory services to the old and the old old. The strength of the findings about reliance on family, and the pride older people take in this, make it clear that reliance on family is the key strategy for the future and policy and interventions must enhance this way of working. This could include providing training and support for family members undertaking attorney responsibilities, and enhancing the role of Centrelink and the Department of Veterans’ Affairs and Legacy in advising about appointing attorneys or protecting against mismanagement. Centrelink has the facility to support older people manage their money by deducting regular bills from pension payments.
Trustee companies could position themselves as partners in supporting family members to carry out the onerous and complicated tasks of financial management of the affairs of older people, promoting reliability, trustworthiness and flexibility as core values. Perhaps trustee companies could put aside a discretionary amount that is agreed upon with the donor which they or their family can access on call and without justification.
The management of the affairs of their elders is a complex task which may arouse strong emotions. There has been little research on the emotional and psychosocial consequences to the carers who take on this task. In clinical practice breakdowns of relationships within families are seen commonly, as well as donors changing their appointment one or more times after the attorney challenges a decision of the donor who may be acting not in their own best interest due to impaired decision making capacity.
The modern family comes in many forms, as a result of breakdowns of marriage, re-partnering, and children living interstate and overseas. The resulting mix of step children, de facto parents and multiple grandparents challenge the strategy of primary reliance on partners and children. There are instances where someone overseas has been appointed as an attorney and the person is not aware of the difficulties the donor is having. Practically it can still be very difficult for EPA to protect older people from scams so public policy is needed to reduce the risk of being taken advantage of.
The most concrete and effective intervention that could support family members appointed as attorneys to do the right thing would be the establishment of a register of attorneys, and systematic or random audits of decisions and records be undertaken so that attorneys were made accountable for their decisions. This might make the organisation appointed to oversee the use of EPAs the ‘capable guardian’ that Tilse, Setterland et al and many others have suggested is the most promising approach to supporting the protection of the assets of older people. There is concern that this extra pressure would deter people from appointing an attorney or accepting the appointment. Such concern may be alleviated with more support for the people holding the power of attorney.
study included the full adult age spectrum, with small numbers of older people, and no data disaggregated after 70 years of age. This makes it a less useful comparator than the Queensland studies for the PEA Study.
Several of the microlevel components of the theoretical model of elder abuse constructed by Rabiner et al (2004) were found to have explanatory value58. Status inequality of gender and wealth were found to influence behaviour and reliance on family in relation to money management, although these were not directly related to vulnerability to financial mismanagement. Relationship type, measured by dependence on family, was not identified as particularly helpful as it was the main strategy of the great majority of respondents in the study. Individual factors of age and gender were explored and found to have an influence on a number of variables related to the experience of financial management and future plans for staying safe.
Routine activity theory, developed by Marcus Felson and Lawrence E. Cohen, is a useful way to think about the findings from this study. Participants were aware of and concerned about the difficulty of managing their assets as they grew older, and particularly if they became incompetent. Their primary strategy was to rely on family members, and yet many were aware of stories where this had not worked out. The data reflect the theory that crime is normal and reflects the opportunities available. Respondents to the study described opportunities that arose when older people become dependent on others for care, usually family. Often the trade off for this care was to relinquish control of assets, with just the hope that their children would ‘do what was expected of them’.
The theory predicts that if the opportunity is there, the reward is great enough and the potential victim is not well protected, then the crime, in this case financial mismanagement, will happen. It requires opportunity rather than bad people. The theory is useful in thinking about data from the study, which describe how the opportunity is there, for example with internet banking or access to the family home when mother moves in with her son or daughter; the reward is substantial, for example paying off a mortgage and obtaining a carer’s allowance; and the older person is not well protected because the person she/he expects to protect her/him is the very person who is taking the money.
The challenge for the policy response to minimise risks of financial mismanagement is to understand why older people are disinclined to use professional financial services and are so heavily dependent on family members when it is known that misuse is predominantly carried out by family members. This study provides evidence that there is a strong preference for involvement of family members rather than professionals, especially as people grow older. However there is also evidence of use of accountants, financial advisors, banks and other professionals in the management of financial affairs, and reasonable levels of satisfaction with these services. What is missing is the use of trustee services, which are specifically aimed at supporting people to manage their money as their capacity diminishes. Unspecified anxiety about loss of control of money, high costs, impersonal services, and stories about lack of responsiveness of trustee services interlinked with general distrust of financial institutions seems to reduce the probability of using financial trustee services.
If family-based financial management provides an acceptable outcome 99% of the time, and is catastrophic 1% of the time, the overall picture might seem satisfactory, when this is not actually so.
58. Rabiner D, O’Keefe J, and Brown D (2004) A conceptual framework of financial
exploitation of older persons. Journal of Elder Abuse and Neglect, 16

36
likely to differ substantially from people who were motivated to take part because they had misgivings arising from bad personal experiences and they wished to share these with others. The description of the participants’ self-reported experiences provides some insights into matters, and suggests that the sample was not so unusual as to have caused strong bias, but this cannot be ruled out. Furthermore, sampling through community organisations, such as the Returned Services League, is likely to access people who are socially engaged with organised society, and will miss out on people who lack social connections. It will also miss out on those too sick or frail to take part, exactly those people who are at increased risk of financial elder abuse and who might have the greatest difficulty in getting help.
Random sampling of community dwelling individuals that achieved a high response rate would increase confidence in the results.
10.4 Qualitative examination limited by small number of Discussion groups
The group discussions were truncated for practical logistic reasons and did not continue until the investigators were sure that no new themes were being identified, that “saturation” had been reached. There were many observations that remained tantalisingly only partly explained. Similarly, for practical logistic reasons the extraction of themes was done by the team by consensus rather than being done by independent observers who then compared their results. The latter would help guard against methodological error, especially against observer bias. To do justice to this complex area sets of focus group discussions, each of which were taken to thematic saturation, with subsequent sets of discussions being used to explore themes identified in earlier discussions would be required. A project of sufficient magnitude to achieve this would require some tens of focus group discussions, spread over many months, interspersed by structured analysis.
10.5 CautionThese factors mean the findings cannot be generalised readily to the whole Victorian older population and confirm that this was a pilot study.
Despite these limitations both the qualitative group discussion method and the more quantitative survey method have yielded interesting results.
The feeling that came from the Study was one of awareness of vulnerability, a need for protection from predators, and a determination to manage their affairs as long as possible. Strength was drawn from family members who could be relied on to take care of their elders when that was needed. There was a sense of pride in having trustworthy family who loved and supported them. This is a strongly held value which makes discussion of financial elder abuse problematic. To consider the possibility that a son or daughter would not take care of them suggests a shameful breakdown in family values, failure as a parent, weakness or inadequacy of a child, and lack of lovability of the older person. These are not judgements that older people welcome, and yet to ask them to consider that their family might be the ones to mismanage their affairs brings these judgements into play.
Aggregating all people aged 65 and older results in loss of information. Important differences between different groups of older people are lost. Research should be designed to disaggregate age into five or ten year age groups at a minimum, up until the maximum age.
The PEA Study was successful in accessing English speaking Victorians aged 65 and older and obtaining data from them about their use of financial services, their awareness of support services, their awareness of financial abuse and plans for protecting themselves if they lose capacity. It is a strength of the study that the old old (85 or older) took part. The mean age of participants was 78 and 5% were aged 90 or older. It is also a strength of the study that it includes both qualitative and quantitative data, which contribute to the reliability of the findings.
10. Limitations10.1 Small sampleThis study is best viewed as an exploratory pilot project that is somewhat larger than a usual pilot project, but is not sufficient to be a definitive study. A consequence of the small sample is that the likelihood of sampling error is increased. The small sample also limits the ability to perform the planned sub-group analyses. The risk of Type II error, failure to find a difference when in truth a real difference exists, is increased. The small sample size also precludes “split half modelling” which entails using one half of the study sample to develop models and the other half of the sample to test any models.
A well designed study some two orders of magnitude greater, analogous to that conducted in the United Kingdom would be required to explore these matters to provide both valid and precise descriptions 59.
10.2 Low response rate and over-representation of men
The response rate to the survey was only 22%, there was an over-representation of men, and people in lower socioeconomic sectors of the community were likely to be under-represented.
10.3 Composition of the sample – principally well, volunteer sample
The study participants were all volunteers. It is not known how similar or dissimilar in their experiences and views they were to other people who did not take part in the study. For example, if predominantly those people who were proud of how well they were managing their financial matters took part because it reinforced their sense of mastery and well-being, the results are
59. Wainer J, Darzins P, Owada K, (2010) Prevalence of financial elder abuse in Victoria
Monash University, Melbourne

37
Staying safe with money: the experience of older English speaking Victorians
The tasks for the future are likely to achieve the most impact if strategies to support older people to keep their money safe work with the assumption that most older people rely on their family members to manage their affairs. Strategies can then focus on how to support family members to take good care of their older members in ways that are safe for the older person and not too onerous for the younger generations. Framing this support as support for the younger generation to do the best they can will take care of the implied mistrust that lies behind a decision to rely on professionals.
A model for a gradual process of supported decision making for people without families, or those with families who are unable or unwilling to take on the tasks of an Enduring Power of Attorney, could have three stages.
The first stage would be collaborative decision making, during which time a professional person becomes familiar with the wishes and values of the older person. Stage two would be assisted decision-making where the professional advises and supervises the older person in carrying out their wishes. The third stage would be substituted decision-making where the professional applies what has been learnt about the wishes and values of the older person in making decisions for them if they become incapable of making decisions themselves.
Future studies about models to support older people to safely manage their money would benefit from exploring the needs of people on a wealth and income spectrum, separating those with little wealth and low income, from those with higher wealth and/or higher income. Their needs and strategies are likely to be quite different.
The findings from Staying safe with money are complimentedby the companion study of non-English speaking and rural older people and their money management strategies.
11. Future directionsThe most important findings from the Study that should be followed up are the reliance on family members for, and the reluctance to engage with professionals in, the management of finances by people as they become less interested or less able to manage their own affairs. Future work that probed the emotions and thoughts that explain these findings would provide the insights needed to formulate strategies to support older people to protect their assets as they age.
Recommendations that arise from Staying safe with money: the experience of older English speaking Victorians:
1. Government and trustee organisations that provide services to older people should encourage older people to engage with their family members in planning for the possibility of decreased decision-making capacity that may arise from illnesses that are more common with ageing.
2. Government or trustee company fact sheets about common scenarios that occur in the management of financial affairs could be made available as part of the booklets containing Enduring Power of Attorney and Guardianship forms. Fact sheets should illustrate both helpful and dangerous ways to deal with these scenarios.
3. A register of Enduring Power of Attorney directions should be considered. It should be available publicly and banks and other organizations dealing with attorneys appointed through an Enduring Power of Attorney would be able to rely on data on the register as proof of entitlement to act as a substitute decision maker for a client. Staff at the register could provide training to those who hold a power of attorney about the need to create and maintain documentation and how to carry out the duties of an attorney in the interests of the donor of the power.
4. That government agencies involved in providing services to older people pro-actively ensure that information about Enduring Powers of Attorney, wills, Seniors Rights Victoria and financial elder abuse is available to older people through senior citizens clubs, nursing homes, retirement villages, general practices and pharmacies.
5. That automatic teller machine use should not be available for people relying on an Enduring Power of Attorney. Attorneys should be required by banks to present to the bank with photo ID when dealing on the donor’s account.
6. Information about trustee company services, Seniors Rights Victoria and Enduring Power of Attorney forms should accompany information sent to people who apply for a Seniors Card.

38
Appendix 1: Data TablesNote: Data was exported into Stata database which were used for data analysis. In analysis of survey results all proportions are calculated as a percentage of valid responses. That is, missing data has been excluded.
Table 6: Q1. How would you rate your interest in managing your own financial affairs?
Q1: How would you rate your interest in managing your own financial affairs? (answers on the scale 0–7 where 0 being “Not interested at all” to 7 being “Very interested”)
Frequency Percent
0 7 1.74
1 1 0.25
2 3 0.75
3 10 2.49
4 14 3.48
5 30 7.46
6 47 11.69
7 290 72.14
Total 402 100
Table 7: Q1. Total, Mean, Standard Deviation, Minimum and Maximum
Variable Total Mean Std. Dev. Min Max
Q1 402 6.355721 1.358571 0 7
Table 8: Q2. Do you have a will?
Q2: Do you have a will? Frequency Percent
Yes 391 96.07
No 16 3.93
Total 407 100
Table 9: Q3. Do you have an Enduring Power of Attorney?
Q3: Do you have an Enduring Power of Attorney (Financial)? Frequency Percent
Yes 280 68.97
No 126 31.03
Total 406 100
Table 10: Q4. Who did you appoint (EPA)?
Q4: If you answered ‘Yes’ to Q3 who did you appoint? Frequency Percent
Spouse 62 22.14
Child 171 61.07
Other family/ friend 33 11.79
A professional 14 5
Total 280 100

39
Staying safe with money: the experience of older English speaking Victorians
Table 11: Q5. As you grow older who do you think will help you with paperwork, banking and bills?
Q5: As you grow older who do you think will help you with paperwork, banking and bills?
Frequency Percent
Spouse 92 22.89
Child 217 53.98
Other family/friend 68 16.92
A professional 25 6.22
Total 402 100
Table 12: Q6. Do you and your family mostly agree about how to manage your finances as you grow older?
Q6: Do you and your family mostly agree about how to manage your finances as you grow older?
Frequency Percent
Yes 295 73.75
No 7 1.75
Sometimes 24 6
Never discussed it 74 18.5
Total 400 100
Table 13: Q7. How would you rate your awareness of the financial services available to support seniors in Victoria?
Q7: How would you rate your awareness of the financial services available to support seniors in Victoria? (answers on the scale 0-7 where 0 being “Not interested at all” to 7 being “Very interested”)
Frequency Percent
0 59 14.82
1 16 4.02
2 25 6.28
3 50 12.56
4 36 9.05
5 67 16.83
6 104 26.13
7 41 10.3
Total 398 100
Table 14: Q7. Total, Mean , Standard Deviation, Minimum and Maximum
Variable Total Mean Std. Dev. Min Max
Q7 398 4.035176 2.294176 0 7

40
Table 15: Q8. Have you or will you use any of the services listed below to increase your skills or confidence in managing your financial affairs?
Q8: Have you, or will you, use any of the services listed below to increase your skill or confidence in managing your financial affairs?
Total (n) Yes No
Frequency (%) Frequency (%)
Q8a: World Wide Web based training 336 58 (17) 278 (83)
Q8b: Workshops at Senior Citizens clubs 330 43 (13) 287 (87)
Q8c: Workshops at a local club that you use 331 56 (17) 275 (83)
Q8d: Discussion with friends 344 177 (51) 167 (49)
Q8e: Employ a financial adviser 354 165 (47) 189 (53)
Q8f: Discussion with a lawyer 331 103 (31) 228 (69)
Q8g: Talk with a trustee company such as State Trustees 321 33 (10) 288 (90)
Q8h: Talk with your family 368 301 (82) 67 (18)
Q8i: Contact Seniors Rights Victoria 320 70 (22) 250 (78)
Q8j: Other (please specify) 6 - Veterans Affairs
- Currently, high level of interest and self education, ongoing
- Medical services, community services.
- Accountant
- Read financial papers and journals
- Accountant and stockbroker
Q8k: If none, please state why 3 - Lack of knowledge
- No need
- No need
Table 16: Q9. How would you rate your level of involvement in your day-to-day management of financial affairs such as paying bills and accessing money?
Q9: How would you rate your level of involvement in your day-to-day management of financial affairs such as paying bills and accessing money? (answers on the scale 0–7 where 0 being “Not interested at all” to 7 being “Very interested”)
Frequency Percent
0 2 0.49
1 4 0.98
2 5 1.23
3 9 2.21
4 7 1.72
5 21 5.16
6 35 8.6
7 324 79.61
Total 407 100

41
Staying safe with money: the experience of older English speaking Victorians
Table 17: Q9. Total, Mean, Standard Deviation, Minimum and Maximum
Variable Total Mean Std. Dev. Min Max
q9 407 6.515971 1.213274 0 7
Table 18: Q10a. Do you use any of the following services to help you manage money (Family members)?
Q10a: Family members (answers on the scale 0–7 where 0 being “very unsatisfied” to 7 being “Extremely unsatisfied”)
Frequency Percent
0 3 1.73
1 1 0.58
2 2 1.16
3 2 1.16
4 14 8.09
5 25 14.45
6 36 20.81
7 90 52.02
Total 173 100
Table 19: Q10a. Total, Mean, Standard Deviation, Minimum and Maximum
Variable Total Mean Std. Dev. Min Max
q10a 173 6 1.434622 0 7
Table 20: Q10b. Accountant
Q10b: Accountant (answers on the scale 0–7 where 0 being “very unsatisfied” to 7 being “Extremely unsatisfied”)
Frequency Percent
0 9 7.56
2 3 2.52
3 3 2.52
4 7 5.88
5 21 17.65
6 32 26.89
7 44 36.97
Total 119 100
Table 21: Q10b, Total, Mean, Standard Deviation, Minimum and Maximum
Variable Total Mean Std. Dev. Min Max
q10b 119 5.445378 1.964505 0 7

42
Table 22: Q10c. Banks
Q10c: Banks (answers on the scale 0–7 where 0 being “very unsatisfied” to 7 being “Extremely unsatisfied”)
Frequency Percent
0 11 6.92
2 11 6.92
3 13 8.18
4 14 8.81
5 44 27.67
6 26 16.35
7 40 25.16
Total 159 100
Table 23: Q10c. Total, Mean, Standard Deviation, Minimum and Maximum
Variable Total Mean Std. Dev. Min Max
q10c 159 4.861635 1.985638 0 7
Table 24: Q10d. Centrelink
Q10d: Centrelink (answers on the scale 0–7 where 0 being “very unsatisfied” to 7 being “Extremely unsatisfied”)
Frequency Percent
0 6 5.94
1 3 2.97
2 4 3.96
3 9 8.91
4 12 11.88
5 17 16.83
6 26 25.74
7 24 23.76
Total 101 100
Table 25: Q10d. Total, Mean, Standard Deviation, Minimum and Maximum
Variable Total Mean Std. Dev. Min Max
q10d 101 4.90099 2.007511 0 7

43
Staying safe with money: the experience of older English speaking Victorians
Table 26: Q10e. Financial advisers
Q10e: Financial advisers (answers on the scale 0–7 where 0 being “very unsatisfied” to 7 being “Extremely unsatisfied”)
Frequency Percent
0 10 5.88
1 4 2.35
2 7 4.12
3 11 6.47
4 16 9.41
5 28 16.47
6 45 26.47
7 49 28.82
Total 170 100
Table 27: Q10e. Total, Mean, Standard Deviation, Minimum and Maximum
Variable Total Mean Std. Dev. Min Max
q10e 170 5.105882 2.000139 0 7
Table 28: Q10f. Guardianship service
Q10f: Guardianship service (answers on the scale 0–7 where 0 being “very unsatisfied” to 7 being “Extremely unsatisfied”)
Frequency Percent
0 13 61.9
2 2 9.52
4 1 4.76
5 2 9.52
6 2 9.52
7 1 4.76
Total 21 100
Table 29: Q10f. Total, Mean, Standard Deviation, Minimum and Maximum
Variable Total Mean Std. Dev. Min Max
q10f 21 1.761905 2.547641 0 7

44
Table 30: Q10g. State Trustees
Q10g: State Trustees (answers on the scale 0–7 where 0 being “very unsatisfied” to 7 being “Extremely unsatisfied”)
Frequency Percent
0 16 61.54
2 2 7.69
3 1 3.85
5 2 7.69
6 3 11.54
7 2 7.69
Total 26 100
Table 31: Q10g. Total, Mean, Standard Deviation, Minimum and Maximum
Variable Total Mean Std. Dev. Min Max
q10g 26 1.884615 2.688151 0 7
Table 32: Q10h. Share holders association
Q10h: Share holders association (answers on the scale 0–7 where 0 being “very unsatisfied” to 7 being “Extremely unsatisfied”)
Frequency Percent
0 12 54.55
2 2 9.09
3 1 4.55
4 3 13.64
6 2 9.09
7 2 9.09
Total 22 100
Table 33: Q10h. Total, Mean, Standard Deviation, Minimum and Maximum
Variable Total Mean Std. Dev. Min Max
q10h 22 2.045455 2.609092 0 7
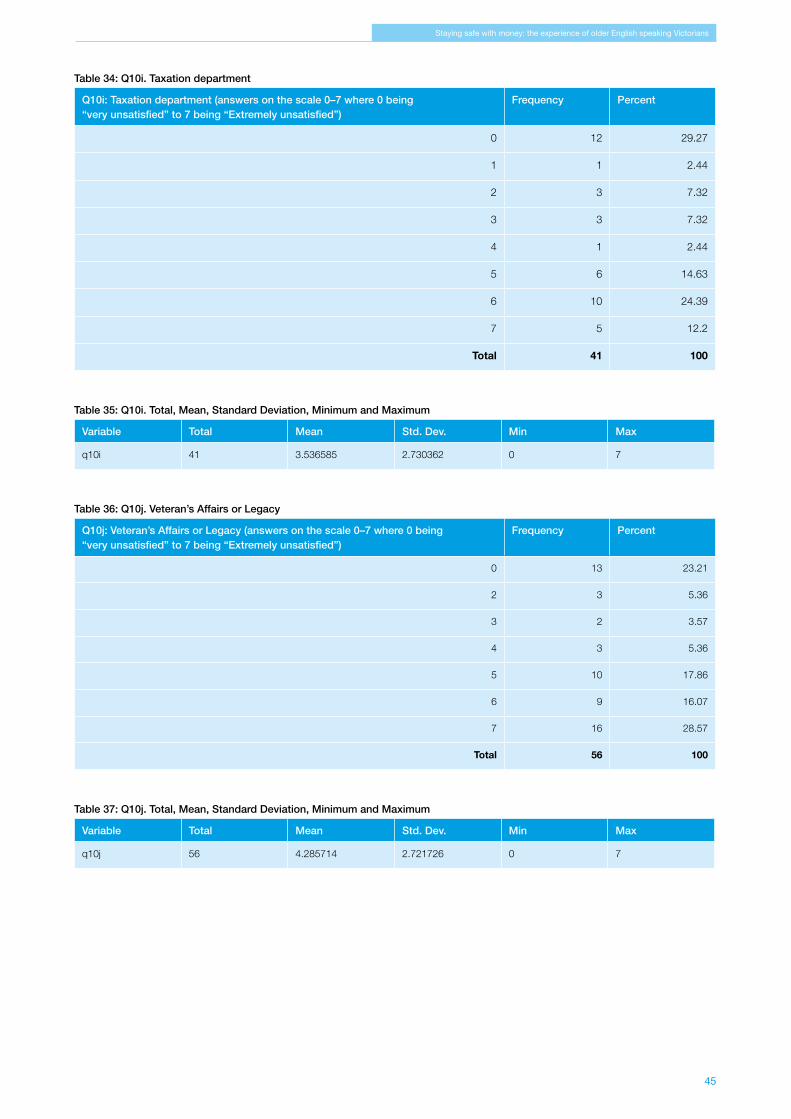
45
Staying safe with money: the experience of older English speaking Victorians
Table 34: Q10i. Taxation department
Q10i: Taxation department (answers on the scale 0–7 where 0 being “very unsatisfied” to 7 being “Extremely unsatisfied”)
Frequency Percent
0 12 29.27
1 1 2.44
2 3 7.32
3 3 7.32
4 1 2.44
5 6 14.63
6 10 24.39
7 5 12.2
Total 41 100
Table 35: Q10i. Total, Mean, Standard Deviation, Minimum and Maximum
Variable Total Mean Std. Dev. Min Max
q10i 41 3.536585 2.730362 0 7
Table 36: Q10j. Veteran’s Affairs or Legacy
Q10j: Veteran’s Affairs or Legacy (answers on the scale 0–7 where 0 being “very unsatisfied” to 7 being “Extremely unsatisfied”)
Frequency Percent
0 13 23.21
2 3 5.36
3 2 3.57
4 3 5.36
5 10 17.86
6 9 16.07
7 16 28.57
Total 56 100
Table 37: Q10j. Total, Mean, Standard Deviation, Minimum and Maximum
Variable Total Mean Std. Dev. Min Max
q10j 56 4.285714 2.721726 0 7

46
Table 38: Q10k. Other
Q10k: Other (please specify) (answers on the scale 0–7 where 0 being “very unsatisfied” to 7 being “Extremely unsatisfied”)
Frequency (n) Mean satisfaction on scale of 0–7
Catholic Super 1 3
Credit Union (MECU) 1 7
Stockbroker 4 3
RLS Welfare 1 4
Computer MYOB 1 6
Table 39: Q11a. Does anyone help with any of the following ways of managing your money (Paperwork)?
Q11a: Paperwork Frequency Percent
Yes 50 13.37
No 284 75.94
Sometimes 40 10.7
Total 374 100
Table 40: Q11b.Paying bills
Q11b: Paying bills Frequency Percent
Yes 43 11.44
No 313 83.24
Sometimes 20 5.32
Total 376 100
Table 41: Q11c. Banking
Q11c: Banking Frequency Percent
Yes 44 11.89
No 311 84.05
Sometimes 15 4.05
Total 370 100
Table 42: Q11d. Managing pension/ superannuation
Q11d: Managing pension/ superannuation Frequency Percent
Yes 91 24.73
No 250 67.93
Sometimes 27 7.34
Total 368 100

47
Staying safe with money: the experience of older English speaking Victorians
Table 43: Q11e. Property management
Q11e: Property management Frequency Percent
Yes 38 11.21
No 292 86.14
Sometimes 9 2.65
Total 339 100
Table 44: Q11f. Accessing financial advice
Q11f: Accessing financial advice Frequency Percent
Yes 86 24.36
No 224 63.46
Sometimes 43 12.18
Total 353 100
Table 45: Q11g. Managing investments
Q11g: Managing investments Frequency Percent
Yes 114 30.89
No 218 59.08
Sometimes 37 10.03
Total 369 100
Table 46: Q12. Did you obtain help from any of the following people?
Q12: If you answered ‘Yes’ to Q11 did you obtain help from any of the following people?
Frequency Percent
Children 74 33.79
Grandchildren 3 1.37
Other family 29 13.24
Professionals 103 47.03
Friend or neighbours 3 1.37
Other 7 3.2
Total 219 100

48
Table 47: Q13. As you grow older who do you think will help you with paperwork, banking and bills?
Q13: As you grow older who do you think will help you with paperwork, baking and bills?
Frequency Percent
Children 284 72.45
Grandchildren 7 1.79
Other family 42 10.71
Professionals 38 9.69
Friends or neighbours 8 2.04
Other 13 3.32
Total 392 100
Table 48: Q14. Who will you rely on to tell you if you are losing your capacity to make good decisions?
Q14: Who will you rely on to tell you if you are losing your capacity to make good decisions?
Frequency Percent
GP 41 10.51
Family 163 41.79
Friends, neighbours 6 1.54
Professionals 13 3.33
Other 167 42.82
Total 390 100
Table 49: Q16a. Are you aware of any examples of ‘financial elder abuse’?
Q16a: Are you aware of any examples of ‘financial elder abuse’? This is where trusted people use others’ money for their own benefit.
Frequency Percent
Yes 93 24.03
No 294 75.97
Total 387 100
Table 50: Q16b. How serious would you rate the situation?
Q16b: If ‘Yes’ to Q16a, how serious would you rate the situation? Frequency Percent
Nil 1 1.12
Low 16 17.98
Medium 17 19.1
High 27 30.34
Very high 28 31.46
Total 89 100

49
Staying safe with money: the experience of older English speaking Victorians
Table 51: Q17. How well would you rate your ability to recognise that financial abuse was happening to you or another person?
Q17: How well would you rate your ability to recognise that financial elder abuse was happening to you or another person?
Frequency Percent
Nil 7 1.85
Low 17 4.5
Medium 51 13.49
High 193 51.06
Very high 110 29.1
Total 378 100
Table 52: Q18. How common do you think financial elder abuse is in the community?
Q18: How common do you think financial elder abuse is in the community? Frequency Percent
Nil 6 1.78
Low 128 37.87
Medium 143 42.31
High 55 16.27
Very high 6 1.78
Total 338 100
Table 53: Q19. Do you think anyone is mismanaging or exploiting your money?
Q19: Do you think anyone is mismanaging or exploiting your money? Frequency Percent
No 379 98.19
Maybe 3 0.78
Not sure 4 1.04
Total 386 100
Table 54: Q20. Do you plan to do anything to reduce the risk of someone accidently or deliberately mismanaging your finances?
Q20: Do you plan to do anything to reduce the risk of someone accidently or deliberately mismanaging your finances?
Frequency Percent
Yes 66 17.93
No 211 57.34
Maybe 55 14.95
Not sure 36 9.78
Total 368 100

50
Table 55: Q23. Age group of Survey respondents
Q23: Please write Age group Frequency Percent
65–74 years 139 35.73
75–84 years 151 38.82
85+ years 99 25.45
Total 389 100
Table 56: Mean age
Variable Total Mean Std. Dev. Min Max
q23age 389 78.00514 7.690198 65 100
Table 57: Sex of Survey respondents
Q24 Frequency Percent
Female 107 27.16
Male 287 72.84
Total 394 100
Table 58: Current working status of Survey respondents
Q25: Please circle your current working status Frequency Percent
Paid work 24 6.12
Volunteer 20 5.1
Retired 343 87.5
Unpaid work 5 1.28
Total 392 100
Table 59: Marital status of Survey respondents
Q26: Please circle your marital status Frequency Percent
Married/ defacto 233 58.84
Separated 8 2.02
Divorced 26 6.57
Widowed 122 30.81
Never been married 7 1.77
Total 396 100

51
Staying safe with money: the experience of older English speaking Victorians
Table 60: Number of children of Survey respondents have
Q27: Please circle the number of children you have Frequency Percent
0 21 5.45
1 36 9.35
2 138 35.84
3 112 29.09
4 52 13.51
5 16 4.16
6 10 2.6
Total 385 100
Table 61: Mean, number of children of Survey respondents
Variable Total Mean Std. Dev. Min Max
q27 385 2.587013 1.261752 0 6
Table 62: Living arrangements of Survey respondents
Q28: Please circle your living arrangements Frequency Percent
Living with spouse, partner 223 57.03
Living with family 19 4.86
Living alone 122 31.2
Hostel or nursing home 8 2.05
Other 19 4.86
Total 391 100
Table 63: Income range of Survey respondents
Q29: Please circle the income range which best reflects your circumstances Frequency Percent
$0-19,999 68 18.63
$20,000-30,000 100 27.4
$30,000-39,999 62 16.99
$40,000-50,000 68 18.63
more than $50,000 67 18.36
Total 365 100
Table 64: Country of origin
Q31: Please circle your country of origin Frequency Percent
Australia 327 82.6
Europe 58 14.6
Other 11 2.8
Total 396 100

52
Table 65: A table of all the findings that are statistically significant
The survey question that was being answered: Q3. Do you have an Enduring Power of Attorney? Yes/No
Number who answered the question Group which was statistically significant
Odds Ratio
P value 95% Confidence Interval (CI)
N=387Age group:65-74 (n=139), 75-84 (n=150), 85+ (n=98)
65-74 (n=139): Yes (55%), No (45%)
- 0.00 -
75-84 (n=150): Yes (77%), No (23%)
85+ (n=98) Yes (78%), No (22%)
84 and younger (n=289) Yes (66%), No (34%)85 and older (n=98)Yes (78%), No (22%)
- 0.03 -
Female (n=106)65-74 (n=26)75-84 (n=57)85 and older (n=23)Male (n=279)65-74 (n=111)75-84 (n=93)85 and older (n=75)
85 and older Female (n=23) Yes (96%), No (4%)85 and older Male (n=75)Yes (72%), No (28%)
- 0.02 -
Q4. Who did you appoint? Spouse/ Child/ Other family/ A professional
Number who answered the question Group which was statistically significant
Odds Ratio
P value 95% Confidence Interval (CI)
N=267Age group:65-74 (n=76),
65-74 (n=76):Spouse(38%), Child(49%), Other family(7%), Professional (7%)
- 0.00 -
75-84 (n=115), 85+ (n=76)
75-84(n=76) Spouse(8%), Child(75%), Other family(15%), Professional(3%)
85+ (n=76)Spouse(8%),Child(75%),Other family(10%), Professional (7%)
84 and younger (n=19)Spouse(29%),Child(55%), Other family(12%), Professional (4%) 85 and older (n=76)Spouse(8%),Child(75%),Other family(10%), Professional (7%)
- 0.00 -
N=268Sex group:Female (n=83)Male (n=185)
Female (n=83):Spouse(6%), Child(78%), Other family(11%), Professional (5%)
- 0.00 -
Male (n=185): Spouse(30%),Child(53%),Other family(12%), Professional (5%)

53
Staying safe with money: the experience of older English speaking Victorians
The survey question that was being answered:Q5: As you grow older who do you think will help you with paperwork, banking and bills? Spouse, Child, A professional
Number who answered the question Group which was statistically significant
Odds Ratio
P value 95% Confidence Interval (CI)
N=319Age group:65-74 (n=119), 75-84 (n=121), 85+ (n=79)
65-74 (n=119): Spouse(40%), Child(51%), Professional(8%)
- 0.00 -
75-84 (n=121): Spouse(24%), Child (68%), Professional(8%)9
85+ (n=79)Spouse(15%), Child(80%), Professional(5%)
N=322Sex group:Female (n=92)Male (n=230)
Female (n=92):Spouse(13%), Child(80%), Professional (7%)
- 0.00 -
Male (n=230): Spouse(35%),Child(57%), Professional (8%)
The survey question that was being answered:Q8: Have you, or will you, use any of the services listed below to increase your skill or confidence in managing your financial affairs?” a) WWW based training, b) Workshops at Senior Citizens clubs, c) Workshops at a local club that you use, d) Discussion with friends, e) Employ a financial adviser, f) Discuss with a lawyer, g) Talk with a trustee company such as State Trustees, h)Talk with your family, i) Contact Seniors Rights Victoria
Category Number who answered the question
Group which was statistically significant
Odds Ratio
P value 95% Confidence Interval (CI)
Employ financial adviser N=341 Sex group:Female (n=90)Male (n=251)
Female Yes (36%), No (64%)MaleYes (51%), No (49%)
- 0.01 -
Comparing Male to Female 1.93 0.01 1.150-3.238
N=339Age group:65-74 (n=129), 75-84 (n=135), 85+ (n=75)
65-74 (n=129)Yes (59%), No (41%)75-84 (n=135)Yes (45%), No (55%)85+ (n=75)Yes (29%), No (71%)
- 0.00 -
84 and younger (n=264)Yes (52%), No (48%)85 and older (n=75)Yes (29%), No (71%)
- 0.00 -
N=318Income group:$0-19,999 (n=57)$20,000-30,000 (n=88)$30,000-39,999 (n=52)$40,000-$50,000 (n=60)More than $50,000 (n=61)
$0-19,999 (n=57)Yes (25%), No (75%)$20,000-30,000 (n=88)Yes (48%), No (52%)$30,000-39,999 (n=52)Yes (62%), No (38%)$40,000-$50,000 (n=60)Yes (52%), No (48%)More than $50,000 (n=61)Yes (53%), No (47%)
- 0.00 -
Less than $30,000 (n=145)More than $30,000 (n=173)
Less than $30,000 (n=145) Yes (39%), No (61%) More than $30,000 (n=173) Yes (55%), No (45%)
- 0.00 -
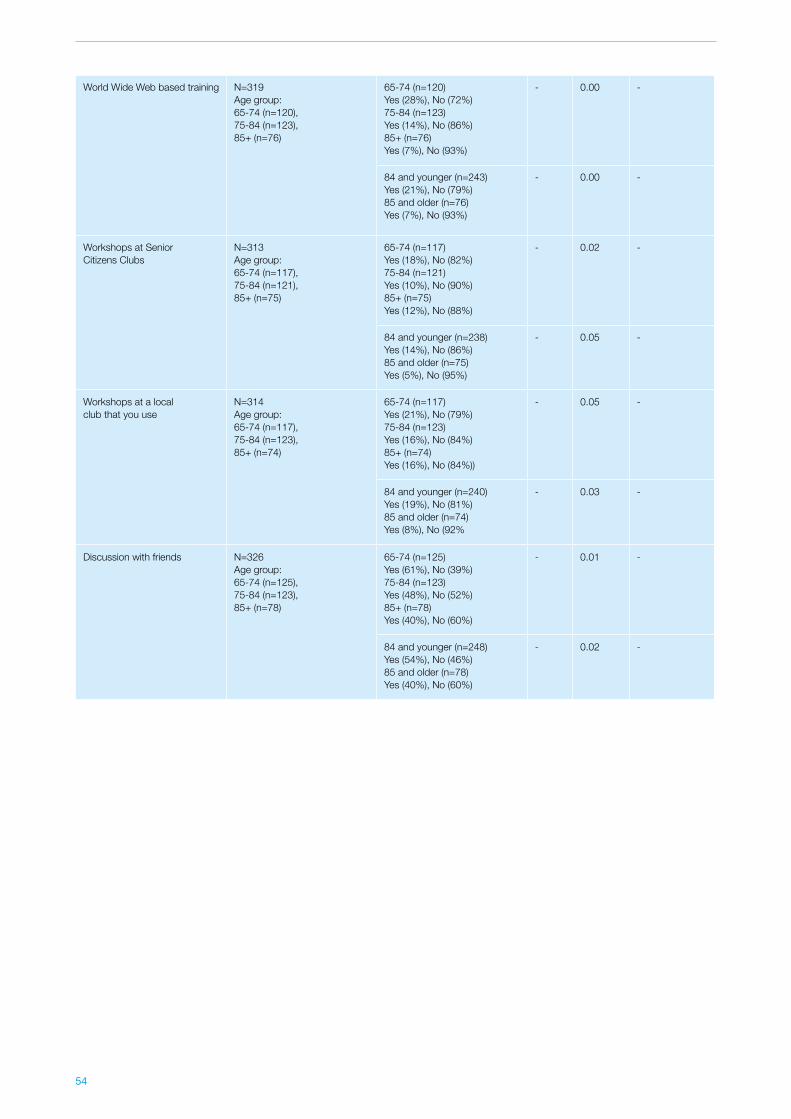
54
World Wide Web based training N=319Age group:65-74 (n=120), 75-84 (n=123), 85+ (n=76)
65-74 (n=120)Yes (28%), No (72%)75-84 (n=123)Yes (14%), No (86%)85+ (n=76)Yes (7%), No (93%)
- 0.00 -
84 and younger (n=243)Yes (21%), No (79%)85 and older (n=76)Yes (7%), No (93%)
- 0.00 -
Workshops at Senior Citizens Clubs
N=313Age group:65-74 (n=117), 75-84 (n=121), 85+ (n=75)
65-74 (n=117)Yes (18%), No (82%)75-84 (n=121)Yes (10%), No (90%)85+ (n=75)Yes (12%), No (88%)
- 0.02 -
84 and younger (n=238) Yes (14%), No (86%) 85 and older (n=75) Yes (5%), No (95%)
- 0.05 -
Workshops at a local club that you use
N=314 Age group:65-74 (n=117), 75-84 (n=123), 85+ (n=74)
65-74 (n=117)Yes (21%), No (79%)75-84 (n=123)Yes (16%), No (84%)85+ (n=74)Yes (16%), No (84%))
- 0.05 -
84 and younger (n=240)Yes (19%), No (81%)85 and older (n=74)Yes (8%), No (92%
- 0.03 -
Discussion with friends N=326Age group:65-74 (n=125), 75-84 (n=123), 85+ (n=78)
65-74 (n=125)Yes (61%), No (39%)75-84 (n=123)Yes (48%), No (52%)85+ (n=78)Yes (40%), No (60%)
- 0.01 -
84 and younger (n=248)Yes (54%), No (46%)85 and older (n=78)Yes (40%), No (60%)
- 0.02 -
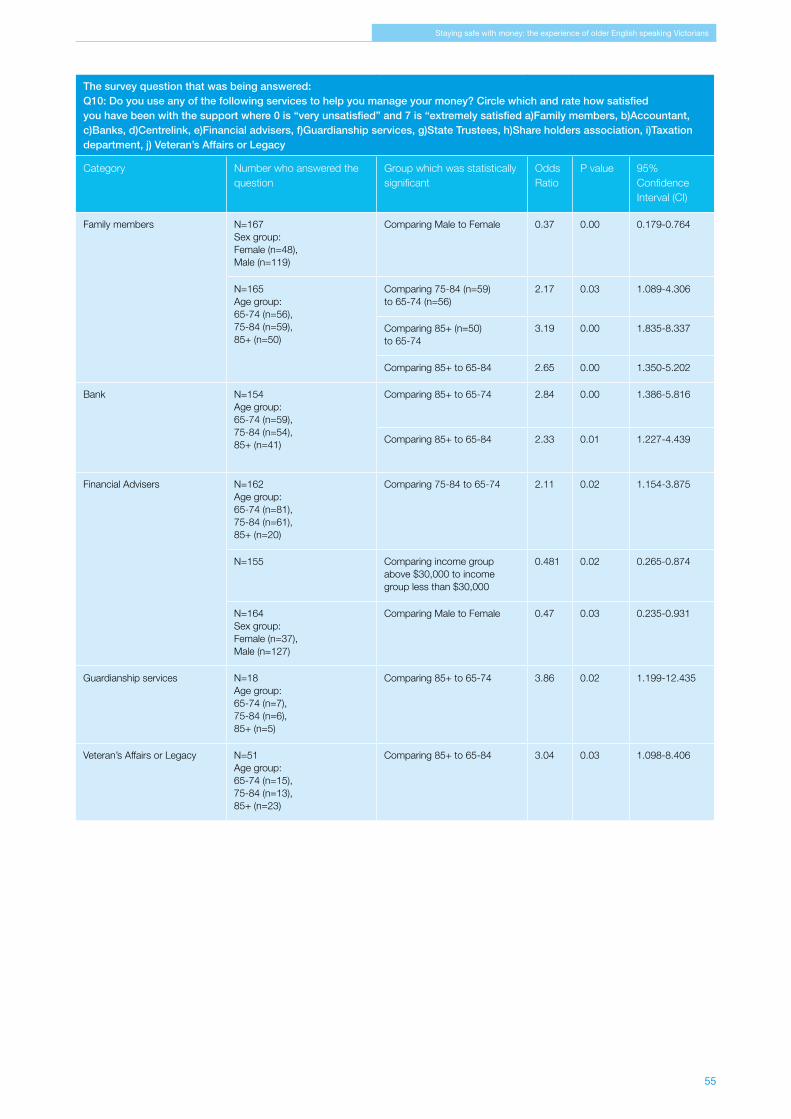
55
Staying safe with money: the experience of older English speaking Victorians
The survey question that was being answered:Q10: Do you use any of the following services to help you manage your money? Circle which and rate how satisfied you have been with the support where 0 is “very unsatisfied” and 7 is “extremely satisfied a)Family members, b)Accountant, c)Banks, d)Centrelink, e)Financial advisers, f)Guardianship services, g)State Trustees, h)Share holders association, i)Taxation department, j) Veteran’s Affairs or Legacy
Category Number who answered the question
Group which was statistically significant
Odds Ratio
P value 95% Confidence Interval (CI)
Family members N=167Sex group:Female (n=48), Male (n=119)
Comparing Male to Female 0.37 0.00 0.179-0.764
N=165 Age group: 65-74 (n=56), 75-84 (n=59), 85+ (n=50)
Comparing 75-84 (n=59) to 65-74 (n=56)
2.17 0.03 1.089-4.306
Comparing 85+ (n=50) to 65-74
3.19 0.00 1.835-8.337
Comparing 85+ to 65-84 2.65 0.00 1.350-5.202
Bank N=154Age group:65-74 (n=59), 75-84 (n=54), 85+ (n=41)
Comparing 85+ to 65-74 2.84 0.00 1.386-5.816
Comparing 85+ to 65-84 2.33 0.01 1.227-4.439
Financial Advisers N=162Age group:65-74 (n=81), 75-84 (n=61), 85+ (n=20)
Comparing 75-84 to 65-74 2.11 0.02 1.154-3.875
N=155 Comparing income group above $30,000 to income group less than $30,000
0.481 0.02 0.265-0.874
N=164Sex group:Female (n=37), Male (n=127)
Comparing Male to Female 0.47 0.03 0.235-0.931
Guardianship services N=18Age group:65-74 (n=7), 75-84 (n=6), 85+ (n=5)
Comparing 85+ to 65-74 3.86 0.02 1.199-12.435
Veteran’s Affairs or Legacy N=51Age group:65-74 (n=15), 75-84 (n=13), 85+ (n=23)
Comparing 85+ to 65-84 3.04 0.03 1.098-8.406

56
The survey question that was being answered:Q11: Does anyone help with any of the following ways of managing your money? Please circle Yes, No or Sometimes. a)Paperwork, b)Paying bills, c)Banking, d)Managing pension/superannuation, e)Property management, f)Accessing financial advice, g)Managing investments
Category Number who answered the question
Group which was statistically significant
Odds Ratio
P value 95% Confidence Interval (CI)
Paper work Female (n=93) Male (n=268)
Female Yes (15%), No (68%), Sometime (17%) Male Yes (13%), No (80%), Sometime (7%)
- 0.01 -
N=349Age group:65-74 (n=131), 75-84 (n=138), 85+ (n=80)
65-74 (n=131)Yes (38%), No (50%), Sometime (12%)75-84 (n=138)Yes (20%), No (75%), Sometime (5%)85+ (n=80)Yes (16%), No (79%), Sometime (5%)
- 0.00 -
84 and younger (n=269)Yes (29%), No (63%), Sometime (8%)85 and older (n=80)Yes (16%), No (79%), Sometime (5%)
- 0.04 -
Accessing financial advice N=336Age group:65-74 (n=129), 75-84 (n=130), 85+ (n=77)
65-74 (n=129)Yes (40%), No (53%), Sometime (16%)75-84 (n=130)Yes (21%), No (68%), Sometime (11%)85+ (n=77)Yes (20%), No (71%), Sometime (9%)
- 0.04 -
Managing investments N=331Income group:$0-19,999 (n=57)$20,000-30,000 (n=86)$30,000-39,999 (n=59)$40,000-$50,000 (n=64)More than $50,000 (n=65)
$0-19,999 (n=57)Yes (14%), No (82%), Sometime (4%)$20,000-30,000 (n=86)Yes (35%), No (52%), Sometime (13%)$30,000-39,999 (n=59)Yes (34%), No (51%), Sometime (15%)$40,000-$50,000 (n=64)Yes (41%), No (53%), Sometime (6%)More than $50,000 (n=65)Yes (32%), No (57%), Sometime (11%)
- 0.00 -

57
Staying safe with money: the experience of older English speaking Victorians
The survey question that was being answered:Q13: As you grow older who do you think will help you with paperwork, banking and bills ? group the responses into 3 categories 1. Family (include ‘Children’, ‘other family’, ‘grand children’) 2. Professionals (exclude ‘other’ and ‘friends and neighbours’)
Number who answered the question Group which was statistically significant
Odds Ratio
P value 95% Confidence Interval (CI)
N=355Age group:65-74 (n=125), 75-84 (n=138), 85+ (n=92)
65-74 (n=125):Family(86%), Professionals (14%)
- 0.05 -
75-84 (n=138): Family(88%), Professionals (12%)
85+ (n=92)Family(96%), Professionals (4%)
The survey question that was being answered:16 b: If Yes*, how serious would you rate the situation? Nil =1/ Low =2 /Medium=3 / High =4 /Very high =5(*Yes to Q16a: Are you aware of any examples of ‘financial elder abuse’? This is where trusted people use others’ money for their own benefit. YES =1/ NO =2)
Number who answered the question Group which was statistically significant
Odds Ratio
P value 95% Confidence Interval (CI)
N=355Income group:$0-19,999 (n=64)$20,000-30,000 (n=99)$30,000-39,999 (n=61)$40,000-$50,000 (n=65)More than $50,000 (n=66)
Comparing income group $40,000-$50,000 to $0-19,999
0.239 0.03 0.065-0.866
The survey question that was being answered:Q18. How common do you think financial elder abuse is in the community? Nil/ Low/Medium/ High/Very high
Number who answered the question Group which was statistically significant
Odds Ratio
P value 95% Confidence Interval (CI)
N=329Sex group:Female (n=80)Male (n=249)
Female (n=80):Nil (2%), Low (33%), Medium (44%), High (15%), Very high (6%)
- 0.00 -
Male (n=249): Nil (1%), Low (40%), Medium (43%), High (16%), Very high (0%)
N=307Income group:$0-19,999 (n=56)$20,000-30,000 (n=85)$30,000-39,999 (n=55)$40,000-$50,000 (n=57)More than $50,000 (n=54)
Comparing income group $20,000-30,000 to $0-19,999
0.41 0.01 0.218-0.768
Comparing income group more than $50,000 to $0-19,999
0.44 0.02 0.218-0.885

58
Appendix 2: References1. Ageing in Victoria: a plan for an age friendly society 2010-2020. Department of Planning and Community Development, Office of Senior Victorians http://www.seniors.vic.gov.au/Web19/osv/dvcosv.nsf/AllDocs/FE76E507747FFA7ACA2577820026A1F1?OpenDocument accessed 26th August 2010.
2. Australian Bureau of Statistics 2006 http://www.censusdata.abs.gov.au/ABSNavigation/prenav/TopicList?prenavtabname=Topic%20List&collection=Census&period=2006&breadcrumb=T&&navmapdisplayed=true&javascript=true&textversion=false& Accessed 2nd September 2010
3. Commonwealth of Australia(2001). National Strategy for an Ageing Australia: An Older Australia, Challenges and Opportunities for all. October 2001. http://www.longevity international.com/assets/National%20Strategy%20for%20an%20Ageing%20Australia.pdf accessed 30th September 2010.
4. Department of Human Services Aged Care Branch (2009) With respect to age – 2009 www.health.vic.gov.au/agedcare/policy/index.htm accessed 20/1/2010
5. D’Aurizio, T. (2007). Research into Community Attitudes to Elder Abuse in Western Australia. Catalyse. Department for Communities, Government of Western Australia. P21.
6. EpiData www.epidata.dk
7. Lowndes G, Darzins P, Wainer J, Owada K and Mihaljcic T (2009) Financial abuse of elders: a review of the evidence Monash University, Melbourne
8. Mihaljcic T and Lowndes G. (2010) Individual and Community Attitudes Toward Financial Elder Abuse (in press).
9. NVivo QSR International www.qsrinternational.com
10. Office of Senior Victorians (2009) Rights. Respect. Trust: Victorian Government Elder Abuse Prevention Strategy. http://www.seniors.vic.gov.au/Web19/osv/rwpgslib.nsf/GraphicFiles/Rights+Respect+Trust_Victorian+Government+Elder+Abuse+Prevention+Strategy/$file/Rights+Respect+Trust_Victorian+Government+Elder+Abuse+Prevention+Strategy.pdf accessed 09/02/2010
11. Office of Senior Victorians. www.seniors.vic.gov.au/web19/osv/dvcosv.nsf/headingpagesdisplay/elder+abuse+prevention accessed 20/1/2010
12. Office of Senior Victorians. Positive Ageing - A Strategy for Current and Future Senior Victorians , Department of Planning and Community Development, Victorian Government
13. Peri K, Fanslow J, Hand J. and Parsons J (2008) Elder abuse and neglect: Exploration of risk and protective factors A Report for the families commission. Wellington, Families Commission.
14. Rabiner D, O’Keefe J, and Brown D (2004) A conceptual framework of financial exploitation of older persons. Journal of Elder Abuse and Neglect, 16, 53-73.
15. Rosenman,L, & Scott W. (2009). Financing Old Age: Why is There Still Gender Inequality? Australian Social Work, 62(2), 287-298.
16. Setterland D, Tilse C, Wilson J, McCawley A-L and Rosenman L. (2007) Understanding financial elder abuse in families : the potential of routine activities theory Ageing & Society 27, pp599–614. Cambridge University Press, United Kingdom.
17. Setterlund, D., Tilse, C. and Wilson, J. 1999. Substitute Decision Making and Older People. Trends and Issues in Crime and Criminal Justice 139, Australian Institute of Criminology, Canberra.
18. Setterland D, Tilse C, Wilson J, McCawley A-L and Rosenman L. (2007) Understanding financial elder abuse in families : the potential of routine activities theory Ageing & Society 27, pp599–614. Cambridge University Press, United Kingdom p 603
19. Senior Rights Victoria. www.seniorsrights.org.au accessed 20/1/2010
20. Stata www.stata.com
21. Tilse C, Setterlund D, Wilson J and Rosenman L (2005a) Minding the money: a growing responsibility for informal carers Ageing & Society 25, 2005, 215–227. Cambridge University Press p 217
22. Tilse C, Setterlund D, Wilson J and Rosenman L (2007) Managing the Financial Assets of Older People: Balancing Independence and Protection British Journal of Social Work, Oxford University Press
23. Tilse C, Wilson J, Setterlund D and Rosenman L (2007). The New Caring: Financial Asset Management and Older People Annals of the New York Academy of Sciences 1114, 355-3561.
24. Tilse C, Setterlund D, Wilson J. and Rosenman L. (2005) Minding the money: a growing responsibility for informal carers Ageing and Society, 25, 215-227.
25. Victorian Government Elder Abuse Prevention Strategy: Rights, Respect, Trust: Financial Abuse Fact Sheet www.seniors.vic.gov.au accessed 17/8/10
26. Victoria Law Reform Commission (2010). Guardianship Information Paper. Victoria Law Reform Commission, Melbourne, State of Victoria, 2010. http://www.lawreform.vic.gov.au/wps/wcm/connect/99f66c0041a1b1959ec8fe5c95479e66/Web_GuardianshipInforPaper_withcover.pdf?MOD=AJPERES accessed 28 September 2010
27. Wainer J, Darzins P, Owada K (2010) Prevalence of financial elder abuse in Victoria Monash University, Melbourne .

59
Staying safe with money: the experience of older English speaking Victorians

Disclaimer: The information in this brochure was
correct at the time of publication. Monash
University reserves the right to alter this
information should the need arise.
CRICOS provider: Monash University 00008C.
November 2010. MMS288151
Further information
Monash University
Faculty of Medicine, Nursing and Health Sciences
Website: www.med.monash.edu.au
State Trustees
168 Exhibition Street
Melbourne, Victoria 3000
Website: www.statetrustees.com.au
Study supported by