Embed Size (px)
Citation preview

Total S.A.
Statutory auditors’ report on the consolidated financial statements
Year ended 31 December2009 Total S.A.

This is a free translation into English of the statutory auditors’ report on the consolidated financial statements issued in French and it is provided solely for the convenience of English-speaking users. The statutory auditors' report includes information specifically required by French law in such reports, whether modified or not. This information is presented below the audit opinion on the consolidated financial statements and includes an explanatory paragraph discussing the auditors' assessments of certain significant accounting and auditing matters. These assessments were considered for the purpose of issuing an audit opinion on the consolidated financial statements taken as a whole and not to provide separate assurance on individual account balances, transactions, or disclosures. This report also includes information relating to the specific verification of information given in the Group's management report. This report should be read in conjunction with, and construed in accordance with, French law and professional auditing standards applicable in France. Total S.A. Statutory auditors’ report on the consolidated financial statements
Year ended 31 December 2009
To the Shareholders,
In compliance with the assignment entrusted to us by your General Shareholder’s Annual Meeting, we hereby report to you, for the year ended 31 December 2009, on:
the audit of the accompanying consolidated financial statements of Total S.A.;
the justification of our assessments;
the specific verification required by law.
These consolidated financial statements have been approved by the Board of Directors. Our role is to express an opinion on these consolidated financial statements based on our audit.
1 Opinion on the consolidated financial statements
We conducted our audit in accordance with professional standards applicable in France; those standards require that we plan and perform the audit to obtain reasonable assurance about whether the consolidated financial statements are free of material misstatement. An audit involves performing procedures, using sampling techniques or other methods of selection, to obtain audit evidence about the amounts and disclosures in the consolidated financial statements. An audit also includes evaluating the appropriateness of accounting policies used and the reasonableness of accounting estimates made, as well as the overall presentation of the consolidated financial statements. We believe that the audit evidence we have obtained is sufficient and appropriate to provide a basis for our audit opinion.
3
In our opinion, the consolidated financial statements give a true and fair view of the assets and liabilities and of the financial position of the Group as at 31 December 2009 and of the results of its operations for the year then ended in accordance with International Financial Reporting Standards as adopted by the European Union.
Without qualifying our opinion, we draw your attention to the matter set out in the Note “Introduction” to the consolidated financial statements regarding application of the new definition and the new rules of estimates for Oil & Gas reserves.
2 Justification of our assessments
In accordance with the requirements of article L. 823-9 of French commercial Code (Code de commerce) relating to the justification of our assessments, we bring to your attention the following matters:
As stated in the Note “Introduction” to the consolidated financial statements, some accounting principles applied by Total S.A. involve a significant amount of assumptions and estimates principally related to the application of the successful efforts method for the oil and gas activities, the depreciation of long-lived assets, the provisions for dismantlement, removal and environmental costs, the valuation of retirement obligations and the determination of the current and deferred taxation. Detailed information relating to the application of these accounting principles is given in the notes to the consolidated financial statements.
Our procedures relating to the material assumptions and estimates made by the management and which can result from the application of these accounting principles enabled us to assess their reasonableness.
These assessments were made as part of our audit of the consolidated financial statements taken as a whole and, therefore, served in forming our audit opinion expressed in the first part of this report.
3 Specific verification
As required by law we have also verified, in accordance with professional standards applicable in France, the information relative to the group, given in the parent company's management report.
We have no matters to report regarding its fair presentation and its consistency with the consolidated financial statements.
4
Paris-La Défense, March 8, 2010
The Statutory Auditors KPMG Audit A division of KPMG S.A. Jay Nirsimloo
ERNST & YOUNG Audit Pascal Macioce
KPMG Audit Eenbnsq A division of KPMG S.A. Additional'mention

Page 1
Consolidated statement of income
TOTAL
For the year ended December 31, (€ million)(a)
2009 2008 2007
Sales (Notes 4 & 5) 131,327 179,976 158,752
Excise taxes (19,174) (19,645) (21,928)
Revenues from sales 112,153 160,331 136,824
Purchases net of inventory variation (Note 6) (71,058) (111,024) (87,807)
Other operating expenses (Note 6) (18,591) (19,101) (17,414)
Exploration costs (Note 6) (698) (764) (877)
Depreciation, depletion and amortization of tangible assets and mineral interests
(6,682) (5,755) (5,425)
Other income (Note 7) 314 369 674
Other expense (Note 7) (600) (554) (470)
Financial interest on debt (530) (1,000) (1,783)
Financial income from marketable securities & cash equivalents 132 473 1,244
Cost of net debt (Note 29) (398) (527) (539)
Other financial income (Note 8) 643 728 643
Other financial expense (Note 8) (345) (325) (274)
Equity in income (loss) of affiliates (Note 12) 1,642 1,721 1,775
Income taxes (Note 9) (7,751) (14,146) (13,575)
Consolidated net income 8,629 10,953 13,535
Group share* 8,447 10,590 13,181
Minority interests 182 363 354
Earnings per share (€) 3.79 4.74 5.84
Fully-diluted earnings per share (€)** 3.78 4.71 5.80
* Adjusted net income 7,784 13,920 12,203** Adjusted fully-diluted earnings per share (€) 3.48 6.20 5.37
(a) Except for per share amounts.
Page 2
Consolidated balance sheet
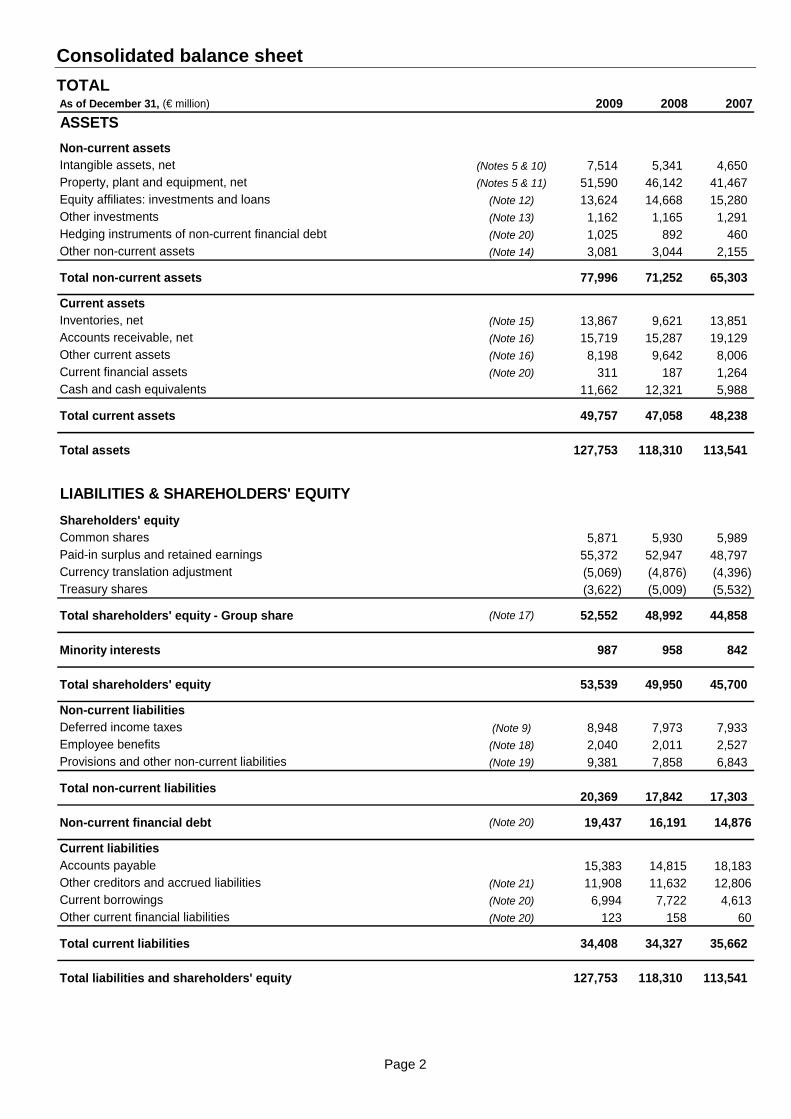
TOTALAs of December 31, (€ million) 2009 2008 2007
ASSETS
Non-current assetsIntangible assets, net (Notes 5 & 10) 7,514 5,341 4,650Property, plant and equipment, net (Notes 5 & 11) 51,590 46,142 41,467Equity affiliates: investments and loans (Note 12) 13,624 14,668 15,280Other investments (Note 13) 1,162 1,165 1,291Hedging instruments of non-current financial debt (Note 20) 1,025 892 460Other non-current assets (Note 14) 3,081 3,044 2,155
Total non-current assets 77,996 71,252 65,303
Current assetsInventories, net (Note 15) 13,867 9,621 13,851Accounts receivable, net (Note 16) 15,719 15,287 19,129Other current assets (Note 16) 8,198 9,642 8,006Current financial assets (Note 20) 311 187 1,264Cash and cash equivalents 11,662 12,321 5,988
Total current assets 49,757 47,058 48,238
Total assets 127,753 118,310 113,541
LIABILITIES & SHAREHOLDERS' EQUITY
Shareholders' equityCommon shares 5,871 5,930 5,989Paid-in surplus and retained earnings 55,372 52,947 48,797Currency translation adjustment (5,069) (4,876) (4,396)Treasury shares (3,622) (5,009) (5,532)
Total shareholders' equity - Group share (Note 17) 52,552 48,992 44,858
Minority interests 987 958 842
Total shareholders' equity 53,539 49,950 45,700
Non-current liabilitiesDeferred income taxes (Note 9) 8,948 7,973 7,933Employee benefits (Note 18) 2,040 2,011 2,527Provisions and other non-current liabilities (Note 19) 9,381 7,858 6,843
Total non-current liabilities20,369 17,842 17,303
Non-current financial debt (Note 20) 19,437 16,191 14,876
Current liabilitiesAccounts payable 15,383 14,815 18,183Other creditors and accrued liabilities (Note 21) 11,908 11,632 12,806Current borrowings (Note 20) 6,994 7,722 4,613Other current financial liabilities (Note 20) 123 158 60
Total current liabilities 34,408 34,327 35,662
Total liabilities and shareholders' equity 127,753 118,310 113,541

Page 3
Consolidated statement of cash flow
TOTAL
(Note 27)
For the year ended December 31, (€ million) 2009 2008 2007
CASH FLOW FROM OPERATING ACTIVITIES
Consolidated net income 8,629 10,953 13,535Depreciation, depletion and amortization 7,107 6,197 5,946Non-current liabilities, valuation allowances, and deferred taxes 441 (150) 826Impact of coverage of pension benefit plans - (505) -(Gains) losses on disposals of assets (200) (257) (639)Undistributed affiliates' equity earnings (378) (311) (821)(Increase) decrease in working capital (3,316) 2,571 (1,476)Other changes, net 77 171 315Cash flow from operating activities 12,360 18,669 17,686
CASH FLOW USED IN INVESTING ACTIVITIES
Intangible assets and property, plant and equipment additions (11,849) (11,861) (10,549)Acquisitions of subsidiaries, net of cash acquired (160) (559) (20)Investments in equity affiliates and other securities (400) (416) (351)Increase in non-current loans (940) (804) (802)Total expenditures (13,349) (13,640) (11,722)Proceeds from disposals of intangible assets and property, plant and equipment 138 130 569Proceeds from disposals of subsidiaries, net of cash sold - 88 5Proceeds from disposals of non-current investments 2,525 1,233 527Repayment of non-current loans 418 1,134 455Total divestments 3,081 2,585 1,556Cash flow used in investing activities (10,268) (11,055) (10,166)
CASH FLOW USED IN FINANCING ACTIVITIES
Issuance (repayment) of shares: - Parent company shareholders 41 262 89 - Treasury shares 22 (1,189) (1,526) - Minority shareholders - (4) 2Dividends paid: - Parent company shareholders (5,086) (4,945) (4,510) - Minority shareholders (189) (213) (228)Net issuance (repayment) of non-current debt 5,522 3,009 3,220Increase (decrease) in current borrowings (3,124) 1,437 (2,654)Increase (decrease) in current financial assets and liabilities (54) 850 2,265Cash flow used in financing activities (2,868) (793) (3,342)Net increase (decrease) in cash and cash equivalents (776) 6,821 4,178Effect of exchange rates 117 (488) (683)Cash and cash equivalents at the beginning of the period 12,321 5,988 2,493Cash and cash equivalents at the end of the period 11,662 12,321 5,988

Page 4
Consolidated statement of changes in shareholders’ equity
TOTAL
(€ million) Number Amount Number Amount
As of January 1, 2007 2,425,767,953 6,064 41,460 (1,383) (161,200,707) (5,820) 40,321 827 41,148
Net income 2007 - - 13,181 - - - 13,181 354 13,535
Other comprehensive income (Note 17)
- - 117 (3,013) - - (2,896) (111) (3,007)
Comprehensive income - - 13,298 (3,013) - - 10,285 243 10,528
Dividend - - (4,510) - - - (4,510) (228) (4,738)
Issuance of common shares (Note 17)
2,769,144 7 82 - - - 89 - 89
Purchase of treasury shares - - - - (32,387,355) (1,787) (1,787) - (1,787)
Sale of treasury shares(a) - - (77) - 9,161,830 341 264 - 264
Share-based payments (Note 25) - - 196 - 196 - 196
Other operations with minority interests
- - - - - - -
Share cancellation (Note 17) (33,005,000) (82) (1,652) - 33,005,000 1,734 - - -
Transactions with shareholders (30,235,856) (75) (5,961) - 9,779,475 288 (5,748) (228) (5,976)
As of December 31, 2007 2,395,532,097 5,989 48,797 (4,396) (151,421,232) (5,532) 44,858 842 45,700
Net income 2008 - - 10,590 - - - 10,590 363 10,953
Other comprehensive income (Note 17)
- - (258) (480) - - (738) (34) (772)
Comprehensive income - - 10,332 (480) - - 9,852 329 10,181
Dividend - - (4,945) - - - (4,945) (213) (5,158)
Issuance of common shares (Note 17)
6,275,977 16 246 - - - 262 - 262
Purchase of treasury shares - - - - (27,600,000) (1,339) (1,339) - (1,339)
Sale of treasury shares(a) - - (71) - 5,939,137 221 150 - 150
Share-based payments (Note 25) - - 154 - 154 - 154
Other operations with minority interests
- - - - - - -
Share cancellation (Note 17) (30,000,000) (75) (1,566) - 30,000,000 1,641 - - -
Transactions with shareholders (23,724,023) (59) (6,182) - 8,339,137 523 (5,718) (213) (5,931)
As of December 31, 2008 2,371,808,074 5,930 52,947 (4,876) (143,082,095) (5,009) 48,992 958 49,950
Net income 2009 - - 8,447 - - - 8,447 182 8,629
Other comprehensive income (Note 17)
- - 246 (193) - - 53 60 113
Comprehensive income - - 8,693 (193) - - 8,500 242 8,742
Dividend - - (5,086) - - - (5,086) (189) (5,275)
Issuance of common shares (Note 17)
1,414,810 3 38 - - - 41 - 41
Purchase of treasury shares - - - - - - - - -
Sale of treasury shares(a) - - (143) - 2,874,905 165 22 - 22
Share-based payments (Note 25) - - 106 - - - 106 - 106
Other operations with minority interests
- - (23) - - - (23) (24) (47)
Share cancellation (Note 17) (24,800,000) (62) (1,160) - 24,800,000 1,222 - - -
Transactions with shareholders (23,385,190) (59) (6,268) - 27,674,905 1,387 (4,940) (213) (5,153)
As of December 31, 2009 2,348,422,884 5,871 55,372 (5,069) (115,407,190) (3,622) 52,552 987 53,539
Common shares issued Paid-in surplus and
retained earnings
Currency translation adjustment
Treasury sharesShareholders' equity - Group
share
Minority interests
Total shareholders'
equity
(a) Treasury shares related to the stock option purchase plans and restricted stock grants.

Page 5
Consolidated statement of comprehensive income(a)
TOTAL
For the year ended December 31, (€ million) 2009 2008 2007
Consolidated net income 8,629 10,953 13,535
Other comprehensive incomeCurrency translation adjustment (244) (722) (2,703)Available for sale financial assets 38 (254) 111Cash flow hedge 128 - -Share of other comprehensive income of associates, net amount 234 173 (406)Other (5) 1 (3)
-Tax effect (38) 30 (6)
Total other comprehensive income (net amount) (note 17) 113 (772) (3,007)
Comprehensive income 8,742 10,181 10,528- Group share 8,500 9,852 10,285- Minority interests 242 329 243(a) In accordance with revised IAS 1, applicable from January 1, 2009.

Page 6
TOTAL
Notes to the Consolidated Financial Statements
On February 10, 2010, the Board of Directors established and authorized the publication of the Consolidated Financial Statements of TOTAL S.A. for the year ended December 31, 2009, which will be submitted for approval to the shareholders’ meeting to be held on May 21, 2010.
Introduction
The Consolidated Financial Statements of TOTAL S.A. and its subsidiaries (the Group) have been prepared on the basis of IFRS (International Financial Reporting Standards) as adopted by the European Union and IFRS as issued by the IASB (International Accounting Standard Board) as of December 31, 2009.
The accounting principles applied in the Consolidated Financial Statements as of December 31, 2009 were the same as those that were used as of December 31, 2008 except for amendments and interpretations of IFRS which were mandatory for the periods beginning after January 1, 2009 (and not early adopted). Their adoption has no impact on the Consolidated Financial Statements as of December 31, 2009.
Among these new standards or interpretations, it should be noted that the revised version of IAS 1 “Presentation of financial statements”, effective for annual periods beginning on or after January 1, 2009, resulted in the following:
presentation of the consolidated statement of comprehensive income; and
information on other comprehensive income presented in Note 17 to the Consolidated Financial Statements.
In addition, the IASB issued in 2009 amendments to standard IFRS 7 “Financial instruments: disclosures” which introduce new disclosure requirements, effective for annual periods beginning on or after January 1, 2009. In particular, financial instruments shall be presented according to the fair value measurement method used (three-level hierarchy described in Note 1 M(v) to the Consolidated Financial Statements).
Lastly, the Group has applied the new definitions and the new method of estimating oil & gas reserves resulting from U.S. Accounting Standards Update No. 2010-03, "Oil and Gas Reserve Estimation and Disclosures", effective for annual reporting periods ended on or after December 31, 2009. The adoption of these new rules had no significant impact on oil & gas reserve estimates and no significant impact on the Consolidated Financial Statements.
The preparation of financial statements in accordance with IFRS requires the management to make estimates and assumptions that affect the reported amounts of assets, liabilities and contingent liabilities at the date of preparation of the financial statements and reported income and expenses for the period. The management reviews these estimates and assumptions on an ongoing basis, by reference to past experience and various other factors considered as reasonable which form the basis for assessing the carrying amount of assets and liabilities. Actual results may differ significantly from these estimates, if different assumptions or circumstances apply. These judgments and estimates relate principally to the application of the successful efforts method for the oil and gas accounting, the valuation of long-lived assets, the provisions for asset retirement obligations and environmental remediation, the pensions and post-retirements benefits and the income tax computation.
Furthermore, where the accounting treatment of a specific transaction is not addressed by any accounting standard or interpretation, the management applies its judgment to define and apply accounting policies that will lead to relevant and reliable information, so that the financial statements:
give a true and fair view of the Group’s financial position, financial performance and cash flows;
reflect the substance of transactions;
are neutral;
are prepared on a prudent basis; and
are complete in all material aspects.

Page 7
1) Accounting policies
Pursuant to the accrual basis of accounting followed by the Group, the financial statements reflect the effects of transactions and other events when they occur. Assets and liabilities such as property, plant and equipment and intangible assets are usually measured at amortized cost. Financial assets and liabilities are usually measured at fair value.
Accounting policies used by the Group are described below:
A) Principles of consolidation
Subsidiaries that are directly controlled by the parent company or indirectly controlled by other consolidated subsidiaries are fully consolidated.
Investments in jointly-controlled entities are proportionately consolidated.
Investments in associates, in which the Group has significant influence, are accounted for by the equity method. Significant influence is presumed when the Group holds, directly or indirectly (e.g. through subsidiaries), 20% or more of the voting rights.
Companies in which ownership interest is less than 20%, but over which the Company is deemed to exercise significant influence, are also accounted for by the equity method.
All significant intercompany balances, transactions and income have been eliminated.
B) Business combinations
Business combinations are accounted for using the purchase method. This method implies the recognition of the assets, liabilities and contingent liabilities of the companies acquired by the Group at their fair value.
The difference between the acquisition cost of the shares and fair value of the acquired share of the assets, liabilities and contingent liabilities identified on the acquisition date is recorded as goodwill.
If the cost of an acquisition is less than the fair value of net assets of the subsidiary acquired, an additional analysis is performed on the identification and valuation of the identifiable elements of the assets and liabilities. Any residual negative goodwill is recorded as income.
The analysis of goodwill is finalized within one year from the acquisition date.
C) Foreign currency translation
The financial statements of subsidiaries are prepared in the currency that most clearly reflects their business environment. This is referred to as their functional currency.
(i) Monetary transactions
Transactions denominated in foreign currencies are translated at the exchange rate on the transaction date. At each balance sheet date, monetary assets and liabilities are translated at the closing rate and the resulting exchange differences are recognized in “Other income” or “Other expenses”.
(ii) Translation of financial statements denominated in foreign currencies
Assets and liabilities of foreign entities are translated into euros on the basis of the exchange rates at the end of the period. The income and cash flow statements are translated using the average exchange rates for the period. Foreign exchange differences resulting from such translations are either recorded in shareholders’ equity under “Currency translation adjustments” (for the Group share) or under “Minority interests” (for the minority share) as deemed appropriate.
D) Sales and revenues from sales
Revenues from sales are recognized when the significant risks and rewards of ownership have been passed to the buyer and the amount can be reasonably measured. Sales figures include excise taxes collected by the Group within the course of its oil distribution operations. Excise taxes are deducted from sales in order to obtain the “Revenues from sales” indicator.
Revenues from sales of crude oil, natural gas and coal are recorded upon transfer of title, according to the terms of the sales contracts.
Page 8
Revenues from the production of crude oil and natural gas properties, in which the Group has an interest with other producers, are recognized based on actual volumes sold during the period. Any difference between volumes sold and entitlement volumes, based on the Group net working interest, are recognized as “Crude oil and natural gas inventories” or “Accounts receivable, net” or “Accounts payable”, as appropriate.
Revenues from gas transport are recognized when services are rendered. These revenues are based on the quantities transported and measured according to procedures defined in each service contract.
Revenues from sales of electricity are recorded upon transfer of title, according to the terms of the related contracts.
Revenues from services are recognized when the services have been rendered.
Shipping revenues and expenses from time-charter activities are recognized on a pro rata basis over a period that commences upon the unloading of the previous voyage and terminates upon the unloading of the current voyage. Shipping revenue recognition starts only when a charter has been agreed to by both the Group and the customer.
Oil and gas sales are inclusive of quantities delivered that represent production royalties and taxes, when paid in cash, and outside the United States and Canada.
Certain transactions within the trading activities (contracts involving quantities that are purchased to third parties then resold to third parties) are shown at their net value in sales.
Exchanges of crude oil and petroleum products within normal trading activities do not generate any income and therefore these flows are shown at their net value in both the statement of income and the balance sheet.
E) Share-based payments
The Group may grant employees stock options, create employee share purchase plans and offer its employees the opportunity to subscribe to reserved capital increases. These employee benefits are recognized as expenses with a corresponding credit to shareholders’ equity.
The expense is equal to the fair value of the instruments granted. The fair value of the options is calculated using the Black-Scholes model at the grant date. The expense is recognized on a straight-line basis between the grant date and vesting date.
For restricted share plans, the expense is calculated using the market price at the grant date after deducting the expected distribution rate during the vesting period.
The cost of employee-reserved capital increases is immediately expensed. A discount reduces the expense in order to account for the nontransferability of the shares awarded to the employees over a period of five years.
F) Income taxes
Income taxes disclosed in the statement of income include the current tax expenses and the deferred tax expenses.
The Group uses the liability method whereby deferred income taxes are recorded based on the temporary differences between the carrying amounts of assets and liabilities recorded in the balance sheet and their tax bases, and on carry-forwards of unused tax losses and tax credits.
Deferred tax assets and liabilities are measured using the tax rates that have been enacted or substantially enacted at the balance sheet date. The tax rates used depend on the timing of reversals of temporary differences, tax losses and other tax credits. The effect of a change in tax rate is recognized either in the Consolidated Statement of Income or in shareholders’ equity depending on the item it relates to.
Deferred tax assets are recognized when future recovery is probable.
Asset retirement obligations and finance leases give rise to the recognition of assets and liabilities for accounting purposes as described in paragraph K “Leases” and paragraph Q “Asset retirement obligations” of this Note. Deferred income taxes resulting from temporary differences between the carrying amounts and tax bases of such assets and liabilities are recognized.
Deferred tax liabilities resulting from temporary differences between the carrying amounts of equity-method investments and their tax bases are recognized. The deferred tax calculation is based on the expected future tax effect (dividend distribution rate or tax rate on the gain or loss upon disposal of these investments).
Taxes paid on the Upstream production are included in operating expenses, including those related to historical concessions held by the Group in the Middle East producing countries.

Page 9
G) Earnings per share
Earnings per share is calculated by dividing net income (Group share) by the weighted-average number of common shares outstanding during the period.
Diluted earnings per share is calculated by dividing net income (Group share) by the fully-diluted weighted-average number of common shares outstanding during the period. Treasury shares held by the parent company, TOTAL S.A., and TOTAL shares held by the Group subsidiaries are deducted from consolidated shareholders’ equity. These shares are not considered outstanding for purposes of this calculation which also takes into account the dilutive effect of stock options, restricted share grants and capital increases with a subscription period closing after the end of the fiscal year.
The weighted-average number of fully-diluted shares is calculated in accordance with the treasury stock method provided for by IAS 33. The proceeds, which would be recovered in the event of an exercise of rights related to dilutive instruments, are presumed to be a share buyback at the average market price over the period. The number of shares thereby obtained leads to a reduction in the total number of shares that would result from the exercise of rights.
H) Oil and gas exploration and producing properties
The Group applies IFRS 6 “Exploration for and Evaluation of Mineral Resources”. Oil and gas exploration and production properties and assets are accounted for in accordance with the successful efforts method.
(i) Exploration costs
Geological and geophysical costs, including seismic surveys for exploration purposes are expensed as incurred.
Mineral interests are capitalized as intangible assets when acquired. These acquired interests are tested for impairment on a regular basis, property-by-property, based on the results of the exploratory activity and the management’s evaluation.
In the event of a discovery, the unproved mineral interests are transferred to proved mineral interests at their net book value as soon as proved reserves are booked.
Exploratory wells are tested for impairment on a well-by-well basis and accounted for as follows:
Costs of exploratory wells which result in proved reserves are capitalized and then depreciated using the unit-of-production method based on proved developed reserves;
Costs of dry exploratory wells and wells that have not found proved reserves are charged to expense;
Costs of exploratory wells are temporarily capitalized until a determination is made as to whether the well has found proved reserves if both of the following conditions are met:
The well has found a sufficient quantity of reserves to justify its completion as a producing well, if appropriate, assuming that the required capital expenditures are made;
The Group is making sufficient progress assessing the reserves and the economic and operating viability of the project. This progress is evaluated on the basis of indicators such as whether additional exploratory works are under way or firmly planned (wells, seismic or significant studies), whether costs are being incurred for development studies and whether the Group is waiting for governmental or other third-party authorization of a proposed project, or availability of capacity on an existing transport or processing facility.
Costs of exploratory wells not meeting these conditions are charged to expense.
(ii) Oil and Gas producing assets
Development costs incurred for the drilling of development wells and for the construction of production facilities are capitalized, together with borrowing costs incurred during the period of construction and the present value of estimated costs of asset retirement obligations. The depletion rate is usually equal to the ratio of oil and gas production for the period to proved developed reserves (unit-of-production method).
With respect to production sharing contracts, this computation is based on the portion of production and reserves assigned to the Group taking into account estimates based on the contractual clauses regarding the reimbursement of exploration and development costs (cost oil) as well as the sharing of hydrocarbon rights (profit oil).
Transportation assets are depreciated using the unit-of-production method based on throughput or by using the straight-line method whichever best reflects the economic life of the asset.
Proved mineral interests are depreciated using the unit-of-production method based on proved reserves.

Page 10
I) Goodwill and other intangible assets
Other intangible assets include goodwill, patents, trademarks, and lease rights.
Intangible assets are carried at cost, after deducting any accumulated depreciation and accumulated impairment losses.
Goodwill in a consolidated subsidiary is calculated as the excess of the cost of shares, including transaction expenses, over the fair value of the Group’s share of the net assets at the acquisition date. Goodwill is not amortized but is tested for impairment annually or as soon as there is any indication of impairment (see Note 1 paragraph L to the Consolidated Financial Statements "Impairment of long-lived assets".)
In equity affiliates, goodwill is included in the investment book value.
Other intangible assets (except goodwill) have a finite useful life and are amortized on a straight-line basis over 10 to 40 years depending on the useful life of the assets.
Research and development
Research costs are charged to expense as incurred.
Development expenses are capitalized when the following can be demonstrated:
the technical feasibility of the project and the availability of the adequate resources for the completion of the intangible asset;
the ability of the asset to generate probable future economic benefits;
the ability to measure reliably the expenditures attributable to the asset; and
the feasibility and intention of the Group to complete the intangible asset and use or sell it.
Advertising costs are charged to expense as incurred.
J) Other property, plant and equipment
Other property, plant and equipment are carried at cost, after deducting any accumulated depreciation and accumulated impairment losses. This cost includes borrowing costs directly attributable to the acquisition or production of a qualifying asset incurred until assets are placed in service. Borrowing costs are capitalized as follows:
if the project benefits from a specific funding, the capitalization of borrowing costs is based on the borrowing rate;
if the project is financed by all the Group’s debt, the capitalization of borrowing costs is based on the weighted average borrowing cost for the period.
Routine maintenance and repairs are charged to expense as incurred. The costs of major turnarounds of refineries and large petrochemical units are capitalized as incurred and depreciated over the period of time between two consecutive major turnarounds.
Other property, plant and equipment are depreciated using the straight-line method over their useful lives, which are as follows:
Furniture, office equipment, machinery and tools 3-12 years
Transportation equipments 5-20 years
Storage tanks and related equipment 10-15 years
Specialized complex installations and pipelines 10-30 years
Buildings 10-50 years
Page 11
K) Leases
A finance lease transfers substantially all the risks and rewards incidental to ownership from the lessor to the lessee. These contracts are capitalized as assets at fair value or, if lower, at the present value of the minimum lease payments according to the contract. A corresponding financial debt is recognized as a financial liability. These assets are depreciated over the corresponding useful life used by the Group.
Leases that are not finance leases as defined above are recorded as operating leases.
Certain arrangements do not take the legal form of a lease but convey the right to use an asset or a group of assets in return for fixed payments. Such arrangements are accounted for as leases and are analyzed to determine whether they should be classified as operating leases or as finance leases.
L) Impairment of long-lived assets
The recoverable amounts of intangible assets and property, plant and equipment are tested for impairment as soon as any indication of impairment exists. This test is performed at least annually for goodwill.
The recoverable amount is the higher of the fair value (less costs to sell) or its value in use.
Assets are grouped into cash-generating units (or CGUs) and tested. A cash-generating unit is a homogeneous group of assets that generates cash inflows that are largely independent of the cash inflows from other groups of assets.
The value in use of a CGU is determined by reference to the discounted expected future cash flows, based upon the management’s expectation of future economic and operating conditions. If this value is less than the carrying amount, an impairment loss on property, plant and equipment and mineral interests, or on other intangible assets, is recognized either in “Depreciation, depletion and amortization of property, plant and equipment and mineral interests” or in “Other expense”, respectively. This impairment loss is first allocated to reduce the carrying amount of any goodwill.
Impairment losses recognized in prior periods can be reversed up to the original carrying amount, had the impairment loss not been recognized. Impairment losses recognized for goodwill cannot be reversed.
M) Financial assets and liabilities
Financial assets and liabilities are financial loans and receivables, investments in non-consolidated companies, publicly traded equity securities, derivatives instruments and current and non-current financial liabilities.
The accounting treatment of these financial assets and liabilities is as follows:
(i) Loans and receivables
Financial loans and receivables are recognized at amortized cost. They are tested for impairment, by comparing the carrying amount of the assets to estimates of the discounted future recoverable cash flows. These tests are conducted as soon as there is any evidence that their fair value is less than their carrying amount, and at least annually. Any impairment loss is recorded in the statement of income.
(ii) Investments in non-consolidated companies and publicly traded equity securities
These assets are classified as financial assets available for sale and therefore measured at their fair value. For listed securities, this fair value is equal to the market price. For unlisted securities, if the fair value is not reliably determinable, securities are recorded at their historical value. Changes in fair value are recorded in shareholders’ equity. If there is any evidence of a significant or long-lasting loss, an impairment loss is recorded in the Consolidated Statement of Income. This impairment is reversed in the statement of income only when the securities are sold.
These investments are presented in the section “Other investments” of the balance sheet.
(iii) Derivative instruments
The Group uses derivative instruments to manage its exposure to risks of changes in interest rates, foreign exchange rates and commodity prices. Changes in fair value of derivative instruments are recognized in the statement of income or in shareholders’ equity and are recognized in the balance sheet in the accounts corresponding to their nature, according to the risk management strategy described in Note 31 to the Consolidated Financial Statements. The derivative instruments used by the Group are the following:
- Cash management
Financial instruments used for cash management purposes are part of a hedging strategy of currency and interest rate risks within global limits set by the Group and are considered to be used for transactions (held for trading). Changes in fair value are systematically recorded in the statement of income. The balance sheet value of those instruments is included in “Current financial assets” or “Other current financial liabilities”.
Page 12
- Long-term financing
When an external long-term financing is set up, specifically to finance subsidiaries, and when this financing involves currency and interest rate derivatives, these instruments are qualified as:
i. Fair value hedge of the interest rate risk on the external debt and of the currency risk of the loans to subsidiaries. Changes in fair value of derivatives are recognized in the statement of income as are changes in fair value of financial debts and loans to subsidiaries.
The fair value of those hedging instruments of long-term financing is included in the assets under “Hedging instruments on non-current financial debt” or in the liabilities under “Non-current financial debt “for the non-current portion. The current portion (less than one year) is accounted for in “Current financial assets” or “Other current financial liabilities”.
In case of the anticipated termination of derivative instruments accounted for as fair value hedges, the amount paid or received is recognized in the statement of income and:
If this termination is due to an early cancellation of the hedged items, the adjustment previously recorded as revaluation of those hedged items is also recognized in the statement of income;
If the hedged items remain in the balance sheet, the adjustment previously recorded as a revaluation of those hedged items is spread over the remaining life of those items.
ii. Cash flow hedge of the currency risk of the external debt. Changes in fair value are recorded in equity for the effective portion of the hedging and in the statement of income for the ineffective portion of the hedging. Amounts recorded in equity are transferred to the income statement when the hedged transaction affects profit or loss.
The fair value of those hedging instruments of long-term financing is included in the assets under “Hedging instruments on non-current financial debt” or in the liabilities under “Non-current financial debt“ for the non-current portion. The current portion (less than one year) is accounted for in “Current financial assets” or “Other current financial liabilities”.
If the hedging instrument expires, is sold or terminated by anticipation, gains or losses previously recognized in equity remain in equity. Amounts are recycled in the income statement when the hedged transaction affects profit or loss.
- Foreign subsidiaries’ equity hedge
Certain financial instruments hedge against risks related to the equity of foreign subsidiaries whose functional currency is not the euro (mainly the dollar). These instruments qualify as “net investment hedges”. Changes in fair value are recorded in shareholders’ equity.
The fair value of these instruments is recorded under “Current financial assets” or ”Other current financial liabilities”.
- Financial instruments related to commodity contracts
Financial instruments related to commodity contracts, including crude oil, petroleum products, gas and power purchasing/selling contracts related to the trading activities, together with the commodity contract derivative instruments such as energy contracts and forward freight agreements, are used to adjust the Group's exposure to price fluctuations within global trading limits. These instruments are considered, according to the industry practice, as held for trading. Changes in fair value are recorded in the statement of income. The fair value of these instruments is recorded in “Other current assets” or “Other creditors and accrued liabilities” depending on whether they are assets or liabilities.
Detailed information about derivatives positions is disclosed in Notes 20, 28, 29, 30 and 31 to the Consolidated Financial Statements.
(iv) Current and non-current financial liabilities
Current and non-current financial liabilities (excluding derivatives) are recognized at amortized cost, except those for which a hedge accounting can be applied as described in the previous paragraph.
(v) Fair value of financial instruments
Fair values are estimated for the majority of the Group’s financial instruments, with the exception of publicly traded equity securities and marketable securities for which the market price is used.
Estimated fair values, which are based on principles such as discounting future cash flows to present value, must be weighted by the fact that the value of a financial instrument at a given time may be influenced by the market environment (liquidity especially), and also the fact that subsequent changes in interest rates and exchange rates are not taken into account.
As a consequence, the use of different estimates, methodologies and assumptions could have a material effect on the estimated fair value amounts.

Page 13
The methods used are as follows:
- Financial debts, swaps
The market value of swaps and of bonds that are hedged by those swaps, have been determined on an individual basis by discounting future cash flows with the zero coupon interest rate curves existing at year-end.
- Financial instruments related to commodity contracts
The valuation methodology is to mark to market all open positions for both physical and derivative transactions. The valuations are determined on a daily basis using observable market data based on organized and over the counter (OTC) markets. In particular cases when market data are not directly available, the valuations are derived from observable data such as arbitrages, freight or spreads and market corroboration. For valuation of risks which are the result of a calculation, such as options for example, commonly known models are used to compute the fair value.
- Other financial instruments
The fair value of the interest rate swaps and of FRA (Forward Rate Agreement) are calculated by discounting future cash flows on the basis of zero coupon interest rate curves existing at year-end after adjustment for interest accrued but unpaid.
Forward exchange contracts and currency swaps are valued on the basis of a comparison of the negociated forward rates with the rates in effect on the financial markets at year-end for similar maturities.
Exchange options are valued based on the Garman-Kohlhagen model including market quotations at year-end.
- Fair value hierarchy
IFRS 7 "Financial instruments: disclosures", amended in 2009, introduces a fair value hierarchy for financial instruments and proposes the following three-level classification :
level 1: quotations for assets and liabilities (identical to the ones that are being valued) obtained at the valuation date on an active market to which the entity has access;
level 2: the entry data are observable data but do not correspond to quotations for identical assets or liabilities;
level 3: the entry data are not observable data. For example: these data come from extrapolation. This level applies when there is no market or observable data and the company has to use its own hypotheses to estimate the data that other market players would have used to determine the fair value of the asset.
Fair value hierarchy is disclosed in Notes 29 and 30 to the Consolidated Financial Statements.
N) Inventories
Inventories are measured in the Consolidated Financial Statements at the lower of historical cost or market value. Costs for petroleum and petrochemical products are determined according to the FIFO (First-In, First-Out) method and other inventories are measured using the weighted-average cost method.
Downstream (Refining – Marketing)
Petroleum product inventories are mainly comprised of crude oil and refined products. Refined products principally consist of gasoline, kerosene, diesel, fuel oil and heating oil produced by the Group's refineries. The turnover of petroleum products does not exceed two months on average.
Crude oil costs include raw material and receiving costs. Refining costs principally include the crude oil costs, production costs (energy, labor, depreciation of producing assets) and allocation of production overhead (taxes, maintenance, insurance, etc.). Start-up costs and general administrative costs are excluded from the cost price of refined products.
Chemicals
Costs of chemical products inventories consist of raw material costs, direct labor costs and an allocation of production overhead. Start-up costs and general administrative costs are excluded from the cost of inventories of chemicals products.
O) Treasury shares
Treasury shares of the parent company held by its subsidiaries or itself are deducted from consolidated shareholders' equity. Gains or losses on sales of treasury shares are excluded from the determination of net income and are recognized in shareholders’ equity.

Page 14
P) Provisions and other non-current liabilities
Provisions and non-current liabilities are comprised of liabilities for which the amount and the timing are uncertain. They arise from environmental risks, legal and tax risks, litigation and other risks.
A provision is recognized when the Group has a present obligation (legal or constructive) as a result of a past event for which it is probable that an outflow of resources will be required and when a reliable estimate can be made regarding the amount of the obligation. The amount of the liability corresponds to the best possible estimate.
Q) Asset retirement obligations
Asset retirement obligations, which result from a legal or constructive obligation, are recognized based on a reasonable estimate in the period in which the obligation arises.
The associated asset retirement costs are capitalized as part of the carrying amount of the underlying asset and depreciated over the useful life of this asset.
An entity is required to measure changes in the liability for an asset retirement obligation due to the passage of time (accretion) by applying a risk-free discount rate to the amount of the liability. The increase of the provision due to the passage of time is recognized as “Other financial expense”.
R) Employee benefits
In accordance with the laws and practices of each country, the Group participates in employee benefit plans offering retirement, death and disability, healthcare and special termination benefits. These plans provide benefits based on various factors such as length of service, salaries, and contributions made to the governmental bodies responsible for the payment of benefits.
These plans can be either defined contribution or defined benefit pension plans and may be entirely or partially funded with investments made in various non-Group instruments such as mutual funds, insurance contracts, and other instruments.
For defined contribution plans, expenses correspond to the contributions paid.
Defined benefit obligations are determined according to the Projected Unit Method. Actuarial gains and losses may arise from differences between actuarial valuation and projected commitments (depending on new calculations or assumptions) and between projected and actual return of plan assets.
The Group applies the corridor method to amortize its actuarial gains and losses. This method amortizes the net cumulative actuarial gains and losses that exceed 10% of the greater of the present value of the defined benefit obligation and the fair value of plan assets, over the average expected remaining working lives of the employees participating in the plan.
In case of a change in or creation of a plan, the vested portion of the cost of past services is recorded immediately in the statement of income, and the unvested past service cost is amortized over the vesting period.
The net periodic pension cost is recognized under “Other operating expenses”.
S) Consolidated Statement of Cash Flows
The Consolidated Statement of Cash Flows prepared in foreign currencies has been translated into euros using the exchange rate on the transaction date or the average exchange rate for the period. Currency translation differences arising from the translation of monetary assets and liabilities denominated in foreign currency into euros using the closing exchange rates are shown in the Consolidated Statement of Cash Flows under “Effect of exchange rates”. Therefore, the Consolidated Statement of Cash Flows will not agree with the figures derived from the Consolidated Balance Sheet.
Cash and cash equivalents
Cash and cash equivalents are comprised of cash on hand and highly liquid short-term investments that are easily convertible into known amounts of cash and are subject to insignificant risks of changes in value.
Investments with maturity greater than three months and less than twelve months are shown under “Current financial assets”.
Changes in current financial assets and liabilities are included in the financing activities section of the Consolidated Statement of Cash Flows.

Page 15
Non-current financial debt
Changes in non-current financial debt have been presented as the net variation to reflect significant changes mainly related to revolving credit agreements.
T) Carbon dioxide emission rights
In the absence of a current IFRS standard or interpretation on accounting for emission rights of carbon dioxide, the following principles have been applied:
emission rights granted free of charge are accounted for at zero carrying amount;
liabilities resulting from potential differences between available quotas and quotas to be delivered at the end of the compliance period are accounted for as liabilities and measured at fair market value;
spot market transactions are recognized in income at cost; and
forward transactions are recognized at their fair market value on the face of the balance sheet. Changes in the fair value of such forward transactions are recognized in income.
U) Non-current assets held for sale and discontinued operations
Pursuant to IFRS 5 "Non-current assets held for sale and discontinued operations”, assets and liabilities of affiliates that are held for sale are presented separately on the face of the balance sheet.
Net income from discontinued operations is presented separately on the face of the statement of income. Therefore, the notes to the Consolidated Financial Statements related to the statement of income only refer to continuing operations.
A discontinued operation is a component of the Group for which cash flows are independent. It represents a major line of business or geographical area of operations which has been disposed of or is currently being held for sale.
V) Alternative IFRS methods
For measuring and recognizing assets and liabilities, the following choices among alternative methods allowable under IFRS have been made:
property, plant and equipment, and intangible assets are measured using historical cost model instead of revaluation model;
actuarial gains and losses on pension and other post-employment benefit obligations are recognized according to the corridor method (see Note 1 paragraph R to the Consolidated Financial Statements);
jointly-controlled entities are consolidated using the proportionate method, as provided for in IAS 31 “Interests in joint ventures”.
W) New accounting principles not yet in effect
The standards or interpretations published respectively by the International Accounting Standards Board (IASB) and the International Financial Reporting Interpretations Committee (IFRIC) which were not yet in effect at December 31, 2009, were as follows:
Revised IFRS 3 “Business Combinations” and IAS 27 “Consolidated and Separate Financial Statements”
In January 2008, the IASB issued revised versions of IFRS 3 “Business Combinations” and IAS 27 “Consolidated and Separate Financial Statements”. These revised standards introduce new provisions regarding the accounting for business combinations. They are effective as of the first annual period starting after July 1, 2009 (i.e. as of January 1, 2010 for the Group). Their application is prospective.
IFRS 9 “Financial Instruments”
In November 2009, the IASB issued standard IFRS 9 “Financial Instruments” that introduces new requirements for the classification and measurement of financial assets. This standard shall be completed in 2010 with requirements regarding classification and measurement of liabilities, derecognition of financial instruments, impairment and hedge accounting. Under standard IFRS 9, financial assets are measured either at fair value through profit or loss or at amortised cost if certain conditions are met. The standard is applicable for annual periods starting on or after January 1, 2013. The application of the standard as published in 2009 should not have any material effect on the Group’s consolidated balance sheet, statement of income and shareholder’s equity.
Page 16
Revised IAS 24 “Related Party Disclosures”
In November 2009, the IASB issued revised standard IAS 24 “Related Party Disclosures” that clarifies the definition of a related party and reduces the disclosure requirements for entities controlled by a government. The standard is applicable for annual periods starting on or after January 1, 2011. The application of this standard should not have any material impact on information presented in the notes to the Consolidated Financial Statements.
IFRIC 17 “Distributions of Non-cash Assets to Owners”
In November 2008, the IFRIC issued interpretation IFRIC 17 “Distributions of Non-cash Assets to Owners”. The interpretation addresses the accounting of non-cash assets distributed among two entities which are not jointly-controlled. It provides that the dividend payable should be measured at the fair value of the net assets to be distributed and that any difference with the carrying amount of the net assets distributed should be recognised in profit or loss. The interpretation is effective for annual periods starting on or after July 1, 2009 (i.e. starting January 1, 2010 for the Group). The application of IFRIC 17 should not have any material effect on the Group’s consolidated balance sheet, statement of income and shareholder’s equity.
IFRIC 19 “Extinguishing Financial Liabilities with Equity Instruments”
In November 2009, the IFRIC issued interpretation IFRIC 19 “Extinguishing Financial Liabilities with Equity Instruments”. The interpretation deals with accounting for debt to equity swaps. It clarifies that equity instruments issued are measured at fair value and that any difference with the carrying amount of the liability is recognised in profit or loss. The interpretation is effective for annual periods starting on or after July 1, 2010 (i.e. starting January 1, 2011 for the Group). The application of IFRIC 19 should not have any material effect on the Group’s consolidated balance sheet, statement of income and shareholder’s equity.
2) Main indicators - information by business segment
Performance indicators excluding the adjustment items, such as adjusted operating income, adjusted net operating income, and adjusted net income are meant to facilitate the analysis of the financial performance and the comparison of income between periods.
Adjustment items
The detail of these adjustment items is presented in Note 4 to the Consolidated Financial Statements.
Adjustment items include :
(i) Special items
Due to their unusual nature or particular significance, certain transactions qualified as "special items" are excluded from the business segment figures. In general, special items relate to transactions that are significant, infrequent or unusual. However, in certain instances, transactions such as restructuring costs or assets disposals, which are not considered to be representative of the normal course of business, may be qualified as special items although they may have occurred within prior years or are likely to occur again within the coming years.
(ii) The inventory valuation effect
The adjusted results of the Downstream and Chemicals segments are presented according to the replacement cost method. This method is used to assess the segments’ performance and facilitate the comparability of the segments’ performance with those of its competitors.
In the replacement cost method, which approximates the LIFO (Last-In, First-Out) method, the variation of inventory values in the statement of income is determined by the average prices of the period rather than the historical value. The inventory valuation effect is the difference between the results according to the FIFO (First-In, First-Out) and the replacement cost.
(iii) TOTAL’s equity share of adjustments and selected items related to Sanofi-Aventis

Page 17
Main indicators:
(i) Operating income (measure used to evaluate operating performance)
Revenue from sales after deducting cost of goods sold and inventory variations, other operating expenses, exploration expenses and depreciation, depletion, and amortization.
Operating income excludes the amortization of intangible assets other than mineral interests, currency translation adjustments and gains or losses on the disposal of assets.
(ii) Net operating income (measure used to evaluate the return on capital employed)
Operating income after taking into account the amortization of intangible assets other than mineral interests, currency translation adjustments, gains or losses on the disposal of assets, as well as all other income and expenses related to capital employed (dividends from non-consolidated companies, equity in income of affiliates, capitalized interest expenses), and after income taxes applicable to the above.
The only income and expense not included in net operating income but included in net income are interest expenses related to net financial debt, after applicable income taxes (net cost of net debt) and minority interests.
(iii) Adjusted income
Operating income, net operating income, or net income excluding the effect of adjustment items described above.
(iv) Capital employed
Non-current assets and working capital, at replacement cost, net of deferred income taxes and non-current liabilities.
(v) ROACE (Return on Average Capital Employed)
Ratio of adjusted net operating income to average capital employed between the beginning and the end of the period.
(vi) Net debt
Non-current debt, including current portion, current borrowings, other current financial liabilities less cash and cash equivalents and other current financial assets.
3) Changes in the Group structure, main acquisitions and divestments
2009
In December 2009, TOTAL signed an agreement with Chesapeake Energy Corporation whereby Total acquired a 25% share in Chesapeake’s Barnett shale gas portfolio located in the United States (State of Texas). The acquisition cost of these assets amounted to €1,562 million and it represents the value of mineral interests that have been recognized as intangible assets on the face of the Consolidated Balance Sheet for €1,449 million and the value of tangible assets that have been recognized on the face of the Consolidated Balance Sheet for €113 million. As no cash payment has occurred in 2009, a corresponding debt has been recognized in the sections “Provisions and other non-current liabilities” and “Other creditors and accrued liabilities” for €818 million and €744 million respectively.
During 2009, TOTAL progressively sold 3.99% of Sanofi-Aventis’ share capital, thus reducing its interest to 7.39%. Sanofi-Aventis is accounted for by the equity method in TOTAL’s Consolidated Financial Statements.
2008
Pursuant to the tender offer described in the prospectus on May 13, 2008 and renewed by the notices on June 19, July 4 and July 16, 2008, TOTAL acquired 100% of Synenco Energy Inc’s Class A ordinary shares. Synenco’s main asset is a 60% interest in the Northern Lights project in the Athabasca region of the Canadian province of Alberta.
The acquisition cost, net of cash acquired (€161 million) for all shares amounted to €352 million. This cost essentially represented the value of the company’s mineral interests that have been recognized as intangible assets on the face of the Consolidated Balance Sheet for €221 million.
Synenco Energy Inc. is fully consolidated in TOTAL’s Consolidated Financial Statements. Its contribution to the consolidated net income for fiscal year 2008 was not material.
In August 2008, TOTAL acquired the Dutch company Goal Petroleum BV. The acquisition cost amounted to €349 million. This cost essentially represented the value of the company’s mineral interests that have been recognized as intangible assets on the face of the Consolidated Balance Sheet for €292 million.
Goal Petroleum BV is fully consolidated in TOTAL’s Consolidated Financial Statements. Its contribution to the consolidated net income for fiscal year 2008 was not material.
Page 18
Pursuant to the agreements signed between the partners in November 2008, the Group’s participation in the Kashagan field decreased from 18.52% to 16.81%.
During 2008, TOTAL progressively sold 1.68% of Sanofi-Aventis’ share capital, thus reducing its interest to 11.38%. Sanofi-Aventis is accounted for by the equity method in TOTAL’s Consolidated Financial Statements.
2007
Pursuant to the agreements signed in 2007, the Group’s participation in Sincor project in Venezuela decreased from 47% to 30.323%.
In December 2007, TOTAL completed the sale of its 70% interest in the Milford Haven Refinery in Wales (UK) to its partner Murco Petroleum Company. This operation will allow TOTAL to concentrate its UK refining operations at the wholly-owned Lindsey Oil Refinery.
During the fourth quarter 2007, TOTAL progressively sold 0.4% of Sanofi-Aventis’ share capital, thus reducing its interest to 13.06%. Sanofi-Aventis is accounted for by the equity method in TOTAL’s Consolidated Financial Statements.
4) Business segment information
Financial information by business segment is reported in accordance with the internal reporting system and shows internal segment information that is used to manage and measure the performance of TOTAL. The Group's activities are conducted through three business segments: Upstream, Downstream and Chemicals.
the Upstream segment includes the activities of the Exploration & Production division and the Gas & Power division;
the Downstream segment includes activities of the Refining & Marketing division and the Trading & Shipping division; and
the Chemicals segment includes Base Chemicals and Specialties.
The Corporate segment includes the operating and financial activities of the holding companies (including the investment in Sanofi-Aventis).
The operational profit and assets are broken down by business segment prior to the consolidation and inter-segment adjustments.
Sales prices between business segments approximate market prices.
Page 19
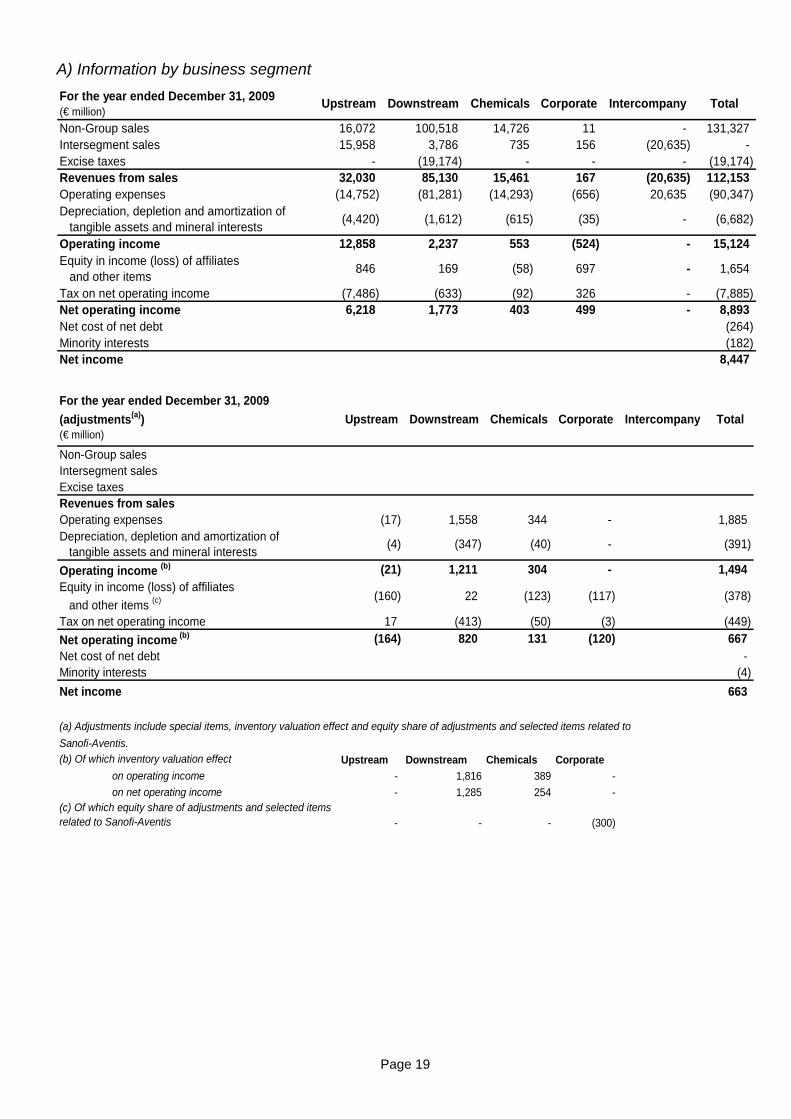
A) Information by business segment
For the year ended December 31, 2009(€ million)
Upstream Downstream Chemicals Corporate Intercompany Total
Non-Group sales 16,072 100,518 14,726 11 - 131,327Intersegment sales 15,958 3,786 735 156 (20,635) -Excise taxes - (19,174) - - - (19,174)Revenues from sales 32,030 85,130 15,461 167 (20,635) 112,153Operating expenses (14,752) (81,281) (14,293) (656) 20,635 (90,347)Depreciation, depletion and amortization of tangible assets and mineral interests
(4,420) (1,612) (615) (35) - (6,682)
Operating income 12,858 2,237 553 (524) - 15,124Equity in income (loss) of affiliates and other items
846 169 (58) 697 - 1,654
Tax on net operating income (7,486) (633) (92) 326 - (7,885)Net operating income 6,218 1,773 403 499 - 8,893Net cost of net debt (264)Minority interests (182)Net income 8,447
For the year ended December 31, 2009
(adjustments(a))(€ million)
Upstream Downstream Chemicals Corporate Intercompany Total
Non-Group salesIntersegment salesExcise taxesRevenues from salesOperating expenses (17) 1,558 344 - 1,885Depreciation, depletion and amortization of tangible assets and mineral interests
(4) (347) (40) - (391)
Operating income (b) (21) 1,211 304 - 1,494Equity in income (loss) of affiliates
and other items (c) (160) 22 (123) (117) (378)
Tax on net operating income 17 (413) (50) (3) (449)
Net operating income (b) (164) 820 131 (120) 667Net cost of net debt -Minority interests (4)
Net income 663
Sanofi-Aventis.(b) Of which inventory valuation effect Upstream Downstream Chemicals Corporate
on operating income - 1,816 389 -
on net operating income - 1,285 254 -(c) Of which equity share of adjustments and selected items related to Sanofi-Aventis - - - (300)
(a) Adjustments include special items, inventory valuation effect and equity share of adjustments and selected items related to

Page 20
For the year ended December 31, 2009 (adjusted) (€ million)
Upstream Downstream Chemicals Corporate Intercompany Total
Non-Group sales 16,072 100,518 14,726 11 - 131,327Intersegment sales 15,958 3,786 735 156 (20,635) -Excise taxes - (19,174) - - - (19,174)Revenues from sales 32,030 85,130 15,461 167 (20,635) 112,153Operating expenses (14,735) (82,839) (14,637) (656) 20,635 (92,232)Depreciation, depletion and amortization of tangible assets and mineral interests
(4,416) (1,265) (575) (35) - (6,291)
Adjusted operating income 12,879 1,026 249 (524) - 13,630
Equity in income (loss) of affiliates and other items
1,006 147 65 814 - 2,032
Tax on net operating income (7,503) (220) (42) 329 - (7,436)
Adjusted net operating income 6,382 953 272 619 - 8,226Net cost of net debt (264)Minority interests (178)Adjusted net income 7,784
For the year ended December 31, 2009(€ million)
Upstream Downstream Chemicals Corporate Intercompany Total
Total expenditures 9,855 2,771 631 92 13,349Total divestments 398 133 47 2,503 3,081Cash flow from operating activities 10,200 1,164 1,082 (86) 12,360Balance sheet as of December 31, 2009Property, plant and equipment, intangible assets, net 43,997 9,588 5,248 271 59,104Investments in equity affiliates 4,260 2,110 652 4,235 11,257Loans to equity affiliates and other non-current assets 3,844 1,369 850 547 6,610Working capital 660 7,624 2,151 58 10,493Provisions and other non-current liabilities (15,364) (2,190) (1,721) (1,094) (20,369)Capital Employed (balance sheet) 37,397 18,501 7,180 4,017 67,095Less inventory valuation effect - (3,202) (282) 840 (2,644)Capital Employed (Business segment information)
37,397 15,299 6,898 4,857 64,451
ROACE as a percentage 18% 7% 4% 13%
Page 21
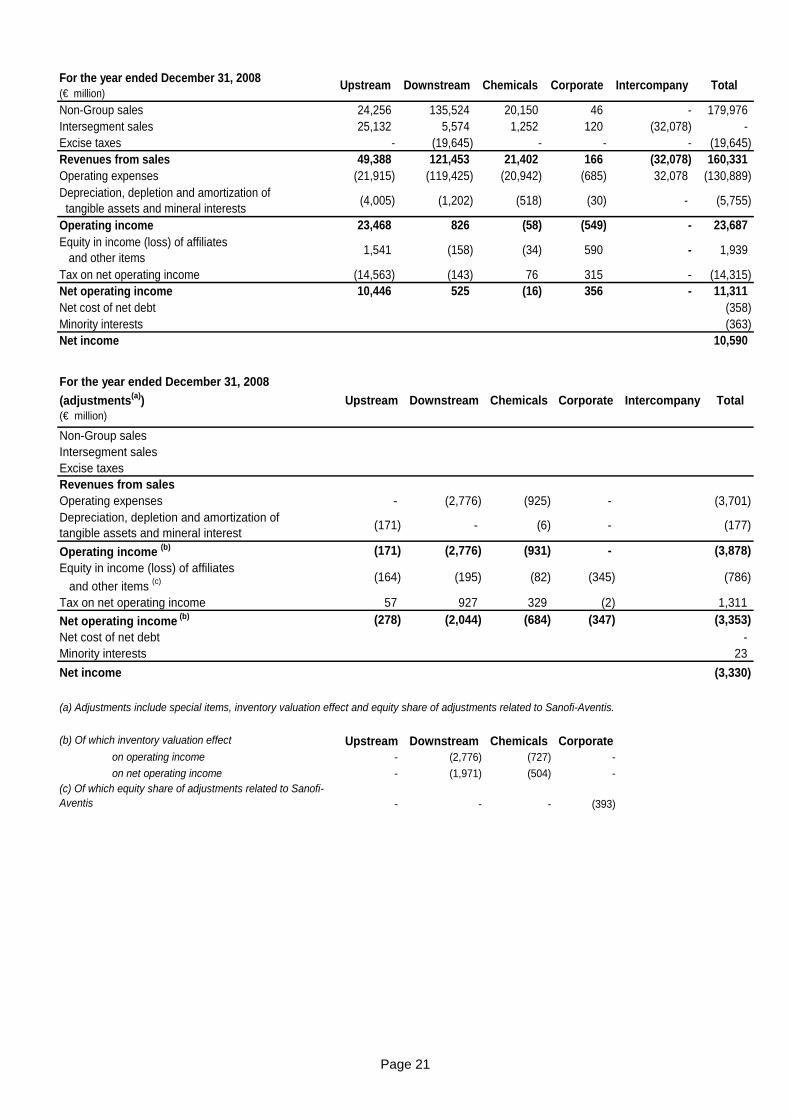
For the year ended December 31, 2008(€ million)
Upstream Downstream Chemicals Corporate Intercompany Total
Non-Group sales 24,256 135,524 20,150 46 - 179,976Intersegment sales 25,132 5,574 1,252 120 (32,078) -Excise taxes - (19,645) - - - (19,645)Revenues from sales 49,388 121,453 21,402 166 (32,078) 160,331Operating expenses (21,915) (119,425) (20,942) (685) 32,078 (130,889)Depreciation, depletion and amortization of tangible assets and mineral interests
(4,005) (1,202) (518) (30) - (5,755)
Operating income 23,468 826 (58) (549) - 23,687Equity in income (loss) of affiliates and other items
1,541 (158) (34) 590 - 1,939
Tax on net operating income (14,563) (143) 76 315 - (14,315)Net operating income 10,446 525 (16) 356 - 11,311Net cost of net debt (358)Minority interests (363)Net income 10,590
For the year ended December 31, 2008
(adjustments(a))(€ million)
Upstream Downstream Chemicals Corporate Intercompany Total
Non-Group salesIntersegment salesExcise taxesRevenues from salesOperating expenses - (2,776) (925) - (3,701)Depreciation, depletion and amortization oftangible assets and mineral interest
(171) - (6) - (177)
Operating income (b) (171) (2,776) (931) - (3,878)Equity in income (loss) of affiliates
and other items (c) (164) (195) (82) (345) (786)
Tax on net operating income 57 927 329 (2) 1,311
Net operating income (b) (278) (2,044) (684) (347) (3,353)Net cost of net debt -Minority interests 23
Net income (3,330)
(b) Of which inventory valuation effect Upstream Downstream Chemicals Corporateon operating income - (2,776) (727) -
on net operating income - (1,971) (504) -(c) Of which equity share of adjustments related to Sanofi-Aventis - - - (393)
(a) Adjustments include special items, inventory valuation effect and equity share of adjustments related to Sanofi-Aventis.
Page 22
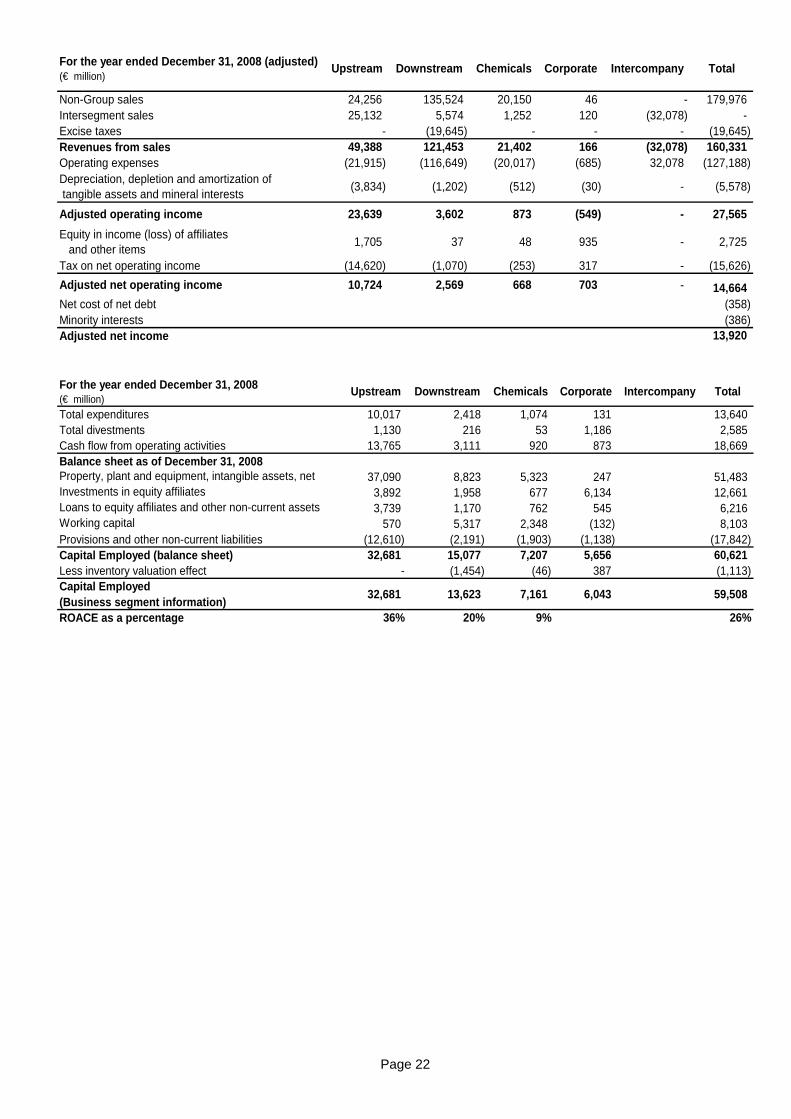
For the year ended December 31, 2008 (adjusted) (€ million)
Upstream Downstream Chemicals Corporate Intercompany Total
Non-Group sales 24,256 135,524 20,150 46 - 179,976Intersegment sales 25,132 5,574 1,252 120 (32,078) -Excise taxes - (19,645) - - - (19,645)Revenues from sales 49,388 121,453 21,402 166 (32,078) 160,331Operating expenses (21,915) (116,649) (20,017) (685) 32,078 (127,188)Depreciation, depletion and amortization of tangible assets and mineral interests
(3,834) (1,202) (512) (30) - (5,578)
Adjusted operating income 23,639 3,602 873 (549) - 27,565
Equity in income (loss) of affiliates and other items
1,705 37 48 935 - 2,725
Tax on net operating income (14,620) (1,070) (253) 317 - (15,626)
Adjusted net operating income 10,724 2,569 668 703 - 14,664Net cost of net debt (358)Minority interests (386)Adjusted net income 13,920
For the year ended December 31, 2008(€ million)
Upstream Downstream Chemicals Corporate Intercompany Total
Total expenditures 10,017 2,418 1,074 131 13,640Total divestments 1,130 216 53 1,186 2,585Cash flow from operating activities 13,765 3,111 920 873 18,669Balance sheet as of December 31, 2008Property, plant and equipment, intangible assets, net 37,090 8,823 5,323 247 51,483Investments in equity affiliates 3,892 1,958 677 6,134 12,661Loans to equity affiliates and other non-current assets 3,739 1,170 762 545 6,216Working capital 570 5,317 2,348 (132) 8,103Provisions and other non-current liabilities (12,610) (2,191) (1,903) (1,138) (17,842)Capital Employed (balance sheet) 32,681 15,077 7,207 5,656 60,621Less inventory valuation effect - (1,454) (46) 387 (1,113)Capital Employed (Business segment information)
32,681 13,623 7,161 6,043 59,508
ROACE as a percentage 36% 20% 9% 26%
Page 23
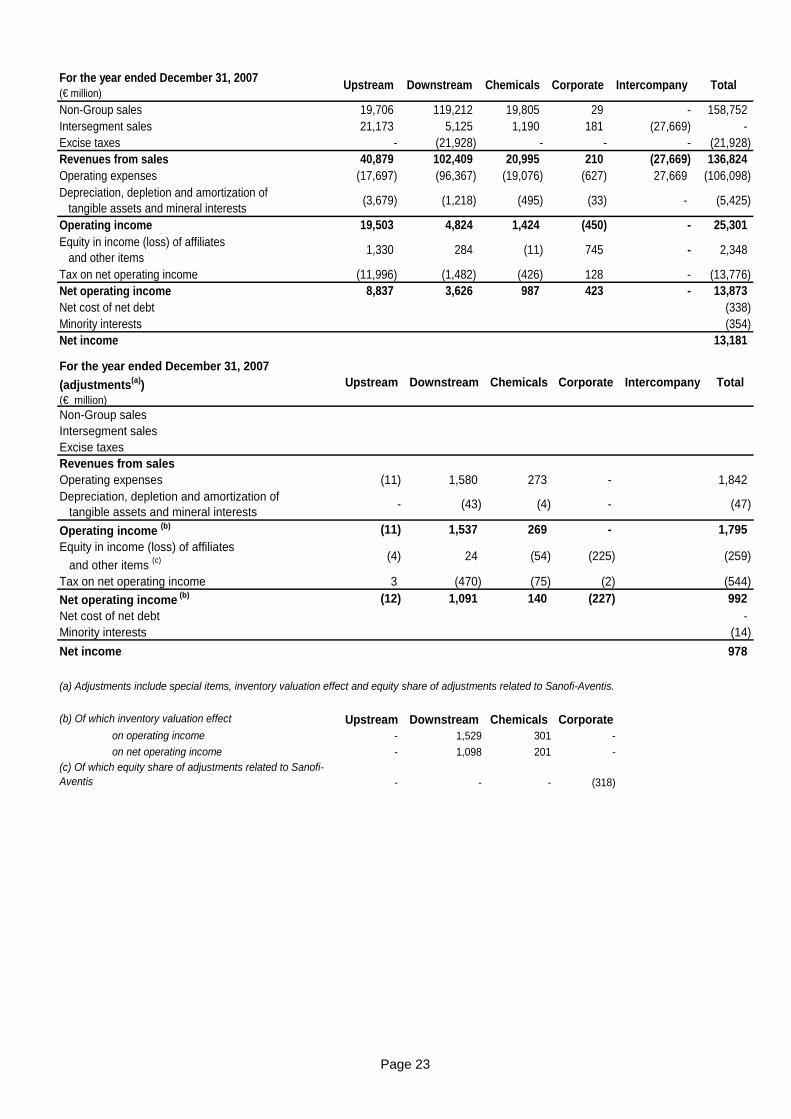
For the year ended December 31, 2007(€ million)
Upstream Downstream Chemicals Corporate Intercompany Total
Non-Group sales 19,706 119,212 19,805 29 - 158,752Intersegment sales 21,173 5,125 1,190 181 (27,669) -Excise taxes - (21,928) - - - (21,928)Revenues from sales 40,879 102,409 20,995 210 (27,669) 136,824Operating expenses (17,697) (96,367) (19,076) (627) 27,669 (106,098)Depreciation, depletion and amortization of tangible assets and mineral interests
(3,679) (1,218) (495) (33) - (5,425)
Operating income 19,503 4,824 1,424 (450) - 25,301Equity in income (loss) of affiliates and other items
1,330 284 (11) 745 - 2,348
Tax on net operating income (11,996) (1,482) (426) 128 - (13,776)Net operating income 8,837 3,626 987 423 - 13,873Net cost of net debt (338)Minority interests (354)Net income 13,181
For the year ended December 31, 2007
(adjustments(a))(€ million)
Upstream Downstream Chemicals Corporate Intercompany Total
Non-Group salesIntersegment salesExcise taxesRevenues from salesOperating expenses (11) 1,580 273 - 1,842Depreciation, depletion and amortization of tangible assets and mineral interests
- (43) (4) - (47)
Operating income (b) (11) 1,537 269 - 1,795Equity in income (loss) of affiliates
and other items (c) (4) 24 (54) (225) (259)
Tax on net operating income 3 (470) (75) (2) (544)
Net operating income (b) (12) 1,091 140 (227) 992Net cost of net debt -Minority interests (14)
Net income 978
(b) Of which inventory valuation effect Upstream Downstream Chemicals Corporateon operating income - 1,529 301 -
on net operating income - 1,098 201 -(c) Of which equity share of adjustments related to Sanofi-Aventis - - - (318)
(a) Adjustments include special items, inventory valuation effect and equity share of adjustments related to Sanofi-Aventis.

Page 24
For the year ended December 31, 2007 (adjusted) (€ million)
Upstream Downstream Chemicals Corporate Intercompany Total
Non-Group sales 19,706 119,212 19,805 29 - 158,752Intersegment sales 21,173 5,125 1,190 181 (27,669) -Excise taxes - (21,928) - - - (21,928)Revenues from sales 40,879 102,409 20,995 210 (27,669) 136,824Operating expenses (17,686) (97,947) (19,349) (627) 27,669 (107,940)Depreciation, depletion and amortization of tangible assets and mineral interests
(3,679) (1,175) (491) (33) - (5,378)
Adjusted operating income 19,514 3,287 1,155 (450) - 23,506
Equity in income (loss) of affiliates and other items
1,334 260 43 970 - 2,607
Tax on net operating income (11,999) (1,012) (351) 130 - (13,232)
Adjusted net operating income 8,849 2,535 847 650 - 12,881Net cost of net debt (338)Minority interests (340)Adjusted net income 12,203
For the year ended December 31, 2007(€ million)
Upstream Downstream Chemicals Corporate Intercompany Total
Total expenditures 8,882 1,875 911 54 11,722Total divestments 751 394 83 328 1,556Cash flow from operating activities 12,692 4,148 1,096 (250) 17,686Balance sheet as of December 31, 2007Property, plant and equipment, intangible assets, net 32,535 8,308 5,061 213 46,117Investments in equity affiliates 3,021 2,105 728 6,851 12,705Loans to equity affiliates and other non-current assets 3,748 1,183 456 634 6,021Working capital (94) 6,811 2,774 506 9,997Provisions and other non-current liabilities (12,147) (2,018) (1,697) (1,441) (17,303)Capital Employed (balance sheet) 27,063 16,389 7,322 6,763 57,537Less inventory valuation effect - (4,198) (424) 1,112 (3,510)Capital Employed (Business segment information)
27,063 12,191 6,898 7,875 54,027
ROACE as a percentage 34% 21% 12% 24%

Page 25
B) Reconciliation between business segment information and the Consolidated Statement of Income
The table below presents the impact of adjustment items on the Consolidated Statement of Income:
For the year ended December 31, 2009(€ million)
Adjusted Adjustments(a)Consolidated statement of
incomeSales 131,327 - 131,327Excise taxes (19,174) - (19,174) Revenues from sales 112,153 - 112,153
Purchases, net of inventory variation (73,263) 2,205 (71,058)Other operating expenses (18,271) (320) (18,591)Exploration costs (698) - (698)Depreciation, depletion and amortization of tangible assets and mineral interests (6,291) (391) (6,682)Other income 131 183 314Other expense (315) (285) (600)
Financial interest on debt (530) - (530)Financial income from marketable securities & cash equivalents 132 - 132 Cost of net debt (398) - (398)
Other financial income 643 - 643Other financial expense (345) - (345)
Equity in income (loss) of affiliates 1,918 (276) 1,642
Income taxes (7,302) (449) (7,751)Consolidated net income 7,962 667 8,629Group share 7,784 663 8,447Minority interests 178 4 182
(a) Adjustments include special items, inventory valuation effect and equity share of adjustments and selected items related to Sanofi-Aventis.
For the year ended December 31, 2008(€ million)
Adjusted Adjustments(a)Consolidated statement of
incomeSales 179,976 - 179,976Excise taxes (19,645) - (19,645) Revenues from sales 160,331 - 160,331
Purchases, net of inventory variation (107,521) (3,503) (111,024)Other operating expenses (18,903) (198) (19,101)Exploration costs (764) - (764)Depreciation, depletion and amortization of tangible assets and mineral interests (5,578) (177) (5,755)Other income 153 216 369Other expense (147) (407) (554)
Financial interest on debt (1,000) - (1,000)Financial income from marketable securities & cash equivalents 473 - 473 Cost of net debt (527) - (527)
Other financial income 728 - 728Other financial expense (325) - (325)
Equity in income (loss) of affiliates 2,316 (595) 1,721
Income taxes (15,457) 1,311 (14,146)Consolidated net income 14,306 (3,353) 10,953Group share 13,920 (3,330) 10,590Minority interests 386 (23) 363
(a) Adjustments include special items, inventory valuation effect and equity share of adjustments related to Sanofi-Aventis.

Page 26
For the year ended December 31, 2007(€ million)
Adjusted Adjustments(a)Consolidated statement of
incomeSales 158,752 - 158,752Excise taxes (21,928) - (21,928) Revenues from sales 136,824 - 136,824
Purchases, net of inventory variation (89,688) 1,881 (87,807)Other operating expenses (17,375) (39) (17,414)Exploration costs (877) - (877)Depreciation, depletion and amortization of tangible assets and mineral interests (5,378) (47) (5,425)Other income 384 290 674Other expense (225) (245) (470)
Financial interest on debt (1,783) - (1,783)Financial income from marketable securities & cash equivalents 1,244 - 1,244 Cost of net debt (539) - (539)
Other financial income 643 - 643Other financial expense (274) - (274)
Equity in income (loss) of affiliates 2,079 (304) 1,775
Income taxes (13,031) (544) (13,575)Consolidated net income 12,543 992 13,535Group share 12,203 978 13,181Minority interests 340 14 354
(a) Adjustments include special items, inventory valuation effect and equity share of adjustments related to Sanofi-Aventis.
C) Adjustment items by business segment
The adjustment items for income as per Note 2 to the Consolidated Financial Statements are detailed as follows:
Adjustments to operating incomeFor the year ended December 31, 2009 (€ million) Upstream Downstream Chemicals Corporate TotalInventory valuation effect - 1,816 389 - 2,205Restructuring charges - - - - -Asset impairment charges (4) (347) (40) - (391)Other items (17) (258) (45) - (320)Total (21) 1,211 304 - 1,494
Adjustments to net income, Group shareFor the year ended December 31, 2009 (€ million) Upstream Downstream Chemicals Corporate TotalInventory valuation effect - 1,279 254 - 1,533TOTAL's equity share of adjustments and selected items related to Sanofi-Aventis - - - (300) (300)Restructuring charges - (27) (102) - (129)Asset impairment charges (52) (253) (28) - (333)Gains (losses) on disposals of assets - - - 179 179Other items (112) (182) 7 - (287)Total (164) 817 131 (121) 663

Page 27
Adjustments to operating incomeFor the year ended December 31, 2008 (€ million) Upstream Downstream Chemicals Corporate TotalInventory valuation effect - (2,776) (727) - (3,503)Restructuring charges - - - - -Asset impairment charges (171) - (6) - (177)Other items - - (198) - (198)Total (171) (2,776) (931) - (3,878)
Adjustments to net income, Group shareFor the year ended December 31, 2008 (€ million) Upstream Downstream Chemicals Corporate TotalInventory valuation effect - (1,949) (503) - (2,452)TOTAL's equity share of adjustments related to Sanofi-Aventis - - - (393) (393)Restructuring charges - (47) (22) - (69)Asset impairment charges (172) (26) (7) - (205)Gains (losses) on disposals of assets 130 - - 84 214Other items (236) - (151) (38) (425)Total (278) (2,022) (683) (347) (3,330)
Adjustments to operating incomeFor the year ended December 31, 2007 (€ million) Upstream Downstream Chemicals Corporate TotalInventory valuation effect - 1,529 301 - 1,830Restructuring charges - - - - -Asset impairment charges - (43) (4) - (47)Other items (11) 51 (28) - 12Total (11) 1,537 269 - 1,795
Adjustments to net income, Group shareFor the year ended December 31, 2007 (€ million) Upstream Downstream Chemicals Corporate TotalInventory valuation effect - 1,084 201 - 1,285TOTAL's equity share of special items recorded by Sanofi-Aventis - - - 75 75TOTAL's equity share of adjustments related to Sanofi-Aventis - - - (318) (318)Restructuring charges - (20) (15) - (35)Asset impairment charges (93) (61) (8) - (162)Gains (losses) on disposals of assets 89 101 - 116 306Other items (8) (27) (38) (100) (173)Total (12) 1,077 140 (227) 978
D) Additional information on impairments
In the Upstream, Downstream and Chemicals segments, impairments of assets have been recognized for the year ended December 31, 2009, with an impact of €413 million in operating income and €382 million in net income, Group share. These impairments have been disclosed as adjustments to operating income for €391 million and as adjustments to net income, Group share for €333 million. These items are identified in paragraph 4C above as adjustment items with the heading “Asset impairment charges”.
The impairment losses impact certain Cash Generating Units (CGU) for which there were indications of impairment, due mainly to changes in the operating conditions or the economic environment of their specific businesses.
The principles applied are the following:
the recoverable amount of CGUs has been based on their value in use, as defined in Note 1 paragraph L to the Consolidated Financial Statements "Impairment of long-lived assets";
future cash flows have been determined with the assumptions in the long-term plan of the Group. These assumptions (including future prices of products, supply and demand for products, future production volumes) represent the best estimate by management of the Group of all economic conditions during the remaining life of assets;
future cash flows are based on the long-term plan and are prepared over a period consistent with the life of the assets within the CGU. They include specific risks attached to CGU assets and are discounted using a 8% after tax discount rate. This rate is a weighted-average capital cost estimated from historical market data.

Page 28
These assumptions have been applied consistently for the years ending in 2007, 2008 and 2009.
The CGUs of the Upstream segment affected by these impairments are oil fields and associates accounted for by the equity method.
The CGUs of the Dowstream segment are affiliates or groups of affiliates (or industrial assets) organized mostly by country for the refining activities and by relevant geographical area for the marketing activities. The year 2009 was marked by the deterioration of the economic environment, and especially by the decline in refining margins that have resulted in changes in the operating conditions of assets in some business units of the Downstream segment. These factors have triggered the recognition of impairments of assets impacting the operating income for €347 millions and the net income for €253 million. Given the deteriorated economic environment, sensitivity analysis using a lower refining margin have been performed by the Group and have not led to additional impairment.
The CGUs of the Chemicals segment are worldwide business units, including activities or products with common strategic, commercial and industrial characteristics.
For the year ended December 31, 2008, impairments of assets have been recognized in the Upstream, Downstream and Chemicals segments with an impact of €216 million in operating income and €244 million in net income, Group share. These impairments have been disclosed as adjustments to operating income for €177 million and adjustments to net income, Group share for €205 million.
For the year ended December 31, 2007, impairments of assets have been recognized in the Upstream, Downstream and Chemicals segments with an impact of €47 million in operating income and €162 million in net income, Group share.
For the year ended December 31, 2009, no reversal of impairment has been recognized. For the year ended December 31, 2008, reversals of impairment losses have been recognized in the Upstream segment with an impact of €41 million in operating income and €29 million in net income, Group share. No reversal of impairment losses has been recognized in 2007.
5) Information by geographical area
(€ mil lion) FranceRest of Europe
North America Africa
Rest of the world Total
For the year ended December 31, 2009
Non-Group sales 32,437 60,140 9,515 9,808 19,427 131,327
Property, p lant and equ ipment, intan gible asse ts, net 6,973 15,218 8,112 1 7,312 11,489 59,104
Capital expe nditures 1,189 2,502 1,739 4,651 3,268 13,349
For the year ended December 31, 2008
Non-Group sales 43,616 82,761 14,002 1 2,482 27,115 179,976
Property, p lant and equ ipment, intan gible asse ts, net 7,260 13,485 5,182 1 5,460 10,096 51,483
Capital expe nditures 1,997 2,962 1,255 4,500 2,926 13,640
For the year ended December 31, 2007
Non-Group sales 37,949 73,757 12,404 1 0,401 24,241 158,752
Property, p lant and equ ipment, intan gible asse ts, net 6,437 14,554 4,444 1 1,872 8,810 46,117
Capital expe nditures 1,627 2,538 740 3,745 3,072 11,722
6) Operating expenses
For the year ended December 31, (€ million) 2009 2008 2007
Purchases, net of inventory variation(a)(71,058) (111,024) (87,807)
Exploration costs (698) (764) (877)
Other operating expenses(b)(18,591) (19,101) (17,414)
of which non-current operating liabilities (allowances) reversals 515 459 781of which current operating liabilities (allowances) reversals (43) (29) (42)
Operating expenses (90,347) (130,889) (106,098)(a) Includes royalties paid on oil and gas production in the Upstream segment (see in particular the taxes paid to Middle East oil producing countries for the Group’s concessions as detailed in Note 33 to the Consolidated Financial Statements “Other information").
(b) Principally composed of production and administrative costs (see in particular the payroll costs as detailed in Note 26 to the Consolidated Financial Statements “Payroll and staff").
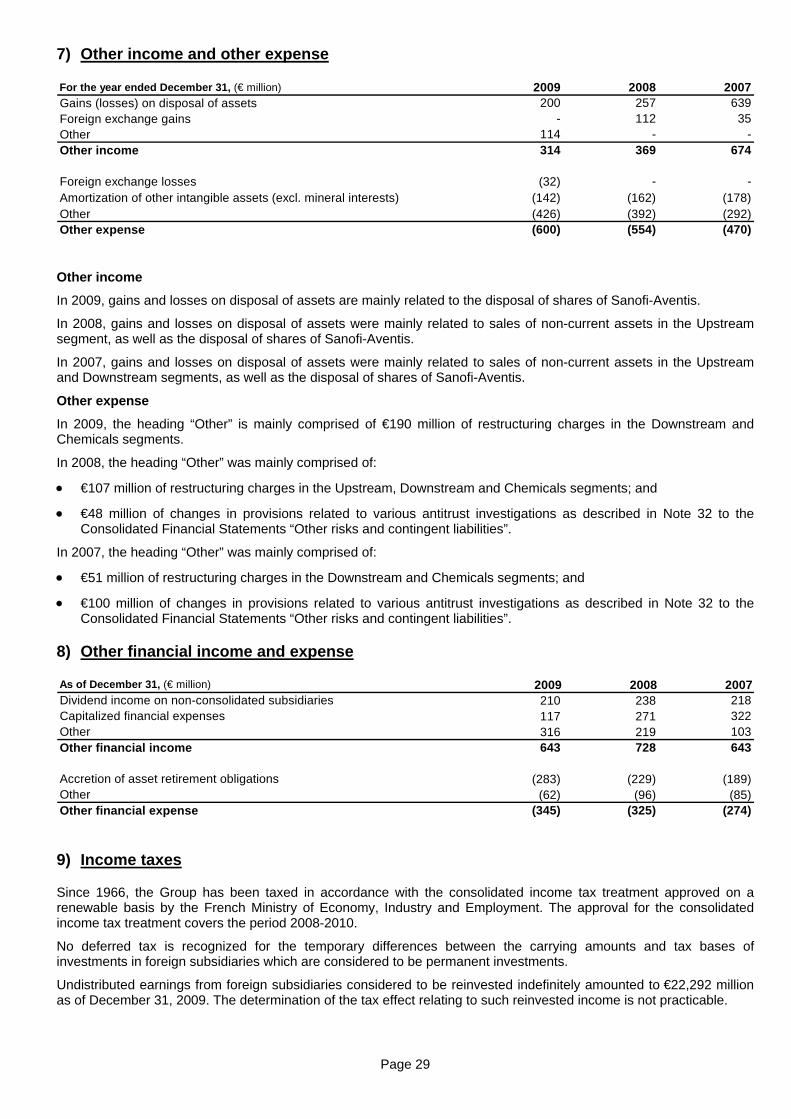
Page 29
7) Other income and other expense
For the year ended December 31, (€ million) 2009 2008 2007Gains (losses) on disposal of assets 200 257 639Foreign exchange gains - 112 35Other 114 - -Other income 314 369 674
Foreign exchange losses (32) - -Amortization of other intangible assets (excl. mineral interests) (142) (162) (178)Other (426) (392) (292)Other expense (600) (554) (470)
Other income
In 2009, gains and losses on disposal of assets are mainly related to the disposal of shares of Sanofi-Aventis.
In 2008, gains and losses on disposal of assets were mainly related to sales of non-current assets in the Upstream segment, as well as the disposal of shares of Sanofi-Aventis.
In 2007, gains and losses on disposal of assets were mainly related to sales of non-current assets in the Upstream and Downstream segments, as well as the disposal of shares of Sanofi-Aventis.
Other expense
In 2009, the heading “Other” is mainly comprised of €190 million of restructuring charges in the Downstream and Chemicals segments.
In 2008, the heading “Other” was mainly comprised of:
€107 million of restructuring charges in the Upstream, Downstream and Chemicals segments; and
€48 million of changes in provisions related to various antitrust investigations as described in Note 32 to the Consolidated Financial Statements “Other risks and contingent liabilities”.
In 2007, the heading “Other” was mainly comprised of:
€51 million of restructuring charges in the Downstream and Chemicals segments; and
€100 million of changes in provisions related to various antitrust investigations as described in Note 32 to the Consolidated Financial Statements “Other risks and contingent liabilities”.
8) Other financial income and expense
As of December 31, (€ million) 2009 2008 2007Dividend income on non-consolidated subsidiaries 210 238 218Capitalized financial expenses 117 271 322Other 316 219 103Other financial income 643 728 643
Accretion of asset retirement obligations (283) (229) (189)Other (62) (96) (85)Other financial expense (345) (325) (274)
9) Income taxes
Since 1966, the Group has been taxed in accordance with the consolidated income tax treatment approved on a renewable basis by the French Ministry of Economy, Industry and Employment. The approval for the consolidated income tax treatment covers the period 2008-2010.
No deferred tax is recognized for the temporary differences between the carrying amounts and tax bases of investments in foreign subsidiaries which are considered to be permanent investments.
Undistributed earnings from foreign subsidiaries considered to be reinvested indefinitely amounted to €22,292 million as of December 31, 2009. The determination of the tax effect relating to such reinvested income is not practicable.

Page 30
In addition, no deferred tax is recognized on unremitted earnings (approximately €17,968 million) of the Group's French subsidiaries since the remittance of such earnings would be tax exempt for the subsidiaries in which the Company owns 95% or more of the outstanding shares.
Income taxes are detailed as follows:
For the year ended December 31, (€ million) 2009 2008 2007Current income taxes (7,213) (14,117) (12,141)Deferred income taxes (538) (29) (1,434)Total income taxes (7,751) (14,146) (13,575)
Before netting deferred tax assets and liabilities by fiscal entity, the components of deferred tax balances as of December 31, 2009, 2008 and 2007 are as follows:
As of December 31, (€ million) 2009 2008 2007Net operating losses and tax carry forwards 1,114 1,031 560Employee benefits 517 519 760Other temporary non-deductible provisions 2,184 2,075 2,341Gross deferred tax assets 3,815 3,625 3,661Valuation allowance (484) (475) (449)Net deferred tax assets 3,331 3,150 3,212
Excess tax over book depreciation (9,791) (8,836) (9,254)Other temporary tax deductions (1,179) (1,171) (1,209)Gross deferred tax liability (10,970) (10,007) (10,463)
Net deferred tax liability (7,639) (6,857) (7,251)
After netting deferred tax assets and liabilities by fiscal entity, deferred taxes are presented on the balance sheet as follows:
As of December 31, (€ million) 2009 2008 2007
Deferred tax assets, non-current (note 14) 1,164 1,010 797Deferred tax assets, current (note 16) 214 206 112Deferred tax liabilities, non-current (8,948) (7,973) (7,933)Deferred tax liabilities, current (69) (100) (227)Net amount (7,639) (6,857) (7,251)
The net deferred tax variation in the balance sheet is analyzed as follows:
As of December 31, (€ million) 2009 2008 2007
Opening balance (6,857) (7,251) (6,369)Deferred tax on income (538) (29) (1,434)Deferred tax on shareholders' equity(a)
(38) 30 (6)Changes in scope of consolidation (1) (1) 158Currency translation adjustment (205) 394 400Closing balance (7,639) (6,857) (7,251)
(a) This amount includes mainly current income taxes and deferred taxes for changes in fair value of listed securities classified as financial assets available for sale as well as deferred taxes related to the cash flow hedge (see Note 17 to the Consolidated Financial Statements).

Page 31
Reconciliation between provision for income taxes and pre-tax income:
For the year ended December 31, (€ million) 2009 2008 2007Consolidated net income 8,629 10,953 13,535Provision for income taxes 7,751 14,146 13,575Pre-tax income 16,380 25,099 27,110French statutory tax rate 34.43% 34.43% 34.43%Theoretical tax charge (5,640) (8,642) (9,334)Difference between French and foreign income tax rates (3,214) (6,326) (5,118)Tax effect of equity in income (loss) of affiliates 565 593 611Permanent differences 597 315 122Adjustments on prior years income taxes (47) 12 75Adjustments on deferred tax related to changes in tax rates (1) (31) (16)Changes in valuation allowance of deferred tax assets (6) (63) 80Other (5) (4) 5Net provision for income taxes (7,751) (14,146) (13,575) The French statutory tax rate includes the standard corporate tax rate (33.33%) and additional applicable taxes that bring the overall tax rate to 34.43% in 2009 (identical to 2008 and 2007).
Permanent differences are mainly due to impairment of goodwill and to dividends from non-consolidated companies as well as the specific taxation rules applicable to certain activities and within the consolidated income tax treatment.
Net operating losses and tax credit carryforwards
Deferred tax assets related to net operating losses and tax carryforwards were available in various tax jurisdictions, expiring in the following years:
As of December 31, (€ million) Basis Tax Basis Tax Basis Tax2008 - - - - 290 1412009 - - 233 115 222 1092010 258 126 167 79 129 592011 170 83 93 42 33 13
2012 (a)121 52 61 19 68 22
2013 (b)133 43 1,765 587
2014 and after 1,804 599 - - - -Unlimited 661 211 560 189 641 216Total 3,147 1,114 2,879 1,031 1,383 560
2009 20072008
(a) Net operating losses and tax credit carryforwards in 2012 and after for 2007 (b) Net operating losses and tax credit carryforwards in 2013 and after for 2008

Page 32
10) Intangible assets
As of December 31, 2009 (€ million) Cost Amortization and impairment Net
Goodwill 1,776 (614) 1,162
Proved and unproved mineral interests 8,204 (2,421) 5,783
Other intangible assets 2,712 (2,143) 569
Total intangible assets 12,692 (5,178) 7,514
As of December 31, 2008 (€ million) Cost Amortization and impairment Net
Goodwill 1,690 (616) 1,074
Proved and unproved mineral interests 6,010 (2,268) 3,742
Other intangible assets 2,519 (1,994) 525
Total intangible assets 10,219 (4,878) 5,341
As of December 31, 2007 (€ million) Cost Amortization and impairment Net
Goodwill 1,684 (617) 1,067
Proved and unproved mineral interests 5,327 (2,310) 3,017
Other intangible assets 2,452 (1,886) 566
Total intangible assets 9,463 (4,813) 4,650
Changes in net intangible assets are analyzed in the following table:
(€ million)
Net amount as of January 1, Acquisitions Disposals
Amortization and impairment
Currencytranslationadjustment Other
Net amount as of December 31,
2009 5,341 629 (64) (345) 2 1,951 7,5142008 4,650 404 (3) (259) (93) 642 5,3412007 4,705 472 (160) (274) (208) 115 4,650
In 2009, the heading “Other” mainly includes Chesapeake’s Barnett shale mineral interests for €1,449 million (see Note 3 to the Consolidated Financial Statements).
In 2008, the heading “Other” mainly included the impact of “proved and unproved mineral interests” from Synenco Energy Inc. for €221 million and from Goal Petroleum B.V. for €292 million.
A summary of changes in the carrying amount of goodwill by business segment for the year ended December 31, 2009 is as follows:
(€ million)Net goodwill as of January 1, 2009 Increases Impairments Other
Net goodwill as of December 31, 2009
Upstream 78 - - - 78Downstream 130 70 - 2 202Chemicals 841 11 - 5 857Corporate 25 - - - 25Total 1,074 81 - 7 1,162

Page 33
11) Property, plant and equipment
As of December 31, 2009 (€ million) Cost Depreciation and impairment NetUpstream properties
Proved properties 71,082 (44,718) 26,364Unproved properties 182 (1) 181Work in progress 10,351 (51) 10,300
Subtotal 81,615 (44,770) 36,845
Other property, plant and equipmentLand 1,458 (435) 1,023
Machinery, plant and equipment (including transportation equipment)
22,927 (15,900) 7,027
Buildings 6,142 (3,707) 2,435Work in progress 2,774 (155) 2,619Other 6,506 (4,865) 1,641
Subtotal 39,807 (25,062) 14,745Total property, plant and equipment 121,422 (69,832) 51,590
As of December 31, 2008 (€ million) Cost Depreciation and impairment NetUpstream properties
Proved properties 61,727 (39,315) 22,412Unproved properties 106 (1) 105Work in progress 9,586 - 9,586
Subtotal 71,419 (39,316) 32,103
Other property, plant and equipmentLand 1,446 (429) 1,017
Machinery, plant and equipment (including transportation equipment)
21,734 (14,857) 6,877
Buildings 5,739 (3,441) 2,298Work in progress 2,226 (10) 2,216Other 6,258 (4,627) 1,631
Subtotal 37,403 (23,364) 14,039Total property, plant and equipment 108,822 (62,680) 46,142
As of December 31, 2007 (€ million) Cost Depreciation and impairment NetUpstream properties
Proved properties 60,124 (38,735) 21,389Unproved properties 48 (1) 47Work in progress 7,010 - 7,010
Subtotal 67,182 (38,736) 28,446
Other property, plant and equipmentLand 1,460 (417) 1,043
Machinery, plant and equipment (including transportation equipment)
20,575 (14,117) 6,458
Buildings 5,505 (3,430) 2,075Work in progress 1,832 (4) 1,828Other 6,291 (4,674) 1,617
Subtotal 35,663 (22,642) 13,021Total property, plant and equipment 102,845 (61,378) 41,467
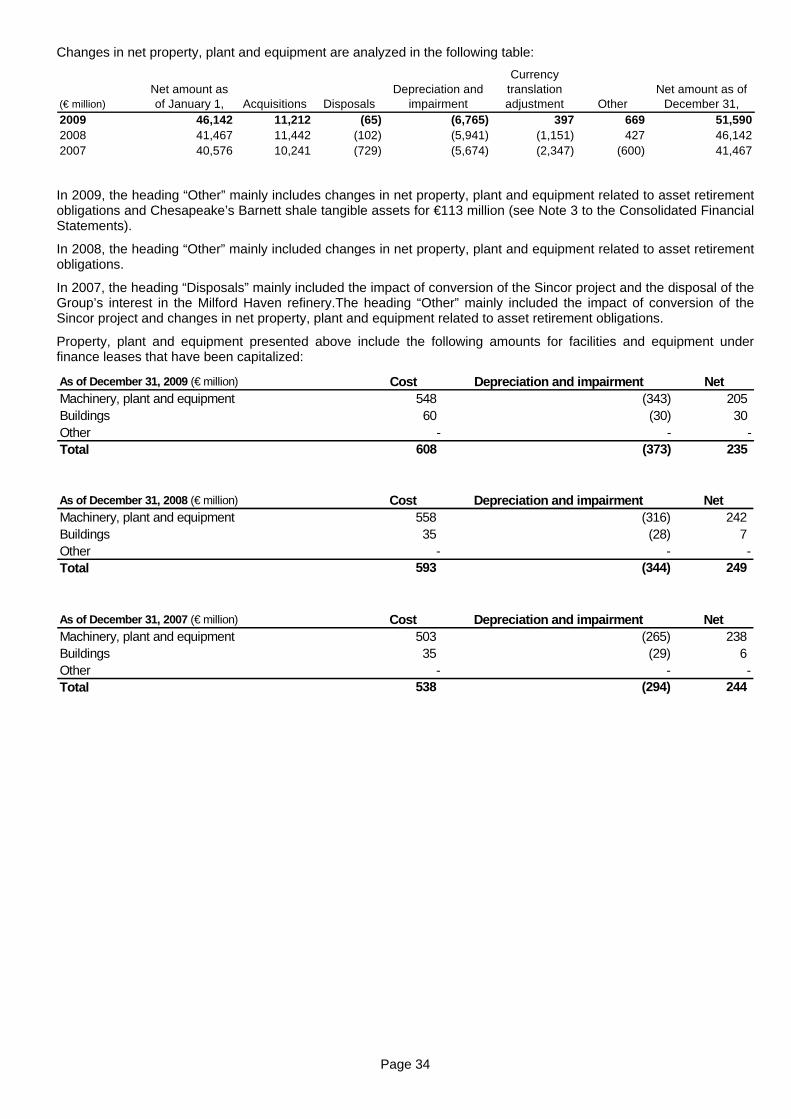
Page 34
Changes in net property, plant and equipment are analyzed in the following table:
(€ million)Net amount as of January 1, Acquisitions Disposals
Depreciation and impairment
Currencytranslationadjustment Other
Net amount as of December 31,
2009 46,142 11,212 (65) (6,765) 397 669 51,5902008 41,467 11,442 (102) (5,941) (1,151) 427 46,1422007 40,576 10,241 (729) (5,674) (2,347) (600) 41,467
In 2009, the heading “Other” mainly includes changes in net property, plant and equipment related to asset retirement obligations and Chesapeake’s Barnett shale tangible assets for €113 million (see Note 3 to the Consolidated Financial Statements).
In 2008, the heading “Other” mainly included changes in net property, plant and equipment related to asset retirement obligations.
In 2007, the heading “Disposals” mainly included the impact of conversion of the Sincor project and the disposal of the Group’s interest in the Milford Haven refinery.The heading “Other” mainly included the impact of conversion of the Sincor project and changes in net property, plant and equipment related to asset retirement obligations.
Property, plant and equipment presented above include the following amounts for facilities and equipment under finance leases that have been capitalized:
As of December 31, 2009 (€ million) Cost Depreciation and impairment NetMachinery, plant and equipment 548 (343) 205Buildings 60 (30) 30Other - - -Total 608 (373) 235
As of December 31, 2008 (€ million) Cost Depreciation and impairment NetMachinery, plant and equipment 558 (316) 242Buildings 35 (28) 7Other - - -Total 593 (344) 249
As of December 31, 2007 (€ million) Cost Depreciation and impairment NetMachinery, plant and equipment 503 (265) 238Buildings 35 (29) 6Other - - -Total 538 (294) 244

Page 35
12) Equity affiliates: investments and loans
Equity value 2009 2008 2007 2009 2008 2007
(€ million)
NLNG 15.00% 15.00% 15.00% 1,136 1,135 1,062
PetroCedeño - EM (a) 30.32% 30.32% 30.32% 874 760 534
CEPSA (Upstream share) 48.83% 48.83% 48.83% 385 403 246
Angola LNG Ltd. (a) 13.60% 13.60% 13.60% 490 326 155
Qatargas 10.00% 10.00% 10.00% 83 251 172
Société du Terminal Méthanier de Fos Cavaou 28.79% 30.30% 30.30% 124 114 92
SCP Limited 10.00% 10.00% 10.00% 89 96 91
Dolphin Energy Ltd (Del) Abu Dhabi 24.50% 24.50% 24.50% 118 85 37
Qatar Liquefied Gas Company Limited II (Train B) 16.70% 16.70% 16.70% 143 82 86
Moattama Gas Transportation Cy 31.24% 31.24% 31.24% 51 65 53
Ocensa 15.20% 15.20% 15.20% 85 60 57
Gasoducto Gasandes Argentina 56.50% 56.50% 56.50% 46 58 74
Gaz transport & Technigaz (a) 30.00% 30.00% 30.00% 26 53 46
Laffan Refinery 10.00% 10.00% 10.00% 60 53 39
Shtokman Development AG (b) 25.00% 25.00% - 162 35 -
Other - - - 388 315 277
Total Upstream 4,260 3,891 3,021
CEPSA (Downstream share) 48.83% 48.83% 48.83% 1,927 1,810 1,932
Saudi Aramco Total Refining & Petrochemicals (b) 37.50% 37.50% - 60 75 -
Wepec 22.41% 22.41% 22.41% - - 70
Other - - 123 73 103
Total Downstream 2,110 1,958 2,105
CEPSA (Chemicals share) 48.83% 48.83% 48.83% 396 424 524
Qatar Petrochemical Company Ltd 20.00% 20.00% 20.00% 205 192 150
Other - - - 51 61 54
Total Chemicals 652 677 728
Sanofi-Aventis 7.39% 11.38% 13.06% 4,235 6,137 6,851
Other - - - - - -
Total Corporate 4,235 6,137 6,851
Total investments 11,257 12,663 12,705
Loans 2,367 2,005 2,575
Total investments and loans 13,624 14,668 15,280
As of December 31, As of December 31,
% owned equity value
(a) Investment accounted for by the equity method as from 2007. (b) Investment accounted for by the equity method as from 2008.
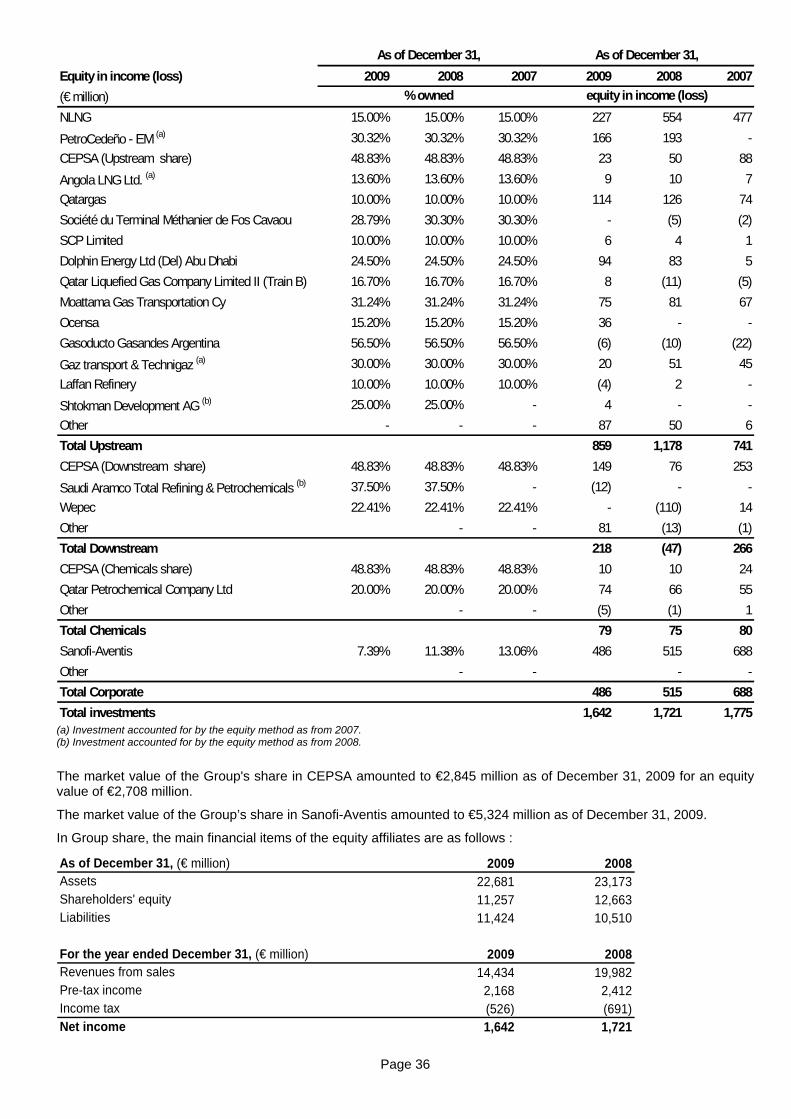
Page 36
Equity in income (loss) 2009 2008 2007 2009 2008 2007
(€ million)
NLNG 15.00% 15.00% 15.00% 227 554 477
PetroCedeño - EM (a) 30.32% 30.32% 30.32% 166 193 -
CEPSA (Upstream share) 48.83% 48.83% 48.83% 23 50 88
Angola LNG Ltd. (a) 13.60% 13.60% 13.60% 9 10 7
Qatargas 10.00% 10.00% 10.00% 114 126 74
Société du Terminal Méthanier de Fos Cavaou 28.79% 30.30% 30.30% - (5) (2)
SCP Limited 10.00% 10.00% 10.00% 6 4 1
Dolphin Energy Ltd (Del) Abu Dhabi 24.50% 24.50% 24.50% 94 83 5
Qatar Liquefied Gas Company Limited II (Train B) 16.70% 16.70% 16.70% 8 (11) (5)
Moattama Gas Transportation Cy 31.24% 31.24% 31.24% 75 81 67
Ocensa 15.20% 15.20% 15.20% 36 - -
Gasoducto Gasandes Argentina 56.50% 56.50% 56.50% (6) (10) (22)
Gaz transport & Technigaz (a) 30.00% 30.00% 30.00% 20 51 45
Laffan Refinery 10.00% 10.00% 10.00% (4) 2 -
Shtokman Development AG (b) 25.00% 25.00% - 4 - -
Other - - - 87 50 6
Total Upstream 859 1,178 741
CEPSA (Downstream share) 48.83% 48.83% 48.83% 149 76 253
Saudi Aramco Total Refining & Petrochemicals (b) 37.50% 37.50% - (12) - -
Wepec 22.41% 22.41% 22.41% - (110) 14
Other - - 81 (13) (1)
Total Downstream 218 (47) 266
CEPSA (Chemicals share) 48.83% 48.83% 48.83% 10 10 24
Qatar Petrochemical Company Ltd 20.00% 20.00% 20.00% 74 66 55
Other - - (5) (1) 1
Total Chemicals 79 75 80
Sanofi-Aventis 7.39% 11.38% 13.06% 486 515 688
Other - - - -
Total Corporate 486 515 688
Total investments 1,642 1,721 1,775
As of December 31, As of December 31,
% owned equity in income (loss)
(a) Investment accounted for by the equity method as from 2007. (b) Investment accounted for by the equity method as from 2008.
The market value of the Group's share in CEPSA amounted to €2,845 million as of December 31, 2009 for an equity value of €2,708 million.
The market value of the Group’s share in Sanofi-Aventis amounted to €5,324 million as of December 31, 2009.
In Group share, the main financial items of the equity affiliates are as follows :
As of December 31, (€ million) 2009 2008Assets 22,681 23,173Shareholders' equity 11,257 12,663Liabilities 11,424 10,510
For the year ended December 31, (€ million) 2009 2008Revenues from sales 14,434 19,982Pre-tax income 2,168 2,412Income tax (526) (691)Net income 1,642 1,721
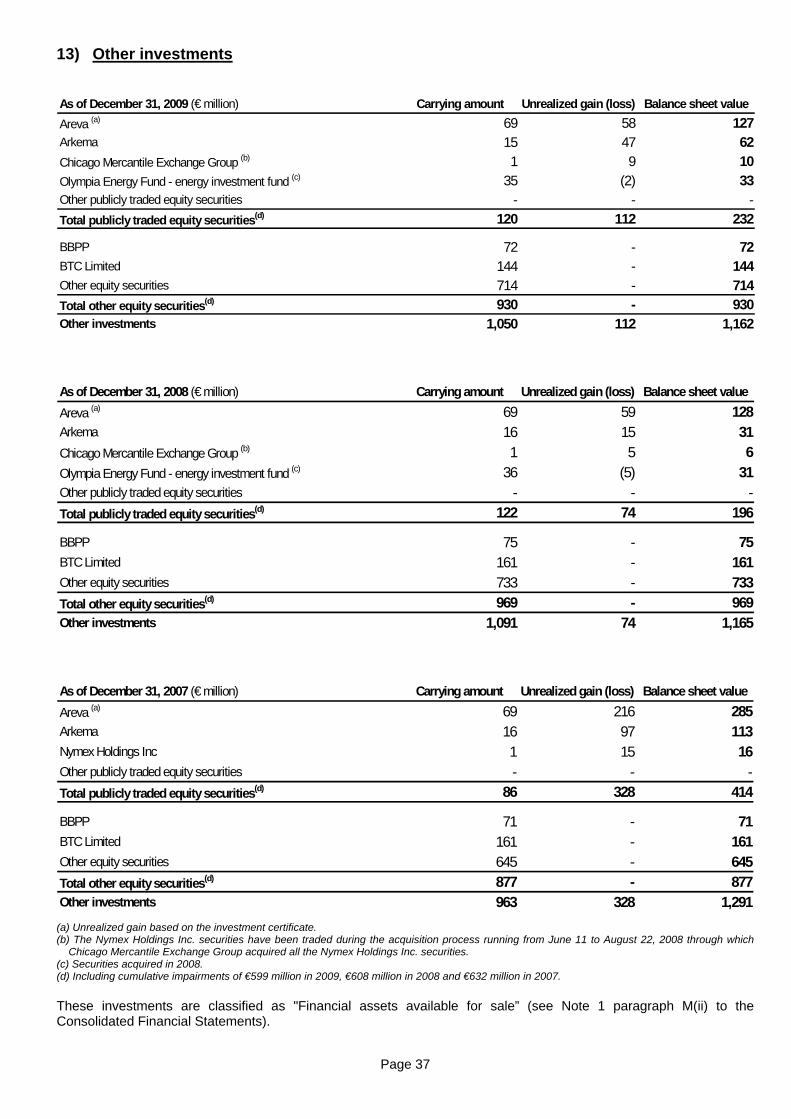
Page 37
13) Other investments
As of December 31, 2009 (€ million) Carrying amount Unrealized gain (loss) Balance sheet value
Areva (a) 69 58 127Arkema 15 47 62
Chicago Mercantile Exchange Group (b) 1 9 10
Olympia Energy Fund - energy investment fund (c) 35 (2) 33Other publicly traded equity securities - - -
Total publicly traded equity securities(d) 120 112 232
BBPP 72 - 72BTC Limited 144 - 144Other equity securities 714 - 714
Total other equity securities(d) 930 - 930Other investments 1,050 112 1,162
As of December 31, 2008 (€ million) Carrying amount Unrealized gain (loss) Balance sheet value
Areva (a) 69 59 128Arkema 16 15 31
Chicago Mercantile Exchange Group (b) 1 5 6
Olympia Energy Fund - energy investment fund (c) 36 (5) 31Other publicly traded equity securities - - -
Total publicly traded equity securities(d) 122 74 196
BBPP 75 - 75BTC Limited 161 - 161Other equity securities 733 - 733
Total other equity securities(d) 969 - 969Other investments 1,091 74 1,165
As of December 31, 2007 (€ million) Carrying amount Unrealized gain (loss) Balance sheet value
Areva (a) 69 216 285Arkema 16 97 113Nymex Holdings Inc 1 15 16Other publicly traded equity securities - - -
Total publicly traded equity securities(d) 86 328 414
BBPP 71 - 71BTC Limited 161 - 161Other equity securities 645 - 645
Total other equity securities(d) 877 - 877Other investments 963 328 1,291
(a) Unrealized gain based on the investment certificate. (b) The Nymex Holdings Inc. securities have been traded during the acquisition process running from June 11 to August 22, 2008 through which
Chicago Mercantile Exchange Group acquired all the Nymex Holdings Inc. securities. (c) Securities acquired in 2008. (d) Including cumulative impairments of €599 million in 2009, €608 million in 2008 and €632 million in 2007.
These investments are classified as "Financial assets available for sale” (see Note 1 paragraph M(ii) to the Consolidated Financial Statements).

Page 38
14) Other non-current assets
Gross Valuation NetAs of December 31, 2009 (€ million) value allowance valueDeferred income tax assets 1,164 - 1,164
Loans and advances(a)1,871 (587) 1,284
Other 633 - 633
Total 3,668 (587) 3,081
Gross Valuation NetAs of December 31, 2008 (€ million) value allowance valueDeferred income tax assets 1,010 - 1,010
Loans and advances(a)1,932 (529) 1,403
Other 631 - 631
Total 3,573 (529) 3,044
Gross Valuation NetAs of December 31, 2007 (€ million) value allowance valueDeferred income tax assets 797 - 797Loans and advances(a)
1,378 (527) 851Other 507 - 507
Total 2,682 (527) 2,155
(a) Excluding loans to equity affiliates.
Changes in the valuation allowance on loans and advances are detailed as follows:
For the year ended December 31,(€ million)
Valuation allowance as of
January 1, Increases Decreases
Currency translation
adjustment and other variations
Valuation allowance as of
December 31,
2009 (529) (19) 29 (68) (587)
2008 (527) (33) 52 (21) (529)
2007 (488) (13) 6 (32) (527)

Page 39
15) Inventories
As of December 31, 2009 (€ million)
Grossvalue Valuation allowance
Net value
Crude oil and natural gas 4,581 - 4,581Refined products 6,647 (18) 6,629Chemicals products 1,234 (113) 1,121Other inventories 1,822 (286) 1,536
Total 14,284 (417) 13,867
As of December 31, 2008 (€ million)
Grossvalue Valuation allowance
Net value
Crude oil and natural gas 2,772 (326) 2,446Refined products 4,954 (416) 4,538Chemicals products 1,419 (105) 1,314Other inventories 1,591 (268) 1,323
Total 10,736 (1,115) 9,621
As of December 31, 2007 (€ million)
Grossvalue Valuation allowance
Net value
Crude oil and natural gas 4,746 - 4,746Refined products 6,874 (11) 6,863Chemicals products 1,188 (91) 1,097Other inventories 1,368 (223) 1,145
Total 14,176 (325) 13,851
Changes in the valuation allowance on inventories are as follows:
For the year ended December 31,(€ million)
Valuation allowance as of January 1, Increase (net)
Currency translation adjustment and other
variationsValuation allowance as of December 31,
2009 (1,115) 700 (2) (417)2008 (325) (740) (50) (1,115)2007 (440) 124 (9) (325)

Page 40
16) Accounts receivable and other current assets
As of December 31, 2009 (€ million)Gross value
Valuation allowance Net
valueAccounts receivable 16,187 (468) 15,719Recoverable taxes 2,156 - 2,156Other operating receivables 5,214 (69) 5,145Deferred income tax 214 - 214Prepaid expenses 638 - 638Other current assets 45 - 45Other current assets 8,267 (69) 8,198
As of December 31, 2008 (€ million)Gross value
Valuation allowance Net
valueAccounts receivable 15,747 (460) 15,287Recoverable taxes 2,510 - 2,510Other operating receivables 6,227 (19) 6,208Deferred income tax 206 - 206Prepaid expenses 650 - 650Other current assets 68 - 68Other current assets 9,661 (19) 9,642
As of December 31, 2007 (€ million)Gross value
Valuation allowance Net
valueAccounts receivable 19,611 (482) 19,129Recoverable taxes 2,735 - 2,735Other operating receivables 4,457 (27) 4,430
Deferred income tax 112 - 112Prepaid expenses 687 - 687Other current assets 42 - 42Other current assets 8,033 (27) 8,006
Changes in the valuation allowance on “Accounts receivable” and “Other current assets” are as follows:
(€ million)
Valuation allowance as of
January 1, Increase (net)
Currency translation adjustments and other
variations
Valuation allowance as of
December 31,Accounts receivable2009 (460) (17) 9 (468)2008 (482) 9 13 (460)2007 (489) (25) 32 (482)
Other current assets2009 (19) (14) (36) (69)2008 (27) 7 1 (19)2007 (39) (4) 16 (27) As of December 31, 2009, the net portion of the overdue receivables included in “Accounts receivable” and “Other current assets” is €3,610 million, of which €2,116 million has expired for less than 90 days, €486 million has expired between 90 days and 6 months, €246 million has expired between 6 and 12 months and €762 million has expired for more than 12 months.
As of December 31, 2008, the net portion of the overdue receivables included in “Accounts receivable” and “Other current assets” was €3,744 million, of which €2,420 million had expired for less than 90 days, €729 million had expired between 90 days and 6 months, €54 million had expired between 6 and 12 months and €541 million had expired for more than 12 months.

Page 41
17) Shareholders’ equity
Number of TOTAL shares
The Company’s common shares, par value €2.50, as of December 31, 2009 are the only category of shares. Shares may be held in either bearer or registered form.
Double voting rights are granted to holders of shares that are fully-paid and held in the name of the same shareholder for at least two years, with due consideration for the total portion of the share capital represented. Double voting rights are also assigned to restricted shares in the event of an increase in share capital by incorporation of reserves, profits or premiums based on shares already held that are entitled to double voting rights.
Pursuant to the Company's bylaws (Statuts), no shareholder may cast a vote at a shareholders' meeting, either by himself or through an agent, representing more than 10% of the total voting rights for the Company's shares. This limit applies to the aggregated amount of voting rights held directly, indirectly or through voting proxies. However, in the case of double voting rights, this limit may be extended to 20%.
These restrictions no longer apply if any individual or entity, acting alone or in concert, acquires at least two-thirds of the total share capital of the Company, directly or indirectly, following a public tender offer for all of the Company’s shares.
The authorized share capital amounts to 3,381,921,458 shares as of December 31, 2009 compared to 3,413,204,025 as of December 31, 2008 and 4,042,585,605 as of December 31, 2007.
As of January 1, 2007 2,425,767,953
Shares issued in connection with: Exercise of TOTAL share subscription options 2,453,832Exchange guarantee offered to the beneficiaries of Elf Aquitaine share subscription options 315,312
Cancellation of shares(a) (33,005,000)As of January 1, 2008 2,395,532,097
Shares issued in connection with: Capital increase reserved for employees 4,870,386Exercise of TOTAL share subscription options 1,178,167Exchange guarantee offered to the beneficiaries of Elf Aquitaine share subscription options 227,424
Cancellation of shares(b) (30,000,000)As of January 1, 2009 2,371,808,074
Shares issued in connection with: Exercise of TOTAL share subscription options 934,780Exchange guarantee offered to the beneficiaries of Elf Aquitaine share subscription options 480,030
Cancellation of shares(c) (24,800,000)
As of December 31, 2009 (d) 2,348,422,884
(a) Decided by the Board of Directors on January 10, 2007.
(b) Decided by the Board of Directors on July 31, 2008.
(c) Decided by the Board of Directors on July 30, 2009.
(d) Including 115,407,190 treasury shares deducted from consolidated shareholders’ equity.
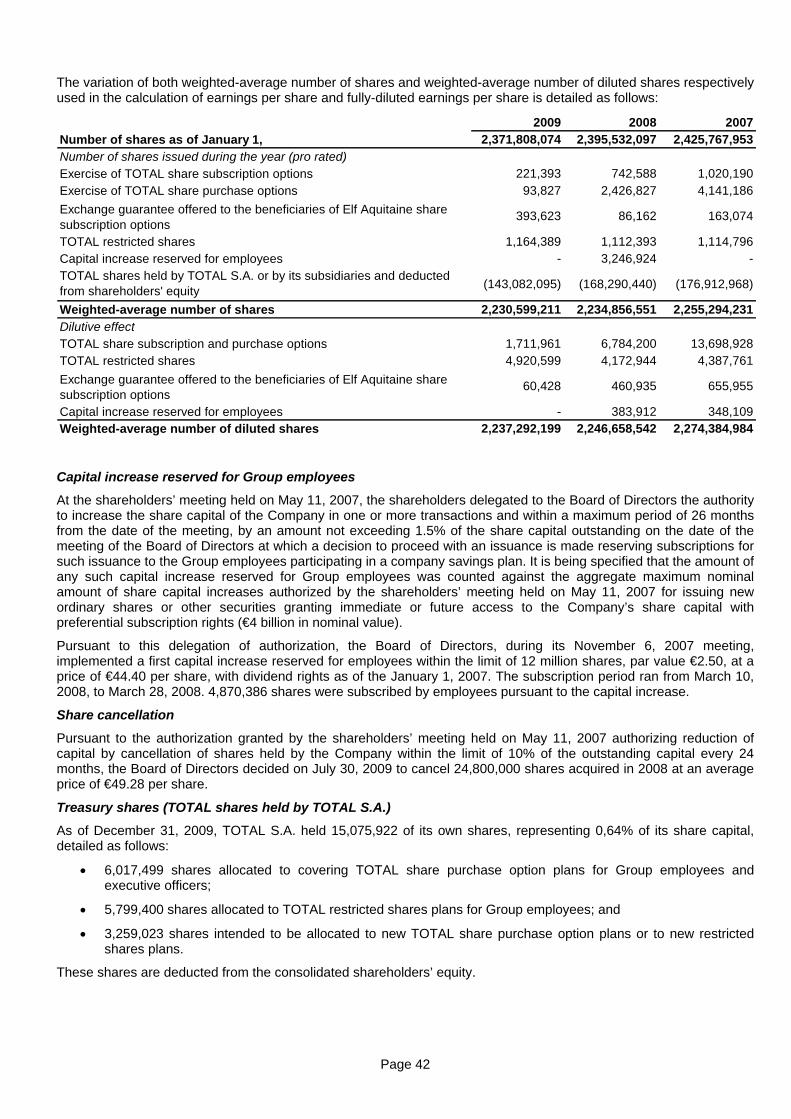
Page 42
The variation of both weighted-average number of shares and weighted-average number of diluted shares respectively used in the calculation of earnings per share and fully-diluted earnings per share is detailed as follows:
2009 2008 20072,371,808,074 2,395,532,097 2,425,767,953
221,393 742,588 1,020,19093,827 2,426,827 4,141,186
393,623 86,162 163,074
1,164,389 1,112,393 1,114,796- 3,246,924 -
(143,082,095) (168,290,440) (176,912,968)
2,230,599,211 2,234,856,551 2,255,294,231
1,711,961 6,784,200 13,698,9284,920,599 4,172,944 4,387,761
60,428 460,935 655,955
- 383,912 348,1092,237,292,199 2,246,658,542 2,274,384,984
Number of shares as of January 1,
Exercise of TOTAL share subscription optionsExercise of TOTAL share purchase options
Number of shares issued during the year (pro rated)
Exchange guarantee offered to the beneficiaries of Elf Aquitaine share subscription optionsTOTAL restricted shares
Weighted-average number of diluted shares
TOTAL share subscription and purchase optionsTOTAL restricted shares
Exchange guarantee offered to the beneficiaries of Elf Aquitaine share subscription optionsCapital increase reserved for employees
Capital increase reserved for employeesTOTAL shares held by TOTAL S.A. or by its subsidiaries and deducted from shareholders' equity
Weighted-average number of sharesDilutive effect
Capital increase reserved for Group employees
At the shareholders’ meeting held on May 11, 2007, the shareholders delegated to the Board of Directors the authority to increase the share capital of the Company in one or more transactions and within a maximum period of 26 months from the date of the meeting, by an amount not exceeding 1.5% of the share capital outstanding on the date of the meeting of the Board of Directors at which a decision to proceed with an issuance is made reserving subscriptions for such issuance to the Group employees participating in a company savings plan. It is being specified that the amount of any such capital increase reserved for Group employees was counted against the aggregate maximum nominal amount of share capital increases authorized by the shareholders’ meeting held on May 11, 2007 for issuing new ordinary shares or other securities granting immediate or future access to the Company’s share capital with preferential subscription rights (€4 billion in nominal value).
Pursuant to this delegation of authorization, the Board of Directors, during its November 6, 2007 meeting, implemented a first capital increase reserved for employees within the limit of 12 million shares, par value €2.50, at a price of €44.40 per share, with dividend rights as of the January 1, 2007. The subscription period ran from March 10, 2008, to March 28, 2008. 4,870,386 shares were subscribed by employees pursuant to the capital increase.
Share cancellation
Pursuant to the authorization granted by the shareholders’ meeting held on May 11, 2007 authorizing reduction of capital by cancellation of shares held by the Company within the limit of 10% of the outstanding capital every 24 months, the Board of Directors decided on July 30, 2009 to cancel 24,800,000 shares acquired in 2008 at an average price of €49.28 per share.
Treasury shares (TOTAL shares held by TOTAL S.A.)
As of December 31, 2009, TOTAL S.A. held 15,075,922 of its own shares, representing 0,64% of its share capital, detailed as follows:
6,017,499 shares allocated to covering TOTAL share purchase option plans for Group employees and executive officers;
5,799,400 shares allocated to TOTAL restricted shares plans for Group employees; and
3,259,023 shares intended to be allocated to new TOTAL share purchase option plans or to new restricted shares plans.
These shares are deducted from the consolidated shareholders’ equity.
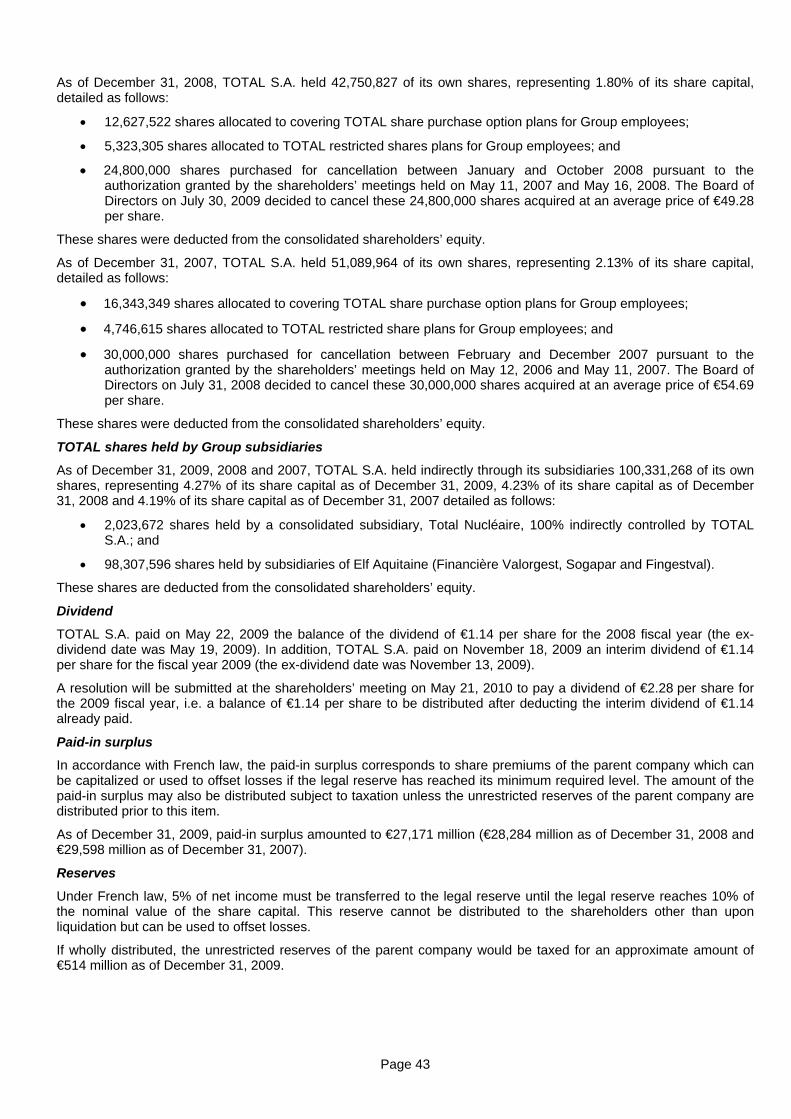
Page 43
As of December 31, 2008, TOTAL S.A. held 42,750,827 of its own shares, representing 1.80% of its share capital, detailed as follows:
12,627,522 shares allocated to covering TOTAL share purchase option plans for Group employees;
5,323,305 shares allocated to TOTAL restricted shares plans for Group employees; and
24,800,000 shares purchased for cancellation between January and October 2008 pursuant to the authorization granted by the shareholders’ meetings held on May 11, 2007 and May 16, 2008. The Board of Directors on July 30, 2009 decided to cancel these 24,800,000 shares acquired at an average price of €49.28 per share.
These shares were deducted from the consolidated shareholders’ equity.
As of December 31, 2007, TOTAL S.A. held 51,089,964 of its own shares, representing 2.13% of its share capital, detailed as follows:
16,343,349 shares allocated to covering TOTAL share purchase option plans for Group employees;
4,746,615 shares allocated to TOTAL restricted share plans for Group employees; and
30,000,000 shares purchased for cancellation between February and December 2007 pursuant to the authorization granted by the shareholders’ meetings held on May 12, 2006 and May 11, 2007. The Board of Directors on July 31, 2008 decided to cancel these 30,000,000 shares acquired at an average price of €54.69 per share.
These shares were deducted from the consolidated shareholders’ equity.
TOTAL shares held by Group subsidiaries
As of December 31, 2009, 2008 and 2007, TOTAL S.A. held indirectly through its subsidiaries 100,331,268 of its own shares, representing 4.27% of its share capital as of December 31, 2009, 4.23% of its share capital as of December 31, 2008 and 4.19% of its share capital as of December 31, 2007 detailed as follows:
2,023,672 shares held by a consolidated subsidiary, Total Nucléaire, 100% indirectly controlled by TOTAL S.A.; and
98,307,596 shares held by subsidiaries of Elf Aquitaine (Financière Valorgest, Sogapar and Fingestval).
These shares are deducted from the consolidated shareholders’ equity.
Dividend
TOTAL S.A. paid on May 22, 2009 the balance of the dividend of €1.14 per share for the 2008 fiscal year (the ex-dividend date was May 19, 2009). In addition, TOTAL S.A. paid on November 18, 2009 an interim dividend of €1.14 per share for the fiscal year 2009 (the ex-dividend date was November 13, 2009).
A resolution will be submitted at the shareholders’ meeting on May 21, 2010 to pay a dividend of €2.28 per share for the 2009 fiscal year, i.e. a balance of €1.14 per share to be distributed after deducting the interim dividend of €1.14 already paid.
Paid-in surplus
In accordance with French law, the paid-in surplus corresponds to share premiums of the parent company which can be capitalized or used to offset losses if the legal reserve has reached its minimum required level. The amount of the paid-in surplus may also be distributed subject to taxation unless the unrestricted reserves of the parent company are distributed prior to this item.
As of December 31, 2009, paid-in surplus amounted to €27,171 million (€28,284 million as of December 31, 2008 and €29,598 million as of December 31, 2007).
Reserves
Under French law, 5% of net income must be transferred to the legal reserve until the legal reserve reaches 10% of the nominal value of the share capital. This reserve cannot be distributed to the shareholders other than upon liquidation but can be used to offset losses.
If wholly distributed, the unrestricted reserves of the parent company would be taxed for an approximate amount of €514 million as of December 31, 2009.

Page 44
Other comprehensive income
Detail of other comprehensive income showing items reclassified from equity to net income is presented in the table below:
For the year ended December 31, (€ million)
Currency translation adjustment (244) (722) (2,703)- Unrealized gain/(loss) of the period (243) (722) (2,703)- Less gain/(loss) included in net income 1 - -
Available for sale financial assets 38 (254) 111- Unrealized gain/(loss) of the period 38 (254) 111- Less gain/(loss) included in net income - - -
Cash flow hedge 128 - -- Unrealized gain/(loss) of the period 349 - -- Less gain/(loss) included in net income 221 - -
Share of other comprehensive income ofequity affiliates, net amount 234 173 (406)
Other (5) 1 (3)- Unrealized gain/(loss) of the period (5) 1 (3)- Less gain/(loss) included in net income - - -
Tax effect (38) 30 (6)
Total other comprehensive income, net amount 113 (772) (3,007)
2009 20072008
Tax effects relating to each component of other comprehensive income are as follows:
For the year ended December 31,
(€ million)Pre-tax amount
Tax effect
Net amount
Pre-tax amount
Tax effect
Net amount
Pre-tax amount
Tax effect
Net amount
Currency translation adjustment (244) (244) (722) (722) (2,703) (2,703)Available for sale financial assets 38 4 42 (254) 30 (224) 111 (6) 105Cash flow hedge 128 (42) 86 - - - -Share of other comprehensive income of equity affiliates, net amount 234 234 173 173 (406) (406)Other (5) (5) 1 1 (3) (3)Total other comprehensive income 151 (38) 113 (802) 30 (772) (3,001) (6) (3,007)
2009 20072008
18) Employee benefits obligations
Liabilities for employee benefits obligations consist of the following:
As of December 31, (€ million) 2009 2008 2007Pension benefits liabilities 1,236 1,187 1,721Other benefits liabilities 592 608 611Restructuring reserves (early retirement plans) 212 216 195Total 2,040 2,011 2,527
The Group’s main defined benefit pension plans are located in France, in the United Kingdom, in the United States, in Belgium and in Germany. Their main characteristics are the following:
The benefits are usually based on the final salary and seniority;
They are usually funded (pension fund or insurer); and
They are closed to new employees who benefit from defined contribution pension plans.
The pension benefits include also termination indemnities and early retirement benefits.
The other benefits are the employer contribution to post-employment medical care.

Page 45
The fair value of the defined benefit obligation and plan assets in the Consolidated Financial Statements is detailed as follows:
Pension benefits Other benefits
As of December 31, (€ million) 2009 2008 2007 2009 2008 2007
Change in benefit obligation
Benefit obligation at beginning of year 7,405 8,129 8,742 544 583 648
Service cost 134 143 160 10 14 12
Interest cost 428 416 396 30 24 28
Curtailments (5) (3) (9) (1) - -Settlements (3) (5) (20) - (4) -
Special termination benefits - - - - - -
Plan participants' contributions 10 12 10 - - -
Benefits paid (484) (463) (448) (33) (37) (40)
Plan amendments 118 12 (70) (2) (12) (2)
Actuarial losses (gains) 446 (248) (384) - (27) (38)
Foreign currency translation and other 120 (588) (248) (1) 3 (25)
Benefit obligation at year-end 8,169 7,405 8,129 547 544 583
Change in fair value of plan assets
Fair value of plan assets at beginning of year (5,764) (6,604) (6,401) - - -
Expected return on plan assets (343) (402) (387) - - -
Actuarial losses (gains) (317) 1,099 140 - - -
Settlements 2 2 8 - - -
Plan participants' contributions (10) (12) (10) - - -Employer contributions (a) (126) (855) (556) - - -
Benefits paid 396 375 349 - - -
Foreign currency translation and other (124) 633 253 - - -
Fair value of plan assets at year-end (6,286) (5,764) (6,604) - - -
Unfunded status 1,883 1,641 1,525 547 544 583
Unrecognized prior service cost (153) (48) (49) 15 21 18
Unrecognized actuarial (losses) gains (1,045) (953) (160) 30 43 10
Asset ceiling 9 5 5 - - -
Net recognized amount 694 645 1,321 592 608 611
Pension benefits and other benefits liabilities 1,236 1,187 1,721 592 608 611
Other non-current assets (542) (542) (400) - - -
(a) In 2008, the Group covered certain employee pension benefit plans through insurance companies for an amount of €757 million.
As of December 31, 2009, the fair value of pension benefits and other pension benefits which are entirely or partially funded amounted to €7,206 million and the present value of the unfunded benefits amounted to €1,510 million (against €6,515 million and €1,434 million respectively as of December 31, 2008 and €7,175 million and €1,537 million respectively as of December 31, 2007).
The experience actuarial gains (losses) related to the defined benefit obligation and the fair value of plan assets are as follows:
For the year ended December 31, (€ million) 2009 2008 2007Experience actuarial gains (losses) related to the defined benefit obligation 108 (12) (80)Experience actuarial gains (losses) related to the fair value of plan assets 317 (1,099) (140)

Page 46
As of December 31, (€ million) 2009 2008 2007 2006 2005Pension benefitsBenefit obligation 8,169 7,405 8,129 8,742 9,647Fair value of plan assets (6,286) (5,764) (6,604) (6,401) (6,274)Unfunded status 1,883 1,641 1,525 2,341 3,373
Other benefitsBenefits obligation 547 544 583 648 774Fair value of plan assets - - - - -Unfunded status 547 544 583 648 774
The Group expects to contribute €152 million to its pension plans in 2010.
Estimated future payments(€ mil lion)201020112012201320142015-2019
Pension benefits Other benefits
489 35
2,508 195474 37
468 36
472 36481 36
Asset allocationAs of December 31, 2009 2008 2007Equity securities 31% 25% 36%Debt securities 62% 56% 56%Monetary 3% 16% 4%Real estate 4% 3% 4%
Pension benefits
The Group’s assumptions of expected returns on assets are built up by asset class and by country based on long-term bond yields and risk premiums.
The discount rate retained corresponds to the rate of prime corporate bonds according to a benchmark per country of different market data on the closing date.
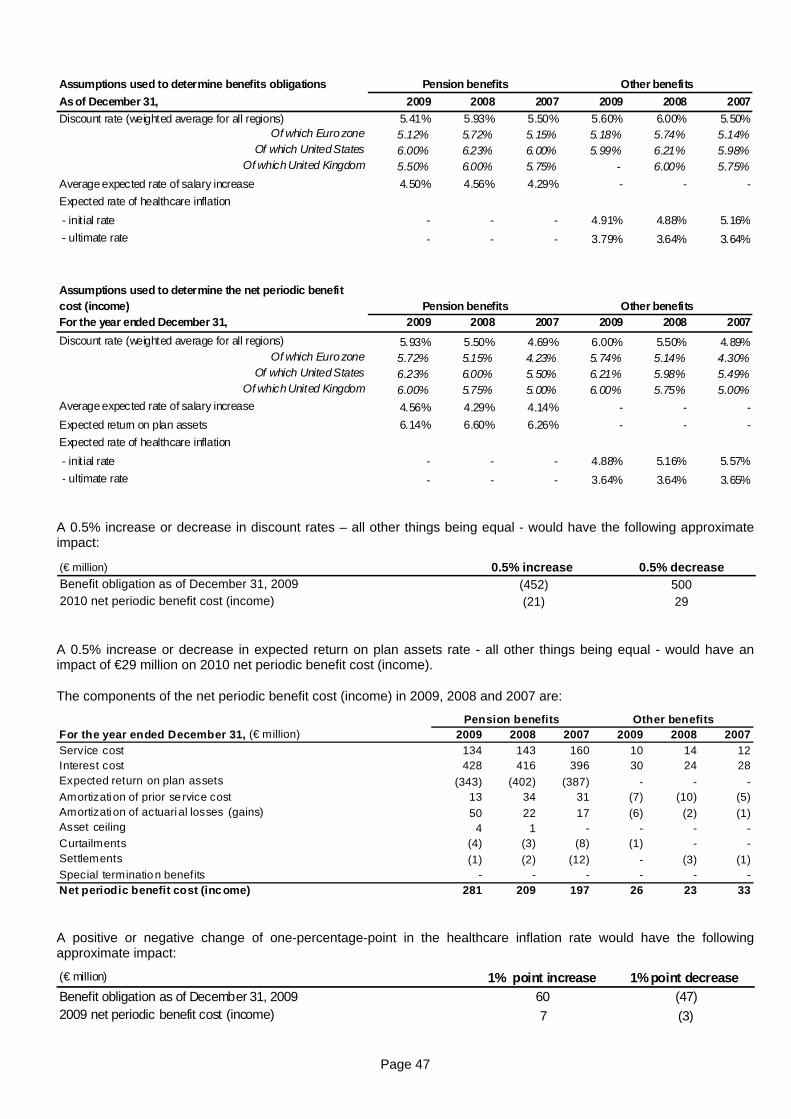
Page 47
Assumptions used to determine benefits obligations
As of December 31, 2009 2008 2007 2009 2008 2007
Discount rate (weighted average for all regions) 5.41% 5.93% 5.50% 5.60% 6.00% 5.50%Of which Euro zone 5.12% 5.72% 5.15% 5.18% 5.74% 5.14%
Of which United States 6.00% 6.23% 6.00% 5.99% 6.21% 5.98%Of which United Kingdom 5.50% 6.00% 5.75% - 6.00% 5.75%
Average expected rate of salary increase 4.50% 4.56% 4.29% - - -
Expected rate of healthcare inflation
- initial rate - - - 4.91% 4.88% 5.16%
- ultimate rate - - - 3.79% 3.64% 3.64%
Assumptions used to determine the net periodic benefit cost (income)For the year ended December 31, 2009 2008 2007 2009 2008 2007
Discount rate (weighted average for all regions) 5.93% 5.50% 4.69% 6.00% 5.50% 4.89%Of which Euro zone 5.72% 5.15% 4.23% 5.74% 5.14% 4.30%
Of which United States 6.23% 6.00% 5.50% 6.21% 5.98% 5.49%Of which United Kingdom 6.00% 5.75% 5.00% 6.00% 5.75% 5.00%
Average expected rate of salary increase 4.56% 4.29% 4.14% - - -
Expected return on plan assets 6.14% 6.60% 6.26% - - -
Expected rate of healthcare inflation
- initial rate - - - 4.88% 5.16% 5.57%
- ultimate rate - - - 3.64% 3.64% 3.65%
Other benefitsPension benefits
Pension benefits Other benefits
A 0.5% increase or decrease in discount rates – all other things being equal - would have the following approximate impact:
(€ million) 0.5% increase 0.5% decreaseBenefit obligation as of December 31, 2009 (452) 5002010 net periodic benefit cost (income) (21) 29
A 0.5% increase or decrease in expected return on plan assets rate - all other things being equal - would have an impact of €29 million on 2010 net periodic benefit cost (income).
The components of the net periodic benefit cost (income) in 2009, 2008 and 2007 are:
For the year ended December 31, (€ million) 2009 2008 2007 2009 2008 2007
Service cost 134 143 160 10 14 12Interest cost 428 416 396 30 24 28Expected return on plan assets (343) (402) (387) - - -Amortization of prior se rvice cost 13 34 31 (7) (10) (5)Amortization of actuarial losses (gains) 50 22 17 (6) (2) (1)Asset ceiling 4 1 - - - -Curtailments (4) (3) (8) (1) - -Settlements (1) (2) (12) - (3) (1)Special termination benefits - - - - - -Net periodic benefit cost (inc ome) 281 209 197 26 23 33
Other benefitsPension benefits
A positive or negative change of one-percentage-point in the healthcare inflation rate would have the following approximate impact:
(€ million) 1% point increase 1% point decrease
Benefit obligation as of December 31, 2009 60 (47)2009 net periodic benefit cost (income) 7 (3)

Page 48
19) Provisions and other non-current liabilities
As of December 31, (€ million) 2009 2008 2007Litigations and accrued penalty claims 423 546 601Provisions for environmental contingencies 623 558 552Asset retirement obligations 5,469 4,500 4,206Other non-current provisions 1,331 1,804 1,188Other non-current liabilities 1,535 450 296Total 9,381 7,858 6,843
In 2009, litigation reserves mainly include a provision covering risks concerning antitrust investigations related to Arkema amounting to €43 million as of December 31, 2009. Other risks and commitments that give rise to contingent liabilities are described in Note 32 to the Consolidated Financial Statements.
In 2009, other non current provisions mainly include :
The contingency reserve related to the Toulouse-AZF plant explosion (civil liability) for €40 million as of December 31, 2009;
Provisions related to restructuring activities in the Downstream and Chemicals segments for €130 million as of December 31, 2009; and
The contingency reserve related to the Buncefield depot explosion (civil liability) for €295 million as of December 31, 2009.
In 2009, other non current liabilities mainly include debts (whose maturity is more than one year) related to fixed assets acquisitions. This heading is mainly composed of a €818 million debt related to Chesapeake acquisition (see Note 3 to the Consolidated Financial Statements).
In 2008, litigation reserves mainly included a provision covering risks concerning antitrust investigations related to Arkema amounting to €85 million as of December 31, 2008. Other risks and commitments that give rise to contingent liabilities are described in Note 32 to the Consolidated Financial Statements.
In 2008, other non current provisions mainly included the contingency reserve related to the Toulouse-AZF plant explosion (civil liability) for €256 million as of December 31, 2008.
In 2007, litigation reserves mainly included a provision covering risks concerning antitrust investigations related to Arkema amounting to €138 million as of December 31, 2007. Other risks and commitments that give rise to contingent liabilities are described in Note 32 to the Consolidated Financial Statements.
In 2007, other non-current provisions mainly included:
The contingency reserve related to the Toulouse-AZF plant explosion (civil liability) for €134 million as of December 31, 2007; and
Provisions related to restructuring activities in the Chemicals segment for €49 million as of December 31, 2007.
Changes in provisions and other non-current liabilities
(€ million) As of January 1, Allowances Reversals
Currency translation
adjustment Other As of December 31,2009 7,858 1,254 (1,413) 202 1,480 9,3812008 6,843 1,424 (864) (460) 915 7,8582007 6,467 747 (927) (303) 859 6,843

Page 49
Allowances
In 2009, allowances of the period (€1,254 million) mainly include:
Asset retirement obligations for €283 million (accretion);
Environmental contingencies for €147 million in the Downstream and Chemicals segments;
The contingency reserve related to the Buncefield depot explosion (civil liability) for €223 million; and
Provisions related to restructuring of activities for €121 million.
In 2008, allowances of the period (€1,424 million) mainly included:
Asset retirement obligations for €229 million (accretion);
The contingency reserve related to the Toulouse-AZF plant explosion (civil liability) for €140 million;
Environmental contingencies for €89 million;
An allowance of €48 million for litigation reserves in connection with antitrust investigations, as described in Note 32 to the Consolidated Financial Statements "Other risks and contingent liabilities"; and
Provisions related to restructuring of activities for €27 million.
In 2007, allowances of the period (€747 million) mainly included:
Provisions for asset retirement obligations for €189 million (accretion);
An allowance of €100 million for litigation reserves in connection with antitrust investigations, as described in Note 32 to the Consolidated Financial Statements "Other risks and contingent liabilities";
Environmental contingencies in the Chemicals segment for €23 million; and
Provisions related to restructuring of activities for €15 million.
Reversals
In 2009, reversals of the period (€1,413 million) mainly relate to the following incurred expenses:
Provisions for asset retirement obligations for €191 million;
€52 million for litigation reserves in connection with antitrust investigations;
Environmental contingencies written back for €86 million;
The contingency reserve related to the Toulouse-AZF plant explosion (civil liability), written back for €216 million;
The contingency reserve related to the Buncefield depot explosion (civil liability), written back for €375 million; and
Provisions for restructuring and social plans written back for €28 million.
In 2008, reversals of the period (€864 million) were mainly related to the following incurred expenses:
Provisions for asset retirement obligations for €280 million;
€163 million for litigation reserves in connection with antitrust investigations;
Environmental contingencies written back for €96 million;
The contingency reserve related to the Toulouse-AZF plant explosion (civil liability), written back for €18 million; and
Provisions for restructuring and social plans written back for €10 million.
In 2007, reversals of the period (€927 million) were mainly related to the following incurred expenses:
Provisions for asset retirement obligations for €209 million;
Environmental contingencies in the Chemicals segment written back for €52 million;
The contingency reserve related to the Toulouse-AZF plant explosion (civil liability), written back for €42 million; and
Provisions for restructuring and social plans written back for €37 million.

Page 50
Changes in the asset retirement obligation
(€ million)
As of January 1, Accretion
Revision in estimates
New obligations
Spending on existing
obligations
Currency translation adjustment Other
As of December 31,
2009 4,500 283 447 179 (191) 232 19 5,4692008 4,206 229 563 188 (280) (414) 8 4,5002007 3,893 189 203 371 (209) (206) (35) 4,206
20) Financial debt and related financial instruments
A) Non-current financial debt and related financial instruments
As of December 31, 2009 (€ million)(Assets) / Liabilities Secured Unsecured TotalNon-current financial debt 312 19,125 19,437of which hedging instruments of non-current financial debt (liabilities) - 241 241
Hedging instruments of non-current financial debt (assets) (a)- (1,025) (1,025)
Non-current financial debt - net of hedging instruments 312 18,100 18,412
Bonds, net of hedging instruments - 17,584 17,584Bank and other, floating rate 60 379 439Bank and other, fixed rate 50 79 129Financial lease obligations 202 58 260Non-current financial debt - net of hedging instruments 312 18,100 18,412
As of December 31, 2008 (€ million)(Assets) / Liabilities Secured Unsecured TotalNon-current financial debt 895 15,296 16,191of which hedging instruments of non-current financial debt (liabilities) - 440 440
Hedging instruments of non-current financial debt (assets) (a)- (892) (892)
Non-current financial debt - net of hedging instruments 895 14,404 15,299
Bonds, net of hedging instruments - 13,667 13,667Bank and other, floating rate 553 665 1,218Bank and other, fixed rate 140 6 146Financial lease obligations 202 66 268Non-current financial debt - net of hedging instruments 895 14,404 15,299
As of December 31, 2007 (€ million)(Assets) / Liabilities Secured Unsecured Total
Non-current financial debt 772 14,104 14,876of which hedging instruments of non-current financial debt (l iabilities) - 369 369Hedging instruments of non-current financial debt (assets) (a)
- (460) (460)Non-current financial debt - net of hedging instruments 772 13,644 14,416
Bonds, net of hedging instruments - 11,650 11,650Bank and other, floating rate 453 1,781 2,234Bank and other, fixed rate 2 213 215Financial lease obligations 317 - 317Non-current financial debt - net of hedging instruments 772 13,644 14,416 (a) See the description of these hedging instruments in Notes 1 paragraph M(iii) “Long-term financing”, 28 and 29 to the Consolidated Financial Statements.

Page 51
Fair value of bonds, as of December 31, 2009, after taking into account currency and interest rates swaps, is detailed as follows:
(€ million)
Year of issue
Fair value after hedging as of December 31,
2009
Fair value after hedging as of December 31,
2008
Fair value after hedging as of December 31,
2007
Currency MaturityInitial rate before hedging
instruments
Parent companyBond 1996 - - 324 FRF 2008 6.750%Bond 1997 - 124 118 FRF 2009 6.200%Bond 1998 - - 26 FRF 2008 Pibor 3 months + 0.380%Bond 1998 - 119 113 FRF 2009 5.125%Bond 1998 116 121 114 FRF 2013 5.000%Bond 2000 61 63 60 EUR 2010 5.650%Current portion (less than one year) (61) (243) (349)Total parent company 116 184 406Elf Aquitaine SABond 1999 - 1,003 998 EUR 2009 4.500%Current portion (less than one year) - (1,003) -Total Elf Aquitaine SA - - 998
TOTAL CAPITAL(a)
Bond 2002 14 14 14 USD 2012 5.890%Bond 2003 - - 39 AUD 2008 5.000%Bond 2003 - - 41 AUD 2008 5.000%Bond 2003 - - 44 CAD 2008 4.250%Bond 2003 - - 148 CHF 2008 2.010%Bond 2003 - - 98 CHF 2008 2.010%Bond 2003 - - 360 EUR 2008 3.500%Bond 2003 - - 72 EUR 2008 3.500%Bond 2003 - - 113 EUR 2008 3.500%Bond 2003 - - 170 USD 2008 3.250%Bond 2003 - 52 49 AUD 2009 6.250%Bond 2003 - 154 145 CHF 2009 2.385%Bond 2003 160 166 157 CHF 2010 2.385%Bond 2003 21 22 20 USD 2013 4.500%Bond 2003-2004 - 395 373 USD 2009 3.500%Bond 2004 - - 34 USD 2008 3.250%Bond 2004 - - 34 USD 2008 3.250%Bond 2004 - - 68 USD 2008 3.250%Bond 2004 - 57 54 AUD 2009 6.000%Bond 2004 - 28 26 AUD 2009 6.000%Bond 2004 53 55 52 CAD 2010 4.000%Bond 2004 113 117 110 CHF 2010 2.385%Bond 2004 438 454 429 EUR 2010 3.750%Bond 2004 322 334 316 GBP 2010 4.875%Bond 2004 128 132 125 GBP 2010 4.875%Bond 2004 185 191 181 GBP 2010 4.875%Bond 2004 53 55 52 AUD 2011 5.750%Bond 2004 107 111 105 CAD 2011 4.875%Bond 2004 203 216 204 USD 2011 4.125%Bond 2004 69 72 68 USD 2011 4.125%Bond 2004 116 120 114 CHF 2012 2.375%Bond 2004 47 49 46 NZD 2014 6.750%Bond 2005 - 36 34 USD 2009 3.500%Bond 2005 53 55 52 AUD 2011 5.750%Bond 2005 56 58 55 CAD 2011 4.000%Bond 2005 112 116 109 CHF 2011 1.625%Bond 2005 226 226 226 CHF 2011 1.625%Bond 2005 144 144 136 USD 2011 4.125%Bond 2005 63 63 63 AUD 2012 5.750%Bond 2005 180 187 177 CHF 2012 2.135%Bond 2005 65 65 65 CHF 2012 2.135%Bond 2005 97 98 97 CHF 2012 2.375%Bond 2005 363 376 356 EUR 2012 3.250%Bond 2005 292 287 286 GBP 2012 4.625%Bond 2005 57 57 57 NZD 2012 6.500%Bond 2006 75 75 75 GBP 2010 4.875%Bond 2006 50 50 50 EUR 2010 3.750%Bond 2006 50 50 50 EUR 2010 3.750%Bond 2006 100 102 100 EUR 2010 3.750%
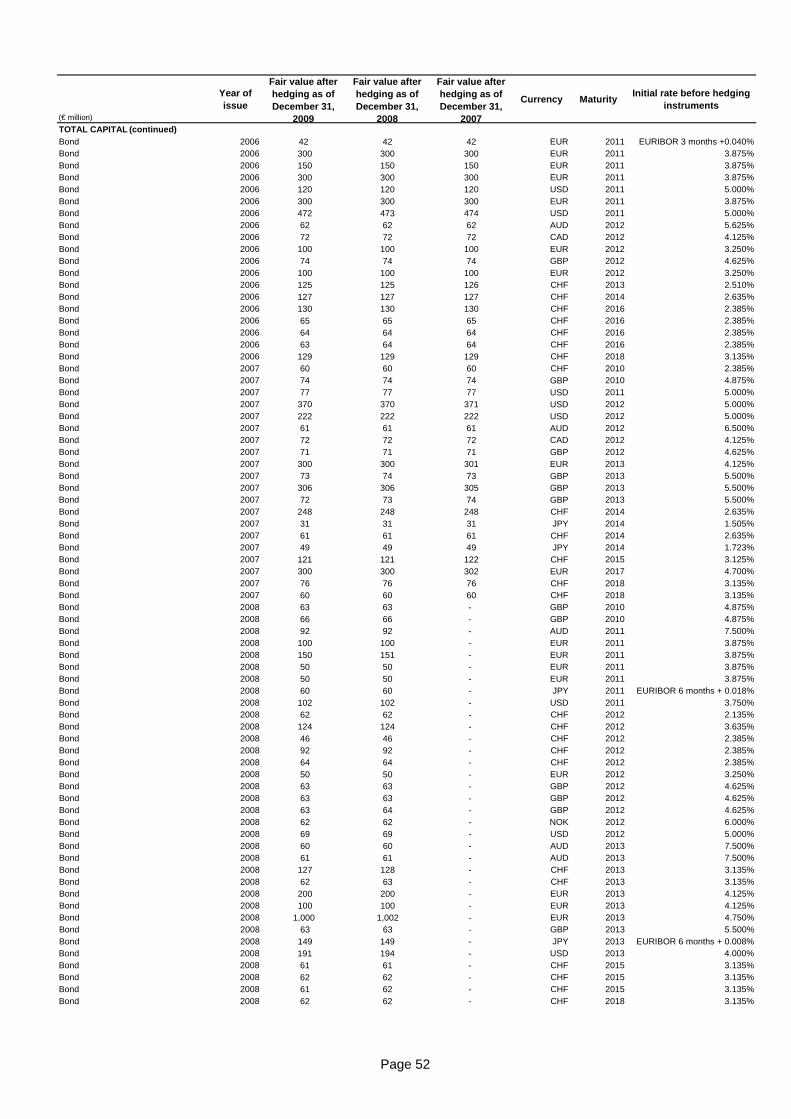
Page 52
(€ million)
Year of issue
Fair value after hedging as of December 31,
2009
Fair value after hedging as of December 31,
2008
Fair value after hedging as of December 31,
2007
Currency MaturityInitial rate before hedging
instruments
TOTAL CAPITAL (continued)
Bond 2006 42 42 42 EUR 2011 EURIBOR 3 months +0.040%Bond 2006 300 300 300 EUR 2011 3.875%Bond 2006 150 150 150 EUR 2011 3.875%Bond 2006 300 300 300 EUR 2011 3.875%Bond 2006 120 120 120 USD 2011 5.000%Bond 2006 300 300 300 EUR 2011 3.875%Bond 2006 472 473 474 USD 2011 5.000%Bond 2006 62 62 62 AUD 2012 5.625%Bond 2006 72 72 72 CAD 2012 4.125%Bond 2006 100 100 100 EUR 2012 3.250%Bond 2006 74 74 74 GBP 2012 4.625%Bond 2006 100 100 100 EUR 2012 3.250%Bond 2006 125 125 126 CHF 2013 2.510%Bond 2006 127 127 127 CHF 2014 2.635%Bond 2006 130 130 130 CHF 2016 2.385%Bond 2006 65 65 65 CHF 2016 2.385%Bond 2006 64 64 64 CHF 2016 2.385%Bond 2006 63 64 64 CHF 2016 2.385%Bond 2006 129 129 129 CHF 2018 3.135%Bond 2007 60 60 60 CHF 2010 2.385%Bond 2007 74 74 74 GBP 2010 4.875%Bond 2007 77 77 77 USD 2011 5.000%Bond 2007 370 370 371 USD 2012 5.000%Bond 2007 222 222 222 USD 2012 5.000%Bond 2007 61 61 61 AUD 2012 6.500%Bond 2007 72 72 72 CAD 2012 4.125%Bond 2007 71 71 71 GBP 2012 4.625%Bond 2007 300 300 301 EUR 2013 4.125%Bond 2007 73 74 73 GBP 2013 5.500%Bond 2007 306 306 305 GBP 2013 5.500%Bond 2007 72 73 74 GBP 2013 5.500%Bond 2007 248 248 248 CHF 2014 2.635%Bond 2007 31 31 31 JPY 2014 1.505%Bond 2007 61 61 61 CHF 2014 2.635%Bond 2007 49 49 49 JPY 2014 1.723%Bond 2007 121 121 122 CHF 2015 3.125%Bond 2007 300 300 302 EUR 2017 4.700%Bond 2007 76 76 76 CHF 2018 3.135%Bond 2007 60 60 60 CHF 2018 3.135%Bond 2008 63 63 - GBP 2010 4.875%Bond 2008 66 66 - GBP 2010 4.875%Bond 2008 92 92 - AUD 2011 7.500%Bond 2008 100 100 - EUR 2011 3.875%Bond 2008 150 151 - EUR 2011 3.875%Bond 2008 50 50 - EUR 2011 3.875%Bond 2008 50 50 - EUR 2011 3.875%Bond 2008 60 60 - JPY 2011 EURIBOR 6 months + 0.018%Bond 2008 102 102 - USD 2011 3.750%Bond 2008 62 62 - CHF 2012 2.135%Bond 2008 124 124 - CHF 2012 3.635%Bond 2008 46 46 - CHF 2012 2.385%Bond 2008 92 92 - CHF 2012 2.385%Bond 2008 64 64 - CHF 2012 2.385%Bond 2008 50 50 - EUR 2012 3.250%Bond 2008 63 63 - GBP 2012 4.625%Bond 2008 63 63 - GBP 2012 4.625%Bond 2008 63 64 - GBP 2012 4.625%Bond 2008 62 62 - NOK 2012 6.000%Bond 2008 69 69 - USD 2012 5.000%Bond 2008 60 60 - AUD 2013 7.500%Bond 2008 61 61 - AUD 2013 7.500%Bond 2008 127 128 - CHF 2013 3.135%Bond 2008 62 63 - CHF 2013 3.135%Bond 2008 200 200 - EUR 2013 4.125%Bond 2008 100 100 - EUR 2013 4.125%Bond 2008 1,000 1,002 - EUR 2013 4.750%Bond 2008 63 63 - GBP 2013 5.500%Bond 2008 149 149 - JPY 2013 EURIBOR 6 months + 0.008%Bond 2008 191 194 - USD 2013 4.000%Bond 2008 61 61 - CHF 2015 3.135%Bond 2008 62 62 - CHF 2015 3.135%Bond 2008 61 62 - CHF 2015 3.135%Bond 2008 62 62 - CHF 2018 3.135%

Page 53
(€ million)
Year of issue
Fair value after hedging as of December 31,
2009
Fair value after hedging as of December 31,
2008
Fair value after hedging as of December 31,
2007
Currency MaturityInitial rate before hedging
instruments
TOTAL CAPITAL (continued)
Bond 2009 56 - - AUD 2013 5.500%Bond 2009 54 - - AUD 2013 5.500%Bond 2009 236 - - CHF 2013 2.500%Bond 2009 77 - - USD 2013 4.000%Bond 2009 131 - - CHF 2014 2.625%Bond 2009 998 - - EUR 2014 3.500%Bond 2009 150 - - EUR 2014 3.500%Bond 2009 40 - - HKD 2014 3.240%Bond 2009 96 - - AUD 2015 6.000%Bond 2009 550 - - EUR 2015 3.625%Bond 2009 684 - - USD 2015 3.125%Bond 2009 208 - - USD 2015 3.125%Bond 2009 99 - - CHF 2016 2.385%Bond 2009 115 - - GBP 2017 4.250%Bond 2009 225 - - GBP 2017 4.250%Bond 2009 448 - - EUR 2019 4.875%Bond 2009 602 - - EUR 2019 4.875%Bond 2009 69 - - HKD 2019 4.180%Bond 2009 347 - - USD 2021 4.250%Bond 2009 806 - - EUR 2024 5.125%Current portion (less than one year) (1,937) (722) (1,222)
Total TOTAL CAPITAL(a) 17,315 13,380 10,136
Other consolidated subsidiaries 153 103 110Total 17,584 13,667 11,650
(a) TOTAL CAPITAL is a wholly-owned indirect subsidiary of TOTAL S.A. (with the exception of one share held by each member of its Board of Directors). It acts as a financing
vehicle for the Group. Its debt securities are fully and unconditionally guaranteed by TOTAL S.A. as to payment of principal, premium, if any, interest and any other amounts
due.

Page 54
Loan repayment schedule (excluding current portion)
As of December 31, 2009(€ million)
Non-current financial debt
of which hedging instruments of non-
current financial debt (liabilities)
Hedging instruments of non-current financial debt
(assets)
Non-current financial debt - net of hedging
instruments %
2011 3,857 42 ( 199) 3,658 20%2012 3,468 48 ( 191) 3,277 18%2013 3,781 95 ( 236) 3,545 19%2014 2,199 6 ( 90) 2,109 11%2015 and beyond 6,132 50 ( 309) 5,823 32%Total 19,437 241 (1 025) 18,412 100%
As of December 31, 2008(€ million)
Non-current financial debt
of which hedging instruments of non-
current financial debt (liabilities)
Hedging instruments of non-current financial debt
(assets)
Non-current financial debt - net of hedging
instruments %
2010 3,160 170 ( 168) 2,992 20%2011 3,803 24 ( 145) 3,658 24%2012 3,503 115 ( 179) 3,324 22%2013 3,430 127 ( 198) 3,232 21%2014 and beyond 2,295 4 ( 202) 2,093 13%Total 16,191 440 ( 892) 15,299 100%
As of December 31, 2007(€ million)
Non-current financial debt
of which hedging instruments of non-
current financial debt (liabilities)
Hedging instruments of non-current financial debt
(assets)
Non-current financial debt - net of hedging
instruments %
2009 2,137 6 ( 114) 2,023 14%2010 2,767 16 ( 207) 2,560 18%2011 3,419 123 ( 65) 3,354 23%2012 3,517 90 ( 30) 3,487 24%2013 and beyond 3,036 134 ( 44) 2,992 21%Total 14,876 369 ( 460) 14,416 100%
Analysis by currency and interest rate
These analyses take into account interest rate and foreign currency swaps to hedge non-current financial debt.
As of December 31, (€ million) 2009 % 2008 % 2007 %U.S. Dollar 3,962 21% 3,990 26% 4,700 33%
Euro 14,110 77% 10,685 70% 8,067 56%Other currencies 340 2% 624 4% 1,649 11%Total 18,412 100% 15,299 100% 14,416 100%
As of December 31, (€ million) 2009 % 2008 % 2007 %
Fixed rate 2,064 11% 633 4% 893 6%Floating rate 16,348 89% 14,666 96% 13,523 94%Total 18,412 100% 15,299 100% 14,416 100%

Page 55
B) Current financial assets and liabilities
Current borrowings consist mainly of commercial papers or treasury bills or draws on bank loans. These instruments bear interest at rates that are close to market rates.
As of December 31, (€ million)
(Assets) / Liabilities 2009 2008 2007
Current financial debt 4,761 5,586 2,530Current portion of non-current financial debt 2,233 2,136 2,083Current borrowings 6,994 7,722 4,613
Current portion of hedging instruments of debt (liabilities) 97 12 1
Other current financial instruments (liabilities) 26 146 59Other current financial liabilities (note 28) 123 158 60
Current deposits beyond three months (55) (1) (850)Current portion of hedging instruments of debt (assets) (197) (100) (388)
Other current financial instruments (assets) (59) (86) (26)Current financial assets (note 28) (311) (187) (1,264)Current borrowings and related financial assets and liabilities, net 6,806 7,693 3,409
C) Net-debt-to-equity ratio
For its internal and external communication needs, the Group calculates a debt ratio by dividing its net financial debt by equity. Shareholders’ equity as of December 31, 2009 is calculated after distribution of a dividend of €2.28 per share of which €1.14 per share was paid on November 19, 2009.
The net-debt-to-equity ratio is calculated as follows:
As of December 31, (€ million)
(Assets) / Liabilities 2009 2008 2007Current borrowings 6,994 7,722 4,613Other current financial liabilities 123 158 60Current financial assets (311) (187) (1,264)Non-current financial debt 19,437 16,191 14,876Hedging instruments on non-current financial debt (1,025) (892) (460)Cash and cash equivalents (11,662) (12,321) (5,988)Net financial debt 13,556 10,671 11,837Shareholders' equity - Group share 52,552 48,992 44,858Estimated dividend payable (2,546) (2,540) (2,397)Minority interest 987 958 842Total shareholder's equity 50,993 47,410 43,303
Net-debt-to-equity ratio 26.6% 22.5% 27.3%
21) Other creditors and accrued liabilities
As of December 31, (€ million) 2009 2008 2007
Accruals and deferred income 223 151 137
Payable to States (including taxes and duties) 6,024 6,256 7,860Payroll 955 928 909Other operating liabilities 4,706 4,297 3,900
Total 11,908 11,632 12,806
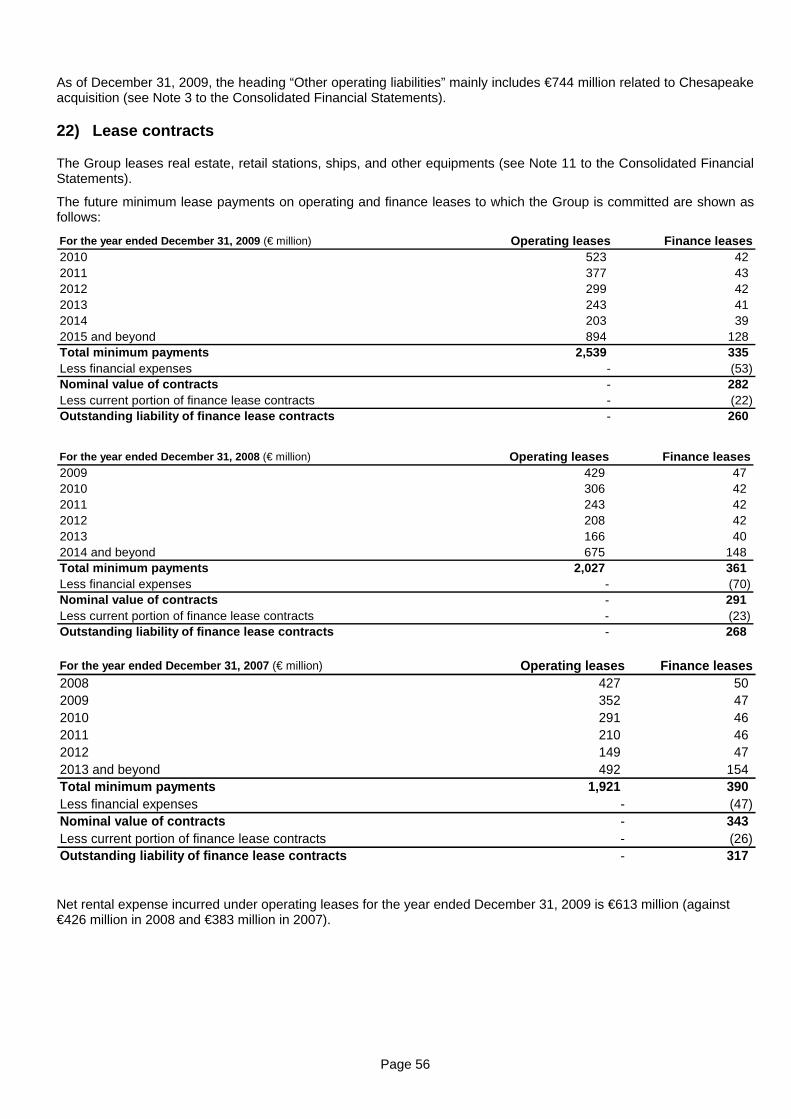
Page 56
As of December 31, 2009, the heading “Other operating liabilities” mainly includes €744 million related to Chesapeake acquisition (see Note 3 to the Consolidated Financial Statements).
22) Lease contracts
The Group leases real estate, retail stations, ships, and other equipments (see Note 11 to the Consolidated Financial Statements).
The future minimum lease payments on operating and finance leases to which the Group is committed are shown as follows:
For the year ended December 31, 2009 (€ million) Operating leases Finance leases2010 523 422011 377 432012 299 422013 243 412014 203 392015 and beyond 894 128Total minimum payments 2,539 335Less financial expenses - (53)Nominal value of contracts - 282Less current portion of finance lease contracts - (22)Outstanding liability of finance lease contracts - 260
For the year ended December 31, 2008 (€ million) Operating leases Finance leases2009 429 472010 306 422011 243 422012 208 422013 166 402014 and beyond 675 148Total minimum payments 2,027 361Less financial expenses - (70)Nominal value of contracts - 291Less current portion of finance lease contracts - (23)Outstanding liability of finance lease contracts - 268
For the year ended December 31, 2007 (€ million) Operating leases Finance leases2008 427 502009 352 472010 291 462011 210 462012 149 472013 and beyond 492 154Total minimum payments 1,921 390Less financial expenses - (47)Nominal value of contracts - 343Less current portion of finance lease contracts - (26)Outstanding liability of finance lease contracts - 317
Net rental expense incurred under operating leases for the year ended December 31, 2009 is €613 million (against €426 million in 2008 and €383 million in 2007).

Page 57
23) Commitments and contingencies
As of December 31, 2009 (€ million)Total
Less than 1 year
Between 1 and 5 years
More than 5 years
Non-current debt obligations net of hedging instruments (Note 20) 18,152 - 12,443 5,709 Current portion of non-current debt obligations net of hedging instruments (Note 20) 2,111 2,111 - -
Finance lease obligations (Note 22) 282 22 146 114 Asset retirement obligations (Note 19) 5,469 235 972 4,262 Contractual obligations recorded in the balance sheet 26,014 2,368 13,561 10,085
Operating lease obligations (Note 22) 2,539 523 1,122 894
Purchase obligations 49,808 4,542 9,919 35,347 Contractual obligations not recorded in the balance sheet 52,347 5,065 11,041 36,241
Total of contractual obligations 78,361 7,433 24,602 46,326
Guarantees given for excise taxes 1,765 1,617 69 79 Guarantees given against borrowings 2,882 1,383 709 790
Indemnities related to sales of businesses 36 - 1 35 Guarantees of current liabilities 203 160 38 5 Guarantees to customers / suppl iers 2,770 1,917 70 783
Letters of credit 1,499 1,485 2 12 Other operating commitments 765 582 103 80
Total of other commitments given 9,920 7,144 992 1,784
Mortgages and liens received 330 5 106 219 Other commitments received 5,637 3,187 481 1,969 Total of commitments received 5,967 3,192 587 2,188
Maturity and installments
As of December 31, 2008 (€ million)Total Less than 1
yearBetween 1 and 5 years
More than 5 years
Non-current debt obligations net of hedging instruments (Note 20) 15,031 - 13,064 1,967 Current portion of non-current debt obligations net of hedging instruments (Note 20) 2,025 2,025 - -
Finance lease obligations (Note 22) 291 23 142 126 Asset retirement obligations (Note 19) 4,500 154 653 3,693 Contractual obligations recorded in the balance sheet 21,847 2,202 13,859 5,786
Operating lease obligations (Note 22) 2,027 429 923 675
Purchase obligations 60,226 4,420 13,127 42,679 Contractual obligations not recorded in the balance sheet 62,253 4,849 14,050 43,354
Total of contractual obligations 84,100 7,051 27,909 49,140
Guarantees given for excise taxes 1,720 1,590 58 72 Guarantees given against borrowings 2,870 1,119 519 1,232
Indemnities related to sales of businesses 39 3 1 35 Guarantees of current liabilities 315 119 164 32 Guarantees to customers / suppl iers 2,866 68 148 2,650
Letters of credit 1,080 1,024 17 39 Other operating commitments 648 246 132 270
Total of other commitments given 9,538 4,169 1,039 4,330
Mortgages and liens received 321 72 110 139 Other commitments received 4,218 2,440 234 1,544 Total of commitments received 4,539 2,512 344 1,683
Maturity and installments

Page 58
As of December 31, 2007 (€ million)Total Less than 1
yearBetween 1 and 5 years
More than 5 years
Non-current debt obligations net of hedging instruments (Note 20) 14,099 - 11,251 2,848 Current portion of non-current debt obligations net of hedging instruments (Note 20) 1,669 1,669 - -
Finance lease obligations (Note 22) 343 26 173 144 Asset retirement obligations (Note 19) 4,206 189 503 3,514 Contractual obligations recorded in the balance sheet 20,317 1,884 11,927 6,506
Operating lease obligations (Note 22) 1,921 427 1,002 492
Purchase obligations 61,794 3,210 15,419 43,165 Contractual obligations not recorded in the balance sheet 63,715 3,637 16,421 43,657
Total of contractual obligations 84,032 5,521 28,348 50,163
Guarantees given for excise taxes 1,796 590 58 1,148 Guarantees given against borrowings 781 9 624 148
Indemnities related to sales of businesses 40 - 3 37 Guarantees of current liabilities 97 16 48 33 Guarantees to customers / suppliers 1,197 23 6 1,168
Letters of credit 1,677 1,677 - -Other operating commitments 1,280 207 151 922
Total of other commitments given 6,868 2,522 890 3,456
Mortgages and liens received 353 7 69 277 Other commitments received 3,887 2,781 377 729 Total of commitments received 4,240 2,788 446 1,006
Maturity and installments
A. Contractual obligations
Debt obligations
“Non-current debt obligations” are included in the items “Non-current financial debt” and “Hedging instruments of non-current financial debt” of the Consolidated Balance Sheet. It includes the non-current portion of swaps hedging bonds, and excludes non-current finance lease obligations of €260 million.
The current portion of non-current debt is included in the items “Current borrowings”, “Current financial assets” and “Other current financial liabilities” of the Consolidated Balance Sheet. It includes the current portion of swaps hedging bonds, and excludes the current portion of finance lease obligations of €22 million.
The information regarding contractual obligations linked to indebtedness is presented in Note 20 to the Consolidated Financial Statements.
Lease contracts
The information regarding operating and finance leases is presented in Note 22 to the Consolidated Financial Statements.
Asset retirement obligations
This item represents the discounted present value of Upstream asset retirement obligations, primarily asset removal costs at the completion date. The information regarding contractual obligations linked to asset retirement obligations is presented in Notes 1Q and 19 to the Consolidated Financial Statements.
Purchase obligations
Purchase obligations are obligations under contractual agreements to purchase goods or services, including capital projects. These obligations are enforceable and legally binding on the company and specify all significant terms, including the amount and the timing of the payments. These obligations mainly include: hydrocarbon unconditional purchase contracts (except where an active, highly-liquid market exists and when the hydrocarbons are expected to be re-sold shortly after purchase), reservation of transport capacities in pipelines, unconditional exploration works and development works in the Upstream segment, and contracts for capital investment projects in the Downstream segment.

Page 59
B. Other commitments given
Guarantees given for excise taxes
They consist of guarantees given to other oil and gas companies in order to comply with French tax authorities’ requirements for oil and gas imports in France. A payment would be triggered by a failure of the guaranteed party with respect to the French tax authorities. The default of the guaranteed parties is however considered to be highly remote by the Group.
Guarantees given against borrowings
The Group guarantees bank debt and finance lease obligations of certain non-consolidated subsidiaries and equity affiliates. Maturity dates vary, and guarantees will terminate on payment and/or cancellation of the obligation. A payment would be triggered by failure of the guaranteed party to fulfill its obligation covered by the guarantee, and no assets are held as collateral for these guarantees. As of December 31, 2009, the maturities of these guarantees are up to 2023.
Indemnities related to sales of businesses
In the ordinary course of business, the Group executes contracts involving standard indemnities in oil industry and indemnities specific to transactions such as sales of businesses. These indemnities might include claims against any of the following: environmental, tax and shareholder matters, intellectual property rights, governmental regulations and employment-related matters, dealer, supplier, and other commercial contractual relationships. Performance under these indemnities would generally be triggered by a breach of terms of the contract or by a third party claim. The Group regularly evaluates the probability of having to incur costs associated with these indemnities.
The guarantees related to antitrust investigations granted as part of the agreement relating to the spin-off of Arkema are described in Note 32 to the Consolidated Financial Statements.
Other guarantees given
Non-consolidated subsidiaries
The Group also guarantees the current liabilities of certain non-consolidated subsidiaries. Performance under these guarantees would be triggered by a financial default of the entity.
Operating agreements
As part of normal ongoing business operations and consistent with generally and accepted recognized industry practices, the Group enters into numerous agreements with other parties. These commitments are often entered into for commercial purposes, for regulatory purposes or for other operating agreements.
24) Related parties
The main transactions and balances with related parties (principally non-consolidated subsidiaries and equity affiliates) are detailed as follows:
Balance sheetAs of December 31, (€ million) 2009 2008 2007ReceivablesDebtors and other debtors 293 244 277Loans (excl. loans to equity affiliates) 438 354 378PayablesCreditors and other creditors 386 136 460Debts 42 50 28
Statement of incomeFor the year ended December 31, (€ million) 2009 2008 2007Sales 2,183 3,082 2,635Purchases 2,958 4,061 3,274Financial expense 1 - -Financial income 68 114 29

Page 60
Compensation for the administration and management bodies
The aggregate amount paid directly or indirectly by the French and foreign affiliates of the Company as compensation to the executive officers of TOTAL (the members of the Management Committee and the Treasury) and to the members of the Board of Directors who are employees of the Group, is detailed as follows:
For the year ended December 31, (€ million) 2009 2008 2007Number of people 27 30 30Direct or indirect compensation 19.4 20.4 19.9
Share-based payments expense (IFRS 2)(a) 11.2 16.6 18.4
Pension expenses(b) 10.6 11.9 12.2
(a) Share-based payments expense computed for the executive officers and the members of the Board of Directors who are employees of the Group as described in Note 25 paragraph E to the Consolidated Financial Statements and based on the principles of IFRS 2 “Share-based payments” described in Note 1 paragraph E to the Consolidated Financial Statements.
(b) The benefits provided for executive officers and certain members of the Board of Directors, employees and former employees of the Group, include severance to be paid on retirement, supplementary pension schemes and insurance plans, which represent €96.6 million provisioned as of December 31, 2009, against €98.0 million as of December 31, 2008 and €102.9 million as of December 31, 2007.

Page 61
25) Share-based payments
A. TOTAL share subscription option plans
Plan 2003 Plan 2004 Plan 2005 Plan 2006 Plan 2007 Plan 2008 Plan 2009 Total
Date of the shareholders' meeting May 17, 2001 May 14, 2004 May 14, 2004 May 14, 2004 May 11, 2007 May 11, 2007 May 11, 2007Date of the award (a)
July 16, 2003 July 20, 2004 July 19, 2005 July 18, 2006 July 17, 2007 October 9, 2008 September 15, 2009
Exercise price until May 23, 2006 included (b) 33.30 39.85 49.73
Exercise price since May 24, 2006 (b) 32.84 39.30 49.04 50.60 60.10 42.90 39.90
Expiry date July 16, 2011 July 20, 2012 July 19, 2013 July 18, 2014 July 17, 2015 October 9, 2016 September 15, 2017Number of options(c)
Existing options as of January 1, 2007 10,608,590 13,430,372 6,275,757 5,726,160 - - - 36,040,879 40.89
Granted - - - - 5,937,230 - - 5,937,230 60.10
Cancelled (22,138) (20,093) (11,524) (13,180) (17,125) - - (84,060) 44.94
Exercised (2,218,074) (213,043) (20,795) (1,920) - - - (2,453,832) 33.55
Existing options as of January 1, 2008 8,368,378 13,197,236 6,243,438 5,711,060 5,920,105 - - 39,440,217 44.23
Granted - - - - - 4,449,810 - 4,449,810 42.90
Cancelled (25,184) (118,140) (34,032) (53,304) (34,660) (6,000) - (271,320) 44.88
Exercised (841,846) (311,919) (17,702) (6,700) - - - (1,178,167) 34.89
Existing options as of January 1, 2009 7,501,348 12,767,177 6,191,704 5,651,056 5,885,445 4,443,810 - 42,440,540 44.35
Granted - - - - - - 4,387,620 4,387,620 39.90
Cancelled (8,020) (18,387) (6,264) (5,370) (13,780) (2,180) (10,610) (64,611) 45.04
Exercised (681,699) (253,081) - - - - - (934,780) 34.59
Existing options as of December 31, 2009 6,811,629 12,495,709 6,185,440 5,645,686 5,871,665 4,441,630 4,377,010 45,828,769 44.12
Weighted Average Exercise
Price
(a) The grant date corresponds to the date of the Board of Directors meeting that awarded the options, except for the options awarded by the Board of Directors at their meeting of September 9, 2008, and granted on October 9, 2008.
(b) Exercise price in euro. The exercise prices of TOTAL subscription shares of the plans in force at that date were multiplied by 0.25 to take into account the four-for-one stock split on May 18, 2006. Moreover, following the spin-off of Arkema, the exercise prices of TOTAL subscription shares of these plans were multiplied by an adjustment factor equal to 0.986147 with effect as of May 24, 2006.
(c) The number of options awarded, outstanding, cancelled or exercised before May 23, 2006 included, was multiplied by four to reflect the four-for-one stock split approved by the shareholders’ meeting on May 12, 2006.
The options, subject to a continued employment condition, are exercisable only after a 2-year period from the date of the Board meeting awarding the options and must be exercised within eight years from this date. Underlying shares may not be sold for four years from the date of grant. For the options of the 2007, 2008 and 2009 Plans, beneficiaries working for a non-French subsidiary as of the grant date are authorized to transfer the shares issued upon exercise of options starting after a 2-year period from the grant date.
The continued employment condition states that the termination of the employment contract will result in the employee losing the right to exercise the options.
For the 2009 Plan, the Board of Directors decided that for each beneficiary other than the CEO of more than 25,000 stock options, one third of the options in excess of this number finally awarded following the 2-year vesting period will be subject to a performance condition. This condition is based on the average of the Return On Equity (ROE) of the Group. The average ROE is calculated based on the consolidated accounts published by TOTAL for fiscal years 2009 and 2010. The acquisition rate:
is equal to zero if the average ROE is less than or equal to 7%;
varies on straight-line basis between 0% and 100% if the average ROE is greater than 7% and less than 18%; and
is equal to 100% if the average ROE is greater than or equal to 18%.
Furthermore, the Board of Directors decided that the number of options awarded to the CEO is subject to two performance conditions:
For 50% of the options granted, the performance condition states that the number of options finally granted is based on the average ROE of the Group. The average ROE is calculated based on the consolidated accounts published by TOTAL for fiscal years 2009 and 2010. The acquisition rates equal to zero if the average ROE is less than or equal to 7%;varies on a straight-line basis between 0% and 100% if the average ROE is greater than 7% and less than 18%; and is equal to 100% if the average ROE is greater than or equal to 18%.
For the other 50% of the options granted, the performance condition states that the number of options finally granted is based on the average of the Return On Average Capital Employed (ROACE) of the Group. The average ROACE is calculated based on the consolidated accounts published by TOTAL for fiscal years 2009 and 2010. The acquisition rate is equal to zero if the average ROACE is less than or equal to 6%; varies on a straight-line basis between 0% and 100% if the average ROACE is greater than 6% and less than 15%; and is equal to 100% if the average ROACE is greater than or equal to 15%.
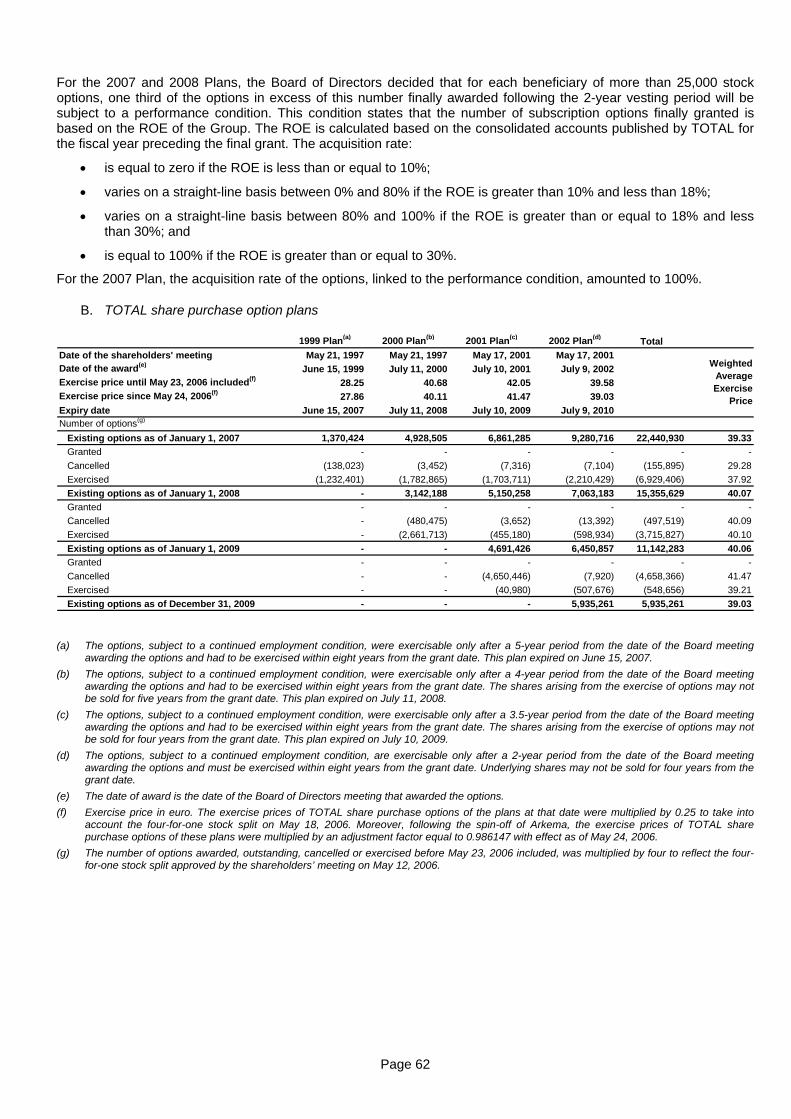
Page 62
For the 2007 and 2008 Plans, the Board of Directors decided that for each beneficiary of more than 25,000 stock options, one third of the options in excess of this number finally awarded following the 2-year vesting period will be subject to a performance condition. This condition states that the number of subscription options finally granted is based on the ROE of the Group. The ROE is calculated based on the consolidated accounts published by TOTAL for the fiscal year preceding the final grant. The acquisition rate:
is equal to zero if the ROE is less than or equal to 10%;
varies on a straight-line basis between 0% and 80% if the ROE is greater than 10% and less than 18%;
varies on a straight-line basis between 80% and 100% if the ROE is greater than or equal to 18% and less than 30%; and
is equal to 100% if the ROE is greater than or equal to 30%.
For the 2007 Plan, the acquisition rate of the options, linked to the performance condition, amounted to 100%.
B. TOTAL share purchase option plans
1999 Plan(a) 2000 Plan(b) 2001 Plan(c) 2002 Plan(d)Total
Date of the shareholders' meeting May 21, 1997 May 21, 1997 May 17, 2001 May 17, 2001Date of the award(e)
June 15, 1999 July 11, 2000 July 10, 2001 July 9, 2002Exercise price until May 23, 2006 included(f)
28.25 40.68 42.05 39.58Exercise price since May 24, 2006(f)
27.86 40.11 41.47 39.03
Expiry date June 15, 2007 July 11, 2008 July 10, 2009 July 9, 2010Number of options(g)
Existing options as of January 1, 2007 1,370,424 4,928,505 6,861,285 9,280,716 22,440,930 39.33
Granted - - - - - -
Cancelled (138,023) (3,452) (7,316) (7,104) (155,895) 29.28
Exercised (1,232,401) (1,782,865) (1,703,711) (2,210,429) (6,929,406) 37.92
Existing options as of January 1, 2008 - 3,142,188 5,150,258 7,063,183 15,355,629 40.07
Granted - - - - - -
Cancelled - (480,475) (3,652) (13,392) (497,519) 40.09
Exercised - (2,661,713) (455,180) (598,934) (3,715,827) 40.10
Existing options as of January 1, 2009 - - 4,691,426 6,450,857 11,142,283 40.06
Granted - - - - - -
Cancelled - - (4,650,446) (7,920) (4,658,366) 41.47
Exercised - - (40,980) (507,676) (548,656) 39.21
Existing options as of December 31, 2009 - - - 5,935,261 5,935,261 39.03
Weighted Average Exercise
Price
(a) The options, subject to a continued employment condition, were exercisable only after a 5-year period from the date of the Board meeting awarding the options and had to be exercised within eight years from the grant date. This plan expired on June 15, 2007.
(b) The options, subject to a continued employment condition, were exercisable only after a 4-year period from the date of the Board meeting awarding the options and had to be exercised within eight years from the grant date. The shares arising from the exercise of options may not be sold for five years from the grant date. This plan expired on July 11, 2008.
(c) The options, subject to a continued employment condition, were exercisable only after a 3.5-year period from the date of the Board meeting awarding the options and had to be exercised within eight years from the grant date. The shares arising from the exercise of options may not be sold for four years from the grant date. This plan expired on July 10, 2009.
(d) The options, subject to a continued employment condition, are exercisable only after a 2-year period from the date of the Board meeting awarding the options and must be exercised within eight years from the grant date. Underlying shares may not be sold for four years from the grant date.
(e) The date of award is the date of the Board of Directors meeting that awarded the options.
(f) Exercise price in euro. The exercise prices of TOTAL share purchase options of the plans at that date were multiplied by 0.25 to take into account the four-for-one stock split on May 18, 2006. Moreover, following the spin-off of Arkema, the exercise prices of TOTAL share purchase options of these plans were multiplied by an adjustment factor equal to 0.986147 with effect as of May 24, 2006.
(g) The number of options awarded, outstanding, cancelled or exercised before May 23, 2006 included, was multiplied by four to reflect the four-for-one stock split approved by the shareholders’ meeting on May 12, 2006.

Page 63
C. Exchange guarantee granted to the holders of Elf Aquitaine share subscription options
Pursuant to the public exchange offer for Elf Aquitaine shares which was made in 1999, the Group made a commitment to guarantee the holders of Elf Aquitaine share subscription options, at the end of the period referred to in Article 163 bis C of the French Tax Code (CGI), and until the end of the period for the exercise of the options, the possibility to exchange their future Elf Aquitaine shares for TOTAL shares, on the basis of the exchange ratio of the offer (nineteen TOTAL shares for thirteen Elf Aquitaine shares).
In order to take into account the spin-off of S.D.A. (Société de Développement Arkema) by Elf Aquitaine, the spin-off of Arkema by TOTAL S.A. and the four-for-one TOTAL stock split, the Board of Directors of TOTAL S.A., in accordance with the terms of the share exchange undertaking, approved on March 14, 2006 to adjust the exchange ratio described above (see pages 24 and 25 of the “Prospectus for the purpose of listing Arkema shares on Euronext Paris in connection with the allocation of Arkema shares to TOTAL S.A. shareholders”). Following the approval by Elf Aquitaine shareholders’ meeting on May 10, 2006 of the spin-off of S.D.A. by Elf Aquitaine, the approval by TOTAL S.A. shareholders’ meeting on May 12, 2006 of the spin-off of Arkema by TOTAL S.A. and the four-for-one TOTAL stock split, the exchange ratio was adjusted to six TOTAL shares for one Elf Aquitaine share on May 22, 2006.
During 2009, 75,699 options were exercised and 80,005 Elf Aquitaine shares were exchanged based on the exchange ratio of six TOTAL shares for one Elf Aquitaine share as adjusted on May 22, 2006.
As of December 31, 2009, this exchange guarantee is not in effect and all Elf Aquitaine subscription plans have expired. Therefore, no Elf Aquitaine shares are covered by the exchange guarantee.
Elf Aquitaine subscription plan(a) 1999 Plan n°1 1999 Plan n°2 Total Weighted-
average exercise price(b)
Exercise price until May 23, 2006 included(b) 115.60 171.60
Exercise price since May 24, 2006(b) 114.76 170.36
Expiration date 03/30/2009 09/12/2009
Outstanding position as of January 1, 2009 90,342 6,044 96,386 118.25
Outstanding Elf Aquitaine shares covered by the exchange guarantee as of January 1, 2009
5,295 - 5,295
Number of options exercised in 2009 69,655 6,044 75,699 119.20
Number of shares exchanged in 2009 73,961 6,044 80,005
Outstanding position as of December 31, 2009 - - -
Total of Elf Aquitaine shares, either outstanding or to be created, covered by the exchange guarantee for TOTAL shares as of December 31, 2009
- -
TOTAL shares likely to be created within the scope of the application of the exchange guarantee as of December 31, 2009
- -
(a) Adjustments of the number of options approved by the Board of Directors of Elf Aquitaine on March 10, 2006 in application of articles 174-9, 174-12 and 174-13 of the decree No. 67-236 of March 23, 1967 in force on March 10, 2006 and during Elf Aquitaine shareholders’ meeting on May 10, 2006, as part of the spin-off of SDA. These adjustments have been made on May 22, 2006 with effect as of May 24, 2006.
(b) Exercise price in euro. To take into account the spin-off of S.D.A., the exercise prices of Elf Aquitaine share subscription options were multiplied by an adjustment factor equal to 0.992769 with effect on May 24, 2006.
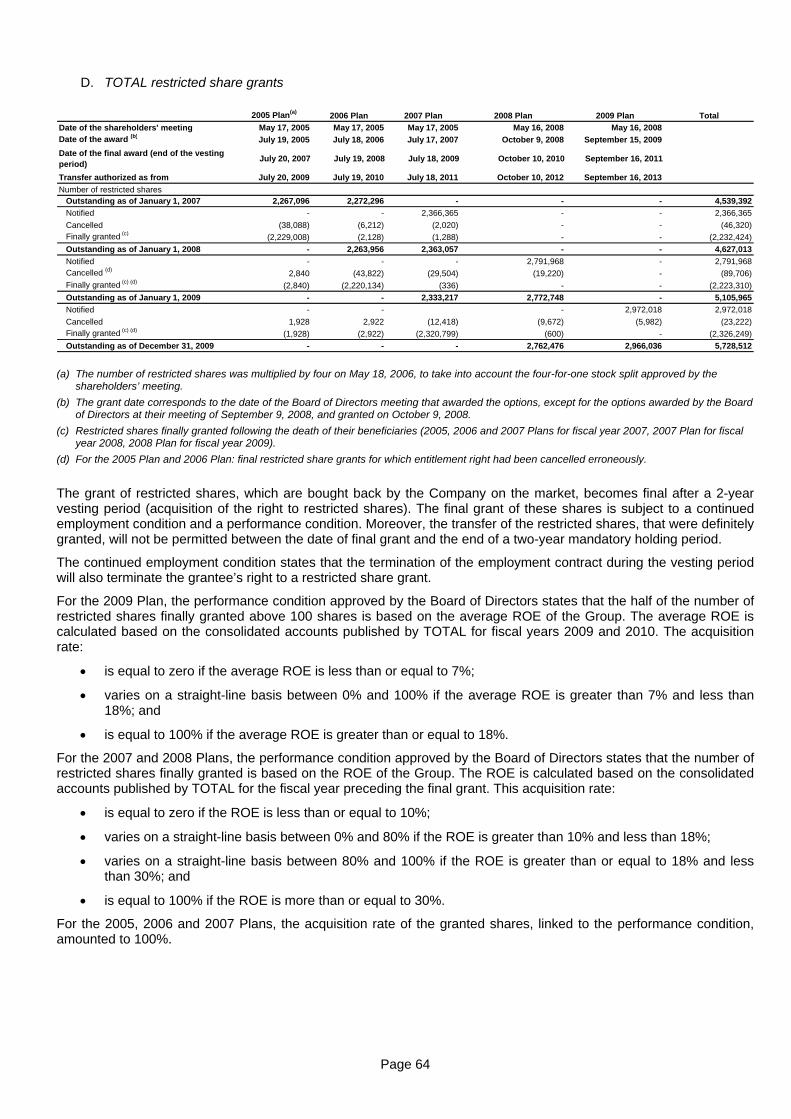
Page 64
D. TOTAL restricted share grants
2005 Plan(a)2006 Plan 2007 Plan 2008 Plan 2009 Plan Total
Date of the shareholders' meeting May 17, 2005 May 17, 2005 May 17, 2005 May 16, 2008 May 16, 2008
Date of the award (b) July 19, 2005 July 18, 2006 July 17, 2007 October 9, 2008 September 15, 2009
Date of the final award (end of the vesting period)
July 20, 2007 July 19, 2008 July 18, 2009 October 10, 2010 September 16, 2011
Transfer authorized as from July 20, 2009 July 19, 2010 July 18, 2011 October 10, 2012 September 16, 2013
Number of restricted shares Outstanding as of January 1, 2007 2,267,096 2,272,296 - - - 4,539,392
Notified - - 2,366,365 - - 2,366,365
Cancelled (38,088) (6,212) (2,020) - - (46,320) Finally granted (c)
(2,229,008) (2,128) (1,288) - - (2,232,424)
Outstanding as of January 1, 2008 - 2,263,956 2,363,057 - - 4,627,013
Notified - - - 2,791,968 - 2,791,968 Cancelled (d)
2,840 (43,822) (29,504) (19,220) - (89,706) Finally granted (c) (d)
(2,840) (2,220,134) (336) - - (2,223,310)
Outstanding as of January 1, 2009 - - 2,333,217 2,772,748 - 5,105,965
Notified - - - 2,972,018 2,972,018
Cancelled 1,928 2,922 (12,418) (9,672) (5,982) (23,222) Finally granted (c) (d)
(1,928) (2,922) (2,320,799) (600) - (2,326,249)
Outstanding as of December 31, 2009 - - - 2,762,476 2,966,036 5,728,512
(a) The number of restricted shares was multiplied by four on May 18, 2006, to take into account the four-for-one stock split approved by the
shareholders’ meeting.
(b) The grant date corresponds to the date of the Board of Directors meeting that awarded the options, except for the options awarded by the Board of Directors at their meeting of September 9, 2008, and granted on October 9, 2008.
(c) Restricted shares finally granted following the death of their beneficiaries (2005, 2006 and 2007 Plans for fiscal year 2007, 2007 Plan for fiscal year 2008, 2008 Plan for fiscal year 2009).
(d) For the 2005 Plan and 2006 Plan: final restricted share grants for which entitlement right had been cancelled erroneously.
The grant of restricted shares, which are bought back by the Company on the market, becomes final after a 2-year vesting period (acquisition of the right to restricted shares). The final grant of these shares is subject to a continued employment condition and a performance condition. Moreover, the transfer of the restricted shares, that were definitely granted, will not be permitted between the date of final grant and the end of a two-year mandatory holding period.
The continued employment condition states that the termination of the employment contract during the vesting period will also terminate the grantee’s right to a restricted share grant.
For the 2009 Plan, the performance condition approved by the Board of Directors states that the half of the number of restricted shares finally granted above 100 shares is based on the average ROE of the Group. The average ROE is calculated based on the consolidated accounts published by TOTAL for fiscal years 2009 and 2010. The acquisition rate:
is equal to zero if the average ROE is less than or equal to 7%;
varies on a straight-line basis between 0% and 100% if the average ROE is greater than 7% and less than 18%; and
is equal to 100% if the average ROE is greater than or equal to 18%.
For the 2007 and 2008 Plans, the performance condition approved by the Board of Directors states that the number of restricted shares finally granted is based on the ROE of the Group. The ROE is calculated based on the consolidated accounts published by TOTAL for the fiscal year preceding the final grant. This acquisition rate:
is equal to zero if the ROE is less than or equal to 10%;
varies on a straight-line basis between 0% and 80% if the ROE is greater than 10% and less than 18%;
varies on a straight-line basis between 80% and 100% if the ROE is greater than or equal to 18% and less than 30%; and
is equal to 100% if the ROE is more than or equal to 30%.
For the 2005, 2006 and 2007 Plans, the acquisition rate of the granted shares, linked to the performance condition, amounted to 100%.
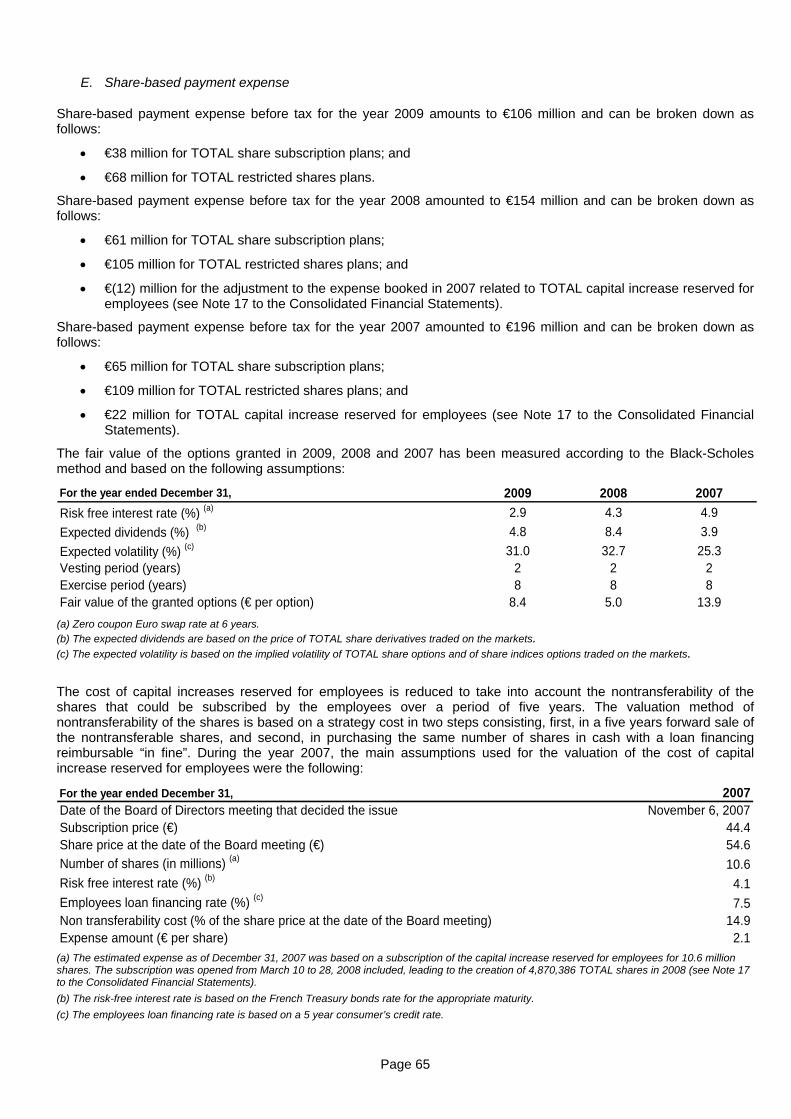
Page 65
E. Share-based payment expense
Share-based payment expense before tax for the year 2009 amounts to €106 million and can be broken down as follows:
€38 million for TOTAL share subscription plans; and
€68 million for TOTAL restricted shares plans.
Share-based payment expense before tax for the year 2008 amounted to €154 million and can be broken down as follows:
€61 million for TOTAL share subscription plans;
€105 million for TOTAL restricted shares plans; and
€(12) million for the adjustment to the expense booked in 2007 related to TOTAL capital increase reserved for employees (see Note 17 to the Consolidated Financial Statements).
Share-based payment expense before tax for the year 2007 amounted to €196 million and can be broken down as follows:
€65 million for TOTAL share subscription plans;
€109 million for TOTAL restricted shares plans; and
€22 million for TOTAL capital increase reserved for employees (see Note 17 to the Consolidated Financial Statements).
The fair value of the options granted in 2009, 2008 and 2007 has been measured according to the Black-Scholes method and based on the following assumptions:
For the year ended December 31, 2009 2008 2007
Risk free interest rate (%) (a) 2.9 4.3 4.9
Expected dividends (%) (b) 4.8 8.4 3.9
Expected volatility (%) (c) 31.0 32.7 25.3Vesting period (years) 2 2 2Exercise period (years) 8 8 8Fair value of the granted options (€ per option) 8.4 5.0 13.9
(a) Zero coupon Euro swap rate at 6 years. (b) The expected dividends are based on the price of TOTAL share derivatives traded on the markets. (c) The expected volatility is based on the implied volatility of TOTAL share options and of share indices options traded on the markets.
The cost of capital increases reserved for employees is reduced to take into account the nontransferability of the shares that could be subscribed by the employees over a period of five years. The valuation method of nontransferability of the shares is based on a strategy cost in two steps consisting, first, in a five years forward sale of the nontransferable shares, and second, in purchasing the same number of shares in cash with a loan financing reimbursable “in fine”. During the year 2007, the main assumptions used for the valuation of the cost of capital increase reserved for employees were the following:
For the year ended December 31, 2007Date of the Board of Directors meeting that decided the issue November 6, 2007Subscription price (€) 44.4Share price at the date of the Board meeting (€) 54.6
Number of shares (in millions) (a)10.6
Risk free interest rate (%) (b)4.1
Employees loan financing rate (%) (c)7.5
Non transferability cost (% of the share price at the date of the Board meeting) 14.9Expense amount (€ per share) 2.1
(a) The estimated expense as of December 31, 2007 was based on a subscription of the capital increase reserved for employees for 10.6 million shares. The subscription was opened from March 10 to 28, 2008 included, leading to the creation of 4,870,386 TOTAL shares in 2008 (see Note 17 to the Consolidated Financial Statements).
(b) The risk-free interest rate is based on the French Treasury bonds rate for the appropriate maturity.
(c) The employees loan financing rate is based on a 5 year consumer’s credit rate.

Page 66
26) Payroll and staff
For the year ended December 31, (€ million) 2009 2008 2007
Personnel expenses (a)
Wages and salaries (including social charges) 6,177 6,014 6,058
Group employees (a)
France• Management 10,906 10,688 10,517• Othe r 25,501 26,413 26,779International• Management 15,243 14,709 14,225• Othe r 44,737 45,149 44,921Total 96,387 96,959 96,442
(a) Number of employees and personnel expenses of fully consolidated subsidiaries.
27) Statement of cash flows
A) Cash flow from operating activities
The following table gives additional information on cash paid or received in the cash flow from operating activities:
For the year ended December 31, (€ million) 2009 2008 2007Interests paid (678) (958) (1,680)Interests received 148 505 1,277Income tax paid (6,202) (10,631) (9,687)Dividends received 1,456 1,590 1,109
Changes in working capital are detailed as follows:
For the year ended December 31, (€ million) 2009 2008 2007Inventories (4,217) 4,020 (2,706)Accounts receivable (344) 3,222 (2,963)Other current assets 1,505 (982) (1,341)Accounts payable 571 (3,056) 4,508Other creditors and accrued liabilities (831) (633) 1,026Net amount (3,316) 2,571 (1,476)
B) Cash flow used in financing activities
Changes in non-current financial debt are detailed in the following table under a net value due to the high number of multiple drawings:
For the year ended December 31, (€ million) 2009 2008 2007Issuance of non-current debt 6,309 5,513 3,313Repayment of non-current debt (787) (2,504) (93)Net amount 5,522 3,009 3,220

Page 67
C) Cash and cash equivalents
Cash and cash equivalents are detailed as follows:
For the year ended December 31, (€ million) 2009 2008 2007Cash 2,448 1,836 1,930Cash equivalents 9,214 10,485 4,058Total 11,662 12,321 5,988
Cash equivalents are mainly composed of deposits beyond three months deposited in government institutions or deposit banks selected in accordance with strict criteria.
28) Financial assets and liabilities analysis per instruments class and strategy
The financial assets and liabilities disclosed on the face of the balance sheet are detailed as follows:
As of December 31, 2009(€ million)Assets / (Liabilities)
Financial instruments related to financing and trading activitiesOther financial
instruments Total Fair value
Amortized cost Fair value
Available
for sale (a)Held for trading
Financial debt (b)
Hedging of financial debt Cash flow hedge
Net investment hedge and other
Equity affiliates: loans 2,367 2,367 2,367Other investments 1,162 1,162 1,162Hedging instruments of non-current financial debt 889 136 1,025 1,025Other non-current assets 1,284 1,284 1,284Accounts receivable, net 15,719 15,719 15,719Other operating receivables 1,029 4,116 5,145 5,145Current financial assets 55 53 197 6 311 311Cash and cash equivalents 11,662 11,662 11,662Total financial assets 3,706 1,162 1,082 - 1,086 136 6 31,497 38,675 38,675Total non-financial assets 89,078Total assets 127,753
Non-current financial debt (389) (18,807) (241) (19,437) (19,437)Accounts payable (15,383) (15,383) (15,383)Other operating liabilities (923) (3,783) (4,706) (4,706)Current borrowings (4,849) (2,145) (6,994) (6,994)Other current financial liabilities (25) (97) (1) (123) (123)Total financial liabilities (5,238) (948) (20,952) (338) - (1) (19,166) (46,643) (46,643)Total non-financial liabilities (81,110)Total liabilities (127,753)
(a) Financial assets available for sale are measured at their fair value except for unlisted securities (see Note 1 paragraph M(ii) and Note 13 to the Consolidated Financial Statements). (b) The financial debt is adjusted to the hedged risks value (currency and interest rate) as part of hedge accounting (see Note 1 paragraph M(iii) to the Consolidated Financial Statements).

Page 68
As of December 31, 2008(€ million)Assets / (Liabilities)
Financial instruments related to financing and trading activitiesOther financial
instruments Total Fair value
Amortized cost Fair value
Available
for sale (a)Held for trading
Financial debt (b)
Hedging of financial debt Cash flow hedge
Net investment hedge and other
Equity affiliates: loans 2,005 2,005 2,005Other investments 1,165 1,165 1,165Hedging instruments of non-current financial debt 892 892 892Other non-current assets 1,403 1,403 1,403Accounts receivable, net - 15,287 15,287 15,287Other operating receivables 1,664 4,544 6,208 6,208Current financial assets 1 86 100 - 187 187Cash and cash equivalents 12,321 12,321 12,321Total financial assets 3,409 1,165 1,750 - 992 - - 32,152 39,468 39,468Total non-financial assets 78,842Total assets 118,310
Non-current financial debt (414) (15,337) (440) (16,191) (16,191)Accounts payable - (14,815) (14,815) (14,815)Other operating liabilities (1,033) (3,264) (4,297) (4,297)Current borrowings (5,721) (2,001) (7,722) (7,722)Other current financial liabilities (146) (12) (158) (158)Total financial liabilities (6,135) (1,179) (17,338) (452) - - (18,079) (43,183) (43,183)Total non-financial liabilities (75,127)Total liabilities (118,310)
(a) Financial assets available for sale are measured at their fair value except for unlisted securities (see Note 1 paragraph M(ii) and Note 13 to the Consolidated Financial Statements). (b) The financial debt is adjusted to the hedged risks value (currency and interest rate) as part of hedge accounting (see Note 1 paragraph M(iii) to the Consolidated Financial Statements).
As of December 31, 2007(€ million)Assets / (Liabilities)
Financial instruments related to financing and trading activitiesOther financial
instruments Total Fair value
Amortized cost Fair value
Available
for sale (a)Held for trading
Financial debt (b)
Hedging of financial debt Cash flow hedge
Net investment hedge and other
Equity affiliates: loans 2,575 2,575 2,575Other investments 1,291 1,291 1,291Hedging instruments of non-current financial debt 460 460 460Other non-current assets 851 851 851Accounts receivable, net 464 18,665 19,129 19,129Other operating receivables 519 3,911 4,430 4,430Current financial assets 850 12 388 14 1,264 1,264Cash and cash equivalents 5,988 5,988 5,988Total financial assets 4,276 1,291 995 - 848 14 28,564 35,988 35,988Total non-financial assets 77,553Total assets 113,541
Non-current financial debt (532) (13,975) (369) (14,876) (14,876)Accounts payable (243) (17,940) (18,183) (18,183)Other operating liabilities (490) (3,410) (3,900) (3,900)Current borrowings (2,655) (1,958) (4,613) (4,613)Other current financial liabilities (59) (1) (60) (60)Total financial liabilities (3,187) (792) (15,933) (370) (21,350) (41,632) (41,632)Total non-financial liabilities (71,909)Total liabilities (113,541)
(a) Financial assets available for sale are measured at their fair value except for unlisted securities (see Note 1 paragraph M(ii) and Note 13 to the Consolidated Financial Statements). (b) The financial debt is adjusted to the hedged risks value (currency and interest rate) as part of hedge accounting (see Note 1 paragraph M(iii) to the Consolidated Financial Statements).

Page 69
29) Fair value of financial instruments (excluding commodity contracts)
A) Impact on the statement of income per nature of financial instruments
Operating assets and liabilities
The impact on the statement of income is detailed as follows:
For the year ended December 31, (€ million) 2009 2008 2007Assets available for sale (investments): - dividend income on non-consolidated subsidiaries 210 238 218 - gains (losses) on disposal of assets 6 15 170 - other (18) (15) (63)Loans and receivables 41 100 (2)Impact on net operating income 239 338 323
The impact in the statement of income mainly includes:
Dividends and gains or losses on disposal of other investments classified as “Other investments”;
Financial gains and depreciation on loans related to equity affiliates, non-consolidated companies and on receivables reported in “Loans and receivables”.
Assets and liabilities from financing activities
The impact on the statement of income of financing assets and liabilities is detailed as follows:
For the year ended December 31, (€ million) 2009 2008 2007Loans and receivables 158 547 1,135Financing liabilities and associated hedging instruments (563) (996) (1,721)Fair value hedge (ineffective portion) 33 (4) (26)Assets and liabilities held for trading (26) (74) 73 Impact on the cost of net debt (398) (527) (539)
The impact on the statement of income mainly includes:
Financial income on cash, cash equivalents, and current financial assets (notably current deposits beyond three months) classified as “Loans and receivables”;
Financial expense of long term subsidiaries financing, associated hedging instruments (excluding ineffective portion of the hedge detailed below) and financial expense of short term financing classified as “Financing liabilities and associated hedging instruments”;
Ineffective portion of bond hedging; and
Financial income, financial expense and fair value of derivative instruments used for cash management purposes classified as “Assets and liabilities held for trading”.
Financial derivative instruments used for cash management purposes (interest rate and foreign exchange) are considered to be held for trading. Based on practical documentation issues, the Group did not elect to set up hedge accounting for such instruments. The impact on income of the derivatives is offset by the impact of loans and current liabilities they are related to. Therefore these transactions taken as a whole do not have a significant impact on the Consolidated Financial Statements.

Page 70
B) Impact of the hedging strategies
Fair value hedge
The impact on the statement of income of the bond hedging instruments which is recorded in the item “Financial interest on debt” in the Consolidated Statement of Income is detailed as follows:
For the year ended December 31, (€ million) 2009 2008 2007Revaluation at market va lue of bonds (183) (66) 137Swap hedging of bonds 216 62 (163)Ineffective portion of the fair value hedge 33 (4) (26)
The ineffective portion is not representative of the Group's performance considering the Group’s objective to hold swaps to maturity. The current portion of the swaps valuation is not subject to active management.
Net investment hedge
These instruments are recorded directly in shareholders’ equity under “Currency translation adjustments”. The variations of the period are detailed in the table below:
For the year ended December 31, (€ million) As of January 1, Variations Disposals As of December 31,2009 124 (99) - 25
2008 29 95 - 124
2007 (188) 217 - 29
As of December 31, 2009, the fair value of the open instruments amounts to €5 million compared to zero in 2008 and €14 million in 2007.
Cash flow hedge
The impact on the statement of income and on equity of the bond hedging instruments qualified as cash flow hedges is detailed as follows:
For the year ended December 31, (€ million) 2009 2008 2007
Profit (Loss) recorded in equity during the period 128 - - Recycled amount from equity to the income statement during the period 221 - -
As of December 31, 2009, the ineffective portion of these financial instruments is equal to zero.
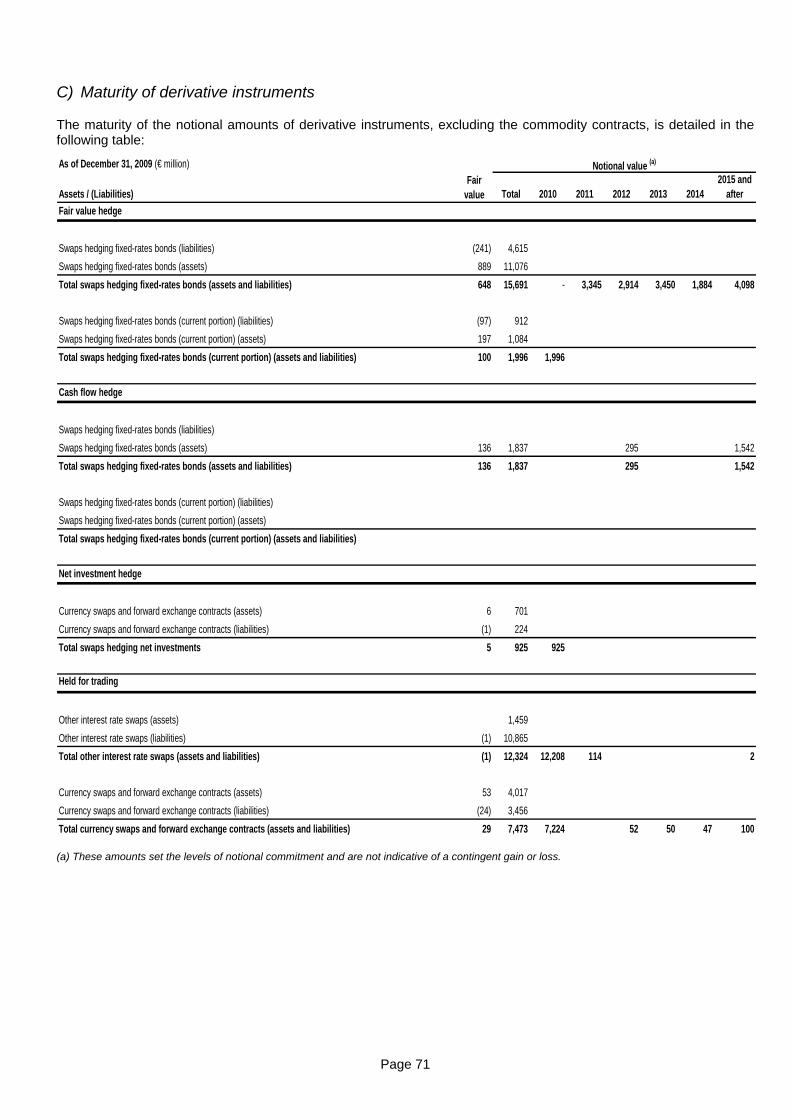
Page 71
C) Maturity of derivative instruments
The maturity of the notional amounts of derivative instruments, excluding the commodity contracts, is detailed in the following table:
As of December 31, 2009 (€ million)
Assets / (Liabilities) Total 2010 2011 2012 2013 20142015 and
after
Swaps hedging fixed-rates bonds (liabilities) (241) 4,615
Swaps hedging fixed-rates bonds (assets) 889 11,076
Total swaps hedging fixed-rates bonds (assets and liabilities) 648 15,691 - 3,345 2,914 3,450 1,884 4,098
Swaps hedging fixed-rates bonds (current portion) (liabilities) (97) 912
Swaps hedging fixed-rates bonds (current portion) (assets) 197 1,084
Total swaps hedging fixed-rates bonds (current portion) (assets and liabilities) 100 1,996 1,996
Swaps hedging fixed-rates bonds (liabilities)
Swaps hedging fixed-rates bonds (assets) 136 1,837 295 1,542
Total swaps hedging fixed-rates bonds (assets and liabilities) 136 1,837 295 1,542
Swaps hedging fixed-rates bonds (current portion) (liabilities)
Swaps hedging fixed-rates bonds (current portion) (assets)
Total swaps hedging fixed-rates bonds (current portion) (assets and liabilities)
Currency swaps and forward exchange contracts (assets) 6 701
Currency swaps and forward exchange contracts (liabilities) (1) 224
Total swaps hedging net investments 5 925 925
Held for trading
Other interest rate swaps (assets) 1,459
Other interest rate swaps (liabilities) (1) 10,865
Total other interest rate swaps (assets and liabilities) (1) 12,324 12,208 114 2
Currency swaps and forward exchange contracts (assets) 53 4,017
Currency swaps and forward exchange contracts (liabilities) (24) 3,456
Total currency swaps and forward exchange contracts (assets and liabilities) 29 7,473 7,224 52 50 47 100
Fair value
Notional value (a)
Fair value hedge
Net investment hedge
Cash flow hedge
(a) These amounts set the levels of notional commitment and are not indicative of a contingent gain or loss.

Page 72
As of December 31, 2008 (€ million)
Assets / (Liabilities) Total 2009 2010 2011 2012 20132014 and
after
Swaps hedging fixed-rates bonds (liabilities) (440) 9,309
Swaps hedging fixed-rates bonds (assets) 892 4,195
Total swaps hedging fixed-rates bonds (assets and liabilities) 452 13,504 2,048 3,373 3,233 3,032 1,818
Swaps hedging fixed-rates bonds (current portion) (liabilities) (12) 92
Swaps hedging fixed-rates bonds (current portion) (assets) 100 1,871
Total swaps hedging fixed-rates bonds (current portion) (assets and liabilities) 88 1,963 1,963
Currency swaps and forward exchange contracts (liabilities) - 1,347 1,347
Held for trading
Other interest rate swaps (assets) - 2,853
Other interest rate swaps (liabilities) (4) 5,712
Total other interest rate swaps (assets and liabilities) (4) 8,565 8,559 4 2
Currency swaps and forward exchange contracts (assets) 86 5,458
Currency swaps and forward exchange contracts (liabilities) (142) 2,167
Total currency swaps and forward exchange contracts (assets and liabilities) (56) 7,625 6,595 483 114 67 76 290
Fair value
Notional value (a)
Fair value hedge
Net investment hedge
As of December 31, 2007 (€ million)
Assets / (Liabilities) Total 2008 2009 2010 2011 20122013 and
after
Swaps hedging fixed-rates bonds (liabilities) (369) 7,506
Swaps hedging fixed-rates bonds (assets) 460 3,982
Total swaps hedging fixed-rates bonds (assets and liabilities) 91 11,488 1,910 1,836 2,725 2,437 2,580
Swaps hedging fixed-rates bonds (current portion) (liabilities) (1) 306
Swaps hedging fixed-rates bonds (current portion) (assets) 388 1,265
Total swaps hedging fixed-rates bonds (current portion) (assets and liabilities) 387 1,571 1,571
Currency swaps and forward exchange contracts (assets) 14 695 695
Held for trading
Other interest rate swaps (assets) 1 8,249
Other interest rate swaps (liabilities) - 3,815
Total other interest rate swaps (assets and liabilities) 1 12,064 12,058 - 4 - - 2
Currency swaps and forward exchange contracts (assets) 11 2,594
Currency swaps and forward exchange contracts (liabilities) (59) 3,687
Total currency swaps and forward exchange contracts (assets and liabilities) (48) 6,281 6,207 42 2 6 8 16
Fair value
Notional value (a)
Fair value hedge
Net investment hedge
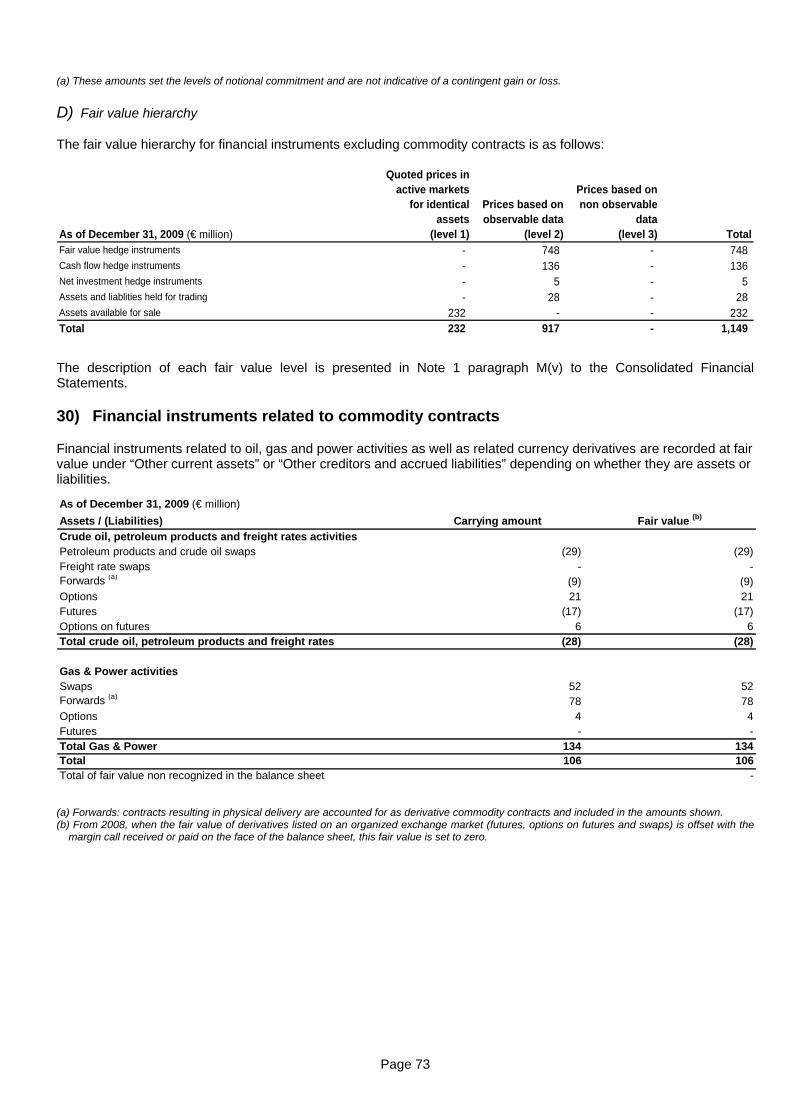
Page 73
(a) These amounts set the levels of notional commitment and are not indicative of a contingent gain or loss.
D) Fair value hierarchy
The fair value hierarchy for financial instruments excluding commodity contracts is as follows:
As of December 31, 2009 (€ million)
Quoted prices in active markets
for identical assets
(level 1)
Prices based on observable data
(level 2)
Prices based on non observable
data(level 3) Total
Fair value hedge instruments - 748 - 748Cash flow hedge instruments - 136 - 136Net investment hedge instruments - 5 - 5Assets and liablities held for trading - 28 - 28Assets available for sale 232 - - 232Total 232 917 - 1,149
The description of each fair value level is presented in Note 1 paragraph M(v) to the Consolidated Financial Statements.
30) Financial instruments related to commodity contracts
Financial instruments related to oil, gas and power activities as well as related currency derivatives are recorded at fair value under “Other current assets” or “Other creditors and accrued liabilities” depending on whether they are assets or liabilities.
As of December 31, 2009 (€ million)
Assets / (Liabilities) Carrying amount Fair value (b)
Crude oil, petroleum products and freight rates activitiesPetroleum products and crude oil swaps (29) (29)Freight rate swaps - -Forwards (a) (9) (9)Options 21 21Futures (17) (17)Options on futures 6 6Total crude oil, petroleum products and freight rates (28) (28)
Gas & Power activitiesSwaps 52 52Forwards (a) 78 78Options 4 4Futures - -Total Gas & Power 134 134Total 106 106Total of fair value non recognized in the balance sheet -
(a) Forwards: contracts resulting in physical delivery are accounted for as derivative commodity contracts and included in the amounts shown. (b) From 2008, when the fair value of derivatives listed on an organized exchange market (futures, options on futures and swaps) is offset with the
margin call received or paid on the face of the balance sheet, this fair value is set to zero.

Page 74
As of December 31, 2008 (€ million)
Assets / (Liabilities) Carrying amount Fair value (b)
Crude oil, petroleum products and freight rates activitiesPetroleum products and crude oil swaps 141 141Freight rate swaps 8 8Forwards (a) (120) (120)Options - -Futures 17 17Options on futures (7) (7)Total crude oil, petroleum products and freight rates 39 39
Gas & Power activitiesSwaps (48) (48)Forwards (a) 659 659Options - -Futures (19) (19)Total Gas & Power 592 592Total 631 631Total of fair value non recognized in the balance sheet -
(a) Forwards: contracts resulting in physical delivery are accounted for as derivative commodity contracts and included in the amounts shown.
(b) From 2008, when the fair value of derivatives listed on an organized exchange market (futures, options on futures and swaps) is offset with the margin call received or paid on the face of the balance sheet, this fair value is set to zero.
As of December 31, 2007 (€ million)
Assets / (Liabilities) Carrying amount Fair value (b)
Crude oil, petroleum products and freight rates activitiesPetroleum products and crude oil swaps (149) (149)Freight rate swaps (3) (3)Forwards (a) (4) (4)Options 272 272Futures (97) (97)Options on futures (1) (1)Total crude oil, petroleum products and freight rates 18 18
Gas & Power activitiesSwaps 4 4Forwards (a) 213 213Options - -Futures 15 15Total Gas & Power 232 232Total 250 250Total of fair value non recognized in the balance sheet -
(a) Forwards: contracts resulting in physical delivery are accounted for as derivative commodity contracts and included in the amounts shown. (b) From 2008, when the fair value of derivatives listed on an organized exchange market (futures, options on futures and swaps) is offset with the
margin call received or paid on the face of the balance sheet, this fair value is set to zero.
Most commitments on crude oil and refined products have a short term maturity (less than one year). The maturity of most Gas & Power energy derivatives is less than three years forward.

Page 75
The changes in fair value of financial instruments related to commodity contracts are detailed as follows:
For the year ended December 31,(€ million)
Fair value as of January 1,
Impact on income
Settled contracts Other
Fair value as of December 31,
Crude oil, petroleum products and freight rates activities2009 39 1,713 (1,779) (1) (28)2008 18 1,734 (1,715) 2 392007 102 1,381 (1,460) (5) 18
Gas & Power activities2009 592 327 (824) 39 1342008 232 787 (310) (117) 5922007 (79) 489 (163) (15) 232
The fair value hierarchy for financial instruments related to commodity contracts is as follows:
As of December 31, 2009 (€ million)
Quoted prices in active
markets for identical assets
(level 1)
Prices based on
observable data
(level 2)
Prices based on non
observable data
(level 3) TotalCrude oil, petroleum products and freight rates activities (45) 17 - (28)Gas & Power activities 140 (6) - 134Total 95 11 - 106
The description of each fair value level is presented in Note 1 paragraph M(v) to the Consolidated Financial Statements.
31) Market risks
Oil and gas market related risks
Due to the nature of its business, the Group has significant oil and gas trading activities as part of its day-to-day operations in order to optimize revenues from its oil and gas production and to obtain favorable pricing to supply its refineries.
In its international oil trading business, the Group follows a policy of not selling its future production. However, in connection with this trading business, the Group, like most other oil companies, uses energy derivative instruments to adjust its exposure to price fluctuations of crude oil, refined products, natural gas and electricity. The Group also uses freight rate derivative contracts in its shipping business to adjust its exposure to freight-rate fluctuations. To hedge against this risk, the Group uses various instruments such as futures, forwards, swaps and options on organized markets or over-the-counter markets. The list of the different derivatives held by the Group in these markets is detailed in Note 30 to the Consolidated Financial Statements.
The Trading & Shipping division measures its market risk exposure, i.e. potential loss in fair values, on its crude oil, refined products and freight rates trading activities using a value-at-risk technique. This technique is based on an historical model and makes an assessment of the market risk arising from possible future changes in market values over a 24-hour period. The calculation of the range of potential changes in fair values takes into account a snapshot of the end-of-day exposures and the set of historical price movements for the last 400 business days for all instruments and maturities in the global trading activities. Options are systematically reevaluated using appropriate models.
The potential movement in fair values corresponds to a 97.5% value-at-risk type confidence level. This means that the Group’s portfolio result is likely to exceed the value-at-risk loss measure once over 40 business days if the portfolio exposures were left unchanged.
Trading & Shipping : value-at-risk with a 97.5% probabilityAs of December 31, (€ million) High Low Average Year end2009 18.8 5.8 10.2 7.62008 13.5 2.8 6.9 11.82007 11.6 3.3 6.7 5.4

Page 76
As part of its gas and power trading activity, the Group also uses derivative instruments such as futures, forwards, swaps and options in both organized and over-the-counter markets. In general, the transactions are settled at maturity date through physical delivery. The Gas & Power division measures its market risk exposure, i.e. potential loss in fair values, on its trading business using a value-at-risk technique. This technique is based on an historical model and makes an assessment of the market risk arising from possible future changes in market values over a one-day period. The calculation of the range of potential changes in fair values takes into account a snapshot of the end-of-day exposures and the set of historical price movements for the past two years for all instruments and maturities in the global trading business.
Gas & Power trading : value-at-risk with a 97.5% probabilityAs of December 31, (€ million) High Low Average Year end2009 9.8 1.9 5.0 4.82008 16.3 1.3 5.0 1.4
2007 (a)18.2 3.2 7.9 4.3
(a) Data takes into account historical price movements over one year.
The Group has implemented strict policies and procedures to manage and monitor these market risks. These are based on the splitting of supervisory functions from operational functions and on an integrated information system that enables real-time monitoring of trading activities.
Limits on trading positions are approved by the Group’s Executive Committee and are monitored daily. To increase flexibility and encourage liquidity, hedging operations are performed with numerous independent operators, including other oil companies, major energy producers or consumers and financial institutions. The Group has established counterparty limits and monitors outstanding amounts with each counterparty on an ongoing basis.
Financial markets related risks
As part of its financing and cash management activities, the Group uses derivative instruments to manage its exposure to changes in interest rates and foreign exchange rates. These instruments are principally interest rate and currency swaps. The Group may also use, on a less frequent basis, futures, caps, floors and options contracts. These operations and their accounting treatment are detailed in Notes 1 paragraph M, 20, 28 and 29 to the Consolidated Financial Statements.
Risks relative to cash management operations and to interest rate and foreign exchange financial instruments are managed according to rules set by the Group’s senior management, which provide for regular pooling of available cash balances, open positions and management of the financial instruments by the Treasury Department. Excess cash of the Group is deposited mainly in government institutions or deposit banks through deposits, reverse repurchase agreements and purchase of commercial paper. Liquidity positions and the management of financial instruments are centralized by the Treasury Department, where they are managed by a team specialized in foreign exchange and interest rate market transactions.
The Cash Monitoring-Management Unit within the Treasury Department monitors limits and positions per bank on a daily basis and reports results. This unit also prepares marked-to-market valuations and, when necessary, performs sensitivity analysis.
Counterparty risk
The Group has established standards for market transactions under which bank counterparties must be approved in advance, based on an assessment of the counterparty’s financial soundness (multi-criteria analysis including a review of market prices and of the Credit Default Swap (CDS), its ratings with Standard & Poor’s and Moody’s, which must be of high quality, and its overall financial condition).
An overall authorized credit limit is set for each bank and is allotted among the subsidiaries and the Group’s central treasury entities according to their needs.
To reduce the market values risk on its commitments, in particular for swaps set as part of bonds issuance, the Treasury Department also developed a system of margin call that is gradually implemented with significant counterparties.
Currency exposure
The Group seeks to minimize the currency exposure of each entity to its functional currency (primarily the euro, the dollar, the pound sterling and the Norwegian krone).
For currency exposure generated by commercial activity, the hedging of revenues and costs in foreign currencies is typically performed using currency operations on the spot market and, in some cases, on the forward market. The Group rarely hedges future cash flows, although it may use options to do so.
With respect to currency exposure linked to non-current assets booked in a currency other than the euro, the Group has a policy of reducing the related currency exposure by financing these assets in the same currency.
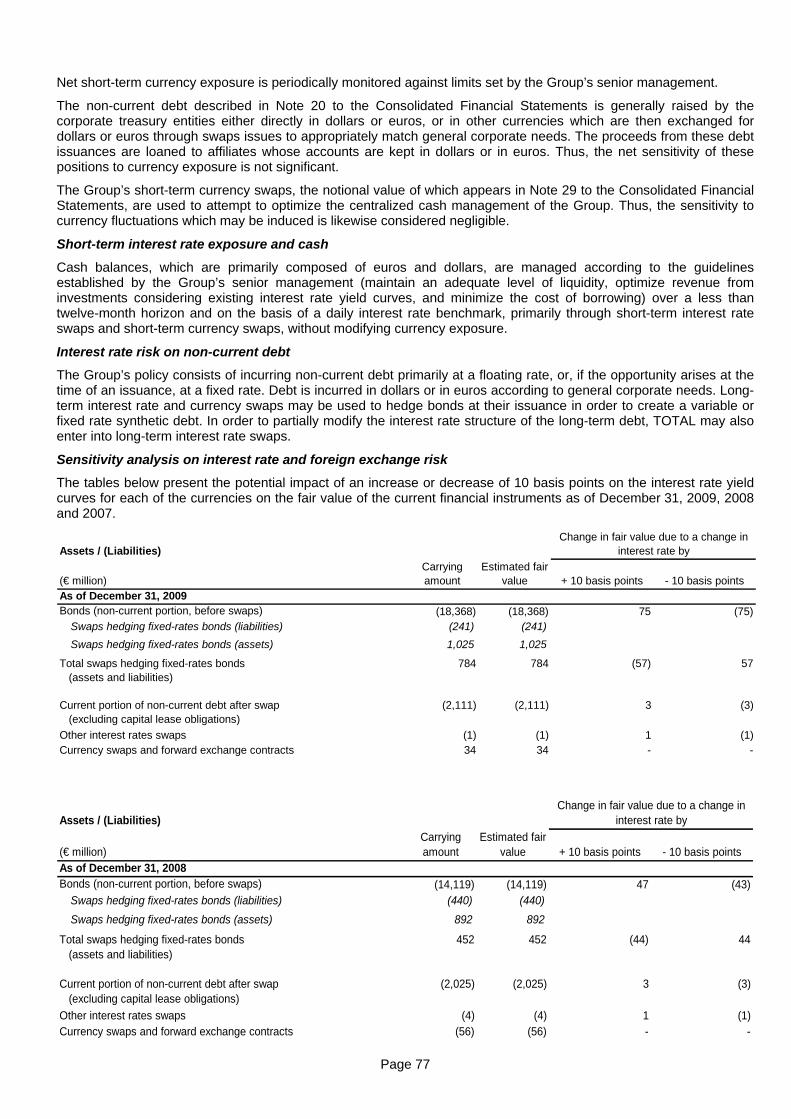
Page 77
Net short-term currency exposure is periodically monitored against limits set by the Group’s senior management.
The non-current debt described in Note 20 to the Consolidated Financial Statements is generally raised by the corporate treasury entities either directly in dollars or euros, or in other currencies which are then exchanged for dollars or euros through swaps issues to appropriately match general corporate needs. The proceeds from these debt issuances are loaned to affiliates whose accounts are kept in dollars or in euros. Thus, the net sensitivity of these positions to currency exposure is not significant.
The Group’s short-term currency swaps, the notional value of which appears in Note 29 to the Consolidated Financial Statements, are used to attempt to optimize the centralized cash management of the Group. Thus, the sensitivity to currency fluctuations which may be induced is likewise considered negligible.
Short-term interest rate exposure and cash
Cash balances, which are primarily composed of euros and dollars, are managed according to the guidelines established by the Group’s senior management (maintain an adequate level of liquidity, optimize revenue from investments considering existing interest rate yield curves, and minimize the cost of borrowing) over a less than twelve-month horizon and on the basis of a daily interest rate benchmark, primarily through short-term interest rate swaps and short-term currency swaps, without modifying currency exposure.
Interest rate risk on non-current debt
The Group’s policy consists of incurring non-current debt primarily at a floating rate, or, if the opportunity arises at the time of an issuance, at a fixed rate. Debt is incurred in dollars or in euros according to general corporate needs. Long-term interest rate and currency swaps may be used to hedge bonds at their issuance in order to create a variable or fixed rate synthetic debt. In order to partially modify the interest rate structure of the long-term debt, TOTAL may also enter into long-term interest rate swaps.
Sensitivity analysis on interest rate and foreign exchange risk
The tables below present the potential impact of an increase or decrease of 10 basis points on the interest rate yield curves for each of the currencies on the fair value of the current financial instruments as of December 31, 2009, 2008 and 2007.
Assets / (Liabilities) Change in fair value due to a change in
interest rate by
(€ million)Carrying amount
Estimated fair value + 10 basis points - 10 basis points
As of December 31, 2009Bonds (non-current portion, before swaps) (18,368) (18,368) 75 (75)
Swaps hedging fixed-rates bonds (liabilities) (241) (241)
Swaps hedging fixed-rates bonds (assets) 1,025 1,025
Total swaps hedging fixed-rates bonds (assets and liabilities)
784 784 (57) 57
Current portion of non-current debt after swap (excluding capital lease obligations)
(2,111) (2,111) 3 (3)
Other interest rates swaps (1) (1) 1 (1)Currency swaps and forward exchange contracts 34 34 - -
Assets / (Liabilities) Change in fair value due to a change in
interest rate by
(€ million)Carrying amount
Estimated fair value + 10 basis points - 10 basis points
As of December 31, 2008Bonds (non-current portion, before swaps) (14,119) (14,119) 47 (43)
Swaps hedging fixed-rates bonds (liabilities) (440) (440)
Swaps hedging fixed-rates bonds (assets) 892 892
Total swaps hedging fixed-rates bonds (assets and liabilities)
452 452 (44) 44
Current portion of non-current debt after swap (excluding capital lease obligations)
(2,025) (2,025) 3 (3)
Other interest rates swaps (4) (4) 1 (1)Currency swaps and forward exchange contracts (56) (56) - -
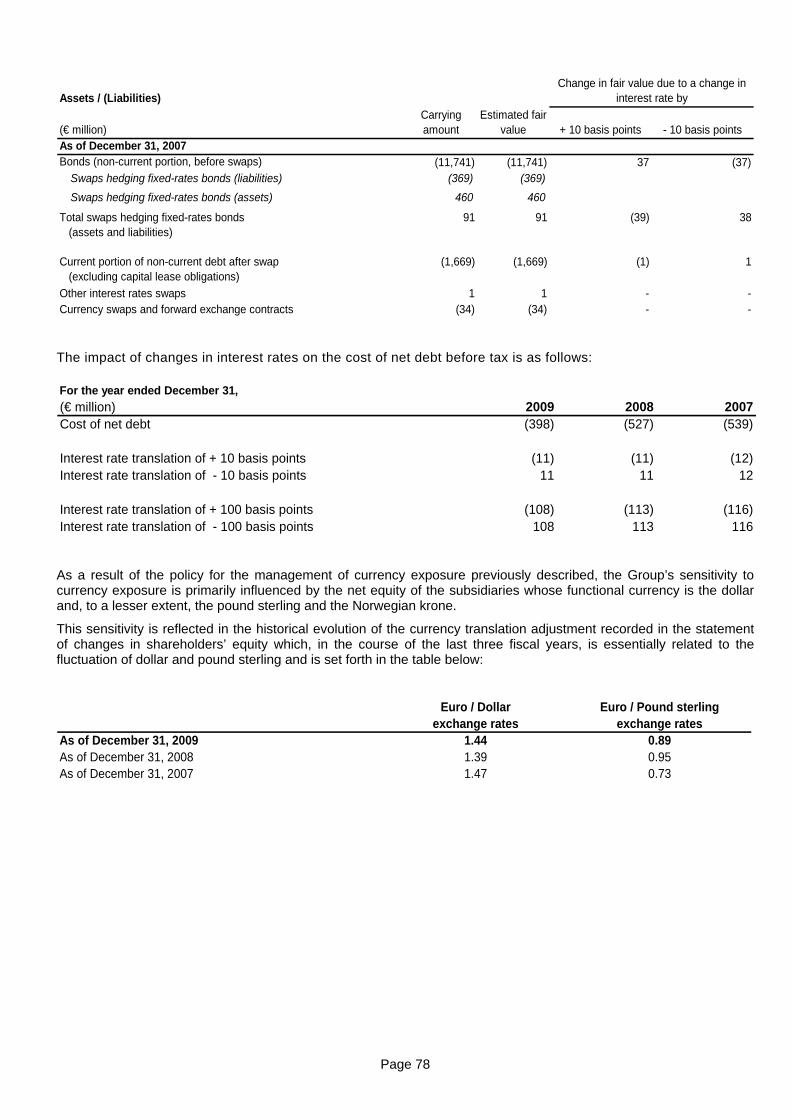
Page 78
Assets / (Liabilities) Change in fair value due to a change in
interest rate by
(€ million)Carrying amount
Estimated fair value + 10 basis points - 10 basis points
As of December 31, 2007Bonds (non-current portion, before swaps) (11,741) (11,741) 37 (37)
Swaps hedging fixed-rates bonds (liabilities) (369) (369)
Swaps hedging fixed-rates bonds (assets) 460 460
Total swaps hedging fixed-rates bonds (assets and liabilities)
91 91 (39) 38
Current portion of non-current debt after swap (excluding capital lease obligations)
(1,669) (1,669) (1) 1
Other interest rates swaps 1 1 - -Currency swaps and forward exchange contracts (34) (34) - -
The impact of changes in interest rates on the cost of net debt before tax is as follows:
For the year ended December 31,
(€ million) 2009 2008 2007Cost of net debt (398) (527) (539)
Interest rate translation of + 10 basis points (11) (11) (12)Interest rate translation of - 10 basis points 11 11 12
Interest rate translation of + 100 basis points (108) (113) (116)Interest rate translation of - 100 basis points 108 113 116
As a result of the policy for the management of currency exposure previously described, the Group’s sensitivity to currency exposure is primarily influenced by the net equity of the subsidiaries whose functional currency is the dollar and, to a lesser extent, the pound sterling and the Norwegian krone.
This sensitivity is reflected in the historical evolution of the currency translation adjustment recorded in the statement of changes in shareholders’ equity which, in the course of the last three fiscal years, is essentially related to the fluctuation of dollar and pound sterling and is set forth in the table below:
Euro / Dollar Euro / Pound sterlingexchange rates exchange rates
As of December 31, 2009 1.44 0.89As of December 31, 2008 1.39 0.95As of December 31, 2007 1.47 0.73

Page 79
As of December 31, 2009 (€ million) Total Euro DollarPound sterling
Other currencies and equity affiliates
Shareholders' equity at historical exchange rate 57,621 27,717 18,671 5,201 6,032Currency translation adjustment before net investment hedge (5,074) (3,027) (1,465) (582)Net investment hedge - open instruments 5 6 (1)Shareholders' equity at exchange rate as of December 31, 2009 52,552 27,717 15,650 3,735 5,450
As of December 31, 2008 (€ million) Total Euro DollarPound sterling
Other currencies and equity affiliates
Shareholders' equity at historical exchange rate 53,868 25,084 15,429 5,587 7,768Currency translation adjustment before net investment hedge (4,876) - (2,191) (1,769) (916)Net investment hedge - open instruments - - - - -Shareholders' equity at exchange rate as of December 31, 2008 48,992 25,084 13,238 3,818 6,852
As of December 31, 2007 (€ million) Total Euro DollarPound sterling
Other currencies and equity affiliates
Shareholders' equity at historical exchange rate 49,254 22,214 12,954 5,477 8,609Currency translation adjustment before net investment hedge (4,410) - (3,501) (289) (620)Net investment hedge - open instruments 14 - 14 - -Shareholders' equity at exchange rate as of December 31, 2007 44,858 22,214 9,467 5,188 7,989
As a result of this policy, the impact of currency exchange rate fluctuations on consolidated income, as illustrated in Note 7 to the Consolidated Financial Statements, has not been significant over the last three years despite the considerable fluctuation of the dollar (loss of €32 million in 2009, gain of €112 million in 2008, gain of €35 million in 2007).
Stock market risk
The Group holds interests in a number of publicly-traded companies (see Notes 12 and 13 to the Consolidated Financial Statements). The market value of these holdings fluctuates due to various factors, including stock market trends, valuations of the sectors in which the companies operate, and the economic and financial condition of each individual company.
Liquidity risk
TOTAL S.A. has confirmed lines of credit granted by international banks, which are calculated to allow it to manage its short-term liquidity needs as required.
As of December 31, 2009, these lines of credit amounted to $9,322 million, of which $9,289 million were unused. The agreements for the lines of credit granted to TOTAL S.A. do not contain conditions related to the Company’s financial ratios, to its financial ratings from specialized agencies, or to the occurrence of events that could have a material adverse effect on its financial position. As of December 31, 2009, the aggregate amount of the principal confirmed lines of credit granted by international banks to Group companies, including TOTAL S.A., was $10,084 million of which $10,051 million were unused. The lines of credit granted to Group companies other than TOTAL S.A. are not intended to finance the Group’s general needs; they are intended to finance either the general needs of the borrowing subsidiary or a specific project.

Page 80
The following tables show the maturity of the financial assets and liabilities of the Group as of December 31, 2009, 2008 and 2007 (see Note 20 to the Consolidated Financial Statements).
Assets / (Liabilities)
As of December 31, 2009 (€ million)
Less than one year
Between 1 year and 5 years
More than 5 years Total
Non-current financial debt (notional value excluding interests) (12,589) (5,823) (18,412)
Current borrowings (6,994) (6,994)
Other current financial liabilities (123) (123)
Current financial assets 311 311
Cash and cash equivalents 11,662 11,662
Net amount before financial expense 4,856 (12,589) (5,823) (13,556)
Financial expense on non-current financial debt (768) (2,007) (1,112) (3,887)
Interest differential on swaps 447 342 (55) 734
Net amount 4,535 (14,254) (6,990) (16,709)
As of December 31, 2008 (€ million)
Less than one year
Between 1 year and 5 years
More than 5 years Total
Non-current financial debt (notional value excluding interests) (13,206) (2,093) (15,299)
Current borrowings (7,722) (7,722)
Other current financial liabilities (158) (158)
Current financial assets 187 187
Cash and cash equivalents 12,321 12,321
Net amount before financial expense 4,628 (13,206) (2,093) (10,671)
Financial expense on non-current financial debt (554) (1,431) (174) (2,159)
Interest differential on swaps 118 410 (7) 521
Net amount 4,192 (14,227) (2,274) (12,309)
As of December 31, 2007 (€ million)
Less than one year
Between 1 year and 5 years
More than 5 years Total
Non-current financial debt (notional value excluding interests) (11,424) (2,992) (14,416)
Current borrowings (4,613) (4,613)
Other current financial liabilities (60) (60)
Current financial assets 1,264 1,264
Cash and cash equivalents 5,988 5,988
Net amount before financial expense 2,579 (11,424) (2,992) (11,837)
Financial expense on non-current financial debt (532) (1,309) (226) (2,067)
Interest differential on swaps (29) (80) (44) (153)
Net amount 2,018 (12,813) (3,262) (14,057)
In addition, the Group guarantees bank debt and finance lease obligations of certain non-consolidated companies and equity affiliates. A payment would be triggered by failure of the guaranteed party to fulfill its obligation covered by the guarantee, and no assets are held as collateral for these guarantees. Maturity dates and amounts are set forth in Note 23 to the Consolidated Financial Statements (“Guarantees given against borrowings”).
The Group also guarantees the current liabilities of certain non-consolidated companies. Performance under these guarantees would be triggered by a financial default of these entities. Maturity dates and amounts are set forth in Note 23 to the Consolidated Financial Statements (“Guarantees of current liabilities”).
The following table sets forth financial assets and liabilities related to operating activities as of December 31, 2009, 2008 and 2007 (see Note 28 to the Consolidated Financial Statements).
Assets / (Liabilities)As of December 31 (€ million) 2009 2008 2007Accounts payable (15,383) (14,815) (18,183)Other operating liabilities (4,706) (4,297) (3,900) including financial instruments related to commodity contracts (923) (1,033) (733)
Accounts receivable, net 15,719 15,287 19,129 Other operating receivables 5,145 6,208 4,430 including financial instruments related to commodity contracts 1,029 1,664 983 Total 775 2,383 1,476
These financial assets and liabilities mainly have a maturity date below one year.

Page 81
Credit risk
Credit risk is defined as the risk of the counterparty to a contract failing to perform or pay the amounts due.
The Group is exposed to credit risks in its operating and financing activities. The Group’s maximum exposure to credit risk is partially related to financial assets recorded on its balance sheet, including energy derivative instruments that have a positive market value.
The following table presents the Group’s maximum credit risk exposure:
As of December 31, (€ million)
Assets / (Liabilities) 2009 2008 2007Loans to equity affiliates (Note 12) 2,367 2,005 2,575 Loans and advances (Note 14) 1,284 1,403 851 Hedging instruments of non-current financial debt (Note 20) 1,025 892 460 Accounts receivable (Note 16) 15,719 15,287 19,129 Other operating receivables (Note 16) 5,145 6,208 4,430 Current financial assets (Note 20) 311 187 1,264 Cash and cash equivalents (Note 27) 11,662 12,321 5,988 Total 37,513 38,303 34,697
The valuation allowance on loans and advances and on accounts receivable and other operating receivables is detailed respectively in Notes 14 and 16 to the Consolidated Financial Statements.
As part of its credit risk management related to operating and financing activities, the Group has developed margin call contracts with certain counterparties. As of December 31, 2009, the net amount paid or received as part of these margin calls was €693 million.
Credit risk is managed by the Group’s business segments as follows:
Upstream Segment
Exploration & Production
Risks arising under contracts with government authorities or other oil companies or under long-term supply contracts necessary for the development of projects are evaluated during the project approval process. The long-term aspect of these contracts and the high-quality of the other parties lead to a low level of credit risk.
Risks related to commercial operations, other than those described above (which are, in practice, directly monitored by subsidiaries), are subject to procedures for establishing and reviewing credit.
Customer receivables are subject to provisions on a case-by-case basis, based on prior history and management’s assessment of the facts and circumstances.
Gas & Power
The Gas & Power division deals with counterparties in the energy, industrial and financial sectors throughout the world, primarily in Europe and North America. Financial institutions providing credit risk coverage are highly rated international bank and insurance groups.
Potential counterparties are subject to credit assessment and approval before concluding transactions and are thereafter subject to regular review, including re-appraisal and approval of the limits previously granted.
The creditworthiness of counterparties is assessed based on an analysis of quantitative and qualitative data regarding financial standing and business risks, together with the review of any relevant third party and market information, such as data published by rating agencies. On this basis, credit limits are defined for each potential counterparty and, where appropriate, transactions are subject to specific authorizations.
Credit exposure, which is essentially an economic exposure or an expected future physical exposure, is permanently monitored and subject to sensitivity measures.
Credit risk is mitigated by the systematic use of industry standard contractual frameworks that permit netting, enable requiring added security in case of adverse change in the counterparty risk, and allow for termination of the contract upon occurrence of certain events of default.
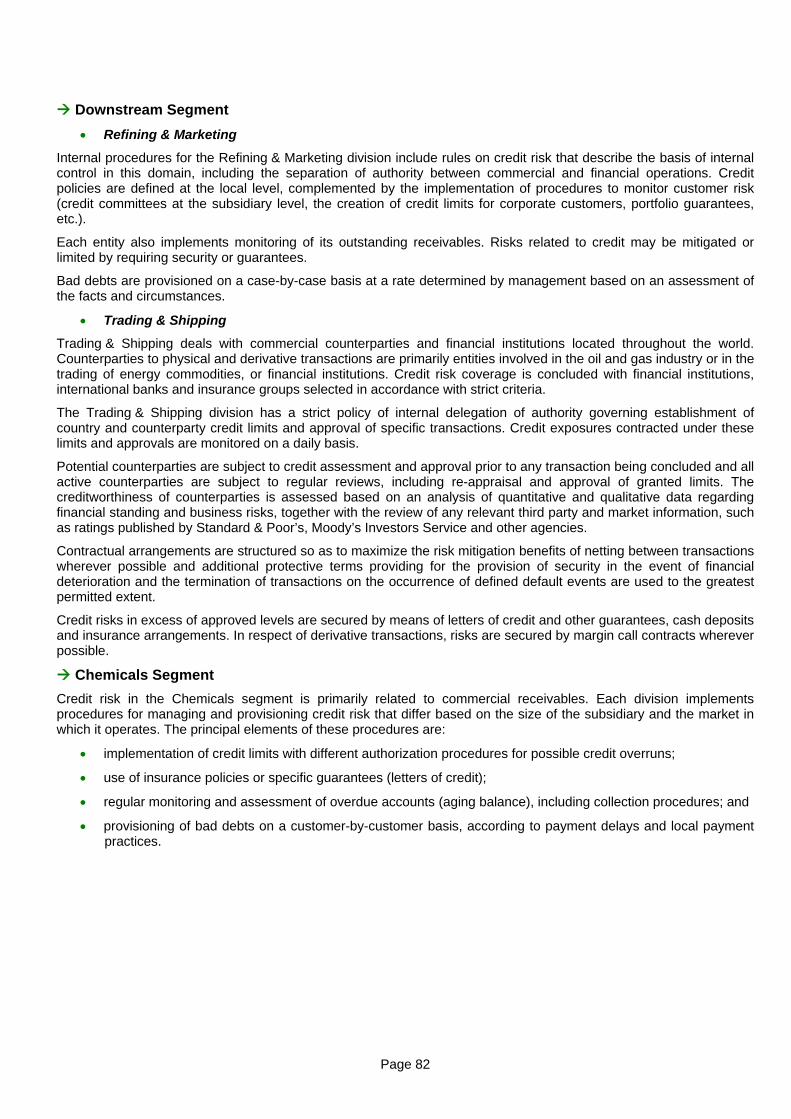
Page 82
Downstream Segment
Refining & Marketing
Internal procedures for the Refining & Marketing division include rules on credit risk that describe the basis of internal control in this domain, including the separation of authority between commercial and financial operations. Credit policies are defined at the local level, complemented by the implementation of procedures to monitor customer risk (credit committees at the subsidiary level, the creation of credit limits for corporate customers, portfolio guarantees, etc.).
Each entity also implements monitoring of its outstanding receivables. Risks related to credit may be mitigated or limited by requiring security or guarantees.
Bad debts are provisioned on a case-by-case basis at a rate determined by management based on an assessment of the facts and circumstances.
Trading & Shipping
Trading & Shipping deals with commercial counterparties and financial institutions located throughout the world. Counterparties to physical and derivative transactions are primarily entities involved in the oil and gas industry or in the trading of energy commodities, or financial institutions. Credit risk coverage is concluded with financial institutions, international banks and insurance groups selected in accordance with strict criteria.
The Trading & Shipping division has a strict policy of internal delegation of authority governing establishment of country and counterparty credit limits and approval of specific transactions. Credit exposures contracted under these limits and approvals are monitored on a daily basis.
Potential counterparties are subject to credit assessment and approval prior to any transaction being concluded and all active counterparties are subject to regular reviews, including re-appraisal and approval of granted limits. The creditworthiness of counterparties is assessed based on an analysis of quantitative and qualitative data regarding financial standing and business risks, together with the review of any relevant third party and market information, such as ratings published by Standard & Poor’s, Moody’s Investors Service and other agencies.
Contractual arrangements are structured so as to maximize the risk mitigation benefits of netting between transactions wherever possible and additional protective terms providing for the provision of security in the event of financial deterioration and the termination of transactions on the occurrence of defined default events are used to the greatest permitted extent.
Credit risks in excess of approved levels are secured by means of letters of credit and other guarantees, cash deposits and insurance arrangements. In respect of derivative transactions, risks are secured by margin call contracts wherever possible.
Chemicals Segment
Credit risk in the Chemicals segment is primarily related to commercial receivables. Each division implements procedures for managing and provisioning credit risk that differ based on the size of the subsidiary and the market in which it operates. The principal elements of these procedures are:
implementation of credit limits with different authorization procedures for possible credit overruns;
use of insurance policies or specific guarantees (letters of credit);
regular monitoring and assessment of overdue accounts (aging balance), including collection procedures; and
provisioning of bad debts on a customer-by-customer basis, according to payment delays and local payment practices.

Page 83
32) Other risks and contingent liabilities
TOTAL is not currently aware of any event, litigation, risks or contingent liabilities that could have a material impact on the assets and liabilities, results, financial position or operations of the Group.
Antitrust investigations
1. Following investigations into certain commercial practices in the chemicals industry in the United States, some subsidiaries of the Arkema(1) group have been involved in criminal investigations, closed as of today, and civil liability lawsuits in the United States for violations of antitrust laws. TOTAL S.A. has been named in certain of these suits as the parent company.
In Europe, the European Commission commenced investigations in 2000, 2003 and 2004 into alleged anti-competitive practices involving certain products sold by Arkema. In January 2005, under one of these investigations, the European Commission fined Arkema €13.5 million and jointly fined Arkema and Elf Aquitaine €45 million. The appeal from Arkema and Elf Aquitaine before the Court of First Instance of the European Union has been rejected on September 30, 2009. A recourse before the Court of Justice of the European Communities has been filed.
The Commission notified Arkema, TOTAL S.A. and Elf Aquitaine of complaints concerning two other product lines in January and August 2005, respectively. Arkema has cooperated with the authorities in these procedures and investigations. In May 2006, the European Commission fined Arkema €78.7 million and €219.1 million, as a result of, respectively, each of these two proceedings. Elf Aquitaine was held jointly and severally liable for, respectively, €65.1 million and €181.35 million of these fines while TOTAL S.A. was held jointly and severally liable, respectively, for €42 million and €140.4 million. TOTAL S.A., Arkema and Elf Aquitaine have appealed these decisions to the Court of First Instance of the European Union.
Arkema and Elf Aquitaine received a statement of objections from the European Commission in August 2007 concerning alleged anti-competitive practices related to another line of chemical products. As a result, in June 2008, Arkema and Elf Aquitaine have been jointly and severally fined in an amount of €22.7 million and individually in an amount of €20.43 million for Arkema and €15.89 million for Elf Aquitaine. The companies concerned appealed this decision to the relevant European court.
Arkema and Elf Aquitaine received a statement of objections from the European Commission in March 2009 concerning alleged anti-competitive practices related to another line of chemical products. The decision has been rendered by the Commission in November 2009. The companies have been jointly and severally fined in an amount of €11 million and individually in an amount of €9.92 million for Arkema and €7.71 million for Elf Aquitaine. The concerned companies will appeal this decision to the relevant European Court.
No facts have been alleged that would implicate TOTAL S.A. or Elf Aquitaine in the practices questioned in these proceedings, and the fines received are based solely on their status as parent companies.
Arkema began implementing compliance procedures in 2001 that are designed to prevent its employees from violating antitrust provisions. However, it is not possible to exclude the possibility that the relevant authorities could commence additional proceedings involving Arkema, as well as TOTAL S.A. and Elf Aquitaine.
2. As part of the agreement relating to the spin-off of Arkema, TOTAL S.A. or certain other Group companies agreed to grant Arkema guarantees for certain risks related to antitrust proceedings arising from events prior to the spin-off.
These guarantees cover, for a period of ten years that began in 2006, 90% of amounts paid by Arkema related to (i) fines imposed by European authorities or European member-states for competition law violations, (ii) fines imposed by U.S. courts or antitrust authorities for federal antitrust violations or violations of the competition laws of U.S. states, (iii) damages awarded in civil proceedings related to the government proceedings mentioned above, and (iv) certain costs related to these proceedings.
The guarantee covering the risks related to anticompetition violations in Europe applies to amounts above a €176.5 million threshold.
If one or more individuals or legal entities, acting alone or together, directly or indirectly holds more than one-third of the voting rights of Arkema, or if Arkema transfers more than 50% of its assets (as calculated under the enterprise valuation method, as of the date of the transfer) to a third party or parties acting together, irrespective of the type or number of transfers, these guarantees will become void.
(1) Arkema is used in this section to designate those companies of the Arkema group whose ultimate parent company is Arkema S.A.. Arkema became an independent company after being spun-off from Total S.A. in May 2006.

Page 84
On the other hand, the agreements provide that Arkema will indemnify TOTAL S.A. or any Group company for 10% of any amount that TOTAL S.A. or any Group company are required to pay under any of the proceedings covered by these guarantees.
3. The Group has recorded provisions amounting to €43 million in its consolidated financial statements as of December 31, 2009 to cover the risks mentioned above.
4. Moreover, as a result of investigations started by the European Commission in October 2002 concerning certain Refining & Marketing subsidiaries of the Group, Total Nederland N.V. and TOTAL S.A. received a statement of objections in October 2004. These proceedings resulted, in September 2006, in Total Nederland N.V. being fined €20.25 million and in TOTAL S.A. as its parent company being held jointly responsible for €13.5 million of this amount, although no facts implicating TOTAL S.A. in the practices under investigation were alleged. TOTAL S.A. and Total Nederland N.V. have appealed this decision to the Court of First Instance of the European Union.
In addition, in May 2007, Total France and TOTAL S.A. received a statement of objections regarding alleged antitrust practices concerning another product line of the Refining & Marketing division. These proceedings resulted, in October 2008, in Total France being fined €128.2 million and in TOTAL S.A., as its parent company, being held jointly responsible although no facts implicating TOTAL S.A. in the practices under investigation were alleged. TOTAL S.A. and Total Raffinage Marketing (the new corporate name of Total France) have appealed this decision to the Court of First Instance of the European Union.
Furthermore, in July 2009, the French antitrust Authority sent to TotalGaz and Total Raffinage Marketing a statement of objections regarding alleged antitrust practices concerning another product line of the Refining & Marketing division.
5. Given the discretionary powers granted to antitrust Authorities for determining fines, it is not currently possible to determine with certainty the ultimate outcome of these investigations and proceedings. TOTAL S.A. and Elf Aquitaine are contesting their liability and the method of determining these fines. Although it is not possible to predict the outcome of these proceedings, the Group believes that they will not have a material adverse effect on its financial condition or results.
Buncefield
On December 11, 2005, several explosions, followed by a major fire, occurred at an oil storage depot at Buncefield, north of London. This depot is operated by Hertfordshire Oil Storage Limited (HOSL), a company in which the British subsidiary of TOTAL holds 60% and another oil group holds 40%.
The explosion caused minor injuries to a number of people and caused property damage to the depot and the buildings and homes located nearby. The official Independent Investigation Board has indicated that the explosion was caused by the overflow of a tank at the depot. The Board’s final report was released on December 11, 2008. The civil procedure for claims, which had not yet been settled, took place between October and December 2008. The Court’s decision of March 20, 2009, declared the British subsidiary of TOTAL responsible for the accident and solely liable for indemnifying the victims. TOTAL’s British subsidiary has appealed this decision. The appeal trial took place in January 2010 and a decision is expected during the first-half 2010.
With respect to civil liability the provision recorded in the Group’s consolidated financial statements as of December 31, 2009 amounts to € 295 million after payments already completed.
The Group carries insurance for damage to its interests in these facilities, business interruption and civil liability claims from third parties. The residual amount to be received from insurers amounts to € 211 million as of December 31, 2009.
The Group believes that, based on the information currently available, on a reasonable estimate of its liability and on provisions recognized, this accident should not have a significant impact on the Group’s financial situation or consolidated results.
On December 1, 2008, the Health and Safety Executive (HSE) and the Environment Agency (EA) issued a Notice of prosecution against five companies, including the British subsidiary of TOTAL. In November 2009, the British subsidiary of TOTAL, pleaded guilty to charges brought by the prosecution and intends to claim/raise, into this framework, a number of elements likely to mitigate the impact of the charges brought against it.
Erika
Following the sinking in December 1999 of the Erika, a tanker that was transporting products belonging to one of the Group companies, the Tribunal de grande instance of Paris convicted TOTAL S.A. of marine pollution pursuant to a judgment issued on January 16, 2008, finding that TOTAL S.A. was negligent in its vetting procedure for vessel selection. TOTAL S.A. was fined € 375,000. The court also ordered compensation to be paid to the victims of pollution from the Erika up to an aggregate amount of €192 million, declaring TOTAL S.A. jointly and severally liable for such payments together with the Erika’s inspection and classification firm, the Erika’s owner and the Erika’s manager.
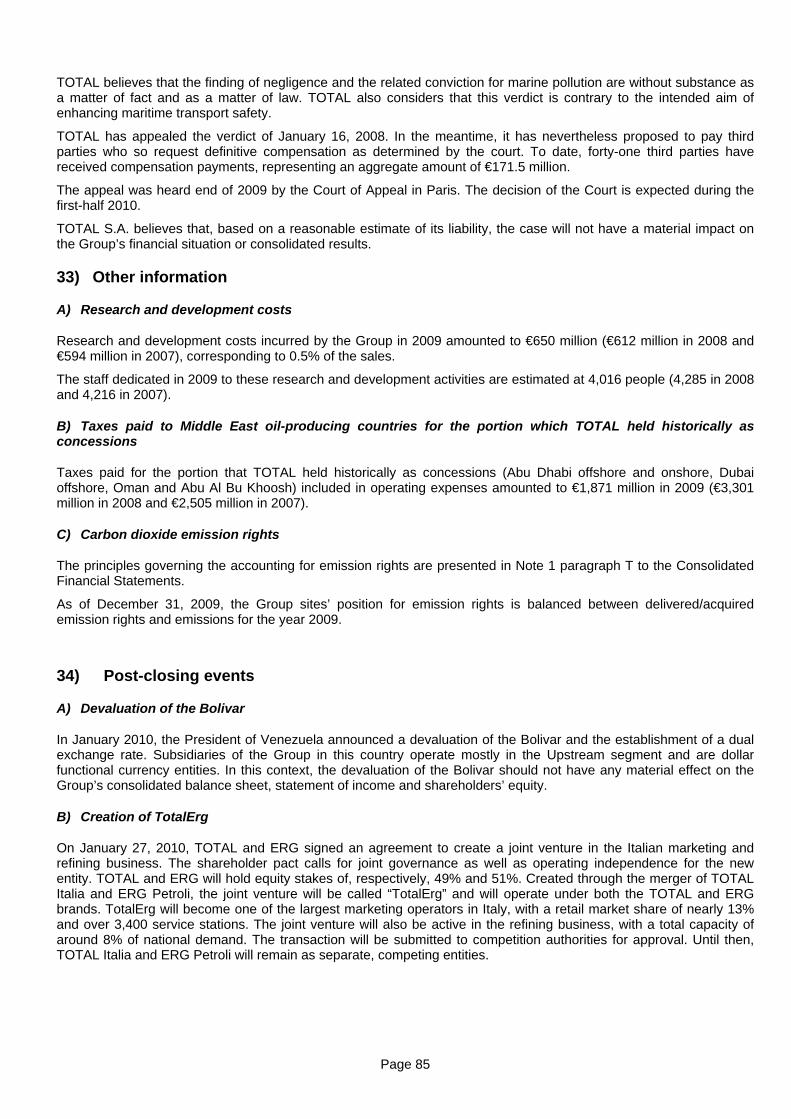
Page 85
TOTAL believes that the finding of negligence and the related conviction for marine pollution are without substance as a matter of fact and as a matter of law. TOTAL also considers that this verdict is contrary to the intended aim of enhancing maritime transport safety.
TOTAL has appealed the verdict of January 16, 2008. In the meantime, it has nevertheless proposed to pay third parties who so request definitive compensation as determined by the court. To date, forty-one third parties have received compensation payments, representing an aggregate amount of €171.5 million.
The appeal was heard end of 2009 by the Court of Appeal in Paris. The decision of the Court is expected during the first-half 2010.
TOTAL S.A. believes that, based on a reasonable estimate of its liability, the case will not have a material impact on the Group’s financial situation or consolidated results.
33) Other information
A) Research and development costs
Research and development costs incurred by the Group in 2009 amounted to €650 million (€612 million in 2008 and €594 million in 2007), corresponding to 0.5% of the sales.
The staff dedicated in 2009 to these research and development activities are estimated at 4,016 people (4,285 in 2008 and 4,216 in 2007).
B) Taxes paid to Middle East oil-producing countries for the portion which TOTAL held historically as concessions
Taxes paid for the portion that TOTAL held historically as concessions (Abu Dhabi offshore and onshore, Dubai offshore, Oman and Abu Al Bu Khoosh) included in operating expenses amounted to €1,871 million in 2009 (€3,301 million in 2008 and €2,505 million in 2007).
C) Carbon dioxide emission rights
The principles governing the accounting for emission rights are presented in Note 1 paragraph T to the Consolidated Financial Statements.
As of December 31, 2009, the Group sites’ position for emission rights is balanced between delivered/acquired emission rights and emissions for the year 2009.
34) Post-closing events
A) Devaluation of the Bolivar
In January 2010, the President of Venezuela announced a devaluation of the Bolivar and the establishment of a dual exchange rate. Subsidiaries of the Group in this country operate mostly in the Upstream segment and are dollar functional currency entities. In this context, the devaluation of the Bolivar should not have any material effect on the Group’s consolidated balance sheet, statement of income and shareholders’ equity.
B) Creation of TotalErg
On January 27, 2010, TOTAL and ERG signed an agreement to create a joint venture in the Italian marketing and refining business. The shareholder pact calls for joint governance as well as operating independence for the new entity. TOTAL and ERG will hold equity stakes of, respectively, 49% and 51%. Created through the merger of TOTAL Italia and ERG Petroli, the joint venture will be called “TotalErg” and will operate under both the TOTAL and ERG brands. TotalErg will become one of the largest marketing operators in Italy, with a retail market share of nearly 13% and over 3,400 service stations. The joint venture will also be active in the refining business, with a total capacity of around 8% of national demand. The transaction will be submitted to competition authorities for approval. Until then, TOTAL Italia and ERG Petroli will remain as separate, competing entities.
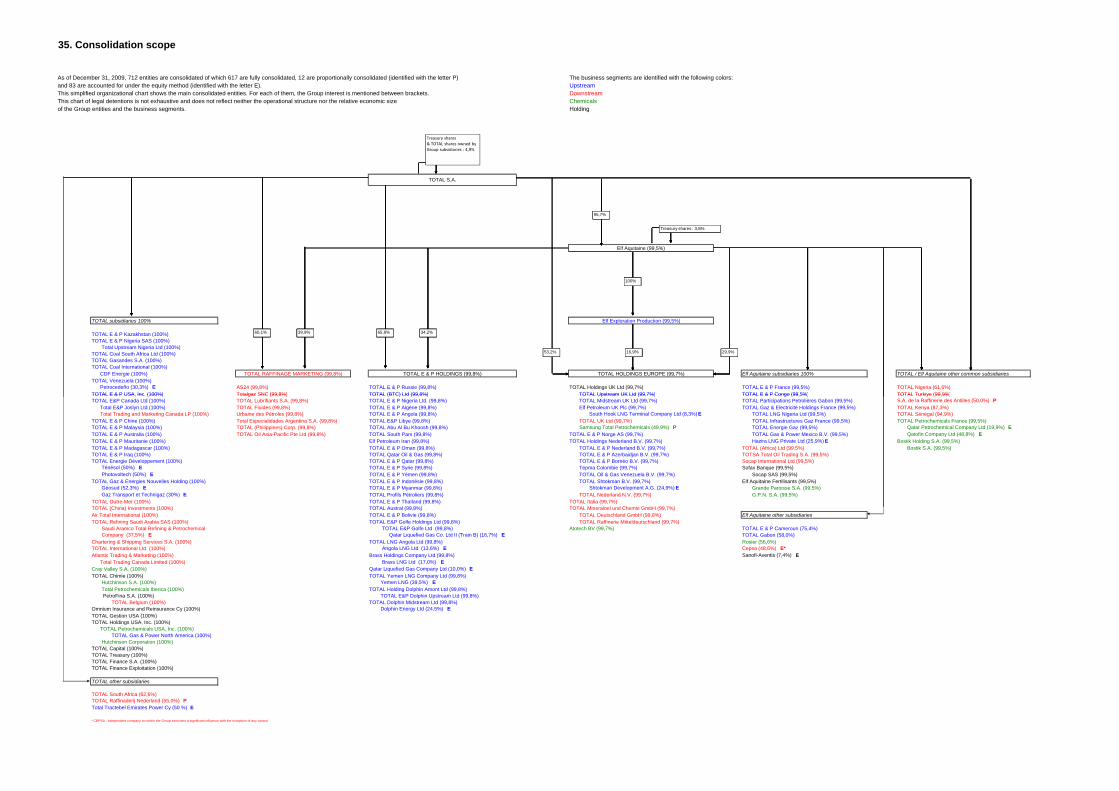
35. Consolidation scope
As of December 31, 2009, 712 entities are consolidated of which 617 are fully consolidated, 12 are proportionally consolidated (identified with the letter P) The business segments are identified with the following colors:and 83 are accounted for under the equity method (identified with the letter E). UpstreamThis simplified organizational chart shows the main consolidated entities. For each of them, the Group interest is mentioned between brackets. DownstreamThis chart of legal detentions is not exhaustive and does not reflect neither the operational structure nor the relative economic size Chemicalsof the Group entities and the business segments. Holding
TOTAL S.A.
Elf Aquitaine (99,5%)
TOTAL subsidiaries 100% Elf Exploration Production (99,5%)
TOTAL E & P Kazakhstan (100%)TOTAL E & P Nigeria SAS (100%) Total Upstream Nigeria Ltd (100%)TOTAL Coal South Africa Ltd (100%)TOTAL Gasandes S.A. (100%)TOTAL Coal International (100%) CDF Energie (100%) TOTAL RAFFINAGE MARKETING (99,8%) TOTAL E & P HOLDINGS (99,8%) TOTAL HOLDINGS EUROPE (99,7%) Elf Aquitaine subsidiaries 100% TOTAL / Elf Aquitaine other common subsidiariesTOTAL Venezuela (100%) Petrocedeño (30,3%) E AS24 (99,8%) TOTAL E & P Russie (99,8%) TOTAL Holdings UK Ltd (99,7%) TOTAL E & P France (99,5%) TOTAL Nigeria (61,6%)TOTAL E & P USA, Inc. (100%) Totalgaz SNC (99,8%) TOTAL (BTC) Ltd (99,8%) TOTAL Upstream UK Ltd (99,7%) TOTAL E & P Congo (99,5%) TOTAL Turkiye (99,9%)
60.1%
95.6%
100%
29.9%16.9%53.2%
34.2%65.8%39.9%
Autodétention: 3,8%
60.1%
100%
29.9%16.9%53.2%
34.2%65.8%39.9%
Autodétention: 3,8%
60,1%
100%
29,9%16,9%53,2%
34,2%65,8%39,9%
Treasury shares& TOTAL shares owned by Group subsidiaries : 4,9%
Treasury shares : 3,8%
95,7%
TOTAL E & P USA, Inc. (100%) Totalgaz SNC (99,8%) TOTAL (BTC) Ltd (99,8%) TOTAL Upstream UK Ltd (99,7%) TOTAL E & P Congo (99,5%) TOTAL Turkiye (99,9%)TOTAL E&P Canada Ltd (100%) TOTAL Lubrifiants S.A. (99,8%) TOTAL E & P Nigeria Ltd. (99,8%) TOTAL Midstream UK Ltd (99,7%) TOTAL Participations Petrolières Gabon (99,5%) S.A. de la Raffinerie des Antilles (50,0%) P Total E&P Joslyn Ltd (100%) TOTAL Fluides (99,8%) TOTAL E & P Algérie (99,8%) Elf Petroleum UK Plc (99,7%) TOTAL Gaz & Electricité Holdings France (99,5%) TOTAL Kenya (87,3%) Total Trading and Marketing Canada LP (100%) Urbaine des Pétroles (99,8%) TOTAL E & P Angola (99,8%) South Hook LNG Terminal Company Ltd (8,3%) E TOTAL LNG Nigeria Ltd (99,5%) TOTAL Sénégal (94,9%)TOTAL E & P Chine (100%) Total Especialidades Argentina S.A. (99,8%) TOTAL E&P Libye (99,8%) TOTAL UK Ltd (99,7%) TOTAL Infrastructures Gaz France (99,5%) TOTAL Petrochemicals France (99,5%)TOTAL E & P Malaysia (100%) TOTAL (Philippines) Corp. (99,8%) TOTAL Abu Al Bu Khoosh (99,8%) Samsung Total Petrochemicals (49,9%) P TOTAL Energie Gaz (99,5%) Qatar Petrochemical Company Ltd (19,9%) ETOTAL E & P Australia (100%) TOTAL Oil Asia-Pacific Pte Ltd (99,8%) TOTAL South Pars (99,8%) TOTAL E & P Norge AS (99,7%) TOTAL Gas & Power Mexico B.V. (99,5%) Qatofin Company Ltd (48,8%) ETOTAL E & P Mauritanie (100%) Elf Petroleum Iran (99,8%) TOTAL Holdings Nederland B.V. (99,7%) Hazira LNG Private Ltd (25,9%) E Bostik Holding S.A. (99,5%)TOTAL E & P Madagascar (100%) TOTAL E & P Oman (99,8%) TOTAL E & P Nederland B.V. (99,7%) TOTAL (Africa) Ltd (99,5%) Bostik S.A. (99,5%)TOTAL E & P Iraq (100%) TOTAL Qatar Oil & Gas (99,8%) TOTAL E & P Azerbaidjan B.V. (99,7%) TOTSA Total Oil Trading S.A. (99,5%)TOTAL Energie Développement (100%) TOTAL E & P Qatar (99,8%) TOTAL E & P Bornéo B.V. (99,7%) Socap International Ltd (99,5%) Ténésol (50%) E TOTAL E & P Syrie (99,8%) Tepma Colombie (99,7%) Sofax Banque (99,5%) Photovoltech (50%) E TOTAL E & P Yémen (99,8%) TOTAL Oil & Gas Venezuela B.V. (99,7%) Socap SAS (99,5%)TOTAL Gaz & Energies Nouvelles Holding (100%) TOTAL E & P Indonésie (99,8%) TOTAL Shtokman B.V. (99,7%) Elf Aquitaine Fertilisants (99,5%) Géosud (52,3%) E TOTAL E & P Myanmar (99,8%) Shtokman Development A.G. (24,9%) E Grande Paroisse S.A. (99,5%) Gaz Transport et Technigaz (30%) E TOTAL Profils Pétroliers (99,8%) TOTAL Nederland N.V. (99,7%) G.P.N. S.A. (99,5%)TOTAL Outre-Mer (100%) TOTAL E & P Thaïland (99,8%) TOTAL Italia (99,7%)TOTAL (China) Investments (100%) TOTAL Austral (99,8%) TOTAL Mineraloel und Chemie GmbH (99,7%)Air Total International (100%) TOTAL E & P Bolivie (99,8%) TOTAL Deutschland GmbH (99,8%) Elf Aquitaine other subsidiariesTOTAL Refining Saudi Arabia SAS (100%) TOTAL E&P Golfe Holdings Ltd (99,8%) TOTAL Raffinerie Mitteldeutschland (99,7%) Saudi Aramco Total Refining & Petrochemical TOTAL E&P Golfe Ltd (99,8%) Atotech BV (99,7%) TOTAL E & P Cameroun (75,4%) Company (37,5%) E Qatar Liquefied Gas Co. Ltd II (Train B) (16,7%) E TOTAL Gabon (58,0%)Chartering & Shipping Services S.A. (100%) TOTAL LNG Angola Ltd (99,8%) Rosier (56,6%)TOTAL International Ltd. (100%) Angola LNG Ltd (13,6%) E Cepsa (48,6%) E*Atlantic Trading & Marketing (100%) Brass Holdings Company Ltd (99,8%) Sanofi-Aventis (7,4%) E Total Trading Canada Limited (100%) Brass LNG Ltd (17,0%) ECray Valley S.A. (100%) Qatar Liquefied Gas Company Ltd (10,0%) ETOTAL Chimie (100%) TOTAL Yemen LNG Company Ltd (99,8%) Hutchinson S.A. (100%) Yemen LNG (39,5%) E Total Petrochemicals Iberica (100%) TOTAL Holding Dolphin Amont Ltd (99,8%) PetroFina S.A. (100%) TOTAL E&P Dolphin Upstream Ltd (99,8%) TOTAL Belgium (100%) TOTAL Dolphin Midstream Ltd (99,8%)Omnium Insurance and Reinsurance Cy (100%) Dolphin Energy Ltd (24,5%) ETOTAL Gestion USA (100%)TOTAL Holdings USA, Inc. (100%) TOTAL Petrochemicals USA, Inc. (100%) TOTAL Gas & Power North America (100%) Hutchinson Corporation (100%)TOTAL Capital (100%)TOTAL Treasury (100%)TOTAL Finance S.A. (100%)TOTAL Finance Exploitation (100%)
TOTAL other subsidiaries
TOTAL South Africa (62,6%)TOTAL Raffinaderij Nederland (55,0%) PTotal Tractebel Emirates Power Cy (50 %) E
* CEPSA : Independent company on which the Group exercises a significant influence with the exception of any control
60.1%
95.6%
100%
29.9%16.9%53.2%
34.2%65.8%39.9%
Autodétention: 3,8%
60.1%
100%
29.9%16.9%53.2%
34.2%65.8%39.9%
Autodétention: 3,8%
60,1%
100%
29,9%16,9%53,2%
34,2%65,8%39,9%
Treasury shares& TOTAL shares owned by Group subsidiaries : 4,9%
Treasury shares : 3,8%
95,7%