Embed Size (px)
Citation preview

Introduction Case study Reverse engineering Nouveau & mesa APIs & Tools Conclusion
Status update of NVIDIA's performance countersfor Nouveau
Samuel Pitoiset
Nouveau & X.Org developer enthusiast
September 17th, 2015
1 / 35
Introduction Case study Reverse engineering Nouveau & mesa APIs & Tools Conclusion
Who am I ?
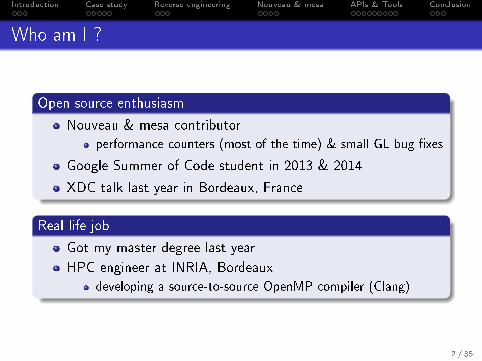
Open source enthusiasm
Nouveau & mesa contributor
performance counters (most of the time) & small GL bug �xes
Google Summer of Code student in 2013 & 2014
XDC talk last year in Bordeaux, France
Real life job
Got my master degree last year
HPC engineer at INRIA, Bordeaux
developing a source-to-source OpenMP compiler (Clang)
2 / 35

Introduction Case study Reverse engineering Nouveau & mesa APIs & Tools Conclusion
Summary
1 IntroductionWhat are performance counters ?NVIDIA's perf countersNVIDIA's pro�ling tools
2 Case study
3 Reverse engineering
4 Nouveau & mesa
5 APIs & Tools
6 Conclusion3 / 35

Introduction Case study Reverse engineering Nouveau & mesa APIs & Tools Conclusion
What are performance counters ?
Performance counters
are blocks in modern processors that monitor their activity
count low-level hardware events such as cache hits/misses
Why use them ?
to analyze the bottlenecks of 3D and GPGPU applications
to dynamically adjust the performance level of the GPU
How to use them ?
GUIs like NVIDIA Nsight and Linux Graphics Debugger
APIs like NVIDIA CUPTI and PerfKit
OpenGL extensions like GL_AMD_performance_monitor
4 / 35

Introduction Case study Reverse engineering Nouveau & mesa APIs & Tools Conclusion
NVIDIA's performance counters
Two groups of counters exposed
compute counters for GPGPU applications
ex: warps_launched, divergent_branch ...
graphics counters for 3D applications
ex: shader_busy, texture_busy ...
Di�erent types of counters
global counters
collect activities regardless of the context
local counters
collect activities per-context only
5 / 35

Introduction Case study Reverse engineering Nouveau & mesa APIs & Tools Conclusion
NVIDIA's pro�ling tools
Visual Pro�ler
cross-platform performance pro�ling tools for CUDA apps
based on CUPTI API (expose compute-related counters)
Nsight
Visual Studio plugin for pro�ling GL/D3D apps (Windows)
based on PerfKit API (expose graphics-related counters)
Linux Graphics Debugger
performance pro�ling tools for GL apps (SIGGRAPH'15)
expose graphics-related counters on Linux (yeah!)
unfortunately, no API like PerfKit is provided
6 / 35

Introduction Case study Reverse engineering Nouveau & mesa APIs & Tools Conclusion
Summary
1 Introduction
2 Case studyImprove a GL app with NVIDIA's toolsWhat about Nouveau ?
3 Reverse engineering
4 Nouveau & mesa
5 APIs & Tools
6 Conclusion
7 / 35

Introduction Case study Reverse engineering Nouveau & mesa APIs & Tools Conclusion
Improve a GL app
How to improve performance of a GL app using perf counters ?
Let's try NVIDIA Linux Graphics Debugger!
8 / 35

Introduction Case study Reverse engineering Nouveau & mesa APIs & Tools Conclusion
Figure : A brain rendered in OpenGL with 165786 voxels
9 / 35

Introduction Case study Reverse engineering Nouveau & mesa APIs & Tools Conclusion
Improve a GL app
Perf counters Values
FPS 56
geom_busy 1%
shader_busy 0.2%
texture_busy 0.5%
ia_requests 350000
l2_read_sysmem_sectors 200000
mmh...l2_read_sysmem_sectors seems to very high and this is probably
one of the bottlenecks!
10 / 35

Introduction Case study Reverse engineering Nouveau & mesa APIs & Tools Conclusion
Improve a GL app
Problem
too many memory reads from the system memory
due to the GPU fetching the vertices at every frame
Solution
use a vbo to store the vertices on the GPU
Perf counters Without VBO With VBO
FPS 56 4701
geom_busy 1% 1%
shader_busy 0.2% 0.2%
texture_busy 0.5% 0.5%
ia_requests 350000 250000
l2_read_sysmem_sectors 200000 35
1There are probably other bottlenecks but this is just a basic example11 / 35

Introduction Case study Reverse engineering Nouveau & mesa APIs & Tools Conclusion
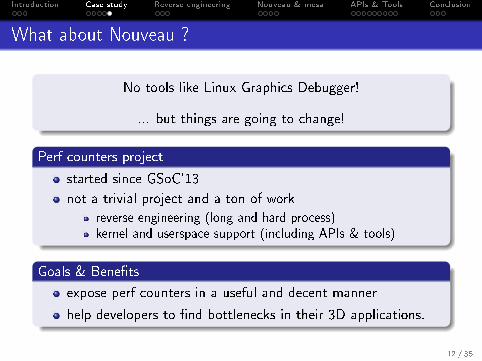
What about Nouveau ?
No tools like Linux Graphics Debugger!
... but things are going to change!
Perf counters project
started since GSoC'13
not a trivial project and a ton of work
reverse engineering (long and hard process)kernel and userspace support (including APIs & tools)
Goals & Bene�ts
expose perf counters in a useful and decent manner
help developers to �nd bottlenecks in their 3D applications.
12 / 35

Introduction Case study Reverse engineering Nouveau & mesa APIs & Tools Conclusion
What about Nouveau ?
No tools like Linux Graphics Debugger!
... but things are going to change!
Perf counters project
started since GSoC'13
not a trivial project and a ton of work
reverse engineering (long and hard process)kernel and userspace support (including APIs & tools)
Goals & Bene�ts
expose perf counters in a useful and decent manner
help developers to �nd bottlenecks in their 3D applications.
12 / 35

Introduction Case study Reverse engineering Nouveau & mesa APIs & Tools Conclusion
Summary
1 Introduction
2 Case study
3 Reverse engineeringCompute-related countersGraphics-related countersCurrent status
4 Nouveau & mesa
5 APIs & Tools
6 Conclusion13 / 35

Introduction Case study Reverse engineering Nouveau & mesa APIs & Tools Conclusion
Compute-related counters
Requirements
CUDA and CUPTI API (CUDA Pro�ling Tools Interface)
valgrind-mmt and demmt (envytools)
cupti_trace from envytools repository
tool which helped me a lot in the REing process
How does it work?
1 launch cupti_trace (ie. cupti_trace -a NVXX)
will automatically trace each hardware event exposed
2 grab a cup of co�ee :) and wait few minutes
3 traces are now saved to your disk
4 analyze and document them
14 / 35

Introduction Case study Reverse engineering Nouveau & mesa APIs & Tools Conclusion
Graphics-related counters
Reverse engineering PerfKit on Windows
really painful and very long process! :(
no MMIO traces and no valgrind-mmt
need to do it by hand (dump registers, etc)
very hard to �nd multiplexers
Reverse engineering LGD on Linux
this Linux Graphics Debugger saved my brain! :)
almost same process as compute-related counters;
but not automatically because it's a GUI.
really easy to �nd multiplexers this time.
15 / 35

Introduction Case study Reverse engineering Nouveau & mesa APIs & Tools Conclusion
Current status
DONE means it's fully reversed and documented
MOSTLY means that some perf counters are reversed
WIP means that I started the reverse engineering process
TODO means that it's on my (long) todolist
Perf counters Tesla Fermi Kepler Maxwell
Graphics MOSTLY1 DONE WIP2 TODO
Compute DONE DONE DONE MOSTLY3
1Except per-context counters (requires PerfKit).2Need to RE new counting modes.3Only on GM107 and need to RE per-context counters logic.
16 / 35

Introduction Case study Reverse engineering Nouveau & mesa APIs & Tools Conclusion
Summary
1 Introduction
2 Case study
3 Reverse engineering
4 Nouveau & mesaKernel interfaceSynchronization
5 APIs & Tools
6 Conclusion
17 / 35

Introduction Case study Reverse engineering Nouveau & mesa APIs & Tools Conclusion
Kernel interface
Why is a kernel interface needed ?
because global counters have to be programmed via MMIO
only root or the kernel can write to them
What the interface has to do ?
set up the con�guration of counters
poll counters
expose counter's data to the userspace (readout)
18 / 35

Introduction Case study Reverse engineering Nouveau & mesa APIs & Tools Conclusion
Synchronization
Synchronizing operations
CPU: ioctls
GPU: software methods
Software method
command added to the command stream of the GPU context
upon reaching the command, the GPU is paused
the CPU gets an IRQ and handles the command
19 / 35

Introduction Case study Reverse engineering Nouveau & mesa APIs & Tools Conclusion
Nouveau
Perfmon work
expose low-level con�guration of perf counters
include lot of signals/sources for Tesla, Fermi and Kepler
allow to schedule/monitor perf counters from the userspace
based on nvif (ioctls interface)
no Perf support is planned for now!
20 / 35

Introduction Case study Reverse engineering Nouveau & mesa APIs & Tools Conclusion
mesa
NV50 driver
patches series already submitted to mesa-dev (pending)
because this requires a libdrm release with nvif support
will expose around 30 global perf counters
will enable GL_AMD_performance_monitor
NVC0 driver
patches still in my local tree but almost ready
will expose around 80 global perf counters for Fermi/Kepler
21 / 35

Introduction Case study Reverse engineering Nouveau & mesa APIs & Tools Conclusion
Summary
1 Introduction
2 Case study
3 Reverse engineering
4 Nouveau & mesa
5 APIs & ToolsGL_AMD_performance_monitorNouveau PerfKitApitrace
6 Conclusion22 / 35

Introduction Case study Reverse engineering Nouveau & mesa APIs & Tools Conclusion
GL_AMD_performance_monitor
OpenGL extension
based on pipe_query interface
drivers need to expose a group of GPU counters to enable it
Current status
released in mesa 10.6
expose per-context counters on Fermi/Kepler
this requires compute support to launch kernels
used by Apitrace for pro�ling frames (GSoC'15)
Cons
do not support round robin sampling and multi-pass events
do not �t well with NVIDIA hardware (obviously)
23 / 35
Introduction Case study Reverse engineering Nouveau & mesa APIs & Tools Conclusion
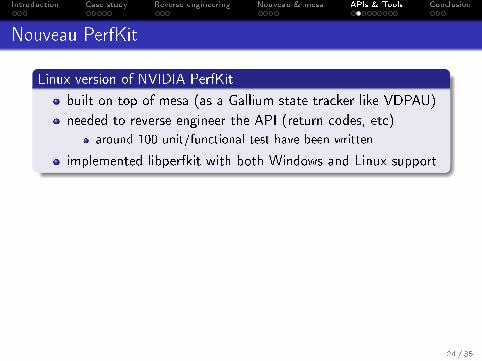
Nouveau PerfKit
Linux version of NVIDIA PerfKit
built on top of mesa (as a Gallium state tracker like VDPAU)
needed to reverse engineer the API (return codes, etc)
around 100 unit/functional test have been written
implemented libperfkit with both Windows and Linux support
Pros
allow support of round robin sampling and multi-pass events
Current status
RFC submitted in June (around 1700 LOC, still in review)
will expose more perf counters than gl_amd_perfmon
no users for now but Apitrace could use PerfKit
24 / 35
Introduction Case study Reverse engineering Nouveau & mesa APIs & Tools Conclusion
Nouveau PerfKit
Linux version of NVIDIA PerfKit
built on top of mesa (as a Gallium state tracker like VDPAU)
needed to reverse engineer the API (return codes, etc)
around 100 unit/functional test have been written
implemented libperfkit with both Windows and Linux support
Pros
allow support of round robin sampling and multi-pass events
Current status
RFC submitted in June (around 1700 LOC, still in review)
will expose more perf counters than gl_amd_perfmon
no users for now but Apitrace could use PerfKit
24 / 35

Introduction Case study Reverse engineering Nouveau & mesa APIs & Tools Conclusion
Apitrace
GSoC'15 project
add support for performance counters in the pro�ling view
project by Alex Tru (mentored by Martin Peres)
DONE (but still not upstream)
abstraction system for pro�ling in glretrace
support for GL_AMD_perfmon and Intel_perfqueryallow to query and to monitor metrics
WIP
pro�ling view improvements for qapitrace
some minor parts are done but very basic visualization
25 / 35

Introduction Case study Reverse engineering Nouveau & mesa APIs & Tools Conclusion
Apitrace
Let's go back to the case study but now with...
... Apitrace and Nouveau!
26 / 35

Introduction Case study Reverse engineering Nouveau & mesa APIs & Tools Conclusion
Apitrace/Nouveau
How to list available metrics?
glretrace �list-metrics <trace>
Backend GL_AMD_performance_monitor :
Group #0: G l oba l pe r fo rmance c oun t e r s .Met r i c #0: shader_busy ( type : CNT_TYPE_GENERIC, type : CNT_NUM_UINT64)Met r i c #1: i a_ r eque s t s ( type : CNT_TYPE_GENERIC, type : CNT_NUM_UINT64) .Met r i c #2: tex tu re_busy ( type : CNT_TYPE_GENERIC, type : CNT_NUM_UINT64) .
Group #1: MP coun t e r s .Met r i c #0: a c t i v e_c y c l e s ( type : CNT_TYPE_GENERIC, type : CNT_NUM_UINT64) .Met r i c #1: ac t i ve_warps ( type : CNT_TYPE_GENERIC, type : CNT_NUM_UINT64) .
Backend openg l :
Group #0: CPU.Met r i c #0: CPU S t a r t ( type : CNT_TYPE_TIMESTAMP, type : CNT_NUM_INT64) .Met r i c #1: CPU Durat i on ( type : CNT_TYPE_DURATION, type : CNT_NUM_INT64) .
27 / 35

Introduction Case study Reverse engineering Nouveau & mesa APIs & Tools Conclusion
Figure : List of available metrics in Apitrace
28 / 35

Introduction Case study Reverse engineering Nouveau & mesa APIs & Tools Conclusion
Apitrace/Nouveau
How to pro�le a GL app?
glretrace �pframes="GL_AMD_perfmon: [0,65]" <trace>
# ia_r eque s t sf rame 285734frame 285799frame 285793frame 285763frame 285762frame 285809frame 285800frame 285744frame 285743frame 285796frame 285893frame 285818frame 285754frame 285804frame 285762frame 285763frame 285813frame 285804frame 285815frame 285747frame 285754
Rendered 20 f rames i n 0 .3365 secs , ave rage o f 59 .4344 f p s
29 / 35

Introduction Case study Reverse engineering Nouveau & mesa APIs & Tools Conclusion
Figure : Very basic visualization with histograms in Apitrace
30 / 35

Introduction Case study Reverse engineering Nouveau & mesa APIs & Tools Conclusion
Apitrace/Nouveau
Perf counters Without VBO With VBO
geom_busy 7% 17%
shader_busy 0.5% 1%
texture_busy 2% 4%
ia_requests 371000 286000
l2_read_sysmem_sectors 193000 35
FPS 251 1601
1Without reclocking31 / 35

Introduction Case study Reverse engineering Nouveau & mesa APIs & Tools Conclusion
Summary
1 Introduction
2 Case study
3 Reverse engineering
4 Nouveau & mesa
5 APIs & Tools
6 ConclusionCurrent statusFuture work
32 / 35

Introduction Case study Reverse engineering Nouveau & mesa APIs & Tools Conclusion
Current status
Reverse engineering
almost all perf counters on Tesla, Fermi and Kepler reversed
Nouveau DRM & mesa
perfmon work merged in Linux 4.3
GL_AMD_performance_monitor merged in mesa 10.6
Userspace tools
GL_AMD_perfmon used by Apitrace!
perf counters are going to be exposed in a useful manner. :)
33 / 35

Introduction Case study Reverse engineering Nouveau & mesa APIs & Tools Conclusion
Future work
Short-term period
add more signals & sources for Fermi and Kepler
rework the software methods interface
release libdrm with nvif support (Ben Skeggs)
complete the support of perf counters in mesa
this will expose GL_amd_perfmon on Teslathis will expose lot of perf counters on Tesla, Fermi and Kepler
Long-term period
�nish implementation of Nouveau PerfKit
and make something use it (Apitrace?)
reverse engineer Maxwell performance counters
34 / 35

Introduction Case study Reverse engineering Nouveau & mesa APIs & Tools Conclusion
Thanks!
I would like to thank the X.Org board members for my travelsponsorship!
Feel free to ask questions...
35 / 35