Embed Size (px)
Citation preview
Status of Water Supply, Sanitation
and Solid Waste Management
in Urban Areas
Sponsored by
Central Public Health and Environmental Engineering Organisation
(CPHEEO)
Ministry of Urban Development
Government of India
National Institute of Urban Affairs
1st & 2
nd Floor, Core 4B, India Habitat Centre, Lodhi Road, New Delhi – 110 003
June 2005
ii
PROJECT TEAM
Project Coordinator: Usha P. Raghupathi
Research Assistance: Anjali Pancholy
Viraj Srivastav
M. Ahmed
Ajay Nigam
Special Assistance: Dr. Kusum Lata
EDP Assistance: Sangeeta Vijh
T. C. Sharma
Photocopying Assistance: H.P. Pandey
M. Usman Khan
iii
Preface
The urban population of India is growing rapidly and exerting considerable pressure on urban
services. It is evident that urban infrastructure has been unable to keep pace with the growing
population. A great challenge for Indian cities is to make cities livable by providing every
citizen with basic servies of acceptable quality. Urban local governments are the institutions
which are entrused with the task of providing these basic services but they are often strapped of
funds and unable to discharge their duties satisfactorily. In order to understand what needs to
be done to improve the provision of basic services, we need to know the level of provision of
these services. It is for this reason the Ministry of Urban Development, Government of India,
commissioned a study to assess the Status of Water Supply, Sanitation and Solid Waste
Management in Urban Areas of the country.
The main objective of the present study is to assess the status of water supply, sanitation and
solid waste management in 300 selected cities and towns and to estimate the requirement of
funds for full coverage of population by these services in the urban areas of the country. The
study is based on a detailed survey of the agencies responsible for the provision, operations and
management of these services in the selected cities and towns including all the metropolitan
cities in the country. The study, commissioned in 1999, took about two years to complete.
However, due to a number of reasons the study took unusually long to be brought to its final
form.
We would like to thank the Ministry of Urban Development and CPHEEO for entrusting this
study to NIUA. We are especially thankful to the then Secretary, Department of Poverty
Alleviation, in the Ministry, Shri S.S.Chattopadhyay, for assigning this study to us. Dr. S.R.
Shukla, Mr. V.B. Ramaprasad (Former Advisers, PHE), Mr. Sethuraman (present Jt.Adviser,
PHEE), Mr. B.B. Uppal, Mr. Sankara Narayanan and Mr. Sukanta Kar of CPHEEO provided
their full support throughout the study and gave their valuable comments, which have greatly
helped bring this report to its final shape.
The data from local governments and other line agencies were collected by engaging a number
of regional institutes, viz. Centre for Research for Rural and Industrial Development
(Chandigarh), ORG-MARG (Vadodra), National Centre for Human Settlements and
Environment (Bhopal) and Institute of Local Government & Urban Studies (Calcutta) and
iv
NGOs viz. INDEP (Bangalore) and MaMista (Ghaziabad). We are thankful to Mr. J.P. Gupta,
Dr. S Ramarao, Mr. Ashok Gupta, Mrs. Chhanda Sarcar, Mr. Prashant Karkare, and Mr. Pankaj
Bhargav for coordinating the arduous task of data collection work at these institutions.
At the Institute Ms Usha P. Raghupathi very ably conducted this study. Ms. Anjali Pancholy
and Mr. Viraj Srivastav, Project Associates, Mr. Ajay Nigam and Mr. M. Ahmed, Junior
Research Officers who provided very valuable research support in the project assisted her. Dr.
Kusum Lata provided special assistance in the latter part of the study. Ms. Sangeeta Vijh and
Mr. Tek Chand Sharma of the computer unit carried out the tedious task of processing the
primary data, generating the final tables and printing the final report.
Finally, we would like to express our appreciation to all the local governments and line
agencies and others for providing data to us for this study.
New Delhi Prof. Usha P. Raghupathi
May, 2005 (Officer in-Charge)
v
Special Note
The present study “Status of Water Supply, Sanitation and Solid Waste Management in Urban
Areas” was commissioned in 1999. The study started in April 1999. However, the declaration
of General Elections in the same year delayed data collection as most local governments were
engaged in election related work. Since the services selected for the study were local subjects,
local situations such as elections, floods, droughts, cyclones and so on had a great impact on
the time required for data collection. However, despite these problems, the data were collected
from most local bodies through personal visits. Only in some cases, such as north-eastern
states, Andaman and Nicobar Islands and Lakshadweep Islands, the questionnaires were
obtained by post.
The data obtained were scrutinized, cross-checked for inconsistencies and then finalized.
However, since the data management in local bodies is generally very poor, with some
exceptions, the information obtained from them, at times, did not seem very reliable, despite
the authentication by the local government with stamp and/or signature. NIUA then reverted
back to the local authorities to clarify/ correct the figures provided in the questionnaire. This
also proved to be a time-consuming process.
The report went through many iterations (over a period of 2-3 years) before finalisation, each
iteration incorporated useful and insightful comments of CPHEEO. However, some data gaps
still remained that were required to be filled. NIUA requested the Ministry’s help in this
matter. The Ministry was very helpful and sent letters, in early 2004, to all the states and union
territories to assist NIUA in filling the data gaps. However, even after sending reminders and
following up on telephone and making an all out effort, very few states/ towns responded. It
was then decided to not wait any longer and the report was finalised in May 2005. Hence,
there are still some ‘n.a. s’ in the report despite all these efforts. The report therefore, is being
submitted with some data gaps remaining.
In spite of these problems, the study is very useful. The uniqueness of the study is that it
covers all the states and union territories of the country and has put together data for each
service for the same year. This makes it possible to make inter-city comparisons.
Researchers and practitioners working with local governments would appreciate the value of
this effort and we hope that this study will be useful to all – administrators, policy makers,
practioners and researchers.
Study Coordinator
vi
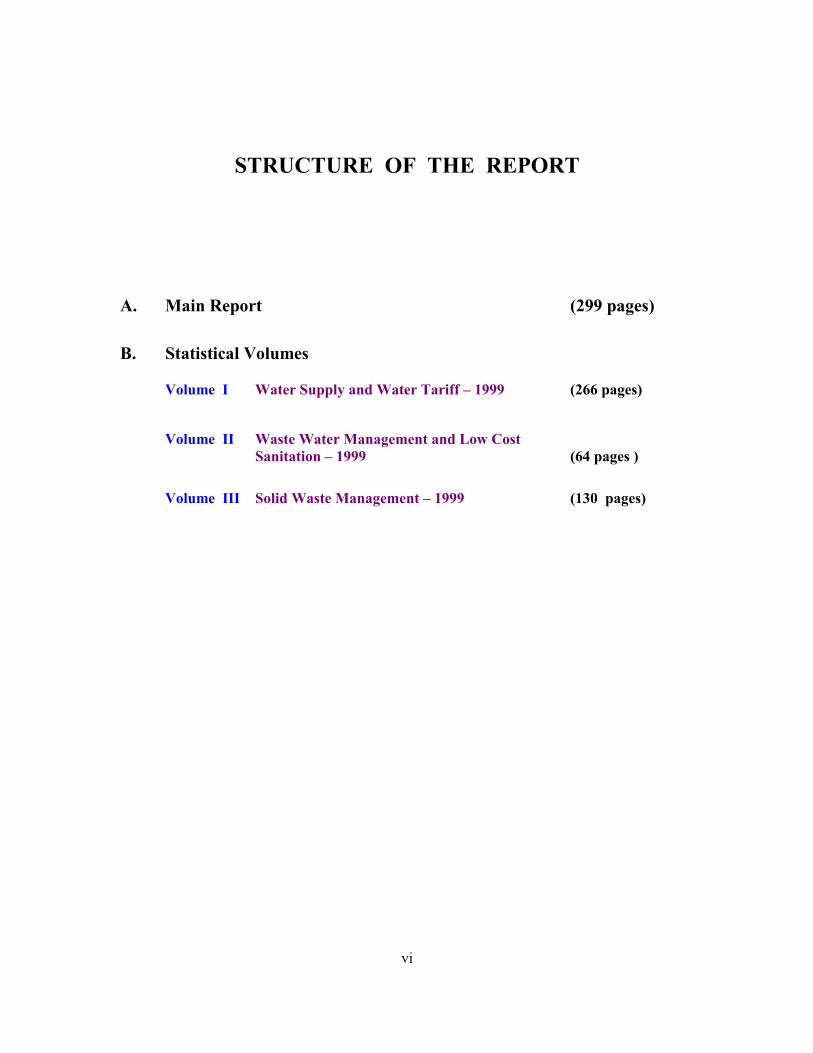
STRUCTURE OF THE REPORT
A. Main Report (299 pages)
B. Statistical Volumes
Volume I Water Supply and Water Tariff – 1999 (266 pages)
Volume II Waste Water Management and Low Cost
Sanitation – 1999 (64 pages )
Volume III Solid Waste Management – 1999 (130 pages)
vii
Contents
Preface iii
Contents vii
List of Tables xi
Annexures xv
List of Abbreviations xvi
Executive Summary xviii
CHAPTER I
INTRODUCTION 1
1.1 BACKGROUND 1
1.2 OBJECTIVES 3
1.3 DATA BASE 5
1.4 METHODOLOGY 6
1.4.1 Selection of Towns 6
1.4.2 Questionnaires 7
1.4.3 Data Collection 8
1.5 SCOPE AND LIMITATIONS 8
1.6 TIME FRAME 9
1.7 PROCESSING OF DATA 9
1.8 STUDY OUTPUT 10
1.9 ORGANISATION OF THE REPORT 10
CHAPTER II
STATUS OF WATER SUPPLY 23
2.1 INTRODUCTION 23
2.2 COVERAGE OF POPULATION BY WATER SUPPLY 23
2.3 QUANTITY OF WATER SUPPLIED 26
2.3.1 Water Supplied for Domestic and Non-Domestic Uses 26
2.3.2 Utilization of Production Capacity 27
2.3.3 Duration of Supply 28
2.3.4 Water Consumption in Metropolitan Cities 29
2.4 NORMS FOR WATER SUPPLY 30
2.4.1 CPHEEO Norms 31
2.4.2 Ninth Five Year Plan Norms 31
2.4.3 Norms Determined by the Individual Cities 31
viii
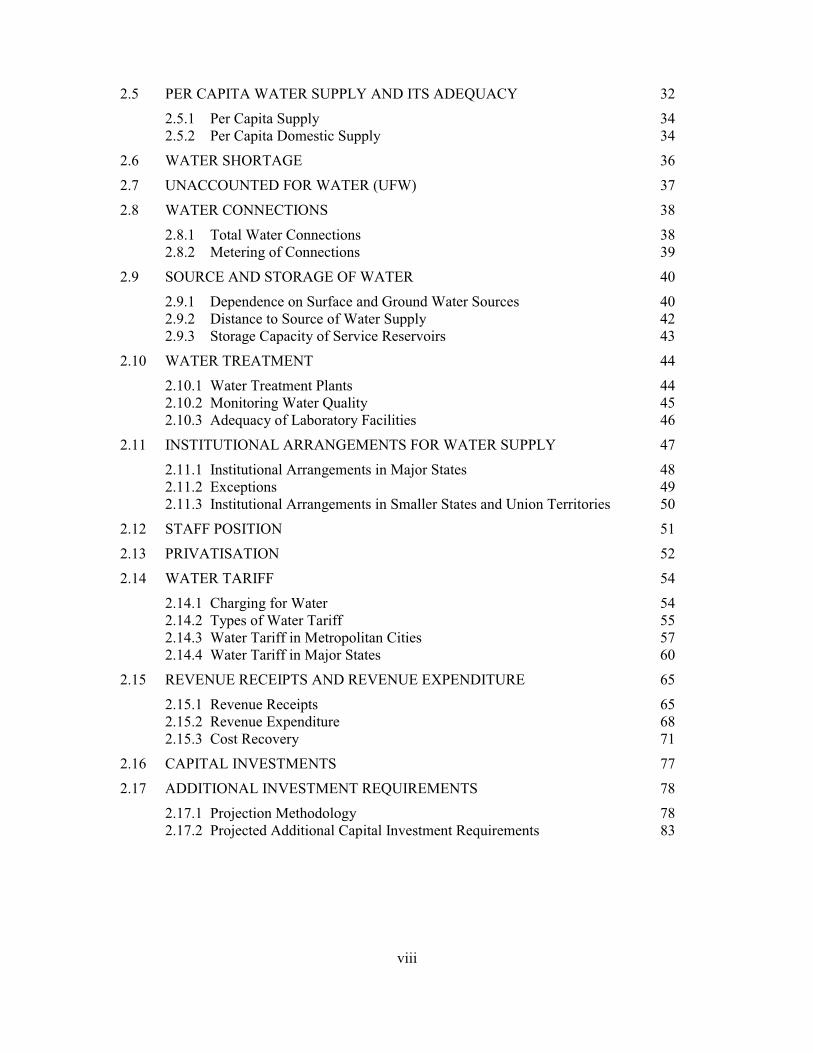
2.5 PER CAPITA WATER SUPPLY AND ITS ADEQUACY 32
2.5.1 Per Capita Supply 34
2.5.2 Per Capita Domestic Supply 34
2.6 WATER SHORTAGE 36
2.7 UNACCOUNTED FOR WATER (UFW) 37
2.8 WATER CONNECTIONS 38
2.8.1 Total Water Connections 38
2.8.2 Metering of Connections 39
2.9 SOURCE AND STORAGE OF WATER 40
2.9.1 Dependence on Surface and Ground Water Sources 40
2.9.2 Distance to Source of Water Supply 42
2.9.3 Storage Capacity of Service Reservoirs 43
2.10 WATER TREATMENT 44
2.10.1 Water Treatment Plants 44
2.10.2 Monitoring Water Quality 45
2.10.3 Adequacy of Laboratory Facilities 46
2.11 INSTITUTIONAL ARRANGEMENTS FOR WATER SUPPLY 47
2.11.1 Institutional Arrangements in Major States 48
2.11.2 Exceptions 49
2.11.3 Institutional Arrangements in Smaller States and Union Territories 50
2.12 STAFF POSITION 51
2.13 PRIVATISATION 52
2.14 WATER TARIFF 54
2.14.1 Charging for Water 54
2.14.2 Types of Water Tariff 55
2.14.3 Water Tariff in Metropolitan Cities 57
2.14.4 Water Tariff in Major States 60
2.15 REVENUE RECEIPTS AND REVENUE EXPENDITURE 65
2.15.1 Revenue Receipts 65
2.15.2 Revenue Expenditure 68
2.15.3 Cost Recovery 71
2.16 CAPITAL INVESTMENTS 77
2.17 ADDITIONAL INVESTMENT REQUIREMENTS 78
2.17.1 Projection Methodology 78
2.17.2 Projected Additional Capital Investment Requirements 83
ix
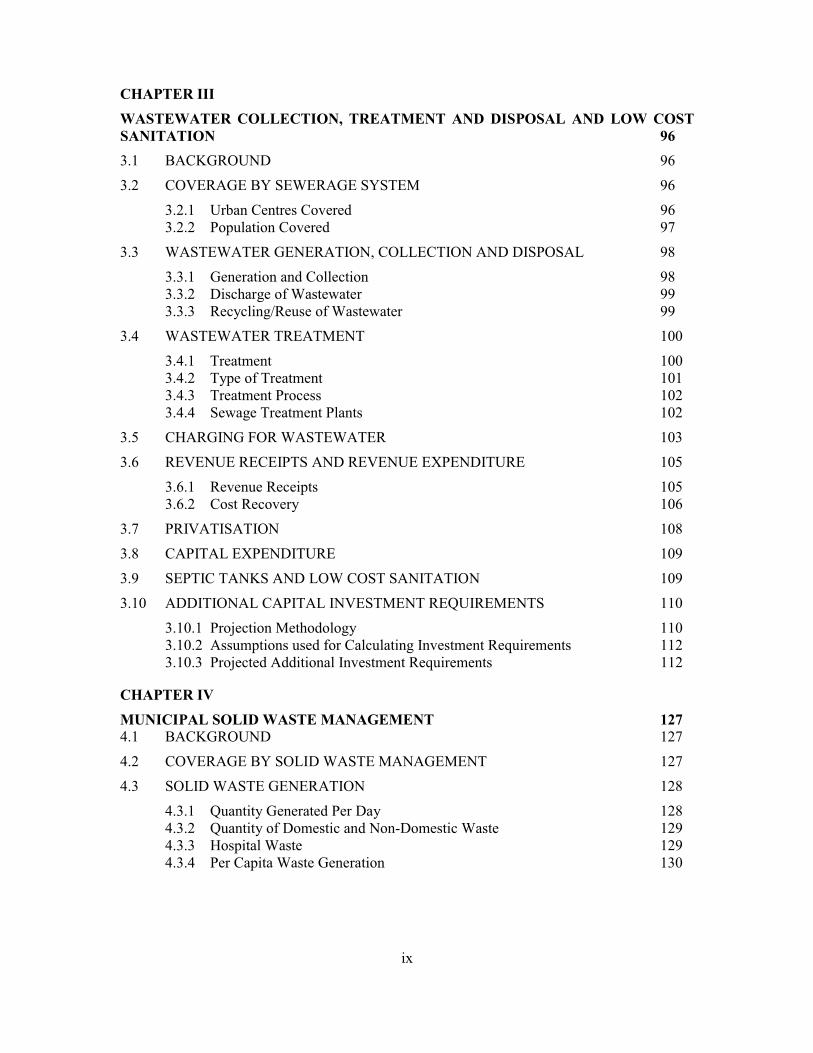
CHAPTER III
WASTEWATER COLLECTION, TREATMENT AND DISPOSAL AND LOW COST
SANITATION 96
3.1 BACKGROUND 96
3.2 COVERAGE BY SEWERAGE SYSTEM 96
3.2.1 Urban Centres Covered 96
3.2.2 Population Covered 97
3.3 WASTEWATER GENERATION, COLLECTION AND DISPOSAL 98
3.3.1 Generation and Collection 98
3.3.2 Discharge of Wastewater 99
3.3.3 Recycling/Reuse of Wastewater 99
3.4 WASTEWATER TREATMENT 100
3.4.1 Treatment 100
3.4.2 Type of Treatment 101
3.4.3 Treatment Process 102
3.4.4 Sewage Treatment Plants 102
3.5 CHARGING FOR WASTEWATER 103
3.6 REVENUE RECEIPTS AND REVENUE EXPENDITURE 105
3.6.1 Revenue Receipts 105
3.6.2 Cost Recovery 106
3.7 PRIVATISATION 108
3.8 CAPITAL EXPENDITURE 109
3.9 SEPTIC TANKS AND LOW COST SANITATION 109
3.10 ADDITIONAL CAPITAL INVESTMENT REQUIREMENTS 110
3.10.1 Projection Methodology 110
3.10.2 Assumptions used for Calculating Investment Requirements 112
3.10.3 Projected Additional Investment Requirements 112
CHAPTER IV
MUNICIPAL SOLID WASTE MANAGEMENT 127
4.1 BACKGROUND 127
4.2 COVERAGE BY SOLID WASTE MANAGEMENT 127
4.3 SOLID WASTE GENERATION 128
4.3.1 Quantity Generated Per Day 128
4.3.2 Quantity of Domestic and Non-Domestic Waste 129
4.3.3 Hospital Waste 129
4.3.4 Per Capita Waste Generation 130
x
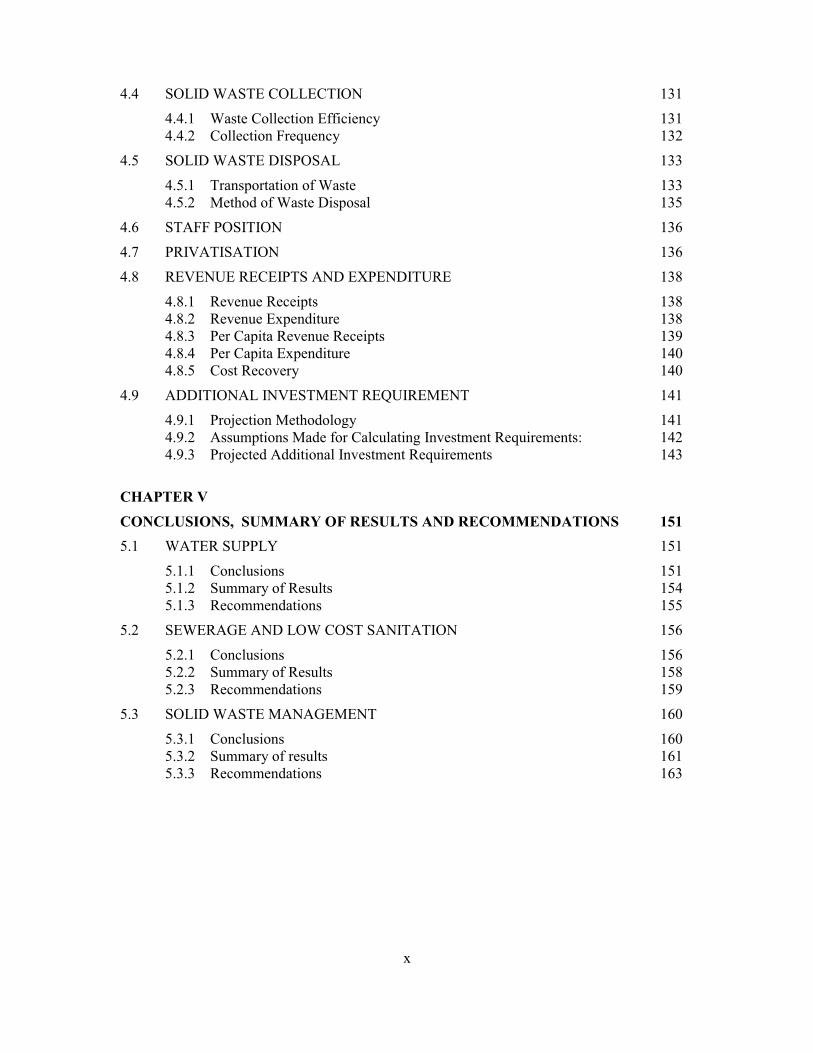
4.4 SOLID WASTE COLLECTION 131
4.4.1 Waste Collection Efficiency 131
4.4.2 Collection Frequency 132
4.5 SOLID WASTE DISPOSAL 133
4.5.1 Transportation of Waste 133
4.5.2 Method of Waste Disposal 135
4.6 STAFF POSITION 136
4.7 PRIVATISATION 136
4.8 REVENUE RECEIPTS AND EXPENDITURE 138
4.8.1 Revenue Receipts 138
4.8.2 Revenue Expenditure 138
4.8.3 Per Capita Revenue Receipts 139
4.8.4 Per Capita Expenditure 140
4.8.5 Cost Recovery 140
4.9 ADDITIONAL INVESTMENT REQUIREMENT 141
4.9.1 Projection Methodology 141
4.9.2 Assumptions Made for Calculating Investment Requirements: 142
4.9.3 Projected Additional Investment Requirements 143
CHAPTER V
CONCLUSIONS, SUMMARY OF RESULTS AND RECOMMENDATIONS 151
5.1 WATER SUPPLY 151
5.1.1 Conclusions 151
5.1.2 Summary of Results 154
5.1.3 Recommendations 155
5.2 SEWERAGE AND LOW COST SANITATION 156
5.2.1 Conclusions 156
5.2.2 Summary of Results 158
5.2.3 Recommendations 159
5.3 SOLID WASTE MANAGEMENT 160
5.3.1 Conclusions 160
5.3.2 Summary of results 161
5.3.3 Recommendations 163

xi
LIST OF TABLES
Table - 1.1: List of Sampled Cities and Towns 11
Table - 1.2: Population of Metropolitan Urban Agglomerations and Metropolitan Cities 22
Table - 2.1: Coverage by Water Supply (1999) 24
Table - 2.2: Urban Centres with Acute Water Problems – 1999 25
Table - 2.3: Water Supplied for Domestic and Non-domestic Uses - 1999 27
Table – 2.4: Utilization of Installed Production Capacity - 1999 28
Table - 2.5: Duration of Supply (1999) 28
Table - 2.6: Ratio of Water Consumed to Population in Metropolitan Cities –1999 30
Table - 2.7: Recommended Per Capita Water Supply Levels for Designing Schemes 31
Table - 2.8: Norms for Water Supply given by Metropolitan Cities (1999) 32
Table - 2.9: Per Capita Water Supply (1999) 34
Table - 2.10: Per Capita Domestic Water Supply (1999) 35
Table - 2.11: Demand – Supply Gap (1999) Using CPHEEO Norms 36
Table - 2.12: Demand – Supply Gap (1999) Using City Norms 37
Table - 2.13: Unaccounted for Water (1999) 38
Table - 2.14: Percentage Connections Metered to Total – 1999 39
Table - 2.15: Percent Domestic Connections Metered 39
Table - 2.16: Percent Non-Domestic Connections Metered 40
Table - 2.17: Share of Ground and Surface Water Source - 1999 41
Table - 2.18: Percentage Water Drawn from Surface and Ground Sources - 1999 42
Table - 2. 19: Maximum Distance to Surface Sources of Water Supply (1999) 42
Table - 2.20: Distance to Present Source of Water for Selected Urban Centres - 1999 43
Table - 2.21: Distance to Future Sources of Water Supply for Selected
Metropolitan Cities - 1999 43
Table - 2.22: Storage Capacity of Service Reservoirs – 1999 44
Table - 2.23: Water Treatment Plants – 1999 45
Table - 2.24: Monitoring Raw Water Quality - 1999 46
Table - 2.25: Monitoring Water Quality At Distribution Network - 1999 46
Table - 2.26 : Adequacy of Laboratory Facilities - 1999 47
Table - 2.27: Institutional Arrangements for Urban Water Supply in Major States 49
Table - 2.28: Institutional Arrangements for Urban Water Supply in Smaller
States and Union Territories 50
Table - 2.29: Staff Per 1000 Connections (1999) 51
xii
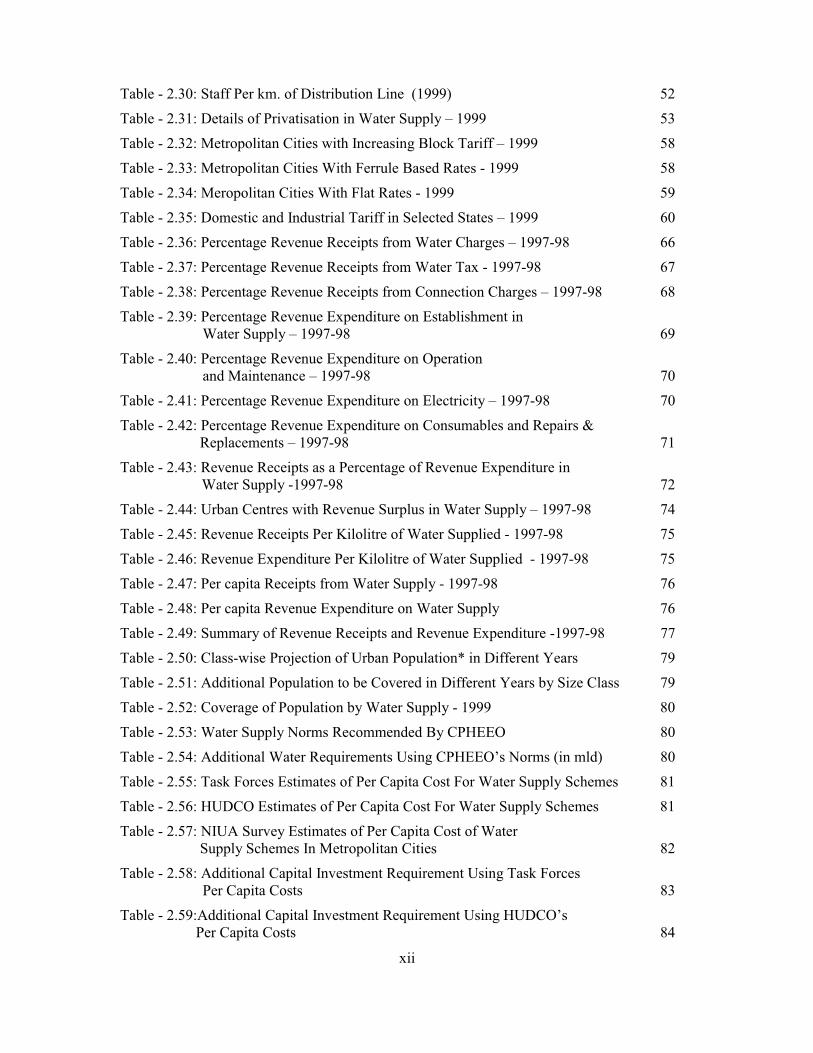
Table - 2.30: Staff Per km. of Distribution Line (1999) 52
Table - 2.31: Details of Privatisation in Water Supply – 1999 53
Table - 2.32: Metropolitan Cities with Increasing Block Tariff – 1999 58
Table - 2.33: Metropolitan Cities With Ferrule Based Rates - 1999 58
Table - 2.34: Meropolitan Cities With Flat Rates - 1999 59
Table - 2.35: Domestic and Industrial Tariff in Selected States – 1999 60
Table - 2.36: Percentage Revenue Receipts from Water Charges – 1997-98 66
Table - 2.37: Percentage Revenue Receipts from Water Tax - 1997-98 67
Table - 2.38: Percentage Revenue Receipts from Connection Charges – 1997-98 68
Table - 2.39: Percentage Revenue Expenditure on Establishment in
Water Supply – 1997-98 69
Table - 2.40: Percentage Revenue Expenditure on Operation
and Maintenance – 1997-98 70
Table - 2.41: Percentage Revenue Expenditure on Electricity – 1997-98 70
Table - 2.42: Percentage Revenue Expenditure on Consumables and Repairs &
Replacements – 1997-98 71
Table - 2.43: Revenue Receipts as a Percentage of Revenue Expenditure in
Water Supply -1997-98 72
Table - 2.44: Urban Centres with Revenue Surplus in Water Supply – 1997-98 74
Table - 2.45: Revenue Receipts Per Kilolitre of Water Supplied - 1997-98 75
Table - 2.46: Revenue Expenditure Per Kilolitre of Water Supplied - 1997-98 75
Table - 2.47: Per capita Receipts from Water Supply - 1997-98 76
Table - 2.48: Per capita Revenue Expenditure on Water Supply 76
Table - 2.49: Summary of Revenue Receipts and Revenue Expenditure -1997-98 77
Table - 2.50: Class-wise Projection of Urban Population* in Different Years 79
Table - 2.51: Additional Population to be Covered in Different Years by Size Class 79
Table - 2.52: Coverage of Population by Water Supply - 1999 80
Table - 2.53: Water Supply Norms Recommended By CPHEEO 80
Table - 2.54: Additional Water Requirements Using CPHEEO’s Norms (in mld) 80
Table - 2.55: Task Forces Estimates of Per Capita Cost For Water Supply Schemes 81
Table - 2.56: HUDCO Estimates of Per Capita Cost For Water Supply Schemes 81
Table - 2.57: NIUA Survey Estimates of Per Capita Cost of Water
Supply Schemes In Metropolitan Cities 82
Table - 2.58: Additional Capital Investment Requirement Using Task Forces
Per Capita Costs 83
Table - 2.59:Additional Capital Investment Requirement Using HUDCO’s
Per Capita Costs 84

xiii
Table - 2.60: Ninth Plan Estimates of Per Capita Cost for Water Supply 84
Table - 2.61: Additional Capital Investment Requirement Using Ninth Plan’s
Per Capita Costs 84
Table - 2.62: HUDCO’s Estimates of Per Mld Cost for Water Supply 85
Table - 2.63: Additional Capital Investment Requirement Using HUDCO’s
Per Mld Costs - Low Estimate 85
Table - 2.64: Additional Capital Investment Requirement Using HUDCO’s
Per Mld Costs - High estimate 85
Annex Tables
Table - AX - 2.1: Urban Centres with Water Supply Below Norm and
Additional Quantity Required to Reach Norms – 1999 87
Table - AX - 2.2: Urban Centres with Surplus Revenue Receipts – 1997-98 93
Table – AX - 2.3:Year and Class Wise Projection of Urban Population 95
Table - 3.1: Sampled urban centres with sewerage system - 1999 96
Table - 3.2: Sampled cities with type of sewerage system - 1999 97
Table - 3.3: Population Covered by Sewerage System – 1999 97
Table - 3.4: Volume of Wastewater Generated, Collected and Treated – 1999 98
Table - 3.5: Wastewater Collection Efficiency - 1999 99
Table - 3.6: Discharge of Wastewater - 1999 99
Table - 3.7: Recycling of Wastewater - 1999 100
Table - 3.8: Wastewater Treated to Collected - 1999 101
Table - 3.9: Type of Wastewater Treatment - 1999 101
Table - 3.10: Wastewater Treatment Process - 1999 102
Table - 3.11: Sewage Treatment Plants - 1999 102
Table - 3.12: Sources of Revenue for Wastewater Management - 1999 103
Table - 3.13: Percentage Revenue Receipts from Sewerage/Drainage Tax - 1997-98 105
Table - 3.14: Percentage Revenue Receipts from Connection Charges - 1997-98 106
Table - 3.15: Percentage Revenue Receipts to Revenue Expenditure - 1997-98 107
Table - 3.16: Privatisation in Wastewater Management - 1999 108
Table - 3.17: Population Dependant on Septic Tanks and LCS 110
Table - 3.18: Class-wise Projection of Urban Population* in Different Years (in million) 111
Table - 3.19: Additional Population to be Covered in Different Years by Size Class 111
Table - 3.20: Coverage of Population by Safe Sanitation - 1999 111
Table - 3.21: Task Forces’ Per Capita Investment Costs for Sanitation
(Estimates at 1998-99 prices) 112
xiv
Table - 3.22: HUDCO’s Per Capita Investment Costs for Sanitation
(HUDCO estimates at 1998-99 prices) 113
Table - 3.23: Additional Investment Requirements for Providing Safe Sanitation
to Population (Using Task Forces’ per capita cost estimates) 113
Table - 3.24: Additional Investment Requirements for Providing Safe Sanitation
to Population (Using HUDCO’s per capita cost estimates) 113
Annex Table
Table - AX- 3.1: Population Covered by Sewerage System and Low Cost
Sanitation - 1999 115
Table - 4.1: Coverage of Population by Solid Waste Management Service - 1999 128
Table - 4.2: Total and Per Capita Waste Generated - 1999 129
Table - 4.3: Waste Generation by Source - 1999 129
Table - 4.4: Collection of Hospital Waste - 1999 130
Table - 4.5: Treatment of Hospital Waste 130
Table - 4.6: Per Capita Waste Generation - 1999 131
Table - 4.7: Quantity of Solid Waste Generated and Collected - 1999 132
Table - 4.8: Waste collection efficiency -1999 132
Table - 4.9: Collection frequency - 1999 133
Table - 4.10: Transportation of Waste by Motorized Vehicles - 1999 134
Table - 4.11: Vehicle Maintenance Workshop - 1999 135
Table - 4.12: Main Method of Waste Disposal - 1999 135
Table - 4.13: Sanitary Workers Per 1000 Population - 1999 136
Table - 4.14: Privatisation of Solid Waste Management Activities - 1999 137
Table - 4.15: Per Cent Share of Establishment Expenditure - 1997-98 139
Table - 4.16: Per Capita Revenue Receipts from SWM (1997-98) 139
Table - 4.17: Per Capita Expenditure on Municipal Solid Waste Management 1997-98 140
Table - 4.18: PerCapita Cost Recovery from Solid Waste Management Service (1997-98) 140
Table - 4.19: Year and Class Wise Projection of Urban Population 141
Table - 4.20: Additional Population to be Covered in Different Years by Size Class 142
Table - 4.21: Population Not Covered by Solid Waste Management - 1999 143
Table - 4.22: Task Forces Per Capita Investment Costs for Solid Waste Management 143
Table - 4.23: Additional Investment using Task Forces Per Capita Cost Estimates 144
Annex Tables
Table -AX- 4.1: Treatment of Hospital Waste - 1999 145
Table -AX- 4.2: Details of Privatisation in Solid Waste Management - 1999 148
xv
Annexure
Annex 1: List of Collaborating Agencies
Annex 2: Questionnaires
Annex 3: Water Tariff Schedules
Annex 4: Cost Estimates of Task Forces on Housing and Urban Development and
HUDCO

xvi
List of Abbreviations
Civic Status
CMC City Municipal Council
CT Census Town
M Municipality
M.Corp. Municipal Corporation
MB Municipal Board
MC Municipal Committee, Municipal Corporation
MCl Municipal Council
NM Non-municipal
NMCT Non-municipal Census Town
NTAC Notified Town Area Committee
TC Town Committee
Institutions
BWS&SB Bangalore Water Supply and Sewerage Board
CMDA Calcutta Metropolitan Development Authority
CMW&SA Calcutta Metropolitan Water & Sanitation Authority
CMWS&SB Chennai Metropolitan Water Supply and Sewerage Board
CPHEEO Central Public Health and Environmental Engineering
Organisation
DJB Delhi Jal Board
GWS&SB Gujarat Water Supply and Sewerage Board
HMWS&SB Hyderabad Metropolitan Water Supply and Sewerage Board
KUWS&DB Karnataka Urban Water Supply and Drainage Board
KWA Kerala Water Authority
MJP Maharashtra Jeevan Pradhikaran
PHD Public Health Division
PHED Public Health Engineering Department
PWD Public Works Department
PWS&SB Punjab Water Supply and Sewerage Board
TWAD Tamil Nadu Water Supply and Drainage Board
xvii
Others
n.a. not available
n.r. not reliable
ltrs. litres
bu.n.a. Breakup not available
kl. kilolitre (1000 litres)
lpcd litres per capita per day
mld million litres daily
m metre
km. kilometre
sq. km. square kilometre
lakh 100,000
crore 10,000,000
gm. Gram
MT Metric tonne
arv Annual rateable valule
nrv Net rateable value
BOO Build-own-operate
IBT Increasing block tariff
LCS Low cost sanitation
O&M Operation and maintenance
NGO Non-governmental organisation
UFW Unaccounted for water
SWM Solid Waste Management
STP Sewage Treatment Plant
WTP Water treatment plant
xviii
EXECUTIVE SUMMARY
Providing water and sanitation to India’s millions is a challenging task. With over 20 million
people without access to safe water supply and 100 million without safe sanitation, the sheer
numbers indicate the massive effort required to provide these basic services to the people of the
country. Just providing access, however, will not solve the problem unless the issues of quality
and adequacy are also addressed. The minimum needs should be met and the quality of the
services provided should be acceptable.
The present study assesses the status of three basic services - water supply, sanitation and
municipal solid waste management. It covers over 300 cities and towns in the country
including all metropolitan cities and selected Class I and Class II urban centres. The study
covers all the states and union territories including the capitals, excepting Patna and
Gandhinagar. The study was commissioned in 1999 and the data collection work took about a
year.
The main objectives of the study were to a) assess the status of water supply, sanitation and
solid waste management; b) analyse the revenue receipts and revenue expenditure of these
services; and c) estimate the additional capital investment requirements for full coverage of
population by these services from 1999 to 2022 (at five yearly intervals). The study covers the
physical and financial aspects of all the three services selected for the study. A conscious
decision was taken in the study to cover only the municipal area of the urban centres and not
the areas falling within the jurisdiction of other authorities such as development authorities,
cantonment boards, railways etc. This was done due to the time-frame of one year for the study
which did not permit data collection from different agencies for the same service. The study
gives the status of these services as provided by the public agencies and does not cover private
provision.
A study of this magnitude can be successful only with the cooperation of the local agencies,
which gave information on various aspects of the selected services. While every effort was
made to collect as accurate a data as possible, it was not always possible to check it with the
records of the agency. Records are often not computerised or kept properly, making data
authentication difficult. However, wherever other data sources were available, attempts were
made to cross-check the data collected and verify the authenticity of figures. Despite these
xix
problems, the data provided by this study does give a broad picture of the overall situation with
respect to these services in the country.
Summary of Findings
Overall, the study confirms the normal notion that the metropolitan cities are better provided
for than the other size class of urban centres. The coverage of population with basic services is
higher for metropolitan cities than for other size class of urban centres. The investment levels
are higher in the metropolitan cities due to large concentration of population in them. This
could be one of the reasons for more people flocking to metropolitan cities – due to better
provision of basic amenities.
The water supply situation, though much better in metropolitan cities at an aggregate level, is
reasonably good in many Class I and Class II urban centres too. The situation with respect to
wastewater management is much worse in smaller urban centres than in metropolitan cities. A
similar situation is obtained in respect of solid waste management where the metropolitan cities
fare much better than the other size class of urban centres. Financially also, the metropolitan
and larger urban centres fare much better than the smaller ones. However, there are large
variations in the status of individual urban centres with respect to these services. The study
found that in some cases the smaller urban centres showed much better service provision than
others. These isolated instances would be exceptions than the rule.
Water Supply
The study indicates that the overall water supply situation, when looked at the city level, is
reasonably adequate in most cities and towns, the problem in many cases lies in the poor
distribution infrastructure. The water crisis is often related to the poor distribution of water
than the lack of water at source (e.g. Delhi). However, there are urban centres where water
source itself is depleting and is unable to cater to the water requirements of the urban centres
(e.g. towns of Tamil Nadu, Andhra Pradesh).
In most cities there are more households than water supply connections, indicating that either
there are many shared connections or households depend upon public stand posts. The data
indicates that many households have their own sources of water supply while others
xx
complement own sources of supply with that of the public agency.
Unaccounted for water (UFW) data have been the most difficult to obtain. UFW is generally an
estimate worked out by the technical staff based on their perception of the situation. Most
cities do not have bulk meters or meters at all the user’s end. This makes the task of
calculating UFW very difficult. Therefore, the figures of UFW should be taken as the best
estimates that could be made by the technical staff of the water-supplying agency. Smaller size
towns that supply water from nearby sources or use ground water source have indicated very
small quantity of UFW. Therefore, the study indicates that the larger cities have greater
quantity of UFW than smaller size class of cities.
A very small percentage of urban centres have all connections metered (e.g. Bangalore, Pune).
About one-third of the urban centres covered do not have any metered connections. In many
urban centres a large percentage of domestic connections are unmetered while in a little above
one-fourth urban centres all non-domestic connections are also unmetered. This needs to be
taken up if tariff structures are to be rationalised and made a deterrent to wastage of water.
Tariff data indicates that uniform volumetric charges and fixed charges (ferrule based etc.) are
the most common methods of charging. Incremental block tariff is mostly used in the larger
cities, with a few exceptions. In many cities, non-domestic connections are metered while the
domestic connections are unmetered. Since meters often do not work, many cities charge fixed
tariff for water supply based on the calculated consumption patterns.
Most large cities depend upon surface sources for water supply, supplementing it with ground
water sources to meet the demand. However, the share of ground water increases with a
decrease in city size, with smaller size class of urban centres showing greater dependence on
ground water for water supply. The large investments required to supply water from surface
sources could be one reason for this pattern. This also reflects in the existence of water
treatment plants. While all metro cities using surface source have water treatment plants, there
is a small percentage of urban centres in other size classes that use surface water but do not
have water treatment plants.
There are many different types of institutional arrangements for water supply in the urban areas
of the country. The most common arrangement is that the capital works are done by a state
level agency and the local government does the O&M. However, there are wide variations to
xxi
this arrangement. These variations range from the state level agency managing the entire water
supply system in the entire state (Rajasthan) to the urban local body performing all the tasks
related to water supply (Mumbai).
Privatisation or public-private partnerships are still not very common in water supply with less
than one-tenth of the urban centres using private participation in this service.
Cost recovery is a major concern in water supply. While it is possible to achieve cost-recovery
in water supply, the fact is that almost four-fifths of the urban centres are unable to recover
even the O&M cost in this service. This indicates that while theoretically water can be treated
as an economic good, there are practical difficulties in implementing decisions on raising water
tariff. Water continues to be treated, as a social good and even recovering O&M cost in most
cities would require political consensus.
The additional capital investment requirements for covering the entire population with water
supply in the years to come is enormous, running into thousands of crores of rupees. While it
may be difficult to find resources to finance such large investments, private sector participation
could be encouraged. Public-private partnerships could reduce the financial burden of public
agencies to some extent and bring in some financial discipline into this sector. While efforts
have to be made to improve efficiency of water supply to reduce operating costs, maintenance
of existing assets would help in reducing new investment requirements in the near future.
Recommendations
1. Problems of intra-city distribution should be taken up immediately by the local
authorities to address the problems of water shortage.
2. Steps should be taken to initiate capacity building in urban centres for estimation of
UFW. Financial assistance should also be provided to the water supplying agencies to
equip them with instruments for estimating UFW.
3. Metering of connections, both for bulk supply and retail distribution, must be
encouraged. Standard meters should be made available, at reasonable cost, to all
urban centres for this purpose.
4. Tariff is a major concern in the water sector. Tariff should be increased at certain
given intervals, indexed to inflation and power tariff.
5. Getting surface water from distant sources is proving to be very expensive. Ground
water depletion can be controlled by undertaking rainwater harvesting in all urban
centres. Specific programmes/ schemes should be initiated for aquifer re-charge.
xxii
6. In line with the provisions of 74th
Constitution Amendment Act, the capacity of local
governments should be built to manage water supply systems. The local governments
should be given sufficient autonomy to decide on increase in water tariff required to
cover at least O&M costs.
7. Improving cost recovery should be linked to giving grants. Financial incentives could
be given to urban centres showing improved cost recovery. Technical assistance and
guidance should also be provided to local authorities to improve financial
performance.
8. Private sector participation in this sector should be encouraged, wherever possible.
Unbundling of the service would allow private sector to participate in this service and
improve efficiency levels.
9. The additional capital investments required to cover the entire urban population with
water supply at the required norms will require huge investments that are not possible
for the Government to provide. Therefore, public-private participation must be
encouraged. New ways of financing for this sector should also be explored.
Sewerage and Sanitation
Wastewater disposal and treatment is a very major problem in most Indian cities. Non-
collection of wastewater and discharge of untreated wastewater into low-lying areas or various
water bodies causes sever water and land pollution problems. This situation reduces the
availability of usable water for water supply.
The study indicates that while all the metropolitan cities have a sewerage system, a third- of the
Class I cities and less than one-fifth of the smaller sized urban centres have a sewerage system.
However, the coverage of population by the sewerage system is partial in all these urban
centres.
Wastewater generation is calculated at a minimum of 80 per cent of water supplied. However,
since people use their own sources of water, additional amounts of wastewater may be
generated, which have been taken into account in the present study. Wastewater collection in
most urban centres with sewerage system usually does not exceed about two-thirds of that
generated. However, the wastewater treatment situation is quite alarming. While the smaller
sized urban centres with sewerage system treat less than one-fourth of the wastewater
generated, even the metropolitan cities treat only about two-fifths of the wastewater generated.
Wastewater disposal is done both on land and in water body by most urban centres. Proximity
to water body, local conditions and financial constraints determine the place and method of
xxiii
wastewater disposal.
Recycling/ reuse of wastewater is practised in very few urban centres and wherever it is done,
it is mostly used for agriculture or horticultural purposes. Recycling/ reusing wastewater will
reduce the demand for fresh water, thereby also postponing the capital investment requirements
for water augmentation.
There is no fixed mechanism for charging for wastewater collection and disposal. The charging
may be through property tax, a charge on water closet or an additional charge on water
supplied.
Wastewater is not charged for in all urban centres, therefore, the cost recovery is generally very
low from this service with even the metro cities showing a very small recovery rate. The
situation is even worse in urban centres of smaller size. In most cities where the recovery rate
has been very good, the reasons have been either due to provision of new connections
(connection charges) or due to levying of sewerage/ drainage tax.
The additional capital investment required for providing safe sanitation to all in the coming
years many is thousands of crores, which would be very difficult to finance. Private sector
participation as well as citizen’s contribution can help provide some of the additional capital
investment requirements.
Recommendations
1. Rehabilitation of sewerage systems must be taken up in all the cities where the
sewerage system exists but has become non-functional.
2. Wastewater treatment must be made mandatory for all sizes of urban centres. The
smaller urban centres could use less capital-intensive technologies to reduce capital
cost as well as maintenance cost of treatment.
3. Pollution of land or water body with untreated wastewater should be made punishable
with fine.
4. Recycling/ reuse of wastewater must be encouraged. Technical and financial
assistance must be provided for this, if required.
5. All agencies dealing with wastewater must prepare plans for cost recovery from this
service. Private sector participation could be encouraged in managing this service to
reduce public expenditure.
6. Successful examples of people’s participation in contributing to the cost of
xxiv
construction of sewerage system (e.g. Alandur) must be examined and adopted in
other urban centres of the country.
Solid Waste Management
Municipal solid waste management is an obligatory function of the urban local governments.
And this is one service that remains a major problem for urban centres of all sizes.
The per capita waste generation has a positive correlation to the size class of urban centres i.e.
the larger the urban centre the more the waste generated.
The collection efficiency of solid waste is much better in larger cities than in smaller urban
centres. This could also be due to the motorised transportation vehicles deployed in larger
cities. Some of the smaller urban centres still depend on tricycles and animal carts for waste
collection. A factor that affects waste collection and transportation is the maintenance of
vehicles. Poor maintenance of fleet affects collection and transportation efficiency. Vehicles,
especially in smaller urban centres, are often not replaced even when there is a dire need to
replace them. Lack of finances for fleet replacement is a major cause of this state of affairs.
The main method of waste disposal continues to be open dumping in most urban centres.
While many urban centres have landfill sites, not all dispose their waste in these landfill sites
as sometimes the sites are far away from the city and the transportation costs become
prohibitive. Therefore, waste is dumped in some low-lying areas or disposed off just outside
the city periphery.
Hospital waste, though should be collected separately, is collected in a combined manner in a
majority of urban centres, including some of the metropolitan cities.
Solid waste management is a labour intensive activity requiring adequate staff. However, with
a few exceptions, most urban centres fall short of staff for this activity. This impacts the
quality of service provided.
Privatisation is much more prevalent in this service than in the other two services covered in
the study. Many urban centres that have used this arrangement have been able to reduce their
expenditure on this service.
Cost recovery from solid waste management is extremely poor and therefore it becomes an
xxv
expenditure heavy service. Expenditure on establishment is the biggest head of expenditure on
this service. Most urban centres spend over three-fourths of their solid waste management
budget on establishment.
The additional capital investment requirements worked out for this service in the coming years
indicate an investment of a couple of hundred crores per annum. However, these figures will
need to be revised taking into account the Hon’ble Supreme Court’s directives. As construction
of sanitary landfills is very expensive, this would add considerably to the investment
requirements.
Recommendations
1. Three ‘R’s of solid waste management i.e. reduce, reuse and recycle must be adopted
by all urban centres. This will help in reducing the quantum of solid waste that the
local governments have to deal with.
2. Efficiency of waste collection must be improved in cities by bringing about the
necessary changes in the design of equipment used by sanitary staff, manpower
management and planning.
3. Transportation fleet needs to be maintained well and needs to be modernised to
improve collection and transportation efficiency.
4. Crude/ open dumping of waste must be completely discouraged by encouraging
controlled tipping.
5. All urban centres should identify landfill sites that are usable. In order to reduce the
quantity of waste that goes to landfill sites, waste treatment such as neighbourhood
composting and recycling of waste must be encouraged.
6. Separate collection of hospital waste must be ensured in every city and incinerators
must be installed to deal with this waste. Landfill sites should apportion an area for
the disposal of hazardous waste from hospitals.
7. Private sector participation must continue to be encouraged in this sector to achieve
efficiency of operations and cost reduction. However, monitoring of privatised
activities should be improved in order to provide better quality of services to the
people.
8. Plans to improve cost recovery from this service must be made by every local
government. New sources of revenue generation must be thought of.
9. People’s participation must be encouraged to keep cities clean and NGOs must be
used to do IEC work in communities.

xxvi
SUMMARY OF KEY INDICATORS FOR WATER SUPPLY – 1999
(Averages)
Indicators Metropolitan
cities
Class I
cities
Class II
towns
Total
No. of sampled urban centres 22 164 115 301
Estimated population (1999) in ‘000 71,429 59,123 10,473 141,025
Population coverage (%) 98 91 89 94
Per capita supply (lpcd) 182 124 83 150
Per capita domestic supply (lpcd) 148 106 69 128
% urban centres with p.c. supply below
CPHEEO norm 50 40 52 46
% urban centres with p.c. supply below
city norm 68 76 79 77
% supply required to be added to reach
city norms 5 25 42 13
Quantity of water required to be added
to reach city norms (in mld) 1397 2209 439 4045
Unaccounted for water (%) 24 16 11 21
% connections metered 60 52 39 55
Staff per 1000 connections 14.5 7.9 6.8 10.9
Cost recovery (%) 70 55 44 65
Revenue receipts (Rs.) per kl. 2.16 1.02 1.21 1.73
Revenue expenditure (Rs.) `per kl. 3.09 1.88 2.44 2.66
Deficit per kl. (Rs.) -0.93 -0.86 -1.23 -0.93
Revenue receipts per capita (Rs.
/annum)
149.43 48.65 39.41 100.55
Revenue expenditure per capita
(Rs./annum)
214.12 89.40 77.86 153.89
Per capita deficit (Rs./ annum) -64.69 -40.75 -38.45 -53.34
Additional capital investment requirements* (1999-2022) range between Rs. 32118 and Rs.
35420 crores or between Rs.1396 and Rs. 1540 crores per annum.
Note: Revenue and expenditure figures are for financial year 1997-98 pc. refers to per capita
*These requirements are for covering the entire urban population, in all size classes of urban centres, till
the year 2022 and are based on two different per capita estimates used for projection.
xxvii
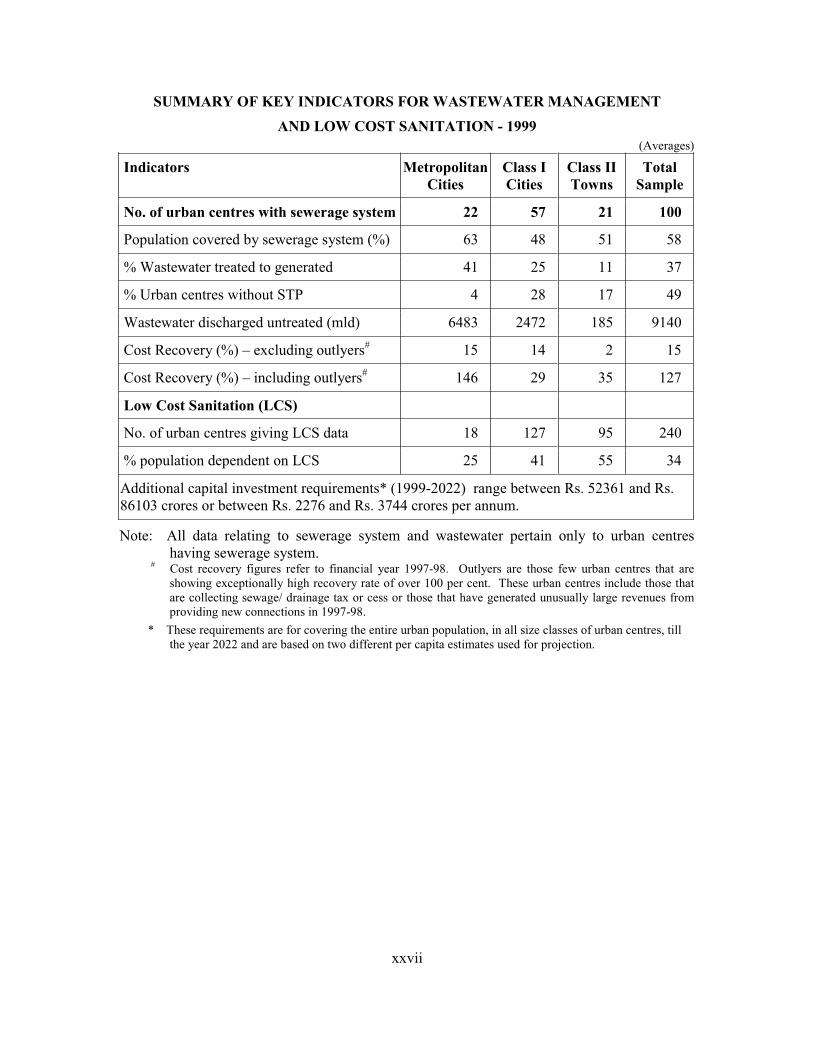
SUMMARY OF KEY INDICATORS FOR WASTEWATER MANAGEMENT
AND LOW COST SANITATION - 1999
(Averages)
Indicators Metropolitan
Cities
Class I
Cities
Class II
Towns
Total
Sample
No. of urban centres with sewerage system 22 57 21 100
Population covered by sewerage system (%) 63 48 51 58
% Wastewater treated to generated 41 25 11 37
% Urban centres without STP 4 28 17 49
Wastewater discharged untreated (mld) 6483 2472 185 9140
Cost Recovery (%) – excluding outlyers# 15 14 2 15
Cost Recovery (%) – including outlyers# 146 29 35 127
Low Cost Sanitation (LCS)
No. of urban centres giving LCS data 18 127 95 240
% population dependent on LCS 25 41 55 34
Additional capital investment requirements* (1999-2022) range between Rs. 52361 and Rs.
86103 crores or between Rs. 2276 and Rs. 3744 crores per annum.
Note: All data relating to sewerage system and wastewater pertain only to urban centres
having sewerage system.
# Cost recovery figures refer to financial year 1997-98. Outlyers are those few urban centres that are
showing exceptionally high recovery rate of over 100 per cent. These urban centres include those that
are collecting sewage/ drainage tax or cess or those that have generated unusually large revenues from
providing new connections in 1997-98.
* These requirements are for covering the entire urban population, in all size classes of urban centres, till
the year 2022 and are based on two different per capita estimates used for projection.
xxviii
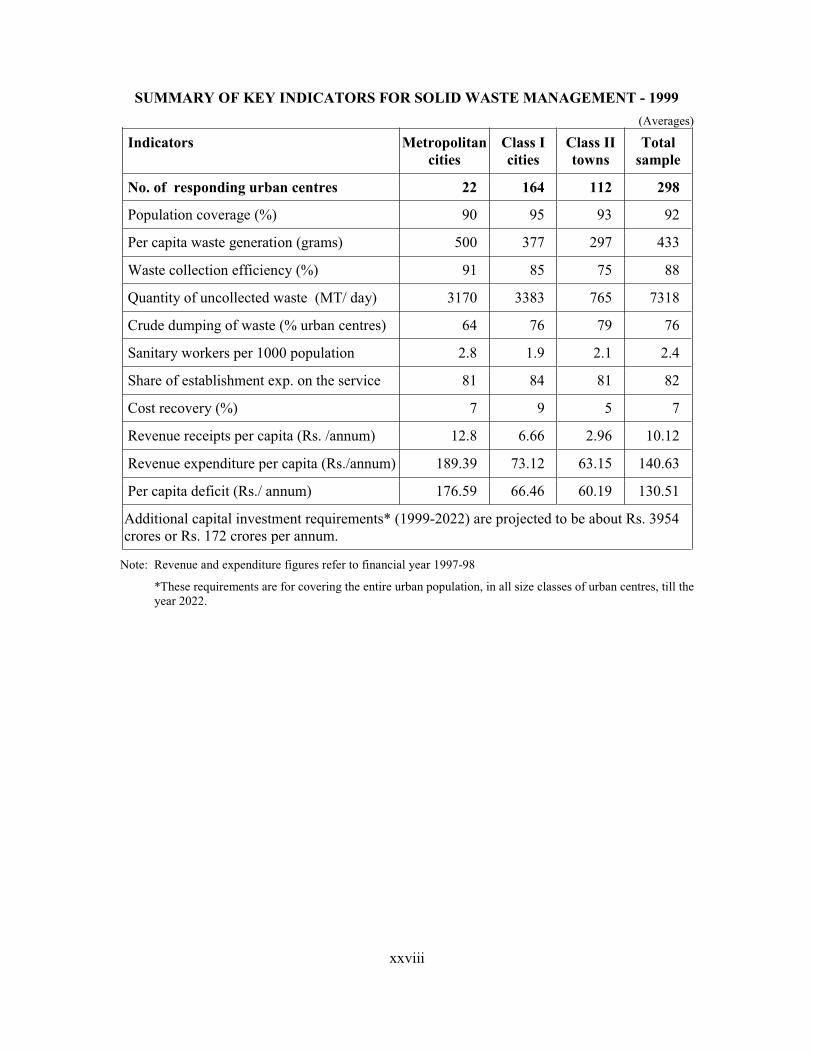
SUMMARY OF KEY INDICATORS FOR SOLID WASTE MANAGEMENT - 1999
(Averages)
Indicators Metropolitan
cities
Class I
cities
Class II
towns
Total
sample
No. of responding urban centres 22 164 112 298
Population coverage (%) 90 95 93 92
Per capita waste generation (grams) 500 377 297 433
Waste collection efficiency (%) 91 85 75 88
Quantity of uncollected waste (MT/ day) 3170 3383 765 7318
Crude dumping of waste (% urban centres) 64 76 79 76
Sanitary workers per 1000 population 2.8 1.9 2.1 2.4
Share of establishment exp. on the service 81 84 81 82
Cost recovery (%) 7 9 5 7
Revenue receipts per capita (Rs. /annum) 12.8 6.66 2.96 10.12
Revenue expenditure per capita (Rs./annum) 189.39 73.12 63.15 140.63
Per capita deficit (Rs./ annum) 176.59 66.46 60.19 130.51
Additional capital investment requirements* (1999-2022) are projected to be about Rs. 3954
crores or Rs. 172 crores per annum.
Note: Revenue and expenditure figures refer to financial year 1997-98
*These requirements are for covering the entire urban population, in all size classes of urban centres, till the
year 2022.
1
CHAPTER 1
INTRODUCTION
1.1 BACKGROUND
Over 20 million people without access to safe water supply and over 100 million
people without safe sanitation facilities is the present (1999) basic services scenario in the
country. Clearly, the task at hand is challenging by any standard. With almost 7 million
people being added to urban India every year, the situation is likely to get worse if the problem
of basic services is not addressed immediately. Efforts are being made to provide basic
services to those deprived of them, yet much more needs to be done to improve the quality of
life in urban India.
India’s ongoing economic liberalization programme aimed at increasing economic growth
along with poverty reduction, needs to be supported by provision of basic infrastructure.
Provision of water supply and sanitation will be essential to such growth to ensure
sustainability. These services have to not only be provided but should meet minimum
standards in terms of quantity, quality and reliability. Constraints and bottlenecks in this sector
have to be addressed on a priority basis to keep up the momentum of economic growth.
Urban India is today faced with major problems such as shortage of safe drinking water,
inadequate sanitation facilities and poor solid waste management services. With the urban
population increasing from 160 million in 1981 to 217 million in 1991, and reaching 285
million in 2001 (Census of India, 2001), the infrastructure in urban areas has reached a
breaking point. This situation has arisen because basic infrastructure has not kept pace with
demand. In 1991, the urban population of the country was residing in 4689 towns/ 3768 urban
agglomerations, as per the Census of India, 1991. The number of cities and towns has now
increased to 5167 (Census, 2001). Increasing attention, therefore, needs to be focused on water
supply, sanitation and solid waste management services as these affect the quality of life of
citizens and the economic growth of the country.
2
Despite the importance of this sector, only a broad assessment of these services is available in
country. The Economic Survey, 1998-991 showed that while 91.82 per cent of the urban
population in the country was covered by water supply, only 49.32 per cent of the urban
population was covered by sanitation facilities. The data available with CPHEEO (for end
March, 1997) puts these figures at 90 per cent and 49 per cent respectively. The main data
source, widely available, on the status of water supply, waste-water, and solid waste
management for Class I and Class II cities and towns in the country is the one published by the
Central Pollution Control Board. These data, however, cover only limited aspects of these
services. There is almost a complete absence of data on the financial aspects of these services
(such as water tariff, income and expenditure on the service) as well as on the newly emerging
aspects such as private sector involvement in municipal services.
Another aspect that is a cause of concern is the neglect of this sector from the standpoint of
investments. While “water supply and sanitation sector continued to receive its due importance
from the First Plan to the Fifth Plan, from the Sixth Plan onwards, there has been a gradual
shift in the priority from urban to rural sector resulting into decreased percentage allocation”.2
This shift has occurred despite the increase in the proportion of urban population to the total
population of the country over the years. In the First Five Year Plan, the Plan outlay for urban
water supply and sanitation sector was Rs.43 crores (1.28% of the public sector outlay) and this
increased to Rs. 549.44 crores (1.4%) in the Fifth Plan. However, in the Sixth Plan the relative
allocation to the urban sector decreased to 1.81% as compared to 2.34% for rural. This
downward trend continued in the subsequent Five Year Plans, resulting in inadequate outlays
(1.38% of the public sector outlay) for urban sector as compared to 2.47% for the rural in the
Eighth Plan. This has had an impact on the coverage of population by these services.
A serious attempt has to be made in the country to assess the financial requirements for this
sector. The only estimates available today come from the Rakesh Mohan Committee Report3
or from the Report of Working Group on Urban Water Supply and Sanitation Sector for Ninth
Five Year Plan (1997-2002). However, the Rakesh Mohan Committee’s financial requirement
1 Economic Survey 1998-99, Ministry of Finance, Economic Division, Government of India, New Delhi (tentative
estimates) 2 Report of the Working Group on Urban Water Supply and Sanitation Sector for Ninth Five Year Plan (1997-
2002), Department of Urban Development, Ministry of Urban Affairs and Employment, Government of India,
New Delhi, July 1996. 3 “The India Infrastructure Report: Policy Imperatives for Growth and Welfare”, Expert Group on the
Commercialisation of Infrastructure Projects, NCAER, New Delhi, 1996.
3
estimates give the investment requirements for these sectors for urban areas as a whole and do
not disaggregate them by size class of urban centres. The Working Group’s estimates, on the
other hand, are grouped into two - Class I and Class II to VI, but have a target year only till the
end of the Ninth Plan i.e. till March 2002. There is thus a need to estimate the financial
requirements for a longer period of time in a disaggregated manner. This would help in long
term planning for the sector.
In the present study an attempt is made to provide the status of water supply, sewerage & low
cost sanitation, and solid waste management (for the year 1999) in 300 selected cities and
towns in the country including metropolitan cities (Table 1.1).
1.2 OBJECTIVES
The main objective of the present study is to assess the status of water supply,
sanitation and solid waste management in selected 305 cities and towns of India and to
estimate the requirement of funds for full coverage of population by these services in the urban
areas of the country. The detailed objectives of the study are:
• To assess the current status of water supply, sanitation (including on-site sanitation) and
solid waste management in the metropolitan cities, Class I and Class II towns of the
country using data from a sample of 305 metropolitan, Class I & Class II towns.
• To analyze the revenue receipts and revenue expenditure of the selected services, i.e.
water supply, sanitation and solid waste management and also to study the capital
investments on these services for the sampled cities and towns.
• To estimate the capital investment requirements for full coverage of population by these
services from 1999 to 2022 A.D. (at 5 yearly intervals) for metropolitan cities and for
all classes of towns by size class.
The status of water supply broadly covers the following aspects:
(a) Institutional arrangements for water supply
(b) the population served and per capita availability of water
(c) sources of water supply and distance to sources
(d) water supply by uses
(e) water losses
(f) water connections and other physical aspects
4
(g) water treatment
(h) privatisation aspects
(i) staff position
(j) water tariff
(k) revenue and expenditure on water supply
(l) capital works undertaken and proposed to be undertaken and their per capita costs
The status of sewerage and sanitation covers the following aspects:
(a) population coverage by sewerage system
(b) waste water generation and collection
(c) treatment of waste water
(d) recycling and reuse of waste water
(e) revenue and expenditure on the sewerage system
(f) staff position
(g) privatisation aspects
(h) capital works undertaken and proposed to be undertaken and their per capita costs
(i) population covered by septic tanks and low cost sanitation facilities
The status of solid waste management broadly covers the following aspects:
(a) population covered by the service
(b) quantity of waste generated and collected
(c) transportation of waste
(d) waste disposal methods
(e) details of treatment and disposal
(f) staff position
(g) privatisation aspects
(h) revenue and expenditure on solid waste management
(i) capital expenditure incurred and proposed to be incurred and their per capita costs
A further attempt is made in the study to estimate the future investment requirements. This
estimate is based on:
a) population projected for various years
b) per capita cost of services
c) backlog population to be covered and additional population to be covered in the years
to come

5
1.3 DATA BASE
The study covers a sample of 305 cities and towns drawn from metropolitan, Class
I and II population size classes (for a list of selected cities/towns see Table 1.1). The study
covers the entire country, i.e., all the 25 States and 7 Union Territories4. All state and union
territory capitals have also been covered in the study, regardless of their size class, except for, ,
Patna and Gandhinagar, where despite efforts, information could not be obtained from the
concerned agencies.
The data for the study has been obtained from the respective urban local bodies, water
supplying authorities and agencies doing capital works in the selected sample cities and towns.
The data, in the present study, has been organised into three groups – metropolitan cities, Class
I cities and Class II towns based on 1991 Census population figures.
The Metropolitan cities include 22 cities and urban agglomerations with million plus
population (as per Census of India, 1991). However, the population of only the main city in
the agglomeration has been taken in the present study. Therefore, six cities in the
metropolitan urban agglomerations list, which do not reach the million mark (as per 1991
Census), have been included in the metropolitan cities group (Table 1.2). This has been done
in order to keep with the general perception of 23 metropolitan cities in the country.
The Class I cities, in the present study, include cities with a population of between 100,000 and
1,000,000. In all the tables in the report, metropolitan cities have been excluded from Class I
cities group. This has been done in order to highlight the status of services in the Class I cities,
other than the metropolitan cities.
The Class II towns, are towns with a population of between 50,000 and 100,000. However, in
the tables in the report, six towns with a population of less than 50,000 have been included in
Class II towns. These are the capitals of the relatively small states and union territories (Table
1.1). This has been done to avoid a fourth classification of towns and arriving at extreme
results due to the very small number of sample towns in this category. The inclusion of these
six towns in Class II category does not alter the major findings of the study.
4 At present there are 28 states in the country but at the time of survey there were only 25 states.
6
1.4 METHODOLOGY
As mentioned earlier, the responsibility for providing water supply and sanitation
rests with different agencies in different states. Therefore, data in respect of these services has
been obtained only from the respective agencies.
1.4.1 Selection of Towns
• Selection of cities/towns has been done on purposive sampling basis. Of the total 305
cities/ towns that were selected, the sample was divided amongst the Class I and Class
II towns in a 2:1 ratio. This was done purposely in order to give greater representation
to Class I cities as these cities form a very large proportion of the total urban centres in
the country.
• While selecting the towns from Class I size class, due consideration was given to the
towns with population of upto 5 lakhs, between 5 to 10 lakhs and above 10 lakhs.
• All the state and union territory capitals, irrespective of their size class and all the
metropolitan cities were included in the sample selected. However, reponse could not
be obtained from Patna.
• Keeping in mind the time frame for the fieldwork, it was decided to select cities that
had relatively better accessibility. Some towns were also selected in clusters in order to
facilitate information collection.
• In selecting the sample towns, care was taken to see that there was sufficient
geographical coverage within each state. In states where there were very few Class I
and II towns, this type of geographical coverage was not possible.
• Urban agglomerations, as agglomerations, have not been included in the sample. In
most cases, only the main city/town in urban agglomerations have been included in the
list of selected towns. If the population of the main town in the agglomeration fell
below Class II level then the town was not selected.
• Only towns with municipal status were selected. Exceptions were only those state/
union territory capitals which had to be selected but did not have a municipal civic
status.

7
• In the selected towns, only the area falling under municipal jurisdiction has been
covered. Areas outside municipal jurisdiction have not been covered by the study.
• In the towns without municipal bodies, area within the jurisdiction of the main authority
in-charge of providing the selected services have been covered.
• A list of alternate cities/towns was also prepared simultaneously. This list consisted of
the remaining Class I and II towns, which were not included in the main list of sample
towns. This list was made in order to provide alternate sample towns for survey in case
there was a problem in data collection in the selected towns.
• Selection of cities/towns was done in consultation with CPHEEO.
1.4.2 Questionnaires
A specially designed questionnaire was prepared for each service covered in the
study i.e., water supply, sanitation and solid waste management for collecting information from
the selected cities and towns.
1. Based on a questionnaire given by CPHEEO, a specially designed questionnaire was
prepared, incorporating many new aspects in order to provide better understanding of
the subject.
2. The questionnaires were designed keeping in mind the objectives of the study and the
clarity required at the field level for filling the questionnaire.
3. The size of the questionnaire was also an important consideration while designing the
questionnaire as the survey had to be completed within a specified time frame.
4. Based on the agencies providing the services covered by the study, the questionnaire
was divided into three viz., water supply, sewerage and sanitation, and solid waste
management.
5. The questionnaire was also translated into Hindi in order to facilitate collection of
information in the northern states of the country.
6. The questionnaires were field tested before finalization. This step helped in refining the
questionnaires – both in content and in design (see Annex 2 for the questionnaires used
in the survey).
8
1.4.3 Data Collection
While the institutional arrangements for providing water supply and sewerage in
different states and union territories vests with different agencies, at times, even within the
same state different towns have different arrangements. In a given state there could be one
agency responsible for capital works (i.e. execution of projects) and another for operation and
maintenance. The agencies could be fully government departments, semi-autonomous boards
and autonomous boards. Therefore, the study had to obtain data from different public agencies
in different states for water supply and sewerage. However, in almost all the states and union
territories, the responsibility for solid waste management vests only with the local
governments. Exceptions to this are mainly found in small states and union territories.
Data was collected by first mailing the questionnaires and then making personal visits to the
selected towns.
a) Mailing
Questionnaires were mailed to different agencies in different towns. The questionnaire
pertaining to water supply and sewerage was mailed to the agencies providing these services in
the selected towns while the questionnaire pertaining to solid waste management was sent to
respective local governments, with some exceptions.
b) Personal visits
Mailing of questionnaires to the selected towns was followed by personal visits to almost all
the towns, exceptions being the North-eastern states, Andaman & Nicobar Islands, and
Lakshadweep Islands. For personal visits, assistance of six agencies was sought covering
different regions of the country (see Annex 1 for the list of collaborating agencies). This was
done not only to save time and costs, but also to overcome the language barrier.
1.5 SCOPE AND LIMITATIONS
The study looks at only the public provision of selected services but does not cover
private arrangements made by individuals, communities or NGOs. The study focusses on the
city as a whole, and does not focus in detail on any specific group such as the community
groups or slums. The study does not cover intra-city distribution of services, it only looks at
the whole city as one unit.
9
The present study has not collected time series data but has collected data for one year only.
Since the present study’s focus is an overview of the status of the selected services in the
country, there is no in-depth analysis of problems in the report.
1.6 TIME FRAME
The study had a time frame of one year starting March, 1999. However, due to the
all-India nature of the survey, the holding of one General Election during the survey period and
the happening of a major natural disaster like the cyclone in Orissa, and other problems like
floods in Bihar and so on, and also local level problems in data collection, the study took
longer to be completed than anticipated.
The major findings emerging from the survey were presented to the CPHEEO and the draft
report with the major findings was submitted in June 2000. A suggestion was made by the
CPHEEO, at this stage, to change the organization of the data in the report so that instead of
presenting the data state-wise, it would be presented class-wise. This entailed redoing all the
tables and calculations, which further delayed the submission of the final report. A revised
draft report, incorporating the suggestions given by the CPHEEO, was submitted to the
Ministry of Urban Development (MOUD&PA) in March 2001. The report was scrutinized by
the CPHEEO and comments sent to NIUA towards the end of 2001. The present report has
incorporated all the comments given by the CPHEEO on the draft reports.
The data in the study pertains to the year 1999, except for the data on revenue and expenditure,
which pertains to the financial year 1997-98.
1.7 PROCESSING OF DATA
The entire data collected from the field was processed and tabulated by the
Institute’s computer unit. This process, included writing of programme for data feeding,
coding of data, scrutinizing, preparing tables for the report as well as for the statistical
volumes.
10
1.8 STUDY OUTPUT
The study’s output are the following:
• Assessment of the current status of water supply, sanitation (including on-site sanitation)
and solid waste management in the metropolitan cities and selected Class I cities & Class
II towns of the country.
• Analysis of revenue income and expenditure on the selected services, i.e. water supply,
sanitation and solid waste management services.
• Estimation of future investment requirements for full coverage of population up to 2022
A.D. at five year intervals, i.e., for 2002, 2007, 2012, 2017 and 2022, for all classes of
cities and towns in the country.
1.9 ORGANISATION OF THE REPORT
The present report has been organised into five chapters. Chapter I contains the
introduction to the study. Chapter II, III and IV present the status of water supply, sewerage &
low cost sanitation, and solid waste management services respectively along with the
additional investment requirements for each service. The final chapter, Chapter V presents the
broad conclusions and summary of results emerging from the study.
The data pertaining to the three services covered in the study have been presented in three
statistical volumes. Statistical Volume I gives data on Water Supply and Water Tariff, Volume
II gives data on Wastewater Management and Low Cost Sanitation and Volume III gives data
on Solid Waste Management.
11
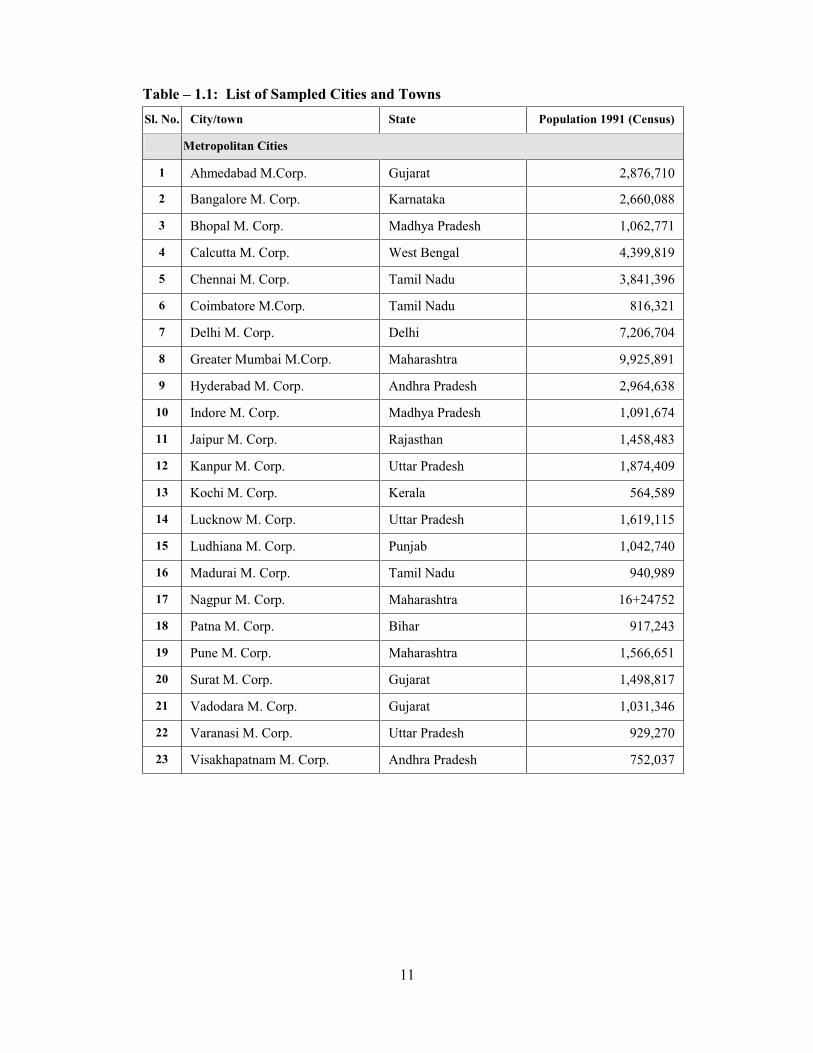
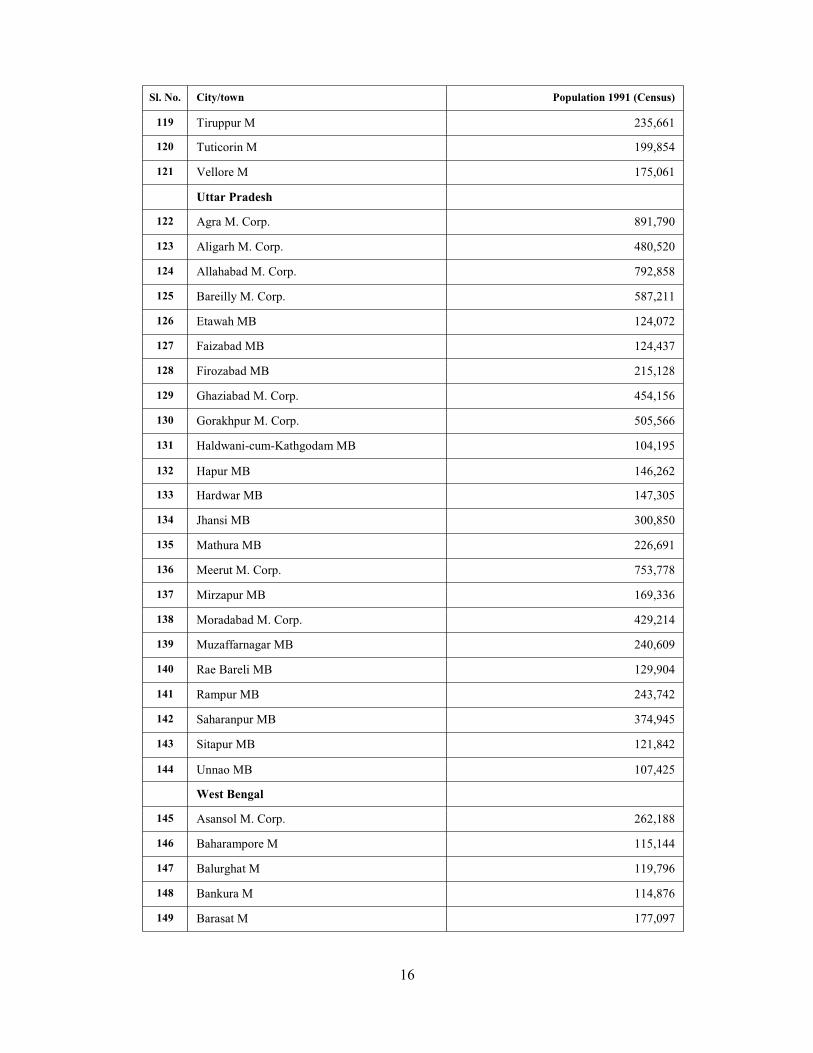
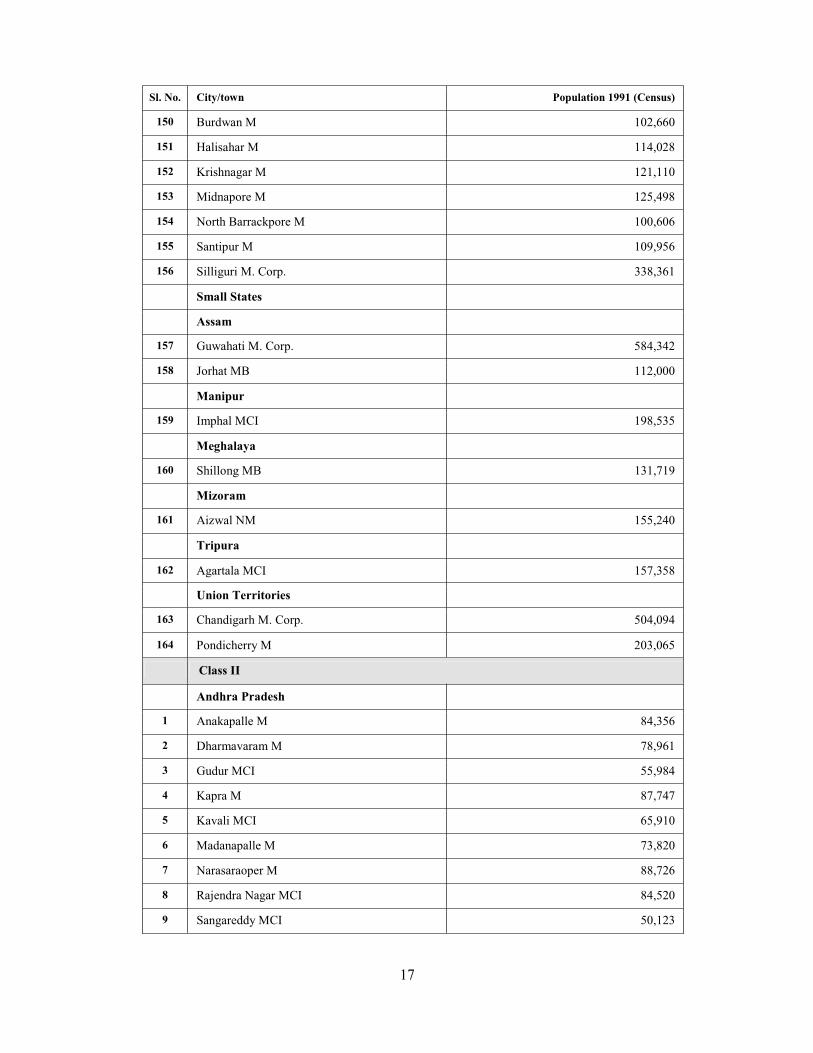
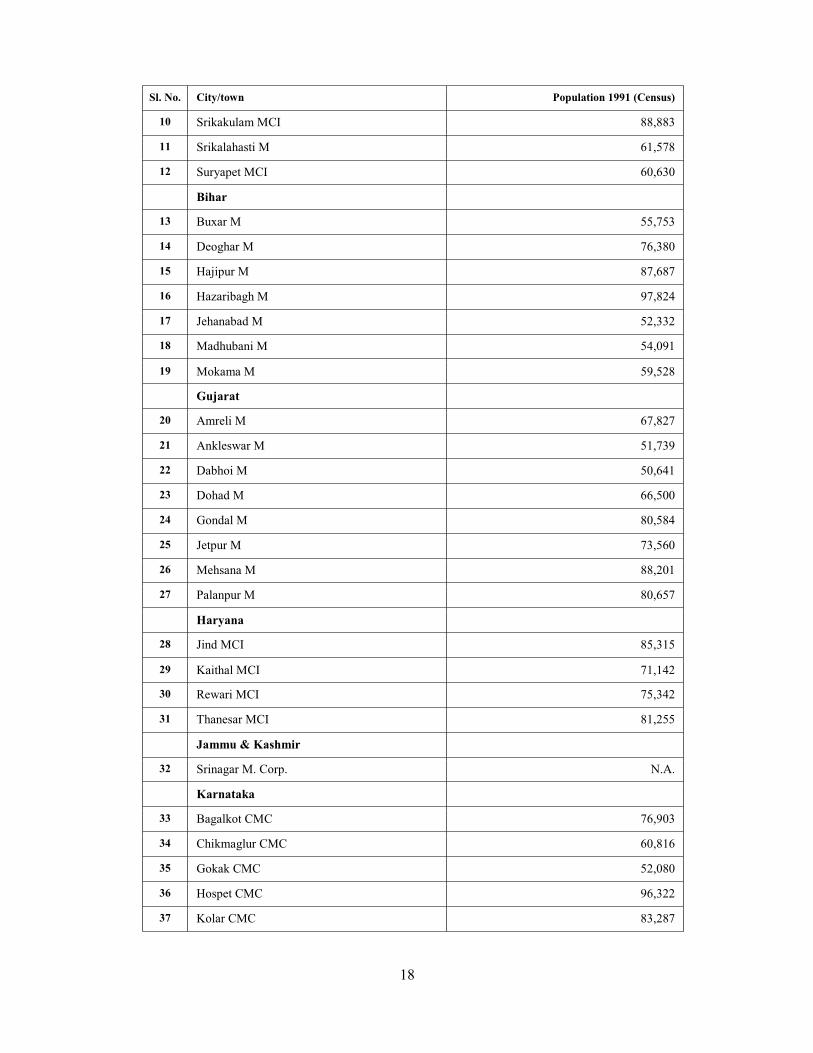
Table – 1.1: List of Sampled Cities and Towns
Sl. No. City/town State Population 1991 (Census)
Metropolitan Cities
1 Ahmedabad M.Corp. Gujarat 2,876,710
2 Bangalore M. Corp. Karnataka 2,660,088
3 Bhopal M. Corp. Madhya Pradesh 1,062,771
4 Calcutta M. Corp. West Bengal 4,399,819
5 Chennai M. Corp. Tamil Nadu 3,841,396
6 Coimbatore M.Corp. Tamil Nadu 816,321
7 Delhi M. Corp. Delhi 7,206,704
8 Greater Mumbai M.Corp. Maharashtra 9,925,891
9 Hyderabad M. Corp. Andhra Pradesh 2,964,638
10 Indore M. Corp. Madhya Pradesh 1,091,674
11 Jaipur M. Corp. Rajasthan 1,458,483
12 Kanpur M. Corp. Uttar Pradesh 1,874,409
13 Kochi M. Corp. Kerala 564,589
14 Lucknow M. Corp. Uttar Pradesh 1,619,115
15 Ludhiana M. Corp. Punjab 1,042,740
16 Madurai M. Corp. Tamil Nadu 940,989
17 Nagpur M. Corp. Maharashtra 16+24752
18 Patna M. Corp. Bihar 917,243
19 Pune M. Corp. Maharashtra 1,566,651
20 Surat M. Corp. Gujarat 1,498,817
21 Vadodara M. Corp. Gujarat 1,031,346
22 Varanasi M. Corp. Uttar Pradesh 929,270
23 Visakhapatnam M. Corp. Andhra Pradesh 752,037
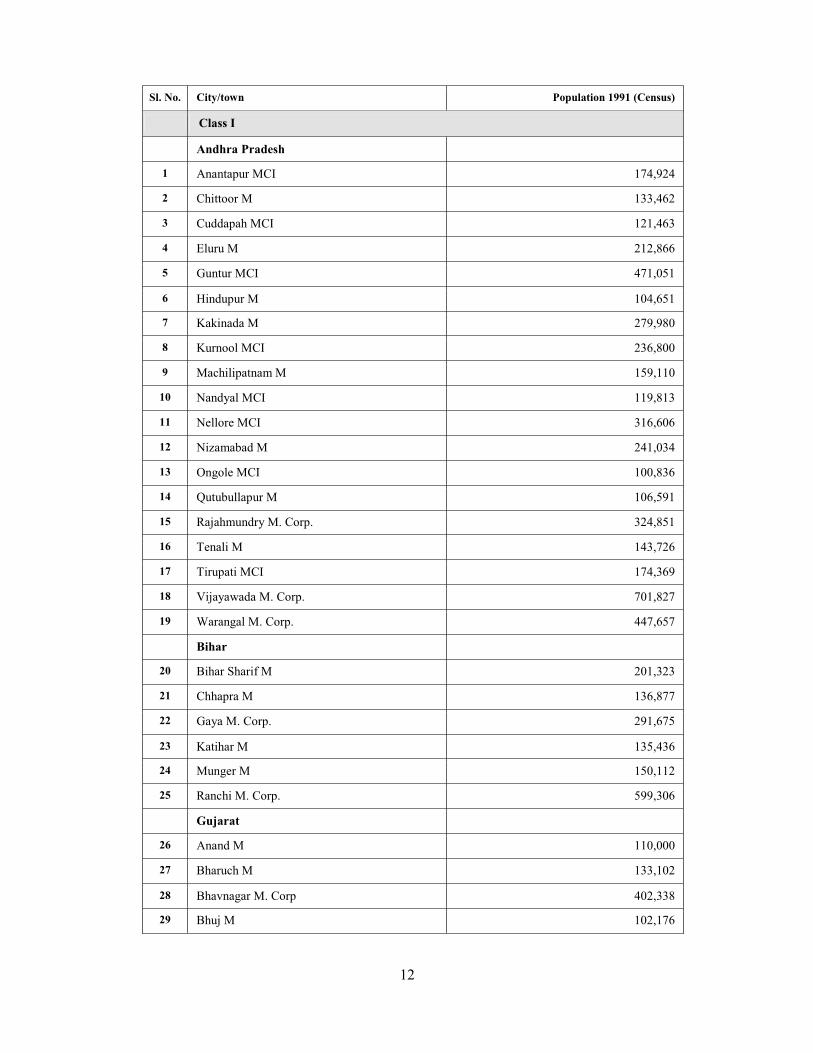
12
Sl. No. City/town Population 1991 (Census)
Class I
Andhra Pradesh
1 Anantapur MCI 174,924
2 Chittoor M 133,462
3 Cuddapah MCI 121,463
4 Eluru M 212,866
5 Guntur MCI 471,051
6 Hindupur M 104,651
7 Kakinada M 279,980
8 Kurnool MCI 236,800
9 Machilipatnam M 159,110
10 Nandyal MCI 119,813
11 Nellore MCI 316,606
12 Nizamabad M 241,034
13 Ongole MCI 100,836
14 Qutubullapur M 106,591
15 Rajahmundry M. Corp. 324,851
16 Tenali M 143,726
17 Tirupati MCI 174,369
18 Vijayawada M. Corp. 701,827
19 Warangal M. Corp. 447,657
Bihar
20 Bihar Sharif M 201,323
21 Chhapra M 136,877
22 Gaya M. Corp. 291,675
23 Katihar M 135,436
24 Munger M 150,112
25 Ranchi M. Corp. 599,306
Gujarat
26 Anand M 110,000
27 Bharuch M 133,102
28 Bhavnagar M. Corp 402,338
29 Bhuj M 102,176

13
Sl. No. City/town Population 1991 (Census)
30 Jamnagar M. Corp. 341,637
31 Junagadh M 130,484
32 Nadiad M 167,051
33 Navsari M 126,089
34 Porbandar M 116,671
35 Rajkot M. Corp. 559,407
36 Surendranagar M 106,110
Haryana
37 Ambala MCI 119,338
38 Faridabad M. Corp. 617,717
39 Gurgaon MCI 121,486
40 Hisar MCI 172,677
41 Karnal MCI 176,131
42 Rohtak MCI 216,096
Jammu & Kashmir
43 Jammu M. Corp. 716,000
Karnataka
44 Belgaum M. Corp. 326,399
45 Bellary CMC 245,391
46 Davangere MCI 266,082
47 Gadag-Betigeri CMC 134,051
48 Gulbarga M. Corp. 304,099
49 Hubli-Dharwar M. Corp. 678,298
50 Mandya M 120,265
51 Mangalore M. Corp. 273,304
52 Mysore M. Corp. 480,692
53 Shimoga CMC 179,258
54 Tumkur M 138,903
Kerala
55 Alappuzha MC 174,666
56 Kollam MC 139,852
57 Kozhikode M. Corp. 419,831
58 Thalaserry M 103,579

14
Sl. No. City/town Population 1991 (Census)
59 Thiruvananthapuram M. Corp. 524,006
Maharashtra
60 Amravati M. Corp. 421,576
61 Aurnagabad M. Corp. 573,272
62 Bhusawal MCI 145,143
63 Chandrapur MCI 226,105
64 Dhule MCI 278,317
65 Ichalkaranji MCI 214,950
66 Jalgaon MCI 242,193
67 Kolhapur M. Corp. 406,370
68 Nanded Waghala M. Corp. 275,083
69 Nashik M. Corp. 656,925
70 Parbhani MCI 190,255
71 Solapur M. Corp. 604,215
72 Wardha M 102,985
73 Yavatmal MCI 108,578
Madhya Pradesh
74 Bhind M 109,755
75 Burhnapur M. Copr. 172,710
76 Dewas M. Corp. 164,364
77 Guna M 100,490
78 Gwalior M. Corp. 690,765
79 Jabalpur M. Corp. 741,927
80 Khandwa M 145,133
81 Morena M 105,135
82 Murwara (Katni) M. Corp. 163,431
83 Ratlam M. Corp. 183,375
84 Rewa M. Corp. 128,981
85 Satna M. Corp. 156,630
86 Shivpuri M 108,277
Orissa
87 Bhubaneswar M. Corp. 411,542
88 Cuttack M. Corp. 403,418
15
Sl. No. City/town Population 1991 (Census)
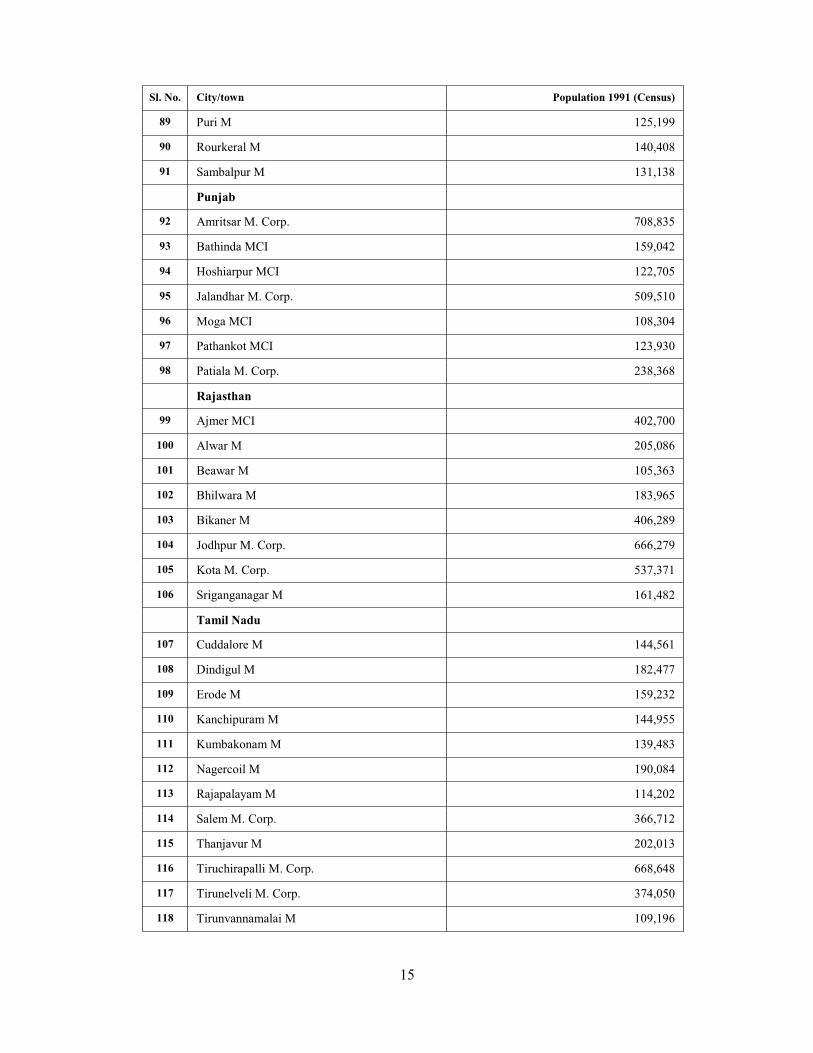
89 Puri M 125,199
90 Rourkeral M 140,408
91 Sambalpur M 131,138
Punjab
92 Amritsar M. Corp. 708,835
93 Bathinda MCI 159,042
94 Hoshiarpur MCI 122,705
95 Jalandhar M. Corp. 509,510
96 Moga MCI 108,304
97 Pathankot MCI 123,930
98 Patiala M. Corp. 238,368
Rajasthan
99 Ajmer MCI 402,700
100 Alwar M 205,086
101 Beawar M 105,363
102 Bhilwara M 183,965
103 Bikaner M 406,289
104 Jodhpur M. Corp. 666,279
105 Kota M. Corp. 537,371
106 Sriganganagar M 161,482
Tamil Nadu
107 Cuddalore M 144,561
108 Dindigul M 182,477
109 Erode M 159,232
110 Kanchipuram M 144,955
111 Kumbakonam M 139,483
112 Nagercoil M 190,084
113 Rajapalayam M 114,202
114 Salem M. Corp. 366,712
115 Thanjavur M 202,013
116 Tiruchirapalli M. Corp. 668,648
117 Tirunelveli M. Corp. 374,050
118 Tirunvannamalai M 109,196
16
Sl. No. City/town Population 1991 (Census)
119 Tiruppur M 235,661
120 Tuticorin M 199,854
121 Vellore M 175,061
Uttar Pradesh
122 Agra M. Corp. 891,790
123 Aligarh M. Corp. 480,520
124 Allahabad M. Corp. 792,858
125 Bareilly M. Corp. 587,211
126 Etawah MB 124,072
127 Faizabad MB 124,437
128 Firozabad MB 215,128
129 Ghaziabad M. Corp. 454,156
130 Gorakhpur M. Corp. 505,566
131 Haldwani-cum-Kathgodam MB 104,195
132 Hapur MB 146,262
133 Hardwar MB 147,305
134 Jhansi MB 300,850
135 Mathura MB 226,691
136 Meerut M. Corp. 753,778
137 Mirzapur MB 169,336
138 Moradabad M. Corp. 429,214
139 Muzaffarnagar MB 240,609
140 Rae Bareli MB 129,904
141 Rampur MB 243,742
142 Saharanpur MB 374,945
143 Sitapur MB 121,842
144 Unnao MB 107,425
West Bengal
145 Asansol M. Corp. 262,188
146 Baharampore M 115,144
147 Balurghat M 119,796
148 Bankura M 114,876
149 Barasat M 177,097
17
Sl. No. City/town Population 1991 (Census)
150 Burdwan M 102,660
151 Halisahar M 114,028
152 Krishnagar M 121,110
153 Midnapore M 125,498
154 North Barrackpore M 100,606
155 Santipur M 109,956
156 Silliguri M. Corp. 338,361
Small States
Assam
157 Guwahati M. Corp. 584,342
158 Jorhat MB 112,000
Manipur
159 Imphal MCI 198,535
Meghalaya
160 Shillong MB 131,719
Mizoram
161 Aizwal NM 155,240
Tripura
162 Agartala MCI 157,358
Union Territories
163 Chandigarh M. Corp. 504,094
164 Pondicherry M 203,065
Class II
Andhra Pradesh
1 Anakapalle M 84,356
2 Dharmavaram M 78,961
3 Gudur MCI 55,984
4 Kapra M 87,747
5 Kavali MCI 65,910
6 Madanapalle M 73,820
7 Narasaraoper M 88,726
8 Rajendra Nagar MCI 84,520
9 Sangareddy MCI 50,123
18
Sl. No. City/town Population 1991 (Census)
10 Srikakulam MCI 88,883
11 Srikalahasti M 61,578
12 Suryapet MCI 60,630
Bihar
13 Buxar M 55,753
14 Deoghar M 76,380
15 Hajipur M 87,687
16 Hazaribagh M 97,824
17 Jehanabad M 52,332
18 Madhubani M 54,091
19 Mokama M 59,528
Gujarat
20 Amreli M 67,827
21 Ankleswar M 51,739
22 Dabhoi M 50,641
23 Dohad M 66,500
24 Gondal M 80,584
25 Jetpur M 73,560
26 Mehsana M 88,201
27 Palanpur M 80,657
Haryana
28 Jind MCI 85,315
29 Kaithal MCI 71,142
30 Rewari MCI 75,342
31 Thanesar MCI 81,255
Jammu & Kashmir
32 Srinagar M. Corp. N.A.
Karnataka
33 Bagalkot CMC 76,903
34 Chikmaglur CMC 60,816
35 Gokak CMC 52,080
36 Hospet CMC 96,322
37 Kolar CMC 83,287
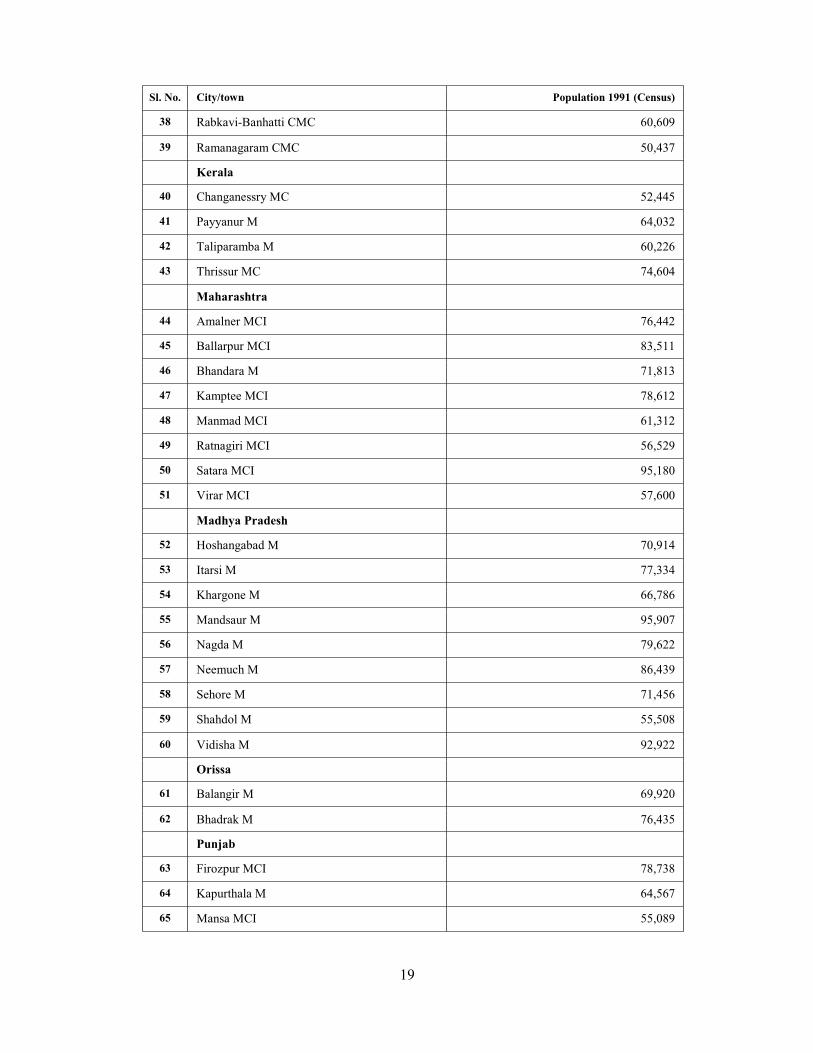
19
Sl. No. City/town Population 1991 (Census)
38 Rabkavi-Banhatti CMC 60,609
39 Ramanagaram CMC 50,437
Kerala
40 Changanessry MC 52,445
41 Payyanur M 64,032
42 Taliparamba M 60,226
43 Thrissur MC 74,604
Maharashtra
44 Amalner MCI 76,442
45 Ballarpur MCI 83,511
46 Bhandara M 71,813
47 Kamptee MCI 78,612
48 Manmad MCI 61,312
49 Ratnagiri MCI 56,529
50 Satara MCI 95,180
51 Virar MCI 57,600
Madhya Pradesh
52 Hoshangabad M 70,914
53 Itarsi M 77,334
54 Khargone M 66,786
55 Mandsaur M 95,907
56 Nagda M 79,622
57 Neemuch M 86,439
58 Sehore M 71,456
59 Shahdol M 55,508
60 Vidisha M 92,922
Orissa
61 Balangir M 69,920
62 Bhadrak M 76,435
Punjab
63 Firozpur MCI 78,738
64 Kapurthala M 64,567
65 Mansa MCI 55,089
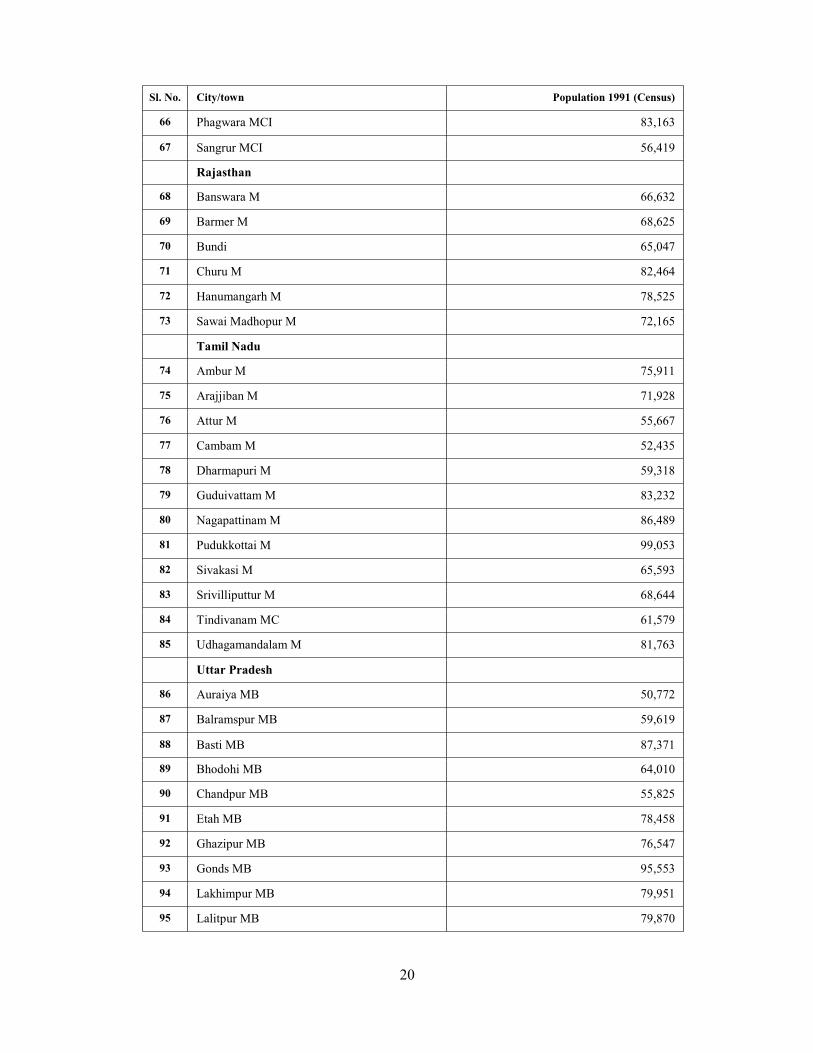
20
Sl. No. City/town Population 1991 (Census)
66 Phagwara MCI 83,163
67 Sangrur MCI 56,419
Rajasthan
68 Banswara M 66,632
69 Barmer M 68,625
70 Bundi 65,047
71 Churu M 82,464
72 Hanumangarh M 78,525
73 Sawai Madhopur M 72,165
Tamil Nadu
74 Ambur M 75,911
75 Arajjiban M 71,928
76 Attur M 55,667
77 Cambam M 52,435
78 Dharmapuri M 59,318
79 Guduivattam M 83,232
80 Nagapattinam M 86,489
81 Pudukkottai M 99,053
82 Sivakasi M 65,593
83 Srivilliputtur M 68,644
84 Tindivanam MC 61,579
85 Udhagamandalam M 81,763
Uttar Pradesh
86 Auraiya MB 50,772
87 Balramspur MB 59,619
88 Basti MB 87,371
89 Bhodohi MB 64,010
90 Chandpur MB 55,825
91 Etah MB 78,458
92 Ghazipur MB 76,547
93 Gonds MB 95,553
94 Lakhimpur MB 79,951
95 Lalitpur MB 79,870
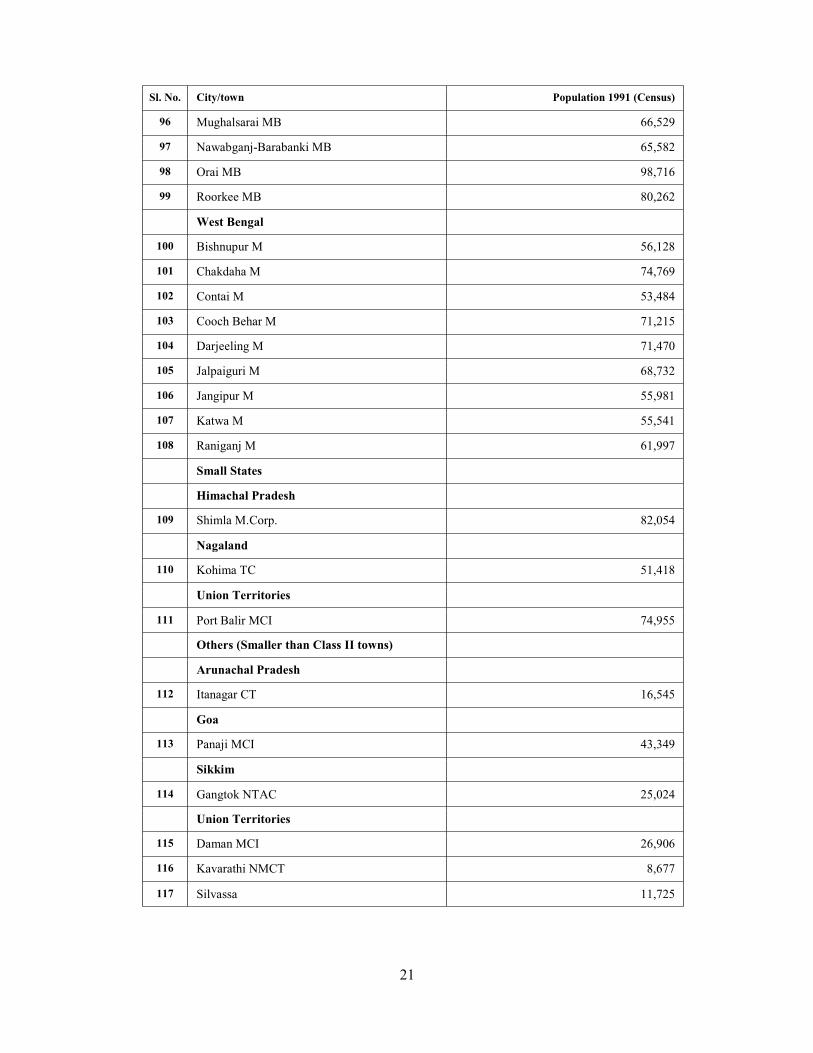
21
Sl. No. City/town Population 1991 (Census)
96 Mughalsarai MB 66,529
97 Nawabganj-Barabanki MB 65,582
98 Orai MB 98,716
99 Roorkee MB 80,262
West Bengal
100 Bishnupur M 56,128
101 Chakdaha M 74,769
102 Contai M 53,484
103 Cooch Behar M 71,215
104 Darjeeling M 71,470
105 Jalpaiguri M 68,732
106 Jangipur M 55,981
107 Katwa M 55,541
108 Raniganj M 61,997
Small States
Himachal Pradesh
109 Shimla M.Corp. 82,054
Nagaland
110 Kohima TC 51,418
Union Territories
111 Port Balir MCI 74,955
Others (Smaller than Class II towns)
Arunachal Pradesh
112 Itanagar CT 16,545
Goa
113 Panaji MCI 43,349
Sikkim
114 Gangtok NTAC 25,024
Union Territories
115 Daman MCI 26,906
116 Kavarathi NMCT 8,677
117 Silvassa 11,725
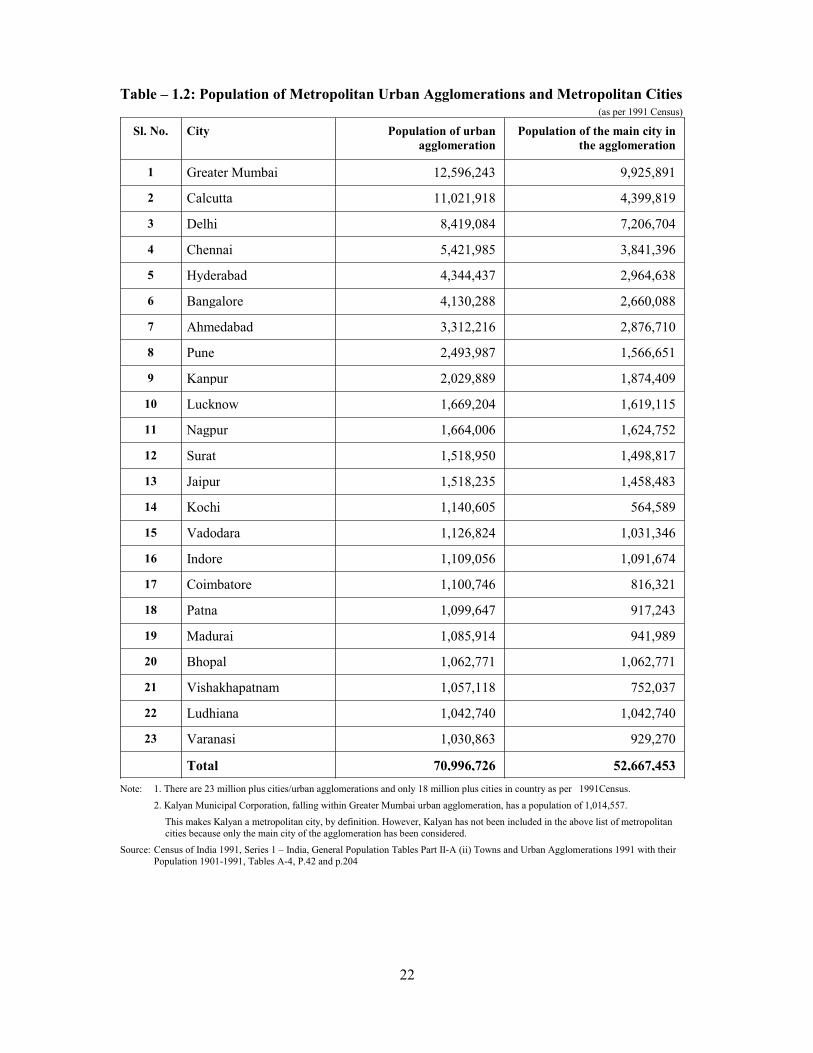
22
Table – 1.2: Population of Metropolitan Urban Agglomerations and Metropolitan Cities (as per 1991 Census)
Sl. No. City Population of urban
agglomeration
Population of the main city in
the agglomeration
1 Greater Mumbai 12,596,243 9,925,891
2 Calcutta 11,021,918 4,399,819
3 Delhi 8,419,084 7,206,704
4 Chennai 5,421,985 3,841,396
5 Hyderabad 4,344,437 2,964,638
6 Bangalore 4,130,288 2,660,088
7 Ahmedabad 3,312,216 2,876,710
8 Pune 2,493,987 1,566,651
9 Kanpur 2,029,889 1,874,409
10 Lucknow 1,669,204 1,619,115
11 Nagpur 1,664,006 1,624,752
12 Surat 1,518,950 1,498,817
13 Jaipur 1,518,235 1,458,483
14 Kochi 1,140,605 564,589
15 Vadodara 1,126,824 1,031,346
16 Indore 1,109,056 1,091,674
17 Coimbatore 1,100,746 816,321
18 Patna 1,099,647 917,243
19 Madurai 1,085,914 941,989
20 Bhopal 1,062,771 1,062,771
21 Vishakhapatnam 1,057,118 752,037
22 Ludhiana 1,042,740 1,042,740
23 Varanasi 1,030,863 929,270
Total 70,996,726 52,667,453
Note: 1. There are 23 million plus cities/urban agglomerations and only 18 million plus cities in country as per 1991Census.
2. Kalyan Municipal Corporation, falling within Greater Mumbai urban agglomeration, has a population of 1,014,557.
This makes Kalyan a metropolitan city, by definition. However, Kalyan has not been included in the above list of metropolitan
cities because only the main city of the agglomeration has been considered.
Source: Census of India 1991, Series 1 – India, General Population Tables Part II-A (ii) Towns and Urban Agglomerations 1991 with their
Population 1901-1991, Tables A-4, P.42 and p.204
23
CHAPTER II
STATUS OF WATER SUPPLY
2.1 INTRODUCTION
Indian cities and towns are increasingly facing potable water crisis due to mounting
demand and inadequate measures to meet the demand. This situation is the result of an
increase in urban population, depletion of nearby water sources, water pollution, inefficient use
of water, inefficient management of water supply systems and multiple institutional
arrangements. This situation needs to be improved so that water is available to all at a
reasonable cost. The present scenario of the public water supply system, thus, needs to be
understood well in order to take steps to improve the system.
This chapter presents the status of public water supply system in 301 sampled Class I and Class
II urban centres, including most of the metropolitan cities in the country (as per Census of
India, 1991). The total population covered by these 301 urban centres is 141.02 million, that is,
71.43 million in 22 metropolitan cities, 59.12 million in 164 Class I cities and 10.47 million in
115 Class II towns (Table A-1 in Statistical Volume I). The chapter covers different aspects of water
supply including coverage, quantity supplied, per capita supply, norms for supply, unaccounted
for water, water connections, source and storage of water, water treatment, institutional
arrangements, staff position, privatisation and financial aspects of water supply. The chapter
finally gives the additional capital investment requirements for covering the entire population
by water supply till the year 2022.
2.2 COVERAGE OF POPULATION BY WATER SUPPLY
The Approach Paper to the Ninth Plan (1997-2002) estimates that 85 per cent of
the country’s urban population has access to water supply. The Plan states that 100 per cent of
the population should be covered by water supply by the year 2002.
One of the obligatory functions of local bodies is to provide water supply to the residents.
Although this function has been taken over by para-statals or city level boards in many urban
centers, providing safe water to the entire population remains the duty of the concerned public
authority. However, covering the entire population by water supply requires continuous
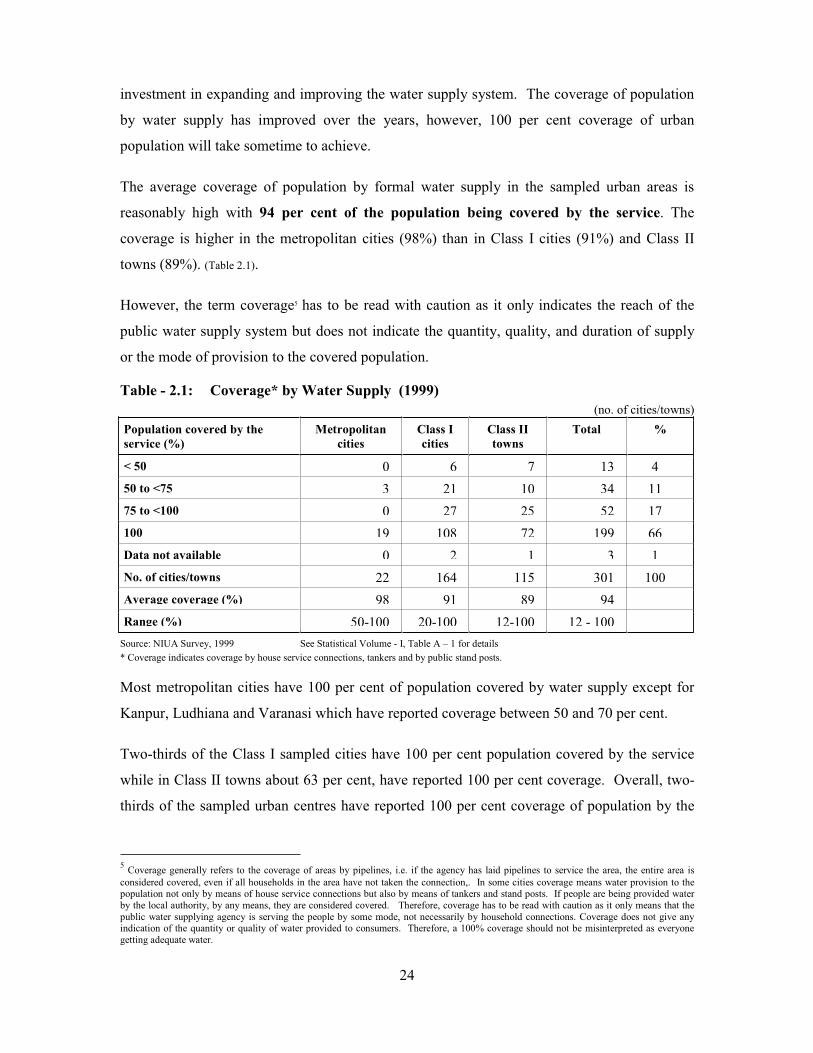
24
investment in expanding and improving the water supply system. The coverage of population
by water supply has improved over the years, however, 100 per cent coverage of urban
population will take sometime to achieve.
The average coverage of population by formal water supply in the sampled urban areas is
reasonably high with 94 per cent of the population being covered by the service. The
coverage is higher in the metropolitan cities (98%) than in Class I cities (91%) and Class II
towns (89%). (Table 2.1).
However, the term coverage5 has to be read with caution as it only indicates the reach of the
public water supply system but does not indicate the quantity, quality, and duration of supply
or the mode of provision to the covered population.
Table - 2.1: Coverage* by Water Supply (1999)
(no. of cities/towns)
Population covered by the
service (%)
Metropolitan
cities
Class I
cities
Class II
towns
Total %
< 50 0 6 7 13 4
50 to <75 3 21 10 34 11
75 to <100 0 27 25 52 17
100 19 108 72 199 66
Data not available 0 2 1 3 1
No. of cities/towns 22 164 115 301 100
Average coverage (%) 98 91 89 94
Range (%) 50-100 20-100 12-100 12 - 100
Source: NIUA Survey, 1999 See Statistical Volume - I, Table A – 1 for details
* Coverage indicates coverage by house service connections, tankers and by public stand posts.
Most metropolitan cities have 100 per cent of population covered by water supply except for
Kanpur, Ludhiana and Varanasi which have reported coverage between 50 and 70 per cent.
Two-thirds of the Class I sampled cities have 100 per cent population covered by the service
while in Class II towns about 63 per cent, have reported 100 per cent coverage. Overall, two-
thirds of the sampled urban centres have reported 100 per cent coverage of population by the
5 Coverage generally refers to the coverage of areas by pipelines, i.e. if the agency has laid pipelines to service the area, the entire area is
considered covered, even if all households in the area have not taken the connection,. In some cities coverage means water provision to the population not only by means of house service connections but also by means of tankers and stand posts. If people are being provided water
by the local authority, by any means, they are considered covered. Therefore, coverage has to be read with caution as it only means that the
public water supplying agency is serving the people by some mode, not necessarily by household connections. Coverage does not give any indication of the quantity or quality of water provided to consumers. Therefore, a 100% coverage should not be misinterpreted as everyone
getting adequate water.
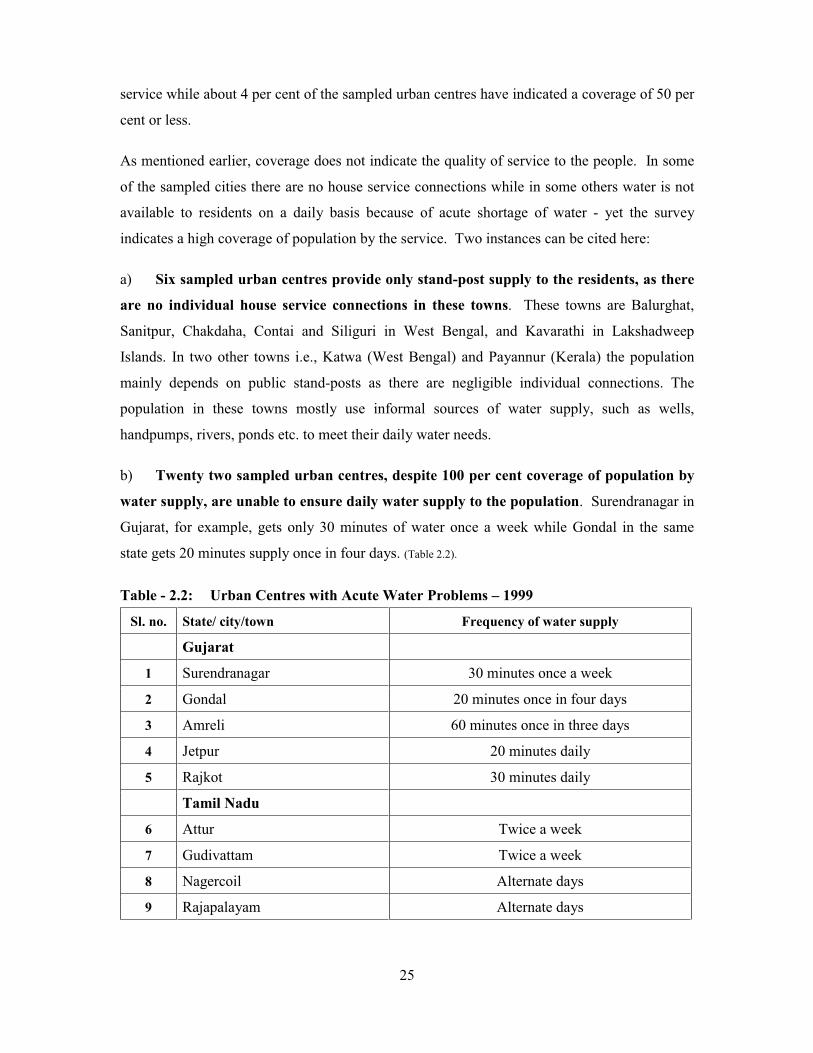
25
service while about 4 per cent of the sampled urban centres have indicated a coverage of 50 per
cent or less.
As mentioned earlier, coverage does not indicate the quality of service to the people. In some
of the sampled cities there are no house service connections while in some others water is not
available to residents on a daily basis because of acute shortage of water - yet the survey
indicates a high coverage of population by the service. Two instances can be cited here:
a) Six sampled urban centres provide only stand-post supply to the residents, as there
are no individual house service connections in these towns. These towns are Balurghat,
Sanitpur, Chakdaha, Contai and Siliguri in West Bengal, and Kavarathi in Lakshadweep
Islands. In two other towns i.e., Katwa (West Bengal) and Payannur (Kerala) the population
mainly depends on public stand-posts as there are negligible individual connections. The
population in these towns mostly use informal sources of water supply, such as wells,
handpumps, rivers, ponds etc. to meet their daily water needs.
b) Twenty two sampled urban centres, despite 100 per cent coverage of population by
water supply, are unable to ensure daily water supply to the population. Surendranagar in
Gujarat, for example, gets only 30 minutes of water once a week while Gondal in the same
state gets 20 minutes supply once in four days. (Table 2.2).
Table - 2.2: Urban Centres with Acute Water Problems – 1999
Sl. no. State/ city/town Frequency of water supply
Gujarat
1 Surendranagar 30 minutes once a week
2 Gondal 20 minutes once in four days
3 Amreli 60 minutes once in three days
4 Jetpur 20 minutes daily
5 Rajkot 30 minutes daily
Tamil Nadu
6 Attur Twice a week
7 Gudivattam Twice a week
8 Nagercoil Alternate days
9 Rajapalayam Alternate days
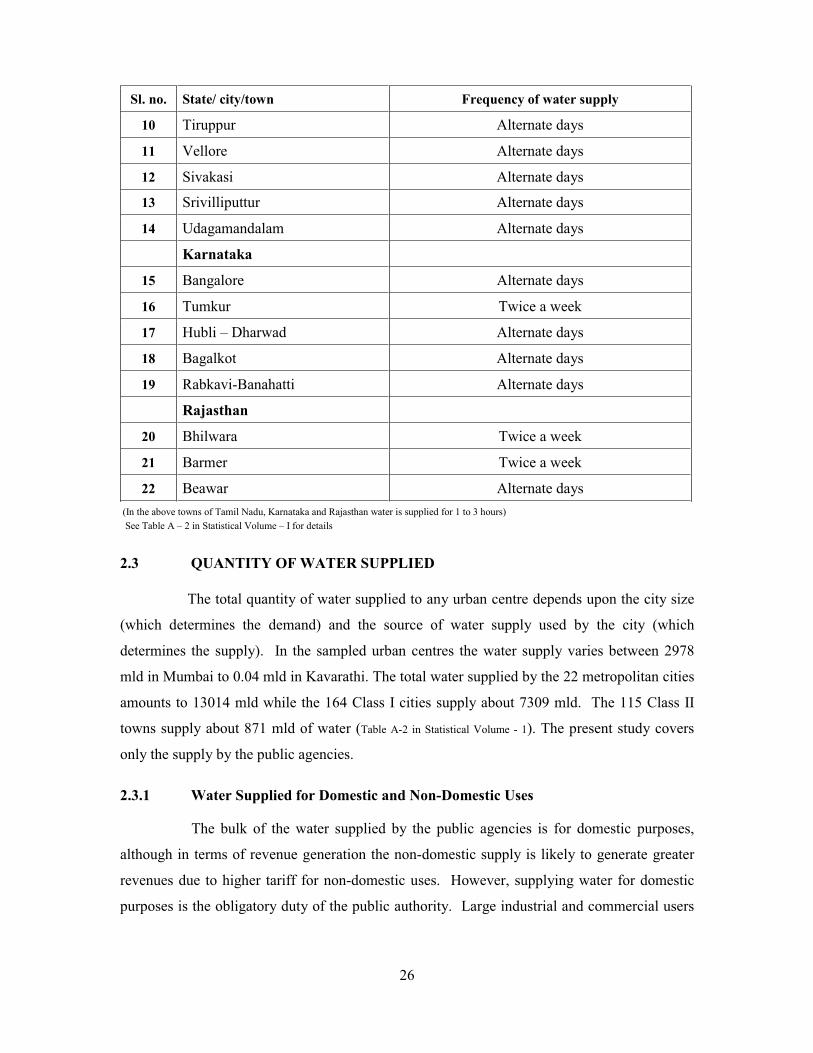
26
Sl. no. State/ city/town Frequency of water supply
10 Tiruppur Alternate days
11 Vellore Alternate days
12 Sivakasi Alternate days
13 Srivilliputtur Alternate days
14 Udagamandalam Alternate days
Karnataka
15 Bangalore Alternate days
16 Tumkur Twice a week
17 Hubli – Dharwad Alternate days
18 Bagalkot Alternate days
19 Rabkavi-Banahatti Alternate days
Rajasthan
20 Bhilwara Twice a week
21 Barmer Twice a week
22 Beawar Alternate days
(In the above towns of Tamil Nadu, Karnataka and Rajasthan water is supplied for 1 to 3 hours)
See Table A – 2 in Statistical Volume – I for details
2.3 QUANTITY OF WATER SUPPLIED
The total quantity of water supplied to any urban centre depends upon the city size
(which determines the demand) and the source of water supply used by the city (which
determines the supply). In the sampled urban centres the water supply varies between 2978
mld in Mumbai to 0.04 mld in Kavarathi. The total water supplied by the 22 metropolitan cities
amounts to 13014 mld while the 164 Class I cities supply about 7309 mld. The 115 Class II
towns supply about 871 mld of water (Table A-2 in Statistical Volume - 1). The present study covers
only the supply by the public agencies.
2.3.1 Water Supplied for Domestic and Non-Domestic Uses
The bulk of the water supplied by the public agencies is for domestic purposes,
although in terms of revenue generation the non-domestic supply is likely to generate greater
revenues due to higher tariff for non-domestic uses. However, supplying water for domestic
purposes is the obligatory duty of the public authority. Large industrial and commercial users
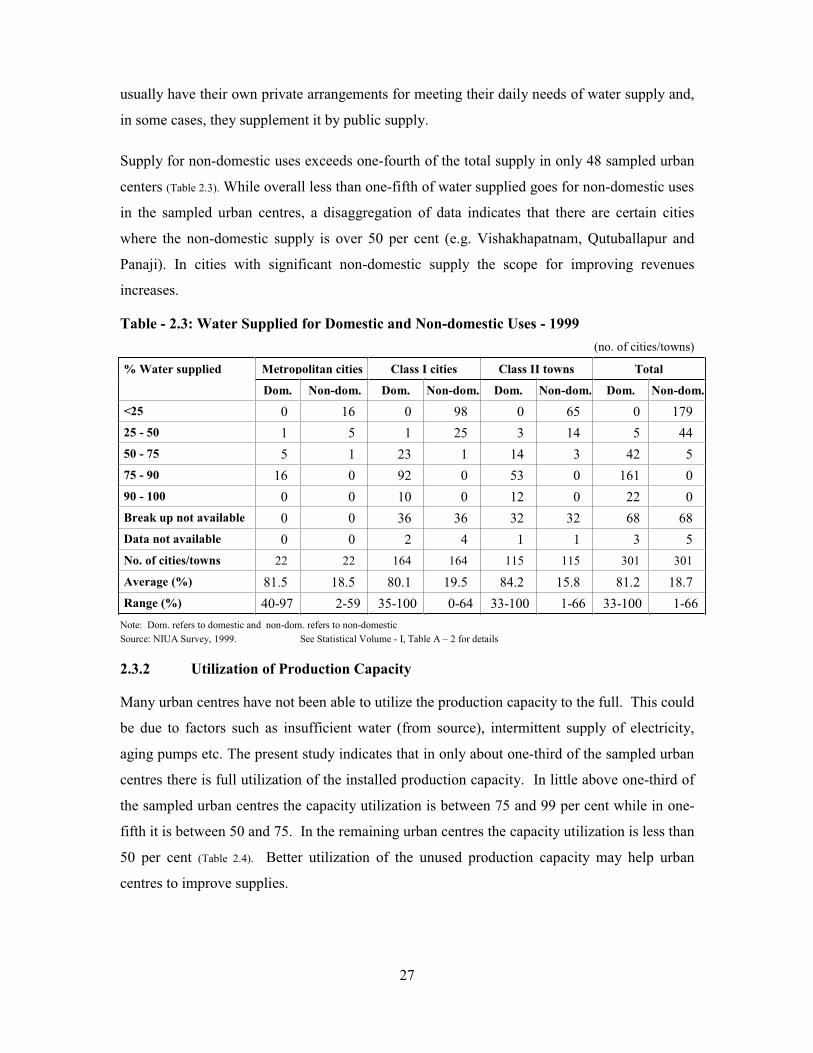
27
usually have their own private arrangements for meeting their daily needs of water supply and,
in some cases, they supplement it by public supply.
Supply for non-domestic uses exceeds one-fourth of the total supply in only 48 sampled urban
centers (Table 2.3). While overall less than one-fifth of water supplied goes for non-domestic uses
in the sampled urban centres, a disaggregation of data indicates that there are certain cities
where the non-domestic supply is over 50 per cent (e.g. Vishakhapatnam, Qutuballapur and
Panaji). In cities with significant non-domestic supply the scope for improving revenues
increases.
Table - 2.3: Water Supplied for Domestic and Non-domestic Uses - 1999
(no. of cities/towns)
Metropolitan cities Class I cities Class II towns Total% Water supplied
Dom. Non-dom. Dom. Non-dom. Dom. Non-dom. Dom. Non-dom.
<25 0 16 0 98 0 65 0 179
25 - 50 1 5 1 25 3 14 5 44
50 - 75 5 1 23 1 14 3 42 5
75 - 90 16 0 92 0 53 0 161 0
90 - 100 0 0 10 0 12 0 22 0
Break up not available 0 0 36 36 32 32 68 68
Data not available 0 0 2 4 1 1 3 5
No. of cities/towns 22 22 164 164 115 115 301 301
Average (%) 81.5 18.5 80.1 19.5 84.2 15.8 81.2 18.7
Range (%) 40-97 2-59 35-100 0-64 33-100 1-66 33-100 1-66
Note: Dom. refers to domestic and non-dom. refers to non-domestic
Source: NIUA Survey, 1999. See Statistical Volume - I, Table A – 2 for details
2.3.2 Utilization of Production Capacity
Many urban centres have not been able to utilize the production capacity to the full. This could
be due to factors such as insufficient water (from source), intermittent supply of electricity,
aging pumps etc. The present study indicates that in only about one-third of the sampled urban
centres there is full utilization of the installed production capacity. In little above one-third of
the sampled urban centres the capacity utilization is between 75 and 99 per cent while in one-
fifth it is between 50 and 75. In the remaining urban centres the capacity utilization is less than
50 per cent (Table 2.4). Better utilization of the unused production capacity may help urban
centres to improve supplies.
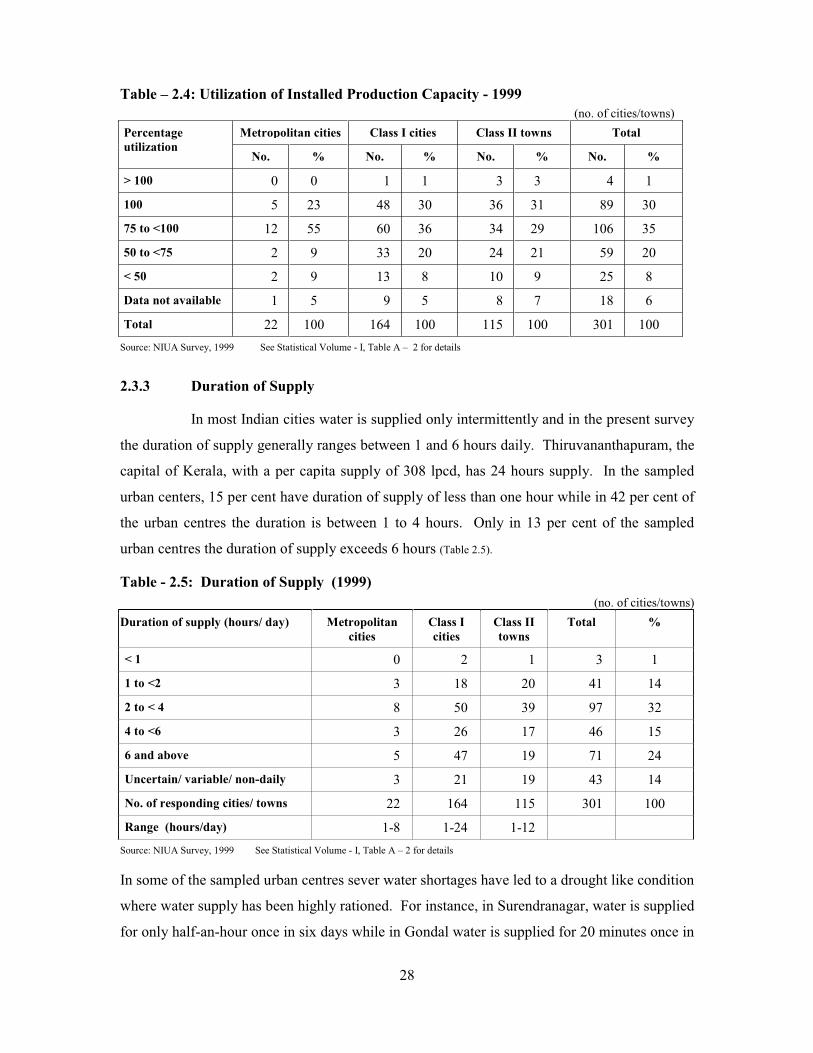
28
Table – 2.4: Utilization of Installed Production Capacity - 1999
(no. of cities/towns)
Metropolitan cities Class I cities Class II towns Total Percentage
utilization No. % No. % No. % No. %
> 100 0 0 1 1 3 3 4 1
100 5 23 48 30 36 31 89 30
75 to <100 12 55 60 36 34 29 106 35
50 to <75 2 9 33 20 24 21 59 20
< 50 2 9 13 8 10 9 25 8
Data not available 1 5 9 5 8 7 18 6
Total 22 100 164 100 115 100 301 100
Source: NIUA Survey, 1999 See Statistical Volume - I, Table A – 2 for details
2.3.3 Duration of Supply
In most Indian cities water is supplied only intermittently and in the present survey
the duration of supply generally ranges between 1 and 6 hours daily. Thiruvananthapuram, the
capital of Kerala, with a per capita supply of 308 lpcd, has 24 hours supply. In the sampled
urban centers, 15 per cent have duration of supply of less than one hour while in 42 per cent of
the urban centres the duration is between 1 to 4 hours. Only in 13 per cent of the sampled
urban centres the duration of supply exceeds 6 hours (Table 2.5).
Table - 2.5: Duration of Supply (1999)
(no. of cities/towns)
Duration of supply (hours/ day) Metropolitan
cities
Class I
cities
Class II
towns
Total %
< 1 0 2 1 3 1
1 to <2 3 18 20 41 14
2 to < 4 8 50 39 97 32
4 to <6 3 26 17 46 15
6 and above 5 47 19 71 24
Uncertain/ variable/ non-daily 3 21 19 43 14
No. of responding cities/ towns 22 164 115 301 100
Range (hours/day) 1-8 1-24 1-12
Source: NIUA Survey, 1999 See Statistical Volume - I, Table A – 2 for details
In some of the sampled urban centres sever water shortages have led to a drought like condition
where water supply has been highly rationed. For instance, in Surendranagar, water is supplied
for only half-an-hour once in six days while in Gondal water is supplied for 20 minutes once in
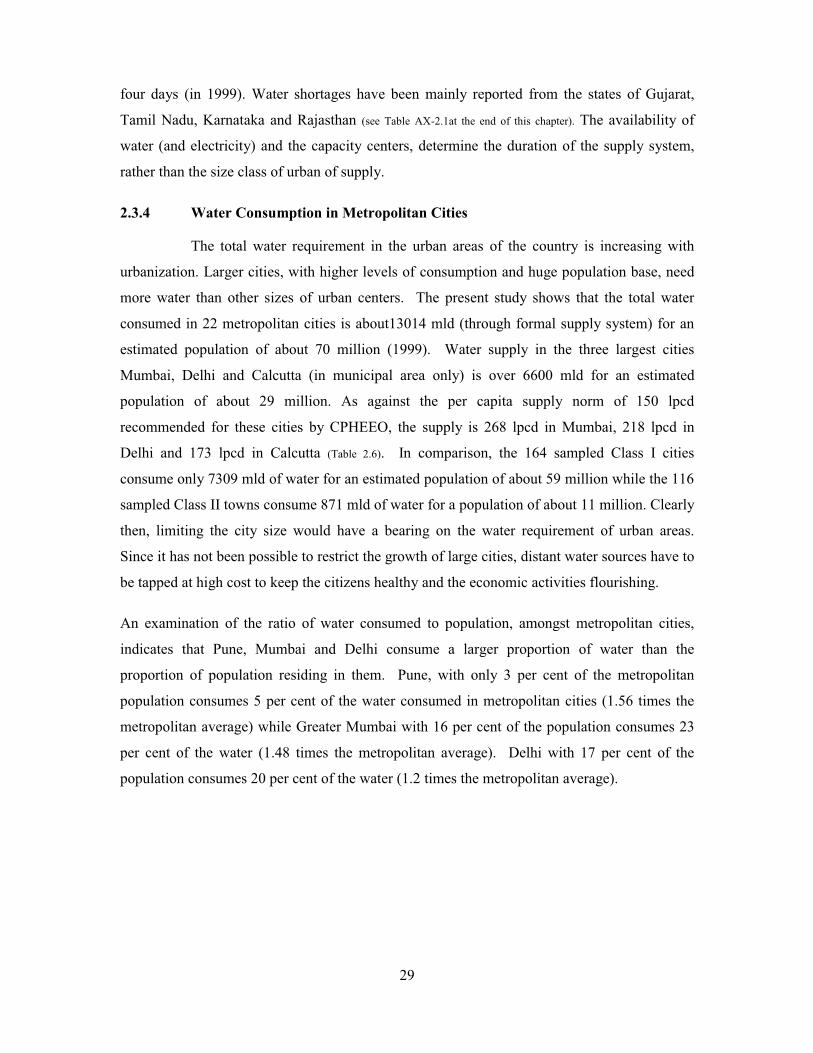
29
four days (in 1999). Water shortages have been mainly reported from the states of Gujarat,
Tamil Nadu, Karnataka and Rajasthan (see Table AX-2.1at the end of this chapter). The availability of
water (and electricity) and the capacity centers, determine the duration of the supply system,
rather than the size class of urban of supply.
2.3.4 Water Consumption in Metropolitan Cities
The total water requirement in the urban areas of the country is increasing with
urbanization. Larger cities, with higher levels of consumption and huge population base, need
more water than other sizes of urban centers. The present study shows that the total water
consumed in 22 metropolitan cities is about13014 mld (through formal supply system) for an
estimated population of about 70 million (1999). Water supply in the three largest cities
Mumbai, Delhi and Calcutta (in municipal area only) is over 6600 mld for an estimated
population of about 29 million. As against the per capita supply norm of 150 lpcd
recommended for these cities by CPHEEO, the supply is 268 lpcd in Mumbai, 218 lpcd in
Delhi and 173 lpcd in Calcutta (Table 2.6). In comparison, the 164 sampled Class I cities
consume only 7309 mld of water for an estimated population of about 59 million while the 116
sampled Class II towns consume 871 mld of water for a population of about 11 million. Clearly
then, limiting the city size would have a bearing on the water requirement of urban areas.
Since it has not been possible to restrict the growth of large cities, distant water sources have to
be tapped at high cost to keep the citizens healthy and the economic activities flourishing.
An examination of the ratio of water consumed to population, amongst metropolitan cities,
indicates that Pune, Mumbai and Delhi consume a larger proportion of water than the
proportion of population residing in them. Pune, with only 3 per cent of the metropolitan
population consumes 5 per cent of the water consumed in metropolitan cities (1.56 times the
metropolitan average) while Greater Mumbai with 16 per cent of the population consumes 23
per cent of the water (1.48 times the metropolitan average). Delhi with 17 per cent of the
population consumes 20 per cent of the water (1.2 times the metropolitan average).
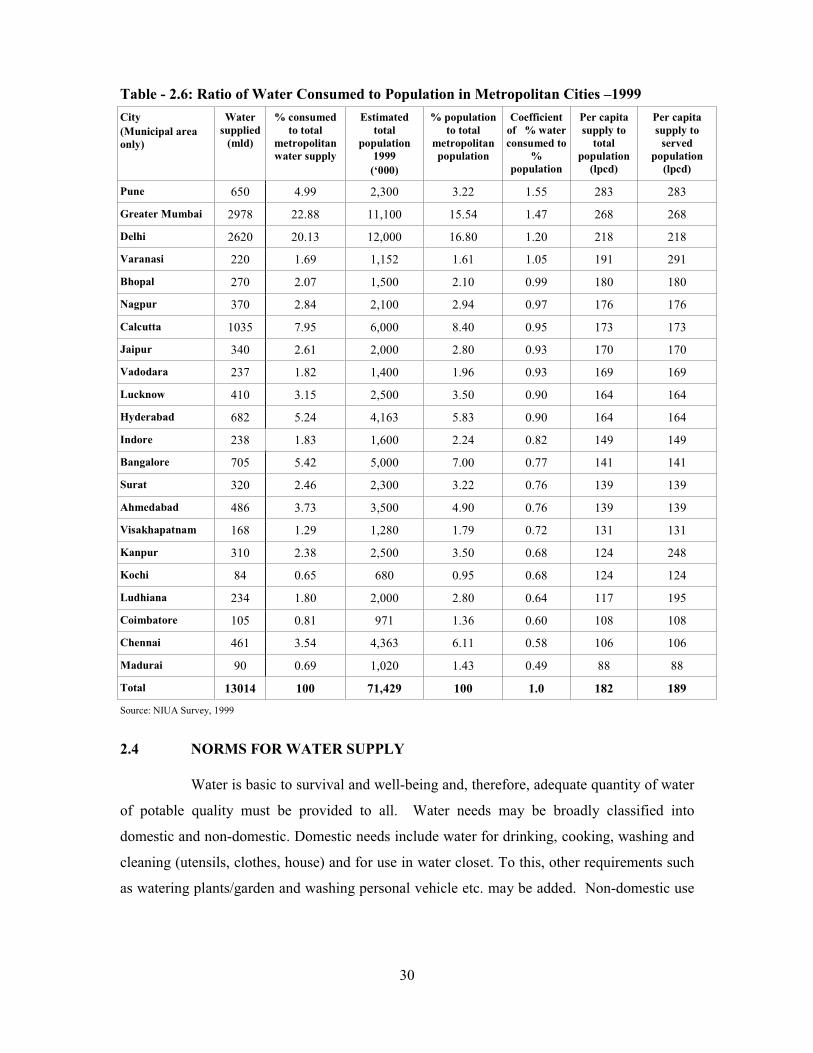
30
Table - 2.6: Ratio of Water Consumed to Population in Metropolitan Cities –1999
City
(Municipal area
only)
Water
supplied
(mld)
% consumed
to total
metropolitan
water supply
Estimated
total
population
1999
(‘000)
% population
to total
metropolitan
population
Coefficient
of % water
consumed to
%
population
Per capita
supply to
total
population
(lpcd)
Per capita
supply to
served
population
(lpcd)
Pune 650 4.99 2,300 3.22 1.55 283 283
Greater Mumbai 2978 22.88 11,100 15.54 1.47 268 268
Delhi 2620 20.13 12,000 16.80 1.20 218 218
Varanasi 220 1.69 1,152 1.61 1.05 191 291
Bhopal 270 2.07 1,500 2.10 0.99 180 180
Nagpur 370 2.84 2,100 2.94 0.97 176 176
Calcutta 1035 7.95 6,000 8.40 0.95 173 173
Jaipur 340 2.61 2,000 2.80 0.93 170 170
Vadodara 237 1.82 1,400 1.96 0.93 169 169
Lucknow 410 3.15 2,500 3.50 0.90 164 164
Hyderabad 682 5.24 4,163 5.83 0.90 164 164
Indore 238 1.83 1,600 2.24 0.82 149 149
Bangalore 705 5.42 5,000 7.00 0.77 141 141
Surat 320 2.46 2,300 3.22 0.76 139 139
Ahmedabad 486 3.73 3,500 4.90 0.76 139 139
Visakhapatnam 168 1.29 1,280 1.79 0.72 131 131
Kanpur 310 2.38 2,500 3.50 0.68 124 248
Kochi 84 0.65 680 0.95 0.68 124 124
Ludhiana 234 1.80 2,000 2.80 0.64 117 195
Coimbatore 105 0.81 971 1.36 0.60 108 108
Chennai 461 3.54 4,363 6.11 0.58 106 106
Madurai 90 0.69 1,020 1.43 0.49 88 88
Total 13014 100 71,429 100 1.0 182 189
Source: NIUA Survey, 1999
2.4 NORMS FOR WATER SUPPLY
Water is basic to survival and well-being and, therefore, adequate quantity of water
of potable quality must be provided to all. Water needs may be broadly classified into
domestic and non-domestic. Domestic needs include water for drinking, cooking, washing and
cleaning (utensils, clothes, house) and for use in water closet. To this, other requirements such
as watering plants/garden and washing personal vehicle etc. may be added. Non-domestic use
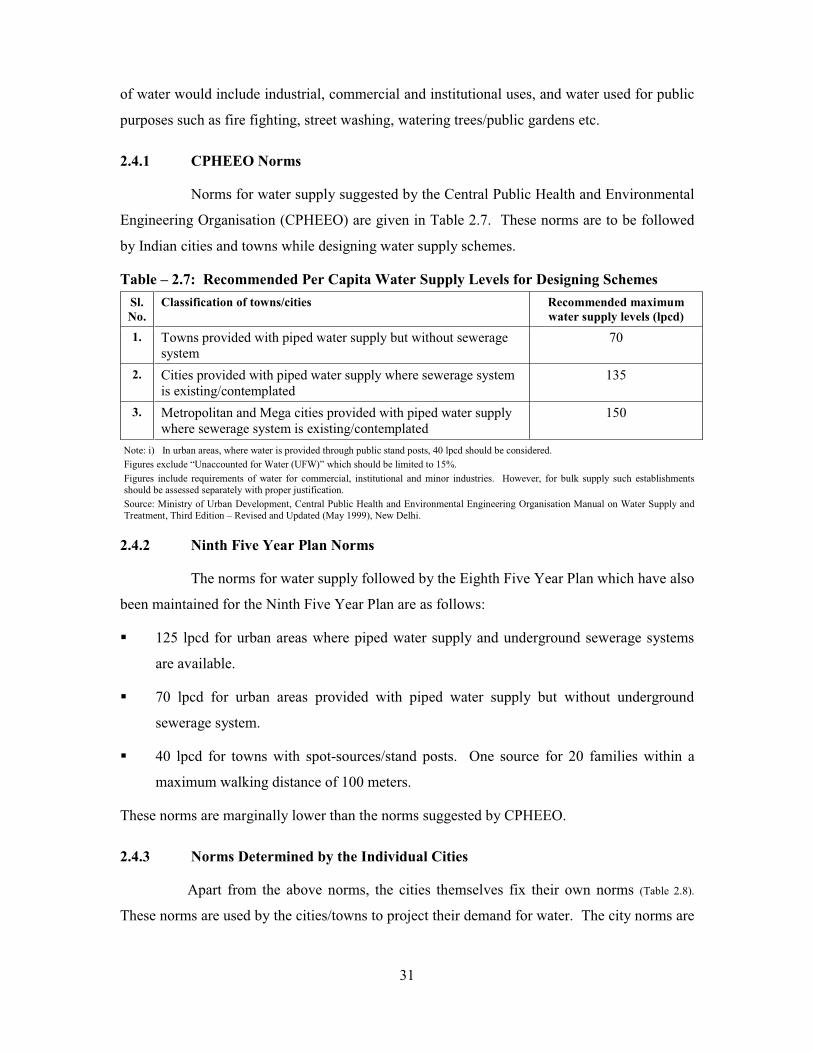
31
of water would include industrial, commercial and institutional uses, and water used for public
purposes such as fire fighting, street washing, watering trees/public gardens etc.
2.4.1 CPHEEO Norms
Norms for water supply suggested by the Central Public Health and Environmental
Engineering Organisation (CPHEEO) are given in Table 2.7. These norms are to be followed
by Indian cities and towns while designing water supply schemes.
Table – 2.7: Recommended Per Capita Water Supply Levels for Designing Schemes
Sl.
No.
Classification of towns/cities Recommended maximum
water supply levels (lpcd)
1. Towns provided with piped water supply but without sewerage
system
70
2. Cities provided with piped water supply where sewerage system
is existing/contemplated
135
3. Metropolitan and Mega cities provided with piped water supply
where sewerage system is existing/contemplated
150
Note: i) In urban areas, where water is provided through public stand posts, 40 lpcd should be considered.
Figures exclude “Unaccounted for Water (UFW)” which should be limited to 15%.
Figures include requirements of water for commercial, institutional and minor industries. However, for bulk supply such establishments
should be assessed separately with proper justification.
Source: Ministry of Urban Development, Central Public Health and Environmental Engineering Organisation Manual on Water Supply and
Treatment, Third Edition – Revised and Updated (May 1999), New Delhi.
2.4.2 Ninth Five Year Plan Norms
The norms for water supply followed by the Eighth Five Year Plan which have also
been maintained for the Ninth Five Year Plan are as follows:
!" 125 lpcd for urban areas where piped water supply and underground sewerage systems
are available.
!" 70 lpcd for urban areas provided with piped water supply but without underground
sewerage system.
!" 40 lpcd for towns with spot-sources/stand posts. One source for 20 families within a
maximum walking distance of 100 meters.
These norms are marginally lower than the norms suggested by CPHEEO.
2.4.3 Norms Determined by the Individual Cities
Apart from the above norms, the cities themselves fix their own norms (Table 2.8).
These norms are used by the cities/towns to project their demand for water. The city norms are
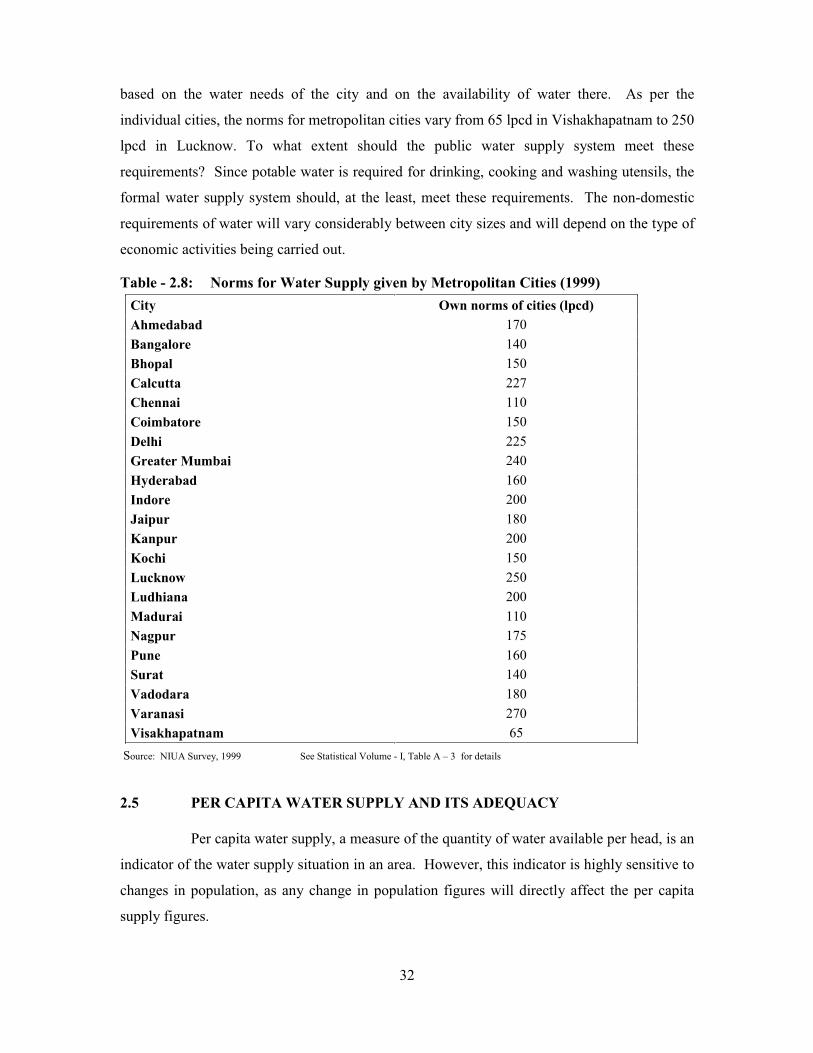
32
based on the water needs of the city and on the availability of water there. As per the
individual cities, the norms for metropolitan cities vary from 65 lpcd in Vishakhapatnam to 250
lpcd in Lucknow. To what extent should the public water supply system meet these
requirements? Since potable water is required for drinking, cooking and washing utensils, the
formal water supply system should, at the least, meet these requirements. The non-domestic
requirements of water will vary considerably between city sizes and will depend on the type of
economic activities being carried out.
Table - 2.8: Norms for Water Supply given by Metropolitan Cities (1999)
City Own norms of cities (lpcd)
Ahmedabad 170
Bangalore 140
Bhopal 150
Calcutta 227
Chennai 110
Coimbatore 150
Delhi 225
Greater Mumbai 240
Hyderabad 160
Indore 200
Jaipur 180
Kanpur 200
Kochi 150
Lucknow 250
Ludhiana 200
Madurai 110
Nagpur 175
Pune 160
Surat 140
Vadodara 180
Varanasi 270
Visakhapatnam 65
Source: NIUA Survey, 1999 See Statistical Volume - I, Table A – 3 for details
2.5 PER CAPITA WATER SUPPLY AND ITS ADEQUACY
Per capita water supply, a measure of the quantity of water available per head, is an
indicator of the water supply situation in an area. However, this indicator is highly sensitive to
changes in population, as any change in population figures will directly affect the per capita
supply figures.
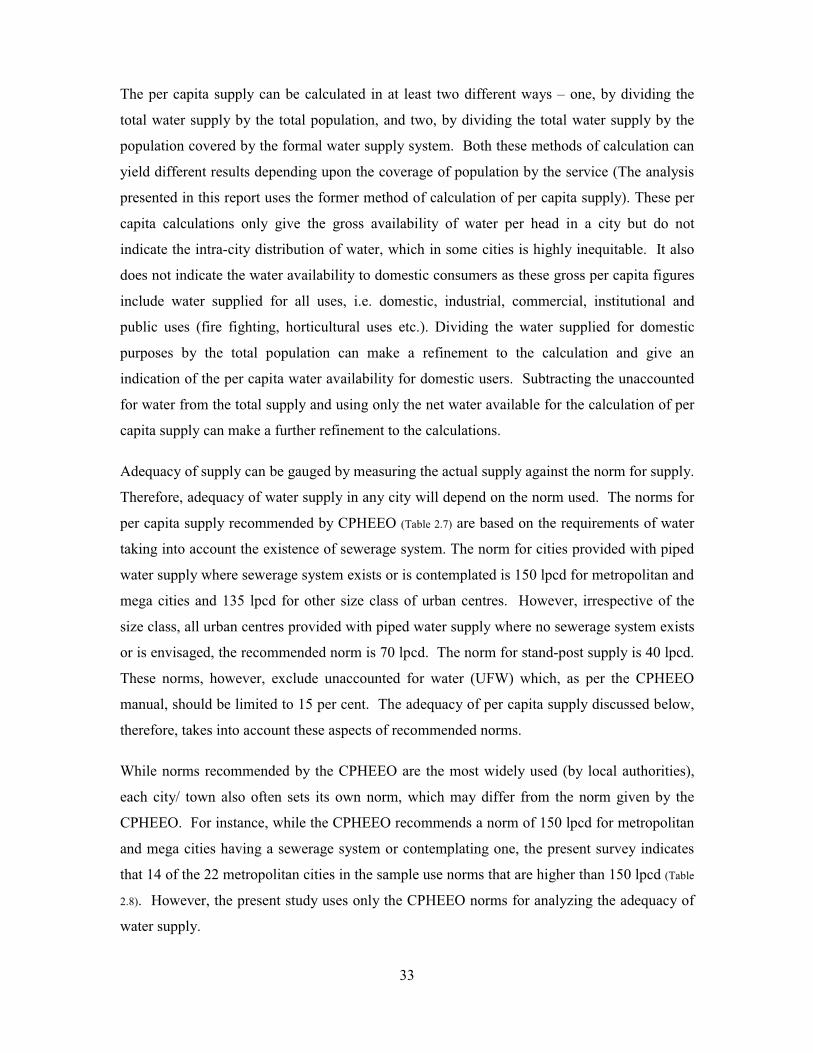
33
The per capita supply can be calculated in at least two different ways – one, by dividing the
total water supply by the total population, and two, by dividing the total water supply by the
population covered by the formal water supply system. Both these methods of calculation can
yield different results depending upon the coverage of population by the service (The analysis
presented in this report uses the former method of calculation of per capita supply). These per
capita calculations only give the gross availability of water per head in a city but do not
indicate the intra-city distribution of water, which in some cities is highly inequitable. It also
does not indicate the water availability to domestic consumers as these gross per capita figures
include water supplied for all uses, i.e. domestic, industrial, commercial, institutional and
public uses (fire fighting, horticultural uses etc.). Dividing the water supplied for domestic
purposes by the total population can make a refinement to the calculation and give an
indication of the per capita water availability for domestic users. Subtracting the unaccounted
for water from the total supply and using only the net water available for the calculation of per
capita supply can make a further refinement to the calculations.
Adequacy of supply can be gauged by measuring the actual supply against the norm for supply.
Therefore, adequacy of water supply in any city will depend on the norm used. The norms for
per capita supply recommended by CPHEEO (Table 2.7) are based on the requirements of water
taking into account the existence of sewerage system. The norm for cities provided with piped
water supply where sewerage system exists or is contemplated is 150 lpcd for metropolitan and
mega cities and 135 lpcd for other size class of urban centres. However, irrespective of the
size class, all urban centres provided with piped water supply where no sewerage system exists
or is envisaged, the recommended norm is 70 lpcd. The norm for stand-post supply is 40 lpcd.
These norms, however, exclude unaccounted for water (UFW) which, as per the CPHEEO
manual, should be limited to 15 per cent. The adequacy of per capita supply discussed below,
therefore, takes into account these aspects of recommended norms.
While norms recommended by the CPHEEO are the most widely used (by local authorities),
each city/ town also often sets its own norm, which may differ from the norm given by the
CPHEEO. For instance, while the CPHEEO recommends a norm of 150 lpcd for metropolitan
and mega cities having a sewerage system or contemplating one, the present survey indicates
that 14 of the 22 metropolitan cities in the sample use norms that are higher than 150 lpcd (Table
2.8). However, the present study uses only the CPHEEO norms for analyzing the adequacy of
water supply.
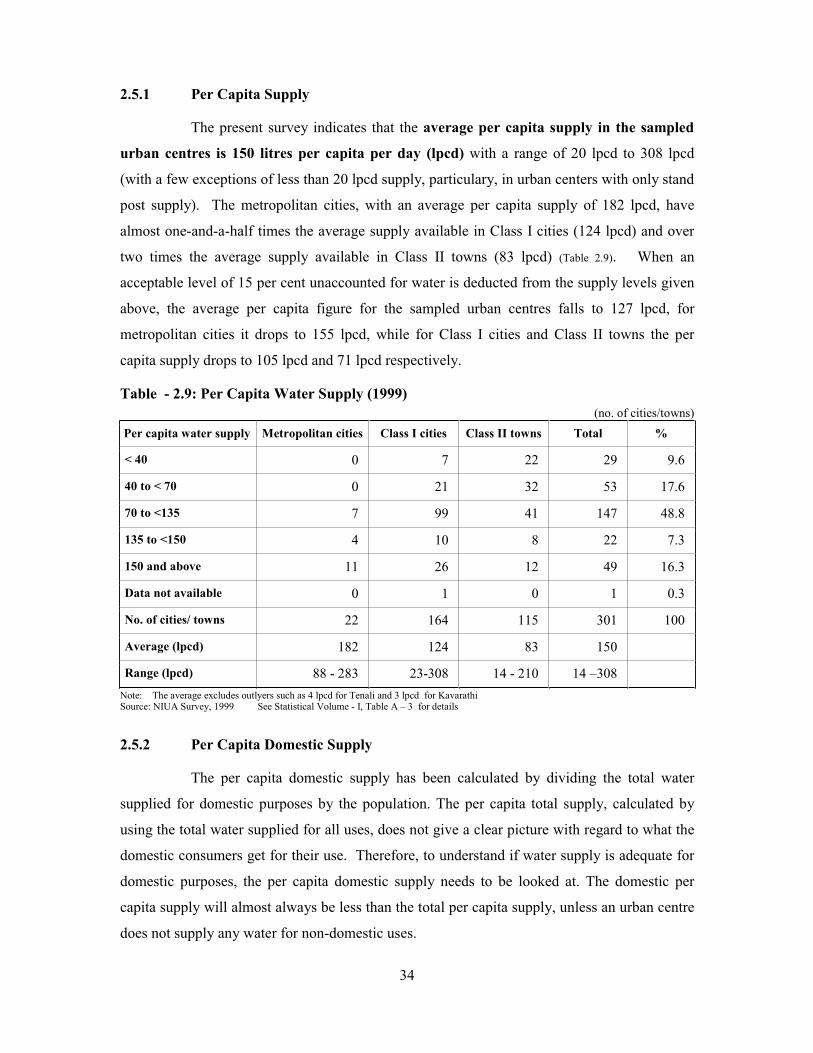
34
2.5.1 Per Capita Supply
The present survey indicates that the average per capita supply in the sampled
urban centres is 150 litres per capita per day (lpcd) with a range of 20 lpcd to 308 lpcd
(with a few exceptions of less than 20 lpcd supply, particulary, in urban centers with only stand
post supply). The metropolitan cities, with an average per capita supply of 182 lpcd, have
almost one-and-a-half times the average supply available in Class I cities (124 lpcd) and over
two times the average supply available in Class II towns (83 lpcd) (Table 2.9). When an
acceptable level of 15 per cent unaccounted for water is deducted from the supply levels given
above, the average per capita figure for the sampled urban centres falls to 127 lpcd, for
metropolitan cities it drops to 155 lpcd, while for Class I cities and Class II towns the per
capita supply drops to 105 lpcd and 71 lpcd respectively.
Table - 2.9: Per Capita Water Supply (1999)
(no. of cities/towns)
Per capita water supply Metropolitan cities Class I cities Class II towns Total %
< 40 0 7 22 29 9.6
40 to < 70 0 21 32 53 17.6
70 to <135 7 99 41 147 48.8
135 to <150 4 10 8 22 7.3
150 and above 11 26 12 49 16.3
Data not available 0 1 0 1 0.3
No. of cities/ towns 22 164 115 301 100
Average (lpcd) 182 124 83 150
Range (lpcd) 88 - 283 23-308 14 - 210 14 –308
Note: The average excludes outlyers such as 4 lpcd for Tenali and 3 lpcd for Kavarathi Source: NIUA Survey, 1999 See Statistical Volume - I, Table A – 3 for details
2.5.2 Per Capita Domestic Supply
The per capita domestic supply has been calculated by dividing the total water
supplied for domestic purposes by the population. The per capita total supply, calculated by
using the total water supplied for all uses, does not give a clear picture with regard to what the
domestic consumers get for their use. Therefore, to understand if water supply is adequate for
domestic purposes, the per capita domestic supply needs to be looked at. The domestic per
capita supply will almost always be less than the total per capita supply, unless an urban centre
does not supply any water for non-domestic uses.

35
The average per capita domestic supply in the sampled urban centers is 128 lpcd with a
range of 14 to 258 lpcd. (Table 2.10). The average domestic supply in the metropolitan cities is
148 lpcd with only 6 out of 22 metropolitan cities being supplied more than 150 lpcd of water.
Similarly the average for Class I cities is 106 lpcd and that for Class II towns is 69 lpcd.
Table - 2.10: Per Capita Domestic Water Supply (1999)
(no. of cities/towns)
Per capita domestic water
supply (lpcd)
Metropolitan
cities
Class I cities Class II towns Total %
< 40 0 9 22 31 10
40 to <70 2 27 25 54 18
70 to <135 12 68 29 109 36
135 to <150 2 9 2 13 5
150 and above 6 12 4 22 7
Data not available 0 39 33 72 24
No. of cities/ towns 22 164 115 301 100
Average (lpcd) 148 106 69 128
Range (lpcd) 53 - 226 16-258 14-177 14-258
Source: NIUA Survey, 1999 See Statistical Volume - I, Table A – 4 for details
Overall, almost 70 per cent of the sampled urban centers get a domestic supply ranging
between 40 to 135 lpcd. It is important to highlight here that there are 31 sampled urban
centers, a majority of them being Class II towns, which do not get domestic supply of even 40
lpcd, i.e. their supply level is even below that prescribed for stand posts. When a minimum of
70 lpcd for domestic supply is taken as the minimum supply level then 85 sampled urban
centers do not reach this norm.
Exceptions
There are certain towns in the sample where the per capita supply levels are extremely low.
These towns are Kavarathi (3 lpcd), Tenali (4 lpcd) and Balurghat, Santipur and Taliparmba
(7 lpcd each). The reasons for the low level of supply in these town are: a) low coverage of
population by water supply; b) public water supplying agency has been able to provide only a
small number of households with domestic connection; and c) dependence of most households
on public stand posts and private sources of supply such as open wells, hand pumps etc.
36
2.6 WATER SHORTAGE
Using the norms recommended by the CPHEEO, which takes into account the
needs of sewerage system, the results of the survey indicate that the water supply situation in
urban India is distressing with almost 46 per cent the sampled urban centres not getting
adequate water supply, that is, getting a per capita supply below the recommended norm. A
further disaggregation by size class of urban centers indicates that almost half the metropolitan
cities have inadequate water supply while 40 per cent of Class I and and 52 per cent of Class II
urban centres have a supply below the recommended norm (Table 2.11 and Table AX- 2.1 at the end of this
chapter).
The picture changes considerably when the norms used by the cities themselves are taken into
account. As per the city norms, almost 77 per cent of the sampled urban centers do not
get adequate water supply, that is, they get water below the norms adopted by them.
According to the city norms, 68 per cent of the metropolitan cities, 76 per cent of the sampled
Class I cities and 79 per cent of the sampled Class II towns do not get adequate water (Table
2.12).
As a result of urbanization and changing requirements the demand for water is increasing. An
estimation of the demand-supply gap in water supply indicates that an additional 1466 mld of
water (using CPHEEO norms) would be required to bridge the gap between demand and
supply in the 137 urban centers that do not get adequate water. The average gap per
metropolitan city works out to 53 mld while those for Class I and Class II cities and towns the
gap works out to 11 mld and 3 mld respectively (Table 2.11).
Table - 2.11: Demand – Supply Gap (1999) Using CPHEEO Norms
Size class of
urban
centres
Urban centres
with supply
below norm
Quantity of
water supplied
(mld)
Demand as per
norm (mld)
Demand - Supply
Gap (mld)
Average per capita
gap (lpcd)
Metropolitan 11 3201.60 3782.10 580.50 23
Class I 66 2154.36 2857.10 702.74 29
Class II 60 286.18 468.98 182.81 33
Total 137 5642.14 7108.18 1466.05 26
Source: NIUA Survey, 1999 See Statistical Volume - I, Table A – 3 for details
Using the city norms, the demand-supply gap for the 231 urban centers with a supply below
norm, works out to 4045 mld. The average gap per metropolitan city works out to 93 mld,
while for the Class I and Class II urban centers the gap is 18 and 5 mld respectively (Table 2.12).
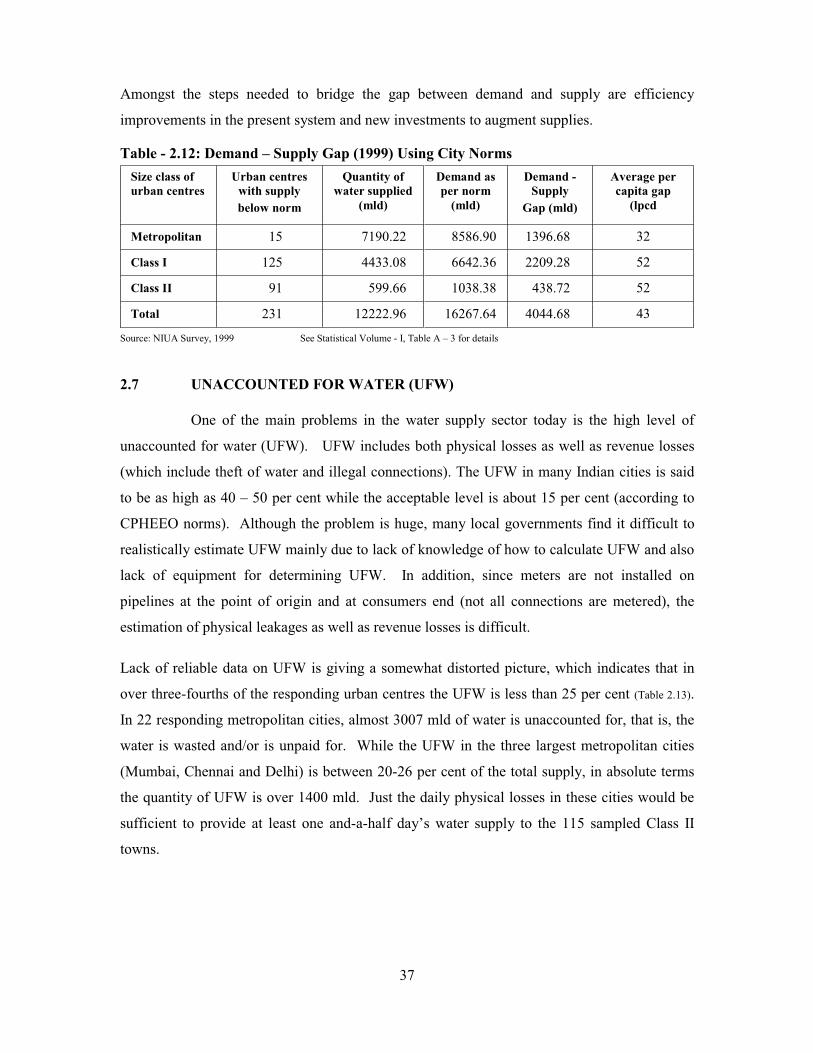
37
Amongst the steps needed to bridge the gap between demand and supply are efficiency
improvements in the present system and new investments to augment supplies.
Table - 2.12: Demand – Supply Gap (1999) Using City Norms
Size class of
urban centres
Urban centres
with supply
below norm
Quantity of
water supplied
(mld)
Demand as
per norm
(mld)
Demand -
Supply
Gap (mld)
Average per
capita gap
(lpcd
Metropolitan 15 7190.22 8586.90 1396.68 32
Class I 125 4433.08 6642.36 2209.28 52
Class II 91 599.66 1038.38 438.72 52
Total 231 12222.96 16267.64 4044.68 43
Source: NIUA Survey, 1999 See Statistical Volume - I, Table A – 3 for details
2.7 UNACCOUNTED FOR WATER (UFW)
One of the main problems in the water supply sector today is the high level of
unaccounted for water (UFW). UFW includes both physical losses as well as revenue losses
(which include theft of water and illegal connections). The UFW in many Indian cities is said
to be as high as 40 – 50 per cent while the acceptable level is about 15 per cent (according to
CPHEEO norms). Although the problem is huge, many local governments find it difficult to
realistically estimate UFW mainly due to lack of knowledge of how to calculate UFW and also
lack of equipment for determining UFW. In addition, since meters are not installed on
pipelines at the point of origin and at consumers end (not all connections are metered), the
estimation of physical leakages as well as revenue losses is difficult.
Lack of reliable data on UFW is giving a somewhat distorted picture, which indicates that in
over three-fourths of the responding urban centres the UFW is less than 25 per cent (Table 2.13).
In 22 responding metropolitan cities, almost 3007 mld of water is unaccounted for, that is, the
water is wasted and/or is unpaid for. While the UFW in the three largest metropolitan cities
(Mumbai, Chennai and Delhi) is between 20-26 per cent of the total supply, in absolute terms
the quantity of UFW is over 1400 mld. Just the daily physical losses in these cities would be
sufficient to provide at least one and-a-half day’s water supply to the 115 sampled Class II
towns.
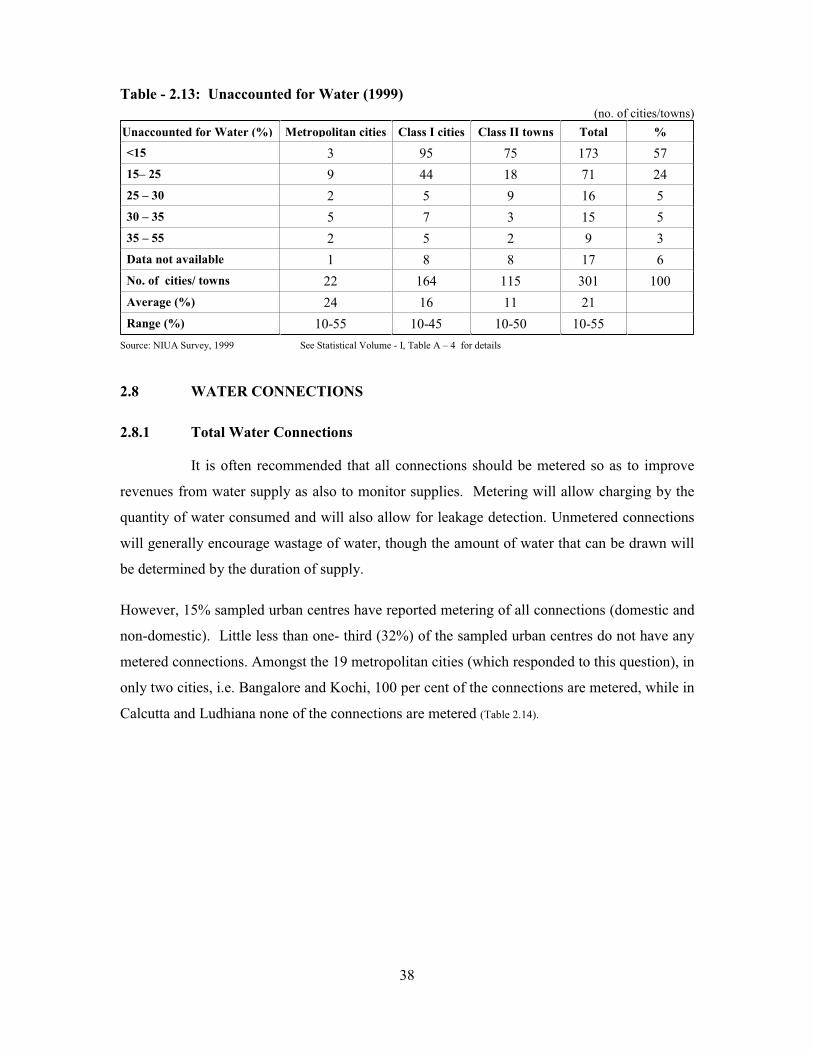
38
Table - 2.13: Unaccounted for Water (1999)
(no. of cities/towns)
Unaccounted for Water (%) Metropolitan cities Class I cities Class II towns Total %
<15 3 95 75 173 57
15– 25 9 44 18 71 24
25 – 30 2 5 9 16 5
30 – 35 5 7 3 15 5
35 – 55 2 5 2 9 3
Data not available 1 8 8 17 6
No. of cities/ towns 22 164 115 301 100
Average (%) 24 16 11 21
Range (%) 10-55 10-45 10-50 10-55
Source: NIUA Survey, 1999 See Statistical Volume - I, Table A – 4 for details
2.8 WATER CONNECTIONS
2.8.1 Total Water Connections
It is often recommended that all connections should be metered so as to improve
revenues from water supply as also to monitor supplies. Metering will allow charging by the
quantity of water consumed and will also allow for leakage detection. Unmetered connections
will generally encourage wastage of water, though the amount of water that can be drawn will
be determined by the duration of supply.
However, 15% sampled urban centres have reported metering of all connections (domestic and
non-domestic). Little less than one- third (32%) of the sampled urban centres do not have any
metered connections. Amongst the 19 metropolitan cities (which responded to this question), in
only two cities, i.e. Bangalore and Kochi, 100 per cent of the connections are metered, while in
Calcutta and Ludhiana none of the connections are metered (Table 2.14).

39
Table - 2.14: Percentage Metered Connections to Total – 1999
(no. of cities/towns)
% Metered connections to total Metropolitan cities Class I cities Class II towns Total %
0 2 50 44 96 32
<25 5 31 17 53 18
25 – 50 1 8 6 15 5
50 – 75 4 11 7 22 7
75 – 99 4 27 10 41 14
100 3 23 19 45 15
n.a. 3 12 9 24 8
not applicable 0 2 3 5 2
Total no. of cities/ towns 22 164 115 301 100
Average (%) 60 52 39 55
Source: NIUA Survey, 1999 See Statistical Volume - I, Table A – 5 for details
2.8.2 Metering of Connections
a) Metering of Domestic Connections
Metering of connections does not necessarily imply that the meters are in working order and
that the meters are read regularly. In many towns, particularly where the supply is for a very
short duration – often for an hour or less a day, metering of domestic connections is not a
preferred option because the meters do not function properly and meter reading is not cost
effective.
This is reflected in the results of the survey, which shows that in 126 of the sampled urban
centres (42%) none of the domestic connections are metered. However, there are 46 cities/
towns (15%) where all the domestic connections are reportedly metered (Table 2.15).
Table – 2.15: Percent Metered Domestic Connections (no. of cities/towns)
% metered domestic connections Metropolitan cities Class I cities Class II towns Total %
0 5 68 53 126 42
<25 2 12 7 21 7
25 – 50 1 6 6 13 4
50 – 75 4 13 7 24 8
75 – 99 4 25 10 39 13
100 3 24 19 46 15
n.a. 3 14 10 27 9
not applicable 0 2 3 5 2
Total no. of cities/ towns 22 164 115 301 100
Average (%) 59 49 38 52
Source: NIUA Survey, 1999 See Statistical Volume - I, Table A – 5 for details
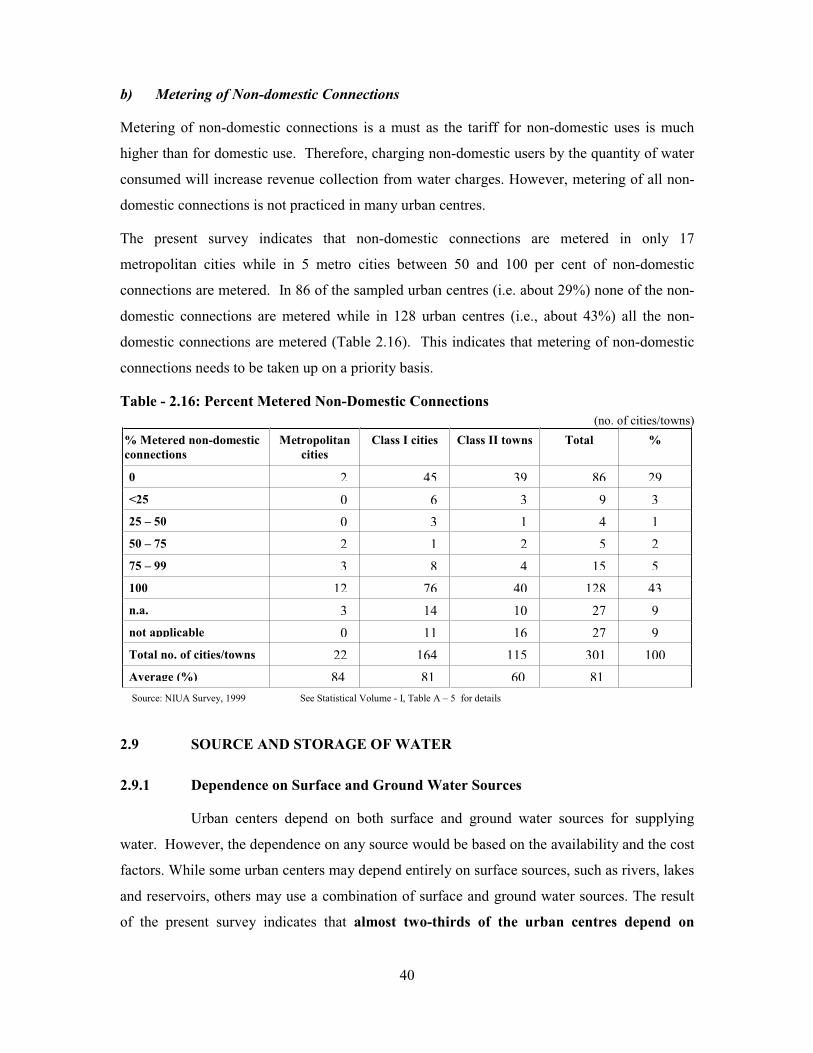
40
b) Metering of Non-domestic Connections
Metering of non-domestic connections is a must as the tariff for non-domestic uses is much
higher than for domestic use. Therefore, charging non-domestic users by the quantity of water
consumed will increase revenue collection from water charges. However, metering of all non-
domestic connections is not practiced in many urban centres.
The present survey indicates that non-domestic connections are metered in only 17
metropolitan cities while in 5 metro cities between 50 and 100 per cent of non-domestic
connections are metered. In 86 of the sampled urban centres (i.e. about 29%) none of the non-
domestic connections are metered while in 128 urban centres (i.e., about 43%) all the non-
domestic connections are metered (Table 2.16). This indicates that metering of non-domestic
connections needs to be taken up on a priority basis.
Table - 2.16: Percent Metered Non-Domestic Connections
(no. of cities/towns)
% Metered non-domestic
connections
Metropolitan
cities
Class I cities Class II towns Total %
0 2 45 39 86 29
<25 0 6 3 9 3
25 – 50 0 3 1 4 1
50 – 75 2 1 2 5 2
75 – 99 3 8 4 15 5
100 12 76 40 128 43
n.a. 3 14 10 27 9
not applicable 0 11 16 27 9
Total no. of cities/towns 22 164 115 301 100
Average (%) 84 81 60 81
Source: NIUA Survey, 1999 See Statistical Volume - I, Table A – 5 for details
2.9 SOURCE AND STORAGE OF WATER
2.9.1 Dependence on Surface and Ground Water Sources
Urban centers depend on both surface and ground water sources for supplying
water. However, the dependence on any source would be based on the availability and the cost
factors. While some urban centers may depend entirely on surface sources, such as rivers, lakes
and reservoirs, others may use a combination of surface and ground water sources. The result
of the present survey indicates that almost two-thirds of the urban centres depend on
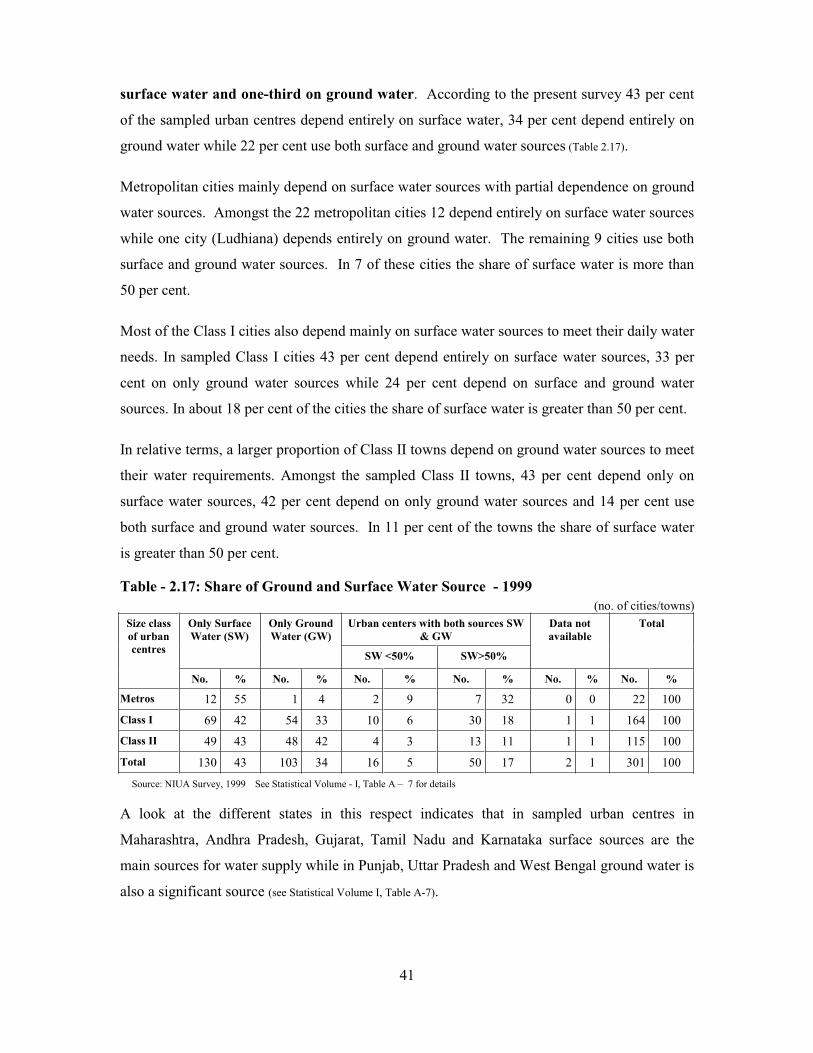
41
surface water and one-third on ground water. According to the present survey 43 per cent
of the sampled urban centres depend entirely on surface water, 34 per cent depend entirely on
ground water while 22 per cent use both surface and ground water sources (Table 2.17).
Metropolitan cities mainly depend on surface water sources with partial dependence on ground
water sources. Amongst the 22 metropolitan cities 12 depend entirely on surface water sources
while one city (Ludhiana) depends entirely on ground water. The remaining 9 cities use both
surface and ground water sources. In 7 of these cities the share of surface water is more than
50 per cent.
Most of the Class I cities also depend mainly on surface water sources to meet their daily water
needs. In sampled Class I cities 43 per cent depend entirely on surface water sources, 33 per
cent on only ground water sources while 24 per cent depend on surface and ground water
sources. In about 18 per cent of the cities the share of surface water is greater than 50 per cent.
In relative terms, a larger proportion of Class II towns depend on ground water sources to meet
their water requirements. Amongst the sampled Class II towns, 43 per cent depend only on
surface water sources, 42 per cent depend on only ground water sources and 14 per cent use
both surface and ground water sources. In 11 per cent of the towns the share of surface water
is greater than 50 per cent.
Table - 2.17: Share of Ground and Surface Water Source - 1999
(no. of cities/towns)
Urban centers with both sources SW
& GW
Only Surface
Water (SW)
Only Ground
Water (GW)
SW <50% SW>50%
Data not
available
Total Size class
of urban
centres
No. % No. % No. % No. % No. % No. %
Metros 12 55 1 4 2 9 7 32 0 0 22 100
Class I 69 42 54 33 10 6 30 18 1 1 164 100
Class II 49 43 48 42 4 3 13 11 1 1 115 100
Total 130 43 103 34 16 5 50 17 2 1 301 100
Source: NIUA Survey, 1999 See Statistical Volume - I, Table A – 7 for details
A look at the different states in this respect indicates that in sampled urban centres in
Maharashtra, Andhra Pradesh, Gujarat, Tamil Nadu and Karnataka surface sources are the
main sources for water supply while in Punjab, Uttar Pradesh and West Bengal ground water is
also a significant source (see Statistical Volume I, Table A-7).
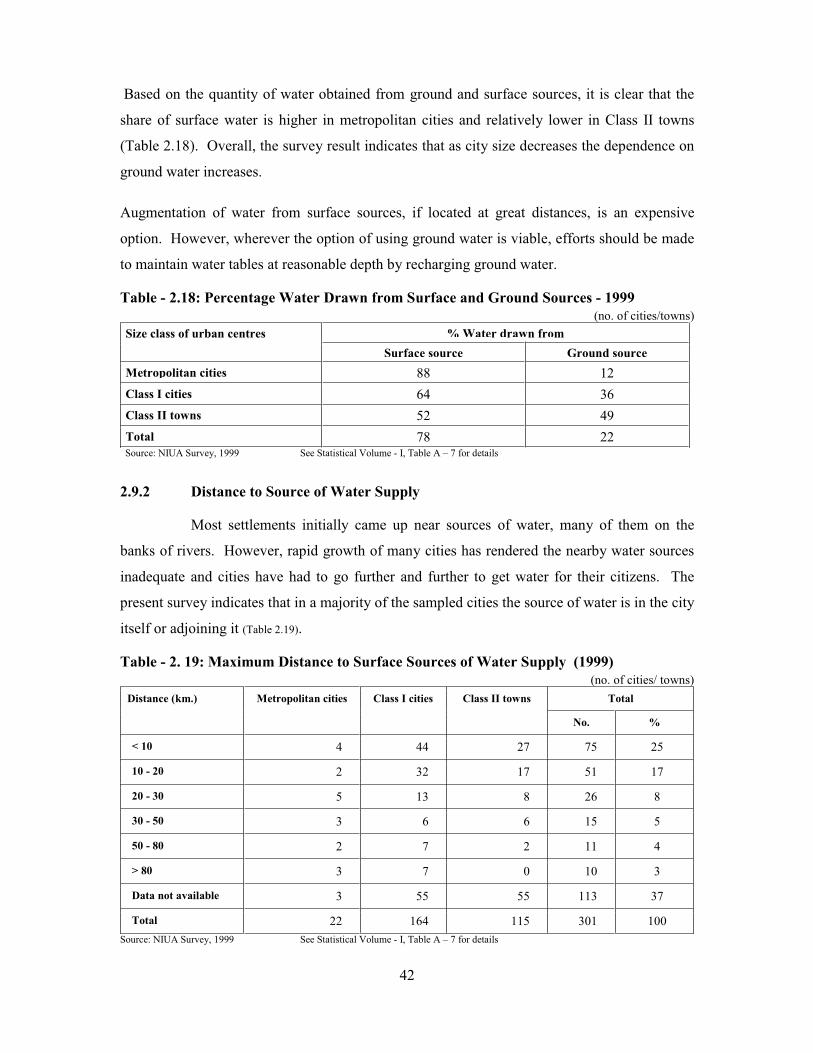
42
Based on the quantity of water obtained from ground and surface sources, it is clear that the
share of surface water is higher in metropolitan cities and relatively lower in Class II towns
(Table 2.18). Overall, the survey result indicates that as city size decreases the dependence on
ground water increases.
Augmentation of water from surface sources, if located at great distances, is an expensive
option. However, wherever the option of using ground water is viable, efforts should be made
to maintain water tables at reasonable depth by recharging ground water.
Table - 2.18: Percentage Water Drawn from Surface and Ground Sources - 1999
(no. of cities/towns)
% Water drawn fromSize class of urban centres
Surface source Ground source
Metropolitan cities 88 12
Class I cities 64 36
Class II towns 52 49
Total 78 22 Source: NIUA Survey, 1999 See Statistical Volume - I, Table A – 7 for details
2.9.2 Distance to Source of Water Supply
Most settlements initially came up near sources of water, many of them on the
banks of rivers. However, rapid growth of many cities has rendered the nearby water sources
inadequate and cities have had to go further and further to get water for their citizens. The
present survey indicates that in a majority of the sampled cities the source of water is in the city
itself or adjoining it (Table 2.19).
Table - 2. 19: Maximum Distance to Surface Sources of Water Supply (1999)
(no. of cities/ towns)
Total Distance (km.) Metropolitan cities Class I cities Class II towns
No. %
< 10 4 44 27 75 25
10 - 20 2 32 17 51 17
20 - 30 5 13 8 26 8
30 - 50 3 6 6 15 5
50 - 80 2 7 2 11 4
> 80 3 7 0 10 3
Data not available 3 55 55 113 37
Total 22 164 115 301 100
Source: NIUA Survey, 1999 See Statistical Volume - I, Table A – 7 for details

43
These are cities that mainly depend on ground water source or nearby surface source. At
present some of the Class I cities are bringing water from over 100 kms. In most such cases
the source of water is a dam and therefore the distance (Table 2.20).
Table - 2.20 : Distance to Present Source of Water for Selected Urban Centres - 1999
Cities Distance (km.)
Ranchi 292
Thaleserry 280
Gadag-Betigeri 255
Jodhpur 209
Ajmer 140
Jalgaon 140
Solapur 103
Source: NIUA Survey, 1999 See Statistical Volume - I, Table A – 7 for details
Metropolitan cities present a different picture. At present, only Mumbai goes as far as 119 km.
for getting water for its citizens. In most other cities the distance to water source is less than 30
kms. However, the future sources of water supply for some metropolitan cities are as far as
400 kms away (Tables 2.21).
Table - 2.21: Distance to Future Sources of Water Supply for Selected Metropolitan
Cities - 1999
City Present source (km.) Future source (km.)
Mumbai 29 - 119 135 - 150
Delhi 26 320 - 400
Chennai - 400
Hyderabad 15 -18 60 - 100
Jaipur 25 120
Vishakhapatnam 15 - 73 60 - 150
Source: NIUA Survey, 1999 See Statistical Volume - I, Table A – 7 for details
2.9.3 Storage Capacity of Service Reservoirs
The minimum storage capacity of service reservoirs depends on many factors. The
CPHEEO Manual states that “A system supplied by pumps with 100% standby will require less
storage capacity than that with less standby provision. Similarly a system divided into
interconnected zones will require less storage capacity for all the zones except for the zones at
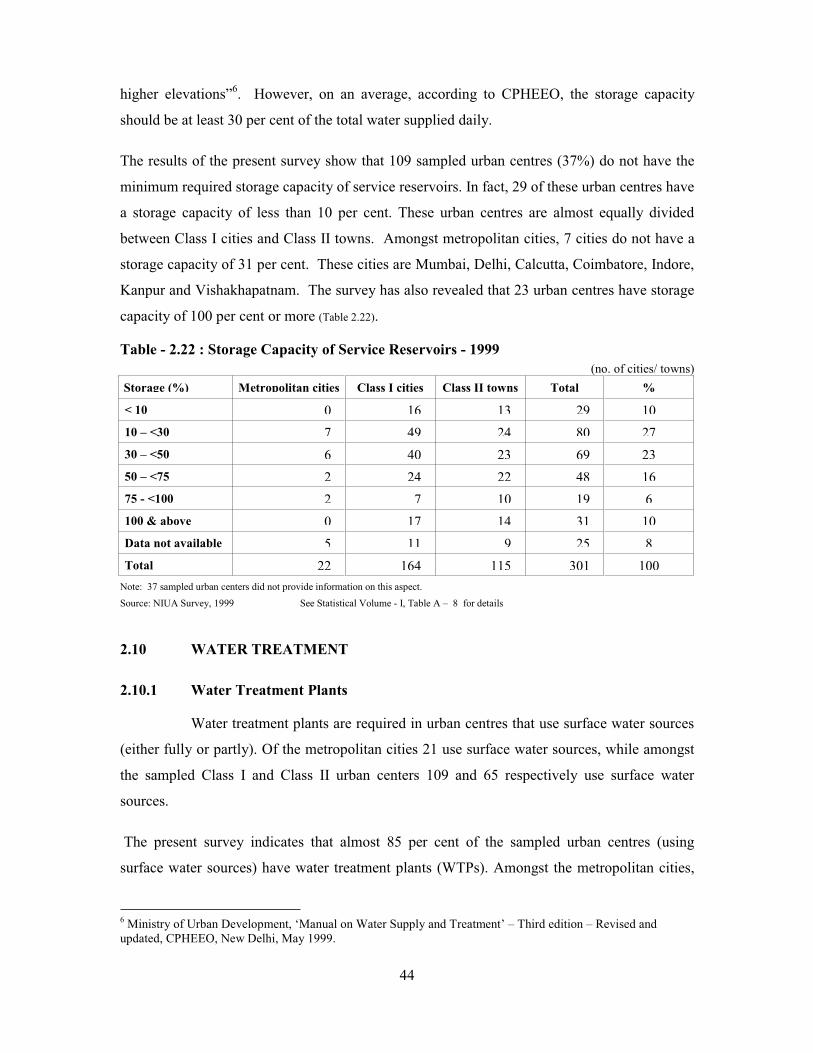
44
higher elevations”6. However, on an average, according to CPHEEO, the storage capacity
should be at least 30 per cent of the total water supplied daily.
The results of the present survey show that 109 sampled urban centres (37%) do not have the
minimum required storage capacity of service reservoirs. In fact, 29 of these urban centres have
a storage capacity of less than 10 per cent. These urban centres are almost equally divided
between Class I cities and Class II towns. Amongst metropolitan cities, 7 cities do not have a
storage capacity of 31 per cent. These cities are Mumbai, Delhi, Calcutta, Coimbatore, Indore,
Kanpur and Vishakhapatnam. The survey has also revealed that 23 urban centres have storage
capacity of 100 per cent or more (Table 2.22).
Table - 2.22 : Storage Capacity of Service Reservoirs - 1999
(no. of cities/ towns)
Storage (%) Metropolitan cities Class I cities Class II towns Total %
< 10 0 16 13 29 10
10 – <30 7 49 24 80 27
30 – <50 6 40 23 69 23
50 – <75 2 24 22 48 16
75 - <100 2 7 10 19 6
100 & above 0 17 14 31 10
Data not available 5 11 9 25 8
Total 22 164 115 301 100
Note: 37 sampled urban centers did not provide information on this aspect.
Source: NIUA Survey, 1999 See Statistical Volume - I, Table A – 8 for details
2.10 WATER TREATMENT
2.10.1 Water Treatment Plants
Water treatment plants are required in urban centres that use surface water sources
(either fully or partly). Of the metropolitan cities 21 use surface water sources, while amongst
the sampled Class I and Class II urban centers 109 and 65 respectively use surface water
sources.
The present survey indicates that almost 85 per cent of the sampled urban centres (using
surface water sources) have water treatment plants (WTPs). Amongst the metropolitan cities,
6 Ministry of Urban Development, ‘Manual on Water Supply and Treatment’ – Third edition – Revised and
updated, CPHEEO, New Delhi, May 1999.
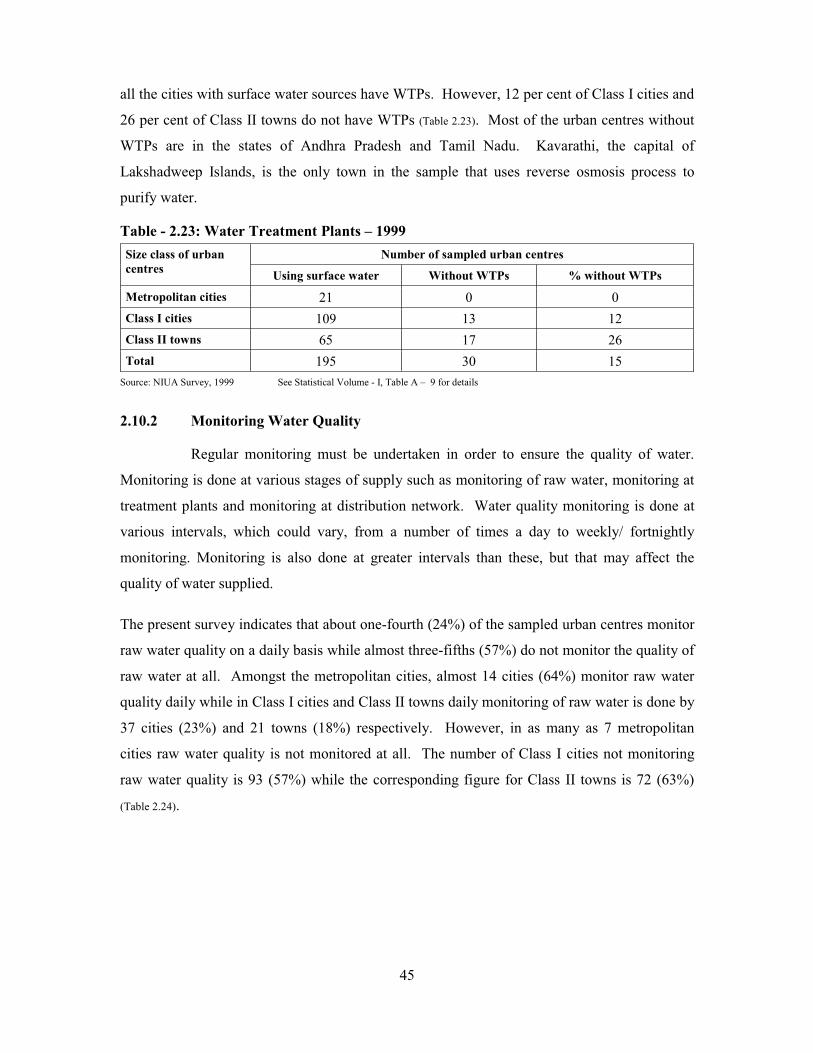
45
all the cities with surface water sources have WTPs. However, 12 per cent of Class I cities and
26 per cent of Class II towns do not have WTPs (Table 2.23). Most of the urban centres without
WTPs are in the states of Andhra Pradesh and Tamil Nadu. Kavarathi, the capital of
Lakshadweep Islands, is the only town in the sample that uses reverse osmosis process to
purify water.
Table - 2.23: Water Treatment Plants – 1999
Number of sampled urban centres Size class of urban
centres Using surface water Without WTPs % without WTPs
Metropolitan cities 21 0 0
Class I cities 109 13 12
Class II towns 65 17 26
Total 195 30 15
Source: NIUA Survey, 1999 See Statistical Volume - I, Table A – 9 for details
2.10.2 Monitoring Water Quality
Regular monitoring must be undertaken in order to ensure the quality of water.
Monitoring is done at various stages of supply such as monitoring of raw water, monitoring at
treatment plants and monitoring at distribution network. Water quality monitoring is done at
various intervals, which could vary, from a number of times a day to weekly/ fortnightly
monitoring. Monitoring is also done at greater intervals than these, but that may affect the
quality of water supplied.
The present survey indicates that about one-fourth (24%) of the sampled urban centres monitor
raw water quality on a daily basis while almost three-fifths (57%) do not monitor the quality of
raw water at all. Amongst the metropolitan cities, almost 14 cities (64%) monitor raw water
quality daily while in Class I cities and Class II towns daily monitoring of raw water is done by
37 cities (23%) and 21 towns (18%) respectively. However, in as many as 7 metropolitan
cities raw water quality is not monitored at all. The number of Class I cities not monitoring
raw water quality is 93 (57%) while the corresponding figure for Class II towns is 72 (63%)
(Table 2.24).
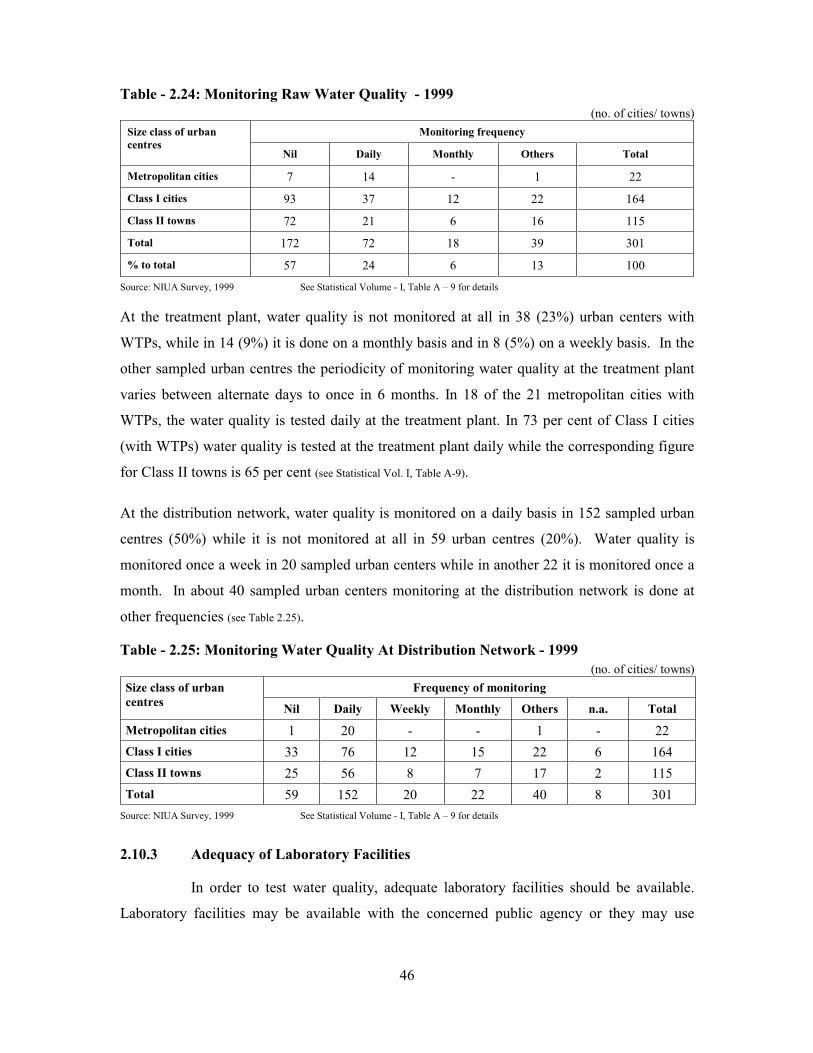
46
Table - 2.24: Monitoring Raw Water Quality - 1999
(no. of cities/ towns)
Monitoring frequency Size class of urban
centres Nil Daily Monthly Others Total
Metropolitan cities 7 14 - 1 22
Class I cities 93 37 12 22 164
Class II towns 72 21 6 16 115
Total 172 72 18 39 301
% to total 57 24 6 13 100
Source: NIUA Survey, 1999 See Statistical Volume - I, Table A – 9 for details
At the treatment plant, water quality is not monitored at all in 38 (23%) urban centers with
WTPs, while in 14 (9%) it is done on a monthly basis and in 8 (5%) on a weekly basis. In the
other sampled urban centres the periodicity of monitoring water quality at the treatment plant
varies between alternate days to once in 6 months. In 18 of the 21 metropolitan cities with
WTPs, the water quality is tested daily at the treatment plant. In 73 per cent of Class I cities
(with WTPs) water quality is tested at the treatment plant daily while the corresponding figure
for Class II towns is 65 per cent (see Statistical Vol. I, Table A-9).
At the distribution network, water quality is monitored on a daily basis in 152 sampled urban
centres (50%) while it is not monitored at all in 59 urban centres (20%). Water quality is
monitored once a week in 20 sampled urban centers while in another 22 it is monitored once a
month. In about 40 sampled urban centers monitoring at the distribution network is done at
other frequencies (see Table 2.25).
Table - 2.25: Monitoring Water Quality At Distribution Network - 1999
(no. of cities/ towns)
Frequency of monitoring Size class of urban
centres Nil Daily Weekly Monthly Others n.a. Total
Metropolitan cities 1 20 - - 1 - 22
Class I cities 33 76 12 15 22 6 164
Class II towns 25 56 8 7 17 2 115
Total 59 152 20 22 40 8 301
Source: NIUA Survey, 1999 See Statistical Volume - I, Table A – 9 for details
2.10.3 Adequacy of Laboratory Facilities
In order to test water quality, adequate laboratory facilities should be available.
Laboratory facilities may be available with the concerned public agency or they may use
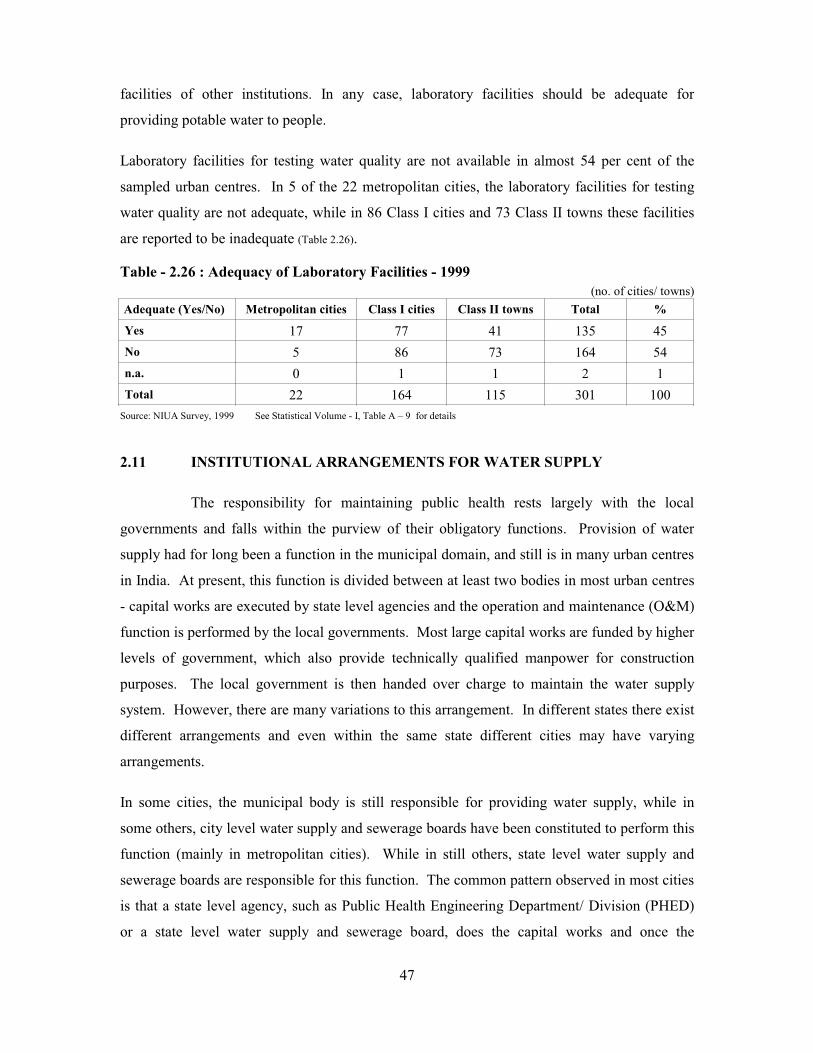
47
facilities of other institutions. In any case, laboratory facilities should be adequate for
providing potable water to people.
Laboratory facilities for testing water quality are not available in almost 54 per cent of the
sampled urban centres. In 5 of the 22 metropolitan cities, the laboratory facilities for testing
water quality are not adequate, while in 86 Class I cities and 73 Class II towns these facilities
are reported to be inadequate (Table 2.26).
Table - 2.26 : Adequacy of Laboratory Facilities - 1999
(no. of cities/ towns)
Adequate (Yes/No) Metropolitan cities Class I cities Class II towns Total %
Yes 17 77 41 135 45
No 5 86 73 164 54
n.a. 0 1 1 2 1
Total 22 164 115 301 100
Source: NIUA Survey, 1999 See Statistical Volume - I, Table A – 9 for details
2.11 INSTITUTIONAL ARRANGEMENTS FOR WATER SUPPLY
The responsibility for maintaining public health rests largely with the local
governments and falls within the purview of their obligatory functions. Provision of water
supply had for long been a function in the municipal domain, and still is in many urban centres
in India. At present, this function is divided between at least two bodies in most urban centres
- capital works are executed by state level agencies and the operation and maintenance (O&M)
function is performed by the local governments. Most large capital works are funded by higher
levels of government, which also provide technically qualified manpower for construction
purposes. The local government is then handed over charge to maintain the water supply
system. However, there are many variations to this arrangement. In different states there exist
different arrangements and even within the same state different cities may have varying
arrangements.
In some cities, the municipal body is still responsible for providing water supply, while in
some others, city level water supply and sewerage boards have been constituted to perform this
function (mainly in metropolitan cities). While in still others, state level water supply and
sewerage boards are responsible for this function. The common pattern observed in most cities
is that a state level agency, such as Public Health Engineering Department/ Division (PHED)
or a state level water supply and sewerage board, does the capital works and once the
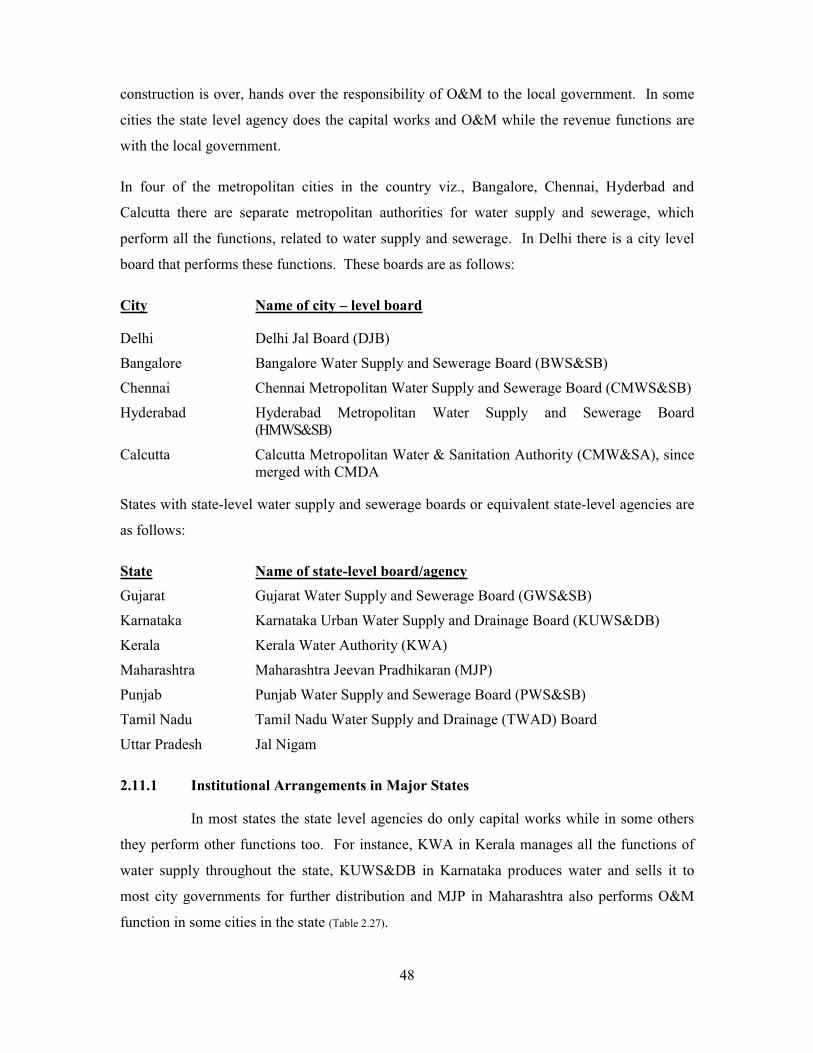
48
construction is over, hands over the responsibility of O&M to the local government. In some
cities the state level agency does the capital works and O&M while the revenue functions are
with the local government.
In four of the metropolitan cities in the country viz., Bangalore, Chennai, Hyderbad and
Calcutta there are separate metropolitan authorities for water supply and sewerage, which
perform all the functions, related to water supply and sewerage. In Delhi there is a city level
board that performs these functions. These boards are as follows:
City Name of city – level board
Delhi Delhi Jal Board (DJB)
Bangalore Bangalore Water Supply and Sewerage Board (BWS&SB)
Chennai Chennai Metropolitan Water Supply and Sewerage Board (CMWS&SB)
Hyderabad Hyderabad Metropolitan Water Supply and Sewerage Board
(HMWS&SB)
Calcutta Calcutta Metropolitan Water & Sanitation Authority (CMW&SA), since
merged with CMDA
States with state-level water supply and sewerage boards or equivalent state-level agencies are
as follows:
State Name of state-level board/agency
Gujarat Gujarat Water Supply and Sewerage Board (GWS&SB)
Karnataka Karnataka Urban Water Supply and Drainage Board (KUWS&DB)
Kerala Kerala Water Authority (KWA)
Maharashtra Maharashtra Jeevan Pradhikaran (MJP)
Punjab Punjab Water Supply and Sewerage Board (PWS&SB)
Tamil Nadu Tamil Nadu Water Supply and Drainage (TWAD) Board
Uttar Pradesh Jal Nigam
2.11.1 Institutional Arrangements in Major States
In most states the state level agencies do only capital works while in some others
they perform other functions too. For instance, KWA in Kerala manages all the functions of
water supply throughout the state, KUWS&DB in Karnataka produces water and sells it to
most city governments for further distribution and MJP in Maharashtra also performs O&M
function in some cities in the state (Table 2.27).

49
In Rajasthan the entire function of water supply in all urban areas is with the state PHED.
Similarly, in Haryana, in all the towns, except in Faridabad where the Corporation is
responsible for water supply, it is the PHD that is responsible for provision of water supply.
In Uttar Pradesh there are seven Jal Sansthans, five of which are city level agencies while two
are regional level agencies. The cities of Kanpur, Lucknow, Varanasi, Allahabad and Agra
have city level Jal Sansthans to manage mainly O&M functions; the two regional agencies are
Kumaon Jal Sansthan and Jhansi Jal Sansthan.
Table - 2.27: Institutional Arrangements for Urban Water Supply in Major States
State Capital works O & M Revenue functions
Andhra Pradesh PHED Municipal body Municipal body
Bihar PHED & Municipal body PHED & Municipal body Municipal body
Gujarat Municipal body & GWS&SB Municipal body Municipal body
Haryana PHD PHD PHD
Karnataka KUWS&DB Municipal body Municipal body
Kerala KWA KWA KWA
Madhya Pradesh Municipal body & PHED Municipal body & PHED Municipal body
Maharashtra MJP & Corporation Municipal body Municipal body
Orissa PHED, Rural Water Supply and
Sanitation Department, Housing
and Urban Development Deptt.
PHED, Rural Water Supply and
Sanitation Department
PHED, Rural Water
Supply and Sanitation
Department
Punjab PWS&SB Municipal body & PWS&SB Municipal body
Rajasthan PHED PHED PHED
Tamil Nadu TWAD Board Municipal body & TWAD
Board
Municipal body
Uttar Pradesh Jal Nigam & Municipal body Jal Sansthan & Municipal body Jal Sansthan &
Municipal body
West Bengal PHED & Municipal body PHED & Municipal body Municipal body
Source: NIUA Survey, 1999 See Statistical Volume - I, Table A – 10 for details
2.11.2 Exceptions
There are exceptions, though, to the above pattern in many states. For instance, in
Hindupur and Srikalahasti in Andhra Pradesh, the municipality performs all the above
functions. In Kerala, Thrissur Municipal Council does the O&M and revenue related functions
in a state where KWA performs all the functions for all towns. In Madhya Pradesh, in the
towns of Satna and Rewa, PHED performs the O&M as well as revenue related functions. In
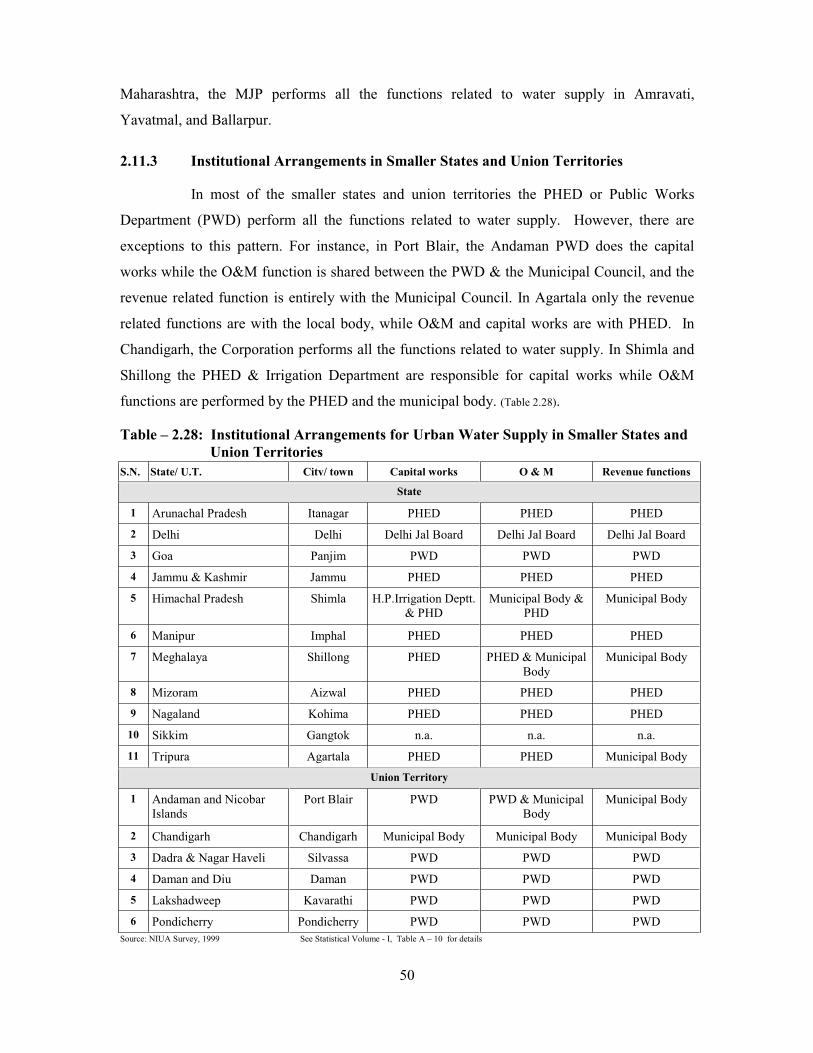
50
Maharashtra, the MJP performs all the functions related to water supply in Amravati,
Yavatmal, and Ballarpur.
2.11.3 Institutional Arrangements in Smaller States and Union Territories
In most of the smaller states and union territories the PHED or Public Works
Department (PWD) perform all the functions related to water supply. However, there are
exceptions to this pattern. For instance, in Port Blair, the Andaman PWD does the capital
works while the O&M function is shared between the PWD & the Municipal Council, and the
revenue related function is entirely with the Municipal Council. In Agartala only the revenue
related functions are with the local body, while O&M and capital works are with PHED. In
Chandigarh, the Corporation performs all the functions related to water supply. In Shimla and
Shillong the PHED & Irrigation Department are responsible for capital works while O&M
functions are performed by the PHED and the municipal body. (Table 2.28).
Table – 2.28: Institutional Arrangements for Urban Water Supply in Smaller States and
Union Territories
S.N. State/ U.T. City/ town Capital works O & M Revenue functions
State
1 Arunachal Pradesh Itanagar PHED PHED PHED
2 Delhi Delhi Delhi Jal Board Delhi Jal Board Delhi Jal Board
3 Goa Panjim PWD PWD PWD
4 Jammu & Kashmir Jammu PHED PHED PHED
5 Himachal Pradesh Shimla H.P.Irrigation Deptt.
& PHD
Municipal Body &
PHD
Municipal Body
6 Manipur Imphal PHED PHED PHED
7 Meghalaya Shillong PHED PHED & Municipal
Body
Municipal Body
8 Mizoram Aizwal PHED PHED PHED
9 Nagaland Kohima PHED PHED PHED
10 Sikkim Gangtok n.a. n.a. n.a.
11 Tripura Agartala PHED PHED Municipal Body
Union Territory
1 Andaman and Nicobar
Islands
Port Blair PWD PWD & Municipal
Body
Municipal Body
2 Chandigarh Chandigarh Municipal Body Municipal Body Municipal Body
3 Dadra & Nagar Haveli Silvassa PWD PWD PWD
4 Daman and Diu Daman PWD PWD PWD
5 Lakshadweep Kavarathi PWD PWD PWD
6 Pondicherry Pondicherry PWD PWD PWD
Source: NIUA Survey, 1999 See Statistical Volume - I, Table A – 10 for details