Embed Size (px)
Citation preview
Status of the Grizzly Bear(Ursus arctos) in Alberta:
Update 2010
Alberta Wildlife Status Report No. 37 (Update 2010)
� �
Status of the Grizzly Bear (Ursus arctos) in Alberta:
Update 2010
Prepared for: Alberta Sustainable Resource Development (ASRD)
Alberta Conservation Association (ACA)
Update prepared by:Marco Festa-Bianchet
Much of the original work contained in the report was prepared by John L. Kansas in 2002.
This report has been reviewed, revised, and edited prior to publication.It is an ASRD/ACA working document that will be revised and updated periodically.
Alberta Wildlife Status Report No. 37 (Update 2010)
February 2010
Published By:
����
Publ�cat�on No. T/223 ISBN: 978-0-7785-9014-9 (Pr�nted Ed�t�on)ISBN: 978-0-7785-9015-6 (On-l�ne Ed�t�on)
ISSN: 1206-4912 (Pr�nted Ed�t�on)ISSN: 1499-4682 (On-l�ne Ed�t�on)
Ser�es Ed�tors: Sue Peters, Rob�n Gutsell and Gav�n BergIllustrat�ons: Br�an Huffman
Maps: Gav�n Berg
For cop�es of th�s report, v�s�t our web s�te at:http://srd.alberta.ca/B�oD�vers�tyStewardsh�p/Spec�esAtR�sk/
and cl�ck on “Deta�led Status”
OR
Contact:Informat�on Centre - Publ�cat�ons
Alberta Susta�nable Resource DevelopmentMa�n Floor, Great West L�fe Bu�ld�ng
9920 - 108 StreetEdmonton, Alberta, Canada T5K 2M4
Telephone: (780) 944-0313 or 1-877-944-0313
Th�s publ�cat�on may be c�ted as:
Alberta Susta�nable Resource Development and Alberta Conservat�on Assoc�at�on. 2010. Status of the Gr�zzly Bear (Ursus arctos) �n Alberta: Update 2010. Alberta Susta�nable Resource Development. W�ldl�fe Status Report No. 37 (Update 2010). Edmonton, AB. 44 pp.
���� ���
PReFACe
Every five years, the Fish and Wildlife Division of Alberta Sustainable Resource Development rev�ews the general status of w�ldl�fe spec�es �n Alberta. These overv�ews, wh�ch have been conducted �n 1991 (The Status of Alberta Wildlife), 1996 (The Status of Alberta Wildlife), 2000 (The General Status of Alberta Wild Species 2000), and 2005 (The General Status of Alberta Wild Species 2005) assign individual species “ranks” that reflect the perceived level of risk to populations that occur �n the prov�nce. Such des�gnat�ons are determ�ned from extens�ve consultat�ons w�th profess�onal and amateur b�olog�sts, and from a var�ety of read�ly ava�lable sources of populat�on data. A key object�ve of these rev�ews �s to �dent�fy spec�es that may be cons�dered for more deta�led status determ�nat�ons.
The Alberta W�ldl�fe Status Report Ser�es �s an extens�on of the general status exerc�se, and prov�des comprehens�ve current summar�es of the b�olog�cal status of selected w�ldl�fe spec�es �n Alberta. Pr�or�ty �s g�ven to spec�es that are At Risk or May Be At Risk �n the prov�nce, that are of uncerta�n status (Undetermined), or that are cons�dered to be at r�sk at a nat�onal level by the Comm�ttee on the Status of Endangered W�ldl�fe �n Canada (COSEWIC).
Reports �n th�s ser�es are publ�shed and d�str�buted by the Alberta Conservat�on Assoc�at�on and the F�sh and W�ldl�fe D�v�s�on of Alberta Susta�nable Resource Development. They are �ntended to prov�de deta�led and up-to-date �nformat�on that w�ll be useful to resource profess�onals for manag�ng populat�ons of spec�es and the�r hab�tats �n the prov�nce. The reports are also des�gned to prov�de current �nformat�on that w�ll ass�st Alberta’s Endangered Spec�es Conservat�on Comm�ttee �n �dent�fy�ng spec�es that may be formally des�gnated as Endangered or Threatened under Alberta’s Wildlife Act. To ach�eve these goals, the reports have been authored and/or rev�ewed by �nd�v�duals w�th un�que local expert�se �n the b�ology and management of each spec�es.
�v�v
eXeCUTIVe SUMMARY
The gr�zzly bear (Ursus arctos) �n Alberta was recommended for Threatened des�gnat�on �n 2002. A morator�um on sport hunt�ng was �nst�tuted �n 2006. DNA-based capture-mark-recapture stud�es from 2004 to 2008 estimated a total of 582 grizzly bears (95% confidence interval: 498–732) from south of Grande Pra�r�e to the Amer�can border, �nclud�ng parts of Jasper and Banff nat�onal parks, and all of Waterton Lakes Nat�onal Park. Add�ng to th�s number the much less prec�se est�mates of gr�zzly bear numbers elsewhere, based mostly on hab�tat qual�ty (15 �mmed�ately to the east of areas where DNA sampl�ng was conducted, 23 �n the Swan H�lls, and 71 �n northwestern Alberta), th�s report est�mates a total of 691 gr�zzly bears �n lands under prov�nc�al jur�sd�ct�on plus Waterton Lakes National Park and portions of Banff and Jasper national parks. No confidence interval can be calculated for th�s est�mate. Of th�s total, about 359 are l�kely mature �nd�v�duals capable of reproduc�ng. Bear dens�ty �s much h�gher �n the relat�vely und�sturbed Grande Cache un�t (about 18 bears/1000 km2) than �n areas between H�ghways 1 (lat�tude of Calgary) and 16 (lat�tude of Edmonton) w�th h�gh levels of �ndustr�al act�v�ty (about 5 bears/1000 km2). South of H�ghway 1, density increases (12–18 bears/1000 km2) but gr�zzly bears are restr�cted to a narrow str�p of hab�tat along the B.C. border. Human act�v�t�es �n bear hab�tat, part�cularly the expand�ng network of roads, lead to unsusta�nable levels of bear mortal�ty. An exam�nat�on of known mortal�ty and results of stud�es on the surv�val and reproduct�ve success of marked gr�zzly bears suggest that some local populat�ons w�th a h�gh level of hab�tat alterat�on are decl�n�ng. Populat�on trends are largely unknown, but l�kely vary substant�ally over d�fferent parts of the prov�nce. In the protected or �naccess�ble parts of the Grande Cache un�t, bear numbers are l�kely stable, and numbers �n the western Bow R�ver dra�nage also appear stable. A large area of gr�zzly bear hab�tat, part�cularly south of H�ghway 16, currently appears to be a populat�on s�nk, but could support a self-susta�n�ng populat�on �f human-caused mortal�ty was reduced. To reduce mortal�ty, motor�zed access to bear habitat must be minimized and human activities that lead to conflicts with bears must be m�t�gated. Publ�c educat�on and research also contr�bute to the conservat�on of gr�zzly bears �n Alberta. Rema�n�ng gaps �n knowledge �nclude rel�able populat�on est�mates �n the Swan H�lls and Alberta North areas, and better long-term �nd�v�dual-based �nformat�on on demograph�c var�ables to assess populat�on trends under d�fferent levels of hab�tat alterat�on.
�v�v v
ACKNOWLeDGeMeNTS
For the original 2002 report prepared by John L. Kansas:Thanks go out to a number of �nd�v�duals for the�r cooperat�on, �nput and ass�stance �n the preparat�on of th�s report. Bryon Benn conducted background research and �n�t�al preparat�on of sect�ons on L�m�t�ng Factors and Populat�on S�ze and Trends. Techn�cal rev�ew comments on draft reports were prov�ded by: Wes Bradford (Jasper Nat�onal Park), Eldon Bruns (Alberta Susta�nable Resource Development), Harold Carr (Alberta Susta�nable Resource Development), Rob�n Gutsell (Alberta Susta�nable ResourceDevelopment) Stephen Herrero (Un�vers�ty of Calgary), Tom Hurd (Banff Nat�onal Park), Adam James (Alberta Susta�nable Resource Development), Jeff Kneteman (Alberta Susta�nable Resource Development), Brent Markham (Alberta Susta�nable Resource Development), Isabelle M�chaud (Alberta Conservat�on Assoc�at�on), R�chard Qu�nlan (Alberta Susta�nable Resource Development), and Gord Stenhouse (Footh�lls Model Forest) and Rob Watt (Waterton Lakes Nat�onal Park).
Preparat�on of the report was funded by the W�ldl�fe Management Enhancement Fund of the Alberta Conservat�on Assoc�at�on and the F�sh and W�ldl�fe D�v�s�on of Alberta Susta�nable Resource Development. Adm�n�strat�ve and report product�on matters ably and pat�ently handled by Isabelle M�chaud, Sherry Feser and Dav�d Prescott.
For the 2010 update prepared by Marco Festa-Bianchet:I am grateful to the follow�ng people for prov�d�ng data, comments and unpubl�shed reports, answer�ng e-ma�ls, or construct�vely cr�t�c�z�ng earl�er drafts of th�s report: Br�an B�ldson (W�llmore W�lderness Foundat�on), John Boulanger (pr�vate consultant), Mark Boyce (Un�vers�ty of Alberta), Gordon Court (Alberta Susta�nable Resource Development [ASRD]), Ch�arastella Feder (ASRD), Rob�n Gutsell (ASRD), Tony Ham�lton (B.C. M�n�stry of Env�ronment), Jon Jorgenson (ASRD), Ph�l McLoughl�n (Un�vers�ty of Saskatchewan), Scott N�elsen (Un�vers�ty of Alberta), Sue Peters (Alberta Conservat�on Assoc�at�on), M�chael Proctor (B�rchdale Ecolog�cal), Charles Schwartz (Northern Rocky Mounta�n Sc�ence Center), Chr�s Servheen (Un�vers�ty of Montana), Gordon Stenhouse (Footh�lls Research Ins�t�tute) and Nate Webb (ASRD).
Preparat�on of th�s report was funded by the Alberta Conservat�on Assoc�at�on and the F�sh and W�ldl�fe D�v�s�on of ASRD.

v�v�
v�v� v��
TABLe OF CONTeNTS
PREFACE .......................................................................................................................... ���
EXECUTIVE SUMMARY ................................................................................................ �v
ACKNOWLEDGEMENTS .................................................................................................v
INTRODUCTION ...............................................................................................................1
HABITAT .............................................................................................................................1
1. Forag�ng Hab�tat ....................................................................................................3
2. Denn�ng Hab�tat .....................................................................................................3
3. Home Range and Hab�tat Requ�rements ................................................................3
4. Hab�tat Effect�veness .............................................................................................4
CONSERVATION BIOLOGY .............................................................................................5
1. Food Hab�ts ............................................................................................................5
2. Populat�on B�ology ................................................................................................7
DISTRIBUTION ..................................................................................................................9
1. Alberta ....................................................................................................................9
2. Other Areas ..........................................................................................................10
POPULATION SIZE AND TRENDS ...............................................................................10
1. Background ..........................................................................................................10
2. Alberta’s Current Populat�on Est�mate .................................................................14
3. Alberta’s H�stor�cal Populat�on Est�mates ...........................................................20
4. Populat�on Trend and Rescue Effect ....................................................................21
5. Other Areas ..........................................................................................................27
LIMITING FACTORS .......................................................................................................27
1. Legal Harvest ......................................................................................................28
2. Illegal and Self-defence K�lls ...............................................................................28
3. Anthropogen�c Attractants ...................................................................................28
v���
TABLe OF CONTeNTS cont�nued:
4. Abor�g�nal Harvest ...............................................................................................28
5. Other Sources of Mortal�ty ..................................................................................28
6. Unreported Mortal�ty ...........................................................................................29
7. Hab�tat Loss and Fragmentat�on ..........................................................................29
8. F�re, F�re Suppress�on and T�mber Harvest .........................................................29
STATUS DESIGNATIONS ...............................................................................................30
1. Alberta ..................................................................................................................30
2. Other Areas ..........................................................................................................30
RECENT MANAGEMENT IN ALBERTA .......................................................................30
LITERATURE CITED .......................................................................................................34
Appendix 1 Definitions of Status Ranks and Legal Designations ....................................43
LIST OF TABLeS
Table 1 Reproduct�ve parameters and surv�val of gr�zzly bears .........................................9
Table 2 Gr�zzly bear populat�on est�mates for Alberta, from DNA-based Capture-Mark-Recapture .............................................................................................................15
Table 3 Est�mated average mortal�ty for gr�zzly bear populat�on un�ts �n Alberta, relat�ve to 2.8% and 4.9% mortal�ty rates .........................................................................25
LIST OF FIGUReS
F�gure 1 Gr�zzly bear core areas and secondary areas �n Alberta .......................................2
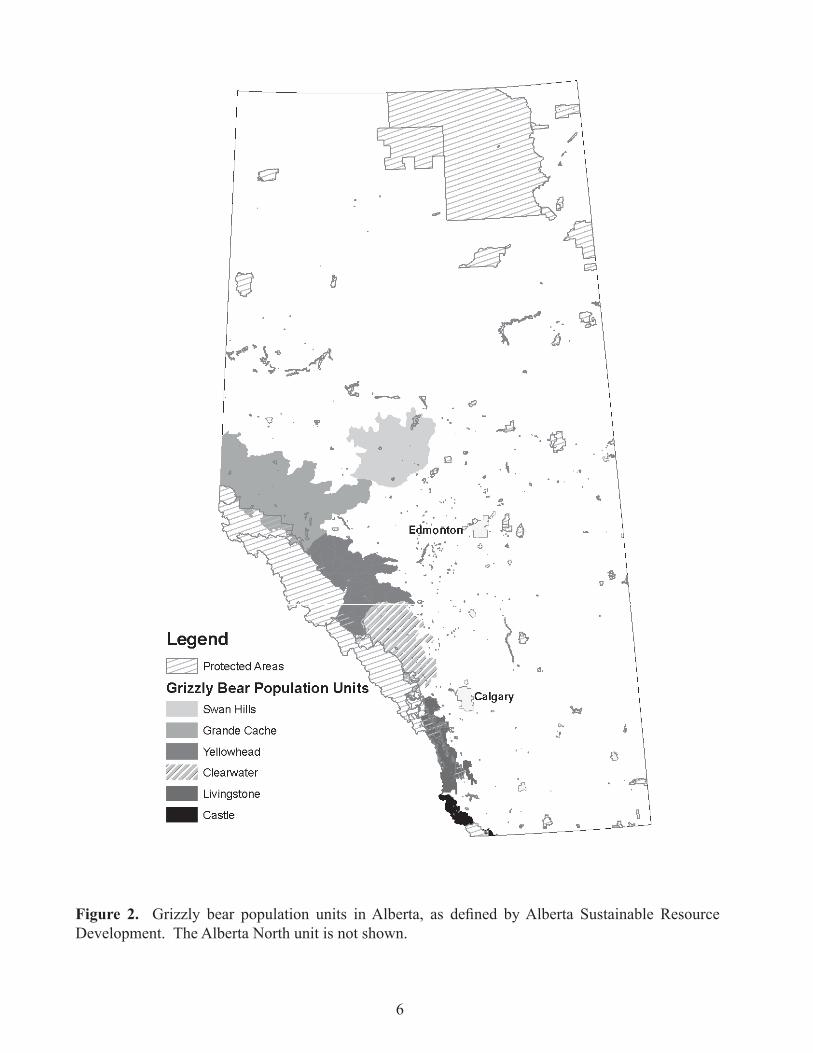
F�gure 2 Gr�zzly bear populat�on un�ts �n Alberta ..............................................................6
F�gure 3 The l�kely current d�str�but�on of gr�zzly bears �n Alberta, based on recent records ..................................................................................................................11
F�gure 4 Approx�mate current and h�stor�cal d�str�but�on of gr�zzly bears �n North Amer�ca ................................................................................................................12
�
* See Appendix 1 for definitions of selected status designations.
INTRODUCTION
In 2002, Alberta’s Endangered Species Conservation Committee recommended the status of the provincial population of grizzly bear (Ursus arctos) as Threatened*. The recommendation to list this species as Threatened under Alberta’s Wildlife Act, however, was not accepted by the Minister of Sustainable Resource Development. In the same year, the Committee on the Status of Endangered Wildlife in Canada (COSEWIC) assessed the grizzly bear in Canada as a species of Special Concern, based mostly on its life-history characteristics, strong evidence of habitat loss and population decline at the southern edge of its range (including in Alberta), and apparently unsustainable human-caused mortality in parts of its range. Canada’s government, however, did not list the grizzly bear under the Species at Risk Act (SARA); it currently has no legislative protection under SARA. In Alberta, grizzly bears and their habitat are protected in three national parks (Waterton Lakes, Banff and Jasper). On lands under provincial jurisdiction, they are managed under the Wildlife Act. Bears or their habitat are also protected in several large provincial parks and protected areas, especially those such as the Willmore Wilderness Park and parts of Kananaskis Country where motorized access is prohibited.
This status report was prepared to assist Alberta’s Endangered Species Conservation Committee in its re-assessment of the status of grizzly bears. It updates the 2002 status report (Kansas 2002) with new information on population estimates, population dynamics and habitat trends. That new information includes a major DNA-based population estimate, cutting-edge research on habitat use and trends in habitat availability, and recent analyses of the
population dynamics of grizzly bears in Alberta based on monitoring marked individuals and records of mortality. Sections of the 2002 report on the general biology and food habits of grizzly bear were updated only if relevant new information had become available.
This report defines the “Alberta population” of grizzly bears as including lands under direct provincial jurisdictions and portions of the national parks that were included in the DNA-based census grids. Demographic and genetic exchanges with bears in the unsampled portions of the national parks, B.C. and Montana will be considered insofar as they may affect the status of the Alberta population. Although some of the bears included in the DNA-based population estimates likely spend their entire lives inside Banff or Jasper national parks, the large home range of grizzly bears and the changes in density according to habitat and level of protection make it difficult and somewhat unhelpful to attempt to exclude bears in national parks from the population estimates.
HABITAT
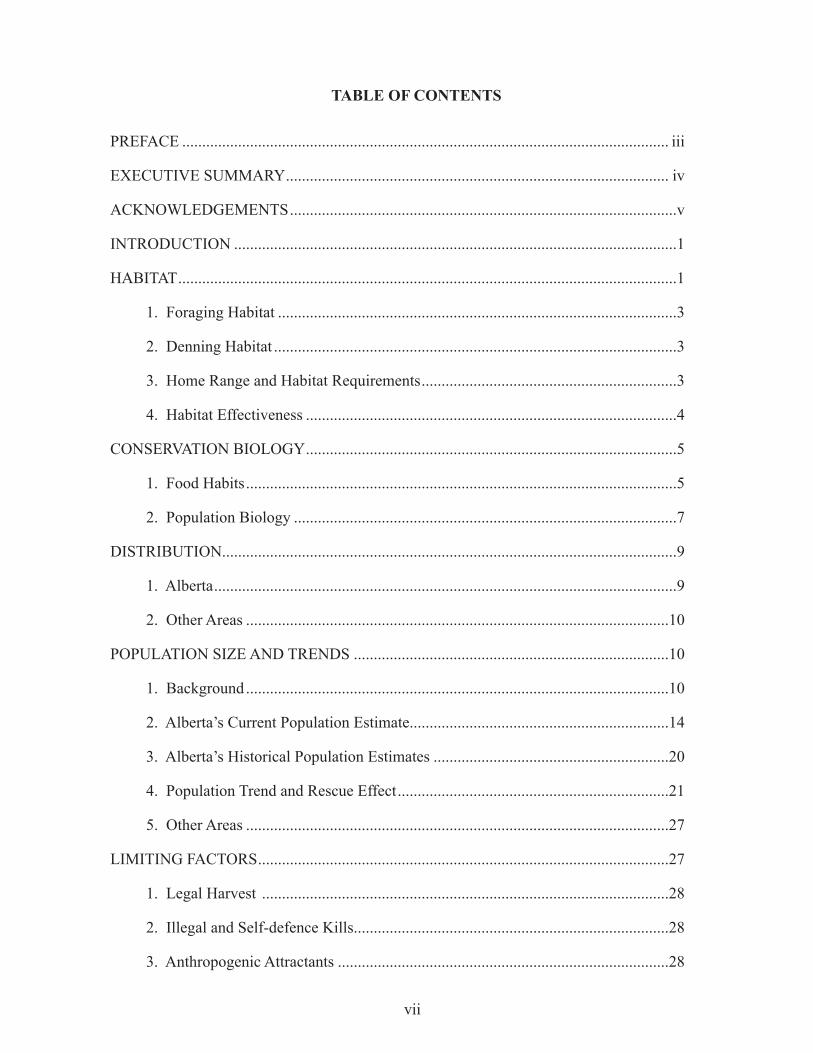
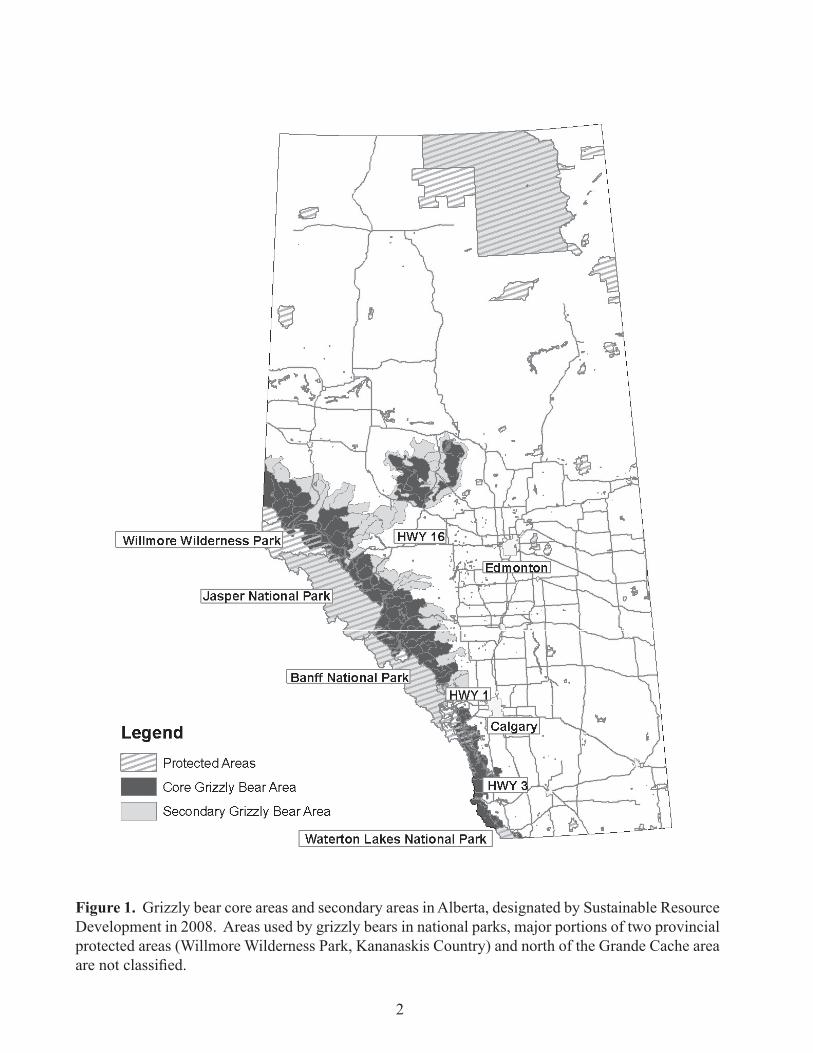
Current primary grizzly bear ranges include the Rocky Mountain Natural Region, as well as portions of the Foothills Natural Region and the Central Mixedwood Subregion of the Boreal Forest Natural Region in west-central and northwestern Alberta. Secondary ranges have low densities of bears, and may be used only by transient bears. These are generally closer to areas with higher density of human settlement (Figure 1). A key factor in grizzly bear habitat, however, is the distinction between habitat suitability and habitat security. Some habitats that provide adequate nutrition, and therefore appear suitable for grizzly bears, may offer no security; bears that use these areas suffer high risk of mortality from human causes. These habitats are ecological traps that attract bears because of the food rewards they offer, but because of human use they are characterized by a high risk of mortality (Nielsen 2005). Similar
�
Figure 1. Grizzly bear core areas and secondary areas in Alberta, designated by Sustainable Resource Development in 2008. Areas used by grizzly bears in national parks, major portions of two provincial protected areas (Willmore Wilderness Park, Kananaskis Country) and north of the Grande Cache area are not classified.
�
to many species whose range has decreased because of human activities (Lomolino and Channell 1995), grizzly bears in Alberta are not necessarily found in the best habitat, but rather where the chances of mortality are lower. The differences between “apparent” and “effective” grizzly bear habitat will be discussed after a summary of habitat preferences, first presented without accounting for the role of human-induced mortality.
1. Foraging Habitat - Grizzly bear use of habitat largely corresponds with the location of food sources (Nielsen et al. 2004a; Nielsen et al. 2004c), although females with cubs may avoid areas used by adult males (Wielgus and Bunnell 2000). The tendency to use areas with concentrations of high-quality foods can be modified by the level of human use, especially when cover is lacking so that bears are easily visible. Five main food groups compose most of the diet in all regions: (1) grasses, sedges and rushes; (2) forbs and their roots; (3) berries and pine seeds; (4) mammals, including ungulates and rodents; and (5) insects, including ants and wasps. Mountain and foothills habitats used by grizzly bears in early spring are dry, steep south- and west-facing subalpine grasslands overlying colluvial, residual and morainal landforms (Hamer and Herrero 1983). Poorly drained tufted hairgrass (Deschampsia cespitosa)-sedge (Carex spp.) meadows used by grizzly bears in early summer are found in moderate to high elevation valley bottoms (Hamer and Herrero 1983). Use of grasses, sedges and rushes in boreal regions is primarily during early summer (Nagy and Russell 1978) in sedge/hairgrass wetlands. Habitats most likely to support root-feeding activity in the Rocky Mountains and foothills are dry and mesic willow (Salix spp.)-dwarf birch (Betula glandulosa) shrub meadows (Hamer and Herrero 1983), well-drained south- to west-facing grasslands with loam-textured soils (Hamer 1996a), moist meadows and open forests near treeline (Raine and Riddell 1991). Roots and bulbs are less abundant in mixedwood boreal and foothills
environments (Nagy and Russell 1978, Nagy et al. 1989). In the boreal forest, most root-foraging habitat occurs along stream banks and channels. Wet streamsides in mature spruce forest, gully bottoms, groundwater seepage areas, wet meadows and fens, and disturbed sites such as roadsides are used in late spring and early summer. In midsummer, avalanche slopes, moist east- and north-facing slopes near treeline, moist gully bottoms, regenerating burns and clearcuts, and groundwater seepage areas are favoured by grizzly bears. These habitats support productive forage sources such as cow parsnip (Heracleum lanatum). Pipeline rights-of-way, roadside verges and other man-made clearings are also used extensively by grizzly bears during spring and early summer (Nagy and Russell 1978). By late July and early August, grizzly bears switch to berry feeding (Munro et al. 2006). Habitats that support these foods are mostly in semi-open, upland mesic forests and burned areas (Raine and Riddell 1991).
2. Denning Habitat - Grizzly bears in the Rocky Mountains prefer to den in habitats that support deep snow. Typical denning sites in Alberta have mean elevations of 2085 m to 2280 m, steep slopes ranging from 30% to 80%, and dominantly north- and east-facing aspects (Raine and Riddell 1991, Vroom et al. 1980). Den habitat preferences in the boreal forest are unknown.
3. Home Range and Habitat Requirements - Grizzly bears require large areas, and habitat productivity is negatively correlated with home range size. Adult males use much larger areas than adult females, likely to overlap the ranges of several potential mates. In Alberta, annual home ranges for females range from 152 km� to 2932 km�, and for males from 501 km� to 4748 km� (Eastern Slopes Grizzly Bear Project unpubl. data, Foothills Research Institute unpubl. data). Grizzly bears require a mix of seasonal habitats in their annual home ranges because of their varying seasonal food
4
sources. A bear that has access to forb-rich avalanche slopes, riparian areas with horsetail and productive berry crops within a small area should have a smaller home range than one in a landscape that is homogeneous with respect to vegetation and topography (Weaver et al. 1986).
4. Habitat Effectiveness - Human activities within grizzly range in Alberta affect the probability that grizzly bears will use some areas and, more importantly, that bears will survive in those areas (Nielsen et al. 2009). Human-induced habitat modifications are of two main types: changes in the age of forests, including an artificial spatial distribution of seral stages, and increased motorized access. Removal of mature timber leads to a predictable temporal series of seral stages of regenerating forests that can provide food to bears (Nielsen et al. 2004a; Nielsen et al. 2004c). Forestry operations, mining and hydrocarbon development lead to an increase in road density. Greater road access leads to a higher frequency of bear-human encounters and higher bear mortality, through accidents, poaching and kills or removals in defence of life and property, real or imaginary. Recent research in and around Yellowstone National Park found that the probability of human-induced mortality (85% of known mortality) was strongly related to land-use practices, particularly the ease of motorized access, and to the level of protection afforded to grizzly bears (Schwartz et al. 2006). There is evidence showing that grizzly bears change their movements and avoid trails heavily used by off-road vehicles (Graves 2002). Similarly, a review by Linnell et al. (2000) found that human activity near denning areas caused some species of bears to relocate their dens. Even within protected areas such as national or provincial parks, motorized access and other sources of human activity lead to human-caused grizzly bear deaths (Benn and Herrero 2002). Much grizzly bear habitat in Alberta cannot be considered secure, particularly south of Highway 16 (Nielsen et al. 2004b).
Early seral forests that develop after wildfires or the harvest of mature timber can improve grizzly bear habitat, if they lead to a more diverse habitat mosaic over the landscape. They provide berries and other vegetation eaten by bears, and they can lead to an increase in ungulate populations, increasing the availability of grizzly bear food (Nielsen 2005). In much of Alberta, because of fire suppression associated with forestry, clearcuts have replaced forest fires as the main forest disturbance within grizzly bear range. Recent clearcuts provide herbaceous foods and berry-producing plants such as wild red raspberry (Rubus idaeus), then as the forest succession process advances, clearcuts become a major source of hedysarum (Hedysarum sp.) roots and finally of other berry-producing plants (Nielsen et al. 2004c). Nielsen et al. (2004a) found that bears prefer clearcuts with low area:perimeter ratios, tend to remain close to the edges and use them mostly at night, all likely indications that grizzly bears using clearcuts attempt to avoid encounters with humans.
Clearcuts typically remain accessible to motorized vehicles, especially ATVs, after forestry operations end, so bears in these areas are at risk of encountering humans. Even temporary logging roads often stay open for a minimum of five years before being reclaimed (J. Jorgenson pers. comm.). Recent research in Alberta (Nielsen 2005) suggests that clearcuts are population sinks for grizzly bears. Although bears may find more food where mature forest has been removed, the high level of human access leads to apparently unsustainable mortality (Nielsen 2005). Nielsen et al. (2006) developed a classification scheme for areas potentially used by grizzly bears that combined available information from Alberta-based studies of both habitat selection and mortality risk. Their scheme recognizes that areas with habitat characteristics normally favoured by grizzly bears but located near roads or other sources of human activity become population sinks. Bears attracted to these areas are likely
5
to suffer high mortality; therefore, these areas are classified as “primary sinks.” High-quality habitats far from sources of anthropogenic mortality are recognized as “primary habitats”: here grizzly bear populations are expected to be self-sustaining. Areas with intermediate habitat quality and risk of mortality are classified as either “secondary sinks” or “secondary habitats,” whereas areas less likely to be utilized by grizzly bears (including former grizzly bear habitat irremediably altered by human activities) are classified as “non-critical habitat,” regardless of the mortality risk (Nielsen et al. 2006).
More recent research that examined bear movements in addition to habitat selection, confirmed that roads attract grizzly bears, probably because roads are associated with clearcuts that provide food resources (Roever et al. 2010). Bears monitored in the Yellowhead Unit (see Figure 2) moved more quickly when near roads and appeared to cross them frequently, independently of traffic volume. Roever et al. (2010) concluded that grizzly bears are often near roads because roads are associated with valley bottoms and clearcuts, landscape features that bears use for travel and foraging. Unfortunately, roads are also a source of grizzly bear mortality. New research, such as that completed by Roever et al. (2010) and Nielsen et al. (2006), can aid in better future road placement to avoid conflicts with bears. It also implies that bear mortality will be reduced by effectively reclaiming roads so that motorized access is prevented.
Because of increasing human activities, mostly forestry and hydrocarbon operations, much of the range of grizzly bear in Alberta is experiencing an increase in the proportion of primary sink habitat (Nielsen et al. 2008). Although the exact impacts of human activities on population dynamics are unknown, the weight of evidence in Alberta suggests that areas with high motorized access cannot sustain populations of grizzly bears. The research by
Nielsen and colleagues was based on habitat selection of radio-collared bears and on the distribution of mortalities. It evaluated relative mortality risk, but could not estimate mortality rates. As the proportion of altered habitat increases, however, it is inevitable that overall bear mortality rate will increase. Motorized access turns high-quality grizzly bear habitat, where populations may prosper, into population sinks where bear numbers decline. Bears are killed on roads by vehicles or are shot. Some are killed or removed because they are perceived as threats to life and property. The latter includes those shot during the fall ungulate hunting season when they are attracted to carcasses and gutpiles left by hunters (Haroldson et al. 2004). Although in some parts of the world, brown bears thrive despite high densities of roads (Swenson et al. 1998), in Alberta and elsewhere in Canada high road density is the single greatest threat to grizzly bears and their habitat. That is probably because in Canada bears are relatively visible and many people behave inappropriately toward bears when in grizzly bear range.
CONSERVATION BIOLOGY
1. Food Habits - Grizzly bears are omnivorous and their use of specific food items varies by season. Grasses and sedges are grazed primarily in May and June in the mountains and foothills (Hamer and Herrero 1983; Munro et al. 2006). The roots of several forbs are important foods during all seasons. In the front ranges of the Rocky Mountains in Alberta, grizzly bears make substantial use of both pink and yellow hedysarum (H. alpinum and H. sulphurescens) roots (Hamer and Herrero 1983, Wielgus 1986). Digging for hedysarum roots in the mountains and foothills is most extensive during spring and fall. In the southern Rocky Mountains of Alberta, grizzly bears increase consumption of glacier lily corms with reduced use of hedysarum (Raine and Riddell 1991). The stems, leaves and flowers of several succulent forbs are eaten during the growing season (early June to late
6
Figure 2. Grizzly bear population units in Alberta, as defined by Alberta Sustainable Resource Development. The Alberta North unit is not shown.
7
July). Preferred forb species in Alberta include common horsetail (Equisetum arvense), cow parsnip (Heracleum lanatum), mountain sorrel (Oxyria digna), and angelica (Angelica spp.). Other native forbs regularly eaten by grizzly bears include peavine (Lathyrus ochroleucus), American vetch (Vicia americana), arrow-leaved groundsel (Senecio triangularis) and sweet cicely (Osmorhiza spp.). Introduced forbs such as sweet clover (Melilotus alba), dandelion (Taraxacum officinale) and wild vetch (Astragalus spp.) are also eaten.
Throughout North America, fruits and conifer seeds, such as those of whitebark pine (Pinus albicaulis) are the preferred high-energy foods for grizzly bears during the late summer and the autumn pre-denning fattening period (Blanchard and Knight 1991, Hamer 1996a, Mattson et al. 1992). Berries are the primary fall food for grizzly bears in Alberta. The relative importance of whitebark pine seeds in the diet of grizzly bears in Alberta is unknown; however, the decline in this potential food resource (whitebark pine was recently listed as Endangered in Alberta) may be a concern. In the Front Ranges of the central Rocky Mountains, the most commonly eaten berry is the buffaloberry (Shepherdia canadensis). Other important berry-producing shrubs in Front Ranges are common bearberry (Arctostaphylos uva-ursi), velvet-leaf blueberry (Vaccinium myrtilloides), lingonberry (Vaccinium vitis-idaea), low bilberry (Vaccinium caespitosum), dogwood (Cornus stolonifera), and gooseberry (Ribes spp.) (Munro et al. 2006). The most commonly eaten berries in the Main Ranges of the Rockies are buffaloberry, blueberry (V. myrtillus) and tall bilberry (V. membranaceum). Important berry-producing shrubs in the boreal forest are velvet-leaf blueberry, low-bush cranberry (Viburnum edule), and bracted honeysuckle (Lonicera involucrata).
Animal protein, in Alberta primarily from ungulates, is crucial to the grizzly bear diet (Mowat and Heard 2006). Recent research
has shown that grizzly bears in some areas are major predators of young ungulates (Barber-Meyer et al. 2008; Munro et al. 2006; Testa et al. 2000; Young and McCabe 1997). In the Rocky Mountains and foothills of Alberta, grizzly bears primarily prey on newborn ungulates in spring (Hamer and Herrero 1991, Raine and Riddell 1991, Wielgus 1986), but predation on adult ungulates has also been documented (Côté and Beaudoin 1997). Ground squirrels are a large component of the grizzly bear’s diet in the Main Ranges of the Rocky Mountains (Raine and Riddell 1991). Ants and their larvae are the most common insects eaten, mainly in midsummer (Munro et al. 2006). In early autumn, grizzly bears rely on berries to acquire the majority of their fat reserves for hibernation (Hamer 1996a, Herrero 1985) and make heavy use of habitats that produce berry crops. In late autumn, digging of roots, such as Hedysarum, is also common (Munro et al. 2006).
2. Population Biology - Grizzly bears have a low reproductive potential relative to other large carnivores (Weaver et al. 1996), because of late primiparity (age of first reproduction), small litters and long interlitter intervals. Age of primiparity varies from four to eight years, and maximum ages of successful reproduction range from 20 to 28 years (Schwartz et al. 2003; Garshelis et al. 2005). In Alberta, grizzly bears have average litter sizes from 1.6 to 2.2 (Nagy and Russell 1978; Nagy et al. 1989). In the Bow River watershed, Garshelis et al. (2005) reported an average litter size of 1.84 (N = 38 litters). Analysis of data from radio-collared females monitored in various parts of Alberta, mostly from the Yellowhead, Clearwater and Grande Cache Units (see Figure 2), found that 32 litters in 1999–2009 averaged 1.87 cubs (range 1–3) (Boulanger and Stenhouse 2009). Interlitter intervals for Alberta grizzly bears were approximately four years in west-central Alberta (Nagy et al. 1989). In the Bow Valley, mean reproductive interval was 4.5 years (range 3 to 8 years) for females whose cubs survived to at least one year of age (Garshelis et al. 2005).
8
From 1994 to 2000, breeding females produced 0.24 female cubs/year. When juvenile mortality was taken into account, each mature female produced on average 0.172 females reaching independence per year, a recruitment rate lower than reported by most other studies of grizzly bears (Garshelis et al. 2005). A recent analysis of reproductive success by Boulanger and Stenhouse (2009) estimated an even lower reproductive rate of 0.20 female cubs/year based on 141 female-years of sexually mature females (Table 1).
Because of the low reproductive rate, the key to the persistence of grizzly bear populations is high survival, particularly for adult females. A review of 11 studies (Garshelis et al. 2005) suggested that cub survival ranged from 34% to 87% and varied widely across populations and among years for a population. As age increased from cub to adult, survival rates became progressively higher and less variable over time (Table 1). The survival of mature females varied from 90% to 98%. These survival rates were obtained from populations that ranged from slowly declining to increasing, with mean growth rates (λ) estimates from 0.96 to 1.09. Survival of adult females in the eight studies with stable or increasing populations ranged from 92% to 98%. In the three populations that appeared to be declining, adult female survival was 90%–93%. Studies of known-age grizzly bears have generally monitored few very old females; therefore, there is little evidence of survival senescence (old-age mortality). Long-term records from Yellowstone suggest that mortality rate of females increases after about 20 years of age (Boyce et al. 2001), but because most adult bears die from human-related causes, the documentation of “natural” survival senescence is problematic. Polar bears (Regehr et al. 2007) show a decline in the natural survival of females aged 20 years and older, and the same is probably true for grizzly bears (Schwartz et al. 2003). Male survival is substantially lower than female survival, and in some cases subadult males suffer greater
mortality than subadult females. Among adult males in the Bow Valley survival was about 86%–89% (Garshelis et al. 2005). A synthesis of long-term data on grizzly bear demography in the Greater Yellowstone ecosystem produced very similar results (Schwartz et al. 2006).
All studies of grizzly and brown bears underline the importance of maintaining very high survival of adult females to sustain populations (Boyce et al. 2001). This is particularly crucial for small populations: in the Bow Valley study, loss of just one more adult female per year would have likely led to a decline over the period of monitoring. Adult female survival has a much greater impact on population growth than fertility, litter size or juvenile survival (Garshelis et al. 2005; Schwartz et al. 2006). Small decreases in adult female survival will have drastic negative impacts on population growth. Moderate changes in litter size, cub survival or the proportion of females reproducing will have a much lower impact. A 2%–3% decline in adult female survival could be catastrophic, whereas the same decline in cub survival would have little impact on population growth rate. That does not mean that cub production is unimportant; inevitably, several years of low cub production or high cub mortality will lead to population declines. To ensure population persistence, it is essential to maintain human-caused mortality of adult females within sustainable levels. Two studies of grizzly bears in Alberta that produced an adequate estimate of adult female survival found that it was very high, at 95% (Table 1). Cub and subadult survival rates, however, were much lower north of the Bow River (mostly the Clearwater, Yellowhead and Grande Cache units) than in the Bow Valley area (Table 1).
Grizzly bears have low dispersal capabilities relative to other large carnivores (McLellan and Hovey 2001b; Weaver et al. 1996). Subadult females usually establish their home range within or adjacent to the maternal range (Nagy et al.1983, Blanchard and Knight 1991).
9
Neither sex defends a territory (McLellan 2005). A genetic analysis of parent-offspring pairs in Alberta and B.C. suggested that females move an average of only 14 km from their mother’s home range (95% confidence interval: 8.7–19.9), whereas males move on average 42 km from their father’s home range (95% confidence interval: 23.0–60.8) (Proctor et al. 2004). The strong philopatry of female grizzly bears leads to very slow recolonization of areas where populations have been depleted (Weaver et al. 1996) and limits the extent to which populations with unsustainable mortality rates can be rescued by immigration of bears from surrounding areas.
DISTRIBUTION
“Grizzly bear” is the common name used in North America for brown bears, whose range also includes portions of Europe and Asia (Servheen 1990). Brown bears historically
ranged through a much larger area from northern Africa to North America (Servheen 1990). Many brown bear populations outside North America have experienced severe habitat fragmentation, but some European populations are increasing (Swenson et al. 1998).
1. Alberta - The grizzly bear once occurred in parts of Alberta where it is now extirpated or transient. These areas include the Cypress Hills and the major river valleys in the prairies, such as the Peace, Bow, and North and South Saskatchewan. European settlement in the 1870s, resulting in agriculture, domestic livestock grazing, and the fur trade, led to extirpation of grizzly bears from these areas (Nielsen 1975). Most remaining grizzly bear range in Alberta is classified as either “core” or “secondary” (Alberta Sustainable Resource Development 2008). Core ranges are “areas of high habitat value and generally low mortality risk.” Secondary ranges are “areas of good
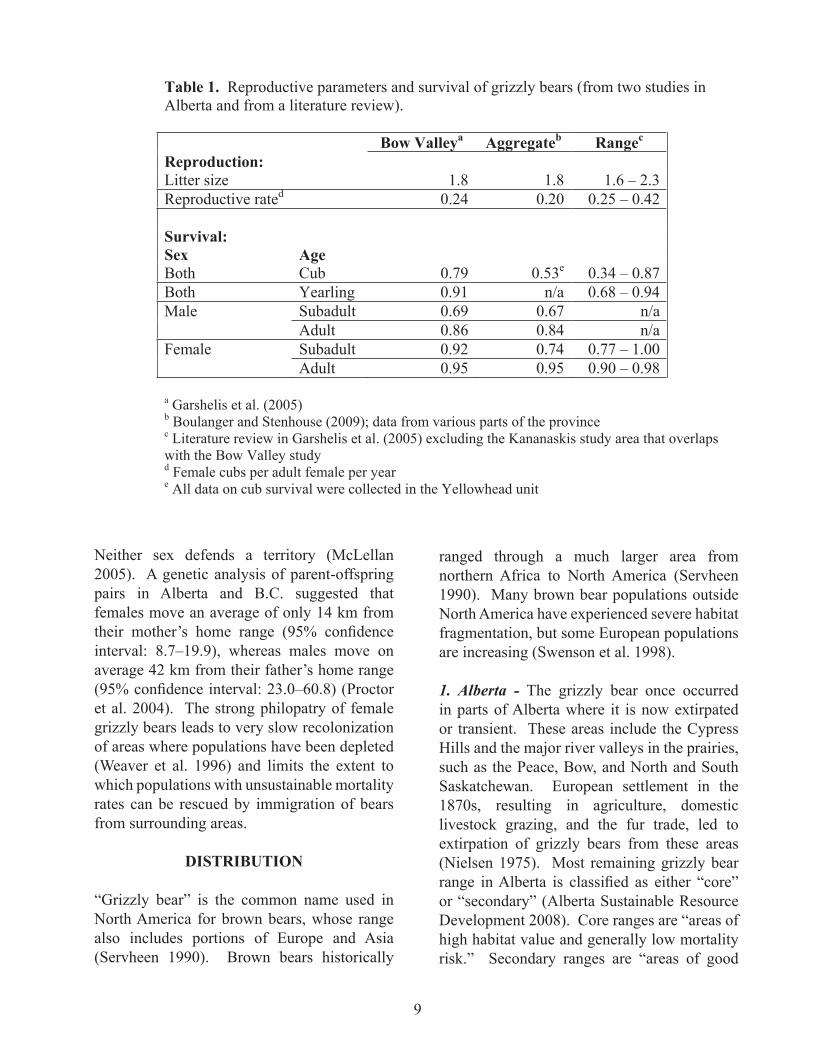
Table 1. Reproductive parameters and survival of grizzly bears (from two studies in Alberta and from a literature review).
Bow Valleya Aggregateb Rangec
Reproduction: Litter size 1.8 1.8 1.6 – 2.3 Reproductive rated 0.24 0.20 0.25 – 0.42 Survival:Sex Age Both Cub 0.79 0.53e 0.34 – 0.87 Both Yearling 0.91 n/a 0.68 – 0.94 Male Subadult 0.69 0.67 n/a Adult 0.86 0.84 n/a Female Subadult 0.92 0.74 0.77 – 1.00 Adult 0.95 0.95 0.90 – 0.98
a Garshelis et al. (2005) b Boulanger and Stenhouse (2009); data from various parts of the province c Literature review in Garshelis et al. (2005) excluding the Kananaskis study area that overlaps with the Bow Valley study d Female cubs per adult female per year e All data on cub survival were collected in the Yellowhead unit
�0
habitat, reflecting the broader range of grizzly bears” (Figure 1). The area of occupancy of grizzly bears in Alberta is about 112 000 km�, based on the number of occupied 350-km� grid squares. This assumes a continuous area of occupancy in Figure 3.
The Alberta population of grizzly bears can be considered a single genetic unit. A survey of the genetic diversity of Alberta grizzly bears suggested some regional differences in population genetic structure. Bears could be partitioned into five groups, but there was evidence of some exchanges of individuals among all neighbouring groups (Proctor 2004). Grizzly bears, particularly adult females, are reluctant to cross major highways, which can become barriers to gene flow and therefore to demographic rescue, as suggested by an analysis of genetic diversity in grizzly bears in B.C. (Proctor et al. 2005). It is reasonable to expect that in the absence of crossing structures available to and used by grizzly bears, major east-west transportation corridors such as Highways 3, 1 and 16 will become increasingly effective barriers to dispersal as traffic volumes increase. Despite limited genetic differentiation, different “subpopulations” of grizzly bears in Alberta could be demographically independent, particularly given major differences in the level of human-caused habitat alteration. The limited dispersal range of grizzly bears, particularly females (Proctor et al. 2004), implies that the number of bears in parts of the province could decline while numbers were stable or increasing in other parts.
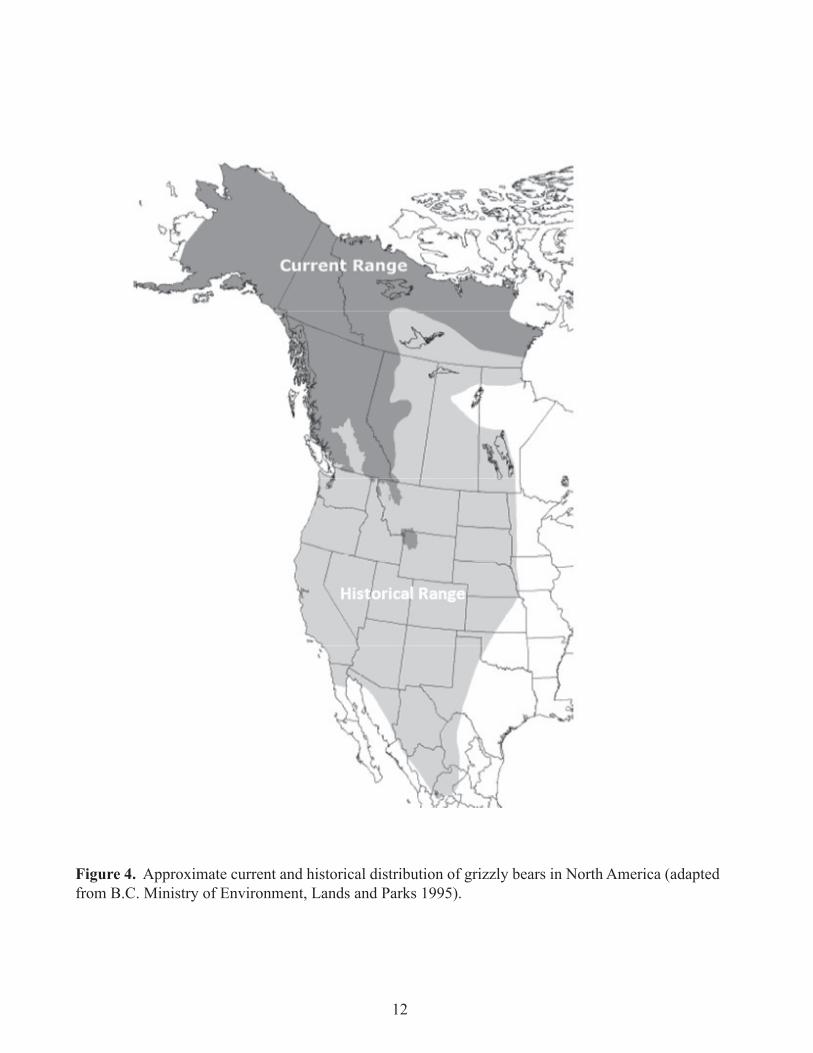
2. Other Areas - Grizzlies once roamed from the Pacific Ocean to the Mississippi River, and from Central Mexico to the Arctic. Extensive land clearing for agriculture and high-density human settlement led to the extirpation or substantial reduction of grizzly bear populations over large portions of their range (Nielsen 1975, Servheen 1990). The southern distribution of grizzly bears in North America is now restricted to relatively unsettled areas in the northwestern
United States. In the contiguous United States, the grizzly bear was eliminated from 98% of its historical range and now remains in five separate populations, four of which are contiguous with populations in Canada. In Canada, the grizzly is mostly restricted to relatively uninhabited portions of B.C., Alberta and the territories (Figure 4).
POPULATION SIZE AND TRENDS
1. Background - Assessing the population status and trend of grizzly bears is difficult, expensive, and must be done over tens of thousands of square kilometres. Because bears are generally secretive, occupy very large home ranges, and tend to avoid people, they are difficult to count. On the other hand, variability in habitat use (in some years, bears may spend more time where they can be seen) and in individual tolerance for humans can easily lead to false perceptions of bear abundance.
Grizzly bear numbers can decline quickly from overexploitation, but recover slowly following protection. That is because declines are usually caused by high mortality of adults, but recoveries rely on the production and multi-year survival of cubs. Because of the late age of primiparity and extended period of maternal care, a female cub born in Alberta this year will not herself recruit any independent juveniles unless she survives at least 8 years. It takes an instant to kill an adult female, but it takes many years to replace her. Even under the best environmental conditions and complete protection, the natural growth rate of grizzly bear populations rarely reaches 8% a year (Schwartz et al. 2006). Higher rates of growth have been reported for brown bears in Europe (Swenson et al. 1998; Swenson et al. 1997).
Population trends of grizzly bears are particularly difficult to assess, especially over the short term. Because even the best estimates have wide margins, multi-year monitoring is required to detect trends, especially for population
��
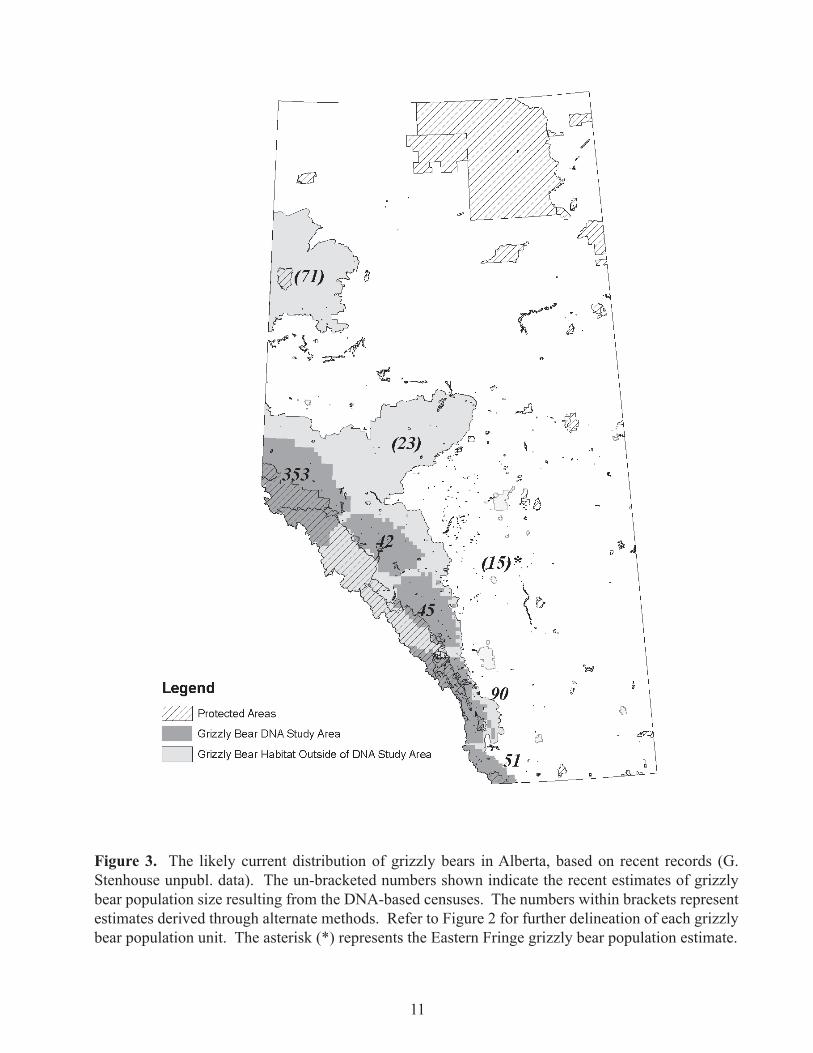
Figure 3. The likely current distribution of grizzly bears in Alberta, based on recent records (G. Stenhouse unpubl. data). The un-bracketed numbers shown indicate the recent estimates of grizzly bear population size resulting from the DNA-based censuses. The numbers within brackets represent estimates derived through alternate methods. Refer to Figure 2 for further delineation of each grizzly bear population unit. The asterisk (*) represents the Eastern Fringe grizzly bear population estimate.
��
Figure 4. Approximate current and historical distribution of grizzly bears in North America (adapted from B.C. Ministry of Environment, Lands and Parks 1995).
��
increases. That is because, although increases are typically of a few percentage points a year, rapid declines are possible if adult mortality is increased through human intervention.
Three techniques have been used to assess population size or trends of grizzly bears: capture-mark-recapture (CMR) studies that identify individual bears from DNA samples (Boulanger et al. 2006); demographic models based on life-history data from marked bears of known sex and age (Schwartz et al. 2006); and indices of relative abundance, such as the number of observations, particularly of family groups, in a given area (Brodie and Gibeau 2007). Direct observations require open habitat, and are unsuitable for forested areas. Indices of relative abundance are generally very imprecise, as they often cannot distinguish multiple sightings of the same individual, nor can they account for year-to-year variability in availability of different seasonal foods that make bears more or less visible, more or less active, or more or less likely to travel. An analysis of long-term data on public reports of females with dependent young suggested that indices of relative abundance have some potential to monitor population trends, but are extremely imprecise and useful only if accumulated systematically over many years (Brodie and Gibeau 2007). For example, a recent DNA-based CMR estimate in Montana, just south of the Alberta border, found more than twice as many bears as estimated from a time series of sightings of females with young (Kendall et al. 2009). On the other hand, in Yellowstone an index based on sightings of females with cubs collected systematically by trained observers over 14 years was able to detect an increasing population trend that was consistent with other data (Harris et al. 2007, Schwartz et al. 2006).
Unsystematic collections of sightings by the general public can document range extensions and timing of local extirpation, but are not useful for assessing population sizes or trends. They do not account for differences
in observer effort, for yearly variability in use of high-visibility habitats, or for skills in identifying bear species. Public reports are highly dependent on motorized access: an expanding road network could lead to more sightings of grizzly bears while simultaneously contributing to their decline through human-caused mortality. Similarly, increasing reports of bear-human conflicts can be due to greater encroachment by humans into bear habitat, and do not necessarily reflect an increasing bear population.
In Alberta, a collection of public reports of grizzly bear sightings was initiated by the Willmore Wilderness Foundation in 2008. A spreadsheet with 342 observations, for a total of 552 grizzly bears sighted was made available for this report (B. Bildson pers. comm.). After careful examination, it was concluded that it did not contain enough information to estimate population size or trend. These data are subject to the same limitations discussed above for other observation data. If continued over several years and accompanied by an attempt at structuring observations and accounting for observer effort, however, this grassroots initiative could become a source of information on possible changes in bear distribution and use of habitat where they are visible to people.
An historical estimate of approximately 6000 grizzly bears in Alberta in the 1800s (Herrero 1992) was based on the unrealistic assumption of at least one bear/100 km� across the entire province. Grizzly bears were likely absent from much of northeastern Alberta and pristine density likely varied substantially according to local productivity and other factors. We do not know how many grizzly bears were in Alberta at the time of European settlement: probably a few thousand, certainly many more than the current population, but likely fewer than 6000. Based on several radio-collaring studies that provided density estimates, and expert opinion to fill major gaps, the total grizzly bear population in 1988 (excluding national parks)
14
was estimated to be 575 (Kansas 2002). In the absence of any measure of error, however, the accuracy of that estimate is unknown.
2. Alberta’s Current Population Estimate: DNA-based Capture-Mark-Recapture (CMR) Estimates, 2004 to 2008 - Management of grizzly bears in Alberta is based upon seven “population units” (Figure 2). Between 2004 and 2008, bear numbers were estimated in five of these units using Capture-Mark-Recapture (CMR) techniques that relied on DNA samples to identify individual bears (Figure 3). Although this technique is based on a number of assumptions (Boulanger et al. 2006; Lebreton et al. 1992), it is superior to any previous attempt to estimate the number of grizzly bears. Despite minor changes in sampling procedures and in the data manipulations used to estimate population size in the different units, overall the technique was applied consistently over the majority of grizzly bear range in the province (Boulanger et al. 2005a; Boulanger et al. 2005b; Alberta Grizzly Bear Inventory Team 2007, 2009; Grizzly Bear Inventory Team 2008). The estimates accounted for possible sex differences in home range size and sampling probability, spatial differences in population density and for variability in the likelihood that individual bears may be sampled. The CMR estimates also include 95% confidence intervals (Table 2).
The DNA population estimates sum to 582 grizzly bears (Table 2). The overall confidence interval, approximated by adding the variances of each estimate and calculating a pooled standard error for all grids, suggests a range of 498-732 bears in the areas covered by the hair-sampling grids. The lower CI is closer to the mean estimate than the upper CI, partly because it takes into account the minimum number of bears known to be alive (White et al. 2000). To estimate the total number of grizzly bears in Alberta, two points must be discussed: the reliability of the DNA sampling technique, and the likely number of grizzly bears outside the areas sampled.
2.1 Summary of Techniques, Assumptions and Possible Biases of DNA CMR Estimates - The field, laboratory and statistical techniques used to obtain CMR estimates of grizzly bears in Alberta based on DNA samples are complex, requiring collaboration of many experts. Some techniques were adapted to the characteristics of each sampling unit, including its size, distribution of bear habitat and unit-specific information on movements and habitat selection of radio-collared bears. These techniques are described in detail in a series of technical reports, that clearly emphasize the limitations of the data, the steps taken to prevent biases and how possible differences in sampling probability were taken into account (Boulanger et al. 2005a; Boulanger et al. 2005b; Alberta Grizzly Bear Inventory Team 2007, 2009, Grizzly Bear Inventory Team 2008). What follows is a summary of those techniques and of possible sources of bias, to provide a basic understanding of how population estimates were obtained.
Sampling was generally restricted to June–July because later in summer grizzly bear movements tend to decrease, diminishing the probability that a bear would encounter a hair-snagging site. A substantial amount of experimentation preceded the Alberta DNA-based grizzly bear census, which also took advantage of the experience accumulated during earlier attempts to estimate grizzly bear populations (Boulanger et al. 2002; Mowat and Strobeck 2000). Earlier research compared field techniques and sampling strategies, such as the size of sampling cells, the placement of hair-snagging barbed wire, and whether or not to move bait sites between sampling intervals (Boulanger et al. 2006). A grid of 7-km x 7-km cells was overlaid to the sampling area. Within each grid, a sampling site was established by pouring a mixture of 2 litres of rancid cow blood and 1 litre of rancid fish liquid on a pile of wood debris and moss surrounded by a single barbed wire strand strung around three to six trees, approximately 50 cm above ground.
15
This technique attracts bears without providing a food reward (Woods et al. 1999). Hairs were collected from the barbed wire. After discarding those that were clearly not from grizzly bears, hairs were genotyped to identify individual bears. Over two months, there were four sampling occasions during which hairs were collected from the barbed wire. DNA profiles provide data on bear species (hairs that were obviously from black bears were not analyzed), identity and sex, but not on age.
Scent lures were placed in areas likely to be used by grizzly bears, based on local data from radio-collared bears and on recent studies of habitat selection of grizzly bears in Alberta (Nielsen 2005). The scent lures and hair traps were usually moved to a new location within the same grid square after each sampling period, because re-location of sampling station increases the capture rate, particularly for females (Boulanger et al. 2006). An exception to this procedure was in parts of the Grande Cache unit, because its very large size limited the ability of the field crew to move lures within the constraint of available budgets (Alberta Grizzly Bear Inventory Team 2009).
There is substantial genetic variability among grizzly bears in Alberta (Proctor 2004) and DNA analyses were based upon seven markers with substantial heterozygosity. The chance of two different bears being mistakenly identified as the same individual was extremely low (Paetkau 2003).
Each bear uniquely identified by its DNA provided a capture history over the four sampling intervals: at each interval a bear may or may not be “captured” by leaving hair on barbed wire. A capture was coded as 1 and a non-capture as 0. For example, a bear sampled in the first and last intervals would have a capture history of 1001, whereas one that provided a hair sample only in the third interval would have a history of 0010. The key feature of modern Capture-Mark-Recapture protocols is an estimate of capture probability based on the frequency with which known bears were captured (Lebreton et al. 1992). The calculation of capture probability allows an estimate of the number of bears present in the study area but not sampled, leading to a robust estimate of population size. The more bears that were only sampled once during the four sampling
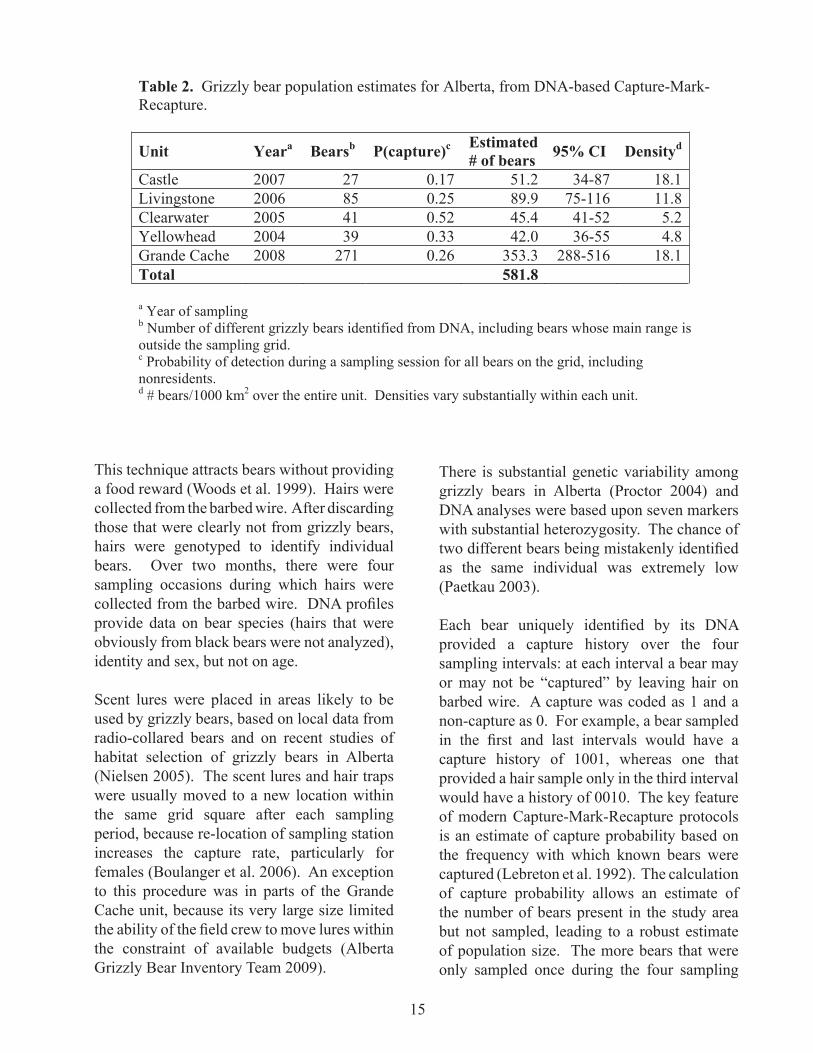
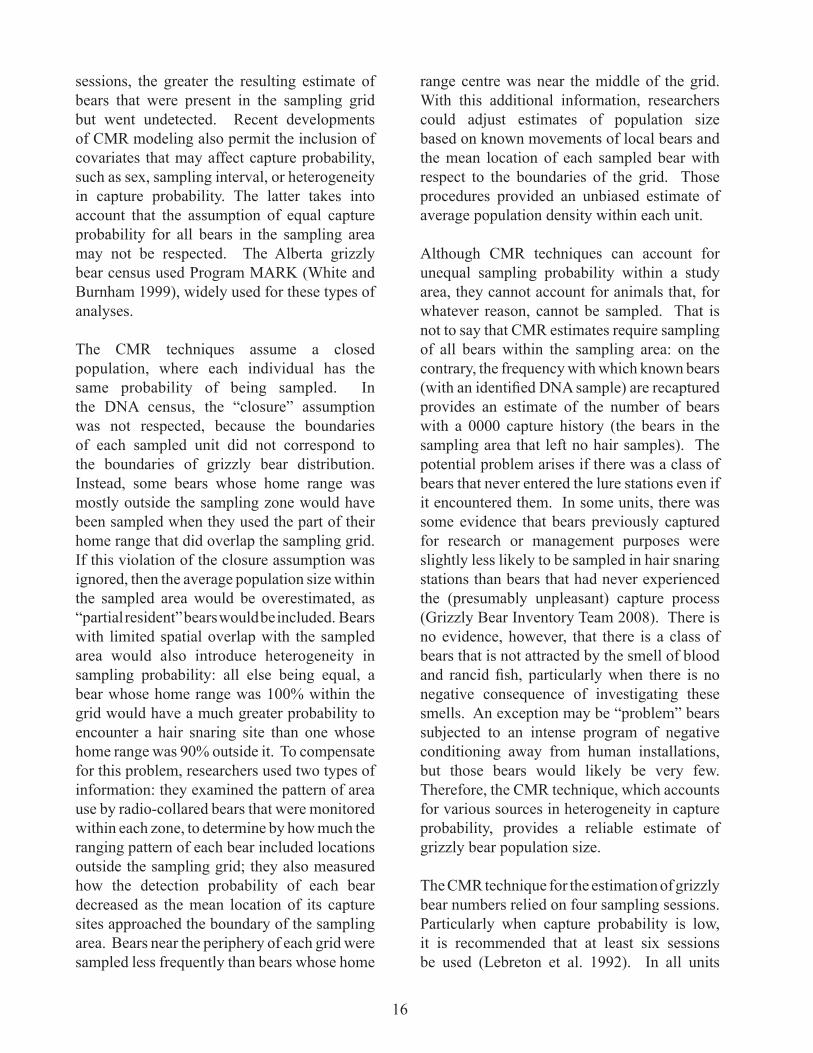
Table 2. Grizzly bear population estimates for Alberta, from DNA-based Capture-Mark-Recapture.
Unit Yeara Bearsb P(capture)c Estimated# of bears 95% CI Densityd
Castle 2007 27 0.17 51.2 34-87 18.1Livingstone 2006 85 0.25 89.9 75-116 11.8Clearwater 2005 41 0.52 45.4 41-52 5.2Yellowhead 2004 39 0.33 42.0 36-55 4.8Grande Cache 2008 271 0.26 353.3 288-516 18.1Total 581.8 a Year of sampling b Number of different grizzly bears identified from DNA, including bears whose main range is outside the sampling grid. c Probability of detection during a sampling session for all bears on the grid, including nonresidents. d # bears/1000 km2 over the entire unit. Densities vary substantially within each unit.
16
sessions, the greater the resulting estimate of bears that were present in the sampling grid but went undetected. Recent developments of CMR modeling also permit the inclusion of covariates that may affect capture probability, such as sex, sampling interval, or heterogeneity in capture probability. The latter takes into account that the assumption of equal capture probability for all bears in the sampling area may not be respected. The Alberta grizzly bear census used Program MARK (White and Burnham 1999), widely used for these types of analyses.
The CMR techniques assume a closed population, where each individual has the same probability of being sampled. In the DNA census, the “closure” assumption was not respected, because the boundaries of each sampled unit did not correspond to the boundaries of grizzly bear distribution. Instead, some bears whose home range was mostly outside the sampling zone would have been sampled when they used the part of their home range that did overlap the sampling grid. If this violation of the closure assumption was ignored, then the average population size within the sampled area would be overestimated, as “partial resident” bears would be included. Bears with limited spatial overlap with the sampled area would also introduce heterogeneity in sampling probability: all else being equal, a bear whose home range was 100% within the grid would have a much greater probability to encounter a hair snaring site than one whose home range was 90% outside it. To compensate for this problem, researchers used two types of information: they examined the pattern of area use by radio-collared bears that were monitored within each zone, to determine by how much the ranging pattern of each bear included locations outside the sampling grid; they also measured how the detection probability of each bear decreased as the mean location of its capture sites approached the boundary of the sampling area. Bears near the periphery of each grid were sampled less frequently than bears whose home
range centre was near the middle of the grid. With this additional information, researchers could adjust estimates of population size based on known movements of local bears and the mean location of each sampled bear with respect to the boundaries of the grid. Those procedures provided an unbiased estimate of average population density within each unit.
Although CMR techniques can account for unequal sampling probability within a study area, they cannot account for animals that, for whatever reason, cannot be sampled. That is not to say that CMR estimates require sampling of all bears within the sampling area: on the contrary, the frequency with which known bears (with an identified DNA sample) are recaptured provides an estimate of the number of bears with a 0000 capture history (the bears in the sampling area that left no hair samples). The potential problem arises if there was a class of bears that never entered the lure stations even if it encountered them. In some units, there was some evidence that bears previously captured for research or management purposes were slightly less likely to be sampled in hair snaring stations than bears that had never experienced the (presumably unpleasant) capture process (Grizzly Bear Inventory Team 2008). There is no evidence, however, that there is a class of bears that is not attracted by the smell of blood and rancid fish, particularly when there is no negative consequence of investigating these smells. An exception may be “problem” bears subjected to an intense program of negative conditioning away from human installations, but those bears would likely be very few. Therefore, the CMR technique, which accounts for various sources in heterogeneity in capture probability, provides a reliable estimate of grizzly bear population size.
The CMR technique for the estimation of grizzly bear numbers relied on four sampling sessions. Particularly when capture probability is low, it is recommended that at least six sessions be used (Lebreton et al. 1992). In all units
17
in Alberta, some previously unsampled bears were only detected in the fourth hair-snaring session (from 5% to 22%; average 18%). The limited number of sampling sessions, however, is unlikely to produce a systematic bias (i.e., consistently higher or lower) in the estimation of the number of bears: it mostly reduces the accuracy of the estimate, so that the 95% confidence interval is larger than with six sampling sessions. It was not possible to increase the number of sampling sessions because of logistic and financial limitations. In addition, the longer sampling season required to increase the number of capture sessions would require more complex modeling, to account for a reduction in hair capture rates that would be expected with the availability of berries and reduced movement rates of bears.
DNA does not inform on the age of bears, leading to two problems. First, there is some evidence that cubs are less likely to be sampled than adults (Kendall et al. 2009), possibly because they seldom approach the lure, or they slide under the wire without leaving a hair sample. That could lead to some unaccounted for heterogeneity in capture probability, so that a population with many cubs may provide a lower CMR estimate than a population of the same size but with fewer cubs. The second problem is that an understanding of the demographic trend of a grizzly bear population would be substantially improved by information on its sex-age structure (Coulson et al. 2008).
The possible underestimation of the number of cubs is unlikely to affect the results of the CMR population estimates, because cubs are usually a small proportion of a grizzly bear population (Garshelis et al. 2005; Schwartz et al. 2006). Growing populations should include a greater proportion of cubs than declining populations. A possible underestimate in the proportion of cubs, however, may affect the estimate of what proportion of the population is made up of mature bears (i.e., those able to reproduce).
The DNA-based CMR population estimates provide a scientifically defensible assessment of the number of bears in the parts of Alberta where the sampling was done. It included a substantial number of improvements in the technique, in terms of the sampling regime in the field (Boulanger et al. 2002), the attention given to the genetic analyses (Paetkau 2003) and data analysis (Boulanger et al. 2006). None of the shortcomings discussed above are likely to strongly bias the results, and the team of scientists that collected and analyzed these data used state-of-the-art molecular and statistical techniques (White et al. 2000). The team was aware of the potential pitfalls of closure violations and of heterogeneity in capture probability, and used recent CMR techniques to account for those problems. The techniques used in Alberta have been widely tested and generally found to be valid (Boulanger et al. 2006; Boulanger et al. 2002). A recent CMR exercise for grizzly bears in and around Glacier National Park in Montana led to an estimate that was more than twice what local managers had expected (Kendall et al. 2009). There is no evidence that the DNA-based census of Alberta grizzly bears produced an underestimate.
2.2 How Many Bears are Outside the DNA Sampling Grids? - There are three areas outside the national parks where DNA sampling was not conducted: a “fringe” area of foothills immediately east of the sampled areas, the Swan Hills, and the Alberta North unit (Figure 3). Of these, only the latter two may hold substantial numbers of grizzly bears.
2.2.1 Eastern Fringe – Within each DNA sampling unit, from the U.S. border to the Grande Cache unit, grizzly bear hairs were mostly found in the western parts. Grizzly density decreased from west to east, and there were very few captures in the easternmost 7 km to 14 km of each grid. Some bears appeared to reside along the eastern edge of the sampling areas, so that it is likely that part, perhaps most, of their home range was outside the grid.
18
Bears with home ranges completely east of the grid would not have been sampled. It seems highly unlikely that there would be grizzly bears with home ranges east of the Castle and Livingstone units. Those bears would be in agricultural lands with a high human density. The same can be said for the Clearwater unit, although recent maulings (including two fatalities) and depredations of livestock in the Sundre area show that grizzly bears do occur in the agricultural zone. Further north, there is an increasing potential that grizzly bears may reside east of the Yellowhead and Grande Cache units. Bears with home ranges mostly or entirely east of the DNA-sampling grids would face a very high risk of mortality from interactions with humans (Nielsen et al. 2006). For example, of three radio-collared bears from the Grande Cache unit that moved to within 40 km of the Swan Hills, two were killed illegally (Boulanger et al. 2009). There is no information about the area used by grizzly bears east of the DNA grids. Bears in this area may be transients that face a high risk of mortality and little chance to contribute to reproduction. In the absence of quantitative information, an additional 15 bears will be added to the provincial total to account for the so-called Eastern Fringe. There is no way to assess whether this estimate is reliable. Bear density in this area is likely extremely low. Assuming a low density of 4 bears/1000 km�, nearly 4000 km� of grizzly habitat would be required to maintain 15 bears east of the DNA grids.
2.2.2 Swan Hills – Since the initial research on grizzly bears in the Swan Hills in the 1970s (Nagy and Russell 1978), this area has undergone much industrial development. That early research already suggested that this population was in decline and recommended suspension of the sport hunt and a reduction in motorized access. The Swan Hills are now covered by a dense network of roads and clearcuts. Based partly on global positioning system (GPS) locations of seven bears in 2005–2007, Alberta Sustainable Resource
Development delineated 5322 km� of “core conservation area” and 6662 km� of “secondary” areas that appear to be currently used by grizzly bears in the Swan Hills. However, preliminary work to plan a DNA survey revealed that 58% of bear habitat is within 500 m of a road or other open access, leading to high mortality risk. An extrapolation from bear densities in comparable habitat in the Clearwater, Yellowhead and Grande Cache units, taking into account anthropogenic influences, estimated 23 grizzly bears (confidence interval 8 – 71) in the Swan Hills (see Boulanger et al. 2009). The very wide confidence interval suggests a less precise estimate than the DNA-based CMR assessments. In the absence of better information, this report will use the estimate of 23 bears for the Swan Hills population. Monitoring of radio-collared bears in both the Swan Hills (N = 8) and the Grande Cache area (N = 37) did not detect any movement between these two areas, although immigration may be essential to maintain the Swan Hills population.
2.2.3 Alberta North – Maps of grizzly bear distribution typically include a wide swath of northwestern Alberta from Grande Cache to the NWT border (Figure 4). Much of this area, however, is no longer available to grizzly bears because it is transformed through agricultural activities in the Grande Prairie – Peace River area. Further north, there are some grizzly bears, but their number is unknown. Based on recent information on grizzly bear mortalities and monitoring of radio-collared bears, it is likely that the actual grizzly bear range in Alberta is much smaller than suggested by Figure 4, and is limited to the areas indicated in Figure 3.
The 2002 status report (Kansas 2002) suggested a total of 141 grizzly bears in this part of the province (Bear Management Areas 1 and 2 in Table 1 of the 2002 report). Those numbers, however, were based on extrapolating assumed growth rates from a 1988 estimate of 104 bears that was itself based on little data. The assumptions made to extrapolate population
19
growth from that initial, unreliable, population estimate, have been criticized (Stenhouse et al. 2005) and likely led to substantial overestimates. For example, the 2002 status report suggested that there were 91 grizzly bears in the Yellowhead unit, while the 2004 DNA-based CMR estimated 53 bears, or 58% as many. Applying the same level of overestimate, the Alberta North population of 141 multiplied by 0.58 would be reduced to 82 bears. Alternatively, Stenhouse et al. (2005) obtained a population estimate for this area in 2004 by considering the initial 1988 estimate for Bear Management Units 1 and 2A (the current Alberta North unit), known grizzly bear deaths in these areas, and a population projection formula that accounted for carrying capacity and for more defensible estimates of both population growth rates and unreported mortality. Their modeling suggested that the small population in 2A should have been extirpated by about 1996, and numbers in area 1 would have stabilized at about 60 bears. The population in 2A did not disappear, and at least 16 human-caused deaths of grizzly bears were reported from this area in 1996–2002. Only five grizzly bears were captured in Alberta North in 2006–2008 and three more were identified from camera traps, despite substantial field effort (Boulanger et al. 2009).
Pre-moratorium sport harvests suggest that density in the Alberta North unit may be low. Between 2000 and 2005, 644 licensed hunters in Alberta shot 85 grizzly bears, a success rate of 13.2%. In area 2A, however, 128 licenses in 1988–2002 led to the harvest of five bears, a success rate of 4%. In area 1, a total of 543 licenses were sold and 36 bears harvested, for a success rate of 6.6%. Although many variables affect hunter success (including motorized access, habitat structure and visibility), the success rate within Alberta North was less than half that over the entire province.
In the near-absence of scientifically defensible information on the grizzly bear population in
the Alberta North unit, this report will assume a total of 71 bears, the average of the “discounted” estimate from the 2002 grizzly bear status report and the estimate by Stenhouse et al. (2005). This estimate is of unknown precision or reliability.
2.3 Total Provincial Population and Number of Mature Individuals - The DNA-based CMR estimates (Table 2) suggest a total of 582 resident grizzly bears in the sampling grids, with an approximate 95% confidence interval of 498-732. Adding the much less precise estimates suggested above for Eastern Fringe bears (15), the Swan Hills (23) and Alberta North (71), sums to 691 grizzly bears. No confidence interval can be calculated.
In Alberta, there is substantial variability in the age of primiparity, but it is reasonable to assume that, on average, females first reproduce at six years. Males mature at about the same age, but their reproductive success when young is likely very low as they are outcompeted by older males (Zedrosser et al. 2007). Based on individually marked bears in the Banff-Kananaskis region, Garshelis et al. (2005) suggested that 52% of females are mature. Using that estimate for both sexes, a population of 691 grizzly bears would include about 359 mature individuals. Even if one took the upper 95% “cumulative” confidence limit for the DNA-based CMR estimates and added the additional 109 bears estimated for the rest of the province, the total would be less than 850, suggesting at most 437 mature bears. It should be pointed out, however, that the estimate of the proportion of mature bears in Alberta suffers from a lack of data. It is unlikely that the sex ratio of bears older than 6 years is 1:1, as male mortality is generally higher than female mortality, and some evidence suggests that grizzly bears in Alberta have a young age distribution (Boulanger and Stenhouse 2009; Stenhouse et al. 2005), so that the 52% estimate may be too liberal. If one took the lower confidence interval for the DNA-based CMR estimate
�0
(498) and added a pessimistic estimate of 70 bears for the remainder of the province, then the minimum number of mature bears would be 295.
3. Alberta’s Historical Population Estimates - Because of changes in techniques, areas sampled, and assumptions about grizzly bear population dynamics, earlier estimates of population size in Alberta are difficult to compare to the estimates obtained from DNA-based CMR techniques. Consequently, it is impossible to calculate trends in population size by simply comparing time series of population estimates.
The grizzly bear was designated as a Fur-bearer in 1928. Until that time, harvest was essentially unrestricted. Although grizzly bears became a “big game animal” in 1929, protection was minimal until the 1950s, resulting in a further decline in numbers (Alberta Fish and Wildlife Division 1990). More protection was afforded in the 1960s, with more stringent hunting restrictions and harvest surveys. Hunting pressure was reduced in 1988 with the institution of a draw system and quotas specific for each Bear Management Area (BMA), replacing an open season with an unlimited number of permits. Systematic records of grizzly bear occurrences, mortalities and translocations have been kept since 1971. A provincial management plan in 1990 included the first population estimates for 21 BMAs. These estimates were based on extrapolations of population densities from field research studies available as of approximately 1989 (Nagy and Russell 1978, Nagy et al. 1989). Population densities of grizzly bears from field research were extrapolated over BMAs with similar ecological conditions, then adjusted based on measures of land surface disturbance (Pedocan Land Evaluation Ltd. 1984). The measured disturbance value was multiplied by two to take into account the large home ranges and mobility of grizzly bears and the projection of disturbance effects beyond the physically
disturbed areas (Alberta Fish and Wildlife Division 1990). Total surface disturbance values used for BMAs averaged 45%.
The population estimates produced in 1988 are similar to the DNA-based CMR estimates obtained between 2004 and 2008. However, the areas of the two estimates are not directly comparable because the spatial definition of most units changed. From 1988 to about 2004, the population estimates were updated annually based on known translocations and mortalities, estimated net immigration and assumed population growth (Gunson 1996). Population growth was calculated as 6% per year minus known human-caused mortality (increased by 25% to account for unknown mortality). Early simulations of grizzly bear population dynamics suggested that 6% to 6.5% human-caused mortality rate would not cause a decline for a population of several hundred bears (Harris 1986, McLellan et al. 1999). Therefore, a population with no known human-caused mortality in one year was assumed to increase by 6%. Recent research that better accounts for stochastic variation in vital rates and uncertainties in population estimates, however, suggests that grizzly bear populations are unlikely to sustain harvests exceeding 5% in highly productive habitat, and 3% in habitats of medium productivity such as most of those in Alberta (McLoughlin 2003). In low-productivity habitats, any human-caused mortality may lead to a decline. The 1988 baseline population estimate was based on the best available data and appears defensible, but the subsequent adjustments were optimistic.
Invalid assumptions about sustainable harvest rates and levels of unreported human-caused mortality led to the perception of an increasing grizzly bear population in much of Alberta (Kansas 2002). Unfortunately, the population projections assumed unlimited exponential growth, ignored the carrying capacity of grizzly bear habitat, did not account for possible wounding losses during the hunting season,
��
and underestimated the extent of human-induced mortality, as revealed by a critical analysis of allocation strategies for hunting quotas (Stenhouse et al. 2005). That analysis suggested that many populations subjected to sport harvest on the assumption that they were stable or increasing were likely declining. The assumption of 25% undetected human-caused mortalities is unrealistic, because 34%–46% of human-caused mortalities might be missed unless bears are equipped with radio collars (McLellan et al. 1999). Particularly in the case of illegal kills, even a radio collar is no guarantee of recovery or of ability to identify cause of death.
Nearly all grizzly bear mortality is caused by humans. For example, within Banff and Yoho national parks, 91% of known deaths of grizzly bears in 1971–1998 were caused by humans (Benn and Herrero 2002). Natural mortalities are much less likely to be documented than those caused by humans, especially for unmarked bears. All studies of radiocollared grizzly and brown bears report that the vast majority of deaths of bears aged one year and older are caused by humans (Bischof et al. 2008; Mattson and Merrill 2002; McLellan et al. 1999; Schwartz et al. 2006), even in national parks. In three years of the sport-hunting moratorium (2006–2008), known deaths in Alberta averaged 14/year, substantially less than over the previous six years (2000–2005) when hunting was allowed (29 known deaths/year). Over the previous 28 years (1972–1999) recorded deaths averaged 33/year, and many more known deaths (average of 40/year) occurred before a draw was instituted for hunting permits in 1988 (average of 23 deaths/year in 1988–1999).
4. Population Trend and Rescue Effect - The DNA-based CMR analyses provide a point estimate of population size in much of Alberta, but cannot be used to infer a trend in numbers as there are no reliable earlier estimates. An earlier attempt to use DNA techniques to
census bears in southwestern Alberta (Mowat and Strobeck 2000) is not comparable with the more recent counts because the study area overlapped parts of the Castle and Livingstone units, and technical problems such as lack of closure were not properly accounted for (Boulanger and Stenhouse 2006). The average density of 14.7 bears estimated by the earlier study is between the more recent estimates for the Castle and Livingstone units.
4.1 Measures of Population Trend - The only published estimate of population growth rate for grizzly bears in Alberta is by Garshelis et al. (2005) for the Bow River drainage, including a large section of Banff National Park and parts of Kananaskis Country. Based on 71 marked bears and nine years of monitoring, they estimated a slightly increasing population (λ = 1.04, 95% CI = 0.99–1.09) using Leslie matrices. They emphasized that any increase in adult female mortality over what they recorded would lead to a decline in numbers.
In one area studied by the Foothills Research Institute Grizzly Bear Program in western Alberta (mostly in the Yellowhead and Grande Cache units), a sample of 153 radio-collared bears monitored over a 10-year period suggested that the survival of adult females was very high (95%), the production of female cubs was similar to that reported for the Bow Valley (0.24 vs. 0.23 female cubs/adult female/year), but the yearly survival of all other sex-age classes (cubs, subadults of both sexes and adult males) was 5%–16% lower than that reported by the Bow Valley study (Boulanger and Stenhouse 2009). Consequently, it is reasonable to assume that the grizzly bear population within the study area was declining during this short-term study. A simple multiplication of the yearly rate of production of female cubs (0.20) times cub survival (0.53) times four years as a subadult (yearly survival of 0.74 for females) suggests that the yearly recruitment of five-year-old females was 0.032/adult female/year: each adult female would require on average 31
��
years of reproduction to replace herself. This simple analysis ignores any stochastic effects of temporal variability, which would lower the population growth rate. It suggests that during this study the sampled population was likely declining, as female bears rarely survive to 35 years and stop reproducing after about age 28 (Schwartz et al. 2003). Most of the monitored bears were in areas severely affected by human-induced mortality brought about by high road access (Nielsen et al. 2004b; Nielsen et al. 2006). One result of this analysis that is particularly relevant to an evaluation of the status of grizzly bear in Alberta, is that cub survival rate increased with the proportion of the mother’s home range that was within protected areas, directly linking habitat protection with population dynamics.
Some of the vital rate estimates from this research likely suffer from a positive bias. First, researchers assumed that loss of contact with a radio-collared bear meant that the collar had failed. In some cases, however, a bear may have been poached and the collar destroyed. If that was the case, survival for adults and subadults would have been lower than the estimate provided. Second, the cub survival estimate does not represent survival from birth to one year of age, but rather from den emergence to autumn. A cub that died in late autumn would have been assumed to have survived to one year of age. It is likely that actual cub survival for the monitored sample of bears was less than 53%.
4.2 Inferred Population Decline - Recent population estimates clearly point out that grizzly bear density in Alberta is negatively correlated with the level of human access. From Highway 16 south to Highway 1, where much of grizzly bear habitat has been affected by human activities, there are few bears. In the Grande Cache unit, particularly in its western parts that are protected by the Willmore Wilderness Park and Jasper National Park, there are more bears than elsewhere in the province. Those
major differences in density provide strong support for the argument that habitat alteration through forestry, mining and hydrocarbon development cause a decline in grizzly bear numbers. That decline appears to be a result of unsustainable human-caused mortality that follows the development of a road network. Detailed analyses of the distribution of known grizzly bear mortality in Alberta reveal that habitat alteration and increased motorized access lead to high mortality of grizzly bears (Nielsen 2005; Nielsen et al. 2004b; Nielsen et al. 2006). An analysis of the fate of radio-collared bears and their cubs also suggests that mortality increases with the proportion of a bear’s home range that could bring it into contact with humans (Boulanger and Stenhouse 2009). An apparent exception to this trend is the relatively high bear density in southwestern Alberta, including the Livingstone unit and particularly the Castle unit, which has the same estimated density as the Grande Cache unit (Table 2). Although parts of these units have a substantial road network, three reasons may contribute to their relatively high bear density. First, an aggressive program to control human behaviour and to discourage bears from using areas of high human use in much of this area may have reduced the level of human-caused bear mortality in recent years (J. Jorgenson pers. comm.). Second, much of this area is protected in national and provincial parks, or is subject to seasonal or year-round road closures, as in much of Kananaskis Country. Third, the Castle and Livingstone units are a narrow strip of bear habitat, often only wide enough for two bear home ranges (Figure 2), adjacent to an area of B.C., the Flathead and Elk River valleys, which have high grizzly bear density (Grizzly Bear Inventory Team 2008). Therefore, grizzly bear populations in these areas may receive some immigration from B.C. and Montana, where the bear population in and around Glacier National Park may have recently increased (Kendall et al. 2009).
��
Given that human activities in grizzly bear range are increasing, it is likely that the population of grizzly bears in parts of Alberta is currently declining. However, the overall trend of the provincial population of grizzly bears is unknown. It is highly likely that population trends in different parts of the province differ: in areas with protected habitat, populations are likely stable. A population viability analysis (see section 4.2) on the only comprehensive demographic information available suggests that the population in the Yellowhead unit is in decline. Changes on the landscape suggest negative impacts to bear habitat, and these negative trends may be responsible for a population decline, but that would only be determined after another round of DNA census work.
The closure of sport hunting in 2006 likely reduced the level of human-related mortality in parts of the province. The number of known human-induced deaths of grizzly bears decreased from an average of 27 in 2000–2005 to 13 in 2006–2008. Much of the hunting mortality in recent years was in the Grande Cache unit: harvests in management units 4A, 3A and 2B, which roughly correspond to that unit, accounted for 39 bears killed by hunters in 1998–2002, or 48% of the total legal harvest. Probably because of fewer human-induced alterations than the rest of grizzly bear habitat in Alberta, it appears that over the last few decades, the Grande Cache unit has held an increasing proportion of the provincial population.
Another way to assess a likely trend in numbers of grizzly bears in Alberta involves calculating the population size that could sustain the current known human-caused mortality. The Alberta Grizzly Bear Recovery Plan (Alberta Grizzly Bear Recovery Team 2008), based on simulations by McLoughlin (2003), assumes that the provincial population can sustain up to 4.9% of human-caused mortality a year. McLoughlin (2003) calculated 4.9% as the
maximum sustainable annual human-caused mortality in optimum habitat, where bears have a high reproductive rate. Research in Alberta, however, shows that grizzly bears in much of the province have a low reproductive rate (Boulanger and Stenhouse 2009; Garshelis et al. 2005), suggesting that the maximum human-caused mortality rate of 2.8% estimated by McLoughlin (2003) for moderate habitats may be worth considering. In addition, a sustainable mortality rate based on the total number of bears killed and the total estimated population does not account for the substantial differences in how mortality in different sex-age classes affects population growth (Schwartz et al. 2006). The death of a young breeding female would have a much greater impact on population dynamics than the death of a cub or of a subadult male.
The known human-caused mortality of grizzly bears in the three years after the start of the hunting moratorium averaged 13 per year. Increasing it by 40% to account for unreported mortalities (McLellan et al. 1999), and adding a 30% mortality of the average of 9 bears per year relocated within the province (Grizzly Bear Inventory Team 2008), suggests 21 human-caused mortalities per year, or just over three percent of the estimated population of 691 bears. Given the large number of uncertainties involved, the precautionary approach is to conclude that currently the population is likely slowly declining and may not sustain any additional human-caused mortality. The uncertainties involved in this calculation are many: we do not know how many bears are killed by humans but unreported, the estimate of sustainable mortality is uncertain and does not account for differences in how the sex-age class of killed bears affects population growth, future human-caused mortality will likely increase as the road network expands, and the estimate of Alberta’s total population itself is uncertain because there are no DNA-based estimates for parts of the province. There is no information on the sex-age structure of
24
unreported mortalities. Finally, there is little utility in considering grizzly bears in Alberta as a single demographic unit: additional mortality in the area between Highways 1 and 16, for example, will affect bears in the Clearwater and Yellowhead units, but will have no effect on bears in southwestern Alberta or north of Highway 16.
An analysis of the impact of human-caused mortality at the provincial scale is not particularly useful because conservation status and population abundance vary widely over grizzly bear range in Alberta. The DNA-based estimates revealed that grizzly bears in the Grande Cache Unit are at higher density than most other areas in the province. In units farther south, which are more affected by habitat alteration and have smaller numbers of grizzly bears, it is likely that any human-caused mortality may be unsustainable (McLoughlin 2003).
Because of the limited dispersal of grizzly bears (McLellan and Hovey 2001b), particularly females, high mortality in areas south of Highway 16 is unlikely to lead to greater immigration from elsewhere with the possible exception of the Castle and Livingstone units. The DNA-based CMR estimates suggest a total of about 228 bears south of Highway 16. If one assumes a maximum sustainable rate of 2.8%, that leads to a tolerable mortality of six bears a year. Human-caused deaths of more than two or three adult females a year south of Highway 16 could be enough to lead to a slow decline (Table 3).
The recent DNA-based population estimates suggest that, as proposed by Stenhouse et al. (2005), in the last few years of the legal hunting season, some areas may have been overharvested. For example, in the Yellowhead unit, the harvest of 7 bears in 2004–2005 suggests a 8.3% harvest rate based on a population of 42 bears. In the Swan Hills, the recorded harvest of two bears
would have represented a 4.3% harvest rate. Within these small local populations, the age-sex composition of the harvest would play an important role on their expected rate of decline. Removal of only 1-2 females a year from local populations of less than 50 bears could have a detrimental effect.
4.2.1 Population Viability Analysis - A population viability analysis (PVA) (McLoughlin et al. 2005) was performed in November 2009 by P. D. McLoughlin (Department of Biology, University of Saskatchewan) using the program Riskman (http://riskman.nrdpfc.ca/riskman.htm) based on data from Boulanger and Stenhouse (2009). The analysis assumed a starting population of 691 bears and these demographic parameters: proportion of females having cubs if not nursing a previous litter of 0.42 at age four and 0.545 for older ages; average litter size at birth of 1.765 cubs, with the following proportions: 0.294 with one cub, 0.647 with two cubs, 0.059 with three cubs; 50:50 sex ratio at birth and maximum age of 30 years. Generation time was 12 years. Harris and Allendorf (1989) calculated 10 years and Garshelis et al. (2005) arrived at a generation time of 13 years, but precise calculation of generation time (the average age of breeding females) is difficult because few data are available and most bears die prematurely from human causes. Based on 2000 simulations, the Riskman analysis estimated a geometric mean λ of 0.958 (SE = 0.015) and projected a 98.6% risk of population decline by 30% or more over the next three bear generations (36 years).
That simulation suggests a population decline of just over 4.4% a year. The applicability of this analysis over the entire provincial population is uncertain, because the vital rates used in the simulation were obtained from a restricted part of grizzly bear distribution, and one that likely suffers high mortality rates because of habitat alteration. Although the analysis may reasonably estimate the current
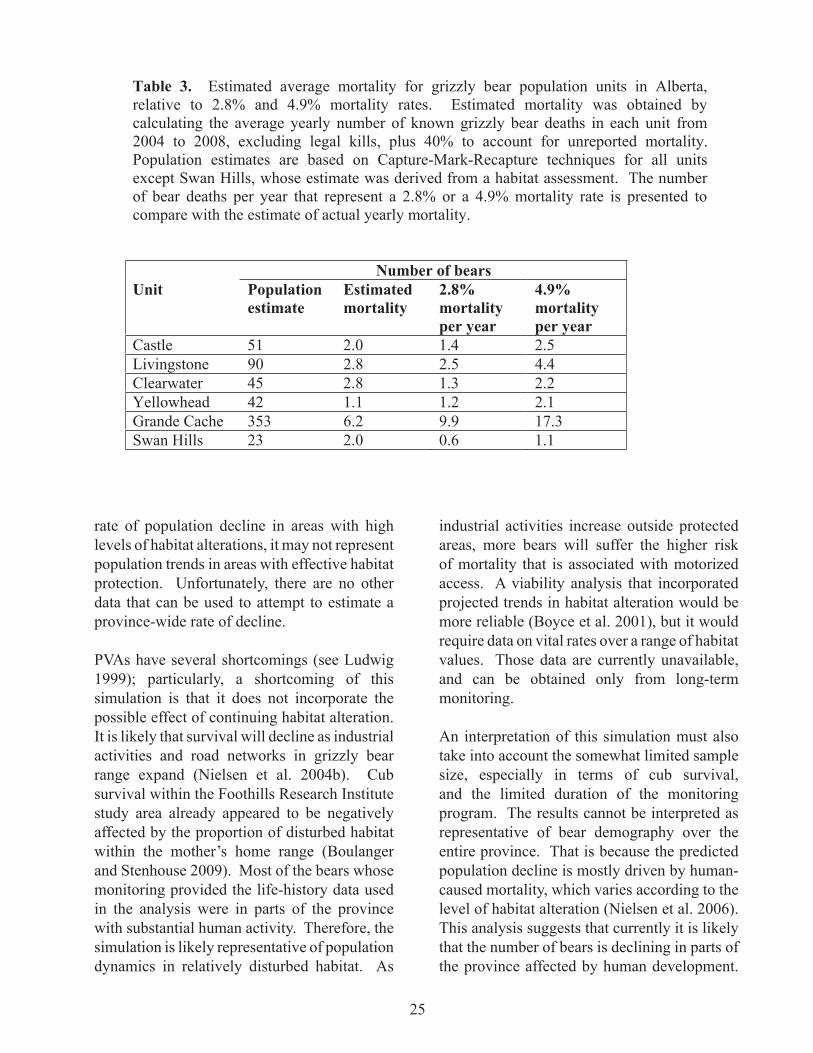
25
rate of population decline in areas with high levels of habitat alterations, it may not represent population trends in areas with effective habitat protection. Unfortunately, there are no other data that can be used to attempt to estimate a province-wide rate of decline.
PVAs have several shortcomings (see Ludwig 1999); particularly, a shortcoming of this simulation is that it does not incorporate the possible effect of continuing habitat alteration. It is likely that survival will decline as industrial activities and road networks in grizzly bear range expand (Nielsen et al. 2004b). Cub survival within the Foothills Research Institute study area already appeared to be negatively affected by the proportion of disturbed habitat within the mother’s home range (Boulanger and Stenhouse 2009). Most of the bears whose monitoring provided the life-history data used in the analysis were in parts of the province with substantial human activity. Therefore, the simulation is likely representative of population dynamics in relatively disturbed habitat. As
industrial activities increase outside protected areas, more bears will suffer the higher risk of mortality that is associated with motorized access. A viability analysis that incorporated projected trends in habitat alteration would be more reliable (Boyce et al. 2001), but it would require data on vital rates over a range of habitat values. Those data are currently unavailable, and can be obtained only from long-term monitoring.
An interpretation of this simulation must also take into account the somewhat limited sample size, especially in terms of cub survival, and the limited duration of the monitoring program. The results cannot be interpreted as representative of bear demography over the entire province. That is because the predicted population decline is mostly driven by human-caused mortality, which varies according to the level of habitat alteration (Nielsen et al. 2006). This analysis suggests that currently it is likely that the number of bears is declining in parts of the province affected by human development.
Table 3. Estimated average mortality for grizzly bear population units in Alberta, relative to 2.8% and 4.9% mortality rates. Estimated mortality was obtained by calculating the average yearly number of known grizzly bear deaths in each unit from 2004 to 2008, excluding legal kills, plus 40% to account for unreported mortality. Population estimates are based on Capture-Mark-Recapture techniques for all units except Swan Hills, whose estimate was derived from a habitat assessment. The number of bear deaths per year that represent a 2.8% or a 4.9% mortality rate is presented to compare with the estimate of actual yearly mortality.
Number of bears Unit Population
estimateEstimatedmortality
2.8% mortalityper year
4.9% mortalityper year
Castle 51 2.0 1.4 2.5 Livingstone 90 2.8 2.5 4.4 Clearwater 45 2.8 1.3 2.2 Yellowhead 42 1.1 1.2 2.1 Grande Cache 353 6.2 9.9 17.3 Swan Hills 23 2.0 0.6 1.1
26
In the more protected parts of grizzly bear range, such as the western sections of the Grande Cache unit and the larger national and provincial parks, bear populations may be stable. Over time, those protected areas will harbour an increasing proportion of the provincial population of grizzly bears. Consequently, the rate of decline should decrease as the population shrinks in both size and area of occupancy. There will likely be fewer bears, but because a greater proportion will be in protected areas, the remaining population should experience a lower rate of decline. On the other hand, in the next few decades, an increasing proportion of the eastern and central parts of the Grande Cache unit are expected to experience increasing industrial activities (West Central Alberta Caribou Landscape Planning Team 2008). This will lead to a denser road network, greater motorized access and, very likely, a decline in numbers of grizzly bears unless efficient measures are implemented to reduce human-caused mortality.
4.3 Rescue Effect - COSEWIC defines rescue effect as the “immigration of … individuals that have a high probability of reproducing successfully, such that extirpation or decline of a population…can be mitigated. If the potential for rescue is high, the risk of extirpation may be reduced (URL: http://www.cosepac.gc.ca/eng/sct0/assessment_process_e.cfm#tbl6).” In other words, successful rescue requires that individuals disperse into Alberta, and survive there.
Some individual grizzly bears have home ranges that span the borders between Alberta, B.C. and Montana. These bears, however, contribute to the current Alberta population but not to a rescue effect, which depends on immigrant bears originating from outside the province. The population estimates based on DNA sampling account for these “partial resident” bears according to the proportion of their home range thought to be in Alberta, based on available radiotelemetry information.
Although grizzly or brown bears rarely disperse over long distances (Proctor et al. 2004; Swenson et al. 1998), some may immigrate into Alberta from the national parks, B.C. or Montana. Individual bears move between Alberta and B.C. (Grizzly Bear Inventory Team 2008), but immigration rates have not been quantified. Immigration may contribute to the persistence of the Alberta population and to the maintenance of its genetic diversity, if immigrating bears survive and reproduce. For example, the Flathead Valley in B.C., just to the west of the Castle unit, has a high density of grizzly bears (McLellan and Hovey 2001a), but recent information suggests this population has been in decline for the past decade (McLellan 2008). There is a dense population just to the south in Montana (Kendall et al. 2009). On the other hand, populations in Banff and Jasper national parks are unlikely to be a major source of immigrants because they appear to have low productivity (Garshelis et al. 2005) and, especially in Banff, suffer high human-induced mortality (Bertch and Gibeau 2009). In much of Alberta, however, immigrating bears would face the same high risk of mortality as resident bears, because of habitat alteration through road development. The only exception is the Grande Cache unit, where some immigrant bears could easily settle. That unit currently appears to have no need for demographic rescue, particularly on its western half, near the likely source of immigration. However, there is ongoing industrial development in the Grande Cache unit (Environment Canada 2008; Smith 2004). There is little reason to expect that a rescue effect may improve the current conservation status of grizzly bears in Alberta.
Michael Proctor has studied movements and population genetics of grizzly bears in Alberta and B.C. for many years (Proctor et al. 2004; 2005). He provided this assessment of the potential for rescue: “There is direct evidence of movements of male and female grizzly bears across the Continental Divide between B.C. and Alberta. There is more movement south
27
of Highway 1 to the U.S. border than north of Highway 1 where icefields are extensive along the Divide. North of Highway 16 the evidence is of genetic interchange, not direct movement of marked bears. Movement between the provinces may improve densities in some populations in Alberta. This may occur to some extent in some areas south of Highways 1 and 3. Here the east-west depth of the Alberta distribution is narrow and several bears use habitat from both provinces. Due to higher productivity within B.C., grizzly bear densities are higher than those in Alberta and the use of productive habitat within B.C. may confer some advantage to a portion of Alberta’s grizzly bears in these regions. For any potential immigrants into Alberta to translate into demographic rescue of extirpated, imminently endangered, or current populations, it would require a suitable supply of quality, secure habitat and effective mortality management” (M. Proctor pers. comm.).
5. Other Areas - There is a healthy and possibly increasing population of grizzly bears in Montana (Kendall et al. 2009), and its conservation status is improved by the protection afforded by Glacier National Park. Bear density in B.C. just west of the border is generally higher than in Alberta (Grizzly Bear Inventory Team 2008, Apps et al. 2004). There are also grizzly bears in the Northwest Territories (Figure 4), but their distribution in the tundra is much to the north of the Alberta border. There is no known immigration to northern Alberta from the territories.
LIMITING FACTORS
Historical reductions in grizzly bear populations were due to extensive agricultural land conversion resulting in habitat loss and unrestricted hunting, including predator control initiatives. These two factors are no longer the main issue in grizzly bear management. Today, the primary limiting factor for grizzly bears in Alberta is human-caused mortality, associated with expanding road access, habitat
loss and alteration. Conflicts also occur where grizzly bear ranges overlap with agricultural areas. Grizzly bears compete with humans for space, game, and livestock (Jorgensen 1983, Knight and Judd 1983, Mattson 1990) and they are potentially dangerous (Herrero 1985): three people have been killed by grizzly bears in Alberta over the past five years. Even inside national and provincial parks, undisturbed habitat is shrinking and grizzly bears are displaced by interactions with human development and activity (Gibeau 2000). Roads and trails cause grizzly bear mortality, habitat avoidance, and vehicle-related mortalities (Graves 2002, Mattson et al.1987, McLellan and Shackleton 1988) and it is reasonable to assume that the negative impact of roads and trails increases with traffic volume. Research in Alberta underlines the negative role of roads and trails that allow access to motorized vehicles in population persistence of grizzly bears (Nielsen 2005; Nielsen et al. 2004b; Nielsen et al. 2006; Roever et al 2008a, 2008b).
Human-caused mortality, especially of adult females, is the primary factor limiting grizzly bear populations (Knight and Eberhardt 1985, Knight et al. 1988). McLellan et al. (1999) determined that 77% to 85% of deaths of radio-collared grizzly bears from 13 different studies were human-caused. Harris (1986) noted that total human-caused mortality rates of greater than 6.5% per year were not compatible with long-term grizzly bear population persistence. Although the figure of 6.5% has been adopted in some management programs, it was estimated for a large contiguous population of at least several hundred bears. Recent research suggests that grizzly bear populations may decline even with a much lower level of human-induced mortality, especially in habitats that are not particularly productive (McLoughlin 2003).
In Alberta, between 1972 and 2008, there were 1121 recorded human-caused grizzly bear deaths. In the following sections, human causes of grizzly bear mortality are considered individually.
28
1. Legal Harvest - Because registration of hunter-harvested grizzly bears was compulsory, it is likely that nearly all legal harvests were recorded. Consequently, the proportion of deaths ascribed to hunting is inevitably an overestimate of the contribution of sport harvest to mortality, because bears that die of other causes may or may not be recorded. Legal hunting accounted for 65% of known human-caused grizzly mortality from 1972 to 1996. Annual harvests during the 1970s varied between 9 and 25 grizzly bears (Gunson 1996). Harvests peaked at about 43 per year from 1983 to 1987. With the implementation of limited-entry hunting, harvest declined to about 12 per year by 1996 (Gunson 1996). From 1997 to 1999 an average of 13 grizzly bears per year were legally harvested. From 2000 to 2005 the average was 14. In the last six years of sport hunting, the number of permits gradually declined from 145 to 73. Alberta Sustainable Resource Development estimated that the legal hunting mortality rate from 1988 to 1999 ranged from 0.7% to 3.5% (mean = 1.8%), but those estimates were based on an inappropriate adjustment of population size (see section on historical population estimates). A recent analysis suggests that in some units, the combination of legal harvest and other human-caused mortality may have been unsustainable in some years (Stenhouse et al. 2005). It is generally accepted that the ratio of females in the annual harvest must be less than 33%–35% (Harris 1986). In 1997–2002, the proportion of females in the harvest was almost 40% (Stenhouse et al. 2005).
2. Illegal and Self-defence Kills - Illegal activities (poaching, misidentification as black bear) and self-defence kills accounted for about 13% of grizzlies known to have been killed between 1972 and 1996. Between 2000 and 2008, the proportion increased to 39%. Self-defence kills made up slightly over half of known illegal deaths (7% of total) in 1972–1996, and 42% (17% of total mortality) in 2000–2008. Most self-defence kills were
during the fall ungulate hunting period (Benn 1998), when armed hunters may come into contact with bears attracted by gutpiles or harvested ungulates that are not immediately retrieved. An unknown number of illegal kills are undetected. The number of grizzly bears illegally shot from vehicles and left inevitably increases with the density of the road network within bear habitat.
3. Anthropogenic Attractants – Anthropogenic bear attractants such as bird feeders, livestock carcasses, grain bins, landfill sites, abandoned orchards, and roadside clover plantings can lead to problem bear situations. These things bring bears into close contact with humans, resulting in bear-human conflicts (N. Webb pers. comm.). Problem bear removals accounted for less than 9% of mortalities, including long-distance translocations that take bears away from specific populations. In some bear management areas (e.g., Castle unit) problem bear removals have been at higher rates. Records of this cause of death are probably accurate, particularly in recent years with improved record keeping. Alberta’s BearSmart program is aimed at decreasing this source of mortality by reducing the availability of such attractants to bears.
4. Aboriginal Harvest - Treaty Indians were responsible for the deaths of about 4% of grizzlies known to be killed by humans between 1972 and 2008. Most of these deaths involved subsistence hunting or problem wildlife control actions on Reserve lands. It is unknown what proportion of Aboriginal subsistence harvest is reported.
5. Other Sources of Mortality - Railway and highway accidents, accidental trapping by registered trappers, research mortalities, incidental poisonings in wolf control programs and other accidents accounted for 9% of reported human-caused mortalities. These sources of mortality are likely underreported by an unknown extent. For example, bears hit by a train or vehicle that walk away and later
29
die of their injuries would be highly unlikely to be recovered and therefore would not be reported as mortalities. As the density of roads increases, so does the risk of mortality from vehicle accidents.
6. Unreported Mortality - McLellan et al. (1999) synthesized mortality data from 13 radio-telemetry studies in Alberta, British Columbia, Montana, Washington and Idaho. They found that in remote areas with legal hunting, managers would likely be aware of over 70% of the grizzly bears killed by people, mostly because legal harvests are generally reported. The proportion of unreported mortality increases where legal hunting does not occur and grizzly bears and humans share habitat to a greater degree (McLellan et al. 1999). McLellan et al. (1999) reported that without radio collars, only 46%–-51% of mortality in their study would have been documented. Natural survival rates for adult grizzly bears are consistently high (Garshelis et al. 2005; Schwartz et al. 2006). Young bears, especially cubs, die more frequently of natural causes such as intraspecific aggression (Swenson et al. 1997), accidents (Nagy et al. 1983), and malnutrition (Nagy et al. 1983, Knight et al. 1988). Although no study has specifically addressed this issue, mortality of cubs and yearlings of unmarked females is probably less likely to be detected than for other age classes. Natural mortality of grizzly bears of any age is rarely detected except during monitoring of radio-collared individuals. Known natural mortality amounted to less than 1% in the Central Rockies Ecosystem portions of Alberta and British Columbia (Benn 1998). McLellan et al. (1999) found that 14 of 92 (15%) radio-collared grizzly bear deaths resulted from natural causes and that 12 of these bears were females (10 adults, 2 subadults).
7. Habitat Loss and Fragmentation - Much of the scientific literature on habitat fragmentation deals with the consequences of the creation of artificial habitat islands, usually nested within
a matrix of habitat made unsuitable by human activities, with roads and other barriers affecting animal movements (Fahrig 2007). Widespread habitat loss associated with agricultural land conversion and settlement occurred historically in Alberta in the prairie and parkland regions and continues to a lesser extent at the interface of the forested and agricultural regions of the province. This loss of habitat eliminated much of the grizzly bear habitat east of the Rocky Mountains. In the forested regions of Alberta, habitat effects on grizzly bears are associated more with alteration and increased human access than with permanent loss. Habitat alteration occurs primarily from forest harvesting, oil and gas exploration and development, power lines, recreational development, and rangeland clearing for livestock. Although temporary habitat modifications such as cutblocks can provide high-quality summer and fall forage (Martin 1983, Waller 1992), these land-use changes also lead to increased mortality and population sinks (Nielsen 2005). Recent research in Alberta has identified movement corridors for grizzly bears in the Canmore and Crowsnest Pass area (Chetkiewicz and Boyce 2009).
8. Fire, Fire Suppression and Timber Harvest - A positive influence of wildfire on grizzly bear habitat use has been observed in the Central Rockies Ecosystem. Hamer and Herrero (1983, 1987) observed that most grizzly bear feeding in the Cascade Valley of Banff National Park occurred in early successional fire and avalanche communities. Raine and Riddell (1991) also observed that burns were preferred by grizzly bears during the berry season in Kootenay and Yoho national parks. Hamer (1996a) found that wildfires created early successional plant communities in which buffaloberry fruit production was the highest recorded. Biomass of yellow hedysarum, a primary food for grizzly bears, was also enhanced in burned areas (Hamer 1996b). Green et al. (1996) reported that prescribed fire in Banff National Park over the previous decade was only 40% of the
�0
long-term average acreage burned per decade. This in turn lessened the availability of open canopy environments, reducing the abundance of at least two major grizzly bear food items – buffaloberry and hedysarum (Hamer 1996a, 1996b). Certain forestry practices may simulate fire by stimulating bear food production (Martin 1983, Waller 1992). The increased motorized access connected with forestry operations, however, diminishes any potential positive effects of forest regeneration on grizzly bear populations (Nielsen et al. 2004a; Nielsen et al. 2008).
STATUS DESIGNATIONS*
1. Alberta - The grizzly bear (Ursus arctos) in Alberta was recommended for Threatened designation in 2002. The grizzly bear was designated as a Fur-bearer in 1928, and a “big game animal” in 1929. According to The General Status of Alberta Wild Species 2000 and 2005 (Alberta Sustainable Resource Development 2001, 2007), the grizzly bear is considered May Be At Risk in the province. In 1991 and 1996, the grizzly bear was classified as a “Blue-List” species (Alberta Forestry, Lands and Wildlife 1991, Alberta Environmental Protection 1996).
2. Other Areas - The prairie population (Alberta, Manitoba, Saskatchewan) of grizzly bears is listed by the Committee on the Status of Endangered Wildlife in Canada (COSEWIC) as Extirpated (COSEWIC 2002). Within its known current distribution in Canada, COSEWIC assessed the grizzly bear in Canada as a species of Special Concern in 2002, based mostly on its life-history characteristics, strong evidence of habitat loss and population decline at the southern edge of its range (including in Alberta), and apparently unsustainable human-
caused mortality in parts of its range. Canada’s government, however, did not list the grizzly bear under the Species at Risk Act (SARA); it currently has no legislative protection under SARA. COSEWIC initiated a status report update for the grizzly bear in early 2010.
The General Status of Species in Canada considers the grizzly bear as nationally Sensitive, as well as Sensitive in the Yukon, Northwest Territories, Nunavut and British Columbia, and Extirpated in Saskatchewan and Manitoba (Canadian Endangered Species Conservation Council 2006).
The grizzly bear’s Global Heritage Status rank is G4, meaning that it is apparently secure (NatureServe 2009). It is considered S3 in B.C. (B.C. Conservation Data Centre 2007), SX in Saskatchewan and Manitoba, and SNR in the Northwest Territories (NatureServe 2009).
The grizzly bear is listed as Threatened in the contiguous United States, and is protected and managed under the U.S. Endangered Species Act (U.S. Fish and Wildlife Service 2009). In the state of Washington, the grizzly bear is ranked as S1 and is listed as Endangered (Washington Natural Heritage Program 2010). It is ranked as S1 and listed as Threatened in Idaho (Idaho Fish and Game 2010) and S1 in Wyoming (Wyoming Natural Diversity Database 2009). In Montana, the grizzly bear is ranked as S2S3 (Montana Natural Heritage Program 2010).
RECENT MANAGEMENT IN ALBERTA
The persistence of grizzly bears in Alberta hinges directly on reducing human-caused mortality. That reduction can best be achieved through limiting motorized access to grizzly bear habitat, including road closures and disallowing off-road vehicles. Experience elsewhere in North America and Sweden has shown that human-induced grizzly bear mortality can be lowered sufficiently to allow population recovery, if motorized access and
* See Appendix 1 for definitions of selected status designations.
��
behaviours likely to lead to bear deaths are controlled (Bischoff et al. 2008; Kendall et al. 2009; Mattson and Merrill 2002; Schwartz et al. 2006).
Following an evaluation of the conservation status of grizzly bears in the province, the Alberta Grizzly Bear Recovery Team (2008) produced 11 key recommendations. Progress toward implementing these recommendations has been mixed and is briefly summarized here:
1. Reduce human-caused grizzly bear mortality by changing human-use of the landscape,including:1a. Controlling access development and use, and other human activities in grizzly bearhabitat.This is the most important action to be taken to conserve grizzly bears in Alberta. So far, progress has been limited to mapping and plan development. In November 2008, Alberta Sustainable Resource Development concluded a series of meetings with 25 stakeholder groups to evaluate plans for access management. There are currently no approved plans to reduce access. Outside Alberta, programs to modify human behaviour and to reduce human-caused mortality of grizzly bears have been effective. Grizzly bears have increased substantially in the Yellowstone (Schwartz et al. 2006) and Glacier (Kendall et al. 2009) areas following the implementation of policies to reduce access and to decrease the chances of human-induced mortality.
1b. Temporary suspension of hunting as an immediate measure while other recovery actions are implemented.The sport hunting season has been closed since 2006, and it will be reassessed after completion of this status review. That management decision substantially reduced the human-caused mortality of grizzly bears in Alberta.
2. Determine grizzly bear population size and continue ongoing collection and monitoring of key data.DNA-based CMR estimates were completed for the vast majority of grizzly bear habitat from the Grande Cache unit to the U.S. border. Over two million dollars were spent to complete these estimates. There are currently no plans to extend the CMR estimates to the Swan Hills and Alberta North units. The number of grizzly bears in the Swan Hills unit was estimated based on habitat quality, particularly the relationships between human use and grizzly bear mortality identified elsewhere in the province. Estimates of the size and density of the Alberta North unit remain speculative. Ongoing grizzly bear research in Alberta includes continued monitoring of health, survival and reproduction of radio-collared bears in the Canmore corridor and in west-central Alberta. Translocated grizzly bears are monitored with satellite collars to determine vital rates and to determine which release sites are most successful. There is currently little effort to obtain long-term data on vital rates from marked known-age individuals, which are key to the evaluation of population trends.
3. Create “Grizzly Bear Priority Areas” in each population unit to protect high quality habitat and reduce risk from humans.The identification of Priority Areas has made substantial progress. The government of Alberta has formally delineated “Core” and “Secondary” grizzly bear habitat over most of the species’ range in the province. These areas have been mapped, and current access development has been inventoried. Recommendations to reduce motorized access to these areas are under review, but have not been implemented.
4. Reduce human-bear conflicts by working with people and managing attractants tominimize adverse bear behaviour.The “BearSmart” program works toward implementing this recommendation. Its budget,
��
however, is less than that of similar programs in other provinces. For example, the current BearSmart yearly budget in Alberta is about $ 150 000, while the BearSmart program in Ontario receives about $ 4.5 million. Mitigation measures that have been implemented in parts of the province include removal of garbage, berry bushes and fruit trees from areas of high human use, placement of bear-resistant garbage containers in several communities, and the fencing of carcass pits and other attractants. Spring intercept feeding is conducted in southern Alberta to reduce conflicts between bears and livestock producers. Bear hazard assessments have been completed or are ongoing in several communities to identify and reduce sources of human-bear conflict.
5. Develop an education program directed at the general public and target audiences.The BearSmart program has developed information leaflets, targeted at specific groups of people and available from sporting equipment retailers, community offices, at conventions, and from the BearSmart website. Educational signage has been placed at several locations throughout grizzly range. Information releases to media on proper behaviour in bear country occur at both the provincial and district level. Ads are placed in popular magazines and hunting and fishing guides. Educational information is being incorporated into hunter safety courses and is provided to hunters as brochures and checklists. In addition, interpretive programs and presentations to schools, Indian Reserves and industry groups are ongoing. Several community-driven BearSmart programs have been established. There are no data on the impacts of these programs on bear conservation, and they are generally too recent to be evaluated.
6. Maintain current grizzly bear distribution, track availability of suitable habitat, andenhance habitat where appropriate.Ongoing research in Alberta is examining the environmental factors affecting the health
of grizzly bears, the possible effects of pine beetles on habitat, and continuing to assess how industrial activities, such as hydrocarbon development and open-pit mining, may affect habitat use and survival of grizzly bears. In addition, researchers are seeking new ways to monitor population status and trends and attempting to find reliable methods to determine regional carrying capacity.
7. Establish regional grizzly bear recovery implementation teams to address regional issues.This recommendation was not accepted by the Alberta government. No regional teams will be established in the near future.
8. Improve inter-jurisdictional cooperation and grizzly bear data management.Biologists from Alberta, B.C., Montana, Parks Canada and other agencies have been in frequent contact and a draft data-sharing agreement has been approved. COSEWIC will re-assess the status of the grizzly bear in Canada within the next two years.
9. Improve regulations and/or legislation to support recovery actions.Fines for poaching have been substantially increased, up to $ 100 000. The town of Canmore has adopted numerous bylaws to reduce bear attractants (Honeyman 2007). Hazard assessments completed as part of the BearSmart program identify bylaws that can be enacted by municipalities to reduce bear-human conflict.
10. Acquire new funding to support additional government staff (create a grizzly bear recovery coordinator position, enforce regulations regarding attractant storage and access use, support conflict management and education, support ongoing inventory and habitat mapping, and assist with integration of grizzly bear conservation needs into land use planning and land use decisions).
��
The Fish and Wildlife Division of Alberta Sustainable Resource Development has secured funding for two biologists as grizzly bear conflict reduction specialists, although these are currently not permanent positions. Grizzly bear recovery actions (including conflict reduction and land use planning) are a core responsibility of numerous permanent staff across the province. Temporary staff have also been hired to conduct Bear Hazard Assessments in priority communities as part of the BearSmart program. A Provincial Carnivore Specialist has recently been hired, and grizzly bears will be a major focus of his work.
11. Involve land users and stakeholders in implementation of the recovery plan, includingimproved communication with, and compensation for, ranchers.Meetings have been held with livestock producers across southwestern Alberta to discuss grizzly bear status, leading to several community-based efforts to reduce conflicts, including improved livestock carcass disposal, grain storage, and livestock husbandry. These efforts are ongoing and so far there is not enough information to evaluate their effectiveness. Other stakeholders are involved in discussions surrounding grizzly bears as part of community BearSmart programs. Improvements have been made to the livestock compensation program.
34
LITERATURE CITED
Alberta Environmental Protection. 1996. The Status of Alberta Wildlife. Alberta Environmental Protection, Natural Resources Service, Wildlife Management Division. Edmonton, AB. 44 pp.
Alberta Fish and Wildlife Division. 1990. Management Plan for Grizzly Bears in Alberta. Wildlife Management Planning Series Number 2. Alberta Forestry, Lands and Wildlife, Edmonton, AB. 164 pp.
Alberta Forestry, Lands and Wildlife. 1991. The Status of Alberta Wildlife. Alberta Forestry, Lands and Wildlife, Fish and Wildlife Division. Edmonton, AB. 49 pp.
Alberta Grizzly Bear Inventory Team. 2007. Grizzly Bear Population and Density Estimates for the 2006 Alberta Unit 5 Management Area Inventory. Alberta Sustainable Resource Development, Fish & Wildlife Division, Edmonton. 37 pp.
Alberta Grizzly Bear Inventory Team. 2009. Grizzly Bear Population and Density Estimates for the 2008 DNA Inventory of the Grand Cache Bear Management Area (BMA 2). Alberta Sustainable Resource Development, Fish & Wildlife Division, Edmonton. 35 pp.
Alberta Grizzly Bear Recovery Team. 2008. Alberta Grizzly Bear Recovery Plan 2008-2013. Alberta Species at Risk Recovery Plan No. 15. Alberta Sustainable Resource Development, Fish and Wildlife Division, Edmonton. 68 pp.
Alberta Natural Heritage Information Centre (ANHIC). 2007. Explanation of ranks. Alberta Tourism, Parks and Recreation. URL: http://tpr.alberta.ca/parks/heritageinfocentre/animals/definitions.aspx [Updated: 1 October 2007].
Alberta Sustainable Resource Development. 2001. The General Status of Alberta Wild Species 2000. Alberta Sustainable Resource Development, Fish and Wildlife Service. Edmonton, AB. 46 pp.
Alberta Sustainable Resource Development. 2007. The General Status of Alberta Wild Species 2005. URL: http://srd.alberta.ca/BioDiversityStewardship/SpeciesAtRisk/GeneralStatus/Default.aspx [Updated September 2009].
Alberta Sustainable Resource Development. 2008. Draft Core and Secondary Grizzly Bear Conservation Boundaries. URL: http://srd.alberta.ca/Managing Programs/FishWildlifeManagement/ BearManagement/documents/GrizzlyBear-CoreSecondaryConservationBoundaries-Sep2008.pdf. [Updated: 24 September 2008].
Apps, C.D., B.N. McLellan, J.G. Woods, and M.F. Proctor. 2004. Estimating grizzly bear distribution and abundance relative to habitat and human influence. Journal of Wildlife Management 68:138–152.
Barber-Meyer, S.H., L.D. Mech, and P.J. White. 2008. Elk calf survival and mortality following wolf restoration to Yellowstone National Park. Wildlife Monographs 169:1–30.
B.C. Conservation Data Centre. 2007. B.C. Species and Ecosystems Explorer. British Columbia Ministry of
35
Sustainable Resource Management. URL: http://www.env.gov.bc.ca/cdc/ [Accessed: February 2010].
B.C. Ministry of Environment, Lands and Parks. 1995. Conservation of Grizzly Bears in British Columbia–Background Report. Ministry of Environment, Lands and Parks, Victoria, B.C. 70 pp.
Benn, B. 1998. Grizzly Bear Mortality in the Central Rockies Ecosystem, Canada. M. E. D. thesis. University of Calgary, Calgary, AB. 151 pp.
Benn, B., and S. Herrero. 2002. Grizzly bear mortality and human access in Banff and Yoho National Parks, 1971-98. Ursus 13:213–221.
Bertch, B., and M.L. Gibeau. 2009. Grizzly Bear Monitoring in and around the Mountain National Parks: Mortalities and Bear/Human Encounters 1990-2008. Parks Canada. 29 pp.
Bischof, R., R. Fujita, A. Zedrosser, A. Söderberg, and J.E. Swenson. 2008. Hunting patterns, ban on baiting, and harvest demographics of Brown Bears in Sweden. Journal of Wildlife Management 72:79–88.
Blanchard, B.M., and R.R. Knight. 1991. Movements of Yellowstone grizzly bears. Biol. Conserv. 58:41–67.
Boulanger, J., J. Cranston, S.E. Nielsen, and G. Stenhouse. 2009. Estimation of Grizzly Bear Population Size for the Swan Hills Management Unit using DNA Sampling and Habitat-Relative Occupancy Models. Unpublished report prepared for Alberta Sustainable Resource Development. URL: http://www.srd.alberta.ca/ManagingPrograms/
F i s h W i l d l i f e M a n a g e m e n t /BearManagement/GrizzlyBears/GrizzlyBears.aspx
Boulanger, J., M. Proctor, S. Himmer, G. Stenhouse, D. Paetkau, and J. Cranston. 2006. An empirical test of DNA mark-recapture sampling strategies for grizzly bears. Ursus 17:149–158.
Boulanger, J., and G. Stenhouse. 2006. Critique of 1998 SW Alberta grizzly bears DNA mark-recapture study. Unpublished report. 11 pp.
Boulanger, J., and G. Stenhouse. 2009. Demography of Alberta grizzly bears: 1999-2009. Unpublished report. 23 pp. URL: http://www.srd.alberta.ca/ManagingPrograms/F i s h W i l d l i f e M a n a g e m e n t /BearManagement/GrizzlyBears/GrizzlyBears.aspx
Boulanger, J., G. Stenhouse, G. MacHutchon, M. Proctor, S. Himmer, D. Paetkau, and J. Cranston. 2005a. Grizzly Bear Population and Density Estimates for the 2005 Alberta (Proposed) Unit 4 Management Area Inventory. Alberta Sustainable Resource Development, Fish & Wildlife Division, Edmonton. 31 pp.
Boulanger, J., G. Stenhouse, M. Proctor, S. Himmer, D. Paetkau, and J. Cranston. 2005b. Population Inventory and Density Estimates for the Alberta 3B and 4B Grizzly Bear Management Areas. Alberta Sustainable Resource Development. Edmonton. 31 pp.
Boulanger, J., G.C.White, B.N. McLellan, J. Woods, M. Proctor, and S. Himmer. 2002. A meta-analysis of grizzly bear DNA mark-recapture projects in British Columbia, Canada. Ursus 13:137–152.
36
Boyce, M.S., B.M. Blanchard, R.R. Knight, and C. Servheen. 2001. Population viability for grizzly bears: a critical review. International Association for Bear Research and Management Monograph Series Number 4:1–45.
Brodie, J.F., and M.L. Gibeau. 2007. Brown bear population trends from demographic and monitoring-based estimators. Ursus 18:137–144.
Canadian Endangered Species Conservation Council (CESCC). 2006. Wild Species 2005: The General Status of Species in Canada. URL: http://www.wildspecies.ca /wi ldspecies2005/search.cfm [Updated 7 November 2006]
Chetkiewicz, C.L.B., and M.S. Boyce. 2009. Use of resource selection functions to identify conservation corridors. Journal of Applied Ecology 46:1036–1047.
COSEWIC. 2002. Wildlife Species Search. Committee on the Status of Endangered Wildlife in Canada. URL: http://www.cosepac.gc.ca/eng/sct1/searchform_e.cfm [Published 21 January 2002].
COSEWIC. 2009. Definitions and abbreviations. Committee on the Status of Endangered Wildlife in Canada. URL: http://www.cosewic.gc.ca/eng/sct2/sct2_6_e.cfm [Updated June 2009].
Côté, S.D., and C. Beaudoin. 1997. Grizzly bear (Ursus arctos) attacks and nanny-kid separation on mountain goats (Oreamnos americanus). Mammalia 61:614–617.
Coulson, T., T.H.G. Ezard, F. Pelletier, G. Tavecchia, N.C. Stenseth, D.Z. Childs, J.G. Pilkington, J.M. Pemberton, L.E.B. Kruuk, T.H. Clutton-Brock, and M.J. Crawley. 2008. Estimating
the functional form for the density dependence from life history data. Ecology 89:1661–1674.
Environment Canada. 2008. Scientific Review for the Identification of Critical Habitat for Woodland Caribou (Rangifer tarandus caribou), Boreal Population, in Canada. Environment Canada, Ottawa. p. 72 + 180 pp.
Fahrig, L. 2007. Non-optimal animal movement in human-altered landscapes. Functional Ecology 21:1003–1015.
Garshelis, D.L., M.L. Gibeau, and S. Herrero. 2005. Grizzly bear demographics in and around Banff National Park and Kananaskis Country, Alberta. Journal of Wildlife Management 69:277–297.
Gibeau, M.L. 2000. A conservation biology approach to the management of grizzly bears in Banff National Park. Ph.D. Thesis, University of Calgary, Calgary, AB.
Graves, T.A. 2002. Spatial and temporal response of grizzly bears to recreational use on trails. Thesis. University of Montana. Missoula, MT.
Green, J., C. Pacas, S. Bayley and L. Cornwell. 1996. Ecological outlooks project. A cumulative effects assessment and futures outlook of the Banff Bow Valley. Prepared for the Banff Bow Valley Study. Department of Canadian Heritage, Ottawa, ON.
Grizzly Bear Inventory Team. 2008. Grizzly Bear Population and Density Estimates for Alberta Bear Management Unit 6 and British Columbia Management Units 4-1, 4-2, and 4-23 (2007). Alberta Sustainable Resource Development, Fish and Wildlife Division, B.C.
37
Ministry of Forests and Range, B.C. Ministry of Environment, and Parks Canada. Edmonton. 46 pp.
Gunson, J.R. 1996. Analysis of the Limited-Entry Grizzly Bear Hunts in Alberta during 1988-1996. Alberta Wildlife Management Division Occ. Paper No. 17. Alberta Environmental Protection, Edmonton, AB. 18 pp.
Hamer, D. 1996a. Buffaloberry (Shepherdia canadensis) Fruit Production in Fire-successional Bear Feeding Sites. Banff National Park, Banff, AB. 59 pp.
Hamer, D. 1996b. Wildfire’s influence on Yellow Hedysarum digging habitat used by grizzly bears in Banff National Park, Alberta: Summary of results from the 1995 field season. Banff National Park. Banff, AB. 13 pp.
Hamer, D., and S. Herrero. 1983. Ecological studies of the grizzly bear in Banff National Park: final report. Parks Canada, Calgary, Alberta. 303 pp.
Hamer, D. and S. Herrero. 1987. Wildfire’s influence on bear feeding ecology in Banff National Park, Alberta. Pp. 179-186 in Bears, their biology and management: A selection of papers from the 7th International Conference on Bear Research and Management (P. Zager, J. Beecham, G. Matula Jr., and H. Reynolds, eds.). International Association for Bear Research and Management, Williamsburg, VA.
Hamer, D. and S. Herrero. 1991. Elk, Cervus elaphus, calves as food for grizzly bears, Ursus arctos, in Banff National Park, AB. Canadian Field-Naturalist 105:101–103.
Haroldson, M.A., C.C. Schwartz, S. Cherry, and D.S. Moody. 2004. Possible effects
of elk harvest on fall distribution of grizzly bears in the greater Yellowstone ecosystem. Journal of Wildlife Management 68:129–137.
Harris, R.B. 1986. Modelling sustainable harvest rates for grizzly bears. Pp. 268-279 in Programmatic Environmental Impact Statement – The grizzly bear in Northwestern Montana. (A. Dood, R. Brannon, and R. D. Mace eds.). Montana Dept. Fish, Wildlife and Parks, Helena, MT.
Harris, R.B., and F.W. Allendorf. 1989. Genetically effective population size of large mammals: an assessment of estimators. Conservation Biology 3:181– 191.
Harris, R. B., G. C. White, C. C. Schwartz, and M. A. Haroldson. 2007. Population growth of Yellowstone grizzly bears: uncertainty and future monitoring. Ursus 18:168–178
Herrero, S. 1985. Bear Attacks—Their Causes and Avoidance. Winchester Press, Piscataway, NJ. 287 pp.
Herrero, S. 1992. The Significance of the Wind Valley for Mammalian Carnivores. Canadian Parks and Wilderness Sociey. Calgary, Canada. 23 pp.
Honeyman, J. 2007. Bow Valley Bear Hazard Assessment. Alberta Sustainable Resource Development. 96 pp.
Idaho Fish and Game. 2010. Idaho Conservation Data Centre. URL: http://fishandgame.idaho.gov/cms/wildlife/ [Accessed: 2 February 2010].
Jorgensen, C. J. 1983. Bear–sheep interactions. Pp. 191-200 in Bears, their Biology and Management: A Selection of Papers from the 5th International Conference
38
on Bear Research and Management (E. C. Meslow, ed.). International Association for Bear Research and Management, Madison, WI.
Kansas, J. 2002. Status of the Grizzly Bear (Ursus arctos) in Alberta. Alberta Sustainable Resource Development, Fish & Wildlife Division, and Alberta Conservation Association, Edmonton. 43 pp.
Kendall, K.C., J.B. Stetz, J. Boulanger, A.C. MacLeod, D. Paetkau, and G.C. White. 2009. Demography and genetic structure of a recovering grizzly bear population. Journal of Wildlife Management 73:3–17.
Knight, R.R., B.M. Blanchard, and L.E. Eberhardt. 1988. Mortality patterns and population sinks for Yellowstone grizzly bears, 1973-85. Wildl. Soc. Bull. 16:121–125.
Knight, R.R., and L.L. Eberhardt. 1985. Population dynamics of Yellowstone grizzly bears. Ecology 66:323–334.
Knight, R.R., and S.L. Judd. 1983. Grizzly bears that kill livestock. Pp. 186-190 in Bears, their Biology and Management: A Selection of Papers from the 5th International Conference on Bear Research and Management (E. C. Meslow, ed.). International Association for Bear Research and Management, Madison, WI.
Lebreton, J.D., K.P. Burnham, J. Clobert, and D.R. Anderson. 1992. Modeling survival and testing biological hypotheses using marked animals: a unified approach with case studies. Ecol. Monogr. 62:67–118.
Linnell, J.D.C., J. E. Swenson, R. Andersen, and B. Barnes. 2000. How vulnerable are
denning bears to disturbance? Wildlife Society Bulletin 28(2):400-413.
Lomolino, M.V., and R. Channell. 1995. Splendid isolation: patterns of geographic range collapse in endangered mammals. Journal of Mammalogy 76:335–347.
Ludwig, D. 1999. Is it meaningful to estimate a probability of extinction? Ecology 80(1):298–310.
Martin, P.A. 1983. Factors influencing globe huckleberry fruit production in Western Montana. Pp. 159-165 in Bears, their Biology and Management: A Selection of Papers from the 5th International Conference on Bear Research and Management (E. C. Meslow, ed.).
Mattson, D.J. 1990. Human impacts on bear habitat use. Pp. 33-56 in Bears, their Biology and Management: A Selection of Papers from the 8th International Conference on Bear Research and Management (L. M. Darling and W. R. Archibald, eds.)..
Mattson, D.J., B.M. Blanchard, and R.R. Knight. 1992. Yellowstone grizzly bear mortality, human habituation, and whitebark pine seed crops. J. Wildl. Manage. 56:432–442.
Mattson, D.J., R.R. Knight, and B.M. Blanchard. 1987. The effects of developments and primary roads on grizzly bear habitat use in Yellowstone National Park, Wyoming. Pp. 259-273 in Bears, their Biology and Management: A Selection of Papers from the 7th International Conference on Bear Research and Management (P. Zager, J. Beecham, G. Matula Jr., and H. Reynolds, eds.).
Mattson, D.J., and T. Merrill. 2002. Extirpations of grizzly bears in the
39
contiguous United States, 1850-2000. Conservation Biology 16:1123–1136.
McLellan, B.N. 2005. Sexually selected infanticide in grizzly bears: the effects of hunting on cub survival. Ursus 16:141-156.
McLellan, B. 2008. Implications of 1970s Salvage Logging of Mountain Pine Beetle Trees and Gas Exploration on Grizzly Bears: Vital Rates and Rate of Change. Unpubl. report. 29 pp.
McLellan, B.N., and F.W. Hovey. 2001a. Habitats selected by grizzly bears in a multiple use landscape. J. Wildl. Manage. 65:92–99.
McLellan, B.N., and F.W. Hovey. 2001b. Natal dispersal of grizzly bears. Canadian Journal of Zoology 79:838–844
McLellan, B.N., F.W. Hovey, R.D. Mace, J.D. Woods, D.W. Carney, M.L. Gibeau, W.S. Wakkinen, and W.F. Kasworm. 1999. Rates and causes of grizzly bear mortality in the interior mountains of British Columbia, Alberta, Montana, Washington, and Idaho. Journal of Wildlife Management 63:911–920.
McLellan, B.N., and D.M. Shackleton. 1988. Grizzly bears and resource-extraction industries: effects of roads on behaviour, habitat use, and demography. Journal of Applied Ecology 25:451–460.
McLoughlin, C.A. 2003. Managing Risk of Decline for Hunted Populations of Grizzly Bears given Uncertainty in Population Parameters. Final report to the British Columbia Independent Scientific Panel on Grizzly Bears. University of Alberta, Edmonton. 74 pp.
McLoughlin, P.D., M.K. Taylor, and F. Messier. 2005. Conservation risks of male-selective harvest for mammals with low reproductive potential. Journal of Wildlife Management 64:1592–1600.
Montana Natural Heritage Program. 2010. Animal Species of Concern. URL: http://mtnhp.org/ [Accessed 2 February 2010].
Mowat, G., and D.C. Heard. 2006. Major components of grizzly bear diet across North America. Canadian Journal of Zoology 84:473–489.
Mowat, G., and C. Strobeck. 2000. Estimating population size of grizzly bears using hair capture, DNA profiling, and mark-recapture analysis. Journal of Wildlife Management 64: 183–193.
Munro, R.H.M., S.E. Nielsen, M.H. Price, G.B. Stenhouse, and M.S. Boyce. 2006. Seasonal and diel patterns of grizzly bear diet and activity in west-central Alberta. Journal of Mammalogy 87:1112–1121.
Nagy, J.A., A.W.L. Hawley, M.W. Barret, and J.W. Nolan. 1989. Population Characteristics of Grizzly and Black Bears in West-central Alberta. Alberta Environment, Vegreville. 35 pp.
Nagy, J.A., and R.H. Russell. 1978. Ecological Studies of the Boreal Forest Grizzly Bear (Ursus arctos) - Annual Report for 1977. Canadian Wildlife Service, Edmonton. 104 pp.
Nagy, J.A., R.H. Russell, A.M. Pearson, M.C. Kingsley, and B.C. Goski. 1983. Ecological studies of grizzly bears in the Arctic Mountains, northern Yukon Territory, 1972 to 1975. Can. Wildl. Serv. Rept. Edmonton, AB. 104 pp.
40
II. Distribution of grizzly bear foods in clearcuts of west-central Alberta, Canada. Forest Ecology and Management 199:67–82.
Nielsen, S.E., G. Stenhouse, and M.S. Boyce. 2006. A habitat-based framework for grizzly bear conservation in Alberta. Biological Conservation 130:217–229.
Nielsen, S.E., G.B. Stenhouse, H.L. Beyer, F. Huettmann, and M.S. Boyce. 2008. Can natural disturbance-based forestry rescue a declining population of grizzly bears? Biological Conservation 141:2193–2207.
Paetkau, D. 2003. An empirical exploration of data quality in DNA-based population inventories. Molecular Ecology 12:1375–1387.
Pedocan Land Evaluation Ltd. 1984. Preliminary Wildlife Habitat Regions/Subregions of Alberta – Extended Legend. Prepared for Alberta Energy and Natural Resources, Fish and Wildlife Division, Edmonton, AB. 44 pp.
Proctor, M. 2004. A Genetics-based Spatial Analysis of Grizzly Bears in Alberta. Report commissioned by the Alberta Grizzly Bear Recovery Team. Edmonton. 26 pp.
Proctor, M.F., B.N. McLellan, C. Strobeck, and R.M.R. Barclay. 2004. Gender-specific dispersal distances of grizzly bears estimated by genetic analysis. Canadian Journal of Zoology 82:1108–1118.
Proctor, M.F., B.N. McLellan, C. Strobeck, and R.M.R Barclay. 2005. Genetic analysis reveals demographic fragmentation of
National Research Council. 1995. Science and the Endangered Species Act. National Academy Press, Washington, DC. 271 pp.
NatureServe. 2009. NatureServe Explorer: an online encyclopedia of life. Version 7.1. Arlington, Virginia, USA: NatureServe. URL: http://www.natureserve.org/explorer [Updated 17 July 2009].
Nielsen, P. L. 1975. The Past and Present Status of the Plains and Boreal Forest Grizzly Bear in Alberta. Can. Wildl. Serv. Report. Edmonton, AB. 61 pp.
Nielsen, S.E. 2005. Habitat Ecology, Conservation, and Projected Population Viability of Grizzly Bears (Ursus arctos L.) in West-central Alberta, Canada. Ph.D. thesis, University of Alberta, Edmonton. 261 pp.
Nielsen, S.E., M.S. Boyce, and G. Stenhouse. 2004a. Grizzly bears and forestry I. Selection of clearcuts by grizzly bears in west-central Alberta, Canada. Forest Ecology and Management 199:51–65.
Nielsen, S.E., J. Cranston, and G.B. Stenhouse. 2009. Identification of priority areas for grizzly bear conservation and recovery in Alberta, Canada. Journal of Conservation Planning 5:38–60.
Nielsen, S.E., S. Herrero, M.S. Boyce, R.D. Mace, B. Benn, M.L. Gibeau, and S. Jevons. 2004b. Modelling the spatial distribution of human-caused grizzly bear mortalities in the Central Rockies ecosystem of Canada. Biological Conservation 120:101–113.
Nielsen, S.E., R.H.M. Munro, E.L. Bainbridge, G. Stenhouse, and M.S. Boyce. 2004c. Grizzly bears and forestry
41
grizzly bears yielding vulnerably small populations. Proceedings of the Royal Society B-Biological Sciences 272: 2409–2416.
Raine, R.M., and R.N. Riddell. 1991. Grizzly Bear Research in Yoho and Kootenay National Parks. Canadian Parks Service Report, Calgary, AB.
Regehr, E.V., N.J. Lunn, S.C. Amstrup, and I. Stirling. 2007. Effects of earlier sea ice breakup on survival and population size of polar bears in Western Hudson Bay. Journal of Wildlife Management 71:2673–2683.
Roever, C., M.S. Boyce, and G.B. Stenhouse. 2008a. Grizzly bears and forestry I: Road vegetation and placement as an attractant to grizzly bears. For. Ecol. Manage. 256:1253–1261.
Roever, C., M. S. Boyce, and G. B. Stenhouse. 2008b. Grizzly bears and forestry II: Grizzly bear habitat selection and conflicts with road placement. For. Ecol. Manage. 256:1262–1269.
Roever, C., M.S. Boyce, and G.B. Stenhouse. 2010. Grizzly bear movements relative to roads: application of step selection functions. Ecography. In press.
Schwartz, C.C., M.A. Haroldson, G.C. White, R.B. Harris, S. Cherry, K.A. Keating, D.S. Moody, and C. Servheen. 2006. Temporal, spatial, and environmental influences on the demographics of grizzly bears in the Greater Yellowstone ecosystem. Wildlife Monographs 161:1–68.
Schwartz, C.C., K.A. Keating, H.V. Reynolds, V.G. Barnes, R.A. Sellers, J.E. Swenson, S.D. Miller, B.N. McLellan, J. Keay, R. McCann, M.L. Gibeau,
W.L. Wakkinen, R.D. Mace, W.F. Kasworm, R. Smith, and S. Herrero. 2003. Reproductive maturation and senescence in the female brown bear. Ursus 14:109–119.
Servheen, C. 1990. The status and conservation of the bears of the world. Int. Conf. Bear Res. and Manage. Monograph Series No.2. 32 pp.
Smith, K.G. 2004. Woodland Caribou Demography and Persistence Relative to Landscape Change in West-central Alberta. M.Sc., Biological Sciences, Alberta, Edmonton.
Stenhouse, G., M.S. Boyce, and J. Boulanger. 2005. Amended Report on Alberta Grizzly Bear assessment of allocation. Alberta Fish & Wildlife. 47 pp.
Swenson, J.E., F. Sandegren, and A. Soderberg. 1998. Geographic expansion of an increasing brown bear population - Evidence for presaturation dispersal. J. Anim. Ecol. 67: 819–826.
Swenson, J.E., F. Sandegren, A. Soderberg, A. Bjarvall, R. Franzen, and P. Wabakken. 1997. Infanticide caused by hunting of male bears. Nature 386:450–451.
Testa, J.W., E.F. Becker, and G.R. Lee. 2000. Temporal patterns in the survival of twin and single moose (Alces alces) calves in southcentral Alaska. J. Mammal. 81:162–168.
U.S. Fish and Wildlife Service. 2009. Species Information. URL: http://www.fws.gov/endangered/wildlife.html. [Accessed 2 February 2010].
Vroom, G. W., S. Herrero, and R. T. Ogilvie. 1980. The ecology of winter den sites in Banff National Park, Alberta.
42
Pp. 321-330 in Bears, their Biology and Management: Papers from the 4th International Conference on Bear Research and Management (C.J. Martinka and K.L. McArthur, eds.)
Waller, J.S. 1992. Grizzly Bear use of Habitats Modified by Timber Harvest. M.Sc. thesis, Montana State University, Bozeman, MT. 64 pp.
Washington Natural Heritage Program. 2010. Rare Animal Information. URL: http://www.dnr.wa.gov/ResearchScience/Topics/NaturalHeritage/Pages/amp_nh.aspx [Accessed 2 February 2010].
Weaver, J., R. Escano, D. Mattson, T. Puchlerz, and D. Despain. 1986. A cumulative effects model for grizzly bear management in the Yellowstone Ecosystem. Pp. 234–236 in Proceedings–Grizzly Bear Habitat Symposium (G. P. Contreras, and K. E. Evans, compilers). Intermountain Research Station Gen. Tech. Rept. INT-207. Ogden, UT. 252 pp.
Weaver, J.L., P.C. Paquet, and L.F. Ruggerio. 1996. Resilience and conservation of large carnivores in the Rocky Mountains. Conserv. Biol. 10:964–976.
West Central Alberta Caribou Landscape Planning Team. 2008. West Central Alberta Caribou Landscape Plan. For the Alberta Caribou Committee. Edmonton, Alberta. 148 pp.
White, G.C., and K.P. Burnham. 1999. Program MARK: survival estimation from populations of marked animals. Bird Study Supplement 46:120–138.
White, G.C., K.P. Burnham, and D.R. Anderson. 2000. Advanced features of program MARK. In Proceedings of the second international wildlife management congress. Edited by R. Fields. The Wildlife Society, Gödöllo, Hungary. pp. 368–377.
Wielgus, R.B. 1986. Habitat Ecology of the Grizzly Bear in the Southern Rocky Mountains of Canada. M.Sc. thesis, University of Idaho, Moscow, ID. 136 pp
Wielgus, R.B., and F.L. Bunnell. 2000. Possible negative effects of adult male mortality on female grizzly bear reproduction. Biol. Cons. 93:145-154.
Woods, J.G., D. Paetkau, D. Lewis, B.N. McLellan, M. Proctor, and C. Strobeck. 1999. Genetic tagging free ranging black and brown bears. Wildlife Society Bulletin 27: 616–627.
Wyoming Natural Diversity Database. 2009. Mammal Species of Concern. URL: http://uwadmnweb.uwyo.edu/WYNDD/ [Accessed 2 February 2010].
Young, D.D., and T.R. McCabe. 1997. Grizzly bear predation rates on caribou calves in Northeastern Alaska. Journal of Wildlife Management 61:1056–1066.
Zedrosser, A., E. Bellemain, P. Taberlet, and J.E. Swenson. 2007. Genetic estimates of annual reproductive success in male brown bears: the effects of body size, age, internal relatedness and population density. Journal of Animal Ecology 76:368–375.
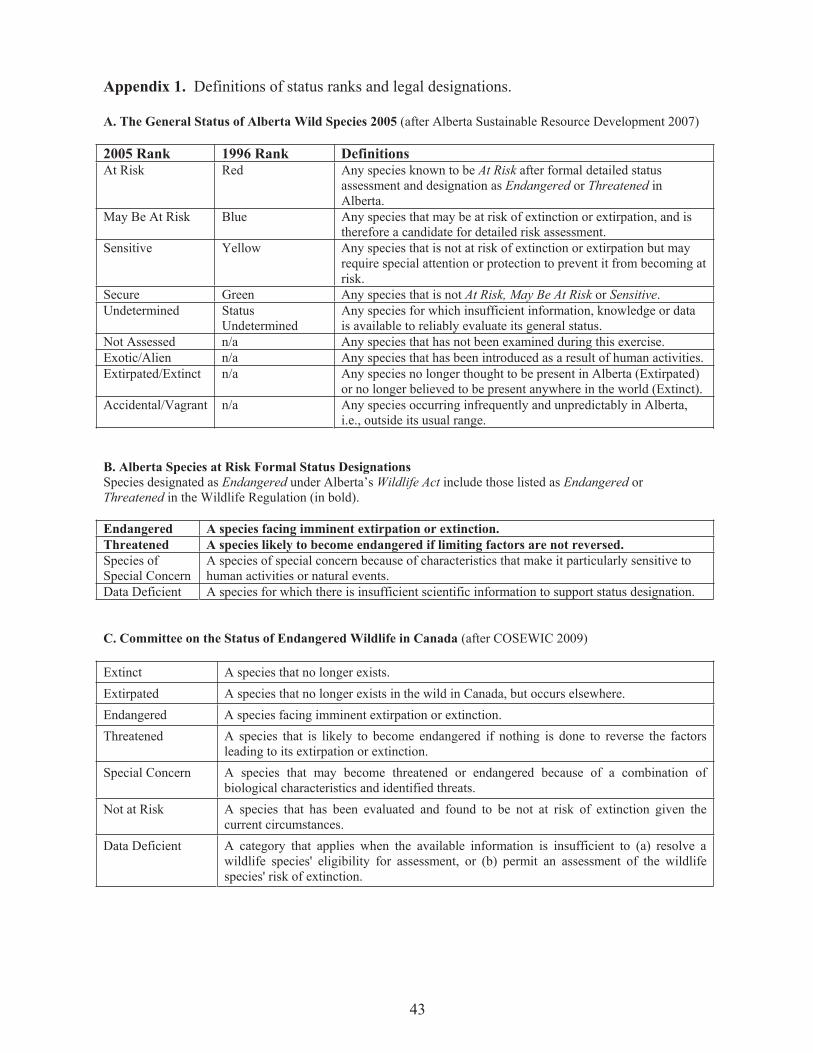
43
Appendix 1. Definitions of status ranks and legal designations.
A. The General Status of Alberta Wild Species 2005 (after Alberta Sustainable Resource Development 2007)
2005 Rank 1996 Rank Definitions At Risk Red Any species known to be At Risk after formal detailed status
assessment and designation as Endangered or Threatened in Alberta.
May Be At Risk Blue Any species that may be at risk of extinction or extirpation, and is therefore a candidate for detailed risk assessment.
Sensitive Yellow Any species that is not at risk of extinction or extirpation but may require special attention or protection to prevent it from becoming at risk.
Secure Green Any species that is not At Risk, May Be At Risk or Sensitive.Undetermined Status
Undetermined Any species for which insufficient information, knowledge or data is available to reliably evaluate its general status.
Not Assessed n/a Any species that has not been examined during this exercise. Exotic/Alien n/a Any species that has been introduced as a result of human activities. Extirpated/Extinct n/a Any species no longer thought to be present in Alberta (Extirpated)
or no longer believed to be present anywhere in the world (Extinct). Accidental/Vagrant n/a Any species occurring infrequently and unpredictably in Alberta,
i.e., outside its usual range.
B. Alberta Species at Risk Formal Status Designations Species designated as Endangered under Alberta’s Wildlife Act include those listed as Endangered or Threatened in the Wildlife Regulation (in bold).
Endangered A species facing imminent extirpation or extinction. Threatened A species likely to become endangered if limiting factors are not reversed. Species of Special Concern
A species of special concern because of characteristics that make it particularly sensitive to human activities or natural events.
Data Deficient A species for which there is insufficient scientific information to support status designation.
C. Committee on the Status of Endangered Wildlife in Canada (after COSEWIC 2009)
Extinct A species that no longer exists. Extirpated A species that no longer exists in the wild in Canada, but occurs elsewhere. Endangered A species facing imminent extirpation or extinction. Threatened A species that is likely to become endangered if nothing is done to reverse the factors
leading to its extirpation or extinction. Special Concern A species that may become threatened or endangered because of a combination of
biological characteristics and identified threats. Not at Risk A species that has been evaluated and found to be not at risk of extinction given the
current circumstances. Data Deficient A category that applies when the available information is insufficient to (a) resolve a
wildlife species' eligibility for assessment, or (b) permit an assessment of the wildlife species' risk of extinction.
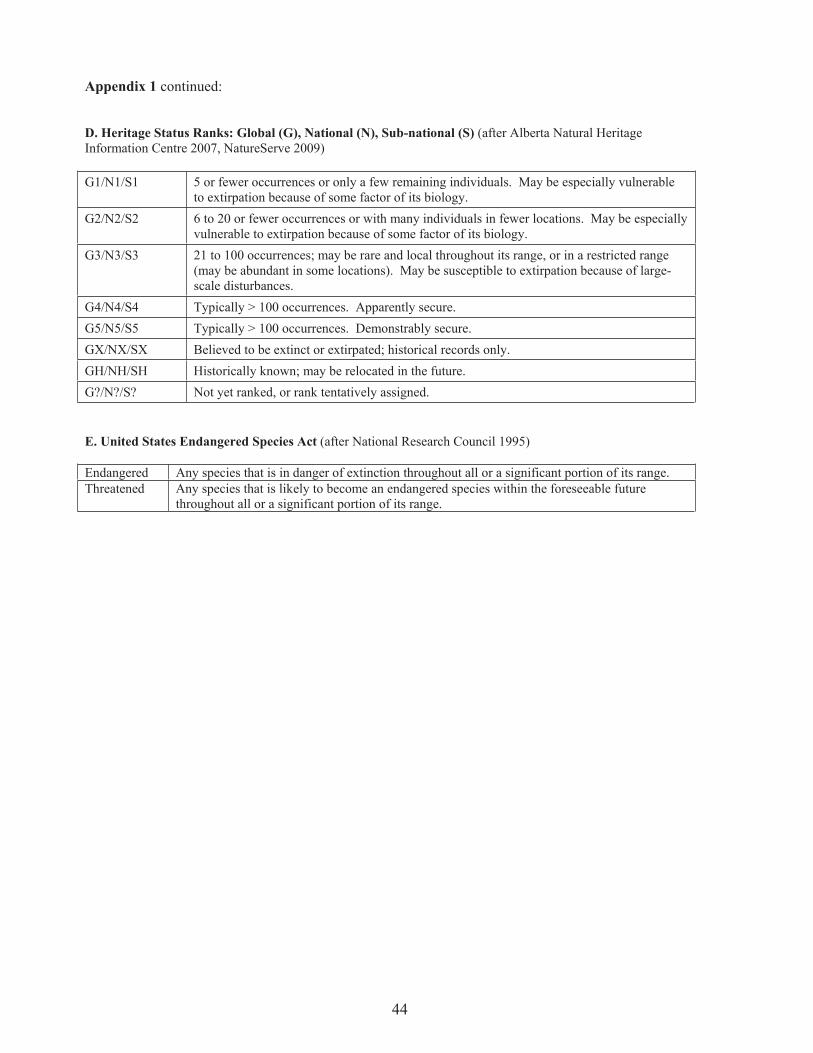
44
Appendix 1 continued:
D. Heritage Status Ranks: Global (G), National (N), Sub-national (S) (after Alberta Natural Heritage Information Centre 2007, NatureServe 2009)
G1/N1/S1 5 or fewer occurrences or only a few remaining individuals. May be especially vulnerable to extirpation because of some factor of its biology.
G2/N2/S2 6 to 20 or fewer occurrences or with many individuals in fewer locations. May be especially vulnerable to extirpation because of some factor of its biology.
G3/N3/S3 21 to 100 occurrences; may be rare and local throughout its range, or in a restricted range (may be abundant in some locations). May be susceptible to extirpation because of large-scale disturbances.
G4/N4/S4 Typically > 100 occurrences. Apparently secure. G5/N5/S5 Typically > 100 occurrences. Demonstrably secure.GX/NX/SX Believed to be extinct or extirpated; historical records only. GH/NH/SH Historically known; may be relocated in the future. G?/N?/S? Not yet ranked, or rank tentatively assigned.
E. United States Endangered Species Act (after National Research Council 1995)
Endangered Any species that is in danger of extinction throughout all or a significant portion of its range. Threatened Any species that is likely to become an endangered species within the foreseeable future
throughout all or a significant portion of its range.
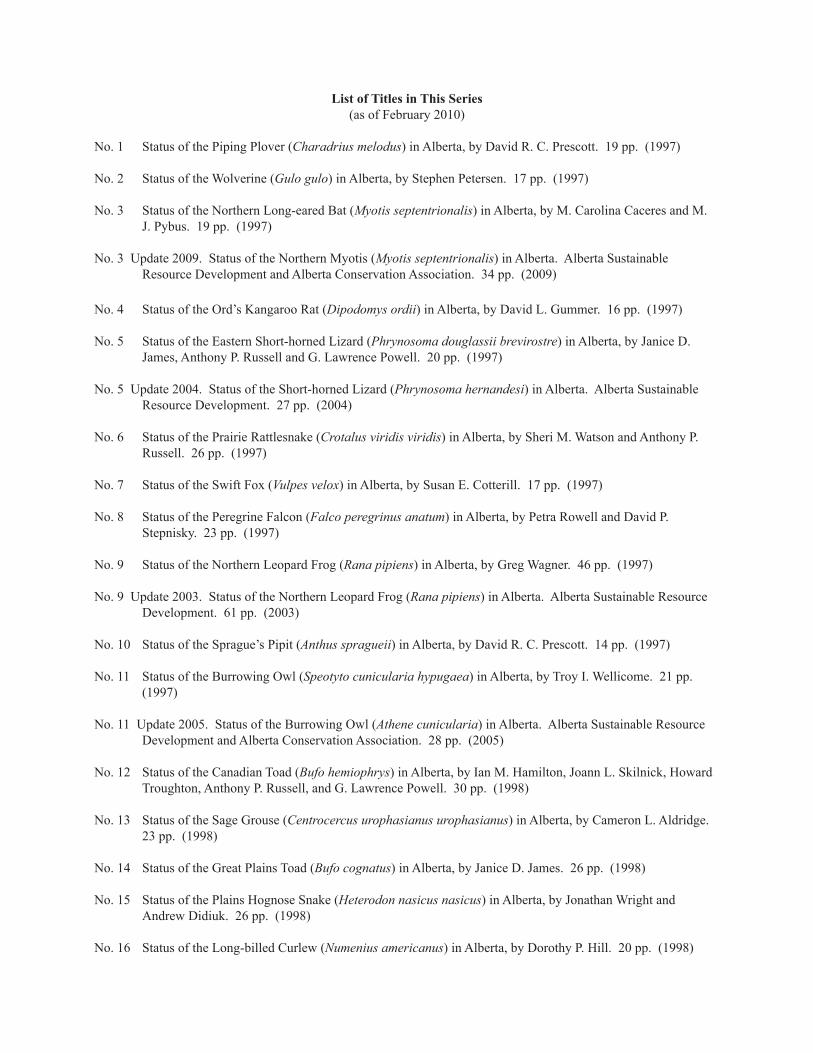
List of Titles in This Series(as of February 2010)
No. 1 Status of the Piping Plover (Charadrius melodus) in Alberta, by David R. C. Prescott. 19 pp. (1997)
No. 2 Status of the Wolverine (Gulo gulo) in Alberta, by Stephen Petersen. 17 pp. (1997)
No. 3 Status of the Northern Long-eared Bat (Myotis septentrionalis) in Alberta, by M. Carolina Caceres and M. J. Pybus. 19 pp. (1997)
No. 3 Update 2009. Status of the Northern Myotis (Myotis septentrionalis) in Alberta. Alberta Sustainable Resource Development and Alberta Conservation Association. 34 pp. (2009)
No. 4 Status of the Ord’s Kangaroo Rat (Dipodomys ordii) in Alberta, by David L. Gummer. 16 pp. (1997)
No. 5 Status of the Eastern Short-horned Lizard (Phrynosoma douglassii brevirostre) in Alberta, by Janice D. James, Anthony P. Russell and G. Lawrence Powell. 20 pp. (1997)
No. 5 Update 2004. Status of the Short-horned Lizard (Phrynosoma hernandesi) in Alberta. Alberta Sustainable Resource Development. 27 pp. (2004)
No. 6 Status of the Prairie Rattlesnake (Crotalus viridis viridis) in Alberta, by Sheri M. Watson and Anthony P. Russell. 26 pp. (1997)
No. 7 Status of the Swift Fox (Vulpes velox) in Alberta, by Susan E. Cotterill. 17 pp. (1997)
No. 8 Status of the Peregrine Falcon (Falco peregrinus anatum) in Alberta, by Petra Rowell and David P. Stepnisky. 23 pp. (1997)
No. 9 Status of the Northern Leopard Frog (Rana pipiens) in Alberta, by Greg Wagner. 46 pp. (1997)
No. 9 Update 2003. Status of the Northern Leopard Frog (Rana pipiens) in Alberta. Alberta Sustainable Resource Development. 61 pp. (2003)
No. 10 Status of the Sprague’s Pipit (Anthus spragueii) in Alberta, by David R. C. Prescott. 14 pp. (1997)
No. 11 Status of the Burrowing Owl (Speotyto cunicularia hypugaea) in Alberta, by Troy I. Wellicome. 21 pp. (1997)
No. 11 Update 2005. Status of the Burrowing Owl (Athene cunicularia) in Alberta. Alberta Sustainable Resource Development and Alberta Conservation Association. 28 pp. (2005)
No. 12 Status of the Canadian Toad (Bufo hemiophrys) in Alberta, by Ian M. Hamilton, Joann L. Skilnick, Howard Troughton, Anthony P. Russell, and G. Lawrence Powell. 30 pp. (1998)
No. 13 Status of the Sage Grouse (Centrocercus urophasianus urophasianus) in Alberta, by Cameron L. Aldridge. 23 pp. (1998)
No. 14 Status of the Great Plains Toad (Bufo cognatus) in Alberta, by Janice D. James. 26 pp. (1998)
No. 15 Status of the Plains Hognose Snake (Heterodon nasicus nasicus) in Alberta, by Jonathan Wright and Andrew Didiuk. 26 pp. (1998)
No. 16 Status of the Long-billed Curlew (Numenius americanus) in Alberta, by Dorothy P. Hill. 20 pp. (1998)
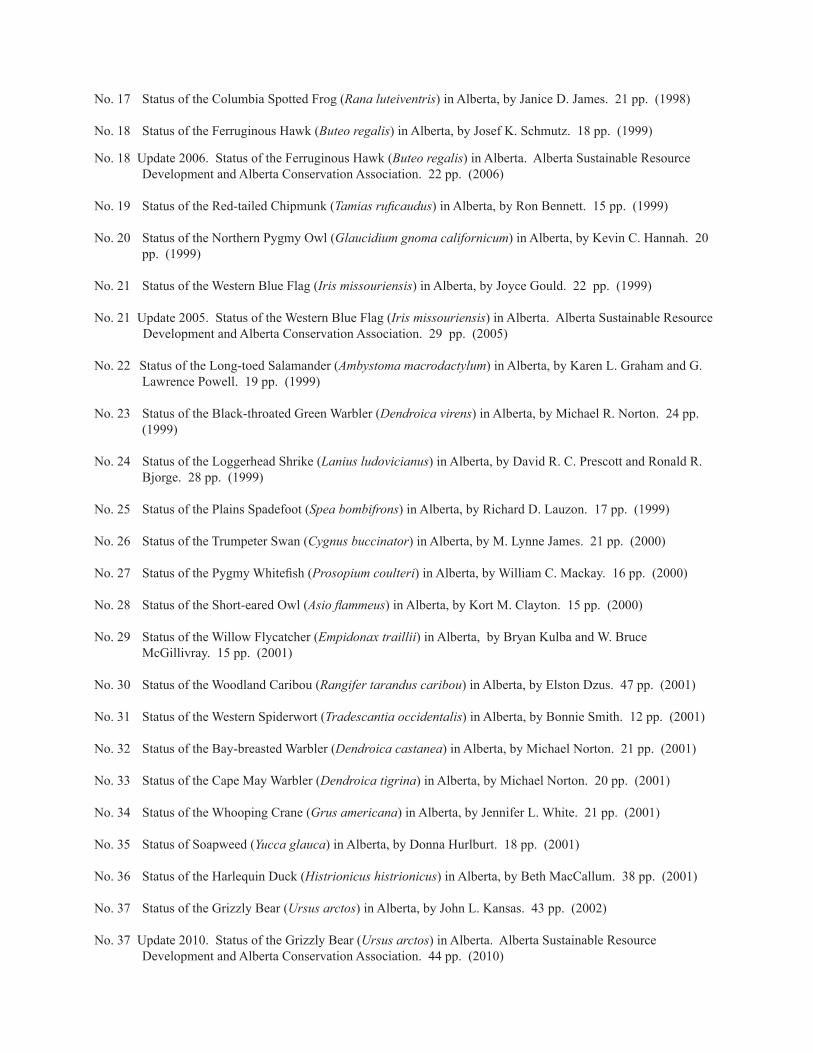
No. 17 Status of the Columbia Spotted Frog (Rana luteiventris) in Alberta, by Janice D. James. 21 pp. (1998)
No. 18 Status of the Ferruginous Hawk (Buteo regalis) in Alberta, by Josef K. Schmutz. 18 pp. (1999)
No. 18 Update 2006. Status of the Ferruginous Hawk (Buteo regalis) in Alberta. Alberta Sustainable Resource Development and Alberta Conservation Association. 22 pp. (2006)
No. 19 Status of the Red-tailed Chipmunk (Tamias ruficaudus) in Alberta, by Ron Bennett. 15 pp. (1999)
No. 20 Status of the Northern Pygmy Owl (Glaucidium gnoma californicum) in Alberta, by Kevin C. Hannah. 20 pp. (1999)
No. 21 Status of the Western Blue Flag (Iris missouriensis) in Alberta, by Joyce Gould. 22 pp. (1999)
No. 21 Update 2005. Status of the Western Blue Flag (Iris missouriensis) in Alberta. Alberta Sustainable Resource Development and Alberta Conservation Association. 29 pp. (2005)
No. 22 Status of the Long-toed Salamander (Ambystoma macrodactylum) in Alberta, by Karen L. Graham and G. Lawrence Powell. 19 pp. (1999)
No. 23 Status of the Black-throated Green Warbler (Dendroica virens) in Alberta, by Michael R. Norton. 24 pp. (1999)
No. 24 Status of the Loggerhead Shrike (Lanius ludovicianus) in Alberta, by David R. C. Prescott and Ronald R. Bjorge. 28 pp. (1999)
No. 25 Status of the Plains Spadefoot (Spea bombifrons) in Alberta, by Richard D. Lauzon. 17 pp. (1999)
No. 26 Status of the Trumpeter Swan (Cygnus buccinator) in Alberta, by M. Lynne James. 21 pp. (2000)
No. 27 Status of the Pygmy Whitefish (Prosopium coulteri) in Alberta, by William C. Mackay. 16 pp. (2000)
No. 28 Status of the Short-eared Owl (Asio flammeus) in Alberta, by Kort M. Clayton. 15 pp. (2000)
No. 29 Status of the Willow Flycatcher (Empidonax traillii) in Alberta, by Bryan Kulba and W. Bruce McGillivray. 15 pp. (2001)
No. 30 Status of the Woodland Caribou (Rangifer tarandus caribou) in Alberta, by Elston Dzus. 47 pp. (2001)
No. 31 Status of the Western Spiderwort (Tradescantia occidentalis) in Alberta, by Bonnie Smith. 12 pp. (2001)
No. 32 Status of the Bay-breasted Warbler (Dendroica castanea) in Alberta, by Michael Norton. 21 pp. (2001)
No. 33 Status of the Cape May Warbler (Dendroica tigrina) in Alberta, by Michael Norton. 20 pp. (2001)
No. 34 Status of the Whooping Crane (Grus americana) in Alberta, by Jennifer L. White. 21 pp. (2001)
No. 35 Status of Soapweed (Yucca glauca) in Alberta, by Donna Hurlburt. 18 pp. (2001)
No. 36 Status of the Harlequin Duck (Histrionicus histrionicus) in Alberta, by Beth MacCallum. 38 pp. (2001)
No. 37 Status of the Grizzly Bear (Ursus arctos) in Alberta, by John L. Kansas. 43 pp. (2002)
No. 37 Update 2010. Status of the Grizzly Bear (Ursus arctos) in Alberta. Alberta Sustainable Resource Development and Alberta Conservation Association. 44 pp. (2010)
No. 38 Status of the Wood Bison (Bison bison athabascae) in Alberta, by Jonathan A. Mitchell and C. Cormack Gates. 32 pp. (2002)
No. 39 Status of the Bull Trout (Salvelinus confluentus) in Alberta, by John R. Post and Fiona D. Johnston. 40 pp. (2002)
No. 39 Update 2009. Status of the Bull Trout (Salvelinus confluentus) in Alberta. Alberta Sustainable Resource Development and Alberta Conservation Association. 48 pp. (2009)
No. 40 Status of the Banff Springs Snail (Physella johnsoni) in Alberta, by Dwayne A.W. Lepitzki. 29 pp. (2002)
No. 41 Status of the Shortjaw Cisco (Coregonus zenithicus) in Alberta, by Mark Steinhilber. 23 pp. (2002)
No. 42 Status of the Prairie Falcon (Falco mexicanus) in Alberta, by Dale Paton. 28 pp. (2002)
No. 43 Status of the American Badger (Taxidea taxus) in Alberta, by Dave Scobie. 17 pp. (2002)
No. 44 Status of the Yucca Moth (Tegeticula yuccasella) in Alberta. Alberta Sustainable Resource Development. 21 pp. (2002)
No. 45 Status of the White-winged Scoter (Melanitta fusca deglandi) in Alberta. Alberta Sustainable Resource Development. 15 pp. (2002)
No. 46 Status of the Lake Sturgeon (Acipenser fulvescens) in Alberta. Alberta Sustainable Resource Development. 30 pp. (2002)
No. 47 Status of the Western Silvery Minnow (Hybognathus argyritis) in Alberta. Alberta Sustainable Resource Development. 24 pp. (2003)
No. 48 Status of the Small-flowered Sand Verbena (Tripterocalyx micranthus) in Alberta. Alberta Sustainable Resource Development. 24 pp. (2003)
No. 49 Status of the Brown Creeper (Certhia americana) in Alberta. Alberta Sustainable Resource Development. 30 pp. (2003)
No. 50 Status of the Mountain Plover (Charadrius montanus) in Alberta. Alberta Sustainable Resource Development. 25 pp. (2003)
No. 51 Status of the St. Mary Shorthead Sculpin (provisionally Cottus bairdi punctulatus) in Alberta. Alberta Sustainable Resource Development. 24 pp. (2003)
No. 52 Status of the Stonecat (Noturus flavus) in Alberta. Alberta Sustainable Resource Development. 22 pp. (2003)
No. 53 Status of the Sage Thrasher (Oreoscoptes montanus) in Alberta. Alberta Sustainable Resource Development. 23 pp. (2004)
No. 54 Status of the Tiny Cryptanthe (Cryptantha minima) in Alberta. Alberta Sustainable Resource Development. 39 pp. (2004)
No. 55 Status of the Slender Mouse-ear-cress (Halimolobos virgata) in Alberta. Alberta Sustainable Resource Development. 27 pp. (2005)
No. 55 Update 2009. Status of the Slender Mouse-ear-cress (Halimolobos virgata or Transberingia bursifolia subsp. virgata) in Alberta. Alberta Sustainable Resource Development and Alberta Conservation Association. 28 pp. (2009)
No. 56 Status of the Barred Owl (Strix varia) in Alberta. Alberta Sustainable Resource Development. 15 pp. (2005)
No. 57 Status of the Arctic Grayling (Thymallus arcticus) in Alberta. Alberta Sustainable Resource Development. 41 pp. (2005)
No. 58 Status of the Weidemeyer’s Admiral (Limenitis weidemeyerii) in Alberta. Alberta Sustainable Resource Development and Alberta Conservation Association. 13 pp. (2005)
No. 59 Status of the Porsild’s Bryum (Bryum porsildii) in Alberta. Alberta Sustainable Resource Development and Alberta Conservation Association. 30 pp. (2006)
No. 60 Status of the Western Grebe (Aechmophorus occidentalis) in Alberta. Alberta Sustainable Resource Development and Alberta Conservation Association. 29 pp. (2006)
No. 61 Status of the Westslope Cutthroat Trout (Oncorhynchus clarkii lewisii) in Alberta. Alberta Sustainable Resource Development and Alberta Conservation Association. 34 pp. (2006)
No. 62 Status of the Limber Pine (Pinus flexilis) in Alberta. Alberta Sustainable Resource Development and Alberta Conservation Association. 17 pp. (2007)
No. 63 Status of the Whitebark Pine (Pinus albicaulis) in Alberta. Alberta Sustainable Resource Development and Alberta Conservation Association. 22 pp. (2007)
No. 64 Status of the Western Small-footed Bat (Myotis ciliolabrum) in Alberta. Alberta Sustainable Resource Development and Alberta Conservation Association. 24 pp. (2008)
No. 65 Status of the Verna’s Flower Moth (Schinia verna) in Alberta. Alberta Sustainable Resource Development and Alberta Conservation Association. 17 pp. (2008)
No. 66 Status of the Athabasca Rainbow Trout (Oncorhynchus mykiss) in Alberta. Alberta Sustainable Resource Development and Alberta Conservation Association. 32 pp. (2009)