Embed Size (px)
Citation preview

CONFIDENTIAL AND PROPRIETARY
Any use of this material without specific permission of McKinsey & Company is strictly prohibited
June 30th 2020
Status of the Automotive Supplier Industry
Pulse Check Results – 3rd COVID-19 survey
DRAFT

McKinsey & Company 1
Your McKinsey team for today’s presentation
McKinsey & Company
Dr. Isabel Huber
Partner
▪ Leader of McKinsey's sales &
channel management and pricing
service line
▪ 7+ years of experience within the
automotive industry
Dr. Dirk Breitschwerdt
Senior Partner
▪ Leader of McKinsey's automotive
supplier sector in EMEA
▪ 15+ years of automotive
experience, focusing on
automotive suppliers
Dr. Lukas Michor
Partner
▪ Leader of McKinsey's automotive
supplier sector in EMEA
▪ 9+ years of experience,
supported 15+ automotive
suppliers
Christian Doppler
Associate Partner
▪ Leader in McKinsey‘s procurement
and product development practice
▪ Longstanding experience in
automotive supplier space

McKinsey & Company 2
McKinsey Perspective – Scenarios and Consumer
Insights
• Updated scenarios for economic development & expected
impact on the light vehicle industry
• Consumer insights on purchase intent & mobility patterns
• Impact nugget – Raw material claw back opportunities
Pulse Check – Automotive Supplier Response
• Impact of COVID-19 crisis on automotive suppliers
• Current challenges, structural measures, and remote
work in the new normal
3rd COVID-19 Pulse Check
June 2020
The 3rd COVID-19 Pulse Check focuses on …

McKinsey & Company 3
90%
First positive signs on the horizon as impact on 2020 improved slightly; however 80% still believe in revenue reductions of >20%
COVID-19 CRISIS RESPONSE
1. March 20-24 2. April 27-30 3. June 15-23 Note: Displayed percent values without accounting for "N/A" answers. N=116 (March 20-24, 2020), N=79 (April 27-30, 2020), N=36 (June 15-23, 2020)
SOURCE: McKinsey CLEPA Pulse Check Survey
In April and May we saw
sales levels at only 25%,
in June we reached 40% -
there might be hope for a
recovery
31%
22%
34%
40% 37%
56%10%
50%19%
+9 p.p.
-30 p.p.
What is the total estimated effect in 2020 on your company’s revenue?(% below plan)
Selected quotes from
respondents
End of March1
End of April2
Survey conducted between June 15 – 23, 2020
The outlook of respondents on revenue in 2020 improved slightly vs. April estimates, still significantly worse than March
82% of respondents now believe in revenue reductions of more than 20% vs. plan
IMPACT OF COVID-19 CRISIS ON AUTOMOTIVE SUPPLIERS
20-30% >30%5-20%60%
82%
Mid June3
First 2 weeks in June
were better than
expected, especially in
the US

McKinsey & Company 4
50% 39%
Although profitability estimates have slightly improved, only 39% of suppliers are confident to achieve a profit in 2020
COVID-19 CRISIS RESPONSE
SOURCE: McKinsey CLEPA Pulse Check Survey
We implemented a
strong cost-saving
policy
Selected quotes from
respondents 12%15%17%24%
39%
32%
28%11% 11%11%
Which profitability do you expect for 2020 after accounting for this effect?
56% 27%
IMPACT OF COVID-19 CRISIS ON AUTOMOTIVE SUPPLIERS
End of April1
12% of respondents expect
profitability below -10%
-5% or below -5% to -1% -1% to 1% 1% to 5% above 5%
1. April 27-30 2. June 15-23 Note: Displayed percent values without accounting for "N/A" answers. N=79 (April 27-30, 2020), N=36 (June 15-23, 2020)
Mid June²
Survey conducted between June 15 – 23, 2020
Liquidity and fixed cost
management are biggest
challenges

McKinsey & Company 5
While short-term revenue and profit outlook slightly increased, suppliers became more skeptical on the time until a full recovery
COVID-19 CRISIS RESPONSE
How long will it take until your company has fully recovered from the COVID-19 impact?
SOURCE: McKinsey CLEPA Pulse Check Survey
Almost 90% of respondents believe recovery will not be achieved within this year
Despite initial signs of recovery, half of respondents believe in a delay over 2 years, with one fifth expecting even
more than 3 years until successful recovery
17%
< 6 months >24 months
8%
6-12 months
3%
12-24 months >36 months
55%
42%
17%
11%
24%
47%
4%
21%
28%
8%
17%
June 15-23March 20-24 April 27-30
Note: Displayed percent values without accounting for "N/A" answers. N=116 (March 20-24, 2020), N=79 (April 27-30, 2020), N=36 (June 15-23, 2020)
IMPACT OF COVID-19 CRISIS ON AUTOMOTIVE SUPPLIERS
~50% now believe recovery
will take more than
two years
Survey conducted between June 15 – 23, 2020

McKinsey & Company 6
Incentives
schemes to
increase
retention
Future business
modell
challenges
Incentives
schemes to
increase
retention
COVID-19 CRISIS RESPONSE
SOURCE: McKinsey CLEPA Pulse Check Survey
In addition to revenue and profitability impact, the Pulse Check survey focuses on the short- and mid/long term measures taken by suppliers
IMPACT OF COVID-19 CRISIS ON AUTOMOTIVE SUPPLIERS
Implementation
of structural
measures
Short-term challenges and response measures
Mid-term/long-term measures
Long-term
increase in
remote working
Focus for today
Motivtaion of
employees
OEM
negotiations on
damage claims
Adaption of
bonus /incentive
schemes
Planning ahead
for Wave 2
Ensure employee
health & safety
Changes in
supply chain
setup (e.g.,
localization)
Challenges in
S&OP planning

McKinsey & Company 7
COVID-19 CRISIS RESPONSE
How serious is your company planning for a potential further wave of COVID-19 and related restrictions
this fall/winter?
42%
6%
Fully detailed, cross-functional plan shared
and aligned with board and executives
Initial central discussions amongst
executives/top management47%
Uncoordinated planning effort
in some functions or departments
Not at all
6%
SOURCE: McKinsey CLEPA Pulse Check Survey
Large majority of suppliers are preparing for further waves of COVID-19 cases and related economic effects and restrictions
Note: Displayed percent values without accounting for "N/A" answers. N=36 (June 15-23, 2020)
PREPARATION FOR NEXT WAVE
Broad majority of respondents is already planning ahead for potential further waves
More than 40% already finalized their detailed cross-functional mitigation plan
Survey conducted between June 15 – 23, 2020
McKinsey & Company 8
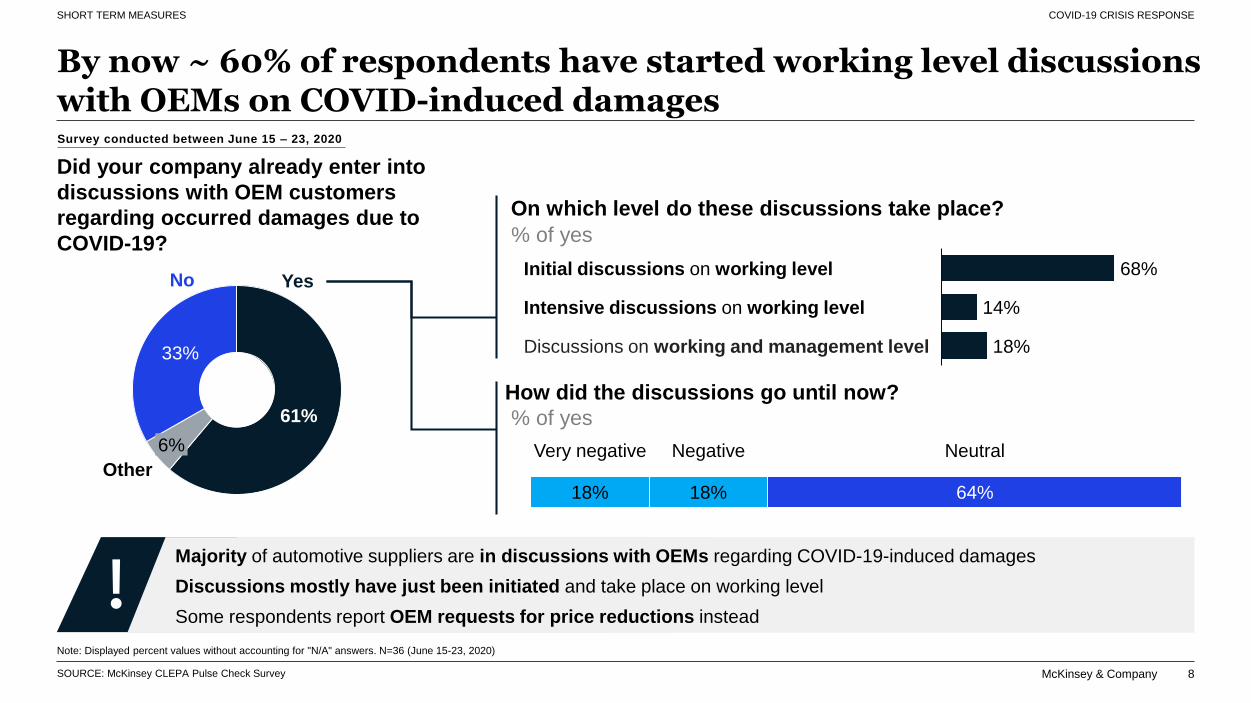
By now ~ 60% of respondents have started working level discussions with OEMs on COVID-induced damages
COVID-19 CRISIS RESPONSE
14%Intensive discussions on working level
18%
Initial discussions on working level
Discussions on working and management level
68%
SOURCE: McKinsey CLEPA Pulse Check Survey
Did your company already enter into
discussions with OEM customers
regarding occurred damages due to
COVID-19?
Majority of automotive suppliers are in discussions with OEMs regarding COVID-19-induced damages
Discussions mostly have just been initiated and take place on working level
Some respondents report OEM requests for price reductions instead
SHORT TERM MEASURES
Survey conducted between June 15 – 23, 2020
Other
Yes
61%
6%
33%
No
% of yes
Note: Displayed percent values without accounting for "N/A" answers. N=36 (June 15-23, 2020)
On which level do these discussions take place?
How did the discussions go until now?
% of yes
18%
Very negative Negative
64%18%
Neutral

McKinsey & Company 9
Which long-term, structural measures in response to COVID-19 do
you consider to take?
Since the last survey, a significant increase in implementation of long-term structural measures in response to COVID-19 can be observed
SOURCE: McKinsey CLEPA Pulse Check Survey
What progress did you already
make?
MID-/LONG-TERM MEASURES
25%
Yet to start
implementation
13%
62%
In implementation
Already
implemented
Ø status of decided measures
Note: Displayed percent values without accounting for "N/A" answers. N=36 (June 15-23, 2020)
Survey conducted between June 15 – 23, 2020
100
85
73
72
64
64
63
47
84
78
39
17
25
36
32
25
Optimization of footprint
Investment optimization
Increase depth of value add
Delay of strategic investments
into future trends
Overhead optimization
Streamlining/shortening
of the supply chain
Adaptation of portfolio
Increased partnerships and M&A
June 15-23 April 27-30
COVID-19 CRISIS RESPONSE

McKinsey & Company 10
~30%Believe one day of
remote work per
week will be part
of new normal
Overall, the industry remains unsure about the future share of remote work…
SOURCE: McKinsey CLEPA Pulse Check Survey, Gartner
Which part 1 of your workforce will be allowed to work
remotely in the future?
Survey conducted between June 15 – 23, 2020
1 Share of workforce that is able to work remote (and is/was working remotely during crisis)
Note: Displayed percent values without accounting for "N/A" answers. N=36 (June 15-23, 2020)
MID-/LONG-TERM MEASURES
…and will vary greatly by function
Which functions do you mainly
expect to continue to work remote?
Other:
31%
IT
19%
Controlling/
Finance
Sales
Procurement
HR
63%
Research/
Development
59%
56%
44%
34%0-5%
19%
11%
5-10% 10-20%
28%
>20%
42%
E.g., customer
care, project
management
Industry generally remains conservative regarding remote
work – however already 30% expect that one day of remote
work per week will be possible
COVID-19 CRISIS RESPONSE

McKinsey & Company 11
McKinsey Perspective – Scenarios and Consumer
Insights
• Updated scenarios for economic development & expected
impact on the light vehicle industry
• Consumer insights on purchase intent & mobility patterns
• Impact nugget – Raw material claw back opportunities
Pulse Check – Automotive Supplier Response
• Impact of COVID-19 crisis on automotive suppliers
• Current challenges, structural measures, and remote
work in the new normal
3rd COVID-19 Pulse Check
June 2020
The 3rd COVID-19 Pulse Check focuses on …

McKinsey & Company 12Source: McKinsey surveys of global executives
Executives have wide-ranging expectations of global outcomes“Thinking globally, please rank the following scenarios in order of how likely you think they are to occur over
the course of the next year”; % of total European respondents1
Updated June 9, 2020
1. Monthly surveys: April 2–April 10, 2020, N=2,079, 769 in Europe; May 4–May 8, 2020, N=2,452, 901 in Europe; June 1–5, N=2,174, 755 in Europe
Virus
spread
and public
health
response
Effective response,
but (regional) virus
resurgence
Broad failure of
public health
interventions
Rapid and effective
control
of virus spread
Knock-on effects and economic policy response
Ineffective
interventions
Partially effective
interventions
Highly effective
interventions
A3
A1 A2
A4B1
B2
B3 B4 B5
Europe April →May → June surveys
14→15→14%
13→12→12%
2→2→1%
15→15→22%
37→40→34%
8→8→8%
4→3→4%
6→4→4%
2→1→1%
ECONOMIC DEVELOPMENT

McKinsey & Company 13
A3-Scenario assumes 20% sales volume loss under risk in key automotive markets in 2020Light vehicle sales volume 2020, in mn units
Selected geographies cover 85% of global automotive sales
A3
Preliminary modeling – one possible scenario As of June 08
1. Based on publicly available information on OEM plant closure plus anticipation of production losses during ramp-up– adaption of production to demand not considered here (esp. catch-up of lost production volumes)
2. Japan, South Korea, Brazil Actual, India based on forecast simulation 3. Based on ~85% of volumes
Source: IHS; MarkLines; CAAM; Monthly volume forecasts based on 2019 actuals, adjustment factor applied to represent Chinese New Year Holiday effect; expert interviews
~96%~90%
58%70%
60%
~83%
38%
~72%
Ref.
A33
A3
Sales forecast incl. COVID effectCurrently announced supply planning1
Sales forecast before COVIDSales actuals
A32
Actuals Forecast simulation
6.2
Jan Jul
6.3
Jun
5.9
SepApr May
5.7
NovAug
6.2
MarFeb Oct
5.9
Dec
5.5
7.5
5.8
6.26.4
6.8
Important note
Production capacity effect with good predictability
due to shut down actions/announcements
Sales forecast represents rough estimate based
on assumptions (without recognition of delays in
existing order pipelines)
Potential positive effects of automotive specific
government stimulus not included
12 % of 2020
sales lost
~76% ~82%
~90%~91%
~93%
~81%
~95%~97%
~68%
71%
~8% of 2020
sales lost
~96%
ECONOMIC DEVELOPMENT

McKinsey & Company 14
JunJan Apr
1.9
AugMay
2.2
SepMarFeb
1.6
1.4
OctJul Dec
1.7
1.5
Nov
1.71.8
1.7
1.4
1.8
1.7
A3-Scenario shows up to 25-30% sales volume at risk in European automotive market in 2020 vs totalEuropean light vehicle sales volume 2020, in mn units
1. Based on publicly available information on OEM plant closure plus anticipation of production losses during ramp-up– adaption of production to demand not considered here (esp. catch-up of lost production volumes)
Source: IHS; MarkLines; Monthly volume forecasts based on 2019 actuals
In total: 5.5-6 mn sales units lost (25-30% of 2020 sales)
23%
~15%
54%
98%97%
~80%
65% 75%
80%
82%85%
87%
90%~61%
Important note
Production capacity effect with good predictability
due to shut down actions/announcements
Sales forecast represents rough estimate based
on assumptions (without recognition of delays in
existing order pipelines)
Potential positive effects of automotive specific
government stimulus not included
A3
Preliminary modeling – one possible scenario
17% of 2020
sales lost
8-13% of 2020
sales lost
As of June 08
43%
~98%
Sales forecast incl. COVID effectCurrently announced supply planning1
Sales forecast before COVIDSales actuals
Actuals Forecast simulation
Preliminary based on
84% of the volumes
ECONOMIC DEVELOPMENT

McKinsey & Company 15
Europe/US still strongly affected but in recovery with -58% and -30% respectively; China fully recovered and growing +11%2020 light vehicles sales growth rate per month (year on year)
Source: Marklines Global Vehicles Sales Data (April 2020)
As of June 17
Jan 20 Feb 20 Mar 20
Worse than -60% -60% to -40% -40% to -20% -20% to 0% Better than 0%
-20% -81% -45% +1% Second consecutive month of significant sales
improvements driven by innovative sales
approach and strong consumer confidence
+1% +9% -38% -47% Recovery in demand, due to removal of
lockdown and subsidies from OEMs
-5% -5% -50% -77% Still plunging demand, but in recovery vs
previous month, affected by prolonged lockdown
in some countries (UK) and economic impact
-12% -10% -9% -29% Implementation of lockdowns only
implemented in mid-April and only for some
regions
Apr 20
+11%
-30%
-58%
-45%
May 20
Note: Europe based on 84% of volumes
ECONOMIC DEVELOPMENT

McKinsey & Company 16
Consumer’s car purchase intent and mobility below pre-COVID-19 levels but recovering
1.Q: Before the COVID-19 / COVID-19 crisis started, how likely were you to buy a new car? 2 Q: During or after the COVID-19 / COVID-19 crisis, how likely will you be to buy a new car?
3 Q: What type of maintenance, repair and improvement work have you delayed or done additionally?
Sampled to match gen pop 18+ years within markets; individual markets weighted based on 2019 car market size, figures may not sum to 100% because of rounding
New car purchase intent1,2
Percent of respondents
69
52 53 58
31
31 2928
May 27-29Before
COVID-19
May 9-11 June 16-18
Likely
Very/
extremely
likely
100
83 8286
-14%
AS OF JUNE 29, 2020
Car buying Aftermarket Mobility
18%
+2%
Plan for
next month
20%
16%
37%
41%
+21%
56%
Up until now
Done additional
No changes
Delay
Changes in maintenance and repair
since beginning of COVID-193
% of respondents
Change mobility mode use% of respondents using mode ≥ once/week
Net impact (Δ p.p. "done add." vs "delay")
78
64 69 7279
37
19 23 23
37
14 11 12 12 15
Wave
2
Wave
1
Be-
fore
crisis
Wave
3
Next
normal
11 9 10 9 12
Wave
2
Wave
3
Be-
fore
crisis
Next
normal
Wave
1
Private car Public transportation
Shared micromobility Car sharing
Source: McKinsey Global COVID-19 Automotive Consumer Survey (May 9-17, May 27-29, June 16-18)
CUSTOMER PREFERENCES

McKinsey & Company 17
New car purchase intent ~-25% vs. pre-COVID-19 in US, UK, IT; markets except IT recovering; CN stable close to pre-COVID-19
1. Q: BEFORE the COVID-19 crisis started, how likely were you to purchase or lease a new or used vehicle within the next 12 months?
2. Q: Given TODAY’S situation, how likely are you to purchase or lease a new or used vehicle within the next 12 months?
Purchase intent new cars vs. pre-COVID-19 level 1,2
Percent
74
31 3649
26
3027
27
Before
COVID-
19
May
9-11
100
May
27-29
June
16-18
6064
76
-24%
Likely Very/extremely likely Change in %
73
4148 49
27
2222 25
June
16-18
100
Before
COVID-
19
May
9-11
May
27-29
6370
74
-26%
FranceGermany ItalyUKUS China
70
4658 58
30
33
2634
May
27-29
Before
COVID-
19
May
11-13
June
16-18
79
100
84
91
-9%
61
37 36 34
39
37 39 40
75 75
Before
COVID-
19
May
11-13
May
27-29
June
16-18
100
74
-26%
AS OF JUNE 29, 2020
73 6860
68
2730
3125
June
16-18
Before
COVID-
19
May
27-29
May
14-15
100 9891 93
-7%
67
4659 59
33
44
3748
May
15-17
May
27-29
89
Before
COVID-
19
June
16-18
10096
106
+6%
Source: McKinsey Global COVID-19 Automotive Consumer Survey (May 9-17, May 27-29, June 16-18)
CUSTOMER PREFERENCES

McKinsey & Company 18
Aside from cash discount, 0% financing is consumers’ preferred discount type
1. Q: Which of the following incentive types would make you most likely to purchase/lease a vehicle in the next 1-2 months aside from cash?
Source: McKinsey Global COVID-19 Automotive Consumer Survey (May 9-17, May 27-29, June 16-18)
AS OF JUNE 29, 2020
Preferred discount type1
Percent of respondents
4339
50
32
52
35
55
30
13 141616
1516 15 16
2213
17 16
18
14
3228
32 2938
32
9
1311
1613 17
7 167
9
6
20
11
17
2922 24
19 16
31 33
0% financing for 60-84 months
Up to 90 days deferred payment option for new purchasers
Up to 6 months cover for new vehicle owners who may lose their jobs
Free activation of telematics, emergency assistance features
Free Wi-Fi data for specified time period
JapanChinaItalyFranceGermanyUKUS
Discount
in-kind
0% financing
Payment
deferment

McKinsey & Company 19
Walking / biking and micromobility potentially becoming more popular in the modal mix of the "next normal"
Source: McKinsey Center for Future Mobility, Results of wave 1 (May 9-18), wave 2 (May 27-29), and wave 3 (June 16-18)
Usage of transportation modes on a regular basis1,2
Number of respondents stating at least weekly, in percent
1 Q: Before/today/when you return to "next normal", how often did/do you/do you expect to use the following modes of transportation?
2. Once or more than once per week, aggregated results from US, UK, Germany, Italy, France, China and Japan
78
64
69
72
79Return to
"normal life"
Before crisis
Wave 1
Wave 2
Wave 3
+5
+3
37
19
23
23
37
+3
0
61
57
60
60
67
+3
0
14
11
12
12
15
+1
-1
11
9
10
9
12
+1
-1
14
10
12
11
15
+1
-1
Private car Public transport
Walking or biking
with private bike
Micromobility (e.g.,
e-scooter, e-bike)
Car sharing
(e.g., ShareNow)
Ride hailing (e.g.,
Uber, Lyft, taxis)
What we
expect in
the "Next
Normal"
Potential long-lasting effects as cities
might extend measures beyond lock-
down to reduce traffic and air pollution
Slight recovery
expected as
curfews are lifted;
strict hygiene
protocols to be
installed
As ride hailers take physical
measures to reduce risk of infection
(e.g. protective shields), demand will
rebound again
Car usage will decrease
in city centers as cities
disincentivize private
vehicle ownership (e.g.,
inner-city bans,
congestion charges)
▪ Respondents
expect an
increased
usage of
walking /
biking and
micro-
mobility when
returning to
“normal life”
▪ Private car
usage picked
up fastest
over the last
month
▪ Walking /
biking almost
back to a pre-
crisis level
x Mobility recovery, in p.p. Mobility usage pre-
vs. post-crisis
Mobility usage
during crisis
AS OF JUNE 29, 2020CUSTOMER PREFERENCES

McKinsey & Company 20Source: McKinsey Center for Future Mobility
Across markets, consumers expect to shift from airplanes and trains for intercity travelling to an increased use of private vehicles
Change of mode for intercity travelling when returning to "next normal" vs. habits before COVID-19 outbreak1
Number of respondents2, in percent
Airplane
Train
Private
vehicle
1 Q: After you return to next normal, how do you think travelling between cities will change compared to before the COVID-19 outbreak?
2. Consumers that have not used this mode of transportation before the COVID-19 outbreak excluded of scope of country
24
-40 -33 -41 -32 -35 -43 -50 -40
1416 19 12 1714 14
Increased usage Decreased usageResults of wave 1 (May 9-18), wave 2 (May 27-29), and wave 3 (June 16-18)
Global3
28
-32 -31 -33 -20 -32 -30 -41 -33
1818 151919 1613
32 32 24 23 38 2749
27-13 -9-13 -14 -17-10 -14-9
AS OF JUNE 29, 2020CUSTOMER PREFERENCES

McKinsey & Company 21
Significant raw material opportunity for automotive suppliers, given price drop in polymers and metals
Technology player
Automotive player
Automotive player
-45%
-32%
-19%
1. Assess 30% share of RM cost of 30%
1920180
20 2021
-34%
Source: IHS, web pages
3-6%
RM price drop
Component
price1
10-20%
Influencing factors
1.) Oil and energy price drops
2.) Decline in manufacturing
Share of spend directly linked to index or RM program2 Even advanced
procurement orga-
nizations do not fully
capture the raw material
opportunity
1 Prices of major raw
materials in automotive
parts dropped
12 month price change
Polypropylene:
Aluminum:
Steel:
-20%
-10%
-10%
Polyamide 66, $ per metric ton
Core tools:
1.) Digital input cost monitoring
2.) Raw material cleansheets
3.) Indexation scan
3 Systematic scan for
opportunities shows
high impact
RAW MATERIAL CLAW BACK
# of raw material part to index
relationships of automotive player:
>100.000

McKinsey & Company 22
Your McKinsey team for today’s presentation
McKinsey & Company
Dr. Isabel Huber
Partner
▪ Leader of McKinsey's sales &
channel management and pricing
service line
▪ 7+ years of experience within the
automotive industry
Dr. Dirk Breitschwerdt
Senior Partner
▪ Leader of McKinsey's automotive
supplier sector in EMEA
▪ 15+ years of automotive
experience, focusing on
automotive suppliers
Dr. Lukas Michor
Partner
▪ Leader of McKinsey's automotive
supplier sector in EMEA
▪ 9+ years of experience,
supported 15+ automotive
suppliers
Christian Doppler
Associate Partner
▪ Leader in McKinsey‘s procurement
and product development practice
▪ Longstanding experience in
automotive supplier space