Embed Size (px)
Citation preview
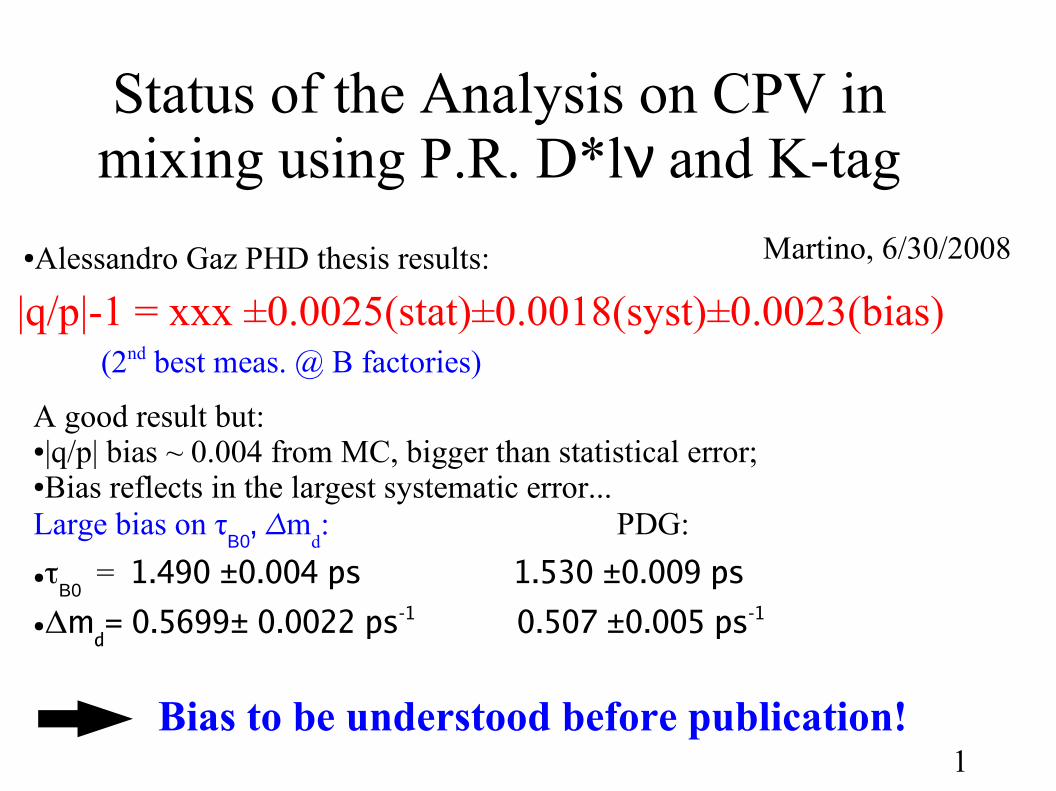
Status of the Analysis on CPV in mixing using P.R. D*lν and K-tag
Martino, 6/30/2008●Alessandro Gaz PHD thesis results:
|q/p|-1 = xxx ±0.0025(stat)±0.0018(syst)±0.0023(bias) (2nd best meas. @ B factories)
A good result but: ●|q/p| bias ~ 0.004 from MC, bigger than statistical error; ●Bias reflects in the largest systematic error... Large bias on τ
Β0, ∆m
d: PDG:
●τΒ0
= 1.490 ±0.004 ps 1.530 ±0.009 ps
●Δmd= 0.5699± 0.0022 ps-1 0.507 ±0.005 ps-1
Bias to be understood before publication!1
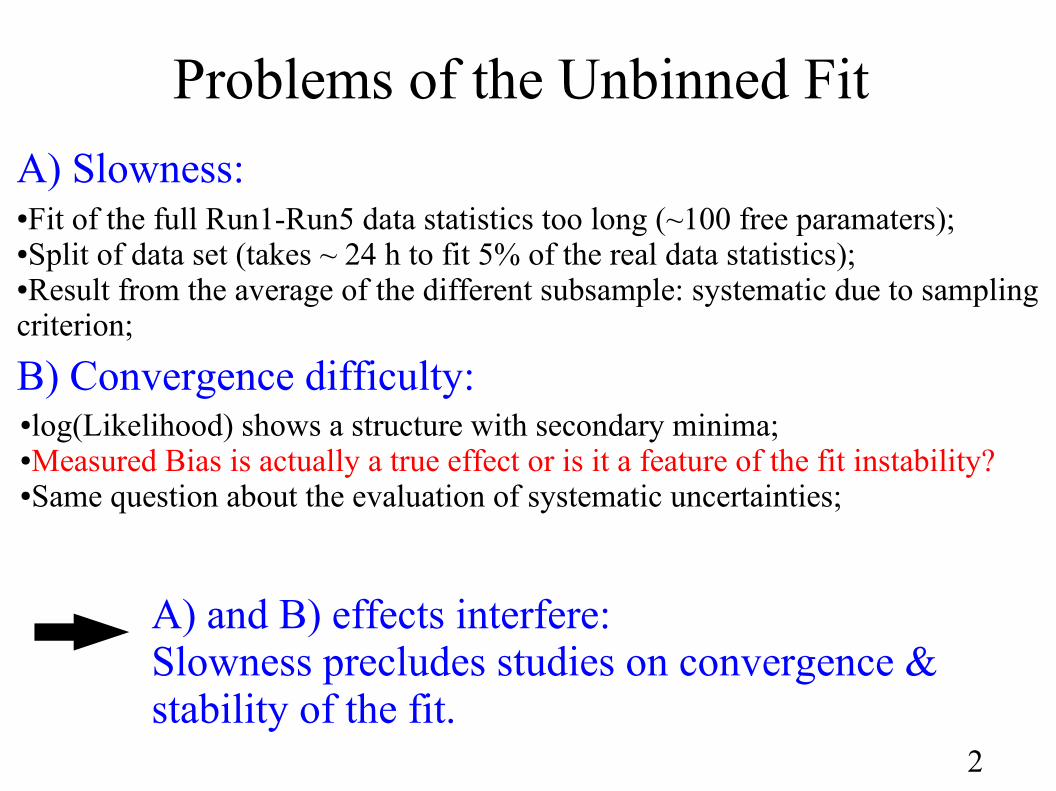
Problems of the Unbinned Fit
2
A) Slowness:●Fit of the full Run1-Run5 data statistics too long (~100 free paramaters);●Split of data set (takes ~ 24 h to fit 5% of the real data statistics);●Result from the average of the different subsample: systematic due to sampling criterion;
B) Convergence difficulty:●log(Likelihood) shows a structure with secondary minima;●Measured Bias is actually a true effect or is it a feature of the fit instability?●Same question about the evaluation of systematic uncertainties;
A) and B) effects interfere:Slowness precludes studies on convergence &stability of the fit.
Solution: Binned Fit
3
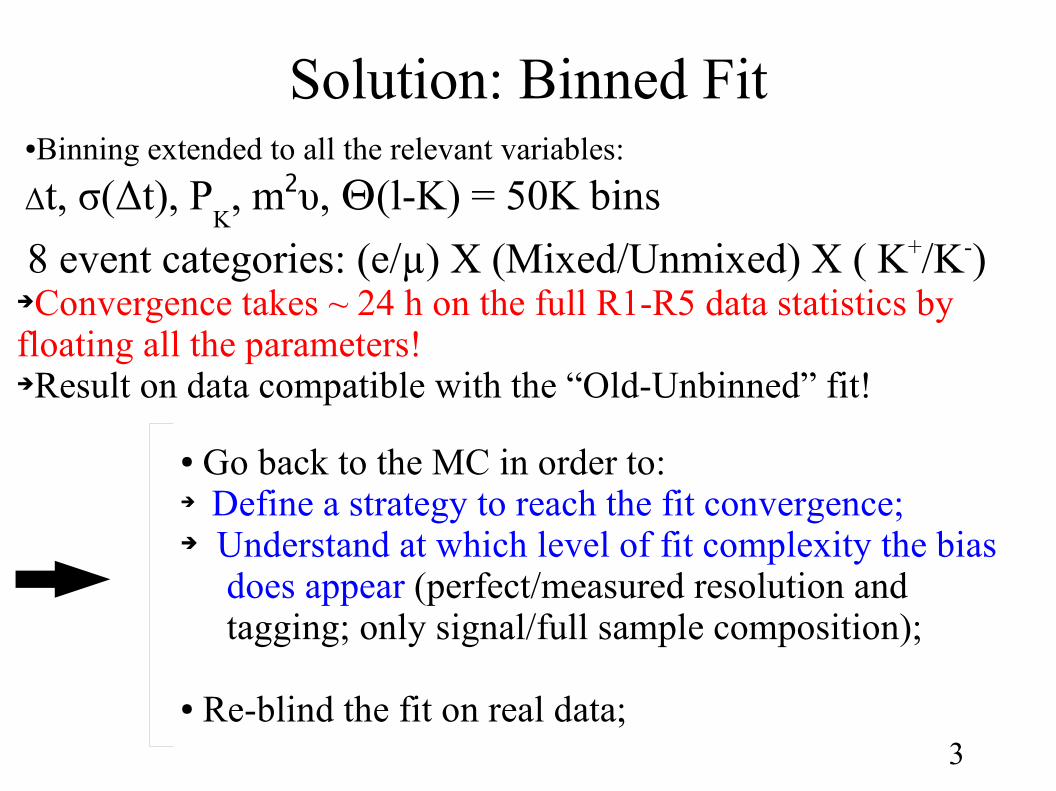
●Binning extended to all the relevant variables:
Δt, σ(Δt), PK, m2υ, Θ(l-K) = 50K bins
8 event categories: (e/µ) X (Mixed/Unmixed) X ( K+/K-) ➔Convergence takes ~ 24 h on the full R1-R5 data statistics by floating all the parameters! ➔Result on data compatible with the “Old-Unbinned” fit!
● Go back to the MC in order to:➔ Define a strategy to reach the fit convergence;➔ Understand at which level of fit complexity the bias does appear (perfect/measured resolution and tagging; only signal/full sample composition); ● Re-blind the fit on real data;
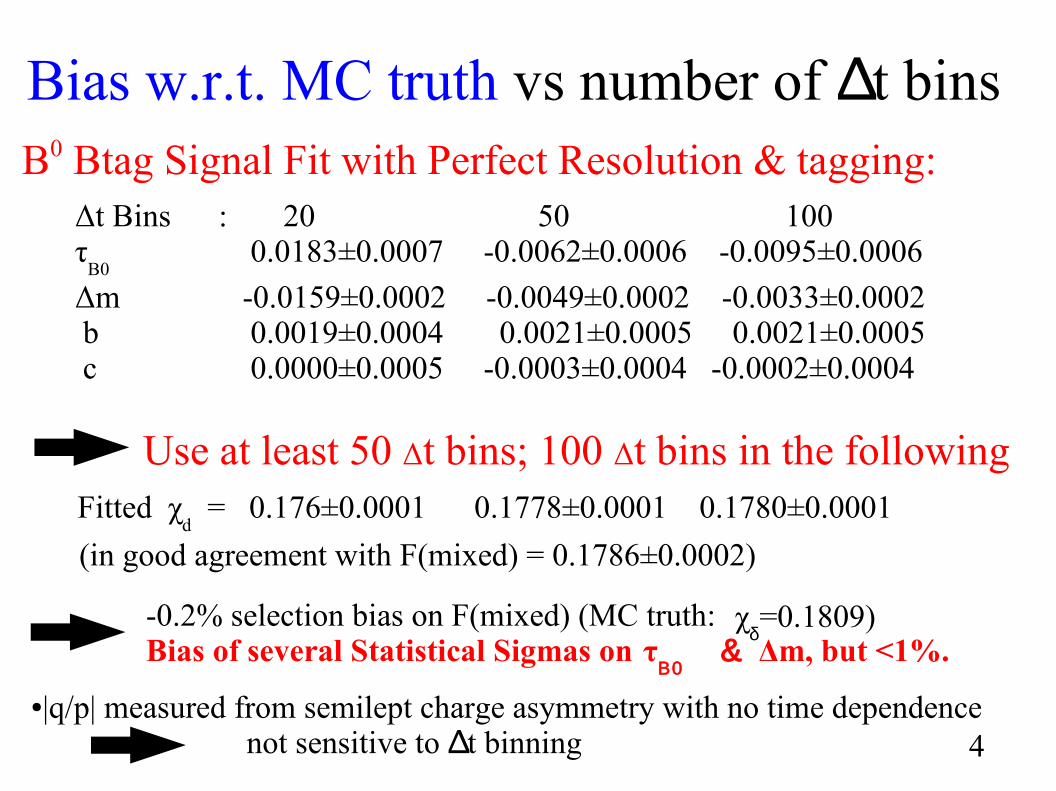
Use at least 50 Δt bins; 100 Δt bins in the following
Bias w.r.t. MC truth vs number of Δt bins B0 Btag Signal Fit with Perfect Resolution & tagging:
4
Fitted χd = 0.176±0.0001 0.1778±0.0001 0.1780±0.0001
(in good agreement with F(mixed) = 0.1786±0.0002)
-0.2% selection bias on F(mixed) (MC truth: Bias of several Statistical Sigmas on τ
Β0& Δm, but <1%. χ
δ=0.1809)
Δt Bins : 20 50 100τ
B0 0.0183±0.0007 -0.0062±0.0006 -0.0095±0.0006
Δm -0.0159±0.0002 -0.0049±0.0002 -0.0033±0.0002 b 0.0019±0.0004 0.0021±0.0005 0.0021±0.0005 c 0.0000±0.0005 -0.0003±0.0004 -0.0002±0.0004
●|q/p| measured from semilept charge asymmetry with no time dependence not sensitive to Δt binning
Study of Fit Convergence
5
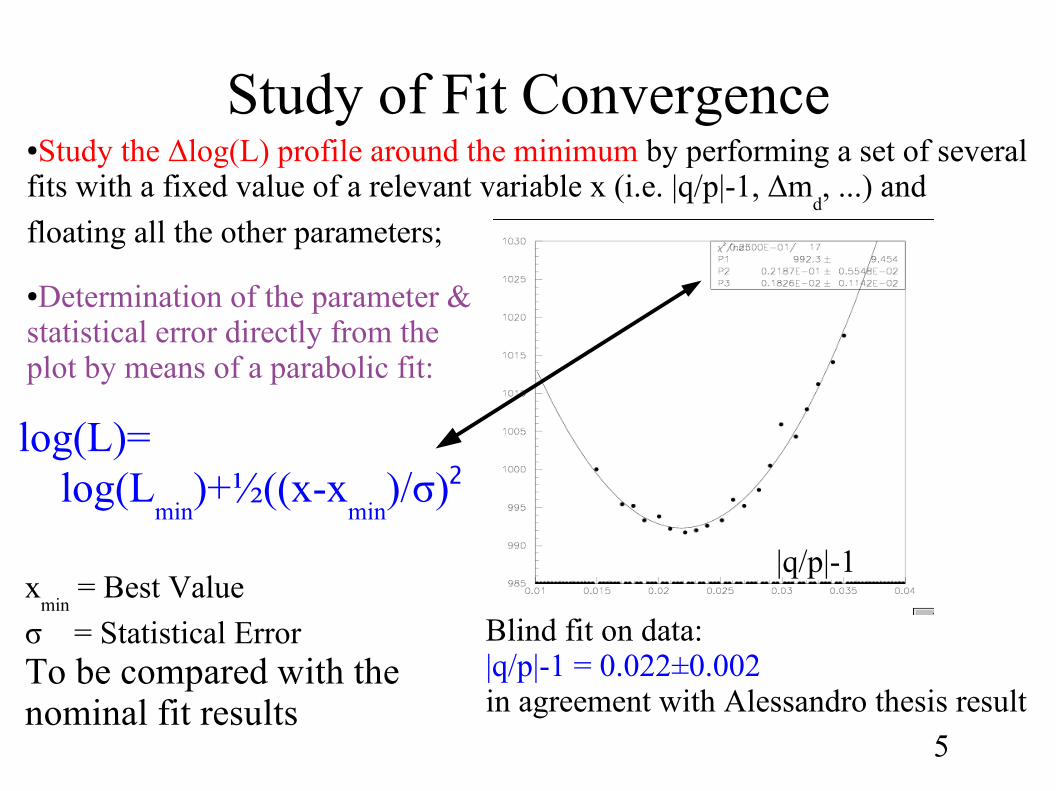
●Study the Δlog(L) profile around the minimum by performing a set of several fits with a fixed value of a relevant variable x (i.e. |q/p|-1, Δm
d, ...) and
floating all the other parameters;
Blind fit on data:|q/p|-1 = 0.022±0.002in agreement with Alessandro thesis result
●Determination of the parameter & statistical error directly from the plot by means of a parabolic fit: log(L)= log(L
min)+½((x-x
min)/σ)2
xmin
= Best Value
σ = Statistical ErrorTo be compared with the nominal fit results
|q/p|-1
6
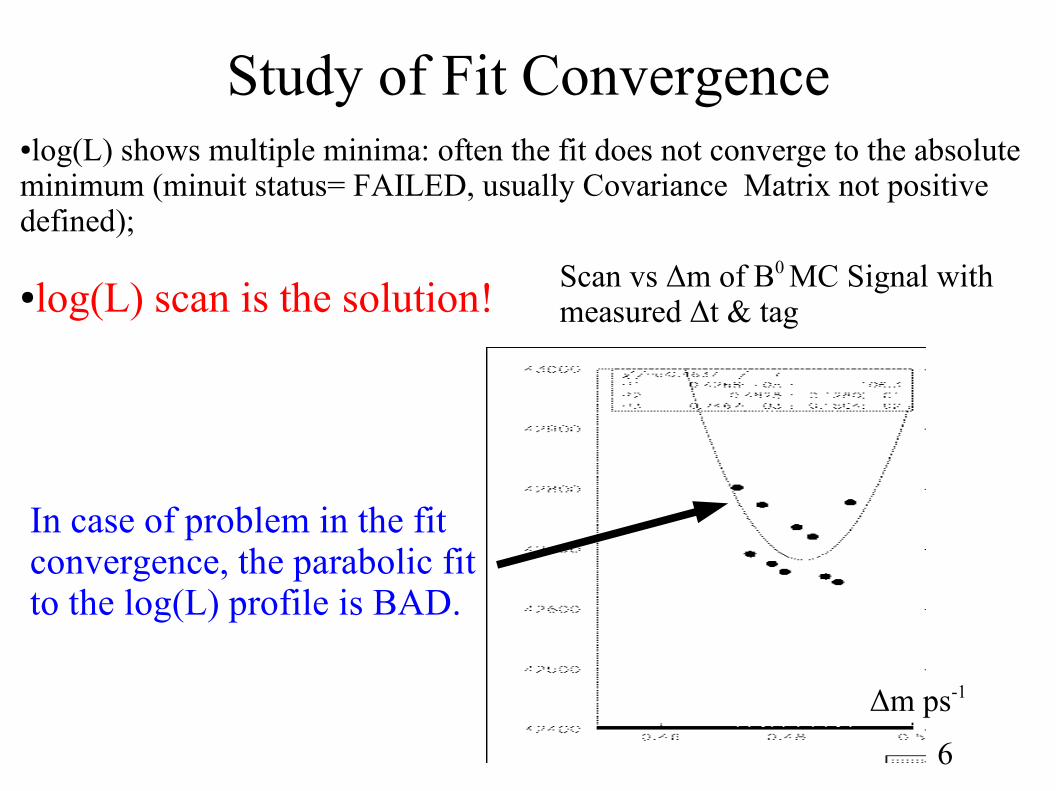
●log(L) shows multiple minima: often the fit does not converge to the absolute minimum (minuit status= FAILED, usually Covariance Matrix not positive defined); ●log(L) scan is the solution!
Study of Fit Convergence
Scan vs Δm of B0 MC Signal with measured Δt & tag
Δm ps-1
In case of problem in the fit convergence, the parabolic fit to the log(L) profile is BAD.
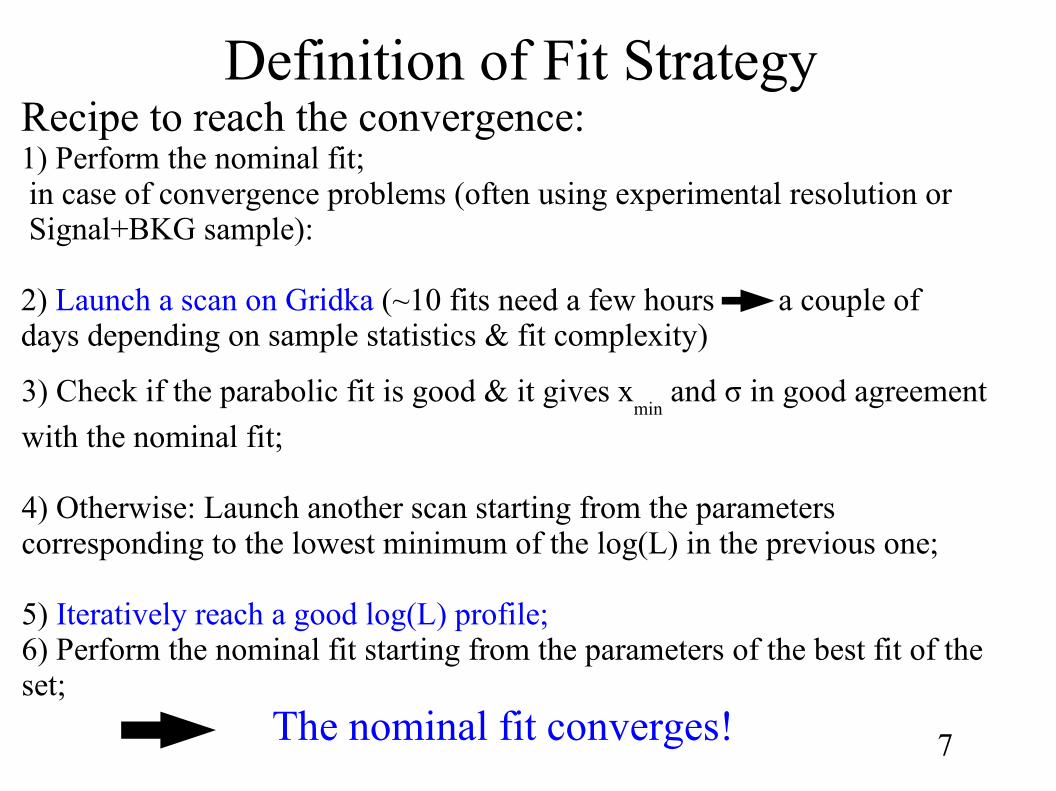
Definition of Fit Strategy
3) Check if the parabolic fit is good & it gives xmin
and σ in good agreement
with the nominal fit; 4) Otherwise: Launch another scan starting from the parameters corresponding to the lowest minimum of the log(L) in the previous one; 5) Iteratively reach a good log(L) profile; 6) Perform the nominal fit starting from the parameters of the best fit of the set;
Recipe to reach the convergence: 1) Perform the nominal fit; in case of convergence problems (often using experimental resolution or Signal+BKG sample): 2) Launch a scan on Gridka (~10 fits need a few hours a couple of days depending on sample statistics & fit complexity)
The nominal fit converges! 7
Fit Strategy
8
The Log(L) scan strategy allow us to:1) Reach the convergence at the “true” Log(L) minimum;2) Check the statistical error of the nominal fit.
●To reach the absolute minimum usually is very useful to perform likelihood scans over different relevant variables (Δm, q/p, τ, Detector Asymmetries, dilutions)
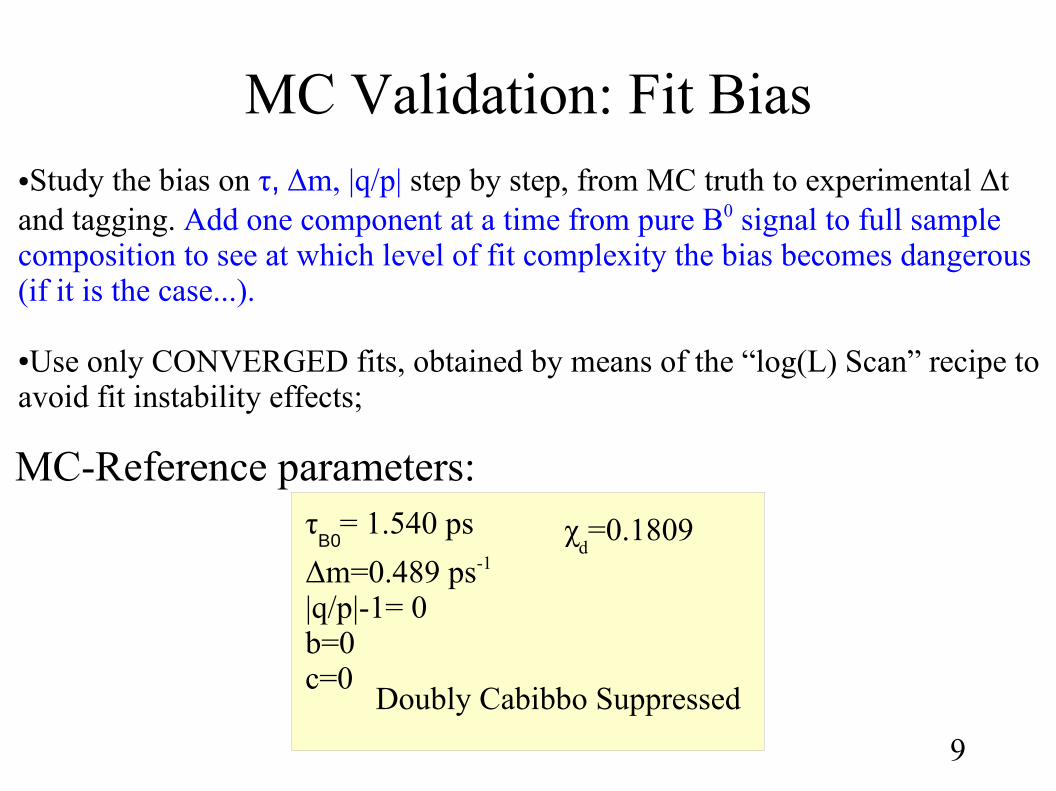
MC Validation: Fit Bias●Study the bias on τ, Δm, |q/p| step by step, from MC truth to experimental Δt and tagging. Add one component at a time from pure B0 signal to full sample composition to see at which level of fit complexity the bias becomes dangerous (if it is the case...). ●Use only CONVERGED fits, obtained by means of the “log(L) Scan” recipe to avoid fit instability effects;
MC-Reference parameters:
Doubly Cabibbo Suppressed
9
τΒ0
= 1.540 ps
Δm=0.489 ps-1
|q/p|-1= 0b=0c=0
χd=0.1809
10
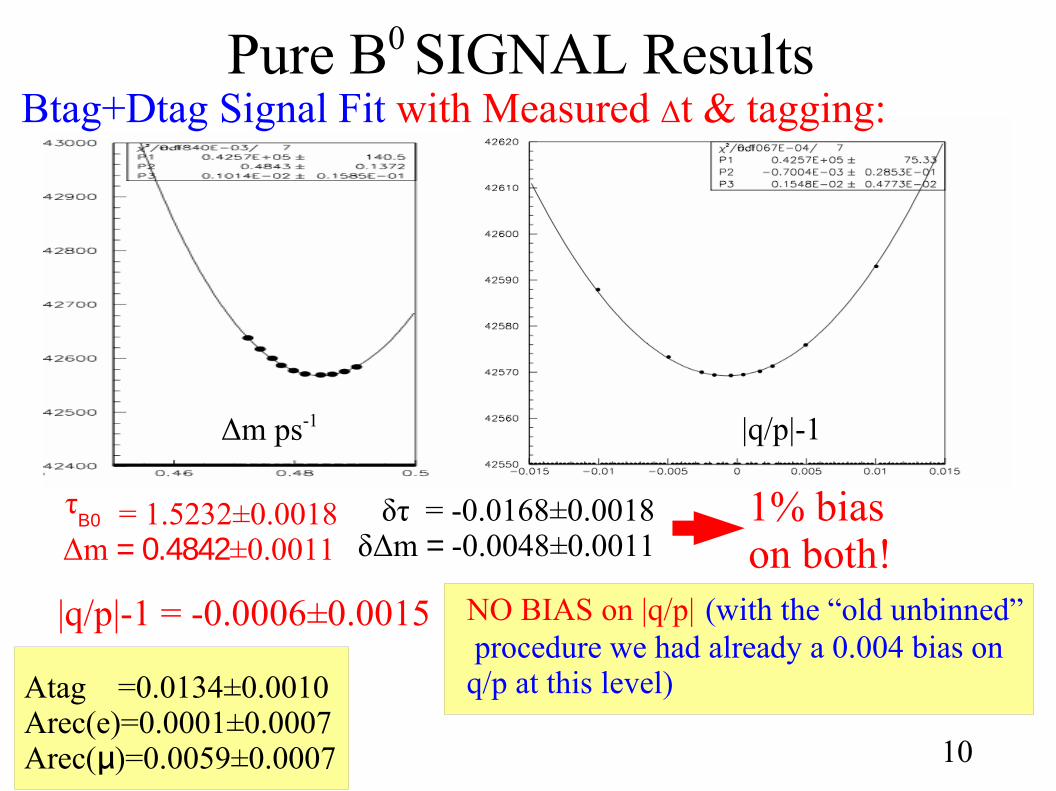
Pure B0 SIGNAL Results
Δm ps-1 |q/p|-1
|q/p|-1 = -0.0006±0.0015
1% bias on both!
= 1.5232±0.0018 Δm = 0.4842±0.0011
τΒ0 δτ = -0.0168±0.0018
δΔm = -0.0048±0.0011
NO BIAS on |q/p| (with the “old unbinned” procedure we had already a 0.004 bias on q/p at this level)
Btag+Dtag Signal Fit with Measured Δt & tagging:
Atag =0.0134±0.0010Arec(e)=0.0001±0.0007Arec(μ)=0.0059±0.0007
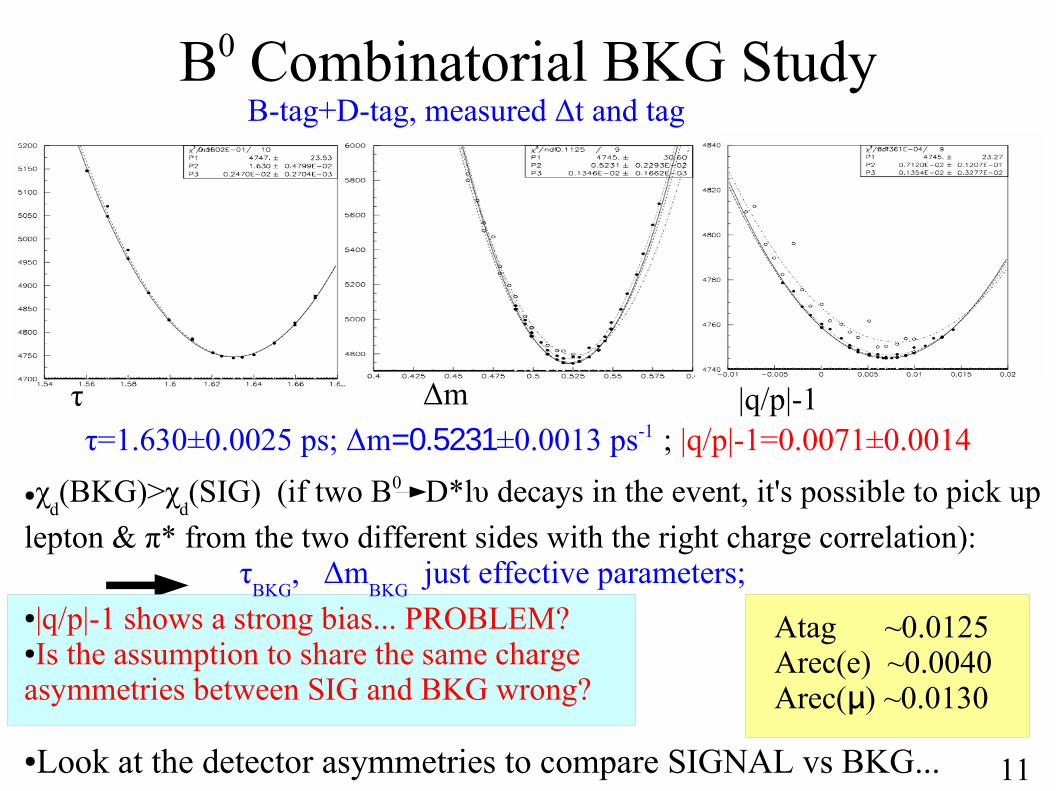
B0 Combinatorial BKG StudyB-tag+D-tag, measured Δt and tag
τ=1.630±0.0025 ps; Δm=0.5231±0.0013 ps-1 ; |q/p|-1=0.0071±0.0014
τ Δm |q/p|-1
11
Atag ~0.0125Arec(e) ~0.0040Arec(μ) ~0.0130
●χd(BKG)>χ
d(SIG) (if two B0 D*lυ decays in the event, it's possible to pick up
lepton & π* from the two different sides with the right charge correlation): τ
BKG, Δm
BKG just effective parameters;
●|q/p|-1 shows a strong bias... PROBLEM?●Is the assumption to share the same charge asymmetries between SIG and BKG wrong? ●Look at the detector asymmetries to compare SIGNAL vs BKG...
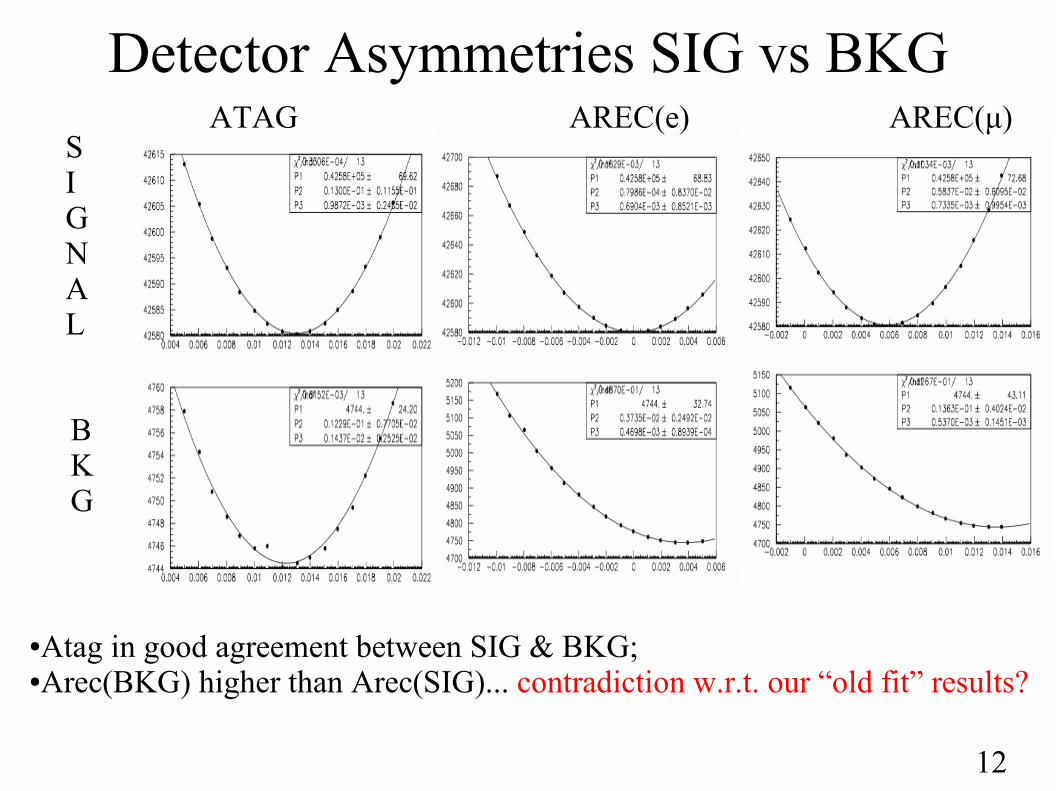
Detector Asymmetries SIG vs BKG ATAG AREC(e) AREC(μ)
●Atag in good agreement between SIG & BKG;●Arec(BKG) higher than Arec(SIG)... contradiction w.r.t. our “old fit” results?
SIGNAL
BKG
12
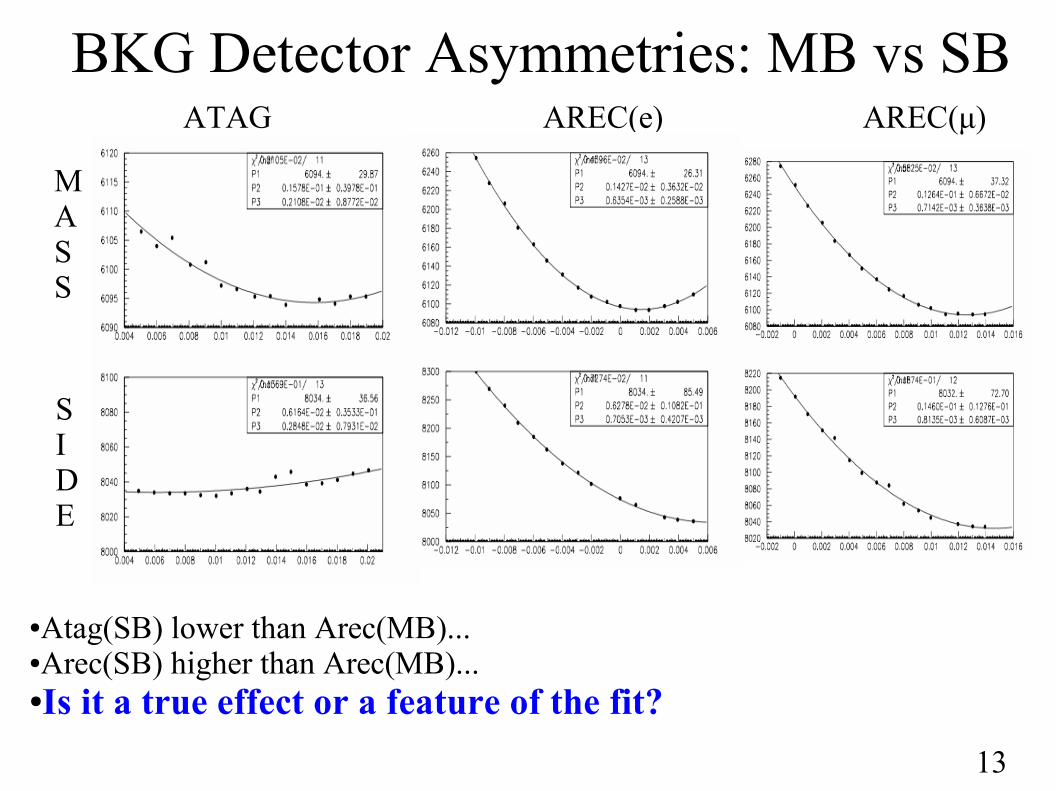
BKG Detector Asymmetries: MB vs SB ATAG AREC(e) AREC(μ)
●Atag(SB) lower than Arec(MB)...●Arec(SB) higher than Arec(MB)...●Is it a true effect or a feature of the fit?
MASS
SIDE
13
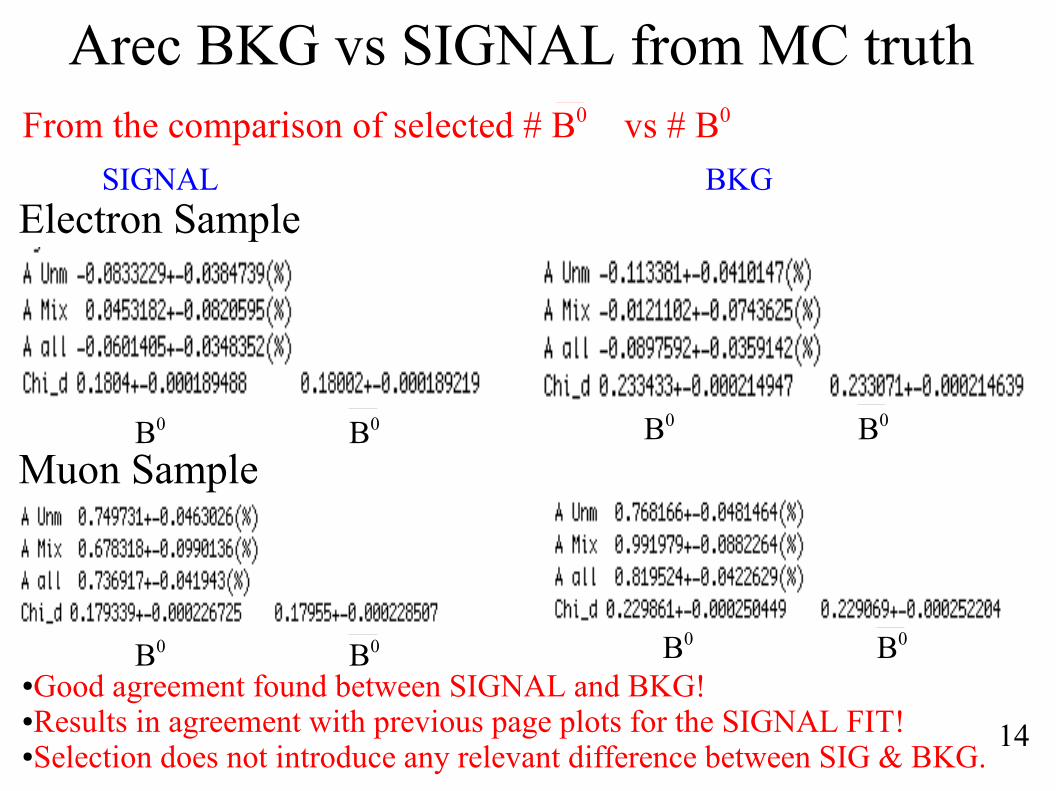
Arec BKG vs SIGNAL from MC truth
●Good agreement found between SIGNAL and BKG!●Results in agreement with previous page plots for the SIGNAL FIT! ●Selection does not introduce any relevant difference between SIG & BKG.
Electron Sample
Muon Sample
SIGNAL BKG
B0 B0 B0 B0
B0 B0 B0 B0
14
From the comparison of selected # B0 vs # B0
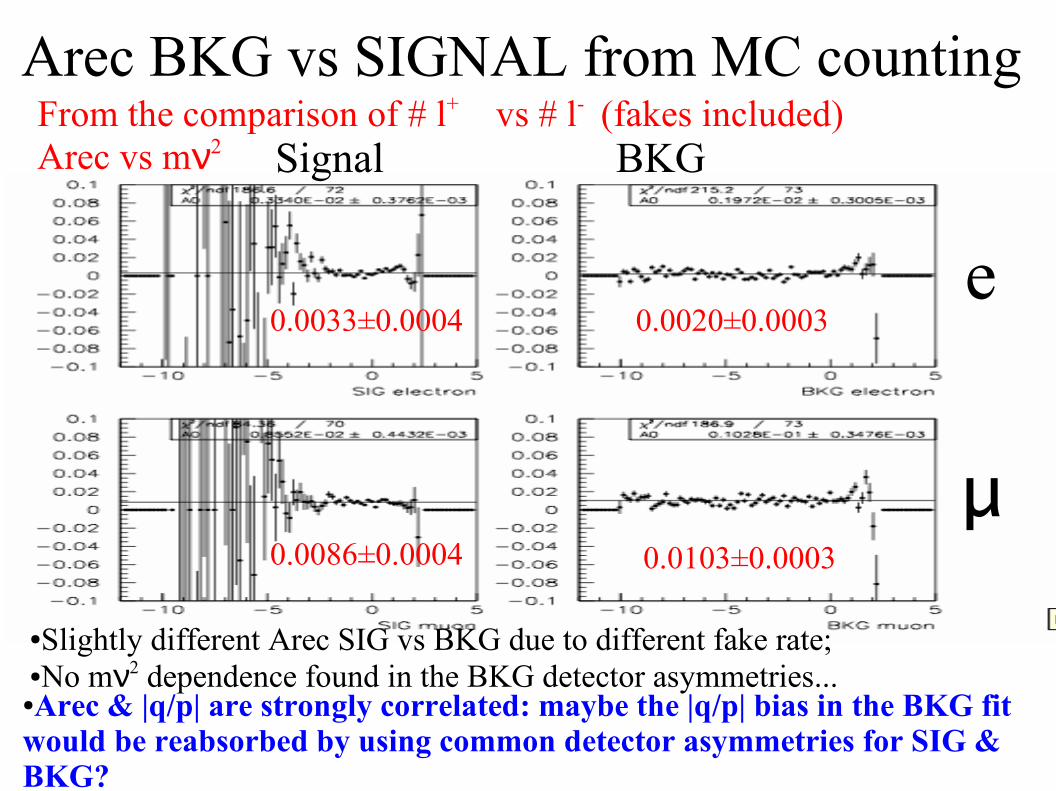
Arec BKG vs SIGNAL from MC counting From the comparison of # l+ vs # l- (fakes included)Arec vs mν2
●Slightly different Arec SIG vs BKG due to different fake rate;●No mν2 dependence found in the BKG detector asymmetries...
e
μ
Signal BKG
●Arec & |q/p| are strongly correlated: maybe the |q/p| bias in the BKG fit would be reabsorbed by using common detector asymmetries for SIG & BKG?
0.0033±0.0004 0.0020±0.0003
0.0086±0.0004 0.0103±0.0003
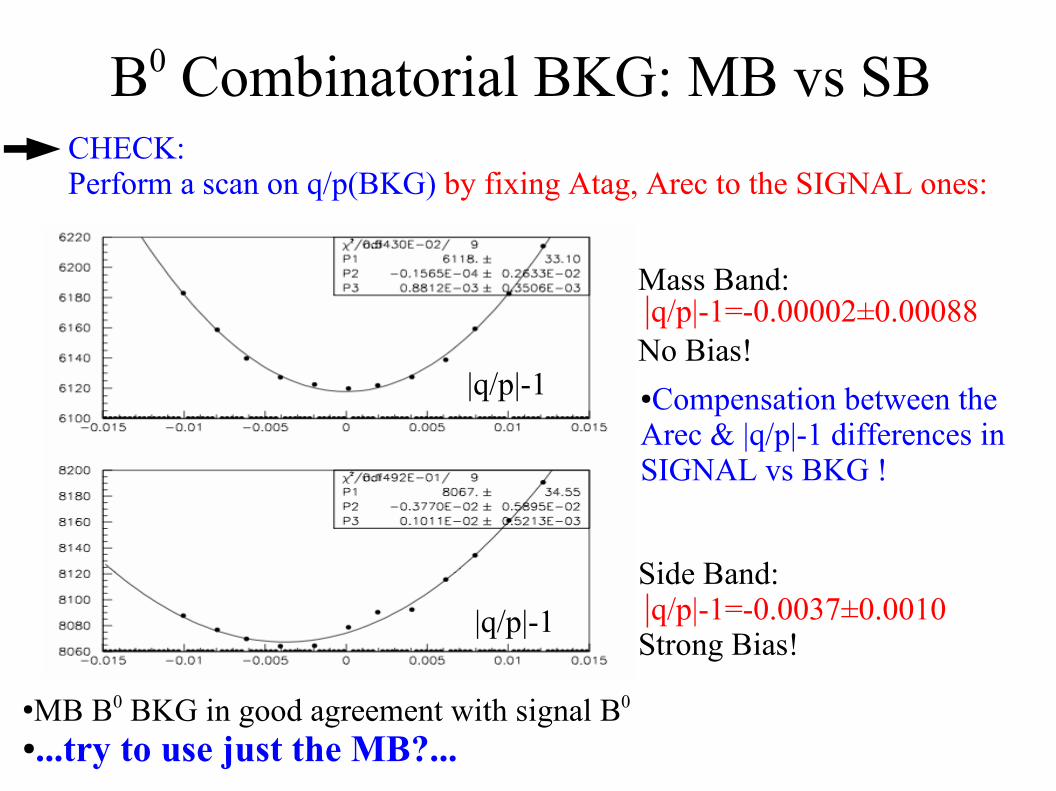
B0 Combinatorial BKG: MB vs SB
|q/p|-1
|q/p|-1
Mass Band:
No Bias!|q/p|-1=-0.00002±0.00088
Side Band:
Strong Bias!|q/p|-1=-0.0037±0.0010
●MB B0 BKG in good agreement with signal B0
●...try to use just the MB?...
CHECK: Perform a scan on q/p(BKG) by fixing Atag, Arec to the SIGNAL ones:
●Compensation between the Arec & |q/p|-1 differences in SIGNAL vs BKG !
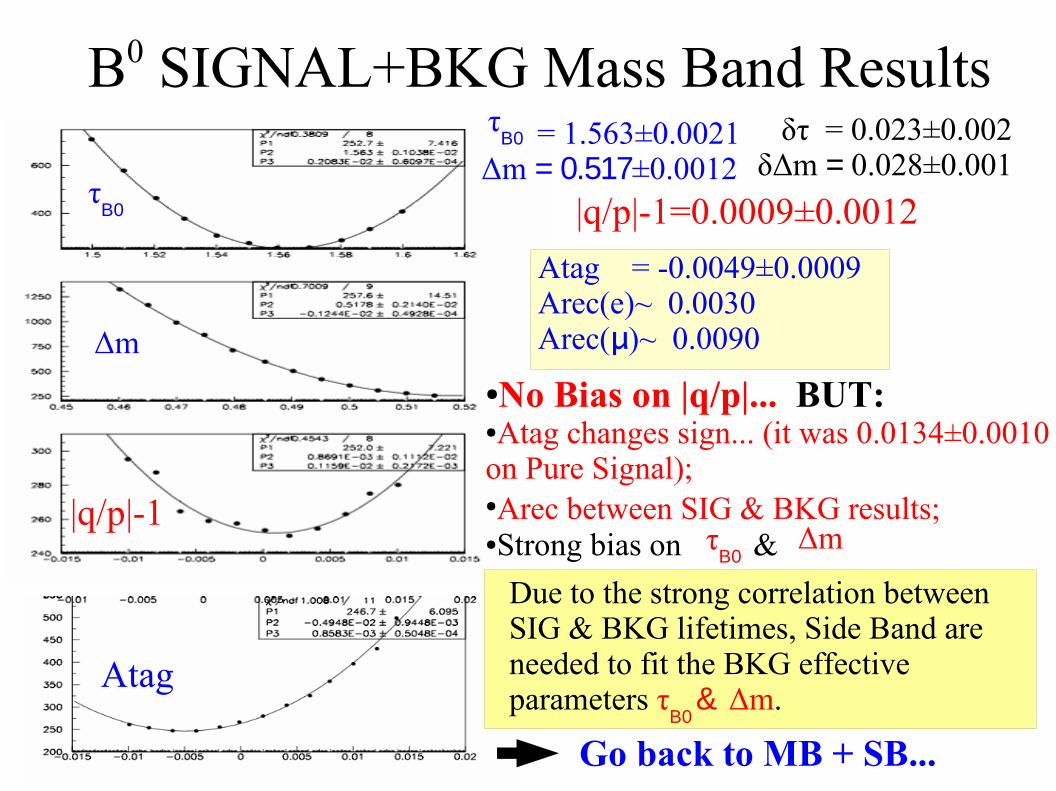
B0 SIGNAL+BKG Mass Band Results = 1.563±0.0021 Δm = 0.517±0.0012
τΒ0
|q/p|-1=0.0009±0.0012
●No Bias on |q/p|... BUT:●Atag changes sign... (it was 0.0134±0.0010 on Pure Signal); ●Arec between SIG & BKG results; ●Strong bias on &τ
Β0Δm
τΒ0
Δm
|q/p|-1
Atag
δτ = 0.023±0.002 δΔm = 0.028±0.001
Due to the strong correlation between SIG & BKG lifetimes, Side Band are needed to fit the BKG effective parameters τ
Β0 & Δm.
Go back to MB + SB...
Atag = -0.0049±0.0009Arec(e)~ 0.0030Arec(μ)~ 0.0090
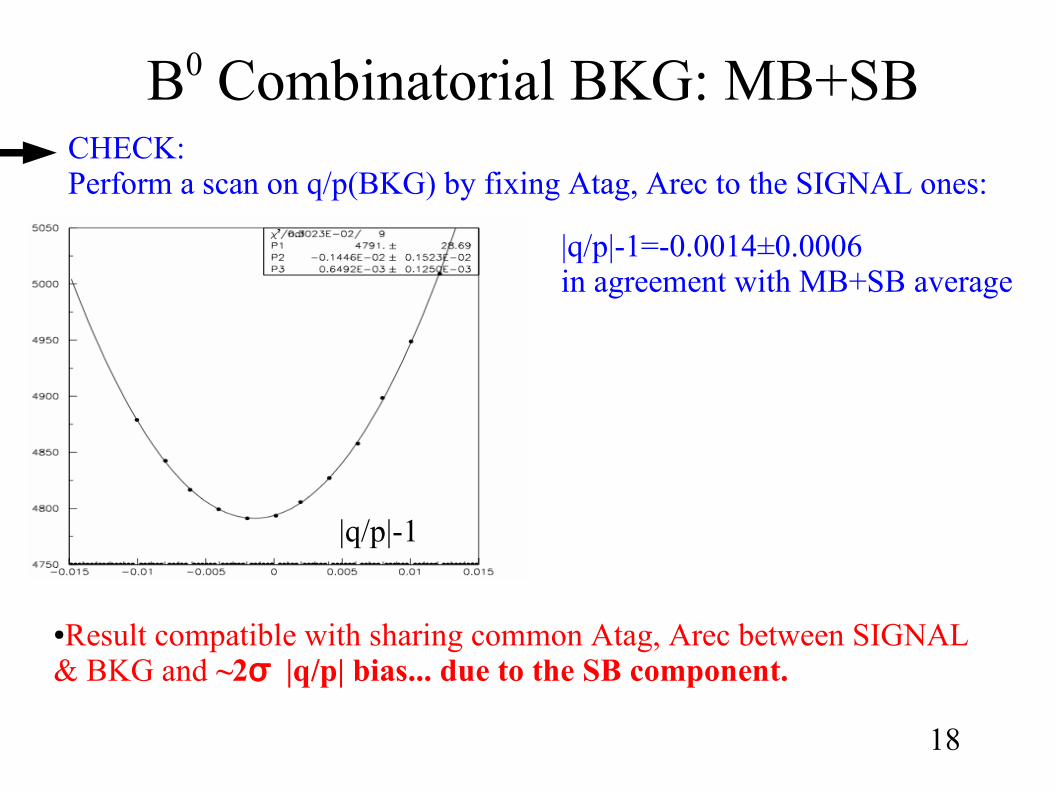
B0 Combinatorial BKG: MB+SBCHECK: Perform a scan on q/p(BKG) by fixing Atag, Arec to the SIGNAL ones:
|q/p|-1=-0.0014±0.0006in agreement with MB+SB average
|q/p|-1
●Result compatible with sharing common Atag, Arec between SIGNAL & BKG and ~2σ |q/p| bias... due to the SB component.
18
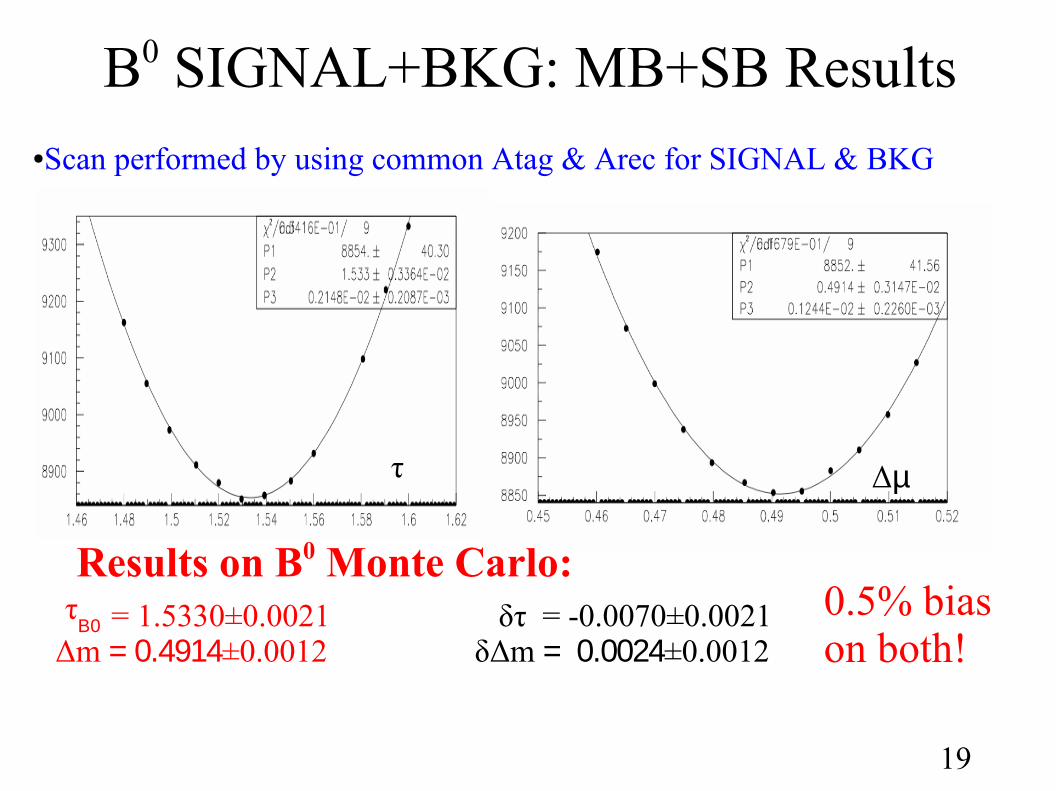
B0 SIGNAL+BKG: MB+SB Results●Scan performed by using common Atag & Arec for SIGNAL & BKG
τ Δµ
Results on B0 Monte Carlo: = 1.5330±0.0021 Δm = 0.4914±0.0012 τ
Β0 δτ = -0.0070±0.0021 δΔm = 0.0024±0.0012
0.5% bias on both!
19
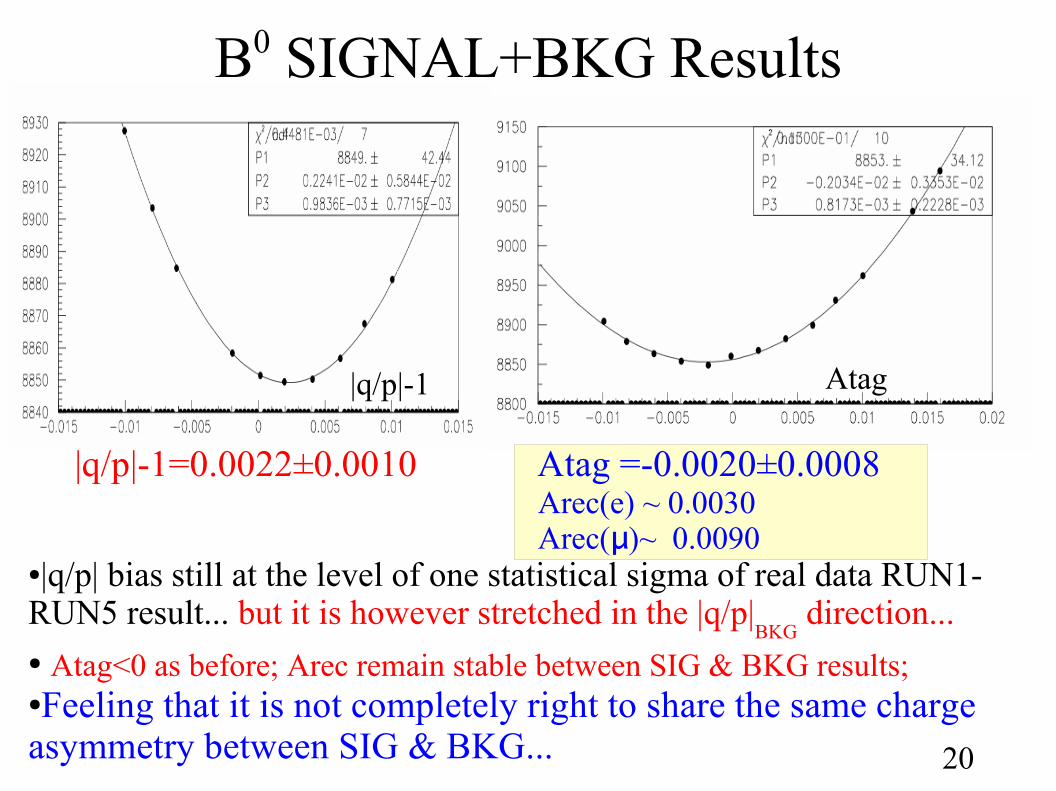
B0 SIGNAL+BKG Results
●|q/p| bias still at the level of one statistical sigma of real data RUN1-RUN5 result... but it is however stretched in the |q/p|
BKG direction...
● Atag<0 as before; Arec remain stable between SIG & BKG results;●Feeling that it is not completely right to share the same charge asymmetry between SIG & BKG...
|q/p|-1
20
Atag
Arec(e) ~ 0.0030Arec(μ)~ 0.0090
|q/p|-1=0.0022±0.0010 Atag =-0.0020±0.0008
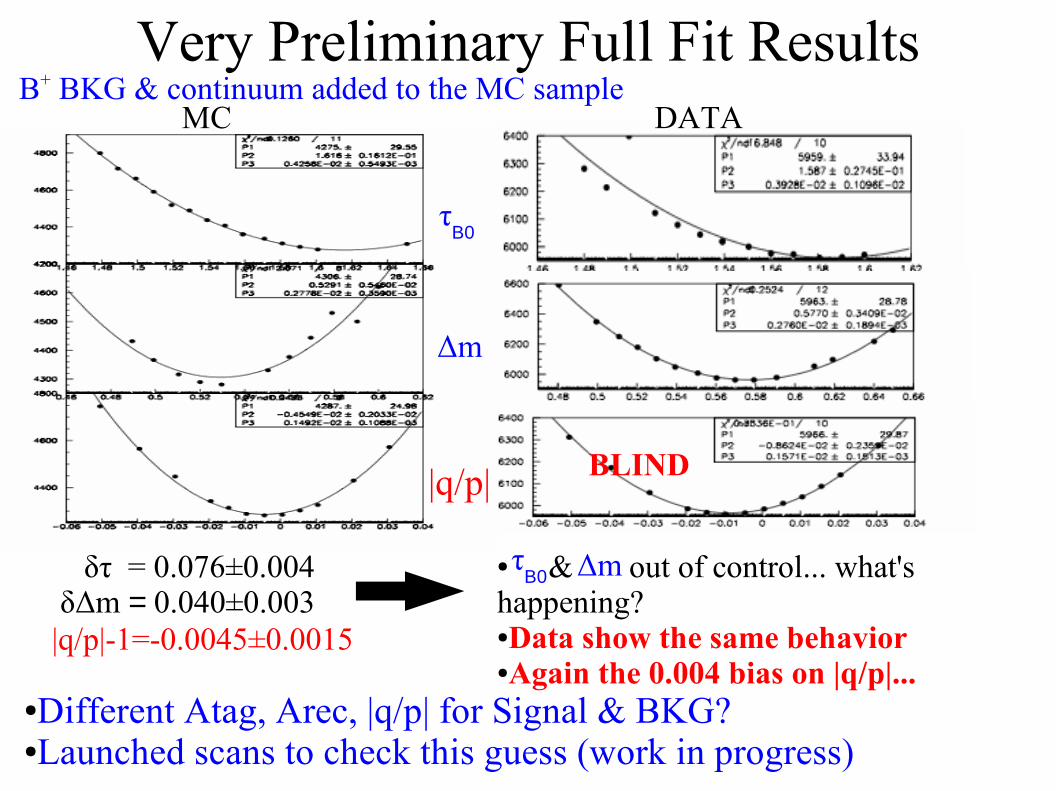
Very Preliminary Full Fit ResultsB+ BKG & continuum added to the MC sample
τΒ0
Δm
|q/p|-1
δτ = 0.076±0.004 δΔm = 0.040±0.003 |q/p|-1=-0.0045±0.0015
τΒ0 Δm● & out of control... what's
happening?●Data show the same behavior●Again the 0.004 bias on |q/p|...
BLIND
●Different Atag, Arec, |q/p| for Signal & BKG? ●Launched scans to check this guess (work in progress)
MC DATA
Toy MC
22
●Generate several experiment starting from the fitted PDF(PK,∆ t,σ∆ t) for the
various sample categories (B0/B+/continuum; peaking/BKG; Btag/Dtag) both for MC and Real Data; ●Fit separately every generated data set; ➔MC fit validation: study the pull of the various fits result vs MC truth/(vs nominal fit result) to check the nominal statistical error & to look for a possible analysis bias (to be done, waiting for the nominal fit result); ➔DATA fit validation: study the pull of the various fits result vs the nominal fit one (to be done, waiting for the nominal fit result);
Enrico Feltresi
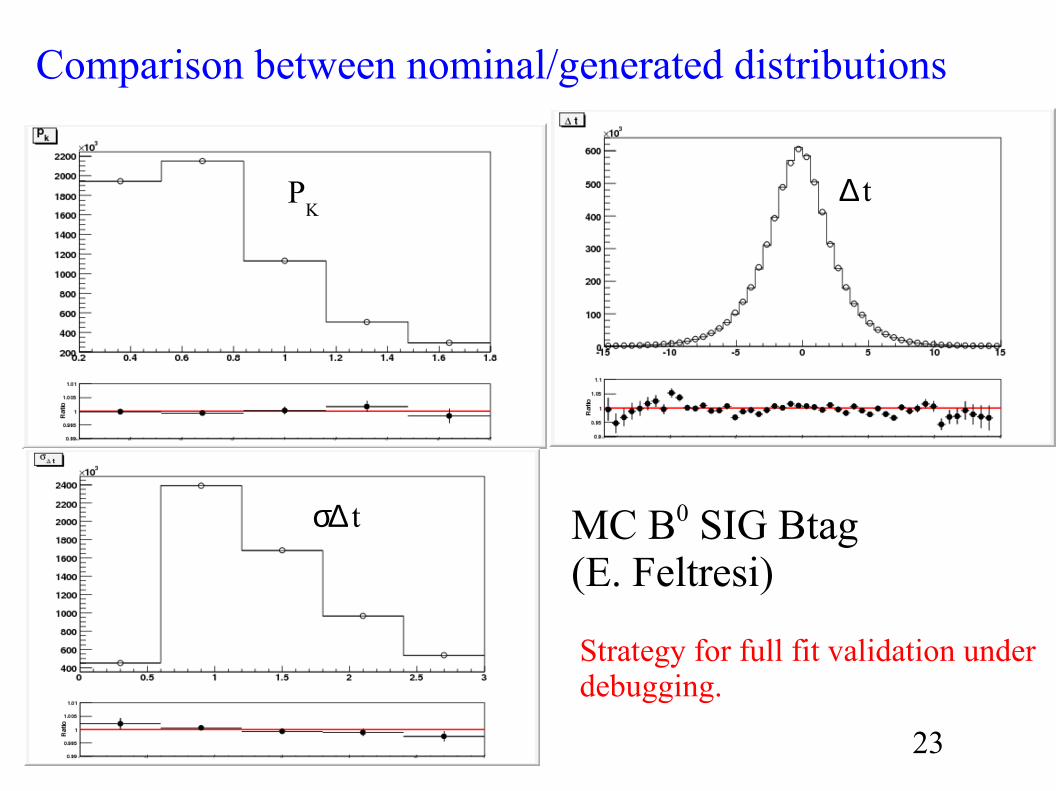
Comparison between nominal/generated distributions
MC B0 SIG Btag (E. Feltresi)
23
PK
∆ t
σ∆ t
Strategy for full fit validation under debugging.
Conclusion & Next Steps●Strategy to reach the fit convergence & evaluate the analysis bias finalized; ●No bias found on |q/p|, τ
B0 and Δm on MC Pure Signal;
●Some hints of different detector charge asymmetry between Signal & BKG which could be the cause of :➔|q/p| bias = 0.0022±0.0010 on MC B0 (Signal+BKG);➔|q/p| bias= -0.0045±0.0015 on Full MC; ●No bias on τ
B0 and Δm on MC B0 (Signal+BKG);
●Strong bias on τB0
and Δm after the addition of B+ & continuum BKG
●Toy MC for full fit validation almost finalized; ●Full MC & Data scans using different charge asymmetries between Signal & BKG are going on...
24
Publication Strategy (to be chosen)
A)Benefit from the binned fit & likelihood scan in order to fully understand the origin of analysis bias before the publication; B)Send a preliminary result to ICHEP with a bias correction of ~0.004 on |q/p| without measuring & τ Δm; C)Let's wait for the results of the scans using different charge asymmetries for Signal & BKG...
Updated Supporting Document & Conference Paper ready in a few days (in the case ICHEP is still the target).