Embed Size (px)
Citation preview

Page 1
Abel M. Siampale, Thomas Haeusler and Sharon Gomez
Status of REDD+ Activity Data for Zambia: A case of the SADC REDD+ MRV Mapping of
Degradation in the Transboundary
Test Site with Malawi
BMZ-DLR International Conference on MRV of REDD Stadthalle Bad Godesberg - Bonn, September 2015
Contact: [email protected]
“Concepts and Costs of Measuring and Monitoring Forest Degradation”

Page 2
TABLE OF CONTENTS
1. REDD+ Readiness in Zambia
• Steps, Achievements and REDD+ MRV in Zambia
2. Status of the Mapping Activity Data for REDD+
• LCMs for Zambia
• Accuracy Assessment Issues
3. SADC REDD MRV Degradation Mapping
• The Dry Forests of Africa
• The SADC REDD MRV Project
• Results of the Transboundary test site
4. National Aspirations on Degradation Assessment

Page 3

Page 4
REDD+ READINESS IN ZAMBIA
PROGRAMME GOAL: To Prepare Zambian
institutions and stakeholders for effective nationwide
implementation of REDD+ mechanism
PROGRAMME DURATION: THREE (3) YEARS
(2010 – 2013) – Now in extension
APPROVED BUDGET: US$4.49 Million
IMPLEMENTING AGENT: Ministry of Lands,
Natural Resources and Environmental Protection
LEAD AGENT: Forestry Department - Zambia
TECHNICAL SUPPORT: UNDP, FAO and UNEP
Page 5
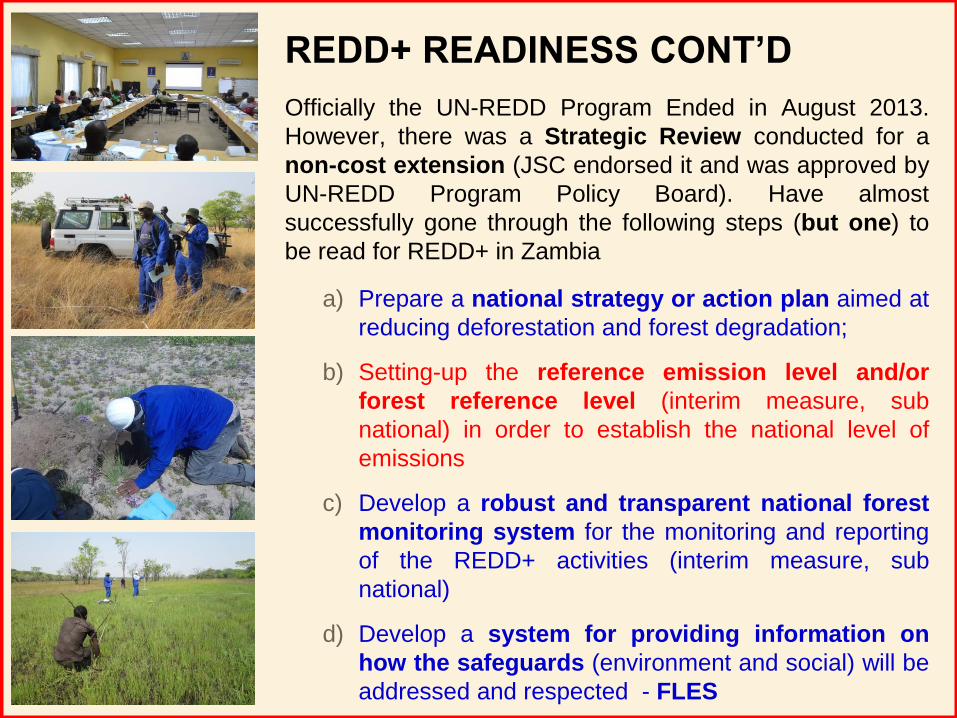
REDD+ READINESS CONT’D
Officially the UN-REDD Program Ended in August 2013.
However, there was a Strategic Review conducted for a
non-cost extension (JSC endorsed it and was approved by
UN-REDD Program Policy Board). Have almost
successfully gone through the following steps (but one) to
be read for REDD+ in Zambia
a) Prepare a national strategy or action plan aimed at
reducing deforestation and forest degradation;
b) Setting-up the reference emission level and/or
forest reference level (interim measure, sub
national) in order to establish the national level of
emissions
c) Develop a robust and transparent national forest
monitoring system for the monitoring and reporting
of the REDD+ activities (interim measure, sub
national)
d) Develop a system for providing information on
how the safeguards (environment and social) will be
addressed and respected - FLES

Page 6
Multi-sector
GHG Invent.
teams set-up in
all provinces
Stakeholder
Consultation in all
provinces
National Forest
Inventories
conducted with
support from
Finland
Land-cover
mapping
completed and
currently
working toward
FREL/FRL
GIS Units set
up in all the
provinces
housed under
the Forestry
Department
ACHIEVEMENTS
In-depth
Studies
conducted to
feed into the
National
Strategy
NFMS and the
Web-portal
Established
http://zmb-
nfms.org/portal/
National
REDD+
Strategy
Completed and
Validated

Page 7
IluaI @ 0.5 degrees (248)
IluaII @ 0.1 degrees (6283)
ILUA NFI DESIGN SECOND LEVEL SAMPLING
1. Targeted vegetation types (10% CC)
2. With good accessibility without
• Cropland
• Water bodies
• Built-up areas
• Bare land
3. Total forested area 61.5%
• T-test 2013 – 2014
• 8 Field Teams
• 2 QA Teams
• 1 Field Coordination Team
EAP
LSP
CEP
SOP
WEP
NWP CBP
LUP MUP
NOP

Page 8
REDD+ MRV in Zambia
EMISSION FACTORS
(National Forest
Inventories)
ACTIVITY DATA
(RS & NFMS)
2005
M
V UNFCCC secretariat
Roster of Experts
GHGs inventories
LULUCF
Inventory
Inventory
compilation
QA/QC
Emission
Inventory
Database
UNFCCC
R
Land-cover mapping
1990, 2000, 2010 & 2014
ILUA II National
Forest Inventory
Capacity building on
GHG reporting for
Forest Lands

Page 9
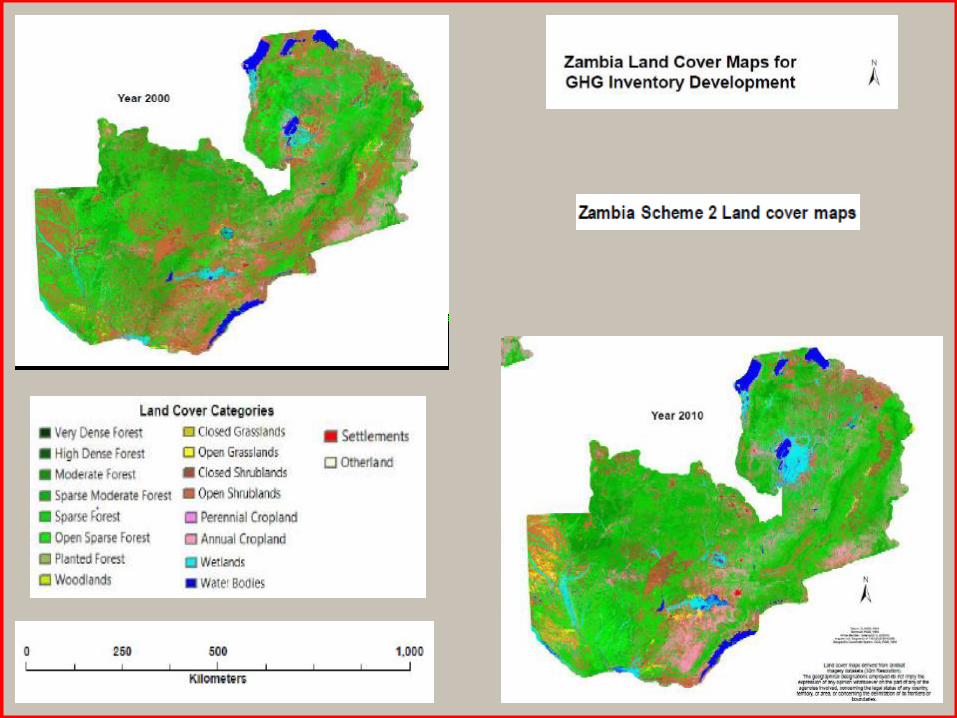
STATUS OF THE MAPPING ACTIVITY DATA FOR ZAMBIA
1. Time Series (i.e. 1990 = FD, 2000 & 2010 = RCMRD and 2014 FAO)
2. Wall to wall Land-sat based
3. Pixel based classification (maximum likelihood)
4. Remote sensing software (Envi 5.0)
5. Preliminary map products (http://zmb-nfms.org/portal/ )

Page 10
STATUS OF THE MAPPING ACTIVITY DATA CONT’D
2000 Schema 1 (89.05%)
Class types determined from reference source
Class types
determined from
classified map
# Of Plots Settlement Cropland Grassland Forestland Water bodies Other-land TOTAL
Settlement 5 0 0 0 0 0 5
Cropland 0 105 8 0 0 1 114
Grassland 0 21 482 23 5 0 531
Forestland 0 15 70 626 8 0 719
Water bodies 0 2 7 1 87 0 97
Other-land 0 0 0 0 0 4 4
TOTALS 5 143 567 650 100 5 1470
Accuracy Assessment: Total
Accuracy
• Quantifying accuracy (Number of correct plots / total number of plots)
• Where diagonals represents sites correctly classified
• Off-diagonals were misclassified
However, TOTAL ACCURACY is normally an average it does not reveal if error was evenly distributed between classes or if some classes were really bad / good. Therefore, we requested for:
• User’s accuracy • Producer’s accuracy • Kappa coefficient

Page 11
STATUS OF THE MAPPING ACTIVITY DATA CONT’D
Overall (summary) accuracy and kappa coefficient
• User’s accuracy – errors of commission (inclusion)
• Producer’s accuracy – errors of omission (exclusion)
• Summary accuracy was 1309/1470*100 = 89.05%
• Kappa coefficient = 0.8268
2000 Schema 1 Class types determined from
reference source USER ACC
%
Class types
determined from
classified map
# Of Plots Settled Crops Grasses Forests Waters Others TOTAL
Settled 5 0 0 0 0 0 5 100
Crops 0 105 8 0 0 1 114 92
Grass 0 21 482 23 5 0 531 91
Forests 0 15 70 626 8 0 719 87
Waters 0 2 7 1 87 0 97 90
Others 0 0 0 0 0 4 4 100
TOTAL 5 143 567 650 100 5 1470
PRODUCER ACC % 100 73 85 96 87 80 89.05
Page 12

Page 13
STATUS OF THE MAPPING ACTIVITY DATA CONT’D
11. Urban settlements
12. Rural settlements
21. Annual crop land
22. Perennial crop land
31. Open grasslands
32. Closed grasslands
33. Open shrub land
34. Closed shrub-land
41. HDF – 80%
42. MDF – 50 to 79%
43. LDF – 20 to 49%
44. ODF – 10 to 19%
45. Planted Forests
51. Inland water
52. Wetlands
61. Outcrop
Forest &
Non Forest
LC
LEVEL II
LEVEL I – LULUFC
1. Settlements
2. Agriculture land
3. Rangeland (GL)
4. Forest land
5. Water bodies
6. Other land
1. Cluster sampling with randomly selected “centroids” = 2700
2. Increased accuracy assessment points to 5700 from on-screen, local knowledge + Google earth
Accuracy assessment yet to be resolved

Page 14
STATUS OF THE MAPPING ACTIVITY DATA CONT’D
1. Biomass map
2. Carbon map
3. Land cover change maps
4. Annual burnt area maps (ZEMA)
5. Grass fuel load / ha (ILUA/FAO)
6. Gross & net emissions (ILUA/FAO)
7. Set the REL and RL
8. 3rd NC to the UNFCC

Page 15
SADC REDD MRV DEGRADATION MAPPING
SADC REDD 3 Pilot sites
Site 1: North-east Botswana –
Baikiaea woodland biome
Site 2: Central Malawi/Zambia
border – Miombo woodland
biome
Site 3: Central Mozambique –
Mopane woodland biome
URAs Test sites of 26,000km2

Page 16
• One of the major ecosystems of these dry forests in SSA is called Miombo. The main tree species that comprise this ecosystem are the deciduous Brachystegia, Julbernardia and Isoberlinia. Mittermeier et al (2003) identified the miombo-mopane woodlands as one of the five ecozones (together with Amazonia, Congo, New Guinea and the North American deserts) needing to be prioritized for biodiversity conservation because of their irreplaceability in terms of species endemism.
• Countries in the southern African regions such as Zambia, Zimbabwe and Malawi have some of the highest deforestation rates in Africa and globally. Malawi for example has a deforestation rate of 2.8% and is ranked 4th in the world and the first in southern Africa.
Dry Forests - Africa

Page 17
Agriculture
Expansion
Settlement
(In-Migrations)
Mining and
Mineral Exploration
Forest Production
(Livelihood)
Infrastructure
Development
Natural Disasters
(Fires/Flooding)
“Our Land”
Major Drivers of Deforestation

Page 18
• Dry Forest Biome is the most threatened and least studied of the world’s ecosystems (Janzen, 1988; Miles et al, 2006…Gillespie et al, 2012)-CIFOR Tropical Dry Forests, 2014 (Blackie et al).
• The biome is largely neglected in the REDD+ process as focus was initially on tropical humid forests.
Observations on Miombo Biome

Page 19
Some Pictures of the
Intact Miombo and
Degraded
Miombo

Page 20
Satellite data classified
into Forest and Non
Forest cover classes for
1990, 2000 and 2010
Example Left: Malawi
Zambia border
Higher human population
density in the area and
more widespread
subsistence agriculture
Example left shows
subsitance agriculture
expansion (orange) into
forest

Page 21
Post Processing: Minimum Mapping Unit filtering, 0,5 ha
Botswana unfiltered Malawi/Zambia unfiltered Mozambique unfiltered
Mozambique filtered Malawi/Zambia filtered Botswana filtered

Page 22
Forest Not Forest
D e
g
r
a
d
a
t
i
o
n
R e
g
e
n
e
r
a
t
i
o
n
Intact
Managed
Degraded
Cropland
Settlement
Other land
Deforestation
Deforestation
Deforestation
= or >10%CC <10%CC

Page 23
Degradation mapping
Malawi/Zambia

Page 24
Overall Map Accuracy
Map Products Overall Map Accuracy
Pilot Countries Botswana Malawi
Zambia Mozamb. Namibia
1990 Forest Cover Map 84.21% 84.54% 79.61% tbd
2000 Forest Cover Map 83.88% 88.16% 87.50% tbd
2010 Forest Cover Map 85.86% 87.17% 79.28% tbd
Forest Cover and Land-use
Change Map 1990 to 2000 N/A N/A N/A tbd
Forest Cover and Land-use
Change Map 2000 to 2010 69.85% 61.17% 68.55% tbd

Page 25
Overview – Forest Cover and Land-use Change Map 1990-2000 Botswana Malawi/Zambia Mozambique
Description Area [km²] Uncertainty
[%]
Area [km²] Uncertainty
[%]
Area [km²] Uncertainty
[%]
Overall interpretable area in 1990 and in 2000 26,252.97 N/A 26,079.53 N/A 26,172.95 N/A
Unchanged Land Use
Forest Land in 1990 remaining Forest Land in 2000 6,971.14 N/A 16,413.42 N/A 21,493.25 ±1.87
Non-Forest Land in 1990 remaining Non-Forest
Land in 2000
19,263.42 N/A 7,894.88 N/A 4,462.22 ±6.86
Changes of Forest Land in 1990 to Non-Forest Land in 2000
Forest Land in 1990 to Cropland in 2000 0.10 N/A 1,311.88 N/A 166.48 ±8.05
Forest Land in 1990 to Grassland in 2000 6.72 N/A 424.49 N/A 25.57 ±1.67
Forest Land in 1990 to Wetland in 2000 0.00 N/A 0.00 N/A 5.06 ±3.91
Forest Land in 1990 to Settlement in 2000 11.37 N/A 1.27 N/A 1.01 ±0.00
Forest Land in 1990 to Other Land in 2000 0.05 N/A 0.00 N/A 0.17 N/A
Sum (Gross Deforestation) 18.24 N/A 1,737.64 N/A 198.29 ±2.67
Changes of Non-Forest Land in 1990 to Forest Land in 2000
Non-Forest in 1990 to Forest Land in 2000 0.17 N/A 33.60 N/A 19.18 ±15.55
Summary Changes 1990 to 2000
Gross Deforestation Area 18.24 N/A 1,737.64 N/A 198.29 ±2.67
Gross Annual Deforestation Area 1.824 N/A 173.764 N/A 19.82 ±0.26
Gross Annual Deforestation Rate 0.026% N/A 0.957% N/A 0.0914% N/A
Majority of Changes

Page 26
Overview – Forest Cover and Land-use Change Map 2000-2010 Botswana Malawi/Zambia Mozambique
Description Area
[km²]
Uncertainty
[%]
Area [km²] Uncertainty
[%]
Area [km²] Uncertainty
[%]
Overall interpretable area in 2000 and in 2010 26,252.97 N/A 26,079.53 N/A 26,172.95 N/A
Unchanged Land Use
Forest Land in 2000 remaining Forest Land in
2010
6,958.86 ±4.14% 15,517.28 ±2.55% 20,674.21 ±2.14
Non-Forest Land in 2000 remaining Non-Forest
Land in 2010
19,284.17 ±1.52% 9,788.23 ±4.50% 4,843.25 ±7.05
Changes of Forest Land in 2000 to Non-Forest Land in 2010
Forest Land in 2000 to Cropland in 2010 0.70 ±0.40% 614.10 ±14.57% 521.53 ±21.98
Forest Land in 2000 to Grassland in 2010 4.86 ±2.63% 159.47 ±6.65% 108.70 ±9.46
Forest Land in 2000 to Wetland in 2010 0.00 N/A 0.00 N/A 10.68 ±3.87
Forest Land in 2000 to Settlement in 2010 4.03 ±1.60% 0.45 ±4.62% 4.52 ±4.08
Forest Land in 2000 to Other Land in 2010 0.12 ±3.42% 0.00 N/A 2.13 ±5.50
Sum (Gross Deforestation) 9.71 ±0.79% 774.02 ±7.80% 647.56 ±7.84
Changes of Non-Forest Land in 2000 to Forest Land in 2010
Non-Forest in 2000 to Forest Land in 2010 0.17 0.23 31.49 ±1.79% 7.93 ±1.82
Summary Changes 2000 to 2010
Gross Deforestation Area 9.71 ±0.79% 774.02 ±7.80% 647.56 ±7.84
Gross Annual Deforestation Area 0.971 ±0.08% 77.40 ±0.78% 64.76 ±0.78
Gross Annual Deforestation Rate 0.014% 0.50% N/A 0.3037% N/A
Majority of Changes
Increase
Decrease
Decrease
Decrease Decrease Increase

Page 27
Overview – Non-Intact Forest Change Map 1990 to 2000 Botswana Malawi/Zambia Mozambique
Description Area [km²] Uncertainty
[%]
Area [km²] Uncertainty
[%]
Area [km²] Uncertainty
[%]
Overall interpretable area in 1990 and in 2000 26,252.97 N/A 26,079.53 N/A 26,172.95 N/A
No Change Categories
Intact Forest in 1990 remaining Intact Forest in 2000 6,907.71 N/A 10,246.51 N/A 9,379.38 N/A
Non-Intact Forest in 1990 remaining Non-Intact Forest in
2000
52.63 N/A 4,599.71 N/A 7,733.40
N/A
Non-Forest in 1990 remaining Non-Forest in 2000 19,266.47 N/A 7,869.13 N/A 4,448.04 N/A
Change of Intact and Non-Intact Forest Land from 1990 to 2000
Intact Forest in 1990 to Non-Intact Forest 2000 5.93 N/A 1,543.74 N/A 4,326.93 N/A
Non-Intact Forest in 1990 to Intact Forest in 2000 0.10 N/A 2.39 N/A 0.00 N/A
Forestations: Intact and Non-Intact Forest Land from 1990 to 2000
Non-Forest in 1990 to Intact Forest in 2000 0.16 N/A 1.04 N/A 0.82 N/A
Non-Forest in 1990 to Non-Intact Forest in 2000 0.01 N/A 32.54 N/A 18.39 N/A
Deforestations of Intact and Non-Intact Forest Land 1990 to 2000
Non-Intact Forest in 1990 to Non-Forest in 2000 11.87 N/A 1,487.78 N/A 145.78 N/A
Intact Forest in 1990 to Non-Forest in 2000 8.09 N/A 296.70 N/A 120.21 N/A
Summary Changes 1990 to 2000
Gross Degradation Area (increase of Non-Intact Forest ) 5.93 N/A 1,543.74 N/A 4,326.96 N/A
Annual Gross Degradation Area 0.593 N/A 154.37 N/A 43.27 N/A
Annual Gross Degradation Rate 0.008% N/A 1.28% N/A 3.13%
High degradation rate

Page 28
Overview – Non-Intact Forest Change Map 2000 to 2010 Botswana Malawi/Zambia Mozambique
Description Area [km²] Uncertainty
[%] Area [km²]
Uncertainty
[%] Area [km²]
Uncertainty
[%]
Overall interpretable area in 2000 and in 2010 26,252.97 N/A 26,079.53 N/A 26,172.95 N/A
No Change Categories
Intact Forest in 2000 remaining Intact Forest in 2010 6,897.94 ±4.14 8,791.80 ±3.95 6,041.58 ±2.14
Non-Intact Forest in 2000 remaining Non-Intact Forest in
2010 51.41 ±4.14 5,371.95 ±3.95 11,263.27 ±2.14
Non-Forest in 1990 remaining Non-Forest in 2000 19,288.27 ±1.52 9,775.89 ±5.65 4,811.90 ±7.05
Change of Intact and Non-Intact Forest Land from 2000 to 2010
Intact Forest in 2000 to Non-Intact Forest in 2010 4.50 ±4.14 1,276.51 ±3.95 3,213.78 ±2.14
Non-Intact Forest in 2000 to Intact Forest in 2010 0.08 ±4.14 0.13 ±3.95 0.0396 ±2.14
Forestations: Intact and Non-Intact Forest Land from 2000 to 2010
Non-Forest in 2000 to Intact Forest in 2010 0.12 ±0.38 4.35 ±1.79% 0.6144 ±1.82
Non-Forest in 2000 to Non-Intact Forest in 2010 0.11 ±0.38 27.05 ±1.79% 7.31 ±1.82
Deforestations of Intact and Non-Intact Forest Land 2000 to 2010
Non-Intact Forest in 2000 to Non-Forest in 2010 5.66 ±0.79 673.72 ±7.80% 724.21 ±7.84
Intact Forest in 2000 to Non-Forest in 2010 4.90 ±0.79 158.14 ±7.80% 110.21 ±7.84
Summary Changes 2000 to 2010
Gross Degradation Area (increase of Non-Intact
Forest Land) 4.50 ±4.14 1,276.51 ±7.80% 3,213.78 ±2.14
Annual Gross Degradation Area 0.450 ±0.41 127.65 ±0.78% 321.38 ±0.21 Annual Gross Degradation Rate 0.006% 1.25% 3.43% N/A
High degradation rate

Page 29
The overall picture of Deforestation and Degradation rates in the
SADC REDD Pilot Countries
Country/Period Gross Annual
Deforestation Rate
Gross Annual Degradation
Rate
Botswana 1990-2000 0.03% 0.008%
Botswana 2000-2010 0.01% 0.006%
Trans-boundary 1990-2000
0.96%
Mal. 1.11%
Zam. 0.86%
1.28%
Mal. 0.98%
Zam. 1.45%
Trans-boundary 2000-2010
0.50%
Mal. 0.37%
Zam. 0.53%
1.25%
Mal. 0.64%
Zam. 1.64%
Mozambique 1990-2000 0.09% 3.13%
Mozambique 2000-2010 0.30% 3.43%
Namibia 1990-2000 0.0044% 0.0128%
Namibia 2000-2010 0.0058% 0.022%

Page 30
NATIONAL ASPIRATIONS GOING FORWARD
The overall objective was to design a SADC REDD+ MRV system based
on an ecosystem approach which can be used by the Member States (MS);
in order to do this a prototype design was successfully tested. Key
expectations going forward:
Overall challenges for Deforestation and Degradation Mapping
1. Financing required to improve current methods / results for
deforestation mapping; for example - methodology issues such as
implementing robust accuracy assessment methods
2. Degradation mapping was done for a test site and now needs to be
rolled out to whole country-needs funding
3. Intensive capacity development in Remote Sensing for Forest
Monitoring in Zambia is required.
4. Developing easier and efficient image processing techniques
(open source based - cloud processing and R-scripts).
5. Development of allometric equations for the Miombo Biome would
be a good research programme (i.e. WHRC – USA).

Page 31
THANK YOU FOR YOUR
VALUABLE TIME