Embed Size (px)
Citation preview

On behalf of
Status of Onshore Wind Energy
Development in Germany
Year 2020

Status of Onshore Wind Energy Development in Germany – Year 2020
Notes
The data from 2012 onwards was obtained through surveys with manufacturers and other industry
representatives, as well as through additional research. Analyses of the DEWI serve as the data basis for
the years 1992 - 2011. Data corrections based on the MaStR were made. The MaStR and the publications
of the awards by the BNetzA serve as a data basis for the analysis of the permit situation and the tender
results.
The information provided within the text and the figures partially includes rounded values. Thus, when
added, there is a possibility of deviations from the overall values.
The cumulative data may be overestimated due to the incomplete capture of dismantling.
Analyses that rely on deviating data bases (i.e. MaStR) exhibit a deviating data inventory.
Photo on Title Page
© Bundesverband WindEnergie e.V. (BWE)
Contact
Deutsche WindGuard GmbH
Oldenburger Strasse 65
26316 Varel, Germany
Phone +49 (4451) 9515-0
Fax +49 (4451) 9515-29
Email [email protected]
URL http://www.windguard.com/
Contents
Gross and Net Wind Energy Additions ................................................................................................................................... 3
Dismantling and Repowering ..................................................................................................................................................... 4
Regional Distribution of Wind Energy Additions ................................................................................................................ 5
Average Wind Turbine Generator Configuration ................................................................................................................ 6
Regional Differences in Wind Turbine Generator Configuration .................................................................................. 7
Results of Tender Rounds ........................................................................................................................................................... 8
Regional Distribution of Awarded Bids ................................................................................................................................... 9
Development Status of Awarded Turbines* ........................................................................................................................10
Permitted Capacity and Future Tender Rounds.................................................................................................................11
Regional Distribution of the Cumulative Portfolio ...........................................................................................................12
Monthly Power Production and Market Values .................................................................................................................13
Status of Onshore Wind Energy Development in Germany – Year 2020
3
Gross and Net Wind Energy Additions
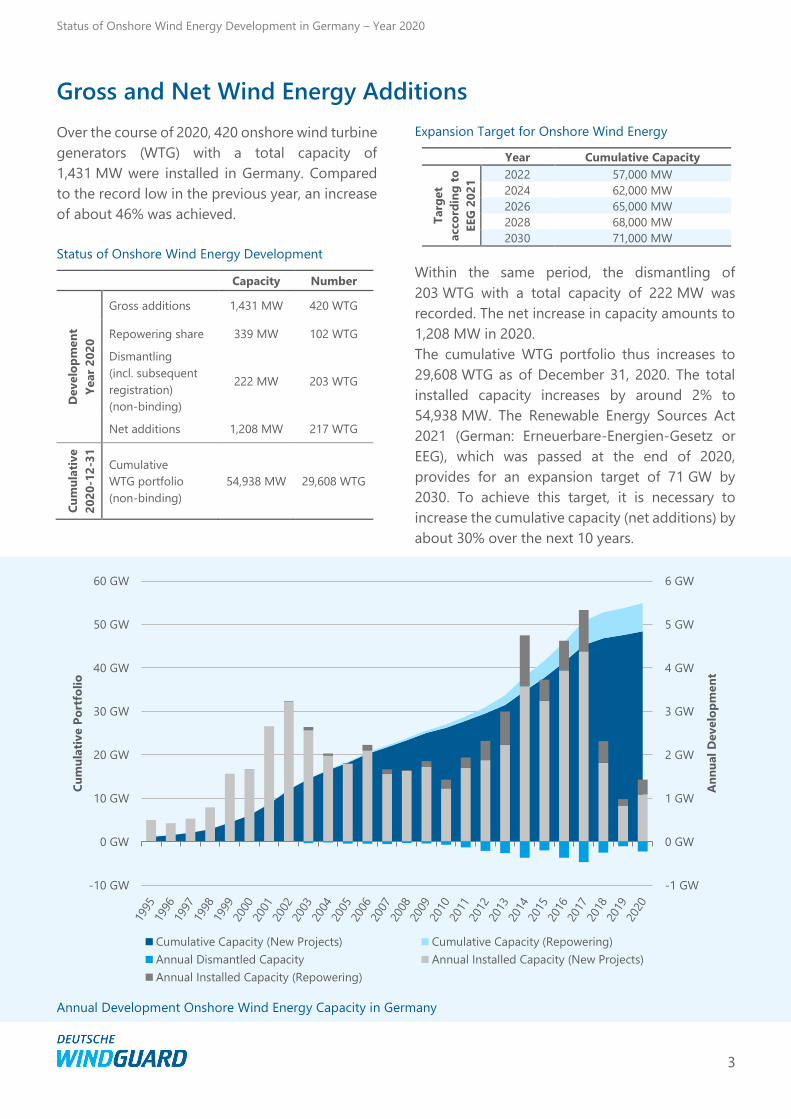
Over the course of 2020, 420 onshore wind turbine
generators (WTG) with a total capacity of
1,431 MW were installed in Germany. Compared
to the record low in the previous year, an increase
of about 46% was achieved.
Status of Onshore Wind Energy Development
Capacity Number
Develo
pm
en
t
Year
20
20
Gross additions 1,431 MW 420 WTG
Repowering share 339 MW 102 WTG
Dismantling
(incl. subsequent
registration)
(non-binding)
222 MW 203 WTG
Net additions 1,208 MW 217 WTG
Cu
mu
lati
ve
20
20
-12
-31
Cumulative
WTG portfolio
(non-binding)
54,938 MW 29,608 WTG
Expansion Target for Onshore Wind Energy
Year Cumulative Capacity
Targ
et
acco
rdin
g t
o
EEG
20
21
2022 57,000 MW
2024 62,000 MW
2026 65,000 MW
2028 68,000 MW
2030 71,000 MW
Within the same period, the dismantling of
203 WTG with a total capacity of 222 MW was
recorded. The net increase in capacity amounts to
1,208 MW in 2020.
The cumulative WTG portfolio thus increases to
29,608 WTG as of December 31, 2020. The total
installed capacity increases by around 2% to
54,938 MW. The Renewable Energy Sources Act
2021 (German: Erneuerbare-Energien-Gesetz or
EEG), which was passed at the end of 2020,
provides for an expansion target of 71 GW by
2030. To achieve this target, it is necessary to
increase the cumulative capacity (net additions) by
about 30% over the next 10 years.
Annual Development Onshore Wind Energy Capacity in Germany
-1 GW
0 GW
1 GW
2 GW
3 GW
4 GW
5 GW
6 GW
-10 GW
0 GW
10 GW
20 GW
30 GW
40 GW
50 GW
60 GW
An
nu
al
Develo
pm
en
t
Cu
mu
lati
ve P
ort
foli
o
Cumulative Capacity (New Projects) Cumulative Capacity (Repowering)
Annual Dismantled Capacity Annual Installed Capacity (New Projects)
Annual Installed Capacity (Repowering)

Status of Onshore Wind Energy Development in Germany – Year 2020
4
Dismantling and Repowering
In 2020, 102 wind turbine generators (WTG) with
339 MW were identified as repowering WTG. The
repowering share in the 2020 gross capacity
additions is thus 24%. Not all 203 dismantled WTG
with 222 MW have been taken down for the
purpose of repowering. The EEG remuneration
period for turbines commissioned in or before
2000, which expired for the first time on December
31, 2020, may reduce the incentive to continue
operating old turbines. If turbines can no longer
be operated or repaired economically, they are
usually dismantled.
The new EEG 2021 provides regulations to prevent
the substantial dismantling of turbines without
replacement for which the EEG remuneration
period has ended. These old turbines are entitled
to receive a transitional remuneration. According
to the EEG 2021, the feed-in tariff corresponds to
the monthly market value for onshore wind
energy, plus a surcharge that decreases over the
course of 2021 (initially 1 ct/kWh, 0.25 ct/kWh at
the end of 2021) and minus marketing costs.
This transitional regulation is to be replaced in
2021 by a special tender system for turbines for
which the EEG remuneration period has ended.
Tenders are to be used to award a feed-in tariff
until the end of 2022 to turbines that continue
operation. The key points for this tender system
are regulated by a so-called ordinance
authorization. Particularly specified is that only
those operators may participate whose turbine is
located on an area where repowering is not
permitted under planning regulations. The volume
of the tenders is limited to 1.5 GW in 2021 and
1 GW in 2022. The upper limit for the bid value is
set between 3 ct/kWh and 3.8 ct/kWh.
Development of Annual Dismantled Capacity, Annual Installed Repowering Capacity and Repowering Share
-15%
-10%
-5%
0%
5%
10%
15%
20%
25%
30%
-600 MW
-400 MW
-200 MW
0 MW
200 MW
400 MW
600 MW
800 MW
1,000 MW
1,200 MW
Rep
ow
eri
ng
Sh
are
Rep
ow
eri
ng
an
d D
ism
an
tlin
g
Annual Dismantled Capacity
Annual Installed Capacity (Repowering)
Repowering Share of Annual Capacity Addition

Status of Onshore Wind Energy Development in Germany – Year 2020
5
Regional Distribution of Wind Energy Additions
The German federal state of North Rhine-
Westphalia accounts for the largest share of new
capacity in 2020, with 22% of gross capacity
additions. It is followed by the states in the north
of Germany. Apart from the city states without any
additions, the southern federal states are at the
bottom of the list in terms of gross capacity added
per state in 2020. If dismantling is taken into
account to determine net capacity additions, the
ranking of the federal states changes slightly, but
all states report positive numbers for net
additions.
Dismantling activities in 2020 are also more
concentrated in the northern states when
compared to the southern part of Germany. This is
primarily due to a larger number of old turbines in
the north. A part of the dismantled turbines could
be replaced by new wind turbines at the original
location. Most of the repowering turbines were
installed in North Rhine-Westphalia. It is followed
by Saxony-Anhalt, Schleswig-Holstein and
Brandenburg.
Regional Distribution of Gross Capacity Additions
Year 2020 Gross Additions Dismantling and Net Additions Repowering
Po
siti
on
State Capacity
Addition
Number
Added
WTG
Share*
Capacity
Dis-
mantling
Number
Dismantled
WTG
Net
Additions
Capacity
Repo-
wering
Number
Repo-
wering
WTG
Repo-
wering-
Share**
1 North Rhine-
Westphalia 317 MW 93 WTG 22% 33 MW 33 WTG 283 MW 83 MW 27 WTG 26%
2 Brandenburg 238 MW 70 WTG 17% 33 MW 43 WTG 205 MW 53 MW 14 WTG 22%
3 Lower Saxony 167 MW 48 WTG 12% 48 MW 34 WTG 118 MW 30 MW 8 WTG 18%
4 Saxony-Anhalt 140 MW 42 WTG 10% 26 MW 36 WTG 114 MW 53 MW 15 WTG 37%
5 Schleswig-Holstein 122 MW 35 WTG 9% 52 MW 30 WTG 70 MW 50 MW 15 WTG 41%
6 Mecklenburg-Western
Pomerania 110 MW 33 WTG 8% 1 MW 1 WTG 110 MW 19 MW 7 WTG 17%
7 Rhineland-Palatinate 89 MW 26 WTG 6% 3 MW 2 WTG 87 MW 8 MW 2 WTG 9%
8 Hesse 88 MW 27 WTG 6% 3 MW 5 WTG 85 MW 7 MW 2 WTG 7%
9 Thuringia 60 MW 16 WTG 4% 13 MW 11 WTG 47 MW 32 MW 9 WTG 53%
10 Baden-Württemberg 37 MW 12 WTG 3% 7 MW 4 WTG 30 MW 0 MW 0 WTG 0%
11 Bavaria 32 MW 8 WTG 2% 0 MW 0 WTG 32 MW 1 MW 1 WTG 3%
12 Saarland 22 MW 7 WTG 2% 0 MW 0 WTG 22 MW 0 MW 0 WTG 0%
13 Saxony 8 MW 3 WTG 1% 3 MW 4 WTG 5 MW 5 MW 2 WTG 57%
Berlin 0 MW 0 WTG 0% 0 MW 0 WTG 0 MW 0 MW 0 WTG
Bremen 0 MW 0 WTG 0% 0 MW 0 WTG 0 MW 0 MW 0 WTG
Hamburg 0 MW 0 WTG 0% 0 MW 0 WTG 0 MW 0 MW 0 WTG
Germany 1,431 MW 420 WTG 222 MW 203 WTG 1,208 MW 339 MW 102 WTG 24%
Gross Additions, Dismantling, Net Additions and Repowering in German Federal States
* Share of gross capacity additions per federal state in total gross capacity additions
** Share of repowering capacity per federal state in gross capacity addition per federal state
Gross Addition - 2020
≥ 250 MW
≥ 200 MW and < 250 MW
≥ 150 MW and < 200 MW
≥ 100 MW and < 150 MW
≥ 50 MW and < 100 MW
> 0 MW and < 50 MW
no addition

Status of Onshore Wind Energy Development in Germany – Year 2020
6
Average Wind Turbine Generator Configuration
The average configuration of wind turbine
generators is described by the parameters of the
turbine capacity, the rotor diameter, and the hub
height. Additional indicators are the tip height and
the specific power that in turn can be derived from
the main parameters.
The technology of the newly installed turbines in
2020 largely corresponds to the technology used
in the previous year. The average turbine capacity
of 3.4 MW remains unchanged compared to 2019.
The rotor diameter, averaging 122 m, and the hub
height, averaging 135 m, are also at the previous
year's level. The WTG installed in 2020 have an
average total height of 196 m and an average
specific power of 298 W/m². These values are also
similar to those of 2019.
The average turbine configuration provides good
insight into the overall development of turbine
technology. In addressing the specific
requirements for each project site, a wide range of
individual installed configurations can be
observed.
Average Wind Turbine Generator Configuration
Average
Configuration
Additions
Year 2020
Changes
compared to
prior year
Turbine Capacity 3,407 kW 0%
Rotor Diameter 122 m 0%
Hub Height 135 m 0%
Tip Height 196 m 0%
Specific Power 298 W/m² +1%
Range of Configuration Values of newly installed WTG
25% - 50% 50% - 75% Ⱶ Minimum/Maximum
0 MW
1 MW
2 MW
3 MW
4 MW
5 MW
6 MW
7 MW
Turbine Capacity
Ø 3,407 kW
0 W/m²
100 W/m²
200 W/m²
300 W/m²
400 W/m²
500 W/m²
600 W/m²
700 W/m²
Specific Power
Ø 298 W/m²
0 m
50 m
100 m
150 m
200 m
250 m
300 m
350 m
Rotor
Diameter
Hub Height Tip Height
Ø 196 mØ 122 m Ø 135 m

Status of Onshore Wind Energy Development in Germany – Year 2020
7
Regional Differences in Wind Turbine Generator Configuration
With regard to the average turbine configuration
of new turbines installed in 2020, there are
regional differences – for example, in the tip
height (TH) that results from adding half the rotor
diameter to the hub height. In 2020, the tallest
turbines on average, with a tip height of 218 m,
were installed in Thuringia. Also, in Saarland,
Bavaria, Rhineland-Palatinate, Hesse, Baden-
Württemberg and Lower Saxony, turbines with an
average tip height of over 200 m were installed. In
the German federal states of Saxony-Anhalt,
Brandenburg and North Rhine-Westphalia, new
turbines have a total height of just below 200 m.
In Saxony, Mecklenburg-Western Pomerania and
Schleswig-Holstein, the average total height of
new installations in 2020 is significantly lower than
the 200 m mark.
However, due to the low number of newly installed
turbines in some federal states in 2020, the
average configuration is in part strongly
influenced by individual projects. On a national
average, the tip height is just below 200 m due to
the stronger influence of the federal states with a
high number of newly installed WTG.
Turbine Configuration of newly installed WTG in
German Federal States
TH SL BY RP HE BW NI
Ø T
H >
200
Ø T
H >
195
Ø T
H <
195
ST BB NW Germany
SN MV SH
200 m
Additions 2020 Average Configuration of newly installed WTG
State WTG-
Number
Turbine
Capacity
Rotor
Diameter Hub Height
Specific
Power Tip Height
North Rhine-Westphalia 93 WTG 3,406 kW 120 m 135 m 301 W/m² 196 m
Brandenburg 70 WTG 3,401 kW 119 m 137 m 310 W/m² 196 m
Lower Saxony 48 WTG 3,474 kW 123 m 143 m 298 W/m² 204 m
Saxony-Anhalt 42 WTG 3,338 kW 126 m 134 m 275 W/m² 197 m
Schleswig-Holstein 35 WTG 3,486 kW 117 m 100 m 336 W/m² 159 m
Mecklenburg-Western
Pomerania 33 WTG 3,342 kW 112 m 121 m 343 W/m² 177 m
Rhineland-Palatinate 26 WTG 3,431 kW 125 m 146 m 284 W/m² 209 m
Hesse 27 WTG 3,268 kW 127 m 145 m 254 W/m² 209 m
Thuringia 16 WTG 3,772 kW 137 m 149 m 260 W/m² 218 m
Baden-Württemberg 12 WTG 3,100 kW 121 m 144 m 270 W/m² 205 m
Bavaria 8 WTG 3,963 kW 137 m 142 m 268 W/m² 210 m
Saarland 7 WTG 3,129 kW 129 m 149 m 242 W/m² 213 m
Saxony 3 WTG 2,700 kW 100 m 137 m 355 W/m² 187 m
Berlin 0 WTG
Bremen 0 WTG
Hamburg 0 WTG
Germany 420 WTG 3,407 kW 122 m 135 m 298 W/m² 196 m
Average Installed Turbine Configuration in German Federal States

Status of Onshore Wind Energy Development in Germany – Year 2020
8
Results of Tender Rounds
In 2020, a total volume of 3,860 MW was put out
to tender in seven rounds for onshore wind
energy. Projects with a capacity of 2,672 MW
received an award. Approximately 32% of the
tender volume remained without award.
Compared to the previous year, when only half of
the tendered volume (1,847 MW) was awarded,
this represents a significant increase in
participation.
In addition to the low participation in the first six
tender rounds, some turbines could not be
awarded due to the exclusion of the bid from the
tender process (e.g. due to formal errors) or due
to the full exhaustion of the volume for the grid
expansion area. Projects with a capacity of
237 MW could not yet secure an entitlement for
EEG remuneration due to the high participation in
the last tender round in December (WIN20-7).
The upper limit for bid values in all 2020 tender
rounds, which may not be exceeded by the
bidders, was set at 6.2 ct/kWh. Weighted by
capacity throughout all tender rounds, an average
award value of 6.11 ct/kWh was achieved in 2020.
In the December 2020 tender round, an average
capacity-weighted award value of less than
6 ct/kWh was achieved for the first time since the
beginning of 2018.
Development of Awarded Bids of Tender Rounds for
Onshore Wind Energy (Database: BNetzA)
Year Bid Limit
Capacity-
weighted award
value
Year
of
Ten
der 2017 7.00 ct/kWh 4.53 ct/kWh
2018 6.30 ct/kWh 5.63 ct/kWh
2019 6.20 ct/kWh 6.14 ct/kWh
2020 6.20 ct/kWh 6.11 ct/kWh
Competitive Situation in Tender System for Onshore Wind Energy (Database: BNetzA)
0 MW 500 MW 1,000 MW 1,500 MW 2,000 MW 2,500 MW 3,000 MW
WIN17-1 (May)
WIN17-2 (Aug)
WIN17-3 (Nov)
WIN18-1 (Feb)
WIN18-2 (May)
WIN18-3 (Aug)
WIN18-4 (Oct)
WIN19-1 (Feb)
WIN19-2 (May)
WIN19-3 (Aug)
WIN19-4 (Sep)
WIN19-5 (Oct)
WIN19-6 (Dec)
WIN20-1 (Feb)
WIN20-2 (Mar)
WIN20-3 (Jun)
WIN20-4 (Jul)
WIN20-5 (Sep)
WIN20-6 (Oct)
WIN20-7 (Dec)
2017
2018
2019
2020
Tender Volume und Bid Capacity
Tender Volume Awarded Capacity Bid Capacity (not awarded)

Status of Onshore Wind Energy Development in Germany – Year 2020
9
Regional Distribution of Awarded Bids
The capacity of 2,672 MW awarded in all tender
rounds in 2020 is largely distributed among four
German federal states with an award volume of
over 400 MW each: Schleswig-Holstein, Lower
Saxony, North Rhine-Westphalia and Branden-
burg. Together, these states account for 74% of
the total awarded capacity in 2020. Saxony-Anhalt,
Thuringia and Mecklenburg-Western Pomerania
follow at a considerable distance, each with an
awarded capacity of between 100 MW and
150 MW, they thus hold the middle positions in
the federal state ranking. In the German federal
states Rhineland-Palatinate, Baden-Württemberg,
Hesse, Saxony, Bavaria and Berlin, the awarded
capacity from all tender rounds in 2020 is less than
100 MW each – this means that only a low
awarded capacity is allocated to the center and
the south of Germany. Projects from Saarland,
Bremen and Hamburg did not participate in the
2020 tender rounds.
Regional Distribution of Awarded Capacity
(Database: BNetzA)
Regional Distribution of Awarded Capacity across the German Federal States (Database: BNetzA)
583 MW
503 MW
456 MW434 MW
149 MW118 MW 115 MW
96 MW80 MW 72 MW
49 MW
14 MW 4 MW 0 MW 0 MW 0 MW
0 MW
100 MW
200 MW
300 MW
400 MW
500 MW
600 MW
700 MW
Aw
ard
ed
Cap
acit
y
WIN20-1 WIN20-2 WIN20-3 WIN20-5 WIN20-6 WIN20-7Tender Round:
Awarded Capacity - 2020
≥ 500 MW
≥ 400 MW and < 500 MW
≥ 300 MW and < 400 MW
≥ 200 MW and < 300 MW
≥ 100 MW and < 200 MW
< 100 MW
no awarded bid
Status of Onshore Wind Energy Development in Germany – Year 2020
10
Development Status of Awarded Turbines*
With the exception of pilot and small-scale
turbines, wind energy turbines that have been put
into operation since the beginning of 2019 (after
the end of the transition period) have received
their EEG remuneration entitlement by means of a
successful participation in a tender. After receiving
an award, the realization period begins that
remains for the project developers until their
award expires. The respective period is between
30 and 54 months and can be extended, e.g. in the
case of a legal action against the turbine’s permit.
The development status of the turbines that were
awarded without permit in 2017 is largely
unknown. For turbines with permits, which were
mainly awarded from 2018 onwards, the
development status could be estimated based on
the Core Energy Market Data Register (German:
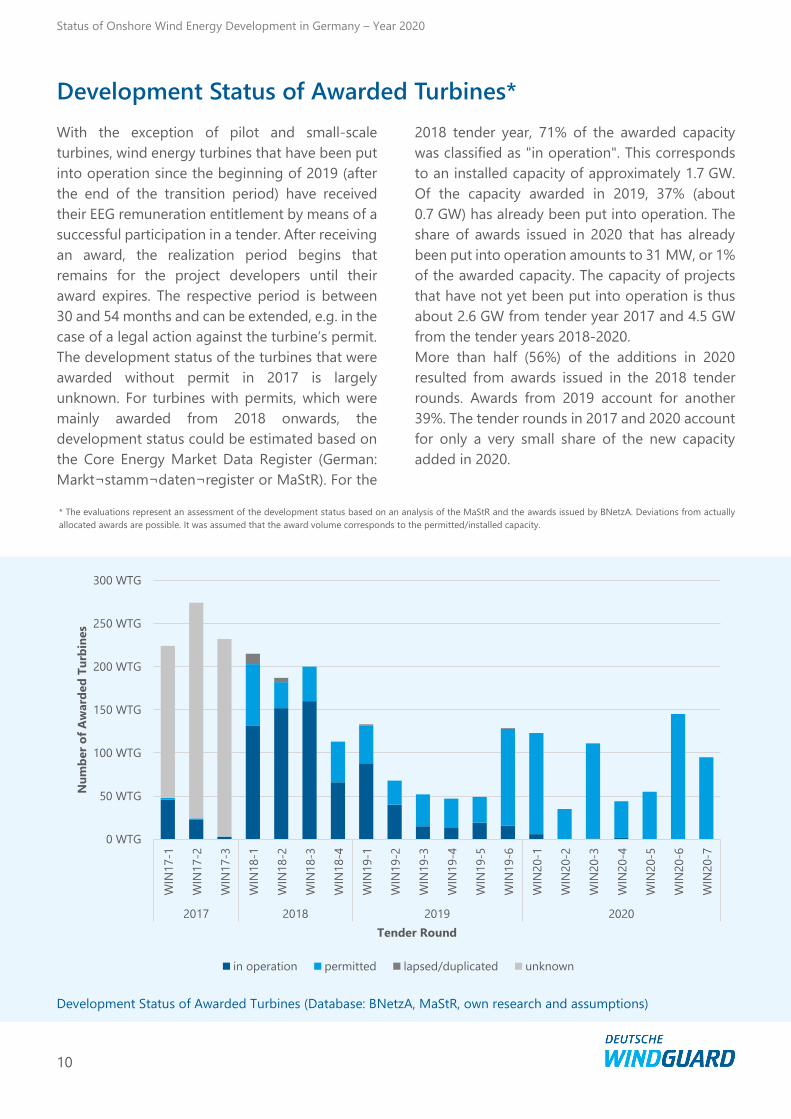
Markt¬stamm¬daten¬register or MaStR). For the
2018 tender year, 71% of the awarded capacity
was classified as "in operation". This corresponds
to an installed capacity of approximately 1.7 GW.
Of the capacity awarded in 2019, 37% (about
0.7 GW) has already been put into operation. The
share of awards issued in 2020 that has already
been put into operation amounts to 31 MW, or 1%
of the awarded capacity. The capacity of projects
that have not yet been put into operation is thus
about 2.6 GW from tender year 2017 and 4.5 GW
from the tender years 2018-2020.
More than half (56%) of the additions in 2020
resulted from awards issued in the 2018 tender
rounds. Awards from 2019 account for another
39%. The tender rounds in 2017 and 2020 account
for only a very small share of the new capacity
added in 2020.
Development Status of Awarded Turbines (Database: BNetzA, MaStR, own research and assumptions)
* The evaluations represent an assessment of the development status based on an analysis of the MaStR and the awards issued by BNetzA. Deviations from actually
allocated awards are possible. It was assumed that the award volume corresponds to the permitted/installed capacity.
0 WTG
50 WTG
100 WTG
150 WTG
200 WTG
250 WTG
300 WTG
WIN
17-1
WIN
17-2
WIN
17-3
WIN
18-1
WIN
18-2
WIN
18-3
WIN
18-4
WIN
19-1
WIN
19-2
WIN
19-3
WIN
19-4
WIN
19-5
WIN
19-6
WIN
20-1
WIN
20-2
WIN
20-3
WIN
20-4
WIN
20-5
WIN
20-6
WIN
20-7
2017 2018 2019 2020
Nu
mb
er
of
Aw
ard
ed
Tu
rbin
es
Tender Round
in operation permitted lapsed/duplicated unknown

Status of Onshore Wind Energy Development in Germany – Year 2020
11
Permitted Capacity and Future Tender Rounds
For 2020, permits with a total volume of around
3.3 GW were reported in the MaStR. Compared to
2019, the permit situation has improved again and
the previous year's volume of around 1,9 GW has
been exceeded.
In order to participate in a tender, modern wind
energy turbines need a permit in accordance to
the Federal Immission Control Act (German:
Bundes-Immissionsschutzgesetz or BImSchG). The
permit is registered in the MaStR. Of the projects
permitted in 2019 and 2020 (5.2 GW), around
0.7 GW are already in operation and another
3.6 GW have been awarded but have not yet been
put into operation. The turbines with 0.9 GW that
have not yet been awarded, as well as all turbines
permitted before and in the future, can secure an
entitlement for EEG remuneration in future
tenders. In 2021, tenders for onshore wind energy
with a volume of 4.5 GW are planned. The bid limit
will fall to 6 ct/kW, which is slightly lower than in
2020, and the grid expansion area, which
previously limited new capacity additions in the
north, will no longer apply. Wind energy turbines,
e.g. in combination with storage facilities, can also
participate in the innovation tenders, in which a
volume of 500 MW will be tendered in 2021.
Tender volume 2021 to 2028 (according to EEG)
Tenders for
Year Onshore Wind Energy Innovations*
2021 4,500 MW 500 MW
2022 2,900 MW 550 MW
2023 3,000 MW 600 MW
2024 3,100 MW 650 MW
2025 3,200 MW 700 MW
2026 4,000 MW 750 MW
2027 4,800 MW 800 MW
2028 5,800 MW 850 MW
Monthly Permitted Capacity including Status
* excluding the capacity reserved for special solar plants (50 MW in 2022)
0 MW
100 MW
200 MW
300 MW
400 MW
500 MW
600 MW
Jan Feb Mar Apr May Jun Jul Aug Sep Oct Nov Dec Jan Feb Mar Apr May Jun Jul Aug Sep Oct Nov Dec
2019 2020
Perm
itte
d C
ap
acit
y
Time of Permission Issue
in operation awarded in tender not awarded yet

Status of Onshore Wind Energy Development in Germany – Year 2020
12
Regional Distribution of the Cumulative Portfolio
The regional distribution of the total number of
WTG in Germany shows a clear north-south divide.
Although the renumeration system provides
stronger support for areas with less wind, which
occur more frequently in the south, the share is
lowest in the south with 15% of the cumulative
capacity. In the tenders from 2022 onwards, the
south should therefore be supported by the newly
defined award quota. Projects located in the
southern region are to receive preferred awards
up to a certain share (15% in 2022/2023 and 20%
from 2024) of the volume. At the end of 2020, the
coastal states accounted for around 41% of the
cumulative installed capacity and the states in
central Germany for around 44%.
Different data are available on the actual
cumulative installed portfolio. Due to different
definition and counting systems, the sources differ
from each other. The MaStR, in which operators
must register their turbines, is still under
development and is to be filled with all existing
turbines by the end of January 2021. Until then,
the sources (DWG statistics, MaStR and, in some
cases, country data) will be maintained in parallel.
Regional Distribution of the Cumulative Capacity
Cumulative Portfolio (2020-12-31)
Region State
Cumulative Capacity Cumulative Number
DWG
Statistics MaStR* State Data**
DWG
Statistics MaStR* State Data**
No
rth
Lower Saxony 11,430 MW 11,327 MW 6,352 WTG 6,214 WTG
Schleswig-Holstein 7,064 MW 6,891 MW 6,780 MW 3,673 WTG 3,335 WTG 3,021 WTG
Mecklenburg-Western
Pomerania 3,556 MW 3,461 MW 1,965 WTG 1,887 WTG
Bremen 198 MW 201 MW 91 WTG 93 WTG
Hamburg 128 MW 122 MW 65 WTG 71 WTG
Cen
tral
Brandenburg 7,478 MW 7,501 MW 3,900 WTG 3,898 WTG
North Rhine-Westphalia 6,174 MW 6,171 MW 3,818 WTG 3,503 WTG
Saxony-Anhalt 5,281 MW 5,295 MW 2,870 WTG 2,890 WTG
Hesse 2,295 MW 2,240 MW 1,179 WTG 990 WTG
Thuringia 1,657 MW 1,743 MW 870 WTG 933 WTG
Saxony 1,272 MW 1,290 MW 907 WTG 965 WTG
Berlin 12 MW 12 MW 4 WTG 10 WTG
So
uth
Rhineland-Palatinate 3,757 MW 3,759 MW 1,791 WTG 1,732 WTG
Bavaria 2,559 MW 2,570 MW 1,172 WTG 1,241 WTG
Baden-Württemberg 1,573 MW 1,648 MW 735 WTG 779 WTG
Saarland 505 MW 527 MW 216 WTG 215 WTG
Germany 54,938 MW 54,759 MW 29,608 WTG 28,756 WTG
Cumulative Capacity and Number of WTG in the German Federal States
* Turbine Portfolio (incl. small turbines) based on WTG reported as in operation according to the Core Energy Market Data Register (MaStR)
** Turbine Portfolio subject to permit according to LLUR Schleswig-Holstein as of December 16, 2020
Cumulative - 2020
≥ 8 GW
≥ 7 GW and < 8 GW
≥ 6 GW and < 7 GW
≥ 5 GW and < 6 GW
≥ 4 GW and < 5 GW
≥ 3 GW and < 4 GW
≥ 2 GW and < 3 GW
≥ 1 GW and < 2 GW
< 1 GW

Status of Onshore Wind Energy Development in Germany – Year 2020
13
Monthly Power Production and Market Values
According to the projection data of the
Transmission System Operators (TSO; German:
Übertragungsnetzbetreiber or ÜNB), onshore
wind energy turbines in Germany produced
112 TWh of power in 2020, which is 5% more than
in the previous year. With almost 20 TWh,
February 2020 was by far the month with the
highest power production of the entire year.
The monthly market values that could be called at
the power exchange for electricity from onshore
wind energy dropped to 0.9 ct/kW in connection
with the effects of the COVID-19 pandemic in
spring 2020. In August, the market value returned
to the previous year's level. Nevertheless, the
volume-weighted average market value for
onshore wind energy in 2020 is only 2.4 ct/kWh,
which is 25% lower than in the previous year.
Monthly Market Values for Onshore Wind Energy
(Database: Netztransparenz)
0 ct/kWh
1 ct/kWh
2 ct/kWh
3 ct/kWh
4 ct/kWh
5 ct/kWh
Jan
Feb
Mrz
Ap
rM
ai
Jun
Jul
Au
gSep
Okt
No
vD
ez
Jan
Feb
Mrz
Ap
rM
ai
Jun
Jul
Au
gSep
Okt
No
vD
ez
2019 2020
Mark
et
Valu
es
for
On
sho
re W
ind
Month
Prior Year 2020
Projection of Power Production by Onshore WTG (Database: Netztransparenz Projection Data)
0 TWh
10 TWh
20 TWh
30 TWh
40 TWh
50 TWh
60 TWh
70 TWh
80 TWh
90 TWh
100 TWh
110 TWh
120 TWh
0 TWh
2 TWh
4 TWh
6 TWh
8 TWh
10 TWh
12 TWh
14 TWh
16 TWh
18 TWh
20 TWh
22 TWh
24 TWh
Jan Feb Mar Apr May Jun Jul Aug Sep Oct Nov Dec
Cu
mu
lati
ve O
nsh
ore
Win
d P
ow
er
Pro
du
cti
on
On
sho
re W
ind
Po
wer
Pro
du
cti
on
Monthly Production 2020 Monthly Production 2019
Cumulative Production 2020 Cumulative Production 2019

About Deutsche WindGuard
In the complex energy market, Deutsche WindGuard is committed to providing independent, manufacturer-neutral
consulting and comprehensive scientific, technical and operational services. The wide range of services creates
extensive synergy effects. Whether due diligence, market analysis, contract consulting or feasibility studies: each of
them contains the expertise and know-how of the entire WindGuard group. Deutsche WindGuard has been publishing
the semi-annual statistics on wind energy development since 2012.
About Bundesverband Windenergie e.V. [German Wind Energy Association (BWE)]
BWE, a member of Bundesverband Erneuerbare Energie [German Renewable Energy Federation (BEE)] with more than
20,000 members, represents the entire industry. Members of BWE include the mechanical engineering industry's
suppliers and manufacturers; project developers; specialist jurists; the financial sector; companies from the fields of
logistics, construction, service/maintenance and storage technology; electricity traders; network operators; and
energy suppliers. As a result, BWE is the primary contact for politics and business, science and the media.
About VDMA Power Systems
VDMA Power Systems is an association of the Mechanical Engineering Industry Association (VDMA). It represents the
interests of manufacturers of wind energy and hydroelectric plants, fuel cells, gas/steam turbines and systems and
engine systems in Germany and abroad. For all of these manufacturers, VDMA Power Systems serves as an
information and communication platform for all topics within the industry, such as energy policy, legislation, market
analyses, trade fairs, standardization, and press and public relations.