Embed Size (px)
Citation preview
Status of Major Sport Fishes in Fawcett Lake, Alberta, 2003
CONSERVATIONCONSERVATION
REPORT REPORT
SERIESSERIES

CONSERVATIONCONSERVATION
REPORT REPORT
SERIESSERIES 25% Post Consumer Fibre
When separated, both the binding and paper in this document are recyclable
The Alberta Conservation Association is a Delegated Administrative Organization under Alberta’s Wildlife Act.
Status of major sport fish in Fawcett Lake, Alberta, 2003
Tyler Johns, Greg Fortier, and John Tchir
Alberta Conservation Association Bag 9000‐26, Peace River, Alberta, Canada T8S 1T4
Report Series Editor PETER AKU Alberta Conservation Association #101, 9 Chippewa Rd Sherwood Park AB T8A 6J7 Conservation Report Series Type Data, Technical ISBN printed: 978‐0‐7785‐6509‐3 ISBN online: 978‐0‐7785‐6510‐9 Publication No.: T/148 Disclaimer: This document is an independent report prepared by the Alberta Conservation Association. The authors are solely responsible for the interpretations of data and statements made within this report. Reproduction and Availability: This report and its contents may be reproduced in whole, or in part, provided that this title page is included with such reproduction and/or appropriate acknowledgements are provided to the authors and sponsors of this project. Suggested Citation: Johns, T., G. Fortier, and J. Tchir. 2004. Status of major sport fish in Fawcett Lake,
Alberta, 2003. Data Report, D‐2004‐023, produced by the Alberta Conservation Association, Peace River, Alberta, Canada. 14 pp + App.
Cover photo credit: David Fairless Digital copies of conservation reports can be obtained from: Alberta Conservation Association #101, 9 Chippewa Rd Sherwood Park AB T8A 6J7 Toll Free: 1‐877‐969‐9091 Tel: (780) 410‐1999 Fax: (780) 464‐0990 Email: info@ab‐conservation.com Website: www.ab‐conservation.com
i
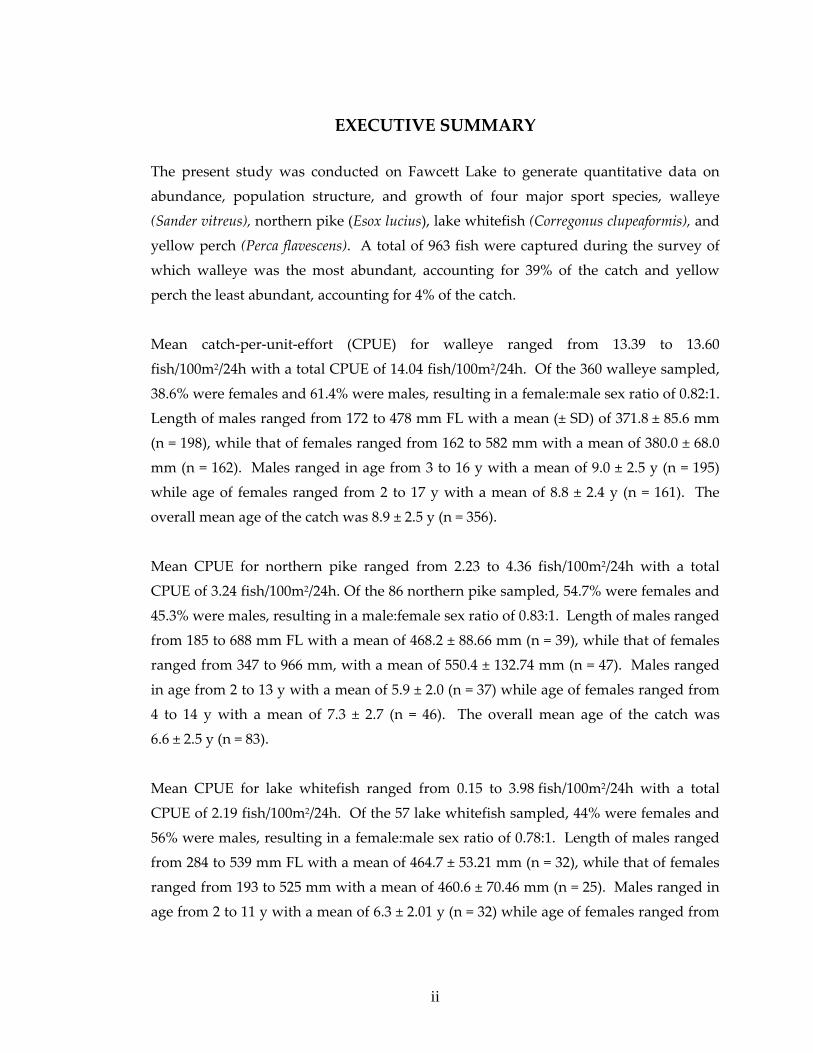
EXECUTIVE SUMMARY
The present study was conducted on Fawcett Lake to generate quantitative data on
abundance, population structure, and growth of four major sport species, walleye
(Sander vitreus), northern pike (Esox lucius), lake whitefish (Corregonus clupeaformis), and
yellow perch (Perca flavescens). A total of 963 fish were captured during the survey of
which walleye was the most abundant, accounting for 39% of the catch and yellow
perch the least abundant, accounting for 4% of the catch.
Mean catch‐per‐unit‐effort (CPUE) for walleye ranged from 13.39 to 13.60
fish/100m2/24h with a total CPUE of 14.04 fish/100m2/24h. Of the 360 walleye sampled,
38.6% were females and 61.4% were males, resulting in a female:male sex ratio of 0.82:1.
Length of males ranged from 172 to 478 mm FL with a mean (± SD) of 371.8 ± 85.6 mm
(n = 198), while that of females ranged from 162 to 582 mm with a mean of 380.0 ± 68.0
mm (n = 162). Males ranged in age from 3 to 16 y with a mean of 9.0 ± 2.5 y (n = 195)
while age of females ranged from 2 to 17 y with a mean of 8.8 ± 2.4 y (n = 161). The
overall mean age of the catch was 8.9 ± 2.5 y (n = 356).
Mean CPUE for northern pike ranged from 2.23 to 4.36 fish/100m2/24h with a total
CPUE of 3.24 fish/100m2/24h. Of the 86 northern pike sampled, 54.7% were females and
45.3% were males, resulting in a male:female sex ratio of 0.83:1. Length of males ranged
from 185 to 688 mm FL with a mean of 468.2 ± 88.66 mm (n = 39), while that of females
ranged from 347 to 966 mm, with a mean of 550.4 ± 132.74 mm (n = 47). Males ranged
in age from 2 to 13 y with a mean of 5.9 ± 2.0 (n = 37) while age of females ranged from
4 to 14 y with a mean of 7.3 ± 2.7 (n = 46). The overall mean age of the catch was
6.6 ± 2.5 y (n = 83).
Mean CPUE for lake whitefish ranged from 0.15 to 3.98 fish/100m2/24h with a total
CPUE of 2.19 fish/100m2/24h. Of the 57 lake whitefish sampled, 44% were females and
56% were males, resulting in a female:male sex ratio of 0.78:1. Length of males ranged
from 284 to 539 mm FL with a mean of 464.7 ± 53.21 mm (n = 32), while that of females
ranged from 193 to 525 mm with a mean of 460.6 ± 70.46 mm (n = 25). Males ranged in
age from 2 to 11 y with a mean of 6.3 ± 2.01 y (n = 32) while age of females ranged from
ii
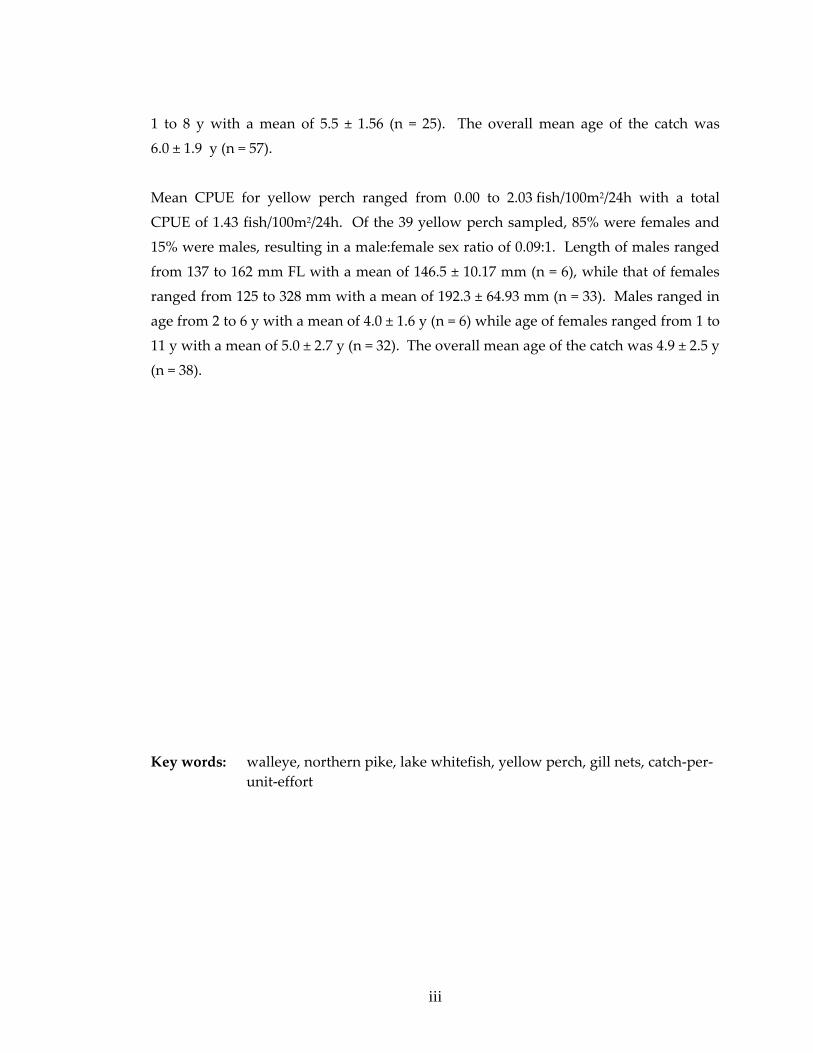
1 to 8 y with a mean of 5.5 ± 1.56 (n = 25). The overall mean age of the catch was
6.0 ± 1.9 y (n = 57).
Mean CPUE for yellow perch ranged from 0.00 to 2.03 fish/100m2/24h with a total
CPUE of 1.43 fish/100m2/24h. Of the 39 yellow perch sampled, 85% were females and
15% were males, resulting in a male:female sex ratio of 0.09:1. Length of males ranged
from 137 to 162 mm FL with a mean of 146.5 ± 10.17 mm (n = 6), while that of females
ranged from 125 to 328 mm with a mean of 192.3 ± 64.93 mm (n = 33). Males ranged in
age from 2 to 6 y with a mean of 4.0 ± 1.6 y (n = 6) while age of females ranged from 1 to
11 y with a mean of 5.0 ± 2.7 y (n = 32). The overall mean age of the catch was 4.9 ± 2.5 y
(n = 38).
Key words: walleye, northern pike, lake whitefish, yellow perch, gill nets, catch‐per‐
unit‐effort
iii

ACKNOWLEDGEMENTS
This program was funded by the Alberta Conservation Association (ACA). We thank
James Aiken, Lorraine Sawdon, Chad Sherburne (ACA), Martin Brilling and Don
Schroeder (Alberta Sustainable Resource Development) for their support in data
collection.
iv

CONSERVATIONCONSERVATIONREPORT REPORT SERIESSERIES
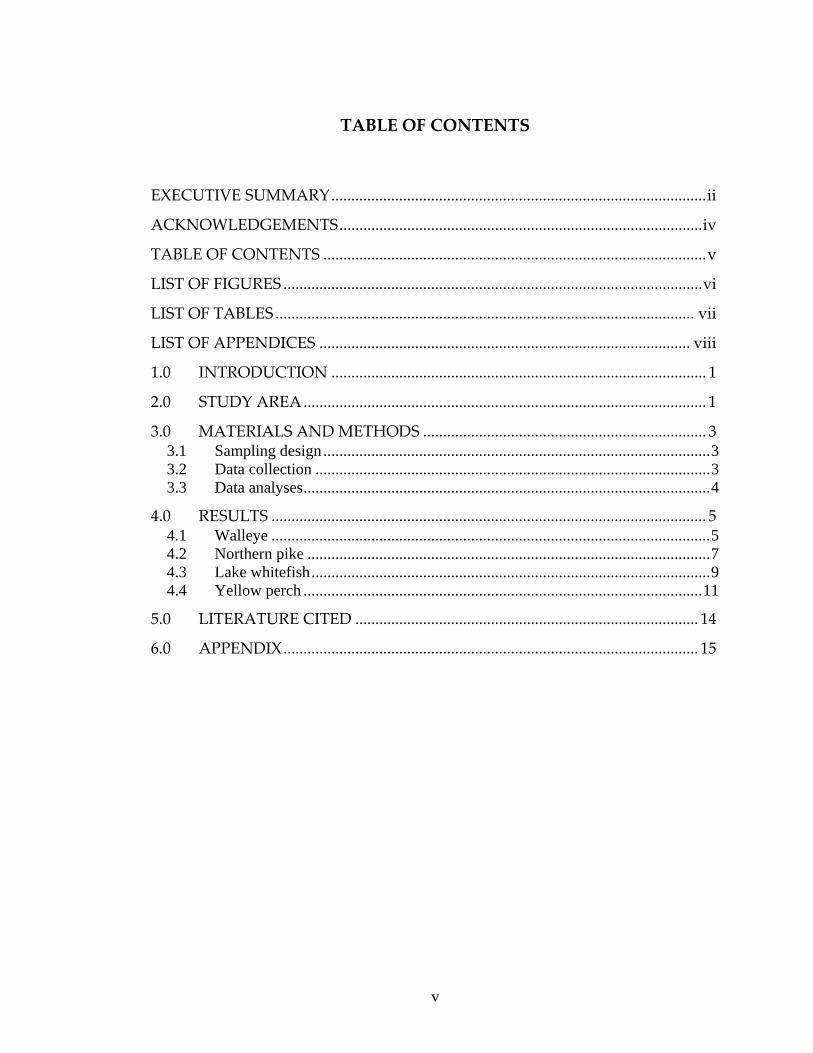
TABLE OF CONTENTS
EXECUTIVE SUMMARY..............................................................................................ii
ACKNOWLEDGEMENTS...........................................................................................iv
TABLE OF CONTENTS ................................................................................................v
LIST OF FIGURES .........................................................................................................vi
LIST OF TABLES ......................................................................................................... vii
LIST OF APPENDICES ............................................................................................. viii
1.0 INTRODUCTION .............................................................................................. 1
2.0 STUDY AREA..................................................................................................... 1
3.0 MATERIALS AND METHODS ....................................................................... 3 3.1 Sampling design.................................................................................................3 3.2 Data collection ...................................................................................................3 3.3 Data analyses......................................................................................................4
4.0 RESULTS ............................................................................................................. 5 4.1 Walleye ..............................................................................................................5 4.2 Northern pike .....................................................................................................7 4.3 Lake whitefish....................................................................................................9 4.4 Yellow perch ....................................................................................................11
5.0 LITERATURE CITED ...................................................................................... 14
6.0 APPENDIX........................................................................................................ 15
v
LIST OF FIGURES Figure 1. Map of Fawcett Lake showing sampling locations for 2003. Inset is map of
the province of Alberta. ......................................................................................... 2
Figure 2. Length distributions of male and female walleye captured in Fawcett Lake during the 2003 gill net survey. ............................................................................ 5
Figure 3. Age distributions of male and female walleye captured in Fawcett Lake during the 2003 gill net survey. ............................................................................ 6
Figure 4. von Bertalanffy growth curves for male and female walleye from Fawcett Lake, Alberta 2003. ................................................................................................. 7
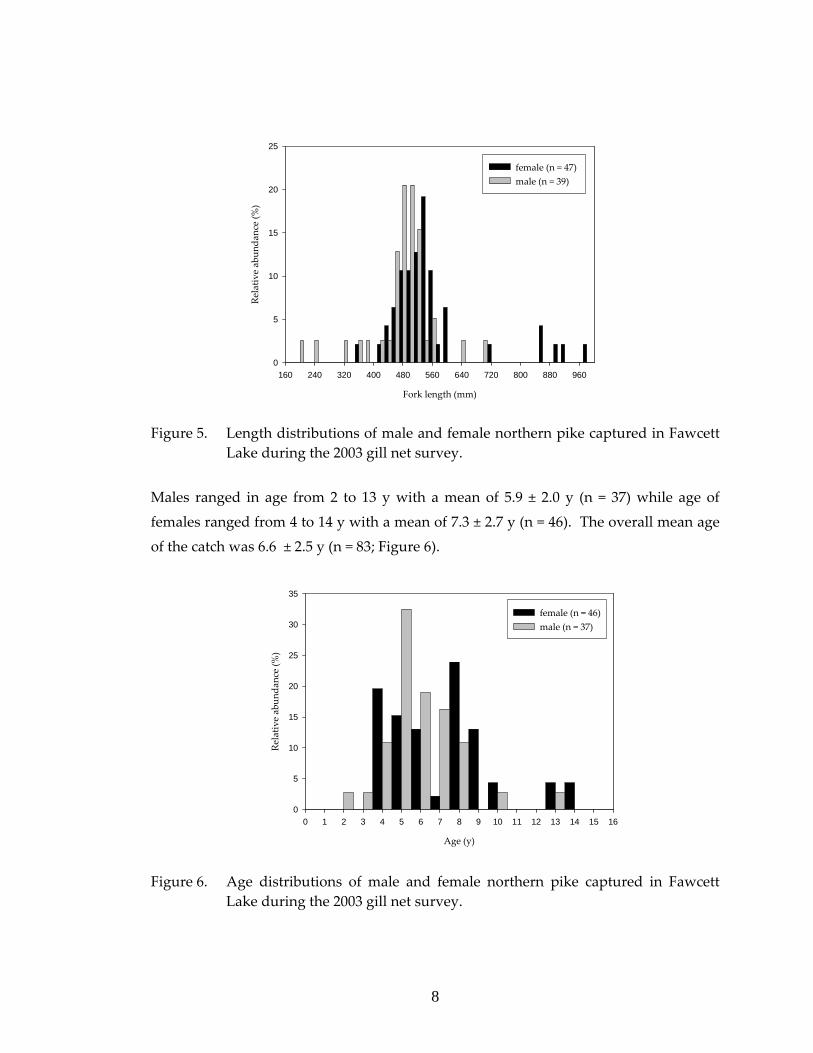
Figure 5. Length distributions of male and female northern pike captured in Fawcett Lake during the 2003 gill net survey. .................................................................. 8
Figure 6. Age distributions of male and female northern pike captured in Fawcett Lake during the 2003 gill net survey. .................................................................. 8
Figure 7. von Bertalanffy growth curves for male and female northern pike from Fawcett Lake, Alberta 2003.. ................................................................................. 9
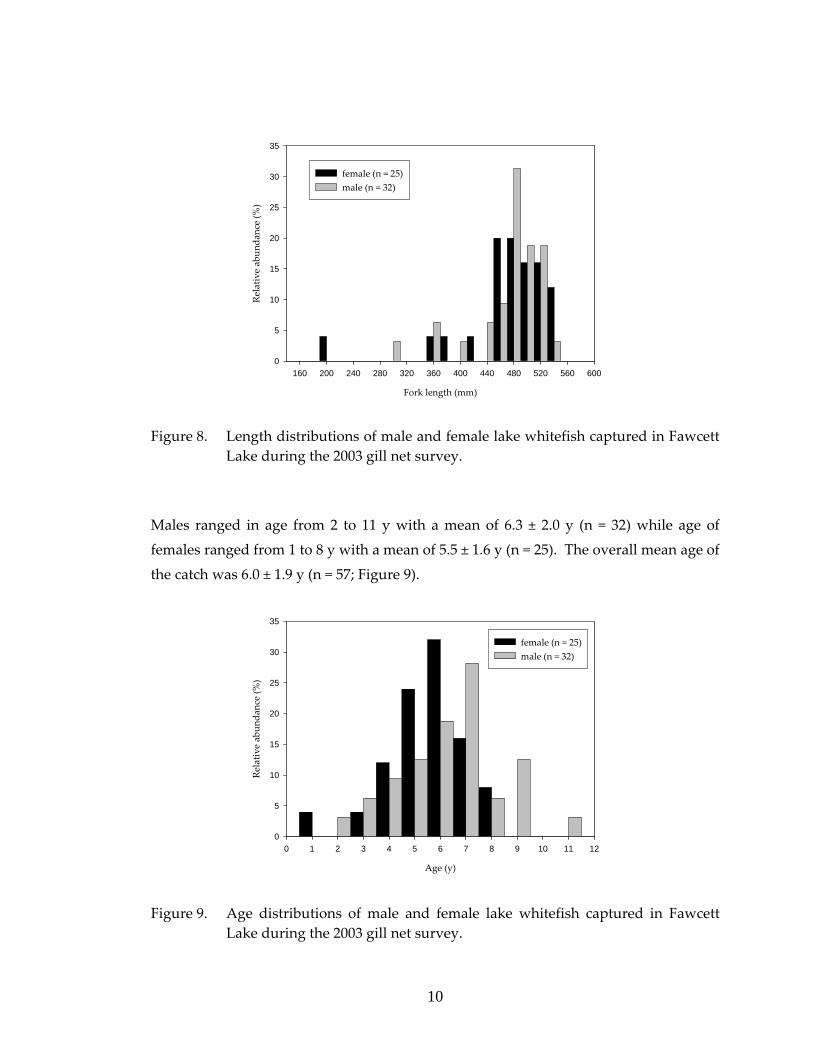
Figure 8. Length distributions of male and female lake whitefish captured in Fawcett Lake during the 2003 gill net survey. ................................................................ 10
Figure 9. Age distributions of male and female lake whitefish captured in Fawcett Lake during the 2003 gill net survey. ................................................................ 10
Figure 10. von Bertalanffy growth curves for male and female lake whitefish from Fawcett Lake, Alberta 2003. ................................................................................ 11
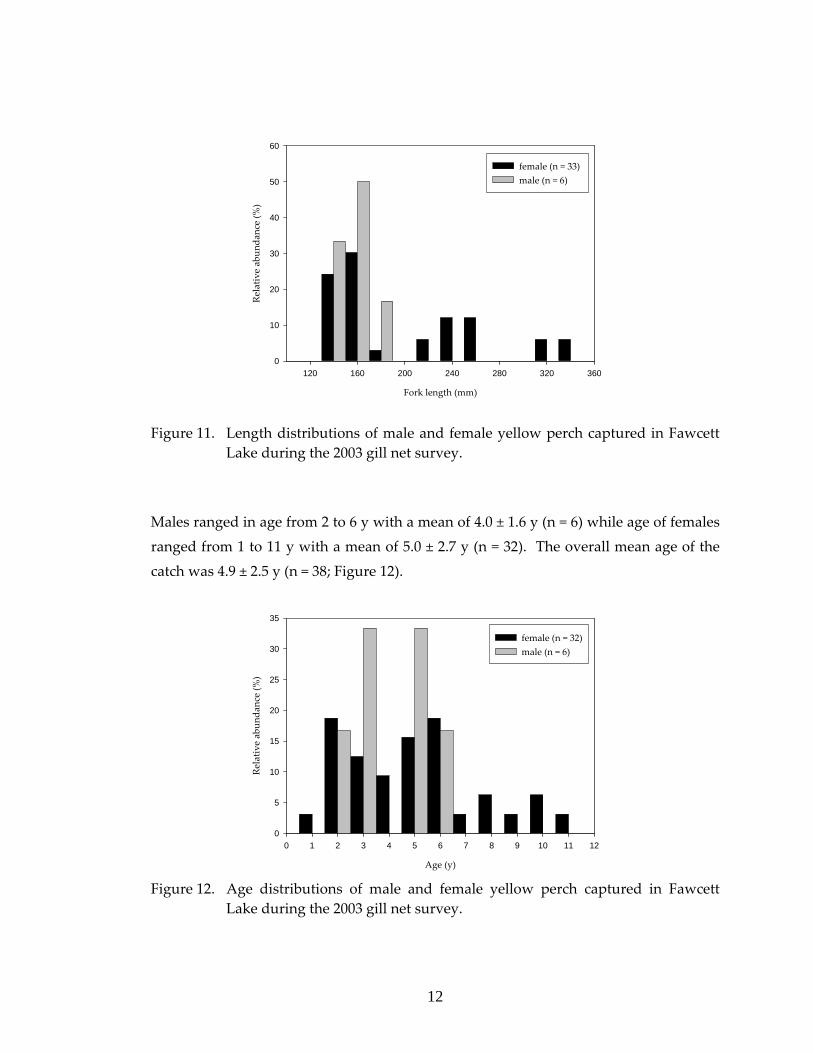
Figure 11. Length distributions of male and female yellow perch captured in Fawcett Lake during the 2003 gill net survey. ................................................................ 12
Figure 12. Age distributions of male and female yellow perch captured in Fawcett Lake during the 2003 gill net survey. ................................................................ 12
Figure 13. von Bertalanffy growth curves for yellow perch from Fawcett Lake, Alberta 2003.. ....................................................................................................................... 13
vi

LIST OF TABLES
Table 1. Distribution of fish sampling effort by depth strata in Fawcett Lake, Alberta 2003.. ......................................................................................................................... 3
vii

LIST OF APPENDICES Appendix 1. Universal transverse mercator (UTM) coordinates (NAD 83, UTM zone
12) of test‐netting locations for Fawcett Lake, Alberta 2003. .................... 15
viii
1
1.0 INTRODUCTION
High angling exploitation of most fish populations, including walleye (Sander vitreus)
and northern pike (Esox lucius), has raised concern about the sustainability of these
sport fisheries in Alberta. Strategies implemented by the Alberta Sustainable Resource
Development (ASRD) to maintain or recover sport fisheries throughout the province
include changes in angling regulations (see Berry 1995, 1999). Such regulation changes
are made in response to changes in angling pressure, catch and harvest rates, as well as
sport fish population parameters.
Fawcett Lake is a popular walleye lake in Alberta. Other major sport fishes in the lake
include northern pike, lake whitefish (Corregonus clupeaformis), and yellow perch (Perca
flavescens). Current regulations for Fawcett Lake state that each angler may keep two
walleye ≥ 43 cm total length (TL) and three northern pike ≥ 63 cm TL per day (ASRD
2003). Daily bag limits are used for yellow perch (15 per day) and lake whitefish (10
per day). To evaluate the effectiveness of these management strategies, we conducted
gill netting surveys on the lake from 2 to 5 September 2003 to quantify population
metrics for four major sport fishes, walleye, northern pike, lake whitefish and yellow
perch. This information is intended for use by fisheries managers to support
management of the fishery at Fawcett Lake.
2.0 STUDY AREA
Fawcett Lake is a 3416‐ha lake located approximately 100 km east of Slave Lake
(Figure 1). It has two basins, a smaller north basin, connected by a narrows to a larger
south basin. The Mink River, located on the east side of the northern basin is the major
inflow to the lake that also serves as the spawning ground for walleye during the
spring. The outflow, Fawcett River is located in the north‐west corner of the lake
(Figure 1). The lake supports natural populations of white sucker (Catostomus
commersoni), longnose sucker (Catostomus catostomus), cisco, lake whitefish, northern
pike, burbot (Lota lota), yellow perch, and walleye.
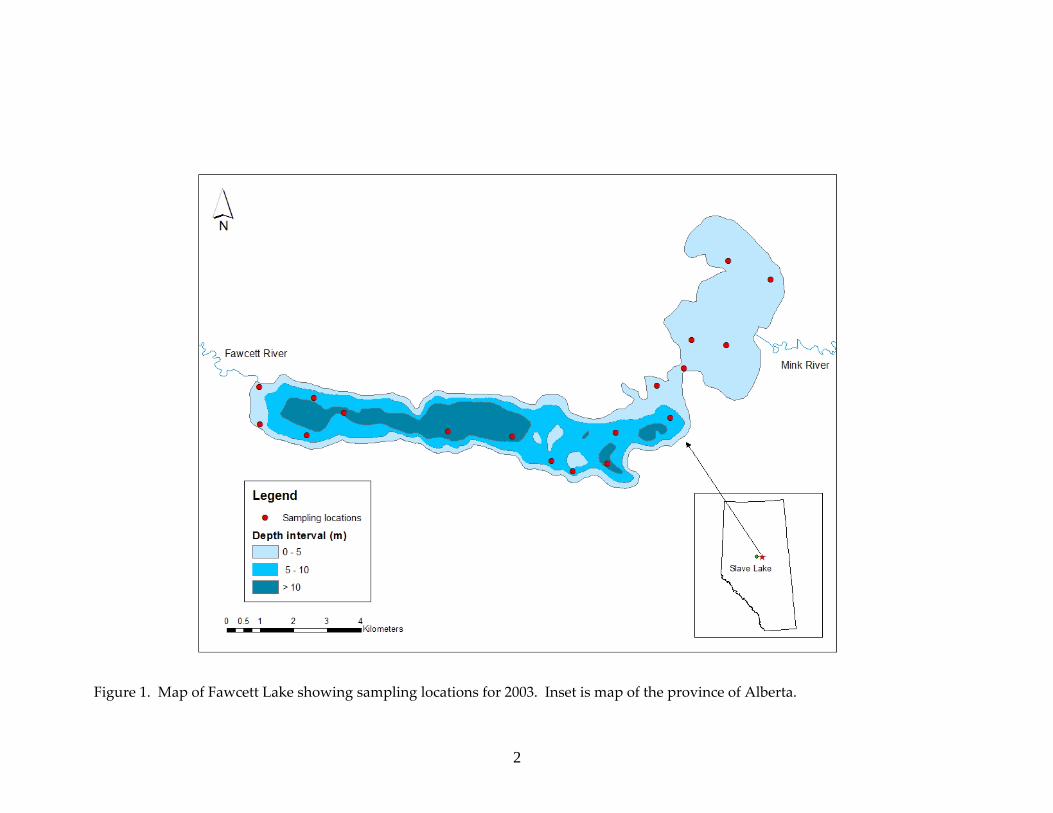
Figure 1. Map of Fawcett Lake showing sampling locations for 2003. Inset is map of the province of Alberta.
2
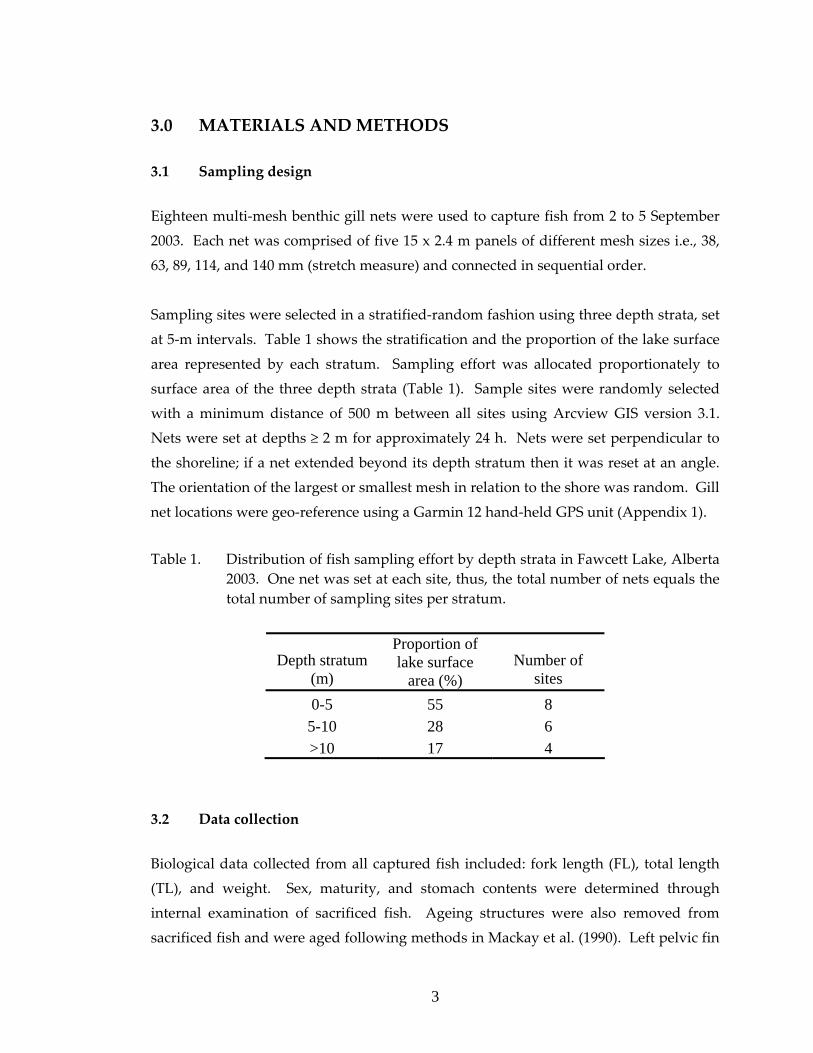
3.0 MATERIALS AND METHODS
3.1 Sampling design
Eighteen multi‐mesh benthic gill nets were used to capture fish from 2 to 5 September
2003. Each net was comprised of five 15 x 2.4 m panels of different mesh sizes i.e., 38,
63, 89, 114, and 140 mm (stretch measure) and connected in sequential order.
Sampling sites were selected in a stratified‐random fashion using three depth strata, set
at 5‐m intervals. Table 1 shows the stratification and the proportion of the lake surface
area represented by each stratum. Sampling effort was allocated proportionately to
surface area of the three depth strata (Table 1). Sample sites were randomly selected
with a minimum distance of 500 m between all sites using Arcview GIS version 3.1.
Nets were set at depths ≥ 2 m for approximately 24 h. Nets were set perpendicular to
the shoreline; if a net extended beyond its depth stratum then it was reset at an angle.
The orientation of the largest or smallest mesh in relation to the shore was random. Gill
net locations were geo‐reference using a Garmin 12 hand‐held GPS unit (Appendix 1).
Table 1. Distribution of fish sampling effort by depth strata in Fawcett Lake, Alberta 2003. One net was set at each site, thus, the total number of nets equals the total number of sampling sites per stratum.
Depth stratum (m)
Proportion of lake surface
area (%) Number of
sites 0-5 55 8 5-10 28 6 >10 17 4
3.2 Data collection
Biological data collected from all captured fish included: fork length (FL), total length
(TL), and weight. Sex, maturity, and stomach contents were determined through
internal examination of sacrificed fish. Ageing structures were also removed from
sacrificed fish and were aged following methods in Mackay et al. (1990). Left pelvic fin
3
rays were collected for ageing walleye and yellow perch, cleithra were collected to age
northern pike, and scales were collected for ageing lake whitefish and cisco. All data
on sport fish, as well as non‐sport fish species (number caught, FL, and weight) were
entered into the Provincial Government Fisheries Management Information System
(FMIS), Project Inventory ID 4959. Stomach content data were collected and archived
as requested by ASRD but not included in this report.
3.3 Data analyses
The abundance of each species, expressed as catch‐per‐unit‐effort (CPUE, fish/100m2 of
net/24h) was calculated at each sampling site and used to estimate the mean CPUE
(+ 95% confidence interval (95% CI)). CPUE values were reported for each depth
stratum, as well as a grand mean for all depth strata combined. Total catch‐per‐unit‐
effort (TCUE) is the total catch of each fish species over the total effort applied.
Length‐ and age‐frequency distributions were used to examine the population structure
of each species. Distributions of length and age were shown in relation to relative
abundance (y‐axis) for each 20‐mm class or age interval.
Fish maturity was described as the age at which 50% of the fish are mature. The length
at which 50% of fish were mature is also reported. Growth rate of fish was described
using the von Bertalanffy (1938) growth model:
)e‐(1L L )t‐(t‐K t
0∞=
where:
Lt = length at age t
L∞ = the asymptote or final maximum size,
K = the rate at which the growth curve approaches the asymptote, and
t0= a time scaler, the hypothetical time when the fish was size zero
To account for sexual variations in growth rate, the von Bertalanffy model was fitted
separately for male and female fish. The parameter used to estimate growth in the von
Bertalanffy model is K i.e., the rate at which the fish approaches maximum size (L∞).
4
High values of K represent fast growth and are usually associated with a low L∞. Due
to small sample sizes of small fish t0 was fixed at zero to reduce bias in the growth
function.
4.0 RESULTS
4.1 Walleye
Walleye accounted for 39% of the total catch (i.e., 371 individuals of the 963 fish
captured). Mean CPUEs were 13.39, 13.63, and 15.2 fish/100m2/24h for the 0 ‐ 5, 5 ‐ 10,
and > 10 m depth strata, respectively with a total catch per unit effort (TCUE) of
14.04 fish/100m2/24h.
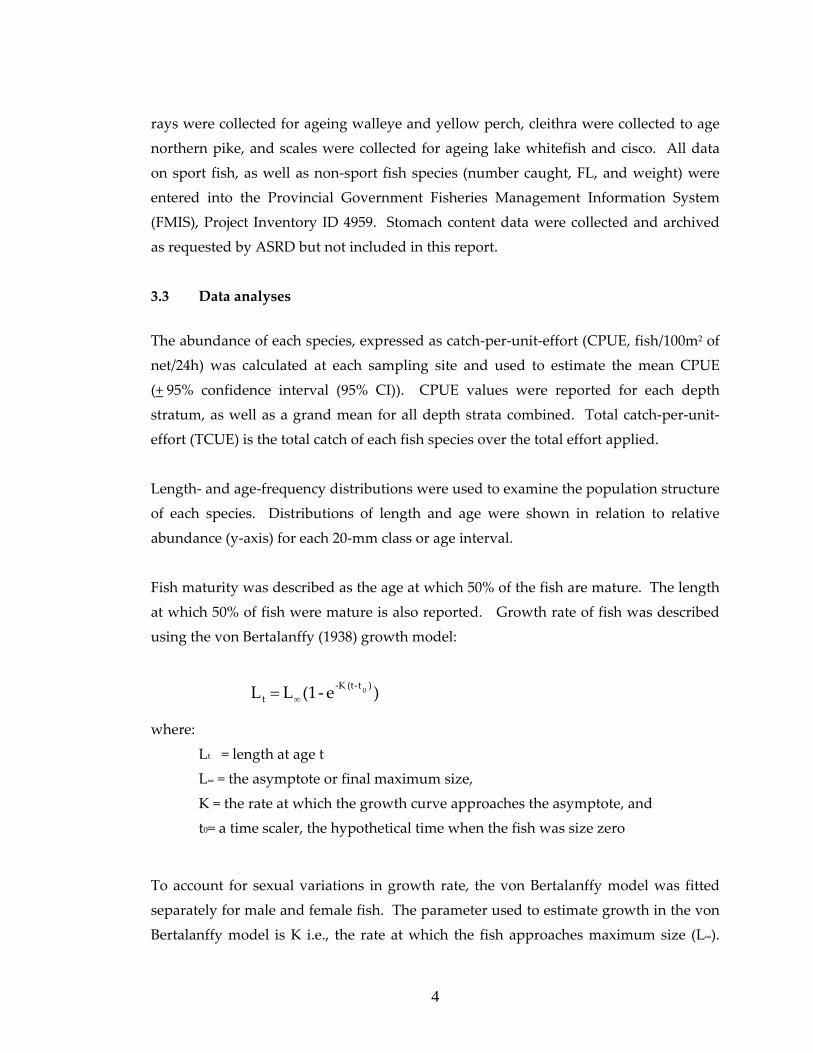
Of the 360 walleye sampled where sex could be determined, 38.6% were females and
61.4 % were males, resulting in a female:male sex ratio of 0.82:1. Male and female
walleye length distributions are shown in Figure 2. Length of males ranged from 172 to
478 mm FL with a mean (± SD) of 371.8 ± 85.6 mm (n = 198), while that of females
ranged from 162 to 582 mm with a mean of 380.0 ± 68.0 mm (n = 162).
Fork length (mm)
160 200 240 280 320 360 400 440 480 520 560 600
Relativ
e abun
dance (%
)
0
5
10
15
20
25
female (n = 162) male (n = 198)
Figure 2. Length distributions of male and female walleye captured in Fawcett Lake
during the 2003 gill net survey.
5
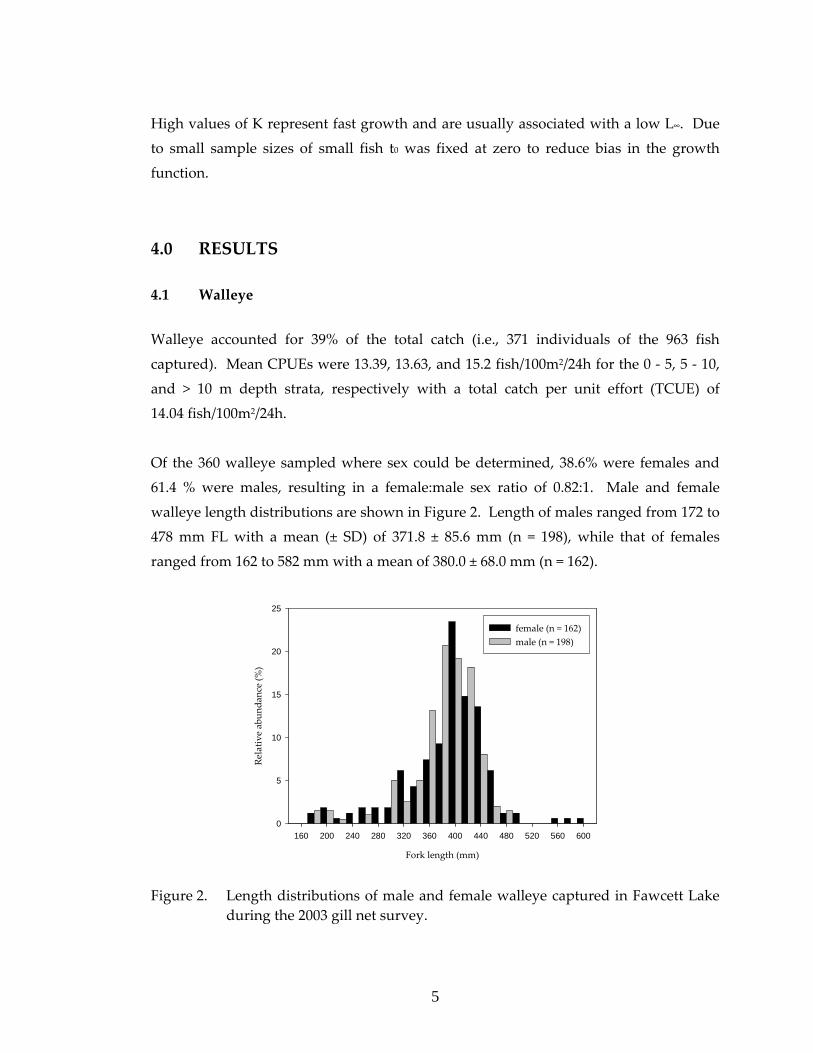
Males ranged in age from 3 to 16 y with a mean of 9.0 ± 2.5 y (n = 195) while age of
females ranged from 2 to 17 y with a mean of 8.8 ± 2.4 y (n = 161). The overall mean age
of the catch was 8.9 ± 2.5 y (n = 356; Figure 3). The age‐10 cohort was the most
abundant year‐class for female walleye, representing 20.0% and the age‐9 cohort was
the most abundant year‐class for males, representing 18%.
Age (y)
0 2 4 6 8 10 12 14 16 18 20
Relativ
e abun
dance (%
)
0
5
10
15
20
25
female (n = 161)male (n = 195)
Figure 3. Age distributions of male and female walleye captured in Fawcett Lake
during the 2003 gill net survey.
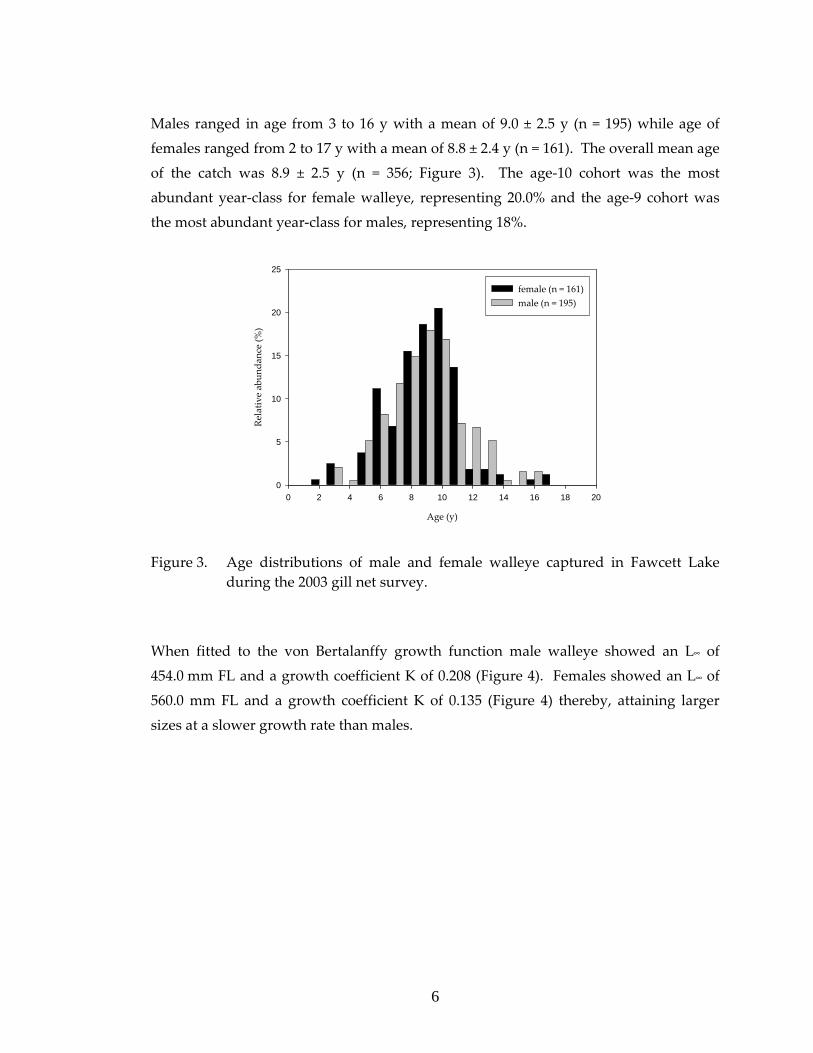
When fitted to the von Bertalanffy growth function male walleye showed an L∞ of
454.0 mm FL and a growth coefficient K of 0.208 (Figure 4). Females showed an L∞ of
560.0 mm FL and a growth coefficient K of 0.135 (Figure 4) thereby, attaining larger
sizes at a slower growth rate than males.
6
Age
0 2 4 6 8 10 12 14 16 18
Fork leng
th (m
m)
0
100
200
300
400
500
600
700
Figure 4. von Bertalanffy growth curves for male and female walleye from Fawcett
Lake, Alberta 2003. von Bertalanffy growth parameters: a) Males: L∞ = 454, K = 0.208, n = 195; b) Females: L∞ = 560, K = 0.135, n = 161.
4.2 Northern pike
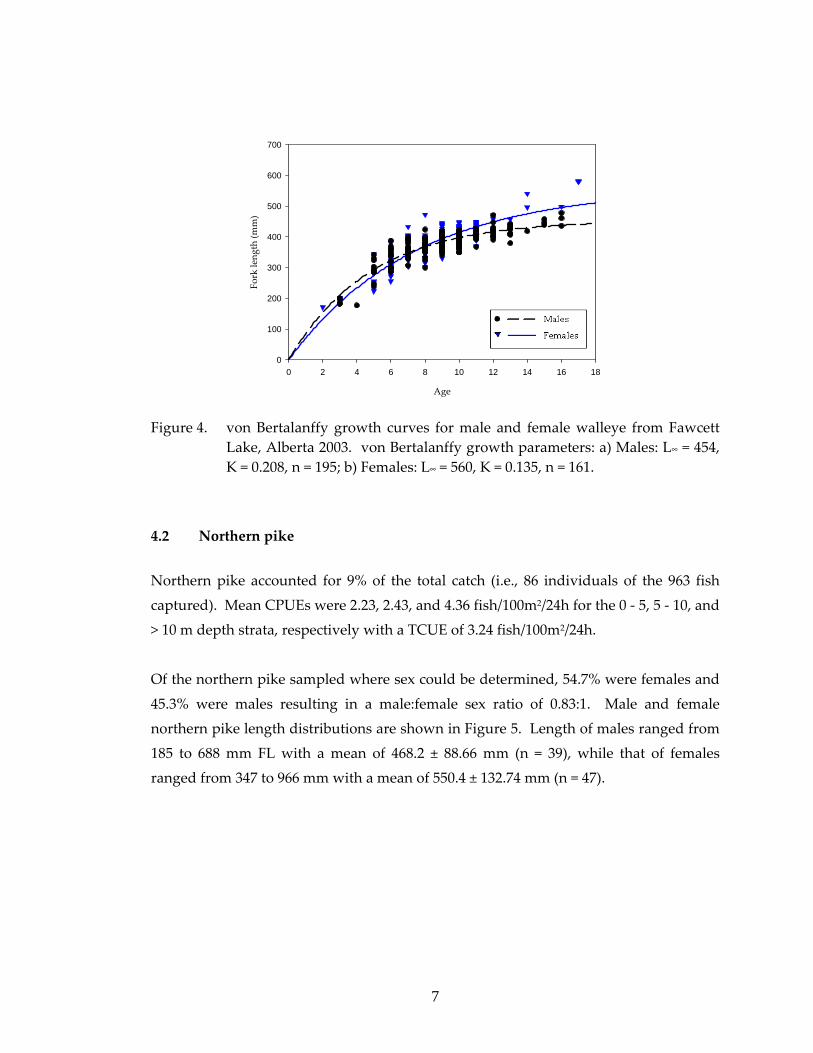
Northern pike accounted for 9% of the total catch (i.e., 86 individuals of the 963 fish
captured). Mean CPUEs were 2.23, 2.43, and 4.36 fish/100m2/24h for the 0 ‐ 5, 5 ‐ 10, and
> 10 m depth strata, respectively with a TCUE of 3.24 fish/100m2/24h.
Of the northern pike sampled where sex could be determined, 54.7% were females and
45.3% were males resulting in a male:female sex ratio of 0.83:1. Male and female
northern pike length distributions are shown in Figure 5. Length of males ranged from
185 to 688 mm FL with a mean of 468.2 ± 88.66 mm (n = 39), while that of females
ranged from 347 to 966 mm with a mean of 550.4 ± 132.74 mm (n = 47).
7
Fork length (mm)
160 240 320 400 480 560 640 720 800 880 960
Relativ
e abun
dance (%
)
0
5
10
15
20
25
female (n = 47) male (n = 39)
Figure 5. Length distributions of male and female northern pike captured in Fawcett
Lake during the 2003 gill net survey.
Males ranged in age from 2 to 13 y with a mean of 5.9 ± 2.0 y (n = 37) while age of
females ranged from 4 to 14 y with a mean of 7.3 ± 2.7 y (n = 46). The overall mean age
of the catch was 6.6 ± 2.5 y (n = 83; Figure 6).
Age (y)
0 1 2 3 4 5 6 7 8 9 10 11 12 13 14 15 16
Relativ
e abun
dance (%
)
0
5
10
15
20
25
30
35
female (n = 46)male (n = 37)
Figure 6. Age distributions of male and female northern pike captured in Fawcett Lake during the 2003 gill net survey.
8
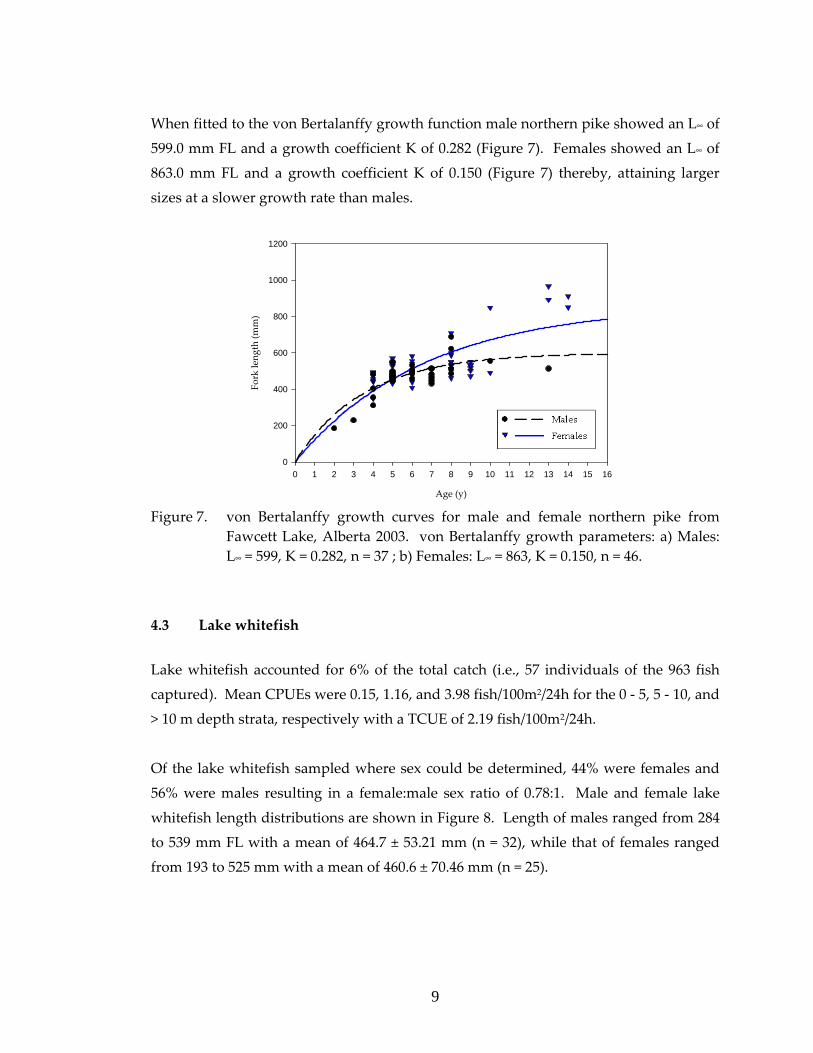
When fitted to the von Bertalanffy growth function male northern pike showed an L∞ of
599.0 mm FL and a growth coefficient K of 0.282 (Figure 7). Females showed an L∞ of
863.0 mm FL and a growth coefficient K of 0.150 (Figure 7) thereby, attaining larger
sizes at a slower growth rate than males.
Age (y)
0 1 2 3 4 5 6 7 8 9 10 11 12 13 14 15 16
Fork leng
th (m
m)
0
200
400
600
800
1000
1200
Figure 7. von Bertalanffy growth curves for male and female northern pike from
Fawcett Lake, Alberta 2003. von Bertalanffy growth parameters: a) Males: L∞ = 599, K = 0.282, n = 37 ; b) Females: L∞ = 863, K = 0.150, n = 46.
4.3 Lake whitefish
Lake whitefish accounted for 6% of the total catch (i.e., 57 individuals of the 963 fish
captured). Mean CPUEs were 0.15, 1.16, and 3.98 fish/100m2/24h for the 0 ‐ 5, 5 ‐ 10, and
> 10 m depth strata, respectively with a TCUE of 2.19 fish/100m2/24h.
Of the lake whitefish sampled where sex could be determined, 44% were females and
56% were males resulting in a female:male sex ratio of 0.78:1. Male and female lake
whitefish length distributions are shown in Figure 8. Length of males ranged from 284
to 539 mm FL with a mean of 464.7 ± 53.21 mm (n = 32), while that of females ranged
from 193 to 525 mm with a mean of 460.6 ± 70.46 mm (n = 25).
9
Fork length (mm)
160 200 240 280 320 360 400 440 480 520 560 600
Relativ
e abun
dance (%
)
0
5
10
15
20
25
30
35
female (n = 25)male (n = 32)
Figure 8. Length distributions of male and female lake whitefish captured in Fawcett
Lake during the 2003 gill net survey.
Males ranged in age from 2 to 11 y with a mean of 6.3 ± 2.0 y (n = 32) while age of
females ranged from 1 to 8 y with a mean of 5.5 ± 1.6 y (n = 25). The overall mean age of
the catch was 6.0 ± 1.9 y (n = 57; Figure 9).
Age (y)
0 1 2 3 4 5 6 7 8 9 10 11 12
Relativ
e abun
dance (%
)
0
5
10
15
20
25
30
35
female (n = 25)male (n = 32)
Figure 9. Age distributions of male and female lake whitefish captured in Fawcett Lake during the 2003 gill net survey.
10
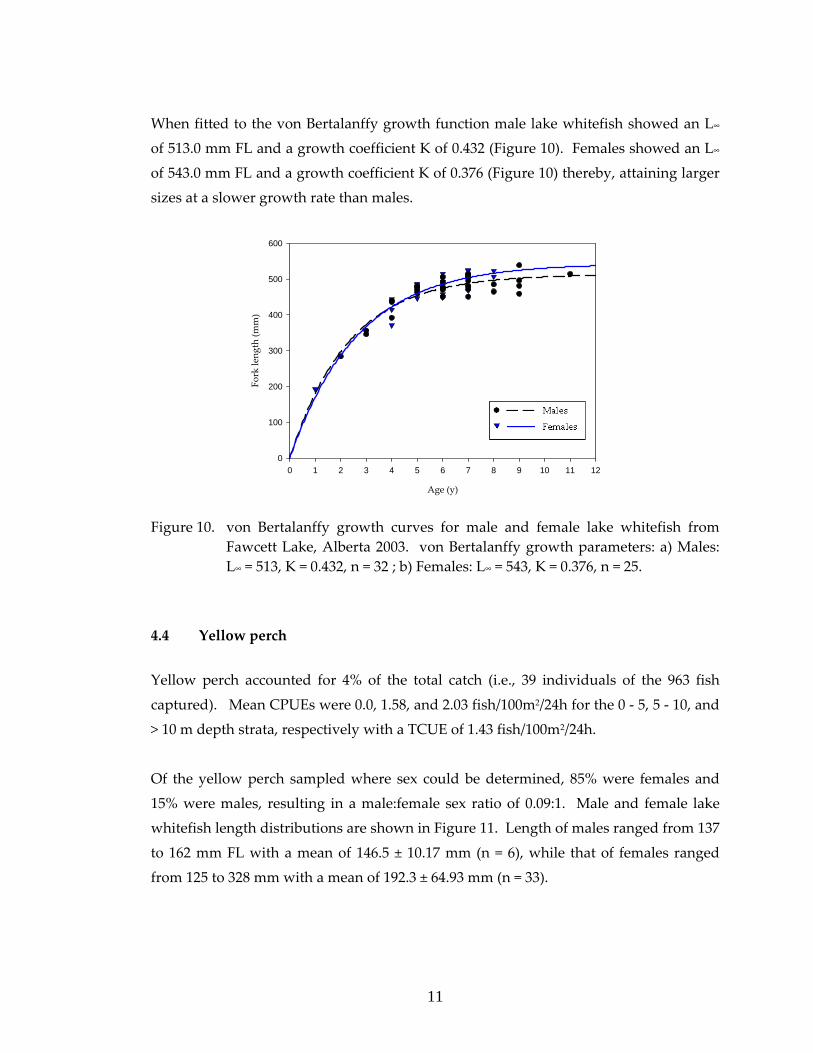
When fitted to the von Bertalanffy growth function male lake whitefish showed an L∞
of 513.0 mm FL and a growth coefficient K of 0.432 (Figure 10). Females showed an L∞
of 543.0 mm FL and a growth coefficient K of 0.376 (Figure 10) thereby, attaining larger
sizes at a slower growth rate than males.
Age (y)
0 1 2 3 4 5 6 7 8 9 10 11 12
Fork leng
th (m
m)
0
100
200
300
400
500
600
Figure 10. von Bertalanffy growth curves for male and female lake whitefish from
Fawcett Lake, Alberta 2003. von Bertalanffy growth parameters: a) Males: L∞ = 513, K = 0.432, n = 32 ; b) Females: L∞ = 543, K = 0.376, n = 25.
4.4 Yellow perch
Yellow perch accounted for 4% of the total catch (i.e., 39 individuals of the 963 fish
captured). Mean CPUEs were 0.0, 1.58, and 2.03 fish/100m2/24h for the 0 ‐ 5, 5 ‐ 10, and
> 10 m depth strata, respectively with a TCUE of 1.43 fish/100m2/24h.
Of the yellow perch sampled where sex could be determined, 85% were females and
15% were males, resulting in a male:female sex ratio of 0.09:1. Male and female lake
whitefish length distributions are shown in Figure 11. Length of males ranged from 137
to 162 mm FL with a mean of 146.5 ± 10.17 mm (n = 6), while that of females ranged
from 125 to 328 mm with a mean of 192.3 ± 64.93 mm (n = 33).
11
Fork length (mm)
120 160 200 240 280 320 360
Relative abun
dance (%
)
0
10
20
30
40
50
60
female (n = 33) male (n = 6)
Figure 11. Length distributions of male and female yellow perch captured in Fawcett Lake during the 2003 gill net survey.
Males ranged in age from 2 to 6 y with a mean of 4.0 ± 1.6 y (n = 6) while age of females
ranged from 1 to 11 y with a mean of 5.0 ± 2.7 y (n = 32). The overall mean age of the
catch was 4.9 ± 2.5 y (n = 38; Figure 12).
Age (y)
0 1 2 3 4 5 6 7 8 9 10 11 12
Relative abun
dance (%
)
0
5
10
15
20
25
30
35
female (n = 32)male (n = 6)
Figure 12. Age distributions of male and female yellow perch captured in Fawcett
Lake during the 2003 gill net survey.
12
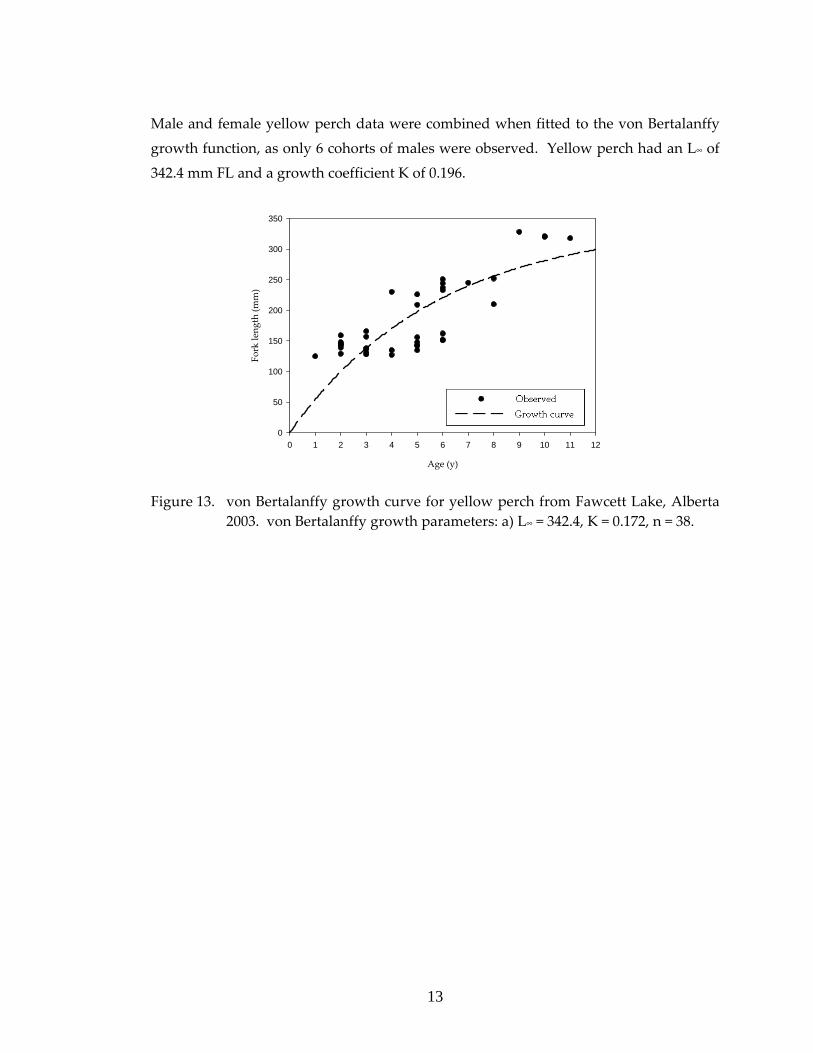
Male and female yellow perch data were combined when fitted to the von Bertalanffy
growth function, as only 6 cohorts of males were observed. Yellow perch had an L∞ of
342.4 mm FL and a growth coefficient K of 0.196.
Age (y)
0 1 2 3 4 5 6 7 8 9 10 11 12
Fork leng
th (m
m)
0
50
100
150
200
250
300
350
Figure 13. von Bertalanffy growth curve for yellow perch from Fawcett Lake, Alberta 2003. von Bertalanffy growth parameters: a) L∞ = 342.4, K = 0.172, n = 38.
13
5.0 LITERATURE CITED
Berry, D.K. 1999. Alberta’s northern pike management and recovery plan.
Number T/459, Alberta Environment Protection, Natural Resources
Service, Edmonton, Alberta, Canada. 22 pp.
Berry, D.K. 1995. Alberta’s walleye management and recovery plan. Number
T/310, Alberta Environment Protection, Natural Resources Service,
Edmonton, Alberta, Canada. 32 pp.
Mackay, W.C., G.R. Ash, and H.J. Norris. 1990. Fish ageing methods for
Alberta. R.L. & L. Environmental Services Ltd. In association with
Alberta Fish and Wildlife Division and University of Alberta, Edmonton.
113p.
von Bertalanffy, L. 1938. A quantitative theory of organic growth. Human
Biology, 10: 181‐213.
14
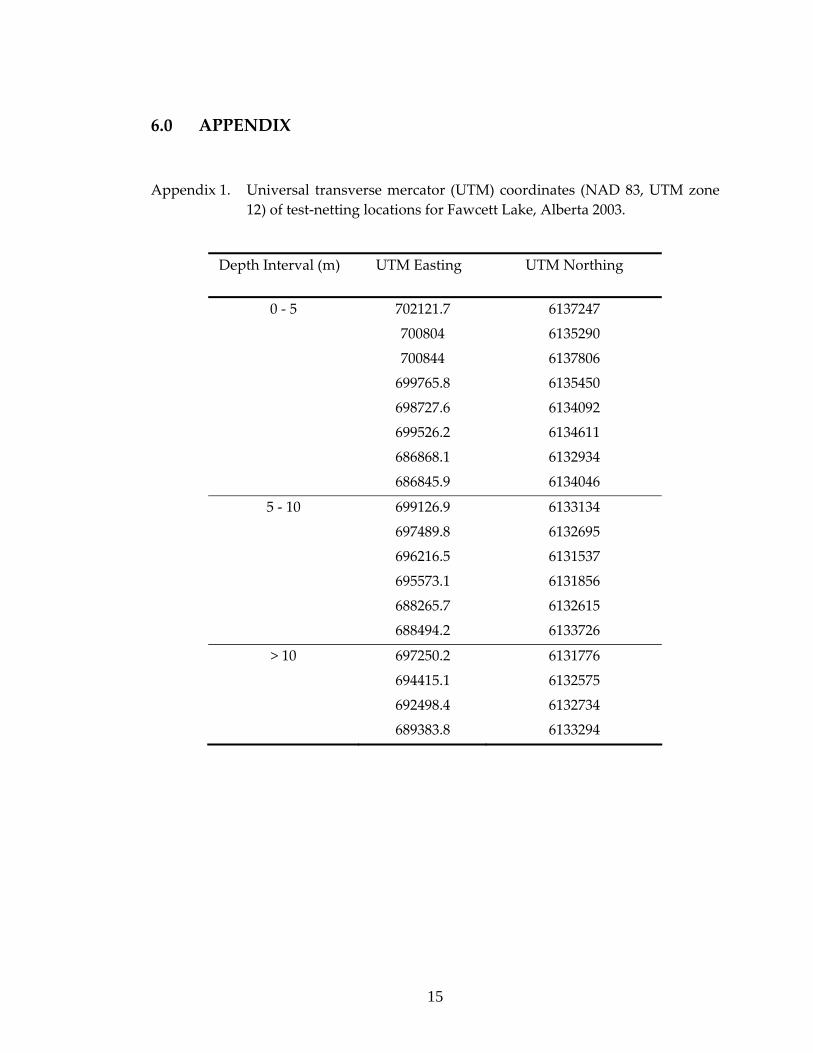
6.0 APPENDIX
Appendix 1. Universal transverse mercator (UTM) coordinates (NAD 83, UTM zone 12) of test‐netting locations for Fawcett Lake, Alberta 2003.
Depth Interval (m) UTM Easting UTM Northing
0 ‐ 5 702121.7 6137247
700804 6135290
700844 6137806
699765.8 6135450
698727.6 6134092
699526.2 6134611
686868.1 6132934
686845.9 6134046
5 ‐ 10 699126.9 6133134
697489.8 6132695
696216.5 6131537
695573.1 6131856
688265.7 6132615
688494.2 6133726
> 10 697250.2 6131776
694415.1 6132575
692498.4 6132734
689383.8 6133294
15

CONSERVATIONCONSERVATIONREPORT REPORT SERIESSERIES

CONSERVATIONCONSERVATIONREPORT REPORT SERIESSERIES

The Alberta Conservation Association acknowledges the following partner for their generous support of
this project