Embed Size (px)
Citation preview

1
STATUS OF FORESTS AND FOREST GOVERNANCE IN UGANDA:
THE CASE OF BULIISA DISTRICT IN THE ALBERTINE RIFT REGION
Uganda Wildlife Society, ENR-CSO Network and Buliisa District Local
Government
DECEMBER 2013
2
STATUS OF FORESTS AND FOREST GOVERNANCE IN UGANDA:
THE CASE OF BULIISA DISTRICT IN THE ALBERTINE RIFT REGION
AUTHORS CONTRIBUTING
Priscilla Nyadoi, Laster Stoney Ogola, Moses Murungi, Balikenda Naphtali, Suzan Owino, Teddy
Namirimu, Joel Buyinza and Charles Walaga.
Editor
Professor Joseph Obua
Project partners
Buliisa District Local Government (BDLG); Ecosystems Alliance Uganda Country Program Partners-
NAPE and AFIEGO; Community Based Civil Society Organization Partners- Soft Power Education
(SPE), Buliisa Initiative for Rural Development Organization (BIRUDO), Buliisa Catholic Women
Association (BUCAWA), Kakindo Orphans Care (KOC) and Kalolo Fish Mongers and Fishermen
Association (KFMFA), Environment and Natural Resources Civil Society Network (ENR-CSOs) and;
Environmental Alert.
December 2013

3
Copyright © 2013 Uganda Wildlife Society and Buliisa District Local Government
Reproduction of this publication for educational or non-commercial purposes is authorized
without prior written permission from the copyright holders provided the source is fully
acknowledged. Publication for resale or other commercial purposes is prohibited.
Citation: Priscilla Nyadoi, Moses Murungi, Balikenda Naphtali, Suzan Owino, Laster Stoney
Ogolla, Teddy Namirimu, Joel Buyinza and Charles Walaga, 2013. Status of Forests and Forest
Governance in Uganda: The Case of Buliisa District in the Albertine Rift Region.
Disclaimer
This research report has been prepared with financial assistance from IUCN NL, Wetlands International
and Both ENDS, partners in the Ecosystem Alliance and CARE International – Uganda. The views
expressed, the information and material presented and the geographical and geopolitical designations used
in this report do not imply the expression of any opinion whatsoever on the part of IUCN NL, Wetlands
International or Both ENDS or CARE International- Uganda and or the institutions and organisations
providing these four organisations with funds.

4
TABLE OF CONTENTS
COVER PAGE.................................................................................................................... 1
AUTHORS CONTRIBUTING ........................................................................................... 2
TABLE OF CONTENTS .................................................................................................... 4
LIST OF TABLES .............................................................................................................. 6
LIST OF FIGURES ............................................................................................................ 7
SUMMARY ........................................................................................................................ 8
INTRODUCTION .............................................................................................................. 9
History of Forest Governance in Uganda ............................................................................9
Status of forest and forest governance in Buliisa district ..................................................10
Issues that guided study .....................................................................................................11
MATERIALS AND METHODS ...................................................................................... 12
Study area...........................................................................................................................12
Demography and socio-economic profile of Buliisa district .............................................12
Sampling approach and data collection .............................................................................13
Data management and analysis ..........................................................................................13
RESULTS ......................................................................................................................... 14
RESULTS -ANALYSIS OF INDIVIDUAL INTERVIEWS DATA ............................... 14
Socio-economic characteristics of respondents .................................................................14
Values and resources that local communities derive from forests in Buliisa district ........16
Sufficiency of access of resources/values from Forests for Local communities in Buliisa
district Communities ..........................................................................................................17
Constraints to respondents’ values/access to forest resources ...........................................17
Local communities’ perspective of forest management in Buliisa district ........................18
Local communities’ perspective of interventions to improve forest management in Buliisa
district and, stakeholders to implement the suggested interventions .................................19
VALIDATION OF RESULTS ......................................................................................... 20
Validation of general findings from individual interviews ................................................20
Restrictions to local communities’ access/value of forest resources .................................20
Interventions to improve forest governance in Buliisa ......................................................21

5
DISCUSSION ................................................................................................................... 24
Emerging issues on state and governance of forest resources in Buliisa district ...............24
Lack of awareness and non use of existing fora, guidelines and legal frameworks on
access, benefit from and participation in forest resource management .............................24
Influence of education on local community access, benefit from and participation in
management of forest resources in Buliisa ........................................................................24
Community access, benefit from and participation in management of forest resources in
Buliisa district based on the forest resource duty bearers’ perspectives ............................24
Community perceptions of state of forests and forest management in Buliisa district .....25
Synthesis-implications of findings on forests state and governance in Buliisa district .....26
CONCLUSIONS AND RECOMMENDATIONS ........................................................... 27
Conclusions .................................................................................................................................. 27
Recommendations ....................................................................................................................... 27
REFERENCES ................................................................................................................. 28
APPENDICES .................................................................................................................. 29
Appendix 1: Analyses, respondents’ socioeconomic characteristics and variables of forest
status and governance investigated ........................................................................................... 29
Appendix 1: Analyses, respondents and investigated variables on forest state and
governance in Buliisa district – Access to forest resources ................................................... 29
Appendix 1b: Analyses, respondents and investigated variables on forest state and
governance in Buliisa district-Sufficiency of resources respondents accessed from forest 41
Appendix 1c: Analyses, respondents and investigated variables on forest state and
governance- Respondents’ perception of forest management in Buliisa district ................ 53
Appendix 1d: Strategies participants agreed on for Achieving Forest Governance Agenda65
Appendix 2: Questionnaire -Investigating the state and, governance of forest resources in
Buliisa district, from local stakeholders- communities and institutions’ perspectives ...... 69

6
LIST OF TABLES
Table 4.1: Respondents Socio-economic characteristics ...................................................... 14
Table 4.2 Correlation analyses, summary of factors found to be important in different
aspects of state and governance of forest resources in Buliisa district. ............................... 16
Table 4.3: Community awareness of fora, guidelines, laws,policies on access, benefits,
and participation in decision making for forest resources use and management in Buliisa20
Table 4.4: The existing fora, guidelines, laws and policies for community access, benefits
and participation in forest resources use and management in Buliisa .................................. 21
Table 4:5 Interventions to improve forest resource access, benefits and community
participation ................................................................................................................................. 21
Table 4.6: Stakeholders to execute forest management interventions in Buliisa district .. 22

7
LIST OF FIGURES
Figure 1: Map of Buliisa District Showing Selected Natural Resources and Sub Counties. ......... 12

8
SUMMARY
Several studies have highlighted weak enforcement of policies and laws, inadequate funding,
inequity in benefit sharing and exclusion of local community from participating in management
as causes of Uganda’s forest cover decline from over 20% early in the 19th
century to now only
17% of the country’s total land area. We report the findings of a case study carried out to help
define the status of forests and forest governance (aspects of community access, benefit from and
participation in the resource management) in Buliisa district from the forest sector stakeholders’
perspective. We used questionnaire-guided individual interviews, focus group discussions and
validation to obtain information from 373 individuals, 45 participants who were representatives
of local communities and policy makers, and 3 officials from National Forest Authority and
Forest Service Support Division. Data were managed and analyzed in SPSS, validated and
reported in this publication.
Results show that 55% of the 373 respondents involved in this study accessed and used forest
resources in Buliisa district. Education and land ownership influenced (P≤0.05) forest resource
access with, degree holders and postgraduates having more access than the none and semi
educated, and more landowners than the landless. About 39% of the respondents did not get
enough resources from the forests due to among others, restrictions by government and resource
decline. Many respondents did not know about the existing fora/avenues, processes/guidelines,
policies and legal frameworks they could use to access (76.7%, 88.9% and 82.2%), benefit from
(91.1%, 91.1% and 91.1%) and or participate in management (76.7%, 76.7% and 76.7%) of
forest resources in the district. Duty bearers on the other hand reported that government outreach
programmes to popularize and implement the existing provisions were curtailed by lack of
resources.
Government through responsible ministries, agencies and sector stakeholders should popularize
and implement the existing fora/avenues, processes, policies and legal framework provisioning
for peoples’ access to resources, benefit from and participation in forest management. This
intervention should be strategically carried out to ensure that the less and or un educated persons
effectively benefit.

9
INTRODUCTION
History of Forest Governance in Uganda
Forest governance is a technique by which officials and institutions acquire and exercise
authority in the management of forest resources. It entails application of government regulation
and law enforcement for sustainable management within the political, organizational and cultural
frameworks through which diverse interests in the resources are coordinated and controlled
(Bodegon et al., 2008; Weiland and Deduerwaerdere, 2010). In Uganda, the forest policy of the
1940’s devolved authority of managing local forest reserves from the protectorate to local
government and had provisions for private forest owners and local community to access forest
resources (Banana et al., 2004). In 1967, forest governance was centralized and subsequently
communities’ participation in decision making, monitoring, and enforcement (forest
management) was weakened and this led to deforestation and the forest resources decline. To
address the problem, in 1999 the forest governance was restructured, roles and responsibilities of
the different sector stakeholders streamlined, new policy (Forest Policy 2001), National Forest
Plan (2002) and the National Forestry and Tree Planting Act 2003 developed (Banana et al.,
2004).
The National Forestry and Tree Planting Act 2003, mandates Forest Inspection Division (DIF) in
the Ministry of Water and Environment to supervise the activities of National Forestry Authority
(NFA) and District Forest Services (DFS). National Forest Authority is charged with regulation
and enforcement of rules in and protection of central forest reserves and provision of technical
training services to the sector’s stakeholders. The DFS offer advisory services to private and
customary forest owners. Working with both NFA and the DFS, local communities are involved
in forest patrols, resource use and management under arrangements such as collaborative forest
management (Banana et al., 2008). But in all the attempts towards good forest governance in
Uganda, just like in other developing countries within the region, the extent and level to which
communities and other stakeholders are engaged in forest governance as provided for in existing
policies and legal frameworks remain questionable even as governance issues are localized
(Buyinza et al., 2010 ).

10
The poor state of governance in Uganda’s forest sector is reflected in the prevailing low levels of
transparency, accountability, public participation in decision-making, enforcement of
policies/laws, funding, benefit sharing and exclusion of local community participation from the
management (in general poor governance) in the sector despite existing policy and legal
provisions that would result in good governance of Uganda’s Forests. Todate, only 17% of
Uganda’s total land area is covered by forests, down from over 24% (early in the 19th
Century).
Even more worrying is that over 60% of this remaining forest lands are privately owned, 30%
are managed by the resource constrained district forest service and only 10% (506 central forest
reserves) are managed by NFA. Thus, the need to define and address governance issues in
Uganda’s forests sector is a matter of national concern. It is against this need that UWS
undertook a case study of the status and governance of forests in Buliisa district, so as to
elucidate strategies that would help to address forest governance problems in the district and also
provide lessons and useful guidelines for national applications.
Status of forest and forest governance in Buliisa district
Just like in many other districts of the Albertine Rift and elsewhere in Uganda, forests and other
wildlife resources in Buliisa district contribute significantly to local communities’ livelihoods,
economy and environment through their direct products and ecological services. Nevertheless,
forests and in general other wildlife resources in the district, just like in many other regions in
Uganda, are being destroyed due to weak governance highlighted above and related challenges
(WCS, 2007; NAPE, AFIEGO and UWS, 2012; Obua et al., 2010; Nyadoi et al., 2012). Most
of these past reports were based on inventories of broad issues on natural resources governance
and hence, forest sector specific governance issues relevant to Buliisa remained undefined
known and therefore no clear interventions to address them have been mapped.
In this case study, Uganda Wildlife Society determined from the local communities and
institutions’ perspective, the status of forests and forest governance in Buliisa district, so as to
elucidate strategies that would be necessary to address them. Questionnaire guided interviews
were with individuals and focus group discussion conducted to obtain information from the
district- forest sector stakeholders (local communities, institutions and duty bearers) on aspects

11
of forest governance (resource access, benefits and participation in management) and, perception
on the state of the forest resources in the district.
Information obtained from interviews and focus group discussions held with the forest sector
stakeholders were validated with key representatives of the local communities and institutions at
district and at national levels, officials from Ministry of Water and Environment–National Forest
Authority and Forest Service Support Division participated.
Issues that guided study
1. General characteristics of the stakeholders - socio-economics, age, sex, marital status,
family size, level of education, land ownership, location of land owned, size of land
owned, type of land tenure/ownership rights, constraints on landownership, what can be
done to address the land ownership constraints and who to intervene.
2. Forest values/resources if any respondents accessed and used.
3. Constraints if any, that respondents felt were hindering their access to forest resources,
interventions and who the respondent deemed were necessary to address the constraints.
4. Respondents’ perceptions of whether, they got enough resources they needed from forests
5. Respondents’ perceptions on whether the forests were being used and managed well and
if not why and the interventions that were needed to improve the management of the
forests.

12
MATERIALS AND METHODS
Study area
Curved out of Masindi in 2006, Buliisa district is located about 340 km from Kampala and lies
between 1º 23′ and 2º 21′ North and 31º 24′ and 33º 24′ East. It is boarded by Nebbi district in
the north, Masindi district in the east, Hoima district in the south and Lake Albert in the west
(Figure 1). The district covers 3,200 km2
and includes parts of Lake Albert, Budongo Forest
Reserve, Murchison Falls National Park and Bugungu Wildlife Reserve. Some of its highest
points reach 1,800 m above sea level.
Figure 1: Map of Buliisa District Showing Selected Natural Resources and Sub Counties.
Demography and socio-economic profile of Buliisa district
Buliisa is composed of seven sub counties (Biiso, Buliisa, Buliisa Town Council, Butiaba, Kigwera,
Kihungya and Ngwedo) all in one county (Figure 1). There are 110,000 people, and each household has
about seven persons (UBOS, 2002). About 90% of these rely on wood fuel as the main source of energy.

13
Natural resource dependent communities in the district include the fisher folk comprising 2,744
households in eight landing sites (Butiaba, Tungo Mbiri, Walukuuba, Bugoigo, Kabolwa, and Wansenko)
around Lake Albert. About 150 households are Pastoralists while 1500 are farmers engaged in crop
farming (UBOS, 2002; NAPE, UWS and AFIEGO, 2012). Land is communally owned and has been
zoned based on resource user groups. Lake Albert shores are a fishing zone, crops are grown near
Waisoke River, Kabolwa landing site and Walukuba that are adjacent to Bugungu Wildlife Reserve. Main
crops are cotton, bananas, cassava and maize (NAPE, UWS and AFIEGO, 2012).
Sampling approach and data collection
Buliisa district is divided into six sub counties of Biiso, Buliisa, Butiaba, Kigwera, Kihungya,
and Ngwedo with one town council; Buliisa Town Council. The survey was carried out in all
the 6 sub-counties and 1 town council, from which 50 households were randomly selected per
sub-county. Households to be interviewed were sampled at a regular interval of 1000 m apart.
Overall, a total of 375 households were randomly sampled from all the seven sub counties and
interviewed in Buliisa district.
Systematic random sampling was used to determine the households to be
interviewed. A random start point was chosen at distance away from the sub-county boundary
and thereafter at a regular interval of 1000 m, the household at that point or the nearest
household was interviewed. In total, 375 households were randomly sampled from all the seven
sub counties in the district and interviewed in Buliisa district.
Data management and analysis
Data collected from the 375 randomly selected respondents were entered in the SPSS programme
and statistical summaries generated on status of forests and forest governance in Buliisa district,
based on local communities’ perceptions. The results were validated by local community
representatives and key informants from the local forest institutions in the district in a one day
workshop and, at the national level with policy makers and practitioners at the Ministry of Water
and Environment, National Forestry Authority and Forest Service Support Division. The status
and governance of forests in Buliisa district are presented in this report.
14
RESULTS
RESULTS OBTAINED UPON ANALYSIS OF INDIVIDUAL INTERVIEWS DATA
Socio-economic characteristics of respondents
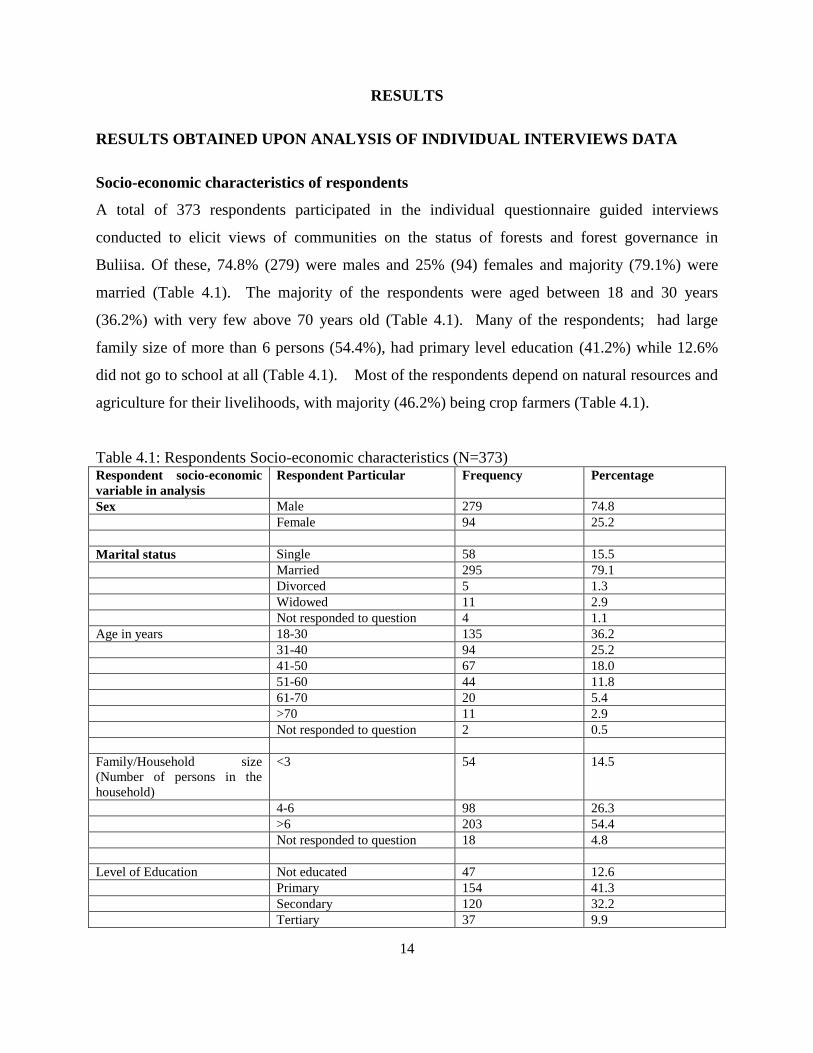
A total of 373 respondents participated in the individual questionnaire guided interviews
conducted to elicit views of communities on the status of forests and forest governance in
Buliisa. Of these, 74.8% (279) were males and 25% (94) females and majority (79.1%) were
married (Table 4.1). The majority of the respondents were aged between 18 and 30 years
(36.2%) with very few above 70 years old (Table 4.1). Many of the respondents; had large
family size of more than 6 persons (54.4%), had primary level education (41.2%) while 12.6%
did not go to school at all (Table 4.1). Most of the respondents depend on natural resources and
agriculture for their livelihoods, with majority (46.2%) being crop farmers (Table 4.1).
Table 4.1: Respondents Socio-economic characteristics (N=373) Respondent socio-economic
variable in analysis
Respondent Particular Frequency Percentage
Sex Male 279 74.8
Female 94 25.2
Marital status Single 58 15.5
Married 295 79.1
Divorced 5 1.3
Widowed 11 2.9
Not responded to question 4 1.1
Age in years 18-30 135 36.2
31-40 94 25.2
41-50 67 18.0
51-60 44 11.8
61-70 20 5.4
>70 11 2.9
Not responded to question 2 0.5
Family/Household size
(Number of persons in the
household)
<3 54 14.5
4-6 98 26.3
>6 203 54.4
Not responded to question 18 4.8
Level of Education Not educated 47 12.6
Primary 154 41.3
Secondary 120 32.2
Tertiary 37 9.9

15
Degree 13 3.5
Postgraduate 2 0.5
Occupation Crop farmer 173 46.4
Fisher folk 73 19.6
Pastoralist 20 5.4
Wildlife resource dependent 1 0.3
Trader 35 9.4
Office employee 23 .2
Others (student,carpenter,Elder
unemployed, traditional
healer,cyclist, etc)
44 11.8
Not responded to question 4 1.1
Period of stay (years) in area <5 27 7.2
5-10 33 8.8
11-15 27 7.2
16-20 47 12.6
>20 235 63
Not responded to question 4 1.1
Origin before settling in area Within the same village 203 54.4
Within the same district 90 24.1
Elsewhere within Uganda 51 13.7
Outside Uganda 21 5.6
Not responded to the question 8 2.1
Land holding size in hectares <1 Hectare 62 16.6
1-3 Hectares 118 31.6
4-7 Hectares 54 14.5
>7 Hectares 44 11.8
Not responded to question 95 25.5
Land tenure Freehold 46 12.3
Mailo land 2 0.5
Communal 92 24.7
Customary 159 42.6
Not responded to question 74 19.8
Majority (63%) of the respondents had lived in their present location for over 20 years, and in
origin before, most of them (54.4%), migrated in from within the same village (Table 4.1) with
reason for migration being land for agriculture (22.3%), fishing (7.2%), inheritance and marriage
(9.9%), business (10.7%), 1.3% settled in Buliisa due to wars from, divorce and related problems
at origin, 3.2 % came in because the area was strategic(favorable environment) while 22.8% did
not state reasons for migration.

16
Majority of the respondents 72% owned the land where they are settled now, the most common
land tenure type was customary ownership held by 46.2% and the majority of the respondents
owned between 1 to 3 acres of land (Table 4.1).
Values and resources that local communities derive from forests in Buliisa district
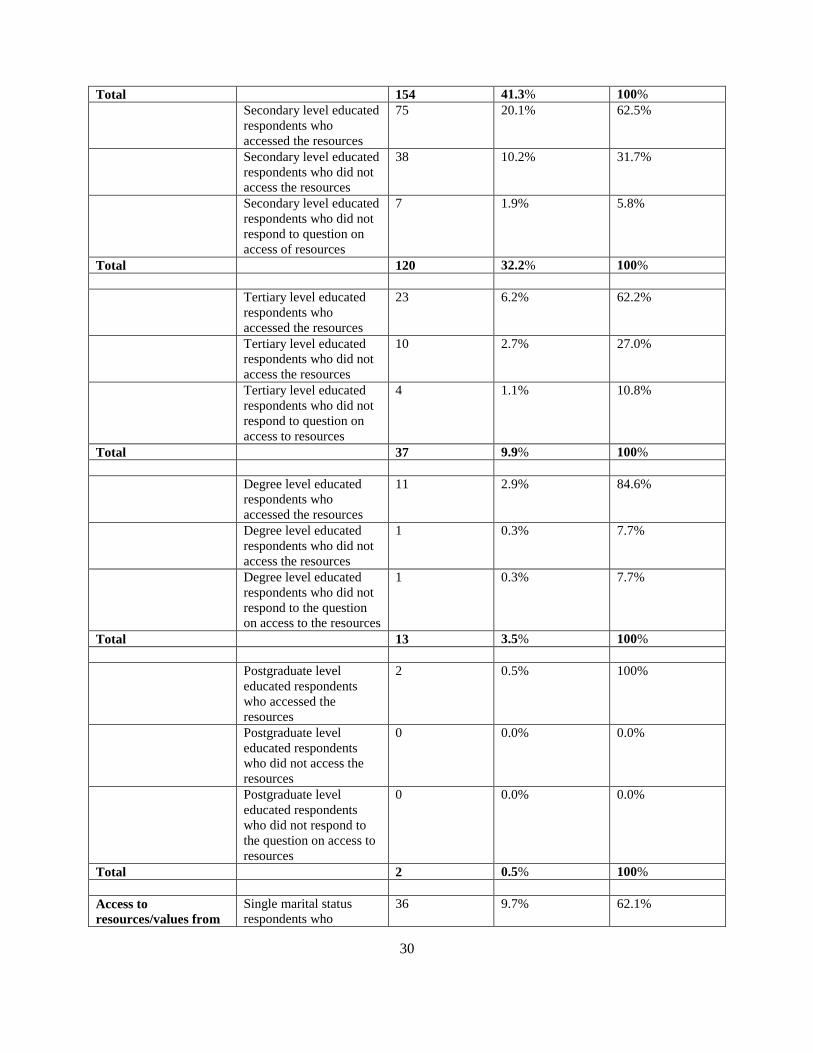
Two hundred and five (55%) of the 373 respondents accessed and used resources from forest in
the district, 37.5% said they did not while 7.5% did not respond to the question on resource
access/value from forests. Overall, more of the educated people (secondary, degree holders and
postgraduates) accessed forest resources (62.5%, 62.2%, 84.6% and 100% respectively) than the
proportion among the less - non and primary level educated (46.8% and 46.8%), and, more of
those who owned land than those who did not own land (P≤=0.05, Table 4.2) with variability in
access with respondent’s other socioeconomic characteristics being as shown in Table in
Appendix 1a)
Table 4.2 Correlation analyses, summary of factors found to be important in different aspects of
state and governance of forest resources in Buliisa district. Item
No.
Forest status and
management Issue
queried
Respondents’ socio economic variable relationship with forests resource
status and management- pair wise comparison, P-values P<0.05
significance level
Educati
on level
Age Marital
status
Famil
y size
Land
ownership
Land
size
Land
tenure
Occupat
ion
1 Respondents
values/access of
resources from forests
0.006 0.798 0.998 0.936 0.049 0.281 0.141 0.067
2 Respondents’ reporting
constraints to resource
access/value from forests
0.004 0.407 0.491 0.402 0.00 0.181 0.160 0.042
3 Respondent reporting
insufficiency of
resources from forests
0.006 0.730 0.931 0.63 0.365 0.513 0.035 0.016
The resources that respondents obtained from the forests included building materials including
timber and poles (mentioned by 23.3% of the respondents), building materials and fuel wood
(11.2%), fuel wood (5.4%), building materials, fuel wood and medicine (4%), building materials,
rainfall and fuel wood (2.9%), building materials and herbal medicine (1.9%),building materials
and fuel wood (1.6%), some 1.3% of the respondents declined to answer question on the type of
resources they accessed from the forest, some 0.8% obtained fuel wood, another 0.8% obtained

17
building materials, fuel wood and herbal medicine, some 0.3% obtained herbal medicine and
others (0.5%) obtained other resources from the forest.
Sufficiency of access of resources/values from Forests for Local communities in Buliisa
district Communities
About 23% of the respondents reported that the resources they got from the forests were
sufficient to meet their needs, 38.6% said the resources were insufficient while 38.1% declined
to state whether the resources were sufficient for their needs or not. Again, fewer of the persons
with higher education level reported not accessing sufficient resources from the forest (0.5- 5.6%
for postgraduates to tertiary level graduates) compared to 4-13.7% for non-educated to primary
level educated respondents (P≤0.006, Table 4.2). Similarly, very few people with Mailo land
tenure (0.0%) reported not accessing sufficient resources from the forest compared to
respondents with land tenure types (P≤0.035 Table 4.2) with insufficiency reporting under the
other tenure types being 15.3% for Customary, Freehold (7.5%), Communal (10.5%) while in
occupation, more people among the crop farmers (16.9%) reported insufficiency of resources
compared to respondents in other groups (0.0% - 6.4%), (P≤ 0.016, Table 4. 2 above). The
variations in sufficiency of resources accessed with the respondents’ socioeconomic variables
were as shown in Table in Appendix 1b).
Constraints to respondents’ values/access to forest resources
Some 159 (42.6%) of the respondents said they did not have any constraints in access/value from
the forest resources, 90 (24.1%) reported they faced constraints in access while 33.2% of the 373
respondents did not answer the question on constraints to access/value from the forest resources.
The factors that respondents mentioned to have constrained their access to forest resources
included restrictions (mentioned by 19.8% of the 373 individuals interviewed), decline in forest
resources (8.6%), location of forest far (3.5%), restriction and forest decline (1.1%) while many
(67%) did not respond to the question on constraints that they faced in accessing resources from
the forest. Also, the respondent’s constraint to forest resource access were influenced by their
level of education, land ownership and occupation (P=0.04, 0.00 and 0.042 respectively, (Table
4.2 above).

18
Respondents’ suggested interventions and stakeholders to implement the interventions
necessary to remove constraints to access/value of resources from forests in Buliisa district
To remove the constraints that hinder access to forest resources the respondents suggested that
restrictions should be removed so that they access the resources from the forests (18.8%), some
67% declined to respond to the question on interventions to remove constraint to access of
resources from the forest, 3% suggested that alternative source need to be provided , 5.4%
suggested Afforestation be carried out to enhance resource availability for access, 4% suggested
legislation be enacted to allow access to resources from the forest , 0.3% suggested allowed
access and Afforestation be effected and another 0.3% suggested legislation for access and
alternative sources of forests resources be developed.
Majority (65.7%) of the respondents did not suggest the stakeholders they deem should
implement the interventions they identified to remove constraints to forest resources access,
6.4% suggested nongovernmental organizations and government, 3.2% suggested local
communities and local government, 2.9% suggested local government, 1.9% (local communities)
and 1.6% (nongovernmental organizations).
Local communities’ perspective of forest management in Buliisa district
Out of the 373 respondents interviewed, 41.3% stated that forest resources in Buliisa were well
managed, 32.4% said the resources were not well managed and 36.3% did not give their opinion
on state of forest management in the district. The respondents (28.4%) mentioned illegal
activities (such as tree cutting, encroachment and charcoal burning), absence of benefits to local
communities (5.6%) and species extinction (0.3%) as the reasons for poor forest management in
Buliisa while some 65.7% did not give response on reasons why they perceive forests in the
district are not being well managed. The respondents’ socioeconomic variable and perception on
forest management in Buliisa district is given in Table in Appendix 1c.

19
Local communities’ perspective of interventions to improve forest management in Buliisa
district and, stakeholders to implement the suggested interventions
The respondents’ suggested interventions to improve forest management in Buliisa district and
these included legislation to curb corruption and illegal activities (mentioned by 23.3% of the
respondents), 64.3% did not give response on perceived interventions to improve forest
management, 5.4% suggested sensitization, 4.8% suggested support to benefit programmes,
1.6% suggested legislation and sensitization while 0.5% mentioned legislation and benefit
programmes.
The specific stakeholders the local communities suggest to implement the interventions
identified to improve forest management in Buliisa district include government (mentioned by
24.4% of the respondents), government and nongovernmental organizations (5.4%), local
government (3.2%), government and local communities (2.7%), nongovernmental organizations
(1.1%), government, nongovernmental organizations and local communities (0.8%) while, some
62.5% declined to suggest any stakeholders to implement interventions to improve forest
management in Buliisa district.
20
VALIDATION OF RESULTS
Validation of general findings from individual interviews
Participants at district level, including representative of local communities and institutions
qualified the survey findings on resource access/value from the forests, the resource sufficiency,
constraints to access and interventions to improve the forest resource sustainability and
governance in Buliisa district. The following issues emerged from the group discussions:
Restrictions to local communities’ access/value of forest resources
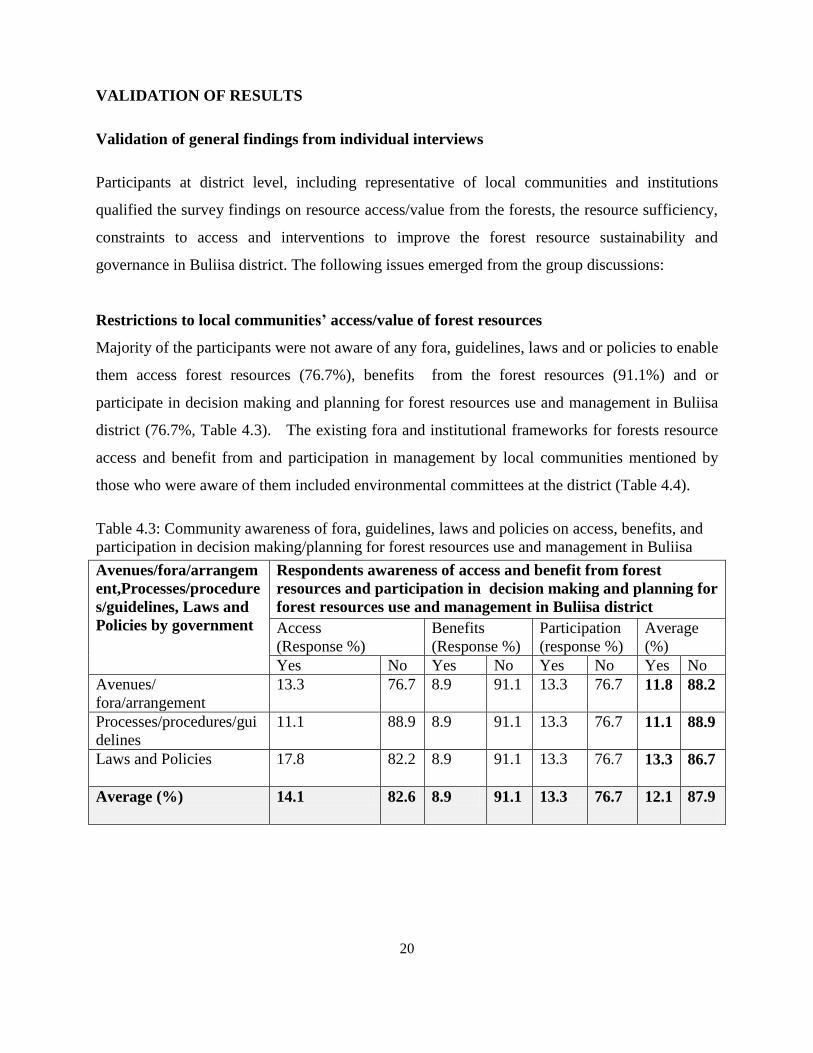
Majority of the participants were not aware of any fora, guidelines, laws and or policies to enable
them access forest resources (76.7%), benefits from the forest resources (91.1%) and or
participate in decision making and planning for forest resources use and management in Buliisa
district (76.7%, Table 4.3). The existing fora and institutional frameworks for forests resource
access and benefit from and participation in management by local communities mentioned by
those who were aware of them included environmental committees at the district (Table 4.4).
Table 4.3: Community awareness of fora, guidelines, laws and policies on access, benefits, and
participation in decision making/planning for forest resources use and management in Buliisa
Avenues/fora/arrangem
ent,Processes/procedure
s/guidelines, Laws and
Policies by government
Respondents awareness of access and benefit from forest
resources and participation in decision making and planning for
forest resources use and management in Buliisa district
Access
(Response %)
Benefits
(Response %)
Participation
(response %)
Average
(%)
Yes No Yes No Yes No Yes No
Avenues/
fora/arrangement
13.3 76.7 8.9 91.1 13.3 76.7 11.8 88.2
Processes/procedures/gui
delines
11.1 88.9 8.9 91.1 13.3 76.7 11.1 88.9
Laws and Policies 17.8 82.2 8.9 91.1 13.3 76.7 13.3 86.7
Average (%) 14.1 82.6 8.9 91.1 13.3 76.7 12.1 87.9
21
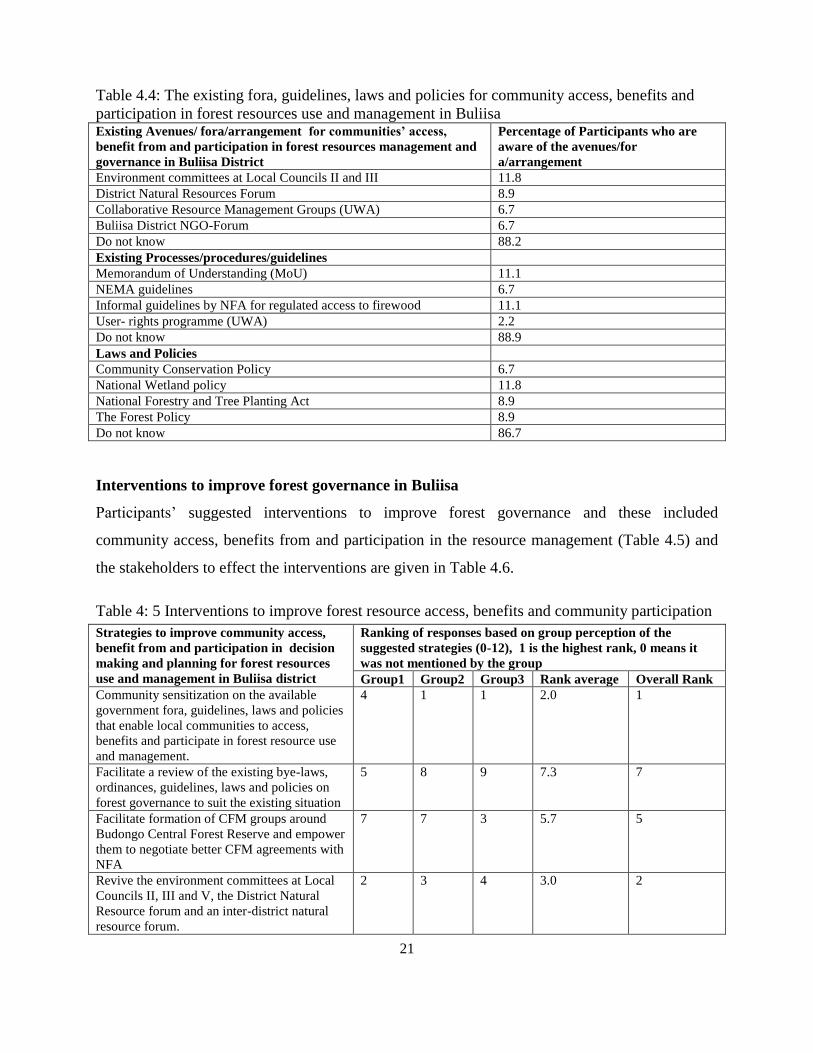
Table 4.4: The existing fora, guidelines, laws and policies for community access, benefits and
participation in forest resources use and management in Buliisa Existing Avenues/ fora/arrangement for communities’ access,
benefit from and participation in forest resources management and
governance in Buliisa District
Percentage of Participants who are
aware of the avenues/for
a/arrangement
Environment committees at Local Councils II and III 11.8
District Natural Resources Forum 8.9
Collaborative Resource Management Groups (UWA) 6.7
Buliisa District NGO-Forum 6.7
Do not know 88.2
Existing Processes/procedures/guidelines
Memorandum of Understanding (MoU) 11.1
NEMA guidelines 6.7
Informal guidelines by NFA for regulated access to firewood 11.1
User- rights programme (UWA) 2.2
Do not know 88.9
Laws and Policies
Community Conservation Policy 6.7
National Wetland policy 11.8
National Forestry and Tree Planting Act 8.9
The Forest Policy 8.9
Do not know 86.7
Interventions to improve forest governance in Buliisa
Participants’ suggested interventions to improve forest governance and these included
community access, benefits from and participation in the resource management (Table 4.5) and
the stakeholders to effect the interventions are given in Table 4.6.
Table 4: 5 Interventions to improve forest resource access, benefits and community participation
Strategies to improve community access,
benefit from and participation in decision
making and planning for forest resources
use and management in Buliisa district
Ranking of responses based on group perception of the
suggested strategies (0-12), 1 is the highest rank, 0 means it
was not mentioned by the group
Group1 Group2 Group3 Rank average Overall Rank
Community sensitization on the available
government fora, guidelines, laws and policies
that enable local communities to access,
benefits and participate in forest resource use
and management.
4 1 1 2.0 1
Facilitate a review of the existing bye-laws,
ordinances, guidelines, laws and policies on
forest governance to suit the existing situation
5 8 9 7.3 7
Facilitate formation of CFM groups around
Budongo Central Forest Reserve and empower
them to negotiate better CFM agreements with
NFA
7 7 3 5.7 5
Revive the environment committees at Local
Councils II, III and V, the District Natural
Resource forum and an inter-district natural
resource forum.
2 3 4 3.0 2

22
Carryout a comprehensive participatory forest
resource-user needs assessment involving both
forest resource users and managers.
0 2 2 5.3 3
Facilitate the district ENR-CSOs and CBOs to
participate in forest governance debates at sub
national and national levels
8 0 6 8.7 8
Simplify existing guidelines, laws and policies
by translating them into local languages
0 4 10 8.7 8
Increase awareness on the values of forests
and strengthen environmental clubs (such as
Wildlife Clubs) in institutions such as schools,
religious and political institutions.
6 5 5 5.3 3
Facilitate creation of incentives (rewards) for
protection of forest resources to motivate
communities to protect trees on their farms
0 6 0 9.3 11
Facilitate forest adjacent communities to
access and benefit from forest resources, and
create platforms for participation in forest
resource use and management
1 9 7 5.7 5
Tree planting activities in local forest reserves
and establishment of community forests in
Kilama-Bukilwa and Got Apol.
3 0 0 9.0 10
Advocate for increased transparency in forest
resource access and benefits licensing process.
9 0 8 9.7 12
Table 4.6: Stakeholders to execute interventions in forest management in Buliisa district Interventions suggested for improving forest governance and
conservation in Buliisa district
Key Stakeholder
Community sensitization on the available government fora, guidelines, laws
and policies that enable local communities to access, benefit and participate
in forest resource use and management.
National Forest Authority
(Budongo), NGOs, Buliisa DFO,
and CDO
Facilitate a review of the existing bye-laws, ordinances, guidelines, laws and
policies on forest governance to suit the existing situation
NGOs, District Environment
Officer, District Council, Parliament
Facilitate formation of CFM groups around Budongo Central Forest Reserve
and empower them to negotiate better CFM agreements with NFA
NFA and NGOs
Revive environment committees at Local Councils II, III and V, the District
Natural Resource forum and an inter-district natural resource forum.
District Council, Parliament, NGOs
Carryout a comprehensive participatory forest resource-user needs
assessment involving both forest resource users and managers.
NFA, DFO, DEO and NGOs
Facilitate the district ENR-CSOs and CBOs to participate in forest
governance debates at sub national and national levels
District NGO-Forum, CBOs and
CSOs
Translate in local languages, the existing guidelines, laws and policies on
access, use and participation in forest management
NGOs and Local government
Increase awareness of values of forests and strengthen environmental clubs
(eg Wildlife Clubs) in schools, religious and political institutions.
NGOs, DFO, Political parties,
Parliament
Facilitate creation of incentives (rewards) for protection of forest resources
to motivate communities to protect trees on their farms
NFA, Parliament and NGOs
Create fora for and, facilitate forest adjacent communities to access, benefit
from and participate in forest resource use and management
NFA and NGOs
Tree planting activities in local forest reserves and establishment of
community forests in Kilama-Bukilwa and Got Apol.
NFA, DFO, CSOs
Advocate for increased transparency in the forest resource access and
benefits licensing process.
NGOs

23
Overall, the participants came up with agenda on forests resources conservation and governance
that they need to be addressed from the district to the national levels and the strategies they felt
would be applicable for the purpose and these were as shown in Table in Appendix 1 d.
Validation of the results obtained from individual interviews and focus group discussion with
relevant stakeholders at the district level, with the national level stakeholders (policy makers and
practitioners) in the Ministry of Water and Environment (Forest Sector Support Division and
National Forestry Authority) revealed the following;
Policy makers and practitioners at the MWE acknowledged and were aware that
communities were largely not aware of the guidelines, policy and legal frameworks and
of the fora/avenues through which they could access and benefit from forest resources.
Community sensitization programmes had not been implemented due to budgetary
constraints.
The guidelines, policy and legal frameworks had not been translated in local languages
and programmes disseminated through radios and television and newspapers, remote
communities did not have access to these media.
Outside natural forests resources, community tree planting implementation had been
constrained by inadequate seedlings raised to meet the demand from the local
communities. Financial constraints hindered production of tree seedlings to supply to the
communities.
The Ministry of Water and Environment planed to promote tree planting as one of its
flagship programmes for 2013/2014 financial year (plant a tree for every public occasion
and or celebration).
Re-invigorating public interest in conservation through functionalizing fora/avenues for
information sharing and debates on conservation issues in the country. This was to be
followed by the Ministry of Water and Environment in the financial year 2013/2014.

24
DISCUSSION
Emerging issues on state and governance of forest resources in Buliisa district
Lack of awareness and non use of existing fora, guidelines and legal frameworks on access,
benefit from and participation in forest resource management
Like most studies undertaken before (Banana et al., 2004; 2008; Obua et al., 2010; Weiland and
Dedeurwaerdere, 2010), our results from Buliisa clearly show that poor forest governance still
exists and includes lack of community participation in forest management, constrained access to
resources and benefits forests in the district. However, unlike most reports that seem to suggest
exclusion of local community participation in forest resource management and access to
resources and benefits due to strict policies and legal frameworks (Banana et al., 2008; Buyinza
et al.,2010), our findings clearly revealed that in Buliisa district local communities lack
awareness of existing avenues/fora, processes/procedures/guidelines and policy and legal frame
that would increase their access to and use of forest resources.
Influence of education on local community access, benefit from and participation in
management of forest resources in Buliisa
In addition to lack of awareness of policy and legal frameworks discussed above, our results
show that people who are not educated and or who have low levels of education benefited less
from forest resources than the educated people – those with degree and postgraduate level
education. Although the latter constitute only a small proportion of the population in Buliisa
district, our findings suggest that education enabled them to access, read and use the existing
guidelines, policies and legal provisions to achieve their interests from the forest resources in the
district. For the non-educated the provisions need to be packaged and information disseminated
using a strategy that can allow for their understanding of the provisions.
Community access, benefit from and participation in management of forest resources in
Buliisa district based on the forest resource duty bearers’ perspectives
Duty bearers at the district and national levels acknowledged that communities have largely not
used the guidelines/procedures, policies and legal provisions available to facilitate their access,
benefit from and participation in forest resource management. They attributed this to lack of

25
awareness about the provisions. They noted that government outreach programmes that were
intended to enable communities know and use the policy and legal frameworks to realize their
entitlements and interests from forest resources were not implemented due to financial
constraints. Thus, although the provisions exist and the government has put in place structures
for their implementation, the structures remain redundant as the communities do not know about
them and hence do not seek for their services.
Even though lack of knowledge on existing procedures, guidelines and legal framework were the
major limitations, our study found that considerable proportion of the local communities
nevertheless accessed and used resources from forests in the district although to a lesser extent.
The constraints they identified to have caused these were government restrictions, resource
decline and location of the forest resources. But as we have identified, perceived restrictions are
really not the issue, rather the limited knowledge they have on procedures, guidelines, policy and
legal provisions they need to use for the purpose was the problem.
Community perceptions of state of the forests and forest management in Buliisa district
The other issues communities identified and used to justify their perception that forests in the
district are poorly managed were corruption and illegal activities. Illegal activities like charcoal
burning and timber harvesting were mentioned by the communities and deemed to be causing
deforestation and species extinction in the forests. One way of addressing this problem in
Buliisa district could be by enhancing community participation in forest resource use and
management. However, strategies for entrenching this is often localized and situation specific
(Buyinza et al., 2010).
In Buliisa district, our findings reveal that there is a need to educate the local communities about
the existing avenues/fora, processes/procedure, policy and legal frameworks to achieve their
entitlements and meet their demand for forest resources. This will enable them acquire sufficient
knowledge and be empowered to pursue their interests, including participation in forest resource
use and management and thereby improving forest resource governance and conservation.

26
Cross synthesis-implications of findings on forests state and governance in Buliisa district
Considered all together, our findings on state of forest and forest governance and from the
discussion above there are implications that stakeholders need to note. Forest resources are
poorly managed and these manifest in the form of inequitable benefit and access to forest
resource access and lack of community participation in the resource management. However, the
government has put place fora, guidelines and, policy and legal provisions, including structures
to ensure local communities’ access to resources, benefits from and participation in forest
resource use and management (governance). In spite of this, majority of the communities have
not used these provisions to fulfill their interests in forest resources in the district because they
are not aware of their existence.
We also established that duty bearers at the district and national levels know that communities
have not been meaningfully engaged in forest resource use and management (governance) in the
district. They know that the majority of the local communities do not know about the fora,
guidelines and, policy and legal frameworks available to fulfill their interests in the forest
resources. Moreover, our findings reveal that this problem is more pronounced among the non
educated members of the communities. The duty bearers lacked resources to implement
government outreach programmes.
27
CONCLUSIONS AND RECOMMENDATIONS
Conclusions
1. Majority of the local communities in Buliisa district access and use resources from the
forests. However, the resource access is influenced by level of education, with more of
the educated people accessing resources than those who are not or are semi educated.
2. Access to forest resources is constrained by government restrictions, resource decline and
location of the forests. However, it is not restriction per-se but local communities’ lack of
awareness and hence non use of existing fora, guidelines, policy and legal frameworks to
increase their access to, benefit from and participation in forest resource management that
is limiting community realization of their interests in the resources.
3. Local communities in Buliisa district perceive forests in the district as being poorly
managed, benefits to them are limited, illegal activities and corruption remain prevalent
and species extinction is taking place in the forests.
Recommendations
To address forest governance problems in Buliisa district, meaningful local community
participation in the resource management and use, an outreach programme aimed at educating
the people about existing fora, guidelines and, policy and legal framework/provisions for
resource access, benefit from and participation in forest management need to be implemented.
The outreach programme should be well designed strategy to include capacity building of both
the educated and none educated members of the communities.
Empowered with the relevant knowledge about their rights and entitlements and aware of the
existing fora, guidelines, policy and legal frameworks to realize their interests, the local
communities will with less facilitation easily and meaningfully get engaged in forest resource
governance. This will bring about more transparency, equity and accountability in the forest
sector and result in sustainable use and management of forests in Buliisa district.
28
REFERENCES
Banana, A.Y., Vogt, N.D., Gombya-Ssembajjwe, W. and Bahati, J. (2004). Local Governance
and Forest conditions: The case of Forests in Mpigi district of Uganda.
Banana, A., Ongugo, P., Bahati, J., Mwangi, E. and Krister, A. (2008). Resource, Recourse and
Decisions: Incentive structures in forest decentralization and governance in East Africa.
Buyinza, M., Lugo, E and Ongugo, P. 2010. Emmerging Local Economic and Social Dynamics
Shapping East African Forest Landscapes. In. Forests and Society – Responding to
Global Drivers of Change (Eds. Gerardo, Mery., Pia, Katila., Glenn Galloway., Rene I.
Alfaro., Markku Kanninen., Max Lobovikov and Jari, Varjo). IUFRO World Series Vol.
25, 315-334.
Jagger, P. (2008). Forest incomes after Uganda’s forest sector reform: are the rural poor gaining?
CAPRI working paper no. 92. IFPRI. Washington D.C USA.
Jan Van Bodegon, A., Klaver, D., Van Schoebroeck, F. and Van der Valke, O. (2008). Exploring
the meaning of governance concept for the FLEGT concept. Wegninggen University and
research centre, Netherlands.
Meinzen-Dick, R. and Knox, A. (1999). Collective action, property rights and devolution of
natural resource management: conceptual framework. In R. Meinzen-Dick, A, Knox, &
M. Di Gregorio (Eds.), Collective action, property rights and devolution of natural
resource management (pp. 40-72). Washington, DC: Collective Action and Property
Rights (CAPRi) program of the consultative group on International Agricultural Research
(CGIAR). URL: http://www.capri.cgiar.org/pdf/meinzen_knox.pdf.
Obua, J., Agea,G,J and Ogwal, J,J. 2010. Status of forests in Uganda. African Journal of
Ecology, 48 (4) 853-859.
The Republic of Uganda 1997. Local government Act 1997. Ministry of local government.
Entebbe. Government printer.
Uganda Forest Department. (1951). A history of the Uganda forest department, 1898 – 1929.
Weiland, S. and Deduerwaerdere,T. (2010). Change in forest governance in developing
countries. In search of sustainable governance. International journal of commons vol. 4,
no 2 August 2010 pp.683-686. Igitur, Utrscht publishing & Archiving services for IASC.
ISSN: 1875-0281

29
APPENDICES
Appendix 1: Analyses, respondents’ socioeconomic characteristics and variables of forest
status and governance investigated
Appendix 1a Table: Analyses, respondents and investigated variables on forest state and
governance in Buliisa district – Access to forest resources (N=373)
Analyzed variable on
forest state and
governance in Buliisa
district based on
information obtained
from respondents
Respondent Particular Frequency out
of 373
Percentage
among groups (
out of 373 )
Percentage
within Groups
Access to
resources/values from
forests and
respondent’s sex
Males who accessed 157 42.1% 56.3%
Males who did not access 100 26.8% 35.8%
Males who did not
respond to the question
on resource access
22
5.9% 7.9%
Total 279 74.8% 100%
Females who accessed 48 12.9% 51.1%
Females who did not
access
40 10.7% 42.6%
Females who did not
respond to question
6 1.6% 6.4%
Total 94 25.2% 100%
Access to
resources/values from
forests and
respondent’s level of
education
Not educated who
accessed the resources
22 5.9% 46.8%
Not Educated who did
not access the resources
22 5.9% 46.8%
Not educated who did not
respond to the question
on access
3 0.8% 6.4%
Total 47 12.6% 100%
Primary level educated
respondents who
accessed the resources
72 19.3% 46.8%
Primary level educated
respondents who did not
access the resources
69 18.5% 44.8%
Primary level educated
respondents who did not
respond to the question
on resources access
13 3.5% 8.4%
30
Total 154 41.3% 100%
Secondary level educated
respondents who
accessed the resources
75 20.1% 62.5%
Secondary level educated
respondents who did not
access the resources
38 10.2% 31.7%
Secondary level educated
respondents who did not
respond to question on
access of resources
7 1.9% 5.8%
Total 120 32.2% 100%
Tertiary level educated
respondents who
accessed the resources
23 6.2% 62.2%
Tertiary level educated
respondents who did not
access the resources
10 2.7% 27.0%
Tertiary level educated
respondents who did not
respond to question on
access to resources
4 1.1% 10.8%
Total 37 9.9% 100%
Degree level educated
respondents who
accessed the resources
11 2.9% 84.6%
Degree level educated
respondents who did not
access the resources
1 0.3% 7.7%
Degree level educated
respondents who did not
respond to the question
on access to the resources
1 0.3% 7.7%
Total 13 3.5% 100%
Postgraduate level
educated respondents
who accessed the
resources
2 0.5% 100%
Postgraduate level
educated respondents
who did not access the
resources
0 0.0% 0.0%
Postgraduate level
educated respondents
who did not respond to
the question on access to
resources
0 0.0% 0.0%
Total 2 0.5% 100%
Access to
resources/values from
Single marital status
respondents who
36 9.7% 62.1%

31
forests and
respondent’s Marital
status
accessed the resources
Single marital status
respondents who did not
access the resources
19 5.1% 32.8%
Single marital status
respondents who did not
respond to the question
on access to resources
3 0.8% 5.2%
Total 58 15.5 100%
Married marital status
respondents who
accessed the resources
157 42.1%
53.2%
Married marital status
respondents who did not
access resources
114 30.6% 38.6%
Married marital status
respondents who did not
respond to the question
on access to resources
24 6.4% 8.1%
Total 295 79.0% 100%
Divorced marital status
respondents who
accessed the resources
3 0.8% 60%
Divorced marital status
respondents who did not
access resources
1 0.3% 20%
Divorced marital status
respondents who did not
respond to question on
access to resources
1 0.3% 20%
Total 5 1.3% 100%
Widowed marital status
respondents who
accessed the resources
5 1.3% 45.5%
Widowed marital status
respondents who did not
access resources
6 1.6% 54.5%
Widowed marital status
respondents who did not
respond to question on
access to resources
0 0.0% 0.0%
Total 11 2.9% 100%
Access to
resources/values from
forests and
respondent’s Age in
years
18-30 year olds
respondents who
accessed the resources
80 21.4% 59.3%
18-30 year olds 45 12.1% 33.3%

32
respondents who did not
access resources
18-30 year olds
respondents who did not
respond to question on
access to resources
10 2.7% 7.40%
Total 135 36.2 100%
31-40 year olds
respondents who
accessed the resources
45 12.1% 47.9%
31-40 year olds
respondents who did not
access the resources
41 11.0% 43.6%
31-40 year olds
respondents who did not
answer question on
access to resources
8 0.8% 8.5%
Total 94 25.2% 100%
41-50 year olds
respondents who
accessed the resources
33 8.8% 49.3%
41-50 year olds
respondents who did not
access the resources
31 8.3% 46.3%
41-50 year olds
respondents who did not
respond to question on
access to resources
3 0.8% 4.5%
Total 67 17.9% 100%
51-60 year olds
respondents who
accessed the resources
28 7.5% 63.6%
51-60 year olds
respondents who did not
access resources
10 2.7% 22.7%
51-60 year olds
respondents who did not
respond to question on
access to resources
6 1.6% 13.6%
Total 44 11.8% 100%
61-70 year olds
respondents who
accessed the resources
11 2.6% 55%
61-70 year olds
respondents who did not
access resources
8 2.1% 40%
61-70 year olds
respondents who did not
respond to question on
access to the resources
1 0.3% 5%

33
Total 20 5.0% 100%
>70 year olds
respondents who
accessed the resources
6 1.6% 54.5%
>70 year olds
respondents who did not
access the resources
5 1.3% 45.5%
>70 year olds
respondents who did not
respond to the question
on access to resources
0 0.0% 0.0%
Total 11 2.9% 100%
Access to
resources/values from
forests and
respondent’s
Family/Household size
(Number of persons in
the household)
<3 persons in a family
respondents who
accessed the resources
28 7.5% 51.9%
<3 persons in a family
respondents who did not
access the resources
21 5.6% 38.9%
<3 persons in a family
respondents who did not
respond to the question
on access to resources
5 1.3% 9.3%
Total 54 14.4% 100%
4-6 persons in a family
respondents who
accessed the resources
56 15.0% 57.1%
4-6 persons in a family
respondents who did not
access resources
36 9.7% 36.7%
4-6 persons in a family
respondents who did not
respond to the question
on access to resources
6 1.6% 6.1%
Total 98 26.3% 100%
>6 persons in a family
respondents who
accessed the resources
112 30.0% 55.2%
>6 persons in a family
respondents who did not
access the resources
77 20.6% 37.9%
>6 persons in a family
respondents who did not
respond to the question
on access to resources
14 3.8% 7.0%
Total 203 54.4% 100%
34
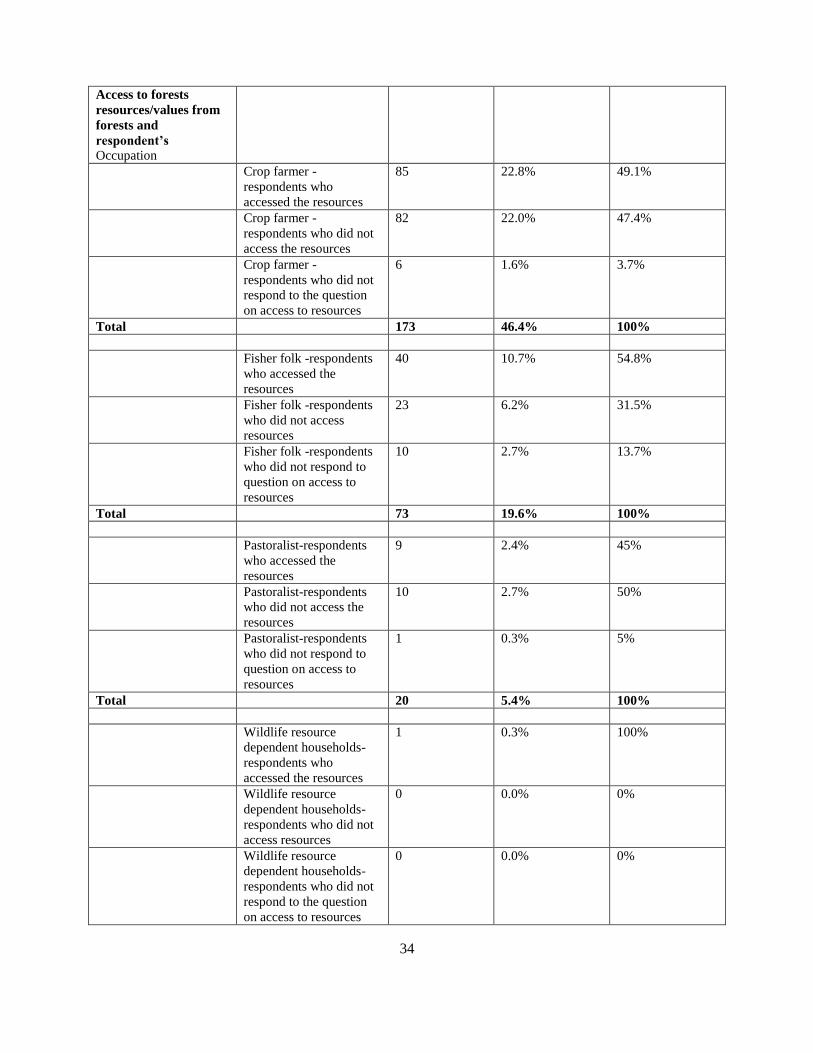
Access to forests
resources/values from
forests and
respondent’s Occupation
Crop farmer -
respondents who
accessed the resources
85 22.8% 49.1%
Crop farmer -
respondents who did not
access the resources
82 22.0% 47.4%
Crop farmer -
respondents who did not
respond to the question
on access to resources
6 1.6% 3.7%
Total 173 46.4% 100%
Fisher folk -respondents
who accessed the
resources
40 10.7% 54.8%
Fisher folk -respondents
who did not access
resources
23 6.2% 31.5%
Fisher folk -respondents
who did not respond to
question on access to
resources
10 2.7% 13.7%
Total 73 19.6% 100%
Pastoralist-respondents
who accessed the
resources
9 2.4% 45%
Pastoralist-respondents
who did not access the
resources
10 2.7% 50%
Pastoralist-respondents
who did not respond to
question on access to
resources
1 0.3% 5%
Total 20 5.4% 100%
Wildlife resource
dependent households-
respondents who
accessed the resources
1 0.3% 100%
Wildlife resource
dependent households-
respondents who did not
access resources
0 0.0% 0%
Wildlife resource
dependent households-
respondents who did not
respond to the question
on access to resources
0 0.0% 0%

35
Total 1 0.3% 100%
Traders- respondents
who accessed the
resources
17 4.6% 48.8%
Traders- respondents
who did not access
resources
12 3.2% 34.3%
Traders- respondents
who did not respond to
question on access to
resources
6 1.6% 17.1%
Total 35 9.4% 100%
Office employee-
respondents who
accessed the resources
18 4.8% 78.3%
Office employee-
respondents who did not
access the resources
3 0.8% 13.0%
Office employee-
respondents who did not
respond to question on
access to resources
2 0.5% 8.7%
Total 23 7.2% 100%
Others
(student,carpenter,Elder
unemployed, traditional
healer,cyclist, etc)-
respondents who
accessed the resources
33 8.8% 75.0%
Others
(student,carpenter,Elder
unemployed, traditional
healer,cyclist, etc)-
respondents who did not
access resources
9 2.4% 20.5%
Others
(student,carpenter,Elder
unemployed, traditional
healer,cyclist, etc)-
respondents who did not
respond to question on
access to resources
2 0.5% 4.5%
Total 44 11.7% 100%
Access to forests
resources/values from
forests and
respondent’s period of
stay (years) in area
<5 years of stay in
present area-
respondents who
accessed the resources
12 3.2% 44.4%
<5 years of stay in
present area-
10 2.7% 37.0%

36
respondents who did not
access the resources
<5 years of stay in
present area-
respondents who did not
respond to question on
access to resources
5 1.3% 18.5%
Total 27 7.2% 100%
5-10 years of stay in
present area-
respondents who
accessed the resources
19 5.1% 57.6%
5-10 years of stay in
present area-
respondents who did not
access resources
13 3.5% 39.4%
5-10 years of stay in
present area-
respondents who did not
respond to question on
access to resources
1 0.3% 3.0%
Total 33 8.9% 100%
11-15 years of stay in
present area-
respondents who
accessed the resources
13 3.5% 48.1%
11-15 years of stay in
present area-
respondents who did not
access resources
12 3.2% 44.4%
11-15 years of stay in
present area-
respondents who did not
respond to question on
access to resources
2 0.5% 7.4%
Total 27 7.2% 100%
16-20 years of stay in
present area-
respondents who
accessed the resources
28 7.5% 59.6%
16-20 years of stay in
present area-
respondents who did not
access resources
15 4.0% 31.9%
16-20 years of stay in
present area-
respondents who did not
respond to question on
access to resources
4 1.1% 8.5%
Total 47 12.6% 100%
37
>20 years of stay in
present area-
respondents who
accessed the resources
129 34.6% 55.0%
>20 years of stay in
present area-
respondents who did not
access resources
90 24.1% 38.3%
>20 years of stay in
present area-
respondents who did not
respond to the question
on access to resources
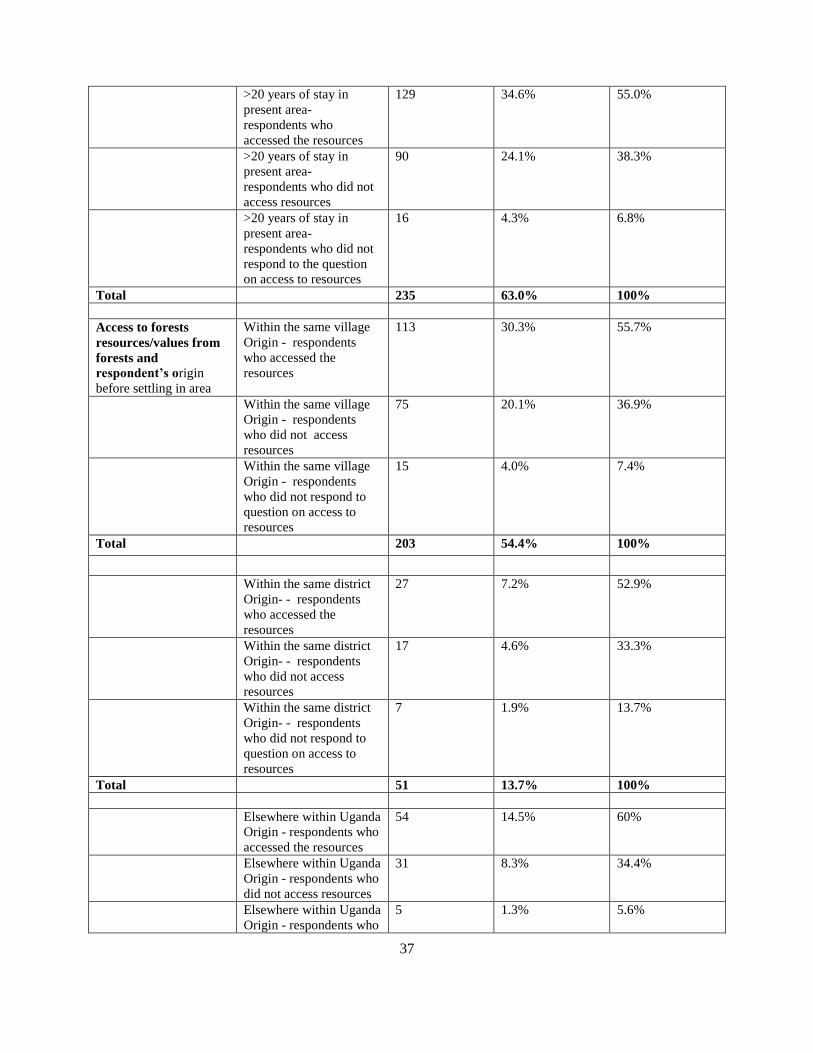
16 4.3% 6.8%
Total 235 63.0% 100%
Access to forests
resources/values from
forests and
respondent’s origin
before settling in area
Within the same village
Origin - respondents
who accessed the
resources
113 30.3% 55.7%
Within the same village
Origin - respondents
who did not access
resources
75 20.1% 36.9%
Within the same village
Origin - respondents
who did not respond to
question on access to
resources
15 4.0% 7.4%
Total 203 54.4% 100%
Within the same district
Origin- - respondents
who accessed the
resources
27 7.2% 52.9%
Within the same district
Origin- - respondents
who did not access
resources
17 4.6% 33.3%
Within the same district
Origin- - respondents
who did not respond to
question on access to
resources
7 1.9% 13.7%
Total 51 13.7% 100%
Elsewhere within Uganda
Origin - respondents who
accessed the resources
54 14.5% 60%
Elsewhere within Uganda
Origin - respondents who
did not access resources
31 8.3% 34.4%
Elsewhere within Uganda
Origin - respondents who
5 1.3% 5.6%
38
did not respond to
question on access to
resources
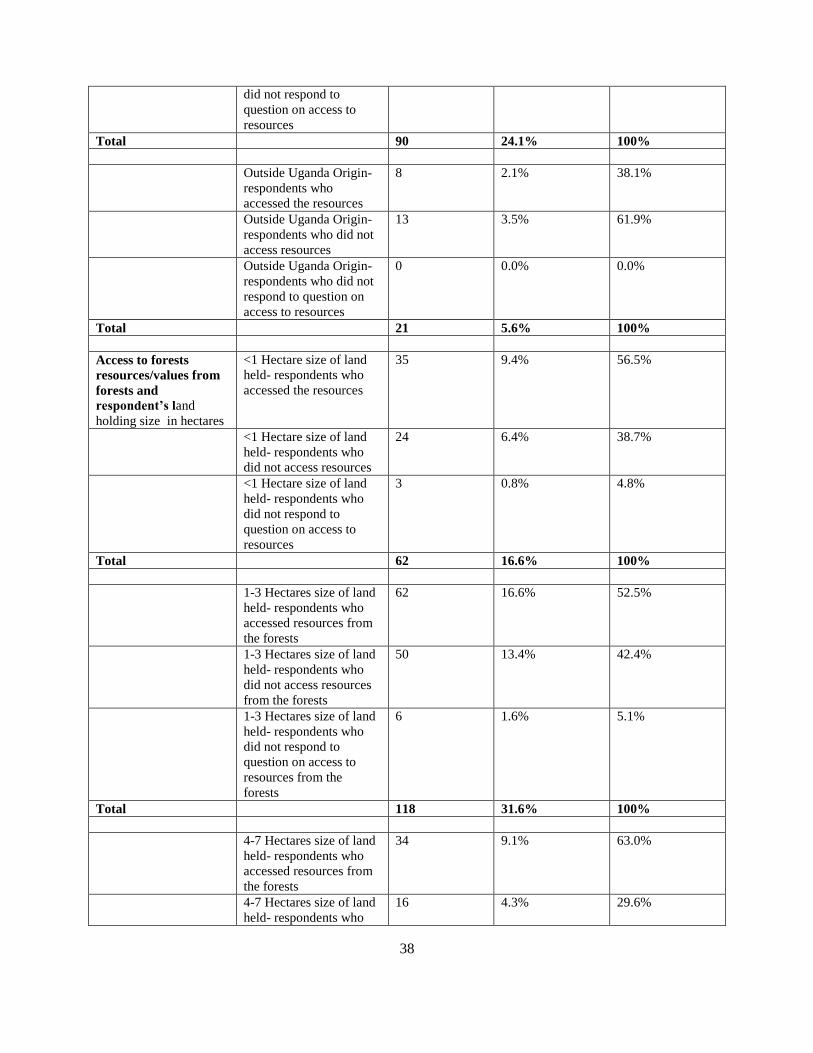
Total 90 24.1% 100%
Outside Uganda Origin-
respondents who
accessed the resources
8 2.1% 38.1%
Outside Uganda Origin-
respondents who did not
access resources
13 3.5% 61.9%
Outside Uganda Origin-
respondents who did not
respond to question on
access to resources
0 0.0% 0.0%
Total 21 5.6% 100%
Access to forests
resources/values from
forests and
respondent’s land
holding size in hectares
<1 Hectare size of land
held- respondents who
accessed the resources
35 9.4% 56.5%
<1 Hectare size of land
held- respondents who
did not access resources
24 6.4% 38.7%
<1 Hectare size of land
held- respondents who
did not respond to
question on access to
resources
3 0.8% 4.8%
Total 62 16.6% 100%
1-3 Hectares size of land
held- respondents who
accessed resources from
the forests
62 16.6% 52.5%
1-3 Hectares size of land
held- respondents who
did not access resources
from the forests
50 13.4% 42.4%
1-3 Hectares size of land
held- respondents who
did not respond to
question on access to
resources from the
forests
6 1.6% 5.1%
Total 118 31.6% 100%
4-7 Hectares size of land
held- respondents who
accessed resources from
the forests
34 9.1% 63.0%
4-7 Hectares size of land
held- respondents who
16 4.3% 29.6%

39
did not access resources
from the forests
4-7 Hectares size of land
held- respondents who
did not respond to
question on access to
resources from the
forests
4 1.1% 7.4%
Total 54 14.5% 100%
>7 Hectares size of land
held- respondents who
accessed resources from
the forests
25 6.7% 56.8%
>7 Hectares size of land
held- respondents who
did not access resources
from the forests
15 4.0% 34.1%
>7 Hectares size of land
held- respondents who
did not respond to
question on access to
resources from the
forests
4 1.1% 9.1%
Total 44 11.8% 100%
Access to forests
resources/values from
forests and
respondent’s land
tenure
Freehold type of land
ownership - respondents
who accessed resources
from the forests
24 6.4% 52.2%
Freehold type of land
ownership - respondents
who did not access
resources from the
forests
20 5.4% 43.5%
Freehold type of land
ownership - respondents
who did not respond to
question on access to
resources from the
forests
2 0.5% 4.3%
Total 46 12.3% 100%
Mailo land type of land
ownership - respondents
who accessed resources
from the forests
1 0.3% 50.0%
Mailo land type of land
ownership - respondents
who did not access
resources from the
forests
0 0.0% 0.0%
Mailo land type of land
ownership - respondents
1 0.3% 50.0%

40
who did not respond to
the question on access to
resources from the
forests
Total 2 0.6% 100%
Communal type of land
ownership - respondents
who accessed resources
from the forests
58 15.5% 63.0%
Communal type of land
ownership - respondents
who did not access
resources from the
forests
29 7.8% 31.5%
Communal type of land
ownership - respondents
who did not respond to
the question on access to
resources from the
forests
5 1.3% 5.4%
Total 92 24.6% 100%
Customary type of land
ownership - respondents
who accessed resources
from the forests
84 22.5% 52.8%
Customary type of land
ownership - respondents
who did not access
resources from the
forests
67 18.0% 42.1%
Customary type of land
ownership - respondents
who did not respond to
question on access to
resources from the
forests
8 2.1% 5.0%
Total 159 42.6% 100%
41
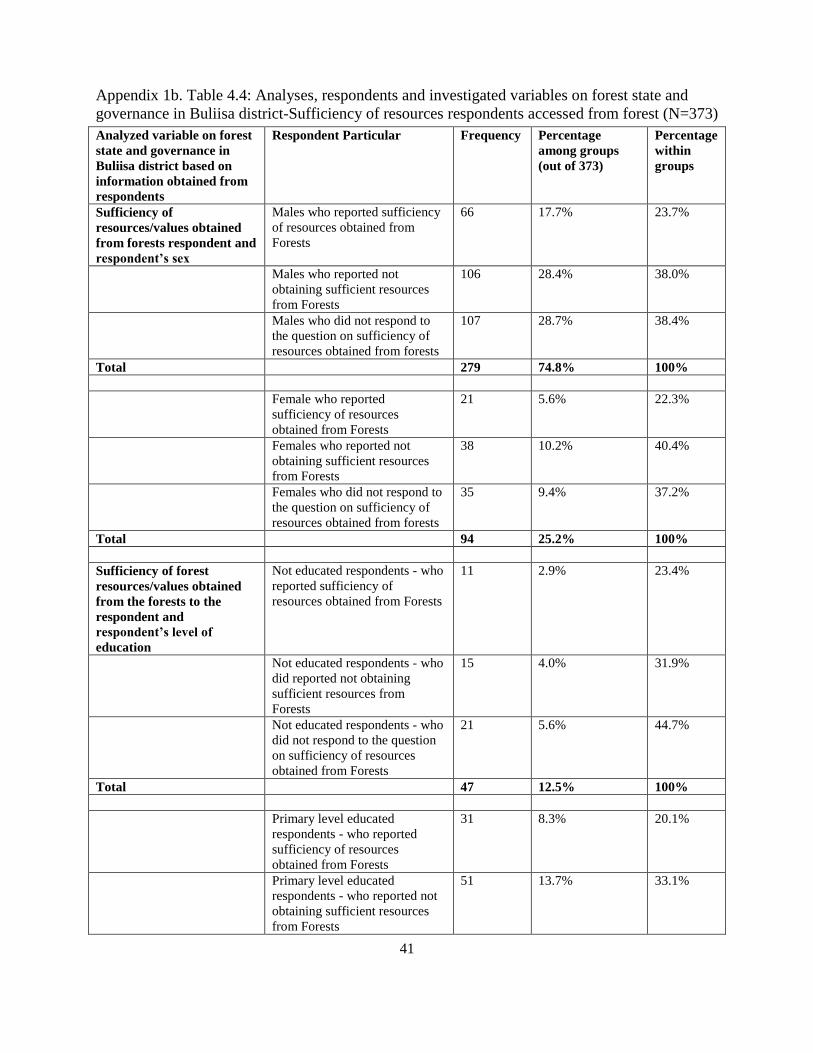
Appendix 1b. Table 4.4: Analyses, respondents and investigated variables on forest state and
governance in Buliisa district-Sufficiency of resources respondents accessed from forest (N=373)
Analyzed variable on forest
state and governance in
Buliisa district based on
information obtained from
respondents
Respondent Particular Frequency Percentage
among groups
(out of 373)
Percentage
within
groups
Sufficiency of
resources/values obtained
from forests respondent and
respondent’s sex
Males who reported sufficiency
of resources obtained from
Forests
66 17.7% 23.7%
Males who reported not
obtaining sufficient resources
from Forests
106 28.4% 38.0%
Males who did not respond to
the question on sufficiency of
resources obtained from forests
107 28.7% 38.4%
Total 279 74.8% 100%
Female who reported
sufficiency of resources
obtained from Forests
21 5.6% 22.3%
Females who reported not
obtaining sufficient resources
from Forests
38 10.2% 40.4%
Females who did not respond to
the question on sufficiency of
resources obtained from forests
35 9.4% 37.2%
Total 94 25.2% 100%
Sufficiency of forest
resources/values obtained
from the forests to the
respondent and
respondent’s level of
education
Not educated respondents - who
reported sufficiency of
resources obtained from Forests
11 2.9% 23.4%
Not educated respondents - who
did reported not obtaining
sufficient resources from
Forests
15 4.0% 31.9%
Not educated respondents - who
did not respond to the question
on sufficiency of resources
obtained from Forests
21 5.6% 44.7%
Total 47 12.5% 100%
Primary level educated
respondents - who reported
sufficiency of resources
obtained from Forests
31 8.3% 20.1%
Primary level educated
respondents - who reported not
obtaining sufficient resources
from Forests
51 13.7% 33.1%

42
Primary level educated
respondents - who did not
respond to the question on
sufficiency of resources
obtained from Forests
72 19.3% 46.8%
Total 154 41.3% 100%
Secondary level educated
respondents - who reported
sufficiency of resources
obtained from Forests
33 8.8% 27.5%
Secondary level educated
respondents - who reported not
obtaining sufficient resources
obtained from Forests
47 12.6% 39.2%
Secondary level educated
respondents - who did not
respond to the question on
sufficiency of resources
obtained from Forests
40 10.7% 33.3%
Total 120 32.1% 100%
Tertiary level educated
respondents - who reported
sufficiency of resources
obtained from Forests
8 2.1% 21.6%
Tertiary level educated
respondents - who reported not
obtaining sufficient resources
obtained from Forests
21 5.6% 56.8%
Tertiary level educated
respondents - who did not
respond to the question on
sufficiency of resources
obtained from Forests
8 2.1% 21.6%
Total 37 9.8% 100%
Degree level educated
respondents - who reported
sufficiency of resources
obtained from Forests
4 1.1% 30.8%
Degree level educated
respondents - who reported not
obtaining sufficient resources
from Forests
8 2.1% 61.5%
Degree level educated
respondents - who did not
respond to the question on
sufficiency of resources
obtained from Forests
1 0.3% 7.7%
Total 13 3.5% 100%
Postgraduate level educated
respondents - who reported
0 0.0% 0.0%

43
sufficiency of resources
obtained from Forests
Postgraduate level educated
respondents - who reported not
obtaining sufficient resources
obtained from Forests
2 0.5% 100%
Postgraduate level educated
respondents - who did not
respond to the question on
sufficiency of resources
obtained from Forests
0 0.0% 0.0%
Total 2 0.5% 100%
Sufficiency of forest
resources/values obtained
from the forests to the
respondent and
respondent’s Marital status
Marital status single -
respondents who reported
sufficiency of resources
obtained from Forests
17 4.6% 29.3%
Marital status single -
respondents who reported not
obtaining sufficient resources
from Forests
23 6.2% 39.7%
Marital status single -
respondents who did not
respond to the question on
sufficiency of resources
obtained from Forests
18 4.8% 31.0%
Total 58 16.6% 100%
Marital status Married-
respondents who reported
sufficiency of resources
obtained from Forests
65 17.4% 22.0%
Marital status Married-
respondents who reported not
obtaining sufficient resources
obtained from Forests
113 30.3% 38.3%
Marital status Married-
respondents who did not
respond to the question on
sufficiency of resources
obtained from Forests
117 31.4% 39.7%
Total 295 79.1% 100%
Marital status divorced -
respondents who reported
sufficiency of resources
obtained from Forests
0 0.0% 0.0%
Marital status divorced -
respondents who reported not
obtaining sufficient resources
obtained from Forests
3 0.8% 60.0%
Marital status divorced -
respondents who did not
respond to the question on
2 0.5% 40.0%

44
sufficiency of resources
obtained from Forests
Total 5 1.3% 100%
Marital status widowed -
respondents who reported
sufficiency of resources
obtained from Forests
2 0.5% 18.2%
Marital status widowed -
respondents who reported not
obtaining sufficient resources
from Forests
4 1.1% 36.4%
Marital status widowed -
respondents who did not
respond to the question on
sufficiency of resources
obtained from Forests
5 1.3% 45.5%
Total 11 2.9% 100%
Sufficiency of forest
resources/values obtained
from the forests to the
respondent and
respondent’s Age in years
18-30 year olds- respondents
who reported sufficiency of
resources obtained from Forests
35 9.4% 25.9%
18-30 year olds- respondents
who reported not obtaining
sufficient resources from
Forests
51 13.7% 37.8%
18-30 year olds- respondents
who did not respond to the
question on sufficiency of
resources obtained from Forests
49 13.1% 36.3%
Total 135 36.2% 100%
31-40 year olds year olds-
respondents who reported
sufficiency of resources
obtained from Forests
23 6.2% 34.3%
31-40 year olds year olds-
respondents who reported not
obtaining sufficient resources
from Forests
29 7.8% 43.3%
31-40 year olds year olds-
respondents who did not
respond to question on
sufficiency of resources
obtained from Forests
15 4.0% 22.4%
Total 67 18.0% 100%
41-50 year olds - respondents
who reported sufficiency of
resources obtained from Forests
15 4.0% 22.4%
41-50 year olds - respondents
who reported not obtaining
25 6.7% 37.3%

45
sufficient resources from
Forests
41-50 year olds - respondents
who did not respond to question
on sufficiency of resources
obtained from Forests
27 7.2% 40.3%
Total 67 17.9% 100%
51-60 year olds - respondents
who reported sufficiency of
resources obtained from Forests
9 2.4% 20.5%
51-60 year olds - respondents
who reported not obtaining
sufficient resources from
Forests
22 5.9% 50.0%
51-60 year olds - respondents
who did not respond to the
question on sufficiency of
resources obtained from Forests
13 3.5% 29.5%
Total 44 11.8% 100%
61-70 year olds - respondents
who reported sufficiency of
resources obtained from Forests
3 0.8% 15.0%
61-70 year olds - respondents
who reported not obtaining
sufficient resources from
Forests
11 2.9% 55.0%
61-70 year olds - respondents
who did not respond to the
question on sufficiency of
resources obtained from Forests
6 1.6% 30.0%
Total 20 5.3% 100%
>70 year olds - respondents who
reported sufficiency of
resources obtained from Forests
2 0.5% 18.2%
>70 year olds - respondents who
reported not obtaining sufficient
resources from Forests
4 1.1% 36.4%
>70 year olds - respondents who
did not respond to the question
on sufficiency of resources
obtained from Forests
5 1.3% 45.5%
Total 11 2.9% 100%
Sufficiency of forest
resources/values obtained
from the forests to the
respondent and
respondent’s
Family/Household size
(Number of persons in the
household)
<3 persons in the family-
respondents who reported
sufficiency of resources
obtained from Forests
13 3.5% 24.1%

46
<3 persons in the family-
respondents who reported not
obtaining sufficient resources
from Forests
16 4.3% 29.6%
<3 persons in the family-
respondents who did not
respond to question on
sufficiency of resources
obtained from Forests
25 6.7% 46.3%
Total 54 14.5% 100%
4-6 persons in the family-
respondents who reported
sufficiency of resources
obtained from Forests
31 8.3% 31.6%
4-6 persons in the family-
respondents who reported not
obtaining sufficient resources
from Forests
31 8.3%% 31.6%
4-6 persons in the family-
respondents who did not
respond to question on
sufficiency of resources
obtained from Forests
36 9.7% 36.7%
Total 98 26.3% 100%
>6 persons in the family-
respondents who reported
sufficiency of resources
obtained from Forests
41 11.0% 20.2%
>6 persons in the family-
respondents who reported not
obtaining sufficient resources
obtained from Forests
90 24.1% 44.3%
>6 persons in the family-
respondents who did not
respond to question on
sufficiency of resources
obtained from Forests
72 19.3% 35.5%
Total 203 54.4% 100%
Sufficiency of forest
resources/values obtained
from the forests to the
respondent and
respondent’s Occupation
Crop farmer- respondents who
reported sufficiency of
resources obtained from Forests
41 11.0% 23.7%
Crop farmer- respondents who
reported not obtaining sufficient
resources obtained from Forests
63 16.9% 36.4%
Crop farmer- respondents who
did not respond to the question
on sufficiency of resources
obtained from Forests
69 18.5% 39.9%
Total 173 46.4% 100%

47
Fisher folk- respondents who
reported sufficiency of
resources obtained from Forests
16 4.3% 21.9%
Fisher folk- respondents who
reported not obtaining sufficient
resources from Forests
23 6.2% 31.5%
Fisher folk- respondents who
did not respond to the question
on sufficiency of resources
obtained from Forests
34 9.1% 46.6%
Total 73 19.6% 100%
Pastoralist- respondents who
reported sufficiency of
resources obtained from Forests
1 0.3% 5.0%
Pastoralist- respondents who
reported not obtaining sufficient
resources from Forests
9 2.4% 45.0%
Pastoralist- respondents who did
not respond to the question on
sufficiency of resources
obtained from Forests
10 2.7% 50.0%
Total 20 5.4% 100%
Wildlife resource dependent
households-respondents who
reported sufficiency of
resources obtained from Forests
0 0.0% 0.0%
Wildlife resource dependent
households-respondents who
reported not obtaining sufficient
resources from Forests
0 0.0% 0.0%
Wildlife resource dependent
households-respondents who
did not respond to questions on
sufficiency of resources
obtained from Forests
1 0.3% 100.0%
Total 1 0.3% 100%
Traders-respondents who
reported sufficiency of
resources obtained from Forests
6 1.6% 17.1%
Traders-respondents who
reported not obtaining sufficient
resources from Forests
13 3.5% 37.1%
Traders-respondents who did
not respond to the question on
sufficiency of resources
obtained from Forests
16 4.3% 45.7%
Total 35 9.4% 100%
Office employee- respondents
who reported sufficiency of
9 2.4% 39.1%

48
resources obtained from Forests
Office employee- respondents
who reported not obtaining
sufficient resources from
Forests
11 2.9% 47.8%
Office employee- respondents
who did not respond to the
question on sufficiency of
resources obtained from Forests
3 0.8% 13.0%
Total 23 6.1% 100%
Others (student,carpenter,Elder
unemployed, traditional
healer,cyclist, etc)- respondents
who reported sufficiency of
resources obtained from Forests
12 3.2% 27.3%
Others (student,carpenter,Elder
unemployed, traditional
healer,cyclist, etc)- respondents
who reported not obtaining
sufficient resources from
Forests
24 6.4% 54.5%
Others (student,carpenter,Elder
unemployed, traditional
healer,cyclist, etc)- respondents
who did not respond to the
question on sufficiency of
resources obtained from Forests
8 2.1% 18.2%
Total 44 11.7% 100%
Sufficiency of forest
resources/values obtained
from the forests to the
respondent and
respondent’s period of stay
(years) in area
<5 years in area - respondents
who reported sufficiency of
resources obtained from Forests
4 1.1% 14.8%
<5 years in area - respondents
who reported not obtaining
sufficient resources from
Forests
10 2.7% 37.0%
<5 years in area - respondents
who did not respond to question
on sufficiency of resources
obtained from Forests
13 3.5% 48.1%
Total 27 7.3% 100%
5-10 years in area - respondents
who reported sufficiency of
resources obtained from Forests
8 2.1% 24.2%
5-10 years in area - respondents
who reported not obtaining
sufficient resources from
Forests
14 3.8% 42.4%
5-10 years in area - respondents
who did not respond to the
11 2.9% 33.3%

49
question on sufficiency of
resources obtained from Forests
Total 33 8.8% 100%
11-15 years in area- respondents
who reported sufficiency of
resources obtained from Forests
5 1.3% 18.5%
11-15 years in area- respondents
who reported not obtaining
sufficient resources obtained
from Forests
10 2.7% 37.0%
11-15 years in area- respondents
who did not respond to question
on sufficiency of resources
obtained from Forests
12 3.2% 44.4%
Total 27 7.2% 100%
16-20 years in area- respondents
who reported sufficiency of
resources obtained from Forests
14 3.8% 29.8%
16-20 years in area- respondents
who reported not obtaining
sufficient resources from
Forests
17 4.6% 36.2%
16-20 years in area- respondents
who did not respond to question
on sufficiency of resources
obtained from Forests
16 4.3% 34.0%
Total 47 12.7% 100%
>20 years in area - respondents
who reported sufficiency of
resources obtained from Forests
54 14.5% 23.0%
>20 years in area - respondents
who reported not obtaining
sufficient resources from
Forests
91 24.4% 38.7%
>20 years in area - respondents
who did not respondent to the
question on sufficiency of
resources obtained from Forests
90 24.1% 38.3%
Total 235 63.0% 100%
Sufficiency of forest
resources/values obtained
from the forests to the
respondent and
respondent’s origin before
settling in area
Within the same village origin -
respondents who reported
sufficiency of resources
obtained from Forests
50 13.4% 24.6%
Within the same village origin -
respondents who reported not
obtaining sufficient resources
from Forests
77 20.6% 37.9%
Within the same village origin - 76 20.4% 37.4%

50
respondents who did not
respond to the question on
sufficiency of resources
obtained from Forests
Total 203 54.4% 100%
Elsewhere within Uganda origin
- respondents who reported
sufficiency of resources
obtained from Forests
14 3.8% 27.5%
Elsewhere within Uganda origin
- respondents who reported not
obtaining sufficient resources
from Forests
15 4.0% 29.4%
Elsewhere within Uganda origin
- respondents who did not
respond to question on
sufficiency of resources
obtained from Forests
22 5.9% 43.1%
Total 51 13.7% 100%
Within the same district origin -
respondents who reported
sufficiency of resources
obtained from Forests
20 5.4% 22.2%
Within the same district origin -
respondents who reported not
obtaining sufficient resources
from Forests
40 10.7% 44.4%
Within the same district origin -
respondents who did not
respond to the question on
sufficiency of resources
obtained from Forests
30 8.7% 33.3%
Total 90 24.8% 100%
Outside Uganda origin -
respondents who reported
sufficiency of resources
obtained from Forests
3 0.8% 14.3%
Outside Uganda origin -
respondents who reported not
obtaining sufficient resources
from Forests
8 2.1% 38.1%
Outside Uganda origin -
respondents who did not
respond to the question on
sufficiency of resources
obtained from Forests
10 2.7% 47.6%
Total 21 5.6% 100%
Sufficiency of forest
resources/values obtained
from the forests to the
<1 Hectare size of land held -
respondents who reported
sufficiency of resources
13 3.5% 21.0%
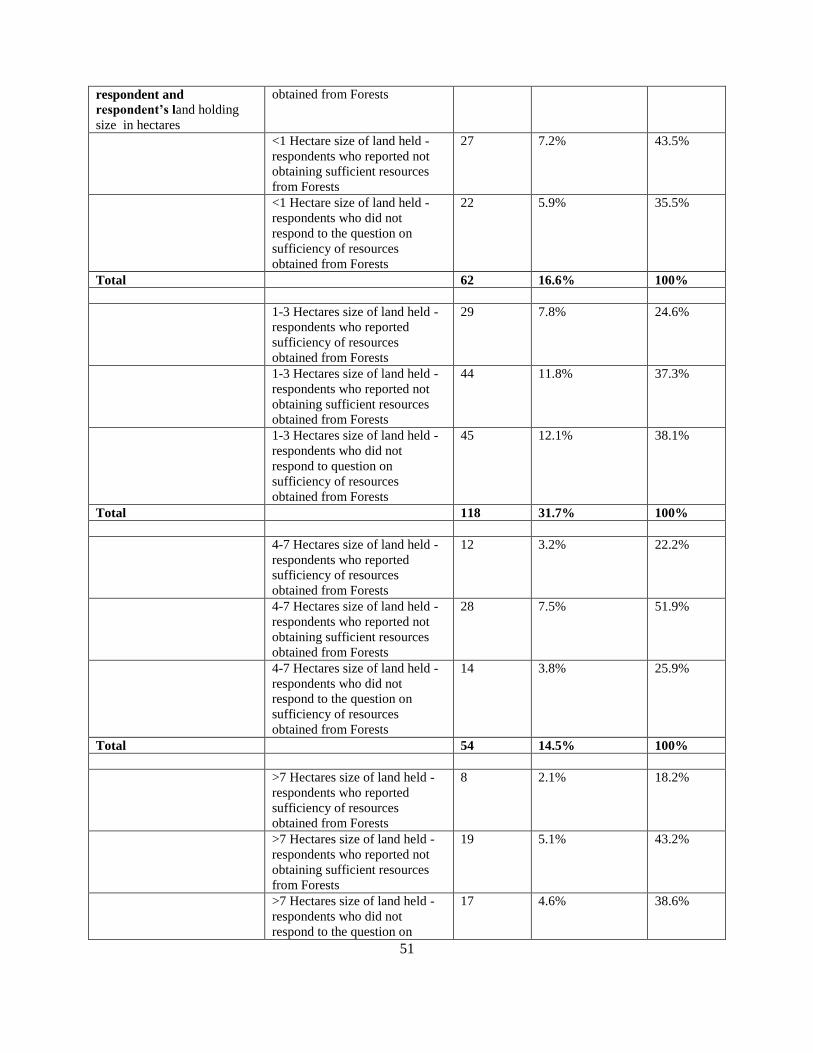
51
respondent and
respondent’s land holding
size in hectares
obtained from Forests
<1 Hectare size of land held -
respondents who reported not
obtaining sufficient resources
from Forests
27 7.2% 43.5%
<1 Hectare size of land held -
respondents who did not
respond to the question on
sufficiency of resources
obtained from Forests
22 5.9% 35.5%
Total 62 16.6% 100%
1-3 Hectares size of land held -
respondents who reported
sufficiency of resources
obtained from Forests
29 7.8% 24.6%
1-3 Hectares size of land held -
respondents who reported not
obtaining sufficient resources
obtained from Forests
44 11.8% 37.3%
1-3 Hectares size of land held -
respondents who did not
respond to question on
sufficiency of resources
obtained from Forests
45 12.1% 38.1%
Total 118 31.7% 100%
4-7 Hectares size of land held -
respondents who reported
sufficiency of resources
obtained from Forests
12 3.2% 22.2%
4-7 Hectares size of land held -
respondents who reported not
obtaining sufficient resources
obtained from Forests
28 7.5% 51.9%
4-7 Hectares size of land held -
respondents who did not
respond to the question on
sufficiency of resources
obtained from Forests
14 3.8% 25.9%
Total 54 14.5% 100%
>7 Hectares size of land held -
respondents who reported
sufficiency of resources
obtained from Forests
8 2.1% 18.2%
>7 Hectares size of land held -
respondents who reported not
obtaining sufficient resources
from Forests
19 5.1% 43.2%
>7 Hectares size of land held -
respondents who did not
respond to the question on
17 4.6% 38.6%

52
sufficiency of resources
obtained from Forests
Total 44 11.8% 100%
Sufficiency of forest
resources/values obtained
from the forests to the
respondent and
respondent’s land tenure
Freehold tenure of land -
respondents who reported
sufficiency of resources
obtained from Forests
9 2.4% 19.6%
Freehold tenure of land -
respondents who reported not
obtaining sufficient resources
from Forests
28 7.5% 60.9%
Freehold tenure of land -
respondents who did not
respond to the question on
sufficiency of resources
obtained from Forests
9 2.4% 19.6%
Total 46 12.3% 100%
Mailo tenure of land -
respondents who reported
sufficiency of resources
obtained from Forests
1 0.3% 50.0%
Mailo tenure of land -
respondents who reported not
obtaining sufficient resources
obtained from Forests
0 0.0% 0.0%
Mailo tenure of land -
respondents who did not
respond to the question on
sufficiency of resources
obtained from Forests
1 0.3% 50.0%
Total 2 0.6% 100%
Communal tenure of land -
respondents who reported
sufficiency of resources
obtained from Forests
25 6.7% 27.2%
Communal tenure of land -
respondents who reported not
obtaining sufficient resources
obtained from Forests
39 10.5% 42.4%
Communal tenure of land -
respondents who did not
respond to the question on
sufficiency of resources
obtained from Forests
28 7.5% 30.4%
Total 92 24.7% 100%
Customary tenure of land -
respondents who reported
sufficiency of resources
obtained from Forests
34 9.1% 21.4%

53
Customary tenure of land -
respondents who reported not
obtaining sufficient resources
obtained from Forests
57 15.3% 35.8%
Customary tenure of land -
respondents who did not
respond to the question on
sufficiency of resources
obtained from Forests
68 18.2% 42.8%
Total 159 42.6% 100%
Appendix 1c. Table: Analyses, respondents and investigated variables on forest state and
governance- Respondents’ perception of forest management in Buliisa district (N=373) Analyzed variable on
forest state and
governance in Buliisa
district based on
information obtained
from respondents
Respondent Particular Frequency Percentage
among
groups (out
of 373)
Percentage within
group
Perception of forest
management in Buliisa
district and
respondent’s sex
Males who perceive that forests
in Buliisa district are being well
managed
113 30.3% 40.5%
Males who perceive that forests
in Buliisa district are being
poorly managed
97 26.0% 34.8%
Males who did not respond to
the question on status of forest
management in Buliisa district
69 18.5% 24.7%
Total 279 74.8% 100%
Females who perceive that
forests in Buliisa district are
being well managed
41 11.0% 43.6%
Females who perceive that
forests in Buliisa district are
being managed poorly
24 6.4% 25.5%
Females who did not respond to
the question on status of forests
management in Buliisa district
29 7.8% 30.9%
Total 94 25.2% 100%
Perception of forest
management in Buliisa
district and
respondent’s level of
education
Not educated respondents - who
perceive that forests in Buliisa
district are being well managed
22 5.9% 46.8%
Not educated respondents - who
perceive that forests in Buliisa
district are being managed
poorly
11 2.9% 23.4%
Not educated respondents - who
did not respond to the question
on status of forest management
14 3.8% 29.8%

54
in Buliisa district
Total 47 12.6% 100%
Primary level educated
respondents - who perceive that
forests in Buliisa district are
being well managed
72 19.3% 46.8%
Primary level educated
respondents - who perceive that
forests in Buliisa district are
being managed poorly
42 11.3% 27.3 %
Primary level educated
respondents – who did not
respond to the question on status
of forest management in Buliisa
district
40 10.7% 26.0%
Total 154 41.3% 100%
Secondary level educated
respondents - who perceive that
forests in Buliisa district are
being well managed
49 13.1% 40.8%
Secondary level educated
respondents - who perceive that
forests in Buliisa district are
being managed poorly
38 10.2% 31.7%
Secondary level educated
respondents - who did not
respond to the question on the
status of forest management in
Buliisa district
33 8.8% 27.5%
Total 120 32.1% 100%
Tertiary level educated
respondents - who perceive that
forests in Buliisa district are
being well managed
7 1.9% 18.9%
Tertiary level educated
respondents - who perceive that
forests in Buliisa district are
being managed poorly
21 5.6% 56.8%
Tertiary level educated
respondents - who did not
respond to the question on status
of forest management in Buliisa
district
9 2.4% 24.3%
Total 37 9.9% 100%
Degree level educated
respondents - who perceive that
forests in Buliisa district are
being well managed
3 0.3% 23.1%
Degree level educated
respondents - who perceive that
8 2.1% 61.5%

55
forests in Buliisa district are
being managed poorly
Degree level educated
respondents - who did not
respond to the question on status
of forest management in Buliisa
district
2 0.5% 15.4%
Total 13 2.9% 100%
Postgraduate level educated
respondents - who perceive that
forests in Buliisa district are
being well managed
1 0.3% 50.0%
Postgraduate level educated
respondents - who perceive that
forests in Buliisa district are
being managed poorly
1 0.3% 50.0%
Postgraduate level educated
respondents - who did not
respond to the question on status
of forest management in Buliisa
district
0 0.0% 0.0%
Total 2 0.6% 100%
Perception of forest
management in Buliisa
district and
respondent’s Marital
status
Marital status single -
respondents who perceive that
forests in Buliisa district are
being well managed
22 5.9% 37.9%
Marital status single -
respondents who perceive that
forests in Buliisa district are
being managed poorly
20 5.4% 34.5%
Marital status single -
respondents who did not respond
to the question on status of
forest management in Buliisa
district
16 4.3% 27.6%
Total 58 15.6% 100%
Marital status Married-
respondents who perceive that
forests in Buliisa district are
being well managed
123 33.0% 41.7%
Marital status Married-
respondents who perceive that
forests in Buliisa district are
being managed poorly
95 25.5% 32.2%
Marital status Married-
respondents who did not respond
to the question on status of
forest management in Buliisa
district
77 20.6% 26.1%
Total 295 79.1% 100%

56
Marital status divorced -
respondents who perceive that
forests in Buliisa district are
being well managed
1 0.3% 20.0%
Marital status divorced -
respondents who perceive that
forests in Buliisa district are
being managed poorly
3 0.8% 60.0%
Marital status divorced -
respondents who did not respond
to the question on status of
forest management in Buliisa
district
1 0.3 20.0%
Total 5 1.4% 100%
Marital status widowed -
respondents who perceive that
forests in Buliisa district are
being well managed
5 1.3% 45.5%
Marital status widowed -
respondents who perceive that
forests in Buliisa district are
being managed poorly
3 0.8% 27.3%
Marital status widowed -
respondents who did not respond
to the question on status of
forest management in Buliisa
district
3 0.8% 27.3%
Total 11 2.9% 100%
Perception of forest
management in Buliisa
district and
respondent’s Age in
years
18-30 year olds- respondents
who perceive that forests in
Buliisa district are being well
managed
56 15.0% 41.5%
18-30 year olds- respondents
who perceive that forests in
Buliisa district are being
managed poorly
46 12.3% 34.1%
18-30 year olds- respondents
who did not respond to the
question on status of forest
management in Buliisa district
33 8.8% 24.4%
Total 135 36.1% 100%
31-40 year olds year olds-
respondents who perceive that
forests in Buliisa district are
being well managed
40 10.7% 42.6%
31-40 year olds year olds-
respondents who perceive that
forests in Buliisa district are
being managed poorly
31 8.3% 33.0%

57
31-40 year olds year olds-
respondents who did not respond
to question on status of forest
management in Buliisa district
23 6.2% 24.5%
Total 94 25.2% 100%
41-50 year olds - respondents
who perceive that forests in
Buliisa district are being well
managed
32 8.6% 47.8%
41-50 year olds - respondents
who perceive that forests in
Buliisa district are being
managed poorly
19 5.1% 28.4%
41-50 year olds - respondents
who did not respond to question
on status of forest management
in Buliisa district
16 4.3% 23.9%
Total 67 18.0% 100%
51-60 year olds - respondents
who perceive that forests in
Buliisa district are being well
managed
14 3.8% 31.8%
51-60 year olds - respondents
who perceive that forests in
Buliisa district are being
managed poorly
12 3.2% 27.3%
51-60 year olds - respondents
who did not respond to the
question on status of forest
management in Buliisa district
18 4.8% 40.9%
Total 44 11.8% 100%
61-70 year olds - respondents
who perceive that forests in
Buliisa district are being well
managed
8 2.1% 40.0%
61-70 year olds - respondents
who perceive that forests in
Buliisa district are being
managed poorly
8 2.1% 40.0%
61-70 year olds - respondents
who did not respond to the
question on status of forest
management in Buliisa district
4 1.1% 20.0%
Total 20 5.3% 100%
>70 year olds - respondents who
perceive that forests in Buliisa
district are being well managed
4 1.1% 36.4%
>70 year olds - respondents who
perceive that forests in Buliisa
district are being poorly
3 0.8% 27.3%
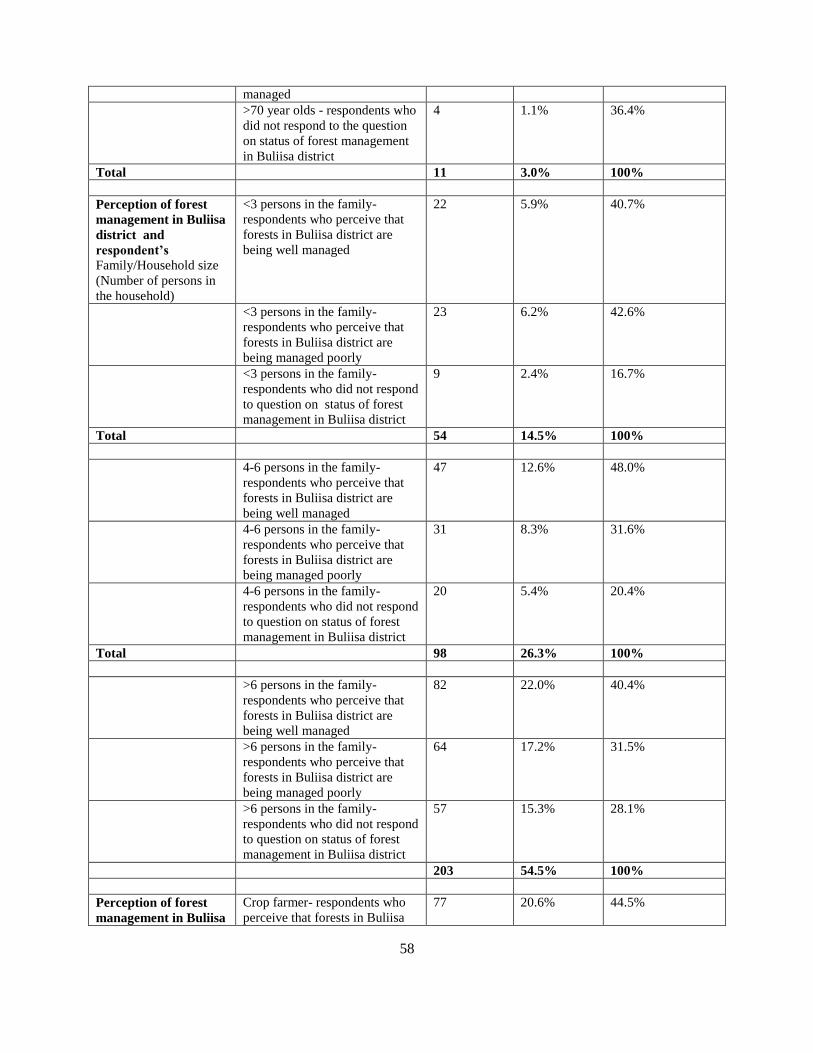
58
managed
>70 year olds - respondents who
did not respond to the question
on status of forest management
in Buliisa district
4 1.1% 36.4%
Total 11 3.0% 100%
Perception of forest
management in Buliisa
district and
respondent’s
Family/Household size
(Number of persons in
the household)
<3 persons in the family-
respondents who perceive that
forests in Buliisa district are
being well managed
22 5.9% 40.7%
<3 persons in the family-
respondents who perceive that
forests in Buliisa district are
being managed poorly
23 6.2% 42.6%
<3 persons in the family-
respondents who did not respond
to question on status of forest
management in Buliisa district
9 2.4% 16.7%
Total 54 14.5% 100%
4-6 persons in the family-
respondents who perceive that
forests in Buliisa district are
being well managed
47 12.6% 48.0%
4-6 persons in the family-
respondents who perceive that
forests in Buliisa district are
being managed poorly
31 8.3% 31.6%
4-6 persons in the family-
respondents who did not respond
to question on status of forest
management in Buliisa district
20 5.4% 20.4%
Total 98 26.3% 100%
>6 persons in the family-
respondents who perceive that
forests in Buliisa district are
being well managed
82 22.0% 40.4%
>6 persons in the family-
respondents who perceive that
forests in Buliisa district are
being managed poorly
64 17.2% 31.5%
>6 persons in the family-
respondents who did not respond
to question on status of forest
management in Buliisa district
57 15.3% 28.1%
203 54.5% 100%
Perception of forest
management in Buliisa
Crop farmer- respondents who
perceive that forests in Buliisa
77 20.6% 44.5%
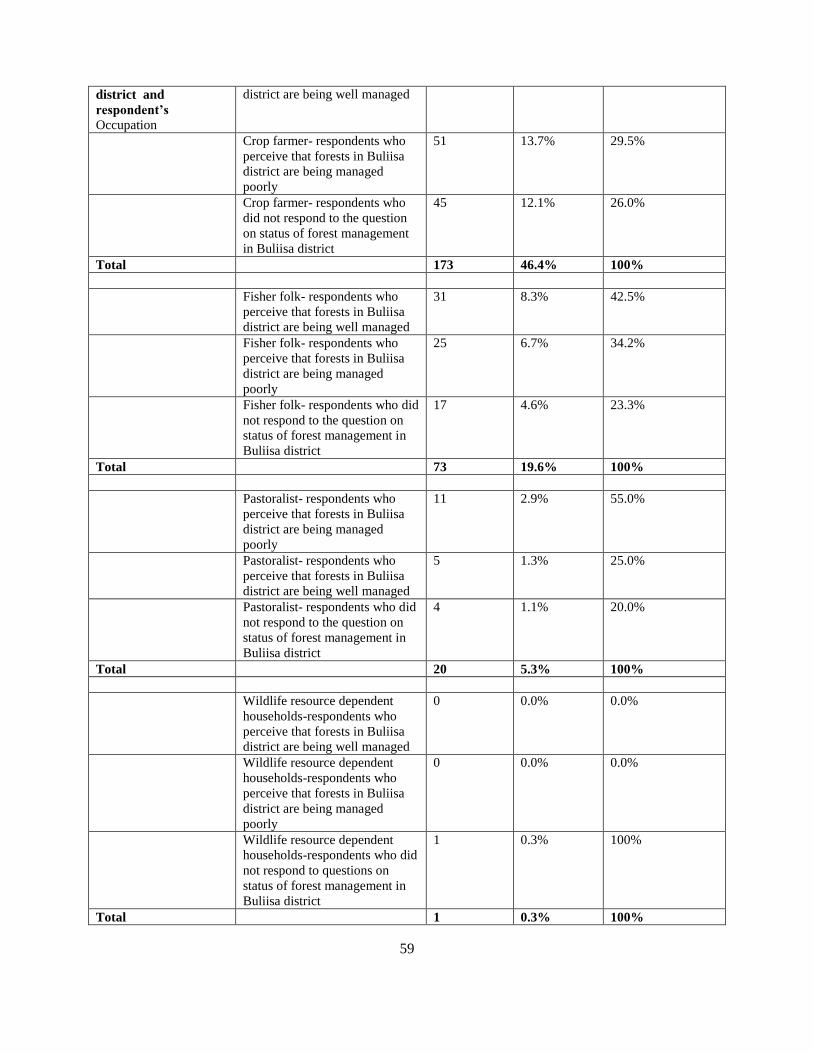
59
district and
respondent’s
Occupation
district are being well managed
Crop farmer- respondents who
perceive that forests in Buliisa
district are being managed
poorly
51 13.7% 29.5%
Crop farmer- respondents who
did not respond to the question
on status of forest management
in Buliisa district
45 12.1% 26.0%
Total 173 46.4% 100%
Fisher folk- respondents who
perceive that forests in Buliisa
district are being well managed
31 8.3% 42.5%
Fisher folk- respondents who
perceive that forests in Buliisa
district are being managed
poorly
25 6.7% 34.2%
Fisher folk- respondents who did
not respond to the question on
status of forest management in
Buliisa district
17 4.6% 23.3%
Total 73 19.6% 100%
Pastoralist- respondents who
perceive that forests in Buliisa
district are being managed
poorly
11 2.9% 55.0%
Pastoralist- respondents who
perceive that forests in Buliisa
district are being well managed
5 1.3% 25.0%
Pastoralist- respondents who did
not respond to the question on
status of forest management in
Buliisa district
4 1.1% 20.0%
Total 20 5.3% 100%
Wildlife resource dependent
households-respondents who
perceive that forests in Buliisa
district are being well managed
0 0.0% 0.0%
Wildlife resource dependent
households-respondents who
perceive that forests in Buliisa
district are being managed
poorly
0 0.0% 0.0%
Wildlife resource dependent
households-respondents who did
not respond to questions on
status of forest management in
Buliisa district
1 0.3% 100%
Total 1 0.3% 100%

60
Traders-respondents who
perceive that forests in Buliisa
district are being well managed
12 3.2% 34.3%
Traders-respondents who
perceive that forests in Buliisa
district are being managed
poorly
11 2.9% 31.4%
Traders-respondents who did not
respond to the question on status
of forest management in Buliisa
district
12 3.2% 34.3%
Total 35 9.3% 100%
Office employee- respondents
who perceive that forests in
Buliisa district are being well
managed
10 2.7% 43.5%
Office employee- respondents
who perceive that forests in
Buliisa district are being
managed poorly
8 2.1% 34.8%
Office employee- respondents
who did not respond to the
question on status of forest
management in Buliisa district
5 1.3% 21.7%
Total 23 6.1% 100%
Others (student,carpenter,Elder
unemployed, traditional
healer,cyclist, etc)- respondents
who perceive that forests in
Buliisa district are being well
managed
11 2.9% 25.0%
Others (student,carpenter,Elder
unemployed, traditional
healer,cyclist, etc)- respondents
who perceive that forests in
Buliisa district are being
managed poorly
21 5.6% 47.7%
Others (student,carpenter,Elder
unemployed, traditional
healer,cyclist, etc)- respondents
who did not respond to the
question on status of forest
management in Buliisa district
12 3.2% 27.3%
Total 44 11.7% 100%
Perception of forest
management in Buliisa
district and
respondent’s period of
stay (years) in area
<5 years in area - respondents
who perceive that forests in
Buliisa district are being well
managed
14 3.8% 51.9%
<5 years in area - respondents
who perceive that forests in
8 2.1%% 29.6%

61
Buliisa district are being
managed poorly
<5 years in area - respondents
who did not respond to question
on status of forest management
in Buliisa district
5 1.3%% 18.5%
Total 27 7.2% 100%
5-10 years in area - respondents
who perceive that forests in
Buliisa district are being well
managed
14 3.8% 42.4%
5-10 years in area - respondents
who perceive that forests in
Buliisa district are being
managed poorly
9 2.4% 27.3%
5-10 years in area - respondents
who did not respond to the
question on status of forest
management in Buliisa district
10 2.7% 30.3%
Total 33 8.9% 100%
11-15 years in area- respondents
who perceive that forests in
Buliisa district are being well
managed
12 3.2% 44.4%
11-15 years in area- respondents
who perceive that forests in
Buliisa district are being
managed poorly
8 2.1% 29.6%
11-15 years in area- respondents
who did not respond to question
on status of forest management
in Buliisa district
7 1.9% 25.9%
Total 27 7.2% 100%
16-20 years in area- respondents
who perceive that forests in
Buliisa district are being well
managed
13 3.5% 27.6%
16-20 years in area- respondents
who perceive that forests in
Buliisa district are being
managed poorly
17 4.6% 36.2%
16-20 years in area- respondents
who did not respond to question
on status of forest management
in Buliisa district
17 4.6% 36.2%
Total 47 12.7% 100%
>20 years in area - respondents
who perceive that forests in
Buliisa district are being well
managed
100 26.8% 42.6%

62
>20 years in area - respondents
who perceive that forests in
Buliisa district are being
managed poorly
77 20.6% 32.8%
>20 years in area - respondents
who did not respondent to the
question on status of forest
management in Buliisa district
58 15.5% 24.7%
Total 235 62.9% 100%
Perception of forest
management in Buliisa
district and
respondent’s origin
before settling in area
Within the same village origin -
respondents who perceive that
forests in Buliisa district are
being well managed
86 23.1% 42.4%
Within the same village origin -
respondents who perceive that
forests in Buliisa district are
being managed poorly
65 17.4% 32.0%
Within the same village origin -
respondents who did not respond
to the question on status of
forest management in Buliisa
district
52 13.9% 25.6%
Total 203 54.4% 100%
Within the same district origin -
respondents who perceive that
forests in Buliisa district are
being well managed
30 8.0% 58.8%
Within the same district origin -
respondents who perceive that
forests in Buliisa district are
being managed poorly
9 2.4% 17.6%
Within the same district origin -
respondents who did not respond
to question on status of forest
management in Buliisa district
12 3.2% 23.5%
Total 51 13.6% 100%
Elsewhere within Uganda origin
- respondents who perceive that
forests in Buliisa district are
being well managed
26 7.0% 28.9%
Elsewhere within Uganda origin
- respondents who perceive that
forests in Buliisa district are
being managed poorly
39 10.5% 43.3%
Elsewhere within Uganda origin
- respondents who did not
respond to the question on status
of forest management in Buliisa
district
25 6.7% 27.8%
Total 90 24.2% 100%

63
Outside Uganda origin -
respondents who perceive that
forests in Buliisa district are
being well managed
7 1.9% 33.3%
Outside Uganda origin -
respondents who perceive that
forests in Buliisa district are
being managed poorly
6 1.6% 28.6%
Outside Uganda origin -
respondents who did not respond
to the question on status of
forest management in Buliisa
district
8 2.1% 38.1%
Total 21 5.6% 100%
Perception of forest
management in Buliisa
district and
respondent’s land
holding size in hectares
<1 Hectare size of land held -
respondents who perceive that
forests in Buliisa district are
being well managed
24 6.4% 38.7%
<1 Hectare size of land held -
respondents who perceive that
forests in Buliisa district are
being managed poorly
22 5.9% 35.5%
<1 Hectare size of land held -
respondents who did not respond
to the question on status of
forest management in Buliisa
district
16 4.3% 25.8%
Total 62 16.6% 100%
1-3 Hectares size of land held -
respondents who perceive that
forests in Buliisa district are
being well managed
53 14.2% 44.9%
1-3 Hectares size of land held -
respondents who perceive that
forests in Buliisa district are
being managed poorly
31 8.3% 26.3%
1-3 Hectares size of land held -
respondents who did not respond
to question on status of forest
management in Buliisa district
34 9.1% 28.8%
Total 118 31.6% 100%
4-7 Hectares size of land held -
respondents who perceive that
forests in Buliisa district are
being well managed
26 7.0% 48.1%
4-7 Hectares size of land held -
respondents who perceive that
forests in Buliisa district are
being managed poorly
18 4.8% 33.3%

64
4-7 Hectares size of land held -
respondents who did not respond
to the question on status of
forest management in Buliisa
district
10 2.7% 18.5%
Total 54 14.5% 100%
>7 Hectares size of land held -
respondents who perceive that
forests in Buliisa district are
being well managed
16 4.3% 36.4%
>7 Hectares size of land held -
respondents who perceive that
forests in Buliisa district are
being managed poorly
18 4.8% 40.9%
>7 Hectares size of land held -
respondents who did not respond
to the question on status of
forest management in Buliisa
district
10 2.7% 22.7%
Total 44 11.8% 100%
Perception of forest
management in Buliisa
district and
respondent’s land
tenure
Freehold tenure of land -
respondents who perceive that
forests in Buliisa district are
being well managed
18 4.8% 39.1%
Freehold tenure of land -
respondents who perceive that
forests in Buliisa district are
being managed poorly
17 4.6% 37.0%
Freehold tenure of land -
respondents who did not respond
to the question on status of
forest management in Buliisa
district
11 2.9% 23.9%
Total 46 12.0% 100%
Mailo tenure of land -
respondents who perceive that
forests in Buliisa district are
being well managed
1 0.3% 50.0%
Mailo tenure of land -
respondents who perceive that
forests in Buliisa district are
being managed poorly
0 0.0% 0.0%
Mailo tenure of land -
respondents who did not respond
to the question on status of
forests in Buliisa district
1 0.3% 50.0%
Total 2 0.6% 100%
Communal tenure of land -
respondents who perceive that
33 8.8% 35.9%

65
forests in Buliisa district are
being well managed
Communal tenure of land -
respondents who perceive that
forests in Buliisa district are
being well managed poorly
35 9.4% 38.0%
Communal tenure of land -
respondents who did not respond
to the question on status of
forest management in Buliisa
district
24 6.4% 26.1%
Total 92 24.6% 100%
Customary tenure of land -
respondents who perceive that
forests in Buliisa district are
being well managed
76 20.4% 47.8%
Customary tenure of land -
respondents who perceive that
forests in Buliisa district are
being managed poorly
47 12.6% 29.6%
Customary tenure of land -
respondents who did not respond
to the question on status of
forest management in Buliisa
district
36 9.7% 22.6%
Total 159 35.7% 100%
Appendix 1 d. Table: Strategies participants agreed on for Achieving Forest Governance Agenda Priority
order
(generated
from
Ranking by
workshop
participants)
of agenda
Buliisa Forest
Governance and
Sustainability
Agenda
Strategy proposed to achieve
Buliisa Forest Governance
and Sustainability Agenda
Time frame
to achieve
Buliisa
Forest
Governance
and
Sustainability
Agenda
Institution/Authority
to spearhead
implementation of
proposed strategies
to Achieve Buliisa
Forest Governance
and Sustainability
Agenda
1 Community
sensitization on the
available government
fora, guidelines, laws
and policies that
enable local
communities to
access, benefit and
participate in forest
resource use and
management.
Organize workshops and local
radio programmes to sensitize
communities on the available
government fora, guidelines,
laws and policies that enable
local communities to access,
benefit and participate in forest
resource use and management
January to
April 2014
National Forest
Authority (Budongo),
NGOs, Buliisa DFO,
and CDO
2 Revive the
environment
committees at Local
Councils II, III and V,
the District Natural
Resource Forum and
-Workshops on the roles and
structure of the environment
committee
-Facilitate formation of the
environment committees
June to
August 2014
District Council,
Parliament and NGOs

66
an inter-district
Natural Resource
Forum.
-Policy dialogues to influence
policy guidelines and
recommendations for effective
functioning of the environment
committees
3 Carry out a
comprehensive
participatory forest
resource-user needs
assessment involving
both forest resource
users and managers.
-Carry out a needs assessment
among forest resource
dependent and adjacent
communities
-Organize Focus Group
Discussions involving both
forest resource users and
managers
January to
April 2014
NFA, DFO, DEO and
NGOs
4 Increase awareness of
the values of forests
and strengthen
environmental clubs
(such as Wildlife
Clubs) in institutions
such as schools,
religious and political
institutions.
-Conduct an inventory to assess
the economic value of forest
products and services
-Awareness through peaceful
public demonstrations and
rallies, workshops and radio
programmes
-Organize school debates
related to sustainable use and
management of forest resources
August to
December
2014
NGOs, DFO, Political
parties, Parliament
5 Facilitate formation of
CFM groups along
Budongo Central
Forest Reserve and
empower them to
negotiate better CFM
agreements with NFA
-Form at least 3 CFM groups in
Buliisa district
-Facilitate CFM groups to
negotiate better CFM
agreement e.g communities
should benefit from carbon
trade (PES and REDD) and
forest revenues.
Attach a legal officer to each of
the formed CFM groups
-Create a central office in
Buliisa district to coordinate the
activities of the CFM groups
January to
August 2015
NFA and NGOs,
Parliament
6 Facilitate forest
adjacent communities
to access and benefit
from forest resources,
and create plat forms
for participation in
forest resource use
and management
-Form at least 3 CFM groups in
Buliisa
-Facilitate CFM groups to
negotiate better CFM
agreements- e.g Have a legal
officer attached to each CFM
-Create a central office in
Buliisa to coordinate the
activities of the CFM groups
-Organize public policy
June to
August 2015
NFA and NGOs
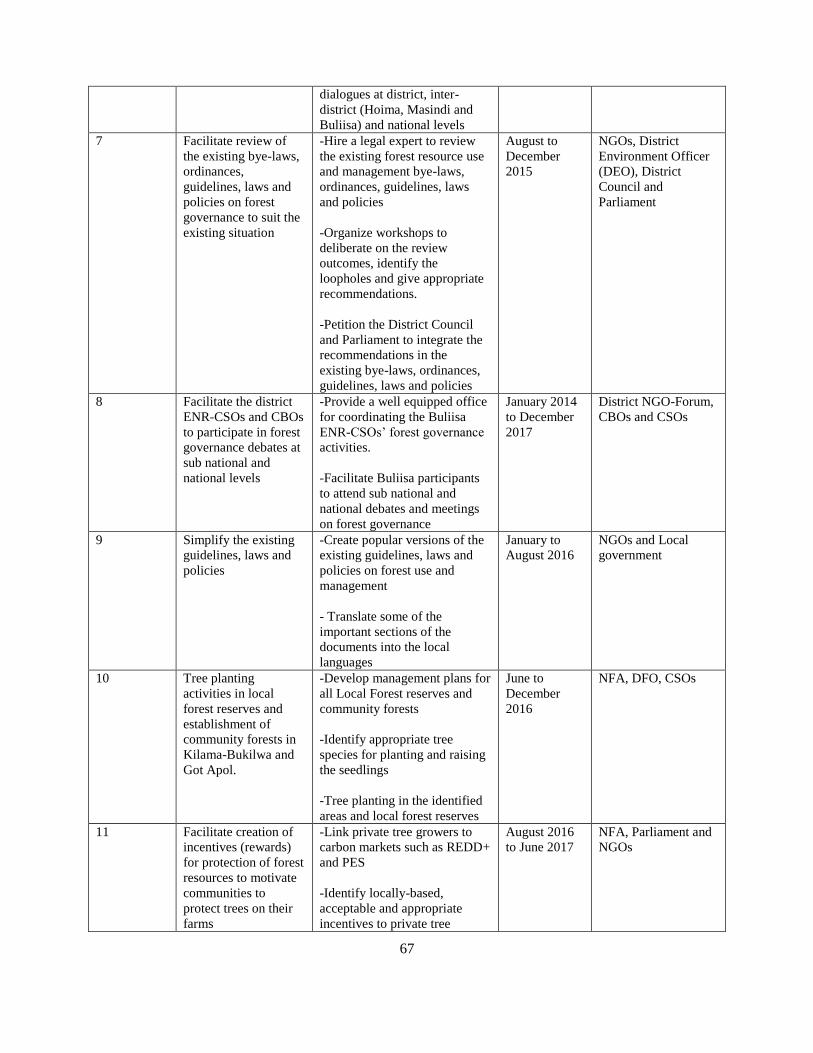
67
dialogues at district, inter-
district (Hoima, Masindi and
Buliisa) and national levels
7 Facilitate review of
the existing bye-laws,
ordinances,
guidelines, laws and
policies on forest
governance to suit the
existing situation
-Hire a legal expert to review
the existing forest resource use
and management bye-laws,
ordinances, guidelines, laws
and policies
-Organize workshops to
deliberate on the review
outcomes, identify the
loopholes and give appropriate
recommendations.
-Petition the District Council
and Parliament to integrate the
recommendations in the
existing bye-laws, ordinances,
guidelines, laws and policies
August to
December
2015
NGOs, District
Environment Officer
(DEO), District
Council and
Parliament
8 Facilitate the district
ENR-CSOs and CBOs
to participate in forest
governance debates at
sub national and
national levels
-Provide a well equipped office
for coordinating the Buliisa
ENR-CSOs’ forest governance
activities.
-Facilitate Buliisa participants
to attend sub national and
national debates and meetings
on forest governance
January 2014
to December
2017
District NGO-Forum,
CBOs and CSOs
9 Simplify the existing
guidelines, laws and
policies
-Create popular versions of the
existing guidelines, laws and
policies on forest use and
management
- Translate some of the
important sections of the
documents into the local
languages
January to
August 2016
NGOs and Local
government
10 Tree planting
activities in local
forest reserves and
establishment of
community forests in
Kilama-Bukilwa and
Got Apol.
-Develop management plans for
all Local Forest reserves and
community forests
-Identify appropriate tree
species for planting and raising
the seedlings
-Tree planting in the identified
areas and local forest reserves
June to
December
2016
NFA, DFO, CSOs
11 Facilitate creation of
incentives (rewards)
for protection of forest
resources to motivate
communities to
protect trees on their
farms
-Link private tree growers to
carbon markets such as REDD+
and PES
-Identify locally-based,
acceptable and appropriate
incentives to private tree
August 2016
to June 2017
NFA, Parliament and
NGOs

68
growers
12 Advocate for
increased transparence
in the forest resource
access and benefits
licensing process.
-Sensitize communities on the
procedure and guidelines for
accessing, benefiting and
participating in forest resources
use and management
-Facilitate formulation of
popular versions of the
guidelines, laws and policies
used in the licensing process.
-Advocate for creation of forest
resource use and access
licensing offices in Buliisa
district.
June to
December
2017
NGOs, Parliament

69
Appendix 2: Questionnaire used in the study -Investigating the state and, governance of
forest resources in Buliisa district, from local stakeholders- communities and institutions’
perspectives
1. Introduction and confidentiality
The range of queries included in this questionnaire tool is intended to identify from target
stakeholders’ perspective, the state of forest and forest governance in Buliisa District. The
overall goal for the questions included were to collect sufficient information on aspects of forest
governance (access to resources, benefit from and participation in management of the forest
resources by local communities), their perception on state of forest and forest management and,
their agenda and strategies for achieving the agenda they want addressed with regard to forest
status and governance in the district and at national level in Uganda. Participation in the
interviews herein, is of free will and confidentiality is assured to all respondents.
2. Data collector’s details
Name of interviewer: ............................................... Contacts:.........................................
Date:........................
3. Socio-economic characteristics of respondent
a) Name:........................................................................Contacts:..............................................
District:....................Sub county
:.................................Parish:........................Village:............
b) Sex: Male Female
c) Marital status: single married divorced widowed
d) Age: 18 -30 31 -40 41-50 51- 60 61-70 >70
e) Household/family size: <3 4- 6 >6
f) Level of education: None Primary Secondary Tertiary Degree
Postgraduate
g) Employment status/occupation: Crop farmer Fisher folk Pastoralist wildlife
resources Oil activities Trader Office employee Others
(specify).......................................................................
h) For how long have you stayed in this area? < 5 yrs 5-10 yrs 11-15 yrs 16-20 yrs
>20 yrs

70
i) Where did you come from? Within the same village from elsewhere within Uganda
Within the same district from outside Uganda Others
(specify)................................................................................
j) Why did you choose to settle here?
..
k) Land ownership: Yes No
l) Land location: Near a swamp Near a water body adjacent to a protected area Others
(specify) .........................................................
m) If yes, size of land owned: < ha 1-3 ha 4-7ha >7ha
n) Land tenure status: freehold Mailo land Communal customary Lease hold
4. Are you happy with the way you own your land? Yes No (if no, go to 7)
5. If yes, what makes you happy with the way you own your land
..
6. What do you think can be done to make your land ownership even better for you?
..
7. You are not happy with the way you own your land, why?
..
8. What do you think can be done to solve your land ownership problems you have talked about?
..
9. Whom do you think can provide the solutions you have suggested?

71
10. Is there anything more you would like to tell us about land in your
area?...................................................................................................................................................
.........................................................................................................................................................
11. You have Bugungu wildlife reserve, MFNP, Budongo central forest reserve, R. Nile; do you
value the forests resources that are here in your area? Yes No ( if no go question 17)
12. If yes, what values/ resources do you get from the forests?
..
13. Do you get enough of the forest resources that you use from the forest? Yes No
14. If no, why are you not able to get enough of the resources you want from Budongo forest?
..
15. What do you think can be done to enable you get enough of the resources you want from
Budongo forest?
..
16. Who do you think can help provide those things that you say need to be done to enable you get
enough of the resources you want from Budongo forest?
..
17. You don’t get any resources from the forests /Budongo forest in your district, but is this forest
important to you in any way as a person who comes from this area? Yes No

72
18. If yes, how is this forest important to you?
..
19. As Budongo and other forests in the district are important to you even though you don’t get any
resources from them yourself, do you think forests in the district are being used and managed
well? Yes No
20. You say the forests are not being used and managed well, why do you say so?
..
21. What do you think can be done to ensure the forests are used and managed well?
……………..
22. Whom do you think can do those things you have said need to be done to ensure Budongo forest
is used and managed well?
..
THANK YOU