Embed Size (px)
Citation preview

Status of Exploited Marine Fishesand Invertebrates
in German Marine Waters
Rainer Froese, GEOMARCluster Meeting ökosystemgerechte Fischerei
Bundesamt für Naturschutz, Insel Vilm, 11.11.13
MSFD Descriptor 31. The level of pressure of the fishing activity, measured either as fishing
mortality F relative to the one associated with the maximum sustainable yield (Fmsy) or, if F is unknown, the ratio between catch and biomass, with a reference point that is compatible with Fmsy.
2. The spawning stock biomass SSB relative to the one that can produce the maximum sustainable yield (SSBmsy) or other suitable biomass indices.
3. The age and size distribution within the population, with the sub-indicatorsi. Proportion of fish larger than the mean size of first sexual maturation;ii. Mean maximum length across all species found in research vessel
surveys;iii. 95 % percentile of the fish length distribution observed in research
vessel surveys; iv. Size at first sexual maturation [relative to historic sizes], which may
reflect the extent of undesirable genetic effects of exploitation.

MSFD Descriptor 3.1: F
• F and Fmsy available only for fully assessed stocks (most stocks are data-limited)
• Natural mortality M is a proxy for Fmsy• M can be estimated for all stocks• Total mortality Z can be estimated from
DATRAS survey data• F = Z – M• M / F is the chosen 3.1 indicator (positive if F < M)

How to Estimate Z
• Number of cohort members declines with age due to total mortality rate Z
• DATRAS gives CPUE by length class• Get CPUE of first fully selected length class• Determine length in 1, 2, 3 subsequent years• Get CPUE in subsequent years for these lengths• Fit regression line to ln(CPUE)• Absolute slope of line is Z
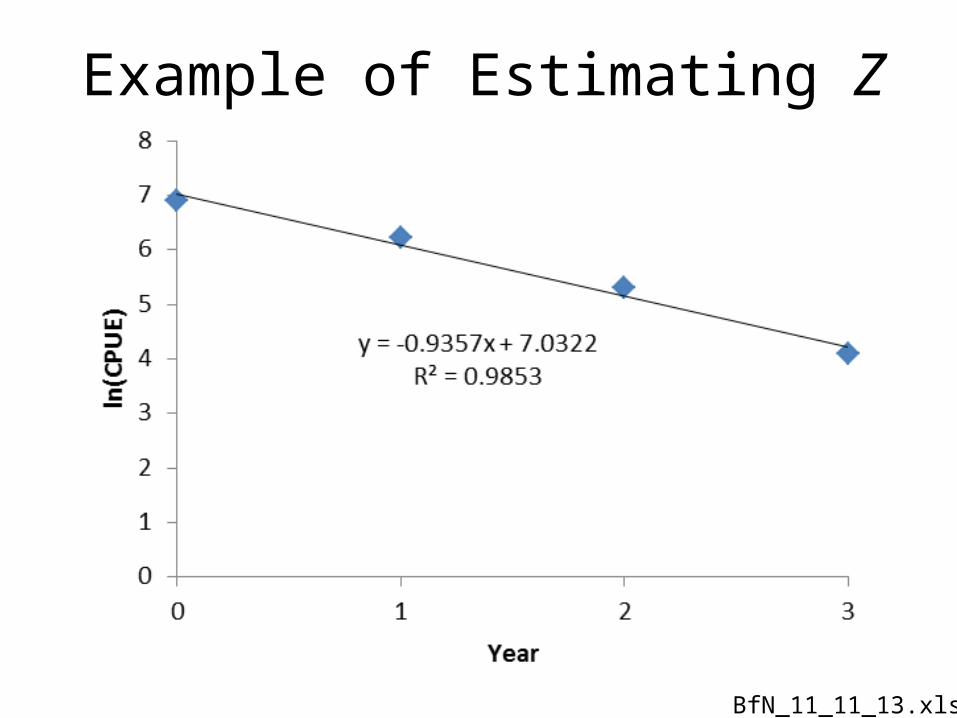
Example of Estimating Z
BfN_11_11_13.xlsx

Example North Sea Dab

MSFD Descriptor 3.2: SSB
• SSB only available for fully assessed stocks• SSBmsy not given by ICES• 2 * SSBpa is reasonable proxy for SSBmsy• CPUE from DATRAS can be used as a proxy for SSB• Proxy SSBpa can be derived as CPUE below which
number of young fish in survey declines • SSB / SSBmsy or the respective proxies are the
chosen 3.2 indicator

Example North Sea Dab

Example of Estimating SSBpa

Example North Sea Dab

MSFD Descriptor 3.3: Age and Size
Age and size distribution within the population, with the sub-indicators
i. Proportion of fish larger than the mean size of first sexual maturation;
ii. Mean maximum length across all species found in research vessel surveys;
iii. 95 % percentile of the fish length distribution observed in research vessel surveys;
iv. Size at first sexual maturation [relative to historic sizes], which may reflect the extent of undesirable genetic effects of exploitation.
‘Across all species’ not suitable for population status

MSFD Descriptor 3.3: Age and Size
Age and size distribution within the population, with the sub-indicators
i. Proportion of fish larger than the mean size of first sexual maturation;
ii. ---iii. 95 % percentile of the fish length distribution
observed in research vessel surveys; iv. Size at first sexual maturation [relative to
historic sizes], which may reflect the extent of undesirable genetic effects of exploitation.Not visible in short time series

MSFD Descriptor 3.3: Age and Size
Age and size distribution within the population, with the sub-indicators
i. Proportion of fish larger than the mean size of first sexual maturation;
ii. ---iii. 95 % percentile of the fish length
distribution observed in research vessel surveys;
iv. ---Inversely sensitive to recruitmentDATRAS biased towards large fish

MSFD Descriptor 3.3: Age and Size
Age and size distribution within the population, with the sub-indicators
i. Proportion of fish larger than the mean size of first sexual maturation;
ii. --iii. --iv. --
Mean length in commercial catches relative to length where 90% of the females have reached maturity is the chosen indicator
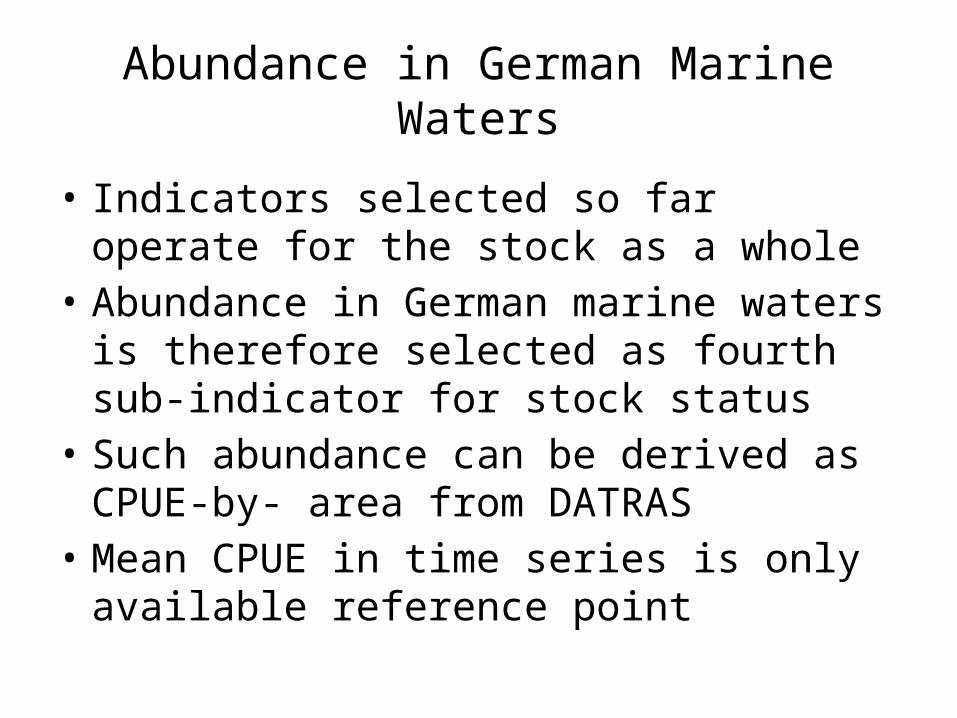
Abundance in German Marine Waters
• Indicators selected so far operate for the stock as a whole
• Abundance in German marine waters is therefore selected as fourth sub-indicator for stock status
• Such abundance can be derived as CPUE-by- area from DATRAS
• Mean CPUE in time series is only available reference point

Example North Sea Cod
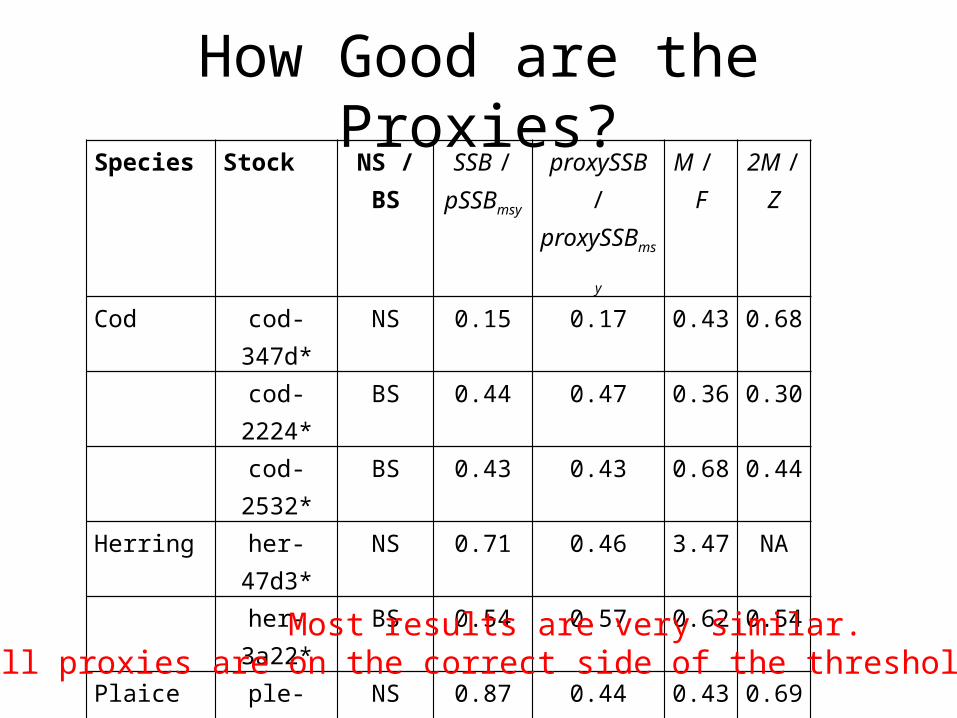
How Good are the Proxies?Species Stock NS / BS SSB /
pSSBmsy
proxySSB /proxySSBmsy
M / F
2M / Z
Cod cod-347d* NS 0.15 0.17 0.43 0.68
cod-2224* BS 0.44 0.47 0.36 0.30
cod-2532* BS 0.43 0.43 0.68 0.44
Herring her-47d3* NS 0.71 0.46 3.47 NA
her-3a22* BS 0.54 0.57 0.62 0.54
Plaice ple-nsea* NS 0.87 0.44 0.43 0.69
Sole sol-nsea* NS 0.44 0.54 0.28 NA
Sprat spr-2232* BS 0.83 0.37 0.97 NA
Most results are very similar. All proxies are on the correct side of the threshold.

Getting Summary Indicatorsfor every Stock
where IF is the indicator for fishing pressure, IL is the indicator for mean length in the catch, IA is the indicator for abundance in German marine waters, and IFLA is the arithmetic mean of these three sub-indicators.
where Isummary is the summary indicator, which equals the stock size indicator IS if the mean of the other sub-indicators is ≥ 1, or is multiplied with the mean of the other sub-indicators if that mean is < 1.

Getting an Overall Indicator
• The overall indicator is the percentage of stocks that obtained a score >= 1
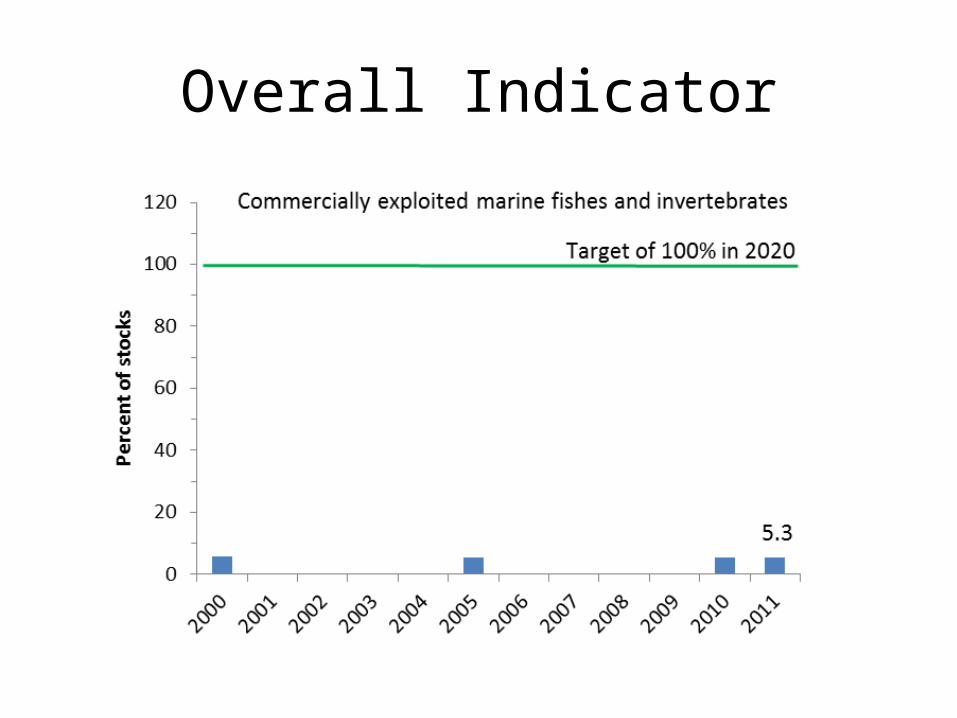
Overall Indicator

Sub-Indicator for Stock Size
Low stock size determines low overall status

Sub-Indicator for Fishing Mortality
Continuing overfishing prevents recovery

Sub-Indicator for Size & Age
Positive bias because of reduced size & age at maturity

Sub-Indicator for Abundance
Positive bias because of low reference point

Next Steps
• Publish results to highlight overfished status of most data-limited stocks
• Combine proxy indicators with analysis of catch data
• Establish robust system to classify relative stock size of data-limited stocks
• Devise simple, precautionary, ecosystem-based harvest control rules for data-limited stocks