Embed Size (px)
Citation preview
Status of Equality and Inclusion in Kenya, 2015
5th July, 2017
1
Presentation Outline Background Purpose of Study Key findings
1. Education2. Labour and employment3. Political representation4. Social protection5. Equality and Inclusion Index
Implications for policy2

Background Economic and social inclusion; poverty eradication, equality and social justice are
critical for sustainable development The adoption of the “Copenhagen Declaration and Programme of Action” gave
impetus to commitments on equality and inclusion. (World Summit for Social Development (Copenhagen, 5-12 March 1995),
3
Policy commitments:
• MDGs: 2015
• Agenda 2030 on SDGs
• International covenants on
human rights
• The constitution of Kenya
• Vision 2030
Aims :
• Equal Society for all
• Free of poverty
• Attainment of full employment
and
• Social integration
However, Special Interest Groups (SIGs) i.e. Children, the youth, women,minorities and marginalized groups, older persons, and persons withdisabilities (PWDs) have suffered most from historical marginalization anddiscrimination

Background cont’d Kenya has progressive laws in place to ensure that SIGs are
represented at all levels of government
However, a lot needs to be done to ensure that SIGs enjoy their rights in the Constitution
Kenya is yet to achieve the one third minority gender representation in its parliament
PWDs stigmatization is still a challenge
4

Sustainable Development Goals Relevant Sustainable Development Goals (SDG)
include: Zero hunger (SDG2), Good health and wellbeing (SGD3), Quality education (SDG4), Gender equality (SDG5), and Decent work and economic empowerment (SDG8)
However, there is limited analytical evidence on current status of equality and inclusion.
Need to assess extent of the integration of the principles of equality and inclusion in national, county and private sector policies, laws and programmes.
5

Purpose of the Study Develop a Country status report on equality and
inclusion focusing on Special Interest Groups including: Children, youth, women, minorities and marginalized groups, older persons, and persons with disability (PWDs)
Focus Sectors:EducationEmploymentPolitical representationSocial protection
6

Methodological approach
7
Sample designedfrom NationalSample Surveyand EvaluationProgramme(NASSEP V) frame
4,920 households from 47 counties; rural and urban and 844 learning institutions (public and private)Data collection: 2015
Sampling frame Sample size

Key findings in Education Substantial expansion in basic education since 2003
Twenty counties had a KCPE mean of 250 marks and below Disparities in teacher distribution with pupil teacher ratio ranging from
a low of 25:1 and a high of 100:1 Additional focus extended to ECDE. Secondary enrolment grew by 49% to 2.3 million students in 2015 Inequalities, low quality and poor access to post primary education for low
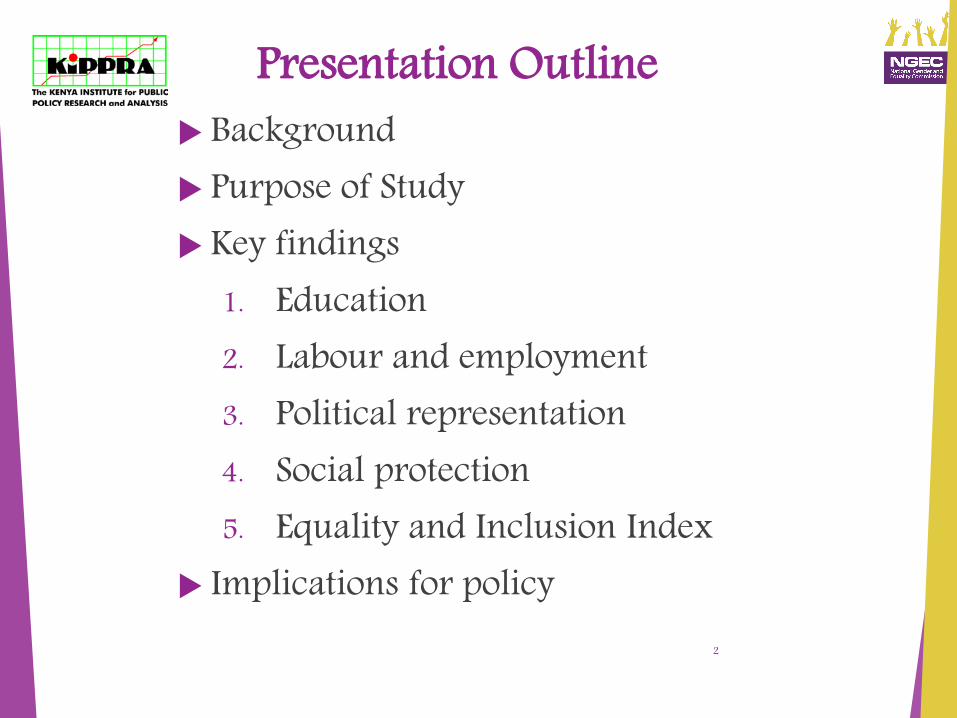
income groups. School related costs is responsible for 49 % of school age children not in
school. Among factors the influence enrollment:
Infrastructure for children with disabilities was perceived as a majorproblem (34%),
Condition of school facilities (18%) Inadequate infrastructure for children with disabilities in urban and
rural areas8
Reasons for not attending school
9
0.1
0.3
0.3
0.4
0.4
0.7
0.9
0.9
1.0
1.1
1.1
1.2
1.7
2.1
2.4
8.0
28.3
49.0
0.0 5.0 10.0 15.0 20.0 25.0 30.0 35.0 40.0 45.0 50.0
fgm/ circumcision
own disability
cultural beliefs
drug and substance abuse
school too far from home
family illness
poor quality of schools
family disability
early marriage
still too young
pregnancy
had to work or help at home
insecurity
parents did not let me
not interested
own illness
other
school related costs
Percent share
School related costs is responsible for 49 % of school age children not in school. Illness has significant effect too.

Key findings….
44% of pre-primary respondents flagged infrastructure for children withdisabilities.
35% per cent pointed to seasonal factors such as rains and floods. Infrastructure for the disabled children was also the dominant ‘major
problem’ for all the other levels of education – rising to 50% per cent forspecial education.
Integration and availability of instructional material and visuals aids inalternative formats was rated at 34 percent.
Recent interventions include community mobilization, participation inschool management and encouraging community level support for SIGs
Lower income groups benefit less from tertiary education compared tohigh and medium income groups, but more from primary education.
Gains for poorest welfare group at primary level are estimated at 24.7 percent, 9.5 per cent for secondary and 1.9 per cent for tertiary education
10

Key findings…. Budget allocations to the sector show a dominance for
recurrent (91%) over development budget (9%) 47% reported that budgeting for capacity building in relation
to equality and inclusion is effective. Only 43% of institutions indicated that budget allocations for
equality and inclusion were effective and Institutions with expenditures for SIG spend effectively, according to the budget.
Families of SIGs rely on services and assistance offered by the government, religious organizations and NGOs.
These families need to be empowered and supported with livelihood options.
Lack of accurate prevalence data and low registration of SIGs result in adequate planning by the government.
11

Low Cohort Enrolment and Progression in Basic Education
12
75
64 65 63 63 65 71 71
92 90 89 95
44 39
35 37
-
20
40
60
80
100
120
-
200
400
600
800
1,000
1,200
1,400
1,600
2001-2012 2002-2013 2003-2014 2004-2015 2005-2016 2006-2013 2007-2014 2008-2015
Perc
ent (
%)
Enro
lmen
t '000
Grade 1 Enrolment '000 Grade 8 Enrolment '000
Form 4 Enrolment '000 % Grade 1 reaching grade 8
% Form 1 progressing to Form 4 % Grade 1 progressing to Form 4

Inequalities in County Secondary NER, 2014
13

Unsatisfactory performance has negative effect of labour market participation
14
6.1 3.8 5.1 5.53.1 4.4
7.14.4 5.9
8.24.7 6.7 7.9
5.1 6.7 7.85.2 6.6 8.6
5.5 7.2 8.25.4 6.9 7.5
4.76.2
27.1
20.524.1
27.5
20.424.3
30.7
23.427.4
32.6
24.929.1
31.8
24.628.630.6
24.227.7
34.1
27.531.1
35.029.3
32.3 31.2
24.428.1
66.7
75.670.8
67.0
76.571.3
62.2
72.366.7
59.2
70.4
64.260.2
70.264.7
61.7
70.565.7
57.2
67.061.8
56.8
65.360.8 61.4
71.065.7
0.0
10.0
20.0
30.0
40.0
50.0
60.0
70.0
80.0M
ale
Fe
ma
le
To
tal
Ma
le
Fe
ma
le
To
tal
Ma
le
Fe
ma
le
To
tal
Ma
le
Fe
ma
le
To
tal
Ma
le
Fe
ma
le
To
tal
Ma
le
Fe
ma
le
To
tal
Ma
le
Fe
ma
le
To
tal
Ma
le
Fe
ma
le
To
tal
Ma
le
Fe
ma
le
To
tal
2008 2009 2010 2011 2012 2013 2014 2015 Average
B+ and above C+ and above C and below
Linear ( B+ and above) Linear ( C+ and above) Linear (C and below)

Key findings on Labour Children aged 5 to 17 were about 15.5 million in 2015
Schooling status is important – yet 15.1% of children reported “never gone to school” in 2015. There are wide variations across counties e.g. Mandera (54%) , Garissa (54%) and Tharaka Nithi (2.3%)
Child labour (defined by hours of work) affected about 10% of the children aged 5 to 17 in 2015.
Proportion of children engaged in child labour in Kenya by age group
15
Age (and hours of work per week)
Total % Total (number)
5 to 12 (1 or more hours) 10.6 10,241,505
13 to 15 (14+ hours) 9.2 3,272,037
16 to 17 (42+ hours) 8.4 1,964,565

Youth (aged 15 to 34 were about 14 million in 2015)
Employment
Majority of the youth were employed in informal sector
Agriculture dominates total employment of the youth
About half of the 9 million employed youth were in individual/family enterprises
TheYouth Employment to Population Ratio was 45% comparable to 58% for the working age group (i.e. 15-64 years).
Among the employed youth 62% were in vulnerable employment (defined as own account or contributing family worker)
16
Main employer Youth %Individual/family enterprise 50.4Private sector company 12.6Informal sector employer 10.1National or County government 3.6Other 22.3Note: Total youth employed were estimated at 9 million

NEET and Unemployment About 21% of those aged 15 to 34 were not in education, employment
or training (NEET)
Unemployment rate for working age group (15-64) was 16.4% and the youth (15-34) 22.7% in 2015.
Unemployment rates by Age Group (2015)
17
Age group Total Unemployment % Urban unemployment* 15-19 35.5 50.120-24 30.3 45.425-29 18.5 21.530-34 11.7 9.115-34 (youth) 22.7 27.115-64 (working age) 16.4 17.2*urban includes Nairobi, Mombasa and Kisumu

Employment sectors On the whole females disadvantaged in many ways. A larger
proportion of women …
Have a lower Employment to Population Ratio for all age groups
Are in informal employment and agriculture or agricultural related activities. This implies a larger proportion are in vulnerable jobs
Are employed as casual workers – 27% versus 23% for men
In Kenya women could be earning about 70% of corresponding males earnings (relative to an ideal of 100%) –Global Gender Gap Report.
The NGEC survey indicates lower median wages for females across sectors
The unemployment rate was larger for female youth and the working age group in 2015
18

PWDs and Elderly Persons
PWDs
PWDs disadvantaged in various ways. PWDs have:
A lower Employment to Population Ratio of 35% versus overall population 57%
A higher vulnerable employment rate of 86.7% versus 60.7% for overall population
Elderly Persons (at least 60 years and above)
Elderly persons have:
A higher vulnerable employment rate of 71.5% versus 60.7% for overall population
Employment to Population Ratio of 61.9% versus overall population 57% BUT most of activity is in informal activities and agriculture
19

Public and private sector
Equality & inclusion process indicators: public & private sectors
20
Process indicator Public sector Private sector Proportion with diversity or inclusion policy of statement
77.1 64.7
Conducted diversity audit with last 2 years 55.1 39.9Proportion with a gender mainstreaming policy 85.5 55.8Proportion with a disability mainstreaming policy 79.7 33.8Proportion with a HIV/AIDS policy 84.1 35.6Hiring goals for achieving equity in workplace diversity
With respect to gender 75.0 62.8With respect to age 71.2 60.7With respect to disability 77.6 43.0With respect to ethnicity 70.2 48.5
Public sector comparatively better on process indicators

Emerging Issues
High proportion of children (ages 5 to 17) reported “never attended school (12% in 2009 and 15% in 2015)
Child labour is a major challenge (affecting 10% of children)
Youth have: a lower Employment Population Ratio (EPR) of 45% relative to 58% for working age group; Have a higher unemployment rate 22.7% versus overall of 16.4% for working age group.
BUT inactivity is their largest challenge AND 21% were NEET (not in education, employment, or training). Most of the employed are in vulnerable jobs.
Women are: underrepresented in formal employment (37% share); relative to males, females are disadvantaged with respect to: school attendance, inactivity, NEET, and vulnerable jobs
21

Emerging Issues
PWDs have: lower Employment Population Ratio 35% vs 57% for overall population. Lower proportion employed in formal sector.
Compared to the overall population in general, persons who are at least 60 years old are more likely to be engaged in informal employment. And as expected are generally under-represented in active employment.
crosscutting
It is difficult to collate data on relevant issues in employment by SIGs across MDAs (e.g. by age and ethnicity). A reflection of:
Ineffective (or no) monitoring of inclusion indicators by MDAs
Non-compliance with regulatory requirements and constitutional provisions 22
Key Findings on Political Representation
Citizen participation is critical in decision-making with regard to national policies, laws and the strategies for development and implementation
Opportunities for such participation will be even more limited for special interest groups (SIG) – children; the youth; women; people with disabilities (PWDs); older members of society; and minorities and marginalized
23

Political representation cont’dWomen still underrepresented at both levels of
government. No single female Governor was elected in 2013 Elections. No single female senator was elected
Youth and also PWDs still under represented at all levels of government
No PWD was elected as Senator or Governor
24

Emerging issues in Political Representation Retrogressive practices still constrain effective
contribution of SIGS in leadership Failure to implement electoral rules in party nominations
has negative effect SIGs candidates Inefficiencies in political party primaries that lock SIGs out
especially in party stronghold areas Poverty: Many members from the SIGs lack access to means
of production due to cultural beliefs and historical marginalization
25

Key Findings on Social Protection: Children
The State has made impressive gains in reaching out to households with orphans and vulnerable children.
60% of children live in households that can afford 3 meals in a day. However, many children still live in households that experience
risky and vulnerable conditions. For instance, 18.6 per cent of children live in households that sleep hungry .
2% of children live in households that have previously received CT resources.
The CTs, which target OVCs only are not adequate to benefit all the OVCs in need.
About 14.4 per cent of children benefit from membership in health insurance schemes.
According to county government budgeting, there are limited special funds targeting children and, where they exist, they are negligible.
26

Key Findings on Status of WomenWomen aged 18 years and above were estimated
at16.7 million. Out of the 16.7 million women, 16.4 per cent of live
in households that go without food at least once a week.
Similarly, 89 per cent of women are not members of any health insurance scheme.
While various milestones have been achieved in addressing the plight of women, some sections of the women still face challenges that require the attention.
27

Key Findings on Status of Older Persons There are about 4.4 million elderly people in Kenya. It is important that older persons live a dignified life
and receive reasonable care and assistance from their families, and State.
However, majority of the older persons face various vulnerabilities and their rights are in most cases unfulfilled.
For instance, while only an average of 12.7 per cent receive a pension, and only about 5 per cent receive cash transfers,
28

Older Persons cont’d This scenario is likely to improve with the introduction of
universal cash transfer for all older persons aged 70 years and above in January 2018. Registration is on-going.
Older persons have the highest health needs in a given population
Despite these economic realities, only 16.5% have access to some form of health insurance.
The National Hospital Insurance Fund (NHIF) premium requirement of Ksh 500 a month is un affordable for most of the older persons.
The State has proposed free access to healthcare for older persons age 70 yrs and above w.e.f 1st July 2017
29

Status of Older Persons cont’d
Moreover, many older persons live in extreme poverty and yet they do not have access to government cash transfers.
While some have access, they need to travel for long distances to access the cash.
Older persons face social threats in some communities.
30

Key Findings on Status of YouthAccording to the Social Assistance Act (2013), an
unemployed person qualifies for social assistance if they are classified as youth, have no source of income, and their lack of a source of income is not due to negligence.
There is no social assistance programme targeting unemployed youth.
Recent interventions targeting youth include: Youth empowerment programmes.
31

Status of Persons with Disability
Like all the SIGs, PWDs should be treated with dignity and accorded respect.
They should enjoy all the rights accorded to the people of Kenya, such as the right to education, food, shelter, life, etc.
However, according to the survey, nearly 46 per cent of PWDs could not afford to eat three meals a day.
At least 9 per cent could not afford a meal a day. The national budgetary allocation for PWD-CT has expanded over time . Only 8.7 per cent have ever received social assistance from the
government. These could be as a result of the targeting, which only caters for Persons With severe Disabilities (PWsD).
Access to health insurance remains a challenge to PWDs, with only 12.7 per cent having an insurance cover. 32

Status of Marginalized/Minorities
The marginalized/minority communities are in most cases affected by hunger and drought.
There is increased government funding towards the hunger Safety Net Program.
The government with assistance from development partners has put in place mechanisms to avert food insecurity during crisis period, with mixed outcomes.
However, there is need for sustainable solutions to avert drought situations and extreme hunger at all times.
33

Financing, Governance and legislative frameworks Social Protection is not just an expenditure but a social
investment with both immediate and future economic benefits
Social Protection supports the achievement of 14 out of 17 SDGs
Social Assistance Act does not adequately meet the needs of the sector
Social Protection programs are housed in different ministries hence need for coordination
The National Social Protection Investment Plan 2018-2030, if properly financed, can be our pathway to meeting the SDGs 34

Equality and inclusion indexIndex Interpretation
Social Justice & Civic Participation
71% Attributed to devolution, institutionalization of protection of human rights in the Constitution, protection of the marginalized, society’s level of inclusiveness & non-discrimination
Health 67% Increase in life expectancy; increased proportion of births in a health facilities; improved sanitation & increasing number of children who were not stunted
Labour Force Participation
64% Positive dimension of economic engagement i.e. either employed or in education or in training and not in vulnerable employment. 35
The national Equality and Inclusion Index was estimated at 58.9 per cent

Equality and inclusion indexIndex Note
Education 61% 25 % of the population have at least secondary education, national average years of schooling at 8.2 years
Development 44% Households are non-poor, have access to electricity & improved water, & paved roads
Gender Equality indices
38% reproductive health, empowerment and economic participation
36
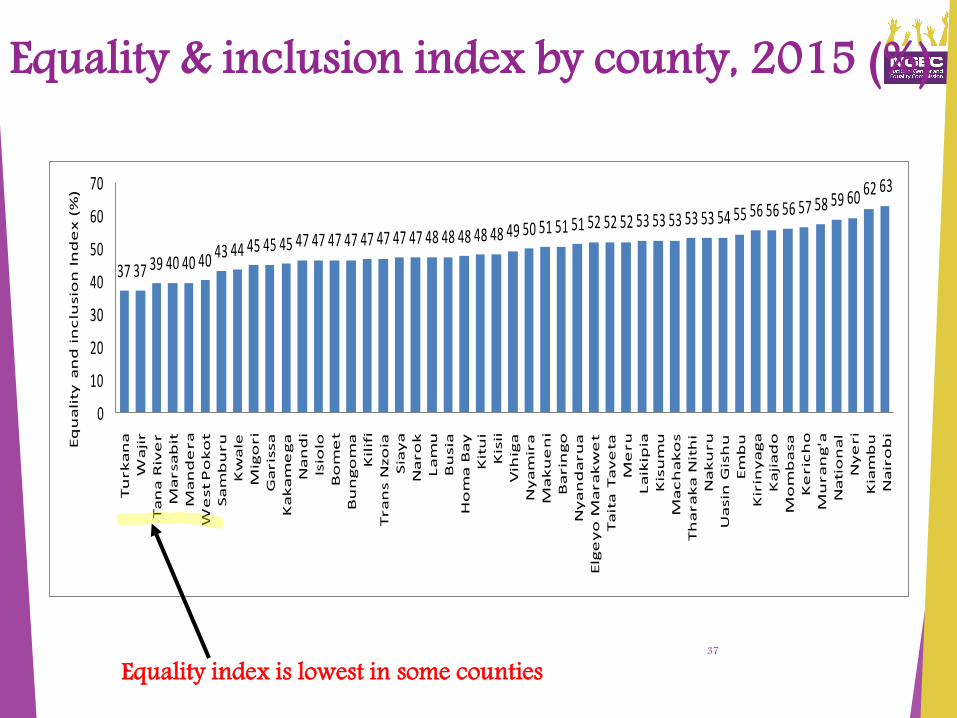
Equality & inclusion index by county, 2015 (%)
37
37 37 39 40 40 40 43 44 45 45 45 47 47 47 47 47 47 47 47 48 48 48 48 48 49 50 51 51 51 52 52 52 53 53 53 53 53 54 55 56 56 56 57 58 59 60 62 63
0
10
20
30
40
50
60
70
Tu
rk
an
a
Wa
jir
Ta
na
Riv
er
Ma
rsa
bit
Ma
nd
era
We
st
Po
ko
t
Sa
mb
uru
Kw
ale
Mig
ori
Ga
ris
sa
Ka
ka
me
ga
Na
nd
i
Isio
lo
Bo
me
t
Bu
ng
om
a
Kil
ifi
Tra
ns N
zo
ia
Sia
ya
Na
ro
k
La
mu
Bu
sia
Ho
ma
Ba
y
Kit
ui
Kis
ii
Vih
iga
Ny
am
ira
Ma
ku
en
i
Ba
rin
go
Ny
an
da
ru
a
Elg
ey
o M
ara
kw
et
Ta
ita
Ta
ve
ta
Me
ru
La
ikip
ia
Kis
um
u
Ma
ch
ak
os
Th
ara
ka
Nit
hi
Na
ku
ru
Ua
sin
Gis
hu
Em
bu
Kir
iny
ag
a
Ka
jia
do
Mo
mb
asa
Ke
ric
ho
Mu
ra
ng
'a
Na
tio
na
l
Ny
eri
Kia
mb
u
Na
iro
bi
Eq
ua
lity
an
d i
nc
lusio
n I
nd
ex
(%
)
Equality index is lowest in some counties

Recommendations: Education County and national governments and the relevant stakeholders
should ensure the integration of practical tools to supporteducation and training programmes to address equitable access,retention and transition for SIGs
Education and training should be made relevant by undertakingmajor curricula reviews, preceded by research and needsassessment.
Redesign teacher education curriculum and training programmesto prepare teachers implementing the new curricula; needs basedfunding, and budgeting for special interest groups.
Training on disability mainstreaming Ensuring a safe and conducive environment targeting SIGs.
Government to operationalize the Nomadic Education PolicyFramework
38

Labour Out of school children – address cost of attending school
and cost of living
Child labour – enforce laws and enhance use of socialprotection programmes
Youth – second chance education programmes; furtherinvestments in productive sectors across all counties
Women – enforce family friendly policies (maternity leave)
PWDs – remove access barriers to education; expandspecialized units in schools & enhance their quality; invest inteacher training especially at secondary & tertiary education;enforce compliance with constitutional requirements
Public Sector – establish measurable goals within Ministries, Departments Agencies that relate to equality and inclusion in employment
39

Political representation Progress has been made on equality and inclusion since the
Constitution was promulgated in 2010 Parliament to legislate framework for inclusion of women
and other marginalized groups in political representation as is envisaged in the Constitution
Invest in countrywide profiling of the SIGs and monitoring IEBC to facilitate use of assistive devices such as Braille and
sign language to support PWDs during electioneering and election period
Mentorship programmes for the youth and PWDs
40

Social Protection Progressively increased investments in Social
Protection sector to at least 4.5 % of GDP as recommended by the AU
Monitor investments in social protection sector Review and fully implement the Social Assistance Act,
2013 Fast truck the process of developing the Social
Protection and Coordination Bill 2016 Like all other social sectors (education and health),
financing and legislative frameworks in Social Protection Sector should be prioritized with similar magnitude .
41

Social protection cont’d
NHIF and NSSF should target to increase membership especially for those working in the informal sector
Both county and national governments should develop milestones for the progressive realization of rights of the SIGs as enshrined in the Constitution and SDGs.
Review and re-design the youth empowerment programme to benefit the target group.
Address the risks and vulnerabilities across the life cycle (childhood, youth, working-age population, older persons)
42
Thank You43