Embed Size (px)
Citation preview
38
Orissa Review * October - 2009
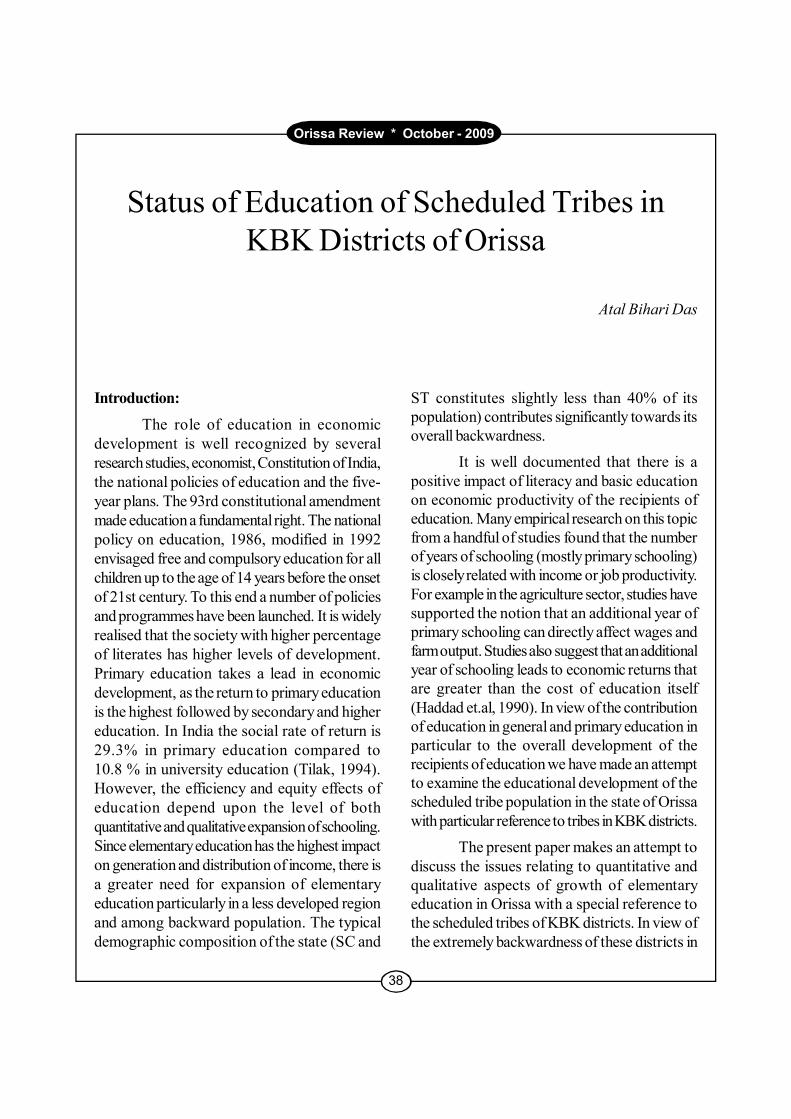
Introduction:
The role of education in economicdevelopment is well recognized by severalresearch studies, economist, Constitution of India,the national policies of education and the five-year plans. The 93rd constitutional amendmentmade education a fundamental right. The nationalpolicy on education, 1986, modified in 1992envisaged free and compulsory education for allchildren up to the age of 14 years before the onsetof 21st century. To this end a number of policiesand programmes have been launched. It is widelyrealised that the society with higher percentageof literates has higher levels of development.Primary education takes a lead in economicdevelopment, as the return to primary educationis the highest followed by secondary and highereducation. In India the social rate of return is29.3% in primary education compared to10.8 % in university education (Tilak, 1994).However, the efficiency and equity effects ofeducation depend upon the level of bothquantitative and qualitative expansion of schooling.Since elementary education has the highest impacton generation and distribution of income, there isa greater need for expansion of elementaryeducation particularly in a less developed regionand among backward population. The typicaldemographic composition of the state (SC and
Status of Education of Scheduled Tribes inKBK Districts of Orissa
Atal Bihari Das
ST constitutes slightly less than 40% of itspopulation) contributes significantly towards itsoverall backwardness.
It is well documented that there is apositive impact of literacy and basic educationon economic productivity of the recipients ofeducation. Many empirical research on this topicfrom a handful of studies found that the numberof years of schooling (mostly primary schooling)is closely related with income or job productivity.For example in the agriculture sector, studies havesupported the notion that an additional year ofprimary schooling can directly affect wages andfarm output. Studies also suggest that an additionalyear of schooling leads to economic returns thatare greater than the cost of education itself(Haddad et.al, 1990). In view of the contributionof education in general and primary education inparticular to the overall development of therecipients of education we have made an attemptto examine the educational development of thescheduled tribe population in the state of Orissawith particular reference to tribes in KBK districts.
The present paper makes an attempt todiscuss the issues relating to quantitative andqualitative aspects of growth of elementaryeducation in Orissa with a special reference tothe scheduled tribes of KBK districts. In view ofthe extremely backwardness of these districts in
Orissa Review * October - 2009
39
respect of almost all the developmental indicators,Government has made the districts a special groupi.e KBK in order to putting more efforts formainstreaming them in developmental process.KBK districts constitute 8 districts with more thanone third of their population being scheduledtribes. The incidence of illiteracy among scheduledtribes in these districts is about 62 per cent andthis is more pronounced among the females andin rural areas. The female literacy is found to beas low as 7.5 per cent in 2001 census among thescheduled tribes in one of the KBK districts(Malkanagiri). All these together show a gloomypicture of educational development in KBKdistricts of the state.
Status of Education of Scheduled Tribes ofKBK Districts in Orissa
Literacy rate
Overall literacy rate:
Literacy is considered as one of thecrucial indictors of education. There is a significantdifference between a literate and an illiterateperson in respect of overall attitude of theconcerned individuals. The overall literacy rate inOrissa has increased by about 15 percent,between 1991 and 2001 from 49.09 to 63.61percent.
District-wise analysis of literacy rateindicates that as per 2001 census, the overall
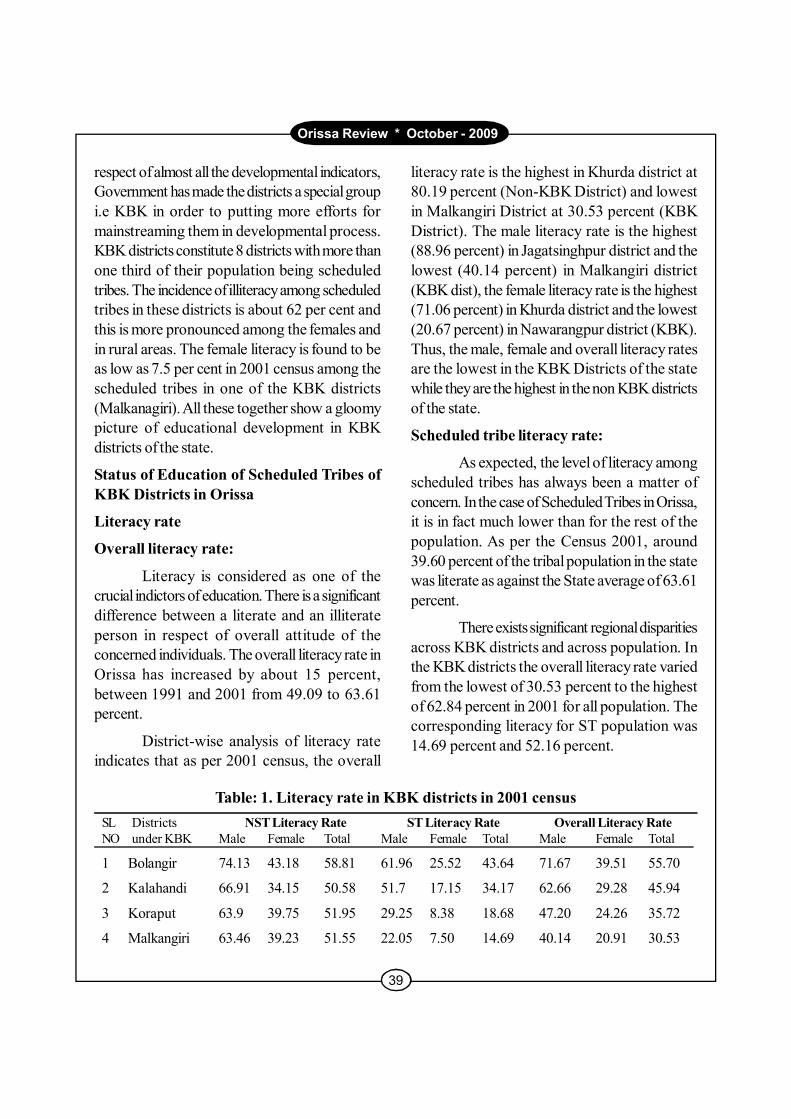
literacy rate is the highest in Khurda district at80.19 percent (Non-KBK District) and lowestin Malkangiri District at 30.53 percent (KBKDistrict). The male literacy rate is the highest(88.96 percent) in Jagatsinghpur district and thelowest (40.14 percent) in Malkangiri district(KBK dist), the female literacy rate is the highest(71.06 percent) in Khurda district and the lowest(20.67 percent) in Nawarangpur district (KBK).Thus, the male, female and overall literacy ratesare the lowest in the KBK Districts of the statewhile they are the highest in the non KBK districtsof the state.
Scheduled tribe literacy rate:
As expected, the level of literacy amongscheduled tribes has always been a matter ofconcern. In the case of Scheduled Tribes in Orissa,it is in fact much lower than for the rest of thepopulation. As per the Census 2001, around39.60 percent of the tribal population in the statewas literate as against the State average of 63.61percent.
There exists significant regional disparitiesacross KBK districts and across population. Inthe KBK districts the overall literacy rate variedfrom the lowest of 30.53 percent to the highestof 62.84 percent in 2001 for all population. Thecorresponding literacy for ST population was14.69 percent and 52.16 percent.
Table: 1. Literacy rate in KBK districts in 2001 censusSL Districts NST Literacy Rate ST Literacy Rate Overall Literacy RateNO under KBK Male Female Total Male Female Total Male Female Total
1 Bolangir 74.13 43.18 58.81 61.96 25.52 43.64 71.67 39.51 55.70
2 Kalahandi 66.91 34.15 50.58 51.7 17.15 34.17 62.66 29.28 45.94
3 Koraput 63.9 39.75 51.95 29.25 8.38 18.68 47.20 24.26 35.72
4 Malkangiri 63.46 39.23 51.55 22.05 7.50 14.69 40.14 20.91 30.53
40
Orissa Review * October - 2009
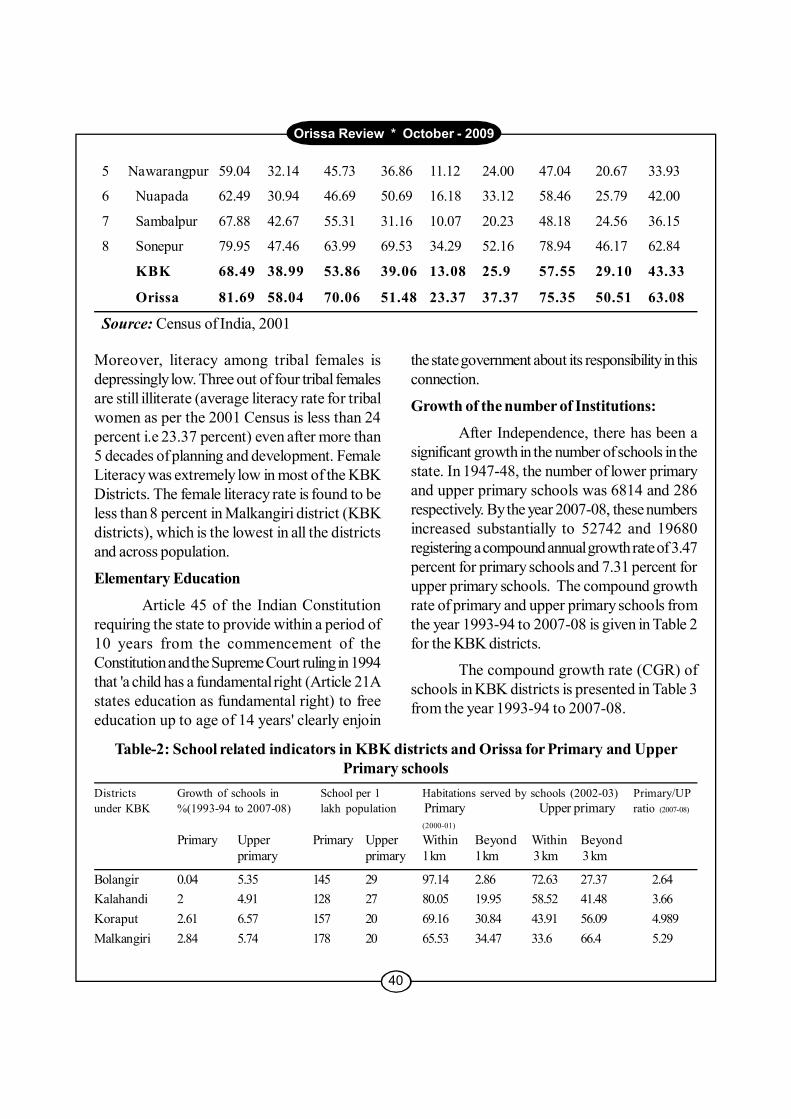
5 Nawarangpur 59.04 32.14 45.73 36.86 11.12 24.00 47.04 20.67 33.93
6 Nuapada 62.49 30.94 46.69 50.69 16.18 33.12 58.46 25.79 42.00
7 Sambalpur 67.88 42.67 55.31 31.16 10.07 20.23 48.18 24.56 36.15
8 Sonepur 79.95 47.46 63.99 69.53 34.29 52.16 78.94 46.17 62.84
KBK 68.49 38.99 53.86 39.06 13.08 25.9 57.55 29.10 43.33
Orissa 81.69 58.04 70.06 51.48 23.37 37.37 75.35 50.51 63.08
Source: Census of India, 2001
Table-2: School related indicators in KBK districts and Orissa for Primary and UpperPrimary schools
Districts Growth of schools in School per 1 Habitations served by schools (2002-03) Primary/UPunder KBK %(1993-94 to 2007-08) lakh population Primary Upper primary ratio (2007-08)
(2000-01)
Primary Upper Primary Upper Within Beyond Within Beyondprimary primary 1 km 1 km 3 km 3 km
Bolangir 0.04 5.35 145 29 97.14 2.86 72.63 27.37 2.64Kalahandi 2 4.91 128 27 80.05 19.95 58.52 41.48 3.66Koraput 2.61 6.57 157 20 69.16 30.84 43.91 56.09 4.989Malkangiri 2.84 5.74 178 20 65.53 34.47 33.6 66.4 5.29
Moreover, literacy among tribal females isdepressingly low. Three out of four tribal femalesare still illiterate (average literacy rate for tribalwomen as per the 2001 Census is less than 24percent i.e 23.37 percent) even after more than5 decades of planning and development. FemaleLiteracy was extremely low in most of the KBKDistricts. The female literacy rate is found to beless than 8 percent in Malkangiri district (KBKdistricts), which is the lowest in all the districtsand across population.
Elementary Education
Article 45 of the Indian Constitutionrequiring the state to provide within a period of10 years from the commencement of theConstitution and the Supreme Court ruling in 1994that 'a child has a fundamental right (Article 21Astates education as fundamental right) to freeeducation up to age of 14 years' clearly enjoin
the state government about its responsibility in thisconnection.
Growth of the number of Institutions:
After Independence, there has been asignificant growth in the number of schools in thestate. In 1947-48, the number of lower primaryand upper primary schools was 6814 and 286respectively. By the year 2007-08, these numbersincreased substantially to 52742 and 19680registering a compound annual growth rate of 3.47percent for primary schools and 7.31 percent forupper primary schools. The compound growthrate of primary and upper primary schools fromthe year 1993-94 to 2007-08 is given in Table 2for the KBK districts.
The compound growth rate (CGR) ofschools in KBK districts is presented in Table 3from the year 1993-94 to 2007-08.
Orissa Review * October - 2009
41
Nabarangpur 1.75 6.59 122 20 80.03 19.97 56.67 43.33 4.45
Nuapada 4.91 5.92 138 31 79.1 20.9 59.83 40.17 3.27
Rayagada 3.91 6.92 178.2 22 66.05 33.95 30.3 69.7 4.993
Sonepur 1.66 4.99 140 32 93.58 6.42 78.87 21.13 2.36
KBK 2.25 5.77 146 25 77.09 22.91 51.6 48.4 3.82
ORISSA 1.71 4.3 114 27 82.93 17.07 73.55 26.45 2.68
Source: Directorate of Elementary Education, Directorate of Economics and Statistics, Orissa andSeventh All India Survey (2002), New Delhi.
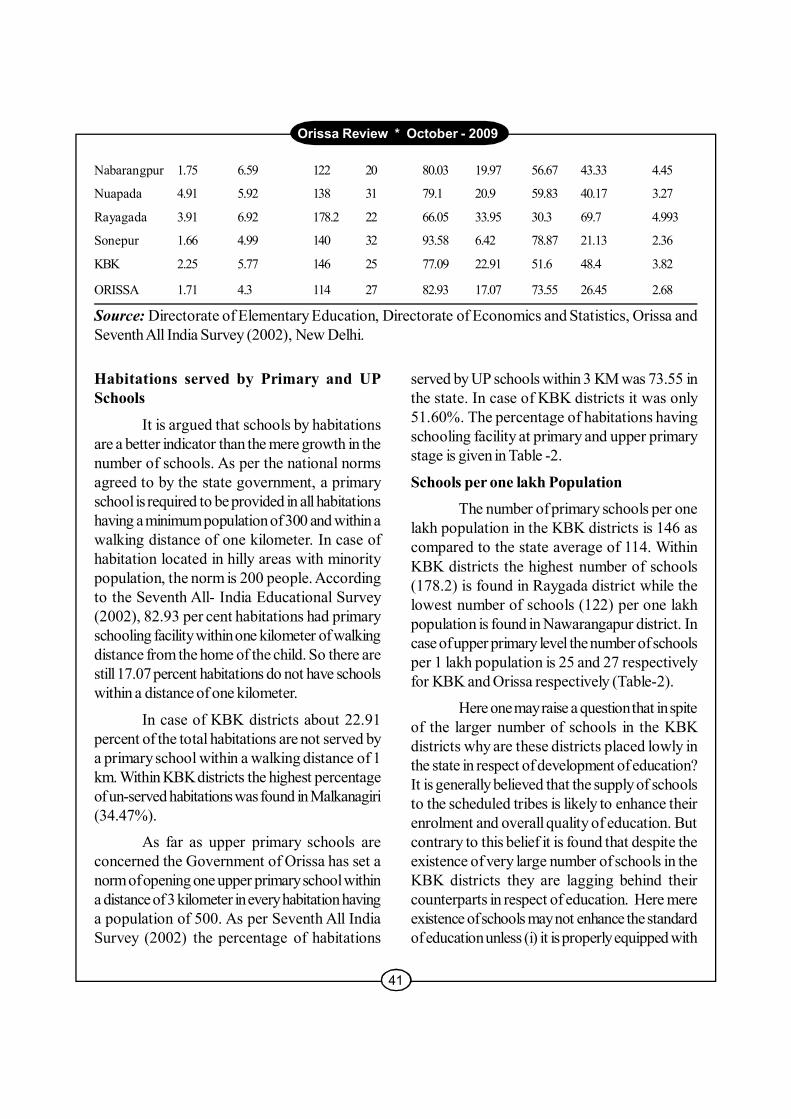
Habitations served by Primary and UPSchools
It is argued that schools by habitationsare a better indicator than the mere growth in thenumber of schools. As per the national normsagreed to by the state government, a primaryschool is required to be provided in all habitationshaving a minimum population of 300 and within awalking distance of one kilometer. In case ofhabitation located in hilly areas with minoritypopulation, the norm is 200 people. Accordingto the Seventh All- India Educational Survey(2002), 82.93 per cent habitations had primaryschooling facility within one kilometer of walkingdistance from the home of the child. So there arestill 17.07 percent habitations do not have schoolswithin a distance of one kilometer.
In case of KBK districts about 22.91percent of the total habitations are not served bya primary school within a walking distance of 1km. Within KBK districts the highest percentageof un-served habitations was found in Malkanagiri(34.47%).
As far as upper primary schools areconcerned the Government of Orissa has set anorm of opening one upper primary school withina distance of 3 kilometer in every habitation havinga population of 500. As per Seventh All IndiaSurvey (2002) the percentage of habitations
served by UP schools within 3 KM was 73.55 inthe state. In case of KBK districts it was only51.60%. The percentage of habitations havingschooling facility at primary and upper primarystage is given in Table -2.
Schools per one lakh Population
The number of primary schools per onelakh population in the KBK districts is 146 ascompared to the state average of 114. WithinKBK districts the highest number of schools(178.2) is found in Raygada district while thelowest number of schools (122) per one lakhpopulation is found in Nawarangapur district. Incase of upper primary level the number of schoolsper 1 lakh population is 25 and 27 respectivelyfor KBK and Orissa respectively (Table-2).
Here one may raise a question that in spiteof the larger number of schools in the KBKdistricts why are these districts placed lowly inthe state in respect of development of education?It is generally believed that the supply of schoolsto the scheduled tribes is likely to enhance theirenrolment and overall quality of education. Butcontrary to this belief it is found that despite theexistence of very large number of schools in theKBK districts they are lagging behind theircounterparts in respect of education. Here mereexistence of schools may not enhance the standardof education unless (i) it is properly equipped with
42
Orissa Review * October - 2009
the teaching and other inputs and (ii) the childrenshould come and attend the school. It is noticedthat in the remote tribal areas the teacherabsenteeism is a regular phenomena and thisaffects largely the quality of education and regularattendance of ST children. Lack of basicinfrastructure (roads, electricity and othercommunications) in the area as well as in theschools also is responsible for poor attendancein the schools by the teachers and students. Mostof these schools have become dysfunctional intribal areas.
Ratio of Primary to Upper Primary Schools
Government has fixed a norm that thereneeds to be one upper primary school for everytwo primary schools. Such ratio calculated for2007-08 reveals that there is one upper primaryschool for 2.68 primary schools for the state. InKBK districts the ratio of primary to upperprimary schools in the year 2007-08 is 3.82.From Table-2 it is observed that across KBKdistricts it is noticed that Malkangiri (5.29) hasthe highest ratio followed by Rayagada (4.993)and Koraput (4.989).
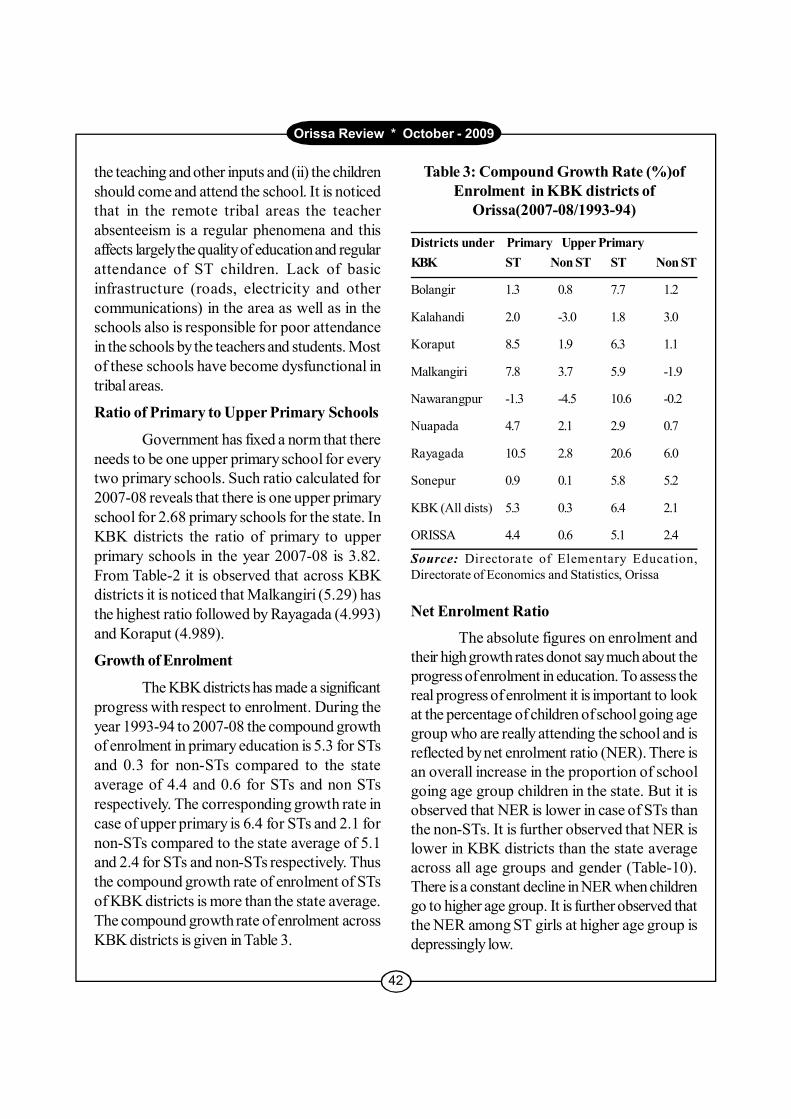
Growth of Enrolment
The KBK districts has made a significantprogress with respect to enrolment. During theyear 1993-94 to 2007-08 the compound growthof enrolment in primary education is 5.3 for STsand 0.3 for non-STs compared to the stateaverage of 4.4 and 0.6 for STs and non STsrespectively. The corresponding growth rate incase of upper primary is 6.4 for STs and 2.1 fornon-STs compared to the state average of 5.1and 2.4 for STs and non-STs respectively. Thusthe compound growth rate of enrolment of STsof KBK districts is more than the state average.The compound growth rate of enrolment acrossKBK districts is given in Table 3.
Table 3: Compound Growth Rate (%)ofEnrolment in KBK districts of
Orissa(2007-08/1993-94)
Districts under Primary Upper PrimaryKBK ST Non ST ST Non ST
Bolangir 1.3 0.8 7.7 1.2
Kalahandi 2.0 -3.0 1.8 3.0
Koraput 8.5 1.9 6.3 1.1
Malkangiri 7.8 3.7 5.9 -1.9
Nawarangpur -1.3 -4.5 10.6 -0.2
Nuapada 4.7 2.1 2.9 0.7
Rayagada 10.5 2.8 20.6 6.0
Sonepur 0.9 0.1 5.8 5.2
KBK (All dists) 5.3 0.3 6.4 2.1
ORISSA 4.4 0.6 5.1 2.4
Source: Directorate of Elementary Education,Directorate of Economics and Statistics, Orissa
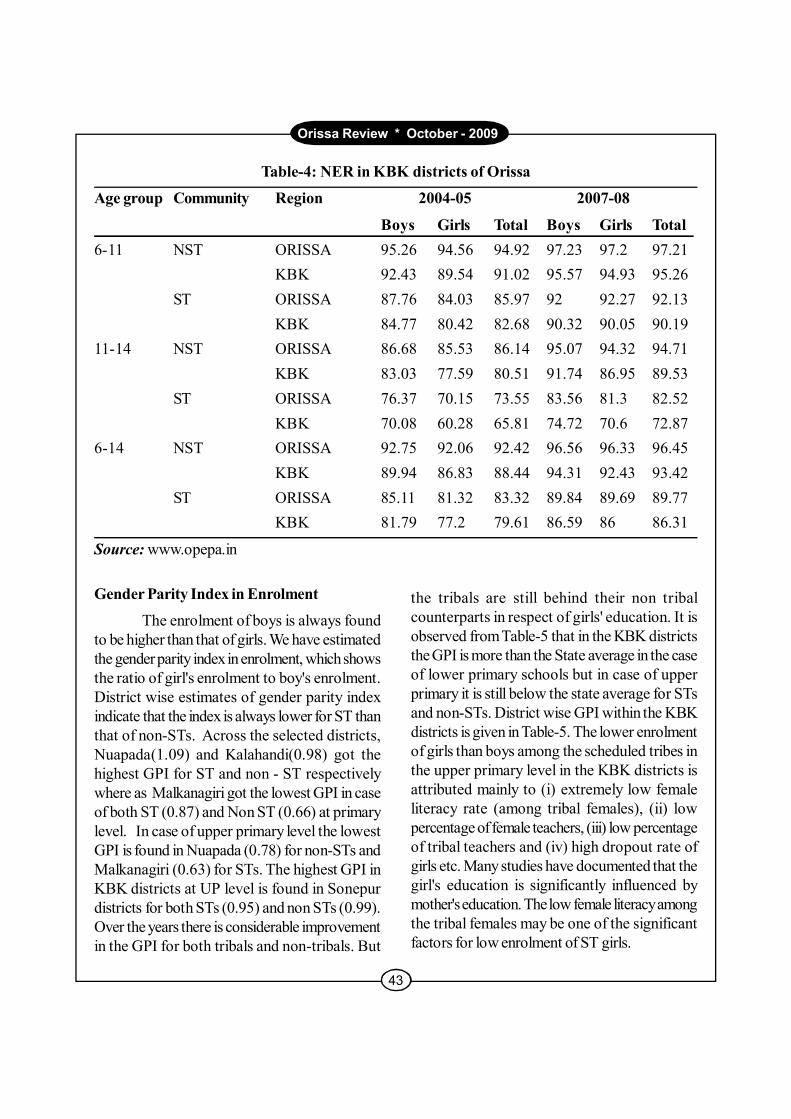
Net Enrolment Ratio
The absolute figures on enrolment andtheir high growth rates donot say much about theprogress of enrolment in education. To assess thereal progress of enrolment it is important to lookat the percentage of children of school going agegroup who are really attending the school and isreflected by net enrolment ratio (NER). There isan overall increase in the proportion of schoolgoing age group children in the state. But it isobserved that NER is lower in case of STs thanthe non-STs. It is further observed that NER islower in KBK districts than the state averageacross all age groups and gender (Table-10).There is a constant decline in NER when childrengo to higher age group. It is further observed thatthe NER among ST girls at higher age group isdepressingly low.
Orissa Review * October - 2009
43
Table-4: NER in KBK districts of Orissa
Age group Community Region 2004-05 2007-08
Boys Girls Total Boys Girls Total6-11 NST ORISSA 95.26 94.56 94.92 97.23 97.2 97.21
KBK 92.43 89.54 91.02 95.57 94.93 95.26ST ORISSA 87.76 84.03 85.97 92 92.27 92.13
KBK 84.77 80.42 82.68 90.32 90.05 90.1911-14 NST ORISSA 86.68 85.53 86.14 95.07 94.32 94.71
KBK 83.03 77.59 80.51 91.74 86.95 89.53ST ORISSA 76.37 70.15 73.55 83.56 81.3 82.52
KBK 70.08 60.28 65.81 74.72 70.6 72.876-14 NST ORISSA 92.75 92.06 92.42 96.56 96.33 96.45
KBK 89.94 86.83 88.44 94.31 92.43 93.42ST ORISSA 85.11 81.32 83.32 89.84 89.69 89.77
KBK 81.79 77.2 79.61 86.59 86 86.31
Source: www.opepa.in
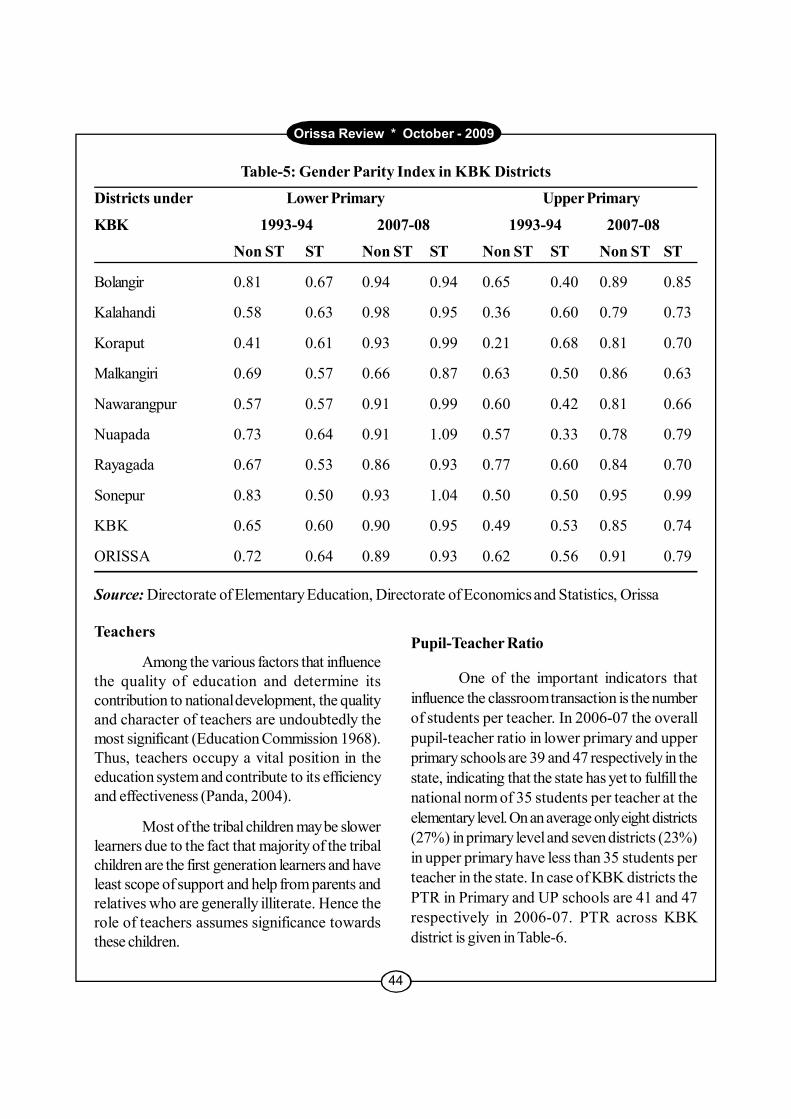
Gender Parity Index in Enrolment
The enrolment of boys is always foundto be higher than that of girls. We have estimatedthe gender parity index in enrolment, which showsthe ratio of girl's enrolment to boy's enrolment.District wise estimates of gender parity indexindicate that the index is always lower for ST thanthat of non-STs. Across the selected districts,Nuapada(1.09) and Kalahandi(0.98) got thehighest GPI for ST and non - ST respectivelywhere as Malkanagiri got the lowest GPI in caseof both ST (0.87) and Non ST (0.66) at primarylevel. In case of upper primary level the lowestGPI is found in Nuapada (0.78) for non-STs andMalkanagiri (0.63) for STs. The highest GPI inKBK districts at UP level is found in Sonepurdistricts for both STs (0.95) and non STs (0.99).Over the years there is considerable improvementin the GPI for both tribals and non-tribals. But
the tribals are still behind their non tribalcounterparts in respect of girls' education. It isobserved from Table-5 that in the KBK districtsthe GPI is more than the State average in the caseof lower primary schools but in case of upperprimary it is still below the state average for STsand non-STs. District wise GPI within the KBKdistricts is given in Table-5. The lower enrolmentof girls than boys among the scheduled tribes inthe upper primary level in the KBK districts isattributed mainly to (i) extremely low femaleliteracy rate (among tribal females), (ii) lowpercentage of female teachers, (iii) low percentageof tribal teachers and (iv) high dropout rate ofgirls etc. Many studies have documented that thegirl's education is significantly influenced bymother's education. The low female literacy amongthe tribal females may be one of the significantfactors for low enrolment of ST girls.
44
Orissa Review * October - 2009
Table-5: Gender Parity Index in KBK Districts
Districts under Lower Primary Upper Primary
KBK 1993-94 2007-08 1993-94 2007-08
Non ST ST Non ST ST Non ST ST Non ST ST
Bolangir 0.81 0.67 0.94 0.94 0.65 0.40 0.89 0.85
Kalahandi 0.58 0.63 0.98 0.95 0.36 0.60 0.79 0.73
Koraput 0.41 0.61 0.93 0.99 0.21 0.68 0.81 0.70
Malkangiri 0.69 0.57 0.66 0.87 0.63 0.50 0.86 0.63
Nawarangpur 0.57 0.57 0.91 0.99 0.60 0.42 0.81 0.66
Nuapada 0.73 0.64 0.91 1.09 0.57 0.33 0.78 0.79
Rayagada 0.67 0.53 0.86 0.93 0.77 0.60 0.84 0.70
Sonepur 0.83 0.50 0.93 1.04 0.50 0.50 0.95 0.99
KBK 0.65 0.60 0.90 0.95 0.49 0.53 0.85 0.74
ORISSA 0.72 0.64 0.89 0.93 0.62 0.56 0.91 0.79
Source: Directorate of Elementary Education, Directorate of Economics and Statistics, Orissa
Teachers
Among the various factors that influencethe quality of education and determine itscontribution to national development, the qualityand character of teachers are undoubtedly themost significant (Education Commission 1968).Thus, teachers occupy a vital position in theeducation system and contribute to its efficiencyand effectiveness (Panda, 2004).
Most of the tribal children may be slowerlearners due to the fact that majority of the tribalchildren are the first generation learners and haveleast scope of support and help from parents andrelatives who are generally illiterate. Hence therole of teachers assumes significance towardsthese children.
Pupil-Teacher Ratio
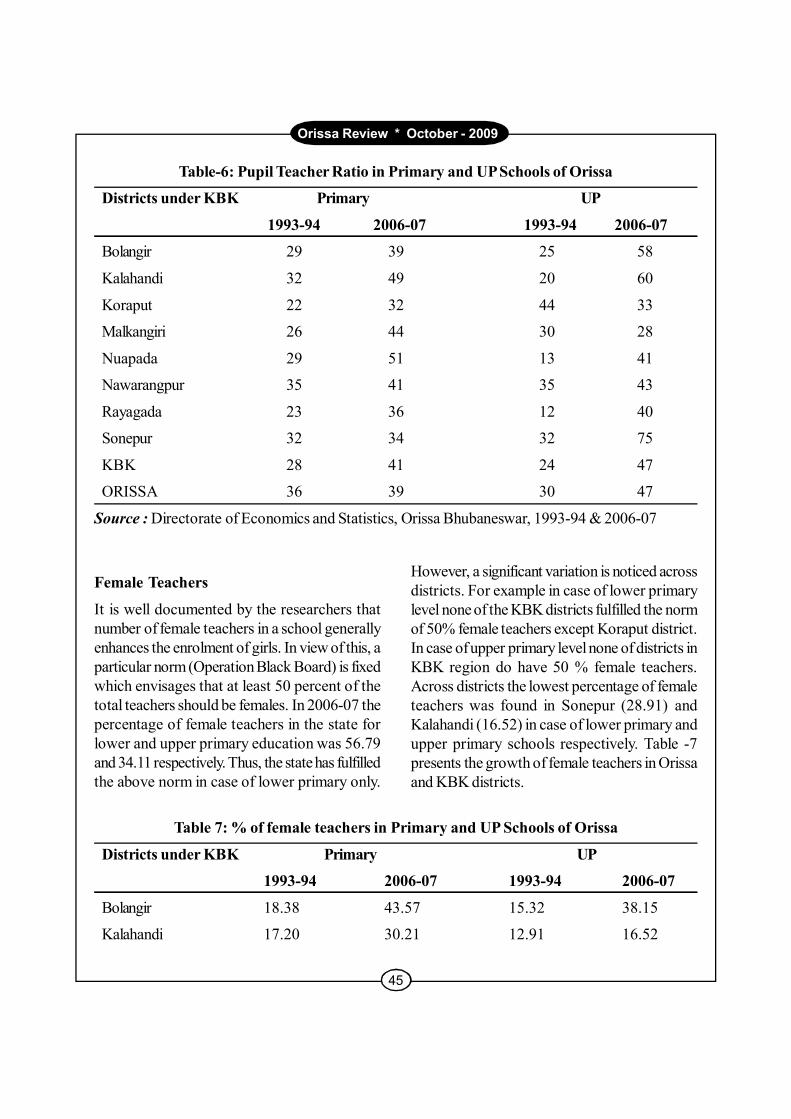
One of the important indicators thatinfluence the classroom transaction is the numberof students per teacher. In 2006-07 the overallpupil-teacher ratio in lower primary and upperprimary schools are 39 and 47 respectively in thestate, indicating that the state has yet to fulfill thenational norm of 35 students per teacher at theelementary level. On an average only eight districts(27%) in primary level and seven districts (23%)in upper primary have less than 35 students perteacher in the state. In case of KBK districts thePTR in Primary and UP schools are 41 and 47respectively in 2006-07. PTR across KBKdistrict is given in Table-6.
Orissa Review * October - 2009
45
Table-6: Pupil Teacher Ratio in Primary and UP Schools of Orissa
Districts under KBK Primary UP
1993-94 2006-07 1993-94 2006-07
Bolangir 29 39 25 58
Kalahandi 32 49 20 60
Koraput 22 32 44 33
Malkangiri 26 44 30 28
Nuapada 29 51 13 41
Nawarangpur 35 41 35 43
Rayagada 23 36 12 40
Sonepur 32 34 32 75
KBK 28 41 24 47
ORISSA 36 39 30 47
Source : Directorate of Economics and Statistics, Orissa Bhubaneswar, 1993-94 & 2006-07
However, a significant variation is noticed acrossdistricts. For example in case of lower primarylevel none of the KBK districts fulfilled the normof 50% female teachers except Koraput district.In case of upper primary level none of districts inKBK region do have 50 % female teachers.Across districts the lowest percentage of femaleteachers was found in Sonepur (28.91) andKalahandi (16.52) in case of lower primary andupper primary schools respectively. Table -7presents the growth of female teachers in Orissaand KBK districts.
Female Teachers
It is well documented by the researchers thatnumber of female teachers in a school generallyenhances the enrolment of girls. In view of this, aparticular norm (Operation Black Board) is fixedwhich envisages that at least 50 percent of thetotal teachers should be females. In 2006-07 thepercentage of female teachers in the state forlower and upper primary education was 56.79and 34.11 respectively. Thus, the state has fulfilledthe above norm in case of lower primary only.
Table 7: % of female teachers in Primary and UP Schools of Orissa
Districts under KBK Primary UP
1993-94 2006-07 1993-94 2006-07
Bolangir 18.38 43.57 15.32 38.15
Kalahandi 17.20 30.21 12.91 16.52
46
Orissa Review * October - 2009
Koraput 36.31 55.12 22.92 42.82
Malkangiri 17.19 34.58 19.91 29.92
Nawarangapur 36.68 37.30 16.83 33.44
Nuapada 19.07 34.35 6.68 16.80
Rayagada 32.98 31.91 14.43 27.33
Sonepur 12.00 28.91 10.00 18.77
KBK 23.80 37.78 14.79 28.37
ORISSA 33.72 56.79 16.92 34.11
Source: Directorate of Elementary Education, Directorate of Economics and Statistics, Orissa
Schools without Female Teachers :
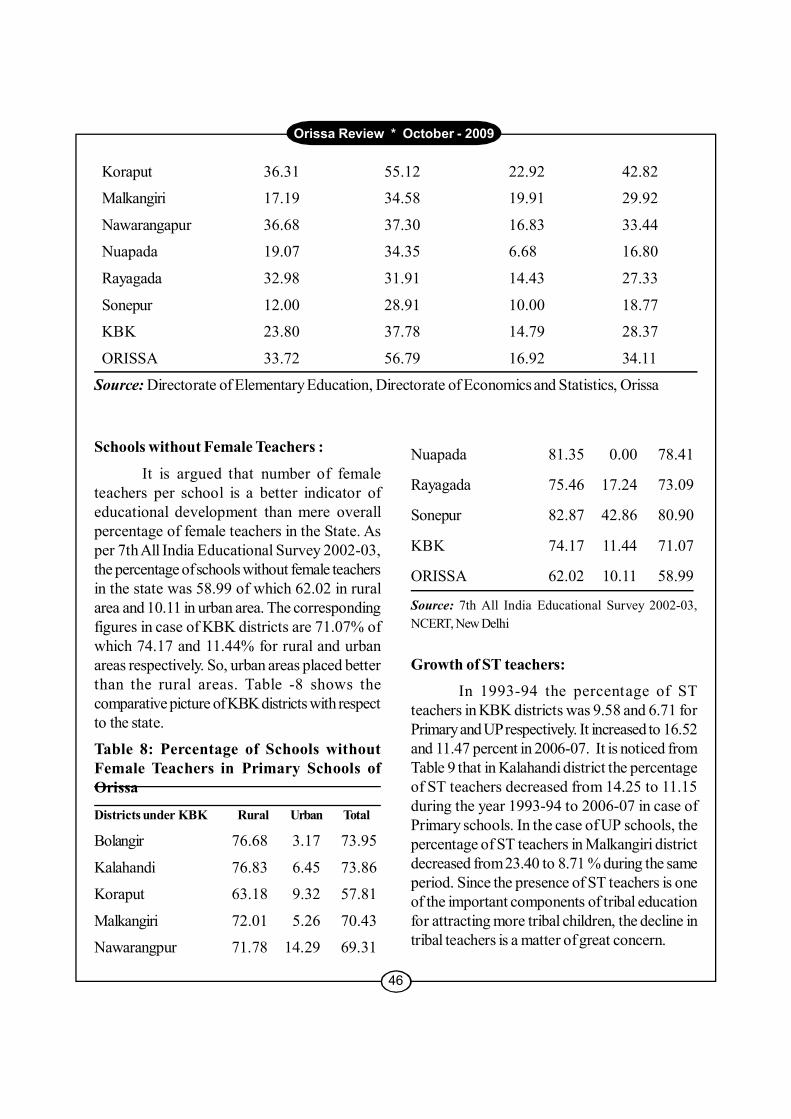
It is argued that number of femaleteachers per school is a better indicator ofeducational development than mere overallpercentage of female teachers in the State. Asper 7th All India Educational Survey 2002-03,the percentage of schools without female teachersin the state was 58.99 of which 62.02 in ruralarea and 10.11 in urban area. The correspondingfigures in case of KBK districts are 71.07% ofwhich 74.17 and 11.44% for rural and urbanareas respectively. So, urban areas placed betterthan the rural areas. Table -8 shows thecomparative picture of KBK districts with respectto the state.
Table 8: Percentage of Schools withoutFemale Teachers in Primary Schools ofOrissa
Districts under KBK Rural Urban Total
Bolangir 76.68 3.17 73.95
Kalahandi 76.83 6.45 73.86
Koraput 63.18 9.32 57.81
Malkangiri 72.01 5.26 70.43
Nawarangpur 71.78 14.29 69.31
Nuapada 81.35 0.00 78.41
Rayagada 75.46 17.24 73.09
Sonepur 82.87 42.86 80.90
KBK 74.17 11.44 71.07
ORISSA 62.02 10.11 58.99
Source: 7th All India Educational Survey 2002-03,NCERT, New Delhi
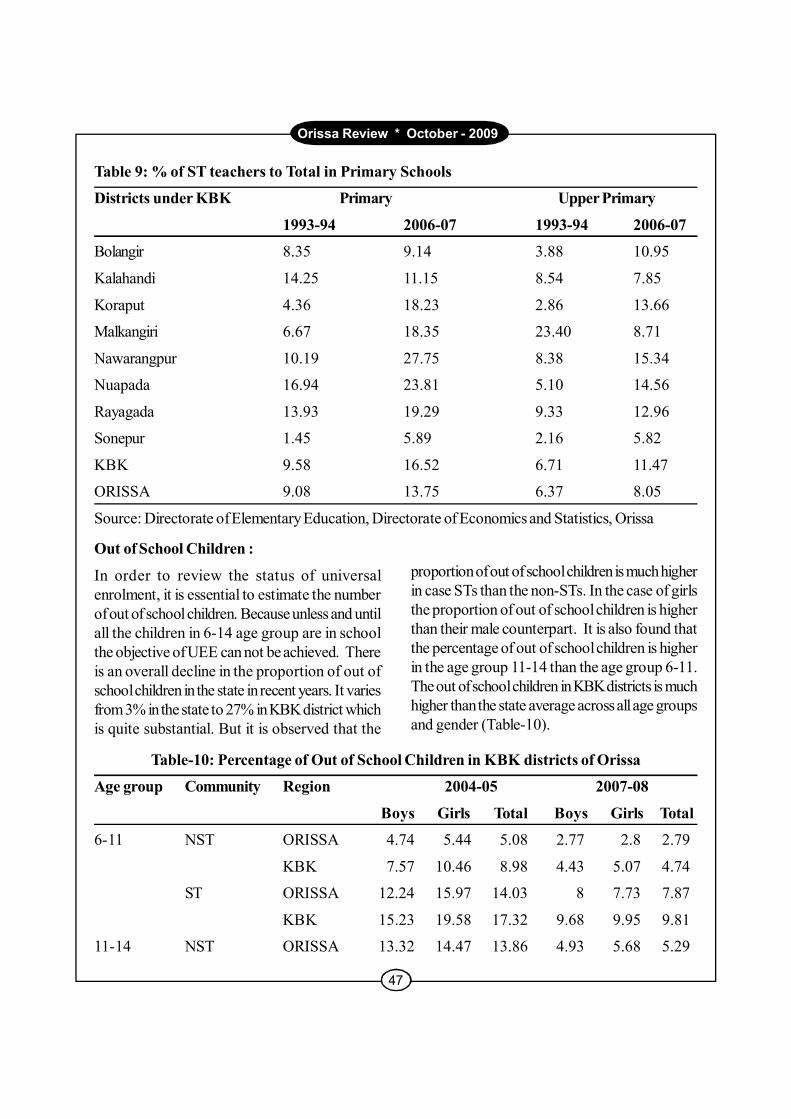
Growth of ST teachers:
In 1993-94 the percentage of STteachers in KBK districts was 9.58 and 6.71 forPrimary and UP respectively. It increased to 16.52and 11.47 percent in 2006-07. It is noticed fromTable 9 that in Kalahandi district the percentageof ST teachers decreased from 14.25 to 11.15during the year 1993-94 to 2006-07 in case ofPrimary schools. In the case of UP schools, thepercentage of ST teachers in Malkangiri districtdecreased from 23.40 to 8.71 % during the sameperiod. Since the presence of ST teachers is oneof the important components of tribal educationfor attracting more tribal children, the decline intribal teachers is a matter of great concern.
Orissa Review * October - 2009
47
Table 9: % of ST teachers to Total in Primary Schools
Districts under KBK Primary Upper Primary
1993-94 2006-07 1993-94 2006-07
Bolangir 8.35 9.14 3.88 10.95
Kalahandi 14.25 11.15 8.54 7.85
Koraput 4.36 18.23 2.86 13.66
Malkangiri 6.67 18.35 23.40 8.71
Nawarangpur 10.19 27.75 8.38 15.34
Nuapada 16.94 23.81 5.10 14.56
Rayagada 13.93 19.29 9.33 12.96
Sonepur 1.45 5.89 2.16 5.82
KBK 9.58 16.52 6.71 11.47
ORISSA 9.08 13.75 6.37 8.05
Source: Directorate of Elementary Education, Directorate of Economics and Statistics, Orissa
Out of School Children :
In order to review the status of universalenrolment, it is essential to estimate the numberof out of school children. Because unless and untilall the children in 6-14 age group are in schoolthe objective of UEE can not be achieved. Thereis an overall decline in the proportion of out ofschool children in the state in recent years. It variesfrom 3% in the state to 27% in KBK district whichis quite substantial. But it is observed that the
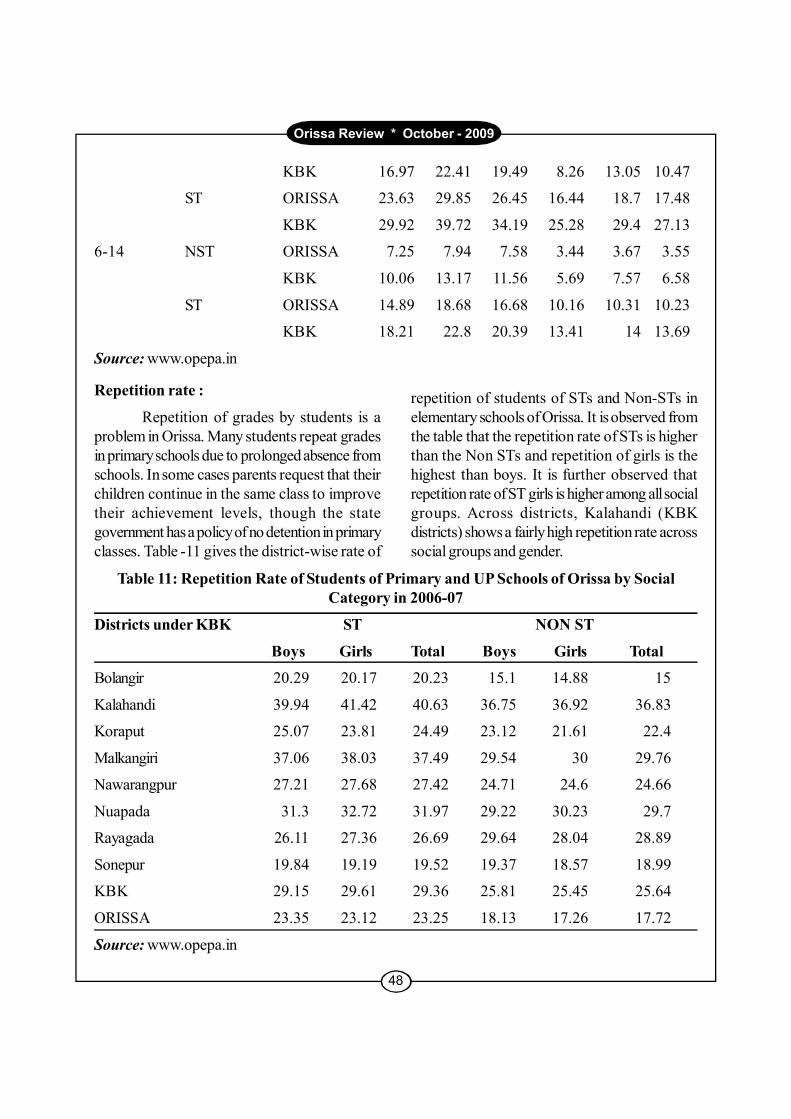
proportion of out of school children is much higherin case STs than the non-STs. In the case of girlsthe proportion of out of school children is higherthan their male counterpart. It is also found thatthe percentage of out of school children is higherin the age group 11-14 than the age group 6-11.The out of school children in KBK districts is muchhigher than the state average across all age groupsand gender (Table-10).
Table-10: Percentage of Out of School Children in KBK districts of Orissa
Age group Community Region 2004-05 2007-08
Boys Girls Total Boys Girls Total
6-11 NST ORISSA 4.74 5.44 5.08 2.77 2.8 2.79
KBK 7.57 10.46 8.98 4.43 5.07 4.74
ST ORISSA 12.24 15.97 14.03 8 7.73 7.87
KBK 15.23 19.58 17.32 9.68 9.95 9.81
11-14 NST ORISSA 13.32 14.47 13.86 4.93 5.68 5.29
48
Orissa Review * October - 2009
KBK 16.97 22.41 19.49 8.26 13.05 10.47
ST ORISSA 23.63 29.85 26.45 16.44 18.7 17.48
KBK 29.92 39.72 34.19 25.28 29.4 27.13
6-14 NST ORISSA 7.25 7.94 7.58 3.44 3.67 3.55
KBK 10.06 13.17 11.56 5.69 7.57 6.58
ST ORISSA 14.89 18.68 16.68 10.16 10.31 10.23
KBK 18.21 22.8 20.39 13.41 14 13.69
Source: www.opepa.in
Repetition rate :
Repetition of grades by students is aproblem in Orissa. Many students repeat gradesin primary schools due to prolonged absence fromschools. In some cases parents request that theirchildren continue in the same class to improvetheir achievement levels, though the stategovernment has a policy of no detention in primaryclasses. Table -11 gives the district-wise rate of
repetition of students of STs and Non-STs inelementary schools of Orissa. It is observed fromthe table that the repetition rate of STs is higherthan the Non STs and repetition of girls is thehighest than boys. It is further observed thatrepetition rate of ST girls is higher among all socialgroups. Across districts, Kalahandi (KBKdistricts) shows a fairly high repetition rate acrosssocial groups and gender.
Table 11: Repetition Rate of Students of Primary and UP Schools of Orissa by SocialCategory in 2006-07
Districts under KBK ST NON ST
Boys Girls Total Boys Girls Total
Bolangir 20.29 20.17 20.23 15.1 14.88 15
Kalahandi 39.94 41.42 40.63 36.75 36.92 36.83
Koraput 25.07 23.81 24.49 23.12 21.61 22.4
Malkangiri 37.06 38.03 37.49 29.54 30 29.76
Nawarangpur 27.21 27.68 27.42 24.71 24.6 24.66
Nuapada 31.3 32.72 31.97 29.22 30.23 29.7
Rayagada 26.11 27.36 26.69 29.64 28.04 28.89
Sonepur 19.84 19.19 19.52 19.37 18.57 18.99
KBK 29.15 29.61 29.36 25.81 25.45 25.64
ORISSA 23.35 23.12 23.25 18.13 17.26 17.72
Source: www.opepa.in
Orissa Review * October - 2009
49
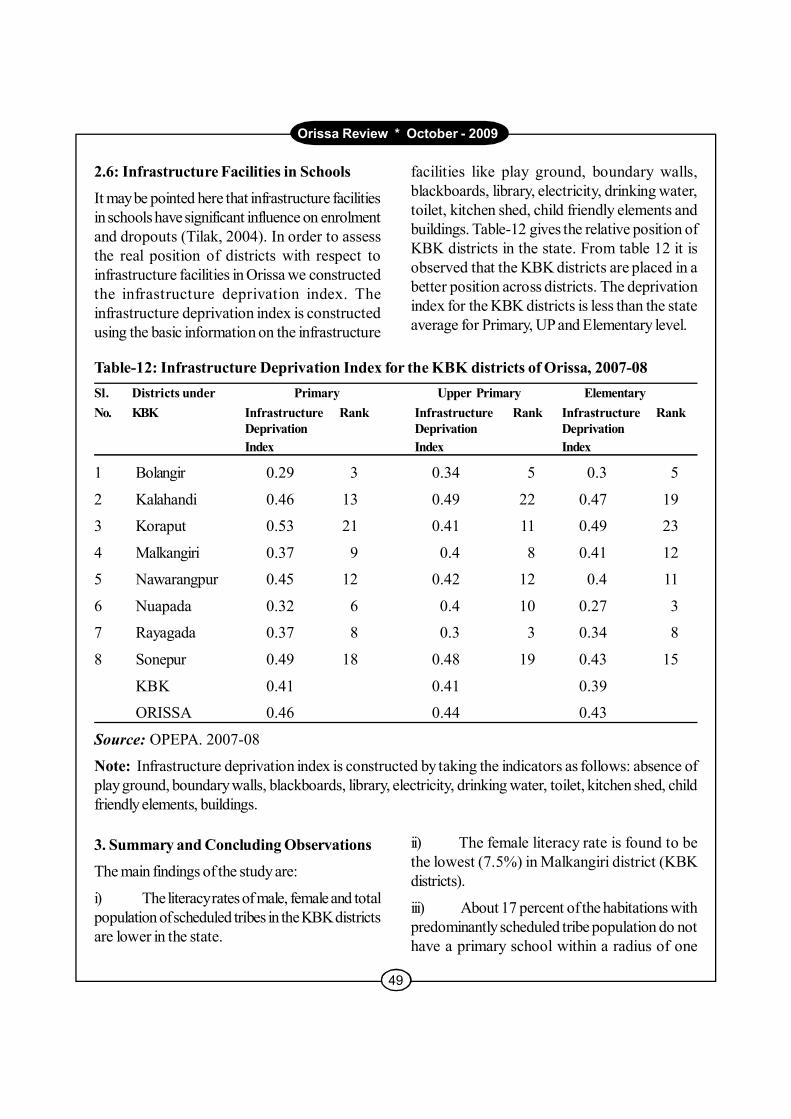
2.6: Infrastructure Facilities in Schools
It may be pointed here that infrastructure facilitiesin schools have significant influence on enrolmentand dropouts (Tilak, 2004). In order to assessthe real position of districts with respect toinfrastructure facilities in Orissa we constructedthe infrastructure deprivation index. Theinfrastructure deprivation index is constructedusing the basic information on the infrastructure
facilities like play ground, boundary walls,blackboards, library, electricity, drinking water,toilet, kitchen shed, child friendly elements andbuildings. Table-12 gives the relative position ofKBK districts in the state. From table 12 it isobserved that the KBK districts are placed in abetter position across districts. The deprivationindex for the KBK districts is less than the stateaverage for Primary, UP and Elementary level.
Table-12: Infrastructure Deprivation Index for the KBK districts of Orissa, 2007-08Sl. Districts under Primary Upper Primary ElementaryNo. KBK Infrastructure Rank Infrastructure Rank Infrastructure Rank
Deprivation Deprivation DeprivationIndex Index Index
1 Bolangir 0.29 3 0.34 5 0.3 5
2 Kalahandi 0.46 13 0.49 22 0.47 19
3 Koraput 0.53 21 0.41 11 0.49 23
4 Malkangiri 0.37 9 0.4 8 0.41 12
5 Nawarangpur 0.45 12 0.42 12 0.4 11
6 Nuapada 0.32 6 0.4 10 0.27 3
7 Rayagada 0.37 8 0.3 3 0.34 8
8 Sonepur 0.49 18 0.48 19 0.43 15
KBK 0.41 0.41 0.39
ORISSA 0.46 0.44 0.43
Source: OPEPA. 2007-08
Note: Infrastructure deprivation index is constructed by taking the indicators as follows: absence ofplay ground, boundary walls, blackboards, library, electricity, drinking water, toilet, kitchen shed, childfriendly elements, buildings.
3. Summary and Concluding Observations
The main findings of the study are:
i) The literacy rates of male, female and totalpopulation of scheduled tribes in the KBK districtsare lower in the state.
ii) The female literacy rate is found to bethe lowest (7.5%) in Malkangiri district (KBKdistricts).
iii) About 17 percent of the habitations withpredominantly scheduled tribe population do nothave a primary school within a radius of one
50
Orissa Review * October - 2009
kilometer. However the ratio of primary to upperprimary schools in KBK districts seems to meetthe required norm.
iv) The girls in primary schools are generallybehind the boys in respect of enrolment. Thepercentage of out of school is found to be highestin KBK districts in case of both STs and NSTs.
v) Some of the districts like Kalahandi,Bolangir and Sonepur have very high pupil teacherratio which is likely to affect the quality in classroom teaching. The percentage of female teachersat primary level across the KBK districts is muchbelow the required norm except Koraput.
In order to achieve the UEE, specific andneed based policies for scheduled tribes in generaland scheduled tribes of KBK districts in particularneed to be implemented by the state governmenton priority basis.The undivided districts of Koraput, Bolangir andKalahandi (popularly known as KBK districts) ofOrissa have divided into eight districts : Koraput,Malkangiri, Nawarangapur, Rayagada, Bolangir,Sonepur, Kalahandi and Nuapada since 1993-94. Inview of the backwardness of these districts, governmenthas initiated several steps for the development of thesedistricts with focused plans and programmes.
References :Census of India, Primary Census Abstract, Orissa, 1991,2001, Office of the Registrar General, Bhubaneswar.
Debi Sailabala (1990) "Education and EconomicDevelopment of Tribals in an Urban Setting", Journalof Educational Planning &Administration, Vol. 10, No.2, pp. 173.
Education Commission (1968), "Education forDevelopment", Report of the Education Commission,1964-66, NCERT, New Delhi.
Government of India (1966), Education and NationalDevelopment" Report of the Education Commission(Kothari Committee), 1964-66, Ministry of Education,New Delhi
Government of Orissa (2007), Economic Survey 2007-08, Planning and Co-ordination Department,Bhubaneswar.
Haddad, W.D, Carnoy, M, Riniddi, R and Regel, O(1990)"Education and Development: Evidence for NewPriorities", World Bank Discussion, Paper No.95,Washington D.C., World Bank.
Orissa Human Development Report (2004), Planning andCo-ordination Department, Government of Orissa.
Orissa Development Report (2002), PlanningCommission, Government of India, New Delhi.
Panda, M. (2004), " Reform Imperatives that matter",paper presented at the workshop organized b yDepartment of School and Mass Education, Governmentof Orissa in collaboration with UNICEF, Orissa on 19-20, February, 2004 at New Delhi.
Sujatha, K 1999, "Education of India, Scheduled Tribes:A study of community schools in the district ofVishakhapatnam, Andhra Pradesh", Working DocumentSeries, published by International Institute forEducational Planning/UNESCO, (http:/ /www.unesco.org /iiep).
Tilak, JBG. (1994), "Education for Development in Asia",Sage, New Delhi.
Tilak, J.B.G (2002) Education in Orissa: A Review ofProgress, Problem and Perspectives for Future onSchool Education, Monograph prepared for UNDP, NewDelhi.
Tilak, JBG. (2004), "Free and compulsory Education".EPW, Vol. 39, No. 7.
Atal Bihari Das lives at Godavarish Chhatravasa, RoomNo- A-18, Utkal University, Vani Vihar, Bhubaneswar-751004