Embed Size (px)
Citation preview

KFRI Research Report No. 293 ISSN 0970-8103
Status, distribution, food and feeding of Malabar Spiny Dormouse (Platacanthomys
lasiurus Blyth) in the Western Ghats of Kerala
E. A. Jayson
Kerala Forest Research Institute Peechi- 680 653, Kerala, India

KFRI Research Report No. 293 Status, distribution, food and feeding of Malabar Spiny Dormouse (Platacanthomys lasiurus Blyth) in the Western Ghats of Kerala (FINAL REPORT OF THE RESEARCH PROJECT KFRI/378/02) E. A. Jayson Division of Forest ecology and Biodiversity Conservation Kerala Forest Research Institute Peechi- 680 653, Kerala, India August 2006

ABSTRACT OF THE PROJECT PROPOSAL 1. Project No. : KFRI/378/02
2. Title of Project : Status, distribution, food and feeding of
Malabar Spiny Dormouse (Platacanthomys
lasiurus Blyth) in the Western Ghats of Kerala 3. Objectives:
a) To determine the population status and distribution of the species in the Western
Ghats of Kerala.
b) To assess the food and feeding behaviour of the species in evergreen and moist
deciduous forests.
4. Date of commencement : February 2002
5. Scheduled date of completion : July 2005
6. Funding agency : Department of Science and Technology
Govt. of India
7. Project Team
Principal Investigator : Dr. E. A. Jayson
Research Fellow : K.M. Jayahari
8. Study area : Kerala
9. Duration of study : 3 Years
10. Project budget : Rs.10, 40,000/-

CONTENTS
ABSTRACT
1. INTRODUCTION 01
1.1. Study areas 03
1.1.1. Forests of Kerala 04
1.1.2. Intensive study area 09 1.2. Review of literature 11 2. METHODS 22
2.1. Status and Distribution 22
2.2. Food and Feeding 23
2.3. Behavioural Observations 25
3. RESULTS AND DISCUSSION 27
3. 1. Status and distribution of Malabar Spiny
Dormouse 27
3.2. Distribution and diversity of Rodents 34
3.3 Food and feeding behaviour 54
3.4 Behavioural observations on Malabar Spiny
Dormouse 68
3.5 Modelling the habitat of Malabar Spiny
Dormouse 83
3.6 Conservation of Malabar Spiny Dormouse 94
4. ACKNOWLEDGEMENTS
5. REFERENCES
6. APPENDICES

ABSTRACT
Malabar Spiny Dormouse (Platacanthomys lasiurus) is an endemic rodent
found in the Western Ghats of South India. The species inhabits the tropical evergreen
and riverine patches in the tropical moist deciduous forests. A study was conducted from
February 2002 to June 2005 in the Western Ghats of Kerala to determine the status,
distribution, food and feeding of the species. Intensive studies were conducted in the
Peppara Wildlife Sanctuary, Thiruvananthapuram District, Kerala, India. Live trapping,
questionnaire survey, direct observation, spot lighting and radio telemetry were used to
assess the status, distribution, food and feeding behaviour of the species. Sherman live
traps were used for detecting the presence of the species in different protected areas of
Kerala.
The species was recorded from ten protected areas in Kerala and from twenty
one forest Ranges. The Malabar Spiny Dormouse was newly recorded from nine
protected areas of Kerala namely Neyyar, Periyar Tiger Reserve, Thattekkad, Idukki,
Chinnar, Eravikulam, Chimmony, Parambikulam and Aralam Wildlife Sanctuaries.
Male of the species was having a weight of 80 gm and female 70 gm. Hbl of male was
110 mm and tail length 105mm, similarly female was having a Hbl of 108 mm and a
tail length of 110 mm. Trapping studies indicated that the species occur in extremely
low densities in the protected areas of Kerala.
Six species of Murid rodents and one insectivore were also identified from the
protected areas namely the Black Rat (Rattus rattus), Blanford’s Rat (Cremnomys
blanfordi), Spiny Field Mouse (Mus platythrix), Indian Bush Rat (Golunda ellioti),
Millardia meltada and House Mouse (Mus musculus). Overall capture success of
rodents was 3.62 %. Mus platythrix distribution in the Kerala part of the Western
Ghats is a new report. Rodent species richness is positively correlated to the tree
species richness and the diversity of trees nurtures the diversity of rodents. Rattus
rattus is the most abundant rodent species of the region and rodents have only low
density in the region.
The Malabar Spiny Dormouse feeds on a variety of food items available in
the habitat. Common food plants of the species were Terminalia bellerica Persia
macrantha, Hydnocarpus pentandra, Tamrindus indica, Bombax ceiba and

Shumanianthus virgatus. Favorite food items included endemic genus like Piper,
exotic species like Theobroma cacoa and Anacardium occidentale. Mode of feeding
was unique and the openings made on the seeds or fruits were of different sizes but
they were of circular shape. The animal was highly selective of the status of the fruits
or seeds and different mode of handling of food was observed according to the size of
edible portion.
Twenty five food plants of Malabar Spiny Dormouse were recorded using
location telemetry and other methods. Foraging decisions are influenced by the
predator pressure. Sexual dimorphism exist in the anti predator behaviour and females
are bolder than males. Two major types of foraging movements were observed in the
species. One type is limited to a distance of 30 m from the nest and other beyond this
distance. In the case of males, short feeding bouts were observed during the short
distance foraging and long feeding bouts in long distance foraging. In females,
considerably long feeding bouts were recorded during the long and short distance
foraging movements. Observations indicated that the species is completely arboreal.
The male moved to a maximum of 1 km during foraging and the female 80 m and the
feeding range of the species is about one km. The animal spent short periods at a point
when the foraging was within 35 m from the nest. But when long periods were
utilized for foraging they intermittently changed the feeding points or moved to areas
with thick canopy. The species utilized long time periods at feeding points when they
were beyond 35 m from the nest, but such long trips were made only occasionally.
The home range of the species is 4.91 ha and home range of the colonies
overlapped. A total of 3 males and 5 females of Malabar Spiny Dormouse were
captured for telemetry experiments giving an over all capture successes of 15%. The
sub adult female with radio transmitter was predated on the first day of observation by
an owl. Frequent movement is within 30m from the nest. Twenty three nests of
Malabar Spiny Dormouse were located in the intensive study area at Peppara Wildlife
Sanctuary. Males were carrying out the nest hole maintenance activity by gnawing the
nest entrance for removing the continuous growth of bark. Female was never
observed carrying out the nest maintenance activity. All the nests were vertical
hollows with opening at the bottom and two of the nests were abandoned during the
study. Of this one nest was on a Persea macrantha which was dried so that the
canopy connection of this tree with the other trees was lost. Another nest on Vateria

indica was filled with rain water and subsequently the nest was deserted. Nests were
made on 11 species of trees. The behaviour of nest hole maintenance can be attributed
to the antipredator behaviour strategy. Lagerstroemia microcarpa is a preferred
nesting tree of Malabar Spiny Dormouse and birds of prey and owls are the main
predators recorded.
Modelling the microhabitat preference of Malabar Spiny Dormouse
indicated that the species inhabits not only in the evergreen species but also in the
riverine patches of the moist deciduous forests. It is found that the Malabar Spiny
Dormouse is highly selective in choosing the microhabitat and high degree of
preference is given to the dense canopy cover and crown density. Preference for
canopy cover is an antipredator strategy. Only weak trend is showed towards food
availability. GIS modeling showed that Malabar Spiny Dormouse prefers the riparian
forest at Peppara Wildlife Sanctuary. The species is being used in tribal medicine, for
preparing drugs for the cure of acute Asthma, which is detrimental to its survival.

1
1. Introduction
About 40 percent of the 4200 species of mammals are Rodents. The 2050
species of the world’s rodents comprise one of the largest mammal groups, the
Rodentia, which is divided into 29 Families. Rats and mice are grouped together in the
largest Family Muridae, which contains 16 distinct sub-families. They are considered
as the integral part of the forest ecosystems due to their multiple role as predator, pray
and insectivores. They serve the ecosystem as seed predators and even as distributors
of mycorrhizal fungal spores (Ure et al., 1982). For humans they are food, pests,
vectors, indicators, medicine and myth and the anthropogenic relationship of rodents
in India can be traced back up to Vedas.
When viewed through the modern Metabolic Theory of Ecology their r-
reproductive strategy, mobility, competitive abilities and feeding behaviours can be
considered as a result of their high metabolic rates (Brown et al., 2004). They invade
almost all sorts of habitats, consume wide range of food items and predated by an
array of small carnivores and birds of prey. Ninety-nine percent of the mouse genome
is identical to humans (Abbott, 2002). The physiological, anatomical and metabolic
parallels of rodents especially mice; with humans make them an excellent model
system in medical, toxicological and molecular research (Bradley, 2002). The capacity
of rodents to modify their environments in such a way as to provide habitat and easy
acclimatisation to any sort of environment makes them well known invaders. Out of
the fourteen world’s worst invasive species, three are rodents.
Hundred and one species of rodents and twenty-eight species of insectivores
are recorded from India and out of these twenty species of rodents are endemic to
India. Forty three percent are in Low Risk category of IUCN classification. And more
than fifty percent of these species are in the Threatened category and Status Unknown
(Data Deficient). One species is extinct (Ratufa indica dealbata) and one is critically
endangered. A total of 72 percent of the species lack proper IUCN status evaluation
either globally or nationally due to deficiency of data, but under rigorous control
solely for economic purposes. Thirty-seven species are in Low Risk category, nine

2
species in vulnerable category and 11 are considered as Vulnerable as the status is not
yet evaluated (Molur et al., 1998). Eight of the twenty endemic species are in
vulnerable category, one is critically endangered, one endangered and three are in data
deficient. Many of the rodent species are treated only as pests, which showed the lack
of proper demographic studies.
As far as the mammalian biodiversity of the Western Ghats is concerned, out
of the one hundred and twenty species of mammals reported from the Western Ghats,
fourteen are endemic. The fauna is dominated by Insectivores (11 species), bats (41
species) and rodents (27 species). Few studies have paid attention to the community
structure and organization of these small mammals in the Western Ghats even though
there have been attempts to review our understanding of the status and ecology of the
small cats and lesser carnivores (Daniels, 2003).
Malabar Spiny Dormouse
Dormice are distributed in Africa, Europe and Asia except Malay region and
Islands. Malabar Spiny Dormouse (Platacanthomys lasiurus Blyth), Family Muridae, is
about the size of common rat and lives on the tree holes in colonies. The best
distinguishing marks of the species are the spiny fur, claw less hallur and bushy tail and
the ears are also very prominent. The species is endemic to Western Ghats and locally
called "Mutteli or Mulleli". The species is found in tropical moist deciduous and tropical
evergreen forests of the Western Ghats. It feeds on Terminalia bellerica, Persia
macranta and pepper and to some extent; these animals are considered as pests on the
cash crops. Loss of habitat and poaching are the serious threats to the survival of the
species.
A detailed study on the man-wildlife conflict in Peppara Wildlife Sanctuary,
Trivandrum District, Kerala was carried out during the period March 1993 to March 1996
(Jayson, 1998). During of the study, Malabar Spiny Dormouse was relocated in its
original locality after 40 years during 1995 (Jayson and Christopher, 1995). This finding
generated interest in the species and a detailed study was initiated. The known
distribution of the species is from South of Shimoga and when this study was initiated,
the species was known only from four occurrence reports. No detailed information on the
ecology and behaviour of the species was available. The status of the population and the
distribution pattern of the species in its range were not known and whether the species

3
was threatened with extinction was also not known. Earlier reports (Rajagopalan, 1968)
emphasized its role as minor pest on pepper, cassava and cashew.
Classification
ORDER Rodentia: Rodents
Family Muridae: Mice, rats etc.
Sub Family: Platacanthomyinae
Genus: Platacanthomys
Species: Platacanthomys lasiurus Blyth 1859a
As the Malabar Spiny Dormouse is restricted to the Western Ghats and no
information is available on the species from other countries. The present study reports
detailed information on the distribution, population status and behaviour of the species.
The population status of the species gathered will enhance our knowledge on the present
conservation status of the species. The present study was conducted from July 2002 to
July 2005.
Objectives
Most important objectives were to find out the details of the ecology and
behaviour of the species and to assess the threats to the survival of the species.
Therefore the specific objectives are,
1. To determine the population status and distribution of the species in the
Western Ghats of Kerala.
2. To assess the food and feeding behaviour of the species in evergreen and moist
deciduous forests.
1.1. Study areas Kerala part of the Western Ghats forest is comprised of fourteen protected
areas including 12 Wildlife Sanctuaries and two National Parks. During the study
period three more National Parks were newly announced. A brief account of the
protected areas where the study was conducted is given below.

4
1.1.1. Forests of Kerala
The population status of Malabar Spiny Dormouse and other rodents were
assessed in the twelve wildlife sanctuaries and two National Parks of Kerala namely
the Peppara, Neyyar, Shendurney, Idukki, Periyar Tiger Reserve, Chinnar,
Parambikulam, Peechi, Chimminy, Wayanad, Aralam, Thattekkad Wildlife
Sanctuaries and Silent Valley and Eravikulam National Park by trapping (Fig. 1).
Apart from these, questionnaire survey and transect survey were carried out in the 76
Forest Ranges belonging to 25 Forest Divisions.
Aralam Wildlife Sanctuary
Aralam Wildlife Sanctuary has a forest area of 55 km2 accommodating rich
diversity of flora and fauna. The sanctuary is located in the south-eastern side of the
Kannur District of Kerala State. The area geographically lies between 11o50’ to 11o52’
N and 75o49’ to 75o57' E. Geologically the area can be grouped into two main rock
types vis Laterites and Crystalline rocks. The habitat constitutes evergreen forests of
21.52 km2, semi evergreen forests with an extent of 25.97 km2 areas and moist
deciduous forest of 1.11 km2. The estimated area of other minor cover types is 6.12
km2 (Menon, 1999).
Wyanad Wildlife Sanctuary
Wyanad, consisting of the forests under the administration of North Wyanad,
South Wyanad and Wyanad Wildlife Sanctuary form a major portion of Nilgiri
Biosphere Reserve. The sanctuary has a total extent of 344.44 km2 and is a part of the
Mysore plateau. The terrain is almost flat and the slope varies from 50 to 10 0 in the
western part (Easa and Sankar, 2001). The altitude varies between 850 m and 1147 m.
The broad type of soil is Ferrolite and sub type is Ustic Altisol. The forest types could
be broadly classified into the following categories (Champion and Seth, 1968) namely
the West coast semi-evergreen forests, southern moist mixed deciduous forests,
southern dry mixed deciduous forests and plantations. The name ’Wyanad’ derives its
name from the numerous swamps locally called as vayals. Francis (1994) studied the
earlier political history, forest and agriculture and Wildlife in Wyanad.

5
Silent Valley National Park
Situated in the Palghat District of Kerala between latitude 110 3' and 11o 15' N
and longitude 76o 23' and 76o 30' E, Silent Valley National Park is one of the core
zones of the Nilgiri Biosphere Reserve. The area was declared as a National Park in
1984 and it falls under the Malabar Rainforest Realm. Covering an area of about 90
km2 this reserve is situated more or less on a plateau of about 1000 m (KFRI, 1999).
The altitude of the habitat varies between 658 to 2383 m above msl. The vegetation is
of west coast tropical evergreen type. Manilal (1988) made a detailed account of the
flora of Silent Valley, which consists of 966 species belonging to 134 families and 559
genera. Structure, diversity and seasonal distribution of birds have been studied by
Jayson and Mathew (2000, 2002, and 2003).
Parambikulam Wildlife Sanctuary
The Parambikulam Wildlife Sanctuary is located in the Palghat District of
Kerala State. Geographically the area lies between 76o 35' and 76o 50' E and 10o 20'
and 10o 26' N at an elevation of 600 m above msl. The altitude varies between 300 m
and 1400 m. The sanctuary was declared in 1962 and has an extent of 270 km2. The
topography is hilly terrain with undulating plains interspersed with marshy fields in
the valleys. The mountain ridges of the sanctuary have well defined valleys and slopes
to streams, which permit denser growth of vegetation in those regions. Some of the
hilltops have stretches of grasslands above 1000 m. Vegetation include moist
deciduous forests to tropical wet evergreen rain forests. Semi-evergreen forests appear
where moist deciduous forests merge into evergreen forests. Nair and Jayson (1988)
had described the habitat use of herbivores in the sanctuary.
Peechi- Vazahani Wildlife Sanctuary
The Peechi-Vazahani Wildlife Sanctuary is situated in the Trichur District,
Kerala State between 10o 28' and 10o 38' N and 76o 18' and 76o 28' E. The sanctuary
was established in 1958 with an extent of 125 km2. The area includes the Reservoirs of
Peechi and Vazahani dams. The reservoir area is of 12.95 km2 and 1.843 km2
respectively (Narayanankutty and Nair, 1990). The sanctuary is well connected with
the forest areas of Nelliampathy and Palappilly Reserves and Chimmony wildlife
sanctuary. The continuity of the Peechi Forest Range with the Vazahani side is lost

6
due to the Trichur-Palakkad National Highway. The terrain is undulating and the
elevation varies from 45 to 900 m. The habitat is dominated by the tropical moist
deciduous forests and semi evergreen forests, which are confined to the upper regions.
Chimmony Wildlife Sanctuary
Chimmony Wildlife Sanctuary is located in the Thrissur District of Kerala
State between 10o 22' and 10o26' N and 76 o31' and 76 o39'E on the western slopes of
Nelliampathy forests. The extent of sanctuary is 85.067 km2 of which the reservoir of
Chimmony dam occupies 5.68% (Menon, 1997). The habitat is contiguous with
Parambikulam and Peechi-Vazahani Wildlife Sanctuaries. Elevation of the terrain
varies from 1126 m to 2500 m above msl. The vegetation of the sanctuary consists of
west coast tropical wet evergreen forests at higher reaches, west coast semi evergreen
forests of an extent of 35.035 km2 and south Indian moist deciduous forests of
31.206 km2 Jayson (1997 and 1999) reported the status and habitat utilization of large
mammals of the sanctuary.
Chinnar Wildlife Sanctuary
Chinnar Wildlife Sanctuary, geographically located between 10o 15' - 10o 21' N
and 77o 05' - 77o 16' E comprises 90.44 km2. The sanctuary comes under the political
boundary of Idukki District of Kerala State. The terrain is highly undulating. The
different regions of the area experience varying climate reflecting in the different
vegetation types (Sasidharan, 1999). The altitude ranges from 400 to 1883 m above
msl. The terrain is much undulated with hills and hillocks of varying altitude from 400
m at Chinnar to 1883 m at Vellakkalmalai. The vegetation of the Sanctuary can be
broadly classified into six types (Champion and Seth, 1968). They are southern
tropical thorn forest (scrub jungle), southern dry mixed deciduous forest (dry
deciduous forest), southern moist mixed deciduous forest (moist deciduous forest),
tropical riparian fringing forest (riparian forest), southern montane wet temperate
forest (hill Shola forest) and southern montane wet grassland (grassland). The habitat
is also rich in fauna and the habitat utilization of large mammals was reported by
Jayson (2004).

7
Eravikulam National Park
Eravikulam National Park is famous as the natural habitat of the world’s
largest Nilgiri Tahr (Hemitragus hylocrius) population. Rice (1984) has given a
detailed description of Eravikulam National Park. The flora could be subdivided into
grassland, shrub land and forests. The terrain above 2000 m is covered primarily by
rolling grasslands with small patches of shola forests. The shola forests mostly located
in the valley can be classified as southern montane wet temperate forest
(Chandrasekharan, 1962). Sixteen mammalian species were reported from the National
Park (Easa, 1995).
Thattekkad Bird Sanctuary
Thattekkad Bird Sanctuary well known for the birds is having an extent of 25
km2 lying in between 770 - 760 E and 100 - 110 N. This sanctuary has low altitude
forest with elevation varying from 60 to 450 m above msl. The habitat consists of
evergreen, semi evergreen and moist deciduous forest types and teak, mahogany and
rosewood plantations. All the plantation activities were stopped for the last 15 years
and the regeneration is copious in the old plantations. The sanctuary is situated around
the reservoir area of Bhoothathankettu Dam.
Idukki Wildlife Sanctuary
Idukki Wildlife Sanctuary with an area of about 77 km2 is located between
09o45' - 09o55’ N and 76o50' - 77°05' E. The area includes 33 km2 reservoir area of the
Idukki dam. The terrain is undulating with an elevation varying from 800 m to 1272 m
above msl. Vegetation could be classified into west coast tropical evergreen forest,
west coast tropical semi-evergreen forest, south Indian moist deciduous forest and
south Indian sub-tropical hill savannah. West coast tropical evergreen forests are
mainly confined to Vagavanam and Kizhukalachimala and also in some isolated
locations. West coast tropical semi evergreen forests are found in the transitional zones
of evergreen and deciduous forests and occupy only a very small patch. South Indian
moist deciduous forest forms sixty percent of the vegetation in the Idukki Wildlife
Sanctuary. South Indian sub-tropical hill savannah type of forests is dominated with
grasslands and sparse tree growth occurs mostly in the hilltops (Easa, 1997).

8
Periyar Tiger Reserve
Periyar Tiger Reserve is a protected area with an extent of 777 km2. The
altitude of the area is up to 1808 m and lies between 760 55’ - 770 25’E and 90 18’ - 90
40’N. The soil is mainly fine loamy in character as it is derived from disintegrated
Laterites and gneisses. In higher altitudes the soil is coarse with large amount of quartz
gravel formed from crystalline rock. The underlying rock formations consist mainly of
granites and gneisses. Laterite occurs at the lower reaches of the Reserve. By
following Champion and Seth (1968), the vegetation of the Periyar Tiger Reserve can
be classified into seven types namely, West coast tropical evergreen forests
(evergreen), West coast semi-evergreen forests (semi-evergreen), Southern moist
mixed deciduous forests (moist deciduous), Southern hill-top tropical evergreen
forests (hill-top evergreen), Southern montane wet temperate forests (Shola), South
Indian sub-tropical hill savannahs (savannah) and Southern wet montane grasslands
(grassland). The flora of Periyar Tiger Reserve was studied in detail by Sasidharan
(1998).
Schenduruni Wildlife Sanctuary
Shendurney Wildlife Sanctuary is located between 77o 4' and 77o 17' E
longitude and between 8o 48' and 8o 58' N latitude in Kollam District, Kerala State.
The name 'Shendurney" is derived from a rare timber tree Gluta travancorica which is
locally called 'Chenkurinji'. The elevation of the area varied from 120 m to 1550 m
above msl. As per the management plan (Vighnarajan, 1990) there are 40 km2 of
evergreen forest, 10 km2 of semi-evergreen forest, 15 km2 of moist deciduous forest, 5
km2 of grassland and 6 km2 of reed and canebrakes in the sanctuary.
Neyyar Wildlife Sanctuary
Neyyar Wildlife Sanctuary with an extent of 128 km2 forest lies at the southern
tip of Kerala part of the Western Ghats. The area lies between 80 17’ - 80 53’ N and
760 40’ - 770 17’ E. Sanctuary has a varying altitude up to 1868 m above msl at
Agasthyamala peak. The forest constitutes of evergreen, semi evergreen and moist
deciduous types and the sanctuary includes the reservoir of Neyyar Dam also. An
evaluation of the Crocodile introduction programme carried out in the Sanctuary was
reported by Jayson et al. (2006).

9
1.1.2. Intensive Study Area – Peppara Wildlife Sanctuary
In an earlier study (Jayson and Christopher, 1995) Malabar Spiny Dormouse
was located at Peppara Wildlife Sanctuary in Trivandrum District, Kerala. Since this is
a known location, intensive studies were carried out in the Peppara Wildlife Sanctuary.
Situated in the southern tip of the Western Ghats in the Agasthiamalai ranges in the
extreme South to the Aryankavu pass, the Peppara Wildlife Sanctuary comes under
Nedumangad Taluk of Thiruvananthapuram District, Kerala State (Fig. 2). It is located
between 8o 34' to 8o 42' N latitude and 77o 7' to 77o 14' E longitude. The State capital
is 50 km away from the sanctuary. The extent of the sanctuary is 76 km2 and is under
the control of Assistant Wildlife Warden stationed at Peppara Dam site and the
Wildlife Warden stationed at Thiruvananthapuram. The altitude varied from 98 m to
1594 m above msl. Forests surround all the sides of the sanctuary. On the northern side
lies the Bonacord estate and eastern side borders with the Mundanthurai-Kalakkad
Tiger Reserve of Tamil Nadu. Southern portion adjoins with the Neyyar Wildlife
Sanctuary and western portion borders with the eucalyptus plantations of Trivandrum
Division. The highest peak is Athirumudi Peak (1594 m) and the entire area is the
catchment of Karamana River, which originates from the Chemmungi peak. The area
forms the part of the Agasthiamalai Biosphere Reserve.
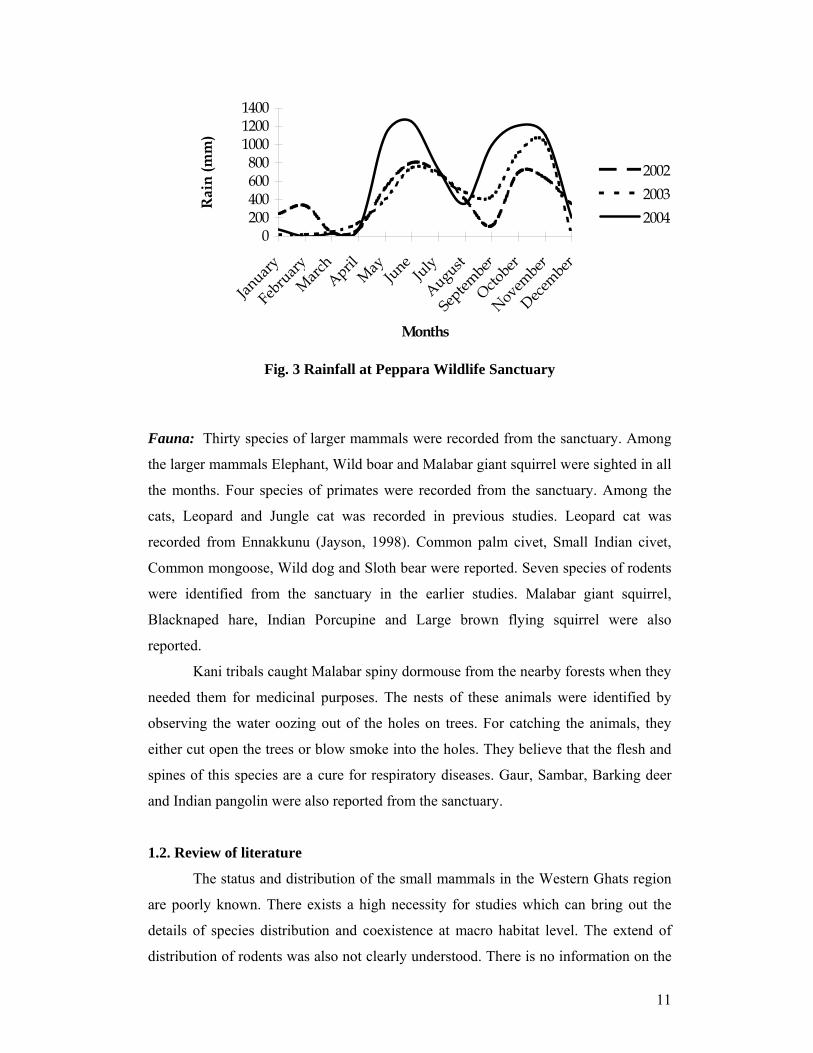
Climate
Sanctuary has a tropical hot and humid climate with a dry summer. Even
during this period, the high ranges maintain a cool and dry climate. Daily temperature
varied from 320 C to 200 C in plains whereas it varied from 250 C to 160 C in high
altitude. Average rainfall was around 4810 mm in the catchment of Peppara Dam
(Fig.3).
Vegetation
The Peppara Wildlife Sanctuary has all typical vegetation types found in the
tropical areas like tropical moist deciduous forests (29 km2), tropical evergreen forests
(10 km2), tropical semi evergreen forest (14 km2), shola forests (0.79 km2), reed brakes
(2 km2), bamboo areas (0.5 km2) and grass lands (2 km2) (Menon, 1999). Nair (1991)
has also described the vegetation of the area in detail. A recent floristic study by
Mohanan et al. (1997) documented 1084 species of flowering plants from the area.
Terminalia paniculata, T. bellerica, Carea arborea, Dillenia pentagyna, Pterocarpus
marsupium, Phyllanthus emblica, Lannea coromandelica, Lagerstroemia microcarpa,

10
Hopea parviflora, Olea dioica, Buchanania longan, Bombax insigne and Wrightia
tinctoria were seen in the moist deciduous forest.
Common trees in the evergreen forests were Cullenia exarillata, Dimocarpus
longan, Mesua nagasarium, Diospyros candolleana, Bischofia javanica, Cinnamomum
verum, Vateria indica, Xanthophyllum arnottianum, Syzygium caryophyllatum,
Palaquium ellipticum, Garcinia gummi-gutta and Holigarna arnottiana. Semi
evergreen forests have trees such as Aporusa sp. Artocarpus hirsutus, Mesua
nagasarium, Persea macrantha, Terminalia paniculata, Vitex altissimia, Mangifera
indica, Madhuca neriifolia, Alstonia scholaris, Bridelia retusa and Calophyllum
apetalum.
Tribals
There are seventeen Kani tribal settlements inside the Peppara Wildlife
Sanctuary. They are distributed in the buffer zone as well as in the core area of the
sanctuary. The Kani tribes of Thiruvananthapuram and Kollam Districts contribute to
the major part of the total tribal population found in the forests of Kerala (Anonymous,
1994). Like the other aboriginal hunting and gathering tribes, Kani’s also have the
primitive history of hunting, gathering and shifting cultivation. Long back, the
Kanikkars were employed by the Travancore Government to collect honey, wax,
ginger, cardamom, dammar and elephant tusks (Thurston, 1909). Many
anthropologists highly regarded their adventurous honey collection from the highly
rugged rock cliffs and treetops, which can be seen even today. Though the insidiously
spreading modern civilisation polluted the tribal culture, some Kani settlements still
preserve their ancient traditions (Jayson, 1998).
11
0200400600800100012001400
January
FebruaryMarchAp
rilMayJuneJuly
August
September
October
November
December
Months
Rai
n (m
m)
200220032004
Fig. 3 Rainfall at Peppara Wildlife Sanctuary
Fauna: Thirty species of larger mammals were recorded from the sanctuary. Among
the larger mammals Elephant, Wild boar and Malabar giant squirrel were sighted in all
the months. Four species of primates were recorded from the sanctuary. Among the
cats, Leopard and Jungle cat was recorded in previous studies. Leopard cat was
recorded from Ennakkunu (Jayson, 1998). Common palm civet, Small Indian civet,
Common mongoose, Wild dog and Sloth bear were reported. Seven species of rodents
were identified from the sanctuary in the earlier studies. Malabar giant squirrel,
Blacknaped hare, Indian Porcupine and Large brown flying squirrel were also
reported.
Kani tribals caught Malabar spiny dormouse from the nearby forests when they
needed them for medicinal purposes. The nests of these animals were identified by
observing the water oozing out of the holes on trees. For catching the animals, they
either cut open the trees or blow smoke into the holes. They believe that the flesh and
spines of this species are a cure for respiratory diseases. Gaur, Sambar, Barking deer
and Indian pangolin were also reported from the sanctuary.
1.2. Review of literature
The status and distribution of the small mammals in the Western Ghats region
are poorly known. There exists a high necessity for studies which can bring out the
details of species distribution and coexistence at macro habitat level. The extend of
distribution of rodents was also not clearly understood. There is no information on the

12
status, food and feeding and other behaviour of the Malabar Spiny Dormouse, which is
one of the endemic mammals of the Western Ghats. Detailed information on the home
range and activity pattern of the species is also lacking
Most of the small mammal studies carried out globally was confined to the
temperate regions and the species diversity, complex pattern of co-existence and the
species distribution of the small mammals of the tropics remain unexplored. Diversity,
structure of species assemblage, the spatial scale of small mammals and various biotic
and abiotic factors responsible for these were the matter of interest for ecological
studies in Australia for the last many years (Stephan et al., 2002; Hockings, 1981;
Laurance, 1994). Studies regarding distribution and ecology have been conducted in
Africa (Cheesman and Delany, 1979), Madagascar and Panama (Seamon and Adler,
1996) also.
Despite an increased interest in biodiversity conservation and high
species richness, Rodentia are often neglected by conservationists (Amori and
Gippoliti, 2001). Since they are an important component of the forest ecosystem, being
the connecting links between many of the biotic elements of the ecosystem and due to
their ‘r-reproduction strategy’, their population and demographic studies are crucial for
their conservation. Western Ghats accommodates 25 percent of the mammalian
diversity in India. As some of theses species are endemic to the region their population
changes will indicate the climatic changes caused by the anthropogenic and non-
anthropogenic factors. Many of these species have complex relationships with
humans, not only for the tribes but also for the urban population. Since the rodents are
the reservoirs of Leptospira, causing the disease Leptospirosis (Weil’s disease), the
knowledge on the wild rodent community will help in the control of the disease. Only
few studies have been carried out on the small mammal community and especially on
the rodent communities of the Southern Western Ghats.
Small mammals in India
The studies on small mammals in India started during the first half of the 19th
century, by the description of Indian Gerbil (Tatera indica) by Major General
Hardwick (Kinner, 1968). Followed by this a series of major works were carried out
by Hodgson and Blyth. Jordan published “Mammals of India”, which was considered

13
as the standard book of mammal identification for the next twenty years. The volumes
of “Fauna of British India” by Blanford replaced the book. Jordan was imperfect in
dealing with small mammals since most of the specimens collected by the earlier
workers like Gray and Hodgson were not available in Asiatic Society of Bengal
(Kinner, 1968). In 1867 Captain Glen Liston read a paper before the Asiatic Society of
Bengal on plague, rats and fleas, which discussed the relation between plague and rats.
He concluded the paper by saying “What do we know about rats very little”. The paper
initiated wide attention towards the lack of knowledge about rodents and small
mammals. During the Golden Jubilee of the Asiatic Society of Bengal in 1911, India’s
first mammal survey had begun. During the survey, Bombay Natural History Society
had contributed much and in later period, they have made an extensive collection of
specimens from different parts of the country. The contribution of Prater (1948) is
outstanding in the mammalian studies during the survey and in the remaining period.
The checklist of paleartic and Indian mammals generated from the mammal survey by
Ellerman and Morison-Scott (1953) had described 291 rodent species and subspecies
of 44 genera where as Blanfrod’s “Fauna of British India” (1891-1988) described only
92 species and 22 genera of rodents. Even today the standard work of rodent taxonomy
is the volume of Rodentia in the Fauna of British India by Ellerman (1961).
In the recent past many individual workers contributed to the distribution
pattern of rodents through out India. But most of these were carried out at the
taxonomical level rather than assessing the ecological species assemblage, coexistence
and diversity in the natural habitat. A sum total of these efforts came out as
compilations and Ellerman et al. (1953) published a checklist of Indian rodents.
Considerable information about the distribution of rodents in India was given by
Biswas and Tiwari (1969). The distribution of Indian Rodents was also compiled and
published by Prater (1988), Corbet et al. (1992) and Musser et al. (1993).
Species distribution of rodents in Indian sub continent was reported by many
workers in the recent past. Chakraborty (1983) studied the rodent distribution in
Jammu and Kashmir region. Mahajan and Mukarjee (1972, 1974) prepared a checklist
of rodents in Himachal Pradesh. Sood and Dilber (1977), Sood and Gurya (1978),
Sood and Ubi (1978) have worked on rodent species of Punjab. Sheiker et al. (1983)
and Jain (1975) have reported the rodent species in Uttar Pradesh. Rodent fauna of

14
Indian desert of Rajasthan was studied in detail by Agarwal (1976), Biswas and Gosh
(1968), Ghose (1976) and Prakash (1963, 1959, 1972, 1977). Hill (1958), Jain (1985)
and Khajuria and Ghosal (1981) have reported the rodent fauna of Madhya Pradesh.
Pradhan (1979) brought out an account of the Rodent species of Bombay and
Maharashtra. Agarwal (1973) reported detailed account of the rodent species in Goa
region. Agarwal and Bhattacharyya (1987) supplemented the rodent distribution in
West Bengal. Agarwal and Bhattacharyya (1977), Roonwal (1948, 1950) have made
remarkable contributions to the Rodent distribution from the North East India.
Rodents in the Western Ghats
Only few studies were carried out on the species composition of rodents in the
Western Ghats, apart from the works conducted during the British era. Similarly
Agarwal et al. (1969) reported a new rat species Rattus renginiae from this region.
Meena (1997) reported the rodent diversity in the Mudumalai Wildlife Sanctuary,
Tamil Nadu. Easa et al. (2001) conducted a survey on the small mammals of this
region with a conservation point of view. Shankar (2000) conducted a detailed study
on the metapopulation dynamics of rodents in the Upper Nilgiri region of Western
Ghats. Kumar et al. (2001) studied the distribution of rodent species in the Kalakkad
Mundanthurai Wildlife Sanctuary, Tamil Nadu. Apart from these no reports were
available even though the area is affirmed as the hot spot of biodiversity and the small
mammals as highly significant ecological component.
Behavioural studies
Most of the behavioural studies on rodents in India are concerned with the crop
damage caused by rodents in the agriculture fields. Barnet and Prakash (1975) reported
considerable information about the food and feeding behaviour of Rattus rattus in the
agriculture fields. Behaviour of desert rodents was well studied by Calhoun (1969),
Agarwal (1967), Fitzwater and Prakash (1969, 1973), Prakash (1975, 1981), Prakash
and Jain (1971) and Prakash and Ojha (1977).
Prakash (1959, 1974, 1975, and 1977) extensively studied the food preference
of several species of rats and gerbils in the Thar Desert. Roonwal (1949) investigated
the food preferences of Rattus manipulus in Manipur State of northeast India. Agarwal
(1968) and Jain (1984) have reported the cannibalism among Rattus rattus. Asari

15
(1975) reported food preference of Rattus rattus on variety of tapioca. Feeding related
behavioural patterns were worked out by many workers (Kumari and Khan, 1984;
Sridhara, 1978; Srihari and Sridhara, 1979 and Chakraborty and Chakraborty, 1982).
The feeding behaviour of Spiny Field Mouse Mus platythrix was subjected to detailed
studies in the laboratory (Srihari and Sridhara, 1978). Behavioural characteristics of
wild rodent species were not studied in detail in the natural habitats of India.
Malabar Spiny Dormouse
As the distribution of the Malabar Spiny Dormouse is restricted to the Western
Ghats of India, no literature is available from other countries on the species. Malabar
Spiny Dormouse belong to a monotypic genus Platacanthomys which itself is the one
and only genus of the subfamily Platacanthomyinae (Corbet and Hill, 1992). As far as
Malabar Spiny Dormouse is concerned the type locality is Bonacord,
Thiruvananthapuram (Blanford, 1888). Except for the occurrence reports, no detailed
studies were carried out to determine the status and distribution of the Malabar Spiny
Dormouse in India. Ellerman and Morrison-Scott (1951) and Ellerman (1961) have
reported the occurrence of the species from Bonacord area in Trivandrum District,
Kerala. Rajagopalan (1968) reported this species from Shimoga in Karnataka State. After
a spell of forty years recently the occurrence of the species was reported from Peppara
Wildlife Sanctuary, Trivandrum District (Jayson and Christopher, 1995). After this
report many short notes on the Malabar Spiny Dormouse appeared in the literature.
Shankar (1996) recorded the species in the Upper Bhavani hills of the Nilgiris. Prabhakar
(1997) has recorded it from Kariyanshola of Indira Gandhi Wildlife Sanctuary, Tamil
Nadu State. Mudappa (2001) sighted it in the Kalakkad Tiger Reserve of Tamil Nadu.
Apart from such records, there is no published information available on the ecology and
behaviour of the species and it is reported that the species also not held in captivity in
India. Many studies were conducted on the ecology, behaviour, morphology, anatomy,
physiology and genetics of the species of Dormouse’s (Family: Gliridae) in Europe,
Japan, South America and in Afghanistan. Most of these research works were
conducted in open woodlands and in captivity. As the Malabar Spiny Dormouse
occupies the evergreen and moist deciduous forest there is not much relevance in
comparing the studies on the dormouse of temperate region belonging to family
Gliridae to the Malabar Spiny Dormouse of south Indian tropical forest, which
belongs to Muridae and live in a different habitat.

16
Bright et al. (1989) have published a practical guide to dormouse conservation
in Europe and some years later standardized the survey techniques (Bright et al.,
1994). The distribution of different dormouse species was studied by many workers
across Europe (Foppen et al., 1989; Jackson, 1994; Bright, 1995; Krystufek, 1994;
Buchenr, 1997; Botond, 1998), population density of Edible Fat Dormouse Glis glis
(Hoodless and Morris, 1993) and population dynamics of European Dormouse(Berg,
1996) and Fat Dormouse (Morris et al., 1997) was well analysed. Abundance
dynamics of three species of Dormouse was observed using nest boxes by Rimvydas
(2000).
Behavioural responses of European Dormouse (Muscardinus avellanarius) to
habitat corridors (Bright, 1998) and influence of vegetation changes especially shrub
vegetation on the population dynamics are well documented (Berg, 1996). Dispersal
behaviour of Edible Dormouse in Germany was well documented (Bieber, 1994).
Ecological requirements of Dormouse species of Hungary have reported by Backo et
al. (1998). The habitat selection criteria in relation to food availability of Hazel
Dormouse (Muscardinus avellanarius) (Berg and Berg, 1999) and Myoxus sp. (Franco,
1990) and woodland requirements of Dormouse Muscardinus avellanarius (Bright,
2000) were subject of behavioural studies in the past decade. Spatial ecology and
habitat selection of Hazel Dormouse was recorded and a criterion of habitat selection
was identified by Berg (1997). Behavioural development of Japanese Dormouse was
well observed by Minto (1996). Habitat utilization of Glis glis in two different forests
was compared in relation to habitat fidelity by Schlund et al. (1997).
Food and feeding behaviour of Glis glis was studied in relation to body weight
and juvenile development by Ercument (1994) and hazel nut feeding was studied by
Rodolfi (1994). The faecal analysis of Glis glis was carried out by Antonio et al.
(1999). Similarly, food availability was correlated to the reproductive behaviour in
Glis glis by Rodolfi et al. (1994). Vocalization of Muscardinus avellanarius was
described by Movchan and Korotetskova (1987).
Many studies were reported on the related species of Dormouse in European
countries. Morris et al. (1990) studied the use of nest boxes by the Dormouse

17
(Muscardinus avellawarius). He compared the efficiency of Sherman traps and local
traps for catching Dormouse. He has concluded that Sherman traps are more effective
than the locally made ones. The use of arboreal vegetation by the populations of
Muscardinus avellawarius was reported by Tattersall and Whitbread (1994).
Distribution, survey techniques, insular ecology and selection of sites for conservation of
the same species have been reported by Bright et al. (1994). The same author has
reported the ranging and nesting behaviour of the Common Dormouse (Bright and
Morris, 1992). Morris and Whitbread (1986) have reported a method for trapping the
Common Dormouse. Another species of dormouse studied in detail in England is the Fat
Dormouse (Glis glis). Hoodles and Morris (1993) have studied the population density of
the species. Similarly, Japanese Dormouse (Glirulus japonicus) was studied by Otsu and
Takeji (1993).
Abundance estimation
Abundance estimation is important in the study of mammals (Seber, 1982).
Capture Mark Recapture methods (here after referred as CMR) is the basic tool for
estimating survival, density in probabilities (Williams, 1996) breeding probabilities
(Williams et al., 2002), survival and animal behaviour like temporary emigration
(Schaub et al., 2004). The history of Capture Mark Recapture techniques can be traced
back to 17th Century and the basic principles were formulated by Lincoln (1930) and
Jackson (1933) independently. Otis et al. (1978) proposed five models for estimating
abundance and recapture probability distributions. This was modified later by White et
al. (1982) who suggested eight models for estimation. The software PROGRAM
CAPTURE was created based on the models suggested by Otis et al., 1978 and White
et al., 1982.
An array of capture mark recapture based census of small mammals studies
have been conducted in the past. Based on the small mammal trapping experience in
montane forest patches of Western Ghats, Shanker (2000) has concluded that since
low densities existing in the tropical forests resulted in low capture probabilities, these
models may not be as useful as in temperate regions. Shanker (1998) suggested a
revision of methodologies designed in temperate region for the use in tropical region.
Capture mark recapture was criticized mostly on the ground of minimum number alive
(Jolly and Dickson, 1983; Nichols and Pollock 1983). The assertions for use of

18
‘Central Limit Theorem’ in setting large sample confidence intervals with
considerably narrow width makes the Otis et al., 1978 and White et al., 1982 based
models unsuitable for small sample size and there by program CAPTURE. The
incapability of program CAPTURE was described by Menkens and Anderson (1988)
especially when the trapability is less than thirty percent (0.30).
For abundance estimation of small mammals direct enumeration method was
proposed by Krebs (1966). This method cannot be applied, if capture probabilities are
very low (<0.5). Menkens and Anderson (1988) suggested Lincoln-Peterson estimator
as an alternative. Lincoln-Peterson estimator methodology involves one session of
catching and marking and one session of recapture. This will not be suitable for small
mammal studies on behalf of the high behavioural heterogeneity of the animals.
Schnabel method (Coughly, 1977) which is based on the same assumptions of
Lincoln-Peterson method but appropriated to capture on several occasions. The
goodness of fit of the data should be assured by conducting a G-test in case of no batch
specific capture and by confirming that the frequency distribution of the recapture
probabilities does not fit a zero truncated poison distribution in case of batch specific
data. Burnham and Overton method (Burnham and Overton, 1979) also can be applied
for the batch specific sampling. Jolly Seber method independently formulated by Jolly
(1965) and Seber (1965) can be used for the sampling data from open populations.
Assumption of homogeneity in tradability between time and animals is the
main limitation of most of the conventional CMR models when operating in tropical
habitats (Otis et al., 1978; White et al. 1982; Nicholas and Pollock, 1983; Shanker,
2000; Vieira, 2004). The solutions to overcome the problem of heterogeneity also have
designed both statistically (Otis et al., 1978; White et al. 1982) and non
mathematically (Minta and Mangel, 1989; Wileyto et al. 1994). Models Mt, Mb, Mh,
Mth, Mbh and Mtbh (Otis et al., 1978; White et al., 1982) attempts to resolve the
problem heterogeneity over animals and time. Out of these Mt, Mb and Mh need
considerably large sample size, Mth and Mbh are conceptual models and Mbh can be
applied only if any of the generalized removal models fit to the data (Otis et al., 1978)
Pollock (1981) suggested the Jackniff method for the situations with high degree of
heterogeneity of capture probabilities. This needed considerably long sampling periods
to attain the minimum sample size. White et al. (1982) suggested the increase in trap

19
density and sampling area as a technique to overcome the problem of small sample
size. Taylor et al., 1981 brought out the use of different methodologies as a solution
for the problem.
In tropical conditions increasing the sampling period for more than four days
was found to cause more trap death (Shanker, 2000) and so can not be practiced on
conservation point of view. Another problem of increasing the sampling periods for
more than four days is the immigration, which will break the demographic closure
assumption necessary for CMR operations other than for open population models
(Shanker, 2000; Vieira, 2004). The use of different methods like transects and grid
together has resulted in problems to determine the trap ability and habitat specificity
statistically (Vieira, 2004). No study has been reported from tropical areas using CMR
in considerably large area as the Kerala part of Western Ghats with uniform
methodology so that the heterogeneity in trap ability over similar large-scale
demographic changes could be assessed.
Behaviour studies
Animal behaviour studies were mostly confined in laboratories than in the field
due to the problems of feasibility, especially when the study animal is nocturnal and
small to locate in the field. Most of the behavioural studies conducted in the natural
habitat are in arid or semi arid habitats. The escape behaviour of lizards, which are
arboreal, was studied in detail in laboratories (Jonathan et al., 1996). The differences
in open field behaviour of many nocturnal small rodent species are interpreted on the
basis of their different ecological strategies and adaptations were well studied in
laboratory by measuring and comparing their exploratory behaviour (Frynta, 1994).
The sex and species differences have been observed in occurrence and patterns of
association between exploratory behavioural events of different individuals of Mus
spicilegus and Mus musculus. The study revealed sexual behavioural dimorphism in
exploration of new environments in both species (Daniela and Simeonovska-Nikolova,
2000).
Habitat selection has been proved as species specific in two lemur species
(Microcebus murinus and M. ravelobensis) at Madagascar, which is important for their
survival. The abundance and the dbh of forest trees were also well correlated to the

20
specific habitat selection of the species (Antje et al., 2003). Tree species richness and
diversity of microhabitat structures also have been positively correlated to lemur
species diversity (Ganzhorn et al., 1997). The social organization and sexual selection
of lemurs were also well studied in captivity (Radespiel et al., 2002). The social
organization and activity pattern of Slender Loris, which is a nocturnal mammal, was
well studied in their natural habitat in Southern India (Radhakrishna and Mewa Singh,
2002). Habitat selection of Marmota bobak (Rodentia, Sciuridae) was studied in
connection with the foraging quality of the habitat (Ronkin and Savchenko, 2000).
Factors of forest and landscape structure influencing the presence and abundance of
rodent species were modelled using logistic and Poisson regression models in the rain
forest of Ranomafana National Park in the south-eastern Madagascar (Lehtonen et al.,
2001). Four soricid and five rodent species in five macro habitats on the Coastal Plain
of Virginia, USA were studied by Bellows et al. (2001). Three species-specific
characteristics influencing the habitat selection of small mammals were identified in
this study such as shrub frequency, canopy openness and diameter of downed woody
debris. The study also revealed the fact that the capacity to access resource from
different sources makes some of the species broad niche species and less selective to
habitats.
Predation is one of the key and fundamental factors in community ecology and
autecology (Kotler and Holt, 1998). Observations on Israeli gerbils (Gerbillus
pyramidium and Gerbillus allenbyi) confirmed the influence of predator pressure on
general behaviour. Works on Gerbillus tytonis and Rhabdomys pumilio revealed that
these two species prefer shrub habitat than open habitat for foraging (Hughes et al.
1994). The influence of predator pressure was supported by correlating the exploratory
behaviour of these rodents to lunar cycle. Yunger et al. (2002) was able to quantify the
predator influence in foraging decisions of small mammals creating a predator
excluded experimental condition. This was carried out in Semi Arid scrub jungle of
Chile. The study revealed that the temporary exclusion of predator for a brief period
could not influence the foraging behaviour of small mammals.
Douglas et al. (2004) used an artificial feeding patches to study the food
selection and also for quantification of feeding. They used Giving Up Densities (GUD)
for estimation. The study also identified demographic factors such as competition
affecting foraging movement rather than predation. The food and feeding of Slender

21
Loris was studied in natural habitat by Nekaris and Rasmussen (2003) using focal-
animal instantaneous point sampling. Food and feeding behaviour of Malabar giant
squirrel (Ratufa indica) was studied in detail in Western Ghats (Borges et al 2001.).
Foraging behaviour of Rattus rattus was studied and correlated to the reproductive
ecology of the bird dispersed tree species in island biota (Delgado, 2000). The
differential maternal investment and sex-specific resource allocation was examined by
manipulation of dietary protein on captive multi-mammate mice (Mus coucha) (Lamb
et al., 2001). Tristiany et al. (2000) correlated the home distribution and the patterns of
rice plant damage distribution caused by Rice field rat Rattus argentiventer. The study
also unearthed the sexual dimorphism in foraging behaviour and home range
establishment of this species.
There are many methods for studying the small mammals and direct
observation and food patch experiment are some of them (Yunger et al., 2002).
Location telemetry is the best mechanism to locate and study animal behaviour in the
field. This method has lot of limitation when used in the case of small animals, which
move comparatively short distances and live in a habitat, where GPS cannot operate
accurately. Telemetry enabled Accelradio-telemetered accelerometer collar that
continuously monitors the acceleration of the animal has been newly designed to
monitor the movement of nocturnal organisms, but it is not cost effective (Sellers et
al., 1998).

22
2. Methods
The study was mainly based on direct observational methods (Altman, 1974). The
study areas were surveyed on foot and vehicle. Observations were mainly done with the
help of binoculars (10 x 40) and on an average 20 days were spent in the field in a month.
Detailed methodology of each aspect is presented in the concerned Chapters (Plate 1).
2.1 Status and Distribution
To determine the population status and distribution of Malabar Spiny
Dormouse, questionnaire survey, live trapping and indirect evidences were mainly
relayed.
Questionnaire survey: Intensive field surveys were carried out in the tropical
evergreen and moist deciduous forests of Kerala. Using a structured questionnaire and
photographs, potential sites of the species were identified in the State. The
questionnaire survey was conducted among the Forest Department officials, local
communities, N.G.O's and non-tribal people inhabiting the forest fringes who
regularly visited forest. Hundred and eleven respondents were contacted for the
survey. But more individuals shared the information since most of the tribal people
were illiterate, the format was filled by the researchers communicating to a group of
people of a settlement at the time and the names of those with distinct opinion were
only noted down. The collective opinion of the group was recorded as of the group.
The survey was conducted in 76 Forest Ranges of Kerala part of the Western Ghats
belonging to 25 Forest Divisions including the 14 protected areas. The format of the
questionnaire is given in Appendix 1. To record the presence of the species in an area,
indirect evidences were also collected. Indirect evidences included nest on tree cavities
and discarded fruits after feeding. Feeding signs on the discarded seeds were
characterised to identify the presence of the species from the fruits and seeds left out
after feeding.
Trapping: Population status was determined by capture-recapture method using
Sherman traps. A total of 6400 trap nights were attempted to study the abundance and
distribution. The trap night efforts were employed in 17 sessions in 17 protected areas.
Traps were placed in grids at an interval of 10 m x10 m. Forty-eight traps were
accommodated in a grid and two such grids were operated at a time. Traps were baited

23
with grated coconut and checked in the morning hours. Trapped individuals were marked
by ear clipping and released. Population status in the intensive study area was monitored
throughout the study period and only once from other areas. In the entire 14 protected
areas one trapping programme was carried out irrespective of the seasons. Trapping
was carried out on four consecutive days. The location for trapping in each protected
area was selected to conduct the trapping study in maximum diverse habitats, so that
the habitat peculiarities of each protected area could be utilized and the trapping could
be carried out at maximum diverse habitats. The location of trapping in each protected
area was identified based on the altitude and vegetation.
The traps were operated in one hectare (100 m X 100 m) square grids. One trap
station was established in each 10 sq m of the grid area so that the over all trap density
was 1 trap/10 sq m. At some locations two grids of 0.5 ha were established. A trap
night is defined as the use of one trap for one night. The standard Sherman live traps
(22.9 cm X 7.6 cm X 8.9 cm) were used for the trapping. The traps were placed in the
forest floor at each trap stations. The traps were kept near to trees, rock, fallen logs or
any other probable run way of the rats if available in the 100 km2 area. The traps were
baited with grated coconut, which was standardized by the 550 trap nights attempted
in the Kerala Forest Research Institute campus at Peechi Initially baits like, roasted
coconut, peanut butter and dry fish were used but after the standardization of baits based
on the capture success, grated coconut was permanently used.
Traps were usually kept near the base of the trees and in open areas. Pre-
baiting was practised initially but later avoided, since no change in the capture success
was recorded. During the early morning the trapped individuals were identified and
sexed, the individuals were then marked by ear punching and released after measuring
the weight and in the evening, the traps were freshly baited. Trapping was carried out
in the fourteen protected areas of Kerala namely Peechi, Chimmony, Peppara,
Parambikulam, Chinnar, Idukki, Wyanad, Thattekkad and Periyar Tiger Reserve
Wildlife Sanctuaries and Silent Valley National Park.
2.2 Food and feeding
Food and feeding behaviour studies were carried out at Peppara Wildlife
Sanctuary and Chimmony Wildlife Sanctuaries. Animals were observed during night
and the discarded seeds and fruits were collected from the feeding sites. Direct

24
observations were carried out in the moist deciduous forests, evergreen forests and in
the areas where the cash crops were cultivated. Detailed observations were carried out
to assess the food materials and feeding habits. Nests were searched to identify the food
particles from the leftovers.
Direct Observations: Direct observations on the food and feeding behaviour of the
Malabar Spiny Dormouse were carried out in the intensive study area at Peppara
Wildlife Sanctuary. The observer walked through the forest at night slowly, listening
to the sound discarded food falling from the trees. After identifying the tree from
where the discarded food was rejected, the approximate position of the animal was
determined and two or three searchlights were flashed to detect the animal. The
feeding of the animal and other observations were recorded. If any suspected food
remains of the Malabar Spiny Dormouse was observed, the feeding of the animal was
confirmed after waiting for the arrival of the animal and feeding.
Indirect Observations: Indirect observations were also carried out with out directly
observing the feeding process. The feeding remains of the seeds were compared for
the specific pattern of gnawing by Malabar Spiny Dormouse. In some cases the
animals were sighted on the trees along with the falling of food remains and where no
other rodent species of similar size was sighted on nearby trees. Food patch
experiment was carried out to confirm the feeding of Malabar Spiny Dormouse on the
Rhizome of Schumarianthus. The food patch was created in the canopy where the
animal was observed foraging and the patches were checked in every hour.
Telemetry: As the species is nocturnal, radio telemetry was essential to locate the
animal during night and to identify the individuals. Radio telemetry studies were
carried out and four animals were studied with radio transmitters (Company -
Telonics, USA, Transmitter weight is 6 gm and Battery life is 3 months and coverage
was 1. 5 km). These studies were conducted in the moist deciduous forests for
observing the foraging behaviour and the activity pattern of Malabar Spiny Dormouse.
Radio transmitter was attached to the dorsal side of the Malabar Spiny Dormouse. The
movement pattern and the feeding behaviour of the species were recorded using the
telemetry. The observations at night were difficult as wild elephants traversed the area
frequently. Malabar Spiny Dormouse was captured by keeping the Sherman traps near

25
to the known and identified nests of the species. The trapped animals were sexed and
weighed. Location telemetry transmitter was attached on the neck of the animals and
the animals were released near the nests. Tracking of the animals started at 18.30 hrs
in the evening and proceeded till the animal returned to the nest in the early morning.
Several times the tracking was interfered by rain or intervention of other large
mammals especially the elephant.
The position of the animal was noted in each ten-minute interval. Initially
attempts were made to sight the animals but later this was abandoned as it interfered
with the natural movement of the animals. Deliberate sightings were avoided and
accidental sightings were recorded. The locations of the animals were not able to mark
in GPS as the animals foraged in dense canopy areas where GPS signals were not
available. Apart from these short distance movement of the animals were not markable
with the aid of GPS. The positions of the animals were recorded to the nearest trees of
the location. In the case of long distance movements the pathway was mapped by
following the transmitter and by marking all the trees of which the canopy was used.
The measurement of distance was carried out on the next day. The calls and sightings
of other animals of the species were also recorded. It was not possible to study any
other activity other than feeding in canopy due to the poor visibility of these nocturnal
animals at night. Artificial searchlights disturbed the natural movement of the animals
and the thick canopy where the animal used to forage restricted visibility in general.
2.3. Behavioural observations
The nesting behaviour and microhabitat selection of Malabar Spiny Dormouse
were studied in detail. Twenty-four nests were located in the intensive study area and
they were numbered and observed regularly once in two weeks for different
parameters. All possible nests were located in the intensive study area. The liveness of
nests was confirmed by the presence of fresh leaves in the nest, wetness of the nest
hole and markings of nest maintenance at the entrance of the nest hole. One hectare
plots were taken around 12 identified nests and 13 control plots were studied for
recording the habitat parameters. Wetness of the nest, liquid oozing out of the nest,
urea content on the leaves in the nest and the presence of spines/hairs were taken as
the indicators of active nests. All confirmed nests were measured for the diameter of

26
the entry hole and the length. The wet leaves collected from the nests were chemically
analysed and the presence of urea was confirmed on the leaves.
Habitat Parameters: Following ecological parameters of the trapping plots were
recorded. Diversity index of trees was worked out by measuring the number of tree
species in the plot. Altitude, distance to the near by water body and distance to the
nearby human habitation were measured using GPS. Canopy cover was qualitatively
estimated manually from five points in the plot (four corners and centre) and the mean
is used. Under growth is scaled qualitatively 1 to 4 by counting the number of shrubs
other than grass in 1 m2 from five points of the plot (four corners and centre). Litter
quantity was measured as the thickness in centimetres using standard engine divided
scale.
Statistical analysis: All the trapping results and the field data were subjected to
statistical analysis using the programs CAPTURE, SPSS Version 11, Staistica Version
6 and BIODIVERSITY PRO.

27
3. Results and Discussion 3.1. Status and distribution of Malabar Spiny Dormouse
3.1.1. Geographic Distribution
The single species Platacanthomys lasiurus is found in southern India
(Ellerman and Morrison-Scott, 1966). Platacanthomys, along with Typhlomys, has
sometimes been placed in a separate family, the Platacanthomyidae and sometimes in
a subfamily, the Platacanthomyinae of the family Gliridae. In accordance with Corbet
and Hill (1992), the Platacanthomyinae are here considered as a subfamily of the
family Muridae. Recently one fossil species has been described from Yunnan, China
P. dianensis Qiu, 1989 of the period Upper Miocene. Nearest related living species is
Typhlomys cinereus distributed in South China from South Shaanxi to Yunnan,
Guangxi and Fujian and in North Vietnam. Four subspecies has been recognised in
this. Apart from these, two fossil species also has been reported recently namely T.
primitivus and T. hipparionum (Asakawa et al., 2001)
Head and body length of the species is about 130-212 mm and tail length is 75-
100 mm and the weight of an adult female was 75 gm (Corbet and Hill 1992). The
upper parts are densely covered with sharp, flat spines intermixed with thin, delicate
under fur, but the under parts have fewer, smaller, and finer spines. The basal half of
the tail is sparsely haired and scaly and the terminal part bears long hairs that form a
brush. The general coloration of the upper parts is light rufescent brown; the forehead
and crown are more reddish and the under parts are dull whitish. The tail is somewhat
darker than the general body color, becoming paler at the thick, bushy tip and the feet
are whitish.
Malabar Spiny Dormouse is much like the Gliridae in form. The muzzle is
pointed, the eyes are small, the ears are thin and naked and the hind feet are broad and
elongated. The first toe barely reaches the base of the second toe. The thumb on the
forefoot, although short, is well developed. The claws of the digits are slender and
compressed. Unlike the Gliridae, Platacanthomys has no premolar teeth, and its dental
formula is the same as that of the Muridae. The incisors are smooth and compressed.
The cheek teeth tend to be high-crowned and generally have parallel oblique cross

28
ridges of enamel on the crown. These ridges are broadened and the depressions tend to
become isolated, on the surface of the crown.
The Malabar Spiny Dormouse inhabits evergreen forests and riverine forests at
elevations of 100-900 meters. Its nest is constructed mostly of leaves. The long, tufted
tail is helpful as a balancing organ as the animal moves about and leaps in trees.
Rajagopalan (1968) reported that a female caught in the wild was still living after 20
months of captivity. In some areas, the Malabar Spiny Dormouse is so plentiful that it
is considered a pest in the past. The people call it the "pepper rat," because it destroys
large quantities of ripe peppers. Dormouse is the common name for several rodents
that live in Europe, Asia, and Africa. Dormice generally have large ears, long, bushy
tails, and soft fur. They feed at night on seeds and nuts. They hibernate in the winter,
often for as long as six months, depending on the climate. One species of European
dormouse, the edible dormouse, is so named because it can be eaten when it has
fattened up for its winter hibernation. Other species include the Small (or Common)
Dormouse of Europe and Asia, the Desert Dormouse of Africa, the Malabar Spiny
Dormouse of India and the Pygmy Dormouse of China. This chapter describes the
status and distribution of Malabar Spiny Dormouse in the forests of Kerala.
3.1.2 Methods
The method of questionnaire survey is already described in the Chapter 2.
Live trapping: The location for trapping in each protected area was selected by
purposive sampling, so that the habitat peculiarities of all the protected areas in Kerala
were represented in the samples (Table 1). The traps were baited with grated coconut
between 17.00 h and 18.30 h and checked for animals between 05.30 h and 07.30 h.
Trapped rodents were identified, sexed, weighed and marked permanently by ear
punching using an ear punch (National Band and Tag Co., U.S.A. No. 1538). Rodents
were identified up to the species level using the reference books (Prater, 1988; Corbet
and Hill, 1992). The animals were photographed and photographs were kept for later
reference.
Table 1. The habitat characteristics of the trapping sites
No. Protected areas Habitat characteristics
1. Neyyar WLS Low altitude moist deciduous forest, 12 km away from
human habituation.

29
2. Peppara WLS Low altitude moist deciduous forest, 1 km away from
human habituation
3. Schenduruni
WLS
Low altitude moist deciduous forest
4. Periyar Tiger
Reserve
High altitude evergreen forest
5. Idukki WLS Semi evergreen forest, boarded by 2 km wide grassland
6. Thattekkad BS Teak plantation converting into natural forest, due to lack of
plantation activities for the past twenty years
7. Chinnar WLS High altitude shola of moderate size, which lies 3 km away
from the nearby shola.
8. Eravikulam NP Shola of moderate size and grassland
9. Parambikulam
WLS
Evergreen forest, 12 km away from human habituation, at
the junction of the near by reserve forest ranges.
10. Peechi WLS Moist deciduous forest and mixed evergreen forest 6 km
away from the human habitation.
11. Chimmony WLS Low altitude moist deciduous forest and mixed evergreen
forest each 3 km away from human habituation
12. Silent Valley NP Ecotone of the evergreen forest and grassland
13. Wayanad WLS High altitude Semi evergreen forest of the plateau
14. Aralam WLS Low altitude moist deciduous forest.
Adult animals were sexed based on the morphology of their genitalia and the
sub adults by the distance between the anus and genital opening. Morphological
measurements of head and body length and tail length were made and the fur
coloration was also noted and photographed. The animals were released at the spot
where they were trapped.
3.1.3 Result
Morphology
Adult females of Malabar Spiny Dormouse weighed 70 g (N = 2) and pregnant
females 90 g (N = 2). Female hbl was between 108 mm to 110 mm and the tail length
were between 100 mm to 105 mm. Adult male was of 80 g weight, 110 mm hbl and
105 mm tail length (N = 1). Sub adult was having 50 g weight and 80 mm tail and hbl.
No morphological variations were observed across the region among the individuals of

30
the species. Sub adults were grey in colour where as the adults were more brownish in
colour. A photograph of Malabar Spiny Dormouse is given in (Plate 2). Only one
photograph of the species was published before this study was initiated. A white patch
was observed at the tip of the tail of the sub adults, which was dark black in case of
adults (Plate 3). The morphological measurements of Malabar Spiny Dormouse are
given in Table 2.
Table 2. Morphological measurements of Malabar Spiny Dormouse
Categories Weight (gm) Hbl (mm) Tail (mm)
Male 80 110 105
Female 70 108 110
Female (Pregnant) 90 108 110
Sub Adult 50 80 80
Distribution
The presence of Malabar Spiny Dormouse an endemic rodent species to the
Western Ghats was recorded for the first time from ten protected areas of Kerala. The
questionnaire survey and field observations proved that the Malabar Spiny Dormouse
is distributed in 33 out of the 39 Forest Ranges (Fig. 4) and 11 Protected Areas of the
Kerala Part of the Western Ghats. The species was recorded for the first time from the
Chimmony, Chinnar, Parambikulam, Idukki, Neyyar and Aralam Wildlife Sanctuaries
and also from Periyar Tiger Reserve, Eravikulam National Park, and Thattekkad bird
sanctuary. It is observed that trap response of rodents was species specific.
A total of 6400 trap nights were attempted and the percentage trap success was
3.625. Maximum trap success was obtained from Shendurney Wildlife Sanctuary.
Malabar Spiny Dormouse was captured in the traps laid on the floor from the three
protected areas namely the Chimmony Wildlife Sanctuary, Eravikulam National Park
and Thattekkad Bird Sanctuary. Trap nights attempted and trap success from each
protected areas, is given in the Table 3.
Lowest trap success was recorded in second session at Peechi Wildlife
Sanctuary and maximum trap success was in Chinnar Wildlife Sanctuary. Other than
by trapping the presence of Malabar Spiny Dormouse was confirmed from Protected
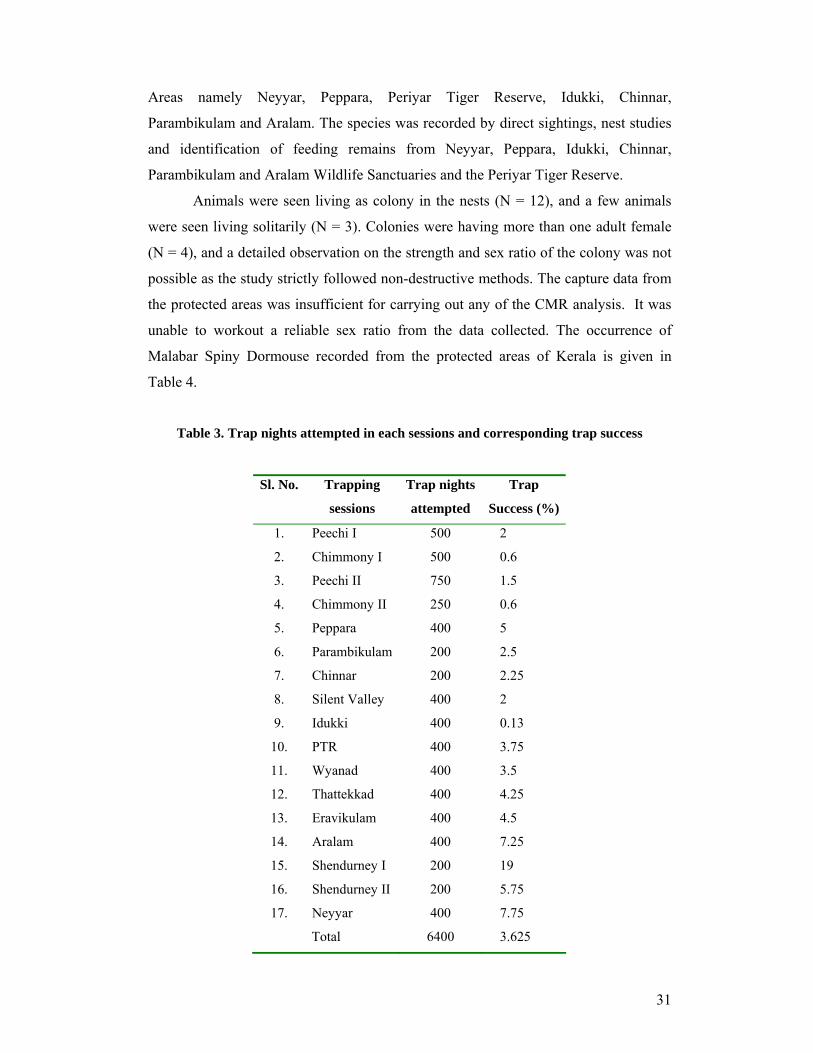
31
Areas namely Neyyar, Peppara, Periyar Tiger Reserve, Idukki, Chinnar,
Parambikulam and Aralam. The species was recorded by direct sightings, nest studies
and identification of feeding remains from Neyyar, Peppara, Idukki, Chinnar,
Parambikulam and Aralam Wildlife Sanctuaries and the Periyar Tiger Reserve.
Animals were seen living as colony in the nests (N = 12), and a few animals
were seen living solitarily (N = 3). Colonies were having more than one adult female
(N = 4), and a detailed observation on the strength and sex ratio of the colony was not
possible as the study strictly followed non-destructive methods. The capture data from
the protected areas was insufficient for carrying out any of the CMR analysis. It was
unable to workout a reliable sex ratio from the data collected. The occurrence of
Malabar Spiny Dormouse recorded from the protected areas of Kerala is given in
Table 4.
Table 3. Trap nights attempted in each sessions and corresponding trap success
Sl. No. Trapping
sessions
Trap nights
attempted
Trap
Success (%)
1. Peechi I 500 2
2. Chimmony I 500 0.6
3. Peechi II 750 1.5
4. Chimmony II 250 0.6
5. Peppara 400 5
6. Parambikulam 200 2.5
7. Chinnar 200 2.25
8. Silent Valley 400 2
9. Idukki 400 0.13
10. PTR 400 3.75
11. Wyanad 400 3.5
12. Thattekkad 400 4.25
13. Eravikulam 400 4.5
14. Aralam 400 7.25
15. Shendurney I 200 19
16. Shendurney II 200 5.75
17. Neyyar 400 7.75
Total 6400 3.625

32
Table 4. Occurrence of Malabar Spiny Dormouse
in the different protected areas of Kerala
Sl No. Protected Areas Status 1. Neyyar WLS P* 2. Peppara WLS P*** 3. Shendurney WLS A 4. Periyar Tiger Reserve P* 5. Thattekkad BS P 6. Idukki WLS P*** 7. Chinnar WLS P*** 8. Eravikulam NP P 9. Chimmony WLS P 10. Peechi WLS A 11. Parambikulam WLS P*** 12. Silent Valley NP A 13. Wayanad WLS A 14. Aralam WLS P*
P - Present * - Confirmed by feeding remaining ** - Confirmed by direct sighting, *** confirmed by nest identification
Peppara Wildlife Sanctuary
The Malabar Spiny Dormouse was recorded from most of the areas in the
Peppara Wildlife Sanctuary. Some of the locations were Chemmankala, Podiakala and
Chathankode. The result of biased trapping of Malabar Spiny Dormouse in the
intensive study area is given in the Table 5. Twelve individuals were trapped from the
intensive study area.

33
Table 5. Trapping of Malabar Spiny Dormouse
in the Peppara Wildlife Sanctuary
3.1.4 Discussion
The Malabar Spiny Dormouse was newly reported from nine protected areas in
Kerala. Terrestrial trapping is a not a good method for catching the Malabar Spiny
Dormouse. The Malabar spiny Dormouse is distributed widely in the forests of Kerala
and in the southern Forest Ranges the species is familiar to the Kani tribals. But in the
central and northern Forest Ranges the animal is not familiar with the tribal people.
Live trapping using Sherman traps yielded result from two sanctuaries and the
trapping studies indicated that the species occur in extremely low densities. Spines on
the dorsal side of the body are very prominent (Plate 4). Apart from the tropical
evergreen forests the species was recorded from the moist deciduous forests also (Plate
5).

34
3.2. Distribution and diversity of Rodents 3.2.1. Introduction Data obtained while trapping the Malabar Spiny Dormouse in the different
protected areas of Kerala is presented in this chapter. This was attempted as no
substantial data is available on the abundance of rodents from the protected areas of
Kerala. Capture Mark Recapture (CMR) method is the basic tool for estimating the
survival, density (Williams, 1996), breeding probabilities (Williams et al., 2002), and
temporary emigration (Schaub et al., 2004) in rodents. No study has been reported
from the tropical areas using CMR in considerably large extent as the Kerala part of
Western Ghats with uniform methodology so that the heterogeneity in trapability over
similar large-scale demographic changes could be assessed. Taking into account of the
limitations of CMR and the suggestions to overcome the problems in operating CMR,
the present study was designed.
3.2.2. Methods
Procedure adopted for trapping the rodents was described in Chapter 2 on
methods. Capture Mark Recapture (CMR) models were used for the analysis of the
multi stage recapture data. The history of Capture Mark Recapture techniques can be
traced back to 17th Century and the basic principles were formulated by Lincoln
(1930) and Jackson (1933) independently. Otis et al. (1978) proposed five models for
estimating abundance and recapture probability distributions. This was modified later
by White et al. (1982), who suggested eight models for estimation. The software
PROGRAM CAPTURE was created based on the models suggested by Otis et al.,
1978 and White et al., 1982.
Basics of CMR: Basically there are four assumptions based on which the whole CMR
technique has been built up (Otis et al., 1978).
a. The population must be closed.
b. Marks are permanent; the marked animals will not lose the marks
during the study period.
c. All marks are noted and recorded in each sampling occasions.
d. Each animal has a constant and equal probability of capture on each
occasion.

35
The closure refers to both geographical and demographical where as the
demographic closure has been relaxed in open models. Open models, which relaxed
closure requirement are used for long term studies to observe survival and recruitment
rates etc. where as the closed models are for short time studies (Otis et al., 1978). The
simple theory behind the abundance estimation can be explained based on the Peterson
Lencoln estimator.
N = n1n2/m2
Where N is the total number of individuals in the population, n1 is the number of
animals captured and marked in the first sampling, n2 the number of animal in the
second sampling and m2 the number of marked animals in the second sampling. In
multi sampling Capture Mark Recapture models the equation becomes much
complicated to be solved directly and so the capture probability is taken as an
estimator to work out the abundance (N).
Analysis: All the trapping results and the field data were subjected to statistical
analysis using the programs CAPTURE, SPSS Version 11, STAISTICA Version 6 and
BIODIVERSITY PRO. CAPTURE was used for the analysis of the capture recapture
data and model selection. SPSS Version 11 was used for the Multidimensional scaling
of the trapping sites. BIODIVERSITY PRO was used for the estimation of different
diversity indices. STAISTICA was used for all the other statistical analysis used
throughout the study. Abundance estimation models vis M0, Mt and Mbh was applied
using the capture data. An x matrices history of binomial capture history was not
possible since the marking was done only by ear punching and no individual animal
identification markings were attempted. The models were tested using the program
CAPTURE version 1.0. The standard error of all the estimators produced by all the
models was less than half of the estimator. Even though the program was having a
facility of model selection it was not able to perform this facility since the x matrices
of the recapture history was not able to create. In this situation the model selection was
based on the relative precession, using Coefficient of variation of the abundance
estimator worked out using the formula
Coefficient of Variation = N
SE 100×
Where SE = the standard error and N = the Population size estimated.

36
Out of the nine capture histories model Mt was chosen for seven data sets and Mbh for
two. No data set has chosen the model M0. Density was estimated using the selected
models in possible cases and in other cases the Minimum Number Alive has taken as
the abundance to work out the density. Schnabel method (Schnabel, 1938; Schumacher
and Eschmeyer, 1943) was attempted for all the data set using the formula
N = ∑∑
(Rt))(MtCt
Where N = the population size
Mt= the number of marked individuals
Ct, = total number of individuals in the sample (marked and unmarked)
and Rat = number of marked individuals recaptured in the sample (values taken at time t).
This attempt was not able to produce any result on behalf of the small sample
size, which is unable to generate reliable upper and lower values for N at 95%
confidence limits. The trends in new capture were observed by plotting the new
capture per day. Vegetation data and habitat parameters of the trapping plots were
collected and subjected to a multi dimensional scaling and the stimulus configurations
were plotted. Initially the variable altitude was used and the result was highly biased
by the effect of comparatively large range of the altitude data, which was between 250
m to 1750 m from msl. So this was removed from the variable list and only variables
regarding the vegetation and topography was used for the analysis.
Following habitat parameters and vegetation data of the trapping sites were
recorded.
1. Number of trees in each species category
2. Altitude
3. Forest type
4. Canopy cover (Qualitative estimation in a scale of 1-10)
5. Under growth (Qualitative estimation in a scale of 1-4)
6. Slope of the land (Angle of inclination)
7. Litter quantity (Thickness in cm)

37
8. Distance to the nearby water body in meters
9. Distance to human habitation in kilometres
3.2.3. Results Occurrence of Rodents
Altogether 131 Murid rodents of seven species and six insectivores of the
genus Suncus were trapped from fourteen protected areas of Kerala. Among the
rodents trapped 68.7 percent was the Black Rat Rattus rattus (Plate 6) followed by
Blanford’s Rat Cremnomys blanfordi (13.7 percent) and Spiny Field Mouse (Mus
platithryx) constitute 11.4 percent of the capture. The remaining was the nominal
capture of Golunda ellioti (Plate 7), Millardia meltada and Mus musculus. Maximum
species richness was recorded from the Peppara Wildlife Sanctuary (Table 6). Trap
mortality was not observed prominently but occurred on the fourth day at Chinnar
Wildlife Sanctuary at an altitude of 1650 m above sea level during the period of
monsoon (July). Capture success of rodents in different protected areas are given in
Fig. 5. Capture and recapture rate of rodents is given in Fig. 6.
05
101520
1 2 3 4Days
Ani
mal
s ca
ptur
ed
Peechi Chimmini PepparaParambikulam S.Valley Idukki
Fig. 5 Capture success in different protected areas

38
05
101520
P S I C P S I C P S I C
1 2 3
Days
No
of a
nim
als Capture Recapture
P-Peppara, S – Silent Valley, I – Idukki, C - Chinnar
Fig. 6 Capture and recapture rate of rodents from four Protected Areas
Table 6. Rodent species recorded from the protected areas of Kerala
Sl. No
Protected Areas
Rattus rattus
Cremnomys blanfordi
Mus platithryx
Mus musculus
Golunda elioti
Tatera indica
Millardia meltada
1. Neyyar WLS P P 2. Peppara WLS P P P P** 3. Shendurney
WLS P
4. Periyar Tiger Reserve P P
5. Thattekkad WLS P P
6. Idukki WLS P 7. Chinnar WLS P 8 Eravikulam
NP P
9. Chimmony WLS P P
10. Peechi WLS P P P 11. Parambikulam
WLS P P
12. Silent Valley NP P P
13. Wayanad WLS P P
14. Aralam WLS P P P - Present, ** - direct sighting,
In the case of insectivores, Suncus sp. was collected from Chimmony, Peechi
and Parambikulam Wildlife Sanctuaries and Silent Valley National Park and there was
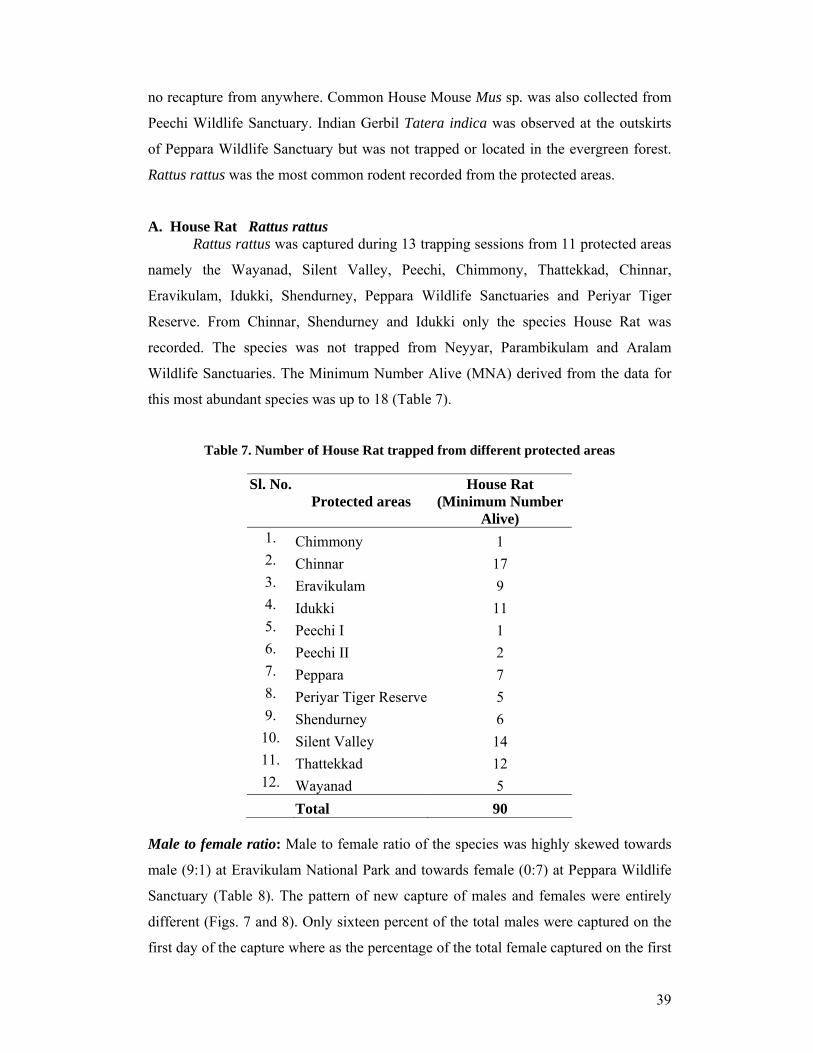
39
no recapture from anywhere. Common House Mouse Mus sp. was also collected from
Peechi Wildlife Sanctuary. Indian Gerbil Tatera indica was observed at the outskirts
of Peppara Wildlife Sanctuary but was not trapped or located in the evergreen forest.
Rattus rattus was the most common rodent recorded from the protected areas.
A. House Rat Rattus rattus Rattus rattus was captured during 13 trapping sessions from 11 protected areas
namely the Wayanad, Silent Valley, Peechi, Chimmony, Thattekkad, Chinnar,
Eravikulam, Idukki, Shendurney, Peppara Wildlife Sanctuaries and Periyar Tiger
Reserve. From Chinnar, Shendurney and Idukki only the species House Rat was
recorded. The species was not trapped from Neyyar, Parambikulam and Aralam
Wildlife Sanctuaries. The Minimum Number Alive (MNA) derived from the data for
this most abundant species was up to 18 (Table 7).
Table 7. Number of House Rat trapped from different protected areas
Sl. No. Protected areas
House Rat (Minimum Number
Alive) 1. Chimmony 1 2. Chinnar 17 3. Eravikulam 9 4. Idukki 11 5. Peechi I 1 6. Peechi II 2 7. Peppara 7 8. Periyar Tiger Reserve 5 9. Shendurney 6 10. Silent Valley 14 11. Thattekkad 12 12. Wayanad 5
Total 90 Male to female ratio: Male to female ratio of the species was highly skewed towards
male (9:1) at Eravikulam National Park and towards female (0:7) at Peppara Wildlife
Sanctuary (Table 8). The pattern of new capture of males and females were entirely
different (Figs. 7 and 8). Only sixteen percent of the total males were captured on the
first day of the capture where as the percentage of the total female captured on the first

40
day was 31. Only at Eravikulam and Thattekkad the numbers of trapped males were
more than trapped females. In the case of Thattekkad the numbers were more close to
the normal value 1:1 and at Shendurney it was 1:1.
Table 8. Male to female ratio of Rattus rattus recorded from the protected areas
Sl. No. Protected Areas
Male to female ratio
1. Peppara 0:7 2. Peechi II 0:2 3. Shendurney 1:1 4. Periyar Tiger Reserve 1:4 5. Wayanad 1:4 6. Idukki 1:5 7. Silent Valley 3:11 8. Chinnar 3:14 9. Thattekkad 6:5 10. Eravikulam 9:1
Morphology: Morphological measurements of the species House Rat of different
sexes captured from different protected areas were not compared since the trapping
was conducted across a large area irrespective of the seasons on which the
morphological characters may vary drastically (Table 9). Body colour or the fur colour
and the hair pattern were varying across each protected areas especially across the
habitat types. This has not been recorded numerically. In general thickness of fur was
high in the evergreen and shola habitats and low in the moist deciduous habitats. Fur
colour was light in sub-adults and dark in adults and feeble variation were observed
through out the region.
Rattus rattus was the most abundant species captured during the study. Out of
the 17 trapping sessions conducted in the 14 protected areas Rattus rattus was captured
during 13 sessions in the 11 protected areas namely the Peppara, Chinnar, Idukki,
Wyanad, Thattekkad and Shendurney Wildlife sanctuaries and Eravikulam and Silent
Valley National Parks. From Chinnar, Shendurney and Idukki wildlife sanctuaries
only Rattus rattus was recorded but the species was not trapped from the Neyyar,
Parambikulam and Aralam Wildlife Sanctuaries.

41
Table 9. Morphological measurements of House Rat
Weight (mg) Tail (mm) Hbl (mm) Tail/Hbl (%) Protected Areas
Sex Minimum
Maximum
Mean
Minimum
Maximum
Minimum
Maximum
Minimum
Maximum
Male 160 170 163.
3 230 240 130 170 135 170 Chinnar (N = 17)
Female 80 150 98.7 190 230 105 170 129 200
Male 100 240 136.
7 178 24 125 150 123 177 Eravikulam (N = 9)
Female 150 150 150 208 208 150 150 139 139
Male 100 170 135 230 230 120 170 135 135 Idukki (N = 1)
Female 70 170 105.
6 140 240 133 130 140 184

42
Male No capture Peechi (N = 3) Female No capture 90 190 80 118 140 156
Male 100 100 100 190 190 123 123 154 154 Periyar Tiger Reserve (N = 5) Female 95 120 98.8 185 200 113 135 140 167
Male 150 200 176.
7 210 225 143 165 130 175 Shendurney (N = 6)
Female 150 160 155 225 235 130 145 155 180
Male 130 130 130 220 220 140 140 157 157 Silent Valley (N = 14)
Female 40 170 121.
7 130 230 93 150 123 200
Male 180 230 205 210 250 130 160 150 167 Thattekkad (N = 12) Female 100 150 120 175 190 105 120 152 174
Male No capture Wayanad (N = 5) Female 60 110 93 170 200 105 142 140 162
Male No capture Peppara (N = 7) Female No capture 140 215 100 140 140 156
Hbl = Head and body length
Body weight of the males and females were compared for each region. The
mean body weight of the males was higher than the mean body weight of the females
in all the areas other than the Eravikulam National Park, where the mean weight of
males was only 0.91 times of that of females. The difference between mean weight of
males and females were highest at Thattekkad Wildlife Sanctuary (1.70 times), at
Thattekkad the male to female ratio was close to the normal value of 1:1. Tail length
of the males were between 135 to 177 percent of the head and body length of the
animals through out the region and that of female were 139 to 200 percent. Females
possessed more long tails compared to their body size.
Age class: Most of the House Rat captured was adults. There was a possibility to
misinterpret the weak females as sub adults. Pregnant female was observed at Peechi-
Vazhani Wildlife Sanctuary during the pre-monsoon season of May. Sub adults were
trapped from three protected areas namely Silent Valley, Wayanad and Shendurney.
They were trapped from Silent Valley and Wayanad during the monsoon season,
during the months of August and June respectively where as from Shendurney the sub-
adult was trapped during the month of January. Out of the 91 animals captured during
the study 78 were hidden in burrows, under rock or under litter when released from
trap, 12 animals climbed on the branch of near by trees and hidden in the clefts on the
lower branches or in the holes on the branches.

43
The House Rat was found absent in the sampling plots at Aralam, Neyyar and
Parambikulam Wildlife Sanctuaries. The plot at Parambikulam Wildlife Sanctuary was
in an evergreen forest and the plot at Neyyar Wildlife Sanctuary was in a moist
deciduous forest, but both of plots were more than 12 km away from human
habitations. In Aralm Wildlife Sanctuary the plot was at 2 km away from the human
habitation and the area was moist deciduous forest.
Abundance: Sufficient capture and recapture data required for statistical analysis was
available only from 9 sessions from 9 protected areas. The trends in new capture were
studied by plotting the new capture on each day (Fig. 9). The pattern of capture for the
initial three days was similar in the case of seven sessions with highest number of
capture on the second day and then a decrease in the number of capture. The trends in
initial three days were different in other two sessions; the second day capture was less
than that of first and third days (Fig. 9 – H and I). For four days of capture as whole
the trends fall in four categories. In the case of three sessions (Fig. 9 – E to G) an
increase in fourth day new capture was recorded.
Out of the nine capture histories model Mt was chosen for seven data set and
Mbh for two. Four data sets the model Mbh failed on behalf of the mathematical
criterion (Table 10). Model M0 was unable to apply for any dataset. Density was
estimated using the selected models in possible cases and in other cases the MNA has
taken as the abundance to work out the density.
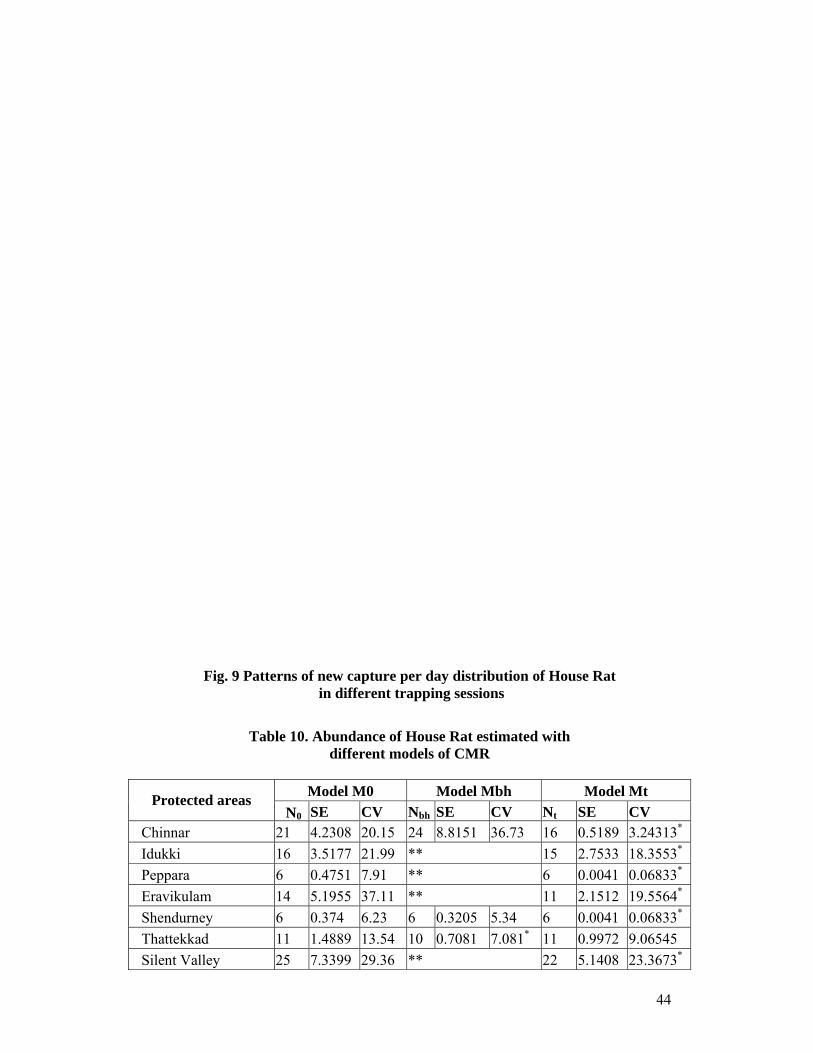
44
Fig. 9 Patterns of new capture per day distribution of House Rat
in different trapping sessions
Table 10. Abundance of House Rat estimated with different models of CMR
Model M0 Model Mbh Model Mt Protected areas
N0 SE CV Nbh SE CV Nt SE CV Chinnar 21 4.2308 20.15 24 8.8151 36.73 16 0.5189 3.24313* Idukki 16 3.5177 21.99 ** 15 2.7533 18.3553* Peppara 6 0.4751 7.91 ** 6 0.0041 0.06833* Eravikulam 14 5.1955 37.11 ** 11 2.1512 19.5564* Shendurney 6 0.374 6.23 6 0.3205 5.34 6 0.0041 0.06833* Thattekkad 11 1.4889 13.54 10 0.7081 7.081* 11 0.9972 9.06545 Silent Valley 25 7.3399 29.36 ** 22 5.1408 23.3673*
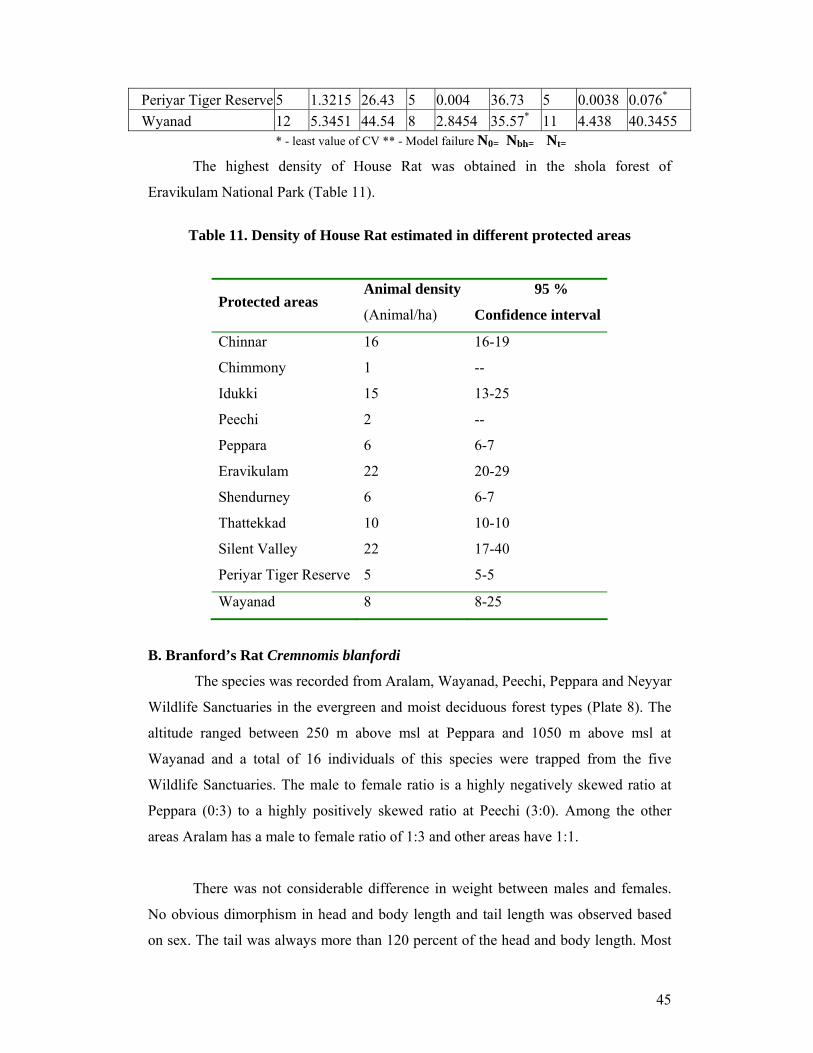
45
Periyar Tiger Reserve 5 1.3215 26.43 5 0.004 36.73 5 0.0038 0.076* Wyanad 12 5.3451 44.54 8 2.8454 35.57* 11 4.438 40.3455
* - least value of CV ** - Model failure N0= Nbh= Nt=
The highest density of House Rat was obtained in the shola forest of
Eravikulam National Park (Table 11).
Table 11. Density of House Rat estimated in different protected areas
Protected areas Animal density
(Animal/ha)
95 %
Confidence interval
Chinnar 16 16-19
Chimmony 1 --
Idukki 15 13-25
Peechi 2 --
Peppara 6 6-7
Eravikulam 22 20-29
Shendurney 6 6-7
Thattekkad 10 10-10
Silent Valley 22 17-40
Periyar Tiger Reserve 5 5-5
Wayanad 8 8-25
B. Branford’s Rat Cremnomis blanfordi
The species was recorded from Aralam, Wayanad, Peechi, Peppara and Neyyar
Wildlife Sanctuaries in the evergreen and moist deciduous forest types (Plate 8). The
altitude ranged between 250 m above msl at Peppara and 1050 m above msl at
Wayanad and a total of 16 individuals of this species were trapped from the five
Wildlife Sanctuaries. The male to female ratio is a highly negatively skewed ratio at
Peppara (0:3) to a highly positively skewed ratio at Peechi (3:0). Among the other
areas Aralam has a male to female ratio of 1:3 and other areas have 1:1.
There was not considerable difference in weight between males and females.
No obvious dimorphism in head and body length and tail length was observed based
on sex. The tail was always more than 120 percent of the head and body length. Most

46
of the animals trapped were adults but two sub adults were also trapped from Wayanad
and Aralam Wildlife Sanctuaries. The sub adults were trapped during the months of
December and March and no pregnant animals were captured at any of the trapping
period. Sixty five percent were hiding in burrows, under rocks or under litter when
released from the traps but others climbed on trees. At Peppara Wildlife Sanctuary one
individual was regularly climbing on a tree 6 m away from the trap station.
Abundance: Sufficient number of capture and recapture data to carryout the CMR
analysis was available only from two protected areas for this species viz. Aralam and
Peppara Wildlife Sanctuaries. Model Mt was selected for the data set from Aralam
Wildlife Sanctuary. Model M0 was selected for the data from Peppara Wildlife
Sanctuary, which was enough to work out Model M0 only. For the data set from
Aralam wildlife Sanctuary the Model Mbh showed failure on behalf of the
mathematical criterion (Table 12). Density was estimated based on the model selection
in possible cases and MNA in cases where the capture data was not enough to select
the models (Table 13).
Table 12. Abundance of Blanford’s Rat estimated under the three possible models of CMR
Model M0 Model Mbh Mt Protected
areas N0 SE CV Nbh SE CV Nt SE CV Aralam 4 0.825 20.625 ** 4 0.003 0.075*
Peppara 3 0.336 11.2* N0, Nbh and Nt – Abundance of Blanford’s Rat, * - least value of CV ** - Model failure
Table 13. Density of Blanford’s Rat estimated in different protected areas
Protected areas
Animal density (Animal / ha)
95% confidence interval
Aralm 4 4 - 4 Peppara 3 3 - 4 Peechi 3 -- Wayanad 3 -- Neyyar 2 --
C. Spiny Field Mouse (Mus platythrix)
A total of 17 individuals of these ground dwelling species were captured from
the seven protected areas (Plate 9). The male to female ratio ranged between 0:4 at

47
Peppara and 3: 2 at Thattekkad. This was 1:1 at Neyyar and 1:2 at Periyar Tiger
Reserve. No morphological differences were observed in the fur colour and hair
growth across different protected areas. Male varied from 30 g to 100 g and females
between 30 g to 70 g in the case of body weight and no sexual dimorphism was
observed in the case of body weight. Length of the tail varied from 50 percent of the
head and body length to 100 percent. All the trapped animals were adults and no sub
adults or pregnant individuals were trapped.
Abundance: The capture recapture data from two protected areas were sufficient to
carry out the estimation of abundance based on Otis et al. (1978). Two of the data
sets failed on behalf of the mathematical criterion when Model Mbh was attempted
and the Model Mt was chosen considering the least CV value (Table 14).
Table 14. Abundance of Spiny Field Mouse estimated
with three possible models of CMR
Model M0 Model Mbh Mt Protected areas N0 SE CV Nbh SE CV Nt SE CV Peppara 6 3.7834 63.0567 ** 4 0.0959 2.3975*
Thattekkad 5 0.8668 17.336 ** 5 0.0038 0.076*
N0, Nbh and Nt – Abundance of Mus platythrix * - least value of CV ** - Model failure
Density was estimated based on the model selection in possible cases and
MNA in cases where the capture data was not enough to select the models (Table 15).
Table 15. Density of Spiny Field Mouse estimated in different protected areas
Protected areas
Animal density (Animal / ha)
95% confidence interval
Aralam 1 -- Parambikulam 2 -- Peppara 4 4 – 4 Periyar Tiger Reserve 3 -- Silent Valley 1 -- Thattekkad 5 5 – 5 Neyyar 2 --
Habitat analysis of Rodent Community
Habitat parameters and vegetation data recorded form the plot where trapping
was carryout is given in the Table 16. Correlation between rodent community and
individual parameters were worked out and given below. A positive correlation was

48
obtained between the number of tree species and the number of rodents captured
from the protected areas (t=0.422, P=0.047 and N=16). Litter thickness was
positively correlated to the under growth (t=0.629, P=0.003, N=16) and canopy cover
(t=0.5226, P=0.23, N=16). Number of tree species in the plots was negatively
correlated to altitude (t = -0.586, P=0.002, N=16) and as expected the canopy cover
was positively correlated to the tree density (t=0.517, P=0.008, N=16).
Habitat data from the trapping plots were subjected to a multi dimensional
scaling and the stimulus configurations were plotted. Initially the variable altitude was
used and the result was then highly biased by the effect of comparatively large range
of the altitude data, which was between 250 m from msl to 1750 m from msl. So this
was removed from the variable list and only variables regarding the vegetation and
topography was used for the analysis. Among the sixteen protected areas used for the
analysis eight was plotted in the negative side of the second dimension axis and eight
in the positive side and (Fig. 10). In all the protected areas which have a value less
than 0.0002 for the stimulus coordinates dimension for the second coordinate the
mostly trapped rodent species from the region House Rat was absent or coexisting
with some other species other than Mus platithryx. Neyyar and Aralam Wildlife
Sanctuaries where Rattus rattus was found absent and Cremnomys blanfordi was
predominant were having least values of the stimulus coordinates dimension for their
second coordinate. In Peppara, Wayanad and Peechi Wildlife Sanctuaries, which have
their stimulus, coordinates dimension for second coordinate less than 0.0002, Rattus
rattus was seen coexisting with Cremnomys blanfordi. At Thattekkad Bird Sanctuary
and Chimmony Wildlife Sanctuary Rattus rattus was seen coexisting with
Platacanthomys lasiurus. In Parambikulam Wildlife Sanctuary, which also lies in the
negative side of the second coordinate Rattus rattus was not trapped, but the rodent
species Gollunda elioti was trapped.
In the case of protected areas, which had their value of the stimulus coordinates
dimension for their second coordinate greater than 0.002, lies in the positive side of
the axis, except Eravikulam either Rattus rattus was the only rodent species trapped or
found coexisting only with Mus platythrix. In all other protected areas which had their
value of the values of the stimulus coordinates dimension for their second coordinate
was less than 0.002 Rattus rattus was found absent or coexisting with Platacanthomys
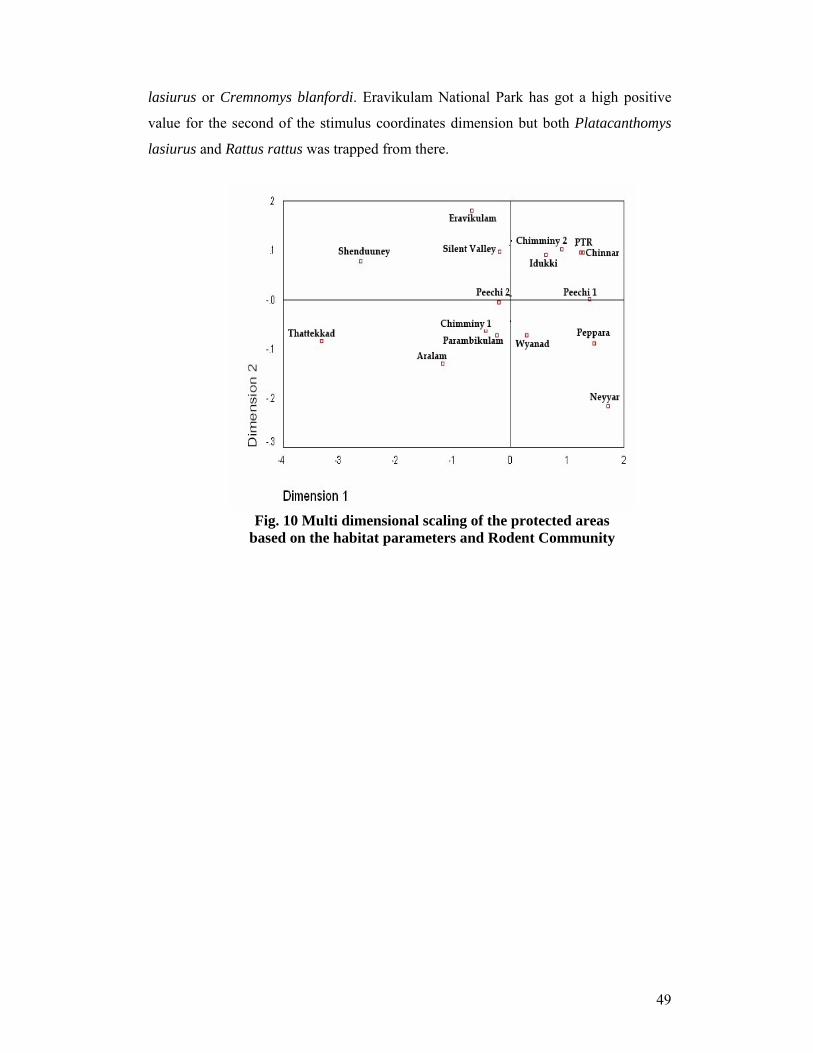
49
lasiurus or Cremnomys blanfordi. Eravikulam National Park has got a high positive
value for the second of the stimulus coordinates dimension but both Platacanthomys
lasiurus and Rattus rattus was trapped from there.
Fig. 10 Multi dimensional scaling of the protected areas
based on the habitat parameters and Rodent Community
54
3.3. Food and feeding behaviour 3.3.1. Introduction
Food and feeding studies on small mammals have proved that the regeneration
in natural and logged forest is highly influenced by the foraging of small mammals
(Adler and Kestell, 1998; Guariguata et al., 2000). Studies on the diet of small
mammals are tantamount in understanding the energy budget of the species in
explaining the demographic aspects like population structure and population
fluctuations (Anderson and Jonasson, 1986) and understanding the trophic
relationship and resource partitioning in the community (Meserve, 1981a and b).
Information on the food and feeding behaviour is crucial to understand the role of any
organism in an ecosystem. No detailed information is available on the food and
feeding behaviour of the Malabar Spiny Dormouse. Mudappa et al., (2001) reported
few species of plants as the food of Malabar Spiny Dormouse and earlier reports
mentioned its preference for Pepper and Cashew. Detailed observations were carried
out on the food items and feeding behaviour of the species with the assistance of
radio telemetry. The food and feeding behaviour of the Malabar Spiny Dormouse
was studied for better understanding of the ecological relationships of this endemic
species and to find the position of the species in the food web in the tropical forest
ecosystem.
3.3.2. Methods
The study was conducted in the intensive study area at Peppara Wildlife
Sanctuary. Three methods were adopted to study the food and feeding of the Malabar
Spiny Dormouse namely the direct observation, indirect observation and radio
telemetry assisted observations. Food and feeding observations were carried at two
locations in the intensive study area separated by an aerial distance of 9 km. The
feeding behaviour was observed directly and on the radio tagged animals. Phenology
of the area has been worked out in an earlier study (Jayson, 1998).
Direct Observation: Direct observation on the food and feeding behaviour of the
Malabar Spiny Dormouse was carried out in the intensive study area. The basic
method of focal animal sampling was employed (Altman, 1974). The observer
walked through the forest, at night very slowly listening to the sound of falling

55
discarded food from the trees. After identifying the tree from which the discarded
food remains were fallen the approximate position of the animal was determined and
two or three flashlights were used to detect the animal. Usually the feeding of the
animal in the canopy was observed. The focal animal was observed till it moved away
from the sight. This was carried out when the feeding remains were spotted under a
tree, suspected to be that of Malabar Spiny Dormouse. In the case of suspected food
remains the feeding of the animals was also confirmed by waiting for the arrival of
the animal and the initiation of the feeding. A total of 52 nights were utilised in the
intensive study area during the summer and monsoon seasons for telemetry assisted
observations.
Indirect Observation: The food species was also confirmed with out directly
observing the feeding process but depending on indirect evidence. The feeding
remains of seeds were compared for the specific pattern of gnawing by the species; in
some instance the Malabar Spiny Dormouse was sighted on the plant along with the
feeding remains falling and where no other rodent of similar size was sighted. Food
patches were also used to confirm the feeding of Malabar Spiny Dormouse in the
intensive study area. The food patch was created in the canopy using the rhizomes of
Shumanianthus were the animals were observed foraging and the patches were
checked in every hour. Food patch experiment was attempted only once.
Telemetry assisted observations: Telemetry assisted observations were carried out at
three locations in the intensive study area at Peppara Wildlife Sanctuary (Plate 10).
Malabar Spiny Dormouse was captured by keeping the live Sherman traps near to the
known and identified nest of the species. The traps were fixed on poles cut from the
same tree. The poles were tied to the branch on which the nest was situated. In some
cases artificial bridges were created using sticks for leading the Malabar Spiny
Dormouse into the traps. The traps were baited with grated coconut and fifty one
traplights were attempted in the intensive study area for catching the individuals. The
trapped animals were sexed and weighed. Radio transmitters (Telonics, USA; CHP-3;
Weight 6 gm) were attached on the neck region of the animals and were released near
their nests on the tree (Plate 11). The transmitters were having a battery life of 3
months. Tracking was started at 18.30 hrs in the evening and preceded till the animal
returned to the nest early in the morning. A total of 16,200 minutes of observations

56
were made on four animals at three locations from March 2004 to February 2005.
Attempts were made to quantify the feeding in Theobroma cacao but the
quantification could not be done as the local people collected the cocoa fruits before
ripening for commercial purpose, otherwise the Malabar Spiny Dormouse will
consume them. Similarly the attempt to quantify the pepper feeding was also failed
due to the same reason mentioned above.
Feeding activity was detected by the sound of discarded food falling on the
ground. Such close feeding points were located on the canopy of the same tree or
overlapping canopy of the nearby trees. These close points were clubbed and
combined to one occurrence point from the field during the next day time. This was
attempted only in cases where the activity of the animals was not clearly observable.
The points where feeding activity was identified were named as feeding points and
the movement paths also were located and marked.
3.3.3. Result
Food species
Twenty-five plant species including four commercial crops were identified as
the food species of Malabar Spiny Dormouse (Table 17). Twelve food species
including two commercial crops were identified using location telemetry and four
species identified by direct sighting and the remaining species were identified by
indirect evidences (Table 18). Common food items of the species in the intensive
study area were Terminalia bellerica, Persia macrantha, Tamarindus indica, Melia
dubia and Pepper (Plate 12). The animal consumed aril, seeds, flower and rhizome of
plants and there was no evidence to show that the animal consumed tender leaves, but
chances for such a feeding habit cannot be ruled out. Seeds or fruits were consumed
from twenty one species; flower was consumed from five species and rhizome from
one species. Cotyledons of seeds of seven plant species, mesocarp from two species
and aril from one species were fed by the animal. The fleshy basal portion of the
flowers was consumed. The fruits of three species and seeds of five species even
though fed by the species, the exact portion of the fruit and seed consumed were not
clear. During summer Artocarpus heterophylla and Theobima cacao species were
used for obtaining food and during monsoon Ficus, Knema attenuata, and
Theobinima cacao were consumed.

57
Animals passed over the fruits of Theobroma cacao but consumed only the
matured fruits before ripening. Preference of food was mostly according to the
availability but the species showed preference for the seeds of Terminalia bellerica in
wild and Theobroma cacao in the case of commercial crops. Piper sp. was fed in
wild and commensal areas. The animals were considered as a pest in the plantations
(Rajagopalan, 1968) at the forest fringes and settlements inside the forest especially
on Anacardium occidentale, Piper nigrum and Theobroma cacao. Three cases of
controlling the species by poisoning were recorded between September 2002 and
March 2005. The animals were feeding from the plants, which have canopy
continuity with the forest area. Tribals used to remove all the canopy continuity to the
commercial crops from the forest area in order to protect the crop from the Malabar
Spiny Dormouse.

58
Table 17. Food species of Malabar Spiny Dormouse and feeding parts
Sl. No. Plant species Plant group Feeding part
1. Anacardium occidentale Commercial crop Cotyledons 2. Aporosa lindleyana Tree Mesocarp
3. Artocarpus heterophylla Commercial/Wild tree Cotyledons
4. Bombax ceiba Tree Flower
5. Careya arborea Tree Fruit/ Flower
6. Ficus sp. Tree Fruit
7. Garcinia cowa Tree Mesocarp
8. Holigarna beddomei Tree Cotyledons
9. Hydnocarpus pentandra Tree Cotyledons
10. Knema attenuata Tree Aril/ Flower
11. KORANDI Tree Seed
12. KURAVI Tree Seed
13. Macaranga indica Tree Seed
14. Madhuca longifolia Tree Seed
15. Melia dubia Tree Seed
16. Persea macrantha Tree Fruit
17. Piper sp. Commercial/Wild climber Cotyledons
18. Sarcostigma klinii Liana Cotyledons
19. Shumanianthus virgatus Shrub Rhizome / Seeds
20. Symplocos anamallayana Tree Flower
21. Syzygium caryophyllatum Tree Flower
22. Tamrindus indica Commercial tree Endocarp
23. Terminalia bellerica Tree Endocarp
24. Theobroma cacao Commercial tree Endocarp
25. Vitex altissimo Tree Fruit
Feeding behaviour
The feeding remains were easily identified by the characteristic circular
incisor marks on small seeds and circular opening with narrow gnawing marks on the
wall in the case of big fruits (Plate 13). Seed hoarding behaviour was not common in
the species but a sign of hoarding of the seeds of the species Terminalia bellerica was
recorded from low elevation forests of Kasragod, in the northern part of the State. In

59
the case of Theobroma cacao animal opened the mesocarp of the fruit mostly from
the top portion (N=38) sitting on the fruit and the head is inserted into the fruit. The
head was taken outside intermittently to throw away the discarded portions. The
openings were more or less circular with a mean diameter of 3.6 cm (N=45). In the
case of few fruits the openings were towards the basal portion of the seed (N=7).
These fruits were on small branches and the animal could feed the contents by
perching on the branches. In most of the cases, half of the seed inside the fruits were
consumed. The Hydnocarpus pentandra fruits were consumed through a hole on the
upper part of the fruit and half of the seeds were consumed (N=18). Animal handled
the seeds for removing the epicarp and mesocarp and then made a hole in the
endocarp to feed on the cotyledons in the case of small fruits like Terminalia
bellerica. Half portion of the Tamrindus indica fruits were cut open and the
cotyledons were consumed keeping the remaining half of the fruit including the
epicarp intact in the plant. In this case also the species consumed only ripened fruits
(Plate 14).

60
Table 18. Seasonal pattern of feeding in Malabar Spiny Dormouse
Months Sl.
No
Species of
trees
Jan
Feb
Mar
Ap r
May
Jun
Jul
Aug
Sep
Oct
Nov
Dec
1. Anacardium
occidentale
X X X X
2. Aporosa
lindleyana
a a
3. Artocarpus
heterophylla
X
a
X
a
X
a
X
a
4. Bombax
ceiba
* * *
5. Careya
arborea
* * * * * * * *
6. Ficus Sp. X
7. Garcinia
cowa
a a
8. Holigarna
beddomei
a a a a
9. Hydnocarpu
s pentandra
a a a a
10. Knema
attenuata
a a a a a a
11. Unidentified * * * *
12. Unidentified a a
13. Macaranga
indica
* * * *
14. Madhuca
longifolia
* * * *
15. Melia dubia * * * *
16. Persea a a a a

61
macrantha
17. Piper sp. * * * *
18. Sarcostigma
klinii
* * * *
19. Shumaniant
hus virgatus
X X X X * * * *
20.
Symplocos
anamallaya
na
a a
21.
Syzygium
caryophyllat
um
a a
22. Tamrindus
indica
a a a a
23. Terminalia
bellerica
* * * *
24. Theobroma
cacao
X X X X X X X X X X
25. Vitex
altissima
a a * * * *
* - Identified by location telemetry, X - Identified by direct observation, a-
Identified by indirect evidences.
In the case of pepper the species opened up the pepper drupes and consumed
the cotyledons. Half portion of the epicarp, mesocarp and endocarp were left in the
drupelets after feeding. Fully and partially eaten drupelets were observed on the
plants. All the fully eaten drupelets were observed initially attached to the plant and
later dried and fallen (N=108) and most of the partially eaten droplets were fallen
fresh (N=34) but some were seen attached to the plant (N=15). All the consumed
drupelets were fully consumed in the case of wild species (N=8). Generally the
animals were seen foraging individually but in the case of Terminalia bellerica
considerably large number of animals were observed feeding at same time (n<12).

62
This type of feeding continued up to 4 to 7 days on a tree by which time the seeds
will be completely finished.
Male: The male animal was foraging in an area of varying canopy cover. Out of the
14 points identified eight points were having food items. Remaining six points were
not having any food items but these points were at an area were relatively high
vertical thickness for the tree canopy due to high lower and mid story cover. The
animal spent a considerably long period of 815 m on reeds at two points (P5 and P6)
(Fig. 11). Daytime observations recorded fresh holes on the tender tips of the reeds as
if the animal had eaten the tender base of the growing stem by making holes on the
sheath covering the basal region. But attempts using searchlights to observe the
feeding failed. It was also not possible to conclude whether the animal was feeding on
the tender shoot or some insects inside the sheath.
Fig. 11 Activity pattern of the male Malabar Spiny Dormouse
The adult male showed two types of foraging movements. Short feeding bouts
were common in short distance foraging but in the long feeding bouts were recorded
in long distance foraging. This type of long feeding bouts was for less number of
days. Solitary foraging. Coco and Terminalia bellerica most preferred food. Dare to
come down for Shumanianthus sp. The animal utilised considerably short periods (10

63
to 180 m) on feeding at a feeding point and then either moved to another feeding
point, nest or to the thick canopy area, in the case of foraging with in thirty five meter
from the nest. The animal spent long periods at a feeding point (210 m to 560 m) in
case the feeding point was more than 800 m away from the nest. Two feeding points
were identified which were more than 700 m from the nest (P9 and P12) (Fig. 11).
P9 was an isolated Terminalia bellerica tree of 47 m height with light canopy and the
point also covered an adjacent Melia dubia tree. The seeds of the tree were fed by the
species and the animal utilised less than 10 m on this tree. P12 was a Theobroma
cacao tree 1.2 km away from the nest inside a commercial plantation where the
canopy was light. Feeding at these areas continued for long time periods with out
changing the position from one tree to another. Mass feeding was observed on
Terminalia bellerica, with more than 12 animals at a time on a single tree. When the
male Malabar Spiny Dormouse was followed during the movement to the Terminalia
bellerica tree other members of the colony were also observed moving in the same
route. The mail stopped foraging on this Terminalia bellerica tree often three nights
but other members of the colony continued feeding until the seeds finished.
Two feeding points were identified which were more than 900 meter from the
nest on was an isolated Terminalia bellerica tree of 47 m height with light canopy
during the period of observation time and the other was a Theobroma cacao
plantation 1.2 km away from the nest, here also the canopy was light. Feeding in
these areas continued for long time with out changing the position from one tree to
another. In the case of Terminalia bellerica there were mass feeding when the seeds
are matured. More than 12 animals were sighted at a time on a single tree. The mail
stopped foraging in this Terminalia bellerica tree after three nights but other members
of the colony continued moving to the tree until the seeds were finished. Even though
the activity of the animal on the thick canopy area was not able to observe, no feeding
remains were found falling from the spot it was located, so it was concluded that the
animal was not carrying out feeding activity. No seasonal variation of feeding was
observed between different habitats. The feeding activity of the species was started at
1900 hours and the animal returned to the nest by 4.00 hours.
The Hydnocarpus pentandra fruits were eaten with a hole in the upper part of
the fruit but half of the seeds were consumed (N=18). The animal handled the seed
for removing the epicarp and mesocarp and then made a hole in the endocarp to feed
64
the whole cotyledons in the case of small fruits like Terminalia bellerica. Half portion
of the Tamrindus indica fruits were cut open and the cotyledons were eaten keeping
the remaining half of the fruit including the epicarp intact with the plant. In this case
also only ripened fruits were consumed. Animals were seen foraging individually and
different animals were feeding on adjacent tree species same time (N=5). In the case
of Terminalia bellerica large number of individuals were observed feeding at same
time (n<12). These mass feeding proceeds to 4-7 days by which the seeds more or
less finish.
Female: The female was pregnant when trapped. Long feeding bouts were observed
in females. Solitary foraging was observed and they never came down during tracking
from trees. Malabar Spiny Dormouse was feeding on a variety of food items available
in its habitat. The seed predating nature of this species is adept at harvesting seeds
and other food items directly from the canopy. The species is capable of long distance
foraging movements up to 1.25 km when the favorite food items were available. The
animal is endemic to the region and the favorite food items include the endemic genus
like piper and the exotic species like Theobroma cacao and Anacardium occidentale.
Anacardium occidentale nuts are fed by only few animals’ species. The feeding of the
Malabar Spiny Dormouse on this exotic species is unique. The openings made on the
seeds or fruits were of different size but they were of similar circular shape. The
feeding remains of the species were recognizable by the shape of the hole made in the
nuts. The openings made by the Rattus rattus, Theobroma cacao was of irregular
shape and with narrow gnawing mark. The Terminalia bellerica and Piper nigrum
were not fed by two species of rodents namely the Rattus rattus and Cremnomys
blanfordi, in captivity even after starving for three days.
Malabar Spiny Dormouse is highly selective of the status of the fruits or
seeds. The animal consumed the mature Theobroma cacao fruits before it ripen but
only the presence of movement marks were recorded on the fruits, which were not
matured. Malabar Spiny Dormouse also had different mode of feeding according to
the size of edible portion of the food species. More studies will be needed to correlate
the nutritive value of the food items and the quantity of consumption. The seed
holding behaviour recorded from the northern part of the State also showed high
diversity in the feeding behaviour of the species. This also supported the general
assumption that the degree of autecology of small mammals varies greatly with

65
change in demography and climatic pattern (Meserve et al., 2003) the probability of
folivory can not be ruled out in the case of Malabar Spiny Dormouse. The absolute
similarity of feeding by the species on one of the favorite food species, Terminalia
bellerica to that of the Hazel Nut Dormouse in Europe on its favourite food species
Hazel nuts is worth mentioning.
Pest of cash crops
The species was doing damage to five species of cash crops in the forest
fringes. The animal came out of the nest hole and foraged only during night. Three
cases of control by poisoning were observed between September 2002 and March
2005. In most cases the food items were consumed after maturation but before the
ripening. This species also observed as moving up to 1.25 km in search of favorite
food items. The animal is endemic to the region, but the most favorite food items
include the endemic plant genus piper and the exotic species like Theobroma cacao
and Anacardium occidentale. This proves that the feeding of small mammals is
always changing according to the availability of the food. Anacardium occidentale
seeds have been observed as fed by limited number of animals. The development of
dentine features to break the extremely corrosive seed coat of the species should by
an evolutionary change attained by Malabar Spiny Dormouse after the introduction of
the tree into the region. The animal is highly selective against the status of food items
and the observation of movement marks on the fruits of Theobroma coca and their
feeding only on the mature fruits before ripening supports the selection. Dormouse
also has different mode of feeding according to the size of edible portion of the food
species. The observation of food holding behaviour in the northern part of the Kerala
part of Western Ghats also showed the existence of high diversity in the feeding
behaviour of the species. This also supports the general assumption that the degree of
autecology of small mammals varies greatly with change in demography and climatic
pattern (Meserve et al., 2003). The chance of flavor also to be suspected in case of
Malabar Spiny Dormouse. Close similarity in feeding favorite food species
Terminalia bellerica to that of Hazel Nut Dormouse in Europe on its favorite food
species Hazel nuts is interesting since both the species fall in different taxonomic
orders and biogeographic regions. The conventional methods of avoiding this animal
by removing all the canopy connection to the cultivating plants are now being
replaced to the modern chemical rodenticide applications. This is a critical problem,

66
which may intensify the bioaccumulation of pesticide in the forest ecosystem. The
animal is a pest in the plantations, situated at the edge of the forest areas and having
canopy continuity with the forest. The conventional method of avoiding the animal,
by removing all the canopy connection to the cultivated plants is now being replaced
by the modern chemical rodenticide applications. This is a critical problem, which
destroys the population of Malabar Spiny Dormouse. The conventional solution
practiced by the tribals i.e. the clearing the canopy connection with the plantation is
an excellent practical solution.
3.3. Discussion
Yunger et al. (2002) reported that predation, competition and the interaction
of these two factors influence the foraging decision of the small mammals. By
manipulating the number of predators and the competitor species, they proved that the
behavioural response towards the temporary adjustments of these factors is species
specific. The present study also brought out enough evidence to show the influence
of risk of predation in the foraging behaviour of Malabar Spiny Dormouse. The
animals changed the feeding points during foraging, if they were feeding with in a
small distance from the nests (80 m maximum). The foraging movements were
susceptible to predation risks. But the animals dared to ignore the risk, and moved
through the canopy with mild mid story cover and fed on a single tree for
considerably long time (560 minutesmax) in order to feed on the most favourite food
items. Male have been carrying out the small distance movements for consecutive
nights (3max) where as the females continued feeding until the seeds finished. The
male was intermittently moving through the area with more mid story from the
feeding tree if the feeding tree is at an area with less mid story. These movements can
be attributed for avoiding the risk of predation while in a high risky location for more
and time, especially when the potent predators are the aerially flying birds of prey.
The sexual dimorphism in behaviour was also supported by the fact
that the biased trapping of Malabar Spiny Dormouse by fixing the traps nears the
identified nests. Males were trapped only when the traps were kept for more nights,
proving that the males are more neophobic than females and so less exploratory too.
Nichols et al. (2004) reported that the males of Mus spicilegus and Mus musculus
musculus are more exploratory than females. Fine scale foraging experiments within

67
well replicated long term biotic manipulations are necessary to ascertain the biotic
and abiotic factors influencing foraging decisions (Kelt et al., 2004). A study with
fine scale experiments can be designed only based on the basic data and hypotheses
brought out by base line studies like the present one, especially on a non-studied
species like Malabar Spiny Dormouse. The practical difficulties in carrying out the
foraging behaviour observations on a nocturnal rodent, especially in a tropical rain
forest, which are frequented by large mammals and torrential rain, also hamper the
study in many ways.
In the case of Malabar Spiny Dormouse the recorded predation (N=1) using
location telemetry was by nocturnal birds of prey on a sub adult Dormouse. More
than fifty percent of the attempts in location telemetry observations during the present
study were partially or fully restricted due to the above reasons. Malabar Spiny
Dormouse is a selective feeder and is adept in seed predation. This endemic rodent
fed on a variety of food items and its preferred food species included exotic cash
crops introduced only the last three centuries. The trophic relationship of this species
in the forest ecosystem is crucial because it act as an important pray base in the
canopy and as a potential seed predator. The foraging decisions of the species are
depending on the predator pressure and food availability. Sexual dimorphism exists in
the foraging behaviour of Malabar Spiny Dormouse. Males are found less exploratory
than the females. The animals are capable of carrying out foraging trips up to 1.25
km, occasionally in search of selected food species.

68
3.4. Behavioural observations on
Malabar Spiny Dormouse 3.4.1 Introduction
The impact of small mammals on rain forest ecosystems is poorly understood
(Wells et al., 2004), but various studies in the tropical forests indicated small
mammal communities as major ecological force due to their seed predation and of
consumption (Struhsaker, 1997; Adler and Kestell, 1998; Guariguata et al., 2000).
Behavioural patterns of a species is evolved by different ecological factors existed
during different time periods in the life history of the species. It is crucial to study the
behaviour patterns of an endemic rodent species of the Western Ghats. The present
chapter deals with the behavioral characteristics of Malabar Spiny Dormouse.
3.4.2. Methods
Estimation of home range and activity pattern: Four animals were studied using
radio telemetry. Details of the methodology are described in Chapter 3.3. The
position of the radio tagged animal was recorded in every ten minutes. Initially the
animals were located and sighted, but later the sighting of the animals was not
insisted as this was interfering with the natural movement of the animals. The
position of each sighting location was not able to mark using GPS, as these animals
foraged in areas where satisfactory GPS signals were not available. As these animals
made only small distance movements, it was not possible to mark the points using
GPS. So the positions of the animals were recorded in relation to the nearest trees.
The occurrence points and feeding points were well marked in the plot and the
movement routes tracked at night was marked with temporary marks on the trees
along the route. These marks were located and plotted in next day morning. In the
case of long distance movements the path way was followed by tracking the animal
and the trees through which the animal moved were marked. This route also was
plotted on next day morning using GPS. The sighting of other individuals of the same
species was also recorded. It was not possible to study many behaviour patterns in the
wild due to the lack of visibility during night. The artificial light disturbed the natural
movement of the animals and the thick canopy prevented the spotting of animals

69
directly. Due to the small size of the organism and the nocturnal habit it was difficult
to observe the activity of the animals in the canopy. Observations were made at
daytime where the animals were located during night.
Peppara forest, which is a part of the peninsular forest, received rains in all
months of the year. Out of the 41 days of field work tracking, 14 days were fully
interfered by rain, 3 days by elephants, 10 days due to the problems of the telemetry
equipment and 3 days due to other reasons. Out of the remaining 11 days, the animal
was tracked for the whole night on five nights and remaining days were partially
interfered by rain. Altogether 1027 locations of the animal movement were identified
out of these eight points were having food plants. At one point the animal was located
on the forest floor while feeding. Home range of the species was estimated using the
movement data collected using the radio telemetry. Minimum convex polygon (MCP)
method (Southwood, 1966) and Fixed kernel estimator was employed using the data
as such and also after standardising the data with multivariate normal scores. Least
Squire Cross Validation (LSCV) was used to estimate an optimal value of h (Seaman
and Powell 1996). Swihart and Slades auto correlation index was estimated to
confirm the independence of data (Swihart and Slades, 1985). The data set is
considered as independent for an index value less than 2. Software CALHOME
version 1.0 was utilised for the home range estimations using Minimum convex
polygon method and the HOME RANGER version 1.5 (Ursus Software, Canada) was
used to estimate home range using adaptive kernel and fixed kernel estimators. The
home range estimations of male and female were carried out using different
estimators. In the case of male Malabar Spiny Dormouse at location III, there were
two outlier points, which were up to 800 to 1100 m away from the nest. So to treat
these outliers in better way home range for male Malabar Spiny Dormouse was
estimated based on the Fixed Kernel Method using the non standardised data.
The Minimum Convex Polygon method at 95 and 95 percentage contour
estimates exaggerated home range including more areas, which were not frequently
visited by the animal. The fixed kernel estimator treats the outlier’s comparatively
better way so that the home range estimation was carried out using this method at 95
percent contour at location III ignoring the less number of fixes. Along with the

70
telemetry assisted observations direct observations were also made for identifying the
activity pattern, the details of this method is already presented. The observers reached
the study locations 30 minutes before the sunset and the nests were observed by
sitting near the nest, before the animal emerged out of the nest.
Nesting Behaviour: Nineteen identified nest of Malabar Spiny Dormouse were
regularly observed in the intensive study area at Peppara Wildlife Sanctuary between
August 2002 and July 2005. The nests were identified primarily based on the
characteristic circular shape of the opening and observing the oozing from the nest.
The suspected nests were identified after examining the nest contents. The nests were
confirmed by the presence of spines in the nest contents and were examined once in a
month for the liveliness. The liveliness of the nests was confirmed by the presence of
fresh leaves in the nests in every month. The direction of nest opening angles were
recorded and the entrance hole diameter of the nests were measured in every month.
The height at which the nests were situated was measured using a measuring tape.
One nest was cut open to study the nest structure, as the number of nests available for
the study was limited. Three nests were observed for three days between 18.00 h and
19.30 h for assessing the number of animals in the nest. Each nest was examined with
out disturbing the animals inhabiting it.
3.4.3 Result
Activity pattern
At location I, one adult female Malabar Spiny Dormouse with 70 g weight
was fitted with telemetry transmitter, but it was possible to observe the animal only
for 20 hours during the four days (Table 19). Elephants frequently visited the area and
on the fourth day the transmitter was detached and located on the ground. At location
II an adult pregnant female Malabar Spiny Dormouse was the study animal. 4670
hours of observations were carried out on this animal, between March 2003 and May
2003. The transmitter stopped giving signals due to some unknown reasons for 20
days during the study. At location III a sub adult and an adult male Malabar Spiny
Dormouse were studied. 10270 minutes of observations were carried out on the adult
male but the sub adult was predated on the very same day when the telemetry

71
transmitter was attached to it. The process of tracking was frequently interfered due to
rains and by the intervention of other large mammals especially the elephants.
Table.19 Details of telemetry observations carried out in the Peppara Wildlife Sanctuary.
Morphology
Location Sex Hbl (mm)
Tail (mm)
Weight(gm)
Duration of observation
(min) Remarks
Location I Female 110 105 70 1200 Location II Female 108 105 70 4670 Pregnant Location III Female 80 85 50 60 Location IV Male 110 105 90 10270
At location I, before the second night of tracking the animal was located
hiding in the epiphytic growth on a nearby tree 28 m away from the original nest. On
the third night the animal created a new nest in a slit of a near by old tree which had
canopy connections with adjacent trees. A nest of one day old contained dry and fresh
leaves. The animal was found resting at the bottom of the nest hollow during daytime
but moved up when disturbed by knocking on the tree. After each disturbance the
animal came down to the bottom exactly after 12 minutes, but again went up if
disturbed again. The animal was having wounds on its body, which was not recorded
when it was released after attaching the transmitter. The cable attaching the
transmitter was found gnawed on the third night and the transmitter was recovered
from the ground after the third night. The animal was observed for a total of 1200
minutes, but all the observations were partially or fully interfered due to the
movements of wild elephants.
Telemetry observations on another female and male carried out at Location II
and III brought out considerable information regarding the behaviour patterns of the
Malabar Spiny Dormouse. Adult female Malabar Spiny Dormouse trapped for
telemetry studies at Location II was pregnant. The animal was of 90 g weight and was
trapped from a riverine habitat. A total of 4670 minutes of observations were carried
out and 467 locations of the animals identified. In seven points the animal used to be
during its activity at night. The female Malabar Spiny Dormouse did not showed any
consistency in time for emerging from the nest. The animal came out of the nest
between 18. 50 h and 19.30 h. Longest distance movements recorded was for foraging
was 85 m from the nest. The animal never came down to the forest floor during the

72
period of observation. The animal was recorded as spending 520 minutes in a canopy
marked as a point (P6) of occurrence of the animal (Fig. 12). The animal was making
frequent movements in the canopy, which was not able to pinpoint using the location
telemetry. The animal could be located using searchlights but the attempts failed as it
was found disturbing the natural foraging movements of the animal. In general the
female Malabar Spiny Dormouse was spending short periods at one point in the
canopy. At location III a sub adult on which transmitter was attached were predated
on the first night of observation, when the observation was being carried out. The
animal was predated 17 minutes after it came out of the nest. At location III, out of
the 60 days of tracking, 34 days were full and 9 days were partially affected by rain.
1027 locations were identified from which 14 potential points were marked in the
field. The point P9 was 820 m away from the nest and another point P12 was 1.2 km
away from the nest (Fig. 13 and Fig. 14). All other points were with in 35 m distance
from the nests. The animal showed consistency in the time of emerging from the nest
for foraging for some of the consecutive days but frequently changed the timing. For
the initial six days of observation, the animal spends considerable time (180 min to
230 min) in the nest after a first feeding bout of 45 min to 150 min duration. The
animal gnawed the nest hole entrance intermittently when they went into the nest. The
animal was sighted 13 times but direct sighting was avoided as it interfered with the
natural foraging movement.
These observations revealed that the locations were having trees with seeds,
fruits and flowers, but this was not the case in all occasions. A total of seven points
were identified during the study, which the animal visited regularly or spent
considerable time at occasional or even single visits. Out of these seven points
identified, only five were having potential food items. The point P7 and P6 were
devoid of any flower fruit or seed (Fig. 15), but the animal spent one night full at
these points. Eight to ten days after the trapping of the pregnant female, the animal
was found intermittently visiting the nest during the foraging movements. This
particular behaviour was not recorded in detail as the transmitter gave bad signals
during that period. But after 20 days when the signal was clear, the animal was not
seen making such intermittent visits. From the limited observation it was presumed
that these visits were for feeding the young ones.
73
Fig. 12 Activity pattern of the female Malabar Spiny Dormouse
Home range
Home range was estimated using the data from telemetry study locations II
and III. Minimum Convex Polygon gave the highest estimates for the male Malabar
Spiny Dormouse (Figs. 16 and 17). At the 95 percent contour the minimum value was
estimated by Fixed Kernel estimator using non standardised data (Fig. 18). In the case
of female Malabar Spiny Dormouse at location II the Minimum Convex Polygon
gives the highest estimates of the home range (Fig. 19) and Fixed Kernel estimator
using the non-standardised data estimated lowest value. As the 50 percent contour
under the Fixed Kernel method using the non-standardised data enclosed the whole
marked points, in order to reduce the exaggeration in estimation, the home range was
estimated at 50 percent contour at this location. For the female Malabar Spiny
Dormouse at location II the MCP method estimated highest value of home range.
The Swihart and Slades auto correlation index was with in the allowed limit for all
the datasets (Table 20 and 21).

74
Table 20. Home range of the Malabar Spiny Dormouse (Location II, female)
Method Contour(%)
Home range (ha)
Minimum Convex Polygon 95 1.1
Minimum Convex Polygon 90 1.1
Minimum Convex Polygon 85 0.66
FK un standardised 95 0.24
FK un standardised 75 0.47
FK un standardised 50 1
FK standardised 95 19.87
FK standardised 75 9.56
FK standardised 50 4.91
Fig. 16 Home range of the male Malabar Spiny Dormouse
(80% Minimum Convex Polygon method)

75
Fig. 17 Home range of the male Malabar Spiny Dormouse
(90 % Minimum Convex Polygon method).
Fig. 18 Home range of the male Malabar Spiny Dormouse
(Fixed Kernel Method using nonstandardised data).

76
Fig. 19 Home range of the female Malabar Spiny Dormouse (90% Minimum Convex Polygon).
Table 21. Home range of the Malabar Spiny Dormouse (Location III, male)
Method Contour%
Home range(ha)
Minimum Convex Polygon 95 55.89 Minimum Convex Polygon 90 4.3 Minimum Convex Polygon 85 0.45 FK un standardised 95 0.97 FK un standardised 75 0.48 FK un standardised 50 0.16 FK standardised 95 4.82 FK standardised 75 1.92 FK standardised 50 0.75
Nesting behaviour
All the recorded nests were vertical hollows with opening at the bottom. The
details of the nests observed are given in Table 22. It was not possible to measure
the length of the hollow through non-invasive techniques. Two of the nests were
abandoned by the dormouse colony, which inhabited it. One nest was abandoned
when the tree (Persea macrantha) was dried and the canopy connection with the
other trees was lost. Second nest in a Vateria indica tree, which was regularly
monitored, was abandoned when it was filled with rainwater. The nest height varied

77
from 3 m to 32 m (Fig. 20). The 23 nests identified were made on 11 species of trees
and 30 percent of the identified nests were made on Lagerstroemia microcarpa. The
nests were seen opening into different directions (Fig. 21) but 61 percent of the nests
were opening towards the West. GBH of the trees in which Malabar Spiny Dormouse
nests were located ranged between 0.48 m to 4.8 m. All the nests were containing dry
and fresh leaves. The characteristic oozing was observed from the nest beginning
from the initial south-west monsoon showers, maximum up to the month of
September in Peppara Wildlife Sanctuary. Presence of urea was confirmed from all
the nest contents. Using the location telemetry it was confirmed that the animal was
entering into the nest only through the bottom of the nest. These regular movements
of the colony members created a dark shade at the bottom of the nest, which prevailed
after the oozing was another characteristic (Plates 15 & 16).
Most of the nests were with circular opening and the mean diameter of the
nest opening was 50.1 mm (N = 19). This was so because three high values existed so
the mode 48 mm with mode frequency 7 was taken as the measure of central
tendency. Out of the 19 nests measured 15 falls in the range of 47 mm to 49 mm (Fig.
22). The nest hole was maintained by the colony with in this narrow range. The male
animal studied at location II was observed gnawing the nest entrance for maintaining
the size (N = 3) and the entrance of the nest, abandoned by the Malabar Spiny
Dormouse colony near the location III was later closed due to the growth of bark.
Another nest located on 8th September 2002 was cut open by local people on 22nd
December 2002 for capturing the animals and after this incident, the nest hole started
shrinking and finally closed with in six months. The local people widened one nest
opening in an attempt to capture the animal and the colony abandoned the nest after
the disturbance. After three months when the nest hole reduced to the normal size the
nest was again occupied. One tribal report from Idukki Wildlife Sanctuary states that
a snake was found in the nest of a Malabar Spiny Dormouse, which consumed its
prey but trapped inside the nest as the snake could not come out of the nest after the
feeding. This happened, as the nest hole was much small to wriggle out with a
dormouse.

78
0
5
10
15
20
25
30
35
0 5 10 15 20
Nests
Hei
ght (
m)
Fig. 20 Height of the Malabar Spiny Dormouse nests from ground
Table. 22 Characteristics of Malabar Spiny Dormouse nest
Nest characters
Sl No. Species of trees Height(m)
Opening Diameter
(mm)
Opening directions
gbh of trees(m)
1. Artocarpus hirsutus 32 48 SE 2.3 2. Carallia brachiata 21 48 SW 0.74 3. Bombax malabarica 15 48 SW 0.48 4. Hopea parviflora 22 50 NW 1.6 5. Lagerstroemia
microcarpa 20 47 NE 0.78
6. Lagerstroemia microcarpa
16 48 NE 1.05
7. Lagerstroemia microcarpa
12 49 SW 0.65
8. Lagerstroemia microcarpa
18 49 W 0.64
9. Persea macrantha 14 47 SW 0.72 10. Lophopetalum
wightianum 3 70 NE 2.1
11. Bridelia crenulata 19 48 SW 0.82 12. Artocarpus hetrophyllus 17 48 NW 0.85 13. Lagerstroemia
microcarpa 22 50 NW 0.90
14. Vateria indica 11 48 SW 0.76 15. Lophopetalum
wightianum 18 49 NE 1.3
16. Artocarpus hirsutus 30 47 SE 0.75 17. Lophopetalum
wightianum 8 62 N 1.9
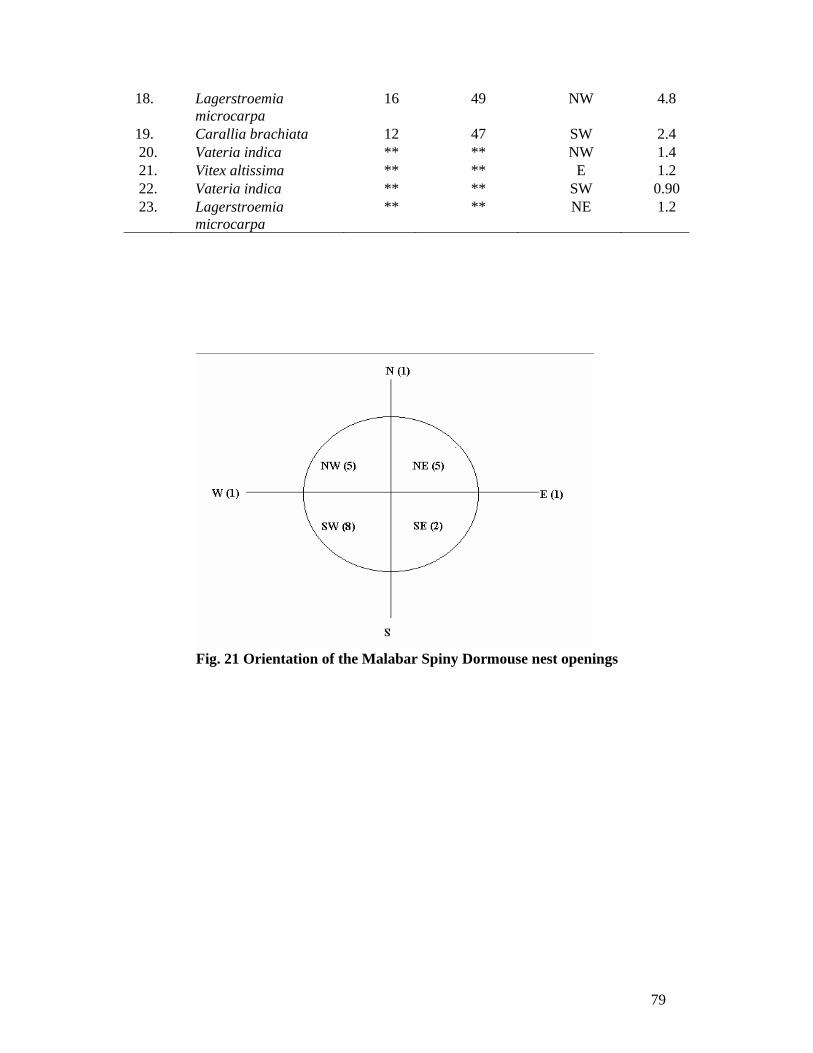
79
18. Lagerstroemia microcarpa
16 49 NW 4.8
19. Carallia brachiata 12 47 SW 2.4 20. Vateria indica ** ** NW 1.4 21. Vitex altissima ** ** E 1.2 22. Vateria indica ** ** SW 0.90 23. Lagerstroemia
microcarpa ** ** NE 1.2
Fig. 21 Orientation of the Malabar Spiny Dormouse nest openings

80
01020304050607080
0 5 10 15 20
nests
Dia
met
er (
mm
)
Fig. 22 Diameter of Malabar Spiny Dormouse nest openings
Social life and breeding
An adult male, two adult females and three sub adults were recorded from a
single nest. Two out of the three nests observed for recording the number of animals
emerging out were having more than one animal but one nest was having only one
male. A total of thirteen animals were captured using Sherman traps from five nests
in 11 occasions out of which two were sub adults. Most of the females were trapped
with in the first night attempt, but males were trapped only when the traps were kept
for more than two days. Pregnant females were recorded during March (N=2) and sub
adults were observed during November and December (N= 4).
3.4.4 Discussion
More than fifty percent of the attempts to observe the behaviour were partially
or fully disturbed due to various reasons. The available results showed that the
foraging decisions of the species were influenced by the availability of food items and
the predator pressure. Sexual dimorphism has a role in balancing these factors. Males
gave relatively more weightage to the predation risks where as females were bolder to
ignore the risk of predation for the availability of food. Juveniles are more prone to
predation and availability of the food species also influenced the foraging decisions
but more studies are necessary.
Tribal people were experts in identifying the nests of Malabar Spiny
Dormouse. They use the characteristics of the nests like clear round opening,

81
presence of leaves inside, oozing from the nest for the identification of the nests.
Lagerstroemia microcarpa was identified as the preferred nesting tree of Malabar
Spiny Dormouse (Plate 17). Sixty five percent of the nests were opening towards the
West (N=23). This may be for easily monitoring the setting of sun to begin foraging.
As the intensive study area was receiving heavy northeast monsoon the preference of
West direction may be to avoid the direct showers into the nest. A colony abandoned
a nest after it was filled with rainwater.
There was a clear pattern in the nest hole diameter, which was more or less
related to the body size of adult animals. Maintenance of nest hole diameter prevents
the entry of the predators like snakes. The incidence of abandoning the nest when the
nest entrance was widened and the reoccupation of the nest after the hole regained the
normal size is indicating to this behaviour. Another incidence reported by the tribals
about a snake, which was trapped inside the nest after swallowing a dormouse, also
supports this conclusion. Nest visibility to the predators has been reported as a major
factor in the nesting behaviour of birds (Rangen et. al., 1999). It was clear that the
nests were constantly gnawed and the entrance size was maintained by the colony.
Females were not carrying out the nest maintenance activity, but the male was
spending considerable time in gnawing the nests during night. The nest maintenance
was carried out on the cost of foraging time. Home range is a more or less restricted
area where an animal moves during its normal activity (Harris et al., 1990). A variety
of methods have been developed for estimating the home range, based on the
probabilistic notion of the utilization distribution (UD). Minimum convex polygon
(MCP) method (Southwood, 1966) using outliers may greatly overestimate home
range size, including parts never visited by the individuals (White and Garrot, 1990).
Even though the home range estimation using MCP method is exaggerated by
including the areas never visited by the animal. This method is the most robust
method especially when the number of fixes is very low (Harris et al., 1990). Kernel
density estimators are the most dependable method when the number of fixes is
sufficient in number (Powell et al., 1997).
The fixed kernel estimator estimates the home range of the male Malabar
Spiny Dormouse as 4.82 ha at 95 percent contour. In the case of female Malabar

82
Spiny Dormouse the home range was estimated at 50 percent contour produced by the
fixed kernel estimator using the standardized data as 4.9 ha. The estimation is
affected by the low sample size but with the available data the home range of the
species can be estimated as 05.085.4 ± ha. Such a wide home range along with the
existence of several nests in an area clearly showed that the home range of the
colonies overlaps. The colony was having more than one female but as no colony
without males was observed and at the same time solitary males existed which
indicates to a male dominated social structure. The observation of pregnant females
and sub adults in the same habitat during March and November respectively indicates
that at least two breeding seasons exist in the case of the species. The species is an
important seed predator in the Western Ghats tropical forest especially on the species
Terminalia bellerica.

83
3.5 Modelling the habitat of Malabar Spiny Dormouse
3.5.1 Introduction
An understanding of the habitat selection of organisms is necessary to solve
many issues in population biology. Development of appropriate habitat selection
theories can in many way address different problems in conservation biology (Morris,
2005). A clear knowledge on the mode of habitat selection will reveal the components
governing ecological systems in a better way (Orrock et al., 2000). This will also help
in the identification and protection of high-profile habitats (Law et al., 1998) and will
predict changes in the community structure that might follow natural or
anthropogenic alterations of ecosystems (Dunning et al., 1995). Habitat selection
influences the distribution of the organisms across landscapes (Pulliam and
Danielson, 1991).
Malabar Spiny Dormouse, an arboreal rodent has been considered as a species
inhabiting the evergreen forests. The animal was reported from the moist deciduous
forest of Peppara Wildlife Sanctuary (Jayson and Christopher, 1995). Information on
the habitat selection of this species is limited (Mudappa et al., 2001). The presence of
arboreal rodents in the canopy provides a prey base for many vertebrate predators
(Carey, 1991). While selecting the habitat, prey species prefer maximum level of
protection from the predators. Diversity of tree species and well developed under
stories will increase the canopy volume, interconnections of crown, abundance and
dependability of which food is the essential habitat requirement of rodents (Carey,
1996). Even though this study has identified major food items of Malabar Spiny
Dormouse, the chances of folivory exist. Considering this, analysis was carried out to
study the influence of habitat parameters like the vegetation and other characteristics
of the habitat. The major objective of this chapter is to describe the microhabitat
selection of the Malabar Spiny Dormouse in the tropical moist deciduous forests of
Western Ghats.
3.5.2 Methods
All the possible nests were located and recorded in the intensive study area.
The aliveness of the nests was confirmed by the presence of fresh leaves in the nest,

84
wetness of the nest hole and markings of nest maintenance at the entrance of the nest
hole. The details of the methodology are already described in an earlier chapter. One
hectare vegetation plots were marked in rectangle shape surrounding the 12 identified
nests and 13 control plots were also surveyed for measuring the following parameters.
1. Tree density- Total number of trees was counted and their Girth at Breast
Height (GBH) was measured in one-hectare plots. The trees were categorized
into four groups based on their Girth at Breast height (10 cm to 20 cm - Class
I, 20 cm to 50 cm - Class II, 50 cm to 1 m - class III and above 1 m - class
IV).
2. Tree diversity – Alpha diversity was calculated using the equation
xxN )1( −
=α (Taylor et al., 1976). Alpha diversity index was selected due to
its high discriminantability and low sample sensitivity (Magurran, 1988). 3. Leaf bead thickness (fallen leaves) was measured using an engine divided
scale.
4. Canopy cover (%) – canopy cover was estimated in percentage using a
grinded plain mirror.
5. Under growth was estimated by counting the number of herbs in one m2 area
from five points of the plot and the mean was calculated. The data from all
the plots were pooled and rated in 1 – 4 scale.
6. Slope of land was arbitrarily measured from field and later confirmed using
the three dimensional topo sheets.
7. Distance to the nearest water body was measured by GPS or using measuring
tapes in the case of short distances.
8. Distance to the nearest human habitation was measured using GPS.
9. The altitude of the plots was measured using the GPS.
Statistical analysis
The data was analysed using a non-parametric test for comparison based on
the presence and absence of the Malabar Spiny Dormouse nests. Mann Whitney U
test was conducted for differentiating the parameters of the selected and control plots
using the statistical package STATISTICA Version 6. The data was then submitted

85
for a forward and reverse stepwise discriminant analysis using the same package to
identify the variables, which best separate the selected plots from the control plots.
GIS analysis
The satellite image from IRS ID with LISS sensors were used for the GIS
analysis (Plate 18). The image was georectified using the software ERDAS 8.6
version using the ground controllable points. Since the image pixel size was 23 m X
23 m and the plot size was 100 m X 100 m the image was resampled and the pixel
size was converted to the sample plot size using the nearest neighbor method
available in the software ARCGIS 90 version. The Geocordates of the center points of
the plots were imported to the image and the pixel values of four bands of the image
from the pixel of the plots were estimated. The ranges of the pixel values of the plots
with the nests of the Malabar Spiny Dormouse were estimated for all the four bands.
The four bands of the image were then reclassified using the pixel value range of the
respective bands using the spatial analyst tool of ARCGIS 9.0. The possible habitats
of Malabar Spiny Dormouse were modeled by combining the resampled layers using
the Raster calculator tool of the software.
3.5.3 Results
Thirteen out of twenty five plots sampled were in the habitats preferred by the
Malabar Spiny Dormouse (Table 23 and 24). One plot (PEP_X) was situated outside
the limits of the protected area. Mann Whitney U test showed that thirteen
microhabitats of Malabar Spiny Dormouse differed significantly from the control
plots in having more canopy cover, species diversity of trees, slope, fallen leaf
thickness, trees in GBH class I and II and proximity to water body (Table 25). The
GHB class 1 increased the lower story of the canopy and Class II increased lower and
middle story. The Class II and IV were providing the Malabar Spiny Dormouse food
and nest holes other than increasing the upper and middle stories of the canopy.
Among these variables canopy cover, litter thickness, distance to water body, number
of trees in GBH class I and diversity index (α) were highly significant (p<0.01) (Fig.
23). Canopy cover, number of trees in the GBH Class IV and species diversity of
trees discriminated best between the preferred habitats and control habitats of the
species using forward stepwise method (Table 26) and among these canopy cover
discriminated best when backward stepwise method was used (Table 27).

86
Table 23. Habitat parameters recorded from the preferred nest sites and control plots
No. of trees in
different GBH classPlot No.
α Diversity
index
Altitude (m)
Litter Thickness (cm)
Canopy cover (%)
Under Growt
h (Scale
d)
Slope (Angle
)
Distance to water
body (km)
Distance to human habitation
(km)
Nest
I II III IV
PEP_A 8.9270 162 8 100 2 15 0 4 P 113 89 55 22
PEP_B 7.0030 178 9 90 2 70 0 3 P 65 100 69 15 PEP_C 7.8870 175 7 70 2 45 0.4 1 P 31 65 72 12 PEP_D 8.9620 126 5 90 2 45 0.3 1 P 65 70 46 14 PEP_E 1.7020 192 0 50 0 2 1 0.5 A 6 76 98 8 PEP_F 5.2270 186 2 60 4 10 1 0.5 A 14 25 32 64 PEP_G 10.8980 173 7 90 2 30 0 0.5 P 39 52 34 20 PEP_H 10.7270 241 5 100 2 0 0 1 P 10 82 67 7 PEP_I 7.2480 650 10 100 3 40 0 5 P 38 66 52 12 PEP_K 9.4460 256 12 100 3 70 0 4 P 68 104 172 31 PEP_L 10.7060 675 8 100 3 60 0 1.5 P 65 72 50 36 PEP_M 1.4630 625 1 25 2 10 3 3 A 9 48 28 3 PEP_N 2.9250 725 1 20 1 0 2 6 A 20 59 43 4 PEP_O 11.9100 642 11 90 4 45 0 9 P 17 49 39 19 PEP_P 4.2410 425 1 20 4 20 2 6 A 22 42 30 26 PEP_Q 18.3540 430 6 70 4 15 0 3 P 7 29 25 21 PEP_R 3.1000 364 4 30 4 70 0.4 2 A 5 25 28 17 PEP_S 2.8690 325 2 50 3 15 1 3 A 14 42 44 41 PEP_T 9.6690 337 6 50 3 45 0 1 A 4 25 39 39 PEP_U 3.9950 196 3 40 2 30 1.5 1.5 A 4 44 63 21 PEP_V 1.6450 135 6 60 3 0 1 3 A 9 55 139 11 PEP_X 3.9160 175 2 40 3 20 1 2.5 A 4 39 73 23 PEP_Y 3.8740 192 6 70 3 0 0.5 1.5 A 4 42 73 24
Table 24. Habitat parameters recorded from the
preferred and control plots (N=25).
Sl. No.
Habitat parameters
Mean Minimum Maximum Standard deviation
1. α diversity index of trees
6.4120 1.4630 18.3540 4.2727
2. Altitude 316.2000 126.0000 725.0000 196.8722
3. Fallen leaf 5.4000 0.0000 12.0000 3.3040
4. Canopy 67.0000 20.0000 100.0000 27.4621
5. Under Growth 2.7200 0.0000 4.0000 1.0214
6. Slope 28.2800 0.0000 70.0000 23.2155
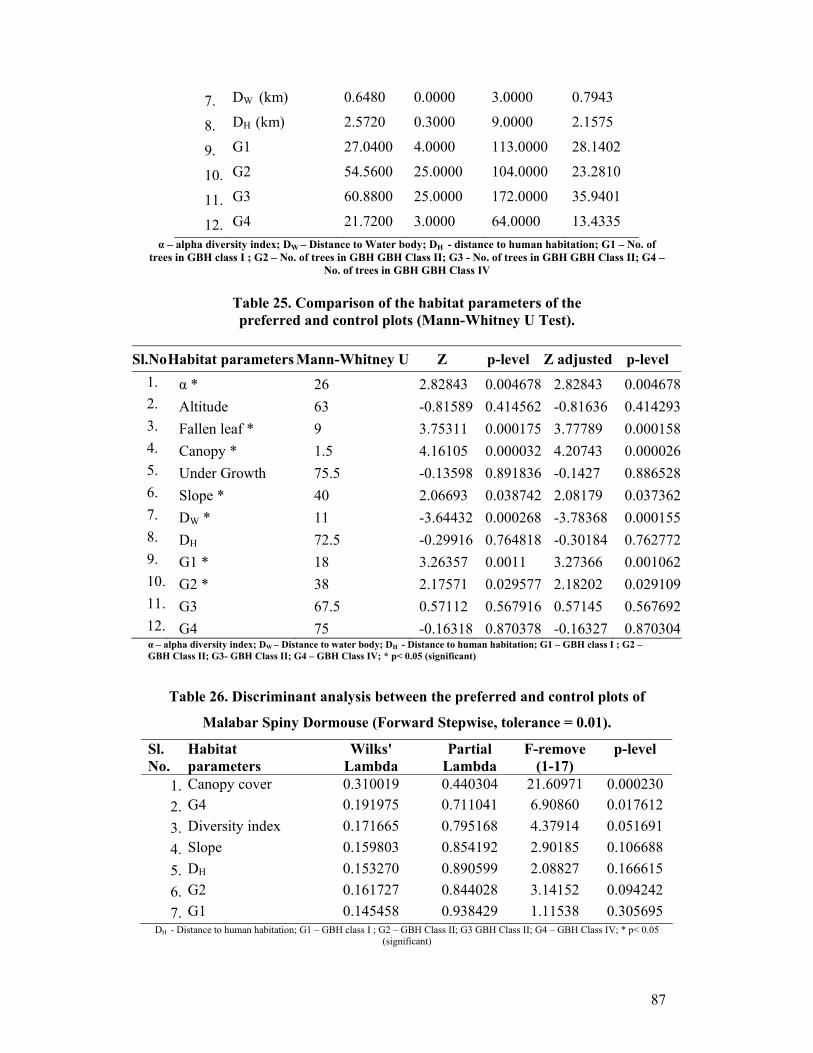
87
7. DW (km) 0.6480 0.0000 3.0000 0.7943
8. DH (km) 2.5720 0.3000 9.0000 2.1575
9. G1 27.0400 4.0000 113.0000 28.1402
10. G2 54.5600 25.0000 104.0000 23.2810
11. G3 60.8800 25.0000 172.0000 35.9401
12. G4 21.7200 3.0000 64.0000 13.4335 α – alpha diversity index; DW – Distance to Water body; DH - distance to human habitation; G1 – No. of
trees in GBH class I ; G2 – No. of trees in GBH GBH Class II; G3 - No. of trees in GBH GBH Class II; G4 – No. of trees in GBH GBH Class IV
Table 25. Comparison of the habitat parameters of the preferred and control plots (Mann-Whitney U Test).
Sl.NoHabitat parameters Mann-Whitney U Z p-level Z adjusted p-level
1. α * 26 2.82843 0.004678 2.82843 0.0046782. Altitude 63 -0.81589 0.414562 -0.81636 0.4142933. Fallen leaf * 9 3.75311 0.000175 3.77789 0.0001584. Canopy * 1.5 4.16105 0.000032 4.20743 0.0000265. Under Growth 75.5 -0.13598 0.891836 -0.1427 0.8865286. Slope * 40 2.06693 0.038742 2.08179 0.0373627. DW * 11 -3.64432 0.000268 -3.78368 0.0001558. DH 72.5 -0.29916 0.764818 -0.30184 0.7627729. G1 * 18 3.26357 0.0011 3.27366 0.00106210. G2 * 38 2.17571 0.029577 2.18202 0.02910911. G3 67.5 0.57112 0.567916 0.57145 0.56769212. G4 75 -0.16318 0.870378 -0.16327 0.870304α – alpha diversity index; DW – Distance to water body; DH - Distance to human habitation; G1 – GBH class I ; G2 – GBH Class II; G3- GBH Class II; G4 – GBH Class IV; * p< 0.05 (significant)
Table 26. Discriminant analysis between the preferred and control plots of
Malabar Spiny Dormouse (Forward Stepwise, tolerance = 0.01).
Sl. No.
Habitat parameters
Wilks' Lambda
Partial Lambda
F-remove (1-17)
p-level
1. Canopy cover 0.310019 0.440304 21.60971 0.000230 2. G4 0.191975 0.711041 6.90860 0.017612 3. Diversity index 0.171665 0.795168 4.37914 0.051691 4. Slope 0.159803 0.854192 2.90185 0.106688 5. DH 0.153270 0.890599 2.08827 0.166615 6. G2 0.161727 0.844028 3.14152 0.094242 7. G1 0.145458 0.938429 1.11538 0.305695
DH - Distance to human habitation; G1 – GBH class I ; G2 – GBH Class II; G3 GBH Class II; G4 – GBH Class IV; * p< 0.05 (significant)

88
Fig. 23 Box plots of the variables showing significant difference between the
preferred and control plots (Mann-Whitney U test (P<0.01)).
A. Distance to water body
1 2
Nest status
-0.5
0.0
0.5
1.0
1.5
2.0
2.5
3.0
3.5
Dis
tanc
e to
wat
er b
ody
(km
) Median 25%-75% Min-Max
B. GBH Class I (10 cm - 20 cm)
1 2
Nest status
-20
0
20
40
60
80
100
120
No.
of t
rees
Median 25%-75% Min-Max
C.Diversity of trees
1 2
Nest status
0
2
4
6
8
10
12
14
16
18
20
Lam
bda
Median 25%-75% Min-Max D. Fallen leafe Thicness
1 2
Nest status
-2
0
2
4
6
8
10
12
14
Falle
n le
afe
Thic
ness
(cm
)
Median 25%-75% Min-Max
E. Canopy cover
1 2
Nest status
10
20
30
40
50
60
70
80
90
100
110
Can
opy
cove
r (%
)
Median 25%-75% Min-Max

89
Table. 27 Discriminant analysis between the preferred and control plots of
Malabar Spiny Dormouse (Backward Stepwise, tolerance = 0.01)
Variable Wilks' Lambda Partial Lambda F-remove (1-23) p-level Canopy cover 1.000000 0.260510 65.28848 0.000000
The variance of the pixel values of the pixels of four bands of the IRS image
of the area was specific for the selected habitats of Malabar Spiny Dormouse. Much
difference were observed in the standard deviation and variance of the pixel values of
the sample plots from the preferred plots of Malabar Spiny Dormouse was lower than
that of the control plots in all cases other than green band (Table 28, Table 29 and
Fig. 24). Non parametric tests to compare the pixel values also showed significant
difference between these two groups of plots in pixel values for all the four bands of
the image (Table 30 and Fig. 25).
Table 28. Pixel values of the four bands of the satellite image of sample plots in
the preferred habitats of Malabar Spiny Dormouse (N=13).
Sl. No. Band Mean
Lower values
Upper values
Variance Standard deviation.
1. Green 75.2500 69.00000 84.0000 22.38636 4.731423 2. Red 38.0833 33.00000 46.0000 20.08333 4.481443 3. Short Infrared 105.6667 84.00000 119.0000 79.15152 8.896714 4. Far Infrared 106.0000 94.00000 116.0000 50.54545 7.109533
Table 29. Pixel values of the four bands of the satellite image of control plots
(N=12)
Sl. No. Bands Mean
Lower values
Upper values
Variance Standard deviation.
1 Green 79.7500 74 88 16.9318 4.11483 2 Red 45.7500 36 53 33.1136 5.75444 3 Short Infrared 96.6667 70 113 165.3333 12.85820 4 Far Infrared 122.6667 106 133 78.0606 8.83519

90
Table 30. Comparison of the pixel values of the preferred
and control plots (Mann-Whitney U Test).
Sl. No.
Bands U Z p-level Z adjusted
p-level 2*1 sided exact p
1. Green 34.5 -2.16506 0.030384 -2.16979 0.030024 0.028421 2. Red 19 -3.05996 0.002214 -3.06931 0.002146 0.001433 3. Short
Infrared 35 2.13620 0.032664 2.13992 0.032362 0.033241
4. Far Infrared 9 -3.63731 0.000276 -3.64524 0.000267 0.000072
Fig. 24 Mean and variation of pixel values of the preferred and control plots
The pixels of the bands of the image, which have a pixel values in the
identified range of pixel values of the preferred habitats of the species, were
reclassified and then superimposed to map the possible habitats of Malabar Spiny
Dormouse. The modelled areas were evidently the riparian multilayer forests of the
intensive study area and adjacent areas (Plate 19).

91
Fig. 25 Box plots comparing the variance of the pixel values of
the preferred and control plots
3.4 Discussion
Habitat selection of rodents is highly influenced by the habitat structure and
the risk of predation (Wywialowski, 1987). In the case of large herbivores with high
risk of predation the habitat structure have been influencing more on the population
structure and density than the predation risk including the hunting risk from humans
(Gude, 2004). The canopy structure and vertical thickness of foliage in tropical forest
is highly correlated to the tree species diversity. Many features of the tropical forest,
like the high degree of variations in the canopy structure and resources for foraging
proved to be enhancing the community diversity and specialization, predator
avoidance and nesting behaviour (Mac Arthur et al., 1966).
The study indicated that Malabar Spiny Dormouse is highly selective in
choosing the microhabitat. High degree of preference is shown to the canopy cover
and the number of trees in the girth class 10 to 50 cm. The trees in this girth class
support the development of lower and middle stories of the canopy rather than food or

92
nest. The selection of microhabitats with dense vegetation is an antipredator strategy
against aerial predators (Longland and Price 1991). This in turn showed that the
antipredator strategy of the species is strong. Various earlier studies showed that
many communities of small mammals prefer habitats with high amount of vegetation
cover (Kotler and Brown, 1988). The avoidance of predation risk was well proved in
the arid rodents (Bowers, 1988), neotropical rodents (Lagos et al,. 1995) and rodent
pests in crop areas of Europe (Díaz, 1992).
Dense canopy provides food resources for small mammals, as leaves, fruits,
seeds and insects but studies showed that the preference is for avoiding predation risk.
Similarly, Malabar Spiny Dormouse showed significant preference to the tree
diversity and number of trees in the Girth class IV (>1 m). This indicates that, the
species gives high importance to the availability of trees for nesting and diverse food.
As stated by MacArthur et al. (1966) diversity cannot be correlated to the food supply
alone but these features also supplement the canopy structure in the tropical forests.
Habitat selection of this species is obvious at microhabitat level and relatively high
preference is attached to the predator avoidance followed by the availability of food
and shelter. Many earlier studies reported that significant relationships between small
mammal distribution, abundance and habitat structure at microhabitat scale. Small
mammal responses to such scales rely on the degree of habitat specialization of every
species: A sharp relationship with microhabitat structure exists in case of generalist
species of rodents (Seamon and Adler, 1996). Analysis of habitat parameters in a
Geographic Information System (GIS) is the best way to understand the habitat
structure and distribution of a species. The potential areas identified using GIS were
not covering the moist deciduous forest areas with low canopy cover and the mono
species plantations including the tea estates with thick vegetation cover. But the GIS
analysis was able to mark the thick forest with diverse vegetation cover clearly.
The GIS assisted prediction, selected the riparian forests of the protected area
as the probable habitat of Malabar Spiny Dormouse. This new and highly significant
information will help in the conservation of the species. Peppara Wildlife Sanctuary
is the type locality of the species. Earlier studies described the Malabar Spiny
Dormouse as an evergreen species, but this study showed that the species inhabit in
the riparian forests in the middle of the dry moist deciduous forest also. The present

93
study has not attempted to evaluate the level of fragmentation between these
populations inhabiting in these habitat patches. But it is clear from the rescaled
satellite image that many of these habitats are fragmented. Most of the studies dealing
with the climatic changes and its impact are restricted to large geographical scale
(Karanth 2003; Sukumar, 2000; Kirsch Baum et al., 1996; Peters and Lovejoy, 1992).
The studies on the impact of climatic changes on the forest cover at microhabitat level
are rare. The probability of this population of an evergreen species like Malabar
Spiny Dormouse to be relict populations aggregated to these habitat refugiums during
the process of forest transformations due to the post glaciation climatic changes also
need validation. Molecular studies using fine scale markers only can check the
hypothesis. Considering the endemic status of the species the hypothesis is
significance even though there are no fine scale ecological studies on the impact of
climatic changes on the forest ecosystems of the region for comparison.
Malabar Spiny Dormouse is not a fully evergreen species, but the species
inhabits, in areas with high crown density in the moist deciduous forests, especially in
the riparian habitats. In habitat selection, the species prefers dense canopy cover
rather than any other ecological variable. This can be directly attributed to the
antipredatior strategy of the species. The species has an altitude independent
distribution. As the species is distributed in the habitat patches, and some of these
patches are fragmented, the probability of isolation of the species in these isolated
patches cannot be ruled out in future.

94
3.6. Conservation of Malabar Spiny Dormouse
The present status of the species is in Vulnerable (IUCN). This is mainly
based on the assumption that the distribution of this species is from the south of
Shimoga to Kanyakumari in the Western Ghats. But now it is clear from this study
that even though the species is distributed all along the Western Ghats, the
distribution is patchy and in the moist deciduous forests it is only found in the
riverine patches. Further in the evergreen forest the species is mainly found in
association with lianas (Mudappa et al., 2001). Further the species is low in density in
all the areas and with the continuing destruction of large trees the availability of nest
holes may be a limiting factor.
The main problem faced by the animal is the poaching. Kani tribals
extensively use the species for preparing medicines which is believed to be a cure for
Asthma. For catching the animal, tribals either destroy the nest hole or smoke out the
animals after making them unconscious (Plate 20). Another problem is the
indiscriminate poisoning practiced by the tribals and locals for getting rid of the
Malabar Spiny Dormouse from their crop fields. Tribals are attempting large scale
poisoning using rodenticide to remove the species from their agricultural areas (Plate
21). Habitat loss due to the drying of rivulets in the moist deciduous forest is a big
threat to the population depending on the riverine forests. As the species needs thick
vertical foliage i.e. undisturbed forest as preferred microhabitat, cattle grazing and
fire wood collection will deteriorate the habitat of the species. Lack of regeneration in
the moist deciduous forest is also harmful to the species. Before this study was
initiated not much information was available on the species (Plate 22).
Management
Maintaining the continuity of the moist deciduous forest and canopy is crucial
for conserving the species. The species can be considered as a indicator species of the
undisturbed riverine forest in the moist deciduous areas. Dormouse is strictly
protected by law and may not be intentionally killed, injured or disturbed in their

95
nests, collected, trapped or sold. The species principally require diverse habitat
having several different trees and shrubs to provide food throughout the seasons. But
lopping of trees can create such conditions as cleared areas and wide gaps which may
interfere with the movements of dormouse, because the species live almost
exclusively in the trees. The study has indicated that sub adults are more prone to
predation. Birds of prey are the only recorded predator. It can be summarised that
protection of riverine patches in the moist deciduous forests and protection of
evergreen forests with lianas are crucial for the survival of Malabar Spiny Dormouse.

96
4. Acknowledgements
Dr. J.K. Sharma, Director, KFRI, keenly followed the study and offered
encouragement and suggestions for the successful completion of the work. We
acknowledge our sincere gratitude to the Department of Science and Technology,
Govt. of India for sponsoring the study. The Kerala Forest and Wildlife Department
provided necessary permission and field assistance. Many tribal people assisted in the
field exploration. I thank the reviewers Dr.V.S.Vijayan, Mr. V. Gopinathan IFS and
Dr. K.K. Ramachandran for their comments on an earlier draft.

97
5. REFERENCES
Abbott, A. 2002. Sorry dogs, man’s got another close friend. Nature 420: 729. Adler, G. H. and Kestell, D.W. 1998. Fates of Neotropical tree seeds influenced by
Spiny Rats (Proechimys semispinosus). Biotropica 30: 677–681. Agarwal, V. C. 1967. Field observations on the biology and ecology of the Desert
Gerbil, Meriones hurriannae (Rodentia: Muridae), in Western India. J. Zool. Soc. India, Calcutta 17(1-2): 125-135.
Agarwal, V. C. 1973. Notes on collection of mammals from Goa. Records Zool. Surv.
India 67: 261-280. Agarwal, V. C. 1976. New mammal records from Rajasthan. Journal of Science and
Technology 5: 342-344. Agarwal, V. C. and Ghosal D. K. 1969. A new field rat from Kerala, India.
Proceedings Zool. Soc. Calcutta 22: 41-45. Agarwal, V. C and Bhattacharya, T. P. 1977. Reports on collection of mammals from
Tripura. Reports Zool. Surv. India. 73: 135-157. Agarwal, V. C. and T. P. Bhattacharya 1987. New mammal records from West
Bengal. Bulletin Zool. Surv. India 8: 221-222. Aiyar, T.V.V. 1932. A working plan for the Ghats forests of the Palghat
Division.1933-34 to 1942-43. Govt. Press, Madras, 202 p. Alder, G. H. and Seamon J. O. 1991. Distribution and abundance of a tropical rodent,
the Spiny Rat in Islands of Panama. J. Trop. Ecol. 7: 349-360. Altman, J. 1974. Observational study of behaviour - sampling methods. Behaviour
49: 227 - 267. Amori, G., S. Gippoliti 2001. Identifying priority ecoregions for rodent conservation
at the genus level, Oryx. 35: 158-165. Anderson, M. and Jonasson, S. 1986. Rodent cycles in relation to food resources on
an Alpine heath. Oikos 46: 93-106. Anonymous, 1994. Scheduled Tribes and Scheduled Castes in the forests of Kerala,
Facts and Figures. Forestry Information Bureau of Kerala Forest Department and Kerala Forest Research Institute, 41 p.
Antje, Rendigs, Ute Radespiel, Dorothea Wrogemann, and Elke Zimmermann 2003.
Relationship between microhabitat structure and distribution of Mouse Lemurs (Microcebus spp.) in North-western Madagascar. International Journal of Primatology 24: 47-64.

98
Antonio, G., Rey, J., and Faecal, M.1999. Analysis of the Edible Dormouse (Glis glis) in the northwest Iberian Peninsula. Zeitschrift für Säugetierkunde 64: 376–379.
Asakawa, M., Hagiwara K. Liao L., Jiang W., Yan S. S., Chai J. J., Oku Y ., Ito M .
Liao L. F., Jiang W., Yan S. S. and Chai J. J. 2001 Collection record of small mammals in Xinjiang-Uygur, 1998 and 1999 with brief review of its mammalian fauna. Biogeography 3: 13-31.
Asari, P. A. R. 1975. Preference of Rattus sp. to different variety of tapioca. Proc.
All-India Rodent Seminar (Ahemadabad), Sidhpur: 134. Backo, B., Csorba G. and Berty L. 1998. Distribution and ecological requirements of
dormouse species occurring in Hungary. Natura Croatica 7: 1–9. Barnet, S. A. and Prakash, I. 1975. Rodents of economic importance in India. G
vasiramani for Arnold Heinemann, New Delhi, India, reprinted 1982: 174p. Bellows, A. S., Pagels, J. F. and Mitchell, J. C. 2001. Macro habitat and microhabitat
affinities of small mammals in a fragmented landscape on the upper Coastal Plain of Virginia. American-Midland-Naturalist 146: 345-360.
Berg, L. 1996. Small-scale changes in the distribution of the Dormouse Muscardinus
avellanarius (Rodentia, Myoxidae) in relation to vegetation changes. Mammalia 60: 211-216.
Berg, L. 1997. Spatial distribution and habitat selection of the Hazel Dormouse
Muscardinus avellanarius in Sweden. Licentiate dissertation, Swedish University of Agricultural Sciences, Uppsala, Sweden.
Berg, L. and Berg A.1999. Abundance and survival of the Hazel Dormouse
Muscardinus avellanarius in a temporary shrub habitat: a trapping study. Annals Zoologici Fennici, 36: 159–165.
Bieber, C. 1996. Population dynamics, sexual activity, and reproduction failure in the
Fat Dormouse (Myoxus glis). J. Zool., 244: 223-229. Binda, O. S. and Sagar P. 1968. Breeding habits of Field Rat, Millardia meltada. J.
Bombay nat. Hist. Soc. 65: 477-481. Biswas, B. and Ghose 1968. New record of mammal from Rajasthan, India. J.
Bombay nat. Hist. Soc., 65:481-482. Biswas, B. and Tiwari, K. K. 1969. Taxonomy and distribution of Indian Rodents.
Proceedings of the Indian Rodent Symposium, Calcutta. 9-45. Blanford, W. T. 1888. Fauna of British India including Ceylon and Burma.
Mammalia part II, Taylor and Francis, London.

99
Borges, .M. R., Subash, M., Hema, S. 2001. Status, ecology and conservation of the Malabar Giant Squirrel, Ratufa indica. Wild Life Institute of India Report: Wildlife Institute of India p 79.
Botond B., Csorba G. and Berty L. 1998 Distribution and ecological requirements of
dormouse species occurring in Hungary. Natura Croatica 7: 1–9. Bowers, M. 1988. Seed removal experiments on desert rodents: the microhabitat by
moonlight effect. Journal of Mammology 69: 201-204. Bradley, Allen 2002. Mining the mouse genome Nature 420:512. Bright, P. W. 1995. Distribution of the Dormouse Muscardinus avellanarius in
Wales, on the edge of its range. Mammal Rev. 25: 101-110. Bright, P. W. 1998. Behaviour of specialist species in habitat corridors: arboreal
dormice avoid corridor gaps. Animal Behaviour 56: 1485–1490. Bright, P. W. 2000. Status and woodland requirements of the dormouse in Wales.
CCW Contract Science Report 406: 1–33. Bright, P. W. and Morris, P. A. A. 1989. Practical Guide to Dormouse Conservation.
London. P 32. Bright, P. W. and P. A. Morris 1992. Ranging and nesting behaviour of the Dormouse
Muscardinus avellanarius, in coppice-with-standards woodland. J. Zool. (Lond.), 226 : 589-600.
Bright, P. W., Mitchell, P. and Morris, P. A. 1994. Dormouse distribution: Survey
techniques, insular ecology and selection of sites for conservation. Journal of Applied Ecology 31: 329–339.
Brown J. S., B. P. Kotler and T. J. Valone 2004. Foraging under predation: A
comparison of energetic and predation cost in rodent communities of the Neger and Sonoran Desert. Australian Journal of Zoology 42: 435-498.
Buckner, S. 1997. Common Dormouse in small isolated woods. Natura Croatica, 6:
271–274. Burnham, K. P. and Overton W. S. 1979. Robust estimation of population of
population size when capture probability varying among animals. Ecology 60: 927-936.
Calhou, J. B. 1969. Community structure among small mammals. Indian Rodent
Symposium, 1966; Calcutta, India: 93-109. Carey, A. B. 1991. The biology of arboreal rodents in Douglas-fir forests. USDA For.
Serv. Gen. Tech. Rep.PNW-GTR-276. Pac. Northw. Res. Sta., Portland, Oregon. p 45.

100
Carey, A. B. 1996. Interactions of Northwest forest canopies and arboreal mammals. Northwest Science 70:
Chakraborty, R. and Chakraborty S. 1982 Food habits of large Bandicoot Rat
Bandicota indica, in the fields of West Bengal during rainy seasons. Rodent Newsl. Jodhpur, India 6: 27.
Chakraborty, S. 1983. Contribution to the knowledge of mammalian fauna of Jammu
and Kashmir. Record Zool. Surv. India Occ. Pap.38: p128. Champion, H. G. and Seth S. K.1968. A Revised Survey of Forest Types of India.
Manager Publications, New Delhi: 404. Chandrasekharan, C. 1962a. Forest types of Kerala State. Indian Forester 88: 660-
674. Chandrasekharan, C. 1962b. Forest types of Kerala State. Indian Forester 88: 713-
747. Chandrasekharan, C. 1962c. Forest types of Kerala State. Indian Forester 88: 837-
847. Cheesman, C. L. and Delaney M. J. 1979. The population dynamics of small rodents
in the tropical African grass land. Journal of Zoology. 188: 451-475. Corbet, G. B. and Hill, J. E. 1992. The Mammals of Indo Malayan Region: A
Systemic Review. Natural history museum publications, Oxford University Press, New York, USA.
Coughly, G. 1977. Analysis of Vertebrate Population. John Wiley & Sons, London. Daniela Marinova and Simeonovska-Nikolova 2000. Strategies in open field
behaviour of Mus spicilegus and Mus musculus musculus. Belg. J. Zool.: 130 : 115-120.
Daniels, R. 2003. Biodiversity of the Western Ghats an overview. Conservation of
rain forest in India; Wildlife and protected areas, (Ed. Gupta A. K., Kumar A. and Ramakanthan V). 25-68.
Delgado Garcia J. D. 2000. Selection and treatment of fleshy fruits by the ship rat
(Rattus rattus L.) in the Canadian laurel forest. Mammalia 64: 11-18. Díaz, M. 1992. Rodent seed predation in cereal crop areas of Central Spain: effects
of physiognomy, food availability, and predation risk. Ecography 15: 77-85. Douglas A. K., Peter L. M., L .K .Nabors, Mathew L .F. and Julio R .G. 2004.
Foraging ecology of small mammals in semi arid Chile: The interplay of Biotic and Abiotic factors.

101
Dunning, J. B. Jr., Danielson, B. J. and Pulliam, H. R. 1995. Ecological processes that affect populations in complex landscapes. Oikos 65:169–175.
Easa, P .S. 1995. Prey predator studies in Eravikulam National Park. KFRI Research
Report 105: 58. Easa, P .S. 1997. Status, food and feeding habits of larger mammals in Idukki
Wildlife Sanctuary, Kerala, KFRI Research Report 134. Kerala Forest Research Institute.
Easa, P. S. and Sankar, S. 2001. Study on man-wildlife interaction in Wayanad
wildlife sanctuary, Kerala. KRFI Research Report No. 166: 183. Easa, P. S., James Zachariah and P. Padmanabhan 2001. Survey of small mammals
in Kerala with special reference to endangered species. Kerala Forest Research Institute, Research Report No. 207. p 34.
Ellerman, J. R. 1961. The Fauna of India Including Pakistan, Burma and Ceylon,
Mammalia Vol.3 Edited by M. L. Roonwal, Zoological Survey of India, Calcutta, 884 p.
Ellerman, J. R. and T .C. Morrison-Scott 1953. Checklist of Palaearctic and Indian
Mammals – amendments. Journal of Mammology 34: 516-518. Ellerman, J. R. and T.S.C. Morrison Scott. 1966. Checklist of Palaearctic and Indian
Mammals, 1758-1946. British Museum (Natural History), London. 810 p. Ercument, C., Nuri, Y. G. and Reyhan, V. 1994. Periodic cycles in food intake and
body weight of juvenile dormice, Glis glis orientalis (Nehring, 1903. (Rodentia: Gliridae), in northern Anatolia. Turkish Journal of Zoology 18: 241–244.
Foppen, R. P. B., Bergers, P. J. M. and Van, G. J. J. 1989. Occurrence and
distribution of the Garden Dormouse, Eliomys quercinus in The Netherlands. Lutra: 32:42-52.
Fitzwater, W. D. and Prakash I. 1969. Burrowing behaviour and home range of
Indian desert gerbil, Meriones hurrianae Jerdon. Mammalia 33: 598-608. Fitzwater, W. D. and Prakash I. 1973. Handbook of vertebrate pest control. Indian
Council of Agriculture research, New Delhi, Revised Ed. 1977: 92p. Francis, W. 1994. The Nilgiris. Madras District Gazetteers. Asian Educational
services New Delhi. A reprint of 1908. Franco, D. 1990. Feeding habits of a Dormouse population (Myoxus glis) in the
Asiago plateau (Venetian Prealps). Hystrix 2: 11-22.
102
Frynta, D. 1994. Exploratory behaviour in 12 Palaearctic mice species (Rodentia: Muridae). A comparative study using free exploration tests. Acta Soc. Zool. Bohem., 57:173-182.
Ganzhorn, J. U., Rakotosamimanana, B., Hannah, L., Hough, J., Iyer, L., Olivieri, S.,
Rajaobelina, S., Rodstrom, C., and Tilkin, G. 1997. Priorities for biodiversity conservation in Madagascar. Primate Report 48:1.
Ghose R. K. 1976 Further new records of mammals from Rajasthan, India. Journal
Zool. Soc. India 26: 149-150. Guariguata, M.R., Rosales, A.J.J. and Finnegan, B. 2000. Seed removal and fate in
two selectively logged lowland forests with contrasting protection levels. Conservation Biology 14: 1046–105.
Gude, J. A. 2004. Applying risk allocation theory in a large mammal predator prey
system: elk-wolf behavioural interactions. MS Thesis, Montana State University Bozeman, Montana.
Harris, S., Cresswell, W. J., Forde, P. G., Trewhella, W. J., Woollard, T. and Wray, S.
1990. Home range analysis using radio tracking data – a review of problems and techniques particularly as applied to the study of mammals. Mammal Review 20: 97-123.
Hill, J. E. 1958. Some observations on the fauna of Maldives Islands. II. Mammals.
J. Bombay Nat. Hist. Soc., 55: 3-10. Hocking, M. 1981. Habitat destruction and species diversity of small mammals in
South-east Queens land in relation to Vegetation to vegetation structure. Australian Wildlife Research 8: 97-108.
Hoodless, A., Morris P. A. 1993. An estimate of population density of the Fat
Dormouse (Glis glis). Journal of Zoology 230: 337–340. Hughes, J. J., Ward, D. and Perrin, M. R. 1994. Predation risk and competition
affect habitat selection and activity of Namib Desert Gerbils. Ecology 75: 1397-1405.
Jackson, C.H.N. 1933. On the true density of Tse Tse flies. Journal of Animal
Ecology 2: 204-209. Jackson, J. E. 1994. The Edible or Fat Dormouse (Glis glis) in Britain. Quarterly
Journal of Forestry 88: 119–125. Jain, A. P. 1975. Determination of bait preference of Rodents. Proc. Summer Inst.
Rodentol. Jodhpur, India: 81-87. Jain, A. P. 1984. A note on the cannibalism of desert rodents. J. Bombay nat. Hist.
Soc., 81: 182-183.

103
Jain, A. P. 1985. A note on field Rodents of Mandsau District of Madhya Pradesh. J. Bombay Nat. Hist. Soc., 82: 397-407.
Jayson, E. A. and G. Christopher 1995. Sighting of Malabar Spiny Dormouse
Platacanthomys lasiurus Blyth 1859 in Peppara Wildlife Sanctuary, Trivandrum District, Kerala. J. Bombay. nat. Hist. Soc., 92: 258.
Jayson, E. A. and Ramachandran K. K. 1996. Habitat utilization by larger mammals
in Chinnar Wildlife Sanctuary. KFRI Research Report 109. Jayson, E.A. 1997. Status and distribution of larger mammals in Chimmony Wildlife
Sanctuary. Indian Forester, 123 :939-947. Jayson, E.A. 1998. Studies on man-wildlife conflict in Peppara Wildlife Sanctuary and
adjacent areas KFRI Research Report No. 140, Kerala Forest Research Institute, Peechi. 71 p.
Jayson, E.A.1999. Habitat preference of five herbivores in the Chimmony Wildlife
Sanctuary. Indian Forester 125 : 975-985. Jayson, E.A. and D.N. Mathew 2000. Diversity and species abundance distribution of
birds in the tropical forests of Silent Valley, Kerala. J. Bombay nat. Hist. Soc. 97: 390-400.
Jayson, E.A. and D.N. Mathew 2002. Structure and composition of two bird
communities of in the southern Western Ghats. J. Bombay nat. Hist. Soc. 99: 8-25.
Jayson, E.A., Mathew, D.N. 2003. Vertical stratification and its relation to foliage in
tropical forest birds in Western Ghats (India). Acta Ornithologica 38: 111-116. Jayson, E.A. 2004. Habitat utilisation of large herbivores in the Chinnar Wildlife
Sanctuary, Kerala. (Ed. Kaul B.L.) In: Advances in Fish and Wildlife Ecology and Biology Vol.3. 239-251. M/S Daya publishing House, Ansari Road, Darya Ganj, New Delhi.
Jayson, E. A., C. Sivaperuman and P. Padmanabhan 2006. Review of the
reintroduction programme of the Mugger crocodile Crocodylus palustris in Neyyar Reservoir, India. Herpetological Journal 16: 69-76.
Jolly, G. M. 1965. Explicit estimation from capture recapture data with both death
and immigration – stochastic model. Biometrika 52: 225-247. Jolly, G. M. and Dickson J. M. 1983. The problems of unequal catchability in mark
recapture estimation of small mammal population. Canadian Journal of Zoology 61: 922-927.
Jonathan, B. Losos and Duncan J. Irschick 1996. The effect of perch diameter on
escape behaviour of Anolis lizards: laboratory predictions and field tests. Anim. Behav. 51: 593–602.

104
Karanth, K. P. 2003. Evolution of disjunct distributions among wet-zone species of
the Indian subcontinent: Testing various hypotheses using a phylogenetic approach. Current Science 85: 1276-1283.
Kelt, D. A., Meserve, P. L., Nabors, K., Forister, L. M. and Gutierrez, J.R 2004.
Foraging ecology of small mammals in semi arid Chile: the interplay of biotic and abiotic factors. Ecology 85: 383-397.
KFRI. 1993. Ecological studies and long-term monitoring of biological process in
Silent Valley National Park KFRI Research Report p. 239. Khajuria, H. and Ghosal D. K. 1981. Studies on Wildlife of Narbada Valley, Part IV.
Mammals. Rec. Zool. Surv. India, Delhi 79: 235-257. Kinner, Norman 1968. The history of Indian Mammology and Ornithology Part I. J.
Bombay nat. Hist. Soc. 50: 766-778. Kirsch Baum, M. U. F., Cannel, M. G. R., Cruz, R. V. O., Galinski, W. and Cramer,
W. P. 1996. Climate change impact on forest. In Climate change 1995. Impacts adaptations and mitigations of climate change: Scientific technical analyses (Watson R. T., Znyowera M. C. and Moss R. H., eds). Cambridge University Press. 95-129.
Kotler, B. P. and R. D. Holt 1998. Predation and competition: Interaction of two
types of species interaction. Oikos 54: 260-265. Kotler, B. P. and Brown, J. S. 1988. Environmental heterogeneity and the
coexistence of desert rodents. Ann. Rev. Ecol. Syst. 19: 281-307. Krebs, C. J. 1966. Demographic changes in fluctuating population of Microtus
californiacus. Ecological Monograph 36: 239-273. Krystufek, B. and V. Vohralik 1994. Distribution of the Forest Dormouse (Dryomys
nitedula (Pallas, 1779) Rodentia, Myoxidae) in Europe Mammal Rev. 24: 161-177.
Kumar, A., Chellam, R., Choudhary, B. C., Mudappa, D., Vasudevan, K., Ishwar, N.M.
and Noon, B. 2001. Impact of rain forest fragmentation on small mammals and herpetofauna in the Western Ghats, South India, A summery of research findings, p 28.
Kumari, V. and Khan J. A. 1984. Structure of audible sounds produced by Tatera
indica. Rodent Newsl., Jodhpur, India 7: 24. Lagos, V. O., Contreras, L. C., Meserve, P. L., Gutiérrez, J. R., and Jaksic, F. M.
1995. Effects of predation risk on space use by small mammals, a field experiment with a Neotropical rodent. Oikos 74: 259-264.

105
Lamb, C. E., Aarde R. J. and Aarde R. J. 2001. Maternal dietary protein intake and sex-specific investment in Mastomys coucha (Rodentia: Muridae). Journal of Zoology 253: 505-512.
Laurence, W. F. 1994. Rainforest fragmentation and the structure of small mammal
communities in tropical Queens land. Ecological Conservation 69: 23-32. Law, B. S. and Dickman, C. R. 1998. The use of habitat mosaics by terrestrial
vertebrate fauna: implications for conservation and management. Biodiversity and Conservation 7: 323 – 333.
Lehtonen, J. T., Mustonen, O., Ramiarinjanahary, H., Niemela, J. and Rita, H. 2001.
Habitat use by endemic and introduced rodents along a gradient of forest disturbance in Madagascar. Biodiversity and Conservation 10: 1185-1202.
Lincoln, F. C. 1930. Calculating waterfowl abundance n the basis of banding returns.
Circular of U.S. Department of Agriculture 118: 1-4. Longland, W. S. and Price, M.V. 1991. Direct observations of owls and heteromyd
rodents, can predation risk explain microhabitat use? Ecology 72: 2261-2273. MacArthur, R. H., Recher, H. and Cody, M. 1966. On the relation between habitat
selection and species diversity. American Naturalist 100: 319–322. Magurran, A. E. 1988. Ecological Diversity and its Measurements. Croom Helm Lit.
London: p 180. Mahajan, K. K. and Mukarjee R. N. 1972. Checklist of mammal of Himachal Pradesh
with a district wise distribution. Proc, 59th Indian Sci. Congre. Pt. 3, Abstrs, Calcutta 473-474.
Mahajan, K. K. and Mukarjee R. N. 1974. A checklist of mammals Himachal Pradesh
with notes on distribution in the area. Hippocaqmpus, Chandigarh 5: 40-47. Manilal, K. S. 1988. Flora of Silent Valley. The Mathrubhumi Press, Calicut. p398. Meena, V. 1997. Small mammal communities of Mudumalai Wildlife Sanctuary,
Southern India. M.S. Thesis. Pondichery University, Pondichery, India. Menkens, G. E. J R., Anderson S. H. 1988. Estimation of small mammal population
size. Ecology 69: 1952-1959. Menon, A. R. R.1997a. Vegetation mapping and analysis of Chimmony Wildlife
Sanctuary using remote sensing techniques. KFRI Research Report 120. Menon, A. R. R. 1997b. Vegetation mapping and analysis of Eravikulam National
Park using remote sensing techniques. KFRI Research Report 130. Menon, A. R. R. 1999. Vegetation mapping and analysis of Aralam Wildlife
Sanctuary using remote sensing techniques. KRFI Research Report No. 161.

106
Menon, A. R. R. 1999a. Vegetation mapping and analysis of the Peppara Wildlife
Sanctuary using remote sensing techniques. KRFI Research Report No. 168. Meserve, P. L. 1981a. Trophic relationships among small mammals in a Chilean
semiarid thorn scrub community. Journal of Mammalogy 62:304-314. Meserve, P. L. 1981b Resource partitioning in a Chilean-semiarid small mammal
community. Journal of Animal Ecology 50:745-757. Meserve, P. L., Kelt, D. A., Milstead, W. B. and Gutierrez, J.R. 2003. Thirteen years
of shifting top-down and bottom-up control. Bioscience 53: 633-646. Minato, S. 1996. Physical and behavioural development of the Japanese dormouse,
Glirulus japonicus (Rodentia, Myoxidae) Mammalia 60: 35-51. Minta, S. and Mangel, M. 1989. A simple population estimate based on simulation for
capture recapture and capture resight data. Ecology 70:1738-1751. Mohanan, N., G. Raj Kumar and T.Saju 1997. Floristic diversity of Agasthiamalai,
Western Ghats. In Proceedings of the Ninth Kerala Science Congress, Science Technology and Environment Department, Trivandrum P. 444-448.
Molur, S., P.O. Nameer and S. Walker (Eds.) 1998. Report of the Workshop
Conservation Assessment and Management Plan for Mammals of India (BCPP-endangered species project). Zoo Outreach Organisation, CBSG, Coimbatore, India. 176 p.
Morris, D. W. 2005. How can we apply theories of habitat selection to wildlife
conservation and management? Wildlife Research 30: 303 – 319. Morris, P. A., Bright, P. W. and Woods, D. 1990. Use of nest boxes by the Dormouse
Muscardinus avellanarius. Biol. Conserve. 51: 1-13. Morris, P. A., Temple R. K. and Jackson J. E. 1997. Studies of the edible dormouse
(Glis glis) in British Woodlands – some preliminary results. Quarterly Journal of Forestry 91: 321–326.
Morris, P. and Whitbread, S. 1986. A method for trapping the Dormouse
(Muscardinus avellanarius). J. Zool. Ser. A (Lond.) 210: 642-644.
Movchan, V. N. and Korotetskova, L. V. 1987. Identification of agonistic vocalisation by Common Dormouse, Muscardinus avellanarius. (Rodentia, Gliridae). Zool. Zh 66:1363-1374.
Mudappa, D., Kumar, A. and Chellam, R. 2001. Abundance and habitat selection of
Malabar Spiny Dormouse in the rainforests of the southern Western Ghats, India. Current Science 80: 424-427.

107
Musser, C. G. and Carleton, M. G. 1993. Family Muridae. In Wilson D and D. M. Reeder (Editors) Mammals species of the world: A taxonomic and geographic reference. Second edition Smithsonian Institute Press, Washington p.1206.
Narayanankutty, T. P and Nair, P. R. 1990. Working plan of Peechi-Vazahani
Wildlife Sanctuary 1990- 1995. Kerala Forest Department. Nair, P.V., and E.A. Jayson, 1988. Habitat utilization by large mammals in teak
plantations and natural forests. Kerala Forest Research Institute. Research Report No.56.
Nair, S. C. 1991. The Southern Western Ghats: A Biodiversity Conservation Plan.
Indian National Trust for Art and Cultural Heritage, New Delhi, 92 p. Nekaris, K. A. I. and Rasmussen, D. T. 2003. Diet and Feeding Behaviour of Mysore
Slender Lorises. International Journal of Primatology 24: 33-46. Nicholas, J. D. and Pollock K. H. 1983. Estimating taxonomic diversity, extinction
rates and speciation rates from fossil data using capture recapture method. Paleobiology 9: 150-163.
Nichols, J. D., Kendall, W. L., Hines, J. E. and Spendelow, J. A. 2004. Estimation of
sex-specific survival from capture–recapture data when sex is not always known. Ecology 85: 3192–3201.
Orrock, J. L., Pagels, J. F., Mcshea, W. J. and Harper, E. K. 2000. Predicting presence
and abundance of a small mammal species: the effect of scale and resolution. Ecological Applications 10: 1356–1366.
Otis, D.L., Burnham K.P., White G.C. and Anderson D.R.1978. Statistical inference
for capture data on closed animal populations. Wildlife Monographs 62: 135p. Otsu, Ryoei and Takeji Kimura 1993. Effects of food availability and ambient
temperature on hibernation in the Japanese dormouse, Glirulus Japonicus, J. Ethol. 11: 37-42.
Peters, R. L. and Lovejoy, T. 1992. Global Warming and Biological Diversity. Yale
University Press. P. 386. Powell, R. A., Zimmerman J. W. and Seaman, D. E. 1997. Ecology and behaviour of
North American Black Bears. Chapman and Hull, New York. Prabhakar, A. 1997. New records of Malabar Spiny Dormouse (Platacanthomys lasiurus
Blyth) in the Indira Gandhi Wildlife Sanctuary, Tamil Nadu. J. Bombay nat. Hist. Soc., 94 : 151.
Pradhan, M. S. 1979. Studies on Bombay Rats. Ph. D. Thesis Bombay University,
Mumbai. Prakash, I. 1959. Checklist of mammals of Rajasthan Desert- Univ. Rajasthan Stud.
(Biol. Sci.), Jaipur, India 1-6.

108
Prakash, I. 1959. Food of some Indian desert mammals. J. boil. Sci., Bombay 2:100-
109. Prakash, I. 1963. Taxonomical and ecological account of mammals in Rajasthan
Desert; India. J. Mammal., Baltimore 41: 386-389. Prakash, I. 1972. Extension of the range of Suncus stoliczkanus in the Rajasthan
desert. Journal Bombay nat. Hist. Soc. 69: 643-644. Prakash, I.1974. The ecology of vertebrates in Indian desert. Biogeography and
Ecology in India (Editor Mani M. S.) The Huge (Junk Publ.): 369-420. Prakash, I. 1975. Food of rodents in nature. Proc. Summer Inst. Rodentol. Jodhpur
1975: 145-150. Prakash, I. 1977. Replacement of sympatric rodent species in the Indian desert.
Proceedings All-India rodent seminar, 1975: 29-31. Prakash, I. 1977. Rodent pest management principles and practice. Monogr. Central
Arid Zone Res. Inst., Jodhpur 4: 1-28. Prakash, I. 1981. Ecology of Indian Desert gerbil Meriones hurrianae. Monogr.
Central Arid Zone Res. Inst., Jodhpur 10: 1-87. Prakash, I. and Jain, A. P. 1971. Bait shyness of two gerbils Tatera indica indica
Hardwick and Meriones hurrianae Jerdon. Ann. Appl. Biol., London, UK 69: 169-172.
Prakash, I. and Ohja 1977. The phenomenon of poison baits aversion and its possible
attenuation in Indian Gerbil Tatera indica indica. Rodent News., Jodhpur 3(2): 12.
Prater, S. H. 1948. The Book of Indian Animals. Bombay Nat. Hist. Soc. Bombay,
India. Pulliam, H. R. and Danielson, B. J. 1991. Sources, sinks, and habitat selection: a
landscape perspective on population dynamics. American Naturalist 137:50–66.
Radhakrishna, S. and Singh M. 2002. Social Behaviour of the Slender Loris (Loris
tardigradus lydekkerianus). Folia Primatologica 73: 181-196. Rajagopalan, P. K. 1968. Notes on the Malabar Spiny dormouse Platacanthomys
lasiurus Blyth 1859 with new distribution record. J. Bombay nat. Hist. Soc. 65: 214-215.
Rangen, S. A., Clark, R. G., and Hobson, K. A. 1999. Influence of nest-site
vegetation and predator community on the success of artificial songbird nests. Zool./Rev. Can. Zool. 77: 1676-1681.

109
Rice, C. G. 1984. The behaviour and ecology of Nilgiri Tahr (Hemitragus hylocrius
Ogliby, 1838). Ph. D. Dissertation. Texas A&M Univ. Rimvydas, J. 2000. Abundance dynamics of Common dormouse (Muscardinus
avellanarius), Fat dormouse (Glis glis) and Yellow-necked mouse (Apodemus flavicollis) derived from nest box occupation. Folia Theriologica Estonica 5: 42–50.
Rodolfi, G. 1994. Dormice Glis glis activity and hazelnut consumption. Acta
Theriologica 39: 215–220. Ronkin, V. I. and Savchenko, G. A. 2000. Adaptability of habitats for Marmota
bobak (Rodentia, Sciuridae) related to plant cover structure. Zoologicheskii-Zhurnal. 79: 1229-1234.
Roonwal, M. L. 1949. The geographical and geological aspects of migration in
animals. Bull. natn. geogr. Soc. India, Banaras (Varanasi), India 11: 1-33. Roonwal, M. V. 1950. Contributions to the fauna of Manipur State Assam. Part III –
Mammalia with special reference to the family Muridae (Order Rodentia). Records of Indian Museum. 47: 1 –64.
Roonwal, M. V. 1948. Three more new Muridae (Mammalia: Rodentia) from Assam
and Kabaw Valley Upper Burma. Proceeding nat. Inst. Soci. India 14: 385-387. Sasidharan, N. 1998. Studies on the flora of Periyar Tiger Reserve. KFRI Research
Report 150: 558. Kerala Forest Research Institute, Peechi Sasidharan, N. 1999. Study on the flora of Chinnar Wildlife Sanctuary. KFRI
Research Report 167: 365. Kerala Forest Research Institute, Peechi. Schaub, M., Gimenez, O., Schimidt, B. R. and Pradel, R. 2004. Estimating survival
and temporary emigration in the multistage capture-recapture framework Ecology 85: 2107 – 2113.
Schlund, W., Scharfe F., Stauss M. and Burkhardt, 1997. Habitat fidelity and habitat
utilization of an arboreal mammal (Myoxus glis) in two different forests. Zeitschrift für Säugetierkunde 67: 158–171.
. Schnabel, Z. E. 1938. The estimation of total fish in a lake. Am. Math. Mon. 348-352. Schumacher, F.X. and Eschmeyer, R. W. 1943. The estimation of fish populations in
lakes and ponds. J. Tenn. Acad. Sci. 18: 228-249 Seaman, D. E. and Powel, R. A. 1996. An evaluation of the accuracy of Kernel
density estimators for home range analysis. Ecology 77: 2075-2085.

110
Seamon, J. O. and Adler, G. H. 1996. Population performance of generalist and specialist rodents along habitat gradients. Canadian Journal of Zoology 74: 1130-1139
. Seber, G. A. F.1965. A note on multiple capture recapture census. Biometrika 52:
245-249. Seber, G. F. A.1982. Estimation of Animal Abundance and Related Parameters.
Macmillan, New York, USA . Sellers, W. I., Varley, J .S. and Waters, S. S. 1998. Remote monitoring of locomotion
using accelerometers: A pilot study. Folia Primatol. 69:82–85. Shankar, K. 1996. Islands in the Western Ghats, Science Reporter 33: 9-13. Shankar, K. 1998. Community ecology of small mammals in montane ecosystems of
Nilgiris, Southern India. Ph.D. Thesis, Centre for Ecological Sciences, Indian Institute of Science, Bangalore, India.
Shankar, K. 2000. Small mammal trapping in tropical montane forests of upper
Nilgiris, southern India: an evaluation of capture-recapture models in estimating abundance. Journal of Bioscience 25:101-112.
Sheikher, C., Malhi, C. S., Rawath, N. S. and Singh, R. 1983. Murids of Garhwal
Himalayas. Rodent Newsl. Jodhpur, India 7(4): 17. Sood, M. L. and Dilber, D. S. 1977. The composition and fluctuation of population
of sympatric Murid in PAU fields. J. Bombay nat. Hist. Soc., Bombay 14(2): 521-524.
Sood, M. L. and Gurya, S. S. 1978. Rats and their Control. Punjab Agri. Univ. Publ.
Ludhiana Sood, M. L. and Ubi, B. S. 1971. Population fluctuation of sympatric Murid occurring
in the field of PAU, Ludhiana, Effect of biotic factors. South Wood, T. R. E. 1966. Ecological methods. Methuen, London. United Kingdom. Sridhara, S. 1978. Influence on early nutritional experience on adult diet choice in
lesser Bandicoot rat Bandicoota bengalensis. Behavioural Biology 23: 540-548. Srihari, K. and Sridhara, S. 1978. Laboratory studies on the feeding behaviour of
Mus platythrix. Rodent Newsl. Jodhpur, India 2: 4. Srihari, K. and Sridhara, S. 1979. Food hoarding behaviour of Bandicoota
bengalensis and Tatera indica. Rodent Newsl. Jodhpur, India 3: 11. Stephen, E. W., Helen, M. and John, W. 2002. Spatial scale, species diversity and
habitat structure: small mammals in Australian Rain forest. Ecology 83: 1317-1329.

111
Struhsaker, T. T. 1997. Ecology of an African rain forest: logging in Kibale and the
conflict between conservation and exploitation. University Press of Florida, Gainesville.
Sukumar, R. 2000. Climate and Ecosystem changes: What does it mean for
biodiversity conservation in India? J. Indian Inst. Sci. 80: 609-918. Swihart, R. K. and Slade, N. A. 1985. Testing for independence of observations in
animal movements. Ecology 66: 1176 – 1184. Tattersall, F. and S. Whitbread 1994. A trap-based comparison of the use of arboreal
vegetation by population of Bank Vole (Clethrionomys glareolus), Wood Mouse (Apodemus sylvaticus) and Common Dormouse (Muscardinus avellanarius). J. Zool. 233:309-314.
Taylor, K. P., Quy, R. J. and Gurnell, J. 1981. Comparison of three methods for
estimating the number of Common Rats (Rattus norvegicus). Mammalia 45: 403-413.
Taylor, L. R., Kempton, R. A. and Woidwod, I. P. 1976. Diversity statistics and the log-series model. Journal of Animal Ecology 45: 255-271.
Thurston, E. 1909. Casts and Tribes of Southern India Vol. III-K. Cosmo
Publications, Delhi, 162-177. Tristiani, H., Murakami, O. and Kuno, E. 2000. Rice plant damage distribution and
home range distribution of the Rice Field Rat Rattus argentiventer (Rodentia: Muridae). Belgian Journal of Zoology 130: 83-91.
Ure, D. C. and Maser, C. 1982. Mycophagy of Redbacked Voles in Oregon and
Washington. Can. J. Zool. 60: 3307 – 3315. Vieira, M. V. Grelle, C. E. V. and Gentile, R. 2004. Differential trap ability of small
mammals in three habitats of south-eastern Brazil. Braz. J. Biol., 64: 895-900. Vighnarajan, G. 1990. Shendurney Wildlife Sanctuary Management Plan1990-'91 to
1999-2000. Kerala Forest Department 90 p. Vijayakumaran Nair P., Jayson, E.A. 1988. Habitat utilization by large mammals in
teak plantation and natural forests. K.F.R.I. Research Report No. 56. Kerala Forest Research Institute, Peechi, India, 47 p.
Wells, K., Pfeiffer, M., Lakim, M. B. and Eduard, K. L 2004. Use of arboreal and
terrestrial space by a small mammal community in a tropical rain forest in Borneo, Malaysia. J. Biogeography. 31: 641–652.
White, G. C. and Garrot, R. A. 1990. Analysis of Wildlife Radio tracking Data. New
York, Academic Press. 383p.

112
.White, G. C., Anderson, D. R., Burnham, K. P. and Otis, D. L. 1982. Capture recapture removal method for sampling closed population. Los Alamos, New Mexico: Los Alamos National Library.
Wileyto, E. P., Ewens, W. J. and Muller, M. A. 1994. Markov recapture population
estimate: a tool for improving interpretation of trapping experiments. Ecology 75: 1109-1117.
Williams B.K., Nichols J.D. and M.J. Conroy 2002. Analysis and management of
animal populations. Academic Press, San Diego, California, USA. Williams J. Southerland 1996. Ecological Census Techniques A Hand Book.
Cambridge University Press, UK p.36. Wywialowski, A. P. 1987. Habitat structure and predators: choices and consequences
for rodent habitat specialists and generalists. Oecologia (Historical Archive) 72: 39 – 45.
Yunger, J. A., Meserve, P. L. and Gutierrez, J. R 2002. Small mammal foraging
behaviour: mechanisms for coexistence and implication for population dynamics. Ecological monographs 72: 561-577.

1
Table16. Vegetation data and habitat parameters recorded from the trapping sites in the protected areas.
Sl. No.
Protected areas
Treespecies
Total no.of trees
Altitude(m from
msl)
Canopycover (%)
Under growth (Scaling)
Litter thickness
(cm)
Distance toWater body
(km)
Distance tohuman
habitations(km)
1. Neyyar 28 92 720 4 1 4 0 12 2. Periyar Tiger Reserve 13 122 1560 8 3 8 5 2 3. Aralam 32 271 250 8 3 6 0 2 4. Shendurney 22 360 250 9 1 9 1 4 5. Peppara 24 107 220 6 2 8 3 1 6. Chinnar 12 120 1710 10 4 11 3 8 7. Silent Valley 16 210 1050 9 3 8 5 2 8. Idukki 14 160 1070 8 3 9 5 5 9. Wayanad 24 180 950 7 2 8 3 8 10. Thattekkad 34 402 100 9 3 9 2 4 11. Eravikulam 12 240 1650 10 3 10 1 1 12. Parambikulam 26 212 495 10 3 11 1 7 13. Peechi I 18 113 550 7 1 5 4 2 14. Peechi II 22 210 780 8 1 5 3 1 15. Chimmony I 26 224 450 9 1 7 1 3 16. Chimmony II 12 143 450 7 0 5 1 3

2
3.2.3 Discussion The protected areas of Kerala have only low density of rodents. Fifty six per
cent of the 16 sampled plots were only having sufficient capture data needed for
necessary analysis for the estimation of density. The increase of new captures on the
fourth day in three of the sessions was significant as it may be due to the immigration
of the rodents from the near by areas to the plot where plenty of food was available.
The study indicated that in the Western Ghats tropical forest, four days of trapping is
optimum. In such circumstances, where a most robust method like Schnabel method
(Schnabel, 1938; Schumacher and Eschmeyer, 1943) fail to produce reliable
population size estimator, the MNA should be taken as the population size. In tropical
conditions increasing the sampling period for more than four days causes high trap
death (Shanker, 2000). Another problem of increasing the sampling period for more
than four days was the immigration, which will break the demographic closure
assumption necessary for CMR operations other than for open population models
(Shanker, 2000; Vieira, 2004). No study has been reported from the tropical areas
using CMR in considerably large area as the Kerala part of the Western Ghats with
uniform methodology so that the heterogeneity in trapability over similar large-scale
demographic changes could be assessed.
Sex ratio: Low density was a problem in interpreting the sex ratio of the animals
trapped except Rattus rattus in some protected areas. The available sex ratio of the
animals trapped was highly biased towards male or female. In the case of Rattus
rattus considerably few percentage of males were trapped on the first day, which
showed that males are more neophobic than females. Since reliable information about
the behaviour of the species is lacking, it is difficult to propose a sex specific change
in trap responses, including exploratory behaviour, which causes a decrease in
number of males trapped at least in certain sessions. Majority of the protected areas
showed highly female biased sex ratio in the case of most abundant species. As the
number of individuals trapped were less in the case of other species, it was difficult to
interpret their sex ratios. The habitat use of two species - Rattus rattus and
Cremnomys blanfordi was similar and the niche of the species Platacanthomys
lasiurus was found overlapping to Rattus rattus.

3
Role of habitat in species composition
The study established a strong positive correlation between the rodent species
richness and the tree species richness. The criteria of habitat selection of each species
were not clearly studied. Multi dimensional scaling of the protected areas based on
the habitat parameters of the sampled plots have shown a pattern of habitat influence
in species assemblage, but with low resolution. The protected area, where the Rattus
rattus was dominating has comparatively high positive values for their second
stimulus coordinates dimension in the analysis. In the protected areas which had a
negative value for this axis (less than 0.002) either species other than Rattus rattus,
which has similar habitat use, was trapped or they were trapped along with Rattus
rattus with out a clear dominancy for Rattus rattus. A clear pattern of species
assemblage was not revealed from this, other than the fact that habitat characteristics
have some influence in habitat selection.
Meena (1997) had reported a strong negative correlation in the distribution of
Rattus rattus and Cremnmys blanfordi. She also reported that Rattus rattus was
dominant in semi evergreen forest and Cremnomys blanfordi was dominant in
deciduous forest. Multi Dimensional Scaling of the protected areas revealed a trend in
the habitat characteristics for the co-existence of these species. Rattus rattus was
found absent in semi evergreen forest at Aralam Wildlife Sanctuary and in moist
deciduous forest at Neyyar Wildlife Sanctuary. In Wayanad Wildlife Sanctuary were
the sample plot was in semi evergreen forest Rattus rattus was the most abundant
species and Cremnomys blanfordi the second abundant one. The present study also
revealed that the diversity of tree species is positively correlated to the diversity of
rodents. This is a strong evidence to believe that, more than competition; the diversity
of the habitat influences the coexistence of rodent species. This is in accordance to
the generally accepted principle that the intensity of the competition depends on the
carrying capacity of the ecosystem.
Since there is no evidence of competition in these circumstances, the species
composition should be attributed to the habitat selection criteria of the individual
species. These criteria may vary over the demography and climate (Meserve et al.,
2003). A behavioural change according to the presence and absence of a resource
sharing species was clear in trapping, but weak to be attributed to competition.

4
Rodent species richness is positively correlated to the tree species richness.
Diversity in tree species nurtures the diversity in an important component of the
ecosystem. In general this shows the necessity and importance of plant diversity. A
pattern of species assemblage exists with regard to the vegetation characteristics of
the habitat. There exist little evidences of competition but strong behavioural
responses against the presence of competitive species at least in case of the most
abundant rodent species Rattus rattus. Mus platythrix, a burrowing rodent species so
far not reported from Kerala part of the Western Ghats was newly recorded from the
Kerala part of the Western Ghats in this study. The study also indicated that House
Rat invaded the most of the forest areas in Kerala.
Cremnomys blanfordi was newly reported from Wyanad, Neyyar and Aralam
Wildlife Sanctuaries. The result is of special interest in formulating wildlife
management and biodiversity conservation strategies for the protected areas of Kerala
and standardising methodology for rodent studies in tropical forest habitat. The
predominance of the species Ratts rattus in all the protected areas among the rodent
community is an important observation. The trap response of Rattus rattus which is a
broad niche species is totally diverse and highly individual. The diverse trap response
of the species and low capture success of the other less dense rodent species make it
impossible to apply conventional Capture Mark Recapture density estimation models
in the study.