Embed Size (px)
Citation preview
0
Status-Aspirational Pricing: The “Chivas Regal” Strategy in U.S. Higher Education, 2006-2012*
Noah Askin, INSEAD, [email protected]
Matthew S. Bothner, European School of Management and Technology, [email protected]
Abstract: This paper examines the effect of status loss on organizations’ price-setting behavior. Our main prediction, counter to existing status theory, is that a status decline prompts a focal organization to charge a higher price. We also develop two moderating hypotheses: the positive effect of status loss on future price is strongest (1) for organizations with broad appeal across disconnected types of customers and (2) for organizations whose strategically similar rivals have charged high prices previously. Using panel data from U.S. News & World Report’s annual rankings of private colleges and universities, we model the effect of drops in rank that take a school below an aspiration level. Findings show that schools set tuition higher after a sharp decline in rank, particularly schools with broad appeal among college applicants and whose rivals are expensive. Scope conditions on our predictions are proposed. Implications for status theory, performance feedback theory, and organizational research on rankings are discussed.
* For valuable comments, we thank Jan Doering, James Evans, Martin Gargiulo, Bruce Kogut, Steve Morgan, Niko de Silva, Simon Wakeman, and seminar participants at Chicago, Cornell, ESMT, IESE, INSEAD, and Oxford. We are also grateful to Elton Lor for his assistance with data collection and cleaning.
1
INTRODUCTION
Whether status is seen as a means of detecting otherwise obscured quality or as a utility-
bearing end in itself, a core insight of previous research in organization theory is that high-status
organizations command higher prices for their goods and services. Benjamin and Podolny (1999)
found that elite wineries enjoy higher prices for their wines than do their lower-status rivals;
Stuart, Hoang and Hybels (1999) established that biotech ventures with more prestigious
affiliates enjoy better initial valuations; and Uzzi and Lancaster (2004) identified a strong
positive effect of corporate law firm status on the price of legal services. While we draw
inspiration from these lines of work, we also depart from them in a salient respect. We develop
and test as our main hypothesis the expectation that, in certain institutional domains, an
organization will charge higher prices as a reaction to status loss.
Examining the effects of status declines allows us to address a significant gap in the
literature: researchers have thus far given little attention to how an organization responds after its
status falls. Focusing explicitly on these behavioral responses is important because it is likely
that “assuming away” agency (Burt, 2010: 222) has created an incomplete view of how status
shapes outcomes in markets. Consider what prevailing status theory (e.g., Podolny, 2005;
Sauder, Lynn, and Podolny, 2012) suggests will occur when an organization (or individual) slips
in status. In this stream of work, the general imagery is strongly deterministic: structures
primarily affect agents rather than vice versa. Existing models, depending on the industry, imply
that status loss induces lower rates of innovation, higher costs, elevated exit chances, lower
growth rates, and lower prices. The implicit picture is clear: when an organization’s status falls,
it passively suffers a future performance decline with low chances for recovery.
In contrast, we believe that an emphatically more agentic conception of status dynamics
in markets is vital. Focusing on active responses to the pain of status loss is important for
2
producing better models of status-based performance (measured by organizational growth,
survival, or profitability) and of industry-wide status distributions (Sauder, Lynn, and Podolny,
2012: 275). That is, if we take into account the triggering effect status loss can exert—or the
satiating effect a status gain can have—we may find that status shapes both organizational
performance and global status distributions in ways that differ from what prevailing wisdom
predicts. The core issue is that a loss in status elicits efforts to recover. Such efforts can curb the
unfavorable effects of these declines on organizational performance, while also shaking up and
ultimately tightening status distributions otherwise thought to fan out irreversibly with time (cf.
Askin, Bothner, and Lee, 2015; Merton, 1968).
Our aim is to contribute to an agentic theory of the effect of status loss on future pricing.
We draw extensively on performance feedback theory (Greve, 2003; Baum, Rowley, Shipilov,
and Chuang, 2005; Shipilov, Li, and Greve, 2011), which offers a theoretical lens that is not
overly deterministic by giving significant weight to agency. According to this perspective, an
organization receives feedback from its external environment (for example, changes to its rank in
a dynamic contest for status) and then adjusts its conduct (for instance, its price-setting behavior)
if that feedback indicates it has fallen short of its aspirations.
Using performance feedback theory as a basis for advancing status theory implies
additional breaks with prior work on the consequences of organizational status. To clarify these
breaks, consider again two prominent studies of the effect of status on price with which we
began: Benjamin and Podolny (1999) on wine and Uzzi and Lancaster (2004) on legal services.
Our hypotheses differ from those predicted by these studies in three ways: how we conceptualize
status, how we view the “role” of price, and the kind of variation on which we focus when
estimating the effects of status on price. Consistent with signaling theory (Spence, 1974) and
3
hedonic pricing models (Rosen, 1974; Feenstra, 1995), Benjamin and Podolny (1999) and Uzzi
and Lancaster (2004) conceive of status as a largely stable trait that buyers desire. Consumers of
wine take winery status as a signal of difficult-to-observe quality, and corporate clients derive
satisfaction from the status of the law firms whose services they buy. Price is then a natural
reflection of consumer demand. Put differently, buyers consider a vertical array of outputs,
differentiated by producer status, and are more willing to pay higher prices for the goods or
services of higher-status organizations. Using between-organization models, Benjamin and
Podolny (1999) and Uzzi and Lancaster (2004) find positive effects of organizational status on
price. Their findings, informed by a strict conception of status signaling in market settings, form
the competing prediction against which we present an alternative.
Inspired by the focus on dynamics in performance feedback models, we instead view
status as a mutable position in a tournament in which producers seek to rank favorably (see also
Sauder and Lancaster, 2006; Espeland and Sauder, 2007). Status, therefore, is not exclusively a
trait that buyers value; it is also a salient, performance-related goal for producers. In our
theoretical account, when a producer’s status falls below its aspirations, it uses price as an
“adaptive device” (Cyert and March, 1963: 152) in an effort to recover lost ground. We thus cast
price-setting as an organizational decision based on status relative to aspirations. In particular,
we discuss organizations as prone to increase price after a drop in status in order to send a quality
signal conducive to status recovery. In this sense, we anchor on a different side of the “dual role
of price” (Volkner and Hofmann, 2007: 194). Following Leavitt’s (1954: 205-6) early
distinction, we focus on price not simply as a “sacrifice” for consumers but also as a “symbol”
4
used strategically by status-aspiring organizations.1 Using within (rather than between)
organization models, we test our main hypothesis that a given producer sets price higher as a
reaction to the perceived problem of status loss. Within-organization models are valuable for two
reasons: first, for sweeping out unobserved stable traits that can create the appearance of a
positive effect of status on price, and second, for bringing into focus the adaptive responses of a
focal organization as it travels through its status hierarchy over time.
However, we do not assert that these departures from prior theory are necessary for
understanding the consequences of status in all empirical settings. One can imagine markets in
which virtually all variance in producers’ status is time-invariant and where prices are primarily
determined by buyers’ preferences. In such cases, the traditional conception of status is the
correct theoretical lens: status acts as a signal or a good that raises buyers’ willingness to pay.
Yet in many contexts, producers do see status as a performance dimension (Sauder and Espeland,
2009) on which they vary over time. For these settings, where passive responses to status decline
seem unlikely, it is necessary to reconsider the nature of the effect of status on price.
Doing so allows us to make two main contributions to status theory. First, we integrate
existing theoretical frameworks to develop the general hypothesis that an organization raises
price in reaction to status decline. We also revisit this hypothesis in our conclusion where we
discuss additional empirical settings in which our main theoretical claim might be tested further
and our findings potentially replicated. We explicitly address wine and restaurants, but are
confident that industries as diverse as luxury goods, high-end hotels, and private art collecting
would show evidence of our expected effects, as well.
Second, as not all organizations will be able to credibly engage in what we refer to as
1 Several other studies draw a similar distinction. For instance, Rao and Monroe (1988: 253) distinguish between price as an “indicator of sacrifice” in economic theory and price as a “quality cue” in behavioral research, and Fruchter (2009: 479) distinguishes between price “as a monetary constraint” and price “as a signal of quality.”
5
status-aspirational pricing, we develop two moderating hypotheses regarding the kinds of
organizations for which we expect the strongest effect of status loss on future price increases.
Previewing our analyses, we find that the effect is concentrated within two kinds of
organizations: those appealing broadly to disconnected kinds of buyers (thus having “license” to
price up in reaction to status decline), and organizations whose structurally equivalent rivals have
previously charged relatively higher prices (a finding consonant with behavioral research on
fairness norms in markets). These contingent effects inform a broader set of scope conditions
that bracket the generality of our primary hypothesis. These boundary conditions clarify the
kinds of industries in which we expect organizations to raise prices in reaction to status loss and,
more generally, indicate pathways for new research on agentic reactions to status decline.
PRICING HIGHER IN REACTION TO STATUS LOSS
Main Hypothesis
We sketch the underpinnings of our main hypothesis in a brief, theoretically informed
narrative centered on a focal producer A (cf. Greve, 2003: 53-60). A is an organization occupying
a rank in a dynamic contest for status. A also sells a good, in competition with other producers in
the set A, to a group of buyers B. Both groups—A and B—place a high value on the status levels
of the producers and their goods in the marketplace: higher status members of the former attract
status-seeking members of the latter, who in turn intrinsically value their association with higher
status producers and their wares. To this end, A’s decision makers are compelled to take steps to
ensure the continual maintenance or improvement of their organizational status: it is a goal unto
itself. In addition, in the simple account that follows, A takes actions that clearly not all
producers across all industries can take, but before describing the factors that bracket the
generality of these actions, we first lay out their antecedents and expected consequences.
6
Suppose first that, in the current iteration of the contest, A observes that it has slipped in
status. Imagine further that this decline means that A is now significantly shy of its aspirational
status level. Within the status hierarchy, this aspiration level is a narrow region in which A is
comfortable.2 We later discuss how we capture this region empirically, but for now we view it as
a band in the status order towards which A is “psychologically neutral” (Kameda and Davis,
1990: 56; Greve, 2003: 39). As A has fallen below this band, A is no longer satisfied but rather
suffers the pain of status loss. In line with prospect theory (Kahneman and Tversky, 1979) and
with Burt’s (1982; 2010) model of peer effects, this displeasure is greater than the pleasure A
would enjoy if it had instead ascended above this band.
Two organizational changes result from A’s dissatisfaction. First, as prospect theory
suggests, A is now more willing to engage in risky behavior (Kahneman and Tversky 1979;
1984; Bothner, Kang and Stuart, 2007). Second, drawing further on performance feedback
theory, A’s sharp distaste for status loss evokes deliberations on possible strategies for
recapturing lost ground. We envision A’s deliberations as a special form of problemistic search
triggered by unmet objectives (Cyert and March, 1963; Shipilov, Li, and Greve, 2011: 1421-22).
These deliberations are related directly to price-setting and are separate from ongoing,
institutionalized mechanisms for status-maintenance (cf. Greve, 2003: 54-56).3 We return to the
issue of greater risk-taking propensities later, focusing now on A’s strategic search.
In particular, imagine that A considers the possibility of raising the price of its good.
Doing so is, in effect, to act on a folk theorem known as the “Chivas Regal” strategy. Named
after a previously middling brand of whiskey purported to have doubled its sales by doubling its
2 We also discuss the consequences of ascending in status above this region as we describe measures of status loss and status gain, respectively. Our theoretical focus, however, is on the consequences of status loss. 3 An organization may engage continually in activities that seek to maintain and improve its status—whether or not its status is currently beneath its reference point. Such activities might include investments in quality, strategic gift giving, or various forms of window-dressing and endorsement seeking (Podolny and Phillips, 1996; Stuart, Huang, and Hybels, 1999).
7
price (Finkelmeyer, 2011), the Chivas Regal strategy is often described as an effort to enhance
status by price signaling: raising price is a way for the focal organization to increase in perceived
quality and associate more closely with its more elite peers. This strategy is consistent with a
long history of work emphasizing the symbolic role of prices. Leavitt (1954: 206-10) was among
the first to stress that price could serve as a symbol of prestige. He argued that a high price may
attract instead of repel, citing as an example the “phenomenon of the dormant shirt that comes to
life when the price is marked up.” In contemporary experimental work, Plassmann and her
colleagues (2008) established that when individuals are informed (falsely) that a given wine
commands a higher price than a physically identical wine, they give the allegedly more
expensive wine a better rating. Perhaps most succinctly demonstrating the potent impact of price
on perceptions, Espay and colleagues (2015) found that placebos described as “expensive” are
more effective than those described as “cheap” in the treatment of Parkinson disease.
On a broader level of analysis, numerous studies similarly suggest that price and
perceived quality are often positively associated in cross-section. For example, although the
magnitude of the correlation between price and quality varies across markets, meta-analyses by
Tellis and Wernerfelt (1987), Rao and Monroe (1989), and Volckner and Hofmann (2007) are all
consistent with the axiom “you get what you pay for.” While we do not cast our focal producer
as explicitly aware of particular, stylized facts reported in the scientific literature, A is not so
boundedly rational as to be unaware of general patterns relevant to its goal of status recovery.
Consistent with a (likely inchoate) sense of these patterns, A may also choose to raise price
because it believes that this will improve how it is perceived among those shaping its status.
A’s assessment of the gap between its current and desired status elicits further
deliberation, and ultimately a decision. Separate from the problemistic search caused by status
8
loss, the focal producer must of course also consider an array of other factors as it settles on the
price of its good. These include cost and demand drivers on which A always deliberates, whether
or not the focal organization is out of sync with its desired level of status. Together with a
consideration of these drivers, A must finally make a judgment about whether raising its price
makes sense in light of the risks involved: demand for A’s good may suffer and, in some
contexts, the composition of its buyers may grow less heterogeneous, or A may be stigmatized
for violating fairness norms on pricing (Kahneman, Knetsch, and Thaler, 1986). More complex
considerations surround how much A values its status and how certain A is that a higher price
will translate into status recovery. These considerations concern aspects of the organization’s
position in its market that we discuss next as moderators, and which affect A’s deliberations as
well as its tolerance for risk.
Suppose, for now, however, that A’s market position and its broader institutional context
are such that the causal sequence we have sketched ends with A’s decision to engage in status-
aspirational pricing: A’s status drops below its aspiration level; the pain of this deviation evokes
problemistic deliberation as well as a greater willingness to take risks; and A, aiming to recover
in status, decides that raising price is the right decision despite the risk involved. Our main
hypothesis, subject to the moderators to which we now turn, is therefore the following:
Hypothesis 1: A focal organization increases price in reaction to status loss.
Moderating Hypotheses
We propose two further hypotheses that concern the circumstances under which
organizations are most likely to react to status loss by raising price. The first has to do with an
organization’s consumer-conferred freedom to charge more, the second with the freedom
9
afforded by its competitors in the market.
Our first moderating hypothesis follows from our discussion of price hikes as cases of
organizational risk-taking: we expect the focal producer A to react most strongly to status decline
insofar as that producer appeals broadly to disparate kinds of buyers (cf. Burt, 1992: fig. 6.6).
More specifically, imagine buyers B are differentiated in their preferences for certain producers
over others. Such a pattern might emerge as the result of many producers’ tendencies to target
specific locations in a technical, geographical, or product-features space, and then target
particular kinds of buyers similarly distributed across that space (cf. White, 2002: 107-8).
Suppose that, by contrast, A appeals to a broad array of these buyers, rather than selling just to a
narrow subset. Our reasons for anticipating that this breadth of appeal will magnify the strength
of A’s reaction to a status decline are twofold: the first is purely structural; the second is
perceptual and more intriguing theoretically (see Podolny, 2001 on “pipes” versus “prisms” for
an analogous distinction).
First, the risks often associated with price increases are lower for an organization that
enjoys broad appeal. Put simply, such a producer is aware of its options, and is appropriately
hedged should some consumers defect. This claim follows several long-standing theoretical
approaches, which include resource dependency theory (Pfeffer and Salancik, 1978), ecological
portrayals of niche width as a buffer against uncertainty (Hannan and Freeman, 1989; Péli,
1997), and structural hole theory, which highlights the freedom to experiment enjoyed by
occupants of brokerage positions (Burt, 1992: 195-97). These research traditions, which stress
the advantages of being minimally dependent on any one exchange partner, jointly imply that
organizations exhibiting wide, diverse appeal will also deem less precarious decisions that are
typically seen as high-risk.
10
Second, we also view an organization with broad appeal as a more credible member of its
market than its more resource-dependent rivals. Here, we diverge from research underscoring the
identity-related advantages of focus and specialization (e.g., Zuckerman, 1999; 2000; Leahey,
2007; Leahey and Reikowsky, 2008), instead focusing on the confirmation of credibility
provided when normally disparate or disagreeing parties reach consensus on a focal individual or
organization. We view producer-buyer ties as implicit endorsements that are especially valuable
for the producer if its buyers are diffuse and otherwise non-overlapping in their choice-sets. This
intuition is perhaps best illustrated by a simple example at the individual level: consider a job
candidate who succeeds in earning praise from several members of a hiring committee who are
typically at each other’s throats. Getting broad support from those with divergent tastes signals
that she, more than her narrowly supported rivals, “is worthy.”4 Research on the performance-
related advantages of betweenness centrality (Rowley et al., 2004) and robust positions (Bothner,
Smith, and White, 2010) in inter-organizational networks is also consistent with this account. We
view organizations with this structure of support as perceived to be fully credible members of
their markets. Such organizations, we predict, will have the leeway to react most strongly when
their status falls. Their solid footing gives them an implicit license in their price-setting decisions
that peripheral organizations lack. More formally, we expect:
Hypothesis 2: A focal organization increases price in reaction to status loss most strongly when that organization appeals broadly to disparate kinds of buyers.
We also expect the positive effect of status loss on future price to be greatest for the focal
producer whose structurally equivalent rivals (Burt, 1987; White, 2002) charge relatively high
4 A broadly similar logic is apparent at a more micro-level of analysis in diffusion research: a piece of information (e.g., a rumor or opinion) is deemed believable only insofar as it is independently verified by multiple, disconnected others (Centola and Macy, 2007).
11
prices. Simply stated, a focal producer is structurally equivalent to other producers insofar as
they sell goods to the same subset of buyers (Burt, 1992; cf. Lorrain and White, 1971;
McPherson, 1983). When joined with behavioral research on fairness norms in markets,
network-analytic research on structural equivalence offers clear guidance on how close
competitors amplify (or dampen) reactions to slips in status.
An important implication of behavioral research is that rivals’ past prices shape the
normative context in which a focal producer selects its own price. Kahneman, Knetsch, and
Thaler (1986) observed that whether buyers perceive a given producer’s price as unfair hinges on
the prices already set by that producer’s rivals. Rivals that have previously charged a high price
afford the producer greater latitude in subsequent price-setting, allowing that producer to charge
more without transgressing norms of fairness. We propose that status-aspirational pricing
becomes a viable strategy when the focal producer is unconcerned about exceeding its peer-
based “just price” (Thaler, 1985: 205), which could lead to being stigmatized as unfair, or even
exploitative (Bolton, Warlop, and Alba, 2003). Support for this claim also appears in the
marketing literature around the concept of “contextual reference prices” (Rajendranan and Tellis,
1994) and in sociological research on markets. In particular, White’s (2002) formal model posits
that all producers in a given market offer buyers an equally fair deal, and suggests that penalties
await the producer that exceeds the price expected in light of the pricing decisions of its peers.
One particularly valuable and precise approach to identifying such peers relies on the
concept of structural equivalence. Work on the subject also supports the contention that
structurally equivalent peers shape a focal producer’s autonomy to react to a status decline by
raising price. Earlier work (Merton, 1957; Burt, 1982) understood structural equivalence as the
social architecture out of which reference groups emerge in competitive domains, while also
12
demonstrating that similarly situated rivals define appropriate conduct for a given organization
(Mizruchi, 1990; Galaskiewicz and Burt, 1991; Bothner, 2003). Taken together, research in this
vein carries direct implications for the circumstances in which a focal producer reacts to status
loss by increasing price. Conditioning on a given organization’s prior price, we expect that
organization to react most assertively to status decline when its nearest peers have previously
charged high prices. Under this scenario, the organization has the freedom to increase price at
lower risk of violating buyers’ normative expectations. We predict:
Hypothesis 3: A focal organization increases price in reaction to status loss most strongly when that organization’s structurally equivalent rivals have charged high prices.
METHOD
Context and Variables
We tested our hypotheses using a panel of nationally focused liberal arts colleges and
universities covered by U.S. News & World Report (hereafter USN) from 2005 through 2012.
This empirical context is appropriate for assessing our predictions for three main reasons. First, it
offers a clear measure of organizational status—the USN rank—and the opportunity to examine
its effects on organizations’ pricing decisions. Second, it contains organizations for which status
is a goal and whose status positions change meaningfully over time.5 Third, during the seven-
year interval from 2005 through 2011, USN reported detailed inter-organizational relational data,
based on reports of incoming students’ application behavior, which allow us to construct
network-related covariates required by our two moderating hypotheses.
5 USN’s separation of liberal arts colleges and universities by geographic scope and degree offerings, based on the Carnegie Foundation’s classification system (http://classifications.carnegiefoundation.org), allows us to focus on those schools for which status matters most: institutions with an (inter)national reach. Our panel excludes institutions covered by non-national USN rankings, such as those for regional and baccalaureate schools. While status and tuition are important for these schools, they tend to have a narrower strategic purview—monitoring peer schools and targeting students within a close geographic radius.
13
USN ranks. USN creates a hierarchy of ranks each year based on weighted and
measurable (if contested) inputs. As such, they are a public, manufactured reflection of the
prestige of colleges and universities (hereafter “schools”) as viewed by administrators as well as
statisticians at USN. Moreover, owing both to their involvement in the rankings’ calculation and
to the fact that their jobs often hinge on improving their school’s position in this ordering (Farrell
and Van Der Werf, 2007), administrators, college presidents, and board members are thought to
care more about the rankings than does any other constituency (Gordon, 2012). These are also
the individuals responsible for setting tuition levels, though the specific office or position
assigned to the task differs by school.
USN began ranking undergraduate institutions in 1983, basing those rankings exclusively
on the subjective assessments of college administrators. Today, USN ranks reflect a much more
intricate process, though they are no less a subjective “gauge of status” (Nocera, 2012: 2), as the
magazine still depends disproportionately on the opinions of top administrators when calculating
ranks. USN takes the weighted average of a series of scores, ranging from subjective appraisals
and student selectivity to alumni giving, to create an “overall score” for each school,6 which is
then normalized to 100 for the top-ranked college and top-ranked university. The normalized
scores are in turn converted to ordinal positions and published as the final annual USN rankings.
For instance, in 2005, Williams, Amherst, and Swarthmore received overall scores of
100, 98, and 96 respectively, and accordingly occupied ranks 1, 2, and 3 in the college category.
In that same year, for universities, the overall scores of Harvard, Princeton, and Yale were 100,
6 More precisely, USN employed the following seven-component weighting system when calculating its 2005 rankings of the colleges and universities in our panel. First, the heaviest weight, 25%, was applied to the results of an “academic peer assessment” questionnaire that asked administrators from each school surveyed to score all other schools with which they are familiar; second, a 20% weight was attached to the student retention rate; and third, 20% was again applied to an aggregation of variables under the heading “faculty resources.” This includes, among other factors, class size and faculty salaries. The remaining four components received the following weights: 15% to an aggregation of “student selectivity” measures (proxies for student quality, such as SAT scores), 10% for the school’s financial resources, 5% for its graduation rate, and 5% for the giving levels of its alumni. The weighting schemes changed slightly over the course of our panel, but the comprising categories did not.
14
100, and 99, and so they held ranks 1, 1, and 3. Ties—like the one in 2005 between Harvard and
Princeton—are even more common as ranks grow larger (e.g., seven universities were tied for
74th in 2005). In addition, ties occur by construction beyond the first tier. As an example, USN’s
2005 Best Colleges assigned ranks for colleges ranging up to 105 (where there was a five-school
tie). Without explicitly denoting a second tier, the guide noted that schools in the third tier were
ranked between 111 and 161 and were listed alphabetically instead of by rank. Fourth-tier
colleges were also listed alphabetically, and were listed as being ranked from 163 to 215. Given
USN’s approach, we followed Sauder and Lancaster’s (2006) method for assigning ranks to
schools outside of the top tier: any school listed alphabetically by group was assigned the
average rank (rounded to the nearest integer) of the reported range for that group. We also
created a corresponding dummy-variable, not-first-tier, for any school with a rank assigned by
this method. We discuss the implications of this covariate for tuition in the context of our results.
Yearly contests for status among schools. Our empirical setting is also marked by a dual
condition that must be met for our hypotheses to have relevance in a given context: status shifts
across time, and status positions as important objectives for the organizations involved. This
condition characterizes the nationally focused schools covered by USN: college administrators
are perhaps extraordinary in their fascination with prestige and in their obsession with yearly
changes in standing. While financial health is certainly a concern for administrators and
overseers, many colleges and universities are arguably more concerned with maintaining and
raising their status than anything else (James, 1990). Unsurprisingly, in the first formal economic
model of the modern university, Garvin (1980) depicted academic departments (and by
extension, entire schools) fundamentally as status-maximizers (see also Ehrenberg, 1999). More
so than in other industries where status also matters—such as banking (Podolny, 1993; Jensen,
15
2003)—in higher education, maximizing institutional status is a primary aim: “if colleges and
universities have a single-valued objective function, it is something like ‘prestige maximization’”
(Winston, 1999: 16). Academics’ reflections on their own context are paralleled in more popular
accounts. Caught up in the USN “rankings craze” (Lovett, 2005), administrators are thought to
“obsess over every incremental shift on the rankings scoreboard” (Pope, 2012), while college
presidents “live and die” by USN rankings (Stecklow, 1995).
There is, though, an important caveat here: public institutions often have different
missions from those of their private counterparts. In particular, public schools are often more
committed to the objective of equal access than the goal of relative standing. Consequently, in
the empirical models we present, our estimates only reflect the rankings and tuition levels of
private institutions.7
Status loss and status gain. Using the USN rank as our starting point, we constructed two
dummy variables, status loss and status gain. Estimating the effect of a loss in status on future
tuition is necessary for testing our three hypotheses. Conditioning separately on a second
indicator that records a significant gain in status is important for addressing alternative
explanations for the empirical pattern we observe, which we describe below.
Our measurement strategy follows earlier work in performance feedback theory in which
researchers have relied on important facets of an organization’s history (Greve, 1998) and have
focused on deviations from an aspiration level or reference point (Baum et al., 2005). In
particular, we build on Baum and colleagues’ (2005: 538) conception of an organization’s
7 There is a second compelling reason for splitting our panel by private versus public institutional type: forces inside and outside public institutions, including state legislatures, often directly shape their tuition-setting behavior (Ehrenberg, 2001). While various groups set tuition at private schools—at times the Board of Trustees or Budget Office, in other cases the Provost or a tuition committee—tuition is always set inside the institution and apart from state-level political intervention (Brewer, Gates and Goldman, 2004). Unlike their private counterparts, which can adjust tuition flexibly in reaction to market stimuli, publics are often constrained by state-specific tuition plans that extend over several years. Therefore, while public institutions are incorporated in the inter-school network covariates to which we now turn, they do not appear in related panel models.

16
reference point as a “boundary between perceived success and failure.” Using this imagery as
our foundation, we assume first that the focal school is relatively neutral or indifferent when its
current rank in year t, itR , is reasonably proximate to its school-specific mean rank, iR . Unlike
very long (i.e., multi-decade) panels in which several time-varying reference points likely arise
for each organization, our panel contains seven years, 2005-2011, along which we can measure
our explanatory variables. Consequently, in our setting, a focal school’s average rank is a
plausible midpoint around which to determine the “width” of that school’s (time-constant)
boundary between perceived failure and success in the rankings. We set the width of this
boundary at ten ranks. When a given school is inside a ten-rank range around its mean, it
occupies a region of relative indifference, compared to the sharp dissatisfaction (satisfaction) it
would sense were it more than five ranks worse (better) than this mean. We use a ten-rank range
so that yearly changes in status captured by our dummy variables exceed white-noise
fluctuations, while also not being so broad that virtually no schools experience these changes
during our observation window. More generally, we view the organizations in our setting as led
by relatively boundedly rational decision-makers who do not pinpoint a single, precise rank at
which they are indifferent. They instead know when they reside meaningfully outside (below or
above) a comfortable range in the tournament for ranks.
Our measures of status loss and status gain are each simple binary switches that reflect
two events. Status loss equals 1 rather than 0 under these two conditions: first, school i is
currently (in year t) more than five ranks worse than its school-specific mean; second, school i
historically (in a year p < t) ascended above that mean. Our measurement of status gain follows
the same logic. It switches from 0 to 1 when these two, mirror-image conditions are met: school i
is currently (in year t) more than five ranks better than its school-specific mean, and school i
17
previously (in a year p < t) fell beneath that mean. More formally, we can depict these two
measures as follows:
1 if 5 , ; 0 otherwise it it i ip istatus loss R R R R p t= > + ∩ < < (1)
1 if 5 , ; 0 otherwise it it i ip istatus gain R R R R p t< − >= ∩ < (2)
Conditioning on status gain, together with status loss, is important for two reasons. First,
on a general level, recall our main interest in testing the prediction that a status decline triggers a
higher future price. Importantly, that effect could instead be traceable to an increase in status that
influences decision-makers to lower price or hold price constant. Such an outcome might occur if
a status gain ratifies existing behaviors, fostering complacency (Bothner, Kim, and Smith, 2012)
and solidifying the sense that change is unnecessary (Audia, Locke, and Smith, 2000). Second,
turning to specific features of our empirical setting, an improvement in status might also reduce
the chances of raising tuition because higher status brings greater visibility (Sauder, Lynn, and
Podolny, 2012) and thus stronger normative pressure to seem less expensive. In a setting in
which political leaders have felt inspired to “declare...war on the rising cost of college”
(Weissman, 2012), it is important to consider that mounting status may make a focal school more
susceptible to an “outrage constraint” (cf. Bebchuk, Fried, and Walker, 2002) and therefore
averse to raising tuition. Entering status gain as an adjustment allows us to address these
possibilities and, in particular, to disentangle the effects of loss versus gain.
Moderating variables: betweenness centrality and weighted peer tuition. Inter-school
relational data reported by USN allow us to capture the width and diversity of schools positions’
in the college-applicant market. Our measure of betweenness centrality (Freeman, 1979;
Brandes, 2001) based on these data permits us to identify fully credible, core institutions to test
18
hypothesis 2. Summarizing our calculation of betweenness centrality, we note first that, from
2005 through 2011, USN listed the top five other schools to which each focal school’s students
also applied. For example, in 2009, New York University “cited” these five schools as those to
which its students also applied: Boston University, Columbia University, Cornell University,
Harvard University, and the University of Pennsylvania. Columbia University in turn cited these
five institutions in 2009: Harvard University, MIT, Princeton University, Stanford University,
and Yale University. Using these citations as inter-school ties, we pooled all schools (private and
public) in each year, and generated symmetric, annual inter-school citation matrices tA , where
t ijta⎡ ⎤⎣ ⎦=A . In this matrix, = 0iita , = 1ijta if school i cited school j or school j cited school i as
an overlap in year t, and = 2ijta if i and j jointly cited each other.
[Figure 1]
We then applied Brandes’s (2001) method to tA to generate betweenness centrality
scores for all schools in each year. Summarized formally, the betweenness centrality of a given
node in a network is a function of the number of shortest paths passing through that node. In our
setting, a school with a high level of betweenness centrality—such as Boston University (BU),
NYU, or Washington University in St. Louis (WashU) shown in figure 1—reaches across
diverse kinds of college applicants. Such schools tend to cite or be cited by schools that typically
do not cite each other as overlap schools, meaning that they appeal broadly to a set of students
whose application-related preferences were divergent. Unlike peripheral schools with limited
market reach, we view occupants of these bridging positions in the network as schools capable of
aspirational pricing. Restating hypothesis 2 in our empirical setting, we expect the positive effect
of status loss on future tuition to increase with betweenness centrality.
19
The inter-school relational data just described also allows us to construct a measure of
peers’ past pricing decisions, which we term weighted peer tuition. We use this variable to test
hypothesis 3. Our approach follows Burt (1987: 1294-97) and Burt (1988). We first calculated
two Euclidean distances in citation patterns between the focal school and all other schools
tracked by USN in the focal year. We computed these distances from yearly-varying matrices of
inter-school citations tC where t ijtc⎡ ⎤⎣ ⎦=C , = 0iitc , and = 1ijtc if school j cited school i as an
overlap in year t.8 Therefore, insofar as i and j have similar row vectors in tC , the same schools
identify them as overlaps, and to the extent that they have similar column vectors, they identify
the same schools as overlaps. Letting ijtdist denote the Euclidean distance between i’s and j’s
rows plus the distance between i’s and j’s columns, we then computed the citation-based
proximity of i and j as max( )ijt ijt ijtprox dist dist= − . After normalizing ijtprox for each school i,
so that w /ijt ijt ijtj
prox prox= ∑ , and collecting tuition values for j, our measure of peer tuition
may be written as:
wit ijt jt
jweightedpeertuition tuition=∑ (3)
Restating our third hypothesis, we expect the positive effect of status loss on future tuition to rise
with the lagged tuition levels of these peers.
8 The matrix tC used to calculate weighted peer tuition differs from tA used to compute betweenness centrality. More precisely,
t t t
T= +A C C . Using a symmetric matrix of 0’s, 1’s, and 2’s meant that more information entered our calculation of
betweenness centrality. Using the rows as well as the columns of tC similarly allowed us to incorporate more information into our structural equivalence based measure of peers’ past tuition levels than using incoming or outgoing citations alone: the rows of
tC reflect other schools’ citations of the focal school, while the columns of tC reflects the focal school’s citations of others. The columns may, in part, capture the aspirations of the focal school (a school may “cite up,” which is relevant for capturing which alters it eyes when setting its own tuition), while the rows, in aggregate, represent the (possibly more objective) information regarding position emanating from other schools.
20
Estimation and Conditioning Variables
We estimate the effect of status decline on schools’ future tuition using two-way fixed-
effects models (e.g., Podolny, Stuart, and Hannan, 1996) of the form:
(4)
where denotes school i’s tuition in year t+1 and t ranges from 2005 to 2011. We included
lagged tuition for three reasons. First, owing to inflation, growing demand for campus services
and amenities, and the perceived need to price high for the sake of prestige, schools rarely hold
tuition levels constant. Schools typically raise tuition every year; the question is by how much.
Second, tuition is remarkably state-dependent (“price stickiness” is substantial), and we therefore
wish to estimate the effect of status decline conditional on the prior level of tuition. Third, a
dynamic model isolates the unique consequences of a slip in rank, separate from a school’s
proximity to an overall price ceiling (captured jointly by lagged tuition and the year fixed
effects).9
[Tables 1 and 2]
We also include several adjustments in the matrix whose coefficients are in . Table
1 includes correlations and descriptive statistics for the private schools in our panel models in
Table 2. We lag all conditioning variables by one year so that they correspond to measurement
year of our main covariate of interest, status loss.10 Summarizing our adjustments in , we
9 Since we condition on lagged log(tuition), we also estimated several robustness check models (results available by request) that incorporate corrections for first-order autocorrelation, using Stata’s xtregar command. Results remained supportive of our findings. 10 We chose a one-year lag structure in light of the way that USN collects and reports data. To provide a concrete example, one of the seven academic years in our panel for which we predict tuition is the 2007-2008 academic year. 2008 is thus year t+1 in equation (4). The focal school's level of tuition for the 2007-2008 academic year is published by USN in August 2007, based on the tuition level set by that school typically during the 2006-2007 academic year, and often announced in letters to parents in the spring of 2007. Given a one-year lag, this level of tuition is predicted as a function of the (loss in) rank published by USN in the
( ) ( ) 1 2, 1 1 , 1ln ln it it it it ii t t i tY Y statusloss statusgain eρ β θ θ σ τ+ + += + + + + + +X
, 1i tY +
itX β
itX
21
first enter the indicator variable not-first-tier to denote those schools not included in USN’s top
tier and for which we have assigned the average of the upper and lower ranks that mark its tier.
Our second set of controls is related to student-body demographics, starting with the
simplest measure: size. We adjust for student-body size because if a school were to decline in
status and size simultaneously, that school might then raise tuition not just to improve in standing
but also to cover the related loss in forecasted revenue. In addition, we capture facets of the
demographic composition of the student body in two ways: through percentages of ethnic
minorities and by Simpson’s diversity index. Conditioning on demographic diversity is essential
because diversity may be associated with status (Stevens, 2007) while also tempering the rate of
tuition growth—potentially reflecting the consequences of an enrollment management strategy
geared toward greater inclusiveness (DesJardins, Ahlburg and McCall, 2006; Bowman and
Bastedo, 2009). We collected these percentages of minorities from the government-run
Integrated Postsecondary Education System (IPEDS). Categories omitted from tables 1 and 2 are
percentages for multiethnic, white, and unknown. We computed Simpson’s diversity index as the
inverse of the sum of the squared proportions of all eight ethnic categories tracked by IPEDS.
We expect this index to affect future tuition negatively.
We also condition on two indicator variables related to inter-school citation data. Zero in-
degree is included to ensure that the effect of betweenness centrality is not a consequence of not
being cited by other schools as an overlap. Zero out-degree addresses the possibility that when a
school chooses not to send network data to USN, it pays less attention to its rivals and prices
differently. When a school does not respond to this aspect of USN’s survey, this could reflect less
prior guidebook, which was published in August 2006. Our models assume that the private colleges and universities in our panel are able to respond by the spring of 2007 to a status decline evident by the late summer of 2006. Although the multi-year tuition-setting plans of many public institutions do lend themselves to this lag structure, private institutions' budgetary cycles and tuition-setting schedules are shorter and more flexible, making this an appropriate interval.
22
susceptibility to the pricing decisions of other schools, and its own rate of tuition growth may
change as a result.
A fourth set of controls is included to adjust for consumer demand. We enter the average
SAT scores of incoming students because willingness to pay may rise with the opportunity to
associate with other high-scoring students (see Hansmann, 1999 on education as an “associative
good”). Schools whose current students have high SAT scores should be more attractive to
prospective students. Consumer demand for a particular school may also be proxied by students’
willingness to take on loans to attend. Using data collected from IPEDS, we include the (logged)
per-student average loan. We expect loan levels to be positively associated with future tuition.
Our fifth set of covariates is intended to gauge the financial well being of each school.
Entering financial measures works to ensure that we do not overestimate the unique effect of
status loss: financial shortfalls may arrive jointly with slips in rank, resulting in tuition hikes as
schools look to increase cash flow to support their strategic objectives (Corkery, 2012). First, we
enter (logged) Average Institutional Grant Aid, which includes all scholarships and fellowships
granted to undergraduates by the institution itself, meaning the school uses this money to attract
students it desires without expectation of financial remuneration (i.e., this covariate excludes
loans). Second (and third), we enter each school’s endowment (collected from the National
Association of College and University Business Officers [NACUBO]), plus a dummy variable,
endowment missing, indicating that the focal school had no record of an endowment according to
NACUBO. Such schools’ endowments were coded to zero. Controlling for endowment is
important because schools with higher endowments have more freedom to adjust tuition levels,
undertake projects, improve facilities, hire faculty and staff, and offer aid—which might also
directly improve rank and lower future tuition growth. We adjust as well for the GDP of the state
23
in which the school is located: more favorable local economic conditions might also associate a
better rank with lower subsequent tuition because of increased revenues from other sources, such
as student athletic events.
School fixed effects and year fixed effects, represented by and , are the final two
terms in equation (2). School fixed effects absorb differences in organization-specific price-
setting regimes, some of which raise rates more quickly than others. They also account for
varying levels of reliance on tuition to cover operating costs at different schools: those more
heavily reliant on tuition for operations should have higher average growth rates. In addition, the
school fixed effects capture other intrinsic qualities—for example, pre-existing reputation,
location, or an unusually large athletics budget. Year fixed effects are included in all models
because tuition rises on average each year. Year fixed effects also adjust for annual changes in
the applicant pool, the number of schools to which the average student applies, and the health of
the stock market, which dramatically impacted college endowments over the course of our panel.
RESULTS
We present estimates for six models predicting future tuition for private institutions in
table 2. We start with a simple pooled cross-sectional model. We include only USN rank, our
not-first-tier dummy variable, and year fixed effects. School fixed effects are omitted. In model
1, the coefficient on USN rank is negative as schools positioned in the top ranks charge higher
tuition. This result is consistent with previous work on status showing that higher-status
organizations command higher prices for their goods and services.
In model 2, we enter school-specific fixed effects. Although we do not report coefficients
on the school indicators to conserve space, these (available by request) express sharp between-
iσ 1tτ +
24
school differences in pricing tendencies, confirming the merits of the within-school estimator. In
addition, the coefficient on USN rank now is significant and positive. Once our estimates reflect
within-organization variations only, a decline in status is associated with a higher future price.
Using this very simple specification, we see initial support for our first hypothesis.
Model 3 replaces the USN rank with our measures of status loss and status gain. Recall
our interest in understanding how organizational decision-makers react to a sharp drop in status.
The coefficient on status loss is significant and positive. When a school slips more than five
ranks beneath its time-constant, mean rank—after having ascended above that threshold
previously—it then raises tuition in the next year. The effect is economically meaningful: the
increase is a full percentage point. Put colloquially, this is the equivalent of the Provost
announcing in his or her “spring letter” to parents that next year’s tuition will go up by 5%
instead of by 4%.
In contrast, the effect of status gain is statistically indiscernible. Upward status mobility,
which we thought might bind a school more tightly to normative constraints to charge students
less, does not uniquely affect price. We instead see further evidence that downward status
mobility is more influential in shaping pricing decisions. In addition, the asymmetric effects of
status loss versus status gain imply that mean reversion is unlikely to account for the positive
effect of status loss. If mean reversion were the main process at work, we would expect
coefficients on these two variables that are roughly equal in absolute value, rather than the
substantial difference we observe.11 11 One can imagine a simple stochastic process in which the rank of the focal school varies yearly, from low to high, around its average rank—for example, due to unplanned variations in the student-to-faculty ratio. Imagine further that the school’s rate of tuition growth wavers in the same way about its typical level—perhaps due to volatility in the composition of the tuition-setting committee. Random slips in rank could then be followed by randomly higher tuition increases the next year. If, however, this were the main process at work in our context, we would also expect to see gains in rank followed by significantly smaller tuition increases the following year. Because the effect of status gain is instead insignificant, we conclude that mean reversion does not mark the link between a loss in status and higher future tuition.
25
In model 4, we condition on a wide range of factors, including lagged tuition, which are
important for isolating the consequences of declines in status. Summarizing the most important
results, we emphasize first that status loss retains its significance in the presence of these
covariates, including those for student-body diversity. Simpson’s diversity index is negative and
significant, reflecting a tempered rate of future price growth as a school commits to a more
heterogeneous student pool. The sustained positive effect of a fall in status, controlling for
student diversity, suggests that our main effect of interest is not a byproduct of a school growing
less diverse and then deciding to exploit a locked-in, higher-SES student body. Second, that
status loss stays significant together with the size of the endowment is also noteworthy. Clearly,
price-setting committees raise tuition in response to financial shortfalls. Yet conditioning on this
process, model 4 indicates that they still also react to sharp declines in rank.
The third and final set of significant continuous variables in model 4 includes
betweenness centrality and weighted peer tuition, the covariates we constructed to test the
interaction effects stated in hypotheses 2 and 3. We turn to these in models 5 and 6, respectively,
but note their main effects here. Aligned with our discussion of betweenness centrality as a
measure of the degree to which a school is a credible market incumbent, its effect is positive,
though not quite achieving significance. It suggests, inconclusively, that the more a school’s
reach cuts across disparate sections of the market for students, the more it charges. The effect of
weighted peer tuition is not what we anticipated: instead of seeing evidence of contagious
pricing, we interpret this coefficient as a possible reflection of efforts to differentiate.12
We turn in models 5 and 6 to two interaction effects, which we present to clarify when
12 Models (available upon request) for public universities were also run, though owing to a number of institutionally relevant features discussed earlier, the results were not indicative of the kind of status loss-related price changes that we see for private institutions. In particular, in the version of model 4 for public institutions, two covariates (in addition to lagged tuition) were positive and significant: the number of full-time students and the percentage of Hispanic students. State GDP was marginally significant (1.80 t-test), and the effect of endowment was negative and significant.
26
status-aspirational pricing is most likely to occur. Recall our second hypothesis that broad appeal
across otherwise disparate buyers allows an organization to price aspirationally. Not all
organizations in a market have the license to do so. Supporting hypothesis 2, the effect of status
loss by betweenness centrality is positive and significant. Note also the weakened main effect of
status loss (at zero betweenness centrality) in model 5. While the effect of status loss is virtually
zero for a peripheral school, its effect grows in magnitude as betweenness centrality rises. For
instance, tuition rises by 1.4% when betweenness centrality is at its mean, but by 2.7% for
betweenness centrality at one standard deviation above its mean and over 4% at two standard
deviations above its mean.
We also find support for our second moderating hypothesis in model 6. Our prediction,
following from our assumption that norms of fairness constrain price-setting decisions, was that
organizations whose close competitors have charged high prices possess the latitude to pursue
status-aspirational pricing. Showing support for hypothesis 3, the coefficient on status loss by
weighted peer tuition is strongly positive. The positive effect on tuition of a fall in status is most
discernible when a focal school’s structurally equivalent peers have previously set tuition high.13
Robustness Checks and Extensions
We took four main steps to evaluate the robustness of our main finding that schools raise
tuition after a status loss. First, given our claim that more credible organizations are most likely
13 The negative and significant main effect of status loss in model 6 also merits further attention. On one hand, it necessarily reflects the distribution of weighted peer tuition, whose observable minimum is far from zero. On the other hand, it is important to ensure that this interaction effect is not an artifact of collinearity. We estimated two additional models to guard against this possibility. First, we mean-centered weighted peer tuition (subtracting out its global mean from table 1) before multiplying it by status loss in the resulting interaction term. When we entered this re-scaled interaction term in place of its un-rescaled version in model 6, the coefficient on status loss was .0065 (2.77 t-test) and the coefficient on interaction term was 3.16e-06 (2.18 t-test). Second, we ran another version of this supplementary model with fixed effects for schools and for years, but then only included three additional predictors: status loss, weighted peer tuition, and status loss x mean-centered weighted peer tuition. We found the coefficients and associated t-tests (in parentheses) for these three predictors were the following, respectively: .0026 (.97), .000047 (-3.59), and 4.54e-06 (2.34).
27
to price aspirationally, we examined counts of status losses and gains together with average
yearly tuition increases across a range of status categories: quartiles of lagged ranks and first-tier
versus not-first-tier schools. If our interpretation of our main effect of interest is correct, there
should both be a sufficient number of status losses among first-tier schools, and the impact of
status loss will be concentrated there.
[Table 3]
As table 3 shows, across our panel’s private schools, there were 237 status losses (13.5%
of the 1,761 school-years) and 139 status gains (7.9%). This asymmetry reflects USN’s record of
demoting more than it promotes, and the expanding size of its coverage over time, usually by
adding lower-ranked schools. This feature of USN’s design also reinforces the importance of
adding year fixed effects. Further, sharp status changes almost never occur in the top quartile of
the rankings (just one school, Bryn Mawr College, suffered a status loss, and no schools ranked
40 or better posted a status gain). This likely reflects USN’s effort to prevent non-credible churn
at the peak of the rankings, as well as our conservative definitions of status loss and status gain.
[Table 4]
Turning to differences between first tier and not-first-tier schools, in the first tier, where
tuition rose by 5.3%, there were 82 status losses and 116 status gains. For not-first-tier
institutions, tuition increased yearly by 5.4%, and there were 155 status losses and only 23 gains.
Status losses for both categories are consistent with our theory, but it is still important to
determine where, in the distribution of ranks, the effect of status loss is most strongly
concentrated. Model 7 of table 4 reports the results of our main model (model 4 in table 2) with
non-first-tier schools removed. Although this effect is slightly dampened—there is no longer a
full percentage point increase in tuition after a status loss—the coefficient on status loss stays
28
significant (2.45 t-test). Among first tier schools, which have clearly crossed a credibility
threshold, we see continued evidence in support of our main hypothesis.14
Our second set of robustness checks sought to guard against the possibility that a small
handful of schools suffer status losses sequentially while also aggressively raising tuition to
arrest a free-fall, thus biasing our estimates. Model 8 presents estimates for the subset of schools
from model 7 with one difference: we exclude all schools experiencing more than one status loss,
and again see a robust effect of our main variable of interest.15 This result gives us added
confidence that our results are not a reflection of a few outlying schools flailing as they slide
down the rankings.
Third, we assessed our claim regarding the direction of the effect of status loss from
several vantage points. One approach was to ask whether the effect of status loss is strongest in
the middle of the first-tier rankings category. If a status decline triggers higher tuition, rather
than vice versa, status loss should exert weaker effects in some regions of the ranks than in
others, rather than affecting tuition uniformly. In model 9, which again includes only first tier
schools, we interacted status loss with a dummy variable termed middle top school. This variable
equals one if the focal school’s rank resides between 50 and a 20-rank distance from the worst
first-tier rank that year. The estimates in model 9 suggest that schools in the middle of the top
tier are also most responsive to a sharp decline. Such schools are core members of the market,
but they are also arguably the most status-anxious: neither entrenched incumbents of the top 50
nor newcomers to the first tier, a sharp fall in rank appears to trouble them the most.
In addition to an instrumental variable analysis (see appendix), we also explored whether
tuition is associated empirically with future status loss: counter to our theory, a tuition hike could
14 In contrast, when we estimate model 4 only with not-first-tier schools, the coefficient on status loss is insignificant (.73 t-test). 15 When not-first-tier schools are included in a model removing all schools experiencing more than one status loss, the coefficient on status loss remains significant (.012; t-test = 2.72)
29
trigger a slip in rank if schools get punished for appearing greedy or unfair. Using a conditional
fixed-effects logit on our full panel of private schools, we modeled status loss as a function of all
explanatory variables from model 4. In this supplementary model, lagged tuition is insignificant
(.26 z-score test), further suggesting that reverse-causality is probably not responsible for the
effect of status loss on future tuition.16
Fourth, we addressed the possibility that status decline prompts schools to spend
exorbitantly—and thus to raise tuition for reasons unrelated to signaling. In particular, as schools
fall in the rankings, they may expect the imminent loss of higher-caliber applicants to further
hurt their ranking, leading them to employ various recruiting strategies to entice their preferred
students. Such strategies could include providing more grants, improving the student-to-faculty
ratio or pushing fund-raising efforts—each of which necessitates spending more money, which
would likely come from increased tuition. We explored each of these scenarios amongst the
ranked schools in our data (results available by request) and found that when (logged) average
grant aid, the student-to-faculty ratio, and the alumni giving rate were each inserted as dependent
variables in alternative versions of model 4, status loss was not a significant predictor for any of
them (t-tests for status loss, across these three models, were .91, .69, and -0.12, respectively).
Though certainly not conclusive, it appears that raising tuition following a decline in status is
not—at least over a short time-horizon—related mainly to spending more money to attract more
desirable students.
Qualitative accounts. Lastly, we collected and coded qualitative accounts of the Chivas
Regal strategy in higher education to assess from another angle our claim that schools increase
16 The dependent variable in this model (available by request) is the “lead” (vs. lag) of our status loss covariate. Since we computed status loss based on lagged rank, modeling status loss as an outcome necessarily excluded the final year in our panel, necessitating our devising another version of the variable based on un-lagged rank. When using this as our dependent variable in a fixed effects logit, the effect of log(tuition) was again insignificant (-.59 z-score test). Only three covariates were significant in this model: (lagged) status loss (-2.44 z-score test), status gain (-2.81 z-score test), and average SAT (-2.31 z-score test).
30
price to send a status signal. Although there has been discussion since the late 1980s (e.g.,
Werth, 1988) of status-aspiring schools hiking tuition to enhance perceptions, a second version
of the Chivas Regal strategy in our context refers to investment in status symbols, such as new
dormitories and gyms, through the revenues provided by tuition increases. This is a long-run
version of status-aspirational pricing in which conspicuous consumption serves as the expected
link between charging more and eventual status gain. While we cannot rule out the possibility
that this long-run version is also at work in our panel, qualitative evidence suggests that the
short-run, signaling-based version the Chivas Regal strategy we have described typically
summarizes tuition-setters’ aims.
Ideally, we would have direct and accurate data on the deliberations of those responsible
for setting tuition each year to further test our theory. Unfortunately, while some university
presidents, such as Stephen Trachtenberg of George Washington University (Luzer, 2010; Carey,
2015) or Richard Freeland of Northeastern University (Kutner, 2014) have discussed their use of
the Chivas Regal strategy, such open revelations have typically come only after they have left the
job. The price-setters themselves are generally unreliable sources when it comes to publicly
confirming the use of higher prices to signal status, as the implicit understanding is that to reveal
the strategy as such would be to kill its efficacy or incite outrage at their school.
Journalists, on the other hand, are not bound by these constraints. To check our main
assertion, we searched Google and Lexis Nexis to collect all of their electronically available
journalistic articles explicitly mentioning “Chivas Regal” in connection with higher education.17
We counted the total number of words in each document referring, explicitly or implicitly, to the
Chivas Regal strategy and coded each sentence according to how the Chivas Regal strategy was
17 Searching from 1/1/1980 through 1/1/2015, we identified 40 articles and 1 congressional hearing document: 31 documents from Lexis Nexis, 6 from Google News, and 4 from Google Web Search.
31
characterized. Our approach yielded four different characterizations: (i) raising tuition to signal
higher status, (ii) raising tuition to invest in status symbols, (iii) charging what the market will
bear, and (iv) other or non-pertinent.18 Of the total words across all 41 documents, 6% were
relevant in that they pertained to the Chivas Regal strategy. Of these relevant words, 64%
pertained to tuition increases geared toward signaling higher status while only 5% pertained to
tuition increases to invest in status symbols. Some examples of text aligned with our emphasis on
status signaling via higher tuition are the following:
Says [Martin] Meyerson [UPenn’s president from 1970-1981]: “We were building up a kind of notion about colleges and universities that the higher the price, the better they were.” (Larson, 2001) For decades, most private college pricing has reflected the Chivas Regal effect-the notion that whether in a Scotch or a school, a higher price indicates higher quality. “Schools wanted a high tuition on the assumption that families would say that if they’re charging that high tuition, they must be right up there with the Ivies,” said David L. Warren, president of the National Association of Independent Colleges and Universities. (Lewin 2013) The increase not only would allow the system to recover more of the cost of a student’s education, he said, but also would encourage applicants to view College Park as a more selective institution, a concept known in higher education circles as the ‘Chivas Regal argument.’ “The perception is, if tuition’s too low, people say, ‘Hey, that school can’t be any good,’” Hug said. “The best way to improve your reputation is to increase tuition. (Montgomery 2003).19
The results of our qualitative search thus indicate that the strategic raising of prices not
only occurs among status-aspiring schools; it also appears to be done more in the name of the
price-status perception link than to be able to invest in tangible status symbols. It is a well-
known and highly utilized tactic for university presidents and other price-setters.
18 Sentences coded as “other” typically either characterized the Chivas Regal strategy ambiguously or conflated multiple characterizations, while sentences coded as “non-pertinent” did not imply any particular characterization. 19 Calvert (2006), in contrast to these statements, offers a characterization consistent that the investment version of Chivas Regal: “Chester Finn, a former Department of Education official, once toured several campuses with his daughter and was greeted everywhere with the ‘Chivas Regal strategy’ (as one dean called it), which lures students with amenities such as posh apartments, food courts and fancy gyms. Finn’s daughter said it was ‘like comparing resort hotels’”
32
[Table 5]
Exploring consequences. These analyses lead us to an important final question: does the
Chivas Regal strategy actually work? To address this question, at least provisionally, our
approach was to see if tuition is positively associated with future improvements in USN rank
after a status loss. Table 5 presents conditional fixed effects logit models predicting the
probability of a focal school’s improvement in rank from year t to t+1 as a function of its
(logged) tuition in t, and whether or not it suffered a loss in status in t-1. We used this estimator
instead of a standard logit with dummies for schools to avoid the incidental parameters problem
(Greene, 2004). For models 10-12, the outcome variable equals 1 under these conditions,
respectively: the school improved by 1 or more ranks, by 2 or more ranks, and by 3 or more
ranks. In models 10 and 11, prior tuition is positively associated with future rank improvement
when the school has previously undergone a loss in status: using the estimates from model 10, a
1% increase in tuition, all else equal, raises that school’s odds of rank improvement by nearly
1.8%. In contrast, the interaction between lagged status loss and tuition falls shy of significance
in model 12, which predicts the probability of a rank improvement of three or more. Hiking
tuition in the wake of the status loss appears to be beneficial; however, it is in no way a panacea
for schools seeking instant recovery from a sharp status loss.20
DISCUSSION AND CONCLUSION
Our examination of colleges and universities in the United States reveals an important 20 We note finally that for some organizations, this strategy is clearly not without risks. So far, as noted, we have only included private institutions in our models. However, we estimated an alternative version of model 10 that included private and public institutions jointly. The change in the estimates was striking: coefficients (and z-score tests) for log(tuition) and status loss x log(tuition) were these, respectively: .17 (.13) and - .1.007 (-2.93). Given a loss, the odds of improving in future rank are therefore proportional to tuition-.837. Consequently, after a status decline, raising tuition appears to hurt the odds of rank improvement, as long as public schools are in the panel. We speculate that this negative association may reflect the different normative expectations facing public colleges and universities.
33
and counterintuitive finding: an institution’s loss of status will, under certain conditions, lead to
status-aspirational—rather than status-consistent—pricing. Having clarified two conditions
through moderating effects in which organizations raise prices in reaction to drops in status, the
impact of status on price can no longer be seen as exclusively positive. This revelation has
implications for status theory, performance feedback theory, and administrative research on
ranking systems. We consider each in turn, before discussing limitations and scope conditions, as
well as potential empirical settings for replicating and extending our results.
Implications. We see two interlinked implications for status theory. First, we think that
new research will benefit from focusing more explicitly on the consequences of significant status
changes. Considering status declines and gains (see Azoulay, Stuart, and Wang, 2013; Jensen
and Kim, 2015) as central explanatory variables in future work will broaden our understanding
of how status shapes organizational conduct and performance. Such an empirical strategy may
also require a broader portrait of the nature of status itself. Some of the most compelling studies,
most notably Podolny’s (1993) original formulation, have construed status as a stable asset
yielding concrete benefits.
We can contrast this perspective with our own using two of Merton’s (1968: 56-57)
metaphors. On one hand, similar to Podolny (1993), Merton pictured high-status actors as
owners of an almost irrevocable “coin of recognition.” Seen from this angle, status is a resource
(cf. Saloner, Shephard, and Podolny, 2001: 53-55) that passively brings advantage. On the other
hand, Merton also analogized a status position to a “way station” en route to the next “summit.”
Seen from this second angle, status is a rank in a tournament in which advances and reversals
occur; status is less like a resource and more like territory in a turf war. This dynamic imagery is
aligned with more recent frameworks (e.g, Sauder and Lancaster, 2006; Espeland and Sauder,
34
2007) in which status shifts meaningfully in real time, confirms and threatens actors’ identities
(Marr and Thau, 2014), and requires constant cultivation. Taking an explicitly dynamic, within-
organization view and zeroing in on a focal firm’s reactions to sharp declines will likely cast new
light on how organizational decision-making varies with relative standing in ways that pooled
cross-sectional designs cannot.
The second implication for status theory is the vital need to reconsider the link between
status and agency. By agency, we mean action taken in the face of normative constraints
imposed by other organizations (see Jensen, Kim, and Kim, 2011: 96-97). Prior work has
underscored elites’ latitude to choose non-normative actions (e.g., Han, 1994; Phillips and
Zuckerman, 2001), observing that there are certain activities in which only high-status actors are
allowed to engage. While we agree with this in general, our results also suggest that agentic
behavior is especially likely among those that have fallen in status. For instance, although Stuart
(1998) found that increases in status raised the propensity to collaborate across firms, we suspect
that a focal firm that was recently pushed down in status beneath its reference point may be
driven, perhaps frantically, into alliance-forming behavior. Using measures and methods similar
to what we have proposed, it may be possible to demonstrate that the strongest bursts of
collaborative behavior come from those wishing to appear more like their more elite peers. More
generally, it is easy to envision occasions to re-examine the effect of status on conduct in settings
in which organizations deeply value status as an end in itself and are willing to take risks to
recover once that status has been lost.
We also see two implications for future investigations in performance feedback theory.
First, consistent with schools’ setting tuition merely to improve how they are perceived, we see
valuable opportunities for theorists of organizational learning to model what might be termed
35
cosmetic, as opposed to material, responses to unfulfilled aspirations. Most of the earlier work in
this tradition has focused on material outcomes, such as R&D intensity and strategic change
(Greve, 2003). In contrast, we see interesting possibilities for modeling the hazard of symbolic
reactions (e.g., securing celebrities’ endorsements) as a function of slips in performance. Second,
given our dependent variable, to us the most obvious suggestion for subsequent research is to
consider whether loss of market share (potentially similar to loss in prestige) could trigger status-
aspirational pricing. Shipilov, Li, and Greve (2011) used relative market share as a predictor of
changes in partnering formation, but pricing changes could also be modeled. Typically, if a
company loses market share, we expect it to lower prices to recover customers, or to seek
orthogonal market niches. However, there are some markets—particularly those described by
White (1981: 540-541) and Jensen, Kim, and Kim (2011: 93-94)—in which market share is
positively associated with producers’ status. In such domains, there is a natural link back to
performance feedback theory arising from our approach: are there conditions in which producers
strategically raise price in response to shortfalls in market share?
Turning to administrative research on ranking systems (e.g., Elsbach and Kramer, 1996;
Sauder, 2008), our moderating effects lead us to anticipate that new research in this vein will
profit from focusing on interorganizational sources of variation in susceptibility to third-party
arbiters (Sauder and Fine, 2008). Sauder (2008) offered a rich account of the process by which
USN adroitly inserted itself as the key arbiter of perceived quality in U.S. legal education. USN
first won over students and employers, and from that beachhead brought about increased
homogeneity across law schools, which felt obliged to bend to its criteria. Sauder’s analysis also
indicated that law schools with less experienced deans were most susceptible to the influence of
USN. Building on this theme, a valuable next step is to bring a network-analytic perspective to
36
bear on the historical question of which schools succumbed and which ones resisted USN’s
pressures toward conformity. For instance, law schools whose structurally equivalent peers
initially posted fast “improvements” on metrics imposed by USN may have been those that
conformed most quickly and tightly. Or alternatively, schools encircled by conformist peers may
have been those most prone to resist and delay in an effort to appear authentic.
Limitations and Scope Conditions. Additional possibilities for new research arise from
considering both a limitation on the interpretation of our results and scope conditions on the
generalizability of our hypotheses. One limitation is that we may not have fully captured the
motivations of the organizational decision-makers in our setting. In particular, we did not address
whether the price signal may also be intended for an internal audience to trigger a self-fulfilling
prophecy among employees. As Klein and Leffler (1981: 634) pointed out, “price not only
influences buyers’ expectations but also influences producers’ incentives.” Although we cannot
address this possibility with our current data, it is worth examining whether a price-setter (e.g.,
provost) may be pursuing intra-organizational changes as he or she prices up: in this scenario,
the goal is to push faculty and administrators to “live up” to the new price. Seeking to better
understand if and when the Chivas Regal strategy is pursued to motivate internal stakeholders is
an interesting possibility for future work, especially research taking a qualitative approach.
Moreover, institutional features salient within higher education are certainly not present
across all markets, and their absence will preclude observing status-aspirational pricing
universally. In addition to the two conditions implied by our moderating hypotheses—the focal
firm must be a credible member of its market, and it cannot violate norms of fairness when it
decides on its price—four further boundary conditions are required. When these conditions are
met by at least a subset of the buyers and producers in a given setting, we expect producers in
37
that setting to increase price in reaction to status loss. Two conditions relate to buyers, and two
concern a focal producer.
First, buyers face uncertainty about the quality of the producer’s good. Without this
uncertainty, price is a rigid reflection of the good’s known (or observable) attributes, and a
producer therefore cannot use it as a strategic, aspriational device. In contrast, goods often
marked by sufficient uncertainty for status-aspirational pricing include experience goods
(Nelson, 1970), credence goods (cf. Rösell and Beckert, 2012) like a fairtrade food whose
conformity to sustainability ideals buyers must blindly trust, and Veblen goods, whose ability to
confer status on its buyers is known only after consumption. Uncertainty creates degrees of
freedom in price-setting.21
Second, buyers have historically viewed high prices as positive signals of quality and/or
status. Buyers may intuitively understand that only a truly high-quality producer can sustain a
high price without losing customers (Bagwell and Riordan, 1991); or, they may see their
purchase of more expensive goods as steps to advancing in status themselves (Lichtenstein,
Ridgway, and Netemeyer, 1993). Not all buyers must meet this second scope condition, only a
subset must. Many buyers may have long been strongly averse to high prices, while some
(sophisticated) consumers may identify price hikes as a placebo (cf. Pettit, Sawa, and Sawa,
1985; Cohen and Cahkravarti, 1990). What is important is that enough buyers have, over a
sustained timeframe, viewed high prices as positive signals of quality and/or status. When this is
the case, a producer can then realistically believe that raising its price is a viable strategy.
Third, expanding on our description of our empirical domain, organizational status is
21 Producers of such goods not only have more information about their goods than do their buyers (Akerlof, 1970), their products or services are also marked by a second-order type of uncertainty in which the dimensions that matter for buyers’ assessments of quality are multiple and contested, rather than singular and taken for granted (Rösell and Beckert, 2012: 3-5). The producer thus has the flexibility to set price with enhanced status as its aim: price itself can enter the mix of quality-dimensions that are up for grabs, and—in the producer’s decision-making process—can be seen as a route to status gain.
38
mutable and is an important objective for the producer. Not all status hierarchies meet these
criteria. Mills (1951: 239-40) distinguished between two hypothetical status systems: one in
which “the exact volume and types of deference expected between any two individuals are
always known, expected, and given” and a second “in which prestige is highly unstable and
ambivalent.” For our assertions to apply, the focal producer and its peers must occupy a status
hierarchy closer to the second type. This means that the producer is not so role-secure (Phillips
and Zuckerman, 2001) that slips in status never occur. Nor does that producer face cultural
norms that punish status falls so sharply that recovery is untenable (Bothner, Podolny, and
Smith, 2011). In addition, producers must significantly value their status beyond the goal of
sustained financial performance (Shipilov and Li, 2008). Where we observe status-aspirational
pricing, we will necessarily see producers for which status is both a salient goal and subject to
(reasonable and recoverable) inter-temporal shifts.
Fourth, the producer perceives some form of a safety net that lowers the perceived risk of
aspirational pricing.22 This condition is informed by one of the unique aspects of our empirical
setting: the presence of a third-party subsidizer, the U.S. government. Government-subsidized
financial aid allows colleges and universities to engage in price discrimination on the basis of
students’ socioeconomic status. In our empirical setting, this is fully legal and sustainable
because admitted students cannot resell their spot (to richer, less deserving applicants). Clearly,
this makes it easier to raise price after a slip in rank. Nonetheless, we do not see the presence of
an active subsidizer as necessary for our theory to apply in other industries; substitutes exist for
this role in other contexts. Such substitutes could include, at the most basic level, access to credit
22 We are grateful to an anonymous reviewer for bringing into focus the issues related to this boundary condition.
39
or an appetite for risk.23 Though our initial boundary condition on producer credibility is similar
conceptually, credibility is analytically distinct from the perception of a buffer against risk.
When such a buffer exists, status-aspirational pricing is more likely to occur.
New Empirical Settings. For organizations satisfying the scope conditions we have
described, two industries are especially promising sites for replicating and extending our results:
wine and high-end restaurants. Similar to other settings that are also candidates for future
study—art, cosmetics, consulting firms, and luxury goods—these industries contain producers
with the credibility and latitude to price in ways intended to counteract shortcomings in status.
Wineries and elite restaurants are particularly appealing, however, due in large part to the precise
time-varying data maintained on organizational status and pricing.
Starting with wine, perhaps the most straightforward way to replicate our findings is to
assemble a panel similar to that used by Benjamin and Podolny (1999) and then take three
analytical steps: add winery fixed effects, construct indicator variables capturing drops in status
below a reference point, and examine interactions with measures of credibility and of close
competitors’ lagged prices. Benjamin and Podolny’s measure of reputation could inform a
covariate capturing credibility, and computing rivals’ average prior prices is unproblematic in
light of the relational data available. Our falsifiable prediction is a positive main effect of status
loss on future price. We believe this is likely in light of the well-documented connection between
price and perceived quality in wine (cf. Plassman et al., 2008). We also expect a set of
moderating effects similar to what we have observed. A certain subset of the wineries in a panel
of wineries will, we expect, exhibit patterns consistent with our theory. If we are correct, then
23 Imagine, for example, a solo practitioner lawyer who experiences a status drop: two close rivals recently secured new, prestigious clients, bringing them a halo she now lacks. Suppose also that her response is to raise her hourly rates for reasons consistent with our theory: a higher price makes her seem closer to her competitors in the local status hierarchy. Our hypothetical lawyer lacks government support, but she relies on two substitutes: her willingness to risk short-term drops in demand to send the right, price-related message, and her access to capital should things go wrong.

40
this core question warrants close attention in future work: what are the distinctive features of
organizations in this section of the wine market?
To conclude with restaurants, Snyder and Cotter (1998) offered evidence largely in
keeping with our theory in their analysis of French restaurants gaining and losing Michelin stars.
They revealed that restaurants dramatically increased their prices in the two years prior to
receiving a Michelin star. This effect is consistent with our main prediction: when shy of an
important status-marker, a focal organization will raise price in hope of ascending. In addition,
although finding that restaurants demoted from three-stars lowered their prices commensurately,
the experience of two-star restaurants experiencing a loss in status is provocative: after suffering
demotion to just one star, these restaurants raised price in real terms. An exciting and
straightforward next step involves identifying when these downwardly mobile restaurants raise
price most sharply in response. Given these possibilities, we see several intriguing pathways for
future research.
41
REFERENCES
Akerlof, G. A. 1970 “The market for‘ lemons’: Quality uncertainty and the market mechanism.” The Quarterly Journal of Economics, 84: 488–500.
Askin, N., M. S. Bothner, and W. Lee 2015 “Emergence of Stratification in Small Groups.” In R. Scott and S. Kosslyn (eds.), Emerging Trends in the Social and Behavioral Sciences. Hoboken, NJ: John Wiley & Sons.
Audia, P. G., E. A. Locke, and K. G. Smith 2000 “The paradox of success: An archival and a laboratory study of strategic persistence following radical environmental change.” Academy of Management Journal, 43: 837–853.
Azoulay, P., T. Stuart, and Y. Wang 2013 “Matthew: Effect or fable?” Management Science, 60: 92–109.
Bagwell, K. and M. H. Riordan 1991 “High and declining prices signal product quality.” The American Economic Review, 81: 224–239.
Barrett, G. 1999, September 3 “Accounting 101 College Costs -- It might not be as bad as you expect.” Tulsa World (Oklahoma). Tulsa.
Baum, J. A., T. J. Rowley, A. V. Shipilov, and Y.-T. Chuang 2005 “Dancing with strangers: Aspiration performance and the search for underwriting syndicate partners.” Administrative Science Quarterly, 50: 536–575.
Bebchuk, L. A., J. M. Fried, and D. I. Walker 2002 “Managerial Power and Rent Extraction in the Design of Executive Compensation.” The University of Chicago Law Review, 69: 751.
Benjamin, B. A. and J. M. Podolny 1999 “Status, Quality, and Social Order in the California Wine Industry.” Administrative Science Quarterly, 44: 563.
Bolton, L. E., L. Warlop, and J. W. Alba 2003 “Consumer Perceptions of Price (Un)Fairness.” Journal of Consumer Research, 29: 474–491.
Bothner, M. S. 2003 “Competition and Social Influence: The Diffusion of the Sixth‐Generation Processor in the Global Computer Industry.” American Journal of Sociology, 108: 1175–1210.

42
Bothner, M. S., J. Kang, and T. E. Stuart 2007 “Competitive Crowding and Risk Taking in a Tournament: Evidence from NASCAR Racing.” Administrative Science Quarterly, 52: 208–247.
Bothner, M. S., Y.-K. Kim, and E. B. Smith 2011 “How Does Status Affect Performance? Status as an Asset vs. Status as a Liability in the PGA and NASCAR.” Organization Science, 23: 416–433.
Bothner, M. S., J. M. Podolny, and E. B. Smith 2009 “Organizing Contests for Status: The Matthew Effect versus the Mark Effect.” The Academy of Management Proceedings Vol. 2009: 1–37. Academy of Management.
Bothner, M. S., E. B. Smith, and H. C. White 2010 “A Model of Robust Positions in Social Structure.” American Journal of Sociology, 116: 943–992.
Bowman, N. A. and M. N. Bastedo 2009 “Getting on the Front Page: Organizational Reputation, Status Signals, and the Impact of U.S. News and World Report on Student Decisions.” Research in Higher Education, 50: 415–436.
Brandes, U. 2001 “A faster algorithm for betweenness centrality*.” Journal of Mathematical Sociology, 25: 163–177.
Brewer, D. J., S. M. Gates, and C. A. Goldman 2001 In Pursuit of Prestige: Strategy and Competition in U.S. Higher Education, Technical Papers: 125. RAND.
Burt, R. S. 1982 Toward a structural theory of action: network models of social Structure, Perception, and Action. New York: Academic Press.
1987 “Social Contagion and Innovation: Cohesion Versus Structural Equivalence.” The American Journal of Sociology, 92: 1287–1335.
1988 “The Stability of American Markets.” American Journal of Sociology, 94: 356–395. 1992 “The Social Structure of Competition.” Networks and Organizations: 57–91. Cambridge: McGraw-Hill.
2010 Neighbor networks: Competitive advantage local and personal. Oxford, UK: Oxford University Press.
Calvert, J. 2006 “Soaring college costs shouldn’t come as surprise.” Grand Forks Herald. June 25.
43
Centola, D. and M. W. Macy 2007 “Complex Contagions and the Weakness of Long Ties.” American Journal of Sociology, 113: 702–734.
Cohen, J. B. and D. Chakravarti 1990 “Consumer psychology.” Annual Review of Psychology, 41: 243–288.
Corkery, M. 2012, December 30 “Pressure to Rein In Tuition Squeezes Colleges.” Wall Street Journal. Cyert, R. M. and J. G. March 1963 A behavioral theory of the firm Vol. 2. Englewood Cliffs, NJ: Prentice-Hall. DesJardins, S. L., D. A. Ahlburg, and B. P. McCall 2006 “An integrated model of application, admission, enrollment, and financial aid.” Journal of Higher Education, 77: 381–429.
Ehrenberg, R. G. 1999 “Adam Smith Goes to College: An Economist Becomes an Academic Administrator.” The Journal of Economic Perspectives, 13: 99–116.
2001 Reaching for the Brass Ring: How the U.S. News & World Report Rankings Shape the Competitive Environment in U.S. Higher Education. Elsbach, K. D. and R. M. Kramer 1996 “Members’ responses to organizational identity threats: Encountering and countering the Business Week rankings.” Administrative Science Quarterly, 41: 442–476.
Espay, A. J. et al. 2015. “Placebo Effect of Medication Cost in Parkinson Disease A Randomized Double-Blind Study.” Neurology 84(8):794–802. Espeland, W. N. and M. Sauder 2007 “Rankings and Reactivity: How Public Measures Recreate Social Worlds.” American Journal of Sociology, 113: 1–40.
Espeland, W. N. and M. L. Stevens 1998 “Commensuration as a Social Process.” Annual Review of Sociology, 24: 313–343.
Farrell, E. F. and M. Van Der Werf 2007
44
“Playing the ranking game.” Chronicle of Higher Education, 53: 5.
Feenstra, R. C. 1995 Exact hedonic price indexes. National Bureau of Economic Research. Finkelmeyer, T. 2011 “Campus Connection: A bachelor’s degree for $10,000?” Madison.com. Freeman, L. C. 1979 “Centrality in Social Networks Conceptual Clarification.” Social Networks, 1: 215–239.
Fruchter, G. E. 2009 “Signaling quality: dynamic price-advertising model.” Journal of Optimization Theory and Applications, 143: 479–496.
Galaskiewicz, J. and R. S. Burt 1991 “Interorganization contagion in corporate philanthropy.” Administrative Science Quarterly, 36: 88–105.
Garvin, D. A. 1980 The Economics of University Behavior. Academic Press.
Gordon, L. 2012, February 12 “Claremont McKenna’s inflated scores bring new scrutiny to college rankings.” Los Angeles Times. Greene, W. 2004 “The behaviour of the maximum likelihood estimator of limited dependent variable models in the presence of fixed effects.” The Econometrics Journal, 7: 98–119. Greve, H. R. 1998 “Performance, Aspirations, and Risky Organizational Change.” Administrative Science Quarterly, 43: 58–86.
2003 Organizational learning from performance feedback: A behavioral perspective on innovation and change. Cambridge, UK: Cambridge University Press.
Han, S.-K. 1994 “Mimetic isomorphism and its effect on the audit services market.” Social Forces, 73: 637–664.
Hannan, M. T. and J. H. Freeman 1989
45
Organizational Ecology. Cambridge, MA: Harvard Univ Press. Hansmann, H. 1999 “Higher Education as an Associative Good.” Yale Law and Economics Working Paper No. 231, Yale ICF Working Paper No. 99-15. James, E. 1990 “Decision processes and priorities in higher education.” In S. A. Hoenack and E. L. Collins (eds.), The economics of American universities: 77–106. Buffalo, NY: New York Press.
Jensen, M. 2003 “The role of network resources in market entry: commercial banks’ entry into investment banking, 1991–1997.” Administrative Science Quarterly, 48: 466–497.
Jensen, M. and H. Kim 2015 “The Real Oscar Curse: The Negative Consequences of Positive Status Shifts.” Organization Science, 26 (2015): 1-21. Jensen, M., B. K. Kim, and H. Kim 2011 “The Importance of Status in Markets: A Market Identity Perspective.” In J. L. Pearce (ed.), Status in Management and Organizations. Cambridge, UK: Cambridge University Press.
Kahneman, D., J. L. Knetsch, and R. Thaler 1986 “Fairness as a constraint on profit seeking: Entitlements in the market.” The American Economic Review, 76: 728–741.
Kahneman, D. and A. Tversky 1979 “Prospect theory: An analysis of decision under risk.” Econometrica: Journal of the Econometric Society, 263–291.
1984 “Choices, values, and frames.” American Psychologist, 39: 341.
Kameda, T. and J. H. Davis 1990 “The function of the reference point in individual and group risk decision making.” Organizational Behavior and Human Decision Processes, 46: 55–76.
Klein, B. and K. B. Leffler 1981 “The Role of Market Forces in Assuring Contractual Performance.” The Journal of Political Economy, 89: 615–641.
Larson, E. 2001, June 24
46
“Why Colleges Cost Too Much.” Time. Leahey, E. 2007 “Not by productivity alone: How visibility and specialization contribute to academic earnings.” American Sociological Review, 72: 533–561.
Leahey, E. and R. C. Reikowsky 2008 “Research specialization and collaboration patterns in sociology.” Social Studies of Science, 38: 425–440.
Leavitt, H. J. 1954 “A note on some experimental findings about the meanings of price.” The Journal of Business, 27: 205–210.
Lewin, T. 2013, December 25 “Getting Out of Discount Game, Small Colleges Lower the Price.” The New York Times. Lichtenstein, D. R., N. M. Ridgway, and R. G. Netemeyer 1993 “Price perceptions and consumer shopping behavior: a field study.” Journal of Marketing Research, 234–245.
Lorrain, F. and H. C. White 1971 “Structural equivalence of individuals in social networks.” Journal of Mathematical Sociology, 1: 49–80.
Lovett, C. 2005 “The Perils of Pursuing Prestige.” Chronicle of Higher Education, 21: 11–13.
Luzer, D. 2010, August 22 “The Prestige Racket.” Washington Monthly. Marr, J. C. and S. Thau 2014 “Falling from Great (and Not-So-Great) Heights: How Initial Status Position Influences Performance after Status Loss.” Academy of Management Journal, 57: 223–248. McPherson, M. 1983 “An ecology of affiliation.” American Sociological Review, 48: 519–532.
Merton, R. K. 1957 Social Theory and Social Structure. New York: Simon and Schuster.
1968
47
“The Matthew effect in science: The reward and communication systems of science are considered.” Science, 159: 56.
Mills, C. W. 1951 White collar: the American middle classes. New York, N.Y: Oxford University Press.
Mizruchi, M. S. 1990 “Cohesion, Structural Equivalence, and Similarity of Behavior: An Approach to the Study of Corporate Political Power.” Sociological Theory, 8: 16–32.
Montgomery, L. 2003 “Md. Trustee Proposes Doubling College Tuition; Money Would Protect Schools From State Cuts, Increase Financial Aid, Ehrlich Ally Says.” The Washington Post. Nelson, P. 1970 “Information and consumer behavior.” The Journal of Political Economy, 78: 311–329.
Nocera, J. 2012, September 28 “The College Rankings Racket.” The New York Times, p. A23.
Péli, G. 1997 “The Niche Hiker’s Guide to Population Ecology: A Logical Reconstruction of Organization Ecology’s Niche Theory.” Sociological Methodology, 27: 1–46.
Pettit, K. L., S. L. Sawa, and G. H. Sawa 1985 “Frugality: A cross-national moderator of the price-quality relationship.” Psychology & Marketing, 2: 253–265.
Pfeffer, J. and G. Salancik 1978 The External Control of Organizations: A Resource Dependence Perspective. New York: Harper & Row.
Phillips, D. J. and E. W. Zuckerman 2001 “Middle-Status Conformity: Theoretical Restatement and Empirical Demonstration in Two Markets.” American Journal of Sociology, 107: 379–429.
Plassmann, H., J. O’Doherty, B. Shiv, and A. Rangel 2008 “Marketing actions can modulate neural representations of experienced pleasantness.” Proceedings of the National Academy of Sciences of the United States of America, 105: 1050–4.
Podolny, J. M. 1993 “A Status-based Model of Market Competition.” American Journal of Sociology, 98: 829–872.
48
2001 “Networks as the Pipes and Prisms of the Market.” American Journal of Sociology, 107: 33–60.
2005 Status signals: A sociological study of market competition. Princeton, NJ: Princeton Univ Press. Podolny, J. M. and D. J. Phillips 1996 “The dynamics of organizational status.” Industrial and Corporate Change, 5: 453.
Podolny, J. M., T. E. Stuart, and M. T. Hannan 1996 “Networks, Knowledge, and Niches: Competition in the Worldwide Semiconductor Industry.” American Journal of Sociology, 102: 659–689.
Pope, J. 2012, February 6 “Colleges obsess over rankings; students shrug.” USATODAY.com. Rajendran, K. N. and G. J. Tellis 1994 “Contextual and Temporal Components of Reference Price.” Journal of Marketing, 58: 22.
Rao, A. R. and K. B. Monroe 1988 “The moderating effect of prior knowledge on cue utilization in product evaluations.” Journal of Consumer Research, 253–264.
Rosen, S. 1974 “Hedonic prices and implicit markets: product differentiation in pure competition.” The Journal of Political Economy, 82: 34–55.
Rössel, J. and J. Beckert 2013 “Quality classifications in competition: Price formation in the German wine market.” Constructing Quality: The Classification of Goods in Markets, 288.
Rowley, T. J., J. A. C. Baum, A. V. Shipilov, H. R. Greve, and H. Rao 2004 “Competing in Groups.” Managerial and Decision Economics, 25: 453–471.
Saloner, G., A. Shepard, and J. M. Podolny 2001 Strategic Management. New York City: John Wiley & Sons.
Sauder, M. 2008 “Interlopers and Field Change: The Entry of U.S. News into the Field of Legal Education.” Administrative Science Quarterly, 53: 209–234.
Sauder, M. and W. N. Espeland 2009
49
“The discipline of rankings: Tight coupling and organizational change.” American Sociological Review, 74: 63–82.
Sauder, M. and G. A. Fine 2008 “Arbiters, Entrepreneurs, and the Shaping of Business School Reputations.” Sociological Forum, 23: 699–723.
Sauder, M. and R. Lancaster 2006 “Do rankings matter? The effects of US News & World Report rankings on the admissions process of law schools.” Law & Society Review, 40: 105–134.
Sauder, M., F. B. Lynn, and J. M. Podolny 2012 “Status: Insights from Organizational Sociology.” Annual Review of Sociology, 38: 267–283.
Shipilov, A. V. and S. X. Li 2008 “Can you have your cake and eat it too? Structural holes’ influence on status accumulation and market performance in collaborative networks.” Administrative Science Quarterly, 53: 73–108.
Shipilov, A. V., S. X. Li, and H. R. Greve 2011 “The Prince and the Pauper: Search and Brokerage in the Initiation of Status-Heterophilous Ties.” Organization Science, 22: 1418–1434.
Snyder, W. and M. Cotter 1998 “The Michelin Guide and Restaurant Pricing Strategies.” Journal of Restaurant & Foodservice Marketing, 3: 51–67.
Spence, A. M. 1974 Market signaling: information transfer in hiring and related processes. Cambridge: Harvard Univ Press. Stecklow, S. 1995, April 5 “Cheat Sheets: Colleges Inflate SATs and Graduation Rates in Popular Guidebooks.” Wall Street Journal, p. 1. New York City, NY.
Stevens, M. L. 2007 Choosing a Class: College Admissions and the Education of Elites. Cambridge, MA: Harvard Univ Press.
Stuart, T. E. 1998 “Network Positions and Propensities to An Collaborate: Investigation of Strategic Alliance Formation in a High-technology Industry.” Administrative Science Quarterly, 43: 668–698.
Stuart, T. E., H. Hoang, and R. C. Hybels 1999
50
“Interorganizational Endorsements and the Performance of Entrepreneurial Ventures.” Administrative Science Quarterly, 44: 315.
Tellis, G. J. and B. Wernerfelt 1987 “Competitive price and quality under asymmetric information.” Marketing Science, 6: 240–253.
Thaler, R. 1985 “Mental accounting and consumer choice.” Marketing Science, 4: 199–214.
Uzzi, B. and R. Lancaster 2004 “Embeddedness and price formation in the corporate law market.” American Sociological Review, 69: 319–344.
Völckner, F. and J. Hofmann 2007 “The price-perceived quality relationship: A meta-analytic review and assessment of its determinants.” Marketing Letters, 18: 181–196.
Weissmann, J. 2012, February 1 “Why Is College So Expensive? And Can Obama Make It Cheaper?” The Atlantic. Werth, B. 1988 “Why Is College so Expensive?: Maybe America Wants It That Way.” Change, 20: 12–25.
White, H. C. 1981 “Where Do Markets Come From?” American Journal of Sociology, 87: 517–547.
2002 Markets From Networks: Socioeconomic Models of Production. Princeton, NJ: Princeton Univ Press. Winston, G. C. 1999 “Subsidies, hierarchy and peers: The awkward economics of higher education.” The Journal of Economic Perspectives, 13: 13–36.
Wooldridge, J. M. 2010 Econometric analysis of cross section and panel data. Cambridge, MA: MIT press. Zuckerman, E. W. 1999 “The Categorical Imperative: Securities Analysis and the Illegitimacy Discount.” American Journal of Sociology, 104: 1398–1438.
2000 “Focusing the Corporate Product: Securities Analysts and De-Diversification.” Administrative Science Quarterly, 45: 591–619.
51
APPENDIX
Our aim in this appendix is to further examine competing explanations for the effects we
have observed. Recall that our theory requires that the focal school is anchoring explicitly on its
USN rank as it sets price. Although we have adjusted for several factors associated with rank and
with future tuition, it is still possible that an unobserved, time-varying process correlated with
rank and subsequent price may have led us to overestimate our main effect of interest. Consider,
for instance, a sudden drop in revenues caused by a school’s decline in NCAA-related
competition—for instance, in its football or basketball program. Such a drop could drive that
school’s slip in rank, as prospective students and peer schools now find the focal school less
appealing. This financial shortfall could also lead the tuition-setting committee to raise price.
Under this scenario, an effect of status decline would be endogenous: the school hikes up tuition
mainly to counteract a drop in revenues triggered by a reversal in athletic standing.
To address the possible endogeneity of status loss, we estimated several two-stage
models. Our first-stage regressions predict status loss as a function of two instruments: double-
lagged rank and a peer-based covariate that we term rankpeeraid. Both covariates are measured
in year t-1 to predict status loss at t, which, in our second-stage models, predicts tuition in t+1.
Our approach exploits the zero-sum character of competition for ranks in dynamic tournaments:
unless a focal school can quickly sense and respond to competitive encroachments, that school
will suffer a drop in rank insofar as its proximate peers in the hierarchy have recently improved
on the dimensions that determine rank. The dimension on which we focus in constructing this
instrument is the average grant aid—money that schools give to students without expectation of
being paid back—dispensed by rival schools. More formally, we compute this measure as
follows:
52
( )w rit ijt jt
jrankpeeraid AvgGrantAid=∑ where jtAvgGrantAid is the average financial aid
grant by school j to its students at year t, and ( )w rijt are rank-based proximity weights that sum to
one.24 Conditioning on lagged rank, an increase in this covariate for a focal school—an
indication that its peers have greater financial resources to attract students conducive to better
rankings—is likely to diminish the focal school’s rank in the future.
The results of two exploratory models were aligned with our expectations. First, in a
simple regression of itstatusloss on , 1i trank − and , 1i trankpeeraid − , the coefficients and test
statistics were these, respectively: .00239 (13.99 t-test) and .0000213 (6.06 t-test). Second, in the
same model but with fixed effects for schools also included, the basic pattern was very similar: a
coefficient of .005 (3.64 t-test) on , 1i trank − and a coefficient of .00005 (7.31 t-test) on
, 1i trankpeeraid − . Consistent with prior work on the intertwined nature of competition for ranks
(cf. Espeland and Stevens, 1998; Espeland and Sauder, 2007: 16-22), peers’ encroachments are
correlated with status decline in the next year. Our assumption is that these rank-based peer
allocations of grant aid reflect changes in their own budgets and are therefore uncorrelated with
contemporaneous unobserved shortfalls at the focal school, such as a financial downturn tied to
weaker athletic performance.
[Table A1]
Table A1 presents estimates from a series of robustness checks. We start with estimates
from a within-two-stage least squares model using double-lagged rank and double-lagged
24 In particular, ( )w /r
ijt ijt ijtj
rankprox rankprox= ∑ where, max(| |) | |ijt it jt it jtrankprox R R R R= − − − and itR
denotes the rank of school i and jtR is the rank of school j. This measure differs in one respect from weighted peer tuition:
because colleges only compete structurally with other colleges for ranks, and universities with other universities, rankpeeraid only includes in the weighted average other schools of the same institutional type.
53
rankpeeraid as instruments. We estimated this model using the xtivreg2 command in Stata. In
model A.1, the effect of status loss (our endogenous explanatory variable) stays significant (2.47
z-score). This model is important because it offers further support for hypothesis 1: that a drop in
status itself, rather than a hidden concurrent process, prompts a higher price. We can reject the
null hypothesis of the Anderson underidentification test (p < .0001), and we also cannot reject
the null of the Sargan overidentification test (p = .141). These tests indicate that our instruments
are consequential and are uncorrelated with the error term. In addition, model A.2 confirms that
the partial correlations of our instruments with future tuition are not significantly different from
zero when all conditioning variables are included.
One surprising feature of model A.1, however, is the magnitude of the coefficient on
status loss. Recall that in table 2 the main effect was approximately .01, meaning that a drop in
status is associated with a full percentage point increase in future tuition. In contrast, in model
A.1, the coefficient is now .047, which is remarkably large. There are three potential reasons for
this dramatic increase in the effect using two-stage least squares: first, it may reflect a cleaner
estimate that is purged of endogenous processes; second, given our longer lag structure, we have
limited our panel to schools appearing consecutively—that is, our panel is now a pruned set of
organizations that may, on average, possess more of the credibility necessary to engage in
aspirational pricing; third, predicted status loss in the second-stage equation can now fall beneath
zero and rise above one because it was constructed from a linear probability model in the first
stage. Status loss, originally an indicator variable, can thus take values outside the bounds of the
unit interval in model A.1. This added range may account for the much larger magnitude of the
effect.
Suspecting that the third factor was dominant, we re-estimated A.1 as a treatment effects
54
model in A.3. Following Wooldridge’s (2010) recommended approach for binary endogenous
explanatory variables, the first-stage regression is now a probit predicting status loss as a
function of our two instruments. Predicted values for status loss entering in the second stage
regression are now bound by zero and one. We estimated A.3 using the treatreg function in Stata,
adding school-specific dummy variables for all schools. Although to our knowledge this
estimator is unaccompanied by standard tests for IV specifications, the stable effect of status loss
lends further support to our main hypothesis. We use the treatreg function for four additional
two-stage regressions in this appendix.
In models A.4-A.7, we re-examine our moderating hypotheses. Since we do not have
instruments for betweenness centrality or weighted peer tuition, we rely on sample-splitting to
approximate our earlier tests of interaction effects. Models A.4 and A.5 present results of
median-splits on betweenness centrality. Broadly consistent with hypothesis 2, the effect of
status loss is roughly 50% larger for betweenness centrality above its median in model A.5 than
for below its median in A.4. In addition, although effects of status fell shy of significance when
we examined median-splits on weighted peer tuition,25 we did find evidence in keeping with
hypothesis 3 when extreme deciles of weighted peer tuition were excluded. In model A.6, we
omit observations for which weighted peer tuition exceeds its 90th percentile ($21,854), while in
A.7 we exclude observations for which weighted peer tuition falls short of its 10th percentile
($15,752).26 Aligned with hypothesis 3, the effect of status loss is (marginally) stronger in model
A.6—for schools whose structurally equivalent competitors charge higher tuition. We thus see
patterns of effects in these two-stage models that are broadly consistent with our earlier, simpler
25 The full results of median-splits on weighted peer tuition are also available by request. For schools beneath the median, the coefficient on status loss was .0007 (.15 z-score test), while the coefficient of interest was .007 (1.81 z-score test) for weighted peer tuition above its median. 26 This distribution is clearly more compressed than the overall tuition distribution because, as a peer-measure, it is a (weighted) average.
55
specifications.
Concluding with model A.8, we consider an additional competing explanation for our
interaction with weighted peer tuition. Recalling hypothesis 3, our main assertion is that status-
aspirational pricing is constrained by fairness norms created, at least in part, by peer producers’
past decision-making: a focal school has “room” to increase price insofar as its close competitors
have pushed out the pricing frontier. Our prediction was explicitly peer-based. Yet an important
counter-possibility to consider is the following: weighted peer tuition is merely correlated with
the focal school’s tuition in the more distant past, and the school’s own past behavior more
decisively shapes its reaction to a status decline. Put differently, if the school itself has been
charging a low price previously, it might then perceive greater freedom in its future choice of
tuition. To address the possibility that the focal school’s history might matter more than peers’
pricing decisions, we interacted status loss at t with log(tuition) at t-2 in a model predicting
tuition at t+1. The result is shown in A.8: the coefficient on the interaction term falls just short of
significance at the conventional level. It appears that a school might be less likely to price
aspirationally if it has charged a very high tuition in years past, but the effect is not discernible.
Given the significance of the interaction between status loss and weighted peer tuition, we are
persuaded that a peers’ behavior is a stronger, more plausible moderator of reactions to drops in
rank.
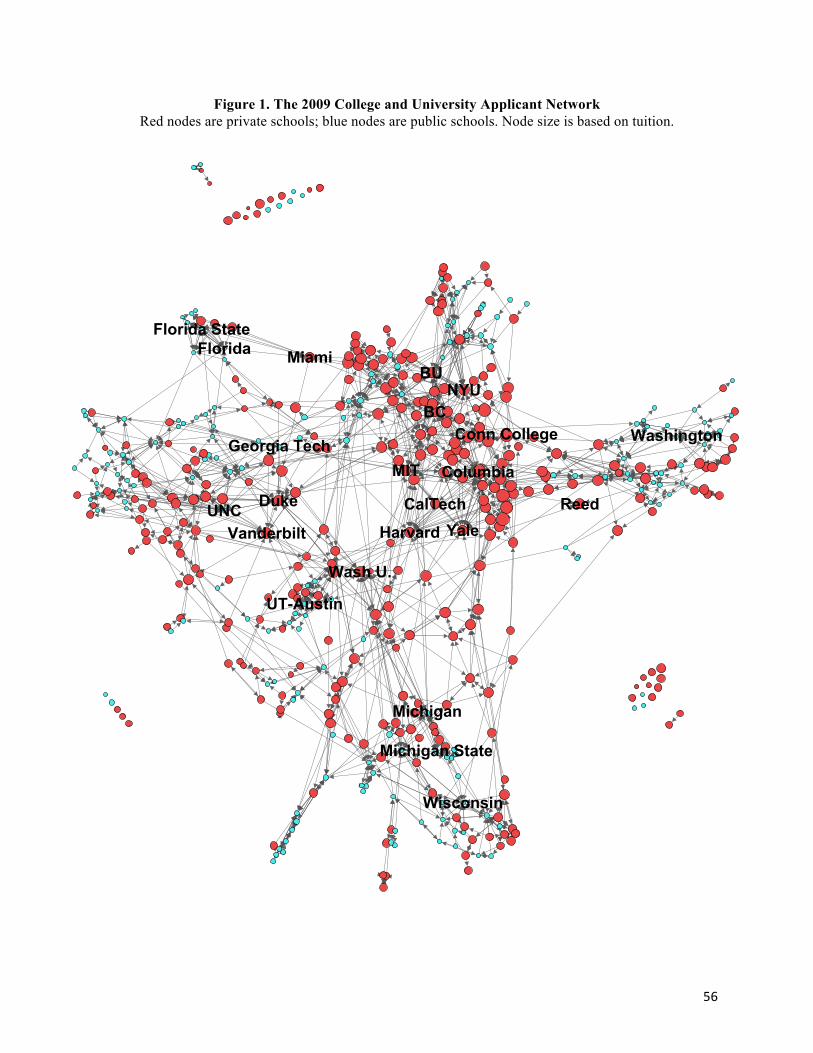
56
Figure 1. The 2009 College and University Applicant Network Red nodes are private schools; blue nodes are public schools. Node size is based on tuition.
BC
BU
CalTech
Columbia
Conn College
Duke
Florida State
Georgia Tech
Harvard
MIT
Michigan State
NYU
Reed
Florida Miami
Michigan
UNC
UT-Austin
Washington
Wisconsin
Vanderbilt
Wash U.
Yale
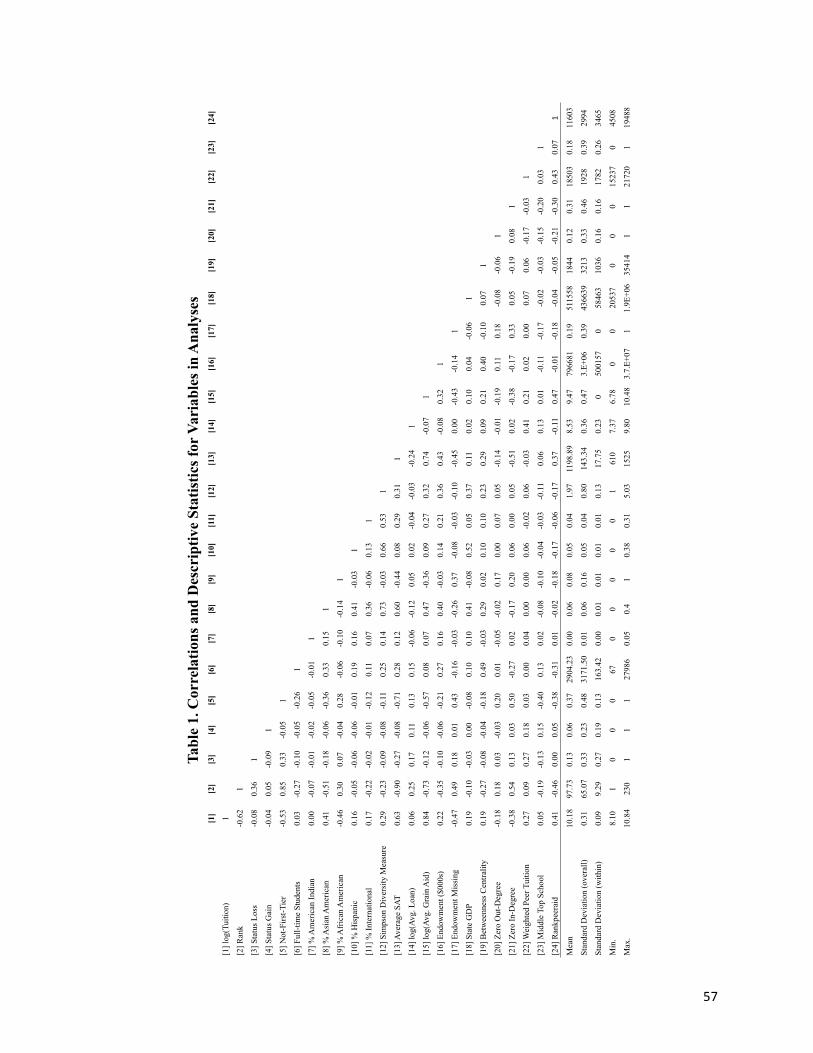
57
[1]
[2]
[3]
[4]
[5]
[6]
[7]
[8]
[9]
[10]
[11]
[12]
[13]
[14]
[15]
[16]
[17]
[18]
[19]
[20]
[21]
[22]
[23]
[24]
[1] l
og(T
uitio
n)1
[2] R
ank
-0.6
21
[3] S
tatu
s Los
s-0
.08
0.36
1
[4] S
tatu
s Gai
n-0
.04
0.05
-0.0
91
[5] N
ot-F
irst-T
ier
-0.5
30.
850.
33-0
.05
1
[6] F
ull-t
ime
Stud
ents
0.03
-0.2
7-0
.10
-0.0
5-0
.26
1
[7] %
Am
eric
an In
dian
0.00
-0.0
7-0
.01
-0.0
2-0
.05
-0.0
11
[8] %
Asi
an A
mer
ican
0.41
-0.5
1-0
.18
-0.0
6-0
.36
0.33
0.15
1
[9] %
Afr
ican
Am
eric
an-0
.46
0.30
0.07
-0.0
40.
28-0
.06
-0.1
0-0
.14
1
[10]
% H
ispa
nic
0.16
-0.0
5-0
.06
-0.0
6-0
.01
0.19
0.16
0.41
-0.0
31
[11]
% In
tern
atio
nal
0.17
-0.2
2-0
.02
-0.0
1-0
.12
0.11
0.07
0.36
-0.0
60.
131
[12]
Sim
pson
Div
ersi
ty M
easu
re0.
29-0
.23
-0.0
9-0
.08
-0.1
10.
250.
140.
73-0
.03
0.66
0.53
1
[13]
Ave
rage
SAT
0.63
-0.9
0-0
.27
-0.0
8-0
.71
0.28
0.12
0.60
-0.4
40.
080.
290.
311
[14]
log(
Avg.
Loa
n)0.
060.
250.
170.
110.
130.
15-0
.06
-0.1
20.
050.
02-0
.04
-0.0
3-0
.24
1
[15]
log(
Avg.
Gra
in A
id)
0.84
-0.7
3-0
.12
-0.0
6-0
.57
0.08
0.07
0.47
-0.3
60.
090.
270.
320.
74-0
.07
1
[16]
End
owm
ent (
$000
s)0.
22-0
.35
-0.1
0-0
.06
-0.2
10.
270.
160.
40-0
.03
0.14
0.21
0.36
0.43
-0.0
80.
321
[17]
End
owm
ent M
issi
ng-0
.47
0.49
0.18
0.01
0.43
-0.1
6-0
.03
-0.2
60.
37-0
.08
-0.0
3-0
.10
-0.4
50.
00-0
.43
-0.1
41
[18]
Sta
te G
DP
0.19
-0.1
0-0
.03
0.00
-0.0
80.
100.
100.
41-0
.08
0.52
0.05
0.37
0.11
0.02
0.10
0.04
-0.0
61
[19]
Bet
wee
nnes
s Cen
tralit
y0.
19-0
.27
-0.0
8-0
.04
-0.1
80.
49-0
.03
0.29
0.02
0.10
0.10
0.23
0.29
0.09
0.21
0.40
-0.1
00.
071
[20]
Zer
o O
ut-D
egre
e-0
.18
0.18
0.03
-0.0
30.
200.
01-0
.05
-0.0
20.
170.
000.
070.
05-0
.14
-0.0
1-0
.19
0.11
0.18
-0.0
8-0
.06
1
[21]
Zer
o In
-Deg
ree
-0.3
80.
540.
130.
030.
50-0
.27
0.02
-0.1
70.
200.
060.
000.
05-0
.51
0.02
-0.3
8-0
.17
0.33
0.05
-0.1
90.
081
[22]
Wei
ghte
d Pe
er T
uitio
n0.
270.
090.
270.
180.
030.
000.
040.
000.
000.
06-0
.02
0.06
-0.0
30.
410.
210.
020.
000.
070.
06-0
.17
-0.0
31
[23]
Mid
dle
Top
Scho
ol0.
05-0
.19
-0.1
30.
15-0
.40
0.13
0.02
-0.0
8-0
.10
-0.0
4-0
.03
-0.1
10.
060.
130.
01-0
.11
-0.1
7-0
.02
-0.0
3-0
.15
-0.2
00.
031
[24]
Ran
kpee
raid
0.41
-0.4
60.
000.
05-0
.38
-0.3
10.
01-0
.02
-0.1
8-0
.17
-0.0
6-0
.17
0.37
-0.1
10.
47-0
.01
-0.1
8-0
.04
-0.0
5-0
.21
-0.3
00.
430.
071
Mea
n10
.18
97.7
30.
130.
060.
3729
04.2
30.
000.
060.
080.
050.
041.
9711
98.8
98.
539.
4779
6681
0.19
5115
5818
440.
120.
3118
503
0.18
1160
3
Stan
dard
Dev
iatio
n (o
vera
ll)0.
3165
.07
0.33
0.23
0.48
3171
.50
0.01
0.06
0.16
0.05
0.04
0.80
143.
340.
360.
473.
E+06
0.39
4366
3932
130.
330.
4619
280.
3929
94
Stan
dard
Dev
iatio
n (w
ithin
)0.
099.
290.
270.
190.
1316
3.42
0.00
0.01
0.01
0.01
0.01
0.13
17.7
50.
230
5001
570
5846
310
360.
160.
1617
820.
2634
65
Min
.8.
101
00
067
00
00
01
610
7.37
6.78
00
2053
70
00
1523
70
4508
Max
.10
.84
230
11
127
986
0.05
0.4
10.
380.
315.
0315
259.
8010
.48
3.7.
E+07
11.
9E+0
635
414
11
2172
01
1948
8
Tabl
e 1.
Cor
rela
tions
and
Des
crip
tive
Stat
istic
s fo
r V
aria
bles
in A
naly
ses
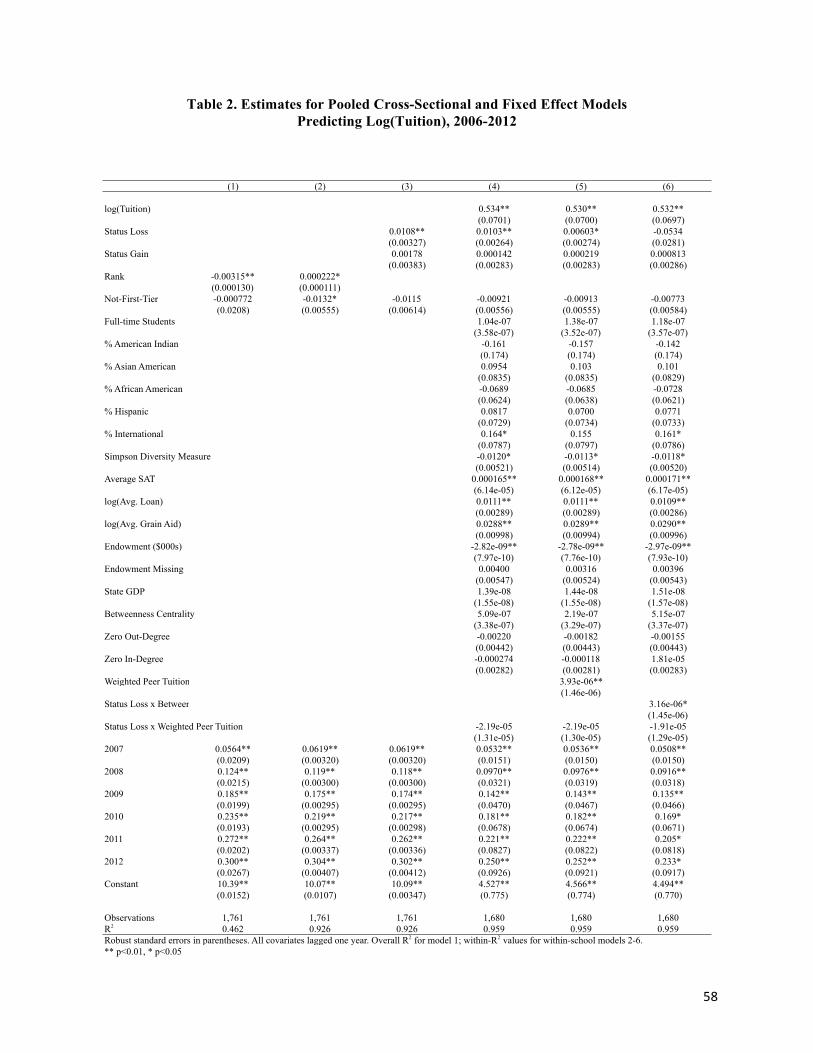
58
Table 2. Estimates for Pooled Cross-Sectional and Fixed Effect Models Predicting Log(Tuition), 2006-2012
(1) (2) (3) (4) (5) (6)
log(Tuition) 0.534** 0.530** 0.532**(0.0701) (0.0700) (0.0697)
Status Loss 0.0108** 0.0103** 0.00603* -0.0534(0.00327) (0.00264) (0.00274) (0.0281)
Status Gain 0.00178 0.000142 0.000219 0.000813(0.00383) (0.00283) (0.00283) (0.00286)
Rank -0.00315** 0.000222*(0.000130) (0.000111)
Not-First-Tier -0.000772 -0.0132* -0.0115 -0.00921 -0.00913 -0.00773(0.0208) (0.00555) (0.00614) (0.00556) (0.00555) (0.00584)
Full-time Students 1.04e-07 1.38e-07 1.18e-07(3.58e-07) (3.52e-07) (3.57e-07)
% American Indian -0.161 -0.157 -0.142(0.174) (0.174) (0.174)
% Asian American 0.0954 0.103 0.101(0.0835) (0.0835) (0.0829)
% African American -0.0689 -0.0685 -0.0728(0.0624) (0.0638) (0.0621)
% Hispanic 0.0817 0.0700 0.0771(0.0729) (0.0734) (0.0733)
% International 0.164* 0.155 0.161*(0.0787) (0.0797) (0.0786)
Simpson Diversity Measure -0.0120* -0.0113* -0.0118*(0.00521) (0.00514) (0.00520)
Average SAT 0.000165** 0.000168** 0.000171**(6.14e-05) (6.12e-05) (6.17e-05)
log(Avg. Loan) 0.0111** 0.0111** 0.0109**(0.00289) (0.00289) (0.00286)
log(Avg. Grain Aid) 0.0288** 0.0289** 0.0290**(0.00998) (0.00994) (0.00996)
Endowment ($000s) -2.82e-09** -2.78e-09** -2.97e-09**(7.97e-10) (7.76e-10) (7.93e-10)
Endowment Missing 0.00400 0.00316 0.00396(0.00547) (0.00524) (0.00543)
State GDP 1.39e-08 1.44e-08 1.51e-08(1.55e-08) (1.55e-08) (1.57e-08)
Betweenness Centrality 5.09e-07 2.19e-07 5.15e-07(3.38e-07) (3.29e-07) (3.37e-07)
Zero Out-Degree -0.00220 -0.00182 -0.00155(0.00442) (0.00443) (0.00443)
Zero In-Degree -0.000274 -0.000118 1.81e-05(0.00282) (0.00281) (0.00283)
Weighted Peer Tuition 3.93e-06**(1.46e-06)
Status Loss x Betweenness Centrality 3.16e-06*(1.45e-06)
Status Loss x Weighted Peer Tuition -2.19e-05 -2.19e-05 -1.91e-05(1.31e-05) (1.30e-05) (1.29e-05)
2007 0.0564** 0.0619** 0.0619** 0.0532** 0.0536** 0.0508**(0.0209) (0.00320) (0.00320) (0.0151) (0.0150) (0.0150)
2008 0.124** 0.119** 0.118** 0.0970** 0.0976** 0.0916**(0.0215) (0.00300) (0.00300) (0.0321) (0.0319) (0.0318)
2009 0.185** 0.175** 0.174** 0.142** 0.143** 0.135**(0.0199) (0.00295) (0.00295) (0.0470) (0.0467) (0.0466)
2010 0.235** 0.219** 0.217** 0.181** 0.182** 0.169*(0.0193) (0.00295) (0.00298) (0.0678) (0.0674) (0.0671)
2011 0.272** 0.264** 0.262** 0.221** 0.222** 0.205*(0.0202) (0.00337) (0.00336) (0.0827) (0.0822) (0.0818)
2012 0.300** 0.304** 0.302** 0.250** 0.252** 0.233*(0.0267) (0.00407) (0.00412) (0.0926) (0.0921) (0.0917)
Constant 10.39** 10.07** 10.09** 4.527** 4.566** 4.494**(0.0152) (0.0107) (0.00347) (0.775) (0.774) (0.770)
Observations 1,761 1,761 1,761 1,680 1,680 1,680R2 0.462 0.926 0.926 0.959 0.959 0.959Robust standard errors in parentheses. All covariates lagged one year. Overall R2 for model 1; within-R2 values for within-school models 2-6.** p<0.01, * p<0.05
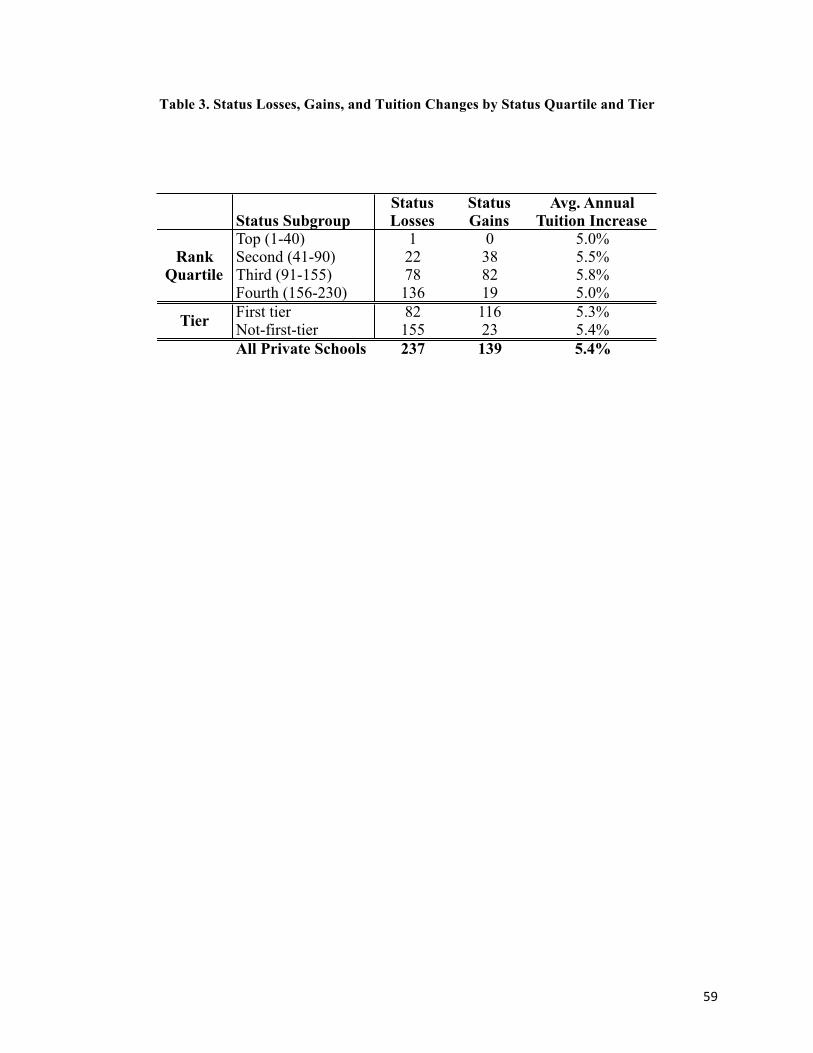
59
Table 3. Status Losses, Gains, and Tuition Changes by Status Quartile and Tier
Status SubgroupStatus Losses
Status Gains
Avg. Annual Tuition Increase
Top (1-40) 1 0 5.0%Second (41-90) 22 38 5.5%Third (91-155) 78 82 5.8%Fourth (156-230) 136 19 5.0%First tier 82 116 5.3%Not-first-tier 155 23 5.4%All Private Schools 237 139 5.4%
Rank Quartile
Tier

60
Table 4. Estimates for Robustness Check Models Predicting Log(Tuition), 2006-2012
(7) (8) (9)
log(Tuition) 0.754** 0.676** 0.748**(0.0602) (0.0514) (0.0585)
Status Loss 0.00818* 0.00970* 0.00105(0.00333) (0.00450) (0.00411)
Status Gain -0.000883 -0.00118 -0.00116(0.00332) (0.00378) (0.00345)
Not-first-tier
Full-time Students 2.11e-07 2.68e-07 2.93e-07(2.53e-07) (2.67e-07) (2.76e-07)
% American Indian 0.0671 -0.162 0.0368(0.221) (0.214) (0.223)
% Asian American 0.0560 0.0764 0.0610(0.0668) (0.0641) (0.0653)
% African American -0.130* -0.139* -0.133*(0.0598) (0.0625) (0.0611)
% Hispanic 0.0878 0.0590 0.0784(0.0902) (0.0861) (0.0893)
% International 0.0952 0.105 0.101(0.0923) (0.0945) (0.0937)
Simpson Diversity Measure -9.74e-05 -0.00210 1.95e-05(0.00518) (0.00477) (0.00524)
Average SAT 4.88e-05 4.14e-05 5.24e-05(6.13e-05) (6.43e-05) (6.26e-05)
log(Avg. Loan) 0.00296 0.000822 0.00243(0.00289) (0.00310) (0.00291)
log(Avg. Grain Aid) 0.0221* 0.0253** 0.0226*(0.00899) (0.00830) (0.00892)
Endowment ($000s) -1.98e-09** -2.39e-09** -2.04e-09**(6.34e-10) (6.46e-10) (6.29e-10)
Endowment Missing -0.00238 -0.0118 -0.00154(0.00517) (0.00654) (0.00521)
State GDP 9.27e-10 -4.00e-09 2.46e-09(1.28e-08) (1.20e-08) (1.29e-08)
Betweenness Centrality 4.03e-07 3.27e-07 3.95e-07(2.97e-07) (2.80e-07) (3.00e-07)
Zero Out-Degree -0.000485 -0.00201 1.64e-05(0.00441) (0.00446) (0.00457)
Zero In-Degree -0.000646 -0.00152 -0.000720(0.00276) (0.00275) (0.00274)
Weighted Peer Tuition -2.40e-06 -7.30e-06 -7.86e-07(1.05e-05) (1.12e-05) (1.12e-05)
Middle Top School 0.00120(0.00288)
Middle Top School x Status Loss 0.0126*(0.00528)
2007 0.0204 0.0290* 0.0192(0.0118) (0.0124) (0.0124)
2008 0.0302 0.0499 0.0276(0.0254) (0.0270) (0.0268)
2009 0.0443 0.0735 0.0403(0.0373) (0.0397) (0.0394)
2010 0.0450 0.0864 0.0391(0.0542) (0.0577) (0.0573)
2011 0.0529 0.102 0.0456(0.0656) (0.0699) (0.0693)
2012 0.0628 0.117 0.0536(0.0741) (0.0791) (0.0785)
Constant 2.294** 3.167** 2.324**(0.704) (0.637) (0.699)
Observations 1,165 1,029 1,165R2 (within) 0.997 0.997 0.997Robust standard errors in parentheses. School fixed effects included. All covariates lagged one year.** p<0.01, * p<0.05
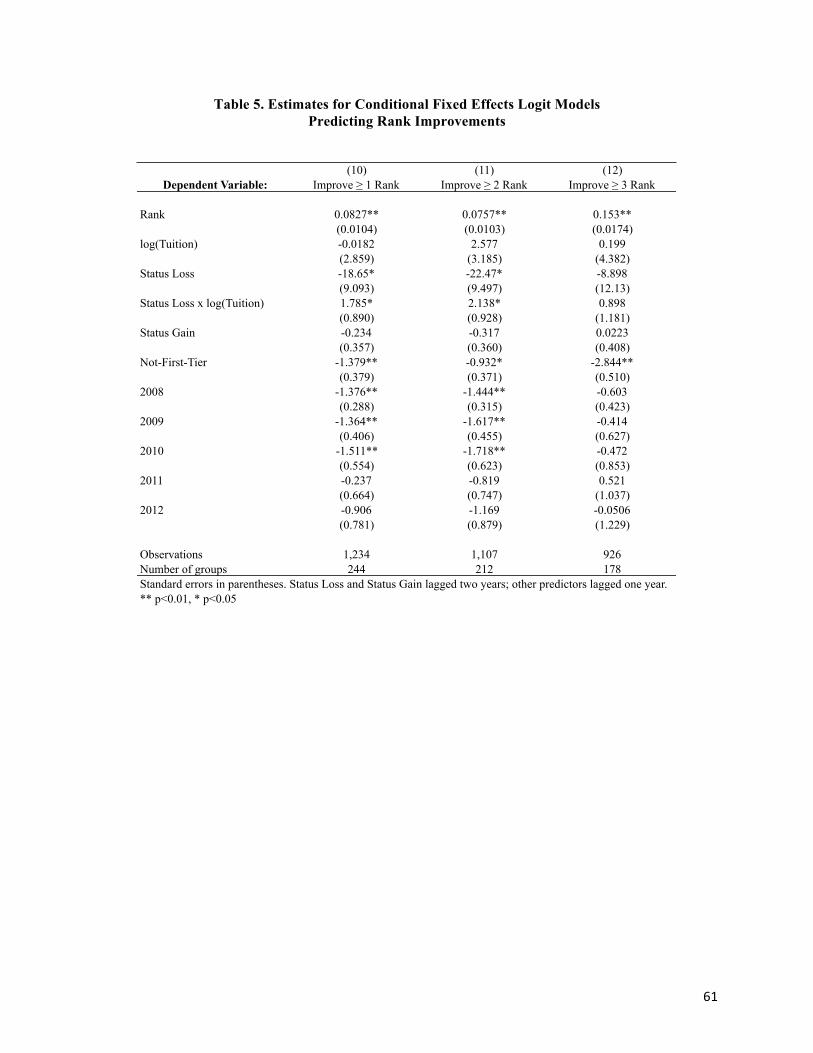
61
Table 5. Estimates for Conditional Fixed Effects Logit Models Predicting Rank Improvements
(10) (11) (12)Dependent Variable: Improve ≥ 1 Rank Improve ≥ 2 Rank Improve ≥ 3 Rank
Rank 0.0827** 0.0757** 0.153**(0.0104) (0.0103) (0.0174)
log(Tuition) -0.0182 2.577 0.199(2.859) (3.185) (4.382)
Status Loss -18.65* -22.47* -8.898(9.093) (9.497) (12.13)
Status Loss x log(Tuition) 1.785* 2.138* 0.898(0.890) (0.928) (1.181)
Status Gain -0.234 -0.317 0.0223(0.357) (0.360) (0.408)
Not-First-Tier -1.379** -0.932* -2.844**(0.379) (0.371) (0.510)
2008 -1.376** -1.444** -0.603(0.288) (0.315) (0.423)
2009 -1.364** -1.617** -0.414(0.406) (0.455) (0.627)
2010 -1.511** -1.718** -0.472(0.554) (0.623) (0.853)
2011 -0.237 -0.819 0.521(0.664) (0.747) (1.037)
2012 -0.906 -1.169 -0.0506(0.781) (0.879) (1.229)
Observations 1,234 1,107 926Number of groups 244 212 178Standard errors in parentheses. Status Loss and Status Gain lagged two years; other predictors lagged one year. ** p<0.01, * p<0.05
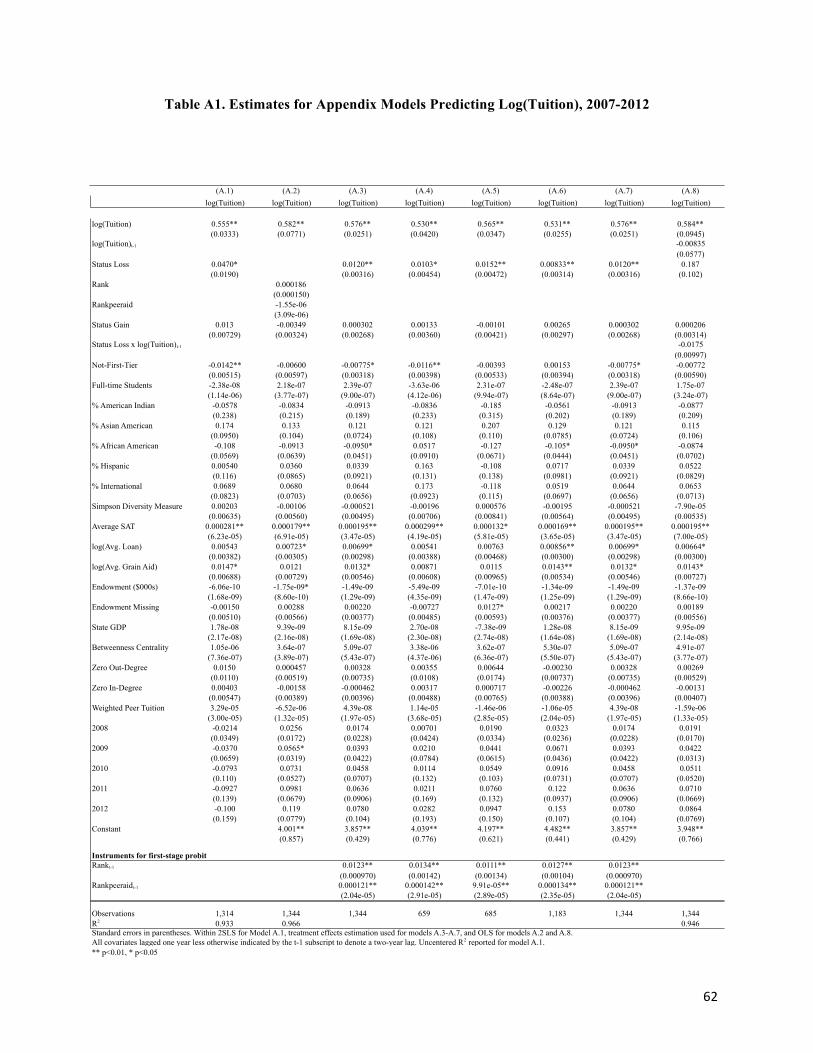
62
Table A1. Estimates for Appendix Models Predicting Log(Tuition), 2007-2012
(A.1) (A.2) (A.3) (A.4) (A.5) (A.6) (A.7) (A.8)log(Tuition) log(Tuition) log(Tuition) log(Tuition) log(Tuition) log(Tuition) log(Tuition) log(Tuition)
log(Tuition) 0.555** 0.582** 0.576** 0.530** 0.565** 0.531** 0.576** 0.584**(0.0333) (0.0771) (0.0251) (0.0420) (0.0347) (0.0255) (0.0251) (0.0945)
log(Tuition)t-1 -0.00835(0.0577)
Status Loss 0.0470* 0.0120** 0.0103* 0.0152** 0.00833** 0.0120** 0.187(0.0190) (0.00316) (0.00454) (0.00472) (0.00314) (0.00316) (0.102)
Rank 0.000186(0.000150)
Rankpeeraid -1.55e-06(3.09e-06)
Status Gain 0.013 -0.00349 0.000302 0.00133 -0.00101 0.00265 0.000302 0.000206(0.00729) (0.00324) (0.00268) (0.00360) (0.00421) (0.00297) (0.00268) (0.00314)
Status Loss x log(Tuition)t-1 -0.0175(0.00997)
Not-First-Tier -0.0142** -0.00600 -0.00775* -0.0116** -0.00393 0.00153 -0.00775* -0.00772(0.00515) (0.00597) (0.00318) (0.00398) (0.00533) (0.00394) (0.00318) (0.00590)
Full-time Students -2.38e-08 2.18e-07 2.39e-07 -3.63e-06 2.31e-07 -2.48e-07 2.39e-07 1.75e-07(1.14e-06) (3.77e-07) (9.00e-07) (4.12e-06) (9.94e-07) (8.64e-07) (9.00e-07) (3.24e-07)
% American Indian -0.0578 -0.0834 -0.0913 -0.0836 -0.185 -0.0561 -0.0913 -0.0877(0.238) (0.215) (0.189) (0.233) (0.315) (0.202) (0.189) (0.209)
% Asian American 0.174 0.133 0.121 0.121 0.207 0.129 0.121 0.115(0.0950) (0.104) (0.0724) (0.108) (0.110) (0.0785) (0.0724) (0.106)
% African American -0.108 -0.0913 -0.0950* 0.0517 -0.127 -0.105* -0.0950* -0.0874(0.0569) (0.0639) (0.0451) (0.0910) (0.0671) (0.0444) (0.0451) (0.0702)
% Hispanic 0.00540 0.0360 0.0339 0.163 -0.108 0.0717 0.0339 0.0522(0.116) (0.0865) (0.0921) (0.131) (0.138) (0.0981) (0.0921) (0.0829)
% International 0.0689 0.0680 0.0644 0.173 -0.118 0.0519 0.0644 0.0653(0.0823) (0.0703) (0.0656) (0.0923) (0.115) (0.0697) (0.0656) (0.0713)
Simpson Diversity Measure 0.00203 -0.00106 -0.000521 -0.00196 0.000576 -0.00195 -0.000521 -7.90e-05(0.00635) (0.00560) (0.00495) (0.00706) (0.00841) (0.00564) (0.00495) (0.00535)
Average SAT 0.000281** 0.000179** 0.000195** 0.000299** 0.000132* 0.000169** 0.000195** 0.000195**(6.23e-05) (6.91e-05) (3.47e-05) (4.19e-05) (5.81e-05) (3.65e-05) (3.47e-05) (7.00e-05)
log(Avg. Loan) 0.00543 0.00723* 0.00699* 0.00541 0.00763 0.00856** 0.00699* 0.00664*(0.00382) (0.00305) (0.00298) (0.00388) (0.00468) (0.00300) (0.00298) (0.00300)
log(Avg. Grain Aid) 0.0147* 0.0121 0.0132* 0.00871 0.0115 0.0143** 0.0132* 0.0143*(0.00688) (0.00729) (0.00546) (0.00608) (0.00965) (0.00534) (0.00546) (0.00727)
Endowment ($000s) -6.06e-10 -1.75e-09* -1.49e-09 -5.49e-09 -7.01e-10 -1.34e-09 -1.49e-09 -1.37e-09(1.68e-09) (8.60e-10) (1.29e-09) (4.35e-09) (1.47e-09) (1.25e-09) (1.29e-09) (8.66e-10)
Endowment Missing -0.00150 0.00288 0.00220 -0.00727 0.0127* 0.00217 0.00220 0.00189(0.00510) (0.00566) (0.00377) (0.00485) (0.00593) (0.00376) (0.00377) (0.00556)
State GDP 1.78e-08 9.39e-09 8.15e-09 2.70e-08 -7.38e-09 1.28e-08 8.15e-09 9.95e-09(2.17e-08) (2.16e-08) (1.69e-08) (2.30e-08) (2.74e-08) (1.64e-08) (1.69e-08) (2.14e-08)
Betweenness Centrality 1.05e-06 3.64e-07 5.09e-07 3.38e-06 3.62e-07 5.30e-07 5.09e-07 4.91e-07(7.36e-07) (3.89e-07) (5.43e-07) (4.37e-06) (6.36e-07) (5.50e-07) (5.43e-07) (3.77e-07)
Zero Out-Degree 0.0150 0.000457 0.00328 0.00355 0.00644 -0.00230 0.00328 0.00269(0.0110) (0.00519) (0.00735) (0.0108) (0.0174) (0.00737) (0.00735) (0.00529)
Zero In-Degree 0.00403 -0.00158 -0.000462 0.00317 0.000717 -0.00226 -0.000462 -0.00131(0.00547) (0.00389) (0.00396) (0.00488) (0.00765) (0.00388) (0.00396) (0.00407)
Weighted Peer Tuition 3.29e-05 -6.52e-06 4.39e-08 1.14e-05 -1.46e-06 -1.06e-05 4.39e-08 -1.59e-06(3.00e-05) (1.32e-05) (1.97e-05) (3.68e-05) (2.85e-05) (2.04e-05) (1.97e-05) (1.33e-05)
2008 -0.0214 0.0256 0.0174 0.00701 0.0190 0.0323 0.0174 0.0191(0.0349) (0.0172) (0.0228) (0.0424) (0.0334) (0.0236) (0.0228) (0.0170)
2009 -0.0370 0.0565* 0.0393 0.0210 0.0441 0.0671 0.0393 0.0422(0.0659) (0.0319) (0.0422) (0.0784) (0.0615) (0.0436) (0.0422) (0.0313)
2010 -0.0793 0.0731 0.0458 0.0114 0.0549 0.0916 0.0458 0.0511(0.110) (0.0527) (0.0707) (0.132) (0.103) (0.0731) (0.0707) (0.0520)
2011 -0.0927 0.0981 0.0636 0.0211 0.0760 0.122 0.0636 0.0710(0.139) (0.0679) (0.0906) (0.169) (0.132) (0.0937) (0.0906) (0.0669)
2012 -0.100 0.119 0.0780 0.0282 0.0947 0.153 0.0780 0.0864(0.159) (0.0779) (0.104) (0.193) (0.150) (0.107) (0.104) (0.0769)
Constant 4.001** 3.857** 4.039** 4.197** 4.482** 3.857** 3.948**(0.857) (0.429) (0.776) (0.621) (0.441) (0.429) (0.766)
Instruments for first-stage probitRankt-1 0.0123** 0.0134** 0.0111** 0.0127** 0.0123**
(0.000970) (0.00142) (0.00134) (0.00104) (0.000970)Rankpeeraidt-1 0.000121** 0.000142** 9.91e-05** 0.000134** 0.000121**
(2.04e-05) (2.91e-05) (2.89e-05) (2.35e-05) (2.04e-05)
Observations 1,314 1,344 1,344 659 685 1,183 1,344 1,344R2 0.933 0.966 0.946Standard errors in parentheses. Within 2SLS for Model A.1, treatment effects estimation used for models A.3-A.7, and OLS for models A.2 and A.8.All covariates lagged one year less otherwise indicated by the t-1 subscript to denote a two-year lag. Uncentered R2 reported for model A.1.** p<0.01, * p<0.05


![Chivas Guidelines MB[1]](https://img.pdfslide.us/doc/110x75/55cf971f550346d0338fcfce/chivas-guidelines-mb1.jpg)
