Embed Size (px)
Citation preview
Status as of 4/30/2006
Oliver MainkaGIS Program ManagerSAP Labs North America
Project Sagres
Spatial Enablement of SAP Business Processes
User Experience Overview
SAP AG 2005, Title of Presentation / Speaker Name / 2
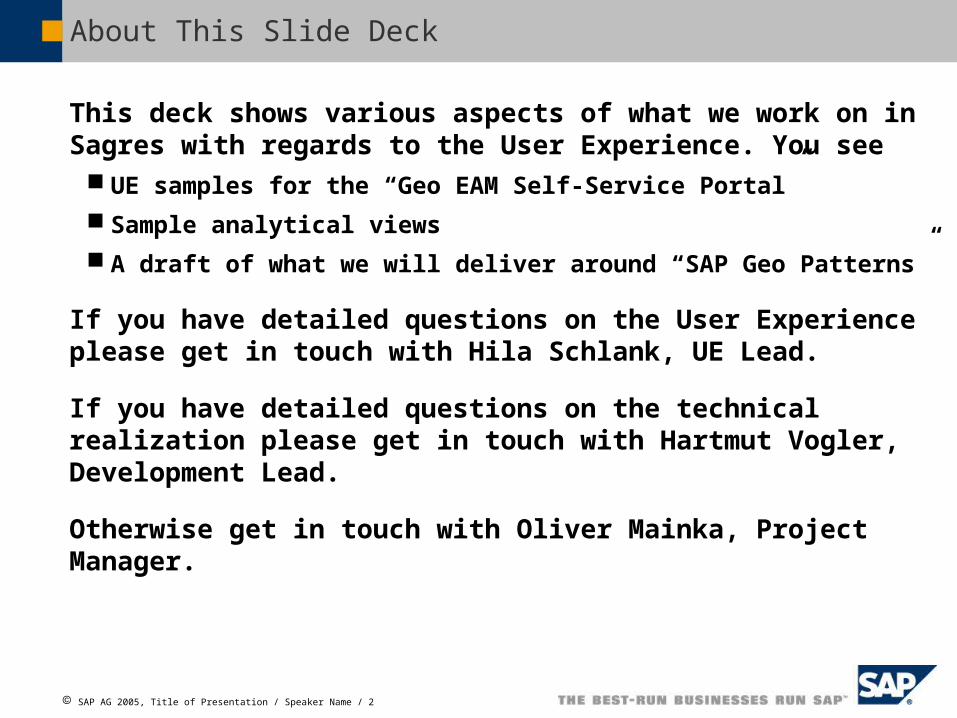
About This Slide Deck
This deck shows various aspects of what we work on in Sagres with regards to the User Experience. You see UE samples for the “Geo EAM Self-Service Portal”
Sample analytical views
A draft of what we will deliver around “SAP Geo Patterns”
If you have detailed questions on the User Experience please get in touch with Hila Schlank, UE Lead.
If you have detailed questions on the technical realization please get in touch with Hartmut Vogler, Development Lead.
Otherwise get in touch with Oliver Mainka, Project Manager.
SAP AG 2005, Title of Presentation / Speaker Name / 3
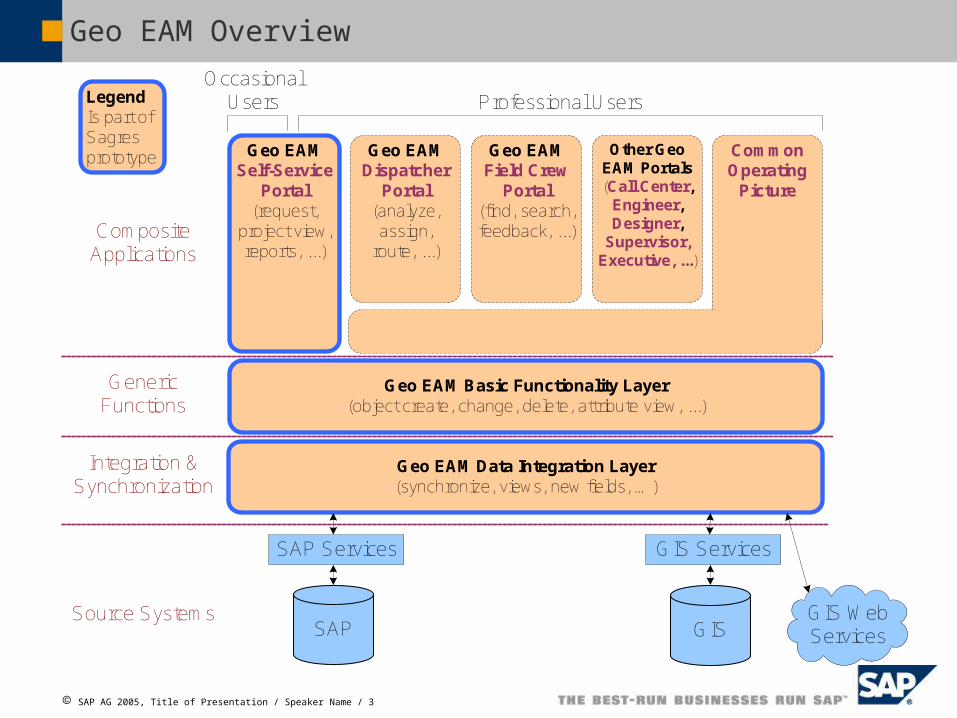
Geo EAM Overview
Geo EAM Data Integration Layer(synchronize, views, new fields, …)
Geo EAM Basic Functionality Layer(object create, change, delete, attribute view, ...)
Geo EAM Self-Service
Portal(request,
project view, reports, ...)
Geo EAM Dispatcher
Portal(analyze, assign,
route, ...)
Geo EAM Field Crew
Portal(find, search, feedback, ...)
Other Geo EAM Portals(Call Center,
Engineer, Designer,
Supervisor, Executive, ...)
SAP GISGIS Web Services
LegendIs part of Sagres prototype
Professional UsersOccasional
Users
Common Operating
Picture
SAP Services GIS Services
CompositeApplications
GenericFunctions
Integration & Synchronization
Source Systems
SAP Geo Patterns (Draft)
Geo EAM Self-Service Portal
Map-Based Analytics
SAP AG 2005, Title of Presentation / Speaker Name / 5
What you see in this section…
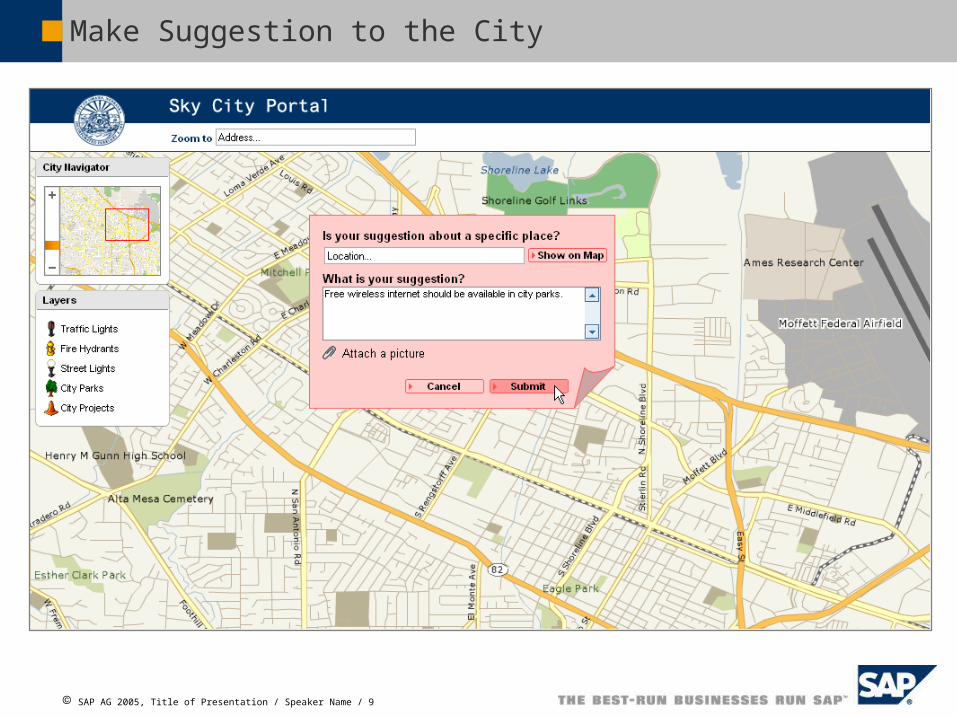
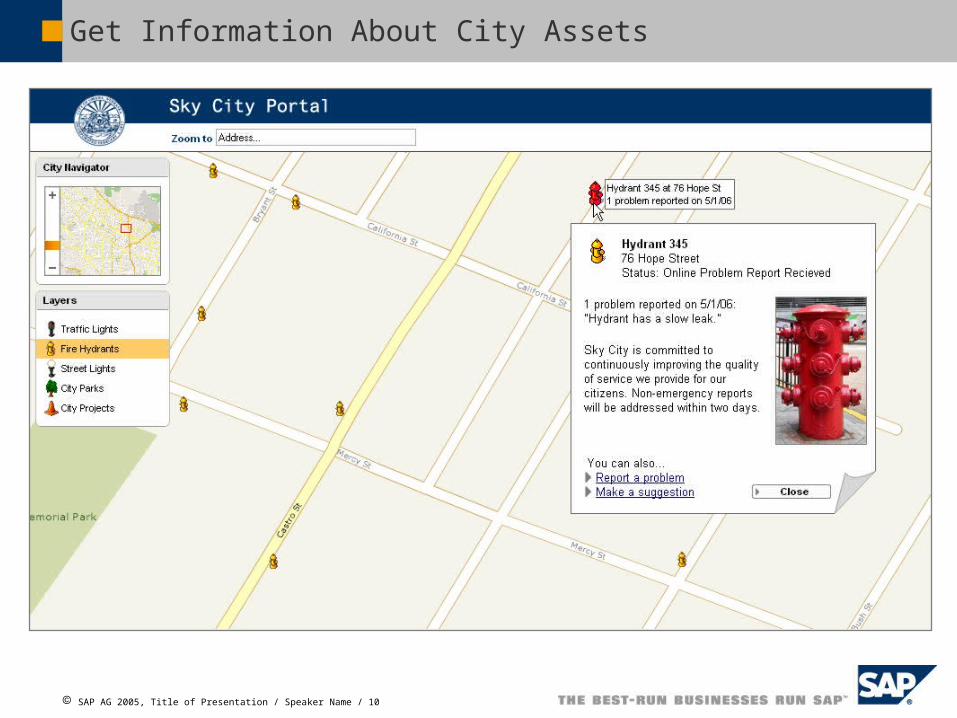
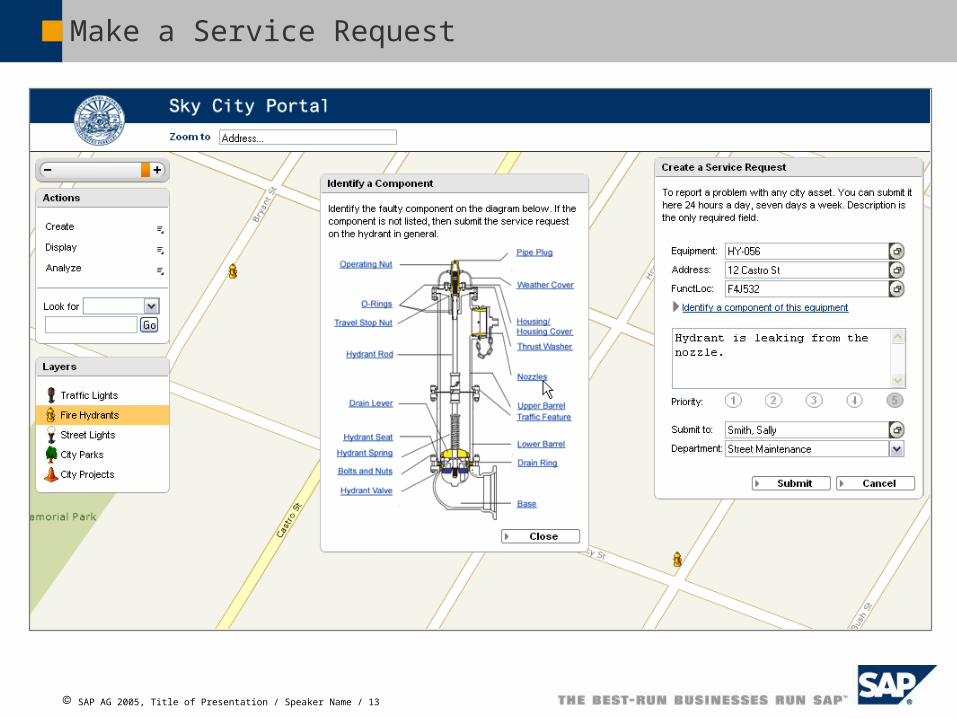
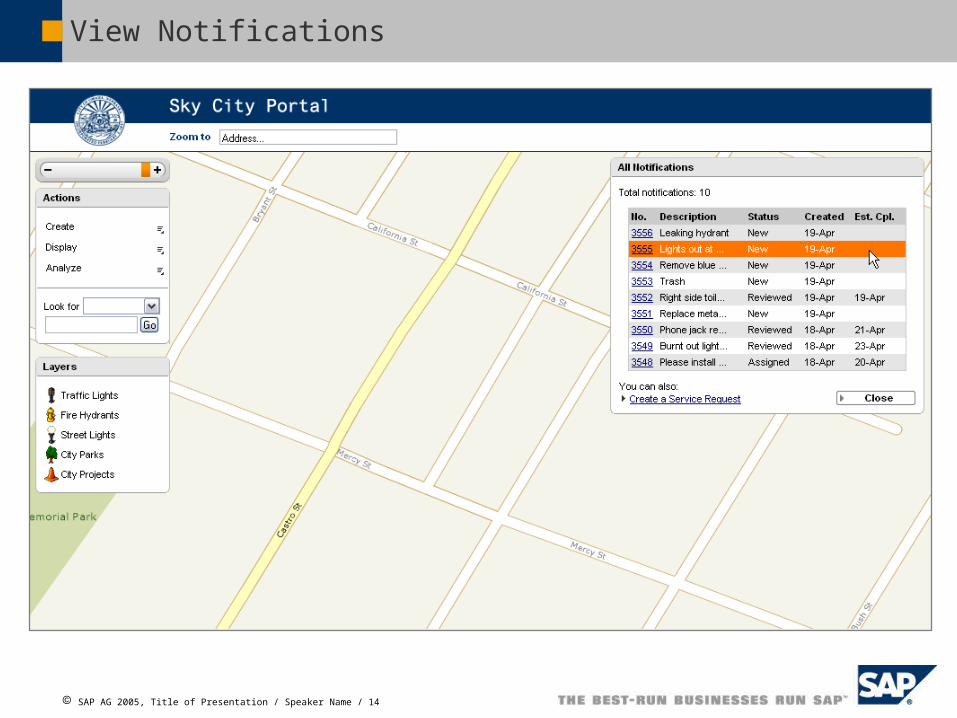
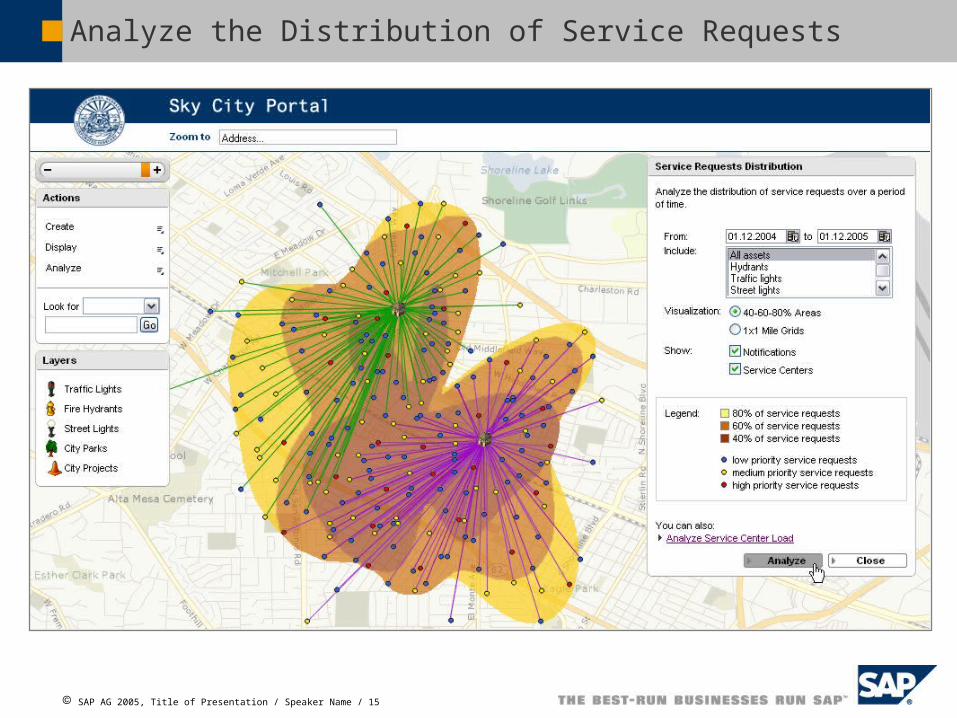
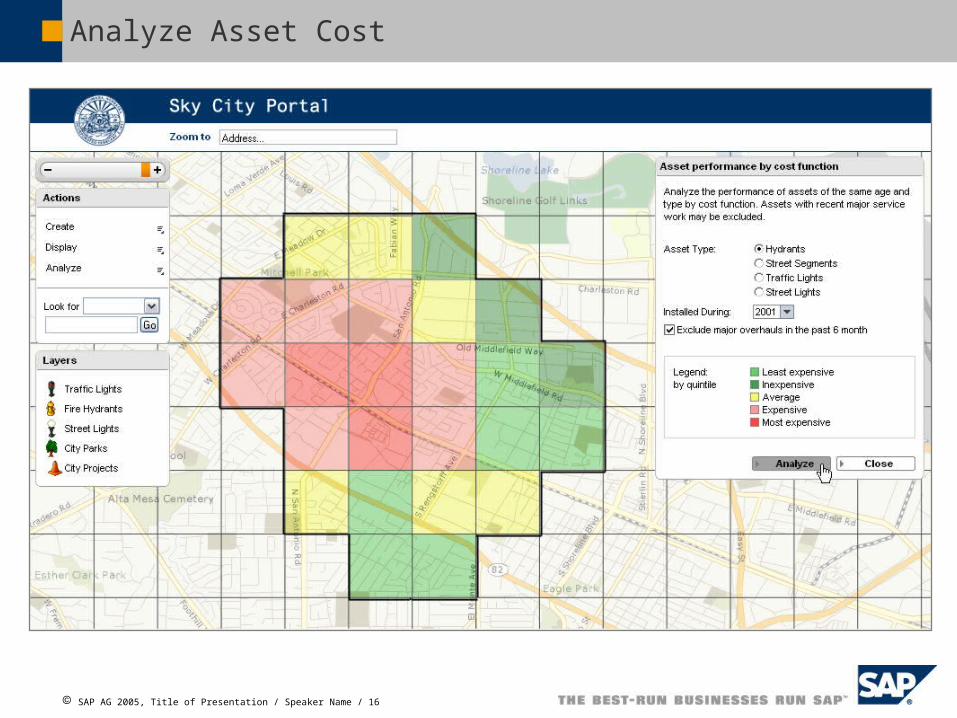
Here are screenshots of the March 2006 version of the User Experience of the Sagres Geo EAM Self-Service Portal. The title indicates which functionality is currently shown.
The UE is being continued to be developed. In particular more Analytics will be added.
SAP AG 2005, Title of Presentation / Speaker Name / 6
Screens for occasional users, e.g. the citizen of a municipality, or an internal person not involved in asset management (e.g. a person in a facility who wants to report an airconditioning problem).
SAP AG 2005, Title of Presentation / Speaker Name / 7
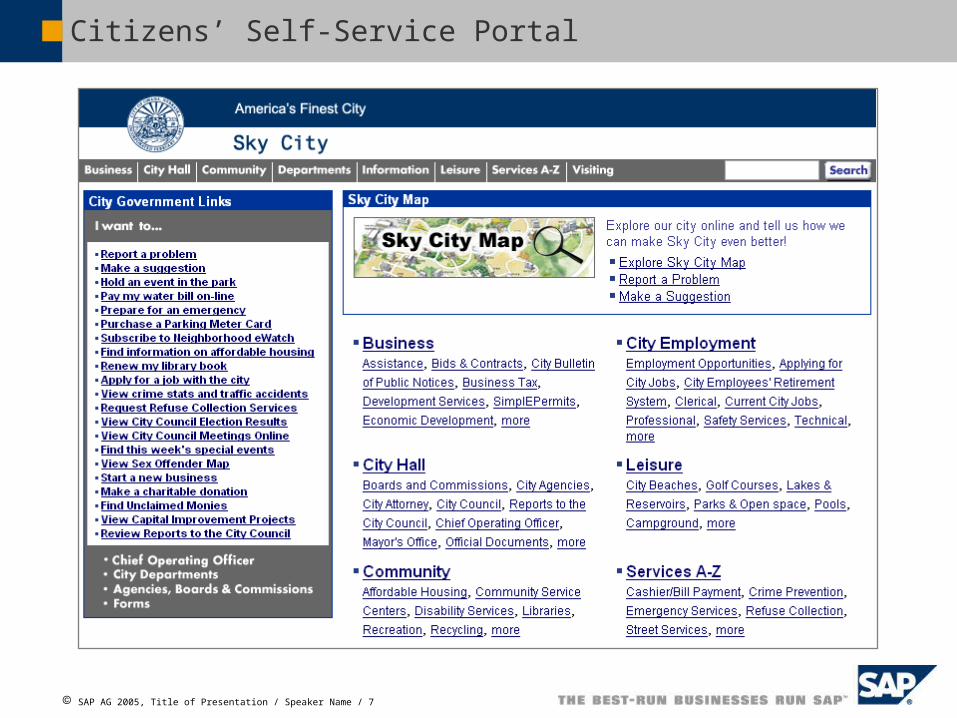
Citizens’ Self-Service Portal
SAP AG 2005, Title of Presentation / Speaker Name / 8
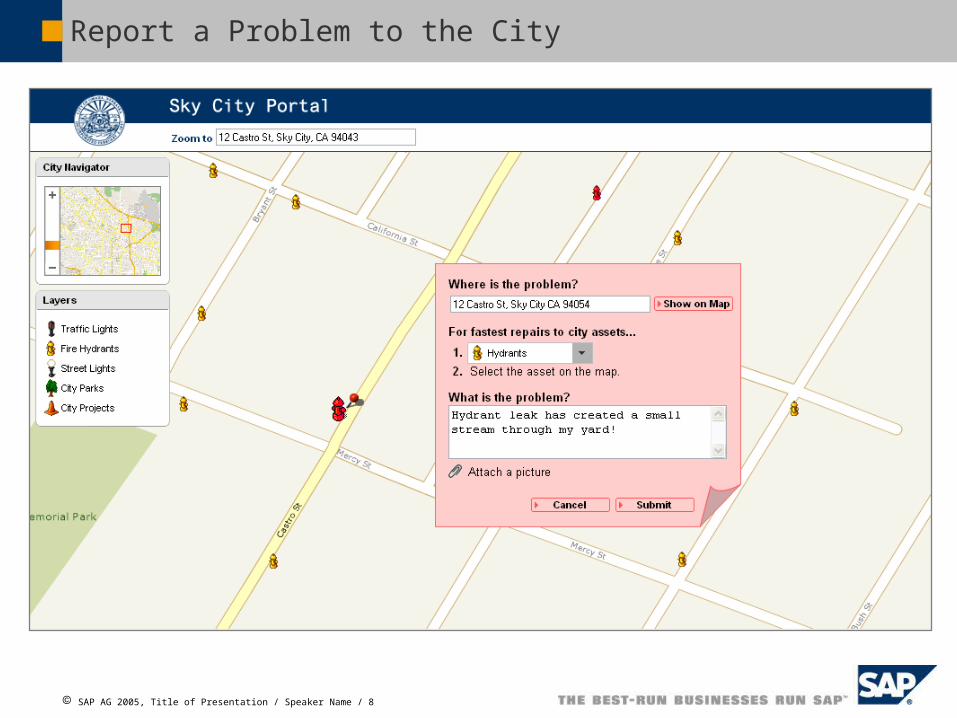
Report a Problem to the City
SAP AG 2005, Title of Presentation / Speaker Name / 9
Make Suggestion to the City
SAP AG 2005, Title of Presentation / Speaker Name / 10
Get Information About City Assets
SAP AG 2005, Title of Presentation / Speaker Name / 11
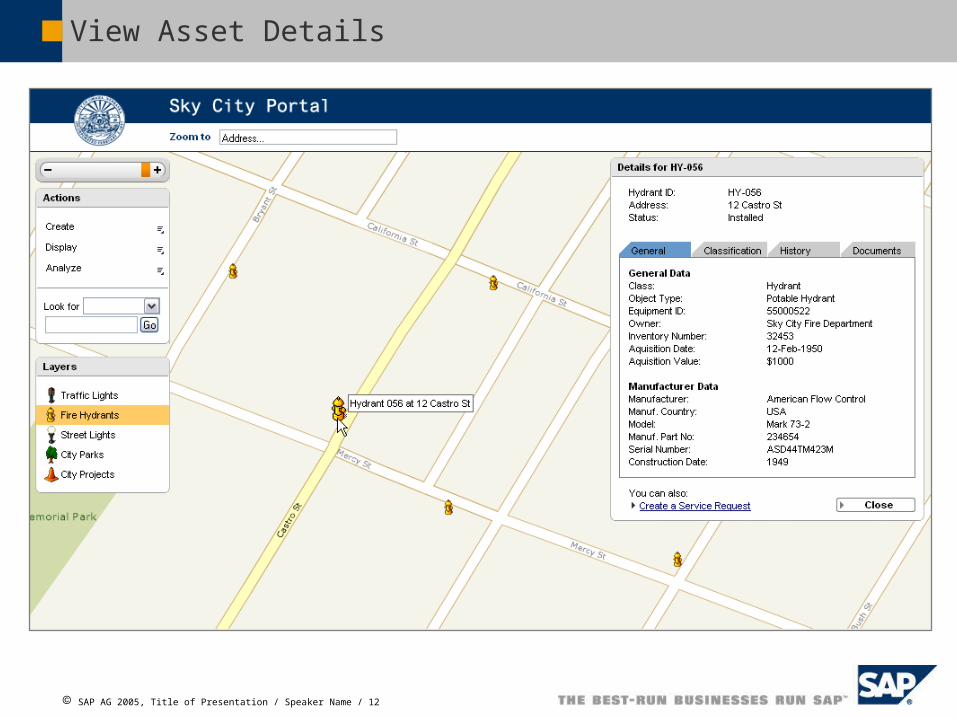
Screens for professional users, who know in detail about asset management and likely are part of the asset management organization.
SAP AG 2005, Title of Presentation / Speaker Name / 12
View Asset Details
SAP AG 2005, Title of Presentation / Speaker Name / 13
Make a Service Request
SAP AG 2005, Title of Presentation / Speaker Name / 14
View Notifications
SAP AG 2005, Title of Presentation / Speaker Name / 15
Analyze the Distribution of Service Requests
SAP AG 2005, Title of Presentation / Speaker Name / 16
Analyze Asset Cost
SAP Geo Patterns (Draft)
Geo EAM Self-Service Portal
Map-Based Analytics
SAP AG 2005, Title of Presentation / Speaker Name / 18
What you see in this section…
The “geo processing” functionalities of a GIS server can be used to deliver valuable insights for people involved along the Enterprise Asset Management lifecycle.
In this section you find some examples which were created with ESRI’s Business Analyst tool. In Sagres we will deliver an architecture how best to extract SAP analytical data (here from PM-IS and EAM info cubes in BW) and display the data in a GIS.
SAP AG 2005, Title of Presentation / Speaker Name / 19
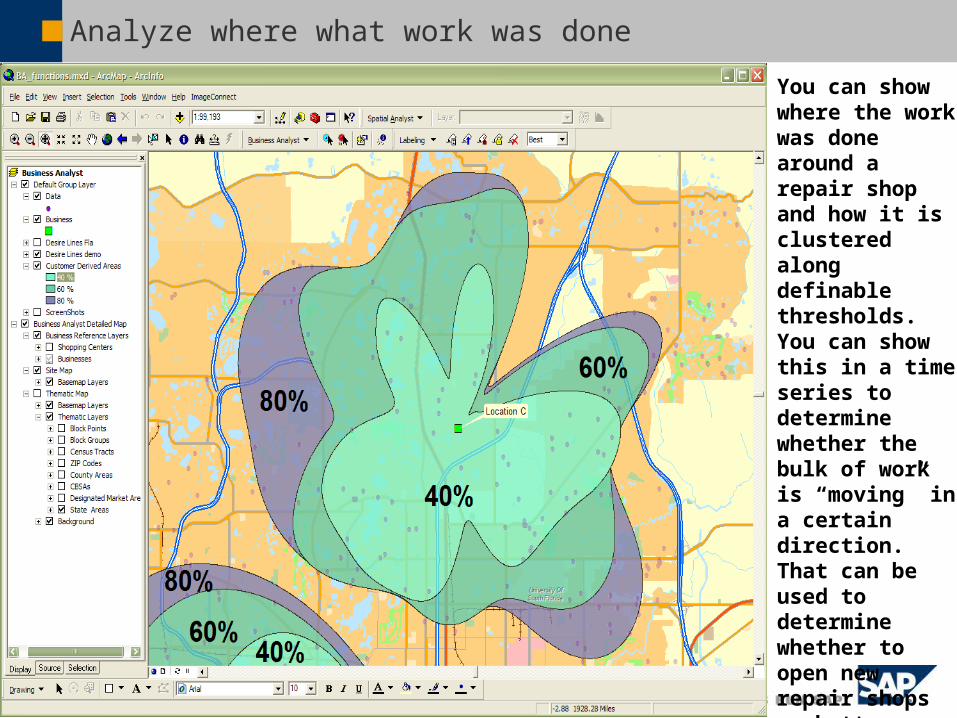
Analyze where what work was done
You can show where the work was done around a repair shop and how it is clustered along definable thresholds. You can show this in a time series to determine whether the bulk of work is “moving” in a certain direction. That can be used to determine whether to open new repair shops or better preposition equipment or spare parts.
SAP AG 2005, Title of Presentation / Speaker Name / 20
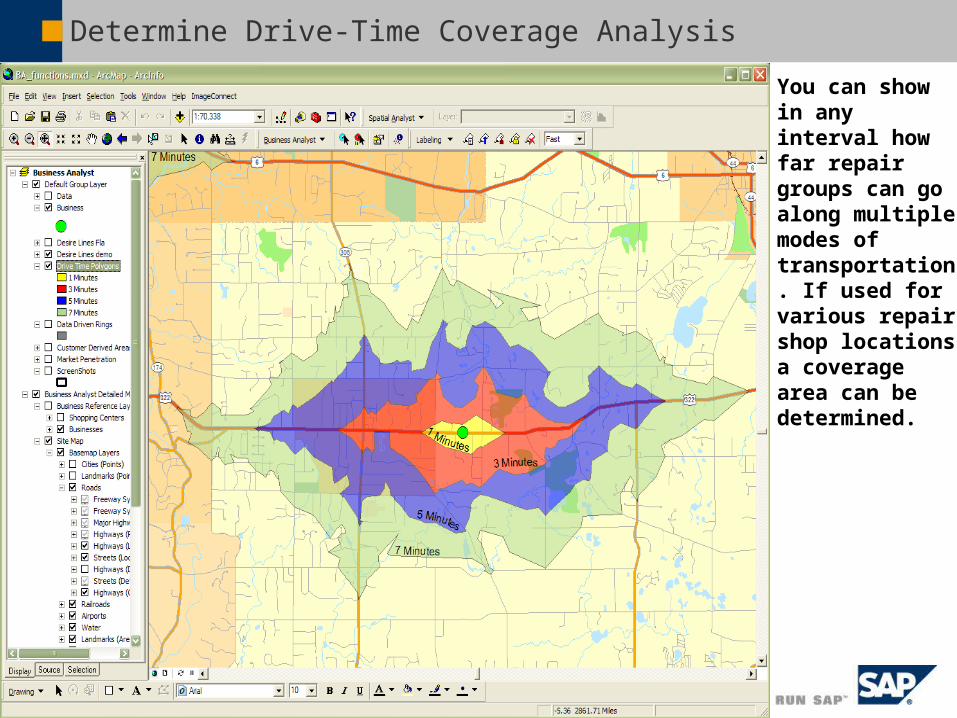
Determine Drive-Time Coverage Analysis
You can show in any interval how far repair groups can go along multiple modes of transportation. If used for various repair shop locations a coverage area can be determined.
SAP AG 2005, Title of Presentation / Speaker Name / 21
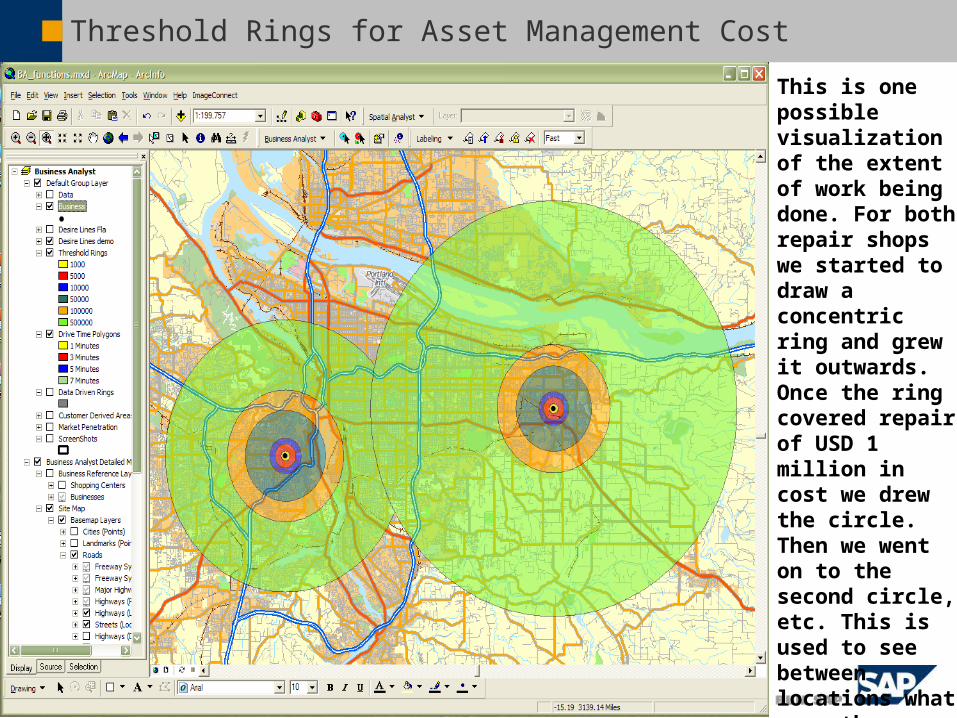
Threshold Rings for Asset Management Cost
This is one possible visualization of the extent of work being done. For both repair shops we started to draw a concentric ring and grew it outwards. Once the ring covered repair of USD 1 million in cost we drew the circle. Then we went on to the second circle, etc. This is used to see between locations what area they cover.
SAP AG 2005, Title of Presentation / Speaker Name / 22
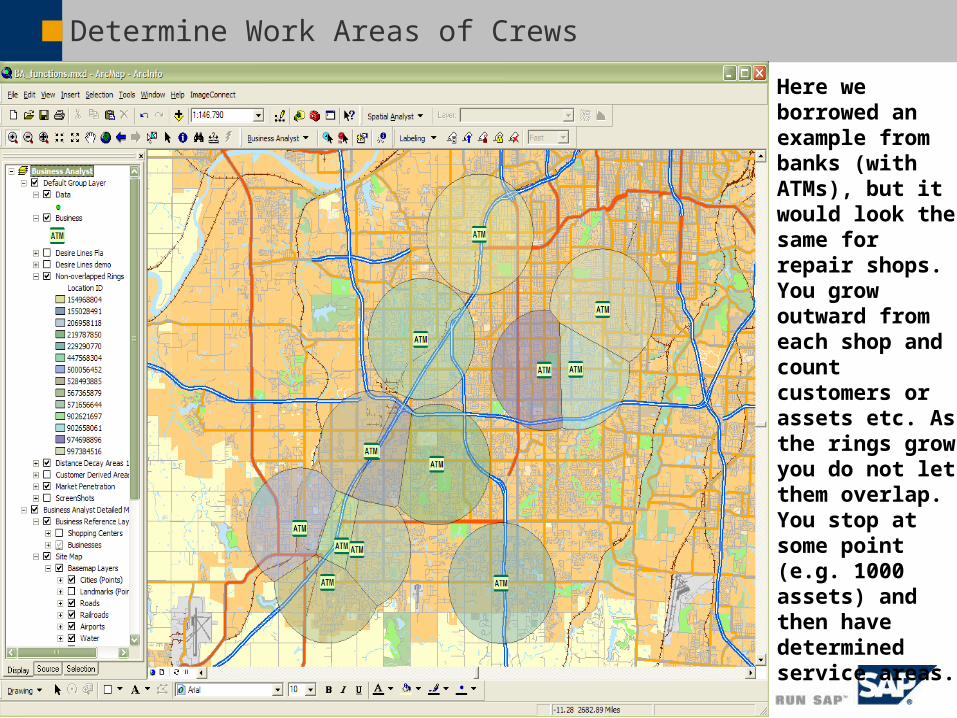
Determine Work Areas of Crews
Here we borrowed an example from banks (with ATMs), but it would look the same for repair shops. You grow outward from each shop and count customers or assets etc. As the rings grow you do not let them overlap. You stop at some point (e.g. 1000 assets) and then have determined service areas.
SAP Geo Patterns (Draft)
Geo EAM Self-Service Portal
Map-Based Analytics
SAP AG 2005, Title of Presentation / Speaker Name / 24
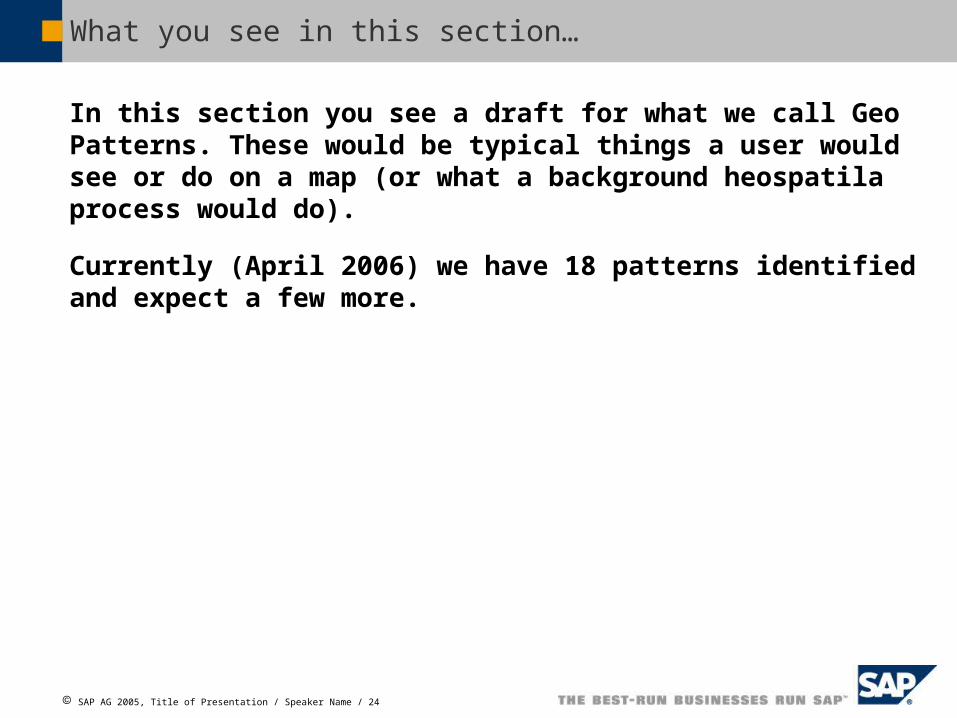
What you see in this section…
In this section you see a draft for what we call Geo Patterns. These would be typical things a user would see or do on a map (or what a background heospatila process would do).
Currently (April 2006) we have 18 patterns identified and expect a few more.
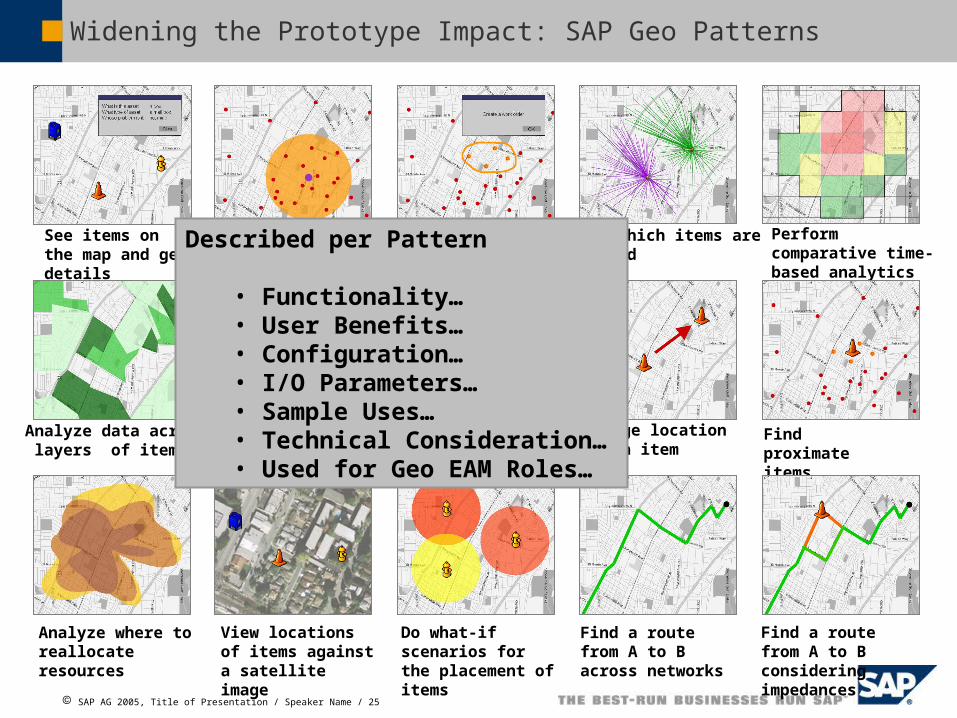
SAP AG 2005, Title of Presentation / Speaker Name / 25
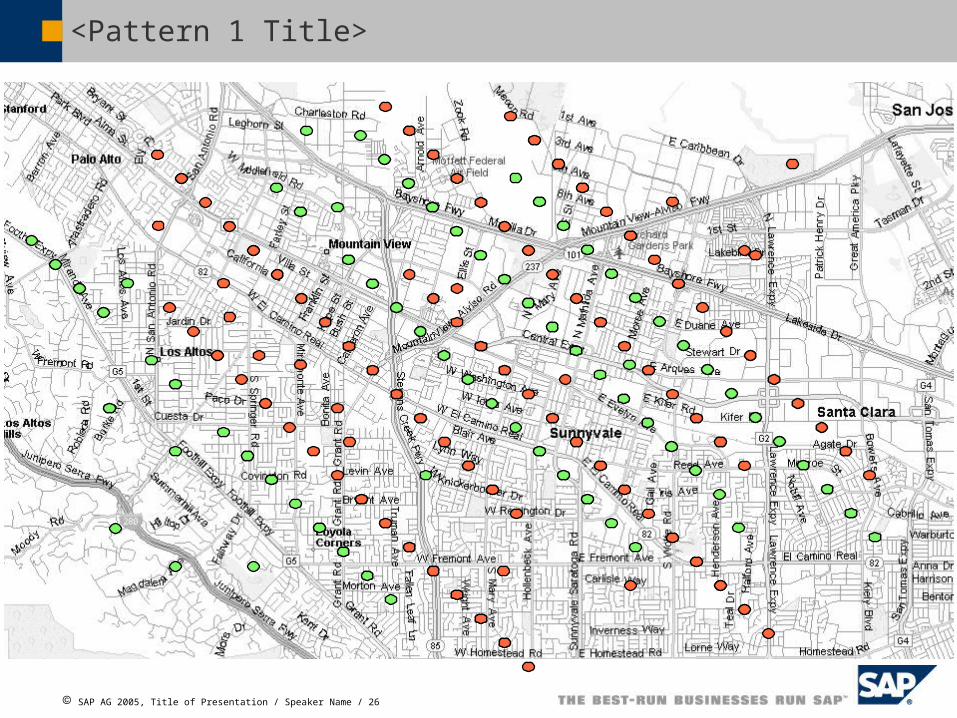
See items on the map and get details
See items within a target area
Trigger activities on items
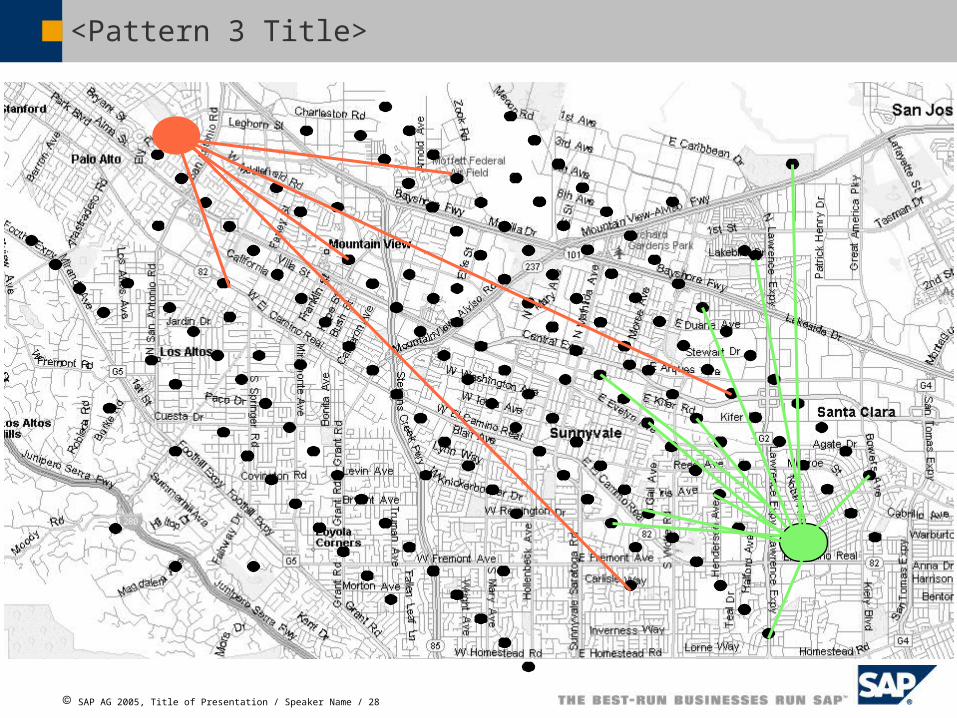
Show which items are related
Perform comparative time-based analytics
Analyze data across layers of items
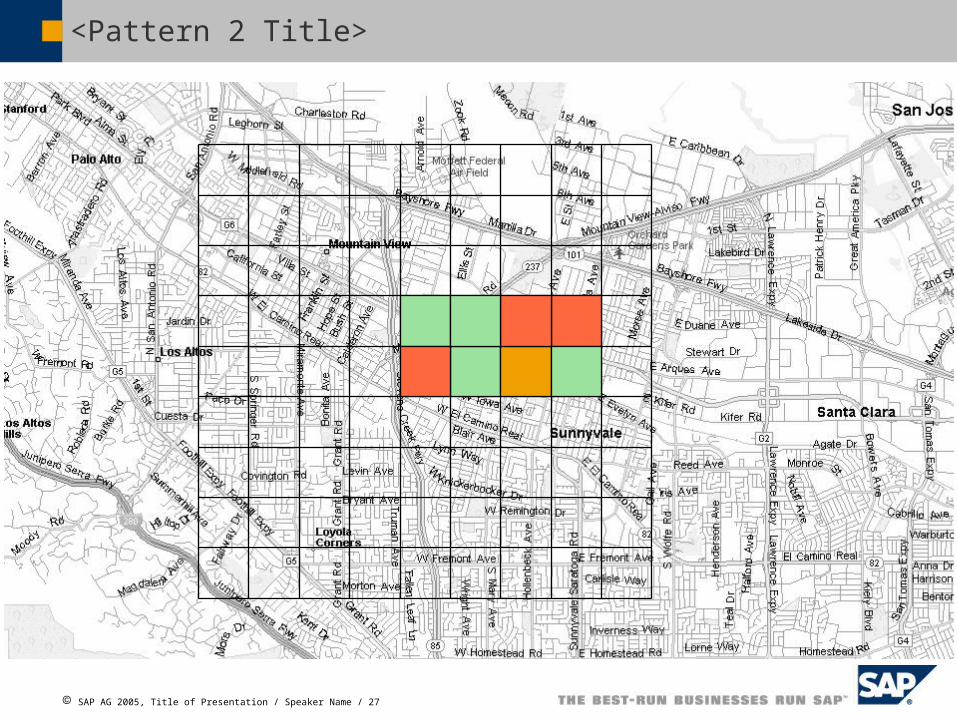
Show clusters of items
Change the attributesof an item
Change location of an item
Find proximate items
Analyze where to reallocate resources
View locations of items against a satellite image
Do what-if scenarios for the placement of items
Find a route from A to B across networks
Find a route from A to B considering impedances
Described per Pattern
• Functionality…• User Benefits…• Configuration…• I/O Parameters…• Sample Uses…• Technical Consideration…• Used for Geo EAM Roles…
Widening the Prototype Impact: SAP Geo Patterns
SAP AG 2005, Title of Presentation / Speaker Name / 26
<Pattern 1 Title>
SAP AG 2005, Title of Presentation / Speaker Name / 27
<Pattern 2 Title>
SAP AG 2005, Title of Presentation / Speaker Name / 28
<Pattern 3 Title>
SAP AG 2005, Title of Presentation / Speaker Name / 29
<Pattern 3 Title> - Details
Functionality Xxx
User Benefits Xxx
I/O Parameters Input
Xxx Output
Xxx
Sample Uses Xxx
Technical Considerations Xxx
Use for Geo EAM Roles <Supervisor, Field Crew>
SAP AG 2005, Title of Presentation / Speaker Name / 30
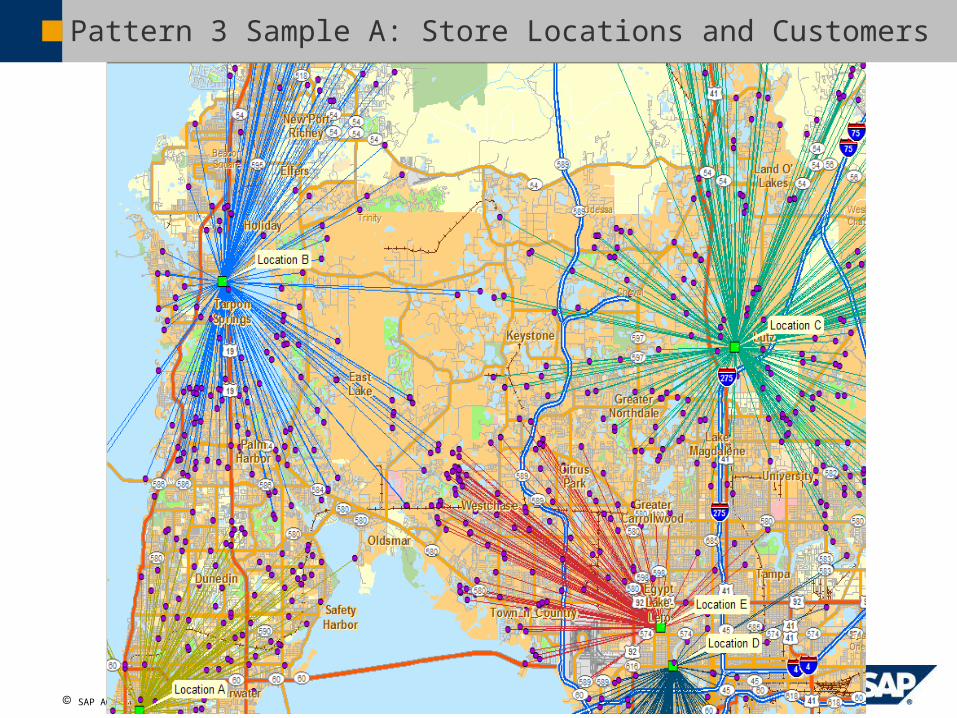
Pattern 3 Sample A: Store Locations and Customers
SAP AG 2005, Title of Presentation / Speaker Name / 31
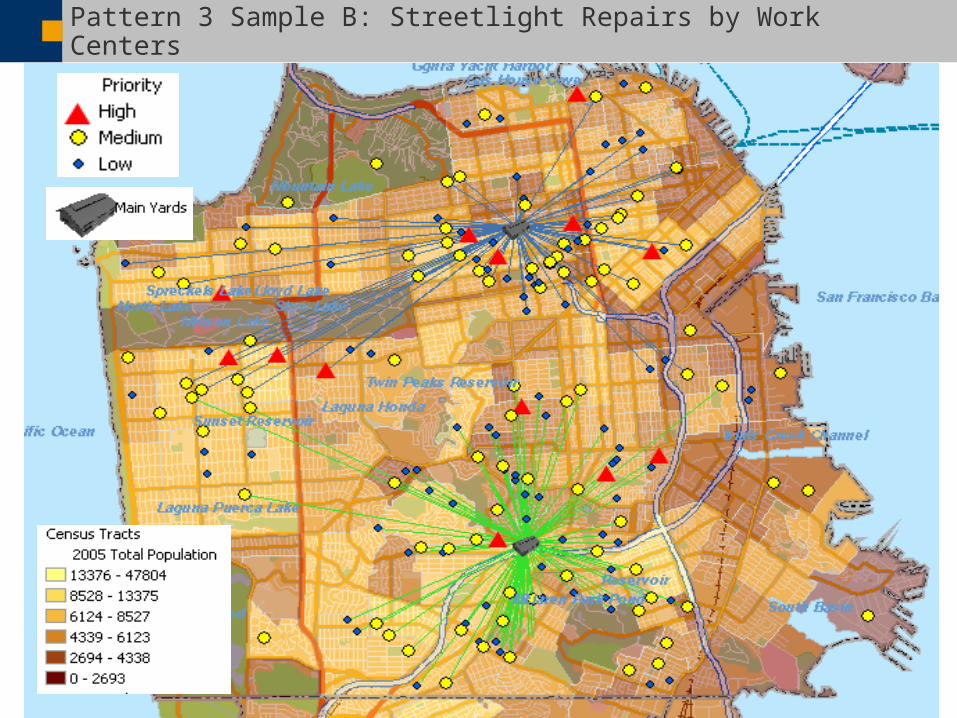
Pattern 3 Sample B: Streetlight Repairs by Work Centers