Embed Size (px)
Citation preview

Status and Trends in the Voluntary Market (2019 data)
Jenny Heeter, NRELEric O’Shaughnessy, Clean Kilowatts LLC
Renewable Energy Markets ConferenceSeptember 23, 2020

NREL | 2
The Big Picture
In 2019, about 7.8 million customers procured about 164 million MWh of renewable energy through green power markets.
That represents about:
1 in 20U.S. retail electricity customers
4%of U.S. retail electricity sales
32% of U.S. non-hydro renewable energy
generation
Total green power sales 2010-2019 (million MWh)

NREL | 3
Green Power Sales and Customers by Mechanism
In 2019, the most voluntary sales were via unbundled RECs, while the most customers were via community choice aggregation (CCA) programs.
Notes: “PPA” is a power purchase agreement. Utility contracts have a small number of customers (<25) so are not visible on the figure.

NREL | 4
Voluntary Sales Increased the Fastest in CCAs and PPAs
38% increase in 2019
33% increase in 2019
Notes: Figures use different Y-axes

NREL | 5
Participation in CCAs Continues to Increase
40% increase in 2019
Notes: Figures use different Y-axes

Voluntary Market Trends by Market Segment

NREL | 7
Utility Green Pricing TrendsAbout 1,082,000 customers procured about 11.1 million MWh of renewable energy through utility green pricing programs in 2019. According to NREL’s estimates, 2019 marks the first year where more than 1 million customers participated in utility green pricing programs.

NREL | 8
Utility Green Power Programs are Diversifying
Premium Products• Utility green pricing programs have
evolved significantly over the past decade.
• Many utilities now offer multiple products with different characteristics, such as relatively low-cost products derived from regional wind projects as well as premium products derived from local solar.
• Premium products have been popular despite their higher costs, suggesting that many customers are willing to pay for products based on premium resources such as local solar.
Community Renewables• Several utilities have begun to offer
community solar and community wind products where subscribers receive the RECs associated with their projects. Contract structures for these utility-led community renewables programs vary, with some resembling conventional utility green pricing programs to different degrees.
• In 2019, we estimate that about 13,000 customers bought about 430,000 MWh from these utility-led community renewables programs. For simplicity, we have included these estimates in the utility green pricing category.
NREL | 9
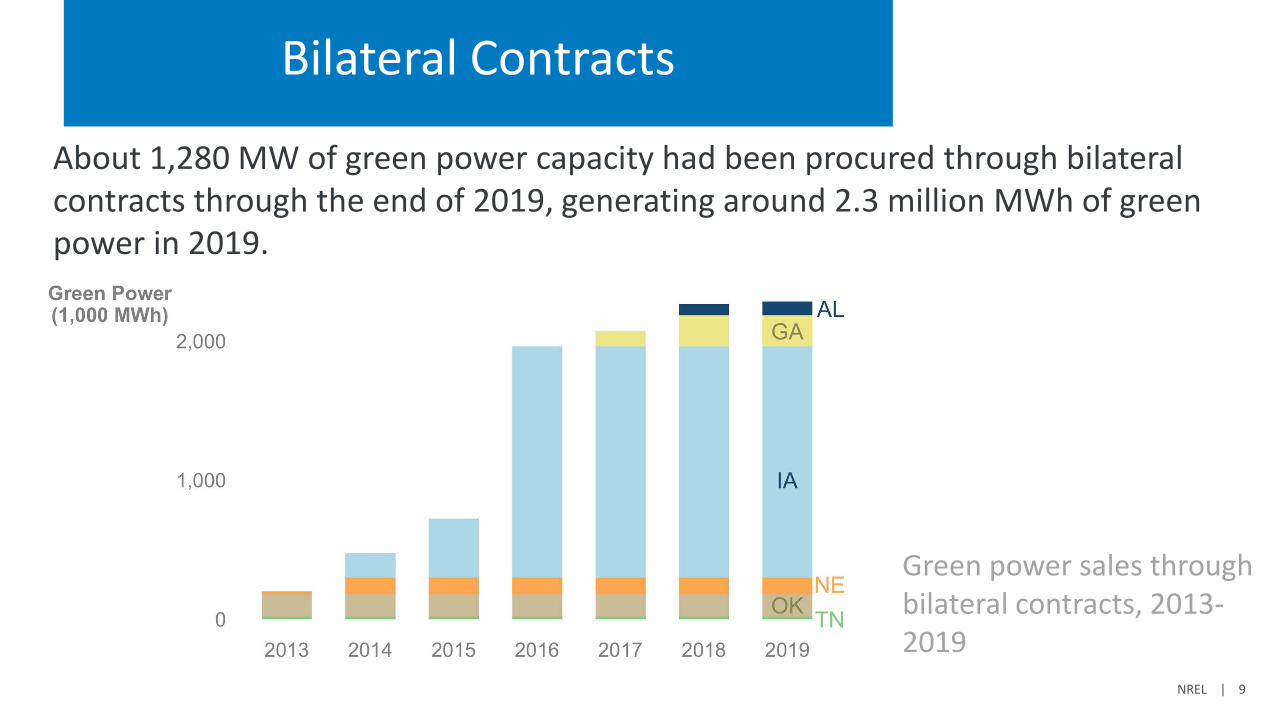
Bilateral Contracts
About 1,280 MW of green power capacity had been procured through bilateral contracts through the end of 2019, generating around 2.3 million MWh of green power in 2019.
Green power sales through bilateral contracts, 2013-2019

NREL | 10
Utility Green Tariffs
About 3,600 MW of green power capacity had been procured through utility green tariffs by the end of 2019, generating around 2.1 million MWh in 2019.
Green power sales through utility green tariffs, 2015-2019
NREL | 11
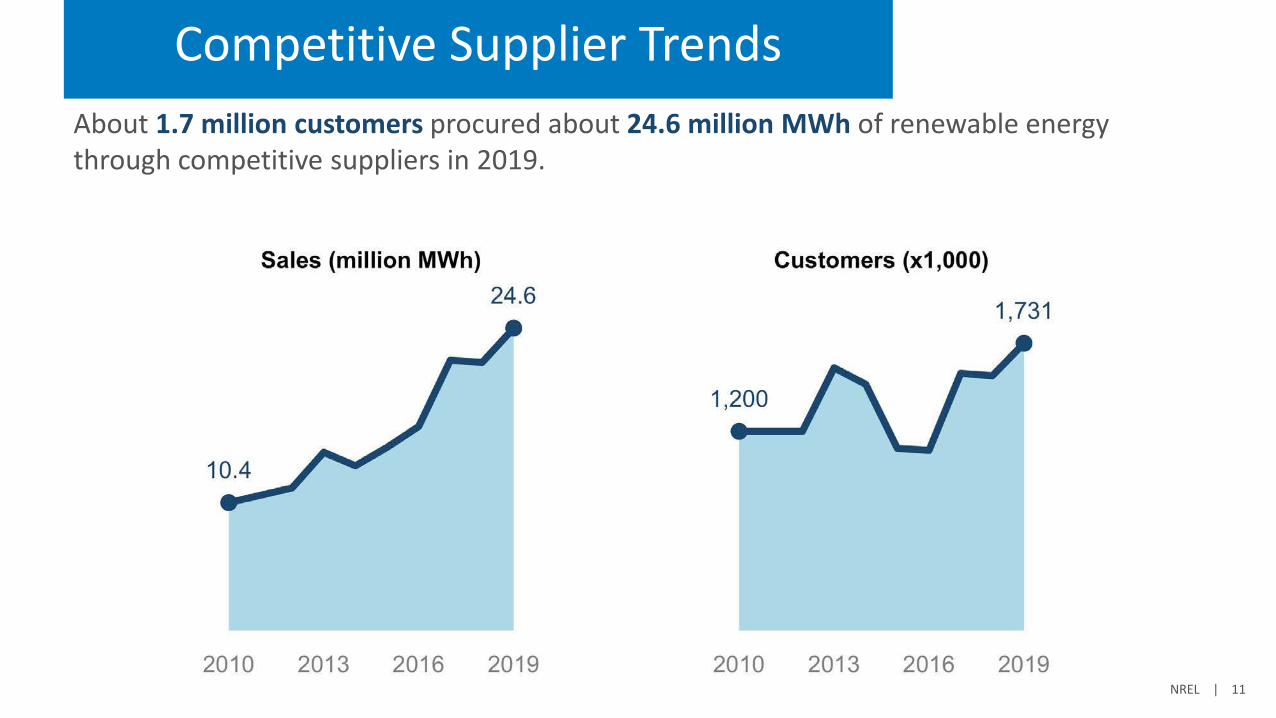
Competitive Supplier TrendsAbout 1.7 million customers procured about 24.6 million MWh of renewable energy through competitive suppliers in 2019.

NREL | 12
Increasing Interest in Green Competitive Supplier Products?
• Data on from the U.S. Energy Information Administration suggest that competitive suppliers offering green power products as their standard options have increased sales more rapidly than other suppliers in recent years.
• These trends could suggest that customers are switching more frequently to suppliers that offer opt-in or default green power products.
Note: EIA data are lagged each year, so that NREL’s estimates are similarly lagged. The increase in estimated green power sales from 2018 to 2019 largely reflects the increase in competitive supplier sales in the EIA data from 2017 to 2018, as depicted in the bottom pane of the figure on this slide.
Total competitive supplier sales by supplier product
types, 2014-2018, based on data from the U.S. EIA.

NREL | 13
Unbundled RECsAbout 197,000 customers procured about 68.7 million MWh of renewable energy through unbundled RECs in 2019.

NREL | 14
Unbundled REC Pricing
• National unbundled REC pricing typically tracks pricing in ERCOT
• Pricing has been under $1/MWh for more than 5 years until an upshoot in Summer 2020
• The increase in pricing in Summer 2020 correlated with increased demand, but the cause of the increase is not clear
• Will pricing impact purchases in 2020? Source: Karbone (2020)

NREL | 15
CCA TrendsAbout 4.7 million customers procured about 13.1 million MWh of renewable energy through CCAs in 2018. Participation in CCAs grew by about 40% from 2018 to 2019 due mostly to the ongoing expansion of CCAs in California.

NREL | 16
CCAs in California
• California continues to drive increasing CCA sales and participation.
• According to preliminary EIA estimates, the percentage of customers served by CCAs in California increased from just 3% in 2016 to about 25% in 2019.
• Importantly, while more than 4 million customers participate in CCAs in California, most of these customers buy default CCA portfolios, which generally supply more renewable energy than what is required by RPS, but do not provide 100% green power.
Areas currently served by and considering CCAs. Map modified from CalCCA (2019).
NREL | 17
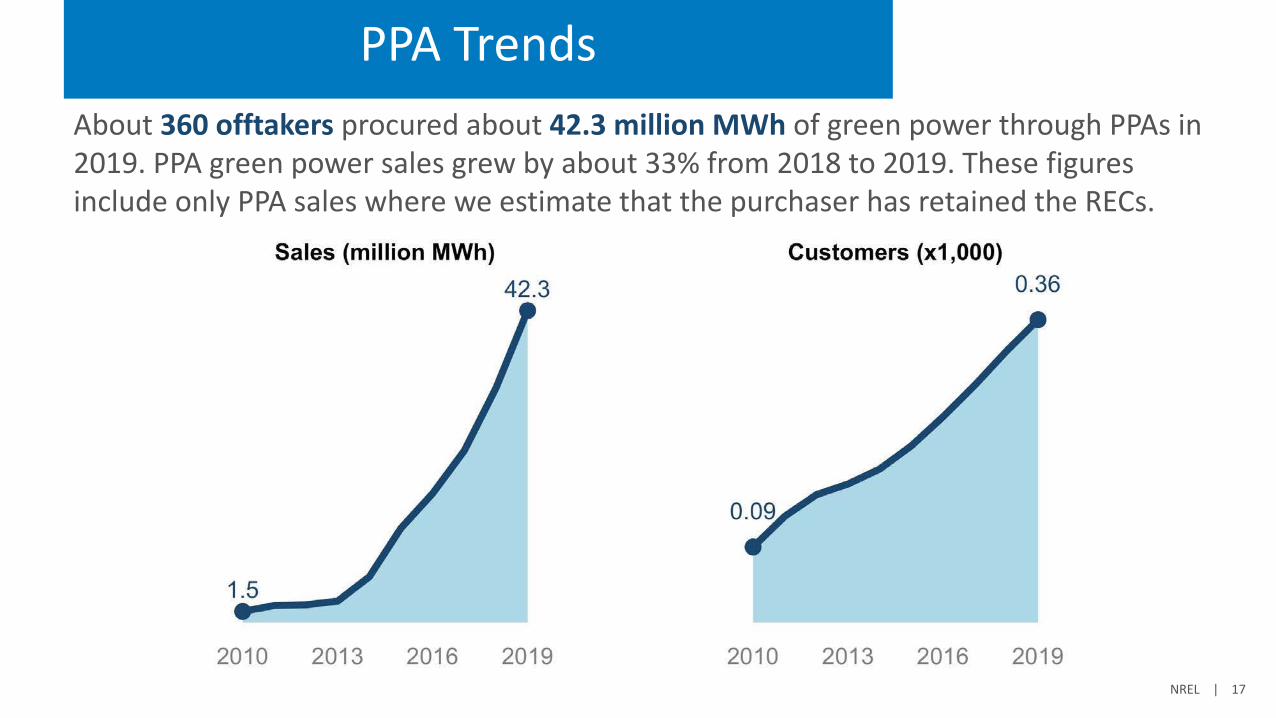
PPA TrendsAbout 360 offtakers procured about 42.3 million MWh of green power through PPAs in 2019. PPA green power sales grew by about 33% from 2018 to 2019. These figures include only PPA sales where we estimate that the purchaser has retained the RECs.

NREL | 18
Tech, Communications, and Consumer Staples Dominate PPAs
• PPAs continue to be dominated by tech, communications, and consumer staples companies.
• More than 25 companies have signed PPAs for more than 100 MW.
• PPAs are increasingly being signed outside of RPS markets.
42%
15%9%
8%
6%
5%
5%4% 2% 2%
1% 1% TechnologyCommunicationsConsumer StaplesFood & BeverageOil & GasConsortiumManufacturingAutomobileReal EstateMUSHOtherFinancial
NREL | 19
Concluding Market Insights
• Large customers are continuing to diversify their renewable energy and carbon reduction objectives.– RE100, 24x7, carbon negative
• Large customers are interested in bringing along smaller companies and even residential customers. – Green tariff design, opening up new supply options,
helping smaller companies understand PPAs• Product design continues to evolve and blur standard product
definitions.– Green tariffs, community renewables, green pricing

20
NREL’s Voluntary Market Research
https://www.nrel.gov/analysis/green-power.html
Contact information:Jenny HeeterSenior Energy AnalystNational Renewable Energy Laboratory
NREL has developed a comprehensive list of renewable energy procurement options available by utility and municipality nationwide.
Status and Trends in the U.S. Voluntary Green Power Market (2018 Data)This slide deck summarizes trends in the market, including customer and sales numbers.
Status and Trends in the U.S. Voluntary Green Power Market (2017 Data)The latest full technical report of NREL's annual tracking of the voluntary market products, customers, and sales.
Community Choice Aggregation: Challenges, Opportunities, and Impacts on Renewable Energy MarketsThis report explores the emergence of community choice aggregation, an energy procurement model that puts communities in control of their electricity supply. It features data on community choice aggregation voluntary green power sales and impacts on voluntary green power markets.
Existing and Potential Corporate Off-Site Renewable Procurement in the SoutheastThis project assesses the market for off-site PV in the Southeast, based on projected corporate load, corporate renewable goals for load in the Southeast, solar economics relative to utility rates, presence of a viable PV purchasing method, and other factors. The project team gathered data directly and indirectly from corporations, higher education institutions, and cities and counties with renewable energy targets. State summaries are available for Alabama, Florida, Georgia, Mississippi, North Carolina, South Carolina, and Tennessee.

www.nrel.gov
This work was authored by the National Renewable Energy Laboratory, operated by Alliance for Sustainable Energy, LLC, for the U.S. Department of Energy (DOE) under Contract No. DE-AC36-08GO28308. Funding provided by the U.S. Department of Energy Office of Energy Efficiency and Renewable Energy Office of Strategic Priorities and Impact Analysis Office . The views expressed in the article do not necessarily represent the views of the DOE or the U.S. Government. The U.S. Government retains and the publisher, by accepting the article for publication, acknowledges that the U.S. Government retains a nonexclusive, paid-up, irrevocable, worldwide license to publish or reproduce the published form of this work, or allow others to do so, for U.S. Government purposes.
NREL/PR-6A20-77915