Embed Size (px)
Citation preview
Reorganization of the Dendritic Trees of Oxytocin and VasopressinNeurons of the Rat Supraoptic Nucleus during Lactation
Javier E. Stern and William E. Armstrong
Department of Anatomy and Neurobiology, College of Medicine, University of Tennessee, Memphis, Tennessee 38163
Oxytocin (OT) and vasopressin (VP) release from the neurohy-pophysis are correlated with the electrical activity of magnocel-lular cells (MNCs) in the supraoptic (SON) and paraventricularnuclei. Synaptic inputs to MNCs influence their electrical activ-ity and, hence, hormone release. During lactation OT neuronsdisplay a synchronized high-frequency bursting activity preced-ing each milk ejection. In parallel to the adoption of this patternof electrical activity, an ultrastructural reorganization of the SONhas been observed during lactation. In the present study weperformed a light microscopic, morphometric analysis of iden-tified OT and VP neurons in the SON to determine whether thedendrites of these neurons participate in the plasticity observedduring lactation. The dendritic trees of OT neurons shrunkduring lactation (;41% decrease in the total dendritic length)because of a decreased dendritic branching concentrated at a
distance of 100–200 mm from the soma. No changes in themaximal distal extension were observed. The distribution pat-tern of dendritic length into branch orders also was affected.Strikingly, opposite effects were observed in VP neurons. Thedendritic trees during lactation elongated (;48% increase inthe total dendritic length) because of an increased branchingclose to the soma. No changes in the maximal distal extensionwere observed. These results indicate that the length and ge-ometry of the dendritic trees of OT and VP neurons are alteredin opposite ways during lactation. These changes would influ-ence the availability of postsynaptic space and alter the elect-rotonic properties of the neurons, affecting the efficacy of syn-aptic inputs.
Key words: oxytocin; vasopressin; supraoptic; lactation; mor-phometry; dendrites
The hypothalamic supraoptic nucleus (SON) contains magnocel-lular neurosecretory cells (MNCs) that synthesize the neurohy-pophysial hormones oxytocin (OT) and vasopressin (VP). Theseneurons send their axons to the neural lobe, where hormones arecarried by anterograde axonal transport and released in responseto physiological stimuli such as dehydration, parturition, andlactation.
A morphological plasticity has been observed in the SONduring conditions of high hormonal demand (for review, seeHatton, 1990; Theodosis and Poulain, 1993). These dynamicchanges include both neuronal–glial remodeling as well as syn-aptic rearrangement. An increase in the amount of somasomaticapposition, dendritic bundling, double synapses, and dye-couplinghas been observed in SON neurons during late pregnancy, par-turition, and lactation (Hatton et al., 1987; Hatton, 1990). Thesechanges occur on a minute-to-hour time scale and reverse on theremoval of the activating stimuli. Furthermore, a rearrangementof SON synaptic inputs involving an increment of both GABAer-gic (Gies and Theodosis, 1994) and glutamatergic innervation (ElMajdoubi et al., 1996) also has been described, yet it has not beeninvestigated in detail whether the dendritic trees of MNCs alsoundergo plastic changes during lactation. Changes in the size andbranching patterns of the dendritic trees could effectively alter the
electrotonic and thus the integrative properties of MNCs and alsowould place limitations on the available postsynaptic space.
The objectives of the present study were to characterize quan-titatively the dendritic trees of SON OT and VP neurons todetermine whether their structure is altered during lactation.Neurons from virgin diestrous and lactating rats were recordedwith intracellular electrodes, labeled with neurobiotin, and recon-structed in three dimensions for morphometric analysis. Ourresults indicate that significant and opposite changes were ob-served in OT and VP neurons: the dendritic arborization wasreduced and enlarged in OT and VP neurons, respectively, duringlactation. How these changes might affect the integrative proper-ties and the physiological responses of these neurons is discussed.
Some of these results have appeared in abstract form (Sternand Armstrong, 1996b).
MATERIALS AND METHODSExplant preparation. Female virgin diestrous rats (assessed by vaginalsmear the morning of the experiment) and lactating albino rats (200–390gm; Holtzman, Harlan Laboratories, Indianapolis, IN) that had suckledat least 10 pups for 8–14 d were used as subjects. The rats wereanesthetized with sodium pentobarbital (50 mg/kg, i.p.) and perfusedthrough the heart with cold medium in which NaCl was replaced by anequiosmolar amount of sucrose (see Aghajanian and Rasmussen, 1989).A ventral hypothalamic explant was removed and placed in an incubationchamber, as described previously (Smith and Armstrong, 1990). Theincubation medium consisted of (in mM): 25 NaHCO3 , 3 KCl, 1.24NaH2PO4 , 124 NaCl, 10 glucose, 2 CaCl2 , 1.3 MgCl2 , 0.2 ascorbic acid,and 0.2 thiourea. The medium was saturated with 95% O2 /5% CO2 , witha pH of 7.3–7.4 and an osmolality of 290–300 mOsm/kg H2O; it waswarmed to 32–34°C. All chemicals, unless otherwise stated, were pur-chased from Sigma (St. Louis, MO).
Electrophysiology. Intracellular recordings, signal digitization, and dataanalysis were made as previously described (Smith and Armstrong, 1990;Armstrong et al., 1994). Briefly, intracellular recording electrodes (100–150 MV) were pulled from 1.5 mm glass pipettes on a Sutter horizontal
Received Sept. 24, 1997; revised Nov. 6, 1997; accepted Nov. 10, 1997.This work was supported by National Institutes of Health Grant NS23941 to
W.E.A. and by the Neuroscience Center for Excellence in the Department ofAnatomy and Neurobiology, University of Tennessee, Memphis, TN. We thank Mr.Emin Kuliyev and Mr. Daniel Keuter for valuable technical assistance and Dr.Charles Wilson for commenting on this manuscript.
Correspondence should be addressed to Dr. Javier E. Stern, Department ofAnatomy and Neurobiology, College of Medicine, University of Tennessee, 855Monroe Avenue, Memphis, TN 38163.Copyright © 1998 Society for Neuroscience 0270-6474/98/180841-13$05.00/0
The Journal of Neuroscience, February 1, 1998, 18(3):841–853
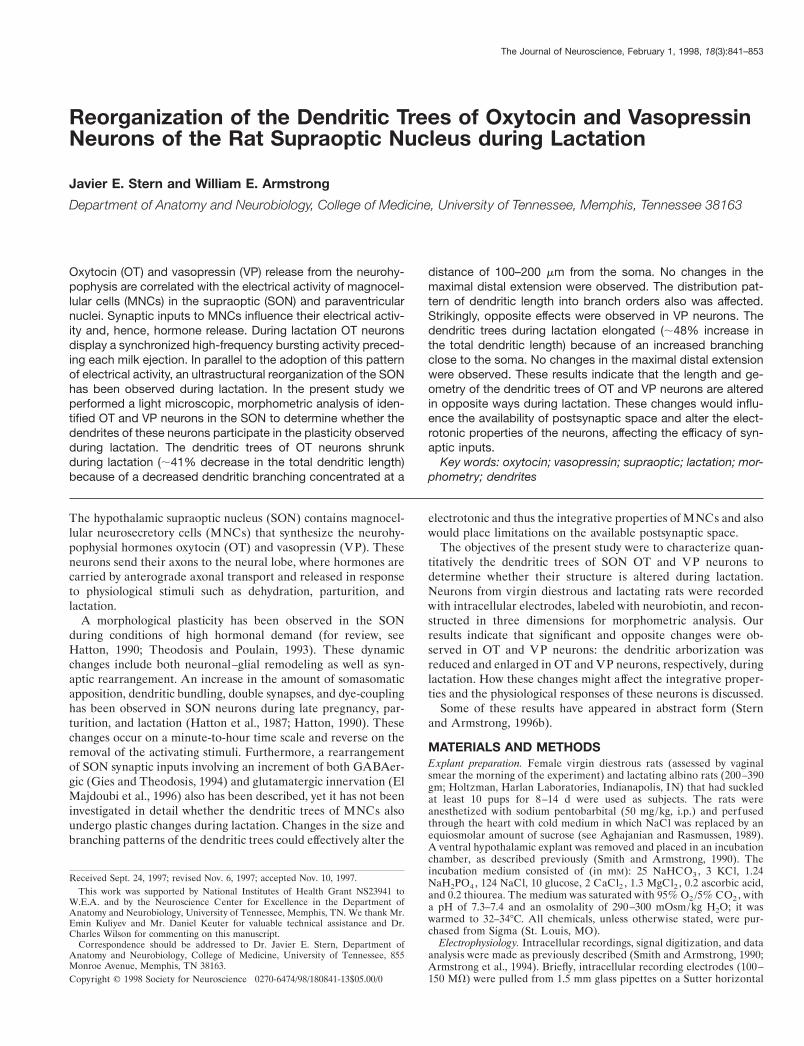
puller (Novato, CA). Recordings were obtained with the use of a Neu-rodata amplifier. Traces were acquired digitally, using the LabmasterTL-1 in conjunction with pClamp 6 software (Axon Instruments, FosterCity, CA). All neurons included in the analysis had membrane potentialsof 250 mV or more negative and action potentials of at least 155 mV. Tounveil the presence of the sustained outward rectification (SOR) andrebound depolarization (RD) (electrophysiological properties specific toOT, but not VP, neurons), we current-clamped neurons at a depolarizedmembrane potential (range, 240 to 250 mV), and subjected them toincreasing hyperpolarizations lasting 1.5 sec [see Stern and Armstrong(1995, 1977) for a detailed characterization of the SOR and RD]. Asshown in the examples of Figure 1 B, when OT, but not VP, neurons werecurrent-clamped at depolarized membrane potentials and subjected tohyperpolarizing pulses, a depolarizing sag to the voltage trajectory,followed by a rebound depolarization at the offset of the pulse, wasobserved. Current–voltage (I/V ) plots were generated by passing 180msec pulses through the electrode. Membrane resistance was taken as theslope of a linear regression measured at the linear part of the curve.Membrane time constant was estimated by exponential fits of the voltagetransient generated from a current pulse sufficient to hyperpolarize themembrane 10–15 mV from rest.
Intracellular labeling, histology, and neuron reconstruction. For intracel-lular labeling, microelectrodes were filled with 1–2 M potassium acetatecontaining 2% N-(2-aminoethyl) biotinamide (neurobiotin, Vector Labs,Burlingame, CA) (Kita and Armstrong, 1991). Intracellular injectionswere made with 200 msec, 10.5 nA rectangular pulses at 1 Hz for at least20 min. After the recording session the explants were fixed in 4%paraformaldehyde and 0.2% picric acid overnight at 4°C. Horizontalsections (100 mm) were cut on a vibratome, rinsed in PBS, and incubatedovernight in avidin–biotin complex (ABC, Vector Labs) diluted 1:100 inPBS containing 0.5% Triton X-100. After a thorough rinsing in PBS, thesections were reacted with diaminobenzidine tetrahydrochloride (60 mg/100 ml) in the presence of H2O2 (0.006%) and nickel ammonium sulfate(0.05%) for 10–20 min, rinsed, mounted on gelatin-coated glass slides,dried for 24 hr, and coverslipped with Permount.
Labeled neurons were reconstructed from serial sections with a draw-ing tube attached to a Nikon Optiphot microscope, reduced by photo-copy, and scanned at 300 dpi (Hewlett Packard Scan Jet IIcx) forplacement in figure layouts. Micrographs of filled neurons were captureddigitally with a Kodak 460 camera (frame resolution, 2000 3 3000 pixels).Photo montages were constructed with Adobe Photoshop and printed toa Tektronic Phaser 440 color printer at 300 dpi. Software tools were usedto adjust brightness and to blend borders that were created from cuttingand pasting across focal planes.
For a morphometric analysis of the dendritic trees, neurons were
reconstructed in three dimensions, using a computer-aided tracing system(Neurolucida, Microbrightfield, Colchester, VT). The detailed recon-struction of the dendrites was made with a 403 objective. In this systemthe course of each dendrite was traced by digitizing the x , y, and zcoordinates and the width of the dendrite along its entire extent. Alldendrites used for analysis were filled completely to their apparentnatural endings. Analysis software allowed various numeric and graphi-cal representations of the dendritic trees (see below). Computer-aidedreconstruction of each neuron was made blind by using a code that wasnot broken until statistical comparisons were made.
Nomenclature and analysis of anatomical data. The terminology used inthis study follows that of Ohara and Havton (1994) and is illustrated inFigure 1 A. Dendrites branch at branching points or nodes. In the presentstudy all of recorded nodes gave rise to two daughter branches (e.g.,dichotomous branching). Thus, branches as used herein correspond tosegments in other nomenclatures (Sadler and Berry, 1988). The termi-nation of a dendrite is called an ending. Branches originating from thelast node and terminating in an ending are called terminal branches(TBs), whereas branches between two branching points or between thesoma and one branching point are called preterminal branches (PTBs).The portion of a dendrite from its origin at the soma to the first node iscalled a first order branch or primary dendrite. The daughter branchesarising from the first node are second order branches, and so on. The
Table 1. Surface area, long axis, and short axis of OT and VP somataof diestrous and lactating female rats
Long axis(mm)
Short axis(mm)
Surface area(mm2)
OT-diestrous 25.7 6 1.3 15.9 6 1.1 1143.0 6 111(10) (10) (10)
OT-lactating 29.6 6 2.1 17.5 6 1.4 1456.6 6 162(10) (10) (10)
VP-diestrous 24.6 6 1.8 15.9 6 1.2 1113.7 6 79(10) (10) (10)
VP-lactating 31.5 6 2.1* 17.0 6 0.9 1495.2 6 99**(13) (13) (13)
Shown are the means 6 SEM, with the number of neurons in parentheses. SeeMaterials and Methods for a detailed description of the calculation of the surfacearea. *p,0.05 and **p,0.01 as compared with VP-diestrous neurons (Student’s ttest).
Figure 1. Electrophysiological characterization of OT and VP neurons. A, Electrical recordings characteristic of an OT (dark trace) and a VP ( graytrace) neuron. When neurons were current-clamped at depolarized membrane potentials, OT neurons were characterized by the presence of a sag duringsmall hyperpolarizations (open arrow), followed by a rebound depolarization that produced spikes ( filled arrow) at the offset of the pulses. On the otherhand, VP neurons lacked a strong sag and exhibited no rebound depolarization. Traces shown are averages (n 5 3). B, Nomenclature used to describedthe geometry of the dendritic trees of MNCs. Shown is an example of a soma with one tree displayed. Numbers represent dendritic branch order, filledcircles represent nodes (branching points), and dashed lines trace an example of a path length. TB, Terminal branch; PTB, preterminal branch; E, branchendings.
842 J. Neurosci., February 1, 1998, 18(3):841–853 Stern and Armstrong • Plasticity of OT and VP Neurons during Lactation
branches arising from a common first order branch constitute a dendritictree. The distance from the origin of a first order branch to the end pointof a terminal branch corresponds to a path length. The length, surfacearea, and volume of the dendritic branches were calculated by algorithmsprovided by Microbrightfield software. The surface area for each cell(assuming a prolate spheroid) was calculated as (p/2) (B 2 1 AB (arcsinE)/E), where eccentricity E 5 (A 2 2 B 2)1/2/A, and A and B equal the longand short Feret diameters, respectively (Russ, 1986). Global dendriticsize parameters such as total dendritic length (TDL), total number ofbranches, total number of endings, etc., were obtained by summing thedata for each dendritic tree. The mean dendritic length (MDL) is theaverage length of individual branches. In many cases these parameterswere analyzed as a function of the branch order. When dendrites branch,each branch may give rise to dendritic subtrees that are of different sizes.A quantitative measure of such branching asymmetry may be obtainedwith a subtree partition analysis (Van Pelt and Verwer, 1983) in whicheach tree is divided into two subtrees after the first node. The number ofterminal branches of the larger subtree is divided by the total number ofterminal branches of the entire tree to arrive at the subtree partition ratio.A value of near 0.5 indicates symmetric branching, whereas a valuetoward 1.0 is indicative of asymmetric branching. The concentric spheremethod of Sholl (Sholl, 1953) also was used to analyze branching patternsfor the dendritic trees. Briefly, concentric spheres of a constant intervalof 20 mm, with the center of the soma as the origin, were drawn for eachfilled neuron. The amount (length) of dendrite contained within eachcircle was counted, and the means and SEs were calculated and plottedas a function of the distance to the soma. The average dendritic diameterof each dendritic branch was back-calculated by using a standard formulafor calculating surface area (2prL) of a cylinder, where L is the length ofthe branch and r is the radius. The resolution of the system for diameterdetection with a 403 lens was 0.31 mm. For all quantitative analysis, datawere not corrected for tissue shrinkage (see Discussion). Because shrink-age occurred mainly in the z-plane (fixation to the slides prevents x–yshrinkage), we measured z-plane shrinkage for each cell and estimated itscontribution to TDL. Shrinkage accounted for a similar percentage
reduction of the TDL in all groups (OT-diestrous, 20.4 6 3.0%; OT-lactating, 22.2 6 3.1%; VP-diestrous, 23.4 6 2.4%; VP-lactating, 20.7 61.5%).
Statistical analysis. To assess a main effect of the cell type, the hor-monal state of the animal, or the existence of significant interactionsbetween these factors, we used a two-way ANOVA. Comparisons be-tween diestrous and lactating states within each cell type were made witha single Student’s t test. When multiple comparisons were needed, as inthe case of the analysis of various parameters as a function of the branchorder, a Tukey’s test was used. In most of the cases the mean of eachparameter was calculated for each neuron; for the statistical analysis, n 5the number of neurons. To compare the incidence of a dendritic versussomatic axonal origin, we arranged frequencies of observations in acontingency table and used x2 statistic for analysis (Zar, 1984). Allresults shown represent the mean 6 SEM.
RESULTSGeneral appearance of filled neuronsA total of 43 SON neurons obtained from diestrous (n 5 20) andlactating (n 5 23) rats was used in this study. Neurons wereclassified electrophysiologically as either OT (diestrous, n 5 10;lactating, n 5 10) or VP (diestrous, n 5 10; lactating, n 5 13) onthe basis of the presence or absence of the SOR and RD, asexplained in Materials and Methods (see Fig. 1B). Neuronssubsequently were filled with neurobiotin and reconstructed inthree dimensions for morphometric analysis. All filled neuronswere located within the boundaries of the SON. In six cases (twofrom diestrous and four from lactating rats), dye-coupled neuronswere encountered and discarded from the morphometric analysis.Figures 2–5 display drawings of camera lucida reconstructedneurons for each experimental group. Photomicrographs showing
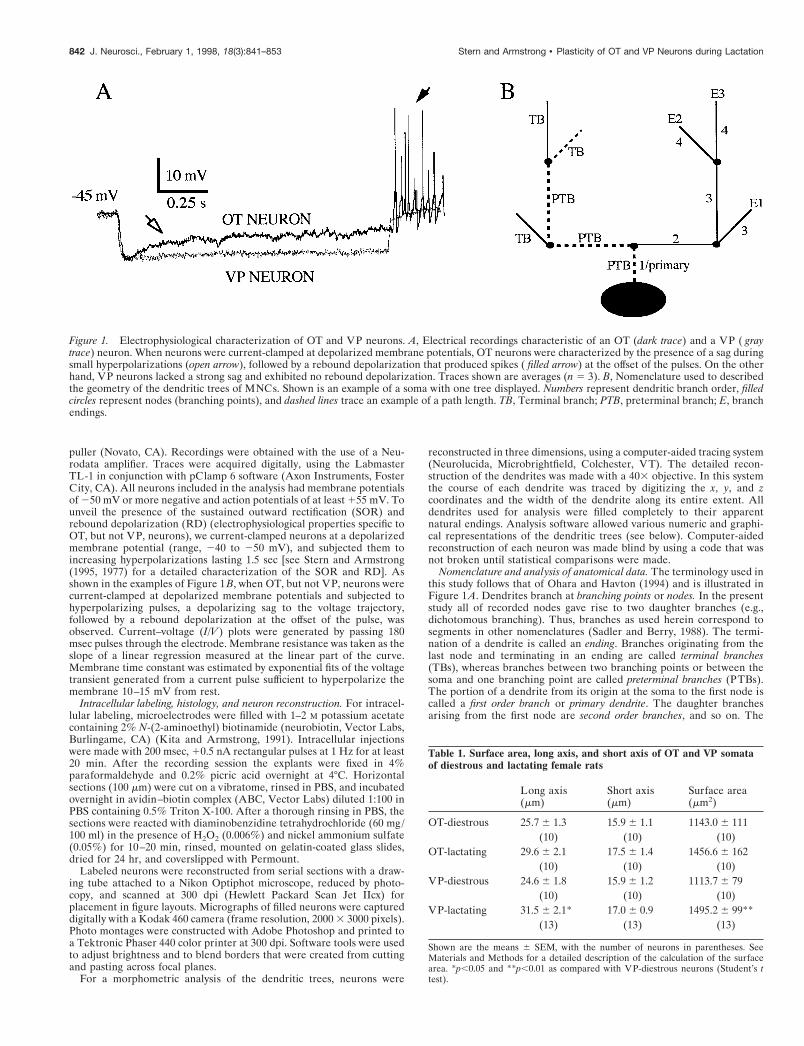
Figure 2. Morphological structure of OT neurons ob-tained from diestrous rats. A–C show representativedrawings of camera lucida reconstructed neurons. Ar-rows point to the axons. D, Dendrogram displaying thedendritic structure of the neuron shown in B.
Stern and Armstrong • Plasticity of OT and VP Neurons during Lactation J. Neurosci., February 1, 1998, 18(3):841–853 843
details of filled neurons are shown in Figure 6. In general, and inagreement with previous work (for review, see Armstrong, 1995),filled neurons had an oblong soma with mean long and short axesof 28.1 6 1.0 and 16.6 6 0.6 mm, respectively. Each SON neuronhad one to four primary dendrites, which usually coursed ven-trally toward the ventral glial lamina (Armstrong et al., 1982).SON dendrites were often varicose and relatively aspiny, althoughin some cases dendritic spinous processes of various shapes wereobserved (Fig. 6D,E).
Axons were identified by their dorsomedial trajectory withinthe explant and were cut artificially at its dorsal surface (Randleet al., 1986; Smith and Armstrong, 1990). In general, they had athinner diameter and beaded appearance (Fig. 6A). On average,the axonal length traced within the explant was 1185 6 146 mm.In 63% of the cases the axon arose directly from the soma (Fig.6B), whereas in the rest of the cases the axon arose from aprimary dendrite, at a mean distance from the soma of 37.4 6 7mm (Fig. 6C). No significant difference in the incidence of adendritic axonal origin was observed either as a function of thecell type (OT, 40%; VP, 35%; p . 0.1, x2 test) or the hormonalstate of the animals (diestrous, 45%; lactating, 30%; p . 0.1, x2
test).The general qualitative aspects of the dendritic trees of the
camera lucida reconstructed neurons, also exemplified in thedendrograms shown in Figures 2D–5D, suggest that considerablechanges in the arborization of the dendritic trees of these neuronsoccur during lactation. This was confirmed and studied in furtherdetail by a morphometric analysis (see below).
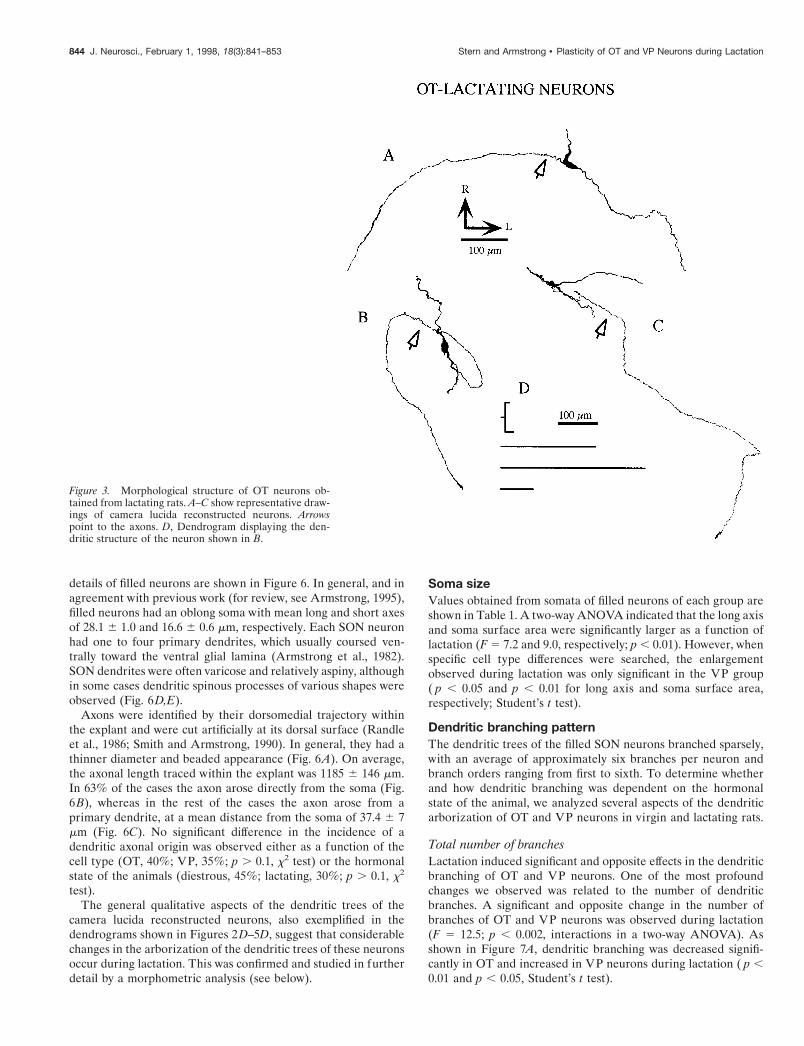
Soma sizeValues obtained from somata of filled neurons of each group areshown in Table 1. A two-way ANOVA indicated that the long axisand soma surface area were significantly larger as a function oflactation (F 5 7.2 and 9.0, respectively; p , 0.01). However, whenspecific cell type differences were searched, the enlargementobserved during lactation was only significant in the VP group( p , 0.05 and p , 0.01 for long axis and soma surface area,respectively; Student’s t test).
Dendritic branching patternThe dendritic trees of the filled SON neurons branched sparsely,with an average of approximately six branches per neuron andbranch orders ranging from first to sixth. To determine whetherand how dendritic branching was dependent on the hormonalstate of the animal, we analyzed several aspects of the dendriticarborization of OT and VP neurons in virgin and lactating rats.
Total number of branchesLactation induced significant and opposite effects in the dendriticbranching of OT and VP neurons. One of the most profoundchanges we observed was related to the number of dendriticbranches. A significant and opposite change in the number ofbranches of OT and VP neurons was observed during lactation(F 5 12.5; p , 0.002, interactions in a two-way ANOVA). Asshown in Figure 7A, dendritic branching was decreased signifi-cantly in OT and increased in VP neurons during lactation ( p ,0.01 and p , 0.05, Student’s t test).
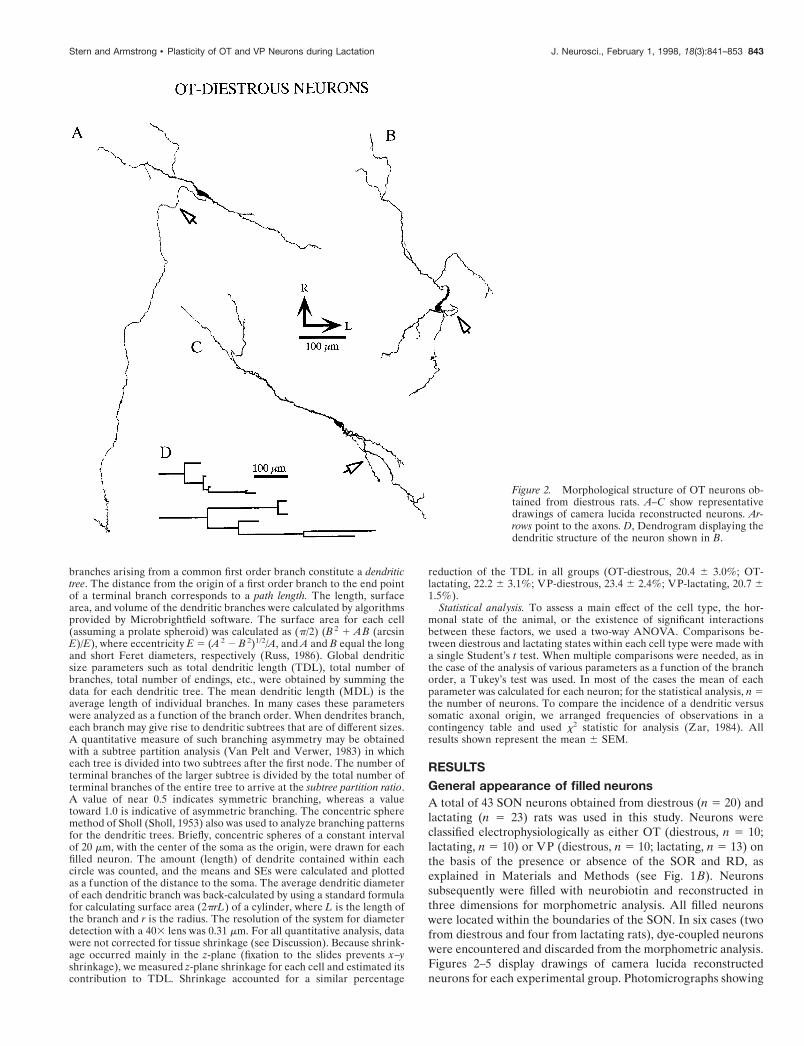
Figure 3. Morphological structure of OT neurons ob-tained from lactating rats. A–C show representative draw-ings of camera lucida reconstructed neurons. Arrowspoint to the axons. D, Dendrogram displaying the den-dritic structure of the neuron shown in B.
844 J. Neurosci., February 1, 1998, 18(3):841–853 Stern and Armstrong • Plasticity of OT and VP Neurons during Lactation
Frequency distribution of the branches into branch ordersTo determine whether the branching pattern also was affectedduring lactation, we studied the frequency distribution ofbranches into branch order. In OT neurons the mean frequency ofdendritic branches varied significantly as a function of the branchorder (F 5 25.2; p , 0.0001, two-way ANOVA) (Fig. 7B, lef tpanel). A post hoc analysis indicated that the decreased branchingchange observed during lactation was confined to the third den-dritic branch order ( p , 0.002, Tukey’s test). In VP neurons themean frequency of dendritic branches also varied significantly asa function of the branch order (F 5 15.8; p , 0.0001, two-wayANOVA) (Fig. 7B, right panel). The increased dendritic branch-ing observed during lactation was attributable both to a tendencyfor an increment of middle order branches (second and thirdorder) as well as to the addition of higher order branches, whichwere not present in diestrous rats.
Number and type of primary dendritesThe number of primary dendrites was increased significantlyduring lactation (F 5 5.0; p , 0.05, ANOVA) (Fig. 7C, lef t panel),although a post hoc test failed to reveal significant differencesbetween groups. When the proportions of branching versus bare(i.e., with no branches) primary dendrites were examined (Fig.7C, right panel), an opposite effect was observed in OT and VPneurons during lactation (F 5 6.9; p , 0.02, significant interac-tions in a two-way ANOVA). The percentage of bare primarydendrites increased in OT and decreased in VP neurons.
In accord with an increased number of branches and primarydendrites, the number of dendritic endings significantly increasedin VP neurons during lactation ( p , 0.01, Student’s t test) (Fig.
7A, right panel). On the basis of the less branching observed in OTneurons during lactation, a decreased number of endings wasexpected to occur in this group. Although a tendency for thiseffect was observed, the difference was not significant (Fig. 7A,right panel), probably because of the balancing effect of theincreased number of bare primary dendrites observed in thisgroup during lactation (Fig. 7C).
Branching symmetry: subtree partition analysisTo determine the degree of dendritic branching symmetry, e.g.,the distribution of branches between two subtrees emerging fromthe same primary dendrite, we performed a subtree partitionanalysis (Van Pelt and Verwer, 1983), and we compared the ratiosof terminal branches among groups (see Materials and Methods).The values obtained from the different groups were as follows:OT-diestrous, 0.58 6 0.03 (n 5 17); OT-lactating, 0.56 6 0.02(n 5 13); VP-diestrous, 0.59 6 0.03 (n 5 7); and VP-lactating,0.61 6 0.03 (n 5 20). These terminal ratio values indicate arelatively symmetric branching pattern in all groups. No signifi-cant differences were observed among groups ( p . 0.05, two-wayANOVA), indicating that the changes observed during lactationin both groups were distributed equally among dendritic trees.
Dendritic lengthChanges in the total and mean dendritic lengthduring lactationA significant and opposite change in the total dendritic length ofOT and VP neurons was observed during lactation (F 5 11.9; p ,0.002, interactions in a two-way ANOVA). The total dendriticlength (TDL) was decreased significantly in OT and increased in
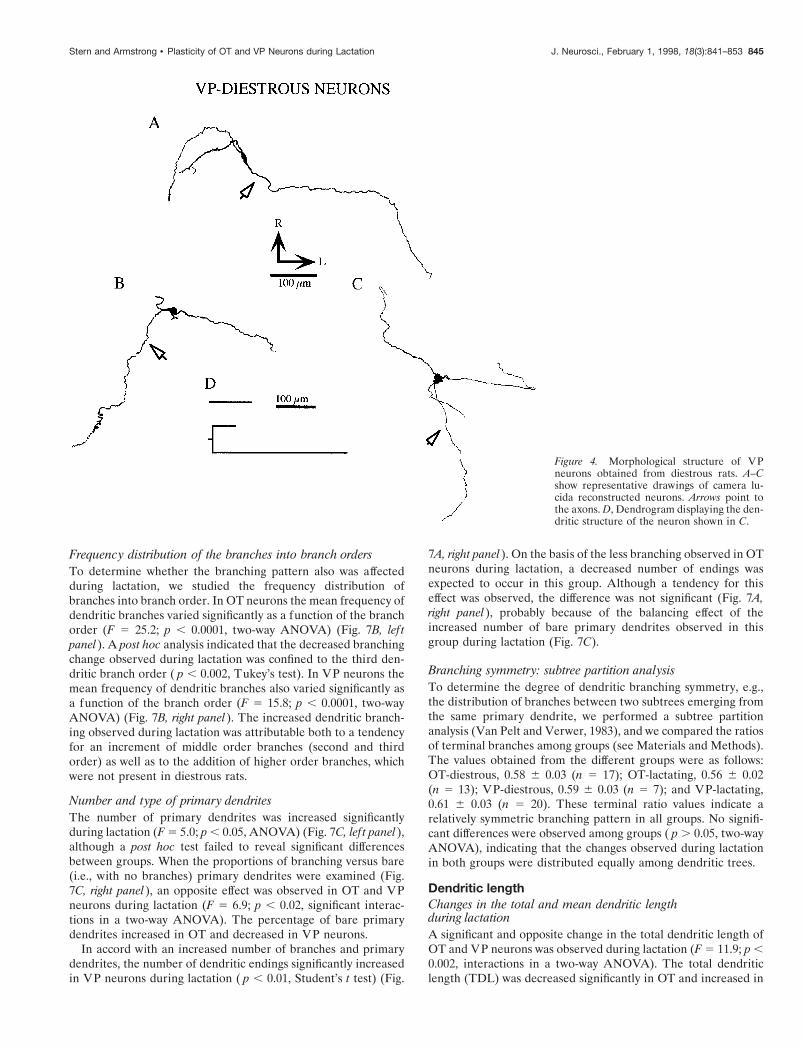
Figure 4. Morphological structure of VPneurons obtained from diestrous rats. A–Cshow representative drawings of camera lu-cida reconstructed neurons. Arrows point tothe axons. D, Dendrogram displaying the den-dritic structure of the neuron shown in C.
Stern and Armstrong • Plasticity of OT and VP Neurons during Lactation J. Neurosci., February 1, 1998, 18(3):841–853 845
VP neurons during lactation ( p , 0.02 and p , 0.05, respectively;Student’s t test) (Fig. 8A, lef t panel). On the other hand, the MDLof individual branches was not changed in either group (F 5 0.21;p . 0.05) (Fig. 8A, right panel). Thus, the changes observed in theTDL presumably reflect the decreased and increased number ofbranches observed during lactation in OT and VP neurons, re-spectively (see above).
Frequency distribution of the dendritic length intobranch ordersTo investigate in more detail the changes observed in dendriticlength, we analyzed the distribution of the TDL and MDL bybranch orders (Fig. 8B). In OT-diestrous neurons the TDL sig-nificantly varied as a function of the branch order (F 5 6.04; p ,0.002, one way ANOVA). A peak occurred at second orderbranches and accounted for ;50% of the TDL (Fig. 8B, top lef tpanel). The MDL of OT-diestrous neurons did not vary signifi-cantly as a function of the branch order, although a tendency forlonger second order branches was observed (Fig. 9B, bottom lef tpanel). The low numbers of events at higher branch orders pre-vented a statistical analysis of the data. During lactation OTneurons displayed a significant change in the pattern of dendriticlength distribution. The TDL of OT-lactating neurons also variedsignificantly as a function of the dendritic order (F 5 11.6; p ,0.0001, one way ANOVA), but in this case a progressive decreasein the length with increasing branch order was observed (Fig. 8B,top lef t panel). In this group most of the length was concentratedon primary dendrites (;54%). As in the case of OT-diestrousneurons, the MDL of OT-lactating neurons did not vary signifi-cantly as a function of the branch order, although primary den-drites tended to be the longest. In fact, when only the primary
dendrites were compared, we found an increased length duringlactation ( p , 0.02, Student’s t test) (see Fig. 8B, bottom lef tpanel). These results clearly show that, in addition to the changein the absolute amount of dendritic length observed during lac-tation, the branching pattern of OT neurons was affectedsignificantly.
For VP neurons, besides the addition of higher (fourth–sixth)branch orders during lactation, no significant differences wereobserved in the distribution pattern of the TDL and MDL (Fig.8B, right panels). The TDL significantly decreased with increasingbranch order in both groups (F 5 14.6 and F 5 9.4, p , 0.0001,one way ANOVA, for VP-diestrous and VP-lactating, respec-tively) (Fig. 8B, top right panel). Although a statistical analysiswas not applied because of low numbers of higher order branches,a similar pattern could be observed in the MDL.
Distribution of the dendritic length into terminal andpreterminal branchesThe effects of lactation on the dendritic arborization of MNCsdescribed above may result in changes in collateral branchingand/or be localized on terminal dendrites. To assess these possi-bilities, we analyzed the number and length of TBs and PTBs.The number of TBs and PTBs decreased and increased in OTand VP neurons, respectively (Fig. 9A) (significant interactions:F 5 11.9, p , 0.02 for TBs and F 5 11.1, p , 0.02 for PTBs,two-way ANOVA). In both cell types most of the dendritic lengthwas confined to TBs (OT-diestrous, 63.7 6 6.1%; OT-lactating,61.3 6 9.7%; VP-diestrous, 85.4 6 5.3%; VP-lactating, 74.6 66.0%). No significant differences among groups were observed.The TDL of TBs and PTBs decreased and increased in OT andVP neurons, respectively (Fig. 9B) (significant interactions: F 5
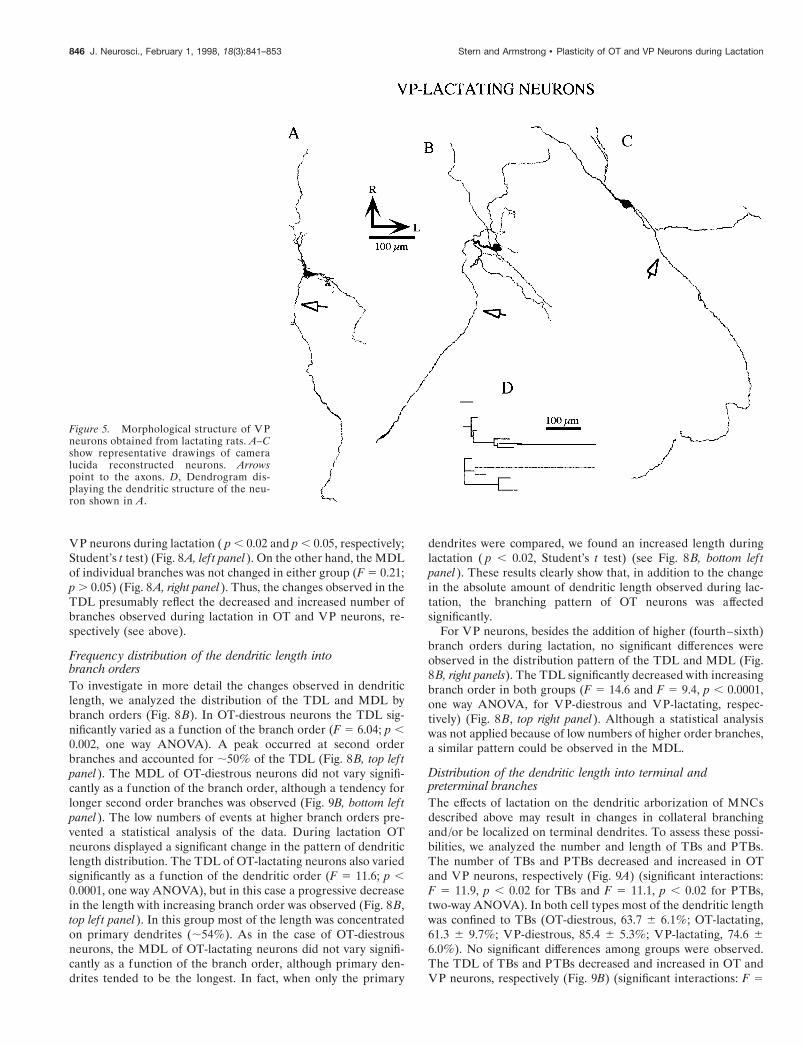
Figure 5. Morphological structure of VPneurons obtained from lactating rats. A–Cshow representative drawings of cameralucida reconstructed neurons. Arrowspoint to the axons. D, Dendrogram dis-playing the dendritic structure of the neu-ron shown in A.
846 J. Neurosci., February 1, 1998, 18(3):841–853 Stern and Armstrong • Plasticity of OT and VP Neurons during Lactation
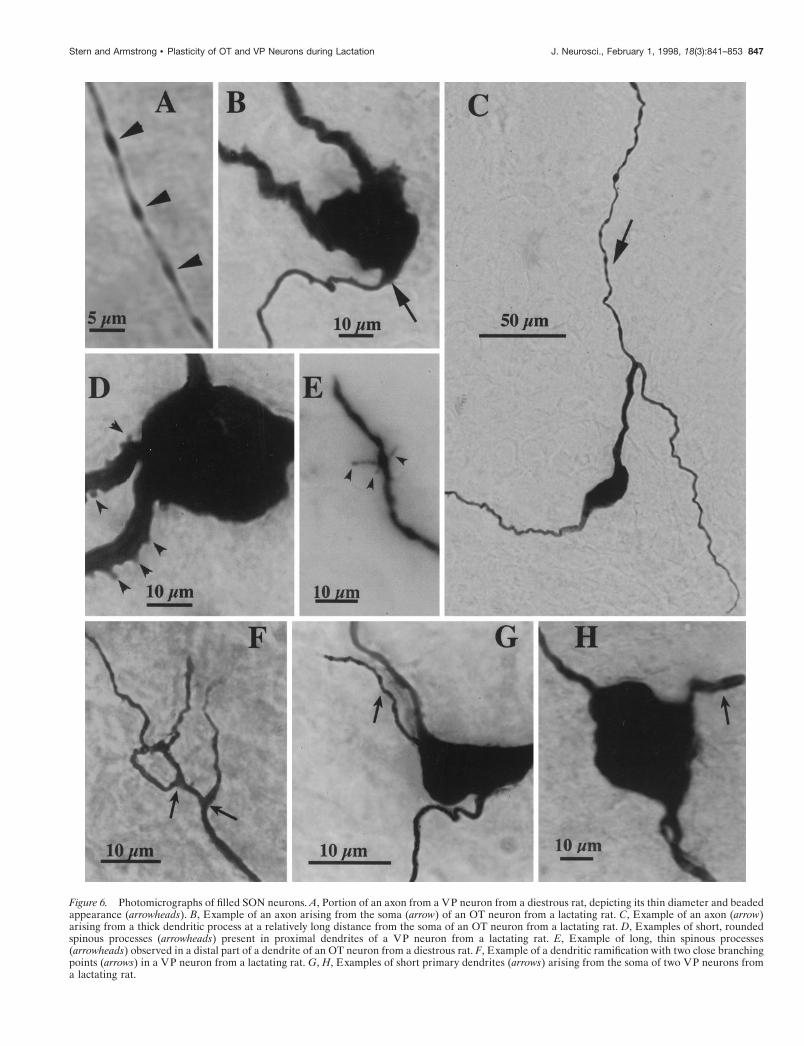
Figure 6. Photomicrographs of filled SON neurons. A, Portion of an axon from a VP neuron from a diestrous rat, depicting its thin diameter and beadedappearance (arrowheads). B, Example of an axon arising from the soma (arrow) of an OT neuron from a lactating rat. C, Example of an axon (arrow)arising from a thick dendritic process at a relatively long distance from the soma of an OT neuron from a lactating rat. D, Examples of short, roundedspinous processes (arrowheads) present in proximal dendrites of a VP neuron from a lactating rat. E, Example of long, thin spinous processes(arrowheads) observed in a distal part of a dendrite of an OT neuron from a diestrous rat. F, Example of a dendritic ramification with two close branchingpoints (arrows) in a VP neuron from a lactating rat. G, H, Examples of short primary dendrites (arrows) arising from the soma of two VP neurons froma lactating rat.
Stern and Armstrong • Plasticity of OT and VP Neurons during Lactation J. Neurosci., February 1, 1998, 18(3):841–853 847
6.9, p , 0.02 for TBs and F 5 4.7, p , 0.05 for PTBs, two-wayANOVA). No significant differences were observed in the MDLof TBs and PTBs in either group (Fig. 9C), although a tendencyfor longer PTBs was observed in OT neurons and a tendency forshorter TBs was observed in VP neurons during lactation. Theseresults suggest that the reduction of the TDL observed in OT
neurons during lactation involved a reduction in the total lengthcontributed by both PTBs and TBs. The tendency for the MDLof PTBs to increase would argue in favor of a collateral branchloss (see Discussion). In the case of VP neurons the growth indendritic length was observed throughout both TBs and PTBs.The tendency for a shorter MDL of TBs observed in this groupwould indicate that shorter TBs were added during lactation.Thus, the changes occurring in OT and VP neurons duringlactation involve different loci on their dendritic trees.
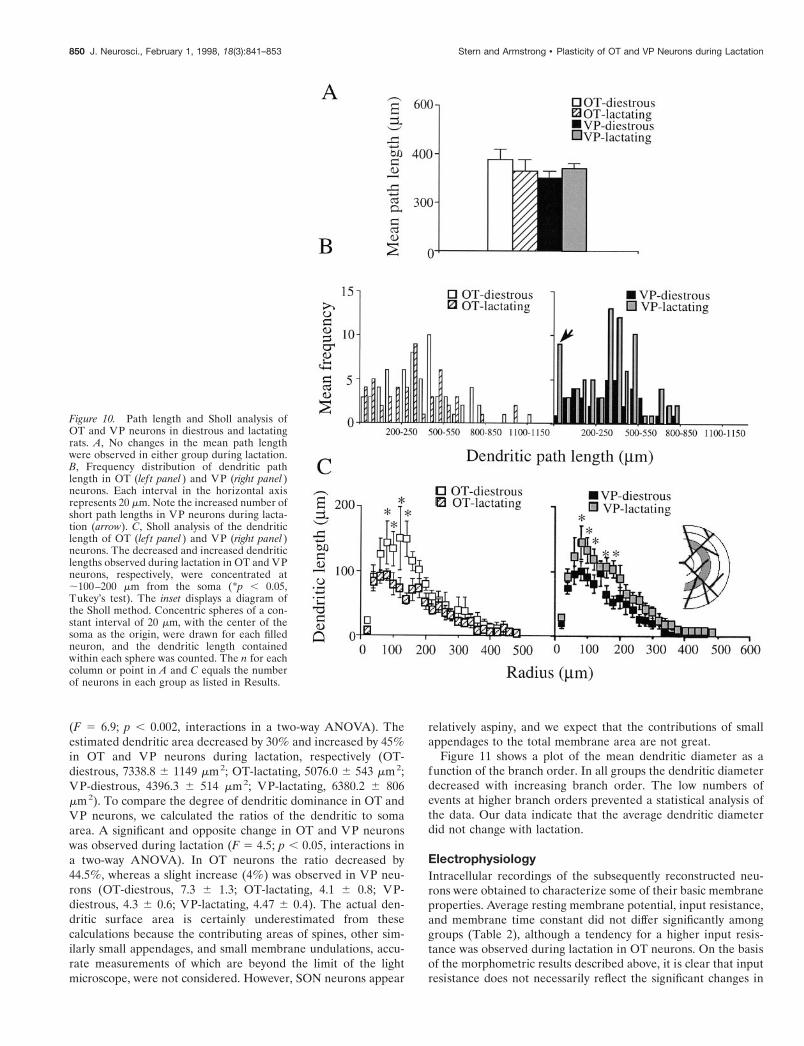
Dendritic path lengthThe study of the dendritic path length, e.g., the distance from thesoma to each dendritic end point, also provides important infor-mation about dendritic branching pattern. The mean path lengthwas similar in OT and VP neurons and did not change duringlactation (Fig. 10A) (F 5 0.9 and F 5 0.2, p . 0.05, two-wayANOVA, for cell type and hormonal state, respectively). Thefrequency distribution of the path length (Fig. 10B) showed alarge decrease in the number of path lengths of 350–400 mmlength in OT neurons and a large increase in the number of pathlengths of 300–500 mm length in VP neurons during lactation. Anincreased number of short (0–50 mm) path lengths also wasobserved in VP neurons during lactation. The fact that the
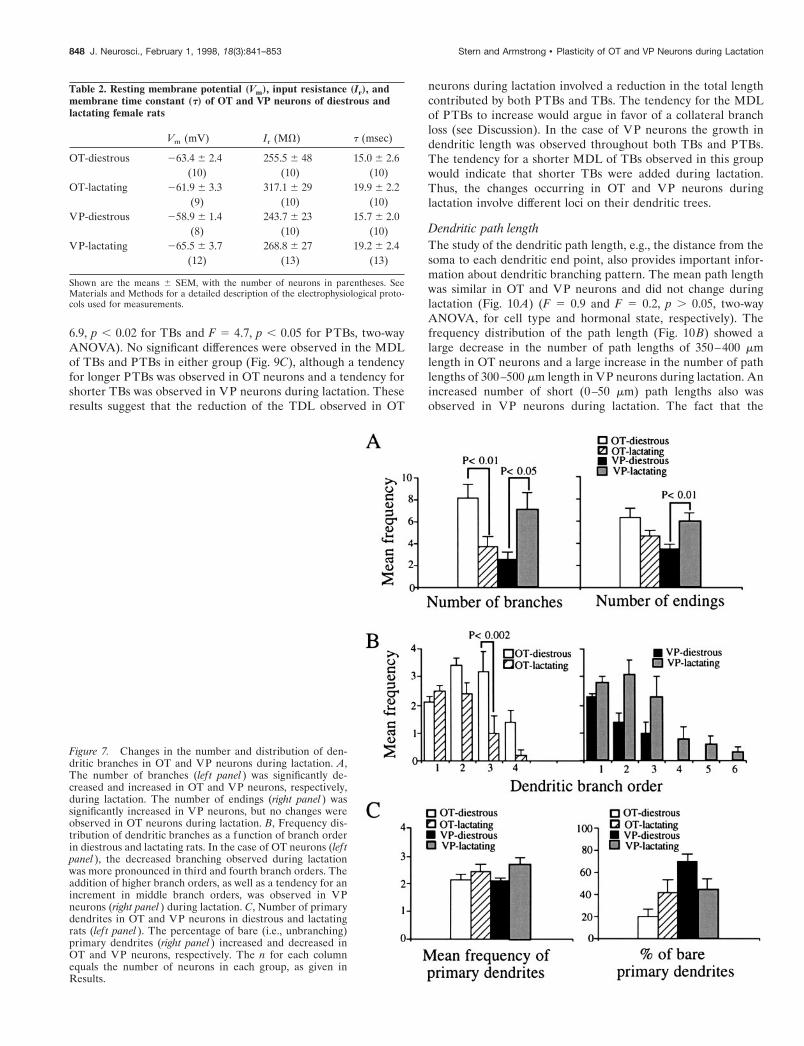
Figure 7. Changes in the number and distribution of den-dritic branches in OT and VP neurons during lactation. A,The number of branches (lef t panel ) was significantly de-creased and increased in OT and VP neurons, respectively,during lactation. The number of endings (right panel ) wassignificantly increased in VP neurons, but no changes wereobserved in OT neurons during lactation. B, Frequency dis-tribution of dendritic branches as a function of branch orderin diestrous and lactating rats. In the case of OT neurons (lef tpanel ), the decreased branching observed during lactationwas more pronounced in third and fourth branch orders. Theaddition of higher branch orders, as well as a tendency for anincrement in middle branch orders, was observed in VPneurons (right panel ) during lactation. C, Number of primarydendrites in OT and VP neurons in diestrous and lactatingrats (lef t panel ). The percentage of bare (i.e., unbranching)primary dendrites (right panel ) increased and decreased inOT and VP neurons, respectively. The n for each columnequals the number of neurons in each group, as given inResults.
Table 2. Resting membrane potential (Vm), input resistance (Ir), andmembrane time constant (t) of OT and VP neurons of diestrous andlactating female rats
Vm (mV) Ir (MV) t (msec)
OT-diestrous 263.4 6 2.4 255.5 6 48 15.0 6 2.6(10) (10) (10)
OT-lactating 261.9 6 3.3 317.1 6 29 19.9 6 2.2(9) (10) (10)
VP-diestrous 258.9 6 1.4 243.7 6 23 15.7 6 2.0(8) (10) (10)
VP-lactating 265.5 6 3.7 268.8 6 27 19.2 6 2.4(12) (13) (13)
Shown are the means 6 SEM, with the number of neurons in parentheses. SeeMaterials and Methods for a detailed description of the electrophysiological proto-cols used for measurements.
848 J. Neurosci., February 1, 1998, 18(3):841–853 Stern and Armstrong • Plasticity of OT and VP Neurons during Lactation
changes in the TDL observed during lactation were not accom-panied by changes in the average dendritic path length wouldfurther support the idea that in both cases the neurons changedsize by altering the number of dendritic branches.
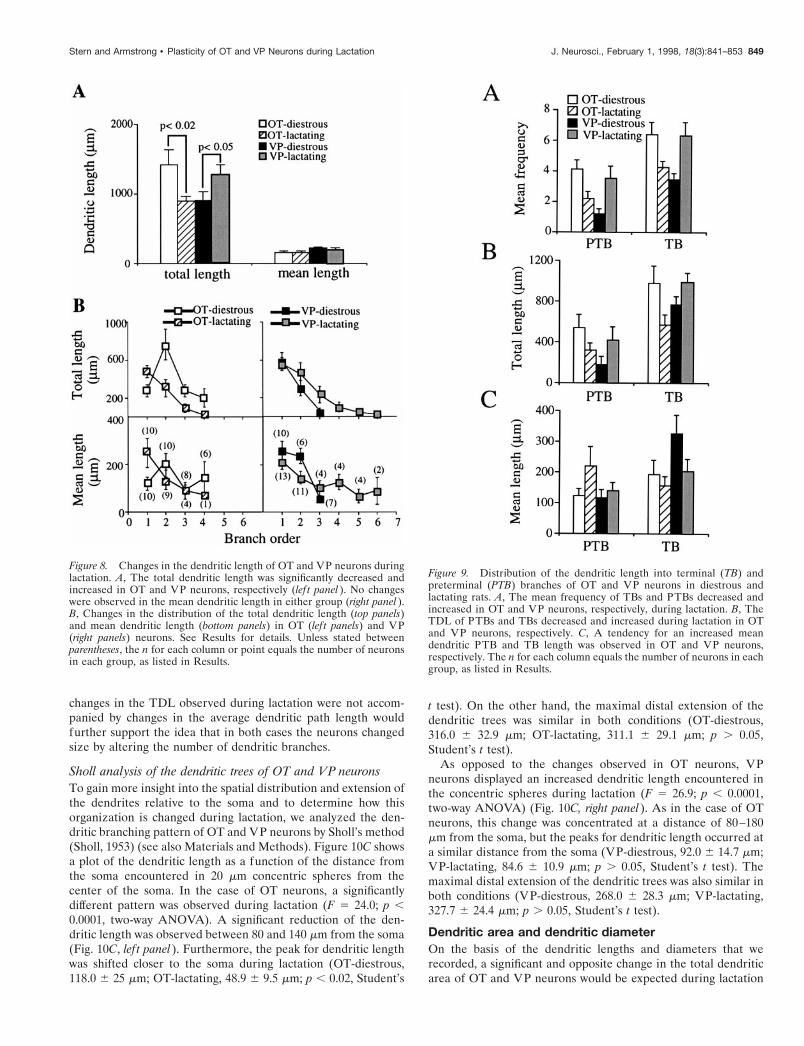
Sholl analysis of the dendritic trees of OT and VP neuronsTo gain more insight into the spatial distribution and extension ofthe dendrites relative to the soma and to determine how thisorganization is changed during lactation, we analyzed the den-dritic branching pattern of OT and VP neurons by Sholl’s method(Sholl, 1953) (see also Materials and Methods). Figure 10C showsa plot of the dendritic length as a function of the distance fromthe soma encountered in 20 mm concentric spheres from thecenter of the soma. In the case of OT neurons, a significantlydifferent pattern was observed during lactation (F 5 24.0; p ,0.0001, two-way ANOVA). A significant reduction of the den-dritic length was observed between 80 and 140 mm from the soma(Fig. 10C, lef t panel). Furthermore, the peak for dendritic lengthwas shifted closer to the soma during lactation (OT-diestrous,118.0 6 25 mm; OT-lactating, 48.9 6 9.5 mm; p , 0.02, Student’s
t test). On the other hand, the maximal distal extension of thedendritic trees was similar in both conditions (OT-diestrous,316.0 6 32.9 mm; OT-lactating, 311.1 6 29.1 mm; p . 0.05,Student’s t test).
As opposed to the changes observed in OT neurons, VPneurons displayed an increased dendritic length encountered inthe concentric spheres during lactation (F 5 26.9; p , 0.0001,two-way ANOVA) (Fig. 10C, right panel). As in the case of OTneurons, this change was concentrated at a distance of 80–180mm from the soma, but the peaks for dendritic length occurred ata similar distance from the soma (VP-diestrous, 92.0 6 14.7 mm;VP-lactating, 84.6 6 10.9 mm; p . 0.05, Student’s t test). Themaximal distal extension of the dendritic trees was also similar inboth conditions (VP-diestrous, 268.0 6 28.3 mm; VP-lactating,327.7 6 24.4 mm; p . 0.05, Student’s t test).
Dendritic area and dendritic diameterOn the basis of the dendritic lengths and diameters that werecorded, a significant and opposite change in the total dendriticarea of OT and VP neurons would be expected during lactation
Figure 8. Changes in the dendritic length of OT and VP neurons duringlactation. A, The total dendritic length was significantly decreased andincreased in OT and VP neurons, respectively (lef t panel ). No changeswere observed in the mean dendritic length in either group (right panel ).B, Changes in the distribution of the total dendritic length (top panels)and mean dendritic length (bottom panels) in OT (lef t panels) and VP(right panels) neurons. See Results for details. Unless stated betweenparentheses, the n for each column or point equals the number of neuronsin each group, as listed in Results.
Figure 9. Distribution of the dendritic length into terminal (TB) andpreterminal (PTB) branches of OT and VP neurons in diestrous andlactating rats. A, The mean frequency of TBs and PTBs decreased andincreased in OT and VP neurons, respectively, during lactation. B, TheTDL of PTBs and TBs decreased and increased during lactation in OTand VP neurons, respectively. C, A tendency for an increased meandendritic PTB and TB length was observed in OT and VP neurons,respectively. The n for each column equals the number of neurons in eachgroup, as listed in Results.
Stern and Armstrong • Plasticity of OT and VP Neurons during Lactation J. Neurosci., February 1, 1998, 18(3):841–853 849
(F 5 6.9; p , 0.002, interactions in a two-way ANOVA). Theestimated dendritic area decreased by 30% and increased by 45%in OT and VP neurons during lactation, respectively (OT-diestrous, 7338.8 6 1149 mm2; OT-lactating, 5076.0 6 543 mm2;VP-diestrous, 4396.3 6 514 mm2; VP-lactating, 6380.2 6 806mm2). To compare the degree of dendritic dominance in OT andVP neurons, we calculated the ratios of the dendritic to somaarea. A significant and opposite change in OT and VP neuronswas observed during lactation (F 5 4.5; p , 0.05, interactions ina two-way ANOVA). In OT neurons the ratio decreased by44.5%, whereas a slight increase (4%) was observed in VP neu-rons (OT-diestrous, 7.3 6 1.3; OT-lactating, 4.1 6 0.8; VP-diestrous, 4.3 6 0.6; VP-lactating, 4.47 6 0.4). The actual den-dritic surface area is certainly underestimated from thesecalculations because the contributing areas of spines, other sim-ilarly small appendages, and small membrane undulations, accu-rate measurements of which are beyond the limit of the lightmicroscope, were not considered. However, SON neurons appear
relatively aspiny, and we expect that the contributions of smallappendages to the total membrane area are not great.
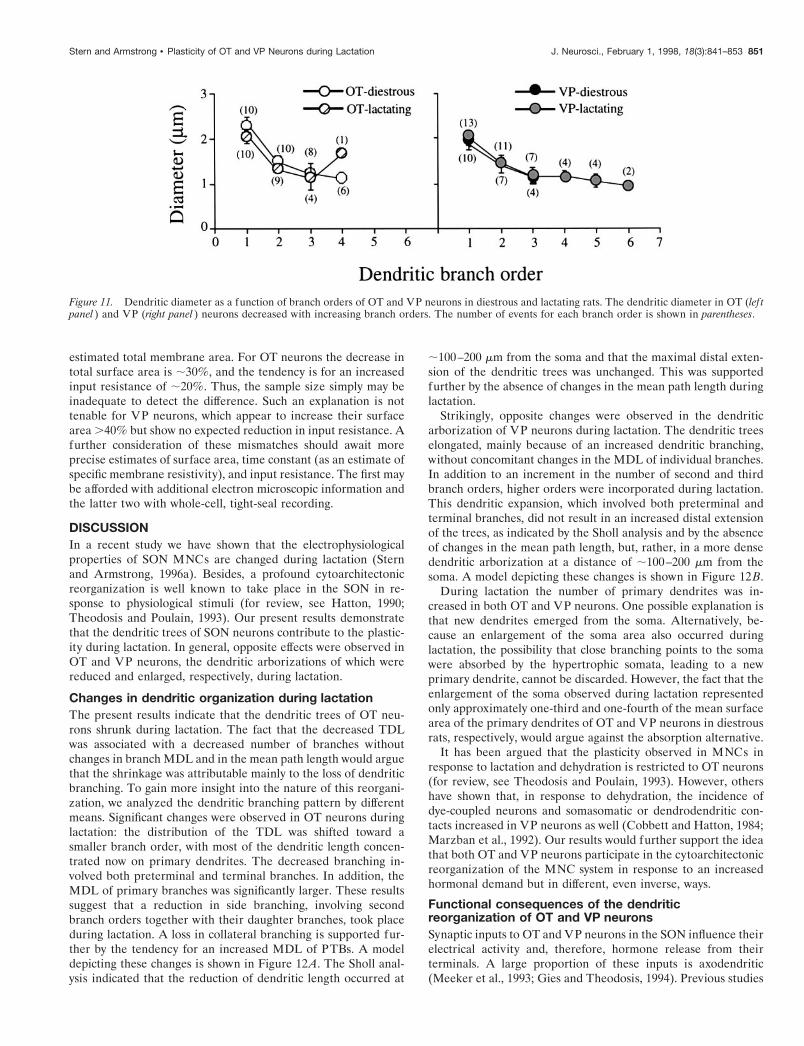
Figure 11 shows a plot of the mean dendritic diameter as afunction of the branch order. In all groups the dendritic diameterdecreased with increasing branch order. The low numbers ofevents at higher branch orders prevented a statistical analysis ofthe data. Our data indicate that the average dendritic diameterdid not change with lactation.
ElectrophysiologyIntracellular recordings of the subsequently reconstructed neu-rons were obtained to characterize some of their basic membraneproperties. Average resting membrane potential, input resistance,and membrane time constant did not differ significantly amonggroups (Table 2), although a tendency for a higher input resis-tance was observed during lactation in OT neurons. On the basisof the morphometric results described above, it is clear that inputresistance does not necessarily reflect the significant changes in
Figure 10. Path length and Sholl analysis ofOT and VP neurons in diestrous and lactatingrats. A, No changes in the mean path lengthwere observed in either group during lactation.B, Frequency distribution of dendritic pathlength in OT (lef t panel ) and VP (right panel )neurons. Each interval in the horizontal axisrepresents 20 mm. Note the increased number ofshort path lengths in VP neurons during lacta-tion (arrow). C, Sholl analysis of the dendriticlength of OT (lef t panel ) and VP (right panel )neurons. The decreased and increased dendriticlengths observed during lactation in OT and VPneurons, respectively, were concentrated at;100–200 mm from the soma (*p , 0.05,Tukey’s test). The inset displays a diagram ofthe Sholl method. Concentric spheres of a con-stant interval of 20 mm, with the center of thesoma as the origin, were drawn for each filledneuron, and the dendritic length containedwithin each sphere was counted. The n for eachcolumn or point in A and C equals the numberof neurons in each group as listed in Results.
850 J. Neurosci., February 1, 1998, 18(3):841–853 Stern and Armstrong • Plasticity of OT and VP Neurons during Lactation
estimated total membrane area. For OT neurons the decrease intotal surface area is ;30%, and the tendency is for an increasedinput resistance of ;20%. Thus, the sample size simply may beinadequate to detect the difference. Such an explanation is nottenable for VP neurons, which appear to increase their surfacearea .40% but show no expected reduction in input resistance. Afurther consideration of these mismatches should await moreprecise estimates of surface area, time constant (as an estimate ofspecific membrane resistivity), and input resistance. The first maybe afforded with additional electron microscopic information andthe latter two with whole-cell, tight-seal recording.
DISCUSSIONIn a recent study we have shown that the electrophysiologicalproperties of SON MNCs are changed during lactation (Sternand Armstrong, 1996a). Besides, a profound cytoarchitectonicreorganization is well known to take place in the SON in re-sponse to physiological stimuli (for review, see Hatton, 1990;Theodosis and Poulain, 1993). Our present results demonstratethat the dendritic trees of SON neurons contribute to the plastic-ity during lactation. In general, opposite effects were observed inOT and VP neurons, the dendritic arborizations of which werereduced and enlarged, respectively, during lactation.
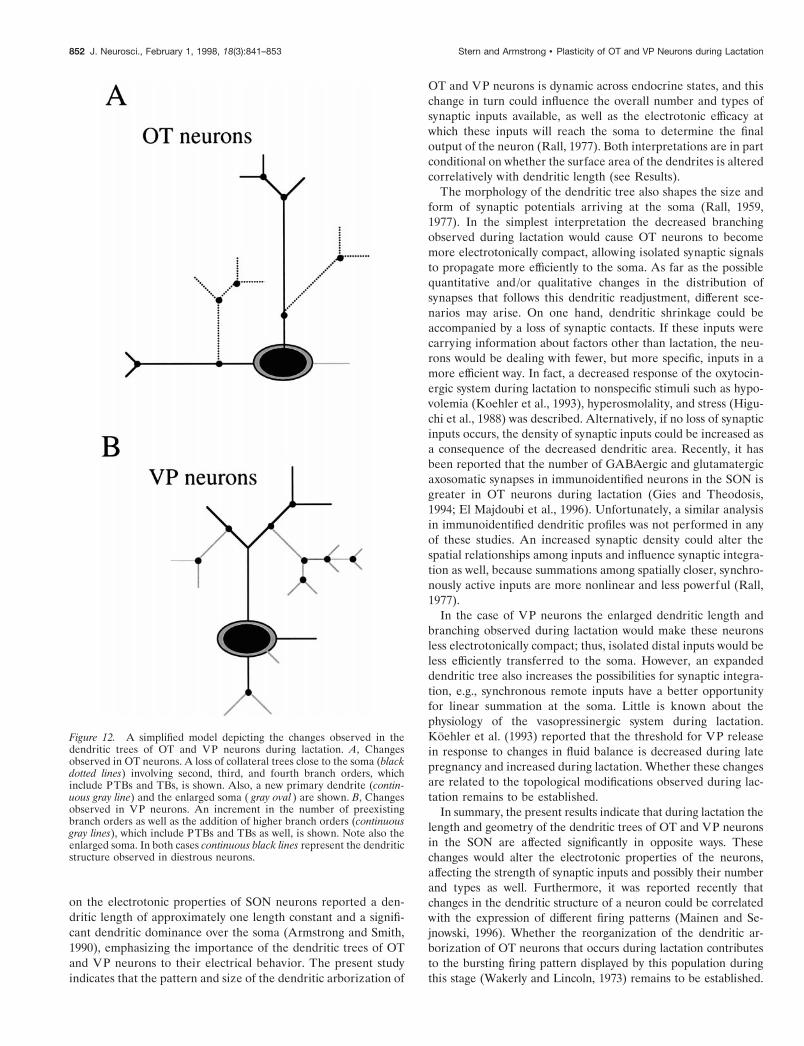
Changes in dendritic organization during lactationThe present results indicate that the dendritic trees of OT neu-rons shrunk during lactation. The fact that the decreased TDLwas associated with a decreased number of branches withoutchanges in branch MDL and in the mean path length would arguethat the shrinkage was attributable mainly to the loss of dendriticbranching. To gain more insight into the nature of this reorgani-zation, we analyzed the dendritic branching pattern by differentmeans. Significant changes were observed in OT neurons duringlactation: the distribution of the TDL was shifted toward asmaller branch order, with most of the dendritic length concen-trated now on primary dendrites. The decreased branching in-volved both preterminal and terminal branches. In addition, theMDL of primary branches was significantly larger. These resultssuggest that a reduction in side branching, involving secondbranch orders together with their daughter branches, took placeduring lactation. A loss in collateral branching is supported fur-ther by the tendency for an increased MDL of PTBs. A modeldepicting these changes is shown in Figure 12A. The Sholl anal-ysis indicated that the reduction of dendritic length occurred at
;100–200 mm from the soma and that the maximal distal exten-sion of the dendritic trees was unchanged. This was supportedfurther by the absence of changes in the mean path length duringlactation.
Strikingly, opposite changes were observed in the dendriticarborization of VP neurons during lactation. The dendritic treeselongated, mainly because of an increased dendritic branching,without concomitant changes in the MDL of individual branches.In addition to an increment in the number of second and thirdbranch orders, higher orders were incorporated during lactation.This dendritic expansion, which involved both preterminal andterminal branches, did not result in an increased distal extensionof the trees, as indicated by the Sholl analysis and by the absenceof changes in the mean path length, but, rather, in a more densedendritic arborization at a distance of ;100–200 mm from thesoma. A model depicting these changes is shown in Figure 12B.
During lactation the number of primary dendrites was in-creased in both OT and VP neurons. One possible explanation isthat new dendrites emerged from the soma. Alternatively, be-cause an enlargement of the soma area also occurred duringlactation, the possibility that close branching points to the somawere absorbed by the hypertrophic somata, leading to a newprimary dendrite, cannot be discarded. However, the fact that theenlargement of the soma observed during lactation representedonly approximately one-third and one-fourth of the mean surfacearea of the primary dendrites of OT and VP neurons in diestrousrats, respectively, would argue against the absorption alternative.
It has been argued that the plasticity observed in MNCs inresponse to lactation and dehydration is restricted to OT neurons(for review, see Theodosis and Poulain, 1993). However, othershave shown that, in response to dehydration, the incidence ofdye-coupled neurons and somasomatic or dendrodendritic con-tacts increased in VP neurons as well (Cobbett and Hatton, 1984;Marzban et al., 1992). Our results would further support the ideathat both OT and VP neurons participate in the cytoarchitectonicreorganization of the MNC system in response to an increasedhormonal demand but in different, even inverse, ways.
Functional consequences of the dendriticreorganization of OT and VP neuronsSynaptic inputs to OT and VP neurons in the SON influence theirelectrical activity and, therefore, hormone release from theirterminals. A large proportion of these inputs is axodendritic(Meeker et al., 1993; Gies and Theodosis, 1994). Previous studies
Figure 11. Dendritic diameter as a function of branch orders of OT and VP neurons in diestrous and lactating rats. The dendritic diameter in OT (lef tpanel ) and VP (right panel ) neurons decreased with increasing branch orders. The number of events for each branch order is shown in parentheses.
Stern and Armstrong • Plasticity of OT and VP Neurons during Lactation J. Neurosci., February 1, 1998, 18(3):841–853 851
on the electrotonic properties of SON neurons reported a den-dritic length of approximately one length constant and a signifi-cant dendritic dominance over the soma (Armstrong and Smith,1990), emphasizing the importance of the dendritic trees of OTand VP neurons to their electrical behavior. The present studyindicates that the pattern and size of the dendritic arborization of
OT and VP neurons is dynamic across endocrine states, and thischange in turn could influence the overall number and types ofsynaptic inputs available, as well as the electrotonic efficacy atwhich these inputs will reach the soma to determine the finaloutput of the neuron (Rall, 1977). Both interpretations are in partconditional on whether the surface area of the dendrites is alteredcorrelatively with dendritic length (see Results).
The morphology of the dendritic tree also shapes the size andform of synaptic potentials arriving at the soma (Rall, 1959,1977). In the simplest interpretation the decreased branchingobserved during lactation would cause OT neurons to becomemore electrotonically compact, allowing isolated synaptic signalsto propagate more efficiently to the soma. As far as the possiblequantitative and/or qualitative changes in the distribution ofsynapses that follows this dendritic readjustment, different sce-narios may arise. On one hand, dendritic shrinkage could beaccompanied by a loss of synaptic contacts. If these inputs werecarrying information about factors other than lactation, the neu-rons would be dealing with fewer, but more specific, inputs in amore efficient way. In fact, a decreased response of the oxytocin-ergic system during lactation to nonspecific stimuli such as hypo-volemia (Koehler et al., 1993), hyperosmolality, and stress (Higu-chi et al., 1988) was described. Alternatively, if no loss of synapticinputs occurs, the density of synaptic inputs could be increased asa consequence of the decreased dendritic area. Recently, it hasbeen reported that the number of GABAergic and glutamatergicaxosomatic synapses in immunoidentified neurons in the SON isgreater in OT neurons during lactation (Gies and Theodosis,1994; El Majdoubi et al., 1996). Unfortunately, a similar analysisin immunoidentified dendritic profiles was not performed in anyof these studies. An increased synaptic density could alter thespatial relationships among inputs and influence synaptic integra-tion as well, because summations among spatially closer, synchro-nously active inputs are more nonlinear and less powerful (Rall,1977).
In the case of VP neurons the enlarged dendritic length andbranching observed during lactation would make these neuronsless electrotonically compact; thus, isolated distal inputs would beless efficiently transferred to the soma. However, an expandeddendritic tree also increases the possibilities for synaptic integra-tion, e.g., synchronous remote inputs have a better opportunityfor linear summation at the soma. Little is known about thephysiology of the vasopressinergic system during lactation.Koehler et al. (1993) reported that the threshold for VP releasein response to changes in fluid balance is decreased during latepregnancy and increased during lactation. Whether these changesare related to the topological modifications observed during lac-tation remains to be established.
In summary, the present results indicate that during lactation thelength and geometry of the dendritic trees of OT and VP neuronsin the SON are affected significantly in opposite ways. Thesechanges would alter the electrotonic properties of the neurons,affecting the strength of synaptic inputs and possibly their numberand types as well. Furthermore, it was reported recently thatchanges in the dendritic structure of a neuron could be correlatedwith the expression of different firing patterns (Mainen and Se-jnowski, 1996). Whether the reorganization of the dendritic ar-borization of OT neurons that occurs during lactation contributesto the bursting firing pattern displayed by this population duringthis stage (Wakerly and Lincoln, 1973) remains to be established.
Figure 12. A simplified model depicting the changes observed in thedendritic trees of OT and VP neurons during lactation. A, Changesobserved in OT neurons. A loss of collateral trees close to the soma (blackdotted lines) involving second, third, and fourth branch orders, whichinclude PTBs and TBs, is shown. Also, a new primary dendrite (contin-uous gray line) and the enlarged soma ( gray oval ) are shown. B, Changesobserved in VP neurons. An increment in the number of preexistingbranch orders as well as the addition of higher branch orders (continuousgray lines), which include PTBs and TBs as well, is shown. Note also theenlarged soma. In both cases continuous black lines represent the dendriticstructure observed in diestrous neurons.
852 J. Neurosci., February 1, 1998, 18(3):841–853 Stern and Armstrong • Plasticity of OT and VP Neurons during Lactation
REFERENCESAghajanian GK, Rasmussen K (1989) Intracellular studies in the facial
nucleus illustrating a simple new method for obtaining viable motoneu-rons in adult rat brain slices. Synapse 3:331–338.
Armstrong WE (1995) Morphological and electrophysiological classifi-cation of hypothalamic supraoptic neurons. Prog Neurobiol 47:291–339.
Armstrong WE, Smith BN (1990) Tuberal supraoptic neurons. II. Elec-trotonic properties. Neuroscience 38:485–494.
Armstrong WE, Scholer J, McNeil TH (1982) Immunocytochemical,Golgi, and electron microscopic characterization of putative dendritesin the ventral glial lamina of the rat supraoptic nucleus. Neuroscience7:679–694.
Armstrong WE, Smith BN, Tian M (1994) Electrophysiological charac-teristics of immunochemically identified oxytocin and vasopressin neu-rons in vitro. J Physiol (Lond) 475:115–128.
Cobbett P, Hatton G (1984) Dye coupling in hypothalamic slices: de-pendence on in vivo hydration state and osmolality of incubationmedium. J Neurosci 4:3034–3038.
El Majdoubi M, Poulain D, Theodosis DT (1996) The glutamatergicinnervation of oxytocin- and vasopressin-secreting neurons in the ratsupraoptic nucleus and its contribution to lactation-induced synapticplasticity. Eur J Neurosci 8:1377–1389.
Gies U, Theodosis T (1994) Synaptic plasticity in the rat supraopticnucleus during lactation involves GABA innervation and oxytocinneurons: a quantitative immunocytochemical analysis. J Neurosci14:2861–2869.
Hatton GI (1990) Emerging concepts of structure–function dynamics inadult brain: the hypothalamo-neurohypophysial system. Prog Neurobiol34:437–504.
Hatton GI, Yang QZ, Cobbett P (1987) Dye coupling among immuno-cytochemically identified neurons in the supraoptic nucleus: increasedincidence in lactating rats. Neuroscience 21:923–930.
Higuchi T, Honda K, Takano S, Negoro H (1988) Reduced oxytocinresponse to osmotic stimulus and immobilization stress in lactating rats.J Endocrinol 116:225–230.
Kita H, Armstrong WE (1991) A biotin-containing compound N-(2-aminoethyl) biotinamide for intracellular labeling and neuronal tracingstudies: comparison with biocytin. J Neurosci Methods 37:141–150.
Koehler EM, McLemore GL, Tang W, Summy-Long JY (1993) Osmo-regulation of the magnocellular system during pregnancy and lactation.Am J Physiol 264:555–560.
Mainen Z, Sejnowski T (1996) Influence of dendritic structure on firingpattern in model neocortical neurons. Nature 382:363–366.
Marzban F, Tweedle CD, Hatton GI (1992) Reevaluation of the plastic-ity in the rat supraoptic nucleus after chronic dehydration using immu-nogold for oxytocin and vasopressin at the ultrastructural level. BrainRes Bull 28:757–766.
Meeker RB, Swanson DJ, Greenwood RS, Hayward JN (1993) Quanti-tative mapping of glutamate presynaptic terminals in the supraopticnucleus and surrounding hypothalamus. Brain Res 600:112–122.
Ohara PT, Havton LA (1994) Dendritic architecture of rat somato-sensory thalamocortical projection neurons. J Comp Neurol341:159 –171.
Rall W (1959) Branching dendritic trees and motoneuron membraneresistivity. Exp Neurol 1:491–527.
Rall W (1977) Core conductor theory and cable properties of neurons.In: Handbook of physiology, the nervous system, Pt 1, pp 39–97.Bethesda, MD: American Physiology Association.
Randle JCR, Bourque CW, Renaud LP (1986) Serial reconstruction ofLucifer yellow-labeled supraoptic nucleus neurons in perfused rathypothalamic explants. Neuroscience 17:453–467.
Russ J (1986) Practical stereology. New York: Plenum.Sadler M, Berry M (1988) Link-vertex analysis of Purkinje cell dendritic
trees from the murine cerebellum. Brain Res 474:130–146.Sholl D (1953) Dendritic organization in the neurons of the visual and
motor cortices of the cat. J Anat 87:387–406.Smith B, Armstrong WE (1990) Tuberal supraoptic neurons. I. Morpho-
logical and electrophysiological characteristics observed with intracel-lular recording and biocytin filling in vitro. Neuroscience 38:469–483.
Stern JE, Armstrong WE (1995) Electrophysiological differences be-tween oxytocin and vasopressin neurons recorded from female rats invitro. J Physiol (Lond) 488(3):701–708.
Stern JE, Armstrong WE (1996a) Changes in the electrical properties ofsupraoptic nucleus oxytocin and vasopressin neurons during lactation.J Neurosci 16:4861–4871.
Stern JE, Armstrong WE (1996b) Morphometric study of oxytocin andvasopressin neurons in the supraoptic nucleus: modulation during lac-tation. Soc Neurosci Abstr 22:628.
Stern JE, Armstrong WE (1997) Sustained outward rectification of oxy-tocinergic neurones in the rat supraoptic nucleus: ionic dependence andpharmacology. J Physiol (Lond) 500:497–508.
Theodosis DT, Poulain DA (1993) Activity-dependent neuronal–glialand synaptic plasticity in the adult mammalian hypothalamus. Neuro-science 57:501–535.
Van Pelt J, Verwer RWH (1983) The exact probabilities of branchingpatterns under terminal and segmental growth hypothesis. Bull MathBiol 45:269–285.
Wakerley JB, Lincoln DW (1973) The milk-ejection reflex of the rat: a20- to 40-fold acceleration in the firing of paraventricular neuronesduring oxytocin release. J Endocrinol 57:477–493.
Zar JH (1984) Biostatistical analysis. Englewood Cliffs, NJ: Prentice-Hall.
Stern and Armstrong • Plasticity of OT and VP Neurons during Lactation J. Neurosci., February 1, 1998, 18(3):841–853 853