Embed Size (px)
Citation preview
Status and Management of the Least Bell’s Vireo and Southwestern Willow Flycatcher in the
Santa Ana River Watershed, 2014, and Summary Data by Site and Watershed-wide, 2000-2014
Prepared by
The Santa Ana Watershed Association
Prepared for Orange County Water District U.S. Fish and Wildlife Service
Principal Field Investigators
Susan M. Hoffman Richard Zembal
Authors
Susan M. Hoffman Richard Zembal Nicole Housel
Co-Authors and Field Investigators
Melody Aimar Maricela Paramo Archer
Talula Barbee Allyson Beckman
Jill Coumoutso Nicole Housel
Cameron Macbeth
December 2014

LBVI AND SWFL REPORT 2014 SANTA ANA WATERSHED ASSOCIATION TABLE OF CONTENTS
i
TABLE OF CONTENTS ABSTRACT 1 INTRODUCTION 2 METHODS 3 Study Sites 4
RESULTS 7 Vireo Abundance 7 Abundance - Vireo Assessment Surveys 7 Chronology of Breeding Activity 8 Nesting Site Preferences 9 Reproductive Success 9 Predation Rates 9 Brown-headed Cowbird Parasitism 10 Repaired Vireo Nests 10 Site Summaries 2014 10
San Jacinto 10 San Timoteo 11 Sycamore Canyon 13 Meridian Conservation Area (former March SKR Preserve) 13 Mockingbird Canyon 14 Santa Ana River – Riverside Ave. to Van Buren Boulevard 15 Santa Ana River – Hidden Valley Wildlife Preserve 16 Santa Ana River between Norco (Goose Creek Golf Club) and River Rd. 18 Temescal Canyon 20 Chino Hills 21 Santa Ana River — Santa Ana Canyon 22 Upper Canyon – Downstream of Prado Dam to the Green River Golf Club 23 Green River Golf Club 24 Featherly Regional Park 25 Irvine Regional Park Summary 27
Southwestern Willow Flycatcher 27 Sightings of Interest 28
BROWN-HEADED COWBIRDS TRAPPING RESULTS 29 Brown-headed Cowbird Trapping, March - July 2014 29 Non-Target Captures in Cowbird Traps, March – July 2014 29 Winter 2013-2014 Brown-headed Cowbird Trapping and Non-Target Captures 30
DISCUSSION 31 MANAGEMENT RECOMMENDATIONS 32 LITERATURE CITATIONS 34 APPENDIX A – SURVEY SITES, STARTING AND ENDING COORDINATES
ERROR! BOOKMARK NOT DEFINED.
APPENDIX B: WATERSHED ANNUAL RESULTS 2000-2014 APPENDIX C: SUMMARY TABLES BY MANAGED SITE, FROM 2000-2014 APPENDIX D: ARCHIVED DATA 2000-2009, UNDER SEPARATE COVER

LBVI AND SWFL REPORT 2014 SANTA ANA WATERSHED ASSOCIATION TABLE OF CONTENTS
ii
LIST OF FIGURES FIGURE 1: LEAST BELL’S VIREO SURVEY SITES IN THE SANTA ANA WATERSHED .................. 38 FIGURE 2: VIREO ABUNDANCE IN THE WATERSHED, PRADO AND OUTSIDE PRADO, 2001-2014. ...................................................................................................................................... 39 FIGURE 3: NUMBER OF COWBIRDS REMOVED FROM SAWA MONITORING SITES IN THE SANTA ANA WATERSHED, 2000-2014 ......................................................................................... 40 FIGURE 4: NUMBER OF LEAST BELL’S VIREO TERRITORIES AT FOUR SITES IN THE SANTA ANA WATERSHED, 2004-2014 ................................................................................................ 41 FIGURE 5: LEAST BELL’S VIREO NESTING SUCCESS, DEPREDATION RATES, PARASITISM RATE IN THE SANTA ANA WATERSHED, 2003-2014 ..................................................................... 42
LIST OF TABLES TABLE 1A: LEAST BELL’S VIREO ABUNDANCE AND DISTRIBUTION IN THE SANTA ANA WATERSHED, 2010-2014 ................................................................................................ 43 TABLE 2.1: LEAST BELL’S VIREO, SURVEY DATES AND BREEDING CHRONOLOGY, 2014 ....... 56 TABLE 3: LEAST BELL’S VIREO STATUS AND MANAGEMENT AND BROWN-HEADED COWBIRD MANAGEMENT DATA, AT CLOSELY MONITORED SITES IN THE SANTA ANA RIVER WATERSHED, CALIFORNIA, 2014. .......................................................................................................... 58 TABLE 4: LEAST BELL'S VIREO NEST PLACEMENT PREFERENCES, MONITORED SITES IN THE SANTA ANA RIVER WATERSHED, 2014 .............................................................................. 59 TABLE 5: LEAST BELL’S VIREO REPRODUCTIVE SUCCESS AND BREEDING BIOLOGY DATA, MONITORED SITES IN THE SANTA ANA RIVER WATERSHED, 2014 ........................................ 61 TABLE 6: BROWN HEADED COWBIRD TRAPPING RESULTS, MARCH-AUGUST 2014 ................ 64 TABLE 7: NON-TARGET AVIAN CAPTURES IN BROWN-HEADED COWBIRD TRAPS, MARCH-AUGUST 2014 ................................................................................................................. 65 TABLE 8: BROWN-HEADED COWBIRD TRAPPING RESULTS, WINTER 2013-2014 ................... 66 TABLE 9: NON-TARGET AVIAN CAPTURES IN BROWN-HEADED COWBIRD TRAPS, WINTER 2013-2014 .............................................................................................................................. 67 TABLE 10: RESULTS OF THE LEAST BELL'S VIREO ASSESSMENT SURVEYS IN THE SANTA ANA WATERSHED, 2006-2014 ................................................................................................ 68 TABLE 11: RESULTS OF THE LEAST BELL'S VIREO ASSESSMENT SURVEYS IN THE SANTA ANA WATERSHED, 2014 .......................................................................................................... 72 TABLE 12: OBSERVATIONS OF SENSITIVE SPECIES BY LOCATION, 2014 ............................... 74

LBVI AND SWFL REPORT 2014 SANTA ANA WATERSHED ASSOCIATION ABSTRACT
1
ABSTRACT
The 2014 monitoring effort for the Least Bell’s Vireo, Vireo belli pusillus, documented an increase in abundance for the second year, after two years of declines. In 2014, vireo abundance in the upper watershed and from cooperating agencies, excluding Prado, increased 4% from 1,021 territories in 2013 to 1,062 territories in 2014. The 2014 numbers do not include data from San Bernardino County which was last reported in 2012, with 30 territories (Table B1). The number of pairs remained stable, increasing by 2%, from 471 to 481 pairs. Fledgling abundance decreased by 20% to 548. This decrease may be due partially to decreased field effort due to staff shortage. Vireo abundance at Prado decreased 7% from 561 territories to 520. The increase in the upper watershed offset the decrease in Prado and the total abundance of vireo territories in 2014 remained unchanged from 2013 at 1,582 territories.
Productivity based on SAWA's well-monitored pairs in 2014 was 2.2, a decrease from 3.0 documented in 2013 and 2.8 in 2012. Nesting success was 48%, and has ranged between 48% and 65% in the last 5 years. The depredation rate was 43% in 2014. Depredation rates have ranged from 28% to 43% in the last 5 years. SAWA's parasitism rate was 5% in 2014. Parasitism rates in the last 4 years are dramatically lower than the rates which ranged between 14 and 28% before 2009. Five vireos fledged from 5 manipulated nests; 3 nests were repaired and fledged 5 young. Twenty-eight per cent of nests were placed in five species of willow, Salix spp. and 33% were placed in mulefat, Baccharis salicifolia.
Brown-headed Cowbirds, Molothrus ater, were also managed throughout the watershed. Over 1,200 cowbirds were removed from 46 traps over a period of more than 5,400 trap days between 3/11/14 and 7/29/14. Additionally over 4,900 cowbirds were removed from the watershed during the winter of 2013-2014 over more than 1,600 trap days. Over 86,000 Brown-headed Cowbirds have been removed from the Santa Ana Watershed since SAWA began its cowbird management program.
No breeding Southwestern Willow Flycatchers, Empidonax trailli extimus, or Yellow-billed Cuckoos, Coccyzus americianus occidentalis, were detected in the Santa Ana Watershed, including Prado Basin, in 2014. Incidental sightings of other sensitive birds were documented. A minimum of 823 Yellow Warblers, Setophaga petechia, and 163 Yellow-breasted Chats, Icteria virens, were detected throughout the watershed in 2014.
Since the Santa Ana Watershed Program began vireo and cowbird management, over 6,000 vireo fledglings have been produced. Presented here are summary watershed-wide totals and data by site for sites monitored by the Santa Ana Watershed Association since 2000. This report documents the last extensive monitoring effort by SAWA. Monitoring efforts in the future will depend upon new funding opportunities.

LBVI AND SWFL REPORT 2014 SANTA ANA WATERSHED ASSOCIATION INTRODUCTION
2
INTRODUCTION
The Least Bell’s Vireo (Vireo bellii pusillus) is a small, insectivorous bird that occupies riparian habitat in central and southern California and northern Baja. It is listed as endangered by both the State of California and the federal government due to the destruction of riparian habitat and brood parasitism by the Brown-headed Cowbird (Molothrus ater) (Pike et al. 1999).
The Southwestern Willow Flycatcher (Empidonax traillii extimus) occupies riparian habitat throughout the southwest. It too is listed as endangered by the federal government due to habitat destruction and alteration and cowbird parasitism. These two endangered species and several other sensitive species have been monitored and managed in the Prado Basin annually since 1986. From 19 pairs of vireo in 1986, the population increased to a high of 386 pairs and 600 territorial males in 2005 (Pike et al. 2005).
The work reported herein is an expansion upon the Prado Basin efforts into other portions of the watershed through the implementation of the Santa Ana River Watershed Program by the Santa Ana Watershed Association (SAWA) and the Orange County Water District (OCWD). The monitoring program was conducted during the breeding season to determine the number of Least Bell’s Vireos and Southwestern Willow Flycatchers present, their breeding status, and nesting outcomes; cowbird trapping in or near riparian habitat was conducted concurrently.

LBVI AND SWFL REPORT 2011 SANTA ANA WATERSHED ASSOCIATION RESULTS
3
METHODS
Both the monitoring effort and data analysis followed Pike et al. (1999). All potential habitats were carefully and slowly traversed along the edges and open trails. All vireos and other sensitive species encountered were noted as to location, behavior, reproductive status, etc. The primary purpose of this monitoring was to locate all vireos and flycatchers to determine their breeding status and enhance their breeding output through management. Surveys were conducted five days per week throughout the season. The surveys began in March and mostly ended in August (Table 2.1). Occasional visits to determine continued vireo presence occurred through September. Temescal Canyon was monitored by a different methodology in 2014. The canyon was partitioned into six sections and each section was assigned to a different biologist. Two to three visits were made during the season. Surveys were done during periods of clement weather. Nest visitation and monitoring during conditions of very high winds, extreme cold, or other climatic factors that could influence survey results or cause disturbance to nesting birds were avoided. No injuries or mortalities occurred in 2014.
In addition to the above intensive monitoring, abbreviated surveys were conducted of other riparian habitat in the watershed. Since 2005, biologists have identified habitat not regularly monitored. Fifty-eight sites were surveyed during the 2014 season, usually three times, mainly during the first weeks of May, June, and July. These surveys, called assessment surveys, were conducted by walking next to or through habitat along trails. Surveys began about 7 a.m. and usually ended by 1 p.m. Territories were marked by GPS and breeding status was assessed if possible on the brief visits. Some surveys took place outside of the scheduled dates due to conflicting schedules. While three surveys were done for most sites, some sites received only one or two visits (Tables 10 and 11).
Successful nesting is defined as fledging at least one bird. Pairs for which nests were not located, who were never observed nest building or were not seen with fledglings were considered non-breeding. Two estimates of fledgling production are given: the number of fledglings observed, which is the minimum total number fledged, and the projected number of fledglings estimated by determining the average number of fledglings produced by closely-tracked pairs and ascribing that productivity to all pairs. The closely-tracked pairs were those visited frequently enough to document all breeding attempts and their outcomes during the season. This usually meant an effort of at least five visits per nesting attempt, several of which were needed to check for fledglings. In areas subject to parasitism, nests were visited once every seven to eight days to check for cowbird eggs. Cowbird eggs and nestlings were removed from nests.
Over the years we have been reporting the percentage of nests which lose partial contents, eggs or chicks, as the depredation rate. As of 2008 we refer to this statistic as rate of missing/eggs/chicks from nests (Table 5, row K and Table 3, row G). Underdeveloped chicks or non-viable eggs are not included in this data set. The depredation rate is nest loss due to depredation (Table 5, row Mc).
No playbacks of taped vocalizations were used during any surveys for the Least Bell’s Vireo. The search for Willow Flycatchers was done in conjunction with visual and auditory searches for vireos and other species.

LBVI AND SWFL REPORT 2014 SANTA ANA WATERSHED ASSOCIATION RESULTS
4
The field biologists worked under the direction of the Principal Field Investigators and all surveys and nest manipulations were performed under, and in compliance with, all terms and conditions of Federal Endangered Species Permit #TE-839480-4 and a Memorandum of Understanding with the California Department of Fish and Wildlife (CDFW).
Forty-six cowbird traps were deployed in or near riparian habitat in drainages throughout the watershed. Traps were checked daily and native birds released. Trapped cowbirds were transferred to holding traps (closed traps) and the birds were picked up by a licensed falconer.
With the increasing vireo population in the watershed and funding limitations, a new survey strategy must be implemented. SAWA hopes to continue to monitor for detection of all territories throughout all historically monitored sites: San Jacinto, San Timoteo Canyon, Mockingbird Canyon, the Santa Ana River from Riverside Ave. to River Road, including Hidden Valley Wildlife Preserve and Norco, Temescal Canyon, and the Santa Ana Canyon.
In 2014, no nest monitoring was done at Temescal Canyon or Chino Hills; opportunistic nest monitoring was done at San Jacinto, Mockingbird Canyon, and Sycamore Canyon. SAWA's surveys in the peripheral sites took place as usual.
A minimum of 4,200 hours was spent in 2014 for the vireo management program, including 1,951 field hours on vireo monitoring and nest management and 382 field hours on the vireo assessment surveys. About 4,900 hours were spent on the Brown-headed Cowbird management program including 1,100 field hours for spring/summer cowbird trapping, and 760 field hours for winter cowbird trapping. Winter traps were closed in December due to lack of funding. SAWA usually runs traps throughout the winter. Due to staffing shortages, SAWA biologists were unable to support monitoring efforts for the Western Riverside Multi-Species Habitat Management Plan monitoring program.
No listed animals were injured or killed during this monitoring effort. Appendices. Appendix A contains the GPS points for all survey sites. Shapefiles of the locations of all vireo territories are sent to USFWS and CDFW. Appendix B contains the annual totals for all statistics. Appendix C contains 2010-2014 annual data by site. Appendix D contains annual data by site for 2000-2009, now under separate cover and available on request.
Study Sites
The Santa Ana River was monitored from Riverside Avenue in Riverside downstream to the Santa Ana Canyon at Weir Canyon Road, excluding the Prado basin. For data from Prado Basin (from River Road downstream to the dam), see Pike et al. 2014, in progress. The following tributaries to the Santa Ana River were surveyed: San Timoteo Canyon, Meridian Conservation Area/former March SKR Preserve, Mockingbird Canyon, Sycamore Canyon, Harrison Reservoir (McAllister Creek), Temescal Canyon, Chino Hills-Butterfield Ranch environs and the San Jacinto watershed (Figure 1).

LBVI AND SWFL REPORT 2014 SANTA ANA WATERSHED ASSOCIATION RESULTS
5
Study sites contained typical Southern Californian riparian vegetation including tall canopies of cottonwood, Populus fremontii, and black willow, Salix gooddingii, sub stories of arroyo and red willows, Salix lasiolepis and Salix laevigata, respectively, and mulefat, Baccharis salicifolia. Lush riparian habitat is abundant throughout the study sites, intermixed with invasive giant reed, Arundo donax, which is currently dominant in many locations only in the middle watershed. Non-native perennial pepperweed, Lepidium latifolium, is found at many sites mainly along paths and trails. Other dominant non-native vegetation includes castor bean, Ricinus communis, poison hemlock, Conium maculatum and Tamarisk, Tamarix ramosissima. Other than storm run-off, the river’s water flow is from discharged treated water, urban runoff, very limited natural springs and upwelling in the Prado Basin, and releases from Seven Oak’s Dam. The river is subjected to heavy human impacts for recreation such as swimming, fishing, paintball gaming, horseback riding, unauthorized trails, and off-road vehicle use.
In addition to long stretches of riparian habitat on the Santa Ana River from Riverside to Norco, the Hidden Valley Wildlife Preserve was monitored. It is located along the Santa Ana River in western Riverside County and supports 1,300 acres (526 ha) of riparian habitat. The area monitored over the last decade is Hidden Valley, south side of the river, and currently refers to approximately 660 acres (267 ha) of riparian habitat on the south side of the river bounded roughly by the river on the north, Pedley St. on the west and Tyler St. to the east. The 25 acre patch of habitat on the south side of the river between Tyler St. and Van Buren Blvd. burned in 2009 and still contains no vireo territories though it is occasionally used for foraging. Historically these vireos were reported as Santa Ana River Mission-Van Buren birds, but from now will be reported as Hidden Valley birds. Some of this habitat was inaccessible in 2005-2007 due to the 2005 flooding of the Santa Ana River and subsequent breaks in the levee diverting water to the Hidden Valley pond system. Horse trails and service roads exist throughout the site. There is an education center that provides tours and education programs for school districts. Since 2010, nest monitoring has been done on approximately 340 acres (138 ha) in the Hidden Valley Wildlife Preserve on the north side of the river. These data are reported separately. Hidden Wildlife Valley Preserve is owned by the State of California and operated by the County of Riverside.
The Santa Ana Canyon was surveyed from Prado Dam to Weir Canyon Road, a distance of approximately nine miles (14 km). The width of the habitat is often less than 200 m. A public golf course covers approximately two miles (3.5 km) of the habitat and about 4.4 miles (7 km) in the County of Orange’s Featherly Regional Park. Parts of the habitat are subject to heavy human disturbance. A heavily used California state highway, the 91 freeway, is built along the entire length of the canyon. Because of the differences in the habitat throughout the canyon, it was divided into three sites for purpose of analysis: the upper canyon from Prado Dam to the beginning of the Green River Golf Club includes canopied habitat and open fields; the Green River Golf Club and Featherly Regional Park are characterized by narrow strips of riparian habitat.
The San Jacinto sub-watershed, along the San Jacinto River above State Street, was managed and several surveys were done throughout the season. The length of this section of the river is approximately 5 miles (8 km). This section of the river is bounded between 2 levees, for a habitat width of 130 to 472 meters. Parts of the habitat are subject to human disturbance, particularly off-road vehicle use and trash dumping.
LBVI AND SWFL REPORT 2014 SANTA ANA WATERSHED ASSOCIATION RESULTS
6
Surrounding land use includes a golf course, agricultural land, retention basins for a local water district, private plant nursery, and residential. The San Jacinto Wildlife Area, east of Lake Perris and north of Ramona Expressway, was also monitored in 2014. This area is owned by the State of California and includes approximately 9,000 acres of restored wetlands, including ponds and marshes. It is currently surrounded by open fields, agricultural land, a seasonally dry lake bed, and a horse ranch.
San Timoteo Creek was surveyed from Cooper's Creek to approximately 15 miles (24 km) downstream. A program initiated by SAWA to restore riparian habitat has removed giant reed along the entire creek watershed. The canyon’s immediate uplands contain citrus groves and remnants of over grazed coastal sage scrub and chaparral. A railroad and a two-lane road border the canyon. Development of portions of the uplands continues to occur.
Mockingbird Canyon was surveyed from Wood Road to the reservoir at Gage Canal. The canyon is characterized by willow species with an under story of mulefat, Yerba mansa, Anemopsis californica, and watercress, Rorippa nasturtium-aquaticum. Residential development is occurring immediately adjacent to the creek on Riversidian alluvial sage scrub. Gage Canal basin is characterized by a large seasonally dry streambed leading to the reservoir that contains native riparian vegetation, and exotics including Arundo donax and perennial pepperweed, which were removed in 2003 and are currently being monitored and re-treated as needed.
Habitat was surveyed along approximately 26 miles (42 km) of Temescal Canyon, from Railroad Canyon, around Lake Elsinore, to approximately two miles upstream of the intersection of Magnolia Avenue and Temescal Creek. This site was not closely monitored for Least Bell’s Vireo in 2014. Special care was taken to document an accurate territory count, and as much reproductive status as time allowed. Temescal Canyon is characterized by patchy, dense riparian vegetation. Privately owned sand and gravel mines operate downstream adjacent to the creek. A commercial fishing lake occurs near the middle section of the wash. Areas of complete channelization without riparian habitat occur downstream of Lake Elsinore, and the most downstream section of the wash. Many sections of the wash are channelized by riprap and berms, but allow for good quality riparian habitat. Residential development of the upland has occurred along portions of the creek.
Fragments of Chino Hills were monitored: the Butterfield Ranch site which includes two drainages on both sides of Butterfield Ranch Road, Slaughter Canyon Creek at Butterfield Park, and a flood basin at Brookwood Lane. Another small ravine off Butterfield Ranch Road was added to the survey in 2009. In 2012, another riparian patch adjacent to Slate Dr. was added to the survey area.
San Timoteo Canyon was surveyed by Allyson Beckman. The Santa Ana River between Riverside Avenue and Van Buren Boulevard was surveyed by Maricela Paramo Archer with assistance from Talula Barbee. Hidden Valley, south side, was surveyed by Sue Hoffman with assistance from Nicole Housel; Hidden Valley, north side was surveyed by Maricela Paramo Archer. The Santa Ana River from River Road to Hidden Valley (Norco) was surveyed by Jill Coumoutso, Cameron Macbeth, and Talula Barbee; the Santa Ana Canyon below Prado Dam was surveyed by Melody Aimar. Mockingbird Canyon was surveyed by Jill Coumoutso and Nicole Housel. The Meridian Conservation Area (formerly March SKR Preserve) was surveyed by Allyson Beckman
LBVI AND SWFL REPORT 2014 SANTA ANA WATERSHED ASSOCIATION RESULTS
7
and Nicole Housel. Sycamore Canyon was surveyed by Cameron Macbeth. Chino Hills was surveyed by Melody Aimar and Jill Coumoutso. San Jacinto was surveyed by Nicole Housel. Irvine Regional Park was surveyed by Talula Barbee and Maricela Paramo Archer. Temescal Canyon was monitored by Cameron MacBeth, Melody Aimar, Nicole Housel, Jill Coumoutso, Talula Barbee, Maricela Paramo Archer, and Henry Armijo.
Patch sizes of the assessment surveys ranged from long stretches of ravines such as Allesandro and Prenda Ravines to small patches in urban parks as found in Norco and Chino Hills.
RESULTS
Vireo Abundance
In 2014, vireo abundance remained stable with documentation of 1582 territories throughout the watershed including Prado. SAWA and cooperators documented a 4% increase in abundance from 1021 territories in 2013 to 1062 territories in 2014. Prado documented a 7% decreased from 561 in 2013 to 520 in 2014. In 2013, vireo abundance throughout the watershed, including Prado, increased 28% from 1,237 territories in 2012 to 1,582 territories in 2013 (Tables 1A and 1B).
SAWA and cooperators documented 481 pairs in 2014, an increase of 2% from the 471 documented in 2013. The number of documented fledglings decreased by 20%, from 682 in 2013 to 548 in 2014. This apparent decrease may be due to staffing limitations in 2014 although the consequences of the continuing drought and potential lack of food cannot be ignored. Reproductive success decreased by 0.8% in 2014 from 2013. The 2014 numbers do not include data from San Bernardino County which documented 30 territories in 2012.
About half of all managed sites showed an increase in abundance, the other half showed a decrease in abundance. Subpopulations at San Timoteo Canyon, Hidden Valley Wildlife Preserve, and Santa Ana Canyon at Green River Golf Course increased by 13 -18%, while Sycamore Canyon increased by 42%. Large decreases in vireo abundance were documented along the Santa Ana River (a 15% decrease), Mockingbird Canyon, a 26% decrease, San Jacinto, a 15% decrease, and the fragmented Chino Hills, a 23% decrease.
Abundance - Vireo Assessment Surveys
Two hundred- eight vireo territories were detected at 58 sites in the Santa Ana watershed during the 2014 assessment surveys (Tables 10 and 11). This is the highest count since the surveys started. These surveys began in 2005 and 2006 when 36 and 35 territories respectively were documented. There were large increases in numbers from 2007 to 2009 and from 2010 to 2012 the numbers stabilized between 146 and159. In 2013 the numbers increased to 197. These surveys were conducted in patches of riparian habitat isolated from the larger tracts of habitat where biologists manage vireos.
Some of these patches have developed sizable populations. Alessandro Arroyo in Riverside has doubled its population in 2014 to 19 documented territories. Poorman
LBVI AND SWFL REPORT 2014 SANTA ANA WATERSHED ASSOCIATION RESULTS
8
Reservoir population increased from 2 in 2013 to 6 in 2014. There are now 20 territories documented at Lake Perris, 15 in Peter’s Canyon in Orange County, and 13 in the riparian corridor upstream from Irvine Lake in Orange County. Vireos were documented at a few sites in 2014 where none had been observed previously. Small patches of habitat at Gilmore at Hwy 15 in Corona, Canyon Crest and Woodcrest in Riverside were occupied in 2014.
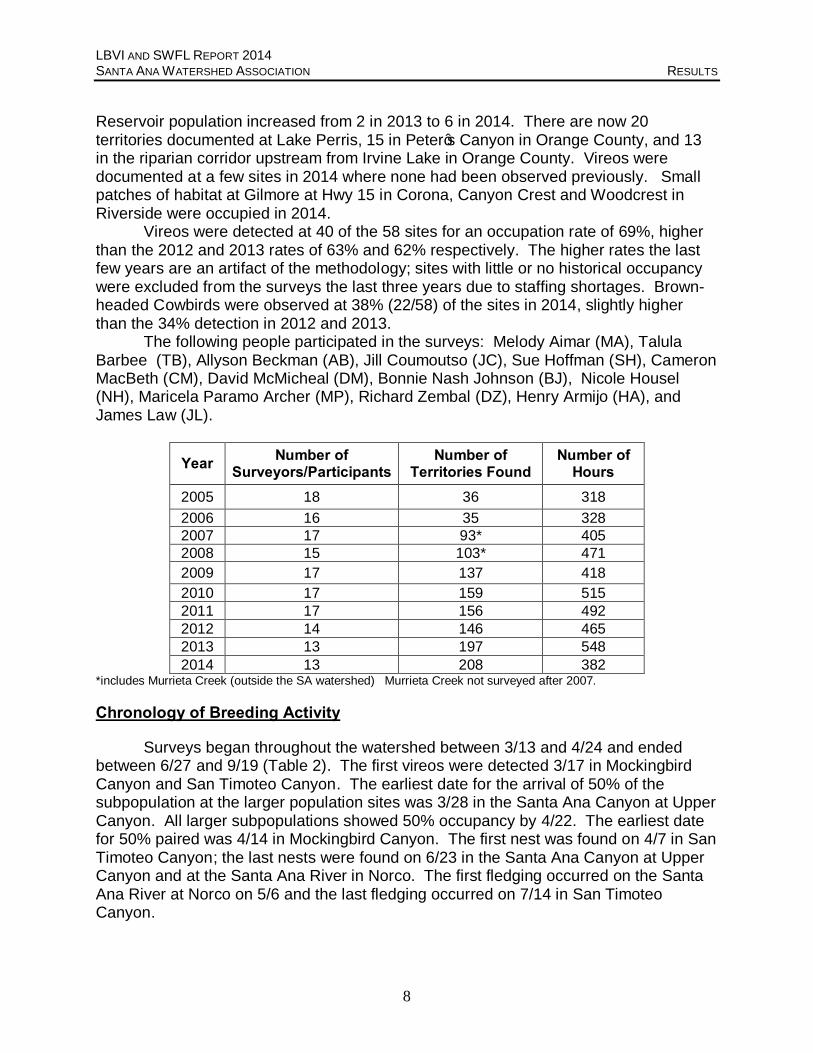
Vireos were detected at 40 of the 58 sites for an occupation rate of 69%, higher than the 2012 and 2013 rates of 63% and 62% respectively. The higher rates the last few years are an artifact of the methodology; sites with little or no historical occupancy were excluded from the surveys the last three years due to staffing shortages. Brown-headed Cowbirds were observed at 38% (22/58) of the sites in 2014, slightly higher than the 34% detection in 2012 and 2013. The following people participated in the surveys: Melody Aimar (MA), Talula Barbee (TB), Allyson Beckman (AB), Jill Coumoutso (JC), Sue Hoffman (SH), Cameron MacBeth (CM), David McMicheal (DM), Bonnie Nash Johnson (BJ), Nicole Housel (NH), Maricela Paramo Archer (MP), Richard Zembal (DZ), Henry Armijo (HA), and James Law (JL).
Year Number of Surveyors/Participants
Number of Territories Found
Number of Hours
2005 18 36 318 2006 16 35 328 2007 17 93* 405 2008 15 103* 471 2009 17 137 418 2010 17 159 515 2011 17 156 492 2012 14 146 465 2013 13 197 548 2014 13 208 382
*includes Murrieta Creek (outside the SA watershed) Murrieta Creek not surveyed after 2007.
Chronology of Breeding Activity
Surveys began throughout the watershed between 3/13 and 4/24 and ended between 6/27 and 9/19 (Table 2). The first vireos were detected 3/17 in Mockingbird Canyon and San Timoteo Canyon. The earliest date for the arrival of 50% of the subpopulation at the larger population sites was 3/28 in the Santa Ana Canyon at Upper Canyon. All larger subpopulations showed 50% occupancy by 4/22. The earliest date for 50% paired was 4/14 in Mockingbird Canyon. The first nest was found on 4/7 in San Timoteo Canyon; the last nests were found on 6/23 in the Santa Ana Canyon at Upper Canyon and at the Santa Ana River in Norco. The first fledging occurred on the Santa Ana River at Norco on 5/6 and the last fledging occurred on 7/14 in San Timoteo Canyon.

LBVI AND SWFL REPORT 2014 SANTA ANA WATERSHED ASSOCIATION RESULTS
9
Nesting Site Preferences
Nesting site preferences followed parameters previously documented by other observers (Pike et al. 1999). Nests were found mostly in riparian vegetation, near water, along dirt trails or roads, and on edges of rows of willows and other riparian vegetation.
Mulefat, Baccharis salicifolia, dominated the nest placement preference for vireos with 33% (57/174) of nests (Table 4). Five species of willow (Salix spp.) held 28% (49/174) of nests in 2014. Arroyo willow, Salix lasiolepis, was the most preferred of the willows holding 28 nests. Other nest-host species in 2014 included but not limited to: wild grape, Vitis girdiana; black elderberry, Sambucus nigra; Fremont cottonwood, Populus fremontii; mugwort, Artemisia douglasiana; toyon, Hetermeles arbutifolia; Poison oak, Toxiocodendron diversilobum; laurel sumac, Malosma laurina; Western sycamore, Platanus racemosa; and golden currant, Ribes aureum. Average nest height was 37” (range 10”-87”) for 155 nests.
Since 2000, 47% of all nests have been found in willow species with arroyo willow and black willow predominating. Mulefat has held 29%. Eleven nests have been found in the black walnut, Juglans californica. Non-native vegetation used by vireos in the watershed include mustard, Brassica spp., Myoporum, Myoporum luteum, Yellowspine Thistle, Cirsium ochrocentrum, perennial pepperweed, Lepidium latifolium, cocklebur, Xanthium strumarium, (now considered native but of weedy growth habit) and poison hemlock, Conium maculatum (Appendix B, Table B-2). Care should be taken when invasive plant spraying is done during the nesting season.
Reproductive Success
Reproductive success as measured by productivity of well-tracked pairs was 2.2 in 2014. This rate represents a decrease from 3.0 in 2103, 2.8 in 2012, and 2.9 in 2011. Nesting success was 48%, a decrease from 61% in 2013 and 60% in 2012 (Appendix B). Average clutch size was 3.2 based on 434 nests (Table 5). See Appendix C for individual site data over time. This year was the first year nesting success was below 50% since at least 2003.
Fifty-four percent of nests lost eggs or chicks during the incubation and nestling periods. This rate includes total depredated nests, but also includes missing eggs or chicks from successful nests. The depredation rate this year was only 43%, see below.
Predation Rates
In 2014, the depredation rate (complete nest loss) was 43%. Rates varied among sites (Table 5, row M.c.). At sites with more than 5 nests monitored, rates varied between 17% and 64%. Historically, watershed-wide, nest loss due to depredation is 32% (Appendix B, Table B-3, row M.c.). Most nest losses were due to unknown predators. Suspected nest predators include Western Scrub-jay, Aphelocoma californica, Greater Roadrunner, Geococcyx californianus, long-tailed weasel, Mustela frenata, raccoon, Procyon lotor, and snakes. In previous years, scrub-jays have been observed carrying eggs in their bills. A California kingsnake, Lampropeltis californiae,

LBVI AND SWFL REPORT 2014 SANTA ANA WATERSHED ASSOCIATION RESULTS
10
has also been observed eating a nestling vireo. These species occur at most sites throughout the watershed.
Feral hogs, Sus scrofa, are another potential predator. This species occurs in high numbers in San Timoteo Canyon and Hidden Valley. Isolated sightings have been made in other areas throughout the watershed. Feral hogs are extremely disruptive to habitat, by creating wallows, possibly trampling or knocking over nests, and eating a wide range of vegetation and animals.
Brown-headed Cowbird Parasitism
The parasitism rate was 5% in 2014. The rate has ranged from 2% to 5% in the last few years. Parasitism was documented at three sites in 2014: San Jacinto, San Timoteo Canyon, and Sycamore Canyon. Five nests were lost to parasitism in 2014. Previous nest losses due to parasitism have ranged between 1-3%. The criteria for judging nest failure being due to parasitism is the loss or abandonment of vireo eggs in the presence of a cowbird egg. In 2014, five nests were manipulated, two of which successfully fledged five young. Since SAWA began nest monitoring, SAWA has manipulated 10% of tracked nests and 196 vireos have fledged from those nests (Appendix B, Table B-3).
Repaired Vireo Nests
Three nests were repaired in 2014. All nests were located in the Santa Ana Canyon; one at Green River, and two at Featherly Park. Two of these three repaired nests successfully fledged five vireo young. Since SAWA has managed vireo nests in the watershed, 34 nests have been repaired and 70 young have fledged from those nests (Appendix B, Table B-3). Site Summaries 2014
SAN JACINTO SUMMARY
In 2014, forty-five vireo territories were detected in San Jacinto, down from 53 in 2013, but up from 42 in 2012. Monitoring efforts were greatly reduced in 2014, compared to the previous year, which may account for the apparent decrease in vireo numbers at this site. Most of the vireos were clustered on the San Jacinto River, upstream of State Street adjacent to Soboba Road. Since 2004, this sub-population has increased steadily from 3 territories. Out of the 45 territories, 6 were located in the San Jacinto Wildlife Area. The section of riparian habitat between Sanderson Avenue and Bridge Street was not surveyed in 2014, but in 2013 and 2012 this section held 7 and 2 territories, respectively.
Nineteen known pairs and 12 fledglings were detected in 2014. Due to staffing limitation, this site was not surveyed with the intent of finding nests. As a result only two nests were found incidentally this year, and only one was considered “well-tracked”. Both of these nests were unsuccessful. One was knocked down during a wind storm,

LBVI AND SWFL REPORT 2014 SANTA ANA WATERSHED ASSOCIATION RESULTS
11
and the tracked nest was abandoned due to parasitism. In the last 10 years, depredation has been a major cause of nest loss, with 34 out of 91 (37%) tracked nests failing due to depredation. Since 2005, 250 vireo fledglings have been documented in San Jacinto. Measures of reproductive success have varied over the years due in part to low vireo numbers and differential monitoring efforts.
When SAWA began monitoring San Jacinto in 2003, no vireos were detected, but cowbirds were common in the habitat. SAWA initiated cowbird trapping in 2003 at several local dairies. Over 1,000 cowbirds were removed from San Jacinto in the first year of trapping. A trap was deployed in 2006 on a levee near the sub-population of vireos in the river with the assistance of the Eastern Municipal Water District. Overall, 19,189 cowbirds have been removed from San Jacinto during the vireo breeding season. Cowbird trapping has most likely played a large role in the increased vireo population size. Parasitism rates decreased from 50% in 2006 to 13% in 2007 and 0% in 2008. In 2009 the parasitism rate increased to 11%, but no parasitism was documented in 2010. In 2011 and 2012, parasitism was documented at 10% and 8%, respectively. In 2013 no parasitism occurred in well-tracked nests, but 2 vireos were observed feeding cowbird fledglings, while in 2014 the one well-tracked nest was parasitized and abandoned. This vireo was later found feeding a cowbird fledgling from a second nesting attempt. A second vireo was also observed feeding a cowbird fledgling. Both of these birds were located in the San Jacinto Wildlife Area. The last year cowbird traps were deployed in the wildlife area was in 2009. Since then, cowbirds have been observed in increasing numbers at this location. We recommend cowbird traps again be deployed in the wildlife area to help control cowbird numbers, and give the vireo, and other avian species, a chance for successful reproduction. Without cowbird traps, it is likely vireos will continue to be parasitized at this location.
Due to the early successional habitat in this portion of the San Jacinto River, vireos are limited to only a handful of plant species from which to choose for nesting sites, compared to other locations. Narrow-leaf willow (57%) and mulefat (35%) have been the primary plant species used for nest placement in San Jacinto since 2004 (n = 99 nests). Black willow held another 5% of nests. Only 3 of the 99 nests found from 2004-2014 were placed in non-native vegetation, two (2%) in tamarisk and one (1%) in black mustard.
SAN TIMOTEO SUMMARY
In 2014, 151 vireo territories were documented in San Timoteo, up 15% from the 131 documented in 2013. A possible reason for this increase could be that a more intense survey effort was undertaken in 2014. However, the population in San Timoteo has experienced an overall increase of over 2200% in the past 14 years. This increase can be attributed to the removal of invasive species and subsequent restoration of native vegetation, nest monitoring, and cowbird management. San Timoteo originally contained many invasive plant species, most notably arundo (Arundo donax) and tamarisk (Tamarix sp.). SAWA removed 239 acres of invasive plants from 1997 to 2001, and continues a maintenance program to control regrowth. Restoration of the native plant community through natural recruitment has taken place throughout the

LBVI AND SWFL REPORT 2014 SANTA ANA WATERSHED ASSOCIATION RESULTS
12
canyon resulting in a healthy riparian under-story, effects of natural storm cycles notwithstanding.
One hundred thirty-five pairs and 206 fledglings were detected in 2014. Nesting success was 48%, down from 57% in 2013 and 64% in 2012. Nest losses were primarily due to predation (44%). Forty-eight well-monitored pairs had a 2.5 reproductive success rate, down from 3.6 in 2013. Nesting success is 57% over 14 years of monitoring (n=657 well-tracked nests), ranging from a low of 29% in 2004 (n=31 nests) to a high of 100% in 2001 (n=4 nests). Depredation has been the major cause of nest loss in the last 14 years; 35% of all nests have been lost due to depredation. Overall reproductive success based on productivity of well-tracked pairs in the last 14 years is 2.8 and has ranged from a low in 2004 of 0.8 to a high of 3.9 in 2009.
Cowbird trapping has occurred in San Timoteo since 2001, and a total of 2,219 cowbirds have been removed from San Timoteo Canyon during this time. In 2014, five of 88 well-tracked nests (6%) were parasitized by cowbirds; two nests successfully fledged vireo after nest manipulation, one nest failed due to predation after removal of the cowbird egg, and two were abandoned (one before nest manipulation and one after). In 2013, 2 of 76 well-tracked nests (3%) were parasitized however neither nest failed due to parasitism; one nest was successful after removal of a cowbird egg and the second failed due to predation after removal of the egg. In 2012, one of 45 well-tracked nests (2%) was parasitized and caused subsequent abandonment and nest failure. In 2011, no well-tracked nests were parasitized; this was the first time in eleven years parasitism had not been documented in San Timoteo. These low rates remain a marked decrease from a high of 75% in 2001. Although parasitism by cowbirds still occurs, at a rate of 17% over fourteen years (114 of 657 nests), only 4% of nests (28 of 657) have failed due to parasitism. This low failure rate is primarily a result of intensive nest monitoring efforts which include nest manipulation.
Mulefat (29%), arroyo willow (21%) and red willow (16%) have been the primary plant species used for nest placement in San Timoteo since 2001 (n= 719 nests). Black willow held another 9% of the nests. Only seven nests found from 2001-2014 were placed in non-native vegetation.
Although the riparian area is protected under existing laws, residential and utility development continues in San Timoteo Canyon. Current threats to the riparian habitat include removal of vegetation by landowners, human encroachment (i.e. paintball and all-terrain vehicle activities), and sheep and cattle grazing. During 2008, a new threat arose in the form of feral pig rooting. While it has long been known that feral pigs were present in the canyon, their growing presence and resulting habitat destruction has increased over the years.
Another potential threat to the habitat is the reduction in volume of surface water discharge into San Timoteo Creek. A local water district began the phased reduction of 3 million gallons per day (mgd) of tertiary-treated discharge to the creek in the Fall/Winter 2012. Hydrology and water use studies were conducted to identify the amount of discharge necessary to maintain existing riparian conditions in the creek and studies determined that discharge could be cut to 1.6 mgd. A Habitat Management Plan was established which calls for management (i.e. increasing discharge to the

LBVI AND SWFL REPORT 2014 SANTA ANA WATERSHED ASSOCIATION RESULTS
13
creek) if a decline in native riparian cover or an increase in non-native invasive species is detected.
SYCAMORE CANYON SUMMARY
Sycamore Canyon has been occupied by Least Bell’s Vireo since monitoring by SAWA biologists began in 2003. Nearly all of the canyon, except for a small portion in the southernmost area, is encompassed within the Sycamore Canyon Wilderness Park and is managed by the City of Riverside. The park is completely surrounded by development and is frequently visited by local residents pursuing outdoor recreational activities such as mountain biking, hiking, and dog walking. The terrain in the park varies from rolling hills in the southern portion, to a very steep canyon in the northern half of the park. In addition to the 3.38 mile long main canyon, the western area of the park contains a smaller 1.42 mile canyon that is difficult to access. Suitable Least Bell’s Vireo habitat can be found throughout much of the canyons, except for a few sections in the middle and northern part of the main canyon that are dominated by mature Western sycamore trees. These areas lack a meaningful amount of understory and are not dominated by willows. Additionally, a portion of habitat in the mid-section of the main canyon was destroyed by a wildfire in July 2013. The fire burned at least 283 acres of the park and destroyed at least one historical vireo territory. The upland sides of the canyons are dominated by coastal sage scrub and non-native grasses.
In 2014, seventeen territories were detected, which is an increase of 42% from the estimated 12 of 2013. Of the 17 territories, 29% (n=5) were known to be paired and nests were found for three pairs. Only one of the three pairs was known to successfully fledge young. As a result, nesting success was at its lowest in 2014 at 25% compared to 50% (n=4) in 2008, and 100% (n=2) in 2007. The other two pairs were unsuccessful with their first nests due to cowbird parasitism, and a second attempt by one of the pairs was depredated.
No breeding data was gathered in 2003 or 2006. In 2004, three nests of two breeding pairs were monitored, producing 2.0 fledglings per pair. The first nesting attempt of one of these breeding pairs resulted in a failure due to parasitism while the other nest loss occurred due to depredation. Until 2014, no nest monitoring had occurred since 2009. Sixty-two fledglings have been observed since monitoring began.
Cowbird trapping occurred in Sycamore Canyon from 2004-2009, and 81 cowbirds were removed from the canyon during this time (42 of these captures occurred in 2004). No cowbirds were removed from the area in 2009. Trapping was discontinued due to lack of sites that could be secured from vandalism. In 2014, cowbird trapping was re-initiated after the start of the breeding season due to nests being parasitized (50%, n=2). Nine cowbirds were removed at Sycamore Canyon over 75 trap days in 2014.
MERIDIAN CONSERVATION AREA (FORMER MARCH SKR PRESERVE) SUMMARY
In 2014, twenty-one vireo territories, 16 pairs, and 23 fledglings were detected in the Meridian Conservation Area (MCA) and a portion of the former March SKR
LBVI AND SWFL REPORT 2014 SANTA ANA WATERSHED ASSOCIATION RESULTS
14
Preserve. The MCA is located in the former March SKR Preserve and is under management by the Riverside Land Conservancy. Riparian habitat just south of Van Buren Boulevard previously surveyed by SAWA as an assessment site was also included in the MCA monitoring area in 2014. Since SAWA began monitoring in 2004, over 150 fledglings have been detected in the former March SKR Preserve.
Measures of reproductive success have varied over the years, due in part to differential monitoring efforts. In 2014, nesting success was 33% (n=3 nests). Two nests failed due to depredation. From 2011-2013, no nest monitoring took place at this site. From 2004 to 2010, nesting success was 77% (n=22 nests). Reproductive success of tracked pairs is 4.6 over 6 years of monitoring. Black willow has been the primary choice for nest placement at this site (38%), followed by arroyo willow (31%) and red willow (27%).
The Meridian Conservation Area is an important piece of the remaining, fragmented riparian habitat in Southern California. A full complement of riparian birds and wildlife occupies this site. Willow Flycatchers, Empidonax traillii, have been detected in the riparian habitat in previous years. Multiple sightings occurred in 2008 and one sighting in 2009, however breeding was not confirmed. In 2014, species listed on the Western Riverside County MSHCP found at the MCA included 10 Yellow Warbler territories, Horned Lark, granite spiny lizard, coyotes, and black-tailed jackrabbits.
Although the Meridian Conservation Area is currently protected, foraging opportunities in the upland habitat are severely limited by current development. The habitat patches currently protected are narrow ribbons of riparian vegetation which support the vireos and associated nesting birds in part because of the adjacent open space and surface water in creeks. Recent legal decisions have upheld that this upland habitat will be developed, leaving narrow riparian strips of habitat with little upland support and buffer.
SAWA biologists remain dedicated to contribute efforts to maintain the former SKR Preserve. In August of 2011, several scientists from different environmental agencies, including SAWA biologists, met to discuss information regarding existing habitat and species found in the preserve.
MOCKINGBIRD CANYON SUMMARY
In 2014, twenty-three vireo territories were detected in Mockingbird Canyon, down from 31 territories in 2013. Monitoring efforts were greatly reduced in 2014 compared to the previous year, which may account for the apparent decrease in vireo numbers at this site. Due to staffing limitations, only a portion of Mockingbird Canyon, the section from Markham Street upstream to Alder Avenue, was monitored throughout the breeding season. This section contained 6 territories. The remaining 17 territories were detected early in the season below Markham but were not followed. The Gage Canal Basin, below Van Buren Blvd, was not surveyed this year. Monitoring in Mockingbird Canyon began in 2003, with nine territories detected.
Seven pairs and 7 fledglings were detected in 2014. Four of these pairs and all fledglings were detected in the portion of this site that was monitored throughout the breeding season. Three nests were found incidentally in 2014 and two were well-

LBVI AND SWFL REPORT 2014 SANTA ANA WATERSHED ASSOCIATION RESULTS
15
tracked. One of these tracked nests failed due to unknown reasons, the other was successful and fledged three young. Measures of reproductive success have varied over the years due in part to differential monitoring efforts. Overall success rate of tracked nests has been 53% (79 out of 148 nests) since 2003. Since 2003, 396 vireo fledglings have been documented in Mockingbird Canyon
In the last 11 years, depredation has been the major cause of nest loss, with 51 out of 148 (34%) tracked nests failing due to depredation. When monitoring began at this site, nest parasitism was high, with 8 out of 13 tracked nests parasitized and 4 of those nests failing as a result of parasitism. Beginning in 2004, an intensive cowbird management program was initiated. The parasitism rate decreased sharply after this management program began. Parasitism continues to occur episodically, but seems to be controlled. Several land owners have allowed traps on their property which has facilitated our program.
Red willow (31%) has been the primary choice for nest placement at this site, along with black willow (18%) and black elderberry (15%). Throughout the entire watershed, mulefat is a top choice for nest placement. In Mockingbird Canyon, mulefat has been documented for only 9% of nests found. Some nests have been placed in non-native vegetation, such as perennial pepperweed and Peruvian pepper trees. As of 2014, vireos at this site have nested in 23 different plant species or combination of species; 55% of nests have been placed in willow species or combinations with willow species.
Although the reservoir and basin are protected from development at this time, residential development continues throughout Mockingbird Canyon. Most of the adjacent upland habitat will soon be lost and the creek is becoming more fragmented by culverts and bridges. The riparian habitat throughout the entire site is continually threatened by ATV and paintball activities, as well as large amounts of trash dumping and other illegal activities. Additionally, because most of the property boundaries extend to the middle of the creek, landowners freely alter the vegetation structure on their property in the floodplain to make “park-like” areas. This removal of understory vegetation eliminates valuable nesting habitat for the vireo and other songbird species. Mockingbird Canyon is a prime candidate for the development and implementation of an open space management plan. SAWA recently acquired an 11-acre easement in Mockingbird Canyon at Roosevelt and Markham, and will continue to work with local property owners to enhance the canyon’s natural resources.
SANTA ANA RIVER – RIVERSIDE AVE. TO VAN BUREN BOULEVARD SUMMARY
In 2014, 66 vireo territories were documented along the Santa Ana River from Riverside Ave. to Van Buren Blvd, a decrease of 14% from the 77 vireos documented in 2013. This decline in the abundance of vireo territories can most likely be attributed to a decreased survey effort due to safety concerns caused by the increase in homeless camps along the river. The areas that were either not surveyed, or had limited nest searching done, included the area just upstream of Van Buren/Clay, as well as by Market Street. In 2013, SAWA added additional habitat to this site by including the river upstream of Mission Ave to Riverside Ave.

LBVI AND SWFL REPORT 2014 SANTA ANA WATERSHED ASSOCIATION RESULTS
16
Nineteen pairs and 15 fledglings were detected in 2014. Nesting success for 3 nests was 67% and the one loss was due to predation (33%). Five pairs were well monitored and reproductive success was 1.2 fledglings per pair. Over fourteen years the nesting success is 67% (n=99 well-tracked nests). This success rate is a limited data set due to the constraints of the survey site. While efforts are made to ensure all territories and pairs are accounted for, the dangers in some parts of the river, e.g. homeless camps, limit the number of sites that can be safely monitored due to staffing restrictions.
Brown-headed Cowbird trapping has occurred on private business and homeowner locations since 2002, and 624 cowbirds have been removed from the site during that time. Since trapping began, the rate of cowbird nest parasitism of well-tracked nests of Least Bell’s Vireo has decreased from 67% in 2002 to 0% from 2006 to 2010. In 2014, no cowbird nest parasitism was observed. With a total of 256 trapping days, 17 cowbirds were removed from the habitat. This is a decrease in trapping days (540 trapping days in 2013) and cowbirds removed (21 cowbirds removed in 2013). Two half traps were removed from the route due to construction at one of our trap locations which resulted in fewer trapping days. The reduction in trap days most likely caused the decrease in the number of cowbirds removed.
Arroyo willow (30%) and mulefat (30%) have been the primary choices for nest placement at this site. Some nests have been successfully placed in non-native vegetation, such as Tamarisk. To date, vireos at this site have nested in 17 different plant species or combination of species. Overall, 52% of nests have been placed in willow species or combinations with willow species.
This section of the Santa Ana River is bordered by several land uses such as residential, public parks, and waste management facilities resulting in habitat disturbances in many areas along the river. The riparian habitat throughout the entire site is continually threatened and disturbed by homeless encampments, off-road use, horse trail management, and paintball activities.
SANTA ANA RIVER – HIDDEN VALLEY WILDLIFE PRESERVE SUMMARY
(South and north side of river)
SAWA has been monitoring Hidden Valley on the south side of the river between approximately Tyler St. and the Edison service road at the powerhouse since 2000. Data reported as "Hidden Valley" refers to this area. The north side of the river has been surveyed about three times each season since 2005 but in the last few years a greater monitoring effort has been made. With the initiation of the arundo removal project, the north side of the river at Hidden Valley Wildlife Preserve has been added to the nest monitoring schedule. Data are presented separately on the data tables for easier comparison to historical numbers. The Hidden Valley Wildlife Preserve also includes 25 acres adjacent to and downstream from Van Buren. This section of the preserve burned at the end of the 2009 breeding season and currently is used only for foraging by vireos nesting on the north side of the river.

LBVI AND SWFL REPORT 2014 SANTA ANA WATERSHED ASSOCIATION RESULTS
17
North side of the river
Twenty-one territories were documented in 2014. This area was flooded during the winter of 2010-2011 and much of the acreage was scoured. However, habitat is coming back and the spraying of non-natives in some areas has helped the habitat as well. Nest monitoring was not done in 2012 or 2013, but began in 2014.
Fourteen pairs and 19 fledglings were detected in 2014. The number of territories between 2013 and 2014 were the same but there was an increase in the number of pairs from 2013 (2 in 2013) as well as fledglings (3 in 2013). These increases can be attributed to the greater monitoring effort. Two of the three nests tracked were successful. The one loss was due to predation from ants (33%). Of the 14 pairs, four pairs were considered well monitored with a reproductive success of 2 fledglings per pair.
The lack of cowbird trapping in this area as shown by Table 5 is somewhat misleading. One trap was placed on private property near Van Buren Blvd. at Riverdale St. Data for the six traps for this area are found under "SAR - Jurupa Park to Hidden Valley" and "SAR -Hidden Valley to River Rd." South side of the river
The Hidden Valley vireo population on the south side of the river has increased almost 40% in the past 2 years. In 2012, 62 territories were detected. The population increased to 75 territories in 2013 and to 85 territories in 2014. In 2014, 85 territories, 32 pairs, and 28 fledglings were documented. Large increases in abundance (by at least 10 territories) took place between 2001-2002, 2007-2008 and 2009-2010 and now 2012-2014. In 2014, nest searching and monitoring was done by S. Hoffman with assistance from N. Housel.
No pairs were followed closely enough to obtain reproductive success data (# of fledglings per pair). In 2014, nesting success was 67% (3/4 nests). Nesting success in Hidden Valley is variable and has ranged from 41% to 88% in the last 5 years. Hidden Valley has a 65% nesting success rate over the last 15 years. Depredation remains the main cause of nest failure.
Willows, Salix spp., are the most common plant species used for nest placement. Fifty-eight percent of all nests found in the last 15 years were placed in willows, mainly arroyo willow, Salix lasiolepis, and black willow, Salix gooddingii. Mulefat, Baccharis salicifolia, has held 29% of all nests.
Management strategies at Hidden Valley include cowbird trapping as well as nest manipulation. Since 2000, 708 cowbirds have been removed from Hidden Valley over more than 6,200 trap days. A pilot program to control wild grape, Vitis californica, that is growing on and killing mature native trees was initiated in October 2013. Two sites were selected and grape at the base of large trees or growing in low carpets were sprayed with a mixture containing a 4% solution of roundup PROMAX and a 2% solution of Monterrey Super & surfactant. The SAWA Invasive Species Removal crew did the spraying with SAWA biologists monitoring the effort. Translocation of the herbicide up into the vines growing into the trees did not occur to any great extent. However, the lower lying vines were affected.

LBVI AND SWFL REPORT 2014 SANTA ANA WATERSHED ASSOCIATION RESULTS
18
SAWA's Arundo Removal Project. In 2008, SAWA began a project to remove 475 acres of Arundo donax from the 728 acre Hidden Valley Wildlife Preserve. The project was halted in March 2008 due to the onset of the breeding season. At that time, 150 acres on the south side of the river, north of the former agricultural field, had been cleared. Removal of Arundo was expected to continue during the winter of 2008-2009 but state budget problems caused a postponement. The removal project began again in October 2009 and halted at the beginning of the 2010 season. A small amount of hand work cutting arundo began again in August 2010 and the final cutting was completed in November 2010. Herbicide applications will continue for at least the next five years. In 2011, additional habitat was put under contract for arundo removal. Removal took place during the winter of 2011-2012. Spraying continued through the early season 2012 and later in the 2013 season in the presence of biologists. With the completion of the project more habitat will be opened up for monitoring and increases in the extent of native habitat and vireo population are expected.
Opening up of the habitat at Hidden Valley has had other benefits. Illegal activities within the dense stands of arundo was stopped in 2008 and 2009. With more open habitat at Hidden Valley, it is hoped that illegal human activity can be lessened and the quality of the natural resources will be enhanced for the benefit of wildlife.
The river flows changed during the storms of 2010-2011. Large swaths of land were eroded from Hidden Valley and the adjacent river near the Department of Fish and Wildlife ponds was lowered 4 feet in some places (J. Vint, personal comm). The levee system that brings water to the ponds and creek system was washed out. The water flow to the ponds was maintained during the 2009 season but has not occurred since 2010. Riverside County Parks and Open Space has installed a well system that may eventually bring water back to the ponds and creeks. It’s first priority however is to maintain the pond used by the Nature Center for school programs.
Incidental surveys for other species of concern take place during vireo monitoring. In 2014, 155 Yellow Warbler, Setophaga petechia, and 50 Yellow-breasted Chat, Icteria virens, territories were detected. A decline in numbers of a common bird, the marsh wren, Cistothorus palustris, is due to the loss of cattails in dry and silted ponds. Only a few marsh wrens have been detected in the last several years. Before the 2005 flooding, 50 territories were estimated.
Vireos were again documented in habitat adjacent to Hidden Valley at Rancho La Sierra for the fifth year. In 2013, two pairs were documented, one pair had a fledgling. In 2014, one vireo territory was documented. These territories are not included in the data for Hidden Valley Wildlife Preserve but are listed on Tables 1A and 1B under Miscellaneous Sightings.
SANTA ANA RIVER BETWEEN NORCO (GOOSE CREEK GOLF CLUB) AND RIVER RD. SUMMARY
In 2002, this site on the Santa Ana River at Hwy 15 in Norco was heavily infested with the invasive Arundo donax. A fire in 2002 burned much of the biomass, and SAWA took advantage of the opportunity to begin spraying the remaining Arundo. SAWA continued to manage the vegetation for nine years, after which the area was managed by the Inland Empire Resource Conservation District. Vireo nest monitoring and cowbird management began in 2004. Abundance has increased from 28 territories in

LBVI AND SWFL REPORT 2014 SANTA ANA WATERSHED ASSOCIATION RESULTS
19
2004 to 110 territories in 2014. Cowbird trapping has removed 547 brown-headed cowbirds from the habitat. The site has been subject to natural and manmade disturbances over the past few years. In the spring of 2010, riparian vegetation was removed illegally from the site at two vireo nest locations. In the winter of 2011, the site flooded, shifting the river flow in several places, and taking out vegetation in several vireo territories. Some regularly used horse trails were completely washed out. The rental horse stable located at Hamner Road became flooded, eventually causing the business to close. The flooding caused the construction of a dike to be built by the City of Norco, near the old stable location. The dike was built during the spring of 2011, during the vireo breeding season, causing noise disturbance and additional habitat destruction to the site. Again in the winter of 2011, habitat was illegally destroyed on the site. In the spring of 2012, vegetation in a known vireo territory was legally removed for the future widening of Hamner Rd. This section of river slopes from northeast to the southwest and contains habitat-altering flows depending on precipitation. The surrounding land use includes former dairy land, residential, cattle grazing, agricultural, and a golf course. Open water and riparian habitat border the site to the south, southwest and southeast. Interstate 15 crosses the river and directly over vireo habitat.
In 2014, 110 territorial males were detected. Thirty-two of these males were paired and 36 fledglings were detected. This is the highest number of territorial males ever detected on site since monitoring began. Nesting success for 9 well-tracked nests was 44%. This is a 39% decrease from the 83% (n=29) success rate of 2013. It is likely the success rate would have been much higher with a larger sample size. In 2012 the nest success rate was 71% and 45% in 2011.
In 2014 and 2013, nest failures were due to depredation and abandonment, but not parasitism or reproductive failure. Twenty pairs monitored throughout the 2013 season had a productivity rate of 2.2. No pairs were well monitored in 2014 due to staffing limitations. Since monitoring began, at least 924 fledglings have been produced at this site.
The vireo population on the Santa Ana River in Corona-Norco almost doubled between 2004 and 2005 from 28 to 42 territories. In 2006 there was a decrease in vireo numbers, but a decrease in abundance was detected throughout the watershed. In 2007 and 2008, the population grew again to 45 and 65 respectively. Population has continued to increase each year (with the exception of 2012, showing a 9.5% decrease) and hit an all-time high this year with a total of 110 males. Overall nesting success from 2001 through 2014 for the site is 67% (n= 272 nests, range= 33%-100%). Depredation has been the main cause of nest loss; 27% of all nests have been lost to depredation. In 2014, the depredation rate was 56%; up from 14% in 2013. In 2011, the depredation rate was 41%, and in 2012 the rate was 18%. In 2010, the depredation rate was only 11%, which is the lowest rate since 2005.
Cowbird trapping has occurred at Norco annually since 2004. Five hundred and forty-seven brown-headed cowbirds have been removed from Norco over 2,317 trap days. Parasitism has occurred on the site in seven out of the fourteen years surveyed. In 2006, the parasitism rate was 22% and mostly concentrated in the habitat adjacent to the Goose Creek Golf Club. A trap was placed in this area late in the season to alleviate

LBVI AND SWFL REPORT 2014 SANTA ANA WATERSHED ASSOCIATION RESULTS
20
the parasitism with no success. In 2007, a trap was put out in the same location earlier in the season and it captured 68 cowbirds during the first three weeks it was open. There was no parasitism in the targeted area by the golf course; however, parasitism still occurred in other parts of the site at a rate of 16%. In 2008 and 2009, parasitism decreased again, to a rate of 7% (2/29 nests) and 2% (1/45 nests), respectively. In 2010, 2011, and 2012 no parasitism occurred on the site. In 2013, parasitism occurred at a rate of 7% (2/29 nests). No monitored nests were parasitized during the 2014 nesting season.
In regards to preferred vegetation for nest placement, mulefat has held 34% of nests, while arroyo willow has held 32% of all vireo nests (n=320) since 2001. Black willow has held 15%. The riparian vegetation over the entire survey area is greater than 50% native. This area was originally monitored and reported by Pike et al. and encompassed the Santa Ana River only from River Road to Hamner Road. SAWA began to monitor the south side of the river from River Road to Hamner Road in 2000 and in 2004 began to monitor and report numbers on both sides of the river from River Road upstream to the Goose Creek Golf Club in Norco. The early surveys on the south side of the river from 2001-2003 show an increase in numbers from 8 to 12 territories.
TEMESCAL CANYON SUMMARY
SAWA has surveyed Temescal Canyon since 2001 when it began its arundo removal program. Habitat is surveyed along approximately 26 miles (42 km) of Temescal Canyon, including Lake Elsinore, from Railroad Canyon to approximately two miles upstream of the intersection of Magnolia Avenue and Temescal Wash. Temescal Wash is currently being managed for arundo regrowth and native vegetation is being allowed to reestablish. Unfortunately, tamarisk has now become a dominant exotic throughout the wash, especially in areas surrounding Lake Elsinore. Temescal Canyon is characterized by patchy, dense riparian vegetation. Privately owned sand and gravel mines operate downstream adjacent to the creek. A commercial fishing lake occurs near the middle section of the wash. Areas of complete channelization without riparian habitat occur downstream of Lake Elsinore and the most downstream section of the wash. Many sections of the wash are channelized by riprap and berms, but allow for good quality riparian habitat. This site was not closely monitored for least Bell’s vireo in 2014. Special care was taken to document an accurate territory count and as much reproductive status as time allowed. As stated in Methodology, Temescal was monitored by several biologists assigned to a section of the canyon. One hundred twenty-six territorial vireo males were detected. Twenty four of these males were known to be paired and 17 fledglings were detected. This count represents a 3.8% decrease from the count of 131 territorial vireos in 2013, which to date, was the peak year. Cowbird trapping has occurred at Temescal annually since 2001. During these 14 years, 11,422 trap days have resulted in the removal of 2,828 brown-headed cowbirds from Temescal. Parasitism has been documented in Temescal in nine out of the 12

LBVI AND SWFL REPORT 2014 SANTA ANA WATERSHED ASSOCIATION RESULTS
21
years it was closely monitored, reaching its highest rate in 2007 (42%). Literature suggests that cowbirds have different regional dialects and female cowbirds tend to prefer older males that use local flight whistles, to younger males or older males that have a foreign dialect (O’Loghlen and Rothstein 1995 and O’Loghlen 1995). In 2014, as done in 2013 and 2012, we stocked the traps with bait birds that were caught locally. We kept local, second-year male birds in the traps for the remainder of the season as they became available. This methodology was tested in San Timoteo beginning in 2007 and has shown promise with increased captures and decreased parasitism. During the course of the 2014 nesting season, a SAWA field assistant observed a section of occupied vireo habitat just south of Lake Elsinore near Oakview Lane being cleared with heavy equipment. The assistant was informed by the equipment operator the vegetation was being cleared to reduce the risk of wildfire. The incident was reported to the California Department of Fish and Wildlife. Another potential impact to vireo, and other native wildlife dependent on the riparian habitat, is the lack of water in the wash downstream of Dos Lagos Golf Course. A SAWA biologist familiar with that area reported massive vegetation die-off due to lack of water from the historical water treatment outflow, primarily from the City of Corona Wastewater Treatment Plant #3, that was cut-off in the last few years. This information was reported to the California Department of Fish and Wildlife.
CHINO HILLS SUMMARY
The patchy riparian habitat in Chino Hills along Butterfield Ranch Road has been surveyed annually since 2003. These sites include two drainages on both sides of Butterfield Ranch Road, Slaughter Canyon Creek at Butterfield Park and a flood basin at Brookwood Lane. Another small ravine off Butterfield Ranch Road was added to the survey in 2009. In 2012, another riparian patch adjacent to Slate Dr. was added to the survey area. Most of these locations occur on private property for which access is restricted. Therefore, few territories can be closely monitored and monitoring does not occur every year. Several other riparian patches in Chino Hills to the northwest of this site have been surveyed as assessment areas since 2005. Results from assessment surveys can be found in Tables 10 and 11.
In 2014, 10 territorial least Bell's vireos were detected. Two of these males were known to be paired and 3 fledglings were detected. Although this count represents a 23% decrease from 2013 (n = 13), nest monitoring was not conducted and the survey effort was reduced in 2014, increasing the possibility that some birds were missed.
Cowbird trapping has occurred in Chino Hills since 2008 when one secure location was found with the assistance of the City of Chino Hills. During 833 trap days, 65 cowbirds have been removed from Chino Hills/Butterfield Ranch. Parasitism has ranged from 43% (3/7 nests) in 2004 to 60% (3/5 nests) in 2007. There has been no parasitism detected since 2008 when cowbird control began. Although little nest monitoring has been done at this site, no vireo have been found with cowbird fledglings and few juveniles (none in 2014) have been trapped. Because of the high parasitism rates in this part of Chino Hills before cowbird control was initiated, it is assumed parasitism may be a problem in the assessment areas of Chino Hills as well. Potential

LBVI AND SWFL REPORT 2014 SANTA ANA WATERSHED ASSOCIATION RESULTS
22
development, human activity, cattle grazing and small fragmented habitat patches are additional factors that confront vireo and likely reduce productivity throughout the Chino Hills area.
SANTA ANA RIVER — SANTA ANA CANYON SUMMARY
The Santa Ana Canyon (SAC) is located along the Santa Ana River, downstream of the Prado Dam to the Weir Canyon/Yorba Linda Blvd. Bridge. The SAC is divided into 3 different sites referred to here as the Upper Canyon, Green River Golf Club and Featherly Regional Park. This summary discusses the compiled data from these sites which are summarized individually below.
The Freeway Complex Fire of November 2008 destroyed habitat for an estimated 43 territories in SAC. However, this did not deter the vireo returning the following spring as much as expected with only moderate decreases in 2009 at the Upper Canyon and Featherly Park. The US Army Corps of Engineers (Corps) riverbank stabilization project (Reach 9) started in the winter of 2009/2010 near the western half of Green River Golf Club, removing over 16 acres of mature riparian habitat that survived the fire. This particular project directly affected six territories by the massive excavations that were needed to reconstruct the riverbed and banks in order to protect the 91 Freeway and adjacent homes. There were additional riparian impacts in the fall/winter of 2011 as the next phase of the riverbank stabilization project got underway further upstream, removing several more acres of mature riparian habitat. In 2014, Phase 3 of the Corps project began which impacted the habitat of 10 more vireo territories. Additional disturbances in SAC include the on-going County of Orange SARI-line project activities in Featherly Park and Green River Golf Club. Work from all of these projects continued throughout the nesting season which impacted nesting vireo in some areas.
One hundred and twelve vireo territories were detected in the Santa Ana Canyon in 2014, which is down only 2% from the 114 territories detected in 2013. Although the construction activities do not appear to be affecting vireos presence, it may affect the productivity of pairs that are close to the disturbance. The vireo in the Upper Canyon endured little to no disturbance from construction activities and had 83% nesting success. The vireo in the Green River Golf Club endured disturbance from construction activities in the beginning of the season, then no disturbance after mid-May and had 63% nesting success. Featherly Park vireos endured the most disturbances from construction activities and only had a 29% nesting success rate. There were two instances of potential construction-related reproductive failure detected. One vireo nest was abandoned with eggs when Corps Phase 2A work came too close to the nest (within 50 feet). The Corps and the USFWS were notified about the direct disturbance potential before the abandonment. Another nest with eggs was abandoned adjacent to the Phase 3 activities in an area where habitat was removed that did not have a sound wall between remaining habitat and construction activities. It is difficult to say what caused this abandonment, but the pair later fledged successfully from an area behind the sound wall.
In 2014, nesting success for 28 well-tracked nests in the Santa Ana Canyon was 50% overall. Twelve of the 28 tracked nests were lost to depredation (43%) and two

LBVI AND SWFL REPORT 2014 SANTA ANA WATERSHED ASSOCIATION RESULTS
23
were lost to reproductive failure (7%). No tracked nests were lost due to parasitism. Overall nesting success for the site from 2001 to 2014 is 58% (163 of 282 nests). The overall productivity rate of well-tracked pairs during the same time is 1.7. Ninety-two fledglings were documented in 2014, a decrease from the 97 detected in 2013. A total of 887 fledglings have been produced in SAC over the last 14 years.
Although overall nesting success in SAC was documented at 50% for 2014, early nesters appeared to have some resource-based difficulties. Many pairs delayed nest-building and egg-laying. For example, on 4/9 a pair was found finishing a nest, but delayed egg-laying for 3 weeks and then laid only 2 eggs. Both eggs hatched, but one nestling died in the nest and the other was underdeveloped and didn’t fledge until 12 days. Another pair laid 3 eggs, of which only 2 hatched and only one survived to fledge at 12-13 days. Later nesting attempts appeared more typical of the species.
SAWA cowbird trapping began in the Santa Ana Canyon in 2001 when parasitism was detected in five of 19 nests (26%). Parasitism was detected in one of 21 nests (5%) in 2009 after 5 years of no detections. SAWA deployed two traps within a mile of that location and no parasitism has been recorded since. In 2014, 112 cowbirds were removed over 509 trap days. Since 2001, 2,044 cowbirds have been removed from the canyon over 10,206 trap days during the vireo’s breeding season.
The County of Orange has initiated implementation of the Santa Ana River Canyon Habitat Management Plan. SAWA biologists sit on 2 subcommittees overseeing implementation of the plan. Although both the Corps riverbank stabilization (Reach 9) project and the SARI-line project are expected to continue for several years, we hope active management of the canyon will improve and maintain optimum conditions for its native species.
UPPER CANYON – DOWNSTREAM OF PRADO DAM TO THE GREEN RIVER GOLF CLUB
This section of the Santa Ana Canyon, from Prado Dam downstream to the Green River Golf Club, has undergone native habitat removal, restoration, subsequent removal and a devastating fire in the last decade. Heavy construction around and just below Prado Dam occurred from 2005 to 2008. Due to this construction, habitat for 10 territories was removed in 2005. Some of the habitat that was restored after construction is now upland habitat and vireo have not used it, but other restored riparian habitat is maturing and is being used by the vireo. In November 2008 the Complex Fire destroyed a wide swath of habitat that had held six territories that were not detected in 2009 or 2010 (post-fire). These areas were part of Phase 2A of the Corps riverbank stabilization project which is nearly complete in the Upper Canyon portion of the project and restoration activities have begun.
In 2014, this section held 27 vireo territories, which is one less than the number from last year (Table C-1). Nesting success for 6 well-tracked nests was 83%. Four pairs closely monitored throughout the season had a 1.8 reproductive rate. One of the 6 tracked nests (17%) was lost to depredation. No tracked nests were lost due to parasitism. Overall nesting success for the site from 2001 to 2014 is 68%. The overall productivity rate of well-tracked pairs during the same time is 1.8. Twenty-eight fledglings were documented in 2014. A total of 276 fledglings have been produced over the last 14 years (Table C-3). Cowbird trapping has occurred in the Upper Canyon

LBVI AND SWFL REPORT 2014 SANTA ANA WATERSHED ASSOCIATION RESULTS
24
since 2001 when the first vireos were detected on-site. Over 3,011 trap days, 664 cowbirds have been removed from the Upper Canyon. Parasitism has only been documented 2 of the 14 years surveyed and reached its highest rate in 2003 (18%). There has been no parasitism detected in the Upper Canyon since 2003 (Table C-3).
By the end of the 2014 season, the Reach 9 project appeared to be complete at this location, which will relieve pressure to nesting birds caused by the related human activities. Restoration activities have begun, which should expand available habitat for the vireo. Unfortunately, this site continues to be plagued by other human-generated impacts including fisherman intrusion, trash and branch-cutting, as well as large areas of invasive species infestation.
GREEN RIVER GOLF CLUB
Habitat at the Green River Golf Club has recovered well since the devastating Complex Fire that swept through the Santa Ana Canyon November 15, 2008. The Army Corp of Engineers Bank Stabilization project removed almost 16 acres of habitat occupied by 6 vireo that the fire missed. The next phase of the bank stabilization project started during the fall/winter 2011 with several more acres of riparian habitat removed that included mature willow and cottonwood trees that had been spared by the 2008 wildfire. This area supported an additional 13 vireo territories in 2011. The 2010 project phase was roughly 75% complete at the end of the 2012 season with some re-planting underway, but the net result for the 2012 season was still a large loss of habitat and much construction activity, which most likely contributed to the decline in vireo activity that season.
In 2014, no additional habitat was taken. However, construction continued adjacent to occupied habitat upstream of the railroad bridge in the beginning of the nesting season. On May 1st, a vireo nest was found within 100 feet of construction activities that were moving toward the nest. The Corps and USFWS were both notified immediately but work continued toward the nest. By the next week the nest was abandoned leaving 2 eggs. Subsequently, other vireo nests were found near construction activities and work eventually stopped in this area for the rest of the season.
In 2014, the vireo population at this location increased 15% (n=4) to 26 territories. This increase is mostly due to the 3 new territories that settled in the Corps restoration area at the western section of the site. The vireo population at Green River Golf Club has more than doubled since monitoring began in 2001 when only ten vireos were detected (Appendix D-1). Of the 26 males found, 19 were known to be paired and 29 fledglings produced in 2014. Nesting success for 8 well-tracked nests was 63%, as compared to only 25% (1 of 4) in 2013. Two of the 8 tracked nests (25%) were lost to depredation and the abandoned nest mentioned above was categorized as reproductive failure (13%). No tracked nests were lost due to parasitism.
Although overall nesting success was documented at 63%, with a productivity rate of 1.6 this year, early nesters appeared to have some resource-based difficulties. Many pairs delayed nest-building and egg-laying. For example, on 4/9 a pair was found finishing a nest, but delayed egg-laying for 3 weeks and then laid only 2 eggs. Both eggs hatched, but one nestling died in the nest and the other was underdeveloped and

LBVI AND SWFL REPORT 2014 SANTA ANA WATERSHED ASSOCIATION RESULTS
25
didn’t fledge until 12 days. Another pair laid 3 eggs, of which only 2 hatched and only one survived to fledge at 12-13 days. Later nesting attempts appeared more typical.
Overall nesting success for the site from 2001 to 2014 is 64%. The overall productivity rate of well-tracked pairs during the same time is 1.8. Twenty-nine fledglings were documented in 2014. A total of 289 fledglings have been produced over the last 14 years (Table C-3).
Cowbird trapping has occurred at the golf club since 2001 when the first vireos were detected on-site. During 4,012 trap days, 972 cowbirds have been removed from the golf club. When SAWA began monitoring this site, the parasitism rate was 44%. There has been no parasitism detected since 2001 when cowbird trapping was initiated (Table C-1).
Management at the Green River Golf Club has continued its cooperative relationship with SAWA and is supportive of SAWA’s efforts to control cowbirds, manage the vireo and other sensitive species and enhance habitat. In addition to the continued support of our program, Troy Thompson, Green River Golf Club Superintendent, has generously offered to allow SAWA to store over 50 cowbird traps in their maintenance yard last winter. We are incredibly grateful.
FEATHERLY REGIONAL PARK
Featherly Regional Park is located on the Santa Ana River between the Green River Golf Club and the Yorba Linda Blvd/Weir Canyon Rd. Bridge. The park is managed by Orange County Parks. Public access is restricted but there is no fencing and the Santa Ana River Trail and Bikeway runs adjacent to the park. The wilderness area of the park is characterized by dense and patchy riparian vegetation, dominated by willow (Salix spp.) and cottonwood (Populus spp.) species, and associated upland habitat. The privately-run Canyon RV Park and some commercial orange groves are adjacent to the native habitat within park boundaries. Featherly Park is bordered by highway 91and multiple commercial and residential areas. The upstream portion of the river where Green River Golf Club boarders Featherly Park has been impacted by the US Army Corps of Engineers (Corps) reinforcement project. Restoration efforts have produced early successional riparian habitat suitable for nesting birds in this area. Phase 3 of the Corps reinforcement project began in 2014. Habitat was removed on the south side of the river, upstream from the Canyon RV Park. Additional riparian die-off has occurred in the surrounding area due to the project-related river diversion. A 6 foot sound fence was installed between construction and the habitat along most of the project area. No biological monitor was on-site during construction. In addition to the Corps project, the County of Orange SARI-line project was ongoing throughout the nesting season. As in 2013, PCR consultants were on-site monitoring vireo and other nesting birds. SAWA would like to thank Florence Chan and Scott Holbrook of PCR for their cooperation and data-sharing in these areas. The downstream portion of the river, below the Weir Canyon Bridge, is channelized with a sandy bottom. This stretch of the river is normally maintained by Orange County Public Works and vegetation is controlled by herbicide application. SAWA has suggested the County remove vegetation mechanically prior to each nesting season to discourage vireo and other nesting birds from using the channel.

LBVI AND SWFL REPORT 2014 SANTA ANA WATERSHED ASSOCIATION RESULTS
26
In 2014, 59 territorial least Bell's vireo males were detected in Featherly Park. Thirty-nine of these males were known to be paired and 35 fledglings were detected. This count represents a 8% decrease from the count of 64 territorial vireos in 2013 (Table C-1). This decrease is partially attributed to the project-related habitat removal where 5 vireo territories were affected. These numbers continue to emphasize that the vireo population recovery in Featherly Park is a success story over the last decade given that no vireos were detected in 2001, the first year of monitoring. The population’s first major increase came in 2004 when it quadrupled from six in 2003 to 24 (Appdx. D-1A, available upon request).
Nesting success for 14 well-tracked nests was only 29% as compared to last year’s 50%. Ten pairs closely monitored throughout the season had a low 1.0 reproductive rate. Nine of the 14 tracked nests (64%) were lost to depredation. One of the 14 tracked nests (7%) was lost due to reproductive failure when a 2-egg nest was abandoned near the construction activities without a sound wall. It is difficult to say if the constant disturbance from construction activities was the primary reason for the low success rate in Featherly Park this year. Nesting birds, including vireo watershed-wide seemed to struggle this year presumably due to drought-induced resource shortages. However, vireo in the adjacent Green River and Upper Canyon sites had reproductive rates of 1.6 and 1.8, respectively. In 2014, these sites were not heavily disturbed by construction activities and the vireos were more productive (Table 5). It is likely that both the drought and the disturbance from construction activities cumulatively affected vireo productivity in 2014. No tracked nests were lost due to parasitism. Overall nesting success for the site from 2002 to 2014 is 46%. The overall productivity rate of well-tracked pairs during the same time is 1.4. Thirty-five fledglings were documented in 2014. A total of 322 fledglings have been observed over the last 14 years (Table C-3).
Cowbird trapping has occurred in Featherly Park since 2001 when the first vireos were detected on-site. Over 3,183 trap days, 408 cowbirds have been removed from Featherly Park. Parasitism has been documented 3 out of the 14 years surveyed, reaching its highest rate in 2002 (67%). There has been no parasitism detected in Featherly Park since 2009 (Table C-1).
In November 2008 the devastating Complex Fire roared through the canyon and destroyed up to 90% of the riparian habitat in Featherly Park. Thirty-four vireos, only 2 less than the 2008 season, returned the following season and remained in or near their former territories. Most of the breeding vireos found nest sites in unburned vegetation or the reemerging native vegetation although 3 pairs used non-native vegetation which included black mustard (Brassica niger), wax leaf privet (Ligustrum sp.), and a small orange tree (Citrus sinensis) on the edge of a burned area. Of the 18 nests found in 2014 all were placed in native vegetation, with the highest number of nests (n=5) in elderberry (Sambucus nigra) (Table C-2).
The highly invasive Arundo donax (arundo) began re-sprouting two weeks after the Complex Fire. In an effort to take advantage of the arundo biomass removed by the fire, Orange County Parks management was able to get approval to spray herbicide on the rapid arundo regrowth before the following nesting season, which helped control a large amount of regrowth. Unfortunately, many patches have re-established since that time and much dead arundo biomass remains, hampering native plant regeneration. Additionally, the use of Imazapyr on arundo was found to be damaging nearby native

LBVI AND SWFL REPORT 2014 SANTA ANA WATERSHED ASSOCIATION RESULTS
27
trees in 2013. Trees damaged by Imazapyr continue to suffer in 2014. The County of Orange is working to remedy the problem and strives toward restoration of the entire park, which should enhance the habitat for vireo and other native birds in the future. Ongoing disturbance from the multiple construction projects slated to continue for several years may challenge future vireo recovery in the impact areas. However, proposed mitigation should expand and enhance vireo habitat in the post-construction years.
IRVINE REGIONAL PARK SUMMARY
Twenty-seven territories, 9 pairs and 12 fledglings were detected in 2014. SAWA has monitored Irvine Regional Park for Least Bell’s Vireo periodically since 2003 in conjunction with an Arundo donax removal project along Santiago Creek. The first year of monitoring in 2003 showed 6 male territories. Surveys after 2006 showed a significant increase in singing males from immediate post A. donax removal visits.
Nesting success this year was 60% and the losses can be attributed primarily to predation (40%). Of the 9 pairs, 5 pairs were considered well monitored and had a reproductive rate of 2.3 fledglings per pair. In 2013, no nest monitoring was done in this area so the increase in observed fledglings and pairs can be attributed to the new effort. Cowbird trapping at this site is done by another entity, so no data is available to report. No cowbirds were observed in the nests that were found or were seen being fed by a Least Bell’s vireo.
Mulefat (58%) has been the primary choice for nest placement at this site. To date, vireos at this site have nested in 5 different plant species or combination of species. Overall, less than 1% of nests have been placed in willow species or combinations with willow species.
A. donax restoration activities have greatly increased the biodiversity in plant species upstream of Villa Park Dam. Black willow with mulefat understory is abundant in the riparian zone, and recent restoration efforts are improving upland coastal sage habitat. This year there was a decrease in the available habitat as a large band of riparian in the northern part of the park was dry. The surrounding land use is recreational hiking, mountain biking and horseback riding.
Southwestern Willow Flycatcher
In 2014, ten Willow Flycatcher territories were documented within the watershed. Two singing males were observed in San Timoteo Canyon on 5/28. Four singing males were detected in the Hidden Valley Wildlife Area, one on 5/16 and three on 5/23. In the Prado Basin, two territorial males were documented. During SAWA’s 2014 assessment surveys, one singing male was detected in Kabian Park on 6/9, and one singing male was detected in Alessandro Arroyo on 6/13. No breeding activity was observed in 2014. Previously a breeding pair has been documented in the Prado Basin since 2011. They produced young in 2012 and 2013. However breeding activity was not observed in 2014. This species has been observed sporadically throughout the watershed over the years, most often in San Timoteo Canyon, Hidden Valley, Norco, Lake Perris, and the

LBVI AND SWFL REPORT 2014 SANTA ANA WATERSHED ASSOCIATION RESULTS
28
former March SKR Preserve. SAWA has not documented any breeding attempts at well monitored or assessment sites. Sightings of Interest
Incidental sightings were made throughout the watershed during vireo monitoring. Emphasis was placed on sensitive species. See Table 12 for a listing of all sightings by species and site. These sightings have been reported to the California Natural Diversity Database (CNDDB).

LBVI AND SWFL REPORT 2013 SANTA ANA WATERSHED ASSOCIATION BROWN-HEADED COWBIRDS TRAPPING RESULTS
29
BROWN-HEADED COWBIRDS TRAPPING RESULTS
BROWN-HEADED COWBIRD TRAPPING, MARCH - JULY 2014
Forty-six cowbird traps were deployed during the 2014 vireo season and 1,271 cowbirds were removed from all sites over 5,408 trap days (Table 6). The sex and ages of the cowbirds removed in 2014 were: 775 adult males, 383 adult females, and 113 juveniles. SAWA biologists and field assistants spent 2,724 hours servicing traps during the vireo season.
The areas trapped and the number of traps in each area are as follows: San Jacinto, eight; San Timoteo, nine; Meridian Conservation Area, two; Sycamore Canyon, one; Mockingbird Canyon, five; Santa Ana River from Jurupa Park to Hidden Valley, two; Hidden Valley, two; Santa Ana River in Norco, two; Temescal Canyon, nine; Santa Ana Canyon, four; Chino Hills, one; and one at Hawk’s Pointe in Fullerton. All of the traps were opened by mid to late March and closed by 7/28. Traps at the San Jacinto dairies, a dairy trap in Temescal Canyon and a trap in the Santa Ana Canyon were open until late November 2014 when they were closed due to lack of funding. These traps usually remain open during the winter. Trapping results in this report end with 7/28 data; results after 7/28/2014 will be reported in winter trapping results for 2015. SAWA assisted OCWD with the management of 4 traps within Prado Basin. Data are reported by Pike, et al.
In 2014, cowbird captures decreased 35% from 2013 (1,945). Thirty-two percent fewer males, 38% percent fewer females, and 40% fewer juveniles were trapped during 2013. In 2013, captures had decreased 31% from 2012 (2,826). The decreased captures could be attributed to fewer trap days (5,408 in 2014 to 6,355 in 2013). However, captures had also decreased in 2013 from 2012 despite an increase of one trap and 882 trap days. The overall capture rate (# birds trapped per day) fell from 0.3 in 2013 to 0.2 in 2014.
In 2014 two traps were stolen in San Timoteo Canyon. Both were discovered missing on consecutive days, July 3 and July 4. A total of 11 cowbirds were lost due to the theft (4 males, 7 females). Vandalism did not occur at any other traps in the watershed.
SAWA has removed over 86,000 cowbirds from the watershed since it began its trapping program in 2000.
NON-TARGET CAPTURES IN COWBIRD TRAPS, MARCH – JULY 2014
Twenty non-target species, consisting of 2,134 individual trapping occurrences, were captured in the 46 cowbird traps (Table 7). The most common species were California Towhee, Melozone crissalis, House Sparrow, Passer domesticus, House Finch, Carpodacus mexicanus, European Starling, Sturnus vulgaris, Red-winged Blackbird, Agelaius phoeniceus, and Song Sparrow, Melospiza melodia. In 2013, thirty non-target species, consisting of 4,370 individual trapping occurrences, were captured. The mortality of non-targets in 2014 averaged 0.8%, similar to the average of 0.7% in 2013.

LBVI AND SWFL REPORT 2013 SANTA ANA WATERSHED ASSOCIATION BROWN-HEADED COWBIRDS TRAPPING RESULTS
30
WINTER 2013-2014 BROWN-HEADED COWBIRD TRAPPING AND NON-TARGET CAPTURES
Cowbird trapping took place in San Jacinto and Temescal during the non-breeding season (i.e., winter) of 2013-2014. Seven traps were located in San Jacinto at dairies and were open between 8/5/2013 and 3/14/2014. A total of 4,072 cowbirds were removed (1,785 adult males, 1,385 adult females, and 902 juveniles) over 1,484 trap days (Table 8). The number of cowbirds trapped in San Jacinto increased 18% from the prior winter. This increase could be attributed to the addition of a trap at a dairy that has had a high capture rate since its initial opening in the middle of the winter of the 2012-2013 season. The capture rate per day was 2.7, up from 2.3 in the winter of 2012-2013. SAWA spent 977 field hours on winter trapping.
One trap was open at a dairy in Temescal during the non-breeding season, from 8/5/13-3/14/14. A total of 865 cowbirds were removed (272 adult males, 271 adult females, and 322 juveniles) over 162 trap days. The total removed represents a 4% decrease in captures from the previous winter.
Ten non-target species, consisting of 548 individual trapping occurrences, were captured in the 8 cowbird traps located in San Jacinto and Temescal (Table 9). The most common species were European Starling, House Sparrow, and Red-winged Blackbird. The mortality of non-targets over the winter averaged 0.9%, similar to the 1.0% in the winter of 2012-2013.

LBVI AND SWFL REPORT 2014 SANTA ANA WATERSHED ASSOCIATION DISCUSSION
31
DISCUSSION
Vireo abundance increased by 4% in 2014 in the upper watershed, continuing the reversal of the downward trend from 2011 and 2012. For the second year, over 1,000 vireo territories were documented by SAWA biologists and cooperators in the upper watershed. Including Prado Basin, 1581 territories were documented in 2014 in the Santa Ana watershed. With the exception of a few years, the vireo abundance has increased since 2000. The dramatic increase over 14 years is illustrated for four sites in Figures 2 and 4. The two main causes of vireo decline, the lack of habitat and parasitism by the brown-headed cowbird, are being successfully managed and the vireos are responding to the point that SAWA biologists have detected vireos in backyards above Featherly Park.
SAWA has removed over 5,000 acres of invasive Arundo donax from the watershed. Tributaries which have been restored have had explosive growth in vireo numbers. San Timoteo Canyon increased its vireo population from five in 2000 to 151 in 2014. Temescal Canyon has shown similar increases with a vireo population increasing from seven in 2001 to 126 in 2014.
SAWA and OCWD Prado biologists have removed over 114,000 cowbirds from the watershed since 2000 and the parasitism rates are no longer in double-digit figures since the cowbird management programs were begun. The disappearance of dairies from the watershed should be an additional aid to the decline in parasitism.
Nesting success in 2014 was 48%, a decrease from 61% in 2013. This year was the first time since monitoring began that nesting success was below 50%. Possible causes of lower success include drought resulting in a lack of food and good nesting sites and disturbance from construction projects. Over fourteen years, the nesting success rate is 60% for 1966 nests. Depredation remains the main cause of nest failure. Nest loss due to depredation was 43%, a small increase from 2013. Nest loss from reproductive failure was 5%; examples of nest loss due to reproductive failure are egg abandonment, failure of all eggs to hatch, or failure of the vegetation to support the nest to a successful hatching. Only 3% of nests were lost to parasitism in 2014. The parasitism rates in the past have ranged between 2% to 5%. Parasitism is episodic throughout the watershed. It continues to be a problem in San Jacinto, San Timoteo, and Sycamore Canyon. Documentation of continued cowbird parasitism in the San Jacinto Wildlife Area, where cowbird traps are no longer placed, lends support for the continued need for cowbird trapping to bring the vireo to full recovery. Figure 5 compares nesting success, predation, and parasitism rates from 2003-2014.
The lack of documented nesting Southwestern Willow Flycatchers in the watershed is not surprising given the continuing low numbers throughout the watershed. No breeding activity was documented in 2014. The mountain canyons have held flycatcher territories in the past and should be under management and monitoring, but without funding such work is not possible.
LBVI AND SWFL REPORT 2014 SANTA ANA WATERSHED ASSOCIATION MANAGEMENT RECOMMENDATIONS
32
MANAGEMENT RECOMMENDATIONS
This report documents SAWA’s last year of extensive vireo monitoring effort in the Santa Ana watershed in the foreseeable future. Although we will attempt to find funding, monitoring efforts will be greatly restricted due to the lack of funding. Priorities for SAWA’s vireo recovery program in the near future will be based primarily on cowbird trapping which we believe provides the most support for the recovering population. Vireo surveys and nest monitoring will be done as funding allows. SAWA will attempt to provide accurate annual data on status and distribution of the vireo in the watershed based on its limited effort. Data from intensive monitoring at funded sites, currently in San Timoteo and Norco, will be augmented with sampling. SAWA will continue to coordinate with other agencies for a watershed-wide documentation of vireo abundance and assessment of all potential vireo habitats.
Restoration of riparian habitat through the removal of non-native invasives such as Arundo donax, tamarisk, and pepperweed continues to be important to the continued recovery of the vireo. However, with the loss of daily surveys throughout the watershed, the notification procedure to make natural resource agency managers aware of local infestations of exotics at an early stage will be curtailed and this lack of awareness may lead to future massive infestations. As possible, SAWA biologists notify SAWA project managers and other agencies when infestations are detected and can be managed in a timely fashion.
Along with restoration and procurement of new land, there needs to be increased protection of those lands for wildlife values. Specifically, there continues to be a need to enforce current laws, and perhaps promulgate new laws, to restrict the use of off-road vehicles in sensitive riparian areas. Local landscapes are scarred with off-highway vehicle (OHV) tracks and the activity is damaging habitat, willows and cottonwoods, in areas such as Mockingbird Canyon, San Timoteo Canyon, the San Jacinto River, and the Santa Ana River. The effect of rampant off-road vehicle use is the destruction of significant riparian resources. The lands with these high wildlife values are very limited in extent and cannot be meaningfully protected or restored in consort with OHV activity. SAWA is attempting to initiate a program of law enforcement in San Timoteo in conjunction with State Parks and the Department of Fish and Game. In 2014, SAWA and the Riverside County Parks and Open Space District are restoring acres of habitat destroyed by off road vehicles. There is also increasing awareness of the need to control feral pigs throughout the watershed. Some multi-organizational planning attempts have been publicized. SAWA and OCWD are planning a pilot study to track feral pig populations in the Prado Basin.
Laws meant to prevent other human disturbances such as laws against streambed alteration must be enforced. There are too many examples of the devastating effects of the lack of enforcement. A positive development in this area is the County of Riverside’s code enforcement program that targets illegal dumping. Enforcement of these laws is sorely needed to protect riparian habitat from degradation. SAWA has had unprecedented success in the scale of riparian habitat restoration that has been achieved on the Santa Ana River. The vireo is truly on the road to recovery in our watershed with ample habitat developing for occupation. However, we will not be ultimately successful without rallying more support from the people living next to and

LBVI AND SWFL REPORT 2014 SANTA ANA WATERSHED ASSOCIATION MANAGEMENT RECOMMENDATIONS
33
using the river. Too little of the riparian resources on the river are in public ownership. Setting aside and enhancing habitat does little good when that land is transformed for other uses by trespassers. Although existing laws should protect these resources, even on private land, the ability to enforce the laws and regulations is inadequate and untimely. As we continue to recover our natural resources, we will endeavor to confront this, perhaps our greatest challenge. We must strive to invest the public in these resources and identify effective ways to ensure that the floodplains are put only to appropriate human uses. We will attempt this through a combination of public education, public involvement thorough volunteerism, and partnerships with enforcement agencies and landowners. The majority of the funding for the past three years has been provided by the Department of Water Resources through SAWPA’s One Water One Watershed Program. Funding for monitoring in San Timoteo Canyon is from an endowment provided by the Corps, held by SAWA, and managed through the Inland Empire Resource Conservation District. Funding for monitoring at the Meridian Conservation Area in 2014 was provided by the Riverside Land Trust.

LBVI AND SWFL REPORT 2014 SANTA ANA WATERSHED ASSOCIATION LITERATURE CITATIONS
34
LITERATURE CITATIONS
Duffy, A.M., Jr., and McChrystal, R. 1992. Vocalizations and copulatory attempts in free-living brown-headed cowbirds. J. Field Ornithol. 63(1):16-25. Garrett, Kimbal and Dunn, Jon. 1981. Birds of Southern California. Status and Distribution. Los Angeles Audubon Society. Los Angeles, California. 408 pp. Hoffman, Susan M., Zembal, Richard, Kastner, Terese, Wiater, Talula, Rahe, Michael, Nash, Bonnie, Aimar, Melody, Reeser, Terry. 2004. Status and management of the least Bell’s vireo and southwestern willow flycatcher in the Santa Ana River watershed: San Timoteo Canyon, Mockingbird Canyon, Temescal Canyon, Hidden Valley, and the Santa Ana River including the Santa Ana Canyon. Submitted to the U.S. Fish and Wildlife Service and the Department of Fish and Game, State of California. March 2004. 39 pp. Hoffman, Susan M.. et al. 2010. Status and Management of the Least Bell’s Vireo and Southwestern Willow Flycatcher in the Santa Ana River Watershed. Archived Data 2000-2009. Summary Data by Site and Watershed-wide. Santa Ana Watershed Association. 77pp. Hoffman, Susan M. et al. 2013. Status and Management of the Least Bell’s Vireo and Southwestern Willow Flycatcher in the Santa Ana River Watershed, 2013, and Summary Data by Site and Watershed-wide, 2000-2013. 132pp.
Kindt, Kim, Fay, Teresa, and Romich. 2008. Cowbird trapping and protocol surveys for Least Bell’s Vireo and Southwestern Willow Flycatcher along the Santa Ana River and Mojave Rivers – 2007. Prepared for U.S. Fish and Wildlife Service and California Department of Fish and Game. 45 pp. Lowther, P.E. 1993. Brown-headed Cowbird (Molothrus ater) In The Birds of North America, No. 47 (A. Poole and F. Gill, Eds.). Philadelphia: The Academy of Natural Sciences; Washington, D.C.: The American Ornithologists’ Union. O'Loghlen, A. L. and S. I. Rothstein. 1995. Culturally correct song dialects are correlated with male age and female song preferences in wild populations of brown-headed cowbirds. Behavioral Ecology and Sociobiology. 36(4):251-259 O’Loghlen, A.L. 1995. Delayed access to local songs prolongs vocal development in dialect populations of brown-headed cowbirds. Condor 97:402-114. Pike, James, Pellegrini, Dharm, Reynolds, Steve, and Hays, Loren R. 1999. The status and management of the least Bell’s vireo and southwestern willow flycatcher within the Prado Basin, California, 1986-1999. 41 pp. Pike, James, Pelligrini, Dharm, Hays, Loren R., and Zembal, Richard. 2005. Least Bell’s Vireo and Southwestern Willow Flycatchers in Prado Basin of the Santa Ana River Watershed, CA. 32 pp

LBVI AND SWFL REPORT 2014 SANTA ANA WATERSHED ASSOCIATION LITERATURE CITATIONS
35
Pike, J., L. Hays, and R. Zembal, 2013. Least Bell’s Vireos and Southwestern Willow Flycatchers in Prado Basin of the Santa Ana River Watershed, CA. Unpublished report prepared for the Orange County Water District and U.S. Fish and Wildlife Service. 35 pp. Pike, J., L. Hays, and R. Zembal, 2014. Least Bell’s Vireos and Southwestern Willow Flycatchers in Prado Basin of the Santa Ana River Watershed, CA. Unpublished report prepared for the Orange County Water District and U.S. Fish and Wildlife Service. In progress. Sims, Theresa. Personal communication. San Bernardino Department of Public Works, Flood Control, San Bernardino Public Works, San Bernardino, CA. 2012.

LBVI AND SWFL REPORT 2014 SANTA ANA WATERSHED ASSOCIATION ACKNOWLEDGMENTS
36
ACKNOWLEDGEMENTS
We heartily thank our field and cowbird assistants: Henry Armijo, Melanie Levato, Valeree Rae Pons, Jacob Lloyd Davies, Cynthia Lujan, Andrea Vallejo, Joseph Vu, Arsenio Hernandez, Edwin Madrid, and project manager James Law. We also wish to thank Gayle Holyoak, Vicki Long, Bonnie Johnson, Mandy Parkes, Jim Pike, and Kerwin Russell for their incredible dedication to natural resources and support of SAWA’s biological management program.
We would also like to thank the following individuals and agencies for their continued assistance: Jack Easton from the Riverside Land Conservancy, Paul Thiel of PABCO Building Products LLC, Christine Medak, USFWS, and Dave Schickling of City of Fullerton, Hidden Valley Golf Club, Lori Askew and Robin Shepard of the City of Norco, Madeline Bauer, Bill Bradberry, Brookfield Residential, Brian and Dana Busch and the staff at the Canyon RV Park, Sherry Chandler, California Department of Fish and Game environmental scientists: Jeff Brandt, Kim Freeburn-Marquez, and Joanna Gibson, California Department of Parks and Recreation ecologists: Alissa Ing and Ken Kietzer, City of Chino Hills Public Works Department, Mike Cravens, Herman DeJong and family at the DeJong Dairy, Lucia Diaz and the Inland Empire Utilities Agency, Eastern Municipal Water District, Dan Ebert, Gordon English, Euclid Dairy, Ross Fisher and the staff of the Goose Creek Golf Club, the staff at Fisherman’s Retreat, Bob Fontaine and John Gericke of Prado Regional Park, Gage Canal, Johnny Garcia, Donna Hart, Dennis Hayes, Barbara Iyer, J and M Oostdam Dairy, KB Home, Bob King, Linda Koki, Joe Lameli and the staff of the Metropolitan Water District, Adam Malisch and the MSHCP monitoring program, the staff at Canyon Lake Water Treatment Plant, Natural Resource Manager Dustin McLean and Natural Resource Specialist Elizabeth Dionne, Robert Williams, Ranger, of the Riverside County Regional Parks and Open-space District, and the staff at the Hidden Valley Wildlife Preserve, The Regional Conservation Authority, Beth Martinez, Scott Holbrook and Florence Chan of PCR Services Corporation, Northwestern Vector Control, Orange County Flood Control, Orange County Park Rangers Kelly Lewis and Joanette Willert, City of Riverside Public Works Department Water Quality Control Plant, Ramona Farms Dairy, Roberta Reed and the 3M Company, R & J Dairy, Riverside County Flood Control, Troy Thompson and the staff at the Green River Golf Club, Scott Brothers Dairy, Scott Sewell, Theresa Sims of the San Bernardino County Flood Control, Lynn Staford, Gary Stockwell and the Elsinore Valley Municipal Water District, John Trotter and the City of Chino Hills, Vanderwoude Dairy, the Western Municipal Water District, and Kraig Williamson of the Temescal Canyon Rockery.
Special thanks go out to the following residents of Mockingbird Canyon, San Timoteo Canyon, and Lake Elsinore for their assistance in cowbird trap placement: Margarite and Jack Empson, Gordon and Peggy Headlee, Mark and Faith Kelsey, the Mendoza Family at Eastside Ranch, and Chris Ungerer. There is a need to acknowledge the SAWA biologists who have contributed to this fourteen year effort. The effort of each biologist is reflected in the data they document. Each biologist writes the site summary analysis for their management areas. Additionally, Melody Aimar bulldogs the presentation of the data per protocol and tracks

LBVI AND SWFL REPORT 2014 SANTA ANA WATERSHED ASSOCIATION MANAGEMENT RECOMMENDATIONS
37
the sensitive species. Allyson Beckman and Terry Reeser have been responsible for the brown-headed cowbird data and analysis. Mari Paramo Archer is responsible for the assessment survey data. Nicole Housel has pulled together the annual report over the past two years and dug through past data. Cameron MacBeth is trying to pull us into the 21st century data collection technology. Allyson Beckman, Jill Coumoutso, Talula Barbee, and Melody Aimar have excelled in nest monitoring. Bonnie Johnson of the Orange County Water District has provided much needed support at critical times. Dick Zembal has championed this effort and is an indispensable source of experience and knowledge.

LBVI AND SWFL REPORT 2014 SANTA ANA WATERSHED ASSOCIATION FIGURES
38
Figure 1: Least Bell’s Vireo Survey Sites in the Santa Ana Watershed

LBVI AND SWFL REPORT 2014 SANTA ANA WATERSHED ASSOCIATION FIGURES
39
Figure 2: Vireo Abundance in the Watershed, Prado and Outside Prado, 2001-2014.
Source: Santa Ana Watershed Association
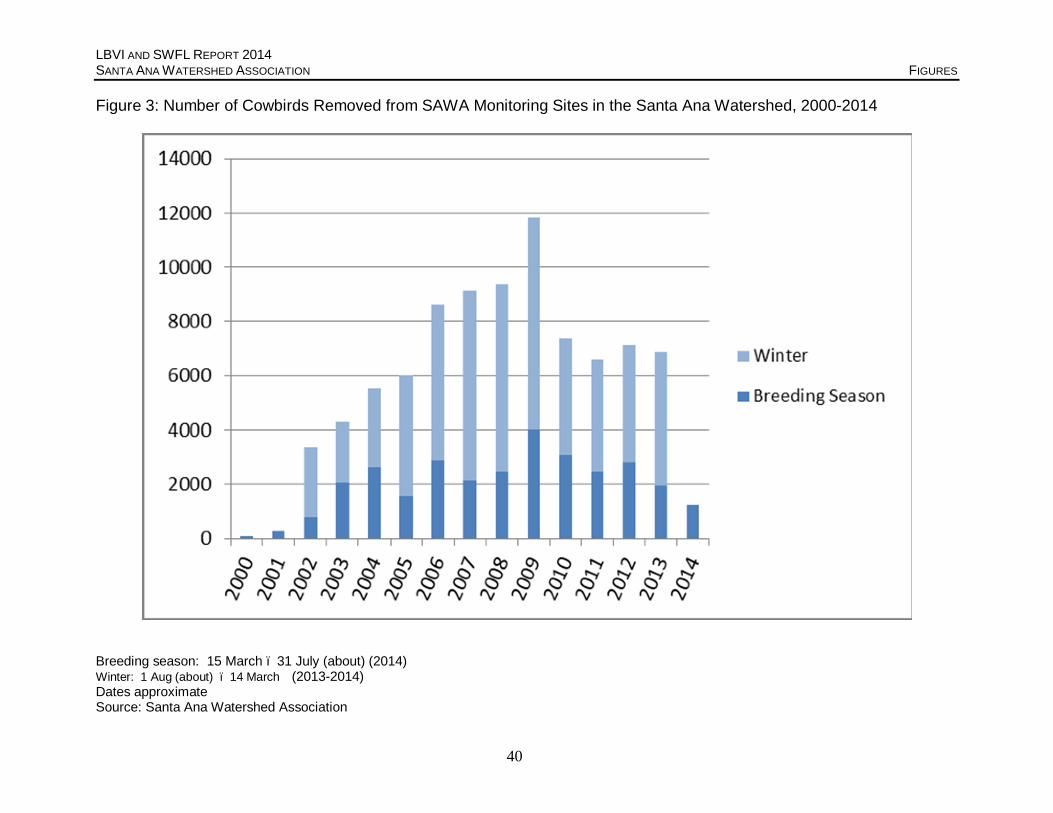
LBVI AND SWFL REPORT 2014 SANTA ANA WATERSHED ASSOCIATION FIGURES
40
Figure 3: Number of Cowbirds Removed from SAWA Monitoring Sites in the Santa Ana Watershed, 2000-2014
Breeding season: 15 March – 31 July (about) (2014) Winter: 1 Aug (about) – 14 March (2013-2014) Dates approximate Source: Santa Ana Watershed Association

LBVI AND SWFL REPORT 2014 SANTA ANA WATERSHED ASSOCIATION FIGURES
41
Figure 4: Number of Least Bell’s Vireo Territories at Four Sites in the Santa Ana Watershed, 2004-2014
Source: Santa Ana Watershed Association
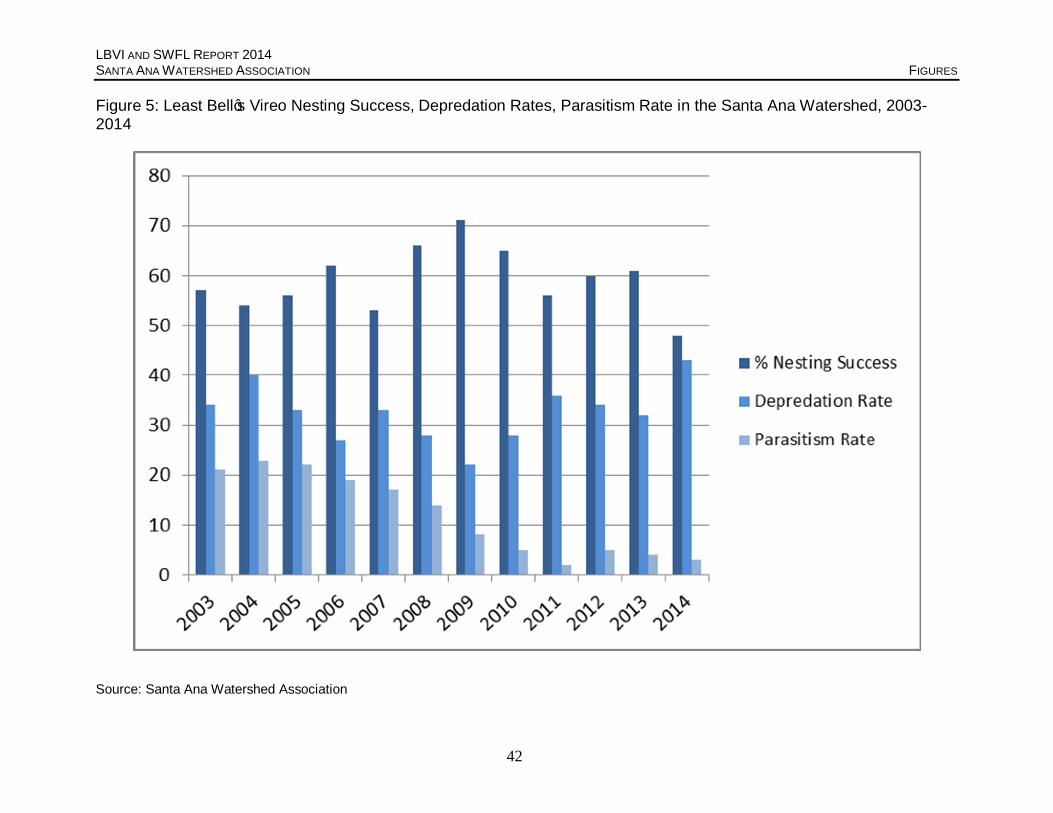
LBVI AND SWFL REPORT 2014 SANTA ANA WATERSHED ASSOCIATION FIGURES
42
Figure 5: Least Bell’s Vireo Nesting Success, Depredation Rates, Parasitism Rate in the Santa Ana Watershed, 2003-2014
Source: Santa Ana Watershed Association

LBVI AND SWFL REPORT 2012 SANTA ANA WATERSHED ASSOCIATION TABLES
43
Table 1A: Least Bell’s Vireo abundance and distribution in the Santa Ana Watershed, 2010-2014 Number of territories/pairs/fledglings detected SUBPOPULATION 2010 2011 2012 2013 2014 San Jacinto 22/18/28 41/25/18 42/36/49 53/29/39 45/19/12 San Timoteo Canyon 126/95/137 116/101/196 118/102/153 131/80/179 151/135/206 Sycamore Canyon 12/8/11 9/5/4 7/7/5 12/--/-- 17/5/2
Meridian C.A. (former March SKR Preserve) 14/12/25 16/9/7 13/11/8 14/12/16 21/16/23
Alessandro Arroyo Assessment
survey Assessment
survey Assessment
survey Assessment
survey Assessment
survey Mockingbird Canyon 43/34/25 37/32/67 28/26/39 31/24/40* 23/7/7
Harrison Reservoir 1/0/0 Not
surveyed Assessment
survey Assessment
survey Assessment
survey
La Sierra Blvd, Riverside County
Assessment survey
Assessment survey
Assessment survey
Assessment survey
Assessment survey
Santa Ana River – Riverside (Riverside Ave to Van Buren Blvd) 68/50/58 49/23/32 41/11/7 78/--/7+ 66/19/15 Hidden Valley (south side of river 60/43/53 55/36/41 62/37/45 75/42/66 85/32/28 Hidden Valley (north side of river) 15/12/18 4/2/2 9/3/1 21/2+/3+ 21/14/19
Santa Ana River – Norco (Goose Creek Golf Course to River Rd) 101/64/113 105/59/91 95/51/86 108/52/109 110/32/36 Temescal Canyon (from Railroad Canyon to approx. Cajalco Rd.) 83/49/73 102/65/113 109/63/71 131/50/48 126/24/17
Chino Hills (Butterfield Ranch environs) 11/7/7 8/3/1 8/2/1 13/5/7 10/2/3

LBVI AND SWFL REPORT 2012 SANTA ANA WATERSHED ASSOCIATION TABLES
44
Table 1A: Least Bell’s Vireo abundance and distribution in the Santa Ana Watershed, 2010-2014 Number of territories/pairs/fledglings detected SUBPOPULATION 2010 2011 2012 2013 2014
Santa Ana Canyon Upper Canyon (below Prado Dam to Green River Golf Club) 11/4/6 14/5/5 10/4/6 28/14/23 27/18/28
Santa Ana Canyon - Green River Golf Club 24/17/19 26/14/19 19/11/11 22/19/19 26/19/29
Santa Ana Canyon - Featherly Reg. Park 40/23/22 33/19/23 36/16/12 64/45/55 59/39/35 Santiago Creek -Irvine Reg. Park 24/14/18 26/9/7
Assessment survey
Assessment survey 27/9/12
Santiago-Santiago Cyn Rd. Assessment
survey Assessment
survey Assessment
survey Assessment
survey Assessment
survey
Santa Ana River mouth-Talbert Park
Not surveyed 1/0/0 2/0/0
Assessment survey
Assessment survey
East Coyote Hills Preserve – Fullerton (3/3/3)(5) (4/0/0)(5) (2/0/0)(5) 2/0/0(5)
Not surveyed
Misc. Sightings ---
-- Shipley Nature Ctr, Huntington Beach 0/0/0(7) 0/0/0(7) 0/0/0(7) 0/0/0(7) 0/0/0(7) -- Santa Ana River, Woolly star Preserve
Not surveyed
Not surveyed 0/0/0
Not Surveyed
Not surveyed
Etiwanda Wildlife Preserve 1/0/0 Assessment
survey Not
surveyed Not
surveyed Not
surveyed
Mt. Baldy Not
surveyed Assessment
survey Not
surveyed Not
surveyed Not
surveyed Chino Creek Park at Inland Empire Utilities Agency 2/1/1 2/1/1 1/0/0 2/1/1 1/0/0
Chula Vista, CA 1/0/0(5) Not
surveyed Not
surveyed Not
surveyed Not
surveyed
Potrero 2/0/0(2) Not
surveyed Not
surveyed Not
surveyed 0/0/0(2)

LBVI AND SWFL REPORT 2012 SANTA ANA WATERSHED ASSOCIATION TABLES
45
Table 1A: Least Bell’s Vireo abundance and distribution in the Santa Ana Watershed, 2010-2014 Number of territories/pairs/fledglings detected SUBPOPULATION 2010 2011 2012 2013 2014 Rancho La Sierra West, Riverside 1/1/0 1/1/1 1/1/1 2/2/1 1/0/0
Estelle Mountain Preserve 0/0/0(2) 1/0/0 Not
surveyed Not
surveyed Not
surveyed
Yorba Linda Lakebed Park Assessment
survey Assessment
survey Assessment
survey Assessment
survey Assessment
survey
Black Gold Golf Club Not
available 2/0/0(6) 4/0/0(6) 3/0/0(6) Not
reported
Diemer Plant, Brea, CA 1/0/0(6) Not
reported
--Riverview Golf Club Not
surveyed Not
surveyed Not
surveyed Not
surveyed Not
surveyed
--Pulte Wetlands, adjacent to Chino Hills State Park CHSP)
Not available 2/0/0(6)
Not surveyed (6)
Not surveyed
Not surveyed
--Rim Crest Dr. & Blue Gum Dr., adjacent to CHSP
Not available 0/0/0(6)
Not surveyed(116
Not surveyed
Assessment survey
Blue Mud Canyon Not
available Not
available 1/0/0(6) Assessment
survey Not
surveyed
South Coal Canyon (Santa Ana Canyon)
Not available
Not available 1/0/0(6) 1/0/0(6)
Not surveyed
Plunge Creek, San Bernardino
Assessment survey
Assessment survey
Assessment survey
Assessment survey
Assessment survey
Santiago Pitts Not
surveyed 2/1/1 Assessment
survey Assessment
survey Assessment
survey
Conrock Basin FHQ Not
surveyed 1/0/0 0/0/0 0/0/0 Assessment
survey
UCR Not
surveyed 1/0/0 0/0/0 Not
surveyed 0/0/0
Aberhill - Temescal 0/0/0 0/0/0 1/0/0(2) Not
surveyed See Temescal Santa Ana River – Riverside Ave to Mission
Not available
Not available 2/0/0
See SAR – Riverside Ave to
See SAR – Riverside Ave to

LBVI AND SWFL REPORT 2012 SANTA ANA WATERSHED ASSOCIATION TABLES
46
Table 1A: Least Bell’s Vireo abundance and distribution in the Santa Ana Watershed, 2010-2014 Number of territories/pairs/fledglings detected SUBPOPULATION 2010 2011 2012 2013 2014 Blvd Van Buren Blvd Van Buren Blvd Colonies Crossraods Shopping ctr Ponds, City 1/0/0
Not surveyed
Hwy 71, OCWD property 1/0/0 Not
surveyed Santa Ana River – AECom Flood Control Mitigation Project within SAR Norco to River Road 32/21/48(8) 38/19/16(9) Subtotal # LBVI 662/452/614 654/410/629 610/381/495 824/396/643 854/409/488
# LBVI from SAWA Assessment Sites 159/65/41 156/63/36 146/49/44 197/73/39 208/72/60 Total # LBV for all sites 821/517/655 810/473/665 756/430/539 1021/471/682 1062/481/548
# LBV on Santa Ana River in San Bernardino County 42/26/24(1) 42/23/30(1) 30/22/25(1)
Not Reported Not Reported
# LBV Chino Hills State Park (51/23/14)(3) (42/17/7)(3) (33/14/11) (3) (36/15/6)(3) (21/6/4)(3)
Total for Santa Ana Watershed- excl. Prado Basin 863/543/679 852/496/695 786/452/564 1021 /471 /682 1062/481/548 Prado Basin 569/286/479(4) 517/200/286(4) 451/158/229(4) 561/195/286(4) 520/172/194
Total Number LBVI in Santa Ana Watershed 1432/829/1158 1369/696/981 1237/610/793 1582/666/968 1582/653/742
(a.) Entries correspond to numbers of territorial males/pairs/'known fledged young' for designated time and locale. (b.) The "--" symbol indicates that no data were available. (c.) The "+" symbol indicates that actual count may have been somewhat higher; field census efforts were started late or were otherwise
deemed to be incomplete (1) Reported by biologists, San Bernardino County Flood Control (2) Reported by MSCHP biologists (3) Chino Hills State Park surveyed as an assessment site and data are included in LBVI Assessment Totals. (4) Data from Pike et al. 2010-2014 (5) Outside Santa Ana Watershed, not included in totals
LBVI AND SWFL REPORT 2012 SANTA ANA WATERSHED ASSOCIATION TABLES
47
(6) Reported by California State Parks (7) Reported by Dave Telford (8) AECOM. 2013b. 2013 Santa Ana River Flood Control Mitigation Plan Least Bell’s Vireo 45-day Report, San Bernardino, California (9) AECOM personal communication
*Number of fledglings misreported in 2013

LBVI AND SWFL REPORT 2014 SANTA ANA WATERSHED ASSOCIATION TABLES
48
Table 1B: Least Bell’s Vireo abundance and distribution in the Santa Ana Watershed, 2010-2014. Numbers of territories, pairs and fledglings detected. By Sub-watershed
2010 2011 2012 2013 2014
Santa Ana River and Tributaries
Cajon Wash 0/0/0 0/0/0 Not
surveyed 0/0/0 Not
surveyed
Plunge Creek, Highland 1/1/0 1/0/0 1/1/1 Not
surveyed 3/1/0
City Creek, Highland 2/1/0 0/0/0 0/0/0 Not
surveyed 4/0/0
Little Sand Basin, Highland 2/0/0 3/2/1 3/2/0 Not
surveyed 0/0/0
Arlington Falls Not
surveyed 0/0/0 0/0/0 0/0/0 0/0/0
Oak Glen Preserve 0/0/0 0/0/0 Not
surveyed Not
surveyed Not
surveyed
San Timoteo Canyon 126/95/137 116/101/196 118/102/153 131/80/179 151/135/206
Box Springs 5/2/1 2/1/0 1/1/1 Not
Surveyed 3/2/1
Poorman Reservoir 6/1/0 4/1/1 1/1/2 2/0/0 6/3/2
Quail Run 0/0/0 0/0/0 0/0/0 Not
Surveyed 0/0/0
Sycamore Canyon 12/8/11 9/5/4 7/7/5 12/--/-- 17/5/2 Meridian C.A. (former March SKR Preserve) 14/12/25 16/9/7 13/11/8 14/12/16 21/16/23
Golden Star 0/0/0 0/0/0 0/0/0 0/0/0 2/1/0
Woodcrest 0/0/0 0/0/0 0/0/0 0/0/0 1/0/0
Mead Valley (Cajalco/Aqueduct) 8/0/0 5/4/5 4/1/2 4/4/2 5/2/0

LBVI AND SWFL REPORT 2014 SANTA ANA WATERSHED ASSOCIATION TABLES
49
Table 1B: Least Bell’s Vireo abundance and distribution in the Santa Ana Watershed, 2010-2014. Numbers of territories, pairs and fledglings detected. By Sub-watershed
2010 2011 2012 2013 2014
Gavilan Hills 0/0/0 0/0/0 Not
surveyed 0/0/0 0/0/0
Menifee - Paloma High School 0/0/0 Not
surveyed Not
surveyed Not
surveyed Not
surveyed
Menifee - Haun Rd. 0/0/0 Not
surveyed Not
surveyed Not
surveyed Not
surveyed
Steele Valley 0/0/0 Not
surveyed Not
surveyed Not
surveyed Not
surveyed
Santa Rosa Mine Rd. Not
surveyed Not
surveyed Not
surveyed Not
surveyed Not
surveyed Van Buren Blvd – Plummer Rd So. 4/3/2 3/2/3 2/1/1
Not surveyed
See Meridian C.A.
Van Buren Blvd. (Bountiful) 0/0/0 0/0/0 0/0/0 Not
surveyed 1/0/0
Van Buren Blvd (Porter Ave) 0/0/0 0/0/0 Not
surveyed Not
surveyed 0/0/0
Canyon Crest 0/0/0 0/0/0 Not
surveyed 0/0/0 1/1/0
Mockingbird Canyon 43/34/25 37/32/67 28/26/39 31/24/40* 23/7/7 Alessandro Arroyo/Prenda Arroyo 6/2/0 7/5/0 6/4/4 7/3/2
Not available
Alessandro Arroyo Not
available Not
available Not
available Not
available 19/4/5
Prenda Arroyo Not
available Not
available Not
available Not
available 4/0/0
Conrock Basin FHQ Not
surveyed 1/0/0 0/0/0 0/0/0 0/0/0
Castleview Park 0/0/0 0/0/0 0/0/0 Not
surveyed Not
surveyed
Tequesquite Arroyo 0/0/0 0/0/0 Not
surveyed 0/0/0 0/0/0
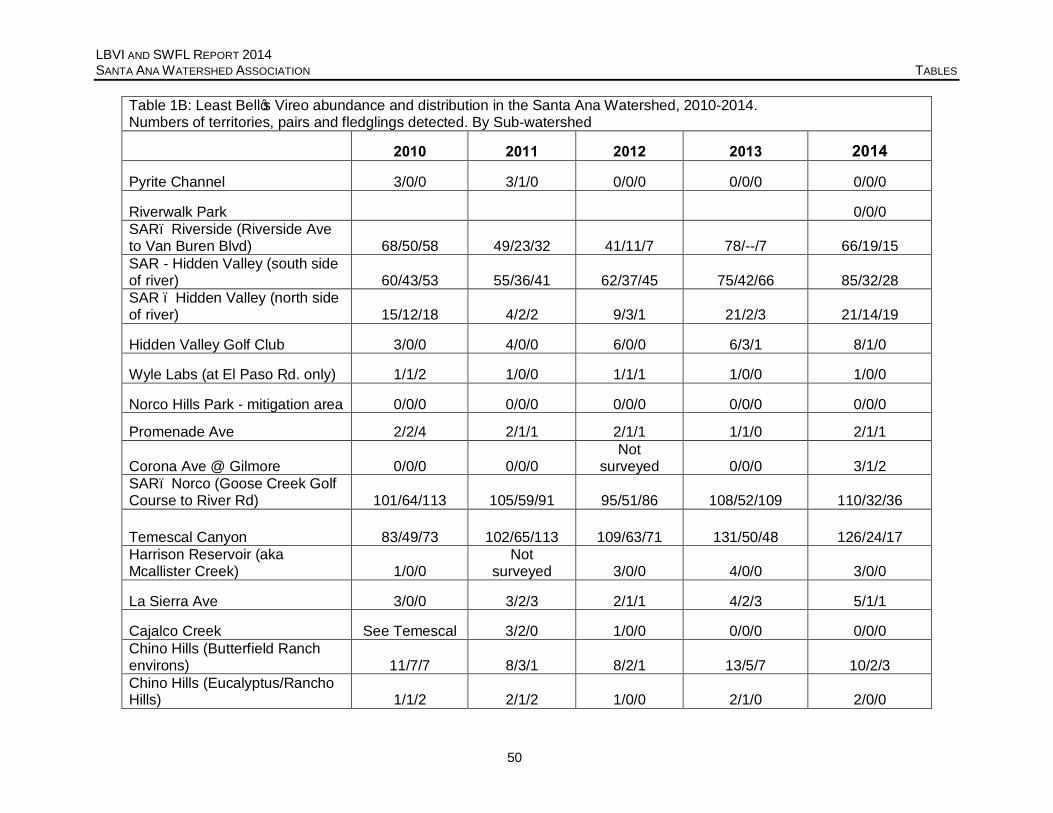
LBVI AND SWFL REPORT 2014 SANTA ANA WATERSHED ASSOCIATION TABLES
50
Table 1B: Least Bell’s Vireo abundance and distribution in the Santa Ana Watershed, 2010-2014. Numbers of territories, pairs and fledglings detected. By Sub-watershed
2010 2011 2012 2013 2014
Pyrite Channel 3/0/0 3/1/0 0/0/0 0/0/0 0/0/0
Riverwalk Park 0/0/0 SAR– Riverside (Riverside Ave to Van Buren Blvd) 68/50/58 49/23/32 41/11/7 78/--/7 66/19/15 SAR - Hidden Valley (south side of river) 60/43/53 55/36/41 62/37/45 75/42/66 85/32/28 SAR – Hidden Valley (north side of river) 15/12/18 4/2/2 9/3/1 21/2/3 21/14/19
Hidden Valley Golf Club 3/0/0 4/0/0 6/0/0 6/3/1 8/1/0
Wyle Labs (at El Paso Rd. only) 1/1/2 1/0/0 1/1/1 1/0/0 1/0/0
Norco Hills Park - mitigation area 0/0/0 0/0/0 0/0/0 0/0/0 0/0/0
Promenade Ave 2/2/4 2/1/1 2/1/1 1/1/0 2/1/1
Corona Ave @ Gilmore 0/0/0 0/0/0 Not
surveyed 0/0/0 3/1/2 SAR– Norco (Goose Creek Golf Course to River Rd) 101/64/113 105/59/91 95/51/86 108/52/109 110/32/36
Temescal Canyon 83/49/73 102/65/113 109/63/71 131/50/48 126/24/17 Harrison Reservoir (aka Mcallister Creek) 1/0/0
Not surveyed 3/0/0 4/0/0 3/0/0
La Sierra Ave 3/0/0 3/2/3 2/1/1 4/2/3 5/1/1
Cajalco Creek See Temescal 3/2/0 1/0/0 0/0/0 0/0/0 Chino Hills (Butterfield Ranch environs) 11/7/7 8/3/1 8/2/1 13/5/7 10/2/3 Chino Hills (Eucalyptus/Rancho Hills) 1/1/2 2/1/2 1/0/0 2/1/0 2/0/0

LBVI AND SWFL REPORT 2014 SANTA ANA WATERSHED ASSOCIATION TABLES
51
Table 1B: Least Bell’s Vireo abundance and distribution in the Santa Ana Watershed, 2010-2014. Numbers of territories, pairs and fledglings detected. By Sub-watershed
2010 2011 2012 2013 2014 Chino Hills (Eucalyptus/Del Monte) 2/1/0 0/0/0 0/0/0 0/0/0 0/0/0
Chino Hills (End of Eucalyptus) 0/0/0 0/0/0 Not
surveyed Not
surveyed Not
surveyed Carbon Canyon (Western Hills Golf Club) 0/0/0 0/0/0
Not surveyed
Not surveyed
Not surveyed
Carbon Canyon (Chino Hills Pkwy) 0/0/0 0/0/0
Not surveyed
Not surveyed
Not surveyed
Chino Hills Community Park (Eucalyptus/Peyton) 10/4/1 9/3/1 3/1/0 7/0/0 4/0/0
Chino Hills (Bayberry Dr) 0/0/0 0/0/0 Not
surveyed Not
surveyed Not
surveyed Chino Hills (Soquel Canyon/Pipeline)
Not surveyed 2/0/0 2/1/1 3/2/0 4/2/3
Carbon Canyon Regional Park & Carbon Canyon Rd. 8/6/3 13/7/5 12/7/7 16/9/1 16/6/5
Clearwater Pkwy @ Glen Helen Not
available Not
available Not
available 0/0/0 1/0/0
Fontana Power Plant Not
available Not
available Not
available 1/1/0 0/0/0 Black Gold Golf Club, Yorba Linda
Not available 2/0/0(5) 4/0/0(5) 3/0/0(5)
Not reported
South Coal Canyon (Santa Ana Canyon)
Not available
Not available 1/0/0(5) 1/0/0(5)
Not surveyed
Mud Canyon, Yorba Linda Not
available Not
available 1/0/0(5) 0/0/0 Not
surveyed
Sun Canyon Park 0/0/0 0/0/0 Not
surveyed 1/0/0 Not
surveyed
Wardlow Wash 0/0/0 0/0/0 Not
surveyed Not
surveyed Not
surveyed

LBVI AND SWFL REPORT 2014 SANTA ANA WATERSHED ASSOCIATION TABLES
52
Table 1B: Least Bell’s Vireo abundance and distribution in the Santa Ana Watershed, 2010-2014. Numbers of territories, pairs and fledglings detected. By Sub-watershed
2010 2011 2012 2013 2014
Fresno Canyon 1/0/0 1/1/1 0/0/0 1/1/0 2/0/0 Santa Ana Canyon - Upper Canyon (below Prado Dam to Green River Golf Club) 11/4/6 14/5/5 10/4/6 28/14/23 27/18/28 Santa Ana Canyon - Green River Golf Club 24/17/19 26/14/19 19/11/11 22/19/19 26/19/29 Santa Ana Canyon - Featherly Regional Park 40/23/22 33/19/23 36/16/12 64/45/55 59/39/35
Yorba Linda (Starlight Dr) 2/0/0 1/1/0 2/0/0 4/0/0 4/1/1
Yorba Linda (San Antonio Rd) Not
available Not
available Not
available Not
available 2/1/1
Yorba Linda Lakebed Park 1/1/1 1/0/0 1/0/0 1/0/0 1/0/0
Talbert Park Not
surveyed 1/0/0 2/0/0 3/1/0 5/1/0
Chino Hills State Park 51/23/14 42/17/7 33/14/11 36/15/6 21/6/4 Pulte Wetlands, adjacent to Chino Hills State Park (CHSP)
Not available 2/0/0
Not surveyed(5)
Not surveyed
Not surveyed
Rim Crest Dr & Blue Gum Dr, adjacent to CHSP
Not available 0/0/0
Not surveyed(5)
Not surveyed
See Chino Hills State Park
SAR - Miscellaneous Sightings/Reporting
Potrero 2/0/0(2) Not
surveyed Not
surveyed Not
surveyed 0/0/0(2) SAR Mainstem at Woolly star Preserve
Not surveyed
Not surveyed
Not surveyed
Not surveyed
Not surveyed
Estelle Mountain Reserve 0/0/0(2) 1/0/0(2) Not
surveyed Not
surveyed Not
surveyed
Hwy 71, OCWD Property Not
available Not
available Not
available 1/0/0 Not
surveyed

LBVI AND SWFL REPORT 2014 SANTA ANA WATERSHED ASSOCIATION TABLES
53
Table 1B: Least Bell’s Vireo abundance and distribution in the Santa Ana Watershed, 2010-2014. Numbers of territories, pairs and fledglings detected. By Sub-watershed
2010 2011 2012 2013 2014
Shipley Nature Center 0/0/0(6) 0/0/0(6) 0/0/0(6) 0/0/0(6) 0/0/0(6)
Etiwanda Wildlife Preserve 1/0/0 0/0/0 Not
surveyed Not
surveyed Not
surveyed
Mt. Baldy (Shinn Rd.) Not
surveyed 0/0/0 Not
surveyed Not
surveyed Not
surveyed Chino Creek Park at Inland Empire Utilities Agency 2/1/1 2/1/1 1/0/0 2/1/1 1/0/0 Coyote Hills East Reserve (Fullerton) (3/3/3)(4) (4/0/0)(4) (2/0/0)(4) 2/0/0(4)
Not surveyed
Rancho La Sierra West, Riverside 1/1/0 1/1/1 1/1/1 2/2/1 1/0/0
(Chula Vista, CA) (1/0/0)(4) Not
surveyed Not
surveyed Not
surveyed Not
surveyed River View Golf Course, Santa Ana
Not surveyed
Not surveyed
Not surveyed
Not surveyed
Not surveyed
UCR Not
surveyed 1/0/0 0/0/0 Not
surveyed 0/0/0
Alberhill - Temescal 0/0/0 0/0/0 1/0/0 Not
surveyed See Temescal
Santa Ana River – Riverside Ave to Mission Blvd
Not available
Not available 2/0/0
See SAR – Riverside Ave to Van Buren Blvd
See SAR – Riverside Ave to Van Buren Blvd
Colonies Crossroads Shopping Ctr Ponds, City
Not available
Not available
Not available 1/0/0
Not surveyed
Diemer Plant, Brea, CA Not
available Not
available Not
available 1/0/0(5) Not
reported Santa Ana River – AECom Flood Control Mitigation Project within SAR Norco to River Road
Not available
Not available
Not available 32/21/48(7) 38/19/16(8)
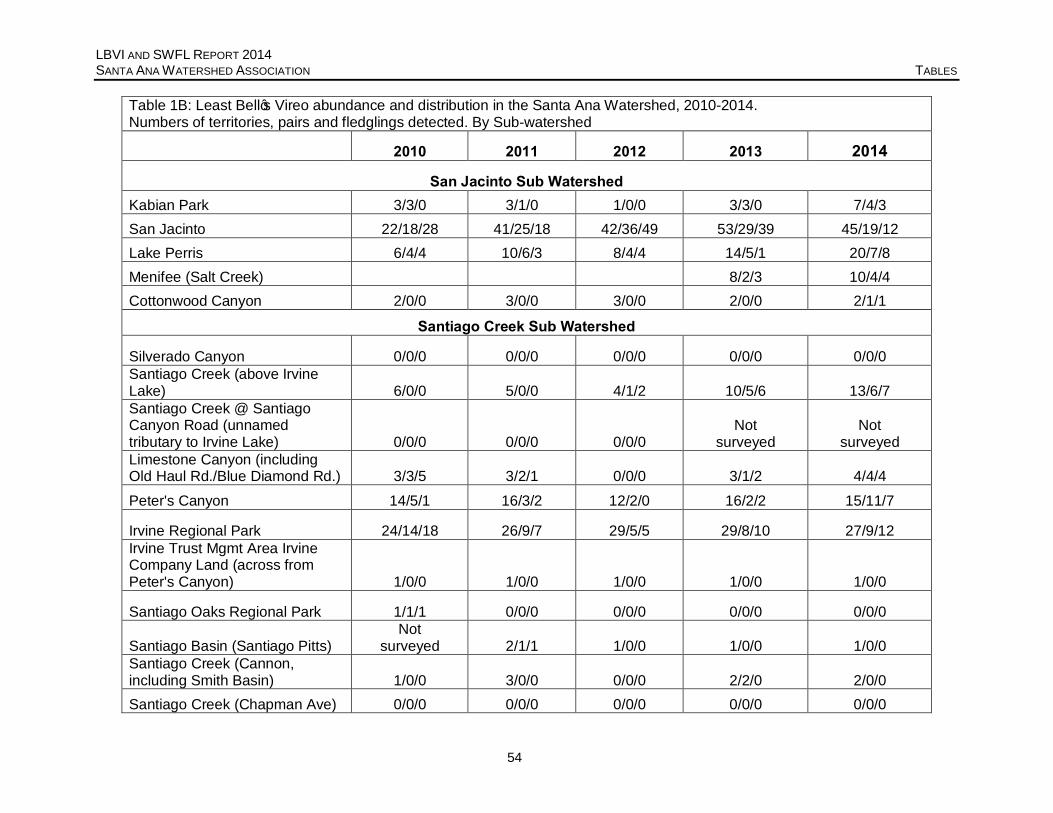
LBVI AND SWFL REPORT 2014 SANTA ANA WATERSHED ASSOCIATION TABLES
54
Table 1B: Least Bell’s Vireo abundance and distribution in the Santa Ana Watershed, 2010-2014. Numbers of territories, pairs and fledglings detected. By Sub-watershed
2010 2011 2012 2013 2014
San Jacinto Sub Watershed Kabian Park 3/3/0 3/1/0 1/0/0 3/3/0 7/4/3 San Jacinto 22/18/28 41/25/18 42/36/49 53/29/39 45/19/12 Lake Perris 6/4/4 10/6/3 8/4/4 14/5/1 20/7/8 Menifee (Salt Creek) 8/2/3 10/4/4 Cottonwood Canyon 2/0/0 3/0/0 3/0/0 2/0/0 2/1/1
Santiago Creek Sub Watershed
Silverado Canyon 0/0/0 0/0/0 0/0/0 0/0/0 0/0/0 Santiago Creek (above Irvine Lake) 6/0/0 5/0/0 4/1/2 10/5/6 13/6/7 Santiago Creek @ Santiago Canyon Road (unnamed tributary to Irvine Lake) 0/0/0 0/0/0 0/0/0
Not surveyed
Not surveyed
Limestone Canyon (including Old Haul Rd./Blue Diamond Rd.) 3/3/5 3/2/1 0/0/0 3/1/2 4/4/4 Peter's Canyon 14/5/1 16/3/2 12/2/0 16/2/2 15/11/7
Irvine Regional Park 24/14/18 26/9/7 29/5/5 29/8/10 27/9/12 Irvine Trust Mgmt Area Irvine Company Land (across from Peter's Canyon) 1/0/0 1/0/0 1/0/0 1/0/0 1/0/0
Santiago Oaks Regional Park 1/1/1 0/0/0 0/0/0 0/0/0 0/0/0
Santiago Basin (Santiago Pitts) Not
surveyed 2/1/1 1/0/0 1/0/0 1/0/0 Santiago Creek (Cannon, including Smith Basin) 1/0/0 3/0/0 0/0/0 2/2/0 2/0/0 Santiago Creek (Chapman Ave) 0/0/0 0/0/0 0/0/0 0/0/0 0/0/0

LBVI AND SWFL REPORT 2014 SANTA ANA WATERSHED ASSOCIATION TABLES
55
Table 1B: Least Bell’s Vireo abundance and distribution in the Santa Ana Watershed, 2010-2014. Numbers of territories, pairs and fledglings detected. By Sub-watershed
2010 2011 2012 2013 2014
Santiago Creek (Cambridge Rd) 0/0/0 0/0/0 0/0/0 0/0/0 0/0/0
SUBTOTAL 821/517/655 810/473/665 756/430/539 1021/471/682 1062/481/548 Santa Ana River - San Bernardino County 42/26/24(1) 42/23/30(1) 30/22/25(1)
Not reported
Not reported
TOTAL FOR SANTA ANA WATERSHED EXCLUDING PRADO BASIN 863/543/679 852/496/695 786/452/564 1021/471/682 1062/481/548
PRADO BASIN (Pike et al ) 569/286/479(3) 517/200/286(3) 451/158/229(3) 561/195/286(3) 520/172/194(3) TOTAL FOR SANTA ANA WATERSHED 1432/829/1158 1369/696/981 1237/610/793 1582/666/968 1582/653/742
(a.) Entries correspond to numbers of territorial males/pairs/'known fledged young' for designated time and locale. (b.) The "--" symbol indicates that no data were available. (c.) The "+" symbol indicates that actual count may have been somewhat higher; field census efforts were started late or were otherwise
deemed to be incomplete (1) Reported by biologists, San Bernardino County Flood Control (2) Reported by MSCHP biologists (3) Data from Pike et al. 2010-2014 (4) Outside Santa Ana Watershed, not included in totals (5) Reported by California State Parks. (6) Reported by Dave Telford (7) AECOM. 2013b. 2013 Santa Ana River Flood Control Project Mitigation Plan Least Bell’s Vireo 45-day Report, San Bernardino,
California (8) AECOM personal communication
*Number of fledglings misreported in 2013

LBVI AND SWFL REPORT 2014 SANTA ANA WATERSHED ASSOCIATION TABLES
56
Table 2.1: Least Bell’s Vireo, Survey Dates and Breeding Chronology, 2014
Survey Start
Date Survey End Date First Arrival Date 50% Arrived 50% Paired Date Last Detected
Santa Ana River and Tributaries San Timoteo Canyon 3/17/14 8/15/14 3/17/14 4/8/14 4/22/14 8/15/14
Sycamore Canyon 4/14/14 7/14/14 4/14/14 4/24/14 n/a 7/14/14 Meridian C.A. (former March SKR Preserve) 4/24/14 8/20/14 4/24/14 5/13/14 6/4/14 8/1/14
Mockingbird Canyon 3/17/14 7/24/14 3/17/14 4/1/14 4/14/14 7/24/14 SAR – Riverside (Riverside Ave to Van Buren Blvd. 3/18/14 8/18/14 3/20/14 4/10/14 5/13/14 7/23/14 SAR mainstem: Hidden Valley Wildlife Preserve Hidden Valley (area monitored since 2000, south side of river) 3/17/14 8/8/14 3/18/14 4/17/14 n/a 8/8/14
Hidden Valley (north side of river) 3/18/14 7/1/14 3/24/14 4/17/14 5/8/14 7/1/14 SAR – Norco (Goose Creek Golf Course to River Rd) 3/19/14 6/27/14 3/19/14 4/9/14 n/a 6/27/14
Temescal Canyon 4/8/14 7/22/14 4/8/14 -- -- 7/22/14
Chino Hills (Butterfield Ranch environs) 3/20/14 7/1/14 3/20/14 n/a n/a 8/7/14 Santa Ana River - Upper Canyon, Santa Ana Canyon 3/21/14 7/21/14 3/26/14 3/28/14
4/18/14 N = 10 9/10/14
Santa Ana River - Green River Golf Course, Santa Ana Canyon 3/27/14 9/10/14 3/27/14 4/1/14 4/23/14 9/10/14 Santa Ana River – Featherly Regional Park, Santa Ana Canyon 3/13/14 9/9/14 3/18/14 4/7/14 4/15/14 9/9/14 Irvine Regional Park, Santiago Creek, Orange County 3/27/14 7/9/14 3/27/14 4/22/14 6/2/14 7/9/14 San Jacinto River Sub Watershed
San Jacinto River 3/18/14 9/19/14 4/3/14 4/9/14 5/9/14 7/23/14
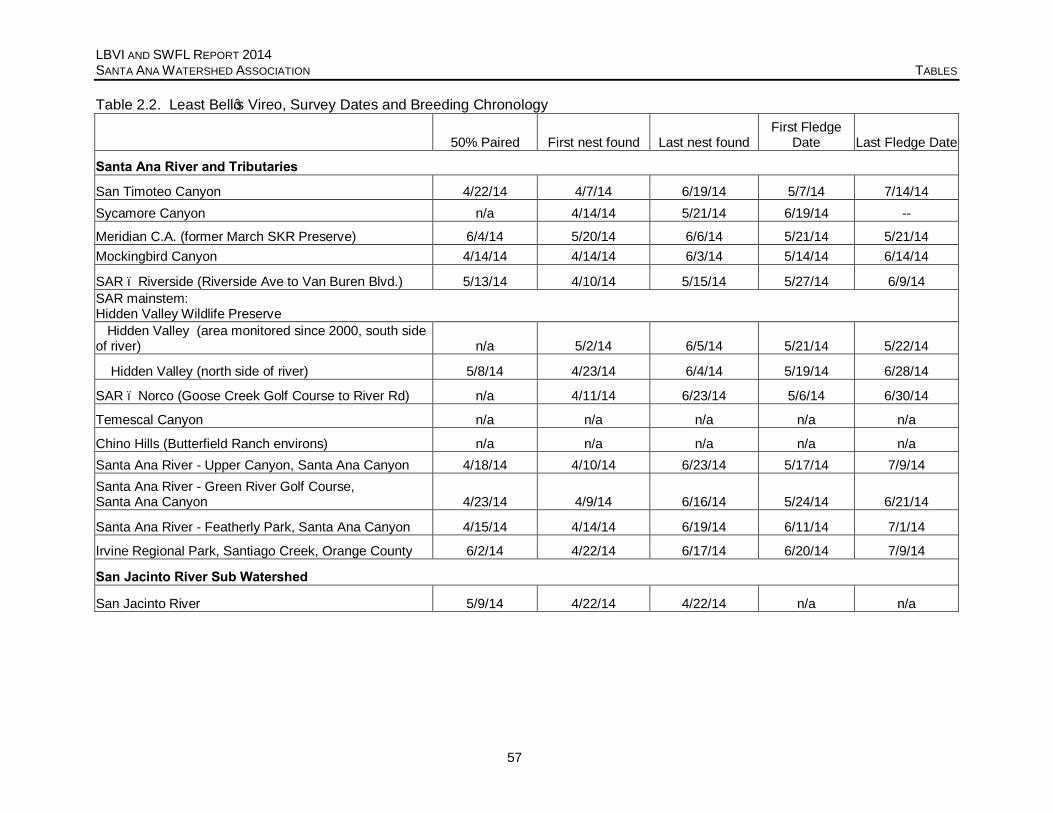
LBVI AND SWFL REPORT 2014 SANTA ANA WATERSHED ASSOCIATION TABLES
57
Table 2.2. Least Bell’s Vireo, Survey Dates and Breeding Chronology
50% Paired First nest found Last nest found First Fledge
Date Last Fledge Date
Santa Ana River and Tributaries
San Timoteo Canyon 4/22/14 4/7/14 6/19/14 5/7/14 7/14/14 Sycamore Canyon n/a 4/14/14 5/21/14 6/19/14 --
Meridian C.A. (former March SKR Preserve) 6/4/14 5/20/14 6/6/14 5/21/14 5/21/14 Mockingbird Canyon 4/14/14 4/14/14 6/3/14 5/14/14 6/14/14
SAR – Riverside (Riverside Ave to Van Buren Blvd.) 5/13/14 4/10/14 5/15/14 5/27/14 6/9/14 SAR mainstem: Hidden Valley Wildlife Preserve Hidden Valley (area monitored since 2000, south side of river) n/a 5/2/14 6/5/14 5/21/14 5/22/14
Hidden Valley (north side of river) 5/8/14 4/23/14 6/4/14 5/19/14 6/28/14
SAR – Norco (Goose Creek Golf Course to River Rd) n/a 4/11/14 6/23/14 5/6/14 6/30/14
Temescal Canyon n/a n/a n/a n/a n/a
Chino Hills (Butterfield Ranch environs) n/a n/a n/a n/a n/a Santa Ana River - Upper Canyon, Santa Ana Canyon 4/18/14 4/10/14 6/23/14 5/17/14 7/9/14 Santa Ana River - Green River Golf Course, Santa Ana Canyon 4/23/14 4/9/14 6/16/14 5/24/14 6/21/14
Santa Ana River - Featherly Park, Santa Ana Canyon 4/15/14 4/14/14 6/19/14 6/11/14 7/1/14
Irvine Regional Park, Santiago Creek, Orange County 6/2/14 4/22/14 6/17/14 6/20/14 7/9/14
San Jacinto River Sub Watershed
San Jacinto River 5/9/14 4/22/14 4/22/14 n/a n/a
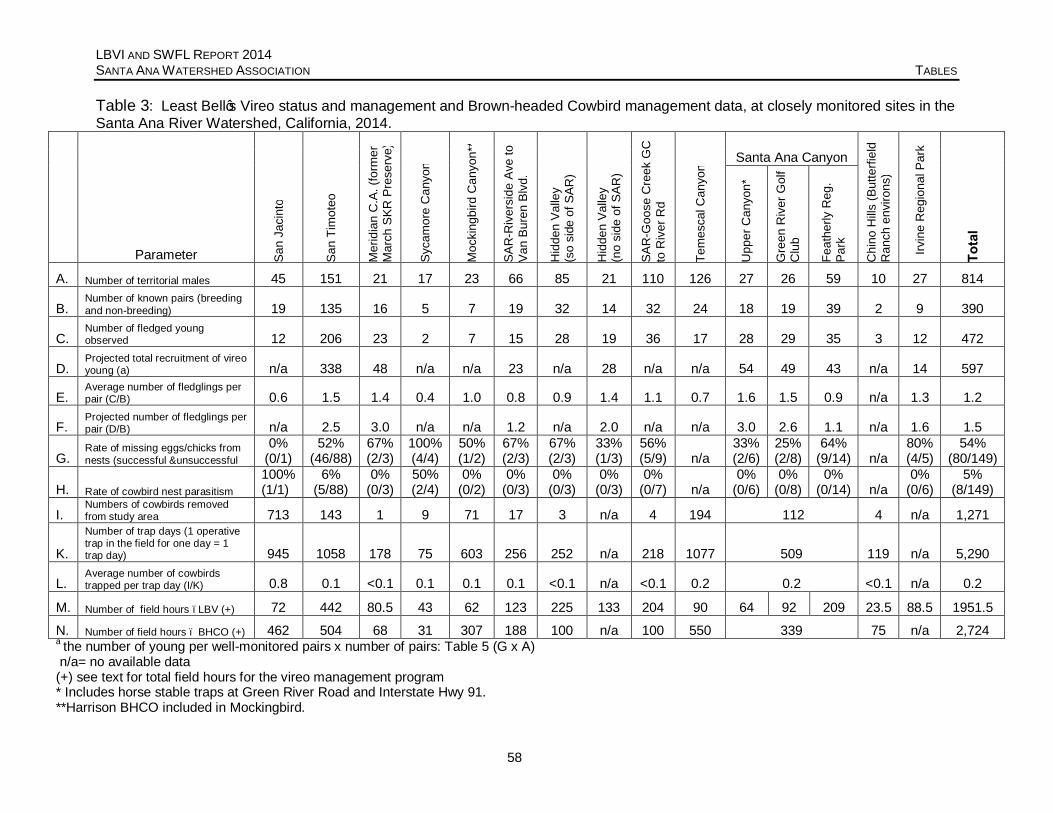
LBVI AND SWFL REPORT 2014 SANTA ANA WATERSHED ASSOCIATION TABLES
58
Table 3: Least Bell’s Vireo status and management and Brown-headed Cowbird management data, at closely monitored sites in the Santa Ana River Watershed, California, 2014.
Parameter San
Jaci
nto
San
Tim
oteo
Mer
idia
n C
.A. (
form
er
Mar
ch S
KR P
rese
rve)
Syca
mor
e C
anyo
n
Moc
king
bird
Can
yon*
*
SAR
-Riv
ersi
de A
ve to
Va
n Bu
ren
Blvd
.
Hid
den
Valle
y
(so
side
of S
AR)
Hid
den
Valle
y
(no
side
of S
AR)
SAR
-Goo
se C
reek
GC
to
Riv
er R
d
Tem
esca
l Can
yon
Santa Ana Canyon
Chi
no H
ills (B
utte
rfiel
d R
anch
env
irons
)
Irvin
e R
egio
nal P
ark
Tota
l
Upp
er C
anyo
n*
Gre
en R
iver
Gol
f C
lub
Feat
herly
Reg
. Pa
rk
A. Number of territorial males 45 151 21 17 23 66 85 21 110 126 27 26 59 10 27 814
B. Number of known pairs (breeding and non-breeding) 19 135 16 5 7 19 32 14 32 24 18 19 39 2 9 390
C. Number of fledged young observed 12 206 23 2 7 15 28 19 36 17 28 29 35 3 12 472
D. Projected total recruitment of vireo young (a) n/a 338 48 n/a n/a 23 n/a 28 n/a n/a 54 49 43 n/a 14 597
E. Average number of fledglings per pair (C/B) 0.6 1.5 1.4 0.4 1.0 0.8 0.9 1.4 1.1 0.7 1.6 1.5 0.9 n/a 1.3 1.2
F. Projected number of fledglings per pair (D/B) n/a 2.5 3.0 n/a n/a 1.2 n/a 2.0 n/a n/a 3.0 2.6 1.1 n/a 1.6 1.5
G. Rate of missing eggs/chicks from nests (successful &unsuccessful
0% (0/1)
52% (46/88)
67% (2/3)
100% (4/4)
50% (1/2)
67% (2/3)
67% (2/3)
33% (1/3)
56% (5/9) n/a
33% (2/6)
25% (2/8)
64% (9/14) n/a
80% (4/5)
54% (80/149)
H. Rate of cowbird nest parasitism 100% (1/1)
6% (5/88)
0% (0/3)
50% (2/4)
0% (0/2)
0% (0/3)
0% (0/3)
0% (0/3)
0% (0/7) n/a
0% (0/6)
0% (0/8)
0% (0/14) n/a
0% (0/6)
5% (8/149)
I. Numbers of cowbirds removed from study area 713 143 1 9 71 17 3 n/a 4 194 112 4 n/a 1,271
K.
Number of trap days (1 operative trap in the field for one day = 1 trap day) 945 1058 178 75 603 256 252 n/a 218 1077 509 119 n/a 5,290
L. Average number of cowbirds trapped per trap day (I/K) 0.8 0.1 <0.1 0.1 0.1 0.1 <0.1 n/a <0.1 0.2 0.2 <0.1 n/a 0.2
M. Number of field hours –LBV (+) 72 442 80.5 43 62 123 225 133 204 90 64 92 209 23.5 88.5 1951.5
N. Number of field hours – BHCO (+) 462 504 68 31 307 188 100 n/a 100 550 339 75 n/a 2,724 a the number of young per well-monitored pairs x number of pairs: Table 5 (G x A) n/a= no available data (+) see text for total field hours for the vireo management program * Includes horse stable traps at Green River Road and Interstate Hwy 91. **Harrison BHCO included in Mockingbird.

LBVI AND SWFL REPORT 2014 SANTA ANA WATERSHED ASSOCIATION TABLES
59
Table 4: Least Bell's Vireo nest placement preferences, monitored sites in the Santa Ana River Watershed, 2014
Host Plant Species (taxonomic order) Sa
n Ja
cint
o
San
Tim
oteo
Mer
idia
n C
.A. (
form
er
Mar
ch S
KR P
resr
ve)
Syca
mor
e C
anyo
n
Moc
king
bird
Can
yon
SAR
-Riv
ersi
de A
ve to
Van
Bu
ren
Blvd
.
Hid
den
Valle
y
(so
side
of S
AR)
Hid
den
Valle
y (n
o si
de o
f SA
R)
SAR
- Goo
se C
reek
GC
to
Riv
er R
d
Tem
esca
l Can
yon
Santa Ana Canyon
Chi
no H
ills (B
utte
rfiel
d R
anch
env
irons
)
Irvin
e R
egio
nal P
ark
Tota
l
Upp
er C
anyo
n
Gre
en R
iver
Gol
f C
ours
e
Feat
herly
Reg
iona
l Pa
rk
Western Sycamore (Platanus racemosa) 3 3 Golden Currant (Ribes aureum) 1 1 Wild Grape (Vitis girdiana) 18 1 1 1 21 Fremont Cottonwood (Populus fremontii) 5 1 1 1 1 9
Narrow-leaf Willow (Salix exigua) 4 2 1 1 8 Black Willow (Salix gooddingii) 2 1 3 Red Willow (Salix laevigata) 6 1 1 8 Arroyo Willow (Salix lasiolepis) 20 2 1 2 1 2 28
Yellow Willow (Salix lucida spp. lasiandra) 1 1 Dead Willow sp. (Salix sp.) 1 1 Toyon (Heteromeles arbutifolia) 4 4 White Mulberry (Morus alba) 1
1
Laurel Sumac (Malosma laurina) 2 2

LBVI AND SWFL REPORT 2014 SANTA ANA WATERSHED ASSOCIATION TABLES
60
Table 4: Least Bell's Vireo nest placement preferences, monitored sites in the Santa Ana River Watershed, 2014
Host Plant Species (taxonomic order) Sa
n Ja
cint
o
San
Tim
oteo
Mer
idia
n C
.A. (
form
er
Mar
ch S
KR P
resr
ve)
Syca
mor
e C
anyo
n
Moc
king
bird
Can
yon
SAR
-Riv
ersi
de A
ve to
Van
Bu
ren
Blvd
.
Hid
den
Valle
y
(so
side
of S
AR)
Hid
den
Valle
y (n
o si
de o
f SA
R)
SAR
- Goo
se C
reek
GC
to
Riv
er R
d
Tem
esca
l Can
yon
Santa Ana Canyon
Chi
no H
ills (B
utte
rfiel
d R
anch
env
irons
)
Irvin
e R
egio
nal P
ark
Tota
l
Upp
er C
anyo
n
Gre
en R
iver
Gol
f C
ours
e
Feat
herly
Reg
iona
l Pa
rk
Poison Oak (Toxocodendron diversilobum) 1 1 2 Tree of Heaven (Ailanthus altissima) 1
1
Black Sage (Salvia mellifera) 1
1
Mugwort (Artemisia douglasiana) 1 1 2 Coyote Bush (Baccharis pilularis) 1 1
Mulefat (Baccharis salicifolia) 26 2 2 10 7 2 4 4 57 Black Elderberry (Sambucus nigra) 4 2 1 1 2 5 15 Yerba Santa species (Eriodictyon sp) 1
1
Unknown 1 2 1
4
Total 2 94 3 4 3 5 4 4 13 n/a 8 10 18 n/a 6 174

LBVI AND SWFL REPORT 2014 SANTA ANA WATERSHED ASSOCIATION TABLES
61
Table 5: Least Bell’s Vireo reproductive success and breeding biology data, monitored sites in the Santa Ana River Watershed, 2014
San
Jaci
nto
San
Tim
oteo
Mer
idia
n C
.A. (
form
er
Mar
ch S
KR P
rese
rve)
Syca
mor
e C
anyo
n
Moc
king
bird
Can
yon
SAR
-Riv
ersi
de A
ve to
Van
Bu
ren
Blvd
Hid
den
Valle
y
(s
o si
de o
f SAR
)
Hid
den
Valle
y
(no
side
of S
AR)
SAR
-Goo
se C
reek
GC
to
Riv
er R
d
Tem
esca
l
Santa Ana Canyon
Chi
no H
ills (B
utte
rfiel
d R
anch
env
irons
)
Irvin
Reg
iona
l Par
kI
Tota
l
Upp
er C
anyo
n
Gre
en R
iver
Gol
f Clu
b
Feat
herly
Reg
. Par
k
A. Number of known pairs 19 135 16 5 7 19 32 14 32 24 18 19 39 2 9 390
B. Number of breeding (nesting) pairs 15 114 16 3 4 10 25 10 28 n/a 16 18 34 n/a 8 301
C.
Number of breeding pairs that were well-monitored throughout the breeding season 0 48 1 0 0 5 0 4 0 n/a 4 4 10 n/a 5 81
D. Number of 'known fledged young' OBSERVED 12 206 23 2 7 15 28 19 36 17 28 29 35 3 12 472
E.
Number of known fledged young produced by pairs monitored throughout the breeding season n/a 121 3 n/a n/a 6 n/a 8 n/a n/a 12 9 11 n/a 8 178
F.
Average number of fledglings produced per breeding pair (minimum; D/B = 'productivity or breeding success') 0.8 1.8 1.4 0.7 1.8 1.5 1.1 1.9 1.3 n/a 1.8 1.6 1.0 n/a 1.5 1.6
G.
Average number of fledglings produced by pairs monitored throughout the breeding season (E/C) equal reproductive success n/a 2.5 3.0 n/a n/a 1.2 n/a 2.0 n/a n/a 3.0 2.3 1.1 n/a 1.6 2.2
H. Number of nests that were discovered 2 94 3 4 3 6 4 4 13 3 8 10 18 n/a 6 178
I. Number of nests that were regularly monitored or 'tracked' 1 88 3 4 2 3 3 3 9 0 6 8 14 n/a 5 149
J.
Number of 'tracked' nests that were successful l (% = J/I x 100)
0% (0/1)
48% (42/88)
33% (1/3)
25% (1/4)
50% (1/2)
67% (2/3)
67% (2/3)
67% (2/3)
44% (4/9) n/a
83% (5/6)
63% (5/8)
29% (4/14) n/a
60% (3/5)
48% (72/149)

LBVI AND SWFL REPORT 2014 SANTA ANA WATERSHED ASSOCIATION TABLES
62
Table 5: Least Bell’s Vireo reproductive success and breeding biology data, monitored sites in the Santa Ana River Watershed, 2014
San
Jaci
nto
San
Tim
oteo
Mer
idia
n C
.A. (
form
er
Mar
ch S
KR P
rese
rve)
Syca
mor
e C
anyo
n
Moc
king
bird
Can
yon
SAR
-Riv
ersi
de A
ve to
Van
Bu
ren
Blvd
Hid
den
Valle
y
(s
o si
de o
f SAR
)
Hid
den
Valle
y
(no
side
of S
AR)
SAR
-Goo
se C
reek
GC
to
Riv
er R
d
Tem
esca
l
Santa Ana Canyon
Chi
no H
ills (B
utte
rfiel
d R
anch
env
irons
)
Irvin
Reg
iona
l Par
kI
Tota
l
Upp
er C
anyo
n
Gre
en R
iver
Gol
f Clu
b
Feat
herly
Reg
. Par
k
K.
Rate of missing eggs/ chicks from nests (successful and unsuccessful) (%=K/I x100) (b)
0% (0/1)
52% (46/88)
67% (2/3)
100% (4/4)
50% (1/2)
67% (2/3)
67% (2/3)
33% (1/3)
56% (5/9) n/a
33% (2/6)
25% (2/8)
64% (9/14) n/a
80% (4/5)
54% (80/149)
L.
Number of 'tracked' nests that were parasitized by cowbirds (%=L/I x 100)
100% (1/1)
6% (5/88)
0% (0/3)
50% (2/4)
0% (0/2)
0% (0/3)
0% (0/3)
0% (0/3)
0% (0/9) n/a
0% (0/6)
0% (0/8)
0% (0/14) n/a
0% (0/5)
5% (8/149)
M.
A. Number of 'tracked' nests that failed as a result of reproductive failure
0% (0/1)
6% (5/88)
0% (0/3)
0% (0/4)
0% (0/2)
0% (0/3)
0% (0/3)
0% (0/3)
0% (0/9) n/a
0% (0/6)
13% (1/8)
7% (1/14) n/a
0% (0/5)
5% (7/149)
B. Number of 'tracked" nests that failed as a result of parasitism
100% (1/1)
2% (2/88)
0% (0/3)
50% (2/4)
0% (0/2)
0% (0/3)
0% (0/3)
0% (0/3)
0% (0/9) n/a
0% (0/6)
0% (0/8)
0% (0/14) n/a
0% (0/5)
3% (5/149)
C. Number of 'tracked' nests that failed as a result of predation-Predation Rate according to Vireo Working Group
0% (0/1)
44% (39/88)
67% (2/3)
25% (1/4)
0% (0/2)
33% (1/3)
33% (1/3)
33% (1/3)
56% (5/9) n/a
17% (1/6)
25% (2/8)
64% (9/14) n/a
40% (2/5)
43% (64/149)
D. Number of ‘tracked’ nests that failed for unknown reasons
0% (0/1)
0% (0/88)
0% (0/3)
0% (0/4)
50% (1/2)
0% (0/3)
0% (0/3)
0% (0/3)
0% (0/9) n/a
0% (0/6)
0% (0/8)
0% (0/14) n/a
0% (0/5)
1% (1/149)
N
Average clutch size 3.0 3.2 3.3 3.3 3.0 3.5 3.0 4.0 3.3 n/a 3.2 3.0 3.1 n/a 3.2 3.2 Number of eggs/Number of clutches 3/1 251/78 10/3 10/3 6/2 7/2 6/2 12/3 36/11 n/a 19/6 24/8 34/11 n/a 16/5 (434/135)
O. Number of cowbird eggs found in or near vireo nests 1 4 0 3 0 0 0 0 0 n/a 0 0 0 n/a 0 8
P. Number of cowbird nestlings removed from 'tracked' nests 0 1 0 0 0 0 0 0 0 n/a 0 0 0 n/a 0 1
Q. Number of cowbird young fledged by vireos 2 0 0 0 0 0 0 0 0 n/a 0 0 0 n/a 0 2
R. Number of 'manipulated' parasitized nests 0 4 0 1 0 0 0 0 0 n/a 0 0 0 n/a 0 5
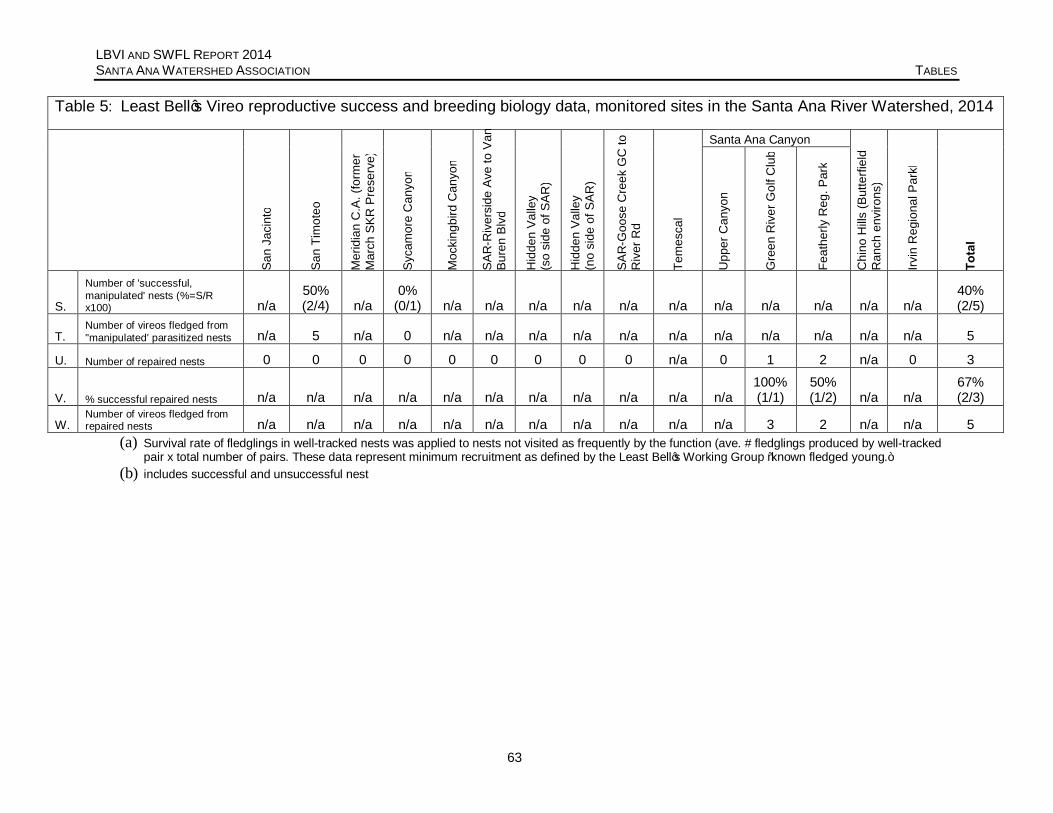
LBVI AND SWFL REPORT 2014 SANTA ANA WATERSHED ASSOCIATION TABLES
63
Table 5: Least Bell’s Vireo reproductive success and breeding biology data, monitored sites in the Santa Ana River Watershed, 2014
San
Jaci
nto
San
Tim
oteo
Mer
idia
n C
.A. (
form
er
Mar
ch S
KR P
rese
rve)
Syca
mor
e C
anyo
n
Moc
king
bird
Can
yon
SAR
-Riv
ersi
de A
ve to
Van
Bu
ren
Blvd
Hid
den
Valle
y
(s
o si
de o
f SAR
)
Hid
den
Valle
y
(no
side
of S
AR)
SAR
-Goo
se C
reek
GC
to
Riv
er R
d
Tem
esca
l
Santa Ana Canyon
Chi
no H
ills (B
utte
rfiel
d R
anch
env
irons
)
Irvin
Reg
iona
l Par
kI
Tota
l
Upp
er C
anyo
n
Gre
en R
iver
Gol
f Clu
b
Feat
herly
Reg
. Par
k
S.
Number of 'successful, manipulated' nests (%=S/R x100) n/a
50% (2/4) n/a
0% (0/1) n/a n/a n/a n/a n/a n/a n/a n/a n/a n/a n/a
40% (2/5)
T. Number of vireos fledged from "manipulated' parasitized nests n/a 5 n/a 0 n/a n/a n/a n/a n/a n/a n/a n/a n/a n/a n/a 5
U. Number of repaired nests 0 0 0 0 0 0 0 0 0 n/a 0 1 2 n/a 0 3
V. % successful repaired nests n/a n/a n/a n/a n/a n/a n/a n/a n/a n/a n/a 100% (1/1)
50% (1/2) n/a n/a
67% (2/3)
W. Number of vireos fledged from repaired nests n/a n/a n/a n/a n/a n/a n/a n/a n/a n/a n/a 3 2 n/a n/a 5
(a) Survival rate of fledglings in well-tracked nests was applied to nests not visited as frequently by the function (ave. # fledglings produced by well-tracked pair x total number of pairs. These data represent minimum recruitment as defined by the Least Bell’s Working Group “known fledged young.”
(b) includes successful and unsuccessful nest
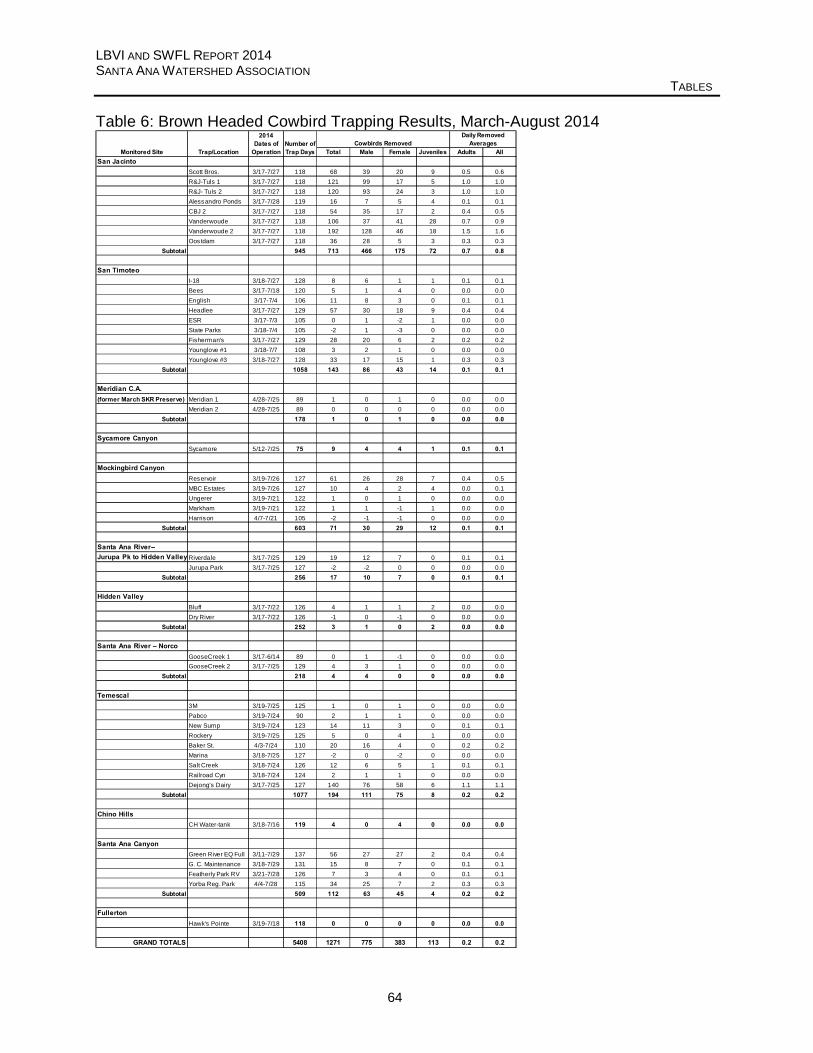
LBVI AND SWFL REPORT 2014 SANTA ANA WATERSHED ASSOCIATION TABLES
64
Table 6: Brown Headed Cowbird Trapping Results, March-August 2014
Total Male Female Juveniles Adults AllSan Jacinto
Scott Bros. 3/17-7/27 118 68 39 20 9 0.5 0.6R&J-Tuls 1 3/17-7/27 118 121 99 17 5 1.0 1.0R&J- Tuls 2 3/17-7/27 118 120 93 24 3 1.0 1.0Alessandro Ponds 3/17-7/28 119 16 7 5 4 0.1 0.1CBJ 2 3/17-7/27 118 54 35 17 2 0.4 0.5Vanderwoude 3/17-7/27 118 106 37 41 28 0.7 0.9Vanderwoude 2 3/17-7/27 118 192 128 46 18 1.5 1.6Oostdam 3/17-7/27 118 36 28 5 3 0.3 0.3
Subtotal 945 713 466 175 72 0.7 0.8
San TimoteoI-18 3/18-7/27 128 8 6 1 1 0.1 0.1Bees 3/17-7/18 120 5 1 4 0 0.0 0.0English 3/17-7/4 106 11 8 3 0 0.1 0.1Headlee 3/17-7/27 129 57 30 18 9 0.4 0.4ESR 3/17-7/3 105 0 1 -2 1 0.0 0.0State Parks 3/18-7/4 105 -2 1 -3 0 0.0 0.0Fisherman's 3/17-7/27 129 28 20 6 2 0.2 0.2Younglove #1 3/18-7/7 108 3 2 1 0 0.0 0.0Younglove #3 3/18-7/27 128 33 17 15 1 0.3 0.3
Subtotal 1058 143 86 43 14 0.1 0.1
Meridian C.A. (former March SKR Preserve) Meridian 1 4/28-7/25 89 1 0 1 0 0.0 0.0
Meridian 2 4/28-7/25 89 0 0 0 0 0.0 0.0Subtotal 178 1 0 1 0 0.0 0.0
Sycamore CanyonSycamore 5/12-7/25 75 9 4 4 1 0.1 0.1
Mockingbird CanyonReservoir 3/19-7/26 127 61 26 28 7 0.4 0.5MBC Estates 3/19-7/26 127 10 4 2 4 0.0 0.1Ungerer 3/19-7/21 122 1 0 1 0 0.0 0.0Markham 3/19-7/21 122 1 1 -1 1 0.0 0.0Harrison 4/7-7/21 105 -2 -1 -1 0 0.0 0.0
Subtotal 603 71 30 29 12 0.1 0.1
Santa Ana River--Jurupa Pk to Hidden Valley Riverdale 3/17-7/25 129 19 12 7 0 0.1 0.1
Jurupa Park 3/17-7/25 127 -2 -2 0 0 0.0 0.0Subtotal 256 17 10 7 0 0.1 0.1
Hidden ValleyBluff 3/17-7/22 126 4 1 1 2 0.0 0.0Dry River 3/17-7/22 126 -1 0 -1 0 0.0 0.0
Subtotal 252 3 1 0 2 0.0 0.0
Santa Ana River – NorcoGooseCreek 1 3/17-6/14 89 0 1 -1 0 0.0 0.0GooseCreek 2 3/17-7/25 129 4 3 1 0 0.0 0.0
Subtotal 218 4 4 0 0 0.0 0.0
Temescal3M 3/19-7/25 125 1 0 1 0 0.0 0.0Pabco 3/19-7/24 90 2 1 1 0 0.0 0.0New Sump 3/19-7/24 123 14 11 3 0 0.1 0.1Rockery 3/19-7/25 125 5 0 4 1 0.0 0.0Baker St. 4/3-7/24 110 20 16 4 0 0.2 0.2Marina 3/18-7/25 127 -2 0 -2 0 0.0 0.0Salt Creek 3/18-7/24 126 12 6 5 1 0.1 0.1Railroad Cyn 3/18-7/24 124 2 1 1 0 0.0 0.0Dejong's Dairy 3/17-7/25 127 140 76 58 6 1.1 1.1
Subtotal 1077 194 111 75 8 0.2 0.2
Chino HillsCH Water-tank 3/18-7/16 119 4 0 4 0 0.0 0.0
Santa Ana CanyonGreen River EQ Full 3/11-7/29 137 56 27 27 2 0.4 0.4G. C. Maintenance 3/18-7/29 131 15 8 7 0 0.1 0.1Featherly Park RV 3/21-7/28 126 7 3 4 0 0.1 0.1Yorba Reg. Park 4/4-7/28 115 34 25 7 2 0.3 0.3
Subtotal 509 112 63 45 4 0.2 0.2
FullertonHawk's Pointe 3/19-7/18 118 0 0 0 0 0.0 0.0
GRAND TOTALS 5408 1271 775 383 113 0.2 0.2
Cowbirds RemovedDaily Removed
AveragesMonitored Site Trap/Location
2014 Dates of
OperationNumber of Trap Days

LBVI AND SWFL REPORT 2014 SANTA ANA WATERSHED ASSOCIATION TABLES
65
Table 7: Non-target Avian Captures in Brown-headed Cowbird Traps, March-August 2014
Common Name Scientific Name caught died caught died caught died caught died caught died caught died caught died caught died caught died caught died caught died caught died caught died
California Towhee Melozone crissalis 340 1 8 0 68 0 3 0 1 0 7 0 37 0 3 0 114 5 1 0 582 6
House Sparrow Passer domesticus 388 0 4 0 1 0 105 1 8 0 1 0 507 1
House Finch Carpodacus mexicanus 60 3 4 0 11 2 11 0 2 0 1 0 148 1 98 1 20 0 355 7
European Starling Sturnus vulgaris 196 0 2 0 2 0 11 0 4 0 23 0 238 0
Red-winged Blackbird Agelaius phoeniceus 19 0 147 0 3 0 5 0 7 0 1 0 182 0
Song Sparrow Melospiza melodia 4 0 1 0 1 0 120 1 126 1
Lark Sparrow Chondestes grammacus 11 0 5 0 2 0 22 0 40 0
White-crowned Sparrow Zonotrichia leucophrys 3 0 36 0 39 0
Yellow-headed Blackbird Xanthocephalus xanthocephalus 3 0 9 0 2 0 14 0
Brewer’s Blackbird Euphagus cyanocephalus 11 0 11 0
Bewick's Wren Thryomanes bewick ii 1 0 1 0 4 1 2 0 8 1
Tri-colored Blackbird Agelaius tricolor 5 0 3 0 8 0
Spotted Towhee Pipilo maculatus 1 1 4 0 5 1
Mourning Dove Zenaida macroura 3 0 1 0 4 0
Black-headed Grosbeak Pheucticus melanocephalus 1 0 1 0 1 0 1 0 4 0
House Wren Troglodytes aedon 1 0 2 0 3 0
Northern Mockingbird Mimus polyglottos 1 0 1 0 1 0 3 0
California Thrasher Toxostoma redivivum 2 0 2 0
Bullocks 's Oriole Icterus bullockii 1 0 1 0 2 0
Black Phoebe Sayornis nigricans 1 0 1 0686 3 530 2 30 2 2 0 89 0 110 1 3 0 11 0 367 3 105 1 199 5 2 0 2134 170.7 0.5 0.2 0.0 0.1 0.4 0.0 0.1 0.3 0.1 0.3 0.0 0.4
0.4% 0.4% 6.7% 0.0% 0.0% 0.9% 0.0% 0 0.8% 1.0% 2.5% 0.0% 0.8%Mortality %
Hidden Valley
** Number of dead cowbirds included in number caught
2014 Total
Santa Ana CanyonTemescalSan Jacinto San Timoteo
SAR-Jurupa to Hidden Valley
FullertonSanta Ana River-Norco Sycamore Cyn
2014 Non-Target Species
TOTALS#/trap day
Meridian C.A. (M ar ch SKR
Pr eser ve)
Mockingbird Canyon Chino Hills

LBVI AND SWFL REPORT 2014 SANTA ANA WATERSHED ASSOCIATION TABLES
66
Table 8: Brown-headed Cowbird Trapping Results, Winter 2013-2014
Total Male Female Juveniles Adults AllSan Jacinto
Scott Bros. 8/5/13-3/14/14 212 427 143 126 158 1.3 2.0R&J-Tuls 1 8/5/13-3/14/14 212 783 455 304 24 3.6 3.7R&J- Tuls 2 8/5/13-3/14/14 212 839 559 242 38 3.8 4.0CBJ#2 8/5/13-3/14/14 212 253 113 101 39 1.0 1.2Vanderwoude 8/5/13-3/14/14 212 758 172 195 391 1.7 3.6Vanderwoude 2 8/5/13-3/14/14 212 932 336 376 220 3.4 4.4Oostdam 8/5/13-3/14/14 212 80 7 41 32 0.2 0.4
Subtotal 1484 4072 1785 1385 902 2.1 2.7
TemescalDejong's Dairy 8/5/13-3/14/14 162 865 272 271 322 3.4 5.3
GRAND TOTAL 1646 4937 2057 1656 1224 2.3 3.0
Cowbirds RemovedDaily Removed
Averages
Monitored Site Trap/LocationDates of
OperationNumber of Trap Days

LBVI AND SWFL REPORT 2014 SANTA ANA WATERSHED ASSOCIATION TABLES
67
Table 9: Non-target Avian Captures in Brown-headed Cowbird Traps, Winter 2013-2014
Common Name Scientific Name caught died caught died caught died
European Starling Sturnus vulgaris 212 3 171 0 383 3
House Sparrow Passer domesticus 65 0 1 0 66 0Red-winged Blackbird Agelaius phoeniceus 34 2 27 0 61 2
House Finch Carpodacus mexicanus 12 0 12 0
Yellow-headed Blackbird Xanthocephalus xanthocephalus 2 0 9 0 11 0Brewer’s Blackbird Euphagus cyanocephalus 10 0 10 0
Budgeriar Melopsittacus undulatus 2 0 2 0
Loggerhead Shrike Lanius ludovicianus 1 0 1 0Yellow-rumped Warbler Setophaga coronata 1 0 1 0
Tricolored Blackbird Agelaius tricolor 1 0 1 0
340 5 208 0 548 50.2 1.3 0.3
1.5% 0.0% 0.9%
2013-2014 Winter Non-Target Species TOTAL
TOTALS
#/trap day Mortality %
Temescal San Jacinto
Number of dead birds included in number birds caught.

LBVI AND SWFL REPORT 2014 SANTA ANA WATERSHED ASSOCIATION TABLES
68
Table 10: Results of the Least Bell's Vireo Assessment Surveys in the Santa Ana Watershed, 2006-2014 Site # LBVI Territories
2005 2006 2007 2008 2009 2010 2011 2012 2013 2014
Alessandro Arroyob See Table 1
See Table 1 3 5 4 6 7 6 7 19
Arlington Falls - - - - - - 0 0 0 0
Box Springs 0 2 2 1 3 5 2 1 - 3
Cajalco Creek 1 1 1 See Temescal
See Temescal
See Temescal 3 1 0 0
Cajon Wash - 0 0 0 0 0 0 - 0 -
Canyon Crest - 0 - - - 0 0 - 0 1
Carbon Canyon (Chino Hills Pkwy) 0 0 1 0 0 0 0 - - -
Carbon Canyon (Western Hills Golf Club) 0 0 0 0 1 0 0 - - -
Carbon Canyon Regional Park 6 5 7 5 3 8 13 12 16 16
Castleview Park 1 0 1 0 0 0 0 0 - -
Chino Hills (Bayberry Dr.) - - - 0 0 0 0 - - -
Chino Hills (end of Eucalyptus) 0 0 0 0 0 0 0 - - -
Chino Hills (Eucalyptus/Del Monte) 3 1 1 0 1 2 0 0 0 0
Chino Hills (Eucalyptus/Rancho Hills) 1 0 1 1 1 1 2 1 2 2
Chino Hills (Soquel Canyon/Pipeline) - - - - - - 2 2 3 4 Chino Hills Community Park (Eucalyptus/Peyton) - - - 5 8 10 9 3 7 4
Chino Hills State Park - Bane Canyon - - 5 5 6 7 5 5 11 -
Chino Hills State Park – Easy Street Trail - - - - - - - - 0 0 Chino Hills State Park - Lower Aliso Creek - - 10 12 13 24 16 11 11 11 Chino Hills State Park - Telegraph Canyon - - 2 6 10 10 9 9 8 4
Chino Hills State Park - Upper Aliso Creek - - 7 8 6 10 12 8 6 6
City Creek (Highland) - - - - - 2 0 0 - 4
Clearwater Pkwy @ Glen Helen - - - - - - - - 0 1

LBVI AND SWFL REPORT 2014 SANTA ANA WATERSHED ASSOCIATION TABLES
69
Table 10: Results of the Least Bell's Vireo Assessment Surveys in the Santa Ana Watershed, 2006-2014 Site # LBVI Territories
2005 2006 2007 2008 2009 2010 2011 2012 2013 2014
Conrock Basin FHQ - - - - - - 1 0 0 0
Corona St. @ Gilmore 0 0 0 0 0 0 0 - 0 3
Fontana Power Plant - - - - - - - - 1 0
Fresno Canyon 2 4 2 1 0 1 1 0 1 2
Gavilan Hills 0 0 0 0 0 0 0 - 0 0
Goldenstar - 0 0 0 1 0 0 0 0 2
Harrison Reservoir (aka Mcallister Creek) See Temescal
See Temescal
See Temescal
See Temescal
See Temescal
See Temescal
See Temescal 3 4 3
Hidden Valley Golf Club - - - - - 3 4 6 6 8
La Sierra - - 1 2 2 3 3 2 4 5
Little Sand Basin (Highland) - - - - - 2 3 3 - 0
Mead Valley (Cajalco/Aqueduct) - 2 5 6 5 8 5 4 4 5
Menifee - Haun Rd. 0 0 0 0 - 0 - - - -
Menifee - Paloma HS 0 0 0 0 - 0 - - - -
Motte-Rimrock Preserve - - 0 - - - - - - -
Norco Hills Park Mitigation 2 0 0 0 0 0 0 0 0 0
Oak Glen Preserve - 0 0 0 0 0 0 - - -
Plunge Creek (Highland) - - - - - 1 1 1 - 3
Poorman Reservoir 0 1 1 1 2 6 4 1 2 6
Prenda Arroyob See Table 1 - - - - - - - 4 4
Promenade - 0 0 0 3 2 2 2 1 2
Pyrite Channel - - - 1 1 3 3 0 0 0
Quail Run 0 0 0 0 0 0 0 0 - 0
Riverwalk Park - - - - - - - - - 0

LBVI AND SWFL REPORT 2014 SANTA ANA WATERSHED ASSOCIATION TABLES
70
Table 10: Results of the Least Bell's Vireo Assessment Surveys in the Santa Ana Watershed, 2006-2014 Site # LBVI Territories
2005 2006 2007 2008 2009 2010 2011 2012 2013 2014
Santa Rosa Mine Rd. 0 0 0 0 0 - - - - -
SAR (north side of Hidden Valley) 5 3 6 1 6 - - - - -
Steele Valley 0 0 0 0 0 0 - - - -
Sun Canyon Park 0 0 0 0 0 0 0 - 0 - Talbert Park - - - - - - - - 3 5 Tequesquite Arroyo 0 0 0 0 0 0 0 - 0 0
Van Buren Blvd. (Bountiful) 0 0 0 0 1 0 0 0 - 1
Van Buren Blvd. (Plummer Rd-south) 3 2 2 3 3 4 3 2 - -d
Van Buren Blvd. (Porter Ave) 0 0 0 0 0 0 0 - - 0
Woodcrest - 0 0 0 0 0 0 0 0 1 Wyle Labs (El Paso only) 0 1 1 0 1 1 1 1 1 1
Yorba Linda (Mud Canyon) - - - - - - - - 0 - Yorba Linda (San Antonio Rd.) - - - - - - - - 1 2 Yorba Linda (Starlight Dr) 1 0 0 0 - 2 1 2 4 4
Yorba Linda Lakebed Park - 1 1 1 1 1
San Jacinto River Sub-Watershed
Cottonwood Canyon 0 0 0 0 0 2 3 3 2 2
East of Canyon Lake 2 - - - - - - - - -
Kabian Park 2 4 4 3 4 3 3 1 3 7 Lake Perris 1 1 3 2 4 6 10 8 14 20
Menifee (Salt Creek) - - - - - - - 1a 8 10
Santiago Creek Sub-Watershed
Irvine Regional Park See Table 1
See Table 1 14 19 29 See tables
1A&1B See tables
1A&1B 29 29 See table 1A
Irvine Trust Management Area - - - - 1 1 1 1 1 1

LBVI AND SWFL REPORT 2014 SANTA ANA WATERSHED ASSOCIATION TABLES
71
Table 10: Results of the Least Bell's Vireo Assessment Surveys in the Santa Ana Watershed, 2006-2014 Site # LBVI Territories
2005 2006 2007 2008 2009 2010 2011 2012 2013 2014
Limestone Canyon See Table 1
See Table 1 2 2 2 3 3 0 3 4
Peter's Canyon 4 4 5 5 8 14 16 12 16 15
Santiago Basin (Santiago Pitts) - - - - - - 2 1 1 1
Santiago Canyon Rd - - 0 0 0 0 0 0 - -
Santiago Creek (above Irvine Lake) 0 - 0 4 4 6 5 4 10 13
Santiago Creek (Cambridge Rd) - 1 0 0 0 0 0 - 0 0
Santiago Creek (Cannon Rd, incl. Smith Basin)c 2 3 4 2 3 1 3 0 2 2
Santiago Creek (Chapman Ave) - - 0 0 0 0 0 0 0 0
Santiago Oaks Regional Park 0 0 0 0 0 1 0 0 0 0
Silverado Canyon 0 0 0 0 0 0 0 0 0 0
S. Margarita Watershed - Murrieta Creek - - 1 3 - - - - - - Total number least Bell’s vireos detected during Assessment Surveys 36 35 93 103 139 159 156 146 197 208
a) Reported by PCR consultants b) Split Alessandro Arroyo and Prenda Arroyo into two separate sites in 2013 c) Added Smith Basin to existing site d) Included in Meridian C.A. (former March SKR Preserve) as of 2014

LBVI AND SWFL REPORT 2014 SANTA ANA WATERSHED ASSOCIATION TABLES
72
Table 11: Results of the Least Bell's Vireo Assessment Surveys in the Santa Ana Watershed, 2014
SiteSurveyor Santa Ana River & Tributaries Terr Pairs Juv. Terr. Pairs Juv. Terr. Pairs Juv. Terr. Pairs Juv.
CM / AB Alessandro Arroyo 13 1 0 12 0 0 11 3 5 19 4 5 4 16.75 Y NAB Arlington Falls 0 0 0 0 0 0 0 0 0 0 0 0 3 6.5 N NMP Box Springs 3 1 0 1 0 0 1 1 1 3 2 1 3 2 N NCM Cajalco Creek 0 0 0 0 0 0 0 0 0 0 0 0 3 2.75 N YHA Canyon Crest 1 0 0 1 0 0 1 1 0 1 1 0 3 4.75 N NMP Carbon Canyon Regional Park 12 2 0 11 0 0 13 5 5 16 6 5 3 13 Y YCM Chino Hills (Eucalyptus/Del Monte) 0 0 0 0 0 0 0 0 0 0 0 0 3 0.75 N NCM Chino Hills (Eucalyptus/Rancho Hills) 2 0 0 2 0 0 1 0 0 2 0 0 3 1.25 Y NCM Chino Hills (Soquel Canyon/Pipeline) 4 0 0 4 1 2 3 1 1 4 2 3 3 1.5 N NCM Chino Hills Community Park (Eucaluptus/Peyton) 3 0 0 3 0 0 2 0 0 4 0 0 0 3.25 Y NTB Chino Hills State Park - Easy Street Trail 0 0 0 0 0 0 0 0 0 0 0 0 3 1.5 N NMA / AB Chino Hills State Park - Lower Aliso Creek 8 0 0 7 0 0 2 1 1 11 1 1 3 15 N NTB Chino Hills State Park - Telegraph Canyon 4 1 0 4 1 0 3 1 0 4 1 0 3 11.5 Y NTB Chino Hills State Park - Upper Aliso Creek 5 0 0 5 3 2 4 3 3 6 4 3 3 9.75 Y YNH City Creek (Highland) 0 0 0 4 0 0 0 0 0 4 0 0 3 10 Y NJC Clearwater Pkwy @ Glen Helen 1 0 0 * * * * * * 1 0 0 1 1 Y NDM Conrock Basin FHQ 0 0 0 0 0 0 0 0 0 0 0 0 3 0.75 Y NHA Corona Ave @ Gilmore 1 0 0 3 0 0 1 1 2 3 1 2 3 2.5 N NJC Fontana Power Plant 0 0 0 * * * * * * 0 0 0 1 1 Y NMP Fresno Canyon 1 0 0 1 0 0 2 0 0 2 0 0 3 4.75 Y NNH Gavilan Hills 0 0 0 0 0 0 0 0 0 0 0 0 3 6.75 N NNH Goldenstar 2 1 0 1 0 0 0 0 0 2 1 0 3 8 N NMP Harrison Reservoir (aka Mcallister Creek) 2 0 0 3 0 0 3 0 0 3 0 0 3 6.25 Y YJC Hidden Valley Golf Club 8 1 0 * * * * * * 8 1 0 1 3.5 N NHA La Sierra 4 0 0 2 1 1 2 0 0 5 1 1 3 9 N NNH Little Sand Basin (Highland) 0 0 0 0 0 0 0 0 0 0 0 0 3 6.5 N NJL Mead Valley (Cajalco/Aqueduct) 3 1 0 5 2 0 2 1 0 5 2 0 3 10.25 N NHA Norco Hills Park Mitigation 0 0 0 0 0 0 0 0 0 0 0 0 3 1 N NNH Plunge Creek (Highland) 1 1 0 3 0 0 1 0 0 3 1 0 3 6.5 Y NNH Poorman Reservoir 6 0 0 6 2 2 5 1 0 6 3 2 3 7 Y N
Traps on site?
Cow-birds Detected
TOTAL # VIREOS# Visits # Hours
SURVEY 3 6/30/14-7/11/14
SURVEY 1 4/28/14-5/9/14
SURVEY 2 6/9/14-6/20/14

LBVI AND SWFL REPORT 2014 SANTA ANA WATERSHED ASSOCIATION TABLES
73
Table 11: Results of the Least Bell’s Vireo Assessment Surveys in the Santa Ana Watershed, 2013 Site
Surveyor Santa Ana River & Tributaries Terr Pairs Juv. Terr. Pairs Juv. Terr. Pairs Juv. Terr. Pairs Juv.
DZ Prenda Arroyo 3 0 0 4 0 0 0 0 0 4 0 0 3 12 N N
HA Promenade 2 1 0 1 1 1 0 0 0 2 1 1 3 3.75 N N
JL Pyrite Channel 0 0 0 0 0 0 0 0 0 0 0 0 3 7 Y N
MP Quail Run 0 0 0 0 0 0 0 0 0 0 0 0 3 3 N N
JC Riverwalk Park 0 0 0 * * * * * * 0 0 0 1 1 N N
SH Talbert Park 3 1 0 5 0 0 3 0 0 5 1 0 3 10 N N
HA Tequesquite Arroyo 0 0 0 0 0 0 0 0 0 0 0 0 3 2.5 N N
JC Van Buren Blvd. (Bountiful) 1 0 0 * * * * * * 1 0 0 1 1.25 N N
AB Van Buren Blvd. (Porter Ave) 0 0 0 0 0 0 0 0 0 0 0 0 3 3.5 N N
NH Woodcrest 0 0 0 1 0 0 1 0 0 1 0 0 3 2.5 Y N
HA Wyle Labs (at El Paso only) 0 0 0 1 0 0 0 0 0 1 0 0 3 1.75 N N
MA Yorba Linda (San Antonio Rd) 0 0 0 2 1 1 0 0 0 2 1 1 3 3.5 N N
SH Yorba Linda (Starlight Dr.) 4 0 0 2 0 0 2 1 1 4 1 1 3 6.25 N N
SH Yorba Linda Lakebed Park 0 0 0 0 0 0 1 0 0 1 0 0 3 5.75 N N
CM Cottonwood Canyon 1 0 0 0 0 0 1 1 1 2 1 1 3 4.25 N N
MA / BJ Kabian Park 4 1 0 5 1 1 5 2 2 7 4 3 3 32 N N
AB / MP Lake Perris 9 1 0 20 5 6 16 3 2 20 7 8 3 26.5 Y Y
CM Menifee (Salt Creek) 8 3 0 7 2 3 8 3 3 10 4 4 3 5.75 Y Y
MA Irvine Trust Management Area 0 0 0 1 0 0 1 0 0 1 0 0 3 0.75 N Y
TB Limestone Canyon 3 2 0 4 2 0 3 3 4 4 4 4 3 10.5 Y Y
MA Peter's Canyon 11 5 0 10 3 1 7 4 6 15 11 7 3 12 N Y
DM Santiago Basin (Santiago Pitts) 1 0 0 1 0 0 0 0 0 1 0 0 3 2.25 N N
TB Santiago Creek (above Irvine Lake) 7 1 0 12 4 0 12 6 7 13 6 7 3 18.5 Y N
DM Santiago Creek (Cambridge Rd) 0 0 0 0 0 0 0 0 0 0 0 0 3 0.75 N N
SH / DM Santiago Creek (Cannon, incl. Smith Basin) 0 0 0 2 0 0 0 0 0 2 0 0 3 15.25 Y N
DM Santiago Creek (Chapman Ave) 0 0 0 0 0 0 0 0 0 0 0 0 3 2.5 N N
MA Santiago Oaks Regional Park 0 0 0 0 0 0 * * * 0 0 0 2 6 N NTB Silverado Canyon 0 0 0 0 0 0 0 0 0 0 0 0 3 6 Y Y
141 24 0 156 29 20 117 42 44 208 72 60 161 381.75 0 0
# Visits # HoursCow-birds Detected
Traps on site?
San Jacinto River Sub-Watershed
SURVEY 1 4/28/14-5/9/14
SURVEY 2 6/9/14-6/20/14
SURVEY 3 6/30/14-7/11/14 TOTAL # VIREOS
# Vireos Detected in Santa Ana Watershed during Assessment Surveys
Santiago Creek Sub-Watershed

LBVI AND SWFL REPORT 2014 SANTA ANA WATERSHED ASSOCIATION TABLES
Common Name Scientific Name
San Timoteo Canyon
San Jacinto River
Mockingbird Canyon
March SKR
PreserveSycamore
Canyon
SAR (Riverside Rd-HV)
SAR (HV)
SAR (HV-
north)
SAR (HV -
River Rd) TemescalChino Hills
SAC (Upper
Cyn)
SAC (Green River)
SAC (Featherly
Pk)
Santiago Cyn
Irvine Park Other* Total
Kangaroo Rat Dipodomys sp. Several n/aSan Diego Black-tailed JackrabbitLepus californicus bennettii Several 4 10 1 1 16Long-tailed Weasel Mustela frenata 2 1 1 1 5Bobcat Lynx rufus 1 1
Redhead Aythya americana 1 family 0American Bittern Botaurus lengtiginosus 2 2Least Bittern Ixobrychus exilis 1 1Osprey Pandion haliaetus 1 1White-tailed Kite Elanus leucurus 1 1 2Bald Eagle Haliaeetus leucocephalus 1 1Northern Harrier Circus cyaneus 2 1 3Cooper's Hawk Accipiter cooperii 2 1 1 family 1 1 family 2 pair 4Red-shouldered Hawk Buteo lineatus 2 families 0Ferruginous Hawk Buteo regalis 1 2 3Golden Eagle Aquila chrysaetos 2 2 4Burrowing Owl Athene cunicularia 1 1Downy Woodpecker Picoides pubescens 2 2 2 1 7Peregrine Falcon Falco peregrinus anatum 1 1 2Prarie Falcon Falco mexicanus 1 1Olive-sided Flycatcher Contopus cooperi 1 pair 1Willow Flycatcher Empidonax traillii 2 4 2 8Loggerhead Shrike Lanius ludovicianus 9 1 10Horned Lark Eremophila alpestris 4 4Tree Swallow Tachycineta bicolor 16 16Clark's Marsh Wrenⁱ Cistothorus palustris clarkae 239 239California Gnatcatcher Polioptila californica 1 pr 1 3 3 1 family+1 10Yellow Warbler Setophaga petechia 162 52 8 10 17 155 116 81 19 11 42 15 135 823Yellow-breasted Chat Icteria virens 13 1 1 12 50 15 1 7 6 11 3 43 163Rufous-crowned Sparrow Aimophila ruficeps canescens 1 1Bell's Sparrow Artemisiospiza belli 3 3Tri-colored Blackbird Agelaius tricolor 3 13 16Lawrence's Goldfinch Spinus lawrencei 2 1 3
Western Spadefoot Toad Spea hammondii 1 1
Blainvilles Horned Lizard Phrynosoma blainvillii 1 1 2Granite Spiny Lizard Sceloporus orcutti 3 1 10 14Orange-throated Whiptail Aspidoscelis hyperythra 8 4 4 3 19Western Whiptail Aspidoscelis tigris several several 1 3 4+Red Diamond Rattlesnake Crotalus ruber 1 1 2Western Pond Turtle Actinemys marmorata 1 1
Santa Ana Speckled Dace Rhinichthys osculus ssp. 3 20-30 20-30
Mammal
Avian
ⁱ Marsh Wren counts from Prado Basin, where subspecific identity needs confirmation.
Other* - Includes all assessment areas and incidental sightings other than those within managed areas
Sensitive species are those that are listed as endangered, threatened, or species of concern by the resource agencies and those that are covered by the Western Riverside County Multiple Species Habitat Conservation Plan (MSHCP).
Observations are minimum numbers of territories and/or individuals observed. Detailed information is reported to the California Natural Diversity Database (CNDDB)
Amphibian
Reptiles
Fish
Table 12: Observations of Sensitive Species by Location, 2014
LBVI AND SWFL REPORT 2014 SANTA ANA WATERSHED ASSOCIATION APPENDIX A
APPENDIX A: GPS POINTS ALL SURVEYED SITES

LBVI AND SWFL REPORT 2014 SANTA ANA WATERSHED ASSOCIATION APPENDIX A
A-1
APPENDIX A – SURVEY SITES, STARTING AND ENDING COORDINATES
(All coordinates – NAD83 (Zone 11S) except where noted otherwise)
Monitored Locations
Survey Site Starting Coordinates Ending Coordinates Chino Hills (Butterfield Ranch) 438975, 3754612 435680, 3757858 Meridian CA (former March SKR Preserve) 473397, 3749383 470485, 3752133 Mockingbird Canyon 461212, 3750319 469427, 3746409 San Jacinto 506079, 3738423 488063, 3745450 Santa Ana Canyon (SAC): -Upper Canyon 440677, 3749724 438736, 3749743 -Green River Golf Club 438736, 3749743 436675, 3748403 -Featherly Park 436613, 3748409 430885, 3748343 Santa Ana River (SAR): -Riverside Ave. to Hidden Valley 466416, 3765008 455523, 3757886 -Hidden Valley, north side of river 456941, 3758360 451564, 3758587 -Hidden Valley, south side of river 455523, 3757886 451482, 3757751 -Hidden Valley to River Rd. 448474, 3756090 444626, 3754049 San Timoteo: -Riverside County 484684, 3762635 500355, 3753595 -San Bernardino County 481616, 3764980 484684, 3762635 Sycamore Canyon 470287, 3756422 473519, 3753591 Temescal Canyon 471486, 3720612 450724, 3746925 Santiago Canyon (Irvine Park) 440662, 3755052 429119, 3741253
Assessment Locations
Survey Site Starting Coordinates Ending Coordinates Santa Ana River & Tributaries: Alessandro Arroyo 465424, 3754439 470391, 3751168 Arlington Falls 453856, 3748925 454753, 3748301 Box Springs 472592, 3756430 471538, 3757620 Cajalco Creek 453805, 3742988 453767, 3743230 Cajon Wash* 457350, 3795730 457285, 3791752 Canyon Crest 468569, 3757034 468569, 3757034 Carbon Canyon (Chino Hills Pkwy)* 431484, 3760317 430579, 3758914 Carbon Canyon (Western Hills Golf Club)* 429466, 3758320 429755, 3758496 Carbon Canyon Regional Park 425027, 3753806 425041, 3753777 Castleview Park* 468185, 3754936 468206, 3754970 Chino Hills (Bayberry Dr.)* 432335, 3758297 431780, 3758507
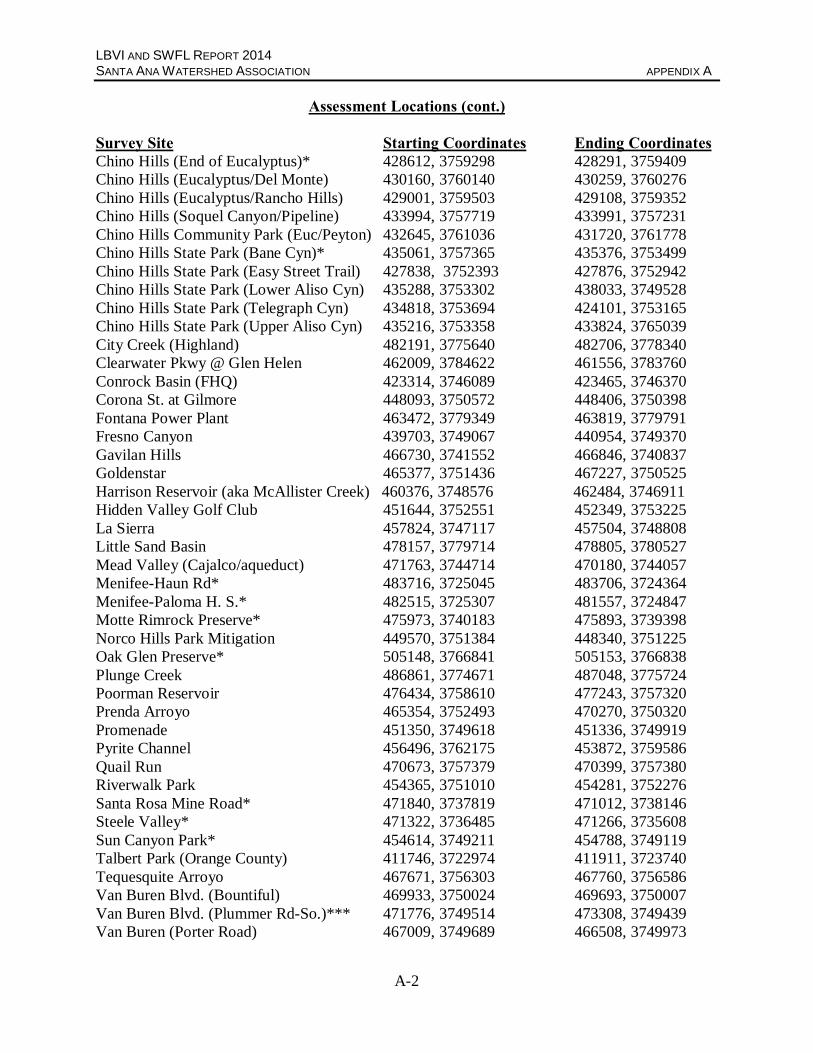
LBVI AND SWFL REPORT 2014 SANTA ANA WATERSHED ASSOCIATION APPENDIX A
A-2
Assessment Locations (cont.)
Survey Site Starting Coordinates Ending Coordinates Chino Hills (End of Eucalyptus)* 428612, 3759298 428291, 3759409 Chino Hills (Eucalyptus/Del Monte) 430160, 3760140 430259, 3760276 Chino Hills (Eucalyptus/Rancho Hills) 429001, 3759503 429108, 3759352 Chino Hills (Soquel Canyon/Pipeline) 433994, 3757719 433991, 3757231 Chino Hills Community Park (Euc/Peyton) 432645, 3761036 431720, 3761778 Chino Hills State Park (Bane Cyn)* 435061, 3757365 435376, 3753499 Chino Hills State Park (Easy Street Trail) 427838, 3752393 427876, 3752942 Chino Hills State Park (Lower Aliso Cyn) 435288, 3753302 438033, 3749528 Chino Hills State Park (Telegraph Cyn) 434818, 3753694 424101, 3753165 Chino Hills State Park (Upper Aliso Cyn) 435216, 3753358 433824, 3765039 City Creek (Highland) 482191, 3775640 482706, 3778340 Clearwater Pkwy @ Glen Helen 462009, 3784622 461556, 3783760 Conrock Basin (FHQ) 423314, 3746089 423465, 3746370 Corona St. at Gilmore 448093, 3750572 448406, 3750398 Fontana Power Plant 463472, 3779349 463819, 3779791 Fresno Canyon 439703, 3749067 440954, 3749370 Gavilan Hills 466730, 3741552 466846, 3740837 Goldenstar 465377, 3751436 467227, 3750525 Harrison Reservoir (aka McAllister Creek) 460376, 3748576 462484, 3746911 Hidden Valley Golf Club 451644, 3752551 452349, 3753225 La Sierra 457824, 3747117 457504, 3748808 Little Sand Basin 478157, 3779714 478805, 3780527 Mead Valley (Cajalco/aqueduct) 471763, 3744714 470180, 3744057 Menifee-Haun Rd* 483716, 3725045 483706, 3724364 Menifee-Paloma H. S.* 482515, 3725307 481557, 3724847 Motte Rimrock Preserve* 475973, 3740183 475893, 3739398 Norco Hills Park Mitigation 449570, 3751384 448340, 3751225 Oak Glen Preserve* 505148, 3766841 505153, 3766838 Plunge Creek 486861, 3774671 487048, 3775724 Poorman Reservoir 476434, 3758610 477243, 3757320 Prenda Arroyo 465354, 3752493 470270, 3750320 Promenade 451350, 3749618 451336, 3749919 Pyrite Channel 456496, 3762175 453872, 3759586 Quail Run 470673, 3757379 470399, 3757380 Riverwalk Park 454365, 3751010 454281, 3752276 Santa Rosa Mine Road* 471840, 3737819 471012, 3738146 Steele Valley* 471322, 3736485 471266, 3735608 Sun Canyon Park* 454614, 3749211 454788, 3749119 Talbert Park (Orange County) 411746, 3722974 411911, 3723740 Tequesquite Arroyo 467671, 3756303 467760, 3756586 Van Buren Blvd. (Bountiful) 469933, 3750024 469693, 3750007 Van Buren Blvd. (Plummer Rd-So.)*** 471776, 3749514 473308, 3749439 Van Buren (Porter Road) 467009, 3749689 466508, 3749973

LBVI AND SWFL REPORT 2014 SANTA ANA WATERSHED ASSOCIATION APPENDIX A
A-3
Wardlow Wash* 443306, 3747252 441873, 3749262 Woodcrest 465362, 3751501 465419, 3751271 Wyle Labs (at El Paso only) 450068, 3751818 450068, 3751818 Yorba Linda (Mud Canyon)* 431693, 3750752 431200, 3750802 Yorba Linda (San Antonio Rd) 429199, 3750653 429322, 3750942 Yorba Linda (Starlight Dr.) 431134, 3749819 430989, 3750218 Yorba Linda Lakebed Park 424530, 3748301 424909, 3749091 San Jacinto River Sub-watershed: Cottonwood Canyon 475633, 3725415 477503, 3724023 Kabian Park 475841, 3730880 476184, 3783238 Lake Perris 483092, 3744484 485461, 3748329 Menifee (Salt Creek) 478164, 3726524 479548, 3727246 Santiago Creek Sub-watershed: Irvine Trust Management Area 429845, 3738585 429845, 3738585 Limestone Canyon 434012, 3736548 434913, 3735769 Peter’s Canyon 429752, 3738563 428604, 3735584 Santiago Basin 425344, 3740796 424678, 3740612 Santiago Creek (above Irvine Lake) 437201, 3736263 435405, 3737556 Santiago Canyon Rd* 434949, 3735740 431995, 3736775 Santiago Creek (Cambridge Road) 421793, 3737067 421619, 3737952 Santiago Creek (Cannon Road, incl. Smith Basin) 425540, 3741436 428079, 3742770 Santiago Creek (Chapman Ave.) 423116, 3738554 423740, 3739316 Santiago Oaks Regional Park 428069, 3742690 429133, 3742111 Silverado Canyon 437692, 3734768 438878, 3734047
Miscellaneous Locations Survey Site Starting Coordinates Ending Coordinates Chino Creek Wetlands Park 437620, 3758246 437395, 3758840 East Coyote Hills Preserve* 415417, 3750601 417337, 3751214 Etiwanda Preserve* 451769, 3780654 451186, 3787544 Mount Baldy (Shinn Rd)* 437794, 3781816 437765, 3782398 Murrieta Creek* 476609, 3716171 476299, 3715809 Rancho La Sierra West* 453521, 3757910 453547, 3757077 Santa Ana River (Market St to 464716, 3762626 463659, 3761240 Mission St)** University of California, Riverside 470131, 3759262 470131, 3759262 *Denotes sites that were not surveyed this year. **Site now falls within the 2014 monitored site “SAR - Riverside Dr. to Hidden Valley” ***Site now falls within the 2014 monitored site Meridian CA “(former March SKR Preserve)”

LBVI AND SWFL REPORT 2014 SANTA ANA WATERSHED ASSOCIATION APPENDIX B
B-1
APPENDIX B: WATERSHED ANNUAL RESULTS 2010-2014

LBVI AND SWFL REPORT 2014 SANTA ANA WATERSHED ASSOCIATION APPENDIX B
B-2
Table B-1: Least Bell’s Vireo status and management and Brown-headed Cowbird management data, at closely monitored sites in the Santa Ana River Watershed, California, 2000-2014. (See Tables 1A and 1B for total abundance.)
Parameter 2000- 2009 2010 2011 2012 2013 2014 Total
A. Number of territorial males n/a 654 641 599 769 814 n/a
B. Number of pairs (breeding and non-breeding) 1,737 450 407 380 374 390 3,738
C. Number of fledged young observed 3,203 613 626 494 611 472 6,019
D.
Projected total recruitment of vireo young (a) 4,584 1,065 1,080 982 830 597 9,138
E. Average number of fledglings per pair (C/B) 1.8 1.4 1.5 1.3 1.6 1.2 1.6
F. Projected number of fledglings per pair (D/B) 2.6 2.4 2.7 2.6 2.2 1.5 2.4
G.
Rate of missing eggs/chicks from nests (successful and unsuccessful nests)
39% (467/1185)
43% (60/138)
40% (82/204)
39% (48/123)
39% (65/167)
54% (80/149)
41% (800/1966)
H. Rate of cowbird nest parasitism
17% (204/1185)
5% (7/138)
2% (5/204)
5% (6/123)
4% (7/167)
5% (8/149)
12% (237/1966)
I. Numbers of cowbirds removed from study area 18,590 3,093 2,444 2,823 1,945 1,271 30,166
K.
Number of trap days (1 operative trap in the field for one day = 1 trap day) 41,691 6,992 6,333 5,190 6,355 5,290 71,851
L.
Average number of cowbirds trapped per trap day (I/K) 0.5 0.4 0.4 0.5 0.3 0.2 0.4
M. Number of field hours –LBV (+)
39,014
2,589 2,738 2,364 2,942 1,952
66,560 N. Number of field hours – BHCO (+) 3,239 3,281 2,838 2,879 2,724
(a) Survival rate of fledglings in well-tracked nests was applied to nests not visited as frequently by the
function (average # fledglings produced by well-tracked pair x total number of pairs. Projected fledglings statistics in bold were calculated using observed fledglings/pr due to low number of well-tracked pairs.

LBVI AND SWFL REPORT 2014 SANTA ANA WATERSHED ASSOCIATION APPENDIX B
B-3
Table B-2. Least Bell’s Vireo nest placement preferences, monitored sites in the Santa Ana River watershed, 2000-2014.
Host Plant Species 2000-2009 2010 2011 2012 2013 2014 Total
Giant Reed (Arundo donax) 1 1 Western Sycamore (Plantanus racemosa) 2 1 3 6 Golden Current (Ribes aureum) 1 2 1 4 Wild Grape (Vitis girdana) 38 8 17 4 7 21 95 Fremont Cottonwood (Populus fremontii) 49 6 12 6 7 9 89 Dead Fremont Cotton Wood (P. fremontii) 1 1 2 Black Cottonwood (Populus trichocarpa) 1 1 Narrow-leafed Willow (Salix exigua) 56 3 12 11 13 8 103 Dead Narrow-leafed Willow (S. exigua) 1 1 Black Willow (Salix gooddingii) 224 12 20 10 11 3 280 Black Willow (dead) (Salix goodingii) 1 1 Dead Black Willow (S. goodingii) covered with living Black Willow 1 1 Red Willow (Salix laevigata) 118 22 39 19 23 8 229 Arroyo Willow (Salix lasiolepis) 291 27 39 31 35 28 451 Dead Arroyo Willow (S. lasiolepsis) 0 1 1 Yellow Willow (Salix lucida spp. lasiandra) 8 1 2 2 1 14 Willow species (Salix spp.) 6 6 Dead Willow species (Salix spp.) 2 1 1 4 Castor bean (Rincus communis) 1 1 False Indigo (Amorpha futicosa) 0 1 1 Toyon (Heteromeles arbutifolia) 17 1 1 1 4 24 Holly-leafed Cherry (Prunus ilicifolia) 0 1 1
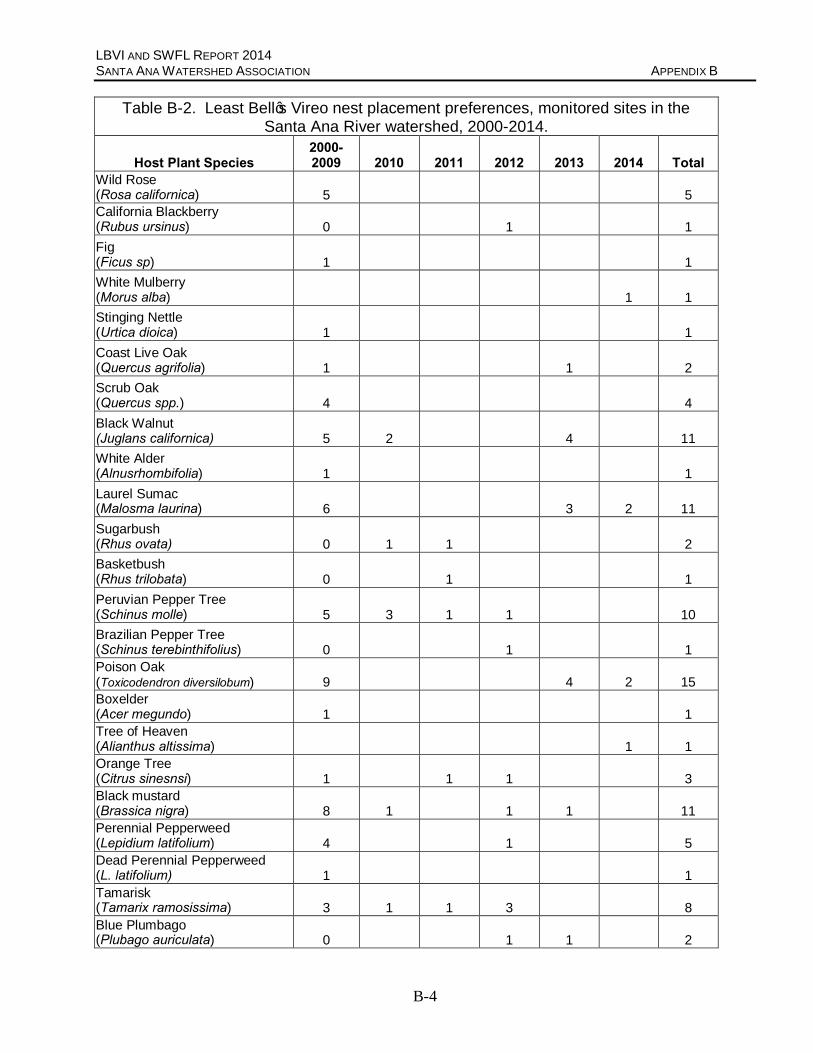
LBVI AND SWFL REPORT 2014 SANTA ANA WATERSHED ASSOCIATION APPENDIX B
B-4
Table B-2. Least Bell’s Vireo nest placement preferences, monitored sites in the Santa Ana River watershed, 2000-2014.
Host Plant Species 2000-2009 2010 2011 2012 2013 2014 Total
Wild Rose (Rosa californica) 5 5 California Blackberry (Rubus ursinus) 0 1 1 Fig (Ficus sp) 1 1 White Mulberry (Morus alba) 1 1 Stinging Nettle (Urtica dioica) 1 1 Coast Live Oak (Quercus agrifolia) 1 1 2 Scrub Oak (Quercus spp.) 4 4 Black Walnut (Juglans californica) 5 2 4 11 White Alder (Alnusrhombifolia) 1 1 Laurel Sumac (Malosma laurina) 6 3 2 11 Sugarbush (Rhus ovata) 0 1 1 2 Basketbush (Rhus trilobata) 0 1 1 Peruvian Pepper Tree (Schinus molle) 5 3 1 1 10 Brazilian Pepper Tree (Schinus terebinthifolius) 0 1 1 Poison Oak (Toxicodendron diversilobum) 9 4 2 15 Boxelder (Acer megundo) 1 1 Tree of Heaven (Alianthus altissima) 1 1 Orange Tree (Citrus sinesnsi) 1 1 1 3 Black mustard (Brassica nigra) 8 1 1 1 11 Perennial Pepperweed (Lepidium latifolium) 4 1 5 Dead Perennial Pepperweed (L. latifolium) 1 1 Tamarisk (Tamarix ramosissima) 3 1 1 3 8 Blue Plumbago (Plubago auriculata) 0 1 1 2

LBVI AND SWFL REPORT 2014 SANTA ANA WATERSHED ASSOCIATION APPENDIX B
B-5
Table B-2. Least Bell’s Vireo nest placement preferences, monitored sites in the Santa Ana River watershed, 2000-2014.
Host Plant Species 2000-2009 2010 2011 2012 2013 2014 Total
Four-winged Saltbush (Atriplex candescens) 1 1 2 Ash (Fraxinus sp.) 1 1 Wax Leaf Privet (Ligustrum sp.) 1 1 Myoporum (Myoporum luteum) 1 1 Black Sage (Salvia mellifera) 1 1 Tree Tobacco (Nicotiana glauca) 0 1 1 California Sagebrush (Artemisia californica) 1 1 Mugwort (Artemisia douglasiana) 18 1 1 1 2 23 Emory Baccharis (Baccharis emoryii) 3 3 Coyote Bush (Baccharis pilularis) 5 2 1 8 Mulefat (Baccharis salicifolia) 418 66 56 29 51 57 677 Dead Mulefat (B. salicifolia) 5 5 Broom Baccharis (Baccharis sarothroides) 1 1 Yellowspine Thistle (Cirsium ochrocentrum) 2 2 Brittlebush (Encelia farinosa) 0 1 1 Common Sunflower (Helianthus annus) 1 1 Arroweed (Pluchea sp.) 1 1 1 3 Milk Thistle (Silybum marianum) 1 1 Cocklebur (Xanthium strumarium) 2 2 Wild Celery (Apium graveolens) 1 1 Poison Hemlock (Conium maculatum) 10 10 Black Elderberry (Sambucus nigra) 67 12 17 11 14 15 136 Fiddleneck (Amsinckia sp.) 1 1

LBVI AND SWFL REPORT 2014 SANTA ANA WATERSHED ASSOCIATION APPENDIX B
B-6
Table B-2. Least Bell’s Vireo nest placement preferences, monitored sites in the Santa Ana River watershed, 2000-2014.
Host Plant Species 2000-2009 2010 2011 2012 2013 2014 Total
Thick-leaved Yerba Santa (Eriodictyon crassifolium) 1 1 Yerba Santa species (Eriodictyon sp) 1 1 Wild Grape (V. girdiana) and Black Willow (S. goodingii) 1 1 Wild Grape (V. girdiana) and Red Willow (S. lasiolepsis ) 1 1 Wild Grape (V. girdiana) and Rose (R. californicus) 1 1 Wild Grape (V. girdiana) and Pepper Tree (S. molle) 0 1 1 Wild Grape (V. girdiana) and Mulefat (B. salicifolia) 2 1 3 Wild Grape (V. girdiana) and Elderbery (S. mexicanus) 1 1 Black Willow (S. goodingii) and Pepperweed (L.latifolium) 1 1 Black Willow (S. goodingii) and Poison Hemlock (C. maculatum) 1 1 Black Willow (S. goodingii) and Black Elderberry (S. nigra) 0 1 1 Dead Black Willow (S. goodingii) and Nettle (U. dioica) 1 1 Red Willow (S. lasiolepsis) and dead Stinging Nettle (U. dioica) 1 1 Red Willow (S. lasiolepsis) and Fennel (F. vulgare) 1 1 Red Willow (S. lasiolepsis) and Fresh Water Reed (species) 1 1 Arroyo Willow (S. lasiolepsis) and Black Mustard (B. nigra) 1 1 Willow sp. (Salix sp.) and Blackberry (Rubus ursinus) 1 1 Willow species/Pepperweed (Salix sp./Lepidium latifolium) 1 1 Castorbean (R. communis) and Mulefat (B. salicifolia) 0 1 1 Black Mustard (B. nigra) and Mulefat (B. salicifolia) 1 1 Coyote Bush (B. pilularis) and Mulefat (B. salicifolia) 1 1

LBVI AND SWFL REPORT 2014 SANTA ANA WATERSHED ASSOCIATION APPENDIX B
B-7
Table B-2. Least Bell’s Vireo nest placement preferences, monitored sites in the Santa Ana River watershed, 2000-2014.
Host Plant Species 2000-2009 2010 2011 2012 2013 2014 Total
Mulefat (B. salicifolia) and Poison Hemlock (C. maculatum) 0 1 1
Deadfall 2 1 1 4
Unknown 0 5 3 4 12
Total 1,430* 168 234 140 192 174 2,338* *Includes corrected 2007 total value
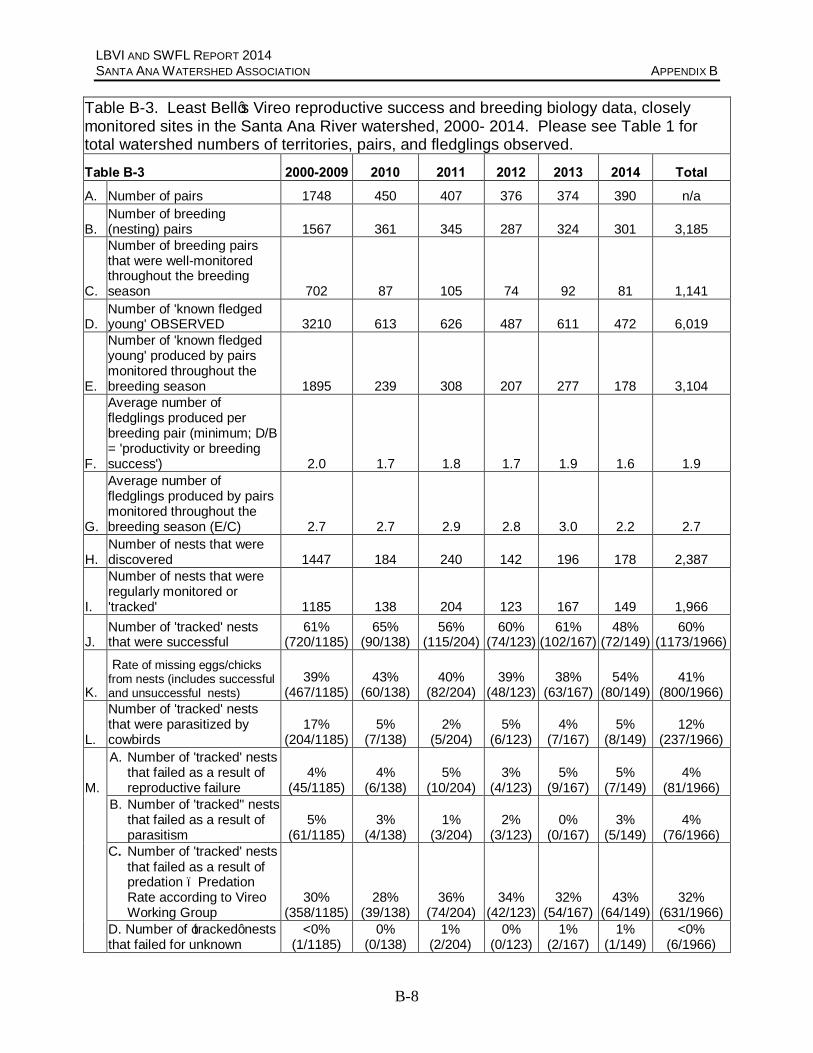
LBVI AND SWFL REPORT 2014 SANTA ANA WATERSHED ASSOCIATION APPENDIX B
B-8
Table B-3. Least Bell’s Vireo reproductive success and breeding biology data, closely monitored sites in the Santa Ana River watershed, 2000- 2014. Please see Table 1 for total watershed numbers of territories, pairs, and fledglings observed. Table B-3 2000-2009 2010 2011 2012 2013 2014 Total A. Number of pairs 1748 450 407 376 374 390 n/a
B. Number of breeding (nesting) pairs 1567 361 345 287 324 301 3,185
C.
Number of breeding pairs that were well-monitored throughout the breeding season 702 87 105 74 92 81 1,141
D. Number of 'known fledged young' OBSERVED 3210 613 626 487 611 472 6,019
E.
Number of 'known fledged young' produced by pairs monitored throughout the breeding season 1895 239 308 207 277 178 3,104
F.
Average number of fledglings produced per breeding pair (minimum; D/B = 'productivity or breeding success') 2.0 1.7 1.8 1.7 1.9 1.6 1.9
G.
Average number of fledglings produced by pairs monitored throughout the breeding season (E/C) 2.7 2.7 2.9 2.8 3.0 2.2 2.7
H. Number of nests that were discovered 1447 184 240 142 196 178 2,387
I.
Number of nests that were regularly monitored or 'tracked' 1185 138 204 123 167 149 1,966
J. Number of 'tracked' nests that were successful
61% (720/1185)
65% (90/138)
56% (115/204)
60% (74/123)
61% (102/167)
48% (72/149)
60% (1173/1966)
K.
Rate of missing eggs/chicks from nests (includes successful and unsuccessful nests)
39% (467/1185)
43% (60/138)
40% (82/204)
39% (48/123)
38% (63/167)
54% (80/149)
41% (800/1966)
L.
Number of 'tracked' nests that were parasitized by cowbirds
17% (204/1185)
5% (7/138)
2% (5/204)
5% (6/123)
4% (7/167)
5% (8/149)
12% (237/1966)
M.
A. Number of 'tracked' nests that failed as a result of reproductive failure
4% (45/1185)
4% (6/138)
5% (10/204)
3% (4/123)
5% (9/167)
5% (7/149)
4% (81/1966)
B. Number of 'tracked" nests that failed as a result of parasitism
5% (61/1185)
3% (4/138)
1% (3/204)
2% (3/123)
0% (0/167)
3% (5/149)
4% (76/1966)
C. Number of 'tracked' nests that failed as a result of predation – Predation Rate according to Vireo Working Group
30% (358/1185)
28% (39/138)
36% (74/204)
34% (42/123)
32% (54/167)
43% (64/149)
32% (631/1966)
D. Number of ‘tracked’ nests that failed for unknown
<0% (1/1185)
0% (0/138)
1% (2/204)
0% (0/123)
1% (2/167)
1% (1/149)
<0% (6/1966)

LBVI AND SWFL REPORT 2014 SANTA ANA WATERSHED ASSOCIATION APPENDIX B
B-9
Table B-3. Least Bell’s Vireo reproductive success and breeding biology data, closely monitored sites in the Santa Ana River watershed, 2000- 2014. Please see Table 1 for total watershed numbers of territories, pairs, and fledglings observed. Table B-3 2000-2009 2010 2011 2012 2013 2014 Total
reasons
N. Average clutch size n/a n/a 3.6 3.4 3.4 1.5 n/a
O. Number of cowbird eggs found in or near vireo nests 248 11 6 9 7 8 289
P. Number of cowbird nestlings removed from 'tracked' nests 15 0 0 0 0 1 16
Q. Number of cowbird young fledged by vireos 8 1 1 0 2 2 14
R. Number of 'manipulated' parasitized nests 169 5 3 4 6 5 192
S. % 'successful, manipulated' nests
45% (76/169)
60% (3/5)
100% (2/2)*
100% (4/4)
83% (5/6)
40% (2/5)
48% (92/191)
T.
Number of vireos fledged from "manipulated' parasitized nests 158 8 4 10 11 5 196
U. Number of repaired nests 19 2 7 2 1 3 34
V. % successful repaired nests 72%
(13/18)* 50% (1/2)
86% (6/7)
100% (2/2)
100% (1/1)
67% (2/3)
76% (25/33)
W. Number of vireos fledged from repaired nests 37 2 16 6 4 5 70
*one outcome unknown

LBVI AND SWFL REPORT 2014 SANTA ANA WATERSHED ASSOCIATION APPENDIX C
C-1
APPENDIX C: SUMMARY TABLES BY MANAGED SITE, FROM 2000-2014

LBVI AND SWFL REPORT 2014 SANTA ANA WATERSHED ASSOCIATION APPENDIX C
C-2
Table C-1. Least Bell’s Vireo status and management and Brown-headed Cowbird management data, at closely monitored sites in the Santa Ana River Watershed, California, BY MANAGED SITE
SAN JACINTO
Parameter 2000
-20
09
2010
2011
2012
2013
2014
Tota
ls
A. Number of territorial males n/a 22 41 42 53 45 n/a
B. Number of pairs (breeding and non-breeding) 43 18 25 36 29 19 170
C. Number of fledged young observed 104 28 18 49 39 12 250
D. Projected total of recruitment of vireo young (a) 122.1 n/a n/a 104 3707 n/a 264*
E. Average number of fledglings per pair (C/B) 2.4 1.6 0.72 1.4 1.3 0.6 1.5
F. Projected number of fledglings per pair (D/B) 2.8 n/a n/a 2.9 1.3 n/a 1.7*
G.
Rate of missing eggs/chicks from nests (successful and unsuccessful nests) %=K/I x100) (b)
33.3% (18/54)
0% (0/3)
80% (8/10)
31% (4/13)
69% (9/13)
0% (0/1)
41% (39/94)
H. Rate of cowbird nest parasitism 11.1% (6/54) 0
10% (1/10)
8% (1/13)
0% (0/13)
100% (1/1)
10% (9/94)
I. Numbers of cowbirds removed from study area 11,622 2136 1797 1728 1085 713 19,081
K.
Number of trap days (1 operative trap in the field for one day = 1 trap day) 6,405 993 982 984 1058 945 11,367
L. Average number of cowbirds trapped per trap day (I/K) 1.81 2.15 1.8 1.8 1.0 0.8 1.7
M. Number of field hours -LBVI 4,425.2 79 129 161 154.5 72 7,759 N. Number of field hours - BHCO 525 544 711 496.25 462 *Excludes 2010 and 2011 data
SAN TIMOTEO
Parameter 2000
-20
09
2010
2011
2012
2013
2014
Tota
ls
A. Number of territorial males n/a 126 116 118 131 151 n/a
B. Number of pairs (breeding and non-breeding) 323 95 101 102 80 135 836
C. Number of fledged young observed 635 137 196 153 179 206 1,506
D. Projected total of recruitment of vireo young (a) 918* 266 343 286 288 338 2,439
E. Average number of fledglings per pair (C/B) 2.0 1.4 1.9 1.5 2.2 1.5 1.8
F. Projected number of fledglings per pair (D/B) 2.8* 2.8 3.4 2.8 3.6 2.5 2.9
G.
Rate of missing eggs/chicks from nests (successful and unsuccessful nests) %=K/I x100) (b)
44.4% (150/338)
65% (24/37)
30% (22/73)
42% (19/45)
41% (31/76)
52% (46/88)
44% (292/657)
H. Rate of cowbird nest parasitism 30.5%
(103/338) 8%
(3/37) 0%
(0/73) 2%
(1/45) 3%
(2/76) 6%
(5/88) 17%
(114/657)
I. Numbers of cowbirds removed from study area 1,487 173 109 143 164 143 2,219
K.
Number of trap days (1 operative trap in the field for one day = 1 trap day) 6,463 1113 1191 982 1198 1058 12,005
L. Average number of cowbirds trapped per trap day (I/K) 0.23 0.16 0.09 0.15 0.1 0.1 0.18
M. Number of field hours -LBVI 6,524.6 505 587 407 481 442 11,369
N. Number of field hours - BHCO 503 564 326 525 504

LBVI AND SWFL REPORT 2014 SANTA ANA WATERSHED ASSOCIATION APPENDIX C
C-3
Table C-1. Least Bell’s Vireo status and management and Brown-headed Cowbird management data, at closely monitored sites in the Santa Ana River Watershed, California, BY MANAGED SITE
MERIDIAN CONSERVATION AREA (former March SKR Preserve)
Parameter 2000
-20
09
2010
2011
2012
2013
2014
Tota
ls
A. Number of territorial males n/a 14 16 13 14 21 n/a
B. Number of pairs (breeding and non-breeding) 33 12 9 11 12 16 93
C. Number of fledged young observed 75 25 7 8 16 23 154
D. Projected total of recruitment of vireo young (a)
121 (n=4 yrs) 76 n/a n/a n/a 48 245
E. Average number of fledglings per pair (C/B) 2.3 2.1 0.8 0.7 1.3 1.4 1.7
F. Projected number of fledglings per pair (D/B)
4.6* (n=4 yrs) 6.3 n/a n/a n/a 3.0 2.6*
G.
Rate of missing eggs/chicks from nests (successful and unsuccessful nests) %=K/I x100) (b)
37.5% (6/16)
(n=4 yrs) 0%
(0/6) n/a n/a n/a 67% (2/3)
32% (8/25)
(N = 6yrs)
H. Rate of cowbird nest parasitism
0.0% (0/16)
(n=4 yrs) 0%
(0/6) n/a n/a n/a 0%
(0/3)
0% (0/25)
(n=6 yrs)
I. Numbers of cowbirds removed from study area 151 13 12 16 15 1 208
K.
Number of trap days (1 operative trap in the field for one day = 1 trap day) 1,203 280 200 235 250 178 2,346
L. Average number of cowbirds trapped per trap day (I/K) 0.13 0.05 0.06 0.07 0.06 <0.1 0.09
M. Number of field hours -LBVI 457 62 55 22 60 80.5 737 N. Number of field hours - BHCO 504 153 45 60 85 68 915 *Excludes 2011-2013 data
SYCAMORE CANYON
Parameter 2000
-20
09
2010
2011
2012
2013
2014
Tota
ls
A. Number of territorial males n/a 12 9 7 12 17 n/a
B. Number of pairs (breeding and non-breeding) 35 8 5 7 n/a 5 60
C. Number of fledged young observed 40 11 4 5 n/a 2 62
D. Projected total of recruitment of vireo young (a) 39.6 n/a n/a n/a n/a n/a 39.6
E. Average number of fledglings per pair (C/B) 1.1 1.4 0.8 0.7 n/a 0.4 1.0
F. Projected number of fledglings per pair (D/B)
1.6* (39.6/25) n/a n/a n/a n/a n/a 0.9*
G.
Rate of missing eggs/chicks from nests (successful and unsuccessful nests) %=K/I x100) (b)
33.3% (3/9) n/a n/a n/a n/a
100% (4/4)
54% (7/13)
H. Rate of cowbird nest parasitism 22.2% (2/9) n/a n/a n/a n/a
50% (2/4)
31% (4/13)
I. Numbers of cowbirds removed from study area 81 n/a n/a n/a n/a 9 90
K.
Number of trap days (1 operative trap in the field for one day = 1 trap day) 635 n/a n/a n/a n/a 75 710
L. Average number of cowbirds trapped per trap day (I/K) 0.13 n/a n/a n/a n/a 0.1 0.13
M. Number of field hours -LBVI 474 54 46 22 n/a 43 636 N. Number of field hours - BHCO 469 n/a n/a n/a n/a 31 500 *Excludes 2006 and 2008 data

LBVI AND SWFL REPORT 2014 SANTA ANA WATERSHED ASSOCIATION APPENDIX C
C-4
Table C-1. Least Bell’s Vireo status and management and Brown-headed Cowbird management data, at closely monitored sites in the Santa Ana River Watershed, California, BY MANAGED SITE
MOCKINGBIRD CANYON
Parameter 2000
-20
09
2010
2011
2012
2013
2014
Tota
ls
A. Number of territorial males n/a 43 37 28 31 23 n/a
B. Number of pairs (breeding and non-breeding) 120 34 32 26 24 7 243
C. Number of fledged young observed 218 25 67 39 40 7 396
D. Projected total of recruitment of vireo young (a) 417.7 n/a 93 78 79 n/a 668
E. Average number of fledglings per pair (C/B) 1.8 0.7 2.1 1.5 1.7 1.0 1.6
F. Projected number of fledglings per pair (D/B) 3.5 n/a 2.9 3 3.3 n/a 3.3*
G.
Rate of missing eggs/chicks from nests (successful and unsuccessful nests) %=K/I x100) (b)
37.8% (31/82) n/a
60% (18/30)
53% (9/17)
47% (8/17)
50% (1/2)
45% (67/148)
H. Rate of cowbird nest parasitism 14.6% (12/82) n/a
0% (0/30)
6% (1/17)
18% (3/17)
0% (0/2)
11% (16/148)
I. Numbers of cowbirds removed from study area 1,258 149 111 140 123 71 1,852
K.
Number of trap days (1 operative trap in the field for one day = 1 trap day) 5,395 1028 908 495 772 603 9,201
L. Average number of cowbirds trapped per trap day (I/K) 0.23 0.14 0.12 0.28 0.16 0.1 0.20
M. Number of field hours -LBVI 3,661
96 302 203 389 62 6,046
N. Number of field hours - BHCO 312 176 215 323 307 *excludes 2010 data
SANTA ANA RIVER - RIVERSIDE (Riverside Ave to Van Buren Blvd)
Parameter 2000
-20
09
2010
2011
2012
2013
2014
Tota
ls
A. Number of territorial males n/a 68 49 43 77 66 n/a
B. Number of pairs (breeding and non-breeding) 167 50 22 11 n/a 19 269
C. Number of fledged young observed 283 58 32 7 7 15 402
D. Projected total of recruitment of vireo young (a)
329.4 (n=5 yrs) 100 71 n/a n/a 23 523
E. Average number of fledglings per pair (C/B) 1.7 1.2 1.5 0.6 n/a 0.8 1.5
F. Projected number of fledglings per pair (D/B)
2.7 (121/329)) 2.0 3.2 n/a n/a 1.2 1.9
G.
Rate of missing eggs/chicks from nests (successful and unsuccessful nests) %=K/I x100) (b)
32.0% (24/75) (n=7 yrs)
36% (4/11)
30% (3/10) n/a n/a
67% (2/3)
33% (33/99)
H. Rate of cowbird nest parasitism 16.0% (12/75)
(n=7 yrs)
0% (0/11)
10% (1/10) n/a n/a
0% (0/3)
13% (13/99)
I. Numbers of cowbirds removed from study area 461 58 30 37 21 17 603
K.
Number of trap days (1 operative trap in the field for one day = 1 trap day) 3,734 530 515 468 540 256 5,513
L. Average number of cowbirds trapped per trap day (I/K) 0.12 0.11 0.06 0.08 0.04 0.1 0.12
M. Number of field hours -LBVI 2,333 335 239 144 167 123 4,585 N. Number of field hours - BHCO 277 315 234 230 188

LBVI AND SWFL REPORT 2014 SANTA ANA WATERSHED ASSOCIATION APPENDIX C
C-5
Table C-1. Least Bell’s Vireo status and management and Brown-headed Cowbird management data, at closely monitored sites in the Santa Ana River Watershed, California, BY MANAGED SITE
HIDDEN VALLEY (as of 2010, south side of river)
Parameter 2000
-20
09
2010
2011
2012
2013
2014
Tota
ls
A. Number of territorial males n/a 60 55 62 75 85 n/a
B. Number of pairs (breeding and non-breeding) 230 43 36 37 42 32 420
C. Number of fledged young observed 407 53 41 45 66 28 640
D. Projected total of recruitment of vireo young (a)
511.6 (n=9 yrs) 90.3 122 104 109 n/a
937 (13 yrs)
E. Average number of fledglings per pair (C/B) 1.8 1.2 1.1 1.2 1.6 0.9 1.5
F. Projected number of fledglings per pair (D/B)
2.4* (n=9 yrs) 2.1 3.4 2.8 2.6 n/a 2.3*
G.
Rate of missing eggs/chicks from nests (successful and unsuccessful nests) %=K/I x100) (b)
36.4% (31/85)
64.7% (11/17)
30% (3/10)
50% (4/8)
25% (2/8)
67% (2/3)
40% (53/131)
H. Rate of cowbird nest parasitism 7.0% (6/85)
5.8% (1/17)
20% (2/10)
0% (0/8)
0% (0/8)
0% (0/3)
7% (9/131)
I. Numbers of cowbirds removed from study area 637 24 12 24 8 3 708
K.
Number of trap days (1 operative trap in the field for one day = 1 trap day) 4,298 252 257 348 362 252 5,769
L. Average number of cowbirds trapped per trap day (I/K) 0.15 0.10 0.05 0.07 0.02 <0.1 0.12
M. Number of field hours -LBVI 4,156.7 330 193 261 305 225 6260
N. Number of field hours -BHCO 196 228 129 136 100 * Calculation excludes 2003, row B= (212+ 43+36+37+42+32), Row F = 828/402 = 2.4
HIDDEN VALLEY (north side of river)
Parameter 2000
-20
09
2010
2011
2012
2013
2014
Tota
ls
A. Number of territorial males n/a 15 4 9 21 21 n/a
B. Number of pairs (breeding and non-breeding) n/a 12 2 3 2 14 33
C. Number of fledged young observed n/a 18 2 1 3 19 43
D. Projected total of recruitment of vireo young (a) n/a 28 n/a n/a n/a 28 56
E. Average number of fledglings per pair (C/B) n/a 1.5 1 0.3 n/a 1.4 1.3
F. Projected number of fledglings per pair (D/B) n/a 2.3 n/a n/a n/a 2.0 1.7
G.
Rate of missing eggs/chicks from nests (successful and unsuccessful nests) %=K/I x100) (b) n/a
11% (1/9) n/a n/a n/a
33% (1/3)
17% (2/12)
H. Rate of cowbird nest parasitism n/a 33% (3/9) n/a n/a n/a
0% (0/3)
25% (3/12)
I. Numbers of cowbirds removed from study area n/a n/a n/a n/a n/a n/a n/a
K.
Number of trap days (1 operative trap in the field for one day = 1 trap day) n/a n/a n/a n/a n/a n/a n/a
L. Average number of cowbirds trapped per trap day (I/K) n/a n/a n/a n/a n/a n/a n/a
M. Number of field hours -LBVI n/a 210 8 12 26 133 389
N. Number of field hours -BHCO n/a n/a n/a -- n/a n/a n/a

LBVI AND SWFL REPORT 2014 SANTA ANA WATERSHED ASSOCIATION APPENDIX C
C-6
Table C-1. Least Bell’s Vireo status and management and Brown-headed Cowbird management data, at closely monitored sites in the Santa Ana River Watershed, California, BY MANAGED SITE
SANTA ANA RIVER - NORCO (Goose Creek Golf Course to River Rd)
Parameter 2000
-20
09
2010
2011
2012
2013
2014
Tota
ls
A. Number of territorial males n/a 101 105 95 108 110 n/a
B. Number of pairs (breeding and non-breeding) 233 64 59 51 52 32 491
C. Number of fledged young observed 489 113 91 86 109 36 924
D. Projected total of recruitment of vireo young (a) 696.2 211.2 177 184 177 n/a 1445
E. Average number of fledglings per pair (C/B) 2.1 1.8 1.5 1.7 2.1 1.1 1.8
F. Projected number of fledglings per pair (D/B) 2.7 3.3 3.0 3.6 3.4 n/a 3.0
G.
Rate of missing eggs/chicks from nests (successful and unsuccessful nests) %=K/I x100) (b)
41.2% (73/177)
28% (5/18)
45% (10/22)
0% (0/17)
26% (8/29)
56% (5/9)
37% (101/272)
H. Rate of cowbird nest parasitism 8.5%
(14/177) 0%
(0/18) 0%
(0/22) 0%
(0/17) 7%
(2/29) 0%
(0/7) 6%
(16/272)
I. Numbers of cowbirds removed from study area 382 49 35 34 23 4 548
K.
Number of trap days (1 operative trap in the field for one day = 1 trap day) 1,102 269 228 230 270 218 2,317
L. Average number of cowbirds trapped per trap day (I/K) 0.35 0.18 0.15 0.15 0.09 <0.1 0.24
M. Number of field hours -LBVI 2,337 183 197 232 256 204 3,409 N. Number of field hours - BHCO 624 252 n/a 230 135 100 1,341
TEMESCAL CANYON
Parameter 2000
-20
09
2010
2011
2012
2013
2014
Tota
ls
A. Number of territorial males n/a 83 102 109 131 126 n/a
B. Number of pairs (breeding and non-breeding) 164 49 65 63 50 24 415
C. Number of fledged young observed 339 73 113 71 48 17 661
D. Projected total of recruitment of vireo young (a) 447.7 151.9 189 189 0 n/a 978
E. Average number of fledglings per pair (C/B) 2.1 1.5 1.7 1.1 1.0 0.7 1.6
F. Projected number of fledglings per pair (D/B) 2.7 3.1 2.9 3.0 n/a n/a 2.5
G.
Rate of missing eggs/chicks from nests (successful and unsuccessful nests) %=K/I x100) (b)
39.1% (52/133)
20% (3/15)
34% (11/32)
0% (0/12) n/a n/a
34% (66/192)
H. Rate of cowbird nest parasitism
20.3% (27/133)
0% (0/15)
3% (1/32)
25% (3/12) n/a n/a
15% (31/205)
I. Numbers of cowbirds removed from study area 1,350 134 204 566 380 194 2828
K.
Number of trap days (1 operative trap in the field for one day = 1 trap day) 5,812 1191 1245 851 1246 1077 11,422
L. Average number of cowbirds trapped per trap day (I/K) 0.23 0.11 0.16 0.52 0.30 0.2 0.25
M. Number of field hours -LBVI 5,690 335 557 531 420 90 10,246 N. Number of field hours - BHCO 467 685 377 544 550

LBVI AND SWFL REPORT 2014 SANTA ANA WATERSHED ASSOCIATION APPENDIX C
C-7
Table C-1. Least Bell’s Vireo status and management and Brown-headed Cowbird management data, at closely monitored sites in the Santa Ana River Watershed, California, BY MANAGED SITE
SANTA ANA CANYON – UPPER CANYON BELOW PRADO DAM
Parameter 2000
-20
09
2010
2011
2012
2013
2014
Tota
ls
A. Number of territorial males n/a 11 14 10 28 27 n/a
B. Number of pairs (breeding and non-breeding) 126 4 5 4 14 18 171
C. Number of fledged young observed 208 6 5 6 23 28 276
D. Projected total of recruitment of vireo young (a)
309.1 (n=8 yrs) n/a n/a 12 42 54
417 (n=11 yrs)
E. Average number of fledglings per pair (C/B) 1.7 1.5 1.0 1.5 1.6 1.6 1.6
F. Projected number of fledglings per pair (D/B)
2.7* * (n=8 yrs) n/a n/a 3.0 3.0 3.0
2.4 (n=11 yrs)
G.
Rate of missing eggs/chicks from nests (successful and unsuccessful nests) %=K/I x100) (b)
40.6% (26/64) (n=8 yrs)
0% (0/1) n/a
0% (0/1)
40% (2/5)
33% (2/6)
39% (30/77)
H. Rate of cowbird nest parasitism
6.3% (4/64)
(n=8yrs) 0%
(0/1) n/a 0%
(0/1) 0%
(0/5) 0%
(0/6)
5% (4/77)
(n=12 yrs)
I. Numbers of cowbirds removed from study area 301 165 48 62 32 56 664
K.
Number of trap days (1 operative trap in the field for one day = 1 trap day) 2,112 286 238 105 133 137 3,011
L. Average number of cowbirds trapped per trap day (I/K) 0.14 0.58 0.20 0.59 0.24 0.4 0.22
M. Number of field hours -LBVI 6,793 324* 350* 325* 396* 365* 10,734.25 N. Number of field hours - BHCO 425* 608* 432* 377* 339
SANTA ANA CANYON - GREEN RIVER GOLF CLUB
Parameter 2000
-20
09
2010
2011
2012
2013
2014
Tota
ls
A. Number of territorial males n/a 24 26 19 22 26 n/a
B. Number of pairs (breeding and non-breeding) 101 17 14 11 19 19 181
C. Number of fledged young observed 192 19 19 11 19 29 289
D. Projected total of recruitment of vireo young (a) 279.3 30.6 29 25 0 49 413
E. Average number of fledglings per pair (C/B) 1.9 1.2 1.4 1.0 1.0 1.5 1.6
F. Projected number of fledglings per pair (D/B) 2.8 1.8 2.1 2.3 n/a 2.6 2.3
G.
Rate of missing eggs/chicks from nests (successful and unsuccessful nests) %=K/I x100) (b)
26.2% (16/61)
71% (5/7)
55% (6/11)
20% (1/5)
50% (2/4)
25% (2/8)
33% (32/96)
H. Rate of cowbird nest parasitism
6.6% (4/61)
0% (0/7)
0% (0/11)
0% (0/5)
0% (0/4)
0% (0/8)
4% (4/96)
I. Numbers of cowbirds removed from study area 802 58 26 37 34 15 972
K.
Number of trap days (1 operative trap in the field for one day = 1 trap day) 3,101 407 119 124 130 131 4,012
L. Average number of cowbirds trapped per trap day (I/K) 0.26 0.14 0.22 0.3 0.3 0.1 0.24
M. Number of field hours -LBVI *See Upper Canyon Summary Sheet for all Santa Ana Canyon hours N. Number of field hours - BHCO

LBVI AND SWFL REPORT 2014 SANTA ANA WATERSHED ASSOCIATION APPENDIX C
C-8
Table C-1. Least Bell’s Vireo status and management and Brown-headed Cowbird management data, at closely monitored sites in the Santa Ana River Watershed, California, BY MANAGED SITE
SANTA ANA CANYON – FEATHERLY REGIONAL PARK
Parameter 2000
-20
09
2010
2011
2012
2013
2014
Tota
ls
A. Number of territorial males n/a 40 33 36 64 59 n/a
B. Number of pairs (breeding and non-breeding) 131 23 19 16 45 39 273
C. Number of fledged young observed 175 22 23 12 55 35 322
D. Projected total of recruitment of vireo young (a) 307.1 46 38 -- 77 43 511
E. Average number of fledglings per pair (C/B) 1.3 1.0 1.21 0.75 1.2 0.9 1.2
F. Projected number of fledglings per pair (D/B) 2.3 2.0 2.0 0 1.7 1.1 1.9
G.
Rate of missing eggs/chicks from nests (successful and unsuccessful nests) %=K/I x100) (b)
47.7% (31/65)
71% (5/7)
20% (1/5)
100% (4/4)
50% (7/14)
64% (9/14)
52% (57/109)
H. Rate of cowbird nest parasitism 7.7% (5/65)
0% (0/7)
0% (0/5)
0% (0/4)
0% (0/14)
0% (0/14)
5% (5/109)
I. Numbers of cowbirds removed from study area 127 118 44 30 48 41 408
K.
Number of trap days (1 operative trap in the field for one day = 1 trap day) 1,591 514 335 244 258 241 3,183
L. Average number of cowbirds trapped per trap day (I/K) 0.08 0.23 0.13 0.12 0.12 0.2 0.13
M. Number of field hours –LBVI See Upper Canyon Summary Sheet for all Santa Ana Canyon hours N. Number of field hours - BHCO
*Includes 2 traps at Yorba Linda Regional Park CHINO HILLS (Butterfields Ranch environs)
Parameter 2000
-20
09
2010
2011
2012
2013
2014
Tota
ls
A. Number of territorial males n/a 11 8 8 13 10 n/a
B. Number of pairs (breeding and non-breeding) 45 7 3 2 5 2 64
C. Number of fledged young observed 54 7 1 1 7 3 73
D. Projected total of recruitment of vireo young (a)
52.9 (n=4 yrs) 11.9 n/a -- 20 n/a
85 (n=6 yrs)
E. Average number of fledglings per pair (C/B) 1.2 1.0 0.33 0.5 1.4 n/a
1.1 (n=8 yrs)
F. Projected number of fledglings per pair (D/B)
1.8* (n=4 yrs) 1.7 n/a 0 4.0 n/a
1.4 (n=7 yrs)
G.
Rate of missing eggs/chicks from nests (successful and unsuccessful nests) %=K/I x100) (b)
63.2% (12/19)
(n= 4 yrs) 67% (2/3) n/a
100% (1/1) 0 n/a
65% (15/23)
H. Rate of cowbird nest parasitism
31.6% (6/19)
(n=4 yrs) 0%
(0/3) n/a 0%
(0/1) 0 n/a
25% (6/24)
(n=7 yrs)
I. Numbers of cowbirds removed from study area 11 16 16 6 12 4 65
K.
Number of trap days (1 operative trap in the field for one day = 1 trap day) 214 129 115 124 132 119 833
L. Average number of cowbirds trapped per trap day (I/K) 0.05 0.12 0.14 0.05 0.1 <0.1 0.08
M. Number of field hours -LBVI 388 59 54 44 36 23.5 604.5 N. Number of field hours - BHCO 179 129 115 124 83 75 662

LBVI AND SWFL REPORT 2014 SANTA ANA WATERSHED ASSOCIATION APPENDIX C
C-9
Table C-1. Least Bell’s Vireo status and management and Brown-headed Cowbird management data, at closely monitored sites in the Santa Ana River Watershed, California, BY MANAGED SITE
IRVINE REGIONAL PARK
Parameter 2000
-20
09
2010
2011
2012
2013
2014
Tota
ls
A. Number of territorial males n/a 24 26 29 n/a 27 n/a
B. Number of pairs (breeding and non-breeding) n/a 14 9 5 n/a 9 37
C. Number of fledged young observed n/a 18 7 5 n/a 12 42
D. Projected total of recruitment of vireo young (a) n/a 50 18 n/a n/a 14 82
E. Average number of fledglings per pair (C/B) n/a 1.3 0.77 1.0 n/a 1.3 1.0
F. Projected number of fledglings per pair (D/B) n/a 3.6 9 n/a n/a 1.6 2.1
G.
Rate of missing eggs/chicks from nests (successful and unsuccessful nests) %=K/I x100) (b) n/a
25% (1/4) n/a n/a n/a
80% (4/5)
56% (5/9)
H. Rate of cowbird nest parasitism n/a
0% (0/4) n/a n/a n/a
0% (0/6)
0% (0/10)
I. Numbers of cowbirds removed from study area n/a n/a n/a n/a n/a n/a n/a
K.
Number of trap days (1 operative trap in the field for one day = 1 trap day) n/a n/a n/a n/a n/a n/a n/a
L. Average number of cowbirds trapped per trap day (I/K) n/a n/a n/a n/a n/a n/a n/a
M. Number of field hours -LBVI n/a 25 21 9.5 n/a 88.5 144 N. Number of field hours - BHCO n/a n/a n/a n/a n/a n/a n/a
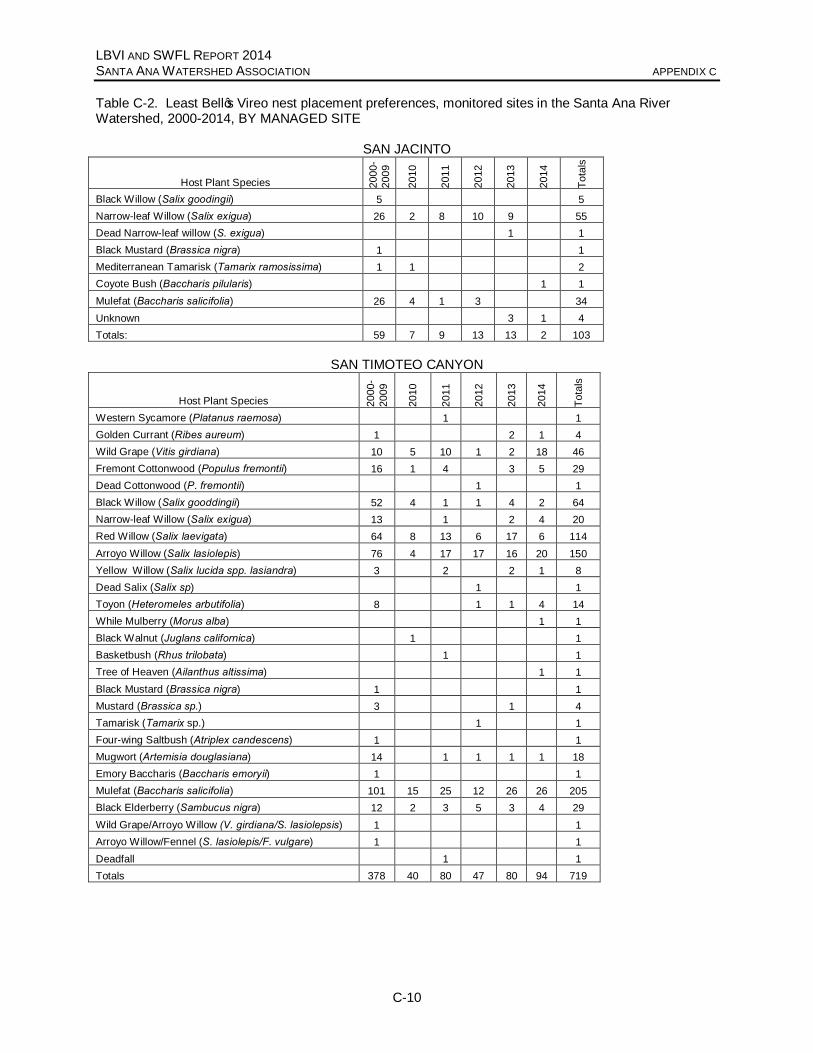
LBVI AND SWFL REPORT 2014 SANTA ANA WATERSHED ASSOCIATION APPENDIX C
C-10
Table C-2. Least Bell’s Vireo nest placement preferences, monitored sites in the Santa Ana River Watershed, 2000-2014, BY MANAGED SITE
SAN JACINTO
Host Plant Species 2000
-20
09
2010
2011
2012
2013
2014
Tota
ls
Black Willow (Salix goodingii) 5 5 Narrow-leaf Willow (Salix exigua) 26 2 8 10 9 55 Dead Narrow-leaf willow (S. exigua) 1 1 Black Mustard (Brassica nigra) 1 1 Mediterranean Tamarisk (Tamarix ramosissima) 1 1 2 Coyote Bush (Baccharis pilularis) 1 1 Mulefat (Baccharis salicifolia) 26 4 1 3 34 Unknown 3 1 4 Totals: 59 7 9 13 13 2 103
SAN TIMOTEO CANYON
Host Plant Species 2000
-20
09
2010
2011
2012
2013
2014
Tota
ls
Western Sycamore (Platanus raemosa) 1 1 Golden Currant (Ribes aureum) 1 2 1 4 Wild Grape (Vitis girdiana) 10 5 10 1 2 18 46 Fremont Cottonwood (Populus fremontii) 16 1 4 3 5 29 Dead Cottonwood (P. fremontii) 1 1 Black Willow (Salix gooddingii) 52 4 1 1 4 2 64 Narrow-leaf Willow (Salix exigua) 13 1 2 4 20 Red Willow (Salix laevigata) 64 8 13 6 17 6 114 Arroyo Willow (Salix lasiolepis) 76 4 17 17 16 20 150 Yellow Willow (Salix lucida spp. lasiandra) 3 2 2 1 8 Dead Salix (Salix sp) 1 1 Toyon (Heteromeles arbutifolia) 8 1 1 4 14 While Mulberry (Morus alba) 1 1 Black Walnut (Juglans californica) 1 1 Basketbush (Rhus trilobata) 1 1 Tree of Heaven (Ailanthus altissima) 1 1 Black Mustard (Brassica nigra) 1 1 Mustard (Brassica sp.) 3 1 4 Tamarisk (Tamarix sp.) 1 1 Four-wing Saltbush (Atriplex candescens) 1 1 Mugwort (Artemisia douglasiana) 14 1 1 1 1 18 Emory Baccharis (Baccharis emoryii) 1 1 Mulefat (Baccharis salicifolia) 101 15 25 12 26 26 205 Black Elderberry (Sambucus nigra) 12 2 3 5 3 4 29 Wild Grape/Arroyo Willow (V. girdiana/S. lasiolepsis) 1 1 Arroyo Willow/Fennel (S. lasiolepis/F. vulgare) 1 1 Deadfall 1 1 Totals 378 40 80 47 80 94 719

LBVI AND SWFL REPORT 2014 SANTA ANA WATERSHED ASSOCIATION APPENDIX C
C-11
Table C-2. Least Bell’s Vireo nest placement preferences, monitored sites in the Santa Ana River Watershed, 2000-2014, BY MANAGED SITE
MERIDIAN CONSERVATION AREA (former March SKR Preserve)
Host Plant Species 2000
-20
09
2010
2011
2012
2013
2014
Tota
ls
Black Willow (Salix gooddingii) 9 1 10 Red Willow (Salix laevigata) 3 3 1 7 Arroyo Willow (Salix lasiolepis) 5 1 2 8 Mulefat (Baccharis salicifolia) 1 1 Totals 17 6 0 0 0 3 26
SYCAMORE CANYON
Host Plant Species 2000
-20
09
2010
2011
2012
2013
2014
Tota
ls
Fremont Cottonwood (Populus fremontii) 1 1 Black Willow (Salix gooddingii) 9 9 Arroyo Willow (Salix lasiolepis) 1 1 Black Elderberry (Sambucus nigra) 1 2 3 Totals 10 n/a n/a n/a n/a 4 14
MOCKINGBIRD CANYON
Host Plant Species 2000
-20
09
2010
2011
2012
2013
2014
Tota
ls
Western Sycamore (Platanus racemosa) 1 1 Wild Grape (Vitis girdiana) 6 1 7 Fremont Cottonwood (Populus fremontii) 1 1 2 Black Willow (Salix goodingii) 26 3 1 1 31 Red Willow (Salix laevigata) 30 2 13 7 2 54 Arroyo Willow (Salix lasiolepis) 2 6 3 4 15 Willow species (Salix sp) 1 1 Dead Salix sp. (Salix sp) 1 1 Holly-leafed Cherry (Prunus ilicifolia) 1 1 Black Walnut (Juglans californica) 1 1 Peruvian Pepper Tree (Schinus molle) 2 1 1 4 Perennial Pepperweed (Lepidium latifolium) 3 1 4 Dead Perennial Pepperweed (L. latifolium) 1 1 Fourwing saltbush (Atriplex canescens) 1 1 Emory’s Baccharis (Baccharis emoryii) 2 2 Mulefat (Baccharis salicifolia) 5 1 2 3 4 15 Arrowhead (Pluchea sericea) 1 1 Wild Celery (Apium graveolens) 1 1 Black Elderberry (Sambucus nigra) 13 3 2 6 1 25 Wild Grape/Black Willow (V. girdiana/S. goodingii) 1 1 Black Willow/Perennial Pepperweed (S. goodingii/L. latifolium) 1 1 Willow species/Perennial Pepperweed (Salix sp/L. latifolium) 1 1 Coyotebush/Mulefat (B. pilularis/B.salicifolia) 1 1 Unknown 2 2 Totals 98 3 31 19 20 3 174

LBVI AND SWFL REPORT 2014 SANTA ANA WATERSHED ASSOCIATION APPENDIX C
C-12
Table C-2. Least Bell’s Vireo nest placement preferences, monitored sites in the Santa Ana River Watershed, 2000-2014, BY MANAGED SITE
SANTA ANA RIVER – RIVERSIDE (Riverside Ave to Van Buren Blvd)
Host Plant Species 2000
-20
09
2010
2011
2012
2013
2014
Tota
ls
Wild Grape (Vitis girdiana) 1 2 1 4 Fremont Cottonwood (Populus fremontii) 7 1 8 Narrow-leaf Willow (Salix exigua) 2 1 2 5 Black Willow (Salix goodingii) 10 1 11 Dead Black Willow (S. goodingii) 1 1 Red Willow (Salix laevigata) 6 1 1 8 Arroyo Willow (Salix lasiolepis) 28 4 5 37 Yellow Willow (Salix lucida spp. lasiandra) 1 1 Willow species (Salix sp.) 1 1 Wild Rose (Rosa californica) 1 1 Hoary Nettle (Utica dioica) 1 1 Scrub Oak (Quercus sp.) 2 2 Mediterranean Tamarisk (Tamarix ramosissima) 1 1 Tree Tobacco (Nicotiana glauca) 1 1 Mulefat (Baccharis salicifolia) 26 7 1 1 2 37 Black Elderberry (Sambucus nigra) 3 1 4 Dead Black Willow/Hoary Nettle (S. goodingii/U. dioica)
1 1 Totals 91 13 13 2 0 5 124
HIDDEN VALLEY (south side of river)
Host Plant Species 2000
-20
09
2010
2011
2012
2013
2014
Tota
ls
Wild Grape (Vitis girdiana) 6 2 2 1 11 Narrow-leafed Willow (Salix exigua) 1 1 1 3 Black Willow (Salix gooddingii) 15 1 2 18 Red Willow (Salix laevigata) 4 1 2 2 1 10 Arroyo Willow (Salix lasiolepis) 43 6 2 1 2 2 56 Yellow Willow (Salix lucida spp. lasiandra) 1 1 Willow species (Salix spp.) 2 2 Poison Oak (Toxicodendron diversilobum) 1 1 Coyote Bush (Baccharis pilularis) 1 1 Mulefat (Baccharis salicifolia) 29 9 3 2 3 46 Black Elderberry (Sambucus nigra) 3 3 Wild Grape/Wild Rose (V. girdiana/R. californica) 1 1 Red Willow/Fresh water reed (S. lasiolepsis/fresh water reed) 1 1 Willow sp/Blackberry (Salix sp/Rubus ursinus ) 1 1 Mulefat/Hemlock (B. salicifolia/C. maculatum) 1 1 Unknown 2 2 Totals 109 17 11 7 10 4 158

LBVI AND SWFL REPORT 2014 SANTA ANA WATERSHED ASSOCIATION APPENDIX C
C-13
Table C-2. Least Bell’s Vireo nest placement preferences, monitored sites in the Santa Ana River Watershed, 2000-2014, BY MANAGED SITE
HIDDEN VALLEY (north side of river)
Host Plant Species 2000
-20
09
2010
2011
2012
2013
2014
Tota
ls
Wild Grape (Vitis girdiana) 2 1 3 Narrow-leaf Willow (Salix exigua) 1 1 Red Willow (Salix laevigata) 2 2 Arroyo Willow (Salix lasiolepis) 1 1 Mulefat (Baccharis salicifolia) 4 2 6 Black Elderberry (Sambucus nigra) 2 1 3 Totals 0 10 2 0 0 4 16
SANTA ANA RIVER – NORCO (Goose Creek Golf Course to River Rd)
Host Plant Species 2000
-20
09
2010
2011
2012
2013
2014
Tota
ls
Wild Grape (Vitis girdiana) 9 1 5 15 Fremont Cottonwood (Populus fremontii) 11 1 1 1 14 Dead Fremont cottonwood (Populus fremontii) 1 1 Narrow-leafed Willow (Salix exigua) 8 1 1 1 11 Black Willow (Salix gooddingii) 39 1 5 2 47 Red Willow (Salix laevigata) 2 2 4 Arroyo Willow (Salix lasiolepis) 70 5 5 9 11 1 101 Dead Arroyo Willow (Salix lasiolepis) 1 1 Dead Willow sp (Salix sp) 1 1 Black walnut (Juglans californica) 1 1 Ash (Fraxinus sp.) 1 1 Mulefat (Baccharis salicifolia) 63 13 10 4 10 10 110 Dead Mulefat (B. salicifolia) 2 2 Poison Hemlock (Conium maculatum) 4 4 Black Elderberry (Sambucus nigra) 2 1 3 Black Willow /Poison Hemlock (S. goodingii/C. maculatum) 1 1 Unknown 3 3 Totals 210 22 25 19 31 13 320

LBVI AND SWFL REPORT 2014 SANTA ANA WATERSHED ASSOCIATION APPENDIX C
C-14
Table C-2. Least Bell’s Vireo nest placement preferences, monitored sites in the Santa Ana River Watershed, 2000-2014, BY MANAGED SITE
TEMESCAL CANYON
Host Plant Species 2000
-20
09
2010
2011
2012
2013
2014
Tota
ls
Western Sycamore (Platanus racemosa) 1 1 Fremont Cottonwood (Populus fremontii) 2 2 4 Narrow-leafed Willow (Salix exigua) 1 1 Black Willow (Salix gooddingii) 18 2 7 2 1 30 Red Willow (Salix laevigata) 1 10 3 14 Arroyo Willow (Salix lasiolepis) 61 7 2 1 1 72 Yellow Willow (Salix lucida spp. lasiandra) 3 1 4 Dead Willow (Salix sp) 1 1 Toyon (Heteromeles arbutifolia) 1 1 Sugarbush (Rhus ovata) 1 1 2 California Blackberry (Rubus ursinus) 1 1 Poison Oak (Toxicodendron diversilobum) 1 1 Mustard (Brassica sp) 1 1 Perennial Pepperweed (Lepidium latifolium) 1 1 Mediterranean Tamarisk (Tamarix ramosissima) 1 1 2 4 Mugwort (Artemisia douglasiana) 1 1 Coyote Bush (Baccharis pilularis) 1 1 2 Mulefat (Baccharis salicifolia) 65 6 7 2 1 81 Dead Mulefat (B. salicifolia) 3 3 Brittlebush (Encelia farinose) 1 1 Common Sunflower (Helianthus annuus) 1 1 Arrowweed (Pluchea sp.) 1 1 2 Black Elderberry (Sambucus nigra) 1 3 3 1 8 Arroyo Willow/Dead Hoary Nettle (S. lasiolepsis/U. dioica) 1 1 Deadfall 2 1 3 Totals 166 22 35 15 3 0 241

LBVI AND SWFL REPORT 2014 SANTA ANA WATERSHED ASSOCIATION APPENDIX C
C-15
Table C-2. Least Bell’s Vireo nest placement preferences, monitored sites in the Santa Ana River Watershed, 2000-2014, BY MANAGED SITE
SANTA ANA CANYON – UPPER CANYON BELOW PRADO DAM
Host Plant Species 2000
-20
09
2010
2011
2012
2013
2014
Tota
ls
Wild Grape (Vitis girdiana) 4 4 Fremont Cottonwood (Populus fremontii) 5 1 1 1 8 Narrow-leafed Willow (Salix exigua) 1 1 Black Willow (Salix goodingii) 10 1 11 Red Willow (Salix laevigata) 3 3 Arroyo Willow (Salix lasiolepis) 2 1 3 Willow Species(Salix spp.) 1 1 Castor Bean (Rincus communis) 1 1 Toyon (Heteromeles arbutifolia) 1 1 Wild Rose (Rosa californica) 3 3 Coast Live Oak (Quercus agrifolia) 1 1 Scrub Oak (Quercus berberidifolia) 2 2 Poison Oak (Toxicodendron diversilobum) 5 5 Peruvian Pepper Tree (Schinus molle) 1 1 Mustard (Brassica spp.) 2 2 Coyote Bush (Baccharis pilularis) 1 1 Mulefat (Baccharis salicifolia) 33 3 7 43 Broom Baccharis (Baccharis sarothroides) 1 1 Milk Thistle (Silybum marianum) 1 1 Cockleburr (Xanthium strumarium) 1 1 Black Elderberry (Sambucus nigra) 14 1 1 1 1 18 Poison Hemlock (Conium maculatum) 2 2 Black Willow/Poison Hemlock (S. goodingii/C. maculatum) 1 1 Wild Grape/Mulefat (V. girdiana/B. salicifolia) 1 1 Totals 96 2 2 2 6 8 116

LBVI AND SWFL REPORT 2014 SANTA ANA WATERSHED ASSOCIATION APPENDIX C
C-16
Table C-2. Least Bell’s Vireo nest placement preferences, monitored sites in the Santa Ana River Watershed, 2000-2014, BY MANAGED SITE
SANTA ANA CANYON – GREEN RIVER GOLF CLUB
Host Plant Species 2000
-20
09
2010
2011
2012
2013
2014
Tota
ls
Giant Reed (Arundo donax) 1 1 Wild Grape (Vitis girdiana) 1 1 2 Fremont Cottonwood (Populus fremontii) 4 1 5 Narrow-leaf Willow (Salix exigua) 1 1 2 Black Willow (Salix gooddingii) 5 2 1 3 11 Red Willow (Salix laevigata) 4 4 Arroyo Willow (Salix lasiolepis) 2 2 4 Toyon (Hetermeles arbutifolia) 1 1 2 Black Walnut (Juglans californica) 1 1 Laurel Sumac (Malosma laurina) 3 3 Poison Oak (Toxicodendron diversilobum) 1 1 2 Peruvian Pepper Tree (Schinus molle) 2 3 5 Brazilian Pepper Tree (Schinus terebinthifolius) 1 1 Blue Plumbago (Plumbago auriculata) 1 1 2 Wax Leaf Privet (Ligustrum sp.) 1 1 Lollypop Tree (Myoporum luteumi) 1 1 California Sagebrush (Artemisia californica) 1 1 Mugwort (Artemisia douglasiana) 1 1 Coyote Bush (Baccharis pilularis) 2 1 3 Mulefat (Baccharis salicifolia) 35 1 5 2 1 2 46 Poison Hemlock (Conium maculatum) 2 2 Black Elderberry (Sambucus nigra) 4 2 2 2 10 Yerba Santa sp (Eriodictyon sp) 1 1 Wild Grape/Peruvian Pepper Tree (V. girdiana/S. molle) 1 1 Wild Grape/Black Elderberry (V. girdiana/S. nigra) 1 1 Black Willow/Black Elderberry (S. goodingii/S. nigra) 1 1 Totals 72 7 13 7 5 10 114

LBVI AND SWFL REPORT 2014 SANTA ANA WATERSHED ASSOCIATION APPENDIX C
C-17
Table C-2. Least Bell’s Vireo nest placement preferences, monitored sites in the Santa Ana River Watershed, 2000-2014, BY MANAGED SITE
SANTA ANA RIVER – FEATHERLY REGIONAL PARK
Host Plant Species 2000
-20
09
2010
2011
2012
2013
2014
Tota
ls
Western Sycamore (Platanus racemosa) 3 3 Wild Grape (Vitis girdiana) 1 1 Fremont Cottonwood (Populus fremontii) 4 3 4 4 2 1 18 Black Cottonwood (Populus trichocarpa) 1 1 Dead Black Willow covered w/ living Black Willow (S. goodingii) 1 1 Narrow-leafed Willow (Salix exigua) 4 4 Black Willow (Salix gooddingii) 13 1 2 3 19 Red Willow (Salix laevigata) 2 2 4 Arroyo Willow (Salix lasiolepis) 3 1 4 Black Walnut (Juglans californica) 4 3 7 Willow species (Salix sp.) 1 1 Toyon (Heteromeles arbutifolia) 1 1 White Alder (Alnus rhombifolia) 1 1 Laurel Sumac (Malosma laurina) 3 3 2 8 Poison Oak (Toxicodendron diversilobum) 1 4 1 6 Orange Tree (Citrus sinensis) 1 1 1 3 Black Mustard (Brassica nigra) 1 1 2 Black Sage (Salvia mellifera) 1 1 Mulefat (Baccharis salicifolia) 23 1 2 3 4 33 Yellowspine Thistle (Cirsium ochrocentrum) 2 2 Cockleburr (Xanithum strumaritum) 1 1 Poison Hemlock (Conium maculatum) 2 2 Black Elderberry (Sambucus nigra) 11 3 2 2 2 5 25 Fiddleneck ( Amsinckia sp.) 1 1 Thick-leaved yerba santa (Eriodictyon crassifolium) 1 1 Wild Grape/Mulefat (V. girdiana/B. salicifolia) 2 2 Arroyo Willow/Black Mustard (S. lasiolepis/B. nigra) 1 1 Castorbean/Mulefat (Ricinus communis/B. salicifolia) 1 1 Unknown 1 1 Totals 83 11 12 8 23 18 155
CHINO HILLS (Butterfield Ranch environs)
Host Plant Species 2000
-20
09
2010
2011
2012
2013
2014
Tota
ls
Wild Grape (Vitis girdiana) 1 1 Black Willow (Salix goodingii) 9 9 Red Willow (Salix laevigata) 3 2 1 6 Arroyo Willow (Salix lasiolepis) 1 1 Toyon (Heteromeles arbutifolia) 1 1 Coast live oak (Quercus agrifolia) 1 1 Mugwort (Artemisia douglasiana) 3 3 Mulefat (Baccharis salicifolia) 4 1 5 Black Elderberry (Sambucus nigra) 2 2 Totals 24 3 0 1 1 0 29

LBVI AND SWFL REPORT 2014 SANTA ANA WATERSHED ASSOCIATION APPENDIX C
C-18
Table C-2. Least Bell’s Vireo nest placement preferences, monitored sites in the Santa Ana River Watershed, 2000-2014, BY MANAGED SITE
IRVINE REGIONAL PARK
Host Plant Species 2000
-20
09
2010
2011
2012
2013
2014
Tota
ls
Wild Grape (Vitis girdiana) 1 1 Black Willow (Salix goodingii) 1 1 False Indigo (Amorpha fruticosa) 1 1 Mulefat (Baccharis salicifolia) 3 4 7 Black Elderberry (Sambucus nigra) 1 1 2 Totals 5 1 0 0 6 12

LBVI AND SWFL REPORT 2014 SANTA ANA WATERSHED ASSOCIATION APPENDIX C
C-19
Table C-3. Least Bell’s Vireo reproductive success and breeding biology data, monitored sites, in the Santa Ana River watershed, 2000-2014, BY MANAGED SITE
SAN JACINTO
Parameter 2000
-20
09
2010
2011
2012
2013
2014
Tota
ls
A. Number of pairs 43 18 25 36 29 19 n/a B. Number of breeding (nesting) pairs 39 15 20 22 28 15 139
C.
Number of breeding pairs that were well-monitored throughout the breeding season 29 0 1 9 6 0 45
D. Number of 'known fledged young' OBSERVED 104 28 18 49 39 12 250
E.
Number of 'known fledged young' produced by pairs monitored throughout the breeding season 93 n/a 0 26 8 n/a 127
F.
Average number of fledglings produced per breeding pair (minimum; D/B = 'productivity or breeding success') 2.7 1.9 0.9 2.2 1.4 0.8 1.8
G.
Average number of fledglings produced by pairs monitored throughout the breeding season (E/C) 3.2 n/a n/a 2.9 1.3 n/a
41% (39/94)
H. Number of nests that were discovered 59 7 14 13 17 2 112
I. Number of nests that were regularly monitored or 'tracked' 54 3 10 13 13 1 94
J. Number of 'tracked' nests that were successful (% = J/I x 100)
59% (32/54)
100% (3/3)
10% (1/10)
69% (9/13)
38% (5/13)
0% (0/1)
53% (50/94)
K.
Rate of missing eggs/chicks from nests (successful and unsuccessful nests) %=K/I x100) (b)
33% (18/54)
0% (0/3)
80% (8/10)
31% (4/13)
69% (9/13)
0% (0/1) n/a
L. Number of 'tracked' nests that were parasitized by cowbirds (% = L/I x 100)
11% (6/54) 0
10% (1/10)
8% (1/13)
0% (0/13)
100% (1/1)
10% (9/94)
M. A. Number of 'tracked' nests that failed as a result of reproductive failure
5% (3/54)
0% (0/3)
0% (0/10)
0% (0/13)
8% (1/13)
0% (0/1)
4% (4/94)
B. Number of 'tracked' nests that failed as a result of parasitism
5-7% (3 or 4/54)
0% (0/3)
10% (1/10)
0% (0/13)
0% (0/13)
100% (1/1)
5-6% (5 or 6/94)
C. Number of 'tracked' nests that failed as a result of predation – Predation Rate according to Vireo Working Group
28% (15/54)
0% (0/3)
80% (8/10)
31% (4/13)
54% (7/13)
0% (0/1)
36% (34/94)
N. Average clutch size n/a 3.3 3.7 3.3 3.5 3.0 n/a
O. Number of cowbird eggs found in or near vireo nests 9 0 1 1 0 1 12
P. Number of cowbird nestlings removed from 'tracked' nests 0 0 0 0 0 0 0
Q. Number of cowbird young fledged by vireo 2 0 1 0 2 2 7
R. Number of 'manipulated' parasitized nests 4 0 0 1 0 0 5
S. Number of 'successful, manipulated' nests (% = S/R x 100)
40% (2/5) n/a n/a
100% (1/1) n/a n/a
50% (3/6)
T. Number of vireo fledged from 'manipulated' parasitized nests 4 n/a n/a 3 n/a n/a 7
U. Number of repaired nests 2 0 0 1 0 0 3
V. % successful repaired nests 100% (2/2) n/a n/a
100% (1/1) n/a n/a
100% (3/3)
W. Number of vireo fledged from repaired nests 6 n/a n/a 4 n/a n/a 10

LBVI AND SWFL REPORT 2014 SANTA ANA WATERSHED ASSOCIATION APPENDIX C
C-20
Table C-3. Least Bell’s Vireo reproductive success and breeding biology data, monitored sites, in the Santa Ana River watershed, 2000-2014, BY MANAGED SITE
SAN TIMOTEO CANYON
Parameter 2000
-20
09
2010
2011
2012
2013
2014
Tota
ls
A. Number of pairs n/a 95 101 102 80 135 n/a B. Number of breeding (nesting) pairs 287 76 78 73 67 114 695
C.
Number of breeding pairs that were well-monitored throughout the breeding season 183 24 31 32 35 48 353
D. Number of 'known fledged young' OBSERVED 635 137 196 153 179 206 1,506
E.
Number of 'known fledged young' produced by pairs monitored throughout the breeding season 497 67 104 90 127 121 1,006
F.
Average number of fledglings produced per breeding pair (minimum; D/B = 'productivity or breeding success') 2.2 1.8 2.5 2.1 2.7 1.8 2.2
G.
Average number of fledglings produced by pairs monitored throughout the breeding season (E/C) 2.7 2.8 3.4 2.8 3.6 2.5 2.8
H. Number of nests that were discovered 388 55 80 47 80 94 744
I. Number of nests that were regularly monitored or 'tracked' 338 37 73 45 76 88 657
J. Number of 'tracked' nests that were successful (% = J/I x 100)
57% (192*/338)
62% (23/37)
60% (44/73)
64% (29/45)
57% (43/76)
48% (42/88)
57% (373/657)
K.
Rate of missing eggs/chicks from nests (successful and unsuccessful nests) %=K/I x100) (b)
44% (150*/338)
65% (24/37)
30% (22/73)
42% (19/45)
41% (31/76)
52% (46/88)
44% (292/657)
L. Number of 'tracked' nests that were parasitized by cowbirds (% = L/I x 100)
30% (103/338)
8% (3/37)
0% (0/73)
2% (1/45)
3% (2/76)
6% (5/88)
17% (114/657)
M. A. Number of 'tracked' nests that failed as a result of reproductive failure
2% (7/338)
11% (4/37)
8% (6/73)
0% (0/45)
5% (4/76)
6% (5/88)
4% (26/657)
B. Number of 'tracked' nests that failed as a result of parasitism
7% (25/338)
0% (0/37)
0% (0/73)
2% (1/45)
0% (0/76)
2% (2/88)
4% (28/657)
C. Number of 'tracked' nests that failed as a result of predation – Predation Rate according to Vireo Working Group
34% (114/338)
27% (10/37)
30% (22/73)
33% (15/45)
36% (27/76)
44% (39/88)
35% (227/657)
D. Number of ‘tracked’ nests that failed for unknown reasons n/a n/a
1% (1/73)
0% (0/45)
3% (2/76)
0% (0/88)
1% (3/282)
N. Average clutch size n/a 3.4 3.5 3.3 3.4 3.2 n/a
O. Number of cowbird eggs found in or near vireo nests 118 3 0 1 2 4 128
P. Number of cowbird nestlings removed from 'tracked' nests 6 0 0 0 0 1 7
Q. Number of cowbird young fledged by vireo 2 0 0 0 0 0 2
R. Number of 'manipulated' parasitized nests 84 3 0 0 2 4 93
S. Number of 'successful, manipulated' nests (% = S/R x 100)
49% (41/84)
100% (3/3) n/a n/a
50% (1/2)
50% (2/4)
51% (47/93)
T. Number of vireo fledged from 'manipulated' parasitized nests 88 8 n/a n/a 1 5 102
U. Number of repaired nests 3 1 2 1 1 0 8
V. % successful repaired nests 66.7% (2/3)
0% (0/1)
100% (2/2)
100% (1/1)
100% (1/1) n/a
75% (6/8)
W. Number of vireo fledged from repaired nests 5 0 7 2 4 n/a 18

LBVI AND SWFL REPORT 2014 SANTA ANA WATERSHED ASSOCIATION APPENDIX C
C-21
Table C-3. Least Bell’s Vireo reproductive success and breeding biology data, monitored sites, in the Santa Ana River watershed, 2000-2014, BY MANAGED SITE
MERIDIAN CONSERVATION AREA (former March SKR Preserve)
Parameter 2000
-20
09
2010
2011
2012
2013
2014
Tota
ls
A. Number of pairs n/a 12 9 7 12 16 n/a B. Number of breeding (nesting) pairs 30 8 5 6 9 16 74
C.
Number of breeding pairs that were well-monitored throughout the breeding season
9 (n=4 yrs) 3 0 0 0 1 13
D. Number of 'known fledged young' OBSERVED 75 25 7 8 16 23 154
E.
Number of 'known fledged young' produced by pairs monitored throughout the breeding season
38 (n=4 yrs) 19 0 n/a n/a 3 60*
F.
Average number of fledglings produced per breeding pair (minimum; D/B = 'productivity or breeding success') 2.5 3.1 1.4 1.3 1.8 1.4 2.1
G.
Average number of fledglings produced by pairs monitored throughout the breeding season (E/C) 4.2 6.3 n/a n/a n/a 3.0 4.6*
H. Number of nests that were discovered 17 6 n/a n/a n/a 3 26
I. Number of nests that were regularly monitored or 'tracked' 16 6 n/a n/a n/a 3 25
J. Number of 'tracked' nests that were successful (% = J/I x 100)
68.8% (11/16)
100% (6/6) n/a n/a n/a
33% (1/3)
72% (18/25)
K.
Rate of missing eggs/chicks from nests (successful and unsuccessful nests) %=K/I x100) (b)
37.5% (6/16)
0% (0/6) n/a n/a n/a
67% (2/3)
32% (8/25)
(n = 6yrs)
L.
Number of 'tracked' nests that were parasitized by cowbirds (% = L/I x 100)
0% (0/16)
0% (0/6) n/a n/a n/a
0% (0/3)
0% (0/25)
M.
A. Number of 'tracked' nests that failed as a result of reproductive failure
0.0% (0/16)
0% (0/6) n/a n/a n/a
0% (0/3)
0% (0/25)
B. Number of 'tracked' nests that failed as a result of parasitism
0.0% (0/16)
0% (0/6) n/a n/a n/a
0% (0/3)
0% (0/25)
C. Number of 'tracked' nests that failed as a result of predation – Predation Rate according to Vireo Working Group
31.2% (5/16)
0% (0/6) n/a n/a n/a
67% (2/3)
28% (7/25)
N. Average clutch size n/a 3.5 n/a n/a n/a 3.3 n/a
O. Number of cowbird eggs found in or near vireo nests 0 1 n/a n/a n/a 0 1
P. Number of cowbird nestlings removed from 'tracked' nests 0 0 n/a n/a n/a 0 0
Q. Number of cowbird young fledged by vireo 0 0 0 n/a n/a 0 0
R. Number of 'manipulated' parasitized nests 0 0 n/a n/a n/a 0 0
S. Number of 'successful, manipulated' nests (% = S/R x 100) n/a n/a n/a n/a n/a n/a n/a
T. Number of vireo fledged from 'manipulated' parasitized nests n/a n/a n/a n/a n/a n/a n/a
U. Number of repaired nests 0 0 n/a n/a n/a 0 0 V. % successful repaired nests n/a n/a n/a n/a n/a n/a n/a
W. Number of vireo fledged from repaired nests n/a n/a n/a n/a n/a n/a n/a
*Excludes 2011-2013 data

LBVI AND SWFL REPORT 2014 SANTA ANA WATERSHED ASSOCIATION APPENDIX C
C-22
Table C-3. Least Bell’s Vireo reproductive success and breeding biology data, monitored sites, in the Santa Ana River watershed, 2000-2014, BY MANAGED SITE
SYCAMORE CANYON
Parameter 2000
-20
09
2010
2011
2012
2013
2014
Tota
ls
A. Number of pairs n/a 8 5 7 n/a 5 n/a
B. Number of breeding (nesting) pairs 19 6 3 4 n/a 3 35
C.
Number of breeding pairs that were well-monitored throughout the breeding season 6 0 0 0 n/a 0 6
D. Number of 'known fledged young' OBSERVED 40 11 4 5 n/a 2 62
E.
Number of 'known fledged young' produced by pairs monitored throughout the breeding season 12 n/a 0 n/a n/a n/a 12
F.
Average number of fledglings produced per breeding pair (minimum; D/B = 'productivity or breeding success') 2.1 1.8 1.3 1.3 n/a 0.7 1.8
G.
Average number of fledglings produced by pairs monitored throughout the breeding season (E/C) 2.0 n/a n/a n/a n/a n/a 2.0
H. Number of nests that were discovered 10 0 0 n/a n/a 4 14
I. Number of nests that were regularly monitored or 'tracked' 9 n/a n/a n/a n/a 4 13
J. Number of 'tracked' nests that were successful (% = J/I x 100)
66.7% (6/9) n/a n/a n/a n/a
25% (1/4)
54% (7/13)
K.
Rate of missing eggs/chicks from nests (successful and unsuccessful nests) %=K/I x100) (b)
33.3% (3/9) n/a n/a n/a n/a
100% (4/4)
54% (7/13)
L. Number of 'tracked' nests that were parasitized by cowbirds (% = L/I x 100)
22.2% (2/9) n/a n/a n/a n/a
50% (2/4)
31% (4/13)
M. A. Number of 'tracked' nests that failed as a result of reproductive failure
0% (0/9) n/a n/a n/a n/a
0% (0/4)
0% (0/13)
B. Number of 'tracked' nests that failed as a result of parasitism
11.1% (1/9) n/a n/a n/a n/a
50% (2/4)
23% (3/13)
C. Number of 'tracked' nests that failed as a result of predation – Predation Rate according to Vireo Working Group
22.2% (2/9) n/a n/a n/a n/a
25% (1/4)
23% (3/13)
N. Average clutch size n/a n/a n/a n/a n/a 3.3 n/a
O. Number of cowbird eggs found in or near vireo nests 2 n/a n/a n/a n/a 3 5
P. Number of cowbird nestlings removed from 'tracked' nests 0 n/a n/a n/a n/a 0 0
Q. Number of cowbird young fledged by vireo 0 n/a 0 n/a n/a 0 0
R. Number of 'manipulated' parasitized nests 1 n/a n/a n/a n/a 1 2
S. Number of 'successful, manipulated' nests (% = S/R x 100)
100% (1/1) n/a n/a n/a n/a
0% (0/1)
50% (1/2)
T. Number of vireo fledged from 'manipulated' parasitized nests 1 n/a n/a n/a n/a 0 1
U. Number of repaired nests 0 n/a n/a n/a n/a 0 0
V. % successful repaired nests n/d n/a n/a n/a n/a n/a n/a
W. Number of vireo fledged from repaired nests n/d n/a n/a n/a n/a n/a n/a

LBVI AND SWFL REPORT 2014 SANTA ANA WATERSHED ASSOCIATION APPENDIX C
C-23
Table C-3. Least Bell’s Vireo reproductive success and breeding biology data, monitored sites, in the Santa Ana River watershed, 2000-2014, BY MANAGED SITE
MOCKINGBIRD CANYON
Parameter 2000
-20
09
2010
2011
2012
2013
2014
Tota
ls
A. Number of pairs n/a 34 32 26 24 7 n/a
B. Number of breeding (nesting) pairs 110 26 31 21 22 4 214
C.
Number of breeding pairs that were well-monitored throughout the breeding season 37 0 16 5 6 0 64
D. Number of 'known fledged young' OBSERVED 218 25 67 39 40 7 396
E.
Number of 'known fledged young' produced by pairs monitored throughout the breeding season 113 n/a 46 15 20 n/a 194
F.
Average number of fledglings produced per breeding pair (minimum; D/B = 'productivity or breeding success') 2.0 1.0 2.2 1.9 1.8 1.8 1.9
G.
Average number of fledglings produced by pairs monitored throughout the breeding season (E/C) 3.0 n/a 2.9 3 3.3 n/a 3
H. Number of nests that were discovered 99 3 31 19 20 3 175
I. Number of nests that were regularly monitored or 'tracked' 82 0 30 17 17 2 148
J. Number of 'tracked' nests that were successful (% = J/I x 100)
54.9% (45/82) n/a
50% (15/30)
47% (8/17)
59% (10/17)
50% (1/2)
53% (79/148)
K.
Rate of missing eggs/chicks from nests (successful and unsuccessful nests) %=K/I x100) (b)
37.8% (31/82) n/a
60% (18/30)
53% (9/17)
47% (8/17)
50% (1/2)
45% (67/148)
L. Number of 'tracked' nests that were parasitized by cowbirds (% = L/I x 100)
14.6% (12/82) n/a
0% (0/30)
6% (1/17)
18% (3/17)
0% (0/2)
11% (16/148)
M. A. Number of 'tracked' nests that failed as a result of reproductive failure
8.5% (7/82) n/a
3% (1/30)
6% (1/17)
6% (1/17)
0% (0/2)
7% (10/148)
B. Number of 'tracked' nests that failed as a result of parasitism
7.3% (6/82) n/a
0% (0/30)
0% (0/17)
0% (0/17)
0% (0/2)
4% (6/148)
C. Number of 'tracked' nests that failed as a result of predation – Predation Rate according to Vireo Working Group
29.3% (24/82) n/a
43% (13/30)
47% (8/17)
35% (6/17)
0% (0/2)
34% (51/148)
D. Number of ‘tracked’ nests that failed for unknown reasons n/a
3% (1/30) 0 0
50% (1/2)
6% (2/32)
N. Average clutch size n/a 3.0 3.6 3.5 2.9 3.0 n/a
O. Number of cowbird eggs found in or near vireo nests 2 1 0 1 3 0 27
P. Number of cowbird nestlings removed from 'tracked' nests 1 n/a 0 0 0 0 2
Q. Number of cowbird young fledged by vireo 10 n/a 0 0 0 0 1
R. Number of 'manipulated' parasitized nests
10% (1/10) n/a 0 1 2 0 13
S. Number of 'successful, manipulated' nests (% = S/R x 100) 2 n/a n/a
100% (1/1)
100% (2/2) n/a
13% (4/13)
T. Number of vireo fledged from 'manipulated' parasitized nests 1 n/a n/a 1 5 n/a 8
U. Number of repaired nests 100% (1/1) n/a 2 0 0 0 3
V. % successful repaired nests 1 n/a 100% (2/2) n/a n/a n/a
100% (3/3)
W. Number of vireo fledged from repaired nests n/a 6 n/a n/a n/a 7

LBVI AND SWFL REPORT 2014 SANTA ANA WATERSHED ASSOCIATION APPENDIX C
C-24
Table C-3. Least Bell’s Vireo reproductive success and breeding biology data, monitored sites, in the Santa Ana River watershed, 2000-2014, BY MANAGED SITE
SANTA ANA RIVER - RIVERSIDE (Riverside Ave to Van Buren Blvd)
Parameter 2000
-20
09
2010
2011
2012
2013
2014
Tota
ls
A. Number of pairs n/a 50 23 11 n/a 19 n/a B. Number of breeding (nesting) pairs 149 39 19 7 n/a 10 224
C.
Number of breeding pairs that were well-monitored throughout the breeding season
51 (n=5 yrs) 9 7 0 0 5 72
D. Number of 'known fledged young' OBSERVED 283 58 30 7 7 15 400
E.
Number of 'known fledged young' produced by pairs monitored throughout the breeding season
133 (n=5 yrs) 18 22 n/a N/a 6 179
F.
Average number of fledglings produced per breeding pair (minimum; D/B = 'productivity or breeding success') 1.9 1.5 1.6 n/a N/a 1.5 1.8
G.
Average number of fledglings produced by pairs monitored throughout the breeding season (E/C)
2.6 (n=5 yrs) 2.0 3.1 n/a n/a 1.2 2.5
H. Number of nests that were discovered 94 13 14 2 0 6 129
I. Number of nests that were regularly monitored or 'tracked' 75 11 10 0 0 3 99
J. Number of 'tracked' nests that were successful (% = J/I x 100)
68.0% (51/75)
55% (6/11)
60% (6/10) n/a n/a
67% (2/3)
66% (65/99)
K.
Rate of missing eggs/chicks from nests (successful and unsuccessful nests) %=K/I x100) (b)
32.0% (24/75)
36% (4/11)
30% (3/10) n/a n/a
67% (2/3)
33% (33/99)
L. Number of 'tracked' nests that were parasitized by cowbirds (% = L/I x 100)
16.0% (12/75) 0
10% (1/10) n/a/ n/a
0% (0/3)
13% (13/99)
M. A. Number of 'tracked' nests that failed as a result of reproductive failure
2.7% (2/75)
9% (1/11)
0% (0/10) n/a n/a
0% (0/3)
3% (3/99)
B. Number of 'tracked' nests that failed as a result of parasitism
8.0% (6/75)
0% (0/11)
10% (1/10) n/a n/a
0% (0/3)
7% (7/99)
C. Number of 'tracked' nests that failed as a result of predation – Predation Rate according to Vireo Working Group
21.3% (16/75)
36% (4/11)
30% (3/10) n/a n/a
33% (1/3)
24% (24/99)
N. Average clutch size n/a 3.2 3.5 3.0 n/a 3.5 n/a
O. Number of cowbird eggs found in or near vireo nests 15 0 2 1 n/a 0 18
P. Number of cowbird nestlings removed from 'tracked' nests 0 0 0 n/a n/a 0 0
Q. Number of cowbird young fledged by vireo 1 1 0 n/a n/a 0 2
R. Number of 'manipulated' parasitized nests 10 0 1 0 n/a 0 11
S.
Number of 'successful, manipulated' nests (% = S/R x 100)
20.0% (2/10) n/a Unknown n/a n/a n/a
20% (2/11)
T. Number of vireo fledged from 'manipulated' parasitized nests 5 n/a Unknown n/a n/a n/a 5
U. Number of repaired nests 1 0 0 0 n/a 0 1 V. % successful repaired nests n/d n/a n/a n/a n/a n/a n/a
W. Number of vireo fledged from repaired nests n/d n/a n/a n/a n/a n/a n/a

LBVI AND SWFL REPORT 2014 SANTA ANA WATERSHED ASSOCIATION APPENDIX C
C-25
Table C-3. Least Bell’s Vireo reproductive success and breeding biology data, monitored sites, in the Santa Ana River watershed, 2000-2014, BY MANAGED SITE
HIDDEN VALLEY (south side of river)
Parameter 2000
-20
09
2010
2011
2012
2013
2014
Tota
ls
A. Number of pairs n/a 43 36 37 42 32 n/a B. Number of breeding (nesting) pairs 212 36 33 31 37 25 374
C.
Number of breeding pairs that were well-monitored throughout the breeding season 56 9 5 4 8 0 82
D. Number of 'known fledged young' OBSERVED 407 53 41 45 66 28 640
E.
Number of 'known fledged young' produced by pairs monitored throughout the breeding season 142 19 17 11 21 n/a 210
F.
Average number of fledglings produced per breeding pair (minimum; D/B = 'productivity or breeding success') 1.9 1.5 1.2 1.5 1.8 1.1 1.7
G.
Average number of fledglings produced by pairs monitored throughout the breeding season (E/C) 2.5 2.1 3.4 2.8 2.6 n/a 2.6
H. Number of nests that were discovered 114 18 11 8 10 4 165
I. Number of nests that were regularly monitored or 'tracked' 85 17 10 8 8 3 131
J. Number of 'tracked' nests that were successful (% = J/I x 100)
68% (58/85)
41% (7/17)
60% (6/10)
63% (5/8)
88% (7/8)
67% (2/3)
65% (85/131)
K.
Rate of missing eggs/chicks from nests (successful and unsuccessful nests) %=K/I x100) (b)
36% (31/85)
65% (11/17)
30% (3/10)
0% (0/8)
25% (2/8)
67% (2/3)
40% (53/131)
L. Number of 'tracked' nests that were parasitized by cowbirds (% = L/I x 100)
7% (6/85)
6% (1/17)
20% (2/10)
0% (0/8)
0% (0/8)
0% (0/3)
7% (9/131)
M. A. Number of 'tracked' nests that failed as a result of reproductive failure
4% (3/85)
0% (0/17)
0% (0/10)
0% (0/8)
0% (0/8)
0% (0/3)
2% (3/131)
B. Number of 'tracked' nests that failed as a result of parasitism
5% (4/85)
6% (1/17)
10% (1/10)
0% (0/8)
0% (0/8)
0% (0/3)
5% (6/131)
C. Number of 'tracked' nests that failed as a result of predation – Predation Rate according to Vireo Working Group
24% (20/85)
53% (9/17)
30% (3/10)
38% (3/8)
13% (1/13)
33% (1/3)
26% (37/131)
N. Average clutch size n/a 3.4 3.1 3.2 3.3 3.0 N/A
O. Number of cowbird eggs found in or near vireo nests 4 2 2 0 0 0 8
P. Number of cowbird nestlings removed from 'tracked' nests 2 0 0 0 0 0 2
Q. Number of cowbird young fledged by vireo 0 0 0 0 0 0 0
R. Number of 'manipulated' parasitized nests 2 0 1 0 0 0 3
S. Number of 'successful, manipulated' nests (% = S/R x 100)
100% (2/2) n/a
100% (1/1) n/a n/a n/a
100% (3/3)
T. Number of vireo fledged from 'manipulated' parasitized nests 6 n/a 2 n/a n/a n/a 8
U. Number of repaired nests 0 0 0 0 0 0 0
V. % successful repaired nests n/d n/a n/a n/a n/a n/a n/a
W. Number of vireo fledged from repaired nests n/d n/a n/a n/a n/a n/a n/a

LBVI AND SWFL REPORT 2014 SANTA ANA WATERSHED ASSOCIATION APPENDIX C
C-26
Table C-3. Least Bell’s Vireo reproductive success and breeding biology data, monitored sites, in the Santa Ana River watershed, 2000-2014, BY MANAGED SITE
HIDDEN VALLEY (north side of river)
Parameter 2000
-20
09
2010
2011
2012
2013
2014
Tota
ls
A. Number of pairs n/a 12 2 3 2 14 n/a
B. Number of breeding (nesting) pairs n/a 9 2 2 2 10 25
C.
Number of breeding pairs that were well-monitored throughout the breeding season n/a 6 0 0 0 4 10
D. Number of 'known fledged young' OBSERVED n/a 18 2 1 3 19 43
E.
Number of 'known fledged young' produced by pairs monitored throughout the breeding season n/a 14 0 n/a n/a 8 22
F.
Average number of fledglings produced per breeding pair (minimum; D/B = 'productivity or breeding success') n/a 2.0 1.0 n/a 1.5 1.9 1.7
G.
Average number of fledglings produced by pairs monitored throughout the breeding season (E/C) n/a 2.3 0 n/a n/a 2.0 2.2
H. Number of nests that were discovered n/a 10 2 0 n/a 4 16
I. Number of nests that were regularly monitored or 'tracked' n/a 9 0 0 n/a 3 12
J. Number of 'tracked' nests that were successful (% = J/I x 100) n/a
56% (5/9) n/a n/a n/a
67% (2/3)
58% (7/12)
K.
Rate of missing eggs/chicks from nests (successful and unsuccessful nests) %=K/I x100) (b) n/a
11% (1/9) n/a n/a n/a
33% (1/3)
17% (2/12)
L. Number of 'tracked' nests that were parasitized by cowbirds (% = L/I x 100) n/a
33% (3/9) n/a n/a n/a
0% (0/3)
25% (3/12)
M. A. Number of 'tracked' nests that failed as a result of reproductive failure n/a
0% (0/9) n/a n/a n/a
0% (0/3)
0% (0/12)
B. Number of 'tracked' nests that failed as a result of parasitism n/a
33% (3/9) n/a n/a n/a
0% (0/3)
25% (3/12)
C. Number of 'tracked' nests that failed as a result of predation – Predation Rate according to Vireo Working Group n/a
11% (1/9) n/a n/a n/a
33% (1/3)
17% (2/12)
N. Average clutch size n/a
3.5 n/a n/a n/a 4.0 3.5
O. Number of cowbird eggs found in or near vireo nests n/a 4 n/a n/a n/a 0 4
P. Number of cowbird nestlings removed from 'tracked' nests n/a 0 n/a n/a n/a 0 0
Q. Number of cowbird young fledged by vireo n/a 0 0 n/a n/a 0 0
R. Number of 'manipulated' parasitized nests n/a 2 n/a
0 n/a 0 2
S. Number of 'successful, manipulated' nests (% = S/R x 100) n/a
0% (0/2) n/a n/a n/a n/a 0%
T. Number of vireo fledged from 'manipulated' parasitized nests n/a
0% (0/2) n/a n/a n/a n/a 0%
U. Number of repaired nests n/a 0 n/a 0 n/a 0 0
V. % successful repaired nests n/a n/a n/a n/a n/a n/a n/a
W. Number of vireo fledged from repaired nests n/a n/a n/a n/a n/a n/a n/a

LBVI AND SWFL REPORT 2014 SANTA ANA WATERSHED ASSOCIATION APPENDIX C
C-27
Table C-3. Least Bell’s Vireo reproductive success and breeding biology data, monitored sites, in the Santa Ana River watershed, 2000-2014, BY MANAGED SITE
SANTA ANA RIVER - NORCO (Goose Creek Golf Course to River Rd)
Parameter 2000
-20
09
2010
2011
2012
2013
2014
Tota
ls
A. Number of pairs n/a 64 59 51 52 32 n/a
B. Number of breeding (nesting) pairs 224 60 56 48 50 28 466
C.
Number of breeding pairs that were well-monitored throughout the breeding season 105 12 12 8 20 0 157
D. Number of 'known fledged young' OBSERVED 489 113 91 86 109 36 924
E.
Number of 'known fledged young' produced by pairs monitored throughout the breeding season 315 39 36 29 68 n/a 487
F.
Average number of fledglings produced per breeding pair (minimum; D/B = 'productivity or breeding success') 2.23 1.9 1.6 1.8 2.2 1.3 2.0
G.
Average number of fledglings produced by pairs monitored throughout the breeding season (E/C) 3.0 3.3 3.0 3.6 3.4 n/a 3.1
H. Number of nests that were discovered 212 22 25 19 31 13 322
I. Number of nests that were regularly monitored or 'tracked' 177 18 22 17 29 9 272
J. Number of 'tracked' nests that were successful (% = J/I x 100)
65.0% (115/177)
89% (16/18)
45% (10/22)
71% (12/17
)
83% (24/29)
44% (4/9)
67% (181/272)
K.
Rate of missing eggs/chicks from nests (successful and unsuccessful nests) %=K/I x100) (b)
41.2% (73/177)
28% (5/18)
45% (10/22)
0% (0/17)
26% (8/29)
56% (5/9)
37% (101/272)
L. Number of 'tracked' nests that were parasitized by cowbirds (% = L/I x 100)
8.5% (15/177)
0% (0/18)
0% (0/22)
0% (0/17)
7% (2/29)
0% (0/9)
6% (17/272)
M. A. Number of 'tracked' nests that failed as a result of reproductive failure
3.4% (6/177)
0% (0/18)
14% (3/22)
12% (2/17)
0% (0/29)
0% (0/9)
4% (11/272)
B. Number of 'tracked' nests that failed as a result of parasitism
2.3% (4/177)
0% (0/18)
0% (0/22)
0% (0/17)
0% (0/29)
0% (0/9)
1% (4/272)
C. Number of 'tracked' nests that failed as a result of predation – Predation Rate according to Vireo Working Group
28.8% (51/177)
11% (2/18)
41% (9/22)
18% (3/17)
14% (4/29)
56% (5/9)
27% (74/272)
D. Number of "tracked" nests that failed for Other/Unknown Reasons
1% (1/177)
0% (0/18)
0% (0/22)
0% (0/17)
3% (1/29)
0% (0/9)
1% (2/272)
N. Average clutch size n/a 3.7 3.8 3.6 3.7 3.3 n/a
O. Number of cowbird eggs found in or near vireo nests 20 0 0 0 2 0 22
P. Number of cowbird nestlings removed from 'tracked' nests 1 0 0 0 0 0 1
Q. Number of cowbird young fledged by vireo 0 0 0 0 0 0 0
R. Number of 'manipulated' parasitized nests 14 0 0 0 2 0 16
S. Number of 'successful, manipulated' nests (% = S/R x 100)
64.3% (9/14) n/a n/a n/a
100% (2/2) n/a
69% (11/16)
T. Number of vireo fledged from 'manipulated' parasitized nests 13 n/a n/a n/a 5 n/a 18
U. Number of repaired nests 2 0 0 0 0 0 2
V. % successful repaired nests 50% (1/2) n/a n/a n/a n/a n/a 50%
(1/2)
W. Number of vireo fledged from repaired nests n/a n/a n/a n/a n/a n/a n/a

LBVI AND SWFL REPORT 2014 SANTA ANA WATERSHED ASSOCIATION APPENDIX C
C-28
Table C-3. Least Bell’s Vireo reproductive success and breeding biology data, monitored sites, in the Santa Ana River watershed, 2000-2014, BY MANAGED SITE
TEMESCAL CANYON
Parameter 2000
-20
09
2010
2011
2012
2013
2014
Tota
ls
A. Number of pairs n/a 49 65 63 50 24 n/a
B. Number of breeding (nesting) pairs 146 38 57 48 42 n/a 331
C.
Number of breeding pairs that were well-monitored throughout the breeding season 81 11 18 8 0 n/a 118
D. Number of 'known fledged young' OBSERVED 339 73 113 71 48 17 661
E.
Number of 'known fledged young' produced by pairs monitored throughout the breeding season 217 34 52 24 0 n/a 327
F.
Average number of fledglings produced per breeding pair (minimum; D/B = 'productivity or breeding success') 2.3 1.9 2.0 1.5 1.1 n/a 2.0
G.
Average number of fledglings produced by pairs monitored throughout the breeding season (E/C) 2.7 3.1 2.9 3.0 0 n/a 2.8
H. Number of nests that were discovered 166 22 35 16 3 3 245
I. Number of nests that were regularly monitored or 'tracked' 133 15 32 12 0 0 192
J. Number of 'tracked' nests that were successful (% = J/I x 100)
62% (82/133)
87% (13/15)
69% (22/32)
58% (7/12) n/a n/a
65% (124/192)
K.
Rate of missing eggs/chicks from nests (successful and unsuccessful nests) %=K/I x100) (b)
39% (52/133)
20% (3/15)
34% (11/32)
0% (0/12) n/a n/a
34% (66/192)
L. Number of 'tracked' nests that were parasitized by cowbirds (% = L/I x 100)
20% (27/133)
0% (0/15)
3% (1/32)
25% (3/12) n/a n/a
16% (31/192)
M. A. Number of 'tracked' nests that failed as a result of reproductive failure
3.8% (5/133) 0/15
0% (0/32)
0% (0/12) n/a n/a
3% (5/192)
B. Number of 'tracked' nests that failed as a result of parasitism
3.0% (4/133) 0/15
0% (0/32)
17% (2/12) n/a n/a
3% (6/192)
C. Number of 'tracked' nests that failed as a result of predation – Predation Rate according to Vireo Working Group
32% (42/133)
13% (2/15)
31% (10/32)
25% (3/12) n/a n/a
30% (57/192)
N. Average clutch size n/a 3.7 3.5 3.5 3.7 n/a n/a
O. Number of cowbird eggs found in or near vireo nests 33 0 1 5 0 n/a 39
P. Number of cowbird nestlings removed from 'tracked' nests 2 0 0 0 0 n/a 2
Q. Number of cowbird young fledged by vireo 2 0 0 0 0 n/a 2
R. Number of 'manipulated' parasitized nests 29 0 1 2 0 n/a 32
S.
Number of 'successful, manipulated' nests (% = S/R x 100)
41% (12/29) 0
100% (1/1)
100% (2/2) n/a n/a
47% (15/32)
T. Number of vireo fledged from 'manipulated' parasitized nests 26 na 2 6 n/a n/a 34
U. Number of repaired nests 0 0 3 0 0 n/a 3
V. % successful repaired nests n/d na 67% (2/3) n/a n/a n/a
67% (2/3)
W. Number of vireo fledged from repaired nests n/d na 3 n/a n/a n/a 3

LBVI AND SWFL REPORT 2014 SANTA ANA WATERSHED ASSOCIATION APPENDIX C
C-29
Table C-3. Least Bell’s Vireo reproductive success and breeding biology data, monitored sites, in the Santa Ana River watershed, 2000-2014, BY MANAGED SITE
SANTA ANA CANYON – UPPER CANYON BELOW PRADO DAM
Parameter 2000
-20
09
2010
2011
2012
2013
2014
Tota
ls
A. Number of pairs n/a 4 5 4 14 18 n/a
B. Number of breeding (nesting) pairs 110 3 5 4 12 16 150
C.
Number of breeding pairs that were well-monitored throughout the breeding season 46 0 0 1 4 4 55
D. Number of 'known fledged young' OBSERVED 208 6 5 6 23 28 276
E.
Number of 'known fledged young' produced by pairs monitored throughout the breeding season 118 n/a n/a 3 12 12 145
F.
Average number of fledglings produced per breeding pair (minimum; D/B = 'productivity or breeding success') 1.9 2.0 1.0 1.5 1.9 1.8 1.8
G.
Average number of fledglings produced by pairs monitored throughout the breeding season (E/C) 2.6 n/a n/a 3.0 3.0 3.0 2.6
H. Number of nests that were discovered 97 2 2 2 6 8 117
I. Number of nests that were regularly monitored or 'tracked' 64 1 0 1 5 6 77
J. Number of 'tracked' nests that were successful (% = J/I x 100)
64% (41/64)
100% (1/1) n/a
100% (1/1)
80% (4/5)
83% (5/6)
68% (52/77)
K.
Rate of missing eggs/chicks from nests (successful and unsuccessful nests) %=K/I x100) (b)
41% (26/64)
0% (0/1) n/a
0% (0/1)
40% (2/5)
33% (2/6)
39% (30/77)
L. Number of 'tracked' nests that were parasitized by cowbirds (% = L/I x 100)
6.3% (4/64)
0% (0/1) n/a
0% (0/1)
0% (0/5)
0% (0/6)
5% (4/77)
M. A. Number of 'tracked' nests that failed as a result of reproductive failure
4.7% (3/64)
0% (0/1) n/a
0% (0/1)
0% (0/5)
0% (0/6)
4% (3/77)
B. Number of 'tracked' nests that failed as a result of parasitism
3.1% (2/64)
0% (0/1) n/a
0% (0/1)
0% (0/5)
0% (0/6)
3% (2/77)
C. Number of 'tracked' nests that failed as a result of predation – Predation Rate according to Vireo Working Group
28% (18/64)
0% (0/1) n/a
0% (0/1)
20% (1/5)
17% (1/6)
26% (20/77)
N. Average clutch size n/a 4.0 4.0 3.0 3.5 3.2 n/a
O. Number of cowbird eggs found in or near vireo nests 3 0 0 0 0 0 3
P. Number of cowbird nestlings removed from 'tracked' nests 1 0 n/a 0 0 0 1
Q. Number of cowbird young fledged by vireo 0 0 0 0 0 0 0
R. Number of 'manipulated' parasitized nests 1 0 0 0 0 0 1
S. Number of 'successful, manipulated' nests (% = S/R x 100)
100% (1/1) n/a n/a n/a n/a n/a
100% (1/1)
T. Number of vireo fledged from ‘manipulated’ parasitized nests 1 n/a n/a n/a n/a n/a 1
U. Number of repaired nests 2 0 0 0 0 0 2
V. % successful repaired nests 0%
(0/2) n/a n/a n/a n/a n/a 0%
(0/2)
W. Number of vireo fledged from repaired nests 0 n/a n/a n/a n/a n/a 0
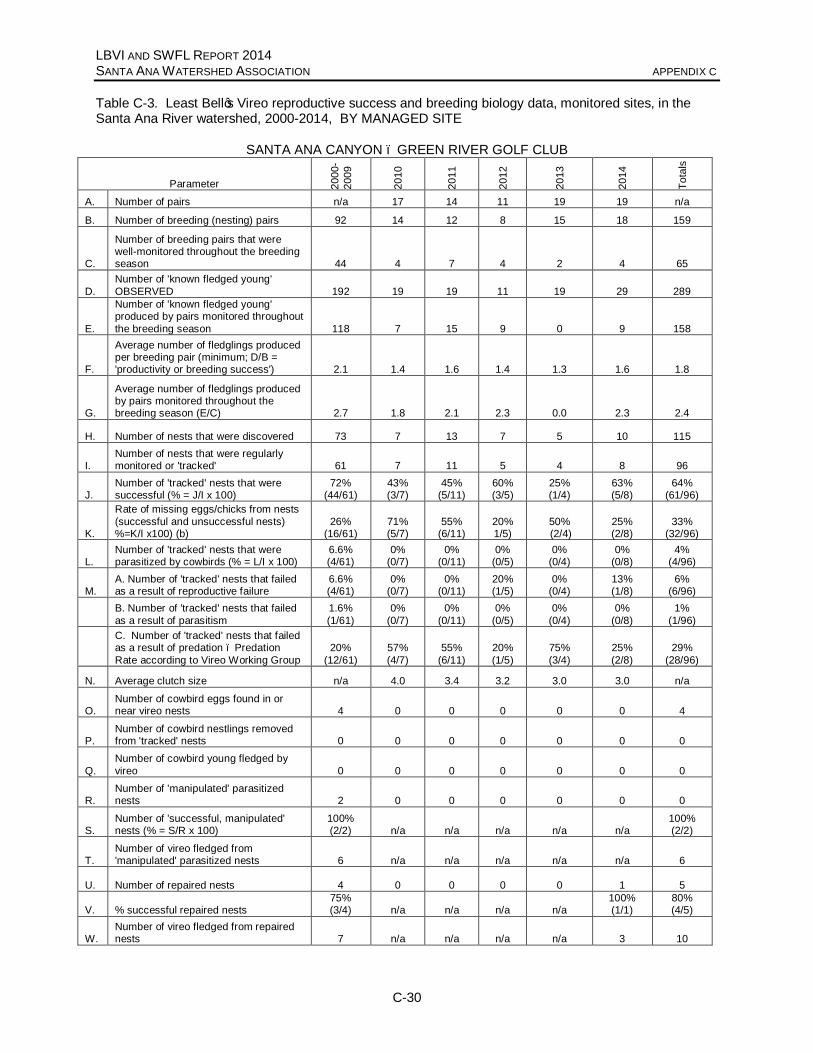
LBVI AND SWFL REPORT 2014 SANTA ANA WATERSHED ASSOCIATION APPENDIX C
C-30
Table C-3. Least Bell’s Vireo reproductive success and breeding biology data, monitored sites, in the Santa Ana River watershed, 2000-2014, BY MANAGED SITE
SANTA ANA CANYON – GREEN RIVER GOLF CLUB
Parameter 2000
-20
09
2010
2011
2012
2013
2014
Tota
ls
A. Number of pairs n/a 17 14 11 19 19 n/a
B. Number of breeding (nesting) pairs 92 14 12 8 15 18 159
C.
Number of breeding pairs that were well-monitored throughout the breeding season 44 4 7 4 2 4 65
D. Number of 'known fledged young' OBSERVED 192 19 19 11 19 29 289
E.
Number of 'known fledged young' produced by pairs monitored throughout the breeding season 118 7 15 9 0 9 158
F.
Average number of fledglings produced per breeding pair (minimum; D/B = 'productivity or breeding success') 2.1 1.4 1.6 1.4 1.3 1.6 1.8
G.
Average number of fledglings produced by pairs monitored throughout the breeding season (E/C) 2.7 1.8 2.1 2.3 0.0 2.3 2.4
H. Number of nests that were discovered 73 7 13 7 5 10 115
I. Number of nests that were regularly monitored or 'tracked' 61 7 11 5 4 8 96
J. Number of 'tracked' nests that were successful (% = J/I x 100)
72% (44/61)
43% (3/7)
45% (5/11)
60% (3/5)
25% (1/4)
63% (5/8)
64% (61/96)
K.
Rate of missing eggs/chicks from nests (successful and unsuccessful nests) %=K/I x100) (b)
26% (16/61)
71% (5/7)
55% (6/11)
20% 1/5)
50% (2/4)
25% (2/8)
33% (32/96)
L. Number of 'tracked' nests that were parasitized by cowbirds (% = L/I x 100)
6.6% (4/61)
0% (0/7)
0% (0/11)
0% (0/5)
0% (0/4)
0% (0/8)
4% (4/96)
M. A. Number of 'tracked' nests that failed as a result of reproductive failure
6.6% (4/61)
0% (0/7)
0% (0/11)
20% (1/5)
0% (0/4)
13% (1/8)
6% (6/96)
B. Number of 'tracked' nests that failed as a result of parasitism
1.6% (1/61)
0% (0/7)
0% (0/11)
0% (0/5)
0% (0/4)
0% (0/8)
1% (1/96)
C. Number of 'tracked' nests that failed as a result of predation – Predation Rate according to Vireo Working Group
20% (12/61)
57% (4/7)
55% (6/11)
20% (1/5)
75% (3/4)
25% (2/8)
29% (28/96)
N. Average clutch size n/a 4.0 3.4 3.2 3.0 3.0 n/a
O. Number of cowbird eggs found in or near vireo nests 4 0 0 0 0 0 4
P. Number of cowbird nestlings removed from 'tracked' nests 0 0 0 0 0 0 0
Q. Number of cowbird young fledged by vireo 0 0 0 0 0 0 0
R. Number of 'manipulated' parasitized nests 2 0 0 0 0 0 0
S. Number of 'successful, manipulated' nests (% = S/R x 100)
100% (2/2) n/a n/a n/a n/a n/a
100% (2/2)
T. Number of vireo fledged from 'manipulated' parasitized nests 6 n/a n/a n/a n/a n/a 6
U. Number of repaired nests 4 0 0 0 0 1 5
V. % successful repaired nests 75% (3/4) n/a n/a n/a n/a
100% (1/1)
80% (4/5)
W. Number of vireo fledged from repaired nests 7 n/a n/a n/a n/a 3 10

LBVI AND SWFL REPORT 2014 SANTA ANA WATERSHED ASSOCIATION APPENDIX C
C-31
Table C-3. Least Bell’s Vireo reproductive success and breeding biology data, monitored sites, in the Santa Ana River watershed, 2000-2014, BY MANAGED SITE
SANTA ANA RIVER – FEATHERLY REGIONAL PARK
Parameter 2000
-20
09
2010
2011
2012
2013
2014
Tota
ls
A. Number of pairs n/a 23 19 16 45 39 n/a
B. Number of breeding (nesting) pairs 109 18 18 11 37 34 227
C.
Number of breeding pairs that were well-monitored throughout the breeding season 36 3 7 2 10 10 68
D. Number of 'known fledged young' OBSERVED 175 22 23 12 55 35 322
E.
Number of 'known fledged young' produced by pairs monitored throughout the breeding season 73 6 14 0 17 11 121
F.
Average number of fledglings produced per breeding pair (minimum; D/B = 'productivity or breeding success') 1.6 1.2 1.3 1.1 1.5 1.0 1.4
G.
Average number of fledglings produced by pairs monitored throughout the breeding season (E/C) 2.0 2.0 2.0 0 1.7 1.1 1.8
H. Number of nests that were discovered 83 11 12 8 23 18 155
I. Number of nests that were regularly monitored or 'tracked' 65 7 5 4 14 14 109
J. Number of 'tracked' nests that were successful (% = J/I x 100)
49% (32/65)
29% (2/7)
100% (5/5)
0% (0/4)
50% (7/14)
29% (4/14)
46% (50/109)
K.
Rate of missing eggs/chicks from nests (successful and unsuccessful nests) %=K/I x100) (b)
48% (31/65)
71% (5/7)
20% (1/5)
100% (4/4)
50% (7/14)
64% (9/14)
52% (57/109)
L. Number of 'tracked' nests that were parasitized by cowbirds (% = L/I x 100)
7.7% (5/65)
0% (07)
0% (0/5)
0% (0/4)
0% (0/14)
0% (0/14)
5% (5/109)
M. A. Number of 'tracked' nests that failed as a result of reproductive failure
4.7% (3/65)
0% (0/7)
0% (0/5)
0% (0/4)
7% (1/14)
7% (1/14)
5% (5/109)
B. Number of 'tracked' nests that failed as a result of parasitism
3.1% (2/65)
0% (0/7)
0% (0/5)
0% (0/4)
0% (0/14)
0% (0/14)
2% (2/109)
C. Number of 'tracked' nests that failed as a result of predation – Predation Rate according to Vireo Working Group
43% (28/65)
71% (5/7)
0% (0/5)
100% (4/4)
43% (6/14)
64% (9/14)
48% (52/109)
N. Average clutch size n/a 4.0 3.6 4.0 3.4 3.1 n/a
O. Number of cowbird eggs found in or near vireo nests 4 0 0 0 0 0 4
P. Number of cowbird nestlings removed from 'tracked' nests 1 0 0 0 0 0 1
Q. Number of cowbird young fledged by vireo 0 0 0 0 0 0 0
R. Number of 'manipulated' parasitized nests 3 0 0 0 0 0 3
S. Number of 'successful, manipulated' nests (% = S/R x 100)
33% (1/3) n/a n/a n/a n/a n/a
33% (1/3)
T. Number of vireo fledged from 'manipulated' parasitized nests 2 n/a n/a n/a n/a n/a 2
U. Number of repaired nests 4 1 0 0 0 2 7
V. % successful repaired nests 100% (4/4)
100% (1/1) n/a n/a n/a
50% (1/2)
86% (6/7)
W. Number of vireo fledged from repaired nests 14 2 n/a n/a n/a 2 18

LBVI AND SWFL REPORT 2014 SANTA ANA WATERSHED ASSOCIATION APPENDIX C
C-32
Table C-3. Least Bell’s Vireo reproductive success and breeding biology data, monitored sites, in the Santa Ana River watershed, 2000-2014, BY MANAGED SITE
CHINO HILLS (Butterfield Ranch environs)
Parameter 2000
-20
09
2010
2011
2012
2013
2014
Tota
ls
A. Number of pairs n/a 7 3 2 5 2 n/a
B. Number of breeding (nesting) pairs 37 4 1 2 4 n/a 48
C.
Number of breeding pairs that were well-monitored throughout the breeding season
15 (n=4 yrs) 3 0 1 1 n/a
20 (n=7 yrs)
D. Number of 'known fledged young' OBSERVED 54 7 1 1 7 3 73
E.
Number of 'known fledged young' produced by pairs monitored throughout the breeding season
19 (n=4 yrs) 5 n/a 0 4 n/a
28 (n=7 yrs)
F.
Average number of fledglings produced per breeding pair (minimum; D/B = 'productivity or breeding success') 1.5 1.8 n/a 0.5 1.8 n/a 1.5
G.
Average number of fledglings produced by pairs monitored throughout the breeding season (E/C)
1.3 (n=4 yrs) 1.7 n/a 0 4.0 n/a 1.4
H. Number of nests that were discovered 24 3 0 1 1 n/a 29
I. Number of nests that were regularly monitored or 'tracked' 19 3 n/a 1 1 n/a 24
J. Number of 'tracked' nests that were successful (% = J/I x 100)
32% (6/19)
67% (2/3) n/a
0% (0/1)
100% (1/1) n/a
38% (9/24)
K.
Rate of missing eggs/chicks from nests (successful and unsuccessful nests) %=K/I x100) (b)
63% (12/19)
33% (1/3) n/a
100% (1/1)
0% (0/1) n/a
65% (15/23)
L. Number of 'tracked' nests that were parasitized by cowbirds (% = L/I x 100)
32% (6/19)
0% (0/3) n/a
0% (0/1)
0% (0/1) n/a
25% (6/24)
M. A. Number of 'tracked' nests that failed as a result of reproductive failure
5.3% (1/19)
0% (0/3) n/a
0% (0/1)
0% (0/1) n/a
4% (1/24)
B. Number of 'tracked' nests that failed as a result of parasitism
10.5% (2/19)
0% (0/3) n/a
0% (0/1)
0% (0/1) n/a
8% (2/24)
C. Number of 'tracked' nests that failed as a result of predation – Predation Rate according to Vireo Working Group
53% (10/19)
33% (1/3) n/a
100% (1/1)
0% (0/1) n/a
50% (12/24)
N. Average clutch size n/a 3.7 n/a 3.0 4.0 n/a n/a
O. Number of cowbird eggs found in or near vireo nests 9 0 n/a 0 0 n/a 9
P. Number of cowbird nestlings removed from 'tracked' nests 0 0 n/a 0 0 n/a 0
Q. Number of cowbird young fledged by vireo 0 0 n/a 0 0 n/a 0
R. Number of 'manipulated' parasitized nests 6 0 n/a 0 0 n/a 6
S. Number of 'successful, manipulated' nests (% = S/R x 100)
0% (0/6) n/a n/a n/a n/a n/a
0% (0/6)
T. Number of vireo fledged from 'manipulated' parasitized nests 0 n/a n/a n/a n/a n/a 0
U. Number of repaired nests 0 0 n/a 0 0 n/a 0
V. % successful repaired nests n/d n/a n/a n/a n/a n/a n/a
W. Number of vireo fledged from repaired nests n/d n/a n/a n/a n/a n/a n/a

LBVI AND SWFL REPORT 2014 SANTA ANA WATERSHED ASSOCIATION APPENDIX C
C-33
Table C-3. Least Bell’s Vireo reproductive success and breeding biology data, monitored sites, in the Santa Ana River watershed, 2000-2014, BY MANAGED SITE
IRVINE REGIONAL PARK
Parameter 2000
-10
09
2010
2011
2012
2013
2014
Tota
ls
A. Number of pairs n/a 14 9 5 n/a 9 n/a
B. Number of breeding (nesting) pairs n/a 9 5 5 n/a 8 27
C.
Number of breeding pairs that were well-monitored throughout the breeding season n/a 3 1 0 n/a 5 9
D. Number of 'known fledged young' OBSERVED n/a 18 7 5 n/a 12 42
E.
Number of 'known fledged young' produced by pairs monitored throughout the breeding season n/a 11 2 n/a n/a 8 21
F.
Average number of fledglings produced per breeding pair (minimum; D/B = 'productivity or breeding success') n/a 2.0 1.4 n/a n/a 1.5 1.6
G.
Average number of fledglings produced by pairs monitored throughout the breeding season (E/C) n/a 3.6 2.0 n/a n/a 1.6 2.3
H. Number of nests that were discovered n/a 5 1 n/a n/a 6 12
I. Number of nests that were regularly monitored or 'tracked' n/a 4 1 n/a n/a 5 10
J. Number of 'tracked' nests that were successful (% = J/I x 100) n/a
75% (3/4)
100% (1/1) n/a n/a
60% (3/5)
70% (7/10)
K.
Rate of missing eggs/chicks from nests (successful and unsuccessful nests) %=K/I x100) (b) n/a
25% (1/4) n/a n/a n/a
80% (4/5)
56% (5/9)
L. Number of 'tracked' nests that were parasitized by cowbirds (% = L/I x 100) n/a
0% (0/4) n/a n/a n/a
0% (0/5)
0% (0/10)
M. A. Number of 'tracked' nests that failed as a result of reproductive failure n/a
0% (0/4) n/a n/a n/a
0% (0/5)
0% (0/10)
B. Number of 'tracked' nests that failed as a result of parasitism n/a
0% (0/4) n/a n/a n/a
0% (0/5)
0% (0/10)
C. Number of 'tracked' nests that failed as a result of predation – Predation Rate according to Vireo Working Group n/a
25% (1/4) n/a n/a n/a
40% (2/5)
30% (3/10)
N. Average clutch size n/a 3.5 2.0 n/a n/a 3.2 n/a
O. Number of cowbird eggs found in or near vireo nests n/a 4 0 n/a n/a 0 4
P. Number of cowbird nestlings removed from 'tracked' nests n/a 0 0 n/a n/a 0 0
Q. Number of cowbird young fledged by vireo n/a 0 0 n/a n/a 0 0
R. Number of 'manipulated' parasitized nests n/a n/a n/a n/a n/a 0 0
S. Number of 'successful, manipulated' nests (% = S/R x 100) n/a n/a n/a n/a n/a n/a n/a
T. Number of vireo fledged from 'manipulated' parasitized nests n/a n/a n/a n/a n/a n/a n/a
U. Number of repaired nests n/a 0 0 n/ n/a 0 0
V. % successful repaired nests n/a n/a n/a n/a n/a n/a n/a
W. Number of vireo fledged from repaired nests n/a n/a n/a n/a n/a n/a n/a


![Environmental Appendix 20131029 DQC Edits...[Unnamed] Ground Beetle Rhadine infernalis Endangered Yes [Unnamed] Ground Beetle Rhadine exilis Endangered Yes Black-capped Vireo Vireo](https://img.pdfslide.us/doc/110x75/611be1e4fd19a9579e003d5d/environmental-appendix-20131029-dqc-edits-unnamed-ground-beetle-rhadine-infernalis.jpg)