Embed Size (px)
Citation preview

Stats

Pop Quiz
1) True or False?2) Up or Down?3) Left or Right?4) Potatoes or French Fries?5) Coke or Pepsi?6) Summer or Winter?7) Justin Bieber or Selena Gomez?8) Red or Green?9) Day or Night?10) Giraffe or Monkey?

Grade Your Quiz
1) True2) Down3) Right4) French Fries5) Pepsi6) Summer7) Justin Bieber8) Green9) Day10) Monkey

Measures of Central Tendency
• Mean: sum of data values/number of data values
• Median: middle value or mean of two middle values
• Mode: most frequently occurring value
Now let’s find the mean, median, and mode of your quiz scores.

Outlier
• A value that is substantially different from other data in the set.
• Which is an outlier in the set of values?– 32, 25, 87, 39, 19, 36, 18

Quartile
One of three values that divides a set of data into four parts.
This data shows water temperatures of the ocean in Pensacola, Florida.
Now let’s find the lower quartile and upper quartile of your quiz scores.

Box PlotMethod of displaying data that uses quartiles to form the center box and the minimum and maximum values to form “whiskers”.
Now let’s make a box plot of your quiz scores.

RangeThe difference between the highest and lowest data values.
86 – 56 = 30 The range is 30.
Now let’s find the range of your quiz scores.

Interquartile RangeThe difference between the first and third quartiles.
83 – 60.5 = 22.5 The interquartile range is 30.
Now let’s find the interquartile range of your quiz scores.

Your Turn• You surveyed 9 of your friends and found out their ACT scores:
24, 19, 22, 31, 25, 24, 21, 18, 29a. Find the mean, median, and mode of the data.
A. Mean: 23.6; Median: 24; Mode: 24
b. Find the upper and lower quartiles of the data.A. Lower: 20; Upper: 27
c. Make a box plot of the data.A.
d. What is the range of the data?A. 13
e. What is the interquartile range of the data?A. 7
18 3120 24 27


Math Test Scores
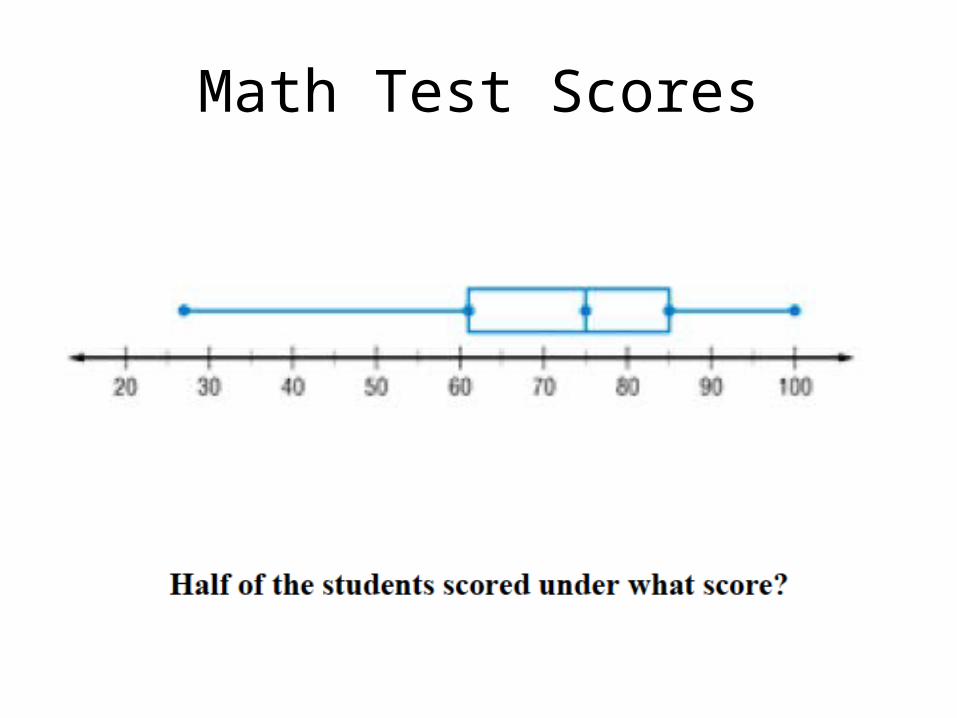
Math Test Scores

Math Test Scores


Intro Activity
• For your set of data, do the following:1.Find the mean, median, mode2.Find the range3.Find the lower and upper quartile4.Find the interquartile range
Set 1 77 78 79 80 80 81 82 83
Set 2 20 60 70 80 80 90 100 140
Set 3 50 60 70 80 80 90 100 110
Set 4 20 30 40 80 80 120 130 140

Intro Activity
• Are the sets the same?• What does the range tell you about the sets?• Find two sets that are spread out differently, but their range
is the same.• Find two sets that are spread out differently, but their
interquartile range is the same.
Set 1 77 78 79 80 80 81 82 83
Set 2 20 60 70 80 80 90 100 140
Set 3 50 60 70 80 80 90 100 110
Set 4 20 30 40 80 80 120 130 140

The Normal Distribution
A normal distribution of data means that most of the points in a set of data are close to the "average," while relatively few points tend to one extreme or the other.

Different Normal Distributions
Most data close to meanData spread out

Standard Deviation
• The standard deviation ( ) is a statistic that tells you how tightly all the various examples are clustered around the mean in a set of data.
When the data are pretty tightly bunched together and the bell-shaped curve is steep, the standard deviation is small.
When the data are spread apart and the bell curve is more flat, that tells you you have a relatively large standard deviation.
σ
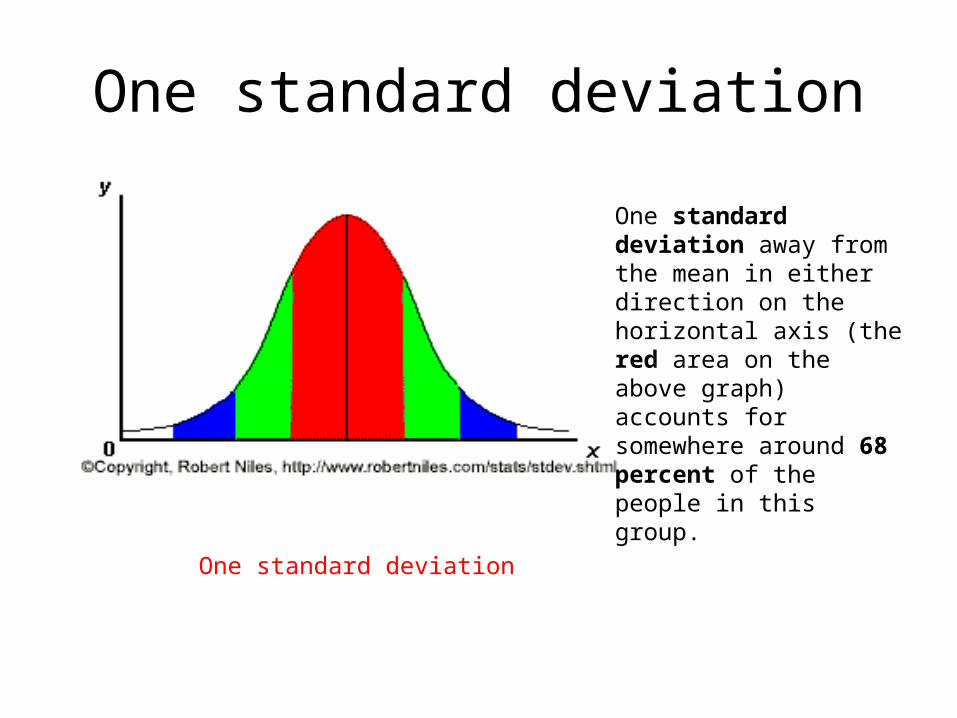
One standard deviation
One standard deviation away from the mean in either direction on the horizontal axis (the red area on the above graph) accounts for somewhere around 68 percent of the people in this group.
One standard deviation

Two standard deviations
Two standard deviations away from the mean (the red and green areas) account for roughly 95 percent of the people.
Two standard deviations
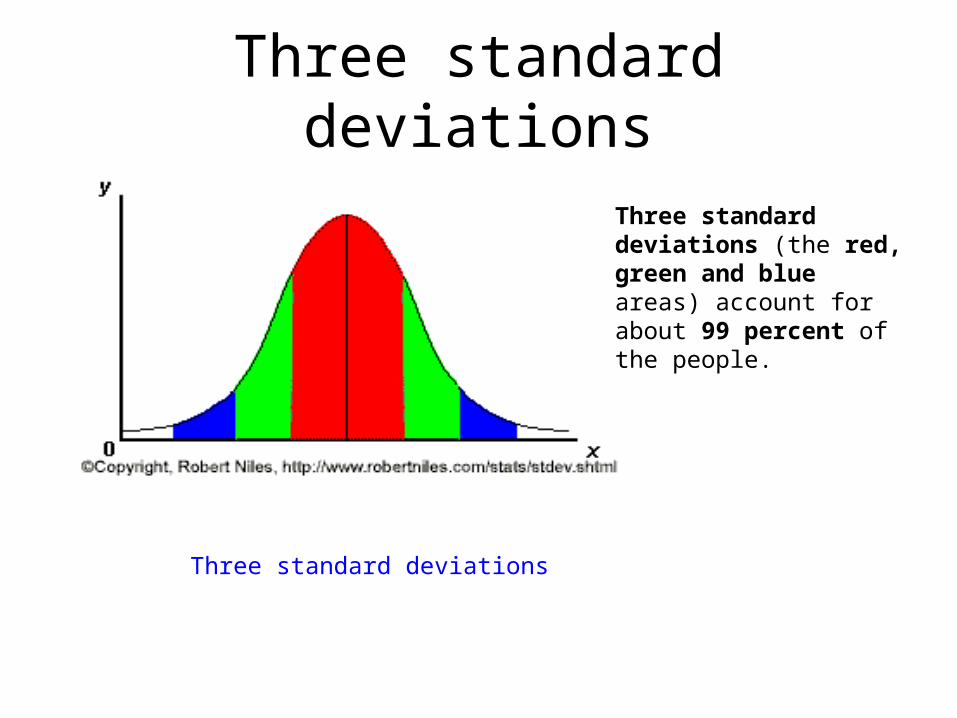
Three standard deviations
Three standard deviations (the red, green and blue areas) account for about 99 percent of the people.
Three standard deviations

Men’s Heights69”
Mean is 69”Standard Deviation is 2.8
71.8” 74.6” 77.4”66.2”63.4”60.6”

Men’s Heights69”
Michael Jordan is 78” tall
71.8” 74.6” 77.4”66.2”63.4”60.6”
Outlier
• A value that is substantially different from other data in the set.
• Michael Jordan’s height is an outlier.

Women’s Heights63.6”
Mean is 63.6”Standard Deviation is 2.5
66.1” 68.6” 71.1”61.1”58.6”56.1”

• The standard deviation of men’s heights is 2.8”
• The standard deviation of women’s heights is 2.5”
• What does this tell you about how the distributions compare?

Example 1
• An average light bulb manufactured by the Acme Corporation lasts 300 days with a standard deviation of 50 days.
• Sketch the normal curve for this distribution, labeling the x-axis with the values that are one, two, and three standard deviations from the mean.
300 350 400 450250200150

Example 2
• An average IQ is 100 with a standard deviation of 10.• Sketch the normal curve for this distribution, labeling the x-
axis with the values that are one, two, and three standard deviations from the mean.
100 110 120 130908070

Example 3Your production plant employs several seamstresses whose
production rate is a normal distribution with a mean (x) of 50 jeans per month and a standard deviation ( ) of 3 jeans.
a) About what percent of the seamstress produce between 47 and 53 jeans per month?
68%
b) What is the probability that a seamstress selected at random will produce more than 56 jeans per month?
2.5%
σ

c) What is the probability that a seamstress selected at random will produce between 44 and 47 jeans per month?
13.5%
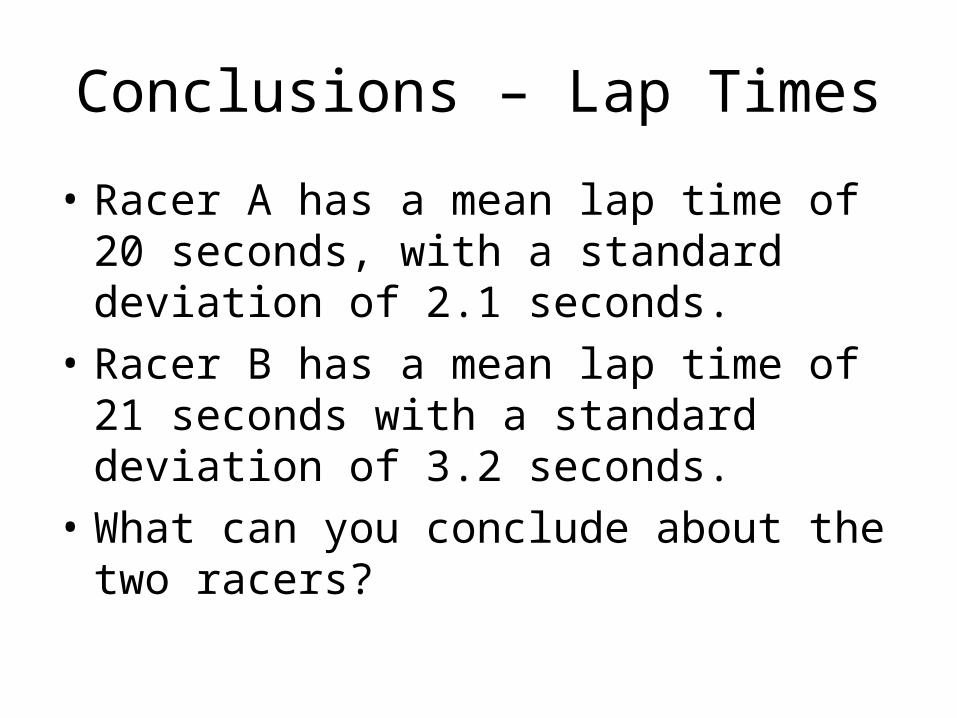
Conclusions – Lap Times
• Racer A has a mean lap time of 20 seconds, with a standard deviation of 2.1 seconds.
• Racer B has a mean lap time of 21 seconds with a standard deviation of 3.2 seconds.
• What can you conclude about the two racers?

Normal Curve
The mean and median are the SAME.
Mean – balance pointMedian – cuts area under curve in half

• A football team has the following scores for their season: 28, 39, 49, 10, 52, 0, 3, 35, 46, 38.
• Find the mean of the scores.• The team won 7 games and lost 3 games. In
the games they lost, they scored 0, 3, and 10 points.
• Find the mean of the scores of the games they won.
• How do the means compare?

Negatively Skewed
The low outliers pull the mean down.

Positively Skewed
The high outliers pull the mean up.

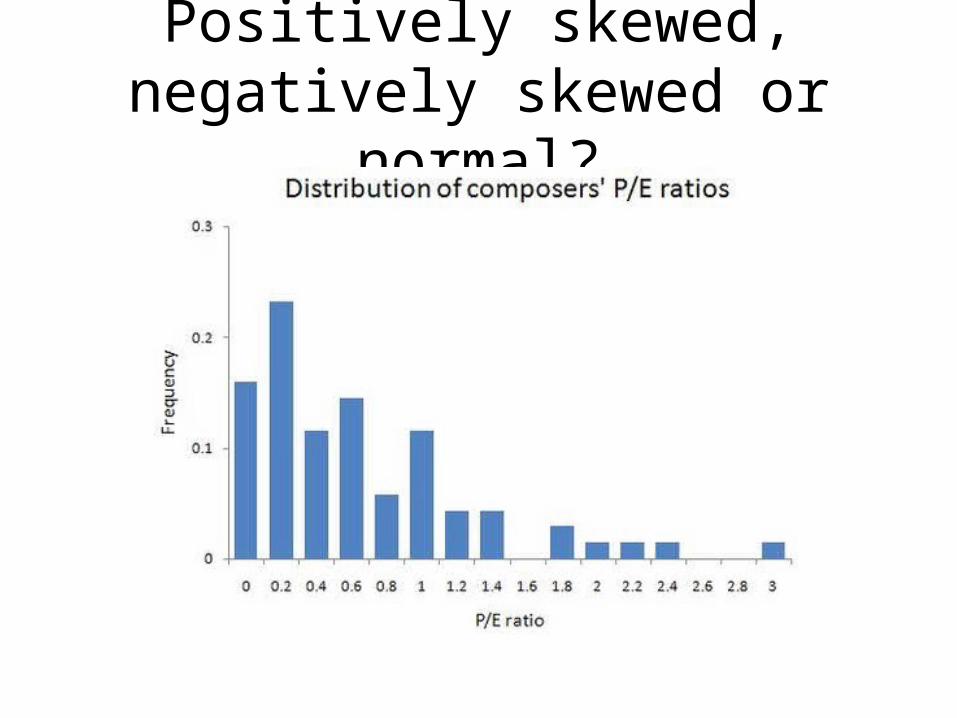
Positively skewed, negatively skewed or normal?

Positively skewed, negatively skewed or normal?

Positively skewed, negatively skewed or normal?
Positively skewed, negatively skewed or normal?

Positively skewed, negatively skewed or normal?

Positively skewed, negatively skewed or normal?

Calculating Standard Deviation
• Worksheet


![Justin Bieber The Key Eau du Parfum 100mL Justin Bieber ...files.shoppersdrugmart.ca/offers/justin-bieber/july2013/JB3_presell... · [ ] Justin Bieber The Key 100mL $70.00* [ ] Justin](https://img.pdfslide.us/doc/110x75/5e5cf67620150154c60a2919/justin-bieber-the-key-eau-du-parfum-100ml-justin-bieber-files-justin-bieber.jpg)