Embed Size (px)
Citation preview
8/8/2019 Stats Canada Enviromental Technologies
http://slidepdf.com/reader/full/stats-canada-enviromental-technologies 1/62
StatistiqueCanada
StatisticsCanada
Catalogue no. 16F0024XIE
Environmental Management
and Technologies in theBusiness Sector
8/8/2019 Stats Canada Enviromental Technologies
http://slidepdf.com/reader/full/stats-canada-enviromental-technologies 2/62
How to obtain more information
Specific inquiries about this product and related statistics or services should be directed to: System of
National Accounts, Environment Accounts and Statistics Division, Statistics Canada, Ottawa Ontario,
K1A 0T6 (telephone: (613) 951-0297).
For information on the wide range of data available from Statistics Canada, you can contact us by calling one
of our toll-free numbers. You can also contact us by e-mail or by visiting our Web site.
National enquiries line 1 800 263-1136
National telecommunications device for the hearing impaired 1 800 363-7629
Depository Services Program inquiries 1 800 700-1033
Fax line for Depository Services Program 1 800 889-9734
E-mail inquiries [email protected]
Web site www.statcan.ca
Ordering and subscription information
This product, Catalogue No. 16F0024XIE, is published on an occasional basis in electronic format on the
Statistics Canada Internet site for free. To obtain single issues visit our Web site at www.statcan.ca.
• Phone (Canada and United States) 1 800 267-6677
• Fax (Canada and United States) 1 877 287-4369
• E-mail [email protected]
• Mail Statistics Canada
Dissemination Division
Circulation Management
120 Parkdale Avenue
Ottawa, Ontario K1A 0T6
• And, in person at the Statistics Canada Regional Centre nearest you.
When notifying us of a change in your address, please provide both old and new addresses.
Standards of service to the public
Statistics Canada is committed to serving its clients in a prompt, reliable and courteous manner and in the
official language of their choice. To this end, the Agency has developed standards of service which its
employees observe in serving its clients. To obtain a copy of these service standards, please contact
Statistics Canada toll free at 1 800 263-1136.
8/8/2019 Stats Canada Enviromental Technologies
http://slidepdf.com/reader/full/stats-canada-enviromental-technologies 3/62
8/8/2019 Stats Canada Enviromental Technologies
http://slidepdf.com/reader/full/stats-canada-enviromental-technologies 4/62
Environmental Management and Technologies in the Business Sector Statistics Canada – Catalogue no. 16F0024XIE i
Table of ContentsTable of Contents . . . . . . . . . . . . . . . . . . . . . . . . . . . . . . . . . . . . . . . . . . . . . . . . . . . . . . . . . . . . . . . . . . . . . . . . . . . iList of Figures and Tables . . . . . . . . . . . . . . . . . . . . . . . . . . . . . . . . . . . . . . . . . . . . . . . . . . . . . . . . . . . . . . . . . . . . iiiSymbols . . . . . . . . . . . . . . . . . . . . . . . . . . . . . . . . . . . . . . . . . . . . . . . . . . . . . . . . . . . . . . . . . . . . . . . . . . . . . . . . . ivPreface . . . . . . . . . . . . . . . . . . . . . . . . . . . . . . . . . . . . . . . . . . . . . . . . . . . . . . . . . . . . . . . . . . . . . . . . . . . . . . . . . . .v
Acknowledgements . . . . . . . . . . . . . . . . . . . . . . . . . . . . . . . . . . . . . . . . . . . . . . . . . . . . . . . . . . . . . . . . . . . . . . . . . .vIntroduction and Highlights . . . . . . . . . . . . . . . . . . . . . . . . . . . . . . . . . . . . . . . . . . . . . . . . . . . . . . . . . . . . . . . . . 1
Introduction . . . . . . . . . . . . . . . . . . . . . . . . . . . . . . . . . . . . . . . . . . . . . . . . . . . . . . . . . . . . . . . . . . . . . . . 1Highlights . . . . . . . . . . . . . . . . . . . . . . . . . . . . . . . . . . . . . . . . . . . . . . . . . . . . . . . . . . . . . . . . . . . . . . . . . 1
1 Environmental Management Practices . . . . . . . . . . . . . . . . . . . . . . . . . . . . . . . . . . . . . . . . . . . . . . . . . . . . . 3
Environmental management system . . . . . . . . . . . . . . . . . . . . . . . . . . . . . . . . . . . . . . . . . . . . . . . . . . . . 4Life cycle analysis . . . . . . . . . . . . . . . . . . . . . . . . . . . . . . . . . . . . . . . . . . . . . . . . . . . . . . . . . . . . . . . . . . 4ISO 14000 certification . . . . . . . . . . . . . . . . . . . . . . . . . . . . . . . . . . . . . . . . . . . . . . . . . . . . . . . . . . . . . . 4Environmental voluntary agreements . . . . . . . . . . . . . . . . . . . . . . . . . . . . . . . . . . . . . . . . . . . . . . . . . . . 5Green procurement policy . . . . . . . . . . . . . . . . . . . . . . . . . . . . . . . . . . . . . . . . . . . . . . . . . . . . . . . . . . . . 5Eco-labelling of products . . . . . . . . . . . . . . . . . . . . . . . . . . . . . . . . . . . . . . . . . . . . . . . . . . . . . . . . . . . . 5Annual environmental performance report . . . . . . . . . . . . . . . . . . . . . . . . . . . . . . . . . . . . . . . . . . . . . . . 5Environmental management practices and firm size . . . . . . . . . . . . . . . . . . . . . . . . . . . . . . . . . . . . . . . . 6
2 Pollution Prevention Methods . . . . . . . . . . . . . . . . . . . . . . . . . . . . . . . . . . . . . . . . . . . . . . . . . . . . . . . . . . . . 9On-site recirculation, recovery, recycle and reuse . . . . . . . . . . . . . . . . . . . . . . . . . . . . . . . . . . . . . . . . 10Prevention of leaks and spills . . . . . . . . . . . . . . . . . . . . . . . . . . . . . . . . . . . . . . . . . . . . . . . . . . . . . . . . 10Energy conservation . . . . . . . . . . . . . . . . . . . . . . . . . . . . . . . . . . . . . . . . . . . . . . . . . . . . . . . . . . . . . . . 10Substitution or modification of production process . . . . . . . . . . . . . . . . . . . . . . . . . . . . . . . . . . . . . . . . 11Material or solvent substitution . . . . . . . . . . . . . . . . . . . . . . . . . . . . . . . . . . . . . . . . . . . . . . . . . . . . . . . 11Product design or reformulation . . . . . . . . . . . . . . . . . . . . . . . . . . . . . . . . . . . . . . . . . . . . . . . . . . . . . . 11Pollution prevention methods and firm size . . . . . . . . . . . . . . . . . . . . . . . . . . . . . . . . . . . . . . . . . . . . . . 11Pollution prevention by province and territory . . . . . . . . . . . . . . . . . . . . . . . . . . . . . . . . . . . . . . . . . . . . 12
3 Use of Environmental Technologies . . . . . . . . . . . . . . . . . . . . . . . . . . . . . . . . . . . . . . . . . . . . . . . . . . . . . . 153.1 Environmental technologies by emissions treated . . . . . . . . . . . . . . . . . . . . . . . . . . . . . . . . . . . . . . . . . . 16
Energy conservation technologies . . . . . . . . . . . . . . . . . . . . . . . . . . . . . . . . . . . . . . . . . . . . . . . . . . . . . 173.2 Environmental technologies used by business . . . . . . . . . . . . . . . . . . . . . . . . . . . . . . . . . . . . . . . . . . . . . 17
3.2.1 Profile of selected industries . . . . . . . . . . . . . . . . . . . . . . . . . . . . . . . . . . . . . . . . . . . . . . . . . . . . . . 18Logging . . . . . . . . . . . . . . . . . . . . . . . . . . . . . . . . . . . . . . . . . . . . . . . . . . . . . . . . . . . . . . . . . . . . . . . . . 18Oil and Gas Extraction . . . . . . . . . . . . . . . . . . . . . . . . . . . . . . . . . . . . . . . . . . . . . . . . . . . . . . . . . . . . . . 18Mining . . . . . . . . . . . . . . . . . . . . . . . . . . . . . . . . . . . . . . . . . . . . . . . . . . . . . . . . . . . . . . . . . . . . . . . . . . 19Electric Power Generation, Transmission and Distribution . . . . . . . . . . . . . . . . . . . . . . . . . . . . . . . . . . 19Natural Gas Distribution . . . . . . . . . . . . . . . . . . . . . . . . . . . . . . . . . . . . . . . . . . . . . . . . . . . . . . . . . . . . 20Pulp, Paper and Paperboard Mills . . . . . . . . . . . . . . . . . . . . . . . . . . . . . . . . . . . . . . . . . . . . . . . . . . . . . 20Petroleum and Coal Products . . . . . . . . . . . . . . . . . . . . . . . . . . . . . . . . . . . . . . . . . . . . . . . . . . . . . . . . 20Chemicals . . . . . . . . . . . . . . . . . . . . . . . . . . . . . . . . . . . . . . . . . . . . . . . . . . . . . . . . . . . . . . . . . . . . . . . 21Primary Metals . . . . . . . . . . . . . . . . . . . . . . . . . . . . . . . . . . . . . . . . . . . . . . . . . . . . . . . . . . . . . . . . . . . . 21Pipeline Transportation . . . . . . . . . . . . . . . . . . . . . . . . . . . . . . . . . . . . . . . . . . . . . . . . . . . . . . . . . . . . . 21
4 Concepts, Methodology and Data Quality . . . . . . . . . . . . . . . . . . . . . . . . . . . . . . . . . . . . . . . . . . . . . . . . . . 41
4.1 Data sources and methodology . . . . . . . . . . . . . . . . . . . . . . . . . . . . . . . . . . . . . . . . . . . . . . . . . . . . . . . . . 41Selection of target industries . . . . . . . . . . . . . . . . . . . . . . . . . . . . . . . . . . . . . . . . . . . . . . . . . . . . . . . . . 411997 . . . . . . . . . . . . . . . . . . . . . . . . . . . . . . . . . . . . . . . . . . . . . . . . . . . . . . . . . . . . . . . . . . . . . . . . . . . . 411998 . . . . . . . . . . . . . . . . . . . . . . . . . . . . . . . . . . . . . . . . . . . . . . . . . . . . . . . . . . . . . . . . . . . . . . . . . . . . 411998 Industry classification . . . . . . . . . . . . . . . . . . . . . . . . . . . . . . . . . . . . . . . . . . . . . . . . . . . . . . . . . . 42Sample selection . . . . . . . . . . . . . . . . . . . . . . . . . . . . . . . . . . . . . . . . . . . . . . . . . . . . . . . . . . . . . . . . . . 421997 . . . . . . . . . . . . . . . . . . . . . . . . . . . . . . . . . . . . . . . . . . . . . . . . . . . . . . . . . . . . . . . . . . . . . . . . . . . . 421998 . . . . . . . . . . . . . . . . . . . . . . . . . . . . . . . . . . . . . . . . . . . . . . . . . . . . . . . . . . . . . . . . . . . . . . . . . . . . 43
8/8/2019 Stats Canada Enviromental Technologies
http://slidepdf.com/reader/full/stats-canada-enviromental-technologies 5/62
ii S tatist ics Canada – Catalogue no. 16F0024XIE Environmental Management and Technologies in the Business Sector
4.2 Concepts and variables measured . . . . . . . . . . . . . . . . . . . . . . . . . . . . . . . . . . . . . . . . . . . . . . . . . . . . . . 43Environmental management practices . . . . . . . . . . . . . . . . . . . . . . . . . . . . . . . . . . . . . . . . . . . . . . . . . 44Pollution prevention methods . . . . . . . . . . . . . . . . . . . . . . . . . . . . . . . . . . . . . . . . . . . . . . . . . . . . . . . . 44Use of environmental technologies . . . . . . . . . . . . . . . . . . . . . . . . . . . . . . . . . . . . . . . . . . . . . . . . . . . . 44
4.3 Data Quality . . . . . . . . . . . . . . . . . . . . . . . . . . . . . . . . . . . . . . . . . . . . . . . . . . . . . . . . . . . . . . . . . . . . . . . . 44Specific questions . . . . . . . . . . . . . . . . . . . . . . . . . . . . . . . . . . . . . . . . . . . . . . . . . . . . . . . . . . . . . . . . . 45Sampling and non-sampling errors . . . . . . . . . . . . . . . . . . . . . . . . . . . . . . . . . . . . . . . . . . . . . . . . . . . . 45
4.4 Comparability of data . . . . . . . . . . . . . . . . . . . . . . . . . . . . . . . . . . . . . . . . . . . . . . . . . . . . . . . . . . . . . . . . 46Annex A: Statistical Tables . . . . . . . . . . . . . . . . . . . . . . . . . . . . . . . . . . . . . . . . . . . . . . . . . . . . . . . . . . . . . . . 47
8/8/2019 Stats Canada Enviromental Technologies
http://slidepdf.com/reader/full/stats-canada-enviromental-technologies 6/62
Environmental Management and Technologies in the Business Sector Statistics Canada – Catalogue no. 16F0024XIE iii
List of Figures and Tables
Table 1.1 Environmental Management Practices by Businesses, 1998 . . . . . . . . . . . . . . . . . . . . . . . . . . . . . . . . 6
Table 1.2 Distribution of Environmental Management Practices by Industry, 1998. . . . . . . . . . . . . . . . . . . . . . . . 7
Table 1.3 Distribution of Environmental Management Practices by Province and Territory, 1998. . . . . . . . . . . . . 7
Table 1.4 Distribution of Environmental Management Practices by Establishment Size, 1998. . . . . . . . . . . . . . . 8
Figure 2.1 Investment in PAC End-of-pipe Processes versus Investment in Pollution Prevention, 1994-1998 . . . 9
Table 2.1 Pollution Prevention Practices, 1995-2000 . . . . . . . . . . . . . . . . . . . . . . . . . . . . . . . . . . . . . . . . . . . . . 10
Table 2.2 Pollution Prevention Methods by Industry, 1998 . . . . . . . . . . . . . . . . . . . . . . . . . . . . . . . . . . . . . . . . . 12
Table 2.3 Planned Pollution Prevention Methods by Industry, 1999-2000 . . . . . . . . . . . . . . . . . . . . . . . . . . . . . 12
Table 2.4 Distribution of Pollution Prevention Methods by Establishment Size, 1998. . . . . . . . . . . . . . . . . . . . . 13
Table 2.5 Pollution Prevention Methods by Province and Territory, 1998 . . . . . . . . . . . . . . . . . . . . . . . . . . . . . . 13
Table 2.6 Planned Pollution Prevention Methods by Province and Territory, 1999-2000 . . . . . . . . . . . . . . . . . . 14
Table 3.1 Type of Treatment by Industry, 1998 . . . . . . . . . . . . . . . . . . . . . . . . . . . . . . . . . . . . . . . . . . . . . . . . . . 17
Table 3.2 Emission Type by Treatment Method and Industry, 1998 . . . . . . . . . . . . . . . . . . . . . . . . . . . . . . . . . . 22
Table 3.3 Energy Conservation Processes and Technologies by Industry, 1998 . . . . . . . . . . . . . . . . . . . . . . . . 23Table 3.4 Environmental Technologies Used in Logging Industry, 1998 . . . . . . . . . . . . . . . . . . . . . . . . . . . . . . . 24
Table 3.5 Environmental Technologies Used in the Oil and Gas Extraction Industry, 1998 . . . . . . . . . . . . . . . . 24
Table 3.6 Environmental Technologies Used in the Mining Industry, 1998 . . . . . . . . . . . . . . . . . . . . . . . . . . . . . 26
Table 3.7 Environmental Technologies Used in the Electric Power Generation, Transmission andDistribution Industry, 1998. . . . . . . . . . . . . . . . . . . . . . . . . . . . . . . . . . . . . . . . . . . . . . . . . . . . . . . . . 27
Table 3.8 Environmental Technologies Used in the Natural Gas Distribution Industry, 1998 . . . . . . . . . . . . . . . 28
Table 3.9 Environmental Technologies Used in the Pulp, Paper and Paperboard Mills Industry,1998 . . . . . . . . . . . . . . . . . . . . . . . . . . . . . . . . . . . . . . . . . . . . . . . . . . . . . . . . . . . . . . . . . . . . . . . . . 29
Table 3.10 Environmental Technologies Used in the Petroleum and Coal Products Industry, 1998 . . . . . . . . . . . 30
Table 3.11 Environmental Technologies Used in the Chemicals Industry, 1998 . . . . . . . . . . . . . . . . . . . . . . . . . . 31
Table 3.12 Environmental Technologies Used in the Primary Metal Industry, 1998 . . . . . . . . . . . . . . . . . . . . . . . 33
Table 3.13 Environmental Technologies Used in the Pipeline Transportation Industry, 1998 . . . . . . . . . . . . . . . . 34
Table 3.14 Distribution of Environmental Technology Use, 1998 . . . . . . . . . . . . . . . . . . . . . . . . . . . . . . . . . . . . . 36
Table 4.1 Number of Establishments Using at Least One Environmental Technology by Industry, 1998 . . . . . . 46
Table A.1 Expenditures on Environmental Protection by Industry and Type of Activity, 1998 . . . . . . . . . . . . . . . 49
Table A.2 Environmental Management Practices by Businesses, 1997 . . . . . . . . . . . . . . . . . . . . . . . . . . . . . . . 50
Table A.3 Distribution of Environmental Management Practices by Industry, 1997. . . . . . . . . . . . . . . . . . . . . . . 50
Table A.4 Distribution of Environmental Management Practices by Establishment Size, 1997. . . . . . . . . . . . . . 50
Table A.5 Distribution of Environmental Management Practices, by Province and Territory, 1997 . . . . . . . . . . . 51
Table A.6 Frequency of Pollution Prevention Methods by Industry, 1997 . . . . . . . . . . . . . . . . . . . . . . . . . . . . . . 51
Table A.7 Planned Pollution Prevention Methods by Industry, 1998-1999 . . . . . . . . . . . . . . . . . . . . . . . . . . . . . 52
Table A.8 Frequency of Pollution Prevention Methods by Province and Territory, 1997 . . . . . . . . . . . . . . . . . . . 52
Table A.9 Planned Pollution Prevention Methods by Province and Territory, 1998-1999 . . . . . . . . . . . . . . . . . . 53
Table A.10 Planned Pollution Prevention Methods by Province and Territory, 1997 . . . . . . . . . . . . . . . . . . . . . . . 53
8/8/2019 Stats Canada Enviromental Technologies
http://slidepdf.com/reader/full/stats-canada-enviromental-technologies 7/62
iv Statist ics Canada – Catalogue no. 16F0024XIE Environmental Management and Technologies in the Business Sector
Symbols
The following standard symbols are used in Statistics Canada publications:
. not available for any reference period
.. not available for a specific reference period
... not applicable
e estimate
p preliminary figures
r revised figures
x suppressed to meet the confidentiality requirements of the Statistics Act
E use with caution
F too unreliable to be published
8/8/2019 Stats Canada Enviromental Technologies
http://slidepdf.com/reader/full/stats-canada-enviromental-technologies 8/62

8/8/2019 Stats Canada Enviromental Technologies
http://slidepdf.com/reader/full/stats-canada-enviromental-technologies 9/62
8/8/2019 Stats Canada Enviromental Technologies
http://slidepdf.com/reader/full/stats-canada-enviromental-technologies 10/62
Environmental Management and Technologies in the Business Sector Statistics Canada – Catalogue no. 16F0024XIE 1
Introduction and Highlights
Introduction
Environmental Management and Technologies in the
Business Sector is an analytical report that featuresdetailed information on environmental managementpractices and pollution prevention activities undertaken bybusiness and the specific technologies used to achieveenvironmental goals. This report is complementary toEnvironmental Protection Expenditures in the Business
Sector, 1996 and 1997 (revised), as well as Environmental
Protection in the Business Sector, 1998 1.
Since 1994, the Survey of Environmental Protection Expen-
ditures (SEPE) has collected statistics on the capital andoperating expenditures of business establishments on
various types of environmental goods, services and activ-ities (e.g., site reclamation, end-of-pipe processes, andintegrated process changes). The SEPE has shown thatgradually businesses have moved from large investmentson end-of-pipe processes toward investments on integratedprocesses and other pollution prevention practices.2 Thisshift has been recognised by the Federal Government.Indeed, one of the main features of the new Canadian
Environmental Protection Act , passed into legislation in2000, is the promotion of pollution prevention.
The 1997 SEPE broadened the coverage and the scope ofenvironmental projects in order to get a more completeprofile of business environmental practices and of the
apparent shift from pollution abatement to pollutionprevention. In addition, the SEPE was modified to capturestatistics on resource conservation and renewable energytechnologies as part of a project to provide federalgovernment departments with improved measurements ofthe use of resource conservation and renewable energytechnologies. Environmental Management and Technol-
ogies in the Business Sector provides an overview of thefollowing new or improved features contained in the 1997and 1998 SEPE:
• Environmental management practices such asenvironmental management systems, environmentalcertification programs (e.g. ISO 14000), participation
in an environmental voluntary program, eco-labellingof products, and use of life cycle analysis (Section 1);
• Pollution prevention methods such as product design,modification of production processes, recycling,energy conservation, substitution of solvent or materialand prevention of leaks and spills (Section 2);
• Technologies used for pollution prevention andabatement: gas and liquid waste treatment, solidwaste management , s i te rec lamat ion anddecommissioning, reduction of noise, vibration andradiation, and energy conservation (Section 3)3.
This report is a national study. It is an introductory tool tohelp policy-makers, producers of environmental goods andservices and academics to identify measures thatbusinesses adopt to improve their environmentalperformance. It can be used to understand the character-istics of business demand for environmental technologies.Businesses can also use the report to benchmark theirenvironmental actions with those of the rest of the industry.Readers are invited to provide comments and feedback onthe information presented in this report.
Highlights
• Establishments are involved in a variety ofenvironmental management practices. For instance,64% of establishments that responded used anenvironmental management system in 1998. Thisfigure was even higher (over 80%) in the Oil and GasExtraction, Natural Gas Distribution, and PipelineTransportation industries. More than one third ofestablishments participated in environmental voluntaryprograms although there were significant variations inparticipation depending on the industry. Almost 34% ofestablishments reported producing an environmental
performance report (Tables 1.1 and 1.2).
• Recirculation, recovery, recycling or reuse was themost widespread pollution prevention method used byestablishments (66% of all establishments reporting).Almost 60% of establishments reporting indicated theytook measures to prevent leaks and spills in 1998.Over 90% of establishments in Pipeline Transportationand over 80% of establishments in Logging, Oil andGas Extraction and Electric Power Generation,Transmission and Distribution used this pollutionprevent ion measure . F i f t y - th ree percent o festablishments planned to use energy conservation in1999-2000. The use of this method has increased
steadily since 1995 (37%) (Table 2.1).
1. These reports are available free of charge on Statistics Canada’s Website
(www.statcan.ca).
2. The sole purpose of end-of-pipe processes is to abate or to control unde-
sirable substances resulting from production. In contrast, modifications to
integrated production processes (for environmental purposes) are one
example of pollution prevention practice. For more information, please see
Section 2 - Pollution Prevention Methods.
3. Section 3 of the report contains1998 reference year data only. The survey
question related to the use of specific environmental technologies and
processes used by business was added to the SEPE for the first time in
1997. Concerns regarding the quality of the 1997 results, and the marked
improvement in data quality in the 1998 reference year, has led Statistics
Canada to restrict the data to 1998 results (please see Section 4 - Con-
cepts, Methodology and Data Quality).
8/8/2019 Stats Canada Enviromental Technologies
http://slidepdf.com/reader/full/stats-canada-enviromental-technologies 11/62
2 Statistics Canada – Catalogue no. 16F0024XIE Environmental Management and Technologies in the Business Sector
• Almost 87% of all establishments reported using aprocess or technology to manage solid waste, andclose to three-quarters of establishments indicatedthey treated liquid or gaseous wastes. Just under 65%of establishments indicated they used an energyconservation process in 1998. (Section 3).
• Overall, more respondents were using these fiveenvironmental technologies or processes than anyother listed: solid waste management by container(68%); followed by energy efficient equipment (44%);the physical treatment of noise using mufflers (37%);the physical treatment of gas by bag house (34%); andfinally, the physical treatment of gas by gravitydeposition dust collector systems.
• While close to half of the respondents indicated theyused energy efficient equipment in 1998, between 10and 20 percent indicated they used waste-to-energysystems, fuel substitution, clean fuel systems or otherenergy conservation methods.
8/8/2019 Stats Canada Enviromental Technologies
http://slidepdf.com/reader/full/stats-canada-enviromental-technologies 12/62
Environmental Management Practices
Environmental Management and Technologies in the Business Sector Statistics Canada – Catalogue no. 16F0024XIE 3
1 Environmental
Management
Practices1
Businesses may be involved in various environmentalmanagement practices aimed at achieving global and/orspecific environmental goals. These practices are designedto take into account environmental issues or the impact oftheir activities on the environment in their day to day opera-tions. Examples of environmental management practicesrange from the implementation of specific managementtools to participation in national and international environ-mental initiatives and programs.
A process is a series of operations while a practice is an
applied action.
The 1998 Survey of Environmental Protection Expenditures
(SEPE) included a question on environmental managementpractices adopted by industry (Text Box 1.1). The infor-mation provided by this question will track the progress ofindustry in implementing environmental managementpractices such as environmental management systems,ISO 14000 certification, and participation in voluntaryprograms.
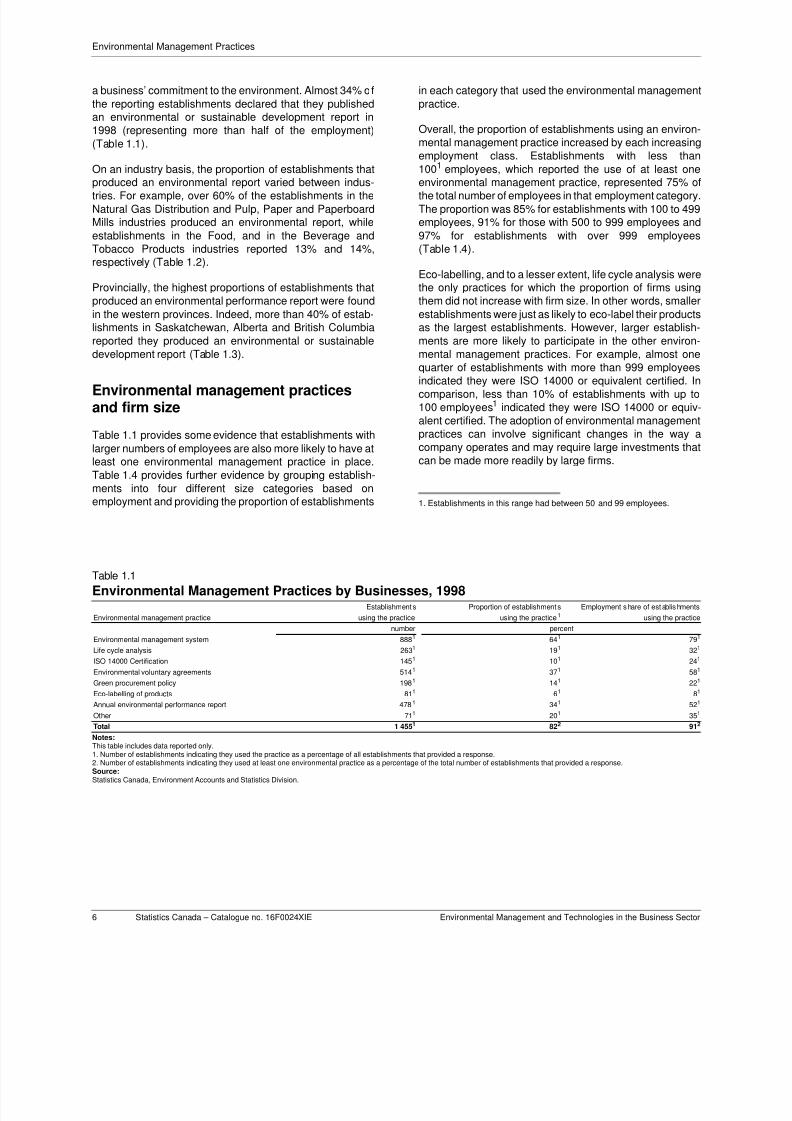
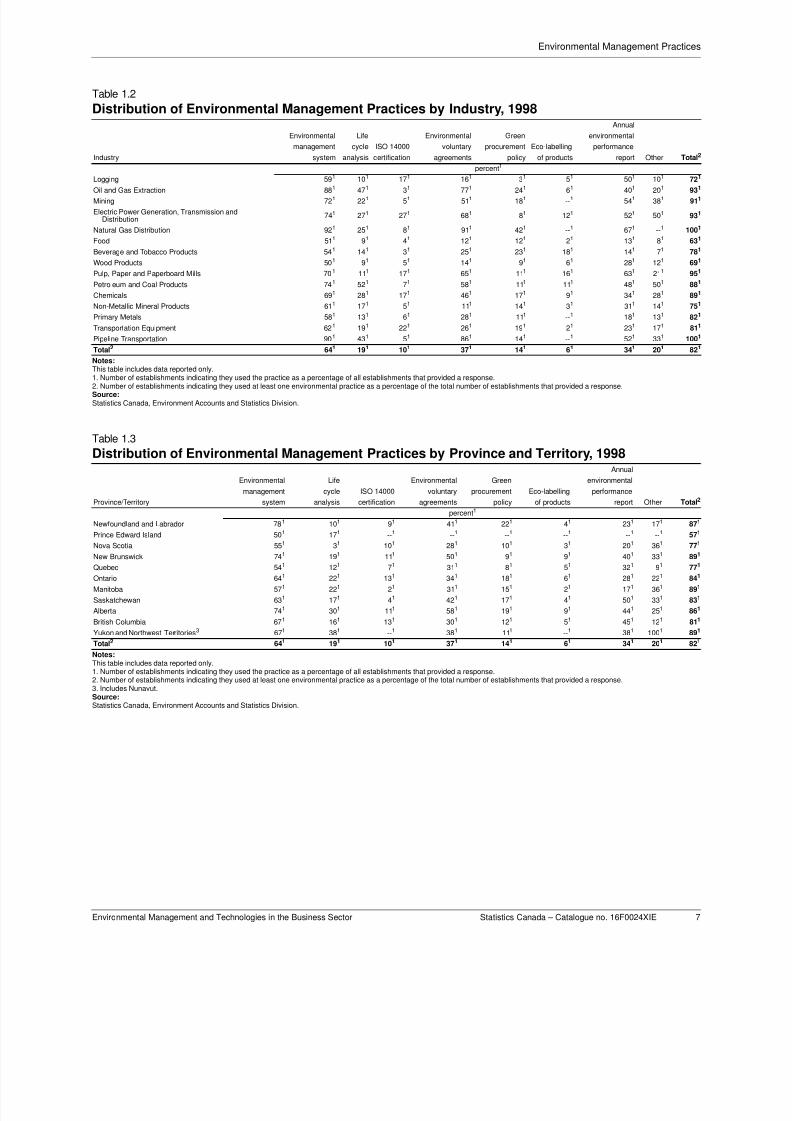
In 1998, almost 1 500 establishments answered thequestion on the type of environmental managementpractice they used, representing close to 80% of all estab-
lishments that were sent a questionnaire.2 Slightly less than82% of the establishments that provided a responseindicated they used at least one environmentalmanagement practice (Table 1.1). The most commonpractice was the use of an environmental managementsystem (64% of establishments representing 79% of theemployment share), followed by the participation in anenvironmental voluntary agreement (37% of establishmentsrepresenting 58% of the employment share) and the publi-cation of an environmental performance or sustainabledevelopment report (34% of establishments representing52% of the employment share).
In many cases, establishments that indicated they used
environmental management practices listed in the Survey of Environmental Protection Expenditures were likely to usemore than one. For example, if an establishment hadobtained, or was in the process of obtaining, ISO 14000certification (for a description, see ISO 14000 certification
on page 4), it was likely that it would also report using an
1. Includes reported data only.
2. See Text Box 1.1, Environmental Management Practices and Compa-
rability of 1997 and 1998 Results.
Text Box 1.1Note to Readers:Environmental Management Practicesand Comparability of 1997 and 1998Results
For the first time, Survey of Environmental Protection Expenditures included a question on environmentalmanagement practices for the 1997 survey year. Re-spondents were asked to report on the following1:
• does the establishment use an environment man-agement system?
• is the establishment ISO 14000 certified or equiva-lent?
• has the establishment implemented any environ-mental voluntary initiative or participated in any vol-untary environmental program?
• does the establishment have a "green" procurementpolicy?
• are any goods produced by the establishmentcertified by an environmental program, such as"Eco-Logo"?
• has the establishment published an annual reporton environmental performance or sustainable de-velopment?
• does the establishment use life cycle analysis fordecision-making?
Readers should be aware that the 1997 and 1998 es-timates provided represent reported data only. No es-
timation was done for non-response and non-surveyed establishments. The 1998 SEPE realized asignificant increase in the response rate for the ques-tion on environmental management practices over1997. There was an associated increase in the qualityof the 1998 estimates. Therefore, comparisons be-tween 1997 and 1998 provide a general view butshould be treated with caution.
In 1997, approximately 1 000 establishments an-swered the question on the type of environmentalmanagement practice they used. This represented62% of all establishments that were sent a question-naire. In 1998, the number of establishments that an-swered the question rose to almost 1 500,representing close to 80% of all establishments thatwere sent a questionnaire. The 1997 tables are pro-vided in the Annex at the end of this report.
1. This question was also asked in the 1998 Survey of Environmental
Protection Expenditures . For further detail, please see Environ-
mental Protection Expenditures in the Business Sector, 1996 and
1997 (revised), and Statistics Canada, and Environmental Protec-
tion Expenditures in the Business Sector, 1998 , Statistics Canada,
Catalogue no. 16F0006XIE (available on Statistics Canada Web
site www.statcan.ca).
8/8/2019 Stats Canada Enviromental Technologies
http://slidepdf.com/reader/full/stats-canada-enviromental-technologies 13/62
Environmental Management Practices
4 Statistics Canada – Catalogue no. 16F0024XIE Environmental Management and Technologies in the Business Sector
environmental management system or life cycle analysis,both of which are components of ISO 14000. If an estab-lishment had adopted a “green” procurement policy, or hadeco-labelled its products, the establishment was most likelyto have used life cycle analysis to assist in the developmentof its environmental policies and environmentally-sensitiveproducts.
Environmental management system
The Standards Council of Canada defines an environmentalmanagement system as “a management structure thatallows an organisation to assess and control the environ-mental impact of its activities, products or services”.1
According to the Standards Council of Canada, an environ-mental management system has six key elements:
• develop and establish an environmental policy;
• environmental impact planning;
• development of processes and practices to reachenvironmental goals and objectives;
• monitoring and measurement system to assess ifgoals and objectives are being met;
• develop a management review process;
• continual improvement.
Overall, almost 64% of the establishments (79% of theemployment share) indicated they employed an environ-mental management system at their establishment2 in 1998(Table 1.1). However, the use of an environmentalmanagement system varied among industries. For
example, over 90% of (responding) establishments in theNatural Gas Distribution and Pipeline Transportation indus-tries indicated that they employed a system, followed by Oiland Gas Extraction (88%), compared to 50% in the WoodProducts and Food industries (Table 1.2).
On a provincial basis, Newfoundland and Labrador (78%),Alberta (75%) and New Brunswick (74%) reported thehighest environmental management system participationrate while Prince Edward Island (50%), Quebec (54%) andNova Scotia (55%) reported the lowest (Table 1.3).
Life cycle analysis
Life cycle analysis or assessment (LCA) is a tool used toidentify and measure direct and indirect environmental,energy and resource impacts associated with a product,process or service through its design, production, usageand final disposal.3 This type of analysis originated from the
global modelling studies and energy audits of the late 1960sand early 1970s. It has grown in importance as environ-mental awareness on the part of governments, industry andthe public has increased.4
Approximately one-fifth of the reporting establishmentsindicated that they used life-cycle analysis for decision-making in 1998 (Table 1.1). These establishments weregenerally larger (based on employment), representing 32%of the total employment of all establishments reporting.Establishments in the natural resource sector generallyreported the highest use of life cycle analysis. For example,over 50% of the establishments that reported in thePetroleum and Coal Products industry indicated they used
life cycle analysis, followed by the Oil and Gas Extraction(47%) and Pipeline Transport (43%) industries (Table 1.2).
Not surprisingly, given the significance of these industries inthat province and territories, Yukon and Northwest Terri-tories (38%)5 and Alberta (30%) had the highest percentageof establishments indicating they used life cycle analysis,followed by Manitoba (22%) and Ontario (22%) (Table 1.3).
ISO 14000 certification
ISO 14000 was developed by the International Organizationfor Standardization as an internationally-recognized set of
standards and guidelines primarily concerned with environ-mental management systems. The goal of ISO 14000 is to“ensure a product will have the least harmful impact on theenvironment, either during production or disposal, either bypolluting or by depleting natural resources.”6 These guide-lines are an environmental management system based onthree sets of tools: 1) life-cycle analysis of products andservices,7 2) environmental performance evaluation, and3) environmental labelling of products and services.8 Usingthe ISO 14000 guidelines yields a number of benefits, fromwaste minimization to energy savings, while offsetting thecosts of reducing environmental impacts.
1. Standards Council of Canada, Questions and Answers About ISO 14000,
<www.scc.ca/standards/iso14000/infobref_e.html>, (accessed March 27,
2002).
2. The implementation of an environmental management system (EMS)
does not necessarily mean ISO 14000 certification. In fact, the majority of
establishments were not ISO 14000 certified, but indicated they employed
EMS at their establishment.
3. International Institute for Sustainable Development, 1996, Global Green
Standards, ISO 14000 and Sustainable Development, Winnipeg.
4. World Resource Foundation, Life cycle analysis and assessment , <http://
www.gdrc.org/uem/waste/life-cycle.html>, (accessed March 27, 2002).
5. Given the small number of establishments reporting in the Territories, the
results should be viewed with caution.
6. International Organization for Standardization, ISO 9000 and ISO 14000
in Plain Language , <http://www.iso.ch/iso/en/iso9000-14000/tour/
plain.html>, (accessed March 27, 2002).
7. Please see the section on li fe cycle analysis on page 4.
8. Please see the section on eco-labelling of products, page 5.
8/8/2019 Stats Canada Enviromental Technologies
http://slidepdf.com/reader/full/stats-canada-enviromental-technologies 14/62
Environmental Management Practices
Environmental Management and Technologies in the Business Sector Statistics Canada – Catalogue no. 16F0024XIE 5
Overall, 10% of establishments indicated that they wereISO 14000 or equivalent1 certified in 1998 (Table 1.1).These establishments were generally larger (based onemployment), representing 24% of the total employment ofall establishments reporting. Over one-quarter of establish-ments in the Electric Power Generation, Transmission andDistribution and 23% in the Transportation Equipment
industry indicated they were ISO 14000 or equivalentcertified. The next highest proportions were found in theChemicals and Pulp, Paper and Paperboard Mills indus-tries, each with 17% (Table 1.2).
ISO 14000 certification or its equivalent was most prevalentin Ontario and British Columbia (almost 13%), followed byNew Brunswick (11%), Alberta (11%) and Nova Scotia(10%) (Table 1.3).
Environmental voluntary agreements
In recent years, industry and governments have opted to
participate in voluntary programs as an alternative toenvironmental regulations and mandatory programs.2
Voluntary actions include codes of environmentalmanagement practice, environmental guidelines, emissionand waste reduction targets, as well as agreements withgovernments. The best known environmental voluntaryprograms are Environment Canada’s AcceleratedReduction/Elimination of Toxics Program (ARET), theVoluntary Challenge and Registry Program (VCR)3 and theCanadian Chemical Producers’ Association ResponsibleCare© program.
Over one-third of the reporting establishments indicatedthey were involved in an environmental voluntary program
or participated in some form of environmental program suchas Responsible Care© 4 (Table 1.1). Participation in suchprograms varied widely according to the type of industry.For example, in 1998, the Natural Gas Distribution industry(91%), Pipeline Transportation (86%) reported the highestparticipation in voluntary programs, while the Food (12%),Wood Products (14%) and Non-Metallic Mineral Products(11%) reported the lowest participation rates (Table 1.2).Fifty percent of the establishments in New Brunswick andalmost 60% in Alberta indicated they participated in avoluntary program (Table 1.3).
Green procurement policy
Green procurement (or supply management) is theprocurement of goods and services that minimize environ-mental impacts compared with goods and services withsimilar performance requirements.5 When an establishmentis purchasing a particular good or service, the costs and
environmental impacts of the product at various stages of itslife cycle are taken into consideration, such as the processused to manufacture the product (including raw materials),transportation, storing, handling and operating anddisposal.6
Overall, just over 14% of establishments indicated that theyused a green procurement policy in 1998 (Table 1.1). On anindustry basis, several industries reported higher use of agreen procurement policy than the average, such as NaturalGas Distribution (42%), Oil and Gas Extraction (24%), andBeverage and Tobacco Products (23%) (Table 1.2). Withthe exception of Newfoundland and Labrador (22%) mostprovinces reported that between 10% and 20% of
businesses used a green procurement policy in 1998(Table 1.3).
Eco-labelling of products
Eco-labelling programs are designed to encouragemanufacturers and suppliers to develop environmentallypreferable products and services and to help consumersidentify products and services that are less harmful to theenvironment.7 Eco-labelling programs such as Environ-mental Choice (managed by TerraChoice EnvironmentalServices Inc. for Environment Canada) are one element ofISO 14000 (see below).
Overall, just under 6% of establishments that respondedindicated that they produced goods certified by an environ-mental program such as Environmental Choice. The mostprevalent use of “Eco-Logo” certification was in theBeverage and Tobacco Products industry (18%), followedby the Pulp, Paper and Paperboard Mills industry (16%)(Table 1.2).
Annual environmental performancereport
The publication of an annual report on environmental
performance or sustainable development is one indicator of
1. Respondents were asked to indicate if they were ISO 14000 or if they had
an environmental management system in place that was equivalent to ISO
14000.
2. Saint-Laurent Vision 2000, 1996, La réduction des rejets liquides toxiques
des 50 établissements industriels prioritaires du plan d’action Saint-Lau-
rent , Rapport synthèse, 1988–1995, Montréal.
3. VCR Inc. is a non-profit partnership between Industry and governments
across Canada.
4. It is mandatory for businesses who join the Canadian Chemical Producers’
Association to participate in Responsible Care.
5. Treasury Board of Canada Secretariat, Green Procurement Reporting
Framework , <http://www.tbs-sct.gc.ca/cmp/green-vert/grnproc_e.asp>,
(accessed March 27, 2002).
6. International Institute for Sustainable Development, Implementation Tool-
box; Green Procurement , <http://iisd1.iisd.ca/business/gprocurement.
htm>, (accessed May 25, 2000).
7. TerraChoice Environmental Services Inc., Environmental Choice Program ,
<http//:www.environmentalchoice.com/index_main.cfm>, (accessed
March 27, 2002).
8/8/2019 Stats Canada Enviromental Technologies
http://slidepdf.com/reader/full/stats-canada-enviromental-technologies 15/62
Environmental Management Practices
6 Statistics Canada – Catalogue no. 16F0024XIE Environmental Management and Technologies in the Business Sector
a business’ commitment to the environment. Almost 34% ofthe reporting establishments declared that they publishedan environmental or sustainable development report in1998 (representing more than half of the employment)(Table 1.1).
On an industry basis, the proportion of establishments that
produced an environmental report varied between indus-tries. For example, over 60% of the establishments in theNatural Gas Distribution and Pulp, Paper and PaperboardMills industries produced an environmental report, whileestablishments in the Food, and in the Beverage andTobacco Products industries reported 13% and 14%,respectively (Table 1.2).
Provincially, the highest proportions of establishments thatproduced an environmental performance report were foundin the western provinces. Indeed, more than 40% of estab-lishments in Saskatchewan, Alberta and British Columbiareported they produced an environmental or sustainabledevelopment report (Table 1.3).
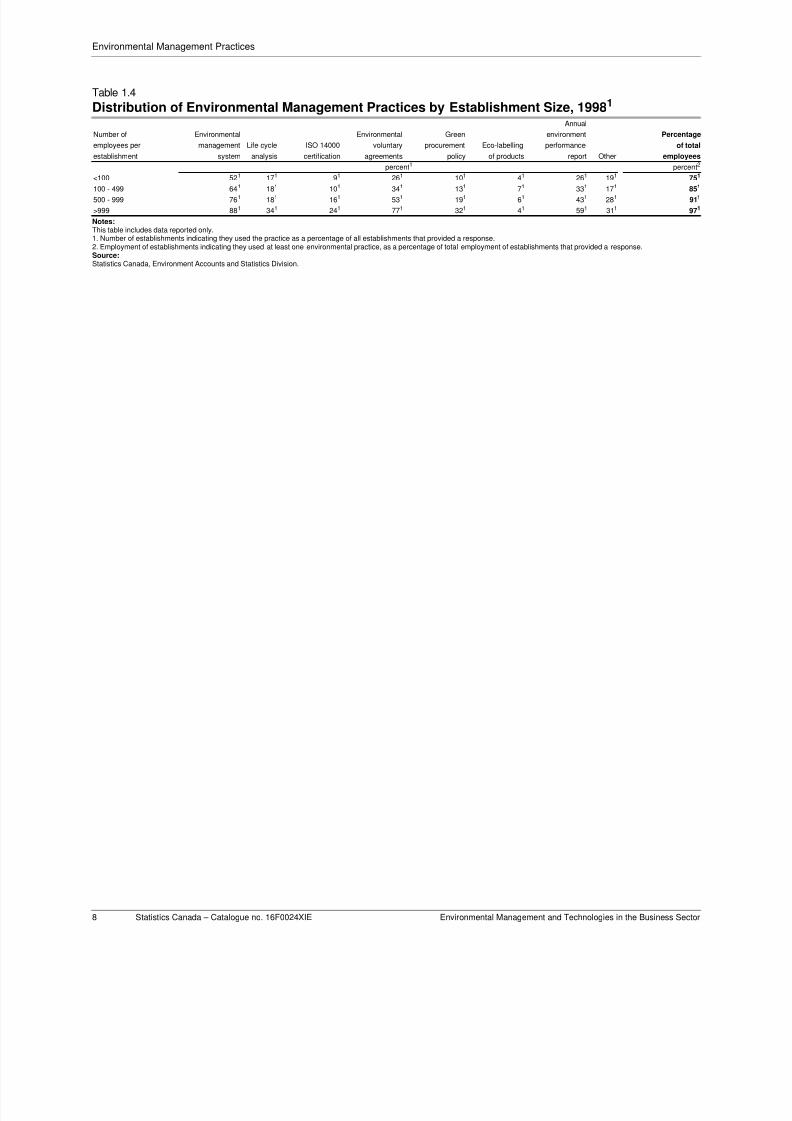
Environmental management practicesand firm size
Table 1.1 provides some evidence that establishments withlarger numbers of employees are also more likely to have atleast one environmental management practice in place.Table 1.4 provides further evidence by grouping establish-ments into four different size categories based onemployment and providing the proportion of establishments
in each category that used the environmental managementpractice.
Overall, the proportion of establishments using an environ-mental management practice increased by each increasingemployment class. Establishments with less than1001 employees, which reported the use of at least one
environmental management practice, represented 75% ofthe total number of employees in that employment category.The proportion was 85% for establishments with 100 to 499employees, 91% for those with 500 to 999 employees and97% for establishments with over 999 employees(Table 1.4).
Eco-labelling, and to a lesser extent, life cycle analysis werethe only practices for which the proportion of firms usingthem did not increase with firm size. In other words, smallerestablishments were just as likely to eco-label their productsas the largest establishments. However, larger establish-ments are more likely to participate in the other environ-mental management practices. For example, almost one
quarter of establishments with more than 999 employeesindicated they were ISO 14000 or equivalent certified. Incomparison, less than 10% of establishments with up to100 employees1 indicated they were ISO 14000 or equiv-alent certified. The adoption of environmental managementpractices can involve significant changes in the way acompany operates and may require large investments thatcan be made more readily by large firms.
1. Establishments in this range had between 50 and 99 employees.
Notes:This table includes data reported only.1. Number of establishments indicating they used the practice as a percentage of all establishments that provided a response.2. Number of establishments indicating they used at least one environmental practice as a percentage of the total number of establishments that provided a response.Source:Statistics Canada, Environment Accounts and Statistics Division.
Table 1.1
Environmental Management Practices by Businesses, 1998Establishments Proportion of establishments Employment share of establishments
Environmental management practice using the practice using the practice1 using the practice
number percent
Environmental management system 8881 641 791
Life cycle analysis 2631 191 321
ISO 14000 Certification 1451 101 241
Environmental voluntary agreements 5141 371 581
Green procurement policy 1981 141 221
Eco-labelling of products 811 61 81
Annual environmental performance report 4781 341 521
Other 711 201 351
Total 1 4551 822 912
8/8/2019 Stats Canada Enviromental Technologies
http://slidepdf.com/reader/full/stats-canada-enviromental-technologies 16/62
Environmental Management Practices
Environmental Management and Technologies in the Business Sector Statistics Canada – Catalogue no. 16F0024XIE 7
Notes:
This table includes data reported only.1. Number of establishments indicating they used the practice as a percentage of all establishments that provided a response.2. Number of establishments indicating they used at least one environmental practice as a percentage of the total number of establishments that provided a response.Source:Statistics Canada, Environment Accounts and Statistics Division.
Notes:This table includes data reported only.1. Number of establishments indicating they used the practice as a percentage of all establishments that provided a response.2. Number of establishments indicating they used at least one environmental practice as a percentage of the total number of establishments that provided a response.3. Includes Nunavut.Source:Statistics Canada, Environment Accounts and Statistics Division.
Table 1.2
Distribution of Environmental Management Practices by Industry, 1998Annual
Environmental Life Environmental Green environmental
management cycle ISO 14000 voluntary procurement Eco-labelling performance
Industry system analysis certification agreements policy of products report Other Total2
percent1
Logging 591 101 171 161 31 51 501 101 721
Oil and Gas Extraction 881 471 31 771 241 61 401 201 931
Mining 721 221 51 511 181 --1 541 381 911
Electric Power Generation, Transmission andDistribution
741 271 271 681 81 121 521 501 931
Natural Gas Distribution 921 251 81 911 421 --1 671 --1 1001
Food 511 91 41 121 121 21 131 81 631
Beverage and Tobacco Products 541 141 31 251 231 181 141 71 781
Wood Products 501 91 51 141 91 61 281 121 691
Pulp, Paper and Paperboard Mills 701 111 171 651 111 161 631 211 951
Petroleum and Coal Products 741 521 71 581 111 111 481 501 881
Chemicals 691 281 171 461 171 91 341 281 891
Non-Metallic Mineral Products 611 171 51 111 141 31 311 141 751
Primary Metals 581 131 61 281 111 --1 181 131 821
Transportation Equipment 621 191 221 261 191 21 231 171 811
Pipeline Transportation 901 431 51 861 141 --1 521 331 1001
Total2 641 191 101 371 141 61 341 201 821
Table 1.3
Distribution of Environmental Management Practices by Province and Territory, 1998Annual
Environmental Life Environmental Green environmental
management cycle ISO 14000 voluntary procurement Eco-labelling performance
Province/Territory system analysis certification agreements policy of products report Other Total2
percent1
Newfoundland and Labrador 781 101 91 411 221 41 231 171 871
Prince Edward Island 501 171 --1 --1 --1 --1 --1 --1 571
Nova Scotia 551 31 101 281 101 31 201 361 771
New Brunswick 741 191 111 501 91 91 401 331 891
Quebec 541 121 71 311 81 51 321 91 771
Ontario 641 221 131 341 181 61 281 221 841
Manitoba 571 221 21 311 151 21 171 361 891
Saskatchewan 631 171 41 421 171 41 501 331 831
Alberta 741 301 111 581 191 91 441 251 861
British Columbia 671 161 131 301 121 51 451 121 811
Yukon and Northwest Territories3 671 381 --1 381 111 --1 381 1001 891
Total2 641 191 101 371 141 61 341 201 821
8/8/2019 Stats Canada Enviromental Technologies
http://slidepdf.com/reader/full/stats-canada-enviromental-technologies 17/62
Environmental Management Practices
8 Statistics Canada – Catalogue no. 16F0024XIE Environmental Management and Technologies in the Business Sector
Notes:This table includes data reported only.1. Number of establishments indicating they used the practice as a percentage of all establishments that provided a response.2. Employment of establishments indicating they used at least one environmental practice, as a percentage of total employment of establishments that provided a response.Source:Statistics Canada, Environment Accounts and Statistics Division.
Table 1.4
Distribution of Environmental Management Practices by Establishment Size, 19981
Annual
Number of Environmental Environmental Green environment Percentage
employees per management Life cycle ISO 14000 voluntary procurement Eco-labelling performance of total
establishment system analysis certification agreements policy of products report Other employees
percent1 percent2
<100 521 171 91 261 101 41 261 191 751
100 - 499 641 181 101 341 131 71 331 171 851
500 - 999 761 181 161 531 191 61 431 281 911
>999 881 341 241 771 321 41 591 311 971
8/8/2019 Stats Canada Enviromental Technologies
http://slidepdf.com/reader/full/stats-canada-enviromental-technologies 18/62
Pollution Prevention Methods
Environmental Management and Technologies in the Business Sector Statistics Canada – Catalogue no. 16F0024XIE 9
2 Pollution Prevention
Methods1
Pollution prevention is the elimination of the causes ofpollution rather than the treatment of waste or pollution afterit is generated (Text Box 2.1). It involves continuousimprovement through changes in product design,technology, operations and behaviour. Pollution preventionis seen as a more effective way of protecting the
environment than the traditional end-of-pipe2 methods andcan even lead to lower production costs.3 In preparation ofthe renewed 1999 Canadian Environmental Protection Act
(CEPA), pollution prevention was the underlying principal ofthe Act. The Preamble declares that “the protection of theenvironment is essential to the well-being of Canadians andthat the primary purpose of this Act is to contribute to
sustainable development through pollution prevention”.4
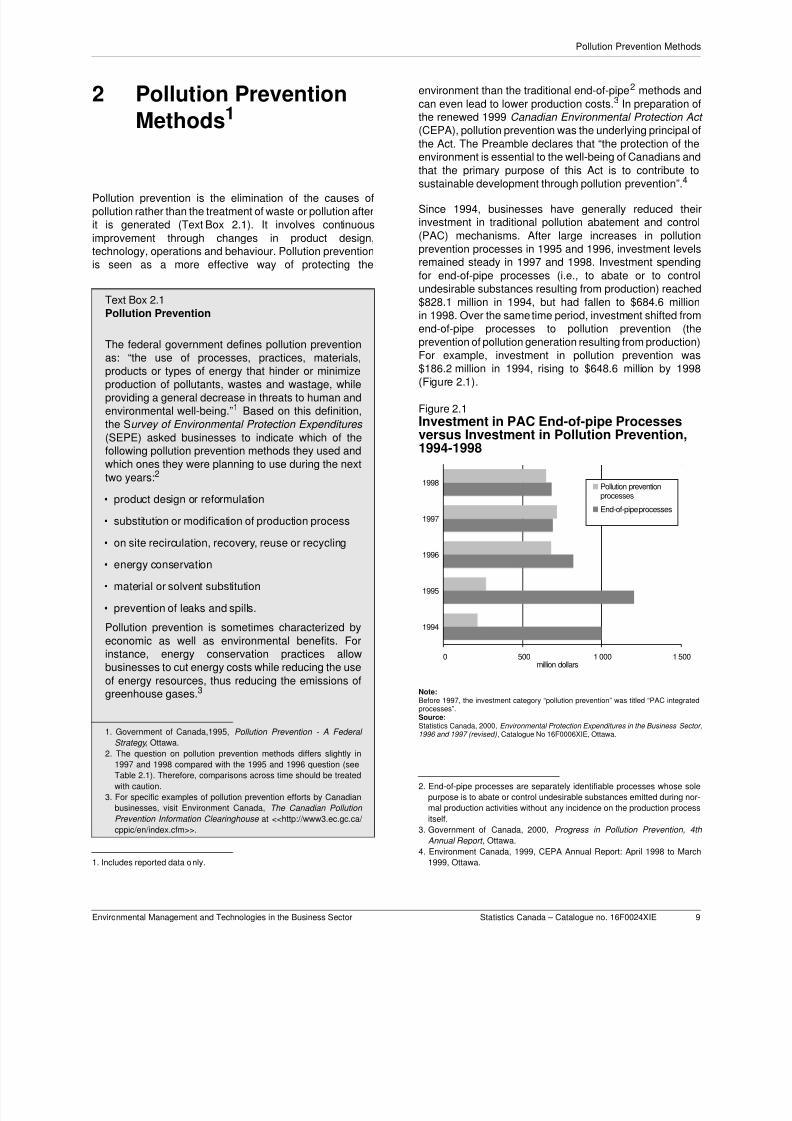
Since 1994, businesses have generally reduced theirinvestment in traditional pollution abatement and control(PAC) mechanisms. After large increases in pollutionprevention processes in 1995 and 1996, investment levelsremained steady in 1997 and 1998. Investment spendingfor end-of-pipe processes (i.e., to abate or to controlundesirable substances resulting from production) reached$828.1 million in 1994, but had fallen to $684.6 millionin 1998. Over the same time period, investment shifted fromend-of-pipe processes to pollution prevention (theprevention of pollution generation resulting from production)For example, investment in pollution prevention was
$186.2 million in 1994, rising to $648.6 million by 1998(Figure 2.1).
Figure 2.1Investment in PAC End-of-pipe Processesversus Investment in Pollution Prevention,1994-1998
Note:Before 1997, the investment category “pollution prevention” was titled “PAC integratedprocesses”.Source:Statistics Canada, 2000, Environmental Protection Expenditures in the Business Sector,1996 and 1997 (revised), Catalogue No 16F0006XIE, Ottawa.
1. Includes reported data only.
2. End-of-pipe processes are separately identifiable processes whose sole
purpose is to abate or control undesirable substances emitted during nor-
mal production activities without any incidence on the production process
itself.
3. Government of Canada, 2000, Progress in Pollution Prevention, 4th
Annual Report , Ottawa.
4. Environment Canada, 1999, CEPA Annual Report: April 1998 to March
1999, Ottawa.
0 500 1 000 1 500
1994
1995
1996
1997
1998
million dollars
Pollution preventionprocesses
End-of-pipe processes
Text Box 2.1Pollution Prevention
The federal government defines pollution preventionas: “the use of processes, practices, materials,
products or types of energy that hinder or minimizeproduction of pollutants, wastes and wastage, whileproviding a general decrease in threats to human andenvironmental well-being.”1 Based on this definition,the Survey of Environmental Protection Expenditures
(SEPE) asked businesses to indicate which of thefollowing pollution prevention methods they used andwhich ones they were planning to use during the nexttwo years:2
• product design or reformulation
• substitution or modification of production process
• on site recirculation, recovery, reuse or recycling
• energy conservation
• material or solvent substitution
• prevention of leaks and spills.
Pollution prevention is sometimes characterized byeconomic as well as environmental benefits. Forinstance, energy conservation practices allowbusinesses to cut energy costs while reducing the useof energy resources, thus reducing the emissions ofgreenhouse gases.3
1. Government of Canada,1995, Pollution Prevention - A Federal
Strategy , Ottawa.
2. The question on pollution prevention methods differs slightly in
1997 and 1998 compared with the 1995 and 1996 question (see
Table 2.1). Therefore, comparisons across time should be treated
with caution.
3. For specific examples of pollution prevention efforts by Canadian
businesses, visit Environment Canada, The Canadian Pollution
Prevention Information Clearinghouse at <<http://www3.ec.gc.ca/
cppic/en/index.cfm>>.
8/8/2019 Stats Canada Enviromental Technologies
http://slidepdf.com/reader/full/stats-canada-enviromental-technologies 19/62
Pollution Prevention Methods
10 Statistics Canada – Catalogue no. 16F0024XIE Environmental Management and Technologies in the Business Sector
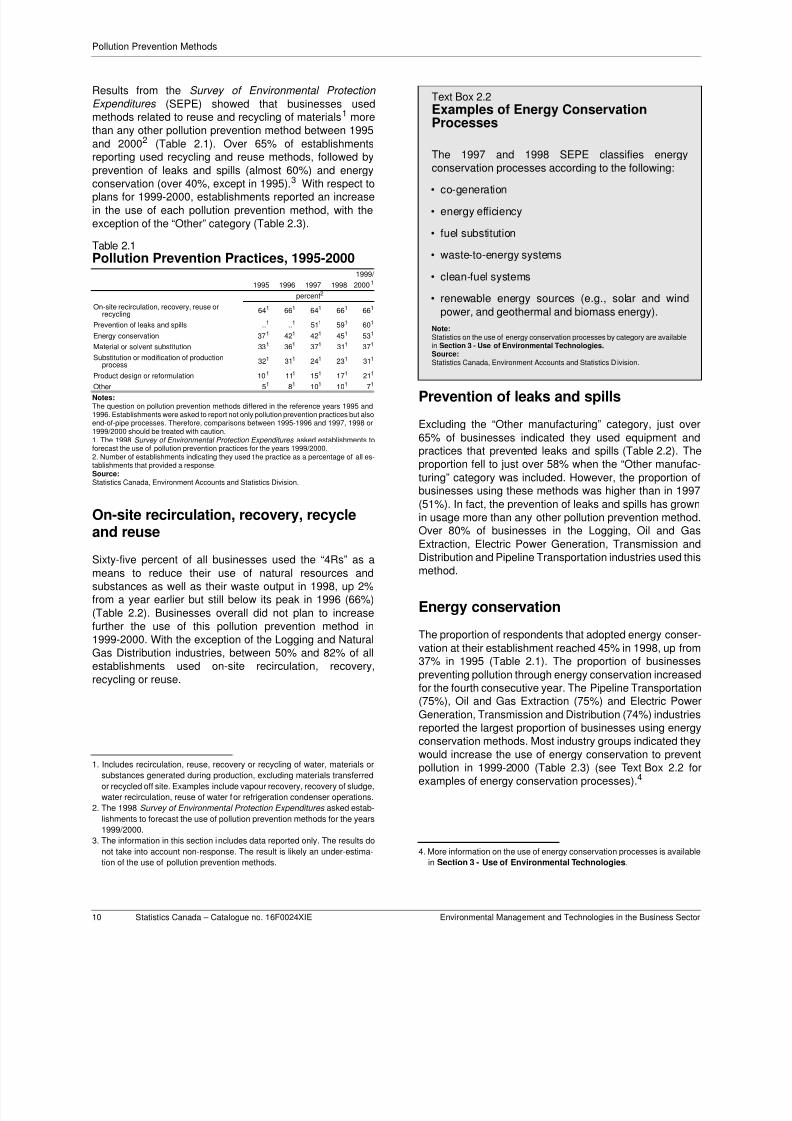
Results from the Survey of Environmental Protection
Expenditures (SEPE) showed that businesses usedmethods related to reuse and recycling of materials1 morethan any other pollution prevention method between 1995and 20002 (Table 2.1). Over 65% of establishmentsreporting used recycling and reuse methods, followed byprevention of leaks and spills (almost 60%) and energy
conservation (over 40%, except in 1995).3 With respect toplans for 1999-2000, establishments reported an increasein the use of each pollution prevention method, with theexception of the “Other” category (Table 2.3).
Notes:The question on pollution prevention methods differed in the reference years 1995 and1996. Establishments were asked to report not only pollution prevention practices but alsoend-of-pipe processes. Therefore, comparisons between 1995-1996 and 1997, 1998 or1999/2000 should be treated with caution.1. The 1998 Survey of Environmental Protection Expenditures asked establishments toforecast the use of pollution prevention practices for the years 1999/2000.2. Number of establishments indicating they used the practice as a percentage of all es-tablishments that provided a response.Source:Statistics Canada, Environment Accounts and Statistics Division.
On-site recirculation, recovery, recycleand reuse
Sixty-five percent of all businesses used the “4Rs” as ameans to reduce their use of natural resources andsubstances as well as their waste output in 1998, up 2%from a year earlier but still below its peak in 1996 (66%)(Table 2.2). Businesses overall did not plan to increasefurther the use of this pollution prevention method in1999-2000. With the exception of the Logging and NaturalGas Distribution industries, between 50% and 82% of allestablishments used on-site recirculation, recovery,recycling or reuse.
Prevention of leaks and spills
Excluding the “Other manufacturing” category, just over65% of businesses indicated they used equipment andpractices that prevented leaks and spills (Table 2.2). Theproportion fell to just over 58% when the “Other manufac-turing” category was included. However, the proportion ofbusinesses using these methods was higher than in 1997(51%). In fact, the prevention of leaks and spills has grownin usage more than any other pollution prevention method.Over 80% of businesses in the Logging, Oil and GasExtraction, Electric Power Generation, Transmission and
Distribution and Pipeline Transportation industries used thismethod.
Energy conservation
The proportion of respondents that adopted energy conser-vation at their establishment reached 45% in 1998, up from37% in 1995 (Table 2.1). The proportion of businessespreventing pollution through energy conservation increasedfor the fourth consecutive year. The Pipeline Transportation(75%), Oil and Gas Extraction (75%) and Electric PowerGeneration, Transmission and Distribution (74%) industriesreported the largest proportion of businesses using energy
conservation methods. Most industry groups indicated theywould increase the use of energy conservation to preventpollution in 1999-2000 (Table 2.3) (see Text Box 2.2 forexamples of energy conservation processes).4
1. Includes recirculation, reuse, recovery or recycling of water, materials or
substances generated during production, excluding materials transferred
or recycled off site. Examples include vapour recovery, recovery of sludge,
water recirculation, reuse of water for refrigeration condenser operations.
2. The 1998 Survey of Environmental Protection Expenditures asked estab-
lishments to forecast the use of pollution prevention methods for the years
1999/2000.
3. The information in this section includes data reported only. The results do
not take into account non-response. The result is likely an under-estima-
tion of the use of pollution prevention methods.
Table 2.1Pollution Prevention Practices, 1995-2000
1999/
1995 1996 1997 1998 20001
percent2
On-site recirculation, recovery, reuse orrecycling
641 661 641 661 661
Prevention of leaks and spills ..1 ..1 511 591 601
Energy conservation 371 421 421 451 531
Material or solvent substitution 331 361 371 311 371
Substitution or modification of productionprocess
321 311 241 231 311
Product design or reformulation 101 111 151 171 211
Other 51 81 101 101 71
4. More information on the use of energy conservation processes is available
in Section 3 - Use of Environmental Technologies.
Text Box 2.2Examples of Energy ConservationProcesses
The 1997 and 1998 SEPE classifies energyconservation processes according to the following:
• co-generation
• energy efficiency
• fuel substitution
• waste-to-energy systems
• clean-fuel systems
• renewable energy sources (e.g., solar and windpower, and geothermal and biomass energy).
Note:Statistics on the use of energy conservation processes by category are availablein Section 3 - Use of Environmental Technologies.Source:Statistics Canada, Environment Accounts and Statistics D ivision.
8/8/2019 Stats Canada Enviromental Technologies
http://slidepdf.com/reader/full/stats-canada-enviromental-technologies 20/62
Pollution Prevention Methods
Environmental Management and Technologies in the Business Sector Statistics Canada – Catalogue no. 16F0024XIE 11
Substitution or modification ofproduction process
The popularity of substitution or modification of productionprocesses (e.g. integrated production processes) hasdeclined since 1995. While 23% of businesses indicatedthey used this process in 1998, this was down from 32% in1995 (Table 2.1). On an industry basis, the largest propor-tions of establishments reporting substitution or modifi-cation of production processes were in Oil and GasExtraction (35%) and Refined Petroleum and Coal Products(32%). All industry groups reported that they would increasethe use of substitution or modification of productionprocesses as a method of preventing pollution in 1999-2000(Tables 2.2 and 2.3).
Material or solvent substitution
Businesses may also reduce pollution by substitutingmaterials or solvents used in production with less harmful
ones, or with ones that require less natural resources orenergy to produce or use. After increasing from 1995 to1997, the proportion of businesses that used material orsolvent substitution as a method of pollution prevention fellfrom 37% in 1997 to 31% in 1998 (Table 2.1). Over 50% ofthe businesses in the Electric Power Generation, Trans-mission and Distribution and Transportation Equipmentindustries indicated they used this method in 1998(Table 2.2). All industry groups reported that they wouldincrease the use of material and solvent substitution as amethod of preventing pollution in 1999-2000 (Table 2.3).
Product design or reformulationThe least reported pollution prevention method was productdesign or reformulation with just under 17% of respondentsusing this method in 1998. Within the industry groups, therewas a wide range of adoption, from 6% in the Miningindustry to just under 30% in the Chemicals industry(Table 2.2). This activity kept increasing in popularity withthe proportion of establishments using product redesignsteadily increasing from 10% in 1995 to 17% in 1998 (and aforecast of 21% for 1999-2000).
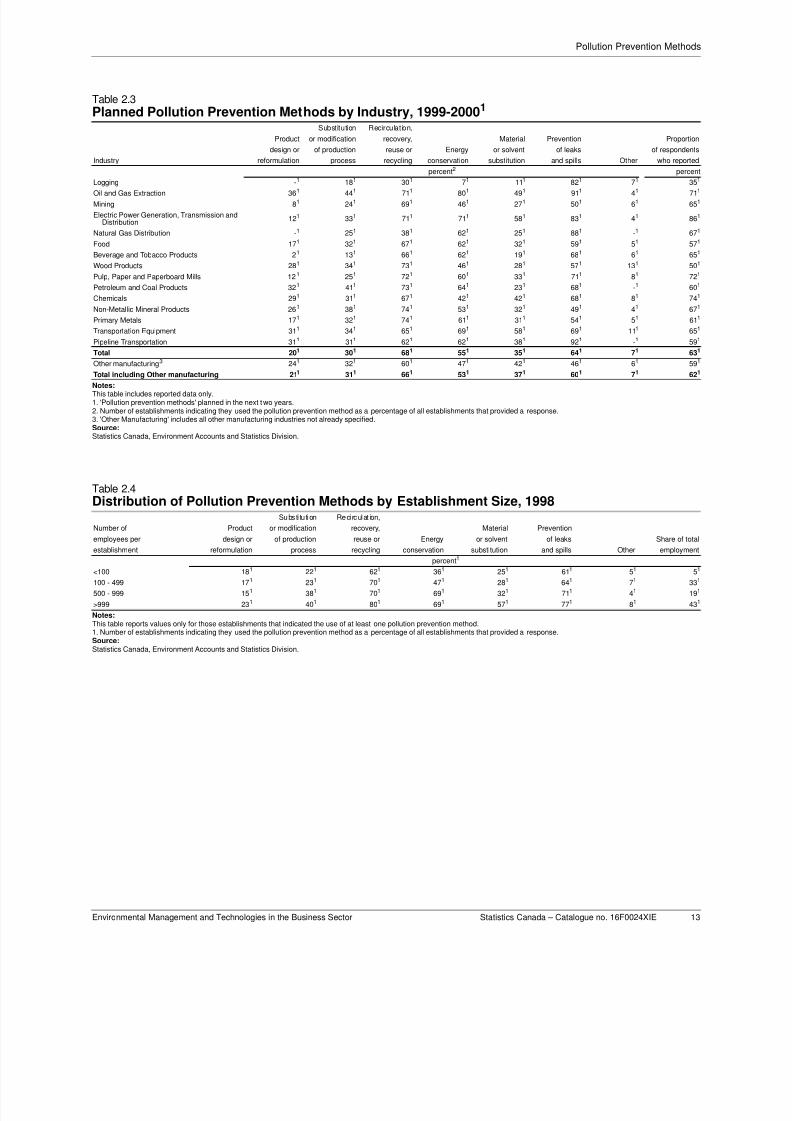
Pollution prevention methods and firm
sizeTable 2.4 groups establishments into four different sizecategories based on employment and provides the propor-tions of establishments in each category that used thepollution prevention method. Although smaller establish-ments with less than 100 employees1 were as likely to beusing certain pollution prevention methods as larger estab-
lishments, methods such as material or solvent substitution,energy efficiency and substitution or modification ofproduction process were more likely to be in use in thelarger establishments. For example, almost two thirds ofestablishments with 1 000 or more employees indicatedthey substituted materials or solvents in 1998 comparedwith one quarter of establishments with less than100 employees2.
1. Between 50 and 99 employees. 2. Ibid .
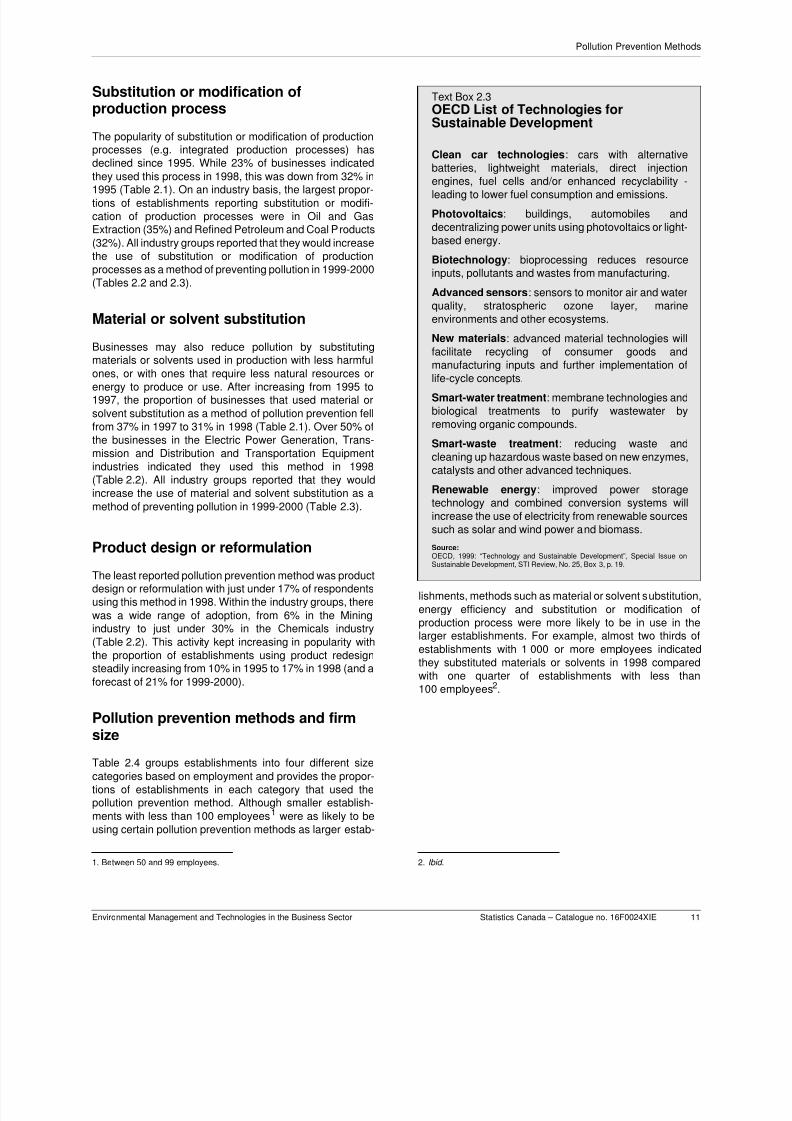
Text Box 2.3OECD List of Technologies forSustainable Development
Clean car technologies: cars with alternativebatteries, lightweight materials, direct injection
engines, fuel cells and/or enhanced recyclability -leading to lower fuel consumption and emissions.
Photovoltaics: buildings, automobiles anddecentralizing power units using photovoltaics or light-based energy.
Biotechnology: bioprocessing reduces resourceinputs, pollutants and wastes from manufacturing.
Advanced sensors: sensors to monitor air and waterquality, stratospheric ozone layer, marineenvironments and other ecosystems.
New materials: advanced material technologies willfacilitate recycling of consumer goods and
manufacturing inputs and further implementation oflife-cycle concepts.
Smart-water treatment: membrane technologies andbiological treatments to purify wastewater byremoving organic compounds.
Smart-waste treatment: reducing waste andcleaning up hazardous waste based on new enzymes,catalysts and other advanced techniques.
Renewable energy: improved power storagetechnology and combined conversion systems willincrease the use of electricity from renewable sourcessuch as solar and wind power and biomass.
Source:
OECD, 1999: “Technology and Sustainable Development”, Special Issue onSustainable Development, STI Review, No. 25, Box 3, p. 19.
8/8/2019 Stats Canada Enviromental Technologies
http://slidepdf.com/reader/full/stats-canada-enviromental-technologies 21/62
Pollution Prevention Methods
12 Statistics Canada – Catalogue no. 16F0024XIE Environmental Management and Technologies in the Business Sector
Pollution prevention by province andterritory
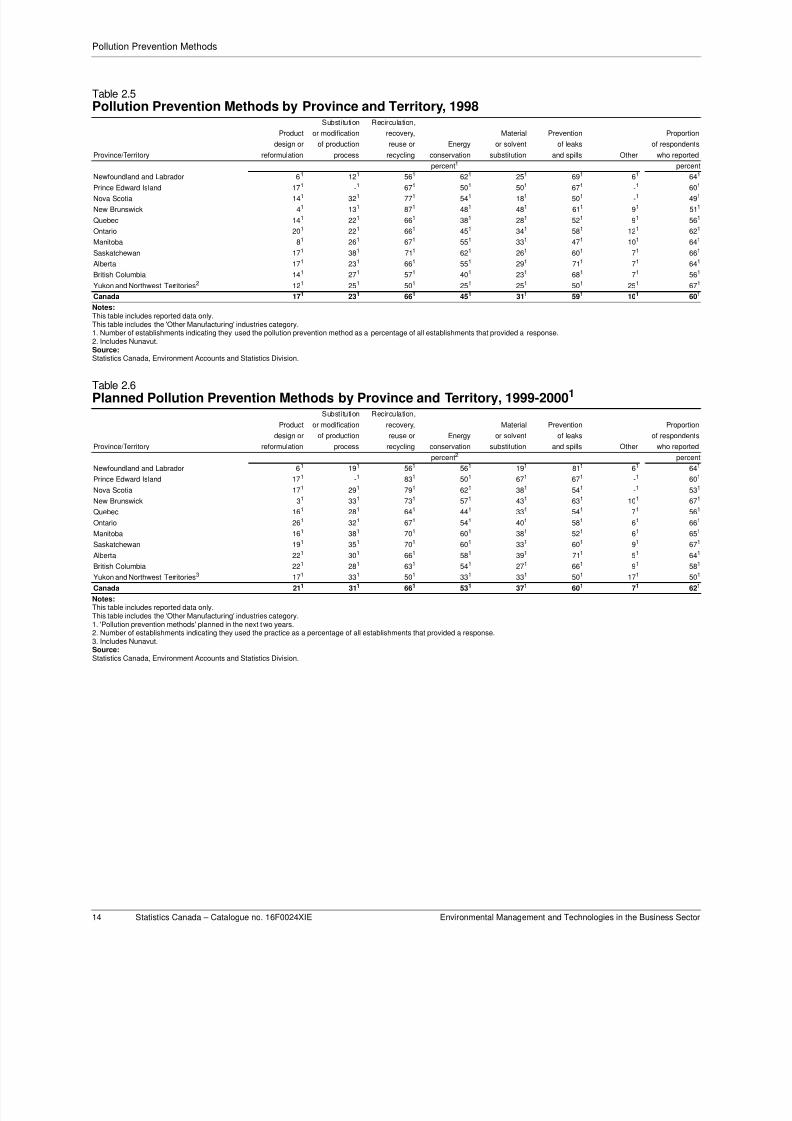
Although the “4Rs” was the most frequent pollutionprevention method adopted by businesses overall, inNewfoundland and Labrador, Saskatchewan and Alberta, alarger proportion of establishments (over 66%) reported theprevention of leaks and spills than any other pollutionprevention method in 1998 (Table 2.5). Energy conser-vation was the second most popular pollution preventionmethod used in Newfoundland and Labrador (63%), NovaScotia (55%), Manitoba (55%) and Saskatchewan (62%),above the Canadian average proportion of 45%.
Notes:This table includes reported data only.1. Number of establishments indicating they used the pollution prevention method as a percentage of all establishments that provided a response.2. 'Other Manufacturing' includes all other manufacturing industries not already specified.Source:Statistics Canada, Environment Accounts and Statistics Division.
Table 2.2Pollution Prevention Methods by Industry, 1998
Substitution Recirculation,
Product or modification recovery, Material Prevention Proportion of
design or of production reuse or Energy or solvent of leaks respondentsIndustry reformulation process recycling conservation substitution and spills Other who reported
percent1 percent
Logging -1 151 331 121 31 821 31 431
Oil and Gas Extraction 271 351 711 751 401 881 61 761
Mining 61 181 671 421 211 531 81 641
Electric Power Generation, Transmission andDistribution
131 221 651 741 521 871 41 821
Natural Gas Distribution -1 251 381 621 251 751 -1 671
Food 131 261 721 611 341 541 31 541
Beverage and Tobacco Products 81 161 501 501 241 631 101 531
Wood Products 231 251 621 401 221 581 121 461
Pulp, Paper and Paperboard Mills 101 241 761 541 381 731 71 641
Petroleum and Coal Products 261 321 741 631 261 791 -1 511
Chemicals 301 241 721 331 271 711 41 701
Non-Metallic Mineral Products 181 201 671 511 271 491 91 641
Primary Metals 141 281 821 541 311 551 61 591
Transportation Equipment 211 251 691 561 511 691 81 651
Pipeline Transportation 251 251 581 751 331 921 -1 541
Total 171 241 691 491 311 651 61 601
Other manufacturing2 151 201 561 341 311 391 201 601
Total including Other manufacturing 171 231 661 451 311 591 101 601
8/8/2019 Stats Canada Enviromental Technologies
http://slidepdf.com/reader/full/stats-canada-enviromental-technologies 22/62
Pollution Prevention Methods
Environmental Management and Technologies in the Business Sector Statistics Canada – Catalogue no. 16F0024XIE 13
Notes:This table includes reported data only.1. 'Pollution prevention methods' planned in the next two years.2. Number of establishments indicating they used the pollution prevention method as a percentage of all establishments that provided a response.3. 'Other Manufacturing' includes all other manufacturing industries not already specified.Source:Statistics Canada, Environment Accounts and Statistics Division.
Notes:This table reports values only for those establishments that indicated the use of at least one pollution prevention method.1. Number of establishments indicating they used the pollution prevention method as a percentage of all establishments that provided a response.Source:Statistics Canada, Environment Accounts and Statistics Division.
Table 2.3Planned Pollution Prevention Methods by Industry, 1999-20001
Substitution Recirculation,
Product or modification recovery, Material Prevention Proportion
design or of production reuse or Energy or solvent of leaks of respondents
Industry reformulation process recycling conservation substitution and spills Other who reported
percent2 percent
Logging -1
181
301
71
111
821
71
351
Oil and Gas Extraction 361 441 711 801 491 911 41 711
Mining 81 241 691 461 271 501 61 651
Electric Power Generation, Transmission andDistribution
121 331 711 711 581 831 41 861
Natural Gas Distribution -1 251 381 621 251 881 -1 671
Food 171 321 671 621 321 591 51 571
Beverage and Tobacco Products 21 131 661 621 191 681 61 651
Wood Products 281 341 731 461 281 571 131 501
Pulp, Paper and Paperboard Mills 121 251 721 601 331 711 81 721
Petroleum and Coal Products 321 411 731 641 231 681 -1 601
Chemicals 291 311 671 421 421 681 81 741
Non-Metallic Mineral Products 261 381 741 531 321 491 41 671
Primary Metals 171 321 741 611 311 541 51 611
Transportation Equipment 311 341 651 691 581 691 111 651
Pipeline Transportation 311 311 621 621 381 921 -1 591
Total 201 301 681 551 351 641 71 631
Other manufacturing3 241 321 601 471 421 461 61 591
Total including Other manufacturing 211 311 661 531 371 601 71 621
Table 2.4Distribution of Pollution Prevention Methods by Establishment Size, 1998
Substi tu tion Reci rculat ion,
Number of Product or modification recovery, Material Prevention
employees per design or of production reuse or Energy or solvent of leaks Share of total
establishment reformulation process recycling conservation substitution and spills Other employment
percent1
<100 181 221 621 361 251 611 51 51
100 - 499 171 231 701 471 281 641 71 331
500 - 999 151 381 701 691 321 711 41 191
>999 231 401 801 691 571 771 81 431
8/8/2019 Stats Canada Enviromental Technologies
http://slidepdf.com/reader/full/stats-canada-enviromental-technologies 23/62
Pollution Prevention Methods
14 Statistics Canada – Catalogue no. 16F0024XIE Environmental Management and Technologies in the Business Sector
Notes:This table includes reported data only.This table includes the 'Other Manufacturing' industries category.1. Number of establishments indicating they used the pollution prevention method as a percentage of all establishments that provided a response.2. Includes Nunavut.Source:Statistics Canada, Environment Accounts and Statistics Division.
Notes:This table includes reported data only.This table includes the 'Other Manufacturing' industries category.1. 'Pollution prevention methods' planned in the next two years.2. Number of establishments indicating they used the practice as a percentage of all establishments that provided a response.3. Includes Nunavut.Source:Statistics Canada, Environment Accounts and Statistics Division.
Table 2.5Pollution Prevention Methods by Province and Territory, 1998
Substitution Recirculation,
Product or modification recovery, Material Prevention Proportion
design or of production reuse or Energy or solvent of leaks of respondents
Province/Territory reformulation process recycling conservation substitution and spills Other who reported
percent1 percent
Newfoundland and Labrador 61 121 561 621 251 691 61 641
Prince Edward Island 171 -1 671 501 501 671 -1 601
Nova Scotia 141 321 771 541 181 501 -1 491
New Brunswick 41 131 871 481 481 611 91 511
Quebec 141 221 661 381 281 521 91 561
Ontario 201 221 661 451 341 581 121 621
Manitoba 81 261 671 551 331 471 101 641
Saskatchewan 171 381 711 621 261 601 71 661
Alberta 171 231 661 551 291 711 71 641
British Columbia 141 271 571 401 231 681 71 561
Yukon and Northwest Territories2 121 251 501 251 251 501 251 671
Canada 171 231 661 451 311 591 101 601
Table 2.6Planned Pollution Prevention Methods by Province and Territory, 1999-20001
Substitution Recirculation,
Product or modification recovery, Material Prevention Proportion
design or of production reuse or Energy or solvent of leaks of respondents
Province/Territory reformulation process recycling conservation substitution and spills Other who reported
percent2 percent
Newfoundland and Labrador 61 191 561 561 191 811 61 641
Prince Edward Island 171 -1 831 501 671 671 -1 601
Nova Scotia 171 291 791 621 381 541 -1 531
New Brunswick 31 331 731 571 431 631 101 671
Quebec 161 281 641 441 331 541 71 561
Ontario 261 321 671 541 401 581 61 661
Manitoba 161 381 701 601 381 521 61 651
Saskatchewan 191 351 701 601 331 601 91 671
Alberta 221 301 661 581 391 711 51 641
British Columbia 221 281 631 541 271 661 91 581
Yukon and Northwest Territories3 171 331 501 331 331 501 171 501
Canada 211 311 661 531 371 601 71 621
8/8/2019 Stats Canada Enviromental Technologies
http://slidepdf.com/reader/full/stats-canada-enviromental-technologies 24/62
Use of Environmental Technologies
Environmental Management and Technologies in the Business Sector Statistics Canada – Catalogue no. 16F0024XIE 15
3 Use of Environmental
Technologies
Businesses use a number of technologies aimed atpreventing or abating pollution. Examples include technol-ogies to reduce gaseous emissions, liquid waste, noise,radiation and vibration, technologies to clean up soil (sitereclamation technologies and solid waste managementtreatment), and energy conservation technologies.
The 1998 edition of the Survey of Environmental Protection
Expenditures (SEPE) included a question on business useof environmental technologies (Text Box 3.1). This sectionprovides a profile of the use of environmental technologiesused by industry. It focuses on the use of pollutionabatement technologies but also looks at examples of
pollution prevention technologies such as energy conser-vation.
The SEPE asked respondents to indicate the type oftechnology used by the establishment to mitigate threemain types of emissions: gaseous emissions, liquid wasteand solid waste management. The survey also includedtechnologies related to site reclamation and decommis-sioning, energy conservation and the control of noise,vibration and radiation. And where appropriate, the technol-ogies were further broken down into physical, chemical,biological and thermal technologies (Text Box 3.1).
Approximately 80% of the respondents sent a questionnaire
indicated they used at least one of the environmentaltechnologies listed on the questionnaire.1
Text Boxes 3.2 to 3.6 provide examples of industrialemissions to air, water and land, as well as explanations ofenergy conservation technologies. Detailed data tables arelocated at the end of the section. Readers should refer tothese if more information is needed beyond that which isfound in the text.
1. The other 20% of respondents either did not treat pollution, or used other
technologies than those listed or did not respond. For more detail on
response rates, see Section 4 – Concepts, Methodology and Data
Quality.
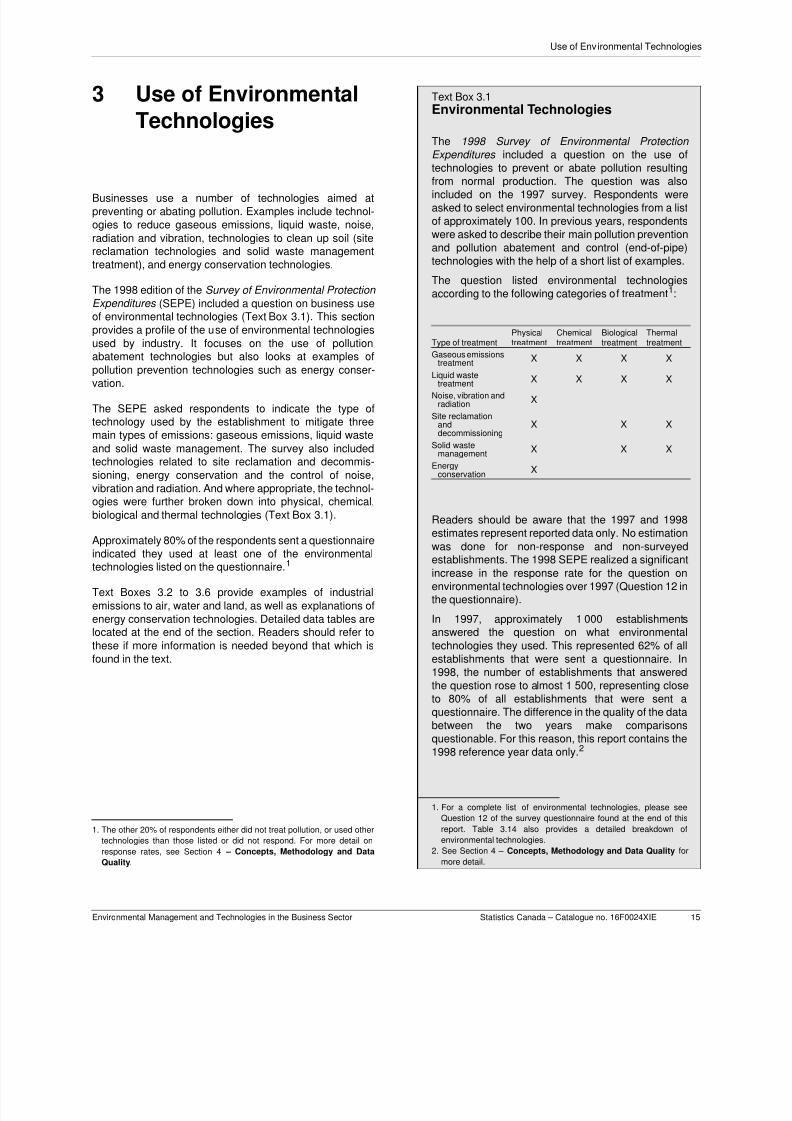
Text Box 3.1Environmental Technologies
The 1998 Survey of Environmental Protection
Expenditures included a question on the use oftechnologies to prevent or abate pollution resulting
from normal production. The question was alsoincluded on the 1997 survey. Respondents wereasked to select environmental technologies from a listof approximately 100. In previous years, respondentswere asked to describe their main pollution preventionand pollution abatement and control (end-of-pipe)technologies with the help of a short list of examples.
The question listed environmental technologiesaccording to the following categories of treatment1:
Readers should be aware that the 1997 and 1998estimates represent reported data only. No estimationwas done for non-response and non-surveyedestablishments. The 1998 SEPE realized a significantincrease in the response rate for the question onenvironmental technologies over 1997 (Question 12 inthe questionnaire).
In 1997, approximately 1 000 establishmentsanswered the question on what environmentaltechnologies they used. This represented 62% of allestablishments that were sent a questionnaire. In1998, the number of establishments that answeredthe question rose to almost 1 500, representing closeto 80% of all establishments that were sent aquestionnaire. The difference in the quality of the databetween the two years make comparisons
questionable. For this reason, this report contains the1998 reference year data only.2
Type of treatmentPhysicaltreatment
Chemicaltreatment
Biologicaltreatment
Thermaltreatment
Gaseous emissionstreatment X X X X
Liquid wastetreatment X X X X
Noise, vibration andradiation X
Site reclamationanddecommissioning
X X X
Solid wastemanagement X X X
Energyconservation
X
1. For a complete list of environmental technologies, please see
Question 12 of the survey questionnaire found at the end of this
report. Table 3.14 also provides a detailed breakdown of
environmental technologies.
2. See Section 4 – Concepts, Methodology and Data Quality for
more detail.
8/8/2019 Stats Canada Enviromental Technologies
http://slidepdf.com/reader/full/stats-canada-enviromental-technologies 25/62
Environmental technologies by emissions treated
16 Statistics Canada – Catalogue no. 16F0024XIE Environmental Management and Technologies in the Business Sector
3.1 Environmentaltechnologies byemissions treated
Businesses may use more than one environmental
technology. They may use several technologies aimed atreducing one particular group of pollutants or they may usevarious technologies in order to deal with different types ofpollutants.1 Almost 1 080 establishments indicated theytreated gaseous (air) emissions. Three-quarters of theseestablishments employed physical treatment technologies,such as a bag house (a chamber for holding bag filters usedto filter gas steams from a furnace); or a dust collectorsystem (Table 3.14). Establishments were less likely toemploy other physical treatments. Biological treatment wasreported by 8% of establishments, chemical treatment by35% and thermal treatment by 36%.
Just over 1 060 establishments indicated they used one or
more of the environmental technologies to treat liquidwaste. About 85% of these also used physical treatmenttechnologies, such as primary clarification, gravity oil/waterseparation and screening. Half of the establishmentsreported using chemical treatment for liquid wastes, such asneutralisation and flocculation - a process bringing destabi-lized or coagulated particles together to form larger massesfor settling. Forty percent indicated the use of biologicaltreatments such as anaerobic treatment (septic tank) andaerobic lagoons or activated sludge dewatering.
Of the 1 262 establishments that reported solid wastemanagement, over 90% used a physical treatment process,primarily containers and compactors. Of those establish-
ments that reported biological treatment for solid wastetreatment, 57% used landfarming and 23% composting.
Almost 600 establishments reported site reclamation anddecommissioning. The majority of these establishments(65%) indicated they employed physical treatment andtechnologies such as excavation and underground storagetanks. Less than 30% reported a biological treatmentmethod such as biological degradation by aeration orbioventilation2, and bioremediation3.
1. The number of technologies used varies according to the nature of the
environmental problem, the complexity of the solution required (for
instance, a filtration system may require the simultaneous use of a
membrane filter and an activated carbon filter), the type of production
process, the industry, or the technological expertise or availability.
2. Biological degradation by aeration or bioventilation is the injection of air
into the contaminated layer to encourage biodegradation of organic
contaminants (light hydrocarbons, gasoline, diesel) and draw them out
with the gaseous effluent.
3. Bioremediation uses naturally occurring or genetically modified micro-
organisms to breakdown hazardous substances into less hazardous
substances.
Text Box 3.2Examples of Substances Emitted to Air
Greenhouse gas (GHG) emissions: the mostimportant GHGs produced by economic activity arecarbon dioxide (CO2), methane (CH4), nitrous oxide(N2O) and chlorofluorocarbons (CFCs). The mainemitting industries are those that use energy with highintensity: mining; crude petroleum; cement; smeltingand refining of metal ores; pulp and paper; andelectricity production.
Dioxins and furans: Waste incineration is a majorsource of release of these chemicals to air. Industrialsources include iron manufacturing (sintering plants),pulp and paper (combustion of salt-laden wood) andsteel manufacturing (electric arc furnaces).
NPRI substances1 - Top on-site releases to air in1998 were:
• ammonia
• sulphuric acid
• methanol
• hydrochloric acid
• xylene
• toluene
Criteria air contaminants2: total particulate matter(mining, iron ore), fine particulate matter (wood, pulpand paper) and suspended particulate matter (mining,thermal power generation); sulphur oxides (oil andgas processing, ore smelting); nitrogen oxides (NOx)(upstream oil and gas industry); volatile organiccompounds (VOCs) (upstream oil and gas industry);
carbon monoxide (CO) (wood, iron and steel andaluminium processes).Particulates, VOCs and NOx cause smog.
Ozone-depleting substances: CFCs and halons.
Notes:
1 The National Pollutant Release Inventory (NPRI) was established
in 1993 by Environment Canada to monitor the release of 176
substances by facilities in Canada. For more information, see
<http://www.ec.gc.ca/pdb/npri/>.
2. The 1995 National Emissions Inventory of Criteria Air
Contaminants is compiled by Environment Canada and the
provincial/territorial ministries of the environment and energy. It
contains estimates of criteria air contaminant emissions for more
than 60 industrial and non-industrial activities. Criteria
contaminants are those for which ambient air quality standards
have been established by government.
Source:Statistics Canada, 2000, Human Activity and the Environment 2000 , CatalogueNo. 11-509-XPE, Ottawa.Environment Canada, Pollution Data Branch, National Pollutant Release Inventory 1998 .
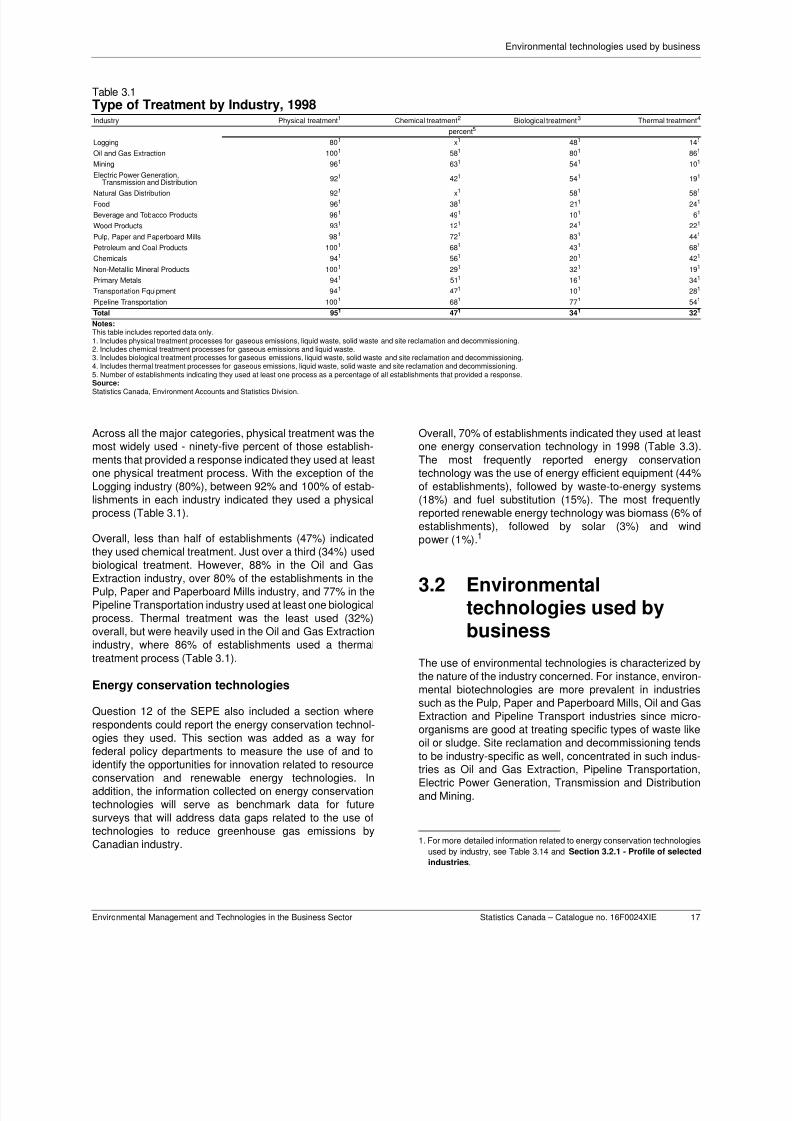
8/8/2019 Stats Canada Enviromental Technologies
http://slidepdf.com/reader/full/stats-canada-enviromental-technologies 26/62
Environmental technologies used by business
Environmental Management and Technologies in the Business Sector Statistics Canada – Catalogue no. 16F0024XIE 17
Across all the major categories, physical treatment was themost widely used - ninety-five percent of those establish-ments that provided a response indicated they used at leastone physical treatment process. With the exception of theLogging industry (80%), between 92% and 100% of estab-lishments in each industry indicated they used a physicalprocess (Table 3.1).
Overall, less than half of establishments (47%) indicated
they used chemical treatment. Just over a third (34%) usedbiological treatment. However, 88% in the Oil and GasExtraction industry, over 80% of the establishments in thePulp, Paper and Paperboard Mills industry, and 77% in thePipeline Transportation industry used at least one biologicalprocess. Thermal treatment was the least used (32%)overall, but were heavily used in the Oil and Gas Extractionindustry, where 86% of establishments used a thermaltreatment process (Table 3.1).
Energy conservation technologies
Question 12 of the SEPE also included a section whererespondents could report the energy conservation technol-
ogies they used. This section was added as a way forfederal policy departments to measure the use of and toidentify the opportunities for innovation related to resourceconservation and renewable energy technologies. Inaddition, the information collected on energy conservationtechnologies will serve as benchmark data for futuresurveys that will address data gaps related to the use oftechnologies to reduce greenhouse gas emissions byCanadian industry.
Overall, 70% of establishments indicated they used at leastone energy conservation technology in 1998 (Table 3.3).The most frequently reported energy conservationtechnology was the use of energy efficient equipment (44%of establishments), followed by waste-to-energy systems(18%) and fuel substitution (15%). The most frequentlyreported renewable energy technology was biomass (6% ofestablishments), followed by solar (3%) and windpower (1%).1
3.2 Environmentaltechnologies used bybusiness
The use of environmental technologies is characterized bythe nature of the industry concerned. For instance, environ-mental biotechnologies are more prevalent in industriessuch as the Pulp, Paper and Paperboard Mills, Oil and GasExtraction and Pipeline Transport industries since micro-organisms are good at treating specific types of waste like
oil or sludge. Site reclamation and decommissioning tendsto be industry-specific as well, concentrated in such indus-tries as Oil and Gas Extraction, Pipeline Transportation,Electric Power Generation, Transmission and Distributionand Mining.
1. For more detailed information related to energy conservation technologies
used by industry, see Table 3.14 and Section 3.2.1 - Profile of selected
industries.
Notes:This table includes reported data only.1. Includes physical treatment processes for gaseous emissions, liquid waste, solid waste and site reclamation and decommissioning.2. Includes chemical treatment processes for gaseous emissions and liquid waste.3. Includes biological treatment processes for gaseous emissions, liquid waste, solid waste and site reclamation and decommissioning.
4. Includes thermal treatment processes for gaseous emissions, liquid waste, solid waste and site reclamation and decommissioning.5. Number of establishments indicating they used at least one process as a percentage of all establishments that provided a response.Source:Statistics Canada, Environment Accounts and Statistics Division.
Table 3.1Type of Treatment by Industry, 1998Industry Physical treatment1 Chemical treatment2 Biological treatment3 Thermal treatment4
percent5
Logging 801 x1 481 141
Oil and Gas Extraction 1001 581 801 861
Mining 961 631 541 101
Electric Power Generation,
Transmission and Distribution
921 421 541 191
Natural Gas Distribution 921 x1 581 581
Food 961 381 211 241
Beverage and Tobacco Products 961 491 101 61
Wood Products 931 121 241 221
Pulp, Paper and Paperboard Mills 981 721 831 441
Petroleum and Coal Products 1001 681 431 681
Chemicals 941 561 201 421
Non-Metallic Mineral Products 1001 291 321 191
Primary Metals 941 511 161 341
Transportation Equipment 941 471 101 281
Pipeline Transportation 1001 681 771 541
Total 951 471 341 321
8/8/2019 Stats Canada Enviromental Technologies
http://slidepdf.com/reader/full/stats-canada-enviromental-technologies 27/62
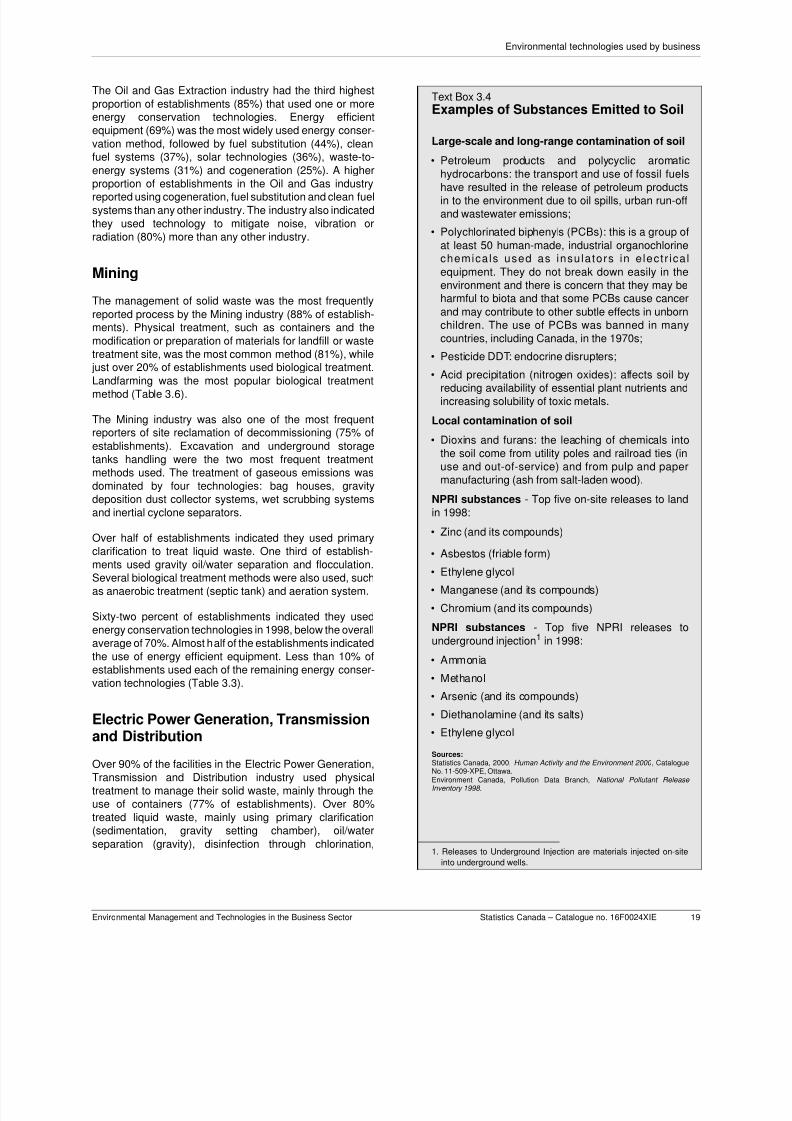
8/8/2019 Stats Canada Enviromental Technologies
http://slidepdf.com/reader/full/stats-canada-enviromental-technologies 28/62
Environmental technologies used by business
Environmental Management and Technologies in the Business Sector Statistics Canada – Catalogue no. 16F0024XIE 19
The Oil and Gas Extraction industry had the third highestproportion of establishments (85%) that used one or moreenergy conservation technologies. Energy efficientequipment (69%) was the most widely used energy conser-vation method, followed by fuel substitution (44%), cleanfuel systems (37%), solar technologies (36%), waste-to-energy systems (31%) and cogeneration (25%). A higher
proportion of establishments in the Oil and Gas industryreported using cogeneration, fuel substitution and clean fuelsystems than any other industry. The industry also indicatedthey used technology to mitigate noise, vibration orradiation (80%) more than any other industry.
Mining
The management of solid waste was the most frequentlyreported process by the Mining industry (88% of establish-ments). Physical treatment, such as containers and themodification or preparation of materials for landfill or wastetreatment site, was the most common method (81%), while
just over 20% of establishments used biological treatment.Landfarming was the most popular biological treatmentmethod (Table 3.6).
The Mining industry was also one of the most frequentreporters of site reclamation of decommissioning (75% ofestablishments). Excavation and underground storagetanks handling were the two most frequent treatmentmethods used. The treatment of gaseous emissions wasdominated by four technologies: bag houses, gravitydeposition dust collector systems, wet scrubbing systemsand inertial cyclone separators.
Over half of establishments indicated they used primary
clarification to treat liquid waste. One third of establish-ments used gravity oil/water separation and flocculation.Several biological treatment methods were also used, suchas anaerobic treatment (septic tank) and aeration system.
Sixty-two percent of establishments indicated they usedenergy conservation technologies in 1998, below the overallaverage of 70%. Almost half of the establishments indicatedthe use of energy efficient equipment. Less than 10% ofestablishments used each of the remaining energy conser-vation technologies (Table 3.3).
Electric Power Generation, Transmission
and Distribution
Over 90% of the facilities in the Electric Power Generation,Transmission and Distribution industry used physicaltreatment to manage their solid waste, mainly through theuse of containers (77% of establishments). Over 80%treated liquid waste, mainly using primary clarification(sedimentation, gravity setting chamber), oil/waterseparation (gravity), disinfection through chlorination,
Text Box 3.4Examples of Substances Emitted to Soil
Large-scale and long-range contamination of soil
• Petroleum products and polycyclic aromatichydrocarbons: the transport and use of fossil fuels
have resulted in the release of petroleum productsin to the environment due to oil spills, urban run-offand wastewater emissions;
• Polychlorinated biphenyls (PCBs): this is a group ofat least 50 human-made, industrial organochlorinechemicals used as insulators in e lect r icalequipment. They do not break down easily in theenvironment and there is concern that they may beharmful to biota and that some PCBs cause cancerand may contribute to other subtle effects in unbornchildren. The use of PCBs was banned in manycountries, including Canada, in the 1970s;
• Pesticide DDT: endocrine disrupters;
• Acid precipitation (nitrogen oxides): affects soil byreducing availability of essential plant nutrients andincreasing solubility of toxic metals.
Local contamination of soil
• Dioxins and furans: the leaching of chemicals intothe soil come from utility poles and railroad ties (inuse and out-of-service) and from pulp and papermanufacturing (ash from salt-laden wood).
NPRI substances - Top five on-site releases to landin 1998:
• Zinc (and its compounds)
• Asbestos (friable form)• Ethylene glycol
• Manganese (and its compounds)
• Chromium (and its compounds)
NPRI substances - Top five NPRI releases tounderground injection1 in 1998:
• Ammonia
• Methanol
• Arsenic (and its compounds)
• Diethanolamine (and its salts)
• Ethylene glycol
Sources:Statistics Canada, 2000, Human Activity and the Environment 2000 , CatalogueNo. 11-509-XPE, Ottawa.Environment Canada, Pollution Data Branch, National Pollutant Release Inventory 1998 .
1. Releases to Underground Injection are materials injected on-site
into underground wells.
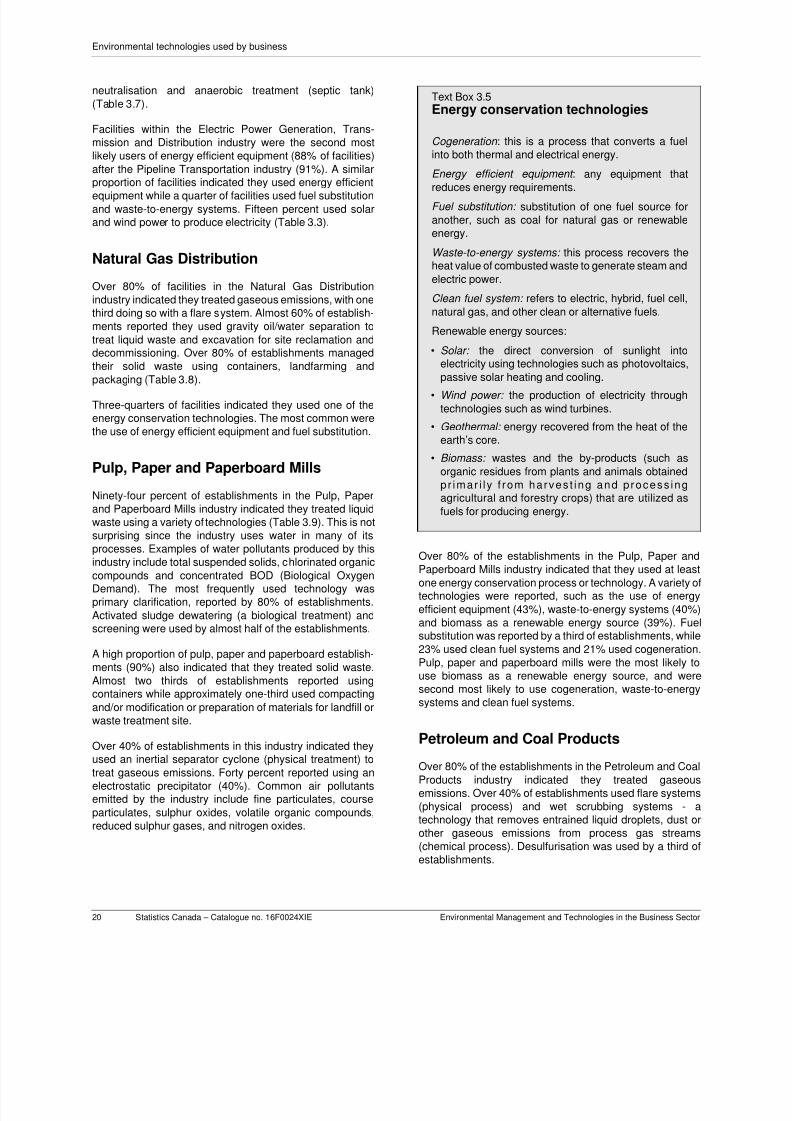
8/8/2019 Stats Canada Enviromental Technologies
http://slidepdf.com/reader/full/stats-canada-enviromental-technologies 29/62
Environmental technologies used by business
20 Statistics Canada – Catalogue no. 16F0024XIE Environmental Management and Technologies in the Business Sector
neutralisation and anaerobic treatment (septic tank)(Table 3.7).
Facilities within the Electric Power Generation, Trans-mission and Distribution industry were the second mostlikely users of energy efficient equipment (88% of facilities)after the Pipeline Transportation industry (91%). A similar
proportion of facilities indicated they used energy efficientequipment while a quarter of facilities used fuel substitutionand waste-to-energy systems. Fifteen percent used solarand wind power to produce electricity (Table 3.3).
Natural Gas Distribution
Over 80% of facilities in the Natural Gas Distributionindustry indicated they treated gaseous emissions, with onethird doing so with a flare system. Almost 60% of establish-ments reported they used gravity oil/water separation totreat liquid waste and excavation for site reclamation anddecommissioning. Over 80% of establishments managed
their solid waste using containers, landfarming andpackaging (Table 3.8).
Three-quarters of facilities indicated they used one of theenergy conservation technologies. The most common werethe use of energy efficient equipment and fuel substitution.
Pulp, Paper and Paperboard Mills
Ninety-four percent of establishments in the Pulp, Paperand Paperboard Mills industry indicated they treated liquidwaste using a variety of technologies (Table 3.9). This is notsurprising since the industry uses water in many of its
processes. Examples of water pollutants produced by thisindustry include total suspended solids, chlorinated organiccompounds and concentrated BOD (Biological OxygenDemand). The most frequently used technology wasprimary clarification, reported by 80% of establishments.Activated sludge dewatering (a biological treatment) andscreening were used by almost half of the establishments.
A high proportion of pulp, paper and paperboard establish-ments (90%) also indicated that they treated solid waste.Almost two thirds of establishments reported usingcontainers while approximately one-third used compactingand/or modification or preparation of materials for landfill orwaste treatment site.
Over 40% of establishments in this industry indicated theyused an inertial separator cyclone (physical treatment) totreat gaseous emissions. Forty percent reported using anelectrostatic precipitator (40%). Common air pollutantsemitted by the industry include fine particulates, courseparticulates, sulphur oxides, volatile organic compounds,reduced sulphur gases, and nitrogen oxides.
Over 80% of the establishments in the Pulp, Paper andPaperboard Mills industry indicated that they used at leastone energy conservation process or technology. A variety oftechnologies were reported, such as the use of energyefficient equipment (43%), waste-to-energy systems (40%)and biomass as a renewable energy source (39%). Fuelsubstitution was reported by a third of establishments, while23% used clean fuel systems and 21% used cogeneration.Pulp, paper and paperboard mills were the most likely touse biomass as a renewable energy source, and weresecond most likely to use cogeneration, waste-to-energysystems and clean fuel systems.
Petroleum and Coal Products
Over 80% of the establishments in the Petroleum and CoalProducts industry indicated they treated gaseousemissions. Over 40% of establishments used flare systems(physical process) and wet scrubbing systems - atechnology that removes entrained liquid droplets, dust orother gaseous emissions from process gas streams(chemical process). Desulfurisation was used by a third ofestablishments.
Text Box 3.5Energy conservation technologies
Cogeneration : this is a process that converts a fuelinto both thermal and electrical energy.
Energy efficient equipment : any equipment that
reduces energy requirements.
Fuel substitution: substitution of one fuel source foranother, such as coal for natural gas or renewableenergy.
Waste-to-energy systems: this process recovers theheat value of combusted waste to generate steam andelectric power.
Clean fuel system: refers to electric, hybrid, fuel cell,natural gas, and other clean or alternative fuels.
Renewable energy sources:
• Solar: the direct conversion of sunlight into
electricity using technologies such as photovoltaics,passive solar heating and cooling.
• Wind power: the production of electricity throughtechnologies such as wind turbines.
• Geothermal: energy recovered from the heat of theearth’s core.
• Biomass: wastes and the by-products (such asorganic residues from plants and animals obtainedpr imar i l y f rom harvest ing and process ingagricultural and forestry crops) that are utilized asfuels for producing energy.
8/8/2019 Stats Canada Enviromental Technologies
http://slidepdf.com/reader/full/stats-canada-enviromental-technologies 30/62
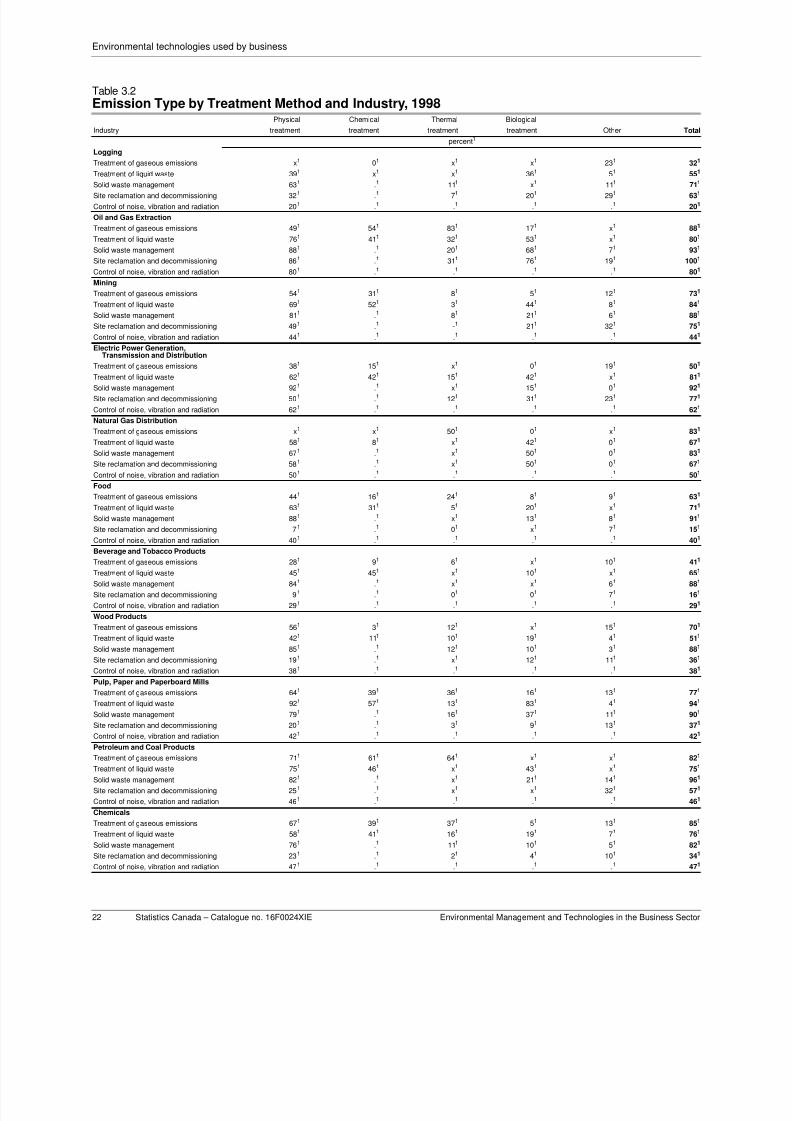
8/8/2019 Stats Canada Enviromental Technologies
http://slidepdf.com/reader/full/stats-canada-enviromental-technologies 31/62
Environmental technologies used by business
22 Statistics Canada – Catalogue no. 16F0024XIE Environmental Management and Technologies in the Business Sector
Table 3.2Emission Type by Treatment Method and Industry, 1998
Physical Chemical Thermal Biological
Industry treatment treatment treatment treatment Other Total
percent1
Logging
Treatment of gaseous emissions x1 01 x1 x1 231 321
Treatment of liquid waste 391 x1 x1 361 51 551
Solid waste management 631 .1 111 x1 111 711
Site reclamation and decommissioning 321 .1 71 201 291 631
Control of noise, vibration and radiation 201 .1 .1 .1 .1 201
Oil and Gas Extraction
Treatment of gaseous emissions 491 541 831 171 x1 881
Treatment of liquid waste 761 411 321 531 x1 801
Solid waste management 881 .1 201 681 71 931
Site reclamation and decommissioning 861 .1 311 761 191 1001
Control of noise, vibration and radiation 801 .1 .1 .1 .1 801
Mining
Treatment of gaseous emissions 541 311 81 51 121 731
Treatment of liquid waste 691 521 31 441 81 841
Solid waste management 811 .1 81 211 61 881
Site reclamation and decommissioning 491 .1 -1 211 321 751
Control of noise, vibration and radiation 441 .1 .1 .1 .1 441
Electric Power Generation,Transmission and Distribution
Treatment of gaseous emissions 38
1
15
1
x
1
0
1
19
1
50
1
Treatment of liquid waste 621 421 151 421 x1 811
Solid waste management 921 .1 x1 151 01 921
Site reclamation and decommissioning 501 .1 121 311 231 771
Control of noise, vibration and radiation 621 .1 .1 .1 .1 621
Natural Gas Distribution
Treatment of gaseous emissions x1 x1 501 01 x1 831
Treatment of liquid waste 581 81 x1 421 01 671
Solid waste management 671 .1 x1 501 01 831
Site reclamation and decommissioning 581 .1 x1 501 01 671
Control of noise, vibration and radiation 501 .1 .1 .1 .1 501
Food
Treatment of gaseous emissions 441 161 241 81 91 631
Treatment of liquid waste 631 311 51 201 x1 711
Solid waste management 881 .1 x1 131 81 911
Site reclamation and decommissioning 71 .1 01 x1 71 151
Control of noise, vibration and radiation 401 .1 .1 .1 .1 401
Beverage and Tobacco ProductsTreatment of gaseous emissions 281 91 61 x1 101 411
Treatment of liquid waste 451 451 x1 101 x1 651
Solid waste management 841 .1 x1 x1 61 881
Site reclamation and decommissioning 91 .1 01 01 71 161
Control of noise, vibration and radiation 291 .1 .1 .1 .1 291
Wood Products
Treatment of gaseous emissions 561 31 121 x1 151 701
Treatment of liquid waste 421 111 101 191 41 511
Solid waste management 851 .1 121 101 31 881
Site reclamation and decommissioning 191 .1 x1 121 111 361
Control of noise, vibration and radiation 381 .1 .1 .1 .1 381
Pulp, Paper and Paperboard Mills
Treatment of gaseous emissions 641 391 361 161 131 771
Treatment of liquid waste 921 571 131 831 41 941
Solid waste management 791 .1 161 371 111 901
Site reclamation and decommissioning 201 .1 31 91 131 371
Control of noise, vibration and radiation 421
.1
.1
.1
.1
421
Petroleum and Coal Products
Treatment of gaseous emissions 711 611 641 x1 x1 821
Treatment of liquid waste 751 461 x1 431 x1 751
Solid waste management 821 .1 x1 211 141 961
Site reclamation and decommissioning 251 .1 x1 x1 321 571
Control of noise, vibration and radiation 461 .1 .1 .1 .1 461
Chemicals
Treatment of gaseous emissions 671 391 371 51 131 851
Treatment of liquid waste 581 411 161 191 71 761
Solid waste management 761 .1 111 101 51 821
Site reclamation and decommissioning 231 .1 21 41 101 341
Control of noise, vibration and radiation 471 .1 .1 .1 .1 471
8/8/2019 Stats Canada Enviromental Technologies
http://slidepdf.com/reader/full/stats-canada-enviromental-technologies 32/62
Environmental technologies used by business
Environmental Management and Technologies in the Business Sector Statistics Canada – Catalogue no. 16F0024XIE 23
Notes:This table includes reported data only.1. Number of establishments indicating they used the treatment method as a percentage of all establishments that provided a response.Source:Statistics Canada, Environment Accounts and Statistics Division.
Notes:This table includes reported data only.1. Number of establishments indicating they used the process or technology as a percentage of all establishments that provided a response.2. Number of establishments that indicated they used at least one environmental process or technology as a percentage of the total number of establishments who provided a response.Source:Statistics Canada, Environment Accounts and Statistics Division.
Non-Metallic Mineral Products
Treatment of gaseous emissions 851 91 151 01 x1 871
Treatment of liquid waste 601 241 71 261 101 711
Solid waste management 911 .1 01 x1 x1 911
Site reclamation and decommissioning 131 .1 01 61 151 311
Control of noise, vibration and radiation 601 .1 .1 .1 .1 601
Primary Metals
Treatment of gaseous emissions 711 331 281 61 141 861
Treatment of liquid waste 641 421 141 111 51 721
Solid waste management 791 .1 51 31 71 821
Site reclamation and decommissioning 231 .1 x1 41 121 331
Control of noise, vibration and radiation 541 .1 .1 .1 .1 541
Transportation Equipment
Treatment of gaseous emissions 541 141 201 x1 161 771
Treatment of liquid waste 591 461 111 71 91 691
Solid waste management 871 .1 41 x1 x1 881
Site reclamation and decommissioning 231 .1 01 x1 101 311
Control of noise, vibration and radiation 401 .1 .1 .1 .1 401
Pipeline Transportation
Treatment of gaseous emissions 451 501 551 01 321 861
Treatment of liquid waste 821 551 321 641 x1 861
Solid waste management 951 .1 321 731 01 1001
Site reclamation and decommissioning 951 .1 x1 771 01 951
Control of noise, vibration and radiation 681 .1 .1 .1 .1 681
Table 3.3Energy Conservation Processes and Technologies by Industry, 1998
Proportion of
establishments
Renewable energy source that used at
Other least one energy
Energy Waste-to- Clean renewable conservation
efficient Fuel energy fuel Solar Wind energy process
Industry Cogeneration equipment substitution system system power power Geothermal Biomass source Other or technology
percent1
Logging x1 161 x1 x1 x1 x1 x1 x1 x1 x1 x1 211
Oil and Gas Extraction 251 691 441 311 371 361 x1 x1 x1 01 121 851
Mining 31 471 71 161 81 81 x1 01 01 01 81 621
Electric Power Generation,Transmission and Distribution
x1 811 231 231 x1 151 151 x1 x1 01 191 881
Natural Gas Distribution x1 501 421 x1 x1 x1 01 01 01 01 x1 751
Food 61 491 91 71 101 x1 01 01 x1 x1 111 621
Beverage and Tobacco Products x1 451 x1 x1 61 01 01 01 01 01 71 571
Wood Products 71 281 211 481 71 01 01 x1 211 x1 51 681
Pulp, Paper and PaperboardMills
211 431 311 401 231 01 01 01 391 x1 41 811
Petroleum and Coal Products 181
501
141
181
211
01
01
01
01
01
141
751
Chemicals 91 401 91 131 101 x1 01 01 01 01 81 531
Non-Metallic Mineral Products 01 531 131 101 x1 01 01 01 01 x1 71 621
Primary Metals 21 391 171 91 121 01 01 01 01 x1 91 541
Transportation Equipment 71 511 121 51 91 51 01 01 01 01 81 591
Pipeline Transportation x1 911 411 271 x1 x1 01 01 01 x1 x1 951
Total2 81 441 151 181 121 31 11 x1 61 11 81 691
Table 3.2Emission Type by Treatment Method and Industry, 1998 (continued)
Physical Chemical Thermal Biological
Industry treatment treatment treatment treatment Other Total
percent1
8/8/2019 Stats Canada Enviromental Technologies
http://slidepdf.com/reader/full/stats-canada-enviromental-technologies 33/62
Environmental technologies used by business
24 Statistics Canada – Catalogue no. 16F0024XIE Environmental Management and Technologies in the Business Sector
Note:This table includes reported data only.Source:Statistics Canada, Environment Accounts and Statistics Division.
Table 3.4Environmental Technologies Used in Logging Industry, 1998
Proportion of total establishments
Technology that used each technology
percent
Treatment of liquid waste
Anaerobic treatment (Septic tank) 341
Oil/Water separation (Gravity) 301
Oil/Water separation (Oilphylic pads) 111
Oil/Water separation (Coalescing separators) 71
Treatment of noise, vibration or radiation
Mufflers 181
Energy conservation
Energy efficient equipment 161
Site reclamation and decommissioning
Excavation 271
Underground storage tanks 91
Biological degradation by aeration or bioventilation 71
Bioremediation 71
Incineration 71
Solid waste management
Container 461
Modification or preparation of materials for landfill or waste treatment site 321
Incineration 111
Packaging 71
Table 3.5Environmental Technologies Used in the Oil and Gas Extraction Industry, 1998
Proportion of total establishments
Technology that used each technology
percent
Treatment of gaseous emissions
Flare system 831
Desulfurisation 321
Filtration (Activated carbon filter) 311
Vapour condenser 311
Scrubbing (Wet scrubbing system) 291
Adsorption (Activated carbon adsorption) 271
Incineration (Thermal recuperative incineration) 251
Cooling tower 201
Catalytic reduction 171
Inertial separator (Cyclone) 151
Filtration (Bag house) 151
Incineration (Catalytic incineration) 151
Gravity deposition (Precipitation chamber) 141
Chemical oxidation 121
Dryer 121
Oxidation (Thermal oxidation) 121
Phytoremediation 101
Thermal regenerative incineration 101
Gravity deposition (Dust collector system) 81
Inertial separator (Vortex) 81
Filtration (Membrane filter) 81
Activated sludge 81
Scrubbing (Air scrubbing) 81
Incineration (Fluidised bed) 81
Inertial separator (Centrifugal precipitator) 71
Adsorption (Other media) 71
Biological filtration 71
Treatment of liquid waste
Oil/water separation (Gravity) 731
Anaerobic treatment (Septic tank) 461
Oil/water separation (Coalescing separators) 361
Adsorption system (Activated carbon adsorption) 321
Aerobic treatment (Aeration pond) 271
8/8/2019 Stats Canada Enviromental Technologies
http://slidepdf.com/reader/full/stats-canada-enviromental-technologies 34/62
Environmental technologies used by business
Environmental Management and Technologies in the Business Sector Statistics Canada – Catalogue no. 16F0024XIE 25
Primary clarification (Sedimentation, gravity settling chamber) 241
Filtration (Bed filtration system) 241
Equalisation pond 221
Incineration 221
Evaporation 221
Aerobic treatment (Aerobic lagoon) 201
Screening 191
Contact system (Air stripping) 191
Filtration (Pressure) 191
Neutralisation 191
Flocculation 191
Disinfection (Chlorination) 171
Oil/water separation (Oilphylic pads) 151
Flotation 151
Ion exchange 151
Demineralisation 141
Aerobic treatment (Aeration system) 141
Centrifugal precipitator 121
Aerobic treatment (Activated sludge dewatering) 121
Coagulation 101
Biosystem (Biological reactor) 101
Degritting 81
Precipitator 81
Adsorption system (Other media) 71
Contact system (Steam stripping) 71
Filtration (Membrane) 71
Drying 71
Distillation 71
Thermal oxidation 71
Aerobic treatment (Biological polishing or biofiltration) 71
Treatment of noise, vibration or radiation
Mufflers 801
Acoustic barriers 611
Energy conservation
Energy efficient equipment 691
Fuel substitution 441
Clean fuel system 371
Renewable energy source (Solar power) 361
Waste-to-energy system 311
Cogeneration 251
Site reclamation and decommissioning
Excavation 831
Bioremediation 691
Underground storage tanks handling 591
Biological degradation by aeration or bioventilation 461
Vapour extraction systems 391
Soil washing 291
Incineration 221
Geomembrane 201
Thermal desorption technology 201
Renaturalisation 171
Reduction 151
Bioslurping 81
Phytoremediation 81
Thermal oxidation system 81
Solid waste management
Container 861
Landfarming method 681
Biopiles 341
Modification or preparation for landfill or waste treatment site 321
Composting technology 271
Packaging 251
Compacting 221
Table 3.5Environmental Technologies Used in the Oil and Gas Extraction Industry, 1998 (continued)
Proportion of total establishments
Technology that used each technology
percent
8/8/2019 Stats Canada Enviromental Technologies
http://slidepdf.com/reader/full/stats-canada-enviromental-technologies 35/62
Environmental technologies used by business
26 Statistics Canada – Catalogue no. 16F0024XIE Environmental Management and Technologies in the Business Sector
Note:This table includes reported data only.Source:Statistics Canada, Environment Accounts and Statistics Division.
Incineration 201
Shredding 191
Screening 151
Dehydration 121
Crushing 81
Table 3.6Environmental Technologies Used in the Mining Industry, 1998
Proportion of total establishments
Technology that used each technology
percent
Treatment of gaseous emissions
Filtration (Bag house) 401
Gravity deposition (Dust collector system) 351
Scrubbing (Wet scrubbing system) 301
Inertial separator (Cyclone) 161
Electrostatic precipitator 71
Gravity deposition (Precipitation chamber) 51
Inertial separator (Impingement eliminator) 51
Catalytic reduction 41
Activated sludge 31
Scrubbing (Air scrubbing) 31
Desulfurisation 31
Cooling tower 31
Treatment of liquid waste
Primary clarification (Sedimentation, Gravity settling chamber) 531
Oil/water separation (Gravity) 341
Flocculation 341
Neutralisation 271
Anaerobic treatment (Septic tank) 211
Disinfection (Chlorination) 161
Aerobic treatment (Aerobic lagoon) 111
Oxidation (Chemical oxidation) 101
Precipitator 91
Aerobic treatment (Aeration system) 91
Coagulation 81
Oil/water separation (Coalescing separators) 51
Aerobic treatment (Biological polishing or biofiltration) 51
Screening 41
Adsorption system (Other media) 41
Filtration (Bed filtration system) 41
Equalisation pond 41
Aerobic treatment (Activated sludge dewatering) 41
Aerobic treatment (Aeration pond) 41
Anaerobic treatment (Anaerobic digester reactor) 41
Degritting 31
Adsorption system (Activated carbon adsorption) 31
Flotation 31
Filtration (Vacuum) 31
Ion exchange 31
Demineralisation 31
Biosystem (Biological reactor) 31
Treatment of noise, vibration or radiation
Mufflers 341
Acoustic barriers 211
Table 3.5Environmental Technologies Used in the Oil and Gas Extraction Industry, 1998 (continued)
Proportion of total establishments
Technology that used each technology
percent
8/8/2019 Stats Canada Enviromental Technologies
http://slidepdf.com/reader/full/stats-canada-enviromental-technologies 36/62
8/8/2019 Stats Canada Enviromental Technologies
http://slidepdf.com/reader/full/stats-canada-enviromental-technologies 37/62
Environmental technologies used by business
28 Statistics Canada – Catalogue no. 16F0024XIE Environmental Management and Technologies in the Business Sector
Note:This table includes reported data only.Source:Statistics Canada, Environment Accounts and Statistics Division.
Note:This table includes reported data only.Source:Statistics Canada, Environment Accounts and Statistics Division.
Site reclamation and decommissioning
Underground storage tanks 231
Excavation 461
Biological degradation by aeration or bioventilation 151
Bioremediation 231
Solid waste management
Container 771
Modification or preparation for landfill or waste treatment site 351
Compacting 231
Shredding 151
Landfarming method 151
Table 3.8Environmental Technologies Used in the Natural Gas Distribution Industry, 1998
Proportion of total establishments
Technology that used each technology
percent
Treatment of gaseous emissions
Flare system 331
Treatment of liquid waste
Oil/water separation (Gravity) 581
Anaerobic treatment (Septic tank) 331
Treatment of noise, vibration or radiation
Acoustic barriers 421
Mufflers 421
Energy conservation
Energy efficient equipment 501
Fuel substitution 42
1
Site reclamation and decommissioning
Excavation 581
Bioremediation 331
Solid waste management
Container 581
Landfarming method 421
Packaging 331
Table 3.7Environmental Technologies Used in the Electric Power Generation, Transmission andDistribution Industry, 1998 (continued)
Proportion of total establishments
Technology that used each technology
percent
8/8/2019 Stats Canada Enviromental Technologies
http://slidepdf.com/reader/full/stats-canada-enviromental-technologies 38/62
Environmental technologies used by business
Environmental Management and Technologies in the Business Sector Statistics Canada – Catalogue no. 16F0024XIE 29
Table 3.9Environmental Technologies Used in the Pulp, Paper and Paperboard Mills Industry,1998
Proportion of total establishments
Technology that used each technology
percent
Treatment of gaseous emissions
Inertial separator (Cyclone) 411
Electrostatic precipitator 401
Scrubbing (Wet scrubbing system) 371
Gravity deposition (Dust collector system) 191
Activated sludge 161
Filtration (Bag house) 131
Incineration (Catalytic incineration) 131
Oxidation (Thermal oxidation) 91
Vapour condenser 71
Cooling tower 61
Incineration (Thermal regenerative incineration) 51
Gravity deposition (Precipitation chamber) 41
Flare system 41
Inertial separator (Impingement eliminator) 41
Chemical oxidation 41
Scrubbing (Air scrubbing) 31
Treatment of liquid waste
Primary clarification 801
Aerobic treatment (Activated sludge dewatering) 491
Screening 491
Degritting 341
Neutralisation 311
Flocculation 301
Aerobic treatment (Aeration system) 291
Flotation 281
Oil/water separation (Gravity) 261
Aerobic treatment (Aeration pond) 201
Equalisation pond 161
Coagulation 161
Aerobic treatment (Aerobic lagoon) 161
Filtration (Pressure) 151
Biosystem (Biological reactor) 151
Contact system (Steam stripping) 121
Disinfection (Chlorination) 121
Filtration (Gravity) 111
Filtration (Bed filtration system) 101
Aerobic treatment (Biological polishing or biofiltration) 91
Incineration 71
Anaerobic treatment (Septic tank) 71
Filtration (Vacuum) 71
Evaporation 71
Oil/water separation (Oilphylic pads) 51
Adsorption system (Polymer) 41
Precipitator 31
Adsorption system (Activated carbon adsorption) 31
Oxidation (Chemical oxidation) 31
Anaerobic treatment (Anaerobic digester reactor) 31
Treatment of noise, vibration or radiation 01
Mufflers 331
Acoustic barriers 221
Energy conservation
Energy efficient equipment 431
Waste-to-energy system 401
Renewable energy source (Biomass energy) 391
Fuel substitution 311
Clean fuel system 231
Cogeneration 211
Site reclamation and decommissioning
Excavation 131
Underground storage tanks handling 61
Bioremediation 51
Reduction 31
Incineration 31
8/8/2019 Stats Canada Enviromental Technologies
http://slidepdf.com/reader/full/stats-canada-enviromental-technologies 39/62
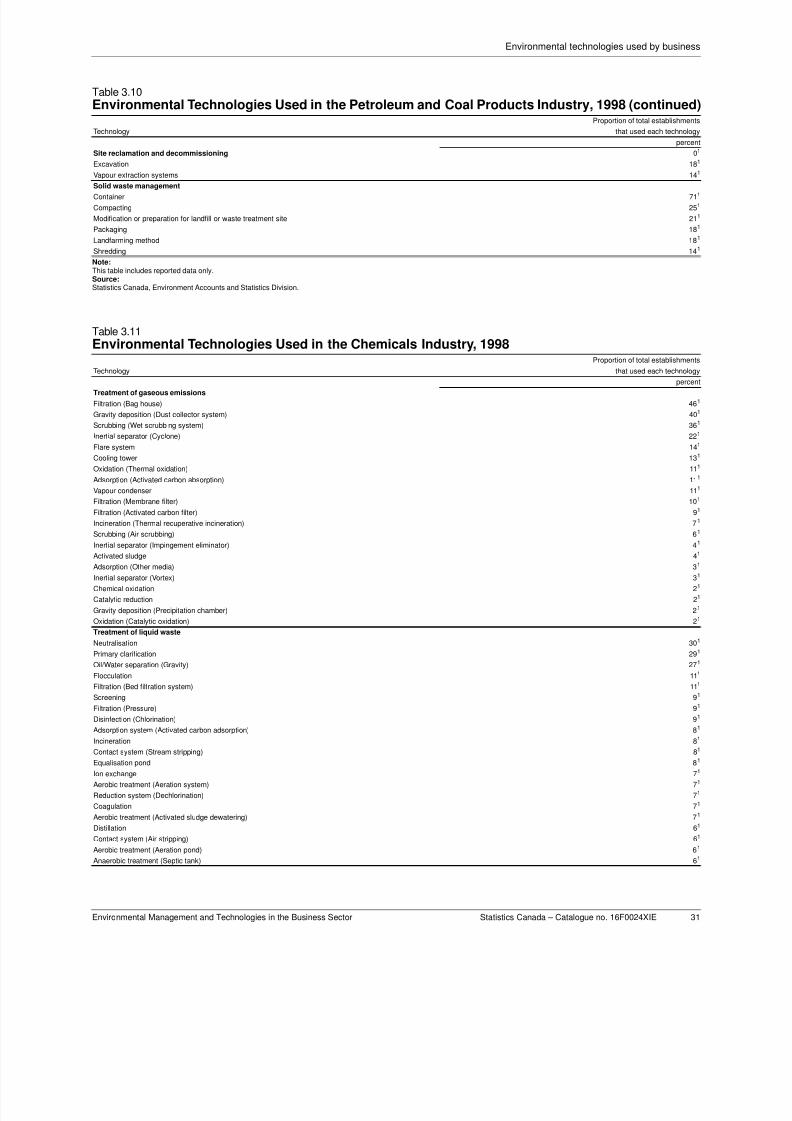
8/8/2019 Stats Canada Enviromental Technologies
http://slidepdf.com/reader/full/stats-canada-enviromental-technologies 40/62
Environmental technologies used by business
Environmental Management and Technologies in the Business Sector Statistics Canada – Catalogue no. 16F0024XIE 31
Note:This table includes reported data only.Source:Statistics Canada, Environment Accounts and Statistics Division.
Site reclamation and decommissioning 01
Excavation 181
Vapour extraction systems 141
Solid waste management
Container 711
Compacting 251
Modification or preparation for landfill or waste treatment site 211
Packaging 181
Landfarming method 181
Shredding 141
Table 3.11Environmental Technologies Used in the Chemicals Industry, 1998
Proportion of total establishments
Technology that used each technology
percent
Treatment of gaseous emissions
Filtration (Bag house) 461
Gravity deposition (Dust collector system) 401
Scrubbing (Wet scrubbing system) 361
Inertial separator (Cyclone) 221
Flare system 141
Cooling tower 131
Oxidation (Thermal oxidation) 111
Adsorption (Activated carbon absorption) 111
Vapour condenser 111
Filtration (Membrane filter) 101
Filtration (Activated carbon filter) 91
Incineration (Thermal recuperative incineration) 71
Scrubbing (Air scrubbing) 61
Inertial separator (Impingement eliminator) 41
Activated sludge 41
Adsorption (Other media) 31
Inertial separator (Vortex) 31
Chemical oxidation 21
Catalytic reduction 21
Gravity deposition (Precipitation chamber) 21
Oxidation (Catalytic oxidation) 21
Treatment of liquid waste
Neutralisation 301
Primary clarification 291
Oil/Water separation (Gravity) 271
Flocculation 111
Filtration (Bed filtration system) 111
Screening 91
Filtration (Pressure) 91
Disinfection (Chlorination) 91
Adsorption system (Activated carbon adsorption) 81
Incineration 81
Contact system (Stream stripping) 81
Equalisation pond 81
Ion exchange 71
Aerobic treatment (Aeration system) 71
Reduction system (Dechlorination) 71
Coagulation 71
Aerobic treatment (Activated sludge dewatering) 71
Distillation 61
Contact system (Air stripping) 61
Aerobic treatment (Aeration pond) 61
Anaerobic treatment (Septic tank) 61
Table 3.10Environmental Technologies Used in the Petroleum and Coal Products Industry, 1998 (continued)
Proportion of total establishments
Technology that used each technology
percent
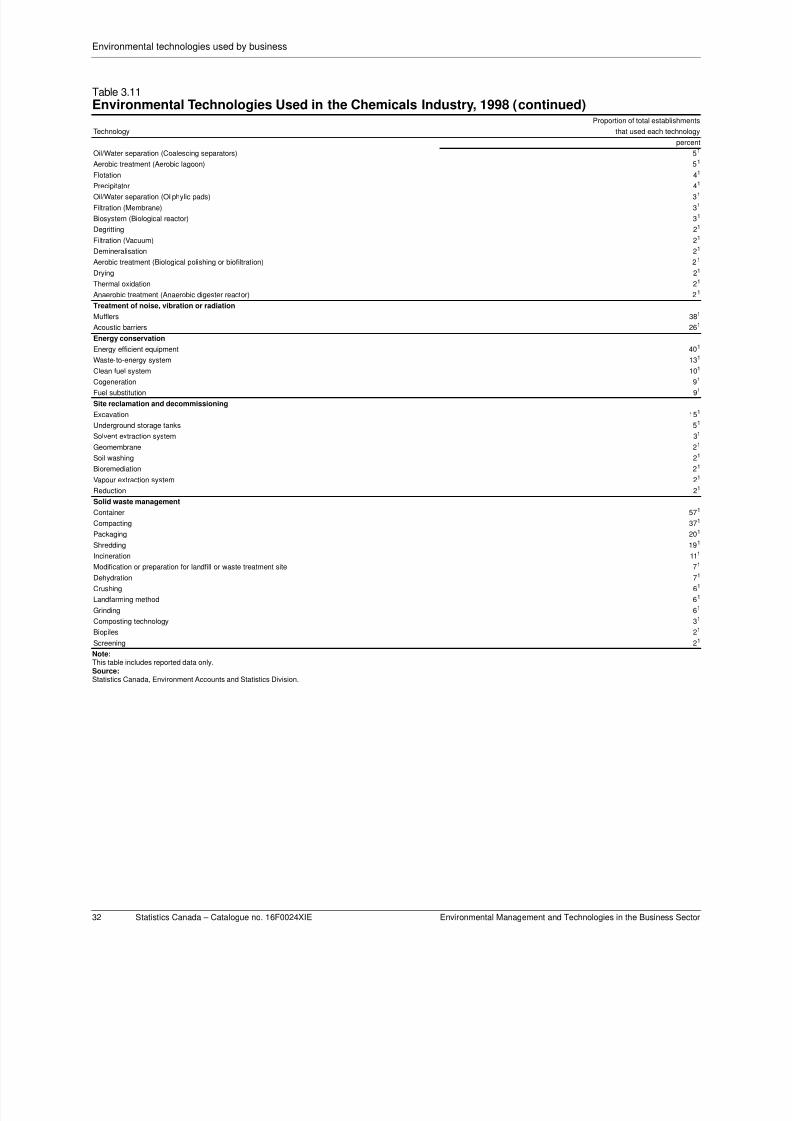
8/8/2019 Stats Canada Enviromental Technologies
http://slidepdf.com/reader/full/stats-canada-enviromental-technologies 41/62
Environmental technologies used by business
32 Statistics Canada – Catalogue no. 16F0024XIE Environmental Management and Technologies in the Business Sector
Note:This table includes reported data only.Source:Statistics Canada, Environment Accounts and Statistics Division.
Oil/Water separation (Coalescing separators) 51
Aerobic treatment (Aerobic lagoon) 51
Flotation 41
Precipitator 41
Oil/Water separation (Oilphylic pads) 31
Filtration (Membrane) 31
Biosystem (Biological reactor) 31
Degritting 21
Filtration (Vacuum) 21
Demineralisation 21
Aerobic treatment (Biological polishing or biofiltration) 21
Drying 21
Thermal oxidation 21
Anaerobic treatment (Anaerobic digester reactor) 21
Treatment of noise, vibration or radiation
Mufflers 381
Acoustic barriers 261
Energy conservation
Energy efficient equipment 401
Waste-to-energy system 131
Clean fuel system 101
Cogeneration 91
Fuel substitution 91
Site reclamation and decommissioning
Excavation 151
Underground storage tanks 51
Solvent extraction system 31
Geomembrane 21
Soil washing 21
Bioremediation 21
Vapour extraction system 21
Reduction 21
Solid waste management
Container 571
Compacting 371
Packaging 201
Shredding 191
Incineration 111
Modification or preparation for landfill or waste treatment site 71
Dehydration 71
Crushing 61
Landfarming method 61
Grinding 61
Composting technology 31
Biopiles 21
Screening 21
Table 3.11Environmental Technologies Used in the Chemicals Industry, 1998 (continued)
Proportion of total establishments
Technology that used each technology
percent
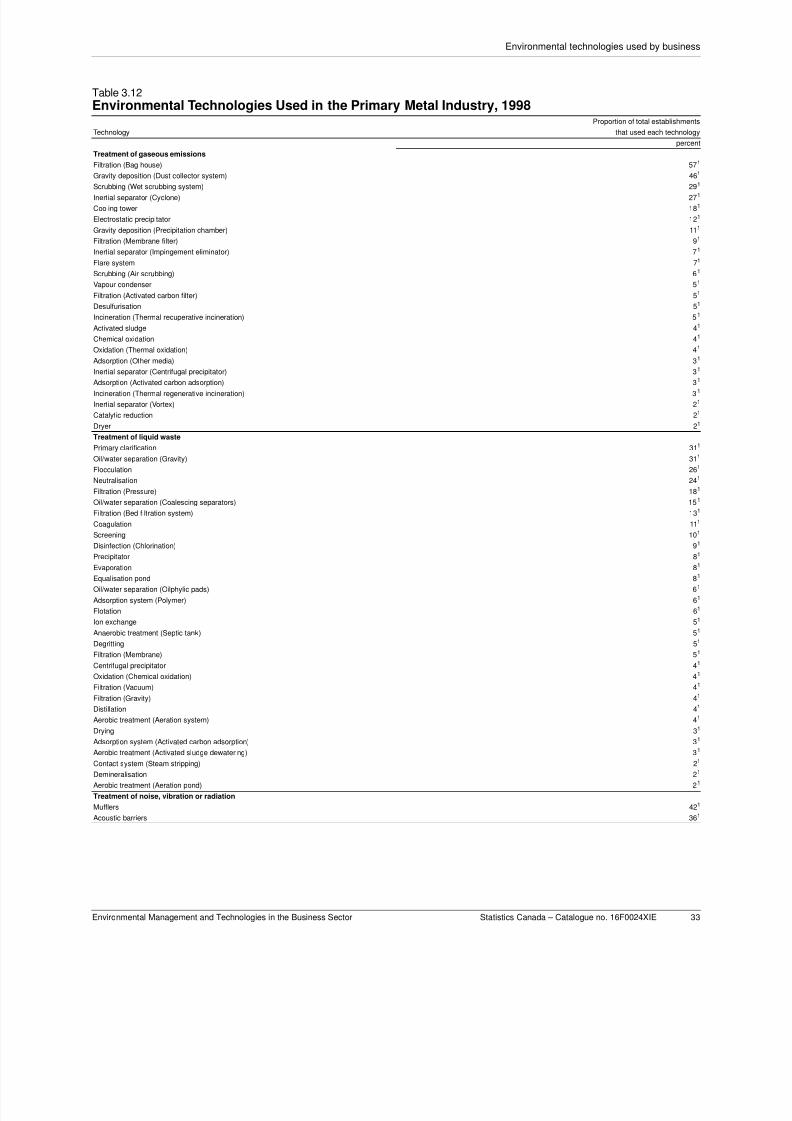
8/8/2019 Stats Canada Enviromental Technologies
http://slidepdf.com/reader/full/stats-canada-enviromental-technologies 42/62
Environmental technologies used by business
Environmental Management and Technologies in the Business Sector Statistics Canada – Catalogue no. 16F0024XIE 33
Table 3.12Environmental Technologies Used in the Primary Metal Industry, 1998
Proportion of total establishments
Technology that used each technology
percent
Treatment of gaseous emissions
Filtration (Bag house) 571
Gravity deposition (Dust collector system) 461
Scrubbing (Wet scrubbing system) 291
Inertial separator (Cyclone) 271
Cooling tower 181
Electrostatic precipitator 121
Gravity deposition (Precipitation chamber) 111
Filtration (Membrane filter) 91
Inertial separator (Impingement eliminator) 71
Flare system 71
Scrubbing (Air scrubbing) 61
Vapour condenser 51
Filtration (Activated carbon filter) 51
Desulfurisation 51
Incineration (Thermal recuperative incineration) 51
Activated sludge 41
Chemical oxidation 41
Oxidation (Thermal oxidation) 41
Adsorption (Other media) 31
Inertial separator (Centrifugal precipitator) 31
Adsorption (Activated carbon adsorption) 31
Incineration (Thermal regenerative incineration) 31
Inertial separator (Vortex) 21
Catalytic reduction 21
Dryer 21
Treatment of liquid waste
Primary clarification 311
Oil/water separation (Gravity) 311
Flocculation 261
Neutralisation 241
Filtration (Pressure) 181
Oil/water separation (Coalescing separators) 151
Filtration (Bed filtration system) 131
Coagulation 111
Screening 101
Disinfection (Chlorination) 91
Precipitator 81
Evaporation 81
Equalisation pond 81
Oil/water separation (Oilphylic pads) 61
Adsorption system (Polymer) 61
Flotation 61
Ion exchange 51
Anaerobic treatment (Septic tank) 51
Degritting 51
Filtration (Membrane) 51
Centrifugal precipitator 41
Oxidation (Chemical oxidation) 41
Filtration (Vacuum) 41
Filtration (Gravity) 41
Distillation 41
Aerobic treatment (Aeration system) 41
Drying 31
Adsorption system (Activated carbon adsorption) 31
Aerobic treatment (Activated sludge dewatering) 31
Contact system (Steam stripping) 21
Demineralisation 21
Aerobic treatment (Aeration pond) 21
Treatment of noise, vibration or radiation
Mufflers 421
Acoustic barriers 361
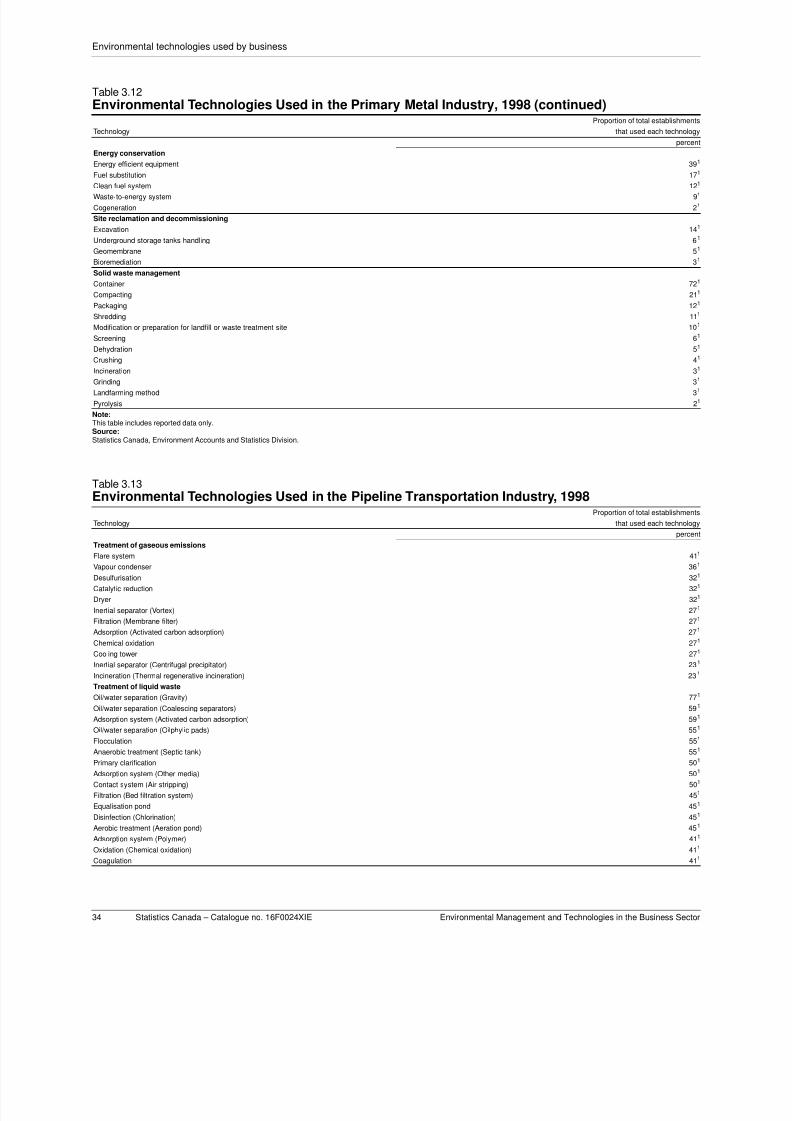
8/8/2019 Stats Canada Enviromental Technologies
http://slidepdf.com/reader/full/stats-canada-enviromental-technologies 43/62
Environmental technologies used by business
34 Statistics Canada – Catalogue no. 16F0024XIE Environmental Management and Technologies in the Business Sector
Note:This table includes reported data only.Source:Statistics Canada, Environment Accounts and Statistics Division.
Energy conservation
Energy efficient equipment 391
Fuel substitution 171
Clean fuel system 121
Waste-to-energy system 91
Cogeneration 21
Site reclamation and decommissioning
Excavation 141
Underground storage tanks handling 61
Geomembrane 51
Bioremediation 31
Solid waste management
Container 721
Compacting 211
Packaging 121
Shredding 111
Modification or preparation for landfill or waste treatment site 101
Screening 61
Dehydration 51
Crushing 41
Incineration 31
Grinding 31
Landfarming method 31
Pyrolysis 21
Table 3.13Environmental Technologies Used in the Pipeline Transportation Industry, 1998
Proportion of total establishments
Technology that used each technology
percent
Treatment of gaseous emissions
Flare system 411
Vapour condenser 361
Desulfurisation 321
Catalytic reduction 321
Dryer 321
Inertial separator (Vortex) 271
Filtration (Membrane filter) 271
Adsorption (Activated carbon adsorption) 271
Chemical oxidation 271
Cooling tower 271
Inertial separator (Centrifugal precipitator) 231
Incineration (Thermal regenerative incineration) 231
Treatment of liquid waste
Oil/water separation (Gravity) 771
Oil/water separation (Coalescing separators) 591
Adsorption system (Activated carbon adsorption) 591
Oil/water separation (Oilphylic pads) 551
Flocculation 551
Anaerobic treatment (Septic tank) 551
Primary clarification 501
Adsorption system (Other media) 501
Contact system (Air stripping) 501
Filtration (Bed filtration system) 451
Equalisation pond 451
Disinfection (Chlorination) 451
Aerobic treatment (Aeration pond) 451
Adsorption system (Polymer) 411
Oxidation (Chemical oxidation) 411
Coagulation 411
Table 3.12Environmental Technologies Used in the Primary Metal Industry, 1998 (continued)
Proportion of total establishments
Technology that used each technology
percent
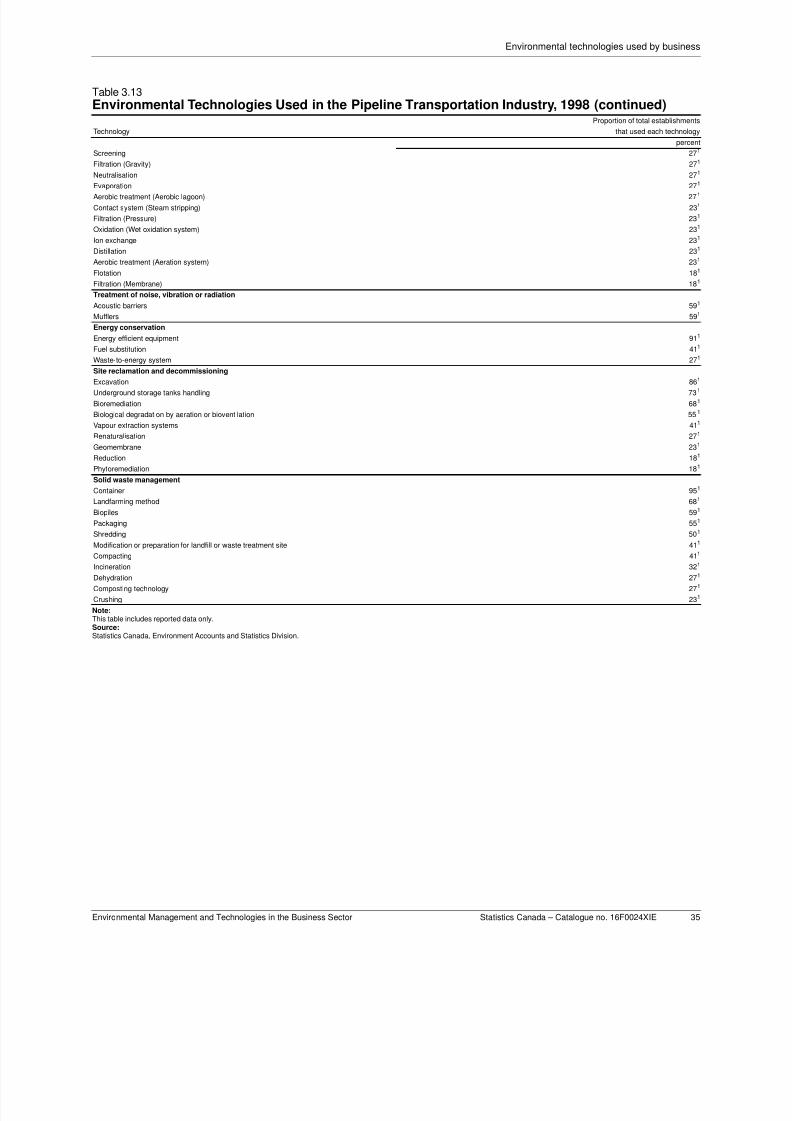
8/8/2019 Stats Canada Enviromental Technologies
http://slidepdf.com/reader/full/stats-canada-enviromental-technologies 44/62
Environmental technologies used by business
Environmental Management and Technologies in the Business Sector Statistics Canada – Catalogue no. 16F0024XIE 35
Note:This table includes reported data only.Source:Statistics Canada, Environment Accounts and Statistics Division.
Screening 271
Filtration (Gravity) 271
Neutralisation 271
Evaporation 271
Aerobic treatment (Aerobic lagoon) 271
Contact system (Steam stripping) 231
Filtration (Pressure) 231
Oxidation (Wet oxidation system) 231
Ion exchange 231
Distillation 231
Aerobic treatment (Aeration system) 231
Flotation 181
Filtration (Membrane) 181
Treatment of noise, vibration or radiation
Acoustic barriers 591
Mufflers 591
Energy conservation
Energy efficient equipment 911
Fuel substitution 411
Waste-to-energy system 271
Site reclamation and decommissioning
Excavation 861
Underground storage tanks handling 731
Bioremediation 681
Biological degradation by aeration or bioventilation 551
Vapour extraction systems 411
Renaturalisation 271
Geomembrane 231
Reduction 181
Phytoremediation 181
Solid waste management
Container 951
Landfarming method 681
Biopiles 591
Packaging 551
Shredding 501
Modification or preparation for landfill or waste treatment site 411
Compacting 411
Incineration 321
Dehydration 271
Composting technology 271
Crushing 231
Table 3.13Environmental Technologies Used in the Pipeline Transportation Industry, 1998 (continued)
Proportion of total establishments
Technology that used each technology
percent
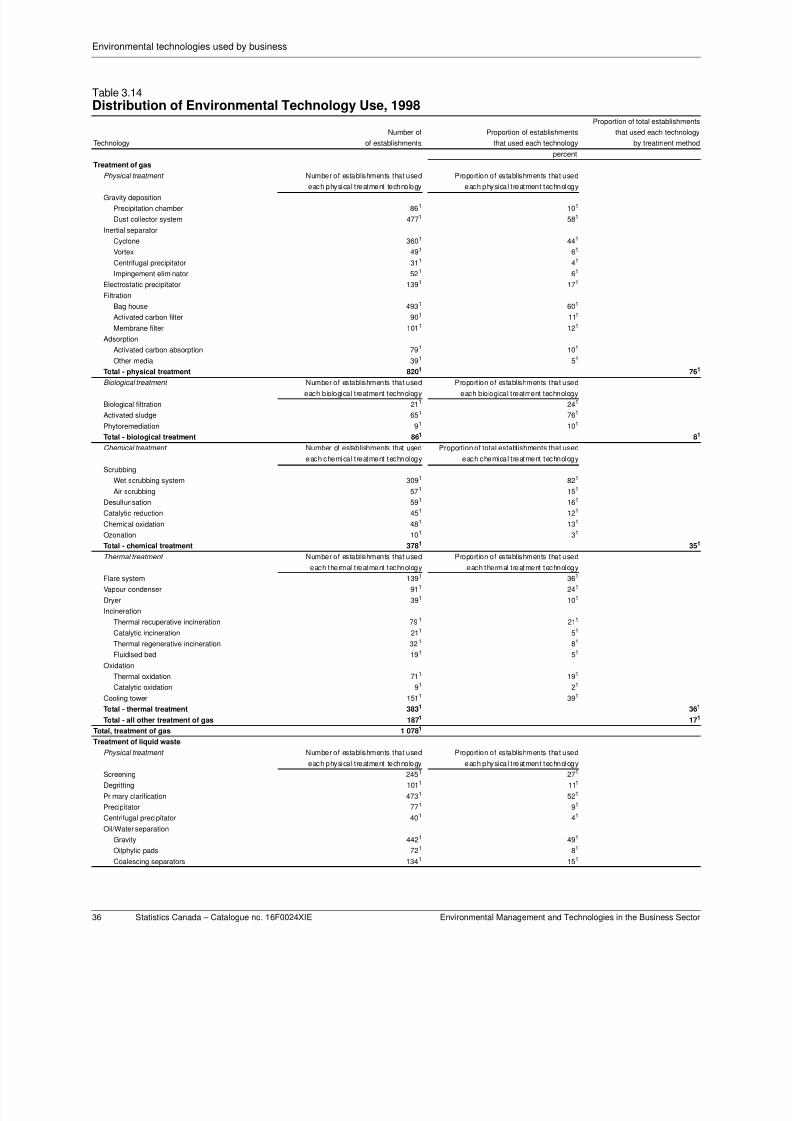
8/8/2019 Stats Canada Enviromental Technologies
http://slidepdf.com/reader/full/stats-canada-enviromental-technologies 45/62
Environmental technologies used by business
36 Statistics Canada – Catalogue no. 16F0024XIE Environmental Management and Technologies in the Business Sector
Table 3.14Distribution of Environmental Technology Use, 1998
Proportion of total establishments
Number of Proportion of establishments that used each technology
Technology of establishments that used each technology by treatment method
percent
Treatment of gas
Physical treatment Number of establishments that used Proportion of establishments that used
each physical treatment technology each physical treatment technology
Gravity deposition
Precipitation chamber 861 101
Dust collector system 4771 581
Inertial separator
Cyclone 3601 441
Vortex 491 61
Centrifugal precipitator 311 41
Impingement eliminator 521 61
Electrostatic precipitator 1391 171
Filtration
Bag house 4931 601
Activated carbon filter 901 111
Membrane filter 1011 121
Adsorption
Activated carbon absorption 791 101
Other media 391 51
Total - physical treatment 8201 761
Biological treatment Number of establishments that used Proportion of establishments that used
each biological treatment technology each biological treatment technology
Biological filtration 211 241
Activated sludge 651 761
Phytoremediation 91 101
Total - biological treatment 861 81
Chemical treatment Number of establishments that used Proportion of total establishments that used
each chemical treatment technology each chemical treatment technology
Scrubbing
Wet scrubbing system 3091 821
Air scrubbing 571 151
Desulfurisation 591 161
Catalytic reduction 451 121
Chemical oxidation 481 131
Ozonation 101 31
Total - chemical treatment 3781 351
Thermal treatment Number of establishments that used Proportion of establishments that used
each thermal treatment technology each thermal treatment technology
Flare system 1391 361
Vapour condenser 911 241
Dryer 391 101
Incineration
Thermal recuperative incineration 791 211
Catalytic incineration 211 51
Thermal regenerative incineration 321 81
Fluidised bed 191 51
Oxidation
Thermal oxidation 711 191
Catalytic oxidation 91 21
Cooling tower 1511 391
Total - thermal treatment 3831 361
Total - all other treatment of gas 1871 171
Total, treatment of gas 1 0781
Treatment of liquid waste
Physical treatment Number of establishments that used Proportion of establishments that used
each physical treatment technology each physical treatment technology
Screening 2451 271
Degritting 1011 111
Primary clarification 4731 521
Precipitator 771 91
Centrifugal precipitator 401 41
Oil/Water separation
Gravity 4421 491
Oilphylic pads 721 81
Coalescing separators 1341 151
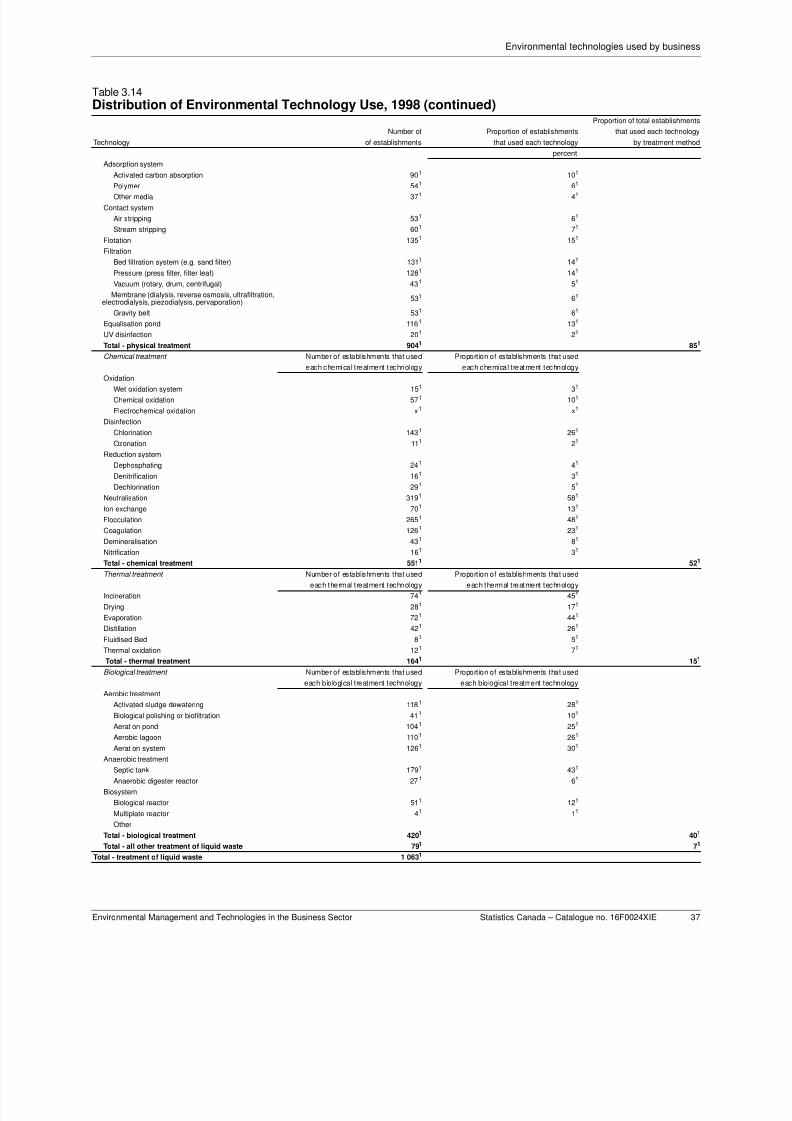
8/8/2019 Stats Canada Enviromental Technologies
http://slidepdf.com/reader/full/stats-canada-enviromental-technologies 46/62
Environmental technologies used by business
Environmental Management and Technologies in the Business Sector Statistics Canada – Catalogue no. 16F0024XIE 37
Adsorption system
Activated carbon absorption 901 101
Polymer 541 61
Other media 371 41
Contact system
Air stripping 531 61
Stream stripping 601 71
Flotation 1351 151
Filtration
Bed filtration system (e.g. sand filter) 1311 141
Pressure (press filter, filter leaf) 1281 141
Vacuum (rotary, drum, centrifugal) 431 51
Membrane (dialysis, reverse osmosis, ultrafiltration,electrodialysis, piezodialysis, pervaporation)
531 61
Gravity belt 531 61
Equalisation pond 1161 131
UV disinfection 201 21
Total - physical treatment 9041 851
Chemical treatment Number of establishments that used Proportion of establishments that used
each chemical treatment technology each chemical treatment technologyOxidation
Wet oxidation system 151 31
Chemical oxidation 571 101
Electrochemical oxidation x1 x1
Disinfection
Chlorination 1431 261
Ozonation 111 21
Reduction system
Dephosphating 241 41
Denitrification 161 31
Dechlorination 291 51
Neutralisation 3191 581
Ion exchange 701 131
Flocculation 2651 481
Coagulation 1261 231
Demineralisation 431 81
Nitrification 161
31
Total - chemical treatment 5511 521
Thermal treatment Number of establishments that used Proportion of establishments that used
each thermal treatment technology each thermal treatment technology
Incineration 741 451
Drying 281 171
Evaporation 721 441
Distillation 421 261
Fluidised Bed 81 51
Thermal oxidation 121 71
Total - thermal treatment 1641 151
Biological treatment Number of establishments that used Proportion of establishments that used
each biological treatment technology each biological treatment technology
Aerobic treatment
Activated sludge dewatering 1181 281
Biological polishing or biofiltration 411 101
Aeration pond 1041 251
Aerobic lagoon 1101
261
Aeration system 1261 301
Anaerobic treatment
Septic tank 1791 431
Anaerobic digester reactor 271 61
Biosystem
Biological reactor 511 121
Multiplate reactor 41 11
Other
Total - biological treatment 4201 401
Total - all other treatment of liquid waste 791 71
Total - treatment of liquid waste 1 0631
Table 3.14Distribution of Environmental Technology Use, 1998 (continued)
Proportion of total establishments
Number of Proportion of establishments that used each technology
Technology of establishments that used each technology by treatment method
percent
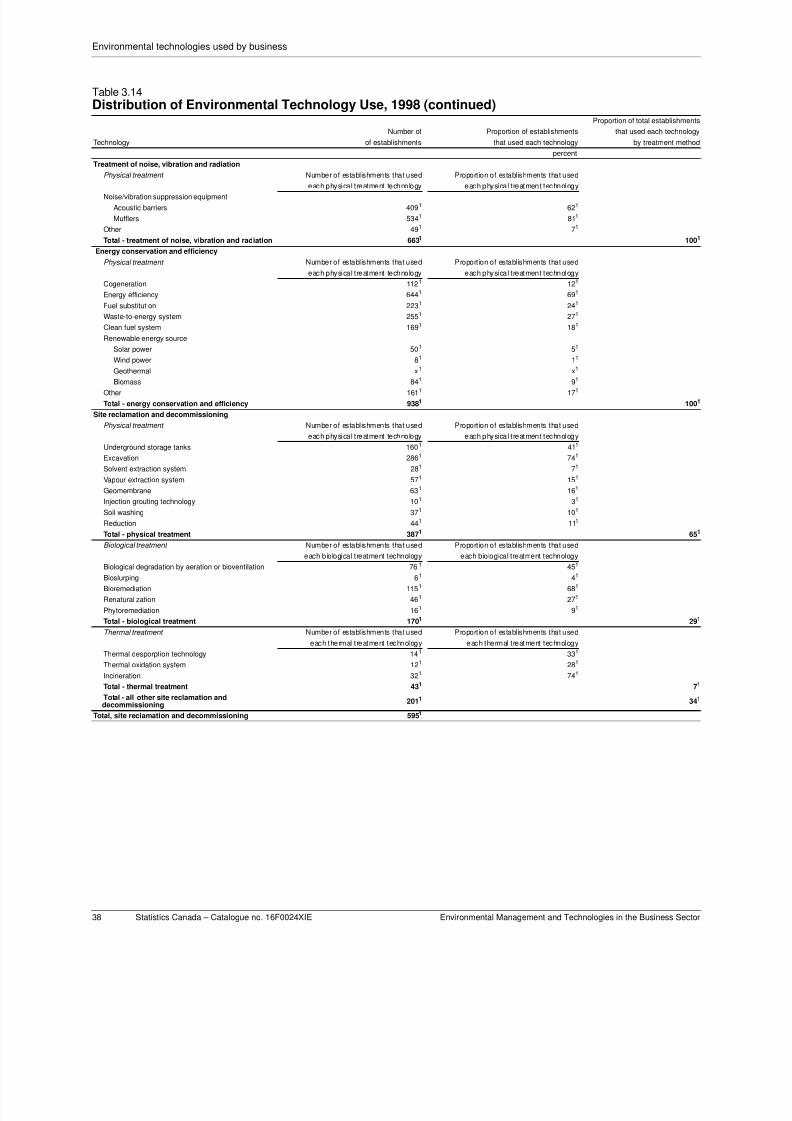
8/8/2019 Stats Canada Enviromental Technologies
http://slidepdf.com/reader/full/stats-canada-enviromental-technologies 47/62
Environmental technologies used by business
38 Statistics Canada – Catalogue no. 16F0024XIE Environmental Management and Technologies in the Business Sector
Treatment of noise, vibration and radiation
Physical treatment Number of establishments that used Proportion of establishments that used
each physical treatment technology each physical treatment technology
Noise/vibration suppression equipment
Acoustic barriers 4091 621
Mufflers 5341 811
Other 491 71
Total - treatment of noise, vibration and radiation 6631 1001
Energy conservation and efficiency
Physical treatment Number of establishments that used Proportion of establishments that used
each physical treatment technology each physical treatment technology
Cogeneration 1121 121
Energy efficiency 6441 691
Fuel substitution 2231 241
Waste-to-energy system 2551 271
Clean fuel system 1691 181
Renewable energy source
Solar power 501 51
Wind power 81 11
Geothermal x1 x1
Biomass 841 91
Other 1611 171
Total - energy conservation and efficiency 9381 1001
Site reclamation and decommissioning
Physical treatment Number of establishments that used Proportion of establishments that used
each physical treatment technology each physical treatment technology
Underground storage tanks 1601 411
Excavation 2861 741
Solvent extraction system 281 71
Vapour extraction system 571 151
Geomembrane 631 161
Injection grouting technology 101 31
Soil washing 371 101
Reduction 441 111
Total - physical treatment 3871 651
Biological treatment Number of establishments that used Proportion of establishments that used
each biological treatment technology each biological treatment technology
Biological degradation by aeration or bioventilation 761 451
Bioslurping 61 41
Bioremediation 1151 681
Renaturalization 461 271
Phytoremediation 161 91
Total - biological treatment 1701 291
Thermal treatment Number of establishments that used Proportion of establishments that used
each thermal treatment technology each thermal treatment technology
Thermal desporption technology 141 331
Thermal oxidation system 121 281
Incineration 321 741
Total - thermal treatment 431 71
Total - all other site reclamation anddecommissioning
2011 341
Total, site reclamation and decommissioning 5951
Table 3.14Distribution of Environmental Technology Use, 1998 (continued)
Proportion of total establishments
Number of Proportion of establishments that used each technology
Technology of establishments that used each technology by treatment method
percent
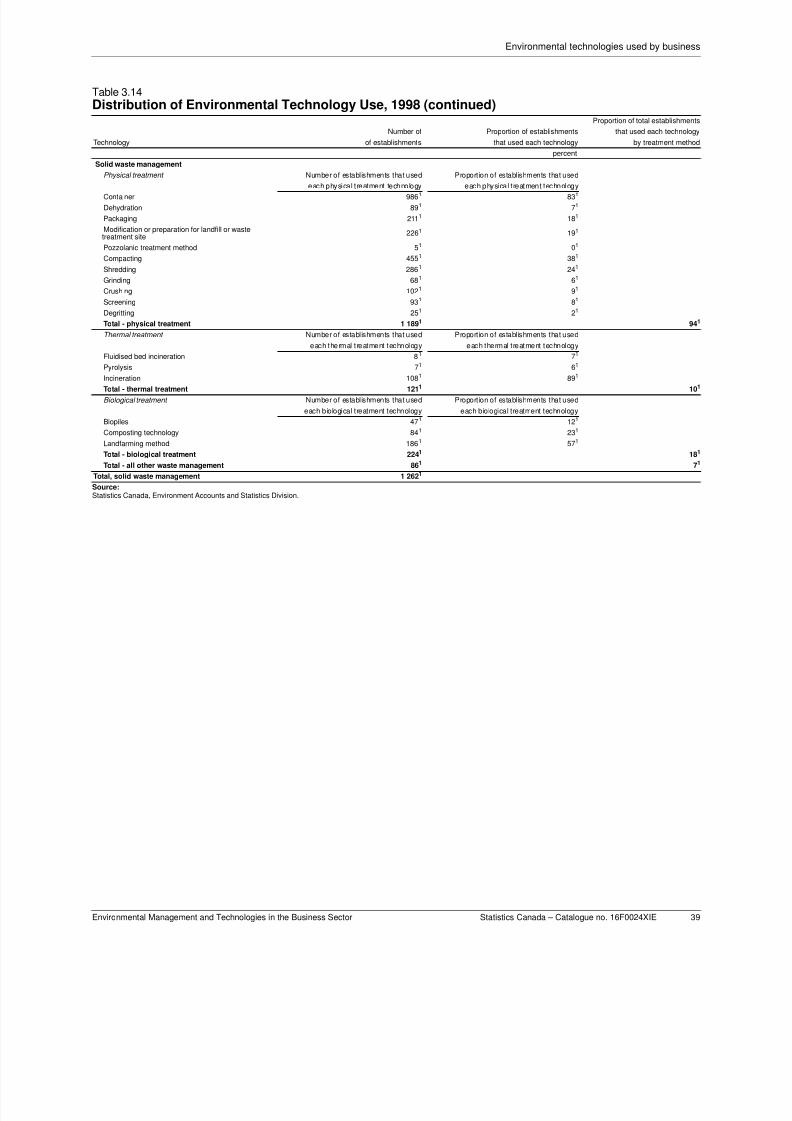
8/8/2019 Stats Canada Enviromental Technologies
http://slidepdf.com/reader/full/stats-canada-enviromental-technologies 48/62

8/8/2019 Stats Canada Enviromental Technologies
http://slidepdf.com/reader/full/stats-canada-enviromental-technologies 49/62
8/8/2019 Stats Canada Enviromental Technologies
http://slidepdf.com/reader/full/stats-canada-enviromental-technologies 50/62
Concepts, Methodology and Data Quality
Environmental Management and Technologies in the Business Sector Statistics Canada – Catalogue no. 16F0024XIE 41
4 Concepts,
Methodology and Data
Quality1
Introduction
The following information should be used to ensure a clearunderstanding of the basic concepts that define the dataprovided in this product, of the underlying methodology ofthe survey, and of key aspects of the data quality. Thisinformation will provide the user with a better understandingof the strengths and limitations of the data, and of how theycan be effectively used and analysed. The information maybe of particular importance when making comparisons withdata from other surveys or sources of information, and in
drawing conclusions regarding change over time.
4.1 Data sources andmethodology
Data presented in this report are derived from the Survey of
Environmental Protection Expenditures (SEPE), 1997 and1998. Conducted on an annual basis from 1994 to 1998, theSEPE provides a measure of the cost imposed on industryin order to comply with or to anticipate compliance withenvironmental regulations, conventions and voluntary
agreements. The 1997 and 1998 surveys also collectednew information related to businesses’ environmentalmanagement practices, pollution prevention practices anduse of environmental technologies.
The 1997 and 1998 SEPE did not cover the entire businesssector (i.e., agriculture, construction, distributive trades,and services industries were not surveyed). Rather, thesurvey targeted a number of industries for whichenvironmental protection spending was likely to constitute arelatively large proportion of total expenditures.
The data reported in this study are based upon a survey of2 459 establishments in 1997 and 2 543 establishments in
1998 in primary industries (resource extraction industries)and manufacturing industries, electric power and gasdistribution industries and the pipeline transport industry. In
order to be selected in the survey, an establishmentgenerally had to have more than 49 employees2.
Selection of target industries
1997
A number of industries were targeted for increased surveycoverage based on 2-digit and 3-digit Standard IndustrialClassification (SIC) industries (Text Box 4.1). Targetindustries were selected based on the likelihood that theyfaced or anticipated high levels of environmentalexpenditures. The selection was based upon previoussurvey results and additional information obtained fromannual reports of companies and Statistics Canada’sannual Capital and Repair Expenditure Survey 3.
Selected establishments that belonged to these targetindustries each received a detailed questionnaire (longform), from which they provided information on the three
specific questions that are the object of this report: theadoption of environmental management methods; the useof pollution prevention practices; and the use ofenvironmental technologies.
For most of these target industries, a census ofestablishments with more than 49 employees was taken.4
A sample of establishments (with more than 49 employees)in other, non-target manufacturing industries was done. Ingeneral, target industries were identified as those reportingmore than $1 000 of environmental expenditures peremployee in 1996.
1998
A total of 15 industry groups were targeted for increasedsurvey coverage in 1998 based on 4, 5, and 6-digit NAICSindustries (Text Box 4.2). Previous survey resultsdetermined that these targeted industries are more likely tohave high levels of environmental expenditures. Typically,target industries were identified as those reporting morethan $1 000 of environmental expenditures per employee in1997. Additional information obtained from the annualreports of companies and Statistics Canada’s annualCapital and Repair Expenditure Survey was also used inmaking this designation.
The following target industries were included in the census(take-all) portion of the survey: Logging (excluding contract
logging); Mining (excluding quarrying); Oil and GasExtraction; Beverages and Tobacco Products; Pulp, Paper
1. For more detailed information on methodology, please see Statistics Can-
ada, Environmental Protection Expenditures in the Business Sector, 1996
and 1997 (Revised), Catalogue No. 16F0006XIE, Ottawa, August 2000
and Statistics Canada, Environmental Protection Expenditures in the Busi-
ness Sector, 1998 , Catalogue No. 16F0006XIE, November 2001, availa-
ble free of charge on Statistics Canada’s Web site (www.statcan.ca).
2. In some provinces and territories, in order to maintain minimum coverage,
the employment thresholds were reduced.
3. The Capital and Repair Expenditure Survey provided information on indus-
tries that had relatively high capital expenditures on assets associated with
pollution abatement and control (PAC). In the past, information from sur-
veys in other countries was also used to help determine target industries.
4. In smaller provinces and in the territories, the employee threshold was
decreased.
8/8/2019 Stats Canada Enviromental Technologies
http://slidepdf.com/reader/full/stats-canada-enviromental-technologies 51/62
Data sources and methodology
42 Statistics Canada – Catalogue no. 16F0024XIE Environmental Management and Technologies in the Business Sector
and Paperboard Mills; Primary Metals; Petroleum and CoalProducts; Electric Power Generation, Transmission, andDistribution; Pipeline Transportation; and Natural GasDistribution.
1998 Industry classification
In previous years establishments were selected based onthe 1980 Standard Industrial Classification System (SIC).However, beginning with reference year 1998 industryselection was based on the North American IndustryClassification System (NAICS).
This new classification system was developed as acooperative effort between the statistical agencies ofCanada, Mexico and the United States. Created against thebackground of the North American Free Trade Agreement,it is designed to provide common definitions of the industrialstructure of the three countries and a common statisticalframework to facilitate the analysis of the three economies.1
The establishments that were surveyed in both 1997 and1998 were compared to examine any differences in industryclassification resulting from the switch to NAICS. It wasfound that an insignificant number of establishments werereclassified into different industry groups, thus allowing forcomparisons with previous survey years.2
Sample selection
1997
The survey included a census strata (take-all) and a samplestrata (take-some). Target industries (manufacturing andnon-manufacturing industries) were included in the censusportion of the survey, with the exception of the followingindustries: Food, Wood, Non-Metallic Mineral Products,Transportation Equipment and Chemical and ChemicalProducts.
For these 5 manufacturing industries, a stratified sample(including some take-all and take-some strata) was taken atthe 3-digit SIC level because of their low environmentalexpenditure per employee ratio and their large number ofsmall and medium-sized establishments. However, thesefive manufacturing industries remained target industriesbecause the environmental expenditure to employee ratiowas higher than $1 000 at the 2-digit SIC level.Consequently, establishments in these industries receiveda long form.
The non-targeted manufacturing industries were sampledat the 3-digit SIC level and grouped into an “othermanufacturing” category. Establishments (with more than
49 employees) in these industries received a shortquestionnaire and therefore did not provide information ontheir use of environmental technologies nor environmentalmanagement practices.3
The take-some strata were selected by rankingestablishments within each 3-digit SIC by total employment.If there were 50 or more establishments in the 3-digit SICs,the top 15% of establishments were selected. If there werebetween 15 and 49 establishments, the top 20% wereselected. Where the total number of establishments fellbelow 15, all establishments were selected. In someprovinces and territories, in order to obtain minimumcoverage, the employment thresholds were reduced. The
sample selected the largest establishments in order tominimise response burden.
1. Statistics Canada, 1997, North American Industry Classification System,
Catalogue No. 12-501-XPE, Ottawa.
2. For additional information on the impact of the conversion to a NAICS-
based classification system from SIC80, please see: Statistics Canada,
September 1999, Private and Public Investment in Canada, Revised
Intentions, 1999 , pp. 11-14, Catalogue No. 61-206-XIB.
3. For more information on the survey methodology, please consult Statistics
Canada, 2000, Environmental Protection Expenditures in the Business
Sector, 1996 and 1997 (revised), Catalogue No. 16F0006XIE, August,
Ottawa, available free of charge on Statistics Canada’s Web site
(www.statcan.ca).
Text Box 4.11997 List of Selected Targeted Industries
• Logging (SIC 041)
• Mining (SICs 061, 062, 063)
• Crude Petroleum and Natural Gas (SIC 071)
• Food (SICs 101-109) and Tobacco Products (SICs121-122)
• Beverage (SICs 111-114)
• Wood (SICs 251, 252, 254 and 259)
• Pulp and Paper (SIC 271)
• Primary Metals (2-digit SIC 29)
• Transportation Equipment (SICs 321-329)
• Non-Metallic Mineral Products (2-digit SIC 35)
• Refined Petroleum and Coal Products (2-digitSIC 36)
• Chemical Products (2-digit SIC 37)
• Pipeline Transport (SIC 461)
• Gas Distribution Systems (SIC 492)
• Electric Power (SIC 491)
8/8/2019 Stats Canada Enviromental Technologies
http://slidepdf.com/reader/full/stats-canada-enviromental-technologies 52/62
Concepts and variables measured
Environmental Management and Technologies in the Business Sector Statistics Canada – Catalogue no. 16F0024XIE 43
1998
The manufacturing sample was a stratified sample basedupon employment. This employment-based stratifiedsample was used to determine a take-all portion and a take-
some portion. The take-all strata contained the followingindustries: Beverage and Tobacco Products; Pulp, Paper,and Paperboard Mills; Primary Metals; and Petroleum andCoal Products. All establishments with over 49 employeesin these target manufacturing industries were surveyed astake-all using a more detailed (long) questionnaire (non-targeted manufacturing industries received a shorterversion of the questionnaire).
The remaining target manufacturing industries (Food;Wood Products; Non-metallic Mineral Products;Transportation Equipment; and Chemicals) were sampledusing a combination of the take-all and take-some strata.These industries were sampled because of their low
environmental expenditure per employee ratio (at the 4, 5 or6-digit NAICS level, depending on the industry) and theirlarge number of small and medium-sized establishments.However, these six manufacturing industries remainedtarget industries because the environmental expenditure toemployee ratio was higher than $1 000 at the 3-digit NAICSlevel. Consequently, establishments in these industriesreceived a long form.
The non-targeted manufacturing industries were sampledat the 4-digit NAICS level and grouped into an "othermanufacturing" category. To minimize response burden,sampled establishments (with more than 49 employees) inthese industries received a short questionnaire.
The take-some strata were selected by ranking
establishments within each 4, 5, or 6-digit NAICS (againdepending on the industry group) by total employment. Ifthere were 50 or more establishments in the 4-digit NAICS,the top 15% of establishments were selected. If there werebetween 15 and 49 establishments, the top 20% wereselected. Where the total number of establishments fellbelow 15, all establishments were selected. In someprovinces and territories, in order to obtain minimumcoverage, the employment thresholds were reduced. Thesample selected the largest establishments in order tominimise response burden.
All establishments with more than 49 employees in Logging;Mining; Oil and Gas Extraction; Electric Power Generation,
Transmission and Distribution; Natural Gas Distribution;and Pipeline Transportation industries were selected. Allestablishments were surveyed using the long (moredetailed) questionnaire.
Analysis had shown that there was no correlation betweenthe environmental expenditure to employment ratio andemployment size. Therefore, it was assumed that no biaswas introduced by surveying the largest establishments inan industry group.
4.2 Concepts and variables
measuredThe survey questionnaire was originally designed inconsultation with key public and private sector groups andby looking at the experience of other countries who haveconducted similar surveys. The scope of the survey was toinclude all expenditures that are required to meetenvironmental regulation, convention or voluntaryagreement1 (see the questionnaire for further explanation).As mentioned above, there were two questionnaires, a longform for target industries and a short form for othermanufacturing industries. The mail out of the 1997 surveytook place in November 1998. The 1998 mail out took placein November 1999.
This report focuses on three questions from the 1997 and1998 SEPE: 1) the adoption of global environmentalmanagement practices such as life cycle analysis; 2) themethods used to prevent pollution; and 3) the technologiesused to reduce pollution.
1. Environmental voluntary agreements were added as a specific criterion (in
addition to the convention criterion) for the 1997 SEPE.
Text Box 4.11998 List of Selected Targeted Industries
• Logging (NAICS 113311, 113312)
• Oil and Gas Extraction (NAICS 211)
• Mining (NAICS 2121, 2122, 21239)
• Electric Power Generation, Transmissionand Distribution (NAICS 2211)
• Natural Gas Distribution (NAICS 2212)
• Food (NAICS 311)
• Beverage and Tobacco Products (NAICS 312)
• Wood Products (NAICS 321)
• Pulp, Paper, and Paperboard Mills (NAICS 3221)
• Petroleum and Coal Products (NAICS 324)
• Chemicals (NAICS 325)
• Non-Metallic Mineral Products (NAICS 327)
• Primary Metals (NAICS 331)
• Transportation Equipment (NAICS 336)
8/8/2019 Stats Canada Enviromental Technologies
http://slidepdf.com/reader/full/stats-canada-enviromental-technologies 53/62
8/8/2019 Stats Canada Enviromental Technologies
http://slidepdf.com/reader/full/stats-canada-enviromental-technologies 54/62
Data Quality
Environmental Management and Technologies in the Business Sector Statistics Canada – Catalogue no. 16F0024XIE 45
Follow-ups via fax and/or telephone were carried out afterthe due date to remind respondents to return their surveys.
Questionnaires were edited in two steps. First, validity editswere applied to ensure that responses to particularquestions fell within a limited range of possible values.Second, consistency edits were then applied. Cases where
responses in one section of the questionnaire wereinconsistent with those given in other sections wereidentified and edited. These edits were done on an ongoingbasis throughout the data collection phase.
Additional follow-ups were carried out to collect missingdata and to resolve inconsistencies.
For the 1997 reference year, there were 1 881 reportsreceived for 2 459 surveyed establishments. The responserate obtained by the 1997 survey was 76%, based on thenumber of reporting establishments, and 85% based onemployment covered. This represented an improvementover 1996.1
For the 1998 reference year, there were 2 108 reportsreceived for 2 543 surveyed establishments. The responserate for the 1998 survey was 83%, based on the number ofreporting establishments, and 88% based on employmentcovered.
Specific questions
There were 1 7432 questionnaires mailed to individualestablishments for the 1997 reference year. Over 1 000establishments answered the question on the type ofenvironmental management practices they used
(Question 13). This represents a response rate of 62%. Theresponse rate for Question 7c, pollution preventionmethods, is the same as the overall response rate for the1997 survey (76%).
There were 1 8313 questionnaires mailed to individualestablishments for the 1998 reference year. One thousandfour hundred and fifty four returned the questionnaire with atleast one environmental technology chosen. Theassumption was made that every establishment wouldindicate the use of at least one process or technology listedin Question 124. Given this assumption, the response ratewas 79% (Table 4.1). The number of establishments thatanswered the question on the type of environmental
management practice they used was virtually identical
(1 455). The response rate for pollution prevention methodswas 83%.
The results presented in this report include reported dataonly. There was no imputation nor estimation done for non-response. Given the large number of possible responsesand the cross-sectional nature of the Survey of
Environmental Protection Expenditures , estimating for non-response would not have resulted in improved results.
When interpreting the results, users must also take intoconsideration that the Survey of Environmental Protection
Expenditures was sent to those establishments with 50 ormore employees. In addition, establishments in thesampled industry codes were selected based onemployment rank (the establishments with the largestnumber of employees were chosen). The largestestablishments are more likely to have the means to adoptenvironmental management and pollution preventionpractices.
Sampling and non-sampling errors
There are two general categories of error in surveys. Thefirst one arises from the fact that a sample or subset of thetarget population is used to represent the population. This isreferred to as sampling error and its size is quantifiable. Theother category is referred to as non-sampling error and isnot as easily quantified because of its nature. Non-samplingerror refers to all the other kinds of error that arise in surveys- incomplete or inaccurate lists of the general population,respondent misinterpretation of questions, provision oferroneous information, failure or refusal to respond,information processing errors, and so on.
Typically the sampling error is measured by the coefficientof variation, that is the standard deviation or expectedvariability of the estimate as a percentage of the estimate.In the case of the Survey of Environmental Protection
Expenditures , the sample of establishments to be surveyedwas not randomly selected. Rather, a minimal samplenumber was calculated, and the establishments with thelargest number of employees were chosen. Thismethodology was used in order to survey the largestproportion of employment in each target industry whilekeeping response burden to a minimum.
Every attempt was made to eliminate the non-sampling
errors from the results of both surveys. Establishmentsbrought into the survey for the first time were researchedand it was verified that the contact information wasaccurate. The returned questionnaires were verified andvalidated before data capture. The data were edited andtabulated automatically. Extensive follow-up was carriedout for incomplete responses and for non-response.Instructions and definitions were further refined.
1. For further detail on response rates and data quality, please see Environ-
mental Protection Expenditures in the Business Sector, 1996 and 1997
(revised), Statistics Canada, Catalogue No. 16F0006XIE (available free of
charge on Statistics Canada Web site www.statcan.ca).
2. This does not include out of scope, out of business, amalgamations or
sales of operations etc.
3. Ibid .
4. For example, it can be assumed that every respondent must manage
some form of solid waste.
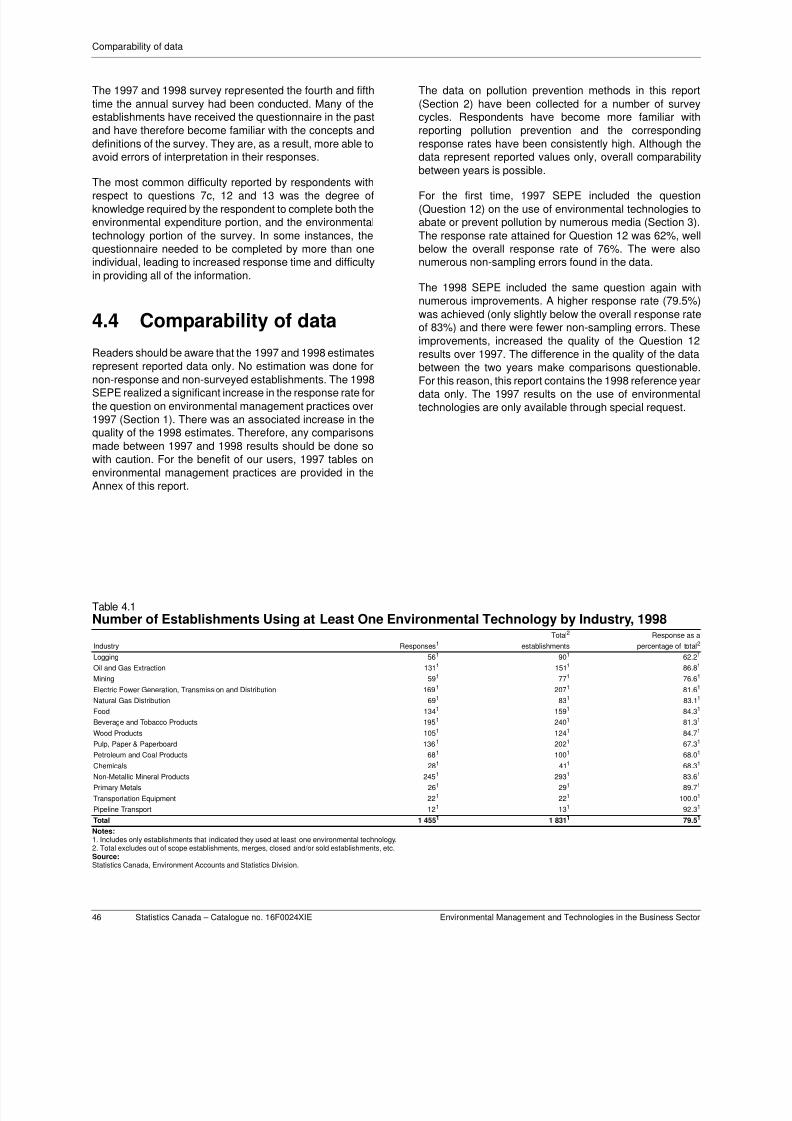
8/8/2019 Stats Canada Enviromental Technologies
http://slidepdf.com/reader/full/stats-canada-enviromental-technologies 55/62
8/8/2019 Stats Canada Enviromental Technologies
http://slidepdf.com/reader/full/stats-canada-enviromental-technologies 56/62
Statistical Tables
Environmental Management and Technologies in the Business Sector Statistics Canada – Catalogue no. 16F0024XIE 47
Annex A: Statistical Tables

8/8/2019 Stats Canada Enviromental Technologies
http://slidepdf.com/reader/full/stats-canada-enviromental-technologies 57/62
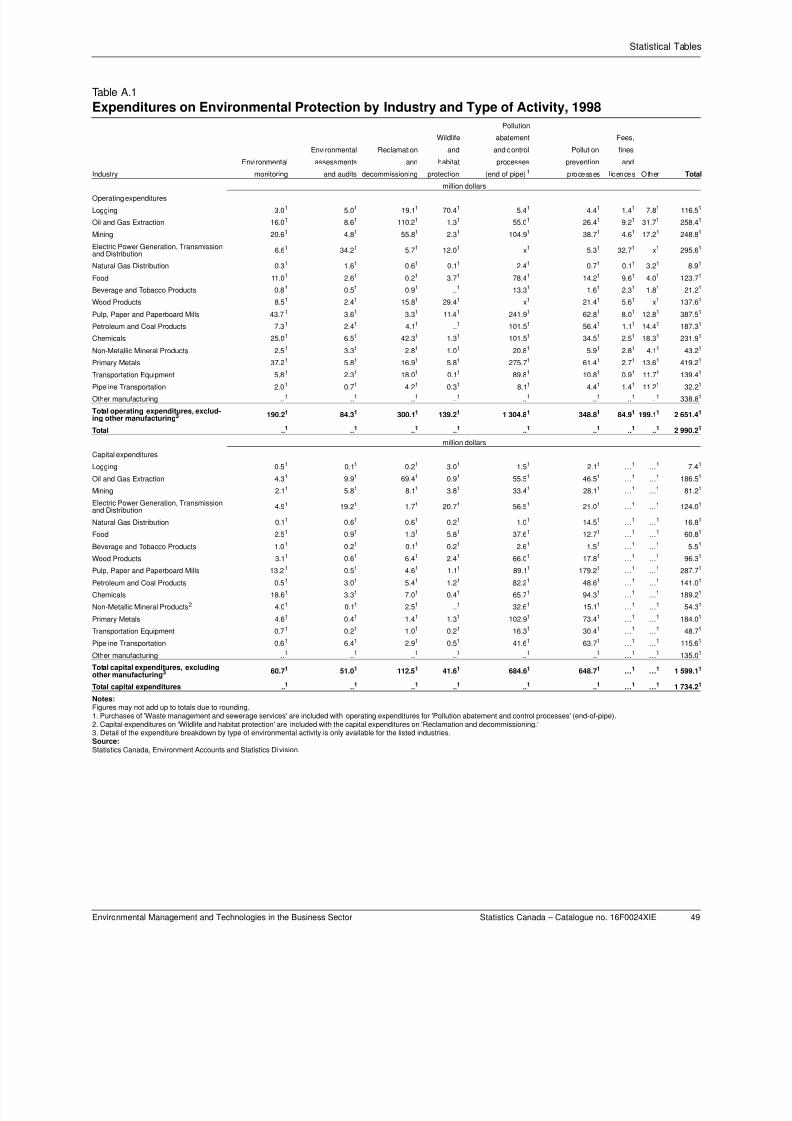
8/8/2019 Stats Canada Enviromental Technologies
http://slidepdf.com/reader/full/stats-canada-enviromental-technologies 58/62
Statistical Tables
Environmental Management and Technologies in the Business Sector Statistics Canada – Catalogue no. 16F0024XIE 49
Notes:Figures may not add up to totals due to rounding.1. Purchases of 'Waste management and sewerage services' are included with operating expenditures for 'Pollution abatement and control processes' (end-of-pipe).2. Capital expenditures on 'Wildlife and habitat protection' are included with the capital expenditures on 'Reclamation and decommissioning.'3. Detail of the expenditure breakdown by type of environmental activity is only available for the listed industries.
Source:Statistics Canada, Environment Accounts and Statistics Di vision.
Table A.1
Expenditures on Environmental Protection by Industry and Type of Activity, 1998
Pollution
Wildlife abatement Fees,
Environmental Reclamation and and control Pollution fines
Environmental assessments and habitat processes prevention and
Industry monitoring and audits decommissioning protection (end of pipe)1 processes l icences Other Total
million dollars
Operating expenditures
Logging 3.01 5.01 19.11 70.41 5.41 4.41 1.41 7.81 116.51
Oil and Gas Extraction 16.01 8.61 110.21 1.31 55.01 26.41 9.21 31.71 258.41
Mining 20.61 4.81 55.81 2.31 104.91 38.71 4.61 17.21 248.81
Electric Power Generation, Transmissionand Distribution
6.61 34.21 5.71 12.01 x1 5.31 32.71 x1 295.61
Natural Gas Distribution 0.31 1.61 0.61 0.11 2.41 0.71 0.11 3.21 8.91
Food 11.01 2.61 0.21 3.71 78.41 14.21 9.61 4.01 123.71
Beverage and Tobacco Products 0.81 0.51 0.91 ..1 13.31 1.61 2.31 1.81 21.21
Wood Products 8.51 2.41 15.81 29.41 x1 21.41 5.61 x1 137.61
Pulp, Paper and Paperboard Mills 43.71 3.61 3.31 11.41 241.91 62.81 8.01 12.81 387.51
Petroleum and Coal Products 7.31 2.41 4.11 ..1 101.51 56.41 1.11 14.41 187.31
Chemicals 25.01 6.51 42.31 1.31 101.51 34.51 2.51 18.31 231.91
Non-Metallic Mineral Products 2.51 3.31 2.81 1.01 20.81 5.91 2.81 4.11 43.21
Primary Metals 37.21 5.81 16.91 5.81 275.71 61.41 2.71 13.61 419.21
Transportation Equipment 5.81 2.31 18.01 0.11 89.81 10.81 0.91 11.71 139.41
Pipeline Transportation 2.01 0.71 4.21 0.31 8.11 4.41 1.41 11.21 32.21
Other manufacturing ..1 ..1 ..1 ..1 ..1 ..1 ..1 ..1 338.81
Total operating expenditures, exclud-ing other manufacturing3 190.21 84.31 300.11 139.21 1 304.81 348.81 84.91 199.11 2 651.41
Total ..1 ..1 ..1 ..1 ..1 ..1 ..1 ..1 2 990.21
million dollars
Capital expenditures
Logging 0.51 0.11 0.21 3.01 1.51 2.11 …1 …1 7.41
Oil and Gas Extraction 4.31 9.91 69.41 0.91 55.51 46.51 …1 …1 186.51
Mining 2.11 5.81 8.11 3.81 33.41 28.11 …1 …1 81.21
Electric Power Generation, Transmissionand Distribution
4.91 19.21 1.71 20.71 56.51 21.01 …1 …1 124.01
Natural Gas Distribution 0.11 0.61 0.61 0.21 1.01 14.51 …1 …1 16.81
Food 2.51 0.91 1.31 5.81 37.61 12.71 …1 …1 60.81
Beverage and Tobacco Products 1.01 0.21 0.11 0.21 2.61 1.51 …1 …1 5.51
Wood Products 3.11 0.61 6.41 2.41 66.01 17.81 …1 …1 96.31
Pulp, Paper and Paperboard Mills 13.21 0.51 4.61 1.11 89.11 179.21 …1 …1 287.71
Petroleum and Coal Products 0.51 3.01 5.41 1.21 82.21 48.61 …1 …1 141.01
Chemicals 18.61 3.31 7.01 0.41 65.71 94.31 …1 …1 189.21
Non-Metallic Mineral Products2 4.01 0.11 2.51 ..1 32.61 15.11 …1 …1 54.31
Primary Metals 4.61 0.41 1.41 1.31 102.91 73.41 …1 …1 184.01
Transportation Equipment 0.71 0.21 1.01 0.21 16.31 30.41 …1 …1 48.71
Pipeline Transportation 0.61 6.41 2.91 0.51 41.61 63.71 …1 …1 115.61
Other manufacturing ..1 ..1 ..1 ..1 ..1 ..1 …1 …1 135.01
Total capital expenditures, excludingother manufacturing3 60.71 51.01 112.51 41.61 684.61 648.71 …1 …1 1 599.11
Total capital expenditures ..1 ..1 ..1 ..1 ..1 ..1 …1 …1 1 734.21
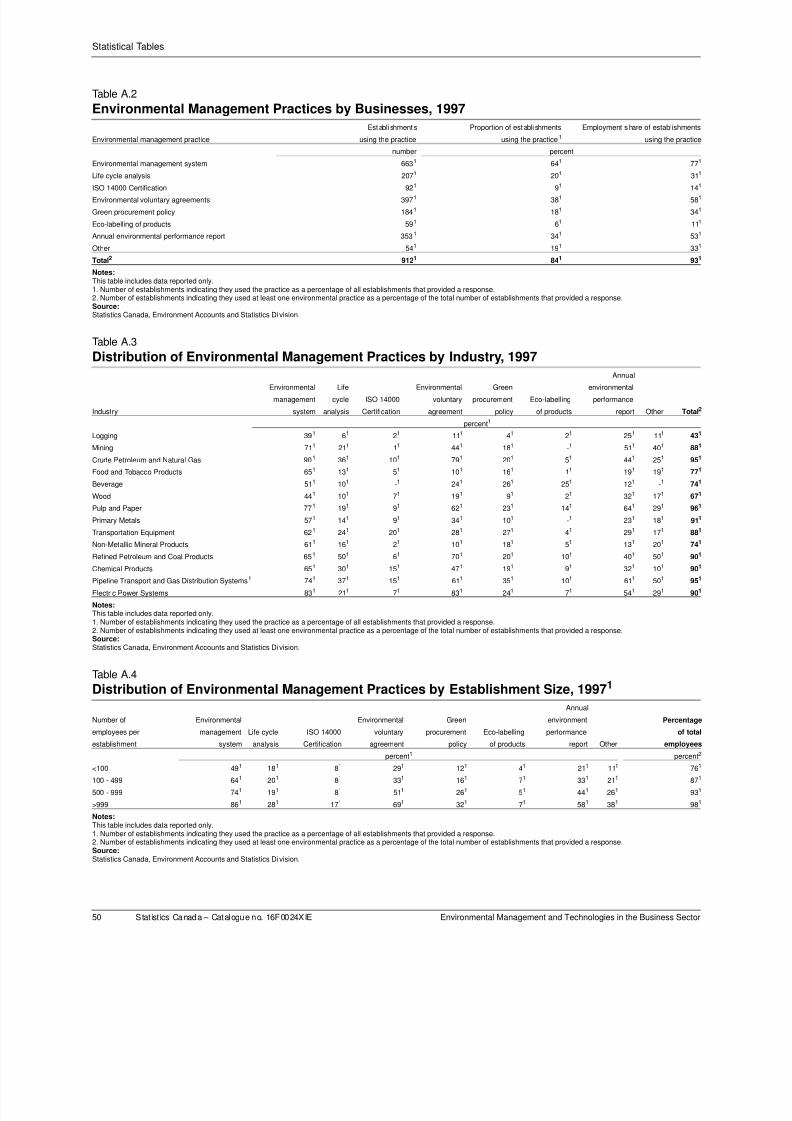
8/8/2019 Stats Canada Enviromental Technologies
http://slidepdf.com/reader/full/stats-canada-enviromental-technologies 59/62
Statistical Tables
50 Statist ics Canada – Catalogue no. 16F0024XIE Environmental Management and Technologies in the Business Sector
Notes:This table includes data reported only.1. Number of establishments indicating they used the practice as a percentage of all establishments that provided a response.2. Number of establishments indicating they used at least one environmental practice as a percentage of the total number of establishments that provided a response.Source:Statistics Canada, Environment Accounts and Statistics Di vision.
Notes:This table includes data reported only.1. Number of establishments indicating they used the practice as a percentage of all establishments that provided a response.2. Number of establishments indicating they used at least one environmental practice as a percentage of the total number of establishments that provided a response.Source:Statistics Canada, Environment Accounts and Statistics Di vision.
Notes:This table includes data reported only.1. Number of establishments indicating they used the practice as a percentage of all establishments that provided a response.2. Number of establishments indicating they used at least one environmental practice as a percentage of the total number of establishments that provided a response.Source:Statistics Canada, Environment Accounts and Statistics Di vision.
Table A.2
Environmental Management Practices by Businesses, 1997
Establi shments Proportion of establi shments Employment share of establishments
Environmental management practice using the practice using the practice1 using the practice
number percent
Environmental management system 6631 641 771
Life cycle analysis 2071 201 311
ISO 14000 Certification 921 91 141
Environmental voluntary agreements 3971 381 581
Green procurement policy 1841 181 341
Eco-labelling of products 591 61 111
Annual environmental performance report 3531 341 531
Other 541 191 331
Total2 9121 841 931
Table A.3
Distribution of Environmental Management Practices by Industry, 1997
Annual
Environmental Life Environmental Green environmental
management cycle ISO 14000 voluntary procurement Eco-labelling performance
Industry system analysis Certification agreement policy of products report Other Total2
percent1
Logging 391 61 21 111 41 21 251 111 431
Mining 711 211 11 441 181 -1 511 401 881
Crude Petroleum and Natural Gas 901 361 101 791 201 51 441 251 951
Food and Tobacco Products 651 131 51 101 161 11 191 191 771
Beverage 511 101 -1 241 261 251 121 -1 741
Wood 441 101 71 191 91 21 321 171 671
Pulp and Paper 771 191 91 621 231 141 641 291 961
Primary Metals 571 141 91 341 101 -1 231 181 911
Transportation Equipment 621 241 201 281 271 41 291 171 881
Non-Metallic Mineral Products 611 161 21 101 181 51 131 201 741
Refined Petroleum and Coal Products 651 501 61 701 201 101 401 501 901
Chemical Products 651 301 151 471 191 91 321 101 901
Pipeline Transport and Gas Distribution Systems1 741 371 151 611 351 101 611 501 951
Electric Power Systems 831 211 71 831 241 71 541 291 901
Table A.4
Distribution of Environmental Management Practices by Establishment Size, 19971
Annual
Number of Environmental Environmental Green environment Percentage
employees per management Life cycle ISO 14000 voluntary procurement Eco-labelling performance of total
establishment system analysis Certification agreement policy of products report Other employees
percent1 percent2
<100 491 181 81 291 121 41 211 111 761
100 - 499 641 201 81 331 161 71 331 211 871
500 - 999 741 191 81 511 261 51 441 261 931
>999 861 281 171 691 321 71 581 381 981
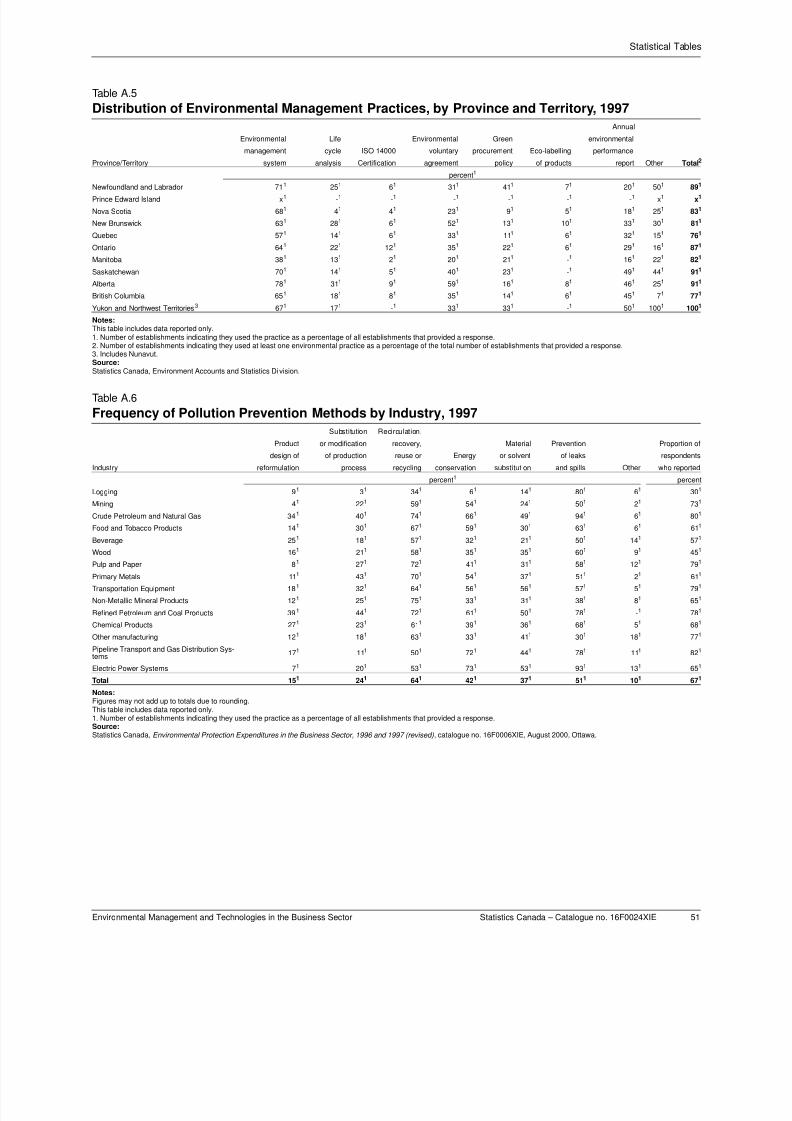
8/8/2019 Stats Canada Enviromental Technologies
http://slidepdf.com/reader/full/stats-canada-enviromental-technologies 60/62
Statistical Tables
Environmental Management and Technologies in the Business Sector Statistics Canada – Catalogue no. 16F0024XIE 51
Notes:This table includes data reported only.1. Number of establishments indicating they used the practice as a percentage of all establishments that provided a response.2. Number of establishments indicating they used at least one environmental practice as a percentage of the total number of establishments that provided a response.3. Includes Nunavut.Source:
Statistics Canada, Environment Accounts and Statistics Di vision.
Notes:Figures may not add up to totals due to rounding.This table includes data reported only.1. Number of establishments indicating they used the practice as a percentage of all establishments that provided a response.Source:Statistics Canada,
Environmental Protection Expenditures in the Business Sector, 1996 and 1997 (revised), catalogue no. 16F0006XIE, August 2000, Ottawa.
Table A.5
Distribution of Environmental Management Practices, by Province and Territory, 1997
Annual
Environmental Life Environmental Green environmental
management cycle ISO 14000 voluntary procurement Eco-labelling performance
Province/Territory system analysis Certification agreement policy of products report Other Total2
percent1
Newfoundland and Labrador 711 251 61 311 411 71 201 501 891
Prince Edward Island x1 -1 -1 -1 -1 -1 -1 x1 x1
Nova Scotia 681 41 41 231 91 51 181 251 831
New Brunswick 631 281 61 521 131 101 331 301 811
Quebec 571 141 61 331 111 61 321 151 761
Ontario 641 221 121 351 221 61 291 161 871
Manitoba 381 131 21 201 211 -1 161 221 821
Saskatchewan 701 141 51 401 231 -1 491 441 911
Alberta 781 311 91 591 161 81 461 251 911
British Columbia 651 181 81 351 141 61 451 71 771
Yukon and Northwest Territories3 671 171 -1 331 331 -1 501 1001 1001
Table A.6
Frequency of Pollution Prevention Methods by Industry, 1997
Substitution Recirculation.
Product or modification recovery, Material Prevention Proportion of
design of of production reuse or Energy or solvent of leaks respondents
Industry reformulation process recycling conservation substitution and spills Other who reported
percent1 percent
Logging 91 31 341 61 141 801 61 301
Mining 41 221 591 541 241 501 21 731
Crude Petroleum and Natural Gas 341 401 741 661 491 941 61 801
Food and Tobacco Products 141 301 671 591 301 631 61 611
Beverage 251 181 571 321 211 501 141 571
Wood 161
211
581
351
351
601
91
451
Pulp and Paper 81 271 721 411 311 581 121 791
Primary Metals 111 431 701 541 371 511 21 611
Transportation Equipment 181 321 641 561 561 571 51 791
Non-Metallic Mineral Products 121 251 751 331 311 381 81 651
Refined Petroleum and Coal Products 391 441 721 611 501 781 -1 781
Chemical Products 271 231 611 391 361 681 51 681
Other manufacturing 121 181 631 331 411 301 181 771
Pipeline Transport and Gas Distribution Sys-tems
171 111 501 721 441 781 111 821
Electric Power Systems 71 201 531 731 531 931 131 651
Total 151 241 641 421 371 511 101 671
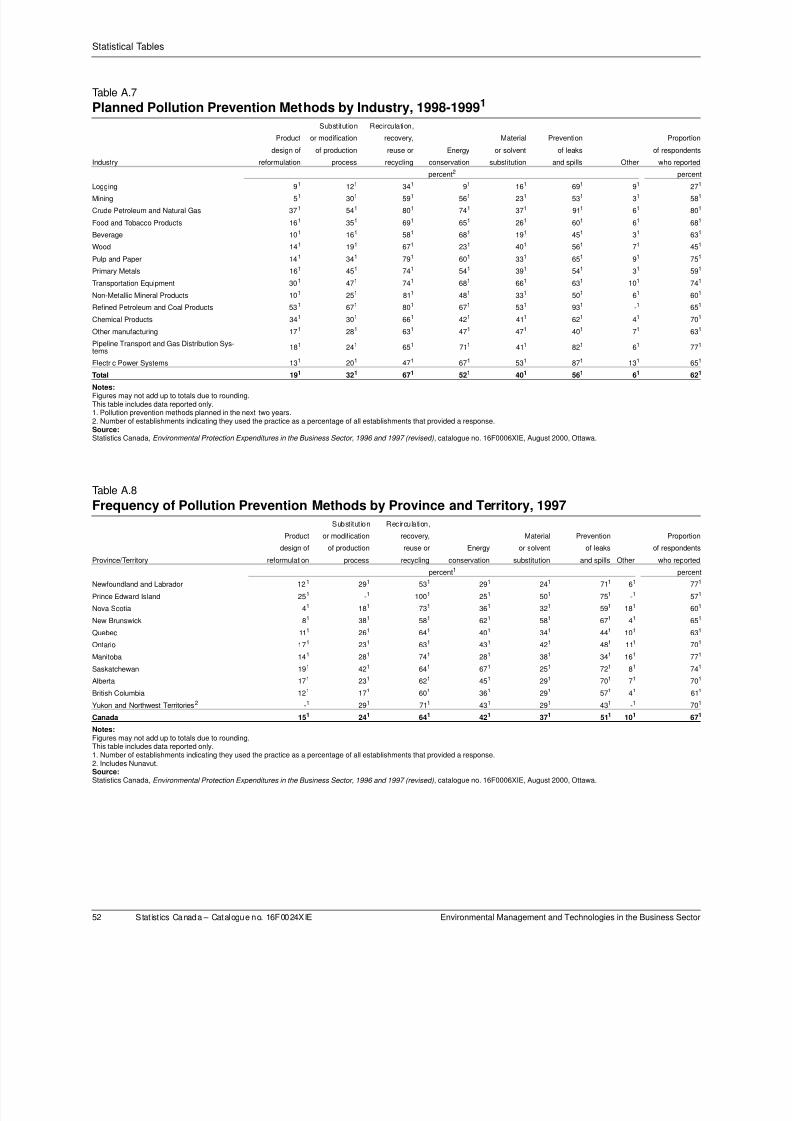
8/8/2019 Stats Canada Enviromental Technologies
http://slidepdf.com/reader/full/stats-canada-enviromental-technologies 61/62
Statistical Tables
52 Statist ics Canada – Catalogue no. 16F0024XIE Environmental Management and Technologies in the Business Sector
Notes:Figures may not add up to totals due to rounding.This table includes data reported only.1. Pollution prevention methods planned in the next two years.2. Number of establishments indicating they used the practice as a percentage of all establishments that provided a response.Source:Statistics Canada, Environmental Protection Expenditures in the Business Sector, 1996 and 1997 (revised), catalogue no. 16F0006XIE, August 2000, Ottawa.
Notes:
Figures may not add up to totals due to rounding.This table includes data reported only.1. Number of establishments indicating they used the practice as a percentage of all establishments that provided a response.2. Includes Nunavut.Source:Statistics Canada, Environmental Protection Expenditures in the Business Sector, 1996 and 1997 (revised), catalogue no. 16F0006XIE, August 2000, Ottawa.
Table A.7
Planned Pollution Prevention Methods by Industry, 1998-19991
Substitution Recirculation,
Product or modification recovery, Material Prevention Proportion
design of of production reuse or Energy or solvent of leaks of respondents
Industry reformulation process recycling conservation substitution and spills Other who reported
percent2 percent
Logging 91 121 341 91 161 691 91 271
Mining 51 301 591 561 231 531 31 581
Crude Petroleum and Natural Gas 371 541 801 741 371 911 61 801
Food and Tobacco Products 161 351 691 651 261 601 61 681
Beverage 101 161 581 681 191 451 31 631
Wood 141 191 671 231 401 561 71 451
Pulp and Paper 141 341 791 601 331 651 91 751
Primary Metals 161 451 741 541 391 541 31 591
Transportation Equipment 301 471 741 681 661 631 101 741
Non-Metallic Mineral Products 101 251 811 481 331 501 61 601
Refined Petroleum and Coal Products 531 671 801 671 531 931 -1 651
Chemical Products 341 301 661 421 411 621 41 701
Other manufacturing 171 281 631 471 471 401 71 631
Pipeline Transport and Gas Distribution Sys-tems
181 241 651 711 411 821 61 771
Electric Power Systems 131 201 471 671 531 871 131 651
Total 191 321 671 521 401 561 61 621
Table A.8
Frequency of Pollution Prevention Methods by Province and Territory, 1997
Substitution Recirculation,
Product or modification recovery, Material Prevention Proportion
design of of production reuse or Energy or solvent of leaks of respondents
Province/Territory reformulation process recycling conservation substitution and spills Other who reported
percent1 percent
Newfoundland and Labrador 121 291 531 291 241 711 61 771
Prince Edward Island 251 -1 1001 251 501 751 -1 571
Nova Scotia 41 181 731 361 321 591 181 601
New Brunswick 81 381 581 621 581 671 41 651
Quebec 111 261 641 401 341 441 101 631
Ontario 171 231 631 431 421 481 111 701
Manitoba 141 281 741 281 381 341 161 771
Saskatchewan 191 421 641 671 251 721 81 741
Alberta 171 231 621 451 291 701 71 701
British Columbia 121 171 601 361 291 571 41 611
Yukon and Northwest Territories2 -1 291 711 431 291 431 -1 701
Canada 151 241 641 421 371 511 101 671
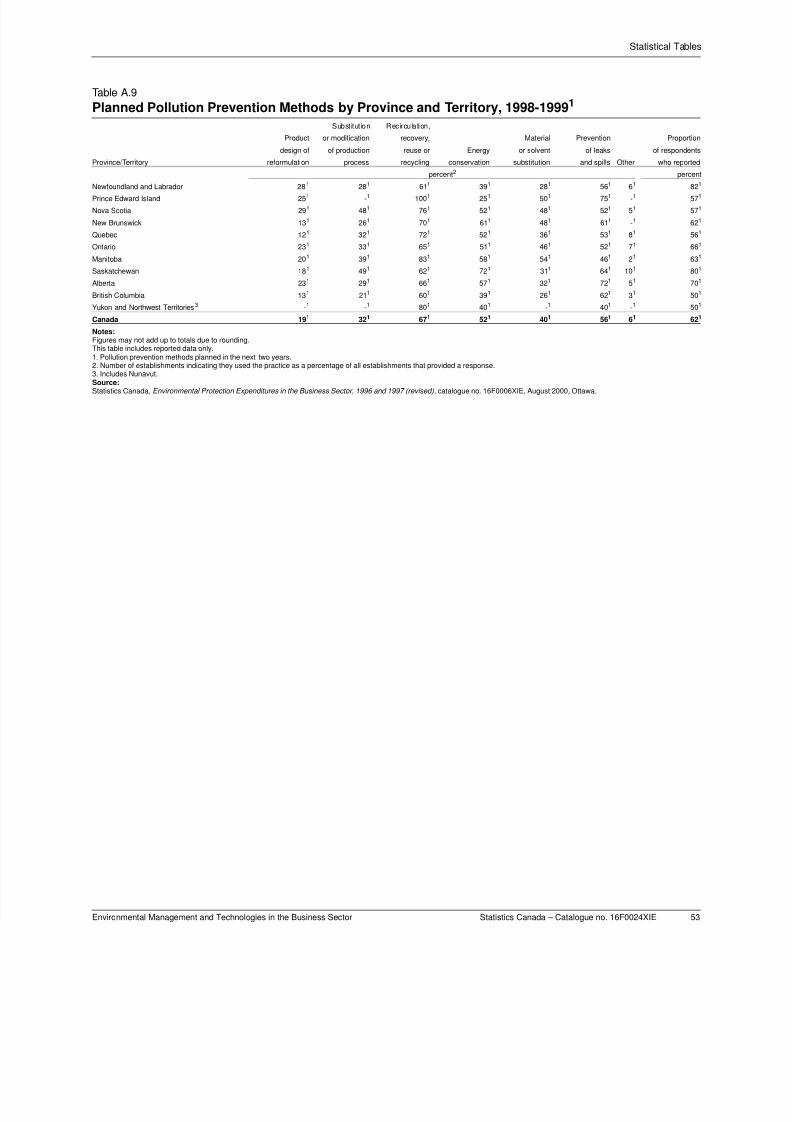
8/8/2019 Stats Canada Enviromental Technologies
http://slidepdf.com/reader/full/stats-canada-enviromental-technologies 62/62


![Enviromental chemistry [autosaved]](https://img.pdfslide.us/doc/110x75/55ceb155bb61eb491e8b45b9/enviromental-chemistry-autosaved.jpg)