Embed Size (px)
DESCRIPTION
Stats 244.3. Elementary Statistical Concepts. Instructor:. W.H.Laverty. Office:. 235 McLean Hall. Phone:. 966-6096. Lectures:. M Tu W Th F 10:30am -11:50am Arts 200 Lab: Tu W Th 12:00 - 12:50 Arts 200. Evaluation:. Assignments, Labs, Term tests - 40% - PowerPoint PPT Presentation
Citation preview
Stats 244.3
Elementary Statistical Concepts
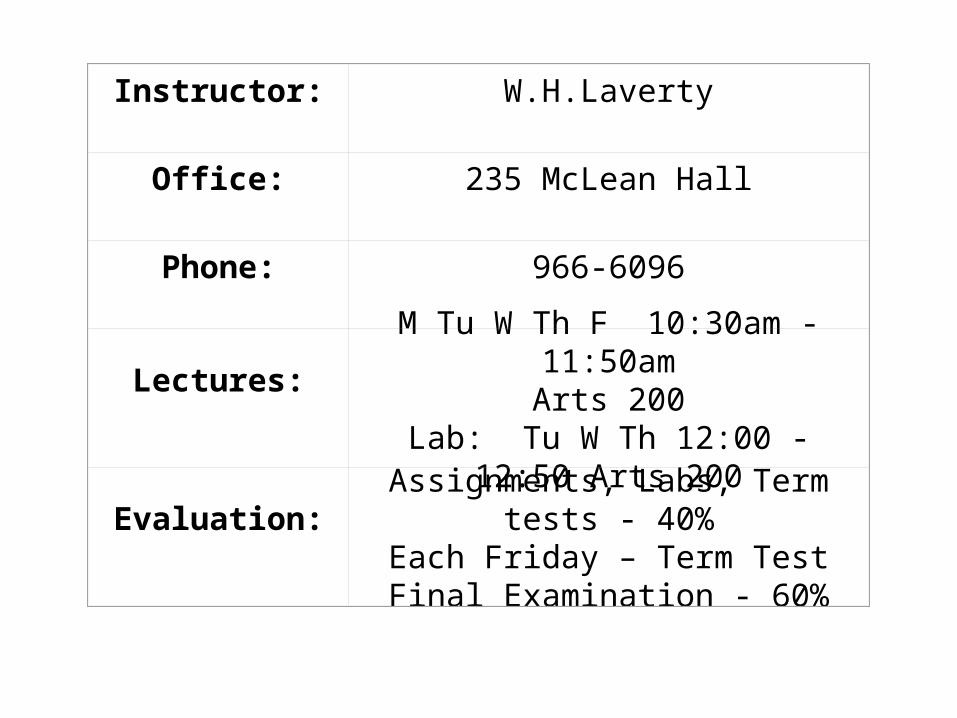
Instructor: W.H.Laverty
Office: 235 McLean Hall
Phone: 966-6096
Lectures:M Tu W Th F 10:30am -11:50am
Arts 200Lab: Tu W Th 12:00 - 12:50 Arts 200
Evaluation:Assignments, Labs, Term tests - 40%
Each Friday – Term TestFinal Examination - 60%

Text:
Moore, The Basic Practice of Statistics,
I will provide lecture notes (power point slides).
I will provide tables.
The assignments will not come from the textbook.
This means that the purchasing of the text is optional.

Course Outline
Introduction
• Populations, samples
• Variables
• Data Collection
• Chapter 1
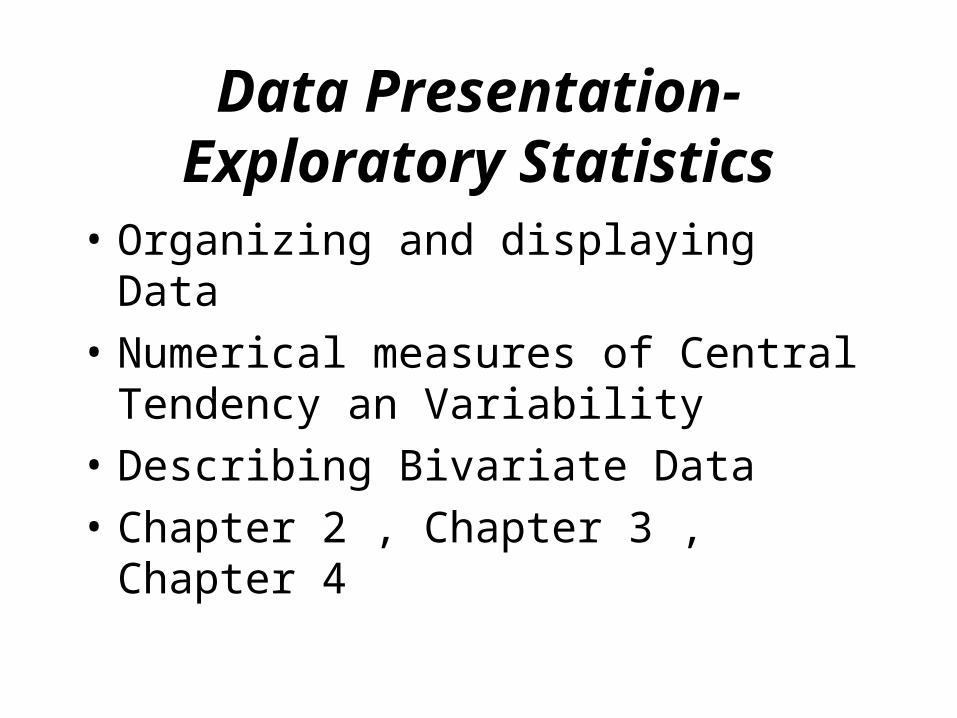
Data Presentation-Exploratory Statistics
• Organizing and displaying Data
• Numerical measures of Central Tendency an Variability
• Describing Bivariate Data
• Chapter 2 , Chapter 3 , Chapter 4
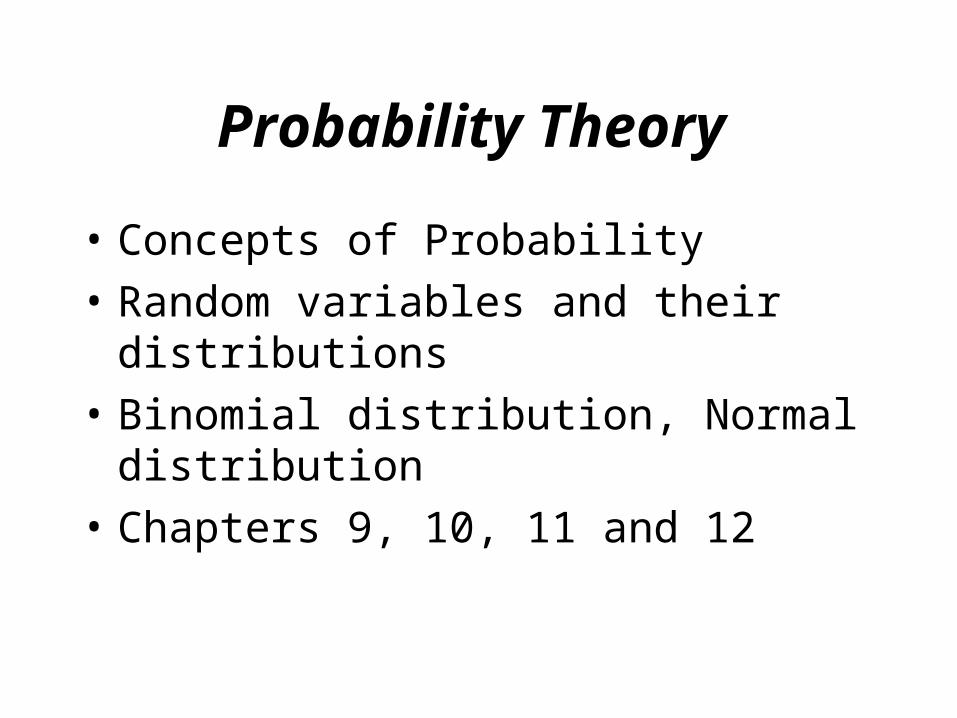
Probability Theory
• Concepts of Probability
• Random variables and their distributions
• Binomial distribution, Normal distribution
• Chapters 9, 10, 11 and 12
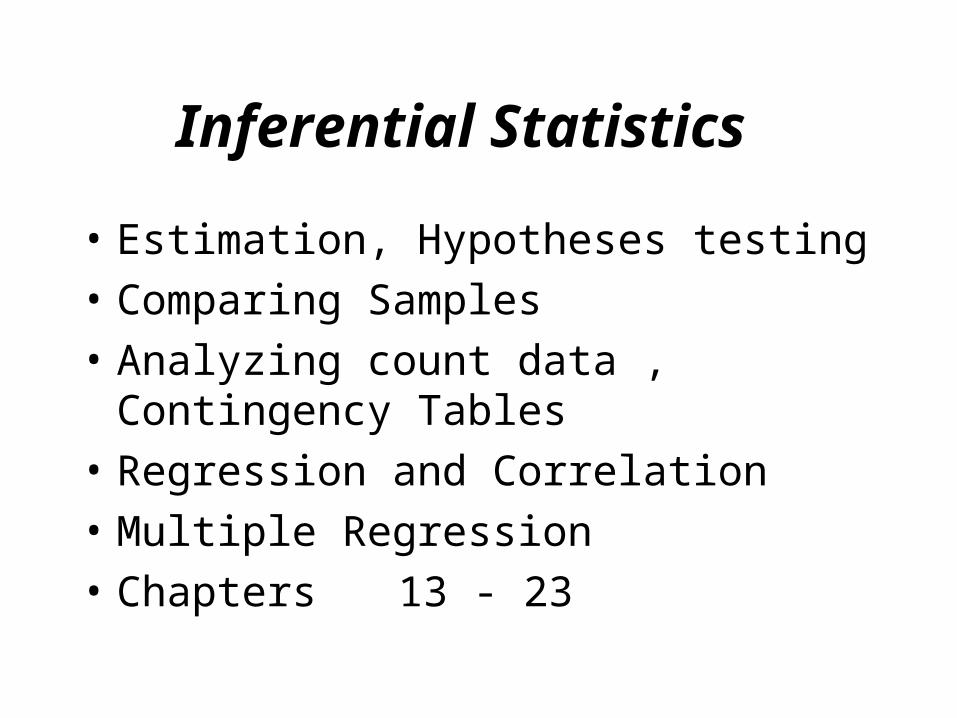
Inferential Statistics
• Estimation, Hypotheses testing
• Comparing Samples
• Analyzing count data , Contingency Tables
• Regression and Correlation
• Multiple Regression
• Chapters 13 - 23

Introduction
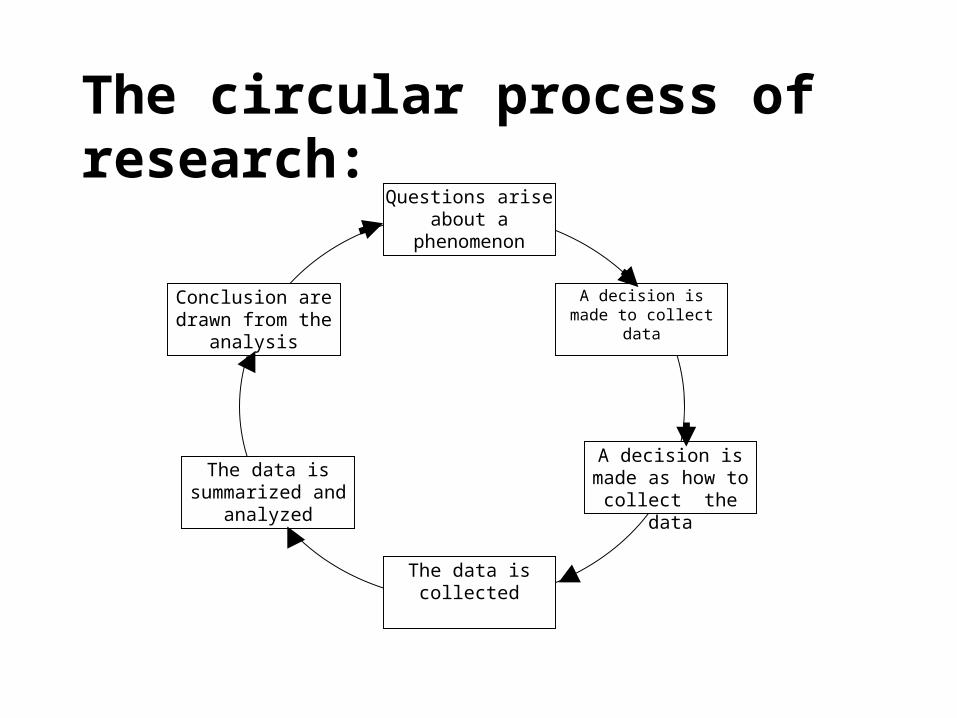
The circular process of research:
Questions arise about a phenomenon
A decision is made to collect data
A decision is made as how to collect the
data
The data is collected
The data is summarized and
analyzed
Conclusion are drawn from the analysis
What is Statistics?
It is the major mathematical tool of scientific inference (research) - the art of drawing conclusion from data.
Data that is to some extent corrupted by some component of random variation (random noise)
Random variation or (random noise) can be defined to be the variation in the data that is not accounted for by factors considered in the analysis.

Example
Suppose we are collecting data on
• Blood Pressure
• Height
• Weight
• Age

Suppose we are interested in how
• Blood Pressure
is influenced by the following factors
• Height
• Weight
• Age
Blood Pressure will not be perfectly predictable from :
• Height
• Weight
• Age
There will departures (random variation) from a perfect prediction because of other factors the could affect Blood pressure
(diet, exercise, hereditary factors)
Another ExampleIn this example we are interested in the use of:1. antidepressants,
2. mood stabilizing medication,
3. anxiety medication,
4. stimulants and
5. sleeping pills.
The data were collected for n = 16383 cases
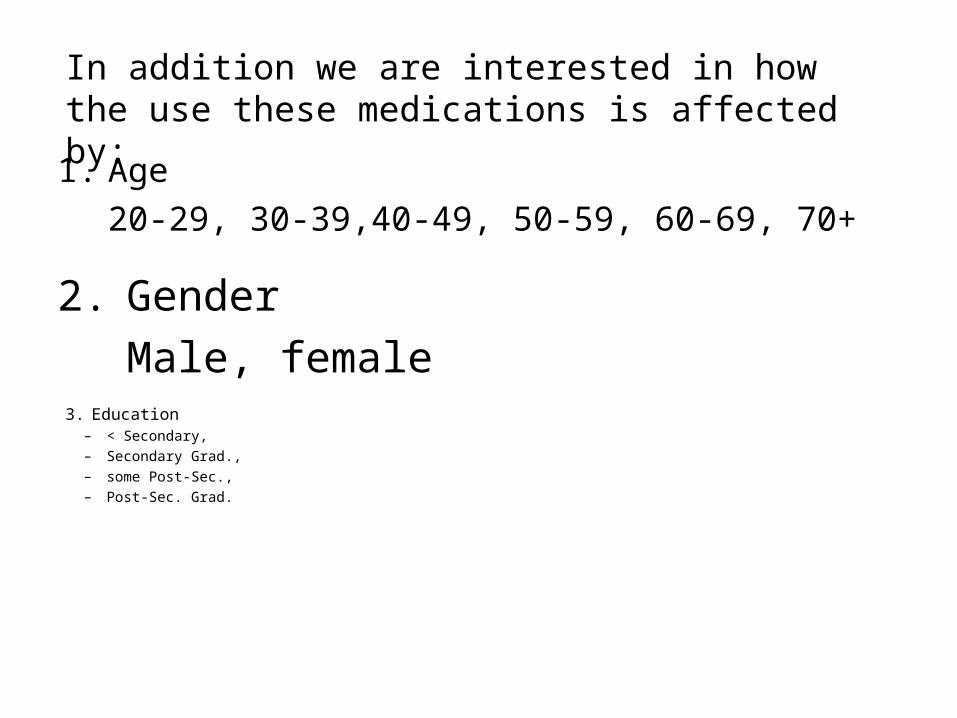
In addition we are interested in how the use these medications is affected by:1. Age
20-29, 30-39,40-49, 50-59, 60-69, 70+2. Gender
Male, female 3. Education
– < Secondary,
– Secondary Grad.,
– some Post-Sec.,
– Post-Sec. Grad.
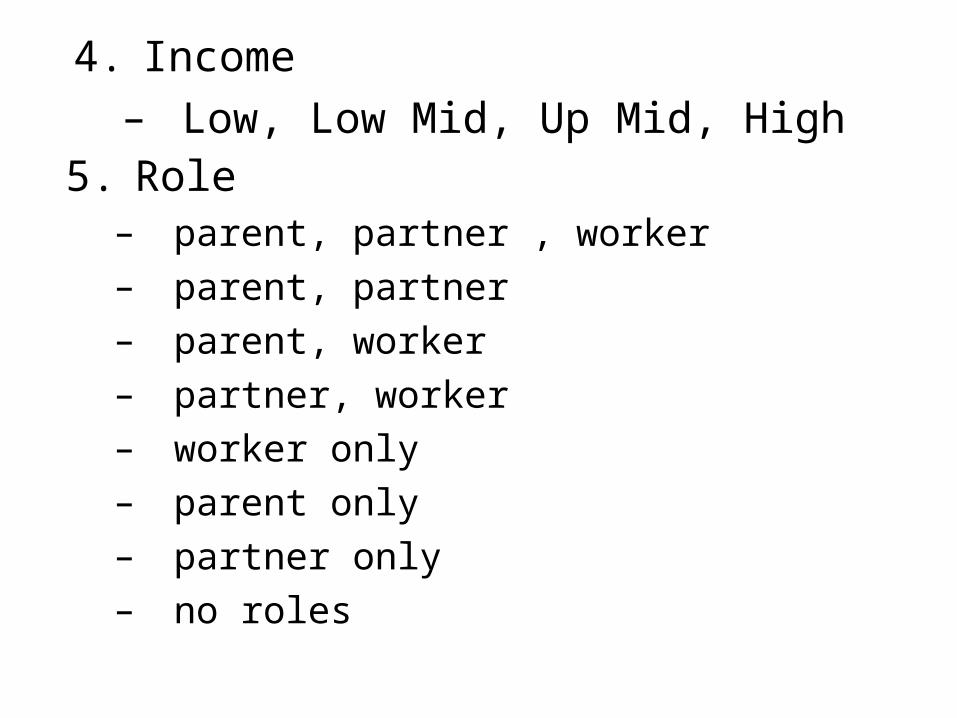
4. Income
– Low, Low Mid, Up Mid, High5. Role
– parent, partner , worker– parent, partner– parent, worker– partner, worker– worker only– parent only– partner only– no roles
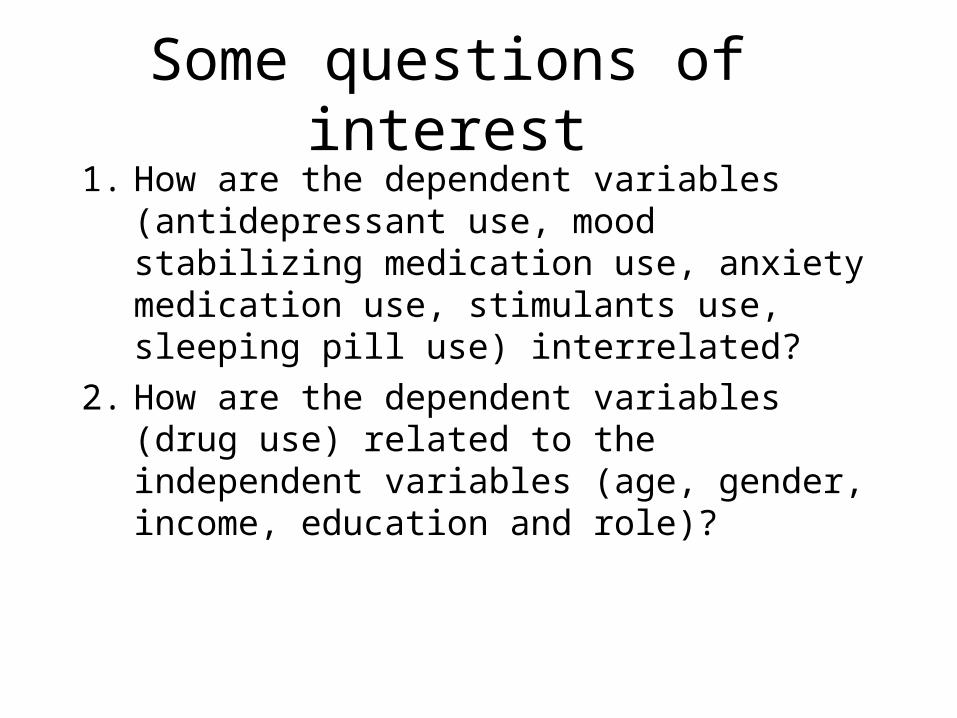
Some questions of interest
1. How are the dependent variables (antidepressant use, mood stabilizing medication use, anxiety medication use, stimulants use, sleeping pill use) interrelated?
2. How are the dependent variables (drug use) related to the independent variables (age, gender, income, education and role)?
• Again the relationships will not be perfect
• Because of the effects of other factors (variables) that have not been considered in the experiment
• If the data is recollected, the patterns observed at the second collection will not be exactly the same as that observed at the first collection

The data appears in the following Excel file
drug data.xls
In Statistics• Questions
– About some scientific, sociological, medical or economic phenomena
• Data– The purpose of the data is to find answers to the
questions
• Answers– Because of the random variation in the data (the
noise). Conclusions based on the data will be subject to error.
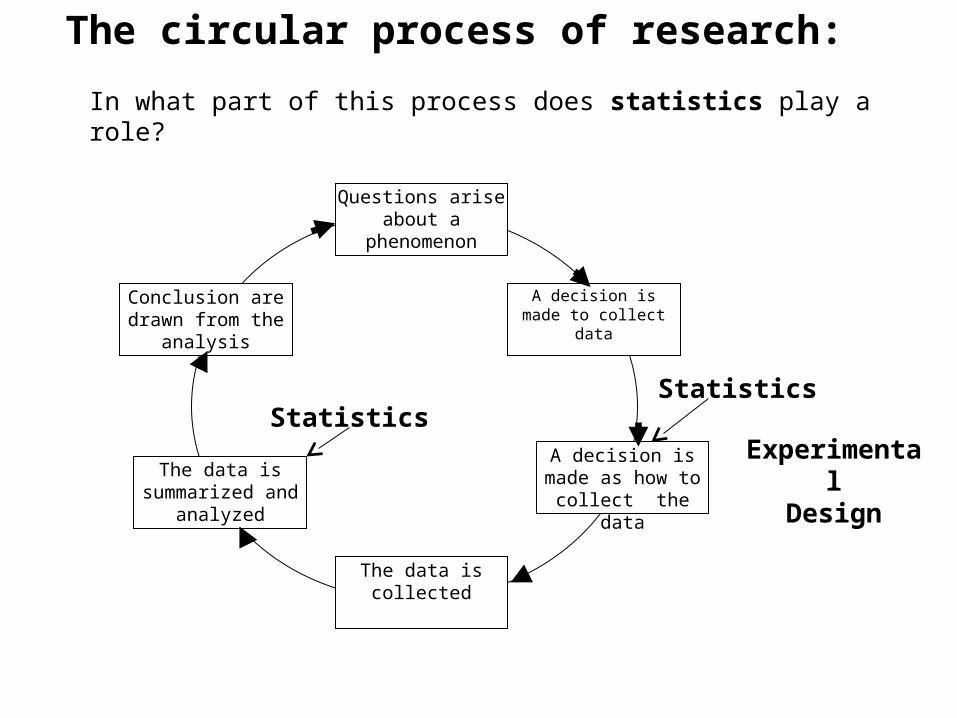
The circular process of research:
Questions arise about a phenomenon
A decision is made to collect data
A decision is made as how to collect the
data
The data is collected
The data is summarized and
analyzed
Conclusion are drawn from the analysis
StatisticsStatistics
In what part of this process does statistics play a role?
ExperimentalDesign
Statistical Theory is interested in
1. The design of the data collection procedures. (Experimental designs, Survey designs). The experiment can be totally lost if it is not designed correctly.
2. The techniques for analyzing the data.
In any statistical analysis it is important to assess the magnitude of the error made by the conclusions of the analysis.
Consider the following statement:
You can prove anything with Statistics.
In fact:
One is unable to “prove” anything with Statistics.
At the end of any statistical analysis there always is a possibility of an error in any of the decisions that it makes.
The success of a research project does not depend on the its conclusions
The success of a research project depends on the accuracy of its conclusions
If one is testing the effectiveness of a drug
There is two possible conclusions:
1. The drug is effective:
2. The drug is not effective:
The success of a this project does not depend on the its conclusions
The success depends on the accuracy of its conclusions
For this reason:
It is extremely important in any study to assess the accuracy of its conclusions
Some definitions
important to Statistics
A population:
this is the complete collection of subjects (objects) that are of interest in the study.
There may be (and frequently are) more than one in which case a major objective is that of comparison.
A case (elementary sampling unit):
This is an individual unit (subject) of the population.
A variable:
a measurement or type of measurement that is made on each individual case in the population.
Types of variables Some variables may be measured on a numerical scale while others are measured on a categorical scale.
The nature of the variables has a great influence on which analysis will be used. .
For Variables measured on a numerical scale the measurements will be numbers.
Ex: Age, Weight, Systolic Blood Pressure
For Variables measured on a categorical scale the measurements will be categories.
Ex: Sex, Religion, Heart Disease
Note Sometimes variables can be measured on both a numerical scale and a categorical scale.
In fact, variables measured on a numerical scale can always be converted to measurements on a categorical scale.
Example
The following variables were evaluated for a study of individuals receiving head injuries in Saskatchewan.
1. Cause of the injury (categorical)• Motor vehicle accident• Fall• Violence• other
2. Time of year (date) (numerical or categorical)
• summer• fall• winter• spring
3. Sex on injured individual (categorical)• male• female
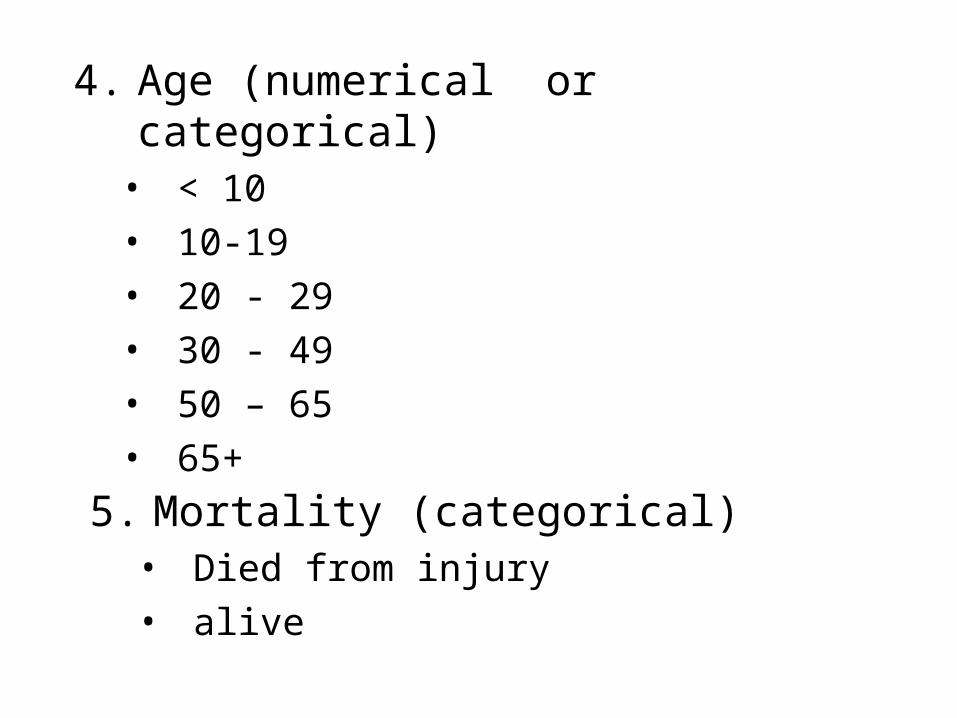
4. Age (numerical or categorical)• < 10• 10-19• 20 - 29• 30 - 49 • 50 – 65• 65+
5. Mortality (categorical)• Died from injury• alive
Types of variables
In addition some variables are labeled as dependent variables and some variables are labeled as independent variables.
This usually depends on the objectives of the analysis.
Dependent variables are output or response variables while the independent variables are the input variables or factors.
Usually one is interested in determining equations that describe how the dependent variables are affected by the independent variables
Example
Suppose we are collecting data on
• Blood Pressure
• Height
• Weight
• Age
Suppose we are interested in how
• Blood Pressure
is influenced by the following factors
• Height
• Weight
• Age
Then
• Blood Pressure
is the dependent variable
and
• Height
• Weight
• Age
Are the independent variables
Example – Head Injury studySuppose we are interested in how• Mortalityis influenced by the following factors• Cause of head injury• Time of year• Sex • Age
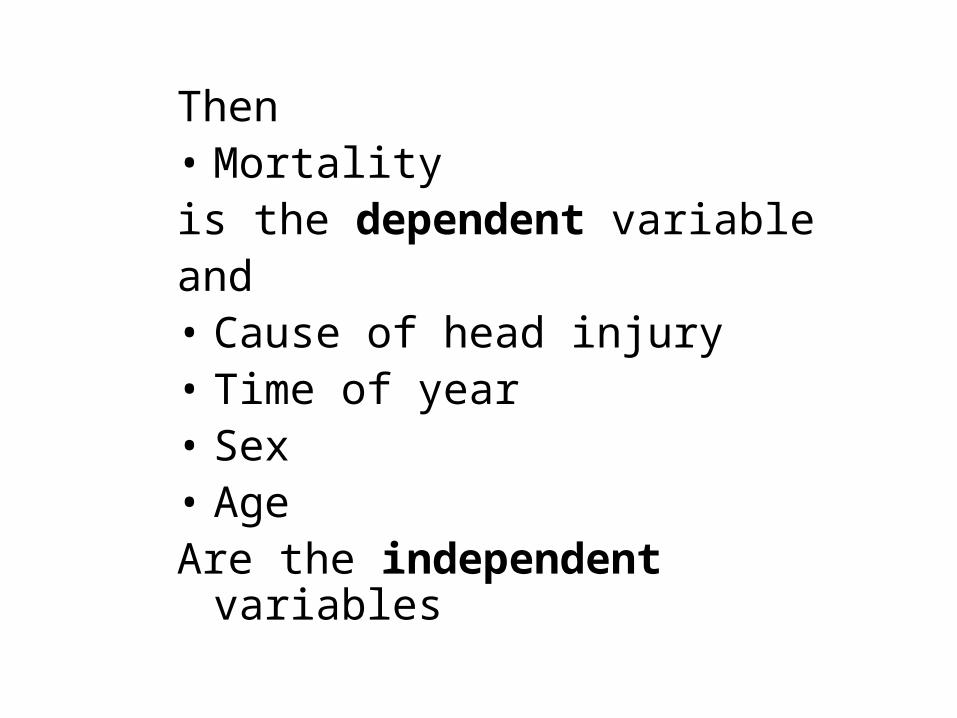
Then• Mortalityis the dependent variableand• Cause of head injury• Time of year• Sex • AgeAre the independent variables
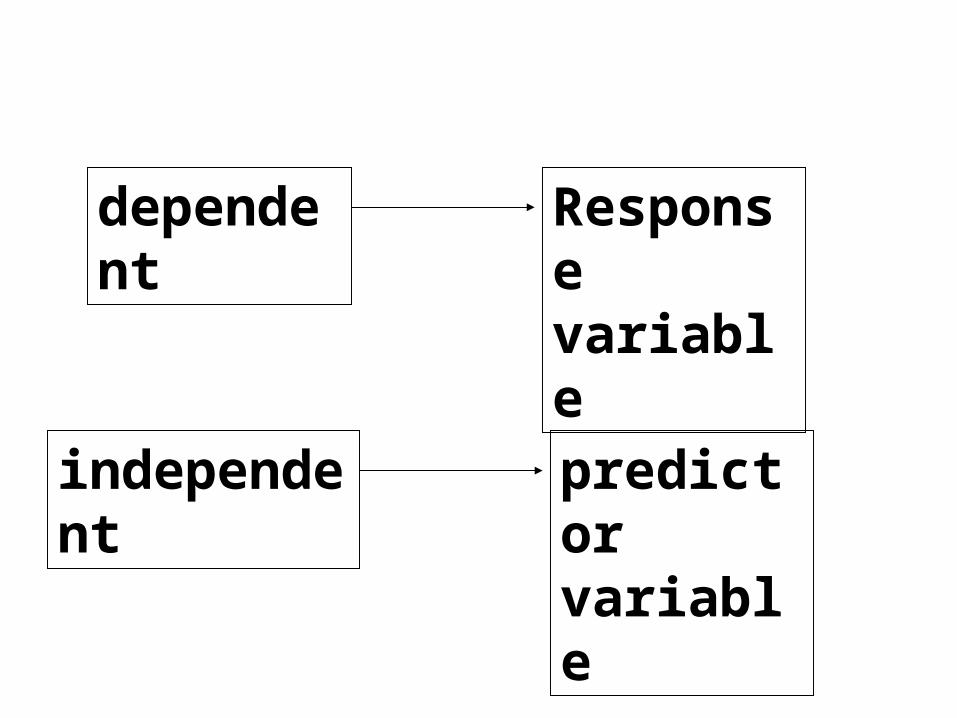
dependent Response variable
independent predictor variable

A sample:
Is a subset of the population
In statistics:
One draws conclusions about the population based on data collected from a sample
Reasons:
Cost
It is less costly to collect data from a sample then the entire population
Accuracy
Accuracy
Data from a sample sometimes leads to more accurate conclusions then data from the entire population
Costs saved from using a sample can be directed to obtaining more accurate observations on each case in the population
Types of Samples
different types of samples are determined by how the sample is selected.
Convenience Samples
In a convenience sample the subjects that are most convenient to the researcher are selected as objects in the sample.
This is not a very good procedure for inferential Statistical Analysis but is useful for exploratory preliminary work.
Quota samples
In quota samples subjects are chosen conveniently until quotas are met for different subgroups of the population.
This also is useful for exploratory preliminary work.
Random Samples
Random samples of a given size are selected in such that all possible samples of that size have the same probability of being selected.
Convenience Samples and Quota samples are useful for preliminary studies. It is however difficult to assess the accuracy of estimates based on this type of sampling scheme.
Sometimes however one has to be satisfied with a convenience sample and assume that it is equivalent to a random sampling procedure
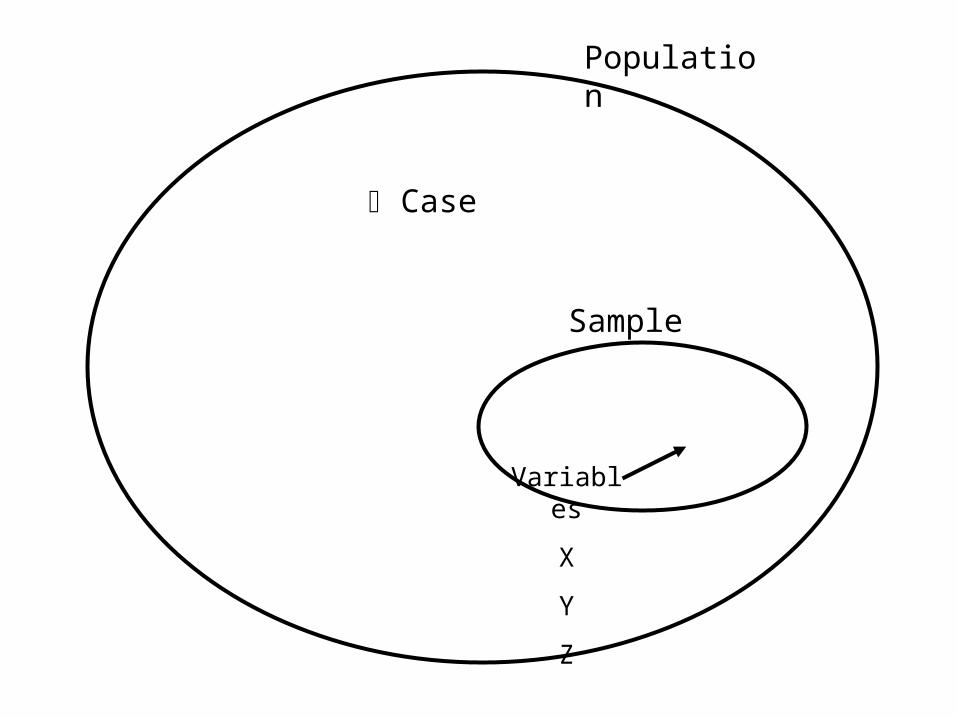
Population
Sample
Case
Variables
X
Y
Z

Some other definitions
A population statistic (parameter):
Any quantity computed from the values of variables for the entire population.
A sample statistic:
Any quantity computed from the values of variables for the cases in the sample.
Since only cases from the sample are observed
– only sample statistics are computed– These are used to make inferences about
population statistics– It is important to be able to assess the accuracy
of these inferences
To download lectures1. Go to the stats 244 web site
a) Through PAWS or
b) by going to the website of the department of Mathematics and Statistics -> people -> faculty -> W.H. Laverty -> Stats 244-. Lectures.
2. Then a) select the lecture
b) Right click and choose Save as

To print lectures1. Open the lecture using MS Powerpoint
2. Select the menu item File -> Print
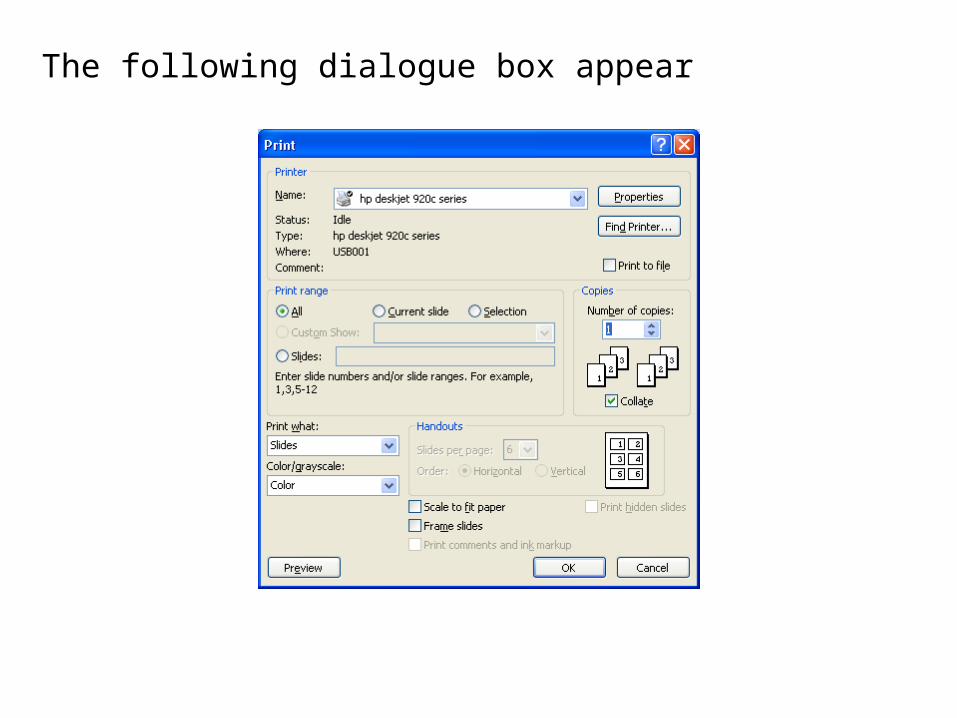
The following dialogue box appear
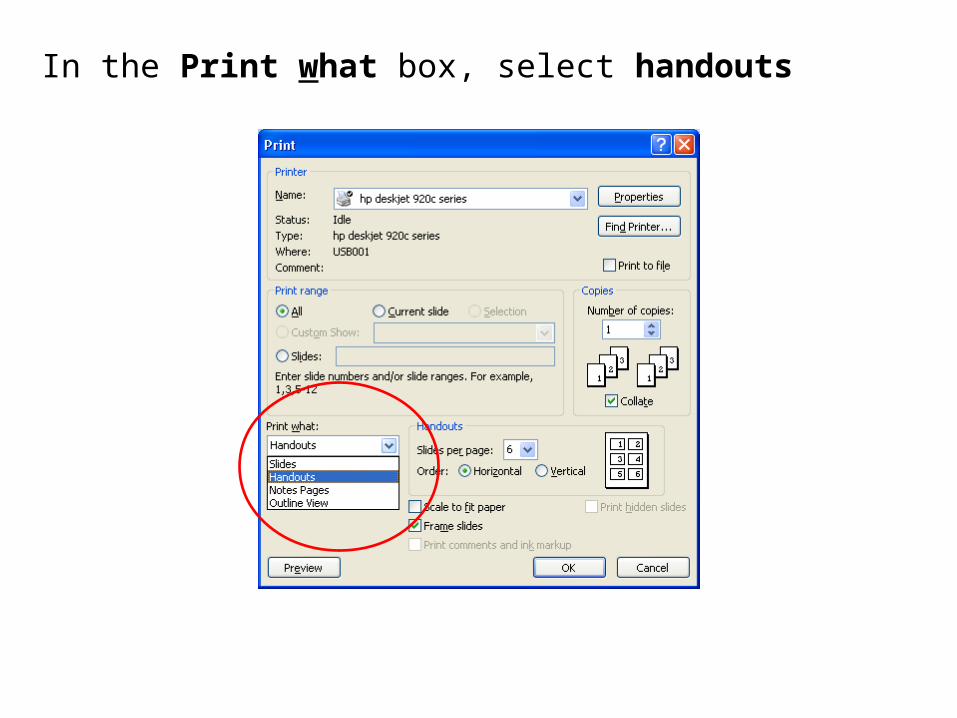
In the Print what box, select handouts
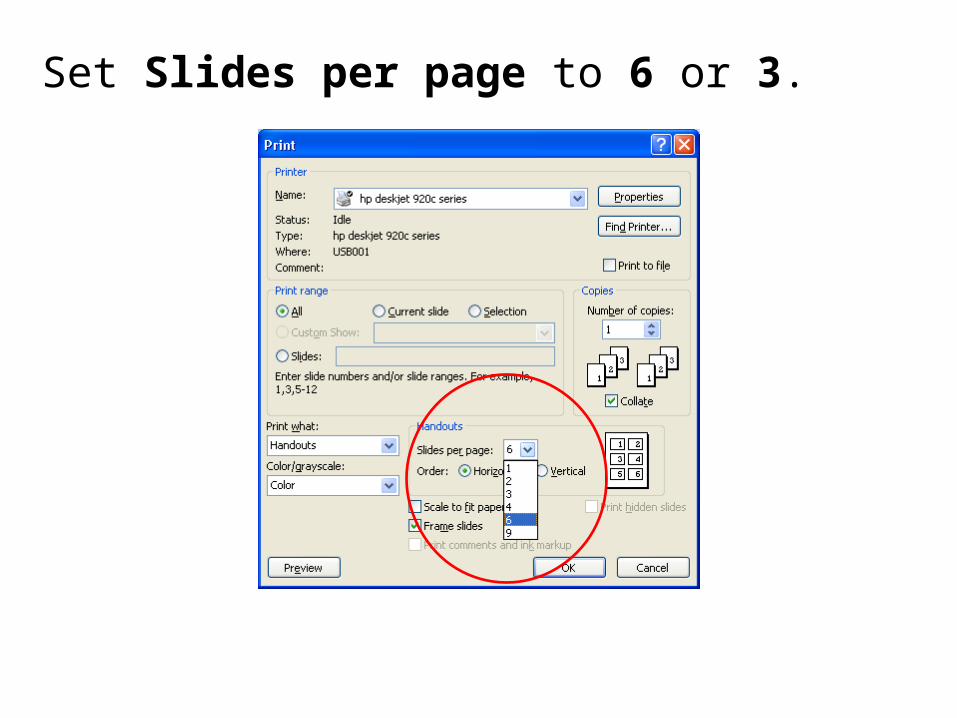
Set Slides per page to 6 or 3.
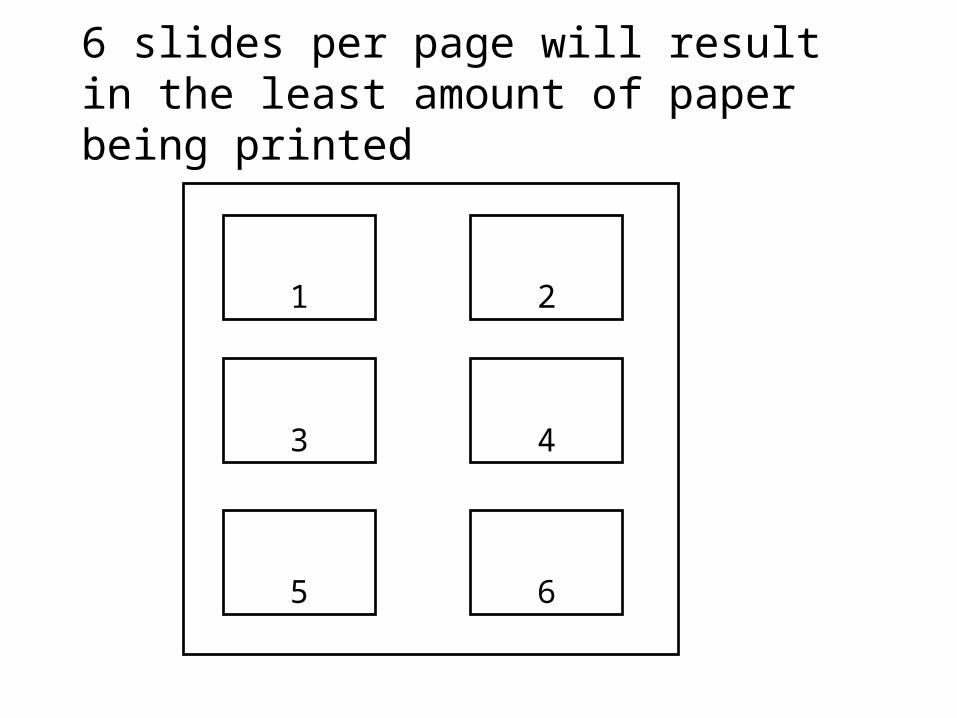
6 slides per page will result in the least amount of paper being printed
1 2
3 4
5 6
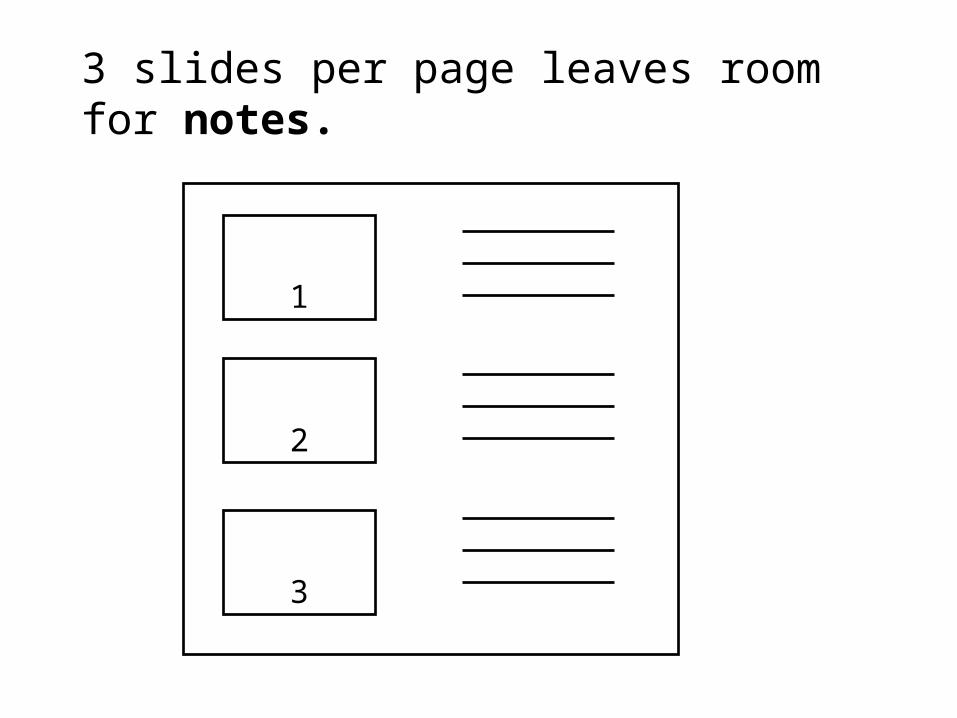
3 slides per page leaves room for notes.
1
2
3