Embed Size (px)
Citation preview
lINITf:.D STATES DEPARTMF.:NT OF' AGRICULTURESTATlS"T"ICAL REPORTH~G SERVICE
WASHINGTON, D.C. 20250
November 30, 1970
SUBJECT: 1969 Corn Validation Project
In the continuing effort to explain the differencebetween Board yields and objective yields, a cornvalidation project was undertaken in Iowa andMissouri in the fall of 1969. In addition to thedifference in levels of yield, the validation projectwas undertaken because this was a Census year andcomparability between the 1969 Census and earlierCensuses is questionable.
Validation and quality control work in the past havegenerally supported the objective yield proceduresbut usually indicate a small upward bias in the objec-tive yield estimates. Weighing projects in 1965 and1967 to establish "true" yield levels generallysupported Board levels.
A summary of the project is enclosed. This summarydoes not include the Office Procedures Manual, theInterviewc~s Manual, the special formsand some of theother details concerning the project. A copy of thesemateriAls may be obtained with a direct request to theproject leader.
\)
SUMMARY
1969
COR N
V A LID A T ION
STUDY
IOWA and MISSOURI
U. S. Department of AgricultureStatistical Reporting Service
CONTENTS
Section Page
I Background, Objective, Survey Procedures 1
II Nwnber of Ears 2
III Weight Per Ear 3
IV Shelling Fraction 4
V Dry Matter Fraction 5
VI Gross Yield 6
VII Harvest Loss 7
VIII Net Yield 8
Section
I
II
III
IV
V
VIVII
VIIIIX
CONTENTS
Background, Objective, Survey Procedures
Nwnber of Ears
Weight Per Ear
Shelling Fraction
Dry Matter Fraction
Gross Yield
Harvest Loss
Net Yield
Summary & Conclusions
Appendixes: Office Procedures
Interviewers Manual
1969 Corn Validation Worksheet 2
Form-N: Pre-Harvest AcreageInterview
Form ~7: Special Pre-HarvestObjective Yield Units
Page
1
2
3
4
5
6
7
8
10
Form B-8: Special Weighed Yield Area
Form B-9: Hand Harvested Row
Form C-l: Pre-HarvestLaboratory DeterminationSpecial Pre-HarvestObjective Yield Units
Form C-2: Pre-Harvest LaboratoryDeterminationFor Grain Shelled in Field
Form E: Corn Yield CountsPost-Harvest Observation
Form E-l: Post-Harvest Observationfrom Special Weighed YieldArea
Memorandum from D. R. Fisher
Memorandum Record and Receipt
ii
1969 Cern Yield Project
BACKGROUND:
Estimates from corn objective yield surveys have consistently beenabove yield levels adopted by the Crop Reporting Board. Historically,Board yields have been tied to levels of the U. S. Census of Agricul-ture. Numerous validation studies and continued quality control workhave generally supported the procedures used in the Objective work. How-ever, when compared with the weighed yield, some upward bias, about 3 to5 percent, has usually been observed. Weighing projects in 1965 and 1967to establish "true" yield have supported Board levels. However, thedifferences between Objective and Board published estimates for Statesincluded in these projects of 4 and 6 percent for 1965 and 1967, respec'-tiveiy, are considerably less than the usual spread. For the years 1966through 1969 (ignoring any Board revisions still to 'be made) the averageyield for all corn objective yield States from the Objective surveys hasranged from 10.0 to 11.4 percent above the comparable Board yield. Inview of these inconsistencies and with 1969 being a Census year the cur-rent project was conducted.
OBJECTIVE:
The primary objective of the 1969 Corn Validation Study was todetermine "true" yield, within sampling error, of corn in the States ofIowa and Missouri. Most of the field work was conducted in the fall of1969 with a few sample fields completed in early 1970.
SURVEY PROCEDURES:
The sample consisted of fields containing the even numbered regularobjective yield samples in Iowa and Missouri. This included about 175fields, 100 of which were in Iowa and 75 in Missouri. A total of 153sample fields were actually completed, 93 in Iowa and 60 in Missouri. The"true" yield was determined by harvesting and weighing production frommeasured areas in each of these sample fields.
The farm operators for these fields were contacted in late Septemberto obtain their cooperation in the project. At this time enumeratorsexplained the purpose of the survey, obtained information as to expectedmethod of harvest, and drew a sketch of the sample field. The sketchesand completed interview forms were returned to the State Office.
A small area of the field was selected as the sampling unit. Usuallythis area was two or four rows, depending upon the length. It was intendedthat production from the selected area be less than 50 bushels. Theoperator's equipment and situation dictated to some extent the number ofrows to be included and the number of passes to be made through the field.The rows were randomly selected and designated to the enumerator beforehe arrived at the field to make his measurements, weighings, etc. As soon
2
as the farm operator harvested the corn from these rows. it was weighedon platform scales in the field and sampled for moisture determination.If the farm operator picked the corn in the ear. it was shelled by a teamof enumerators at the farm with a portable sheller. Measurements of rowlength and average row width were made to compute area. In a few cases.the farmer weighed production from the entire field and field measure-ments were taken in order to derive the true yield.
In addition. two special objective yield units were randomly locatedand laid out just prior to harvest in rows adjacent to the weighed area.These units were laid out using regular objective yield procedures. Allof the ears in both rows of each unit were harvested. Row I ears wereweighed following regular objective yield procedures, and the third andfourth ears from each unit were sent to the State laboratory to determineshelling fraction and moisture. Then all ears, excluding the four earssent to the laboratory, were weighed, shelled and a sample taken formoisture determination.
A part of one row in each sample field was hand harvested. This wasusually one half of a row and was located near the weighed area. Thelength of row was measured and the harvested ears were also weighed.shelled and sampled for moisture.
After the operator had harvested the selected rows, two post-harvestunits were randomly located in the harvested area and gleaned for harvestloss. Both row middles were gleaned for loose grain and, if more thantwo row harvesting equipment was used, the unit included as many rows astaken in one pass with the harvester. In addition, two post-harvest unitswere located in the field using regular objective yield procedures.
The work was done by statisticians, supervisory enumerators, andenumerators. Fifteen two-man teams were required to handle the peak work-load. Five portable corn shellers and fifteen platform scales werepurchased especially for this survey. These were used to shell and weighthe corn in the field.
RESULTS:
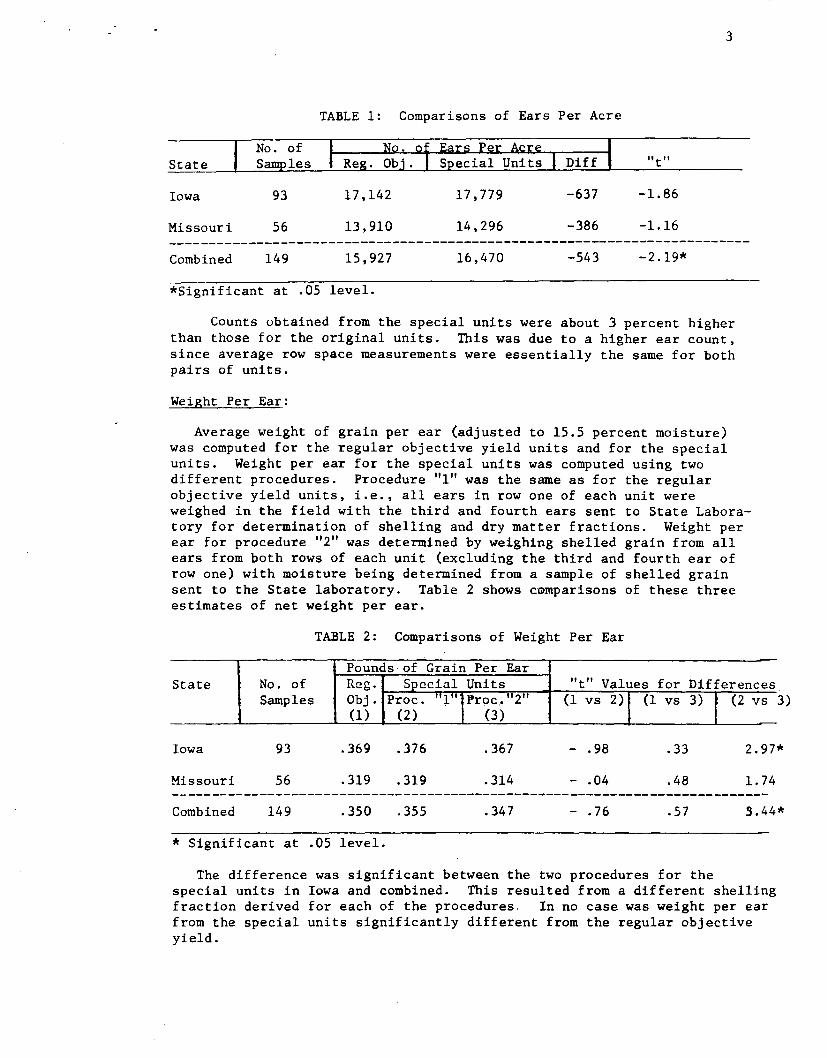
Number of Ears:
Estimated ears per acre were computed from ear counts made in thespecial units and compared with ears per acre derived from the regularobjective units. The following table shows these results.
3
TABLE 1: Comparisons of Ears Per Acre
State lit"
Iowa
Missour i
93
56
17,142
13,910
17,779
14,296
-637
-386
-1. 86
-1. 16-------------------------------------------------------------------------Combined 149 15,927 16,470 -543 -2.19*
*Significant at .05 level.
Counts obtained from the special units were about 3 percent higherthan those for the original units. This was due to a higher ear count,since average row space measurements were essentially the same for bothpairs of units.
Weight Per Ear:
Average weight of grain per ear (adjusted to 15.5 percent moisture)was computed for the regular objective yield units and for the specialunits. Weight per ear for the special units was computed using twodifferent procedures. Procedure "1" was the same as for the regularobjective yield units, i.e., all ears in row one of each unit wereweighed in the field with the third and fourth ears sent to State Labora-tory for determination of shelling and dry matter fractions. Weight perear for procedure "2" was determined by weighing shelled grain from allears from both rows of each unit (excluding the third and fourth ear ofrow one) with moisture being determined from a sample of shelled grainsent to the State laboratory. Table 2 shows c(i)mparisons of these threeestimates of net weight per ear.
TABLE 2: Comparisons of Weight Per Ear
Pounds of Grain Per EarState No. of Reg. S ecial Units "t" Values for Differences
Samples Obj. Proc. ":}.."Proc,."2" (1 vs 2) (1 vs 3) (2 vs 3)(1) (2) (3)
Iowa 93 .369 .376 .367 - .98 .33 2.97*
Missouri 56 .319 .319 .314 - .04 .48 1.74
Combined 149 .350 .355 .347 - .76 .57 3.44*
* Significant at .05 level.
The difference was significant between the two procedures for thespecial units in Iowa and combined. This resulted from a different shellingfraction derived for each of the procedures, In no case was weight per earfrom the special units significantly different from the regular objectiveyield.
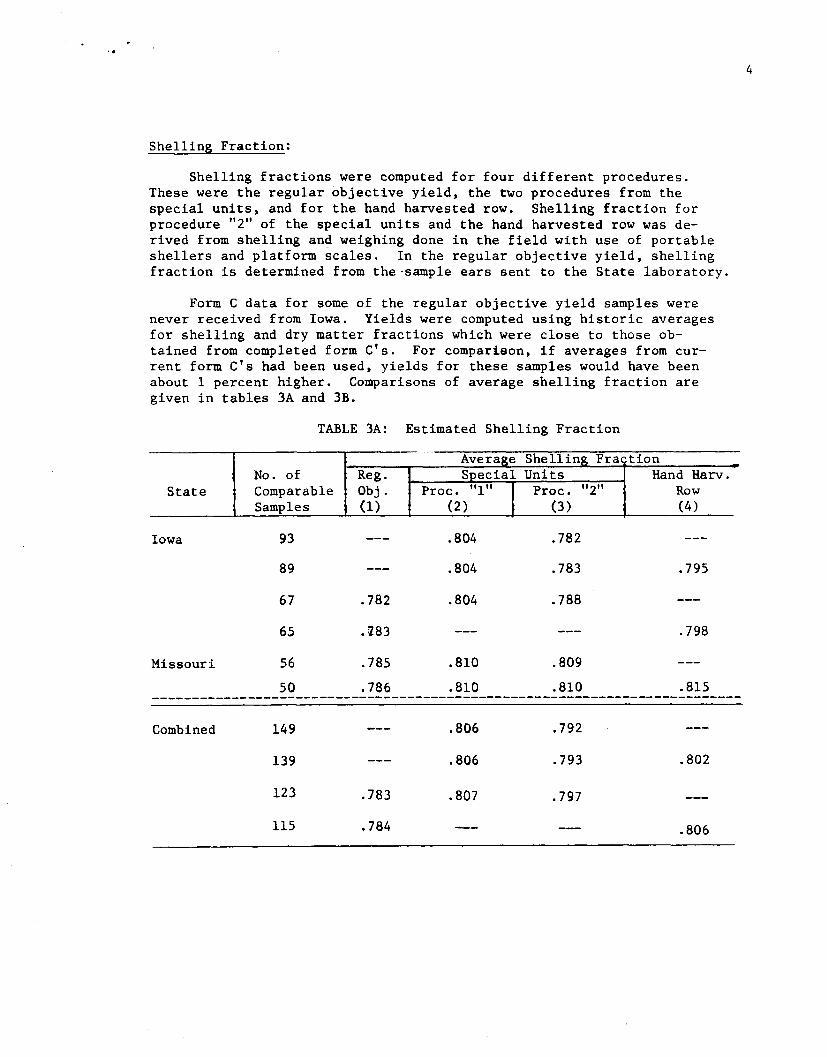
Shelling Fraction:
Shelling fractions were computed for four different procedures.These were the regular objective yield, the two procedures from thespecial units, and for the hand harvested row. Shelling fraction forprocedure "2" of the special units and the hand harvested row was de-rived from shelling and weighing done in the field with use of portableshellers and platform scales. In the regular objective yield, shellingfraction is determined from the-sample ears sent to the State laboratory.
Form C data for some of the regular objective yield samples werenever received from Iowa. Yields were computed using historic averagesfor shelling and dry matter fractions which were close to those ob-tained from completed form CIS. For comparison, if averages from cur-rent form CIS had been used, yields for these samples would have beenabout 1 percent higher. Comparisons of average shelling fraction aregiven in tables 3A and 3B.
TABLE 3A: Estimated Shelling Fraction
Shellin Fra tionNo. of Reg. Units Hand Harv.
State Comparable Obj. Proc. "2" RowSamples (1) (3) (4)
Iowa 93 .804 .78289 .804 .783 .795
67 .782 .804 .788
65 .iS3 .798
Missouri 56 .785 .810 .80950 .786 .810 .810 .815--------------------------------------------------------------------------
4
Combined 149
139
123
115.783
.784
.806
.806
.807
.792
.793
.797
.802
.806
5
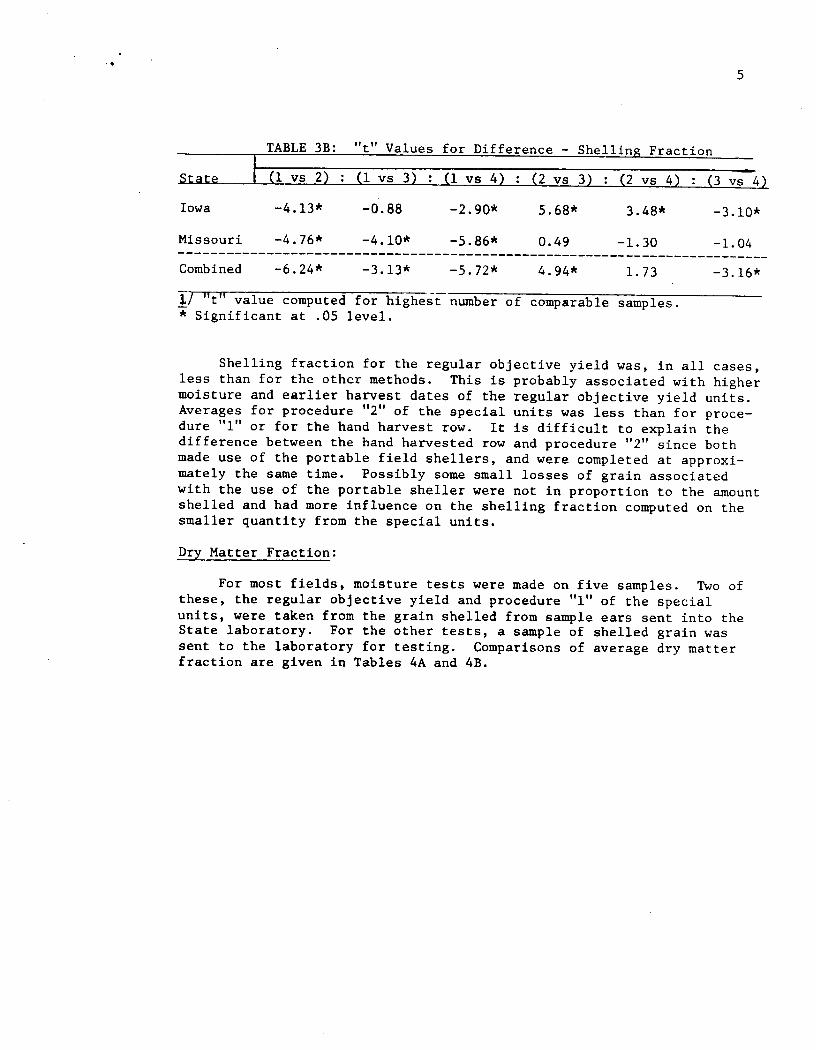
"t" Values for Difference - Shelling Fraction
State
Iowa
Missouri
TABLE 3B:(1 vs 2)
-4.13*
-4.76*
(1 vs 3)
-0.88
-4.l0W
(1 vs 4)
-2.90*
-5.86*
(2 vs 3)
5.68*
0.49
(2 vs 4)
3.48*
-1.30
=:(3 vs 4)
-3.10*-1.04--------------------------------------------------------------------------
Combined -6.24* -3.l3W -5.72* 4.94* 1. 73 -3.16*1/ "t" value computed for highest number of comparable samples.* Significant at .05 level.
Shelling fraction for the regular objective yield was, in all cases,less than for the other methods. This is probably associated with highermoisture and earlier harvest dates of the regular objective yield units.Averages for procedure "2" of the special units was less than for proce-dure "1" or for the hand harvest row. It is difficult to explain thedifference between the hand harvested row and procedure "2" since bothmade use of the portable field shellers, and were completed at approxi-mately the same time. Possibly some small losses of grain associatedwith the use of the portable sheller were not in proportion to the amountshelled and had more influence on the shelling fraction computed on thesmaller quantity from the special units.
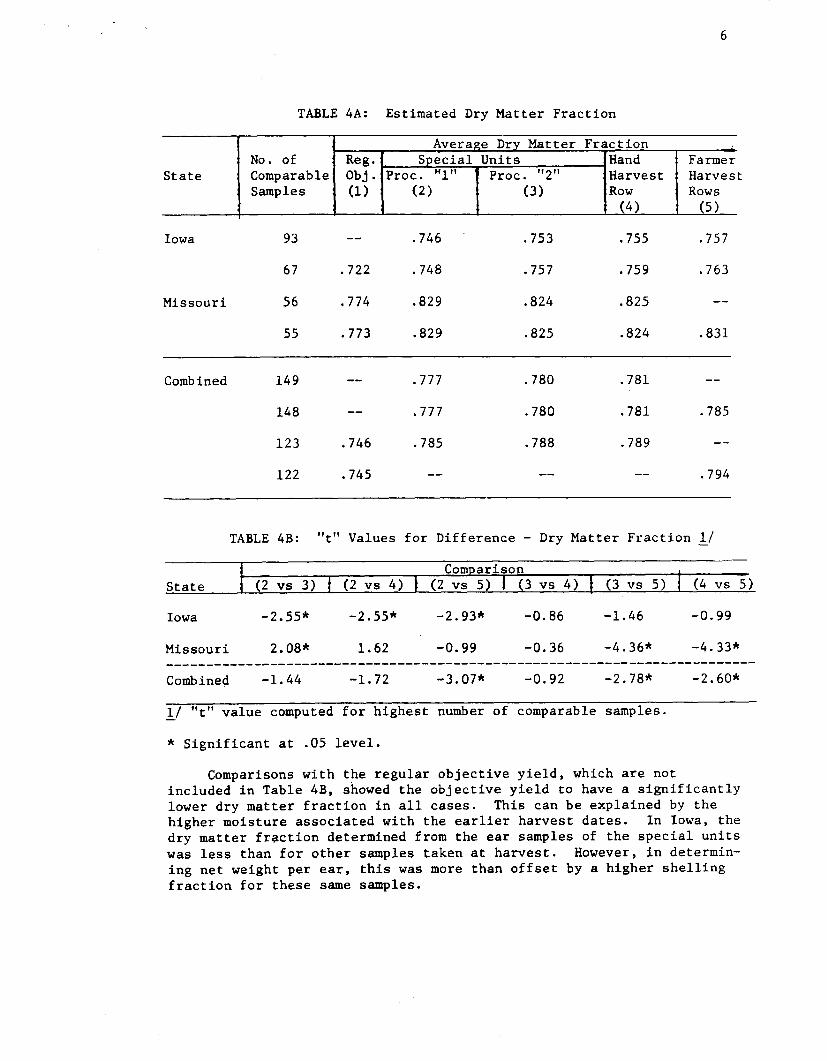
Dry Matter Fraction:
For most fields, moisture tests were made on five samples. Two ofthese, the regular objective yield and procedure "1" of the specialunits, were taken from the grain shelled from sample ears sent into theState laboratory. For the other tests, a sample of shelled grain wassent to the laboratory for testing. Comparisons of average dry matterfraction are given in Tables 4A and 4B.
t
6
TABLE 4A: Estimated Dry Matter FractionAverage Drv Matter Fraction
No. of Reg. Special Units Hand FarmerState Comparable Obj. Proc. "'I" Proc. "2" Harvest Harves
Samples (1) (2) (3) Row Rows(4) (5)
Iowa 93 .746 .753 .755 .757
67 .722 .748 .757 .759 .763
Missouri 56 .774 .829 .824 .825
55 .773 .829 .825 .824 .831
Combined 149 .777 .780 .781
148 .777 .780 .781 .785
123 .746 .785 .788 .789
122 .745 .794
TABLE 4B: "t" Values for Difference - Dry Matter Fraction }j
State (2 VB 3) (2 vs 4) (3 vs 5) (4 vs 5)
Iowa
Missouri
-2.55*
2.08*
-2.55*
1.62
-2.93*
-0.99
-0.86
-0.36
-1. 46
-4.36*
-0.99
-4.33*--------------------------------------------------------------------------Combined -1. 44 -1.72 -3.07* -0.92 -2.78* - 2.60*
1./ lit"value computed for highest number of comparable samples.
* Significant at .05 level.Comparisons with the regular objective yield, which are not
included in Table 4B, showed the objective yield to have a significantlylower dry matter fraction in all cases. This can be explained by thehigher moisture associated with the earlier harvest dates. In Iowa, thedry matter fraction determined from the ear samples of the special unitswas less than for other samples taken at harvest. However, in determin-ing net weight per ear, this was more than offset by a higher shellingfraction for these same samples.
7
Combined results indicate that the average dry matter fraction forsamples from the farmer harvested rows was greater than from other samples.Possibly_ some additional drying of the farmer harvested corn occurredduring processing delays of these larger quantities of corn. This wouldhave no effect on the weighed yield provided the sample was obtained atthe time of weighing. Disregarding the dry matter fraction from theregular objective yield samples_ the differences from the other methodshave mly a small effect on yield.
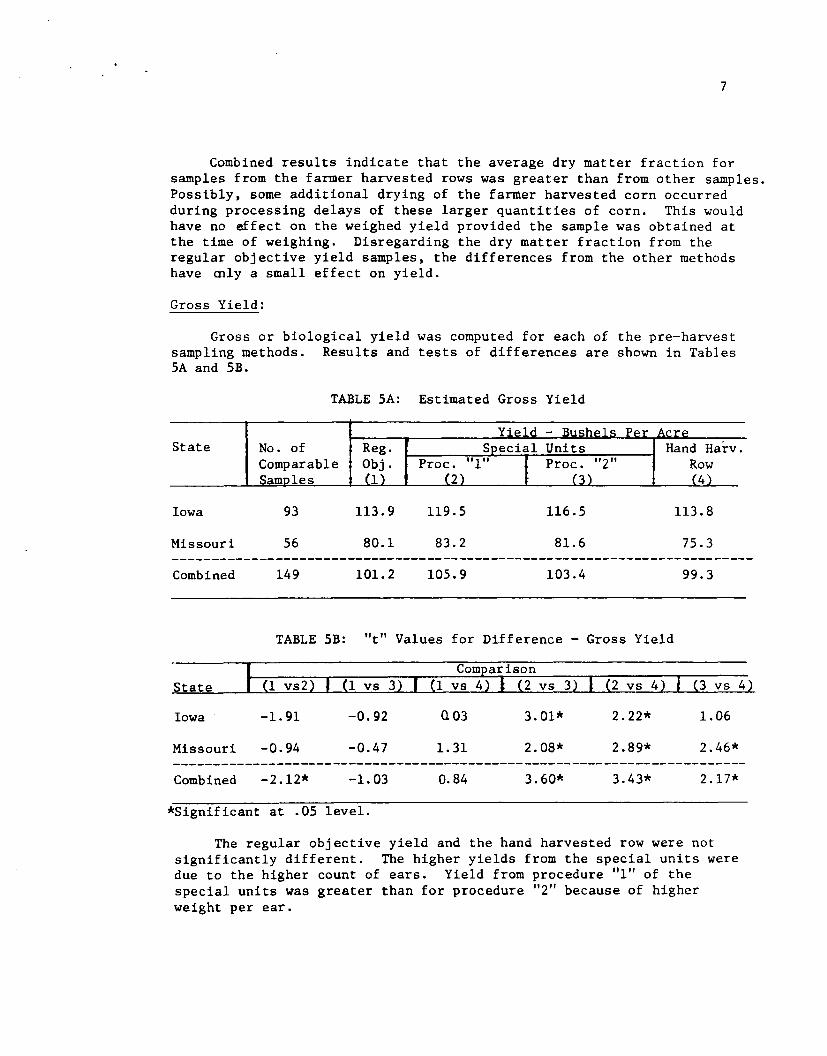
Gross Yield:
Gross or biological yield was computed for each of the pre-harvestsampling methods. Results and tests of differences are shown in TablesSA and 5B.
TABLE SA: Estimated Gross Yield
State No. ofComparableSam les
Iowa
Missouri
Combined
93
56
149
113.9
80.1
101.2
119.5
83.2
105.9
116.5
81.6
103.4
113.8
75.3
99.3
State
TABLE 5B: "t" Values for Difference - Gross Yield
Iowa
Missouri
Combined
-1. 91
-0.94
-2.12*
-0.92
-0.47
-1.03
(l03
1. 31
0.84
3.01*
2.08*
3.60*
2.22*
2.89*
3.43*
1.06
2.46*
2.17*
*Significant at .05 level.
The regular objective yield and the hand harvested row were notsignificantly different. The higher yields from the special units weredue to the higher count of ears. Yield from procedure "1" of thespecial units was greater than for procedure "2" because of higherweight per ear.
8
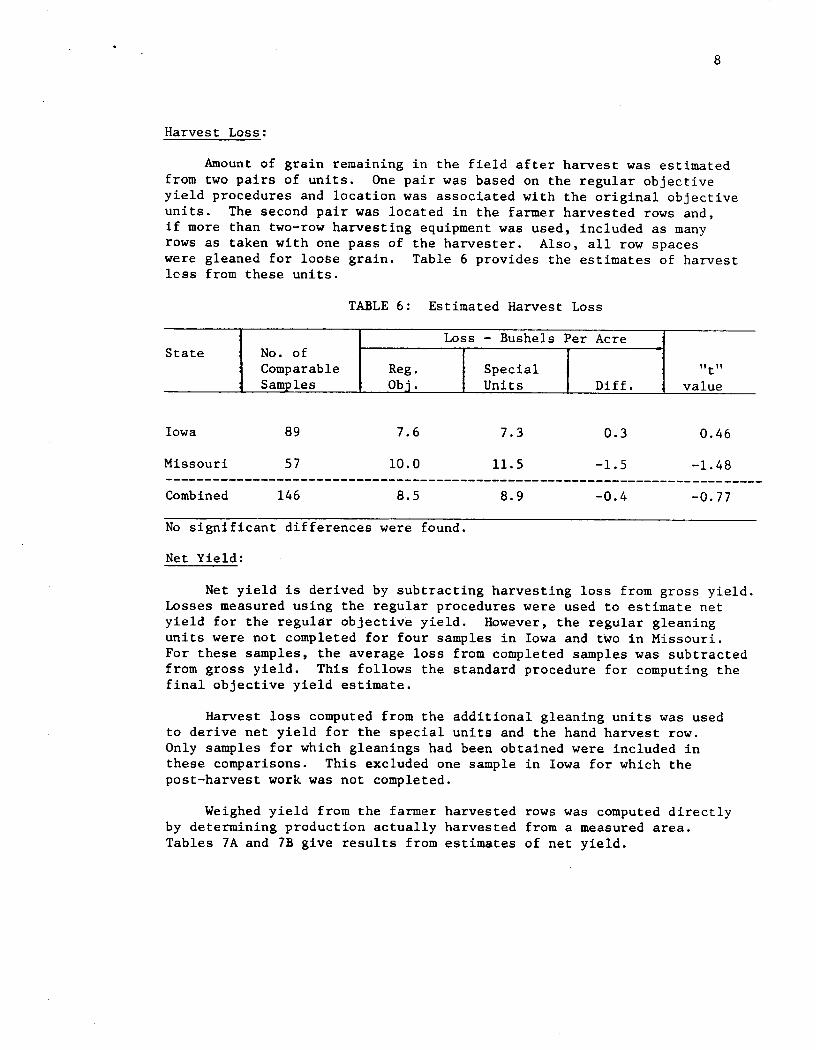
Harvest Loss:
Amount of grain remaining in the field after harvest was estimatedfrom two pairs of units. One pair was based on the regular objectiveyield procedures and location was associated with the original objectiveunits. The second pair was located in the farmer harvested rows and,if more than two-row harvesting equipment was used, included as manyrows as taken with one pass of the harvester. Also, all row spaceswere gleaned for loose grain. Table 6 provides the estimates of harvestless from these units.
TABLE 6: Estimated Harvest Loss
Loss - Bushels Per AcreState No. of
Comparable Reg. Special "t"Samples Obi. Units Diff. value
Iowa
Missouri
89
57
7.6
10.0
7.3
11.5
0.3
-1.50.46
-1.48---------------------------------------------------------------------------Combined 146 8.5 8.9 -0.4 -0.77No significant differences were found.
Net Yield:
Net yield is derived by subtracting harvesting loss from gross yield.Losses measured using the regular procedures were used to estimate netyield for the regular objective yield. However, the regular gleaningunits were not completed for four samples in Iowa and two in Missouri.For these samples, the average loss from completed samples was subtractedfrom gross yield. This follows the standard procedure for computing thefinal objective yield estimate.
Harvest loss computed from the additional gleaning units was usedto derive net yield for the special units and the hand harvest row.Only samples for which gleanings had been obtained were included inthese comparisons. This excluded one sample in Iowa for which thepost-harvest work was not completed.
Weighed yield from the farmer harvested rows was computed directlyby determining production actually harvested from a measured area.Tables 7A and 7B give results from estimates of net yield.
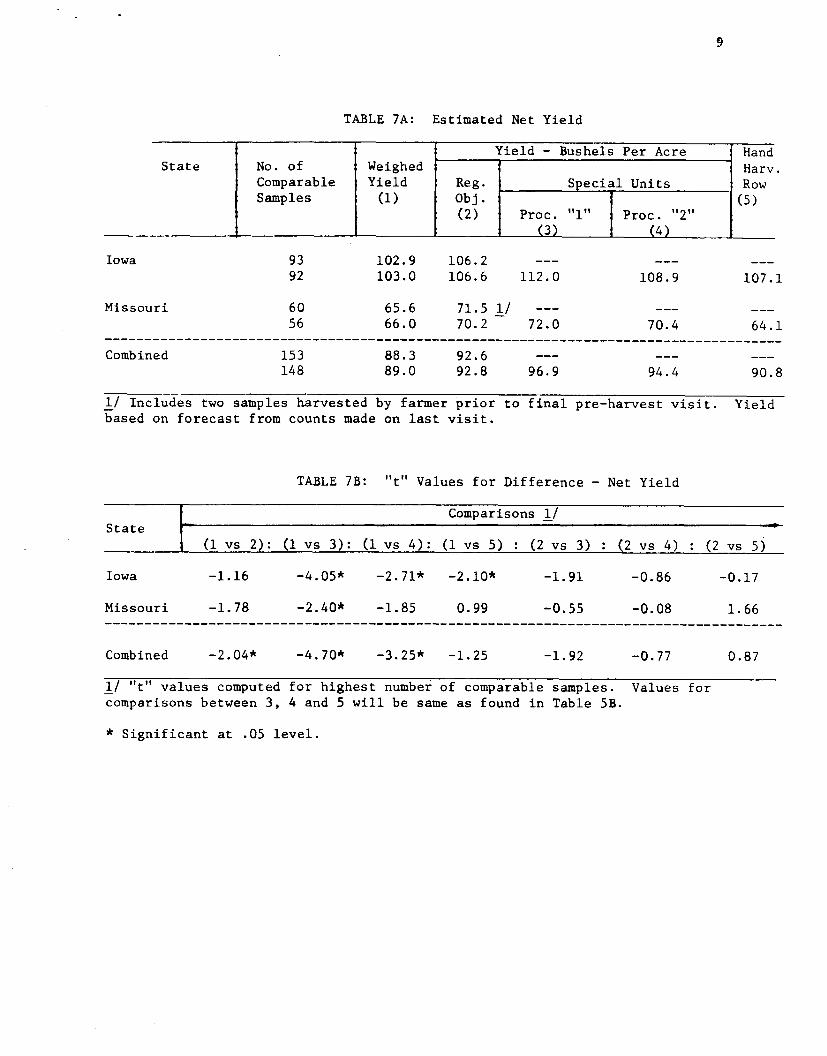
9
TABLE 7A: Estimated Net Yield
Yield - Bushels Per Acre HandState No. of Weighed Harv
Comparable Yield Reg. Special Units RowSamples (1) Obj. (5)
(2) Proc. "1" Proc. "2"(3) (4)
Iowa
Missouri
9392
6056
102.9103.0
65.666.0
106.2106.6 112.0
71. 5 1/70.2 72.0
108.9
70.4
107.1
64.1-------------------------------------------------------------------------------------Combined 153
14888.389.0
92.692.8 96.9 94.4 90.8
1/ Includes two samples harvested by farmer prior to final pre-harvest visit. Yieldbased on forecast from counts made on last visit.
TABLE 7B: "t" Values for Difference - Net Yield
Comparisons 1/State
(1 vs 2): (1 vs 3): (lvs4): (1 vs 5) (2 vs 3) (2 vs 4) (2 vs 5)
Iowa -1.16 -4.05* -2.71* -2.10* -1. 91 -0.86 -0.17
Missouri -1. 78 -2.40* -1. 85 0.99 -0.55 -0.08 1.66
Combined -2.04* -4.70* -3.25* -1. 25 -1. 92 -0.77 0.87
1/ "t" values computed for highest number of comparable samples. Values forcomparisons between 3, 4 and 5 will be same as found in Table 5B.
* Significant at .05 level.
10
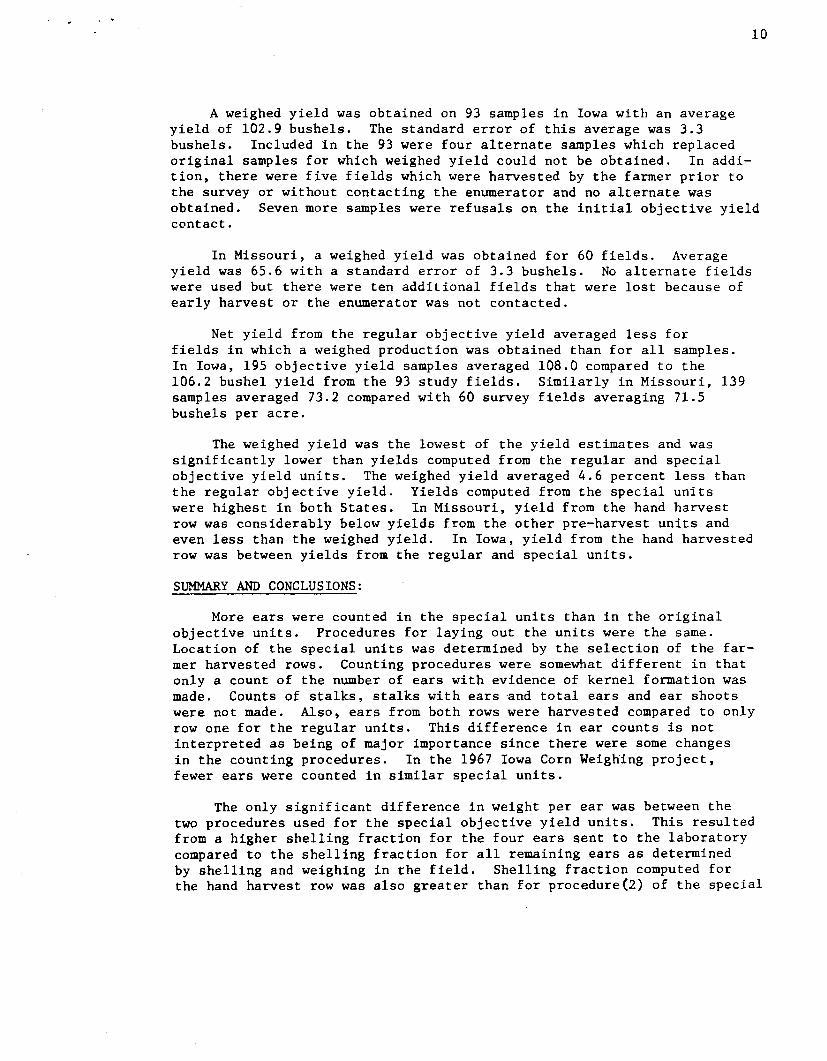
A weighed yield was obtained on 93 samples in Iowa with an averageyield of 102.9 bushels. The standard error of this average was 3.3bushels. Included in the 93 were four alternate samples which replacedoriginal samples for which weighed yield could not be obtained. In addi-tion, there were five fields which were harvested by the farmer prior tothe surveyor without contacting the enumerator and no alternate wasobtained. Seven more samples were refusals on the initial objective yieldcontact.
In Missouri, a weighed yield was obtained for 60 fields. Averageyield was 65.6 with a standard error of 3.3 bushels. No alternate fieldswere used but there were ten additional fields that were lost because ofearly harvest or the enumerator was not contacted.
Net yield from the regular objective yield averaged less forfields in which a weighed production was obtained than for all samples.In Iowa, 195 objective yield samples averaged 108.0 compared to the106.2 bushel yield from the 93 study fields. Similarly in Missouri, 139samples averaged 73.2 compared with 60 survey fields averaging 71.5bushels per acre.
The weighed yield was the lowest of the yield estimates and wassignificantly lower than yields computed from the regular and specialobjective yield units. The weighed yield averaged 4.6 percent less thanthe regular objective yield. Yields computed from the special unitswere highest in both States. In Missouri,yield from the hand harvestrow was considerably below yields from the other pre-harvest units andeven less than the weighed yield. In Iowa, yield from the hand harvestedrow was between yields from the regular and special units.
SUMMARY AND CONCLUSIONS:
More ears were counted in the special units than in the originalobjective units. Procedures for laying out the units were the same.Location of the special units was determined by the selection of the far-mer harvested rows. Counting procedures were somewhat different in thatonly a count of the number of ears with evidence of kernel formation wasmade. Counts of stalks, stalks with ears ~nd total ears and ear shootswere not made. Also, ears from both rows were harvested compared to onlyrow one for the regular units. This difference in ear counts is notinterpreted as being of major importance since there were some changesin the counting procedures. In the 1967 Iowa Corn Weighing project,fewer ears were counted in similar special units.
The only significant difference in weight per ear was between thetwo procedures used for the special objective yield units. This resultedfrom a higher shelling fraction for the four ears sent to the laboratorycompared to the shelling fraction for all remaining ears as determinedby shelling and weighing in the field. Shelling fraction computed forthe hand harvest row was also greater than for procedure(2) of the special
11
units although shelling and weighing procedures were the same. It issuspected that some small amounts of grain were not accounted for in theshelling of ears from the special units. Small differences in the drymatter fraction are believed related to processing time required foreach of the harvested samples of corn and had little effect on yield.
Comparisons from this study indicate the weighed yield is less thanyields determined by any of the pre-harvest sampling methods used.Some of the questionable factors relating to the accuracy of the weighedproduction for the 1967 project in Iowa were eliminated for this project.Howevert for 1969, production for fields harvested in the ear was highlydependent on the success of the portable shellers. After some initialexperimentation, the shellers are believed to have performed satisfac-torily. Assuming the weighed to be "true" yieldt the bias in the estimatefrom using the regular objective yield procedures was observed to be 4.6or 6.1 percent depending on whether the yield indications from the specialunits are considered. The higher percent is derived by combining theyields from both the original and special units. Although procedure (1)for the special units was intended to be the same as for the regularobjective yield, operationally the procedures may not have been comparablesince significantly more ears were counted in the special units. Also,recognizing that additional work was done in the special units, conditionsunder which data from the original units was obtained more closely compareto those in the regular objective yield program.
One potential source of bias is the incomplete measure of harvestloss. The special additional gleaning units for this survey estimatedabout the same losses as the original units. Corn that is crushed orground during harvest ("invisible loss") cannot be gleaned by conventionalprocedures. The amount of this invisible loss is unknown but would notlikely account for all of the difference. Some disappearance of grainremaining after harvest was noted during the 1968 project involving twoadjacent fields in Maryland. Weekly post-harvest observations made infields in Wisconsin, Nebraska and Tennessee in 1969 did not measuresimilar losses which would be missed if gleaning did not promptly followharvest.
Current Board yields are 98.0 and 70.0 for Iowa and Missouri,respectively. Average weighed yields were 102.9 and 65.6, each witha standard error of 3.3 bushels. The yield survey was designed to pro-vide a probability sample of weighed fields. However, a few earlyfields were harvested before the initial contact was made. In addition,there were several fields which were harvested without contacting theenumerator and there were some refusals. If a ratio estimate were usedbased on the objective yield average for the sample fields compared toall objective yield fields in the State the weighed averages wouldadjust to 104.6 and 67.2 bushels per acre. This analysis would support(within one standard error) the current Board yield in Missouri, butwould not support the yield in Iowa.


![[PUBLIC Law 534—78rn Censuses]](https://img.pdfslide.us/doc/110x75/623e84ce9f052223074b9064/public-law-53478rn-censuses.jpg)