Embed Size (px)
Citation preview

29/11/2013
1
STATISTIKA INDUSTRI 2
TIN 4004
Pertemuan 11 & 12
• Outline:
– Nonparametric Statistics
• Referensi:
– Walpole, R.E., Myers, R.H., Myers, S.L., Ye, K.,
Probability & Statistics for Engineers & Scientists
, 9th Ed. Prentice Hall, 2012.
Nonparametric
• Distribution-free methods
• Analysis of ranks
• Small sample size
• Disadvantages:
– Do not utilize all information provided by the sample
– Less efficient than parametric procedure
Sign Test
• Used to test hypotheses on a population median
• Population mean = population median when distribution is symmetric
• In testing the 𝐻0: 𝜇 = 𝜇 0 against an appropriate alternative, with random sample size = n, replace each sample value exceeding 𝜇 0 with “+”, and each sample value exceeding 𝜇 0 with “-”
• The sign test is applicable only in situations where 𝜇0 cannot equal the value of any of the observations
• Binomial random variable 𝑋, representing the number of plus signs in our random sample
Sign Test
• Test 𝐻0 that the number of “+” is a value of a random variable having the binomial distribution with 𝑝 = 1/2.
• P-values are calculated using binomial distribution
• Reject 𝐻0 if proportion of “+” is sufficiently less than ½, when the value 𝑥 of our random variable is small. 𝑃 − 𝑣𝑎𝑙𝑢𝑒 ≤ 𝛼
Sign Test
Reject 𝐻0, jika P-value ≤ α

29/11/2013
2
Sign Test
• Contoh:
Sign Test
• Contoh:
Sign Test • Contoh
Sign Test • Contoh
Wilcoxon Signed-Rank Test
• Symmetric continuous distribution
• Subtract sample value with 𝜇0, rank it from absolute smallest to the largest one
• When there are more than one differences are the same, rank it with the average number of the differences
Wilcoxon Signed-Rank Test
• Test Procedures

29/11/2013
3
Wilcoxon Signed-Rank Test
• n < 5, and level of significance ≤ 0,05 (one-tailed test), level of significance ≤ 0,01 (two-tailed test) >>> 𝑤+, 𝑤−, 𝑤 will lead to acceptance 𝐻0
• 5 ≤ n ≤ 30, check table to set critical region
Wilcoxon Signed-Rank Test
• Contoh:
Wilcoxon Signed-Rank Test
• Contoh:
Wilcoxon Signed-Rank Test
• Contoh:
Wilcoxon Signed-Rank Test Wilcoxon Rank-Sum Test
• Testing equality of means of two continous distributions that nonnormal and samples are independent
• Take random sample, assign 𝑛1 for smaller number sample and 𝑛2 for larger one. Assigned randomly if two population have the same number of sample
• Arrange 𝑛1 + 𝑛2 observations in ascending order. If there are the identical observations value, mean the ranks
• 𝑤1= sum of ranks of 𝑛1 observations
• 𝑤2= sum of ranks of 𝑛2 observations

29/11/2013
4
Wilcoxon Rank-Sum Test
Wilcoxon Rank-Sum Test
• Procedures:
• Reject 𝐻0: 𝑢1, 𝑢2, 𝑢 less than or equal to the table value
Wilcoxon Rank-Sum Test
• Contoh:
Wilcoxon Rank-Sum Test
Wilcoxon Rank-Sum Test Kruskal-Wallis Test
• Nonparametric alternative to analysis of variance
– ANOVA: testing equality of 𝑘 ≥ 2 population means, must be normal distribution when using F-statistic
– Kruskal-Wallis Test is a nonparametric procedure for testing the equality of means in the one-factor analysis of variance without normal populations assumption
• Generalization of Runk-Sum test for case 𝑘 > 2 samples
29/11/2013
5
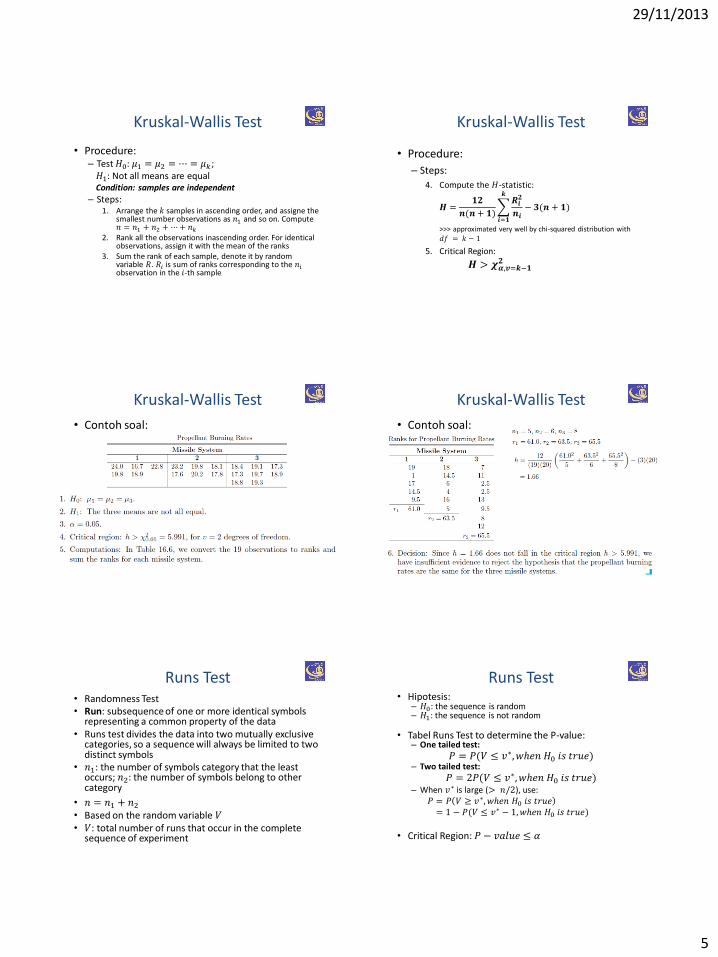
Kruskal-Wallis Test
• Procedure: – Test 𝐻0: 𝜇1 = 𝜇2 = ⋯ = 𝜇𝑘 ;
𝐻1: Not all means are equal Condition: samples are independent
– Steps: 1. Arrange the 𝑘 samples in ascending order, and assigne the
smallest number observations as 𝑛1 and so on. Compute 𝑛 = 𝑛1 + 𝑛2 + ⋯+ 𝑛𝑘
2. Rank all the observations inascending order. For identical observations, assign it with the mean of the ranks
3. Sum the rank of each sample, denote it by random variable 𝑅. 𝑅𝑖 is sum of ranks corresponding to the 𝑛𝑖 observation in the 𝑖-th sample
Kruskal-Wallis Test
• Procedure:
– Steps:
4. Compute the 𝐻-statistic:
𝑯 =𝟏𝟐
𝒏(𝒏 + 𝟏)
𝑹𝒊𝟐
𝒏𝒊− 𝟑(𝒏 + 𝟏)
𝒌
𝒊=𝟏
>>> approximated very well by chi-squared distribution with 𝑑𝑓 = 𝑘 − 1
5. Critical Region:
𝑯 > 𝝌𝜶,𝒗=𝒌−𝟏𝟐
Kruskal-Wallis Test
• Contoh soal:
Kruskal-Wallis Test
• Contoh soal:
Runs Test • Randomness Test • Run: subsequence of one or more identical symbols
representing a common property of the data • Runs test divides the data into two mutually exclusive
categories, so a sequence will always be limited to two distinct symbols
• 𝑛1: the number of symbols category that the least occurs; 𝑛2: the number of symbols belong to other category
• 𝑛 = 𝑛1 + 𝑛2 • Based on the random variable 𝑉 • 𝑉: total number of runs that occur in the complete
sequence of experiment
Runs Test • Hipotesis:
– 𝐻0: the sequence is random – 𝐻1: the sequence is not random
• Tabel Runs Test to determine the P-value:
– One tailed test:
𝑃 = 𝑃(𝑉 ≤ 𝑣∗, 𝑤ℎ𝑒𝑛 𝐻0 𝑖𝑠 𝑡𝑟𝑢𝑒) – Two tailed test:
𝑃 = 2𝑃(𝑉 ≤ 𝑣∗, 𝑤ℎ𝑒𝑛 𝐻0 𝑖𝑠 𝑡𝑟𝑢𝑒) – When 𝑣∗ is large (> 𝑛/2), use: 𝑃 = 𝑃 𝑉 ≥ 𝑣∗, 𝑤ℎ𝑒𝑛 𝐻0 𝑖𝑠 𝑡𝑟𝑢𝑒
= 1 − 𝑃(𝑉 ≤ 𝑣∗ − 1,𝑤ℎ𝑒𝑛 𝐻0 𝑖𝑠 𝑡𝑟𝑢𝑒)
• Critical Region: 𝑃 − 𝑣𝑎𝑙𝑢𝑒 ≤ 𝛼

29/11/2013
6
Runs Test • Contoh Soal:
Runs Test • Contoh Soal:
Runs Test • When 𝑛1 and 𝑛2 (≥ 10 𝑓𝑜𝑟 𝑒𝑎𝑐ℎ) is large, the
sampling distribution of 𝑉 approaches the normal distribution with mean and variance as follow:
• 𝑍 − 𝑇𝑒𝑠𝑡:
Runs Test
• Lakukan uji apakah data berikut random atau tidak:
Kolmogorov-Smirnov Test
• Test for normality
• An alternative to the chi-squared test for distribution hypothesis test
Kolmogorov-Smirnov Test

29/11/2013
7
Kolmogorov-Smirnov Test
Spearman Coefficient of Rank Correlation
Spearman Coefficient of Rank Correlation
Spearman Coefficient of Rank Correlation

29/11/2013
8
Pertemuan 13 - Persiapan
• Materi – Validitas dan Realibilitas


![[Ict] contoh final test g3 s2 2012 2013](https://img.pdfslide.us/doc/110x75/557da35fd8b42a3a7c8b5238/ict-contoh-final-test-g3-s2-2012-2013.jpg)