Embed Size (px)
Citation preview
Statistics Yearbook
Personal debt
2013
Our objectives
• Creategreaterawarenessof,andaccessto,trulyfree debt advice and debt solutions
• Developextensiverelationshipswithotherorganisations to bring greater help and support to people with problem debt
• Providenewandimprovedproductsandservicesto meet the changing needs of people with problem debt
• Investinourpeople,processesandsystemstoeffectively deliver timely and high quality help and support
• Buildarobust,stableandsustainablecharitythatcan be relied on by all in society
• Championthecauseof peopleinoratriskof problem debt by influencing policymakers and campaigning for change
• Enhancepeoples’financialunderstandingandcapability so they can better manage their money and debts
STEPCHANGE DEBT CHARITY RESEARCH
Main Findings 2013 1
Chief Executive’s Introduction 2
Section 2: Demand 3• Demandforadvice• Debtmap• Reasonsfordebt• Recommendationsflowchart• Demandforadvice–age• Demandforadvicebychannel• Demandforadvice–gender• Demandforadvice–familytype• Demandforadvice–housingtenure• Numberof clientswithbenefits• Clientsonbenefits–averagesurplus• Employment• Ourclientsurvey
Section 3: Debts 15• Averageunsecureddebt• Unsecureddebtlevels• Averageunsecureddebt–age• Averageunsecureddebt–gender• Averageunsecureddebt–housingtenure• Averageunsecureddebt–familytype• Averageunsecureddebt–employment• Typesof unsecureddebt
• Numberof unsecureddebts• Sizeof problembynumberof debtsseen• Multipleunsecureddebts–creditcards• Multipleunsecureddebts–paydayloans• Debttofamilyand/orfriends• Debtcocktails
Section 4: Arrears on essential household bills 25• Arrearsonessentialhouseholdbills• Arrearsnumbers/debts• Arrearsonessentialhouseholdbills–age• Arrearsonessentialhouseholdbills–gender• Arrearsonessentialhouseholdbills–familytype• Arrearsonessentialhouseholdbills–housingtenure
Section 5: Social Policy 29• SocialPolicy–organisations• SocialPolicy–issues• SocialPolicy–biggestconcerns
Appendix 32
ThedataintheStatisticsYearbookisdrawnfromawarehousecontainingthedetailsof morethan16mphonecallsand2.3mclients.The2013dataanalysesaround300,000clientswhoreceivedafulladvicesessionfromStepChangeDebtCharitylastyear.
Table of Contents
You’llnoticeafewchangesinthisyear’sStatisticsYearbook.We’vedecidedtofreshenitupabitbymakingitmorevisuallyexcitingandconcentratingonstatisticsthatbestexplainourclients’stories.Wehopeyouenjoythechanges.
STATISTICS YEARBOOK 2013 1
• Arecordnumberof people,507,863,contactedStepChangeDebtCharityin2013.Thiswasdrivenbya29percentincreaseinthenumberof peoplecontactingthecharitybytelephoneanda50percentincreaseinthenumberof peoplecontactingthecharityonline
• Asinpreviousyears,demandforadvicewasprimarilyaresultof unemployment(23percent)andreducedincomeresultingfromalossof hoursatwork(16percent)
• Theproportionof peoplewholiveinrentedaccommodationseekingadvicefromthecharitycontinuestogrow.Lastyearalmost70percentof clientsadvisedlivedinrentedaccommodation,comparedtojustover50percentin2009
• Beinginworkdoesnotnecessarilyprotectpeoplefromdebtproblems;overhalf of clientsseekinghelpwereinwork,31percentemployedfulltime
• Relyingprimarilyonincomefromjobseeker’sallowancemeansthatpeopledonothaveenoughmoneytomeettheiressentialspend.Clientsreceivingthebenefithave,onaverage,significantlyhigheroutgoingsthanincome
• Theresultsof ourclientsurveyshowedthatindebtedconsumersstillcontinuetowaitalongtimebeforeseekingdebtadvice.Half of thosesurveyedwaitedmorethanayearbetweenrealisingtheirdebtswereaproblemandseekinghelpfromanydebtadviceprovider
• Oursurveyshowedthepsychologicalimpactproblemdebtcanhaveonindividuals.Three-quartersof respondentsexperiencedsleepingproblemsduetotheirdebt,and64percentexperiencedmoodswings.Over50percentalsofoundtheirworkperformancesufferedasaresultof problemdebt
• Paydayloanscontinuetocausehugeproblemsforconsumers.StepChangeDebtCharityclientswithpaydayloanshave,onaverage,three,withtheaveragepaydaydebt(£1,647)outstrippingaverageincome
• Thelastfiveyearshaveseenaworryingriseintheproportionof StepChangeDebtCharityclientswitharrearsonessentialhouseholdbills.ThelargestrisehasbeeninCouncilTaxarrears,wheretheproportionof clientswithmissedpaymentshasincreasedfromlessthan10percentin2009to
over25percentin2013
• Thecharityhasalsoseenbigrisesintheproportionof clientswitharrearsonutilitybills.Around13percentof clientshavearrearson
gasandelectricitybills.
Main Findings 2013

STATISTICS YEARBOOK 2013 2
1 Office of National Statistics: An Examination of Falling Real Wages, 2010 – 20132 ONS Economic Review for November
Since2006ourStatisticsYearbookhasilluminatedthedifficultiesfacedbyhouseholdsstrugglingwithproblemdebtacrosstheUK.Thisyear,myfirstasChief Executiveof theUK’slargestdebtadvicecharity,thedatarevealsacomplexbutconcerningstory.
Althoughthereiswelcomeevidenceof economicgrowth,andaveragedebtisfalling,manypeoplearestilllivinginaverydifficulteconomicenvironment,onethatrequiresarobust,comprehensiveandcoordinatedapproachtohouseholdproblemdebtbygovernment,creditors,serviceprovidersandcharities.
Wehavecontinuedtoseeasharpriseinthenumberof peoplewithhigh-cost,short-termcredit.67,000of thepeopleweadvisedin2013hadpaydayloans,almostdoublethepreviousyear.Over20percentof thoseseekingourhelpwithpaydayloanshadtakenoutmorethanfive,showinganongoingproblemwithirresponsiblelendingpracticeswhichwehopetheFinancialConductAuthoritywilltackle.
Therehasalsobeenasharpincreaseinthenumberof peoplecomingtouswitharrearsonessentialhouseholdbills–thedebtsmanypeoplearestrugglingwitharenottheresultof oneoffextravagances,butastructuralshortfallbetweentheirincomeandessentiallivingexpenses.Theproportionof clientswitharrearsontheirCouncilTaxhasincreasedfrom10percentin2009toover25percentin2013.Theproportionof clientswitharrearsonutilitybills,gasandelectricity,hasdoubledoverthesameperiod.Theneedforinvestmentininfrastructuresuchasenergy,waterandcommunicationswillpassthroughtoconsumers’bills.Interestrateriseswillalsocomesoonerorlaterandbeashockafteralongperiodof staticandlowrates.
Realwagesfellin2013andhavebeenfallingconsistentlysince2010,thelongestperiodof declinefor50years1.Theproportionof averagehouseholddisposableincomeaccountedforbyexpenditureonessentialhouseholdgoodsandserviceshasrisenfrom20percentin2003to27percentin20132.Coupledwithpersistentworriesoverjobsecurity,thismeanspeople’sfinancialhorizonsappeartobereducing.Thelackof people’sfinancialresiliencemeansthatitisverydifficulttocopewithincomecostshocksoverthelongterm,evenovertheshortterm.
Inthisenvironmentthegrowthof thepaydayloanmarketandarrearsisalmostinevitable,anddemandsastronggovernmentresponse.Therapidriseinarrearsonessentialhouseholdbillsinparticularisonethatisunder-reported,andraisesseriousquestionsregardingthepublicsector’sroleasadebtcollectorandthebusinesspracticesof serviceproviders,suchasutilitycompanies.
2014willproveachallengingoneforallorganisationsconcernedwithhelpingfinanciallystressedconsumers,withpeoplefacinghardpersonaleconomiccircumstancesandwelfarechangescontinuingtobite.StepChangeDebtCharitywillcarryonourkeytaskwithvigourandpassion,offeringfree,independentadviceandsupporttoallwhoneedit,nomatterwhattheircircumstances.WewillcontinuetodrivethechangeneededtofurtherhelptheUK’sindebtedpopulation.Wewillcontinuetoadvisepolicymakers,usingevidencefromourclientsandourresearch.Wehaveanexcitingresearchprogrammeplannedfor2014examiningwhatlifeislikeforfamilies“ontheedge”–whoarefalling,orhavefallen,intofinancialdifficulty–andlookingatwhetherthereisanadequatesafetynetinplacetoprotectthem.
Mike O’Connor CBEChief Executive
1. Chief Executive’s Introduction
STATISTICS YEARBOOK 2013 3
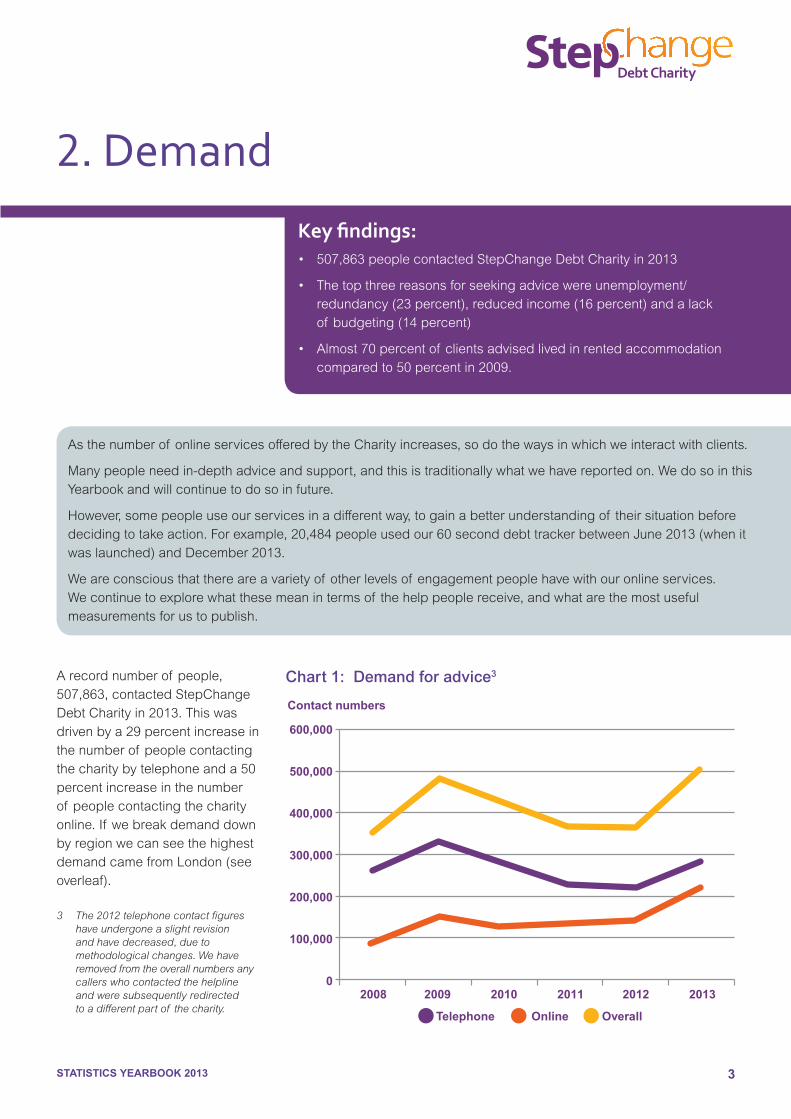
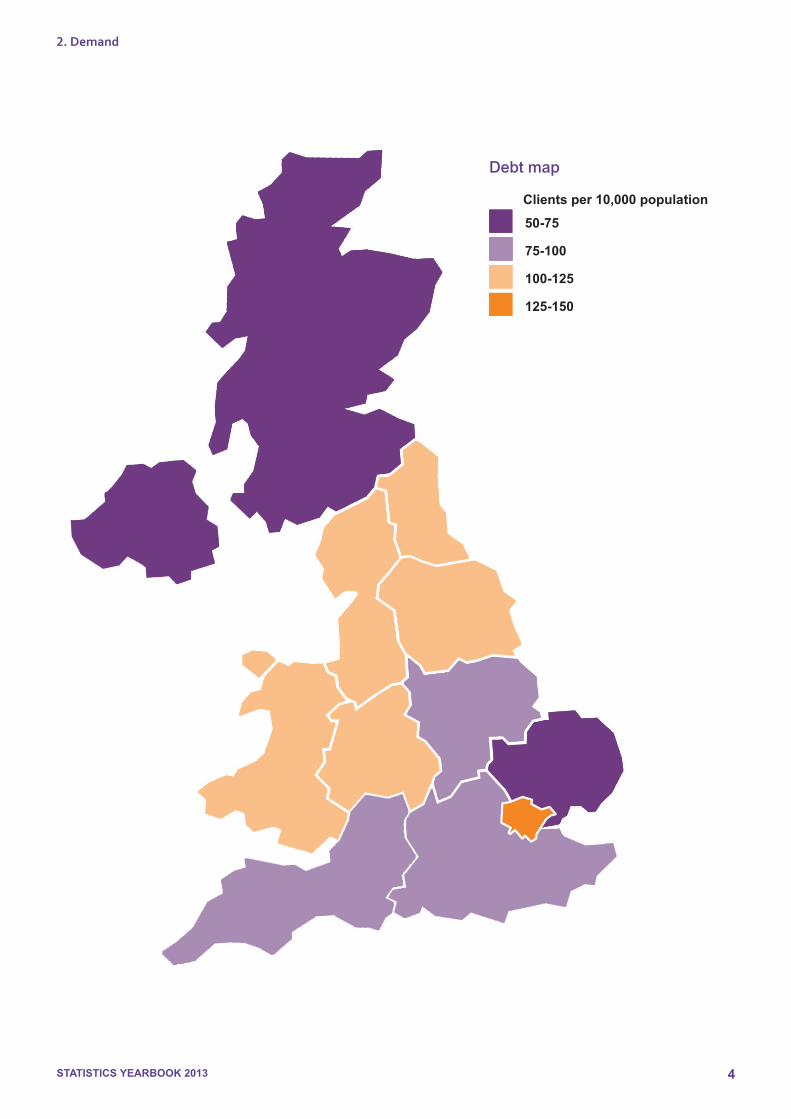
Arecordnumberof people,507,863,contactedStepChangeDebtCharityin2013.Thiswasdrivenbya29percentincreaseinthenumberof peoplecontactingthecharitybytelephoneanda50percentincreaseinthenumberof peoplecontactingthecharityonline.If webreakdemanddownbyregionwecanseethehighestdemandcamefromLondon(seeoverleaf).
3 The 2012 telephone contact figures have undergone a slight revision and have decreased, due to methodological changes. We have removed from the overall numbers any callers who contacted the helpline
and were subsequently redirected to a different part of the charity.
2. Demand
Chart 1: Demand for advice3
600,000
500,000
400,000
300,000
200,000
100,000
02008 2009 2010 2011 2012 2013
Contact numbers
Telephone Online Overall
Key findings:• 507,863peoplecontactedStepChangeDebtCharityin2013
• Thetopthreereasonsforseekingadvicewereunemployment/redundancy(23percent),reducedincome(16percent)andalackof budgeting(14percent)
• Almost70percentof clientsadvisedlivedinrentedaccommodationcomparedto50percentin2009.
Asthenumberof onlineservicesofferedbytheCharityincreases,sodothewaysinwhichweinteractwithclients.
Manypeopleneedin-depthadviceandsupport,andthisistraditionallywhatwehavereportedon.WedosointhisYearbookandwillcontinuetodosoinfuture.
However,somepeopleuseourservicesinadifferentway,togainabetterunderstandingof theirsituationbeforedecidingtotakeaction.Forexample,20,484peopleusedour60seconddebttrackerbetweenJune2013(whenitwaslaunched)andDecember2013.
Weareconsciousthatthereareavarietyof otherlevelsof engagementpeoplehavewithouronlineservices.Wecontinuetoexplorewhatthesemeanintermsof thehelppeoplereceive,andwhatarethemostusefulmeasurementsforustopublish.
STATISTICS YEARBOOK 2013 4
2. Demand
50-75
75-100
100-125
125-150
Debt map
Clients per 10,000 population

STATISTICS YEARBOOK 2013 5
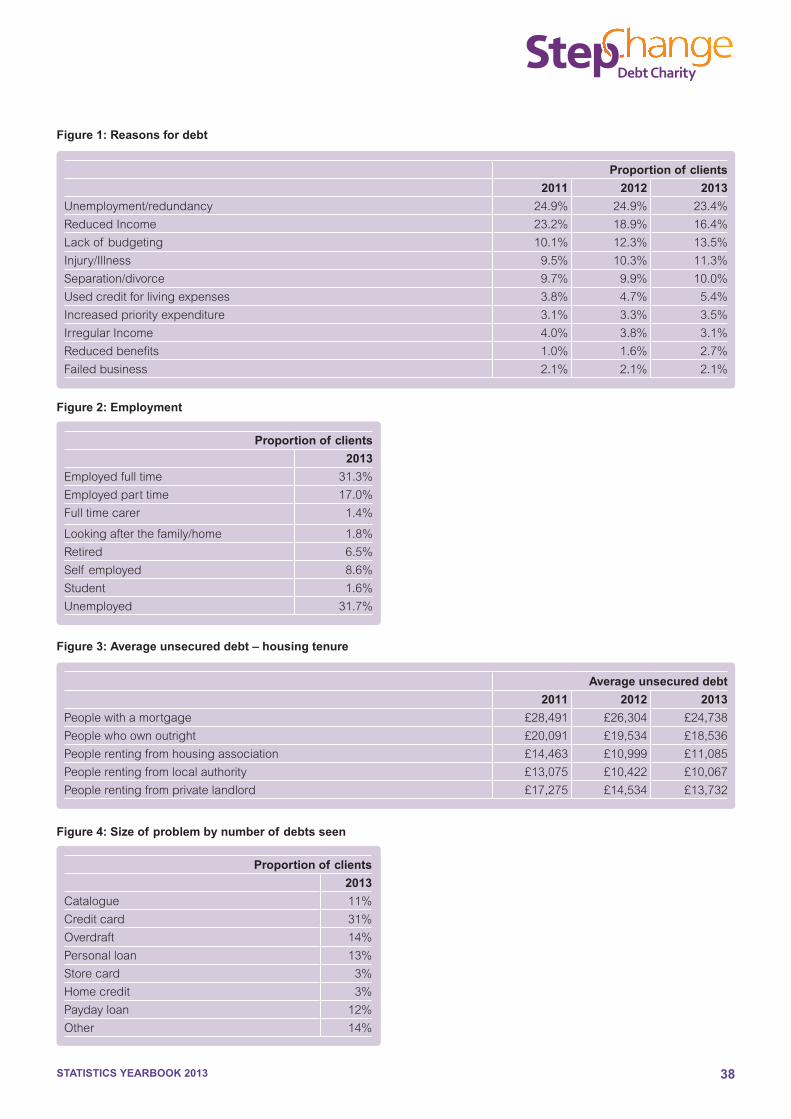
Asinpreviousyears,demandforadvicewasprimarilyaresultof unemployment(23percent)andreducedincomeresultingfromlossof hoursatwork(16percent).
Figure 1: Reasons for debt
STATISTICS YEARBOOK 2013 6
2. Demand
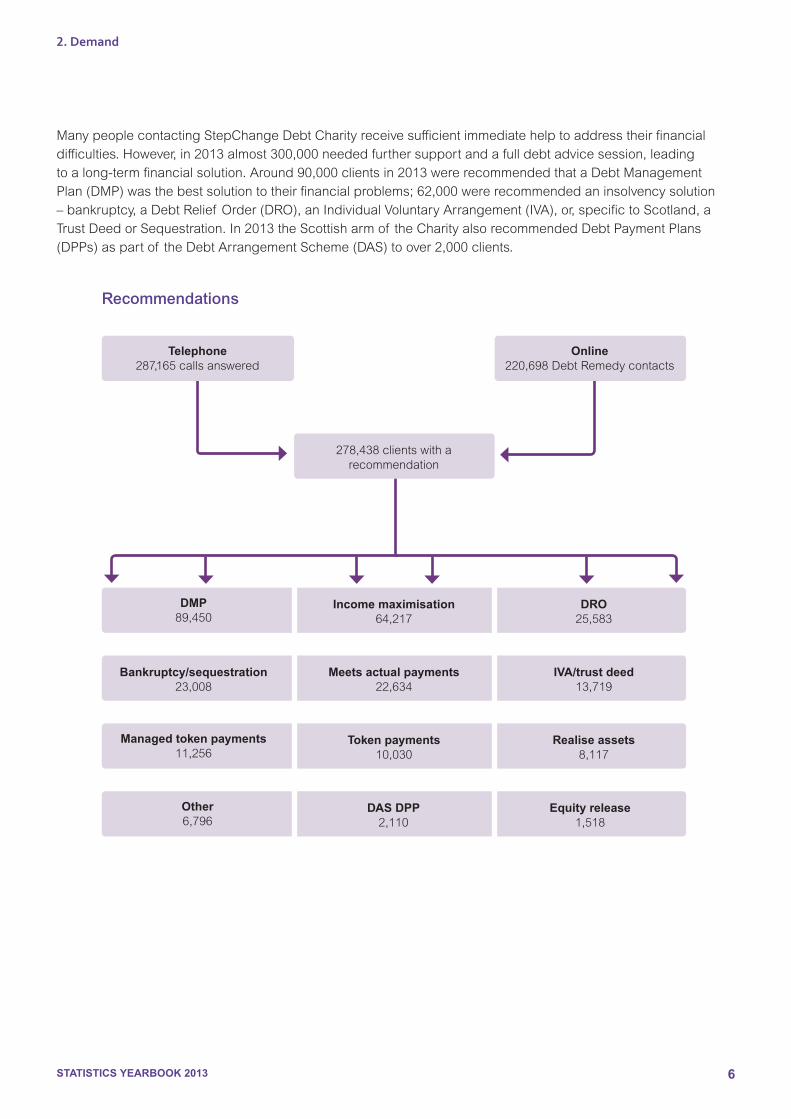
DMP89,450
Income maximisation64,217
DRO25,583
Bankruptcy/sequestration23,008
Meets actual payments22,634
IVA/trust deed13,719
Managed token payments11,256
Token payments10,030
Realise assets8,117
278,438clientswitharecommendation
Other6,796
DAS DPP2,110
Equity release1,518
Telephone287,165callsanswered
Online220,698DebtRemedycontacts
Recommendations
ManypeoplecontactingStepChangeDebtCharityreceivesufficientimmediatehelptoaddresstheirfinancialdifficulties.However,in2013almost300,000neededfurthersupportandafulldebtadvicesession,leadingtoalong-termfinancialsolution.Around90,000clientsin2013wererecommendedthataDebtManagementPlan(DMP)wasthebestsolutiontotheirfinancialproblems;62,000wererecommendedaninsolvencysolution–bankruptcy,aDebtRelief Order(DRO),anIndividualVoluntaryArrangement(IVA),or,specifictoScotland,aTrustDeedorSequestration.In2013theScottisharmof theCharityalsorecommendedDebtPaymentPlans(DPPs)aspartof theDebtArrangementScheme(DAS)toover2,000clients.
STATISTICS YEARBOOK 2013 7
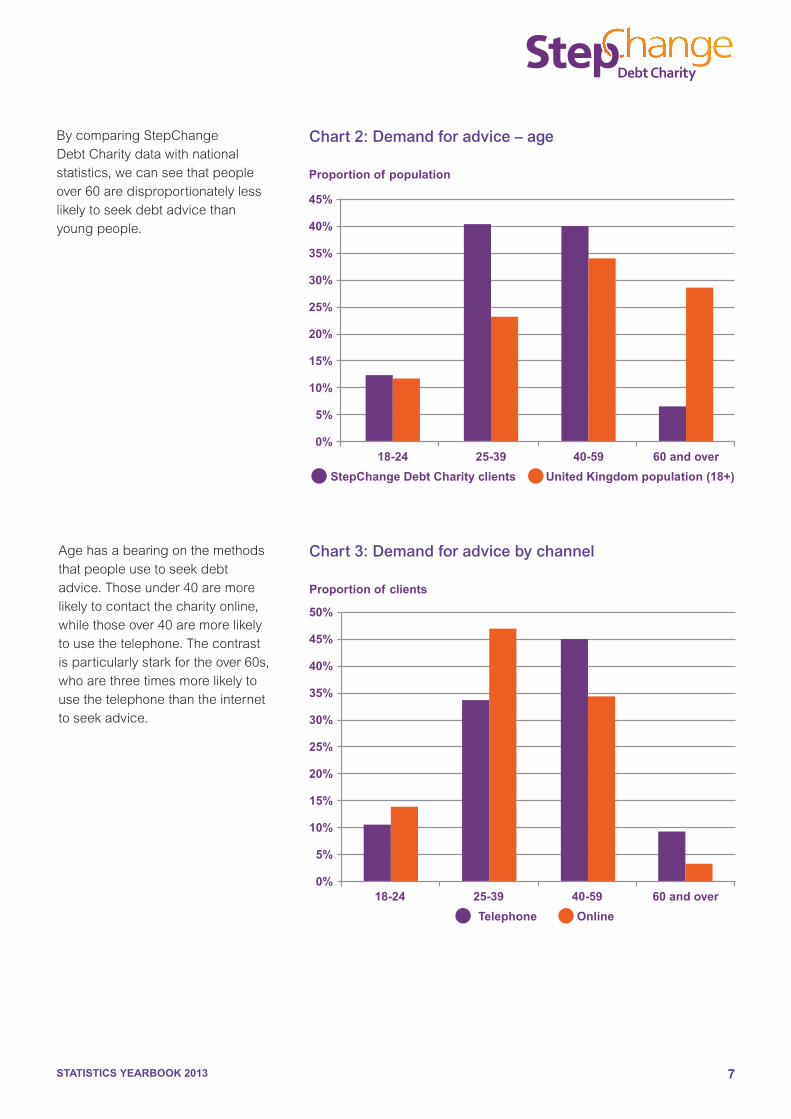
BycomparingStepChangeDebtCharitydatawithnationalstatistics,wecanseethatpeopleover60aredisproportionatelylesslikelytoseekdebtadvicethanyoungpeople.
45%
40%
35%
30%
25%
20%
15%
10%
5%
0%
Proportion of population
18-24 25-39 40-59 60 and over
StepChange Debt Charity clients United Kingdom population (18+)
Chart 2: Demand for advice – age
50%
45%
40%
35%
30%
25%
20%
15%
10%
5%
0%
Proportion of clients
18-24 25-39 40-59 60 and over
Telephone Online
Chart 3: Demand for advice by channelAgehasabearingonthemethodsthatpeopleusetoseekdebtadvice.Thoseunder40aremorelikelytocontactthecharityonline,whilethoseover40aremorelikelytousethetelephone.Thecontrastisparticularlystarkfortheover60s,whoarethreetimesmorelikelytousethetelephonethantheinternettoseekadvice.
STATISTICS YEARBOOK 2013 8
4 ONS Families and Households 2012: lone parent families with dependent children
2. Demand
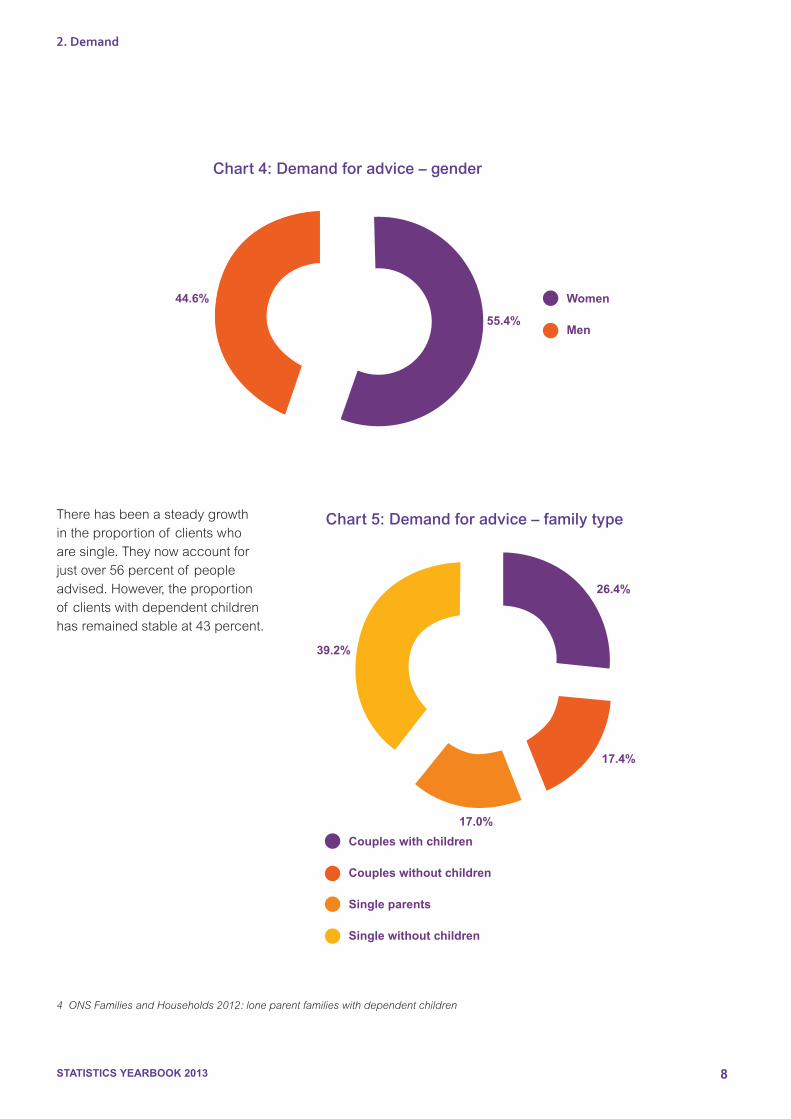
Chart 4: Demand for advice – gender
Women
Men55.4%
44.6%
Therehasbeenasteadygrowthintheproportionof clientswhoaresingle.Theynowaccountforjustover56percentof peopleadvised.However,theproportionof clientswithdependentchildrenhasremainedstableat43percent.
Couples with children
Couples without children
Single parents
Single without children
26.4%
17.4%
39.2%
17.0%
Chart 5: Demand for advice – family type
STATISTICS YEARBOOK 2013 9
80%
70%
60%
50%
40%
30%
20%
10%
0%
Proportion of clients
2003 2004 2005 2006 2007 2008 2009 2010 2011 2012 2013
Homeowners Renters
Board payment
Mortgage
Own outright
Rent & mortgage
Rent - housing association
Rent - local authority
Rent - private landlord
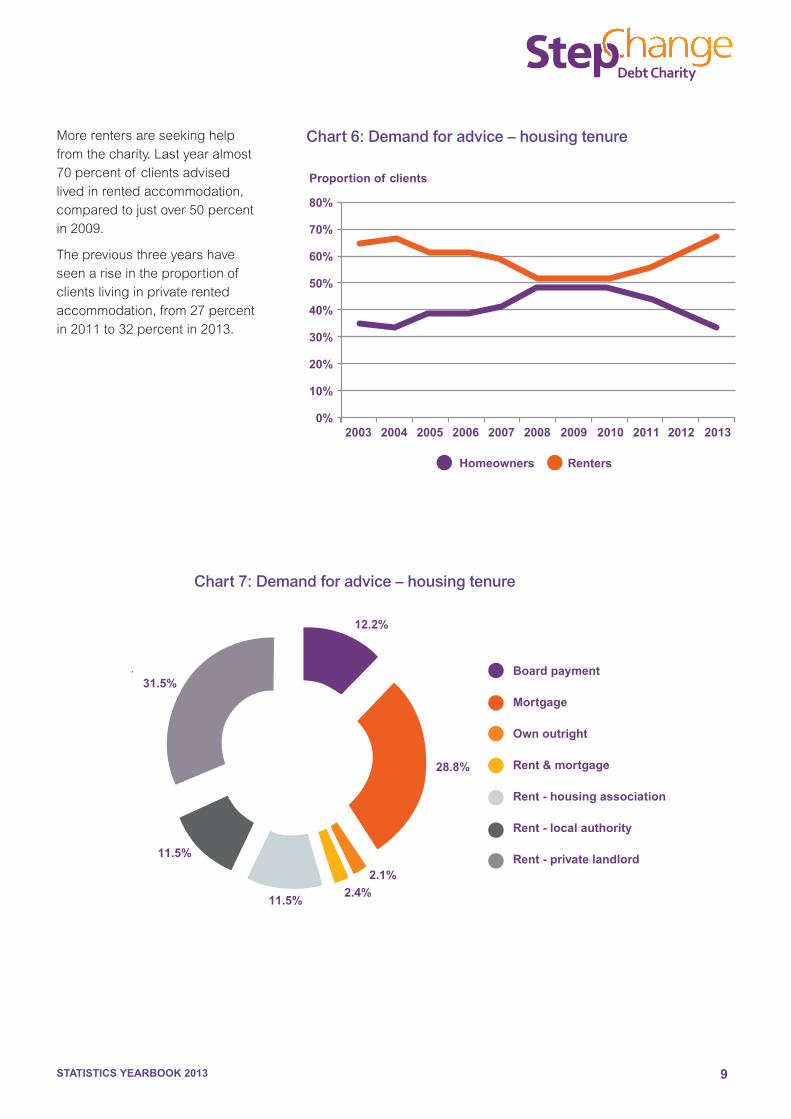
12.2%
28.8%
2.1%
31.5%
11.5%
11.5%
2.4%
Chart 6: Demand for advice – housing tenure
Chart 7: Demand for advice – housing tenure
Morerentersareseekinghelpfromthecharity.Lastyearalmost70percentof clientsadvisedlivedinrentedaccommodation,comparedtojustover50percentin2009.
Thepreviousthreeyearshaveseenariseintheproportionof clientslivinginprivaterentedaccommodation,from27percentin2011to32percentin2013.
STATISTICS YEARBOOK 2013 10
2. Demand
Claireisalowpaidpart-timeworker.Shehashadherwagesfrozenforfouryearsandhadtoreduceherworkinghoursasshesuffersfromtendonitisandarthritisinherhands.Herhusband,anMOTtester,hasbeenforcedtobecomeself-employedafterhisgaragemadehimredundant.Afterstrugglingforanumberof yearstheirfinancesgotsteadilyworseandtheywerehavingtoincreasinglyrelyonanoverdraftandcreditcardfordaytodayliving.Claireaskedforhelpfromherbankandwasofferedfurthercredit.
ShethenreceivedaletterinJanuary2013fromthecreditcarddepartmentsayingthattheywouldhavetoincreaseherinterestrateuntilherspendingorcreditimproved.ShewasreferredtoStepChangeDebtCharityandwearrangedaDMP.
“[It]isthebestthingwecouldhavedoneandwishIhaddoneitsooner.”
Case study Claire
AfterAdamwasforcedtotakeearlyretirementduetogrowinghealthproblems,hefoundhimself dependentonbenefits.Hehadtakenoutacarloanwhilsthewasstillworking,andhenowstrugglestoliveonhisbenefitsandrepaytheloan.
“Onedayyou’reearningapaycheckandthenextdayyou’renotandyou’reindeeptrouble.”
Thebenefitmoneyisn’tenoughtopayoffhisdebts,orevenliveon,andhehasbeenkeptwaitingayearforallof hisbenefitstobeprocessed.
Adamcontactedthebankfourorfivemonthsafterbeingmedicallyretired.
“Isaid‘lookI’mnotgoingtohaveenoughmoneytopaythesethingsoff,’becauseitsaysontheirbankwebsite,nicely,phoneusandwe’lldoeverythingwecantohelpyouandthefirstthingtheysaidwas‘sorrywecan’thelpyou’so…itwasaveryunpleasantexperienceandquitesouldestroyingactually.”
Hestrugglestoliveonthemoneyhedoeshavecominginandhasnorealwayof earninganymore.
“I’vegotnomoney.Ithinkthethingthat’sgoingtohappenisprobablybankruptcy.”
Case study Adam
STATISTICS YEARBOOK 2013 11
5 Not including housing benefit
Number of clients
180,000
160,000
140,000
120,000
100,000
80,000
60,000
40,000
20,000
0
Child b
enefi
tChild
tax c
redit
Disabilit
y livi
ng allo
wance
Inca
pacity
ben
efit/E
SAIn
com
e support
Jobse
eker
’s all
owance
Work
ing ta
x cre
dit
All clie
nts cl
aimin
g
benefi
ts
2011 2012 2013
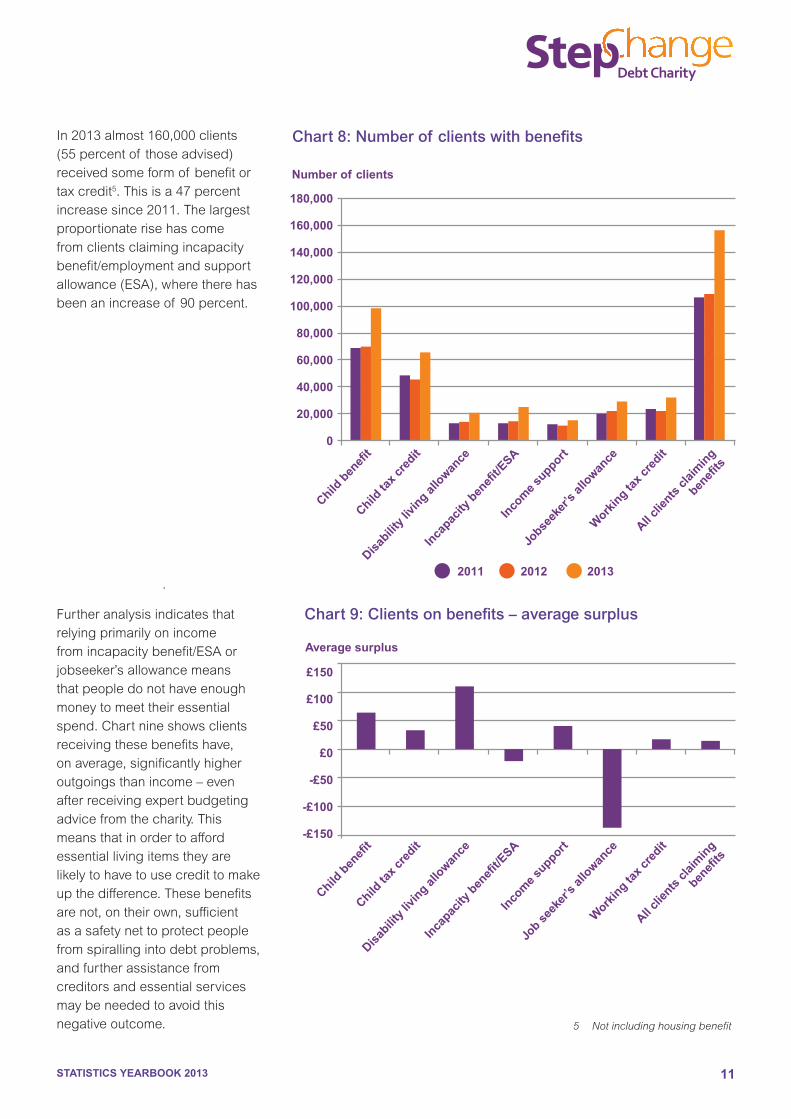
Chart 8: Number of clients with benefitsIn2013almost160,000clients(55percentof thoseadvised)receivedsomeformof benefitortaxcredit5.Thisisa47percentincreasesince2011.Thelargestproportionaterisehascomefromclientsclaimingincapacitybenefit/employmentandsupportallowance(ESA),wheretherehasbeenanincreaseof 90percent.
Chart 9: Clients on benefits – average surplus
Average surplus
£150
£100
£50
£0
-£50
-£100
-£150
Child b
enefi
tChild
tax c
redit
Disabilit
y livi
ng allo
wance
Inca
pacity
ben
efit/E
SAIn
com
e support
Job se
eker
’s all
owance
Work
ing ta
x cre
dit
All clie
nts cl
aimin
g
benefi
ts
Furtheranalysisindicatesthatrelyingprimarilyonincomefromincapacitybenefit/ESAorjobseeker’sallowancemeansthatpeopledonothaveenoughmoneytomeettheiressentialspend.Chartnineshowsclientsreceivingthesebenefitshave,onaverage,significantlyhigheroutgoingsthanincome–evenafterreceivingexpertbudgetingadvicefromthecharity.Thismeansthatinordertoaffordessentiallivingitemstheyarelikelytohavetousecredittomakeupthedifference.Thesebenefitsarenot,ontheirown,sufficientasasafetynettoprotectpeoplefromspirallingintodebtproblems,andfurtherassistancefromcreditorsandessentialservicesmaybeneededtoavoidthisnegativeoutcome.
STATISTICS YEARBOOK 2013 12
2. Demand
6 ONS labour market statistics Sep-Nov 2013
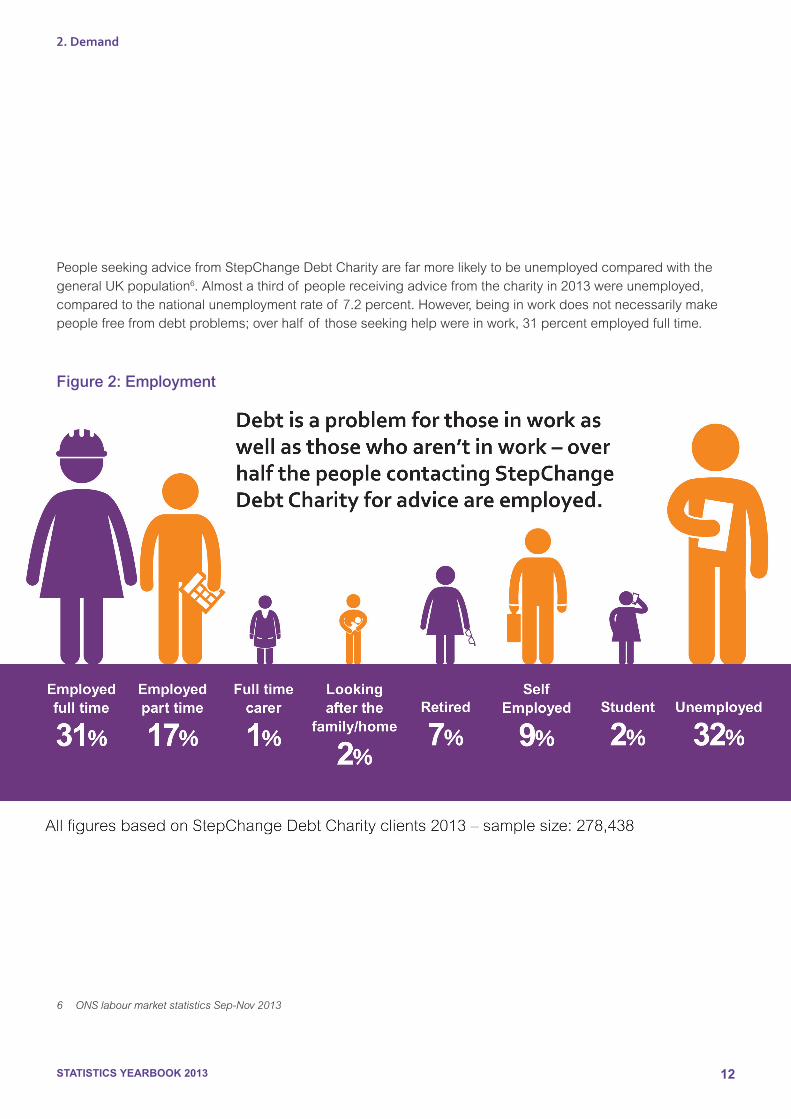
PeopleseekingadvicefromStepChangeDebtCharityarefarmorelikelytobeunemployedcomparedwiththegeneralUKpopulation6.Almostathirdof peoplereceivingadvicefromthecharityin2013wereunemployed,comparedtothenationalunemploymentrateof 7.2percent.However,beinginworkdoesnotnecessarilymakepeoplefreefromdebtproblems;overhalf of thoseseekinghelpwereinwork,31percentemployedfulltime.
Figure 2: Employment
STATISTICS YEARBOOK 2013 13
How long was it between starting to worry that your debt was a problem and seeking help from any debt advice provider?
2011 2012 2013
1-3months 15% 13% 9%
4-6months 15% 22% 17%
7-9months 11% 11% 10%
10-12months 12% 14% 14%
Afterayear 45% 40% 50%
Have your debt problems had a negative impact on your relationships with friends and family?
2011 2012 2013
Yes 31% 30% 37%
No 34% 39% 30%
Ihaven’ttoldthem 35% 31% 33%
Have your debt problems affected your self-confidence/faith in your own ability to support yourself or your family?
2011 2012 2013
Alot 47% 36% 44%
Somewhat 35% 42% 40%
No 7% 12% 8%
Hardtosay/don’tknow 11% 10% 8%
Do you believe that if you had received more financial education in school you would have avoided unmanageable debt?
2011 2012 2013
Yes 46% 42% 44%
No 21% 22% 23%
Hardtosay/don’tknow 28% 32% 30%
Notapplicable 5% 3% 3%
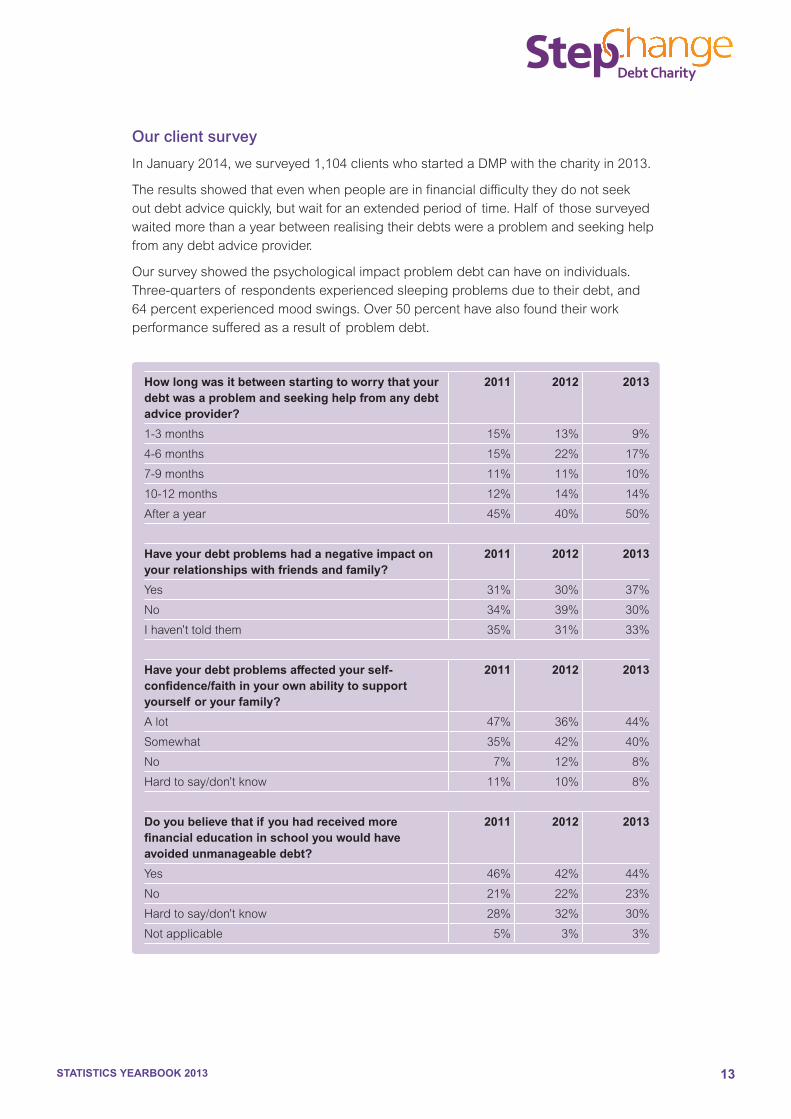
Our client survey
InJanuary2014,wesurveyed1,104clientswhostartedaDMPwiththecharityin2013.
Theresultsshowedthatevenwhenpeopleareinfinancialdifficultytheydonotseekoutdebtadvicequickly,butwaitforanextendedperiodof time.Half of thosesurveyedwaitedmorethanayearbetweenrealisingtheirdebtswereaproblemandseekinghelpfromanydebtadviceprovider.
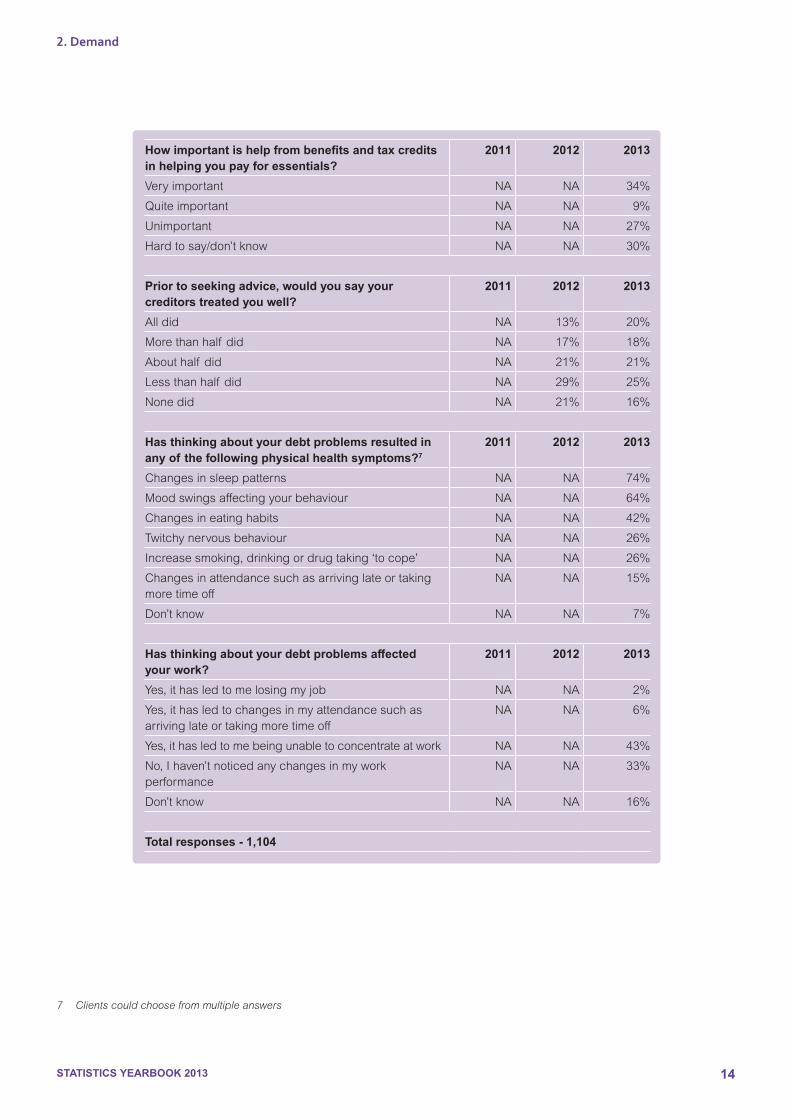
Oursurveyshowedthepsychologicalimpactproblemdebtcanhaveonindividuals.Three-quartersof respondentsexperiencedsleepingproblemsduetotheirdebt,and64percentexperiencedmoodswings.Over50percenthavealsofoundtheirworkperformancesufferedasaresultof problemdebt.
STATISTICS YEARBOOK 2013 14
7 Clients could choose from multiple answers
2. Demand
How important is help from benefits and tax credits in helping you pay for essentials?
2011 2012 2013
Veryimportant NA NA 34%
Quiteimportant NA NA 9%
Unimportant NA NA 27%
Hardtosay/don’tknow NA NA 30%
Prior to seeking advice, would you say your creditors treated you well?
2011 2012 2013
Alldid NA 13% 20%
Morethanhalf did NA 17% 18%
Abouthalf did NA 21% 21%
Lessthanhalf did NA 29% 25%
Nonedid NA 21% 16%
Has thinking about your debt problems resulted in any of the following physical health symptoms?7
2011 2012 2013
Changesinsleeppatterns NA NA 74%
Moodswingsaffectingyourbehaviour NA NA 64%
Changesineatinghabits NA NA 42%
Twitchynervousbehaviour NA NA 26%
Increasesmoking,drinkingordrugtaking‘tocope’ NA NA 26%
Changesinattendancesuchasarrivinglateortakingmoretimeoff
NA NA 15%
Don’tknow NA NA 7%
Has thinking about your debt problems affected your work?
2011 2012 2013
Yes,ithasledtomelosingmyjob NA NA 2%
Yes,ithasledtochangesinmyattendancesuchasarrivinglateortakingmoretimeoff
NA NA 6%
Yes,ithasledtomebeingunabletoconcentrateatwork NA NA 43%
No,Ihaven’tnoticedanychangesinmyworkperformance
NA NA 33%
Don’tknow NA NA 16%
Total responses - 1,104
STATISTICS YEARBOOK 2013 15
3. Debts
Average unsecured debt
£30,000
£25,000
£20,000
£15,000
£10,000
£5,000
£02009 2010 2011 2012 2013
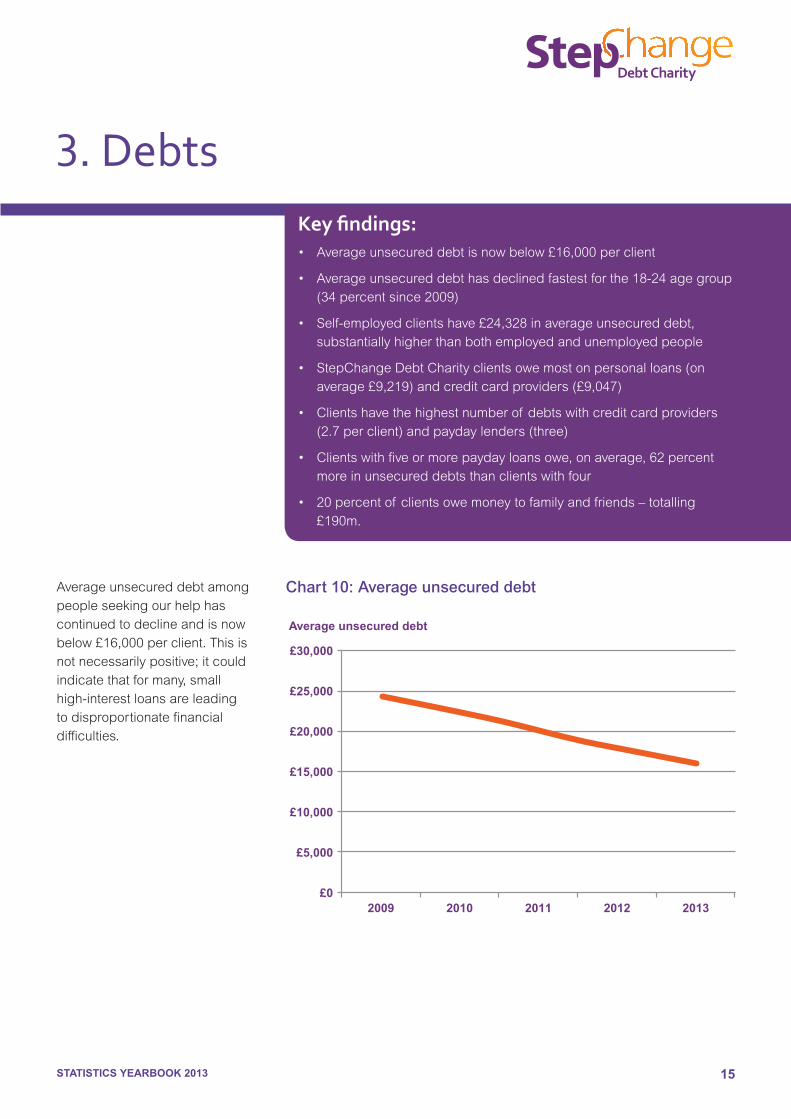
Key findings:• Averageunsecureddebtisnowbelow£16,000perclient
• Averageunsecureddebthasdeclinedfastestforthe18-24agegroup(34percentsince2009)
• Self-employedclientshave£24,328inaverageunsecureddebt,substantiallyhigherthanbothemployedandunemployedpeople
• StepChangeDebtCharityclientsowemostonpersonalloans(onaverage£9,219)andcreditcardproviders(£9,047)
• Clientshavethehighestnumberof debtswithcreditcardproviders(2.7perclient)andpaydaylenders(three)
• Clientswithfiveormorepaydayloansowe,onaverage,62percentmoreinunsecureddebtsthanclientswithfour
• 20percentof clientsowemoneytofamilyandfriends–totalling £190m.
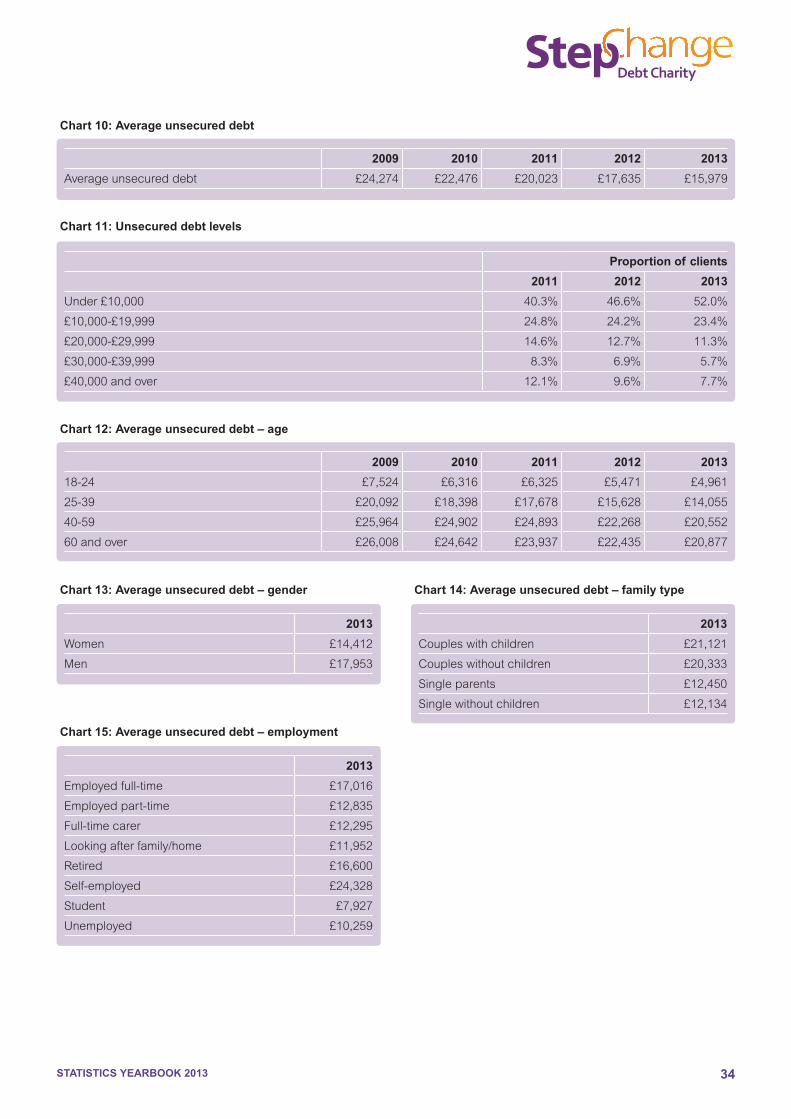
Chart 10: Average unsecured debtAverageunsecureddebtamongpeopleseekingourhelphascontinuedtodeclineandisnowbelow£16,000perclient.Thisisnotnecessarilypositive;itcouldindicatethatformany,smallhigh-interestloansareleadingtodisproportionatefinancialdifficulties.
STATISTICS YEARBOOK 2013 16
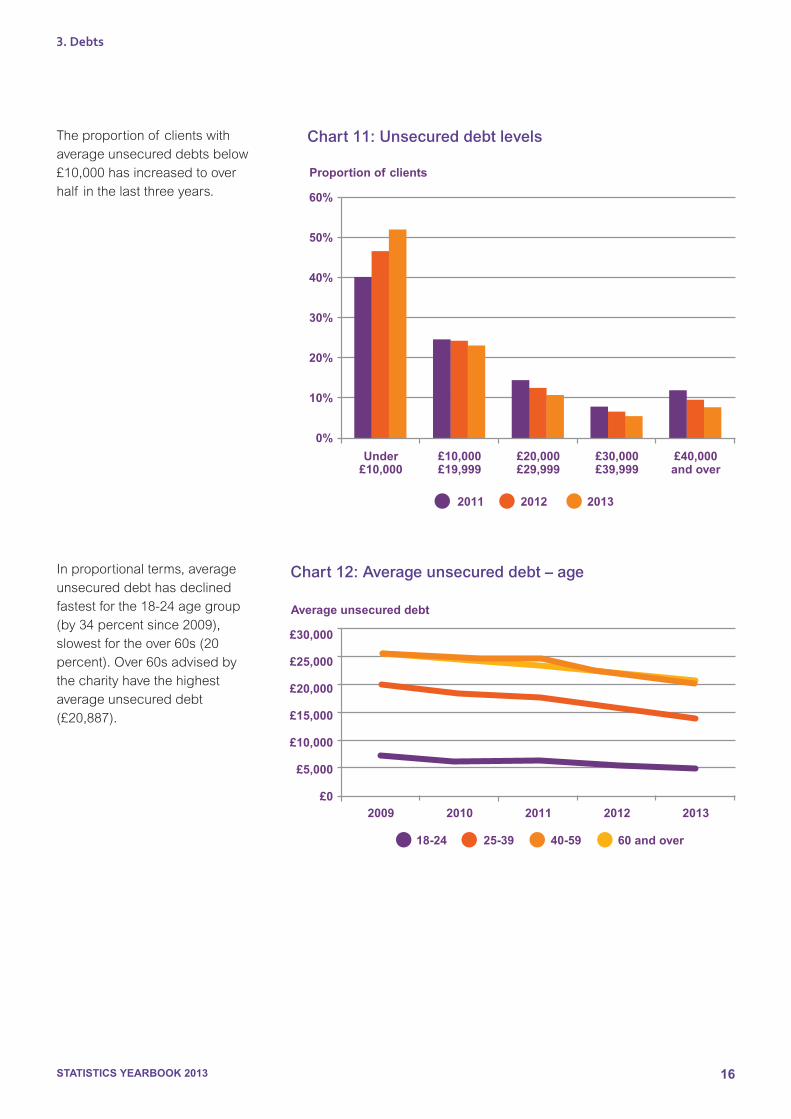
Theproportionof clientswithaverageunsecureddebtsbelow£10,000hasincreasedtooverhalf inthelastthreeyears.
3. Debts
Proportion of clients
60%
50%
40%
30%
20%
10%
0%
2011 2012 2013
Under£10,000
£10,000£19,999
£20,000£29,999
£30,000£39,999
£40,000and over
Chart 11: Unsecured debt levels
Chart 12: Average unsecured debt – ageInproportionalterms,averageunsecureddebthasdeclinedfastestforthe18-24agegroup(by34percentsince2009),slowestfortheover60s(20percent).Over60sadvisedbythecharityhavethehighestaverageunsecureddebt(£20,887).
Average unsecured debt
£30,000
£25,000
£20,000
£15,000
£10,000
£5,000
£0
18-24 25-39 40-59 60 and over
2009 2010 2011 2012 2013
STATISTICS YEARBOOK 2013 17
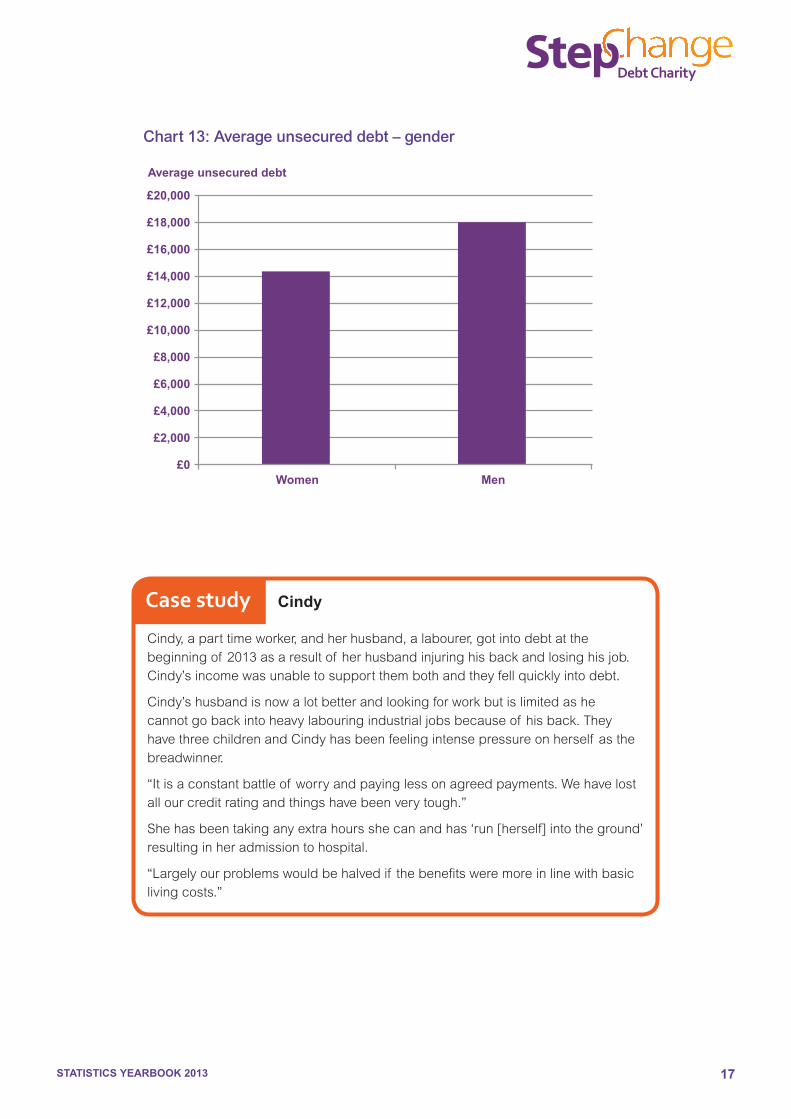
Cindy,aparttimeworker,andherhusband,alabourer,gotintodebtatthebeginningof 2013asaresultof herhusbandinjuringhisbackandlosinghisjob.Cindy’sincomewasunabletosupportthembothandtheyfellquicklyintodebt.
Cindy’shusbandisnowalotbetterandlookingforworkbutislimitedashecannotgobackintoheavylabouringindustrialjobsbecauseof hisback.TheyhavethreechildrenandCindyhasbeenfeelingintensepressureonherself asthebreadwinner.
“Itisaconstantbattleof worryandpayinglessonagreedpayments.Wehavelostallourcreditratingandthingshavebeenverytough.”
Shehasbeentakinganyextrahoursshecanandhas‘run[herself]intotheground’resultinginheradmissiontohospital.
“Largelyourproblemswouldbehalvedif thebenefitsweremoreinlinewithbasiclivingcosts.”
Case study Cindy
£20,000
£18,000
£16,000
£14,000
£12,000
£10,000
£8,000
£6,000
£4,000
£2,000
£0
Average unsecured debt
Women Men
Chart 13: Average unsecured debt – gender
STATISTICS YEARBOOK 2013 18
3. Debts
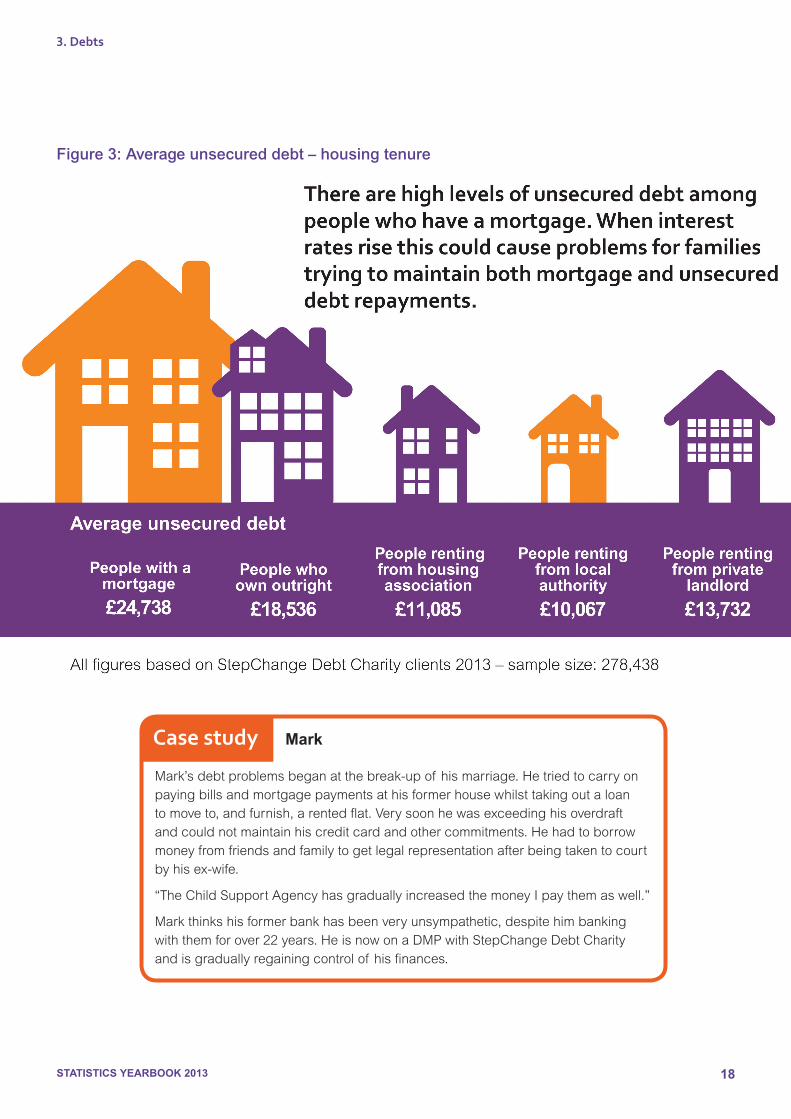
Figure 3: Average unsecured debt – housing tenure
Mark’sdebtproblemsbeganatthebreak-upof hismarriage.Hetriedtocarryonpayingbillsandmortgagepaymentsathisformerhousewhilsttakingoutaloantomoveto,andfurnish,arentedflat.Verysoonhewasexceedinghisoverdraftandcouldnotmaintainhiscreditcardandothercommitments.Hehadtoborrowmoneyfromfriendsandfamilytogetlegalrepresentationafterbeingtakentocourtbyhisex-wife.
“TheChildSupportAgencyhasgraduallyincreasedthemoneyIpaythemaswell.”
Markthinkshisformerbankhasbeenveryunsympathetic,despitehimbankingwiththemforover22years.HeisnowonaDMPwithStepChangeDebtCharityandisgraduallyregainingcontrolof hisfinances.
Case study Mark
STATISTICS YEARBOOK 2013 19
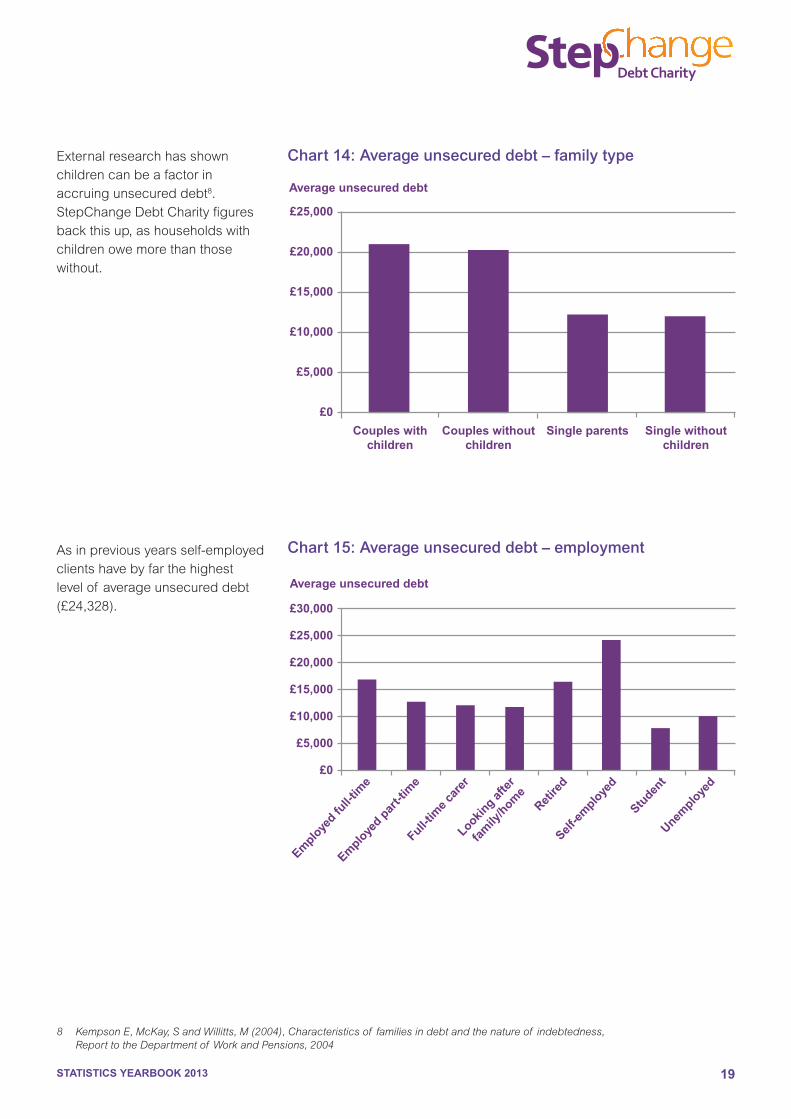
Chart 14: Average unsecured debt – family typeExternalresearchhasshownchildrencanbeafactorinaccruingunsecureddebt8.StepChangeDebtCharityfiguresbackthisup,ashouseholdswithchildrenowemorethanthosewithout.
Average unsecured debt
£25,000
£20,000
£15,000
£10,000
£5,000
£0
Couples with children
Couples without children
Single parents Single without children
Asinpreviousyearsself-employedclientshavebyfarthehighestlevelof averageunsecureddebt(£24,328).
Chart 15: Average unsecured debt – employment
Average unsecured debt
£30,000
£25,000
£20,000
£15,000
£10,000
£5,000
£0
Emplo
yed fu
ll-tim
e
Emplo
yed p
art-t
ime
Full-tim
e car
erLookin
g afte
r
fam
ily/h
ome
Retire
dSelf
-em
ploye
d
Studen
tUnem
ploye
d
8 Kempson E, McKay, S and Willitts, M (2004), Characteristics of families in debt and the nature of indebtedness, Report to the Department of Work and Pensions, 2004

STATISTICS YEARBOOK 2013 20
3. Debts
£10,000
£9,000
£8,000
£7,000
£6,000
£5,000
£4,000
£3,000
£2,000
£1,000
£0
Average unsecured debt
Catalo
gueCre
dit ca
rd
Overd
raft
Perso
nal lo
an
Store
card
Home c
redit
Payday
loan
3.5
3.0
2.5
2.0
1.5
1.0
0.5
0.0
Catalo
gueCre
dit ca
rd
Overd
raft
Perso
nal lo
an
Store
card
Home c
redit
Payday
loan
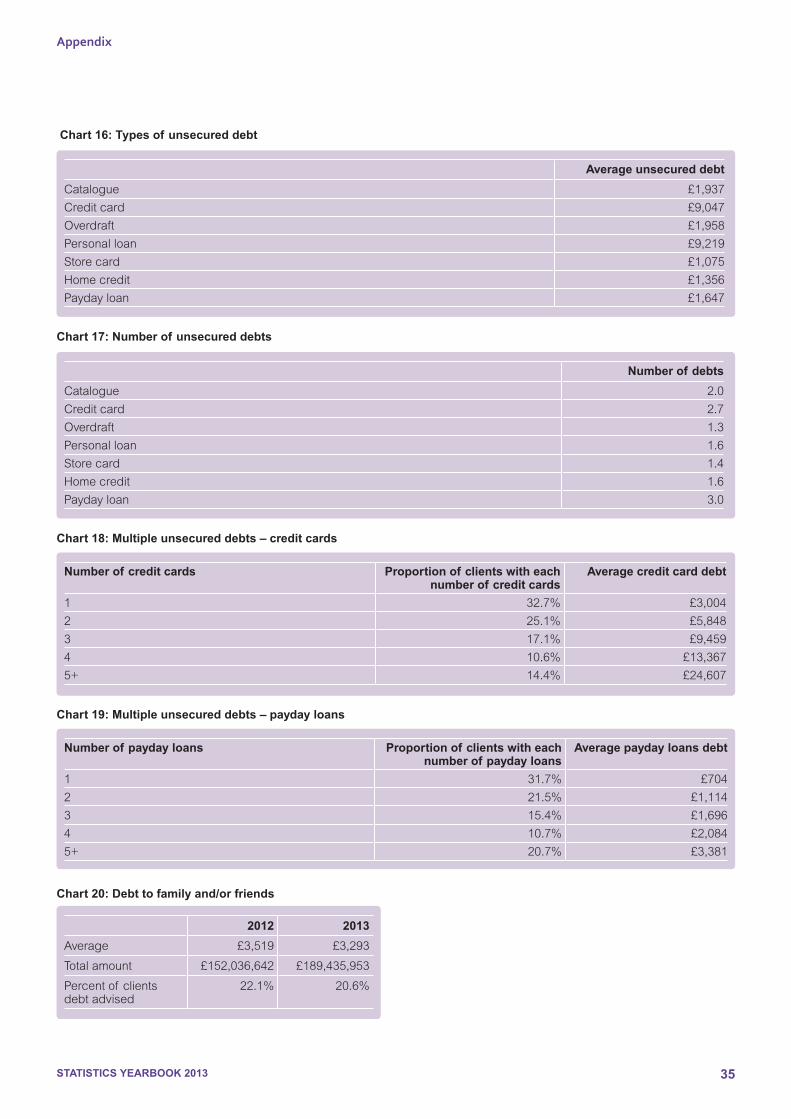
Chart 16: Types of unsecured debtStepChangeDebtCharityclientsonaverageowemostonpersonalloans(£9,219)andcreditcards(£9,047).
Chart 17: Number of unsecured debtsHowever,ourclientshavethehighestnumberof debtswithcreditcardproviders(2.7)andwithpaydaylenders(three)indicatingproblemsarisingfrommultipledebts.
Number of debts
STATISTICS YEARBOOK 2013 21
WhenMarytookoutaloan,herunclesignedasherguarantor.Afterlosingherjob,shestruggledtokeepupherrepayments.Thecreditorbegantocallherrepeatedly-upto18timesperdayonsomeoccasions-tochasethearrearsonheraccount.Mary’sunclestartedtomakeupthepaymentsuntilhelosthisjob.BothMaryandheruncletriedtocanceltheContinuousPaymentAuthorityontheirdebitcardswiththelenderandtheirbanks;howeverthelenderstillcontinuedtotakepayments,leavingtheminapositionwheretheystruggledtobuyfoodandpayessentialhouseholdbills.Mary’sunclefoundwork,butwasstillunabletomakethefullmonthlypaymentfortheloan.Thelenderkeptcallinghimatwork,despiterepeatedrequestsnotto,whichalmostledtohimreceivingdisciplinaryactionaboutreceivingpersonalcalls.
MaryiscurrentlyonaDMParrangedbyStepChangeDebtCharity,butisconsideringbankruptcy.
Case study Mary
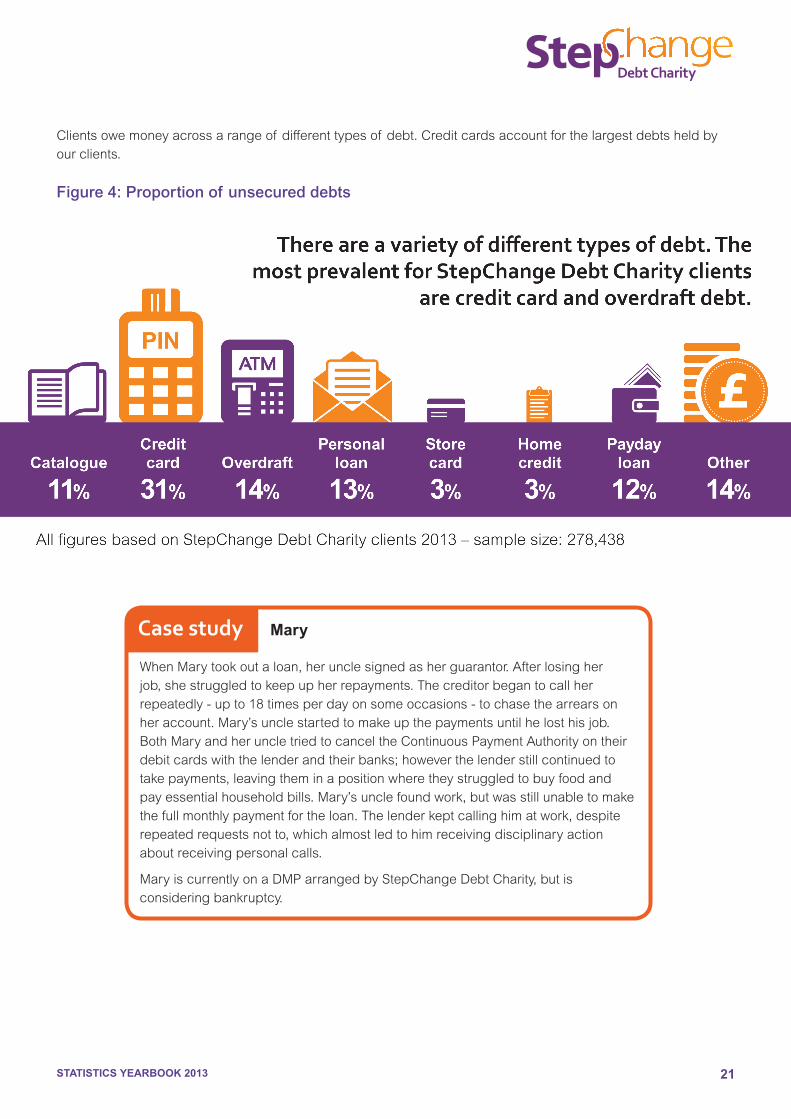
Figure 4: Proportion of unsecured debts
Clientsowemoneyacrossarangeof differenttypesof debt.Creditcardsaccountforthelargestdebtsheldbyourclients.
STATISTICS YEARBOOK 2013 22
3. Debts
35%
30%
25%
20%
15%
10%
5%
0%
£30,000
£25,000
£20,000
£15,000
£10,000
£5,000
£01 2 3 4 5+
Number of credit cards Average credit card debt
Proportion of clients with each number of credit cards
Average credit card debt
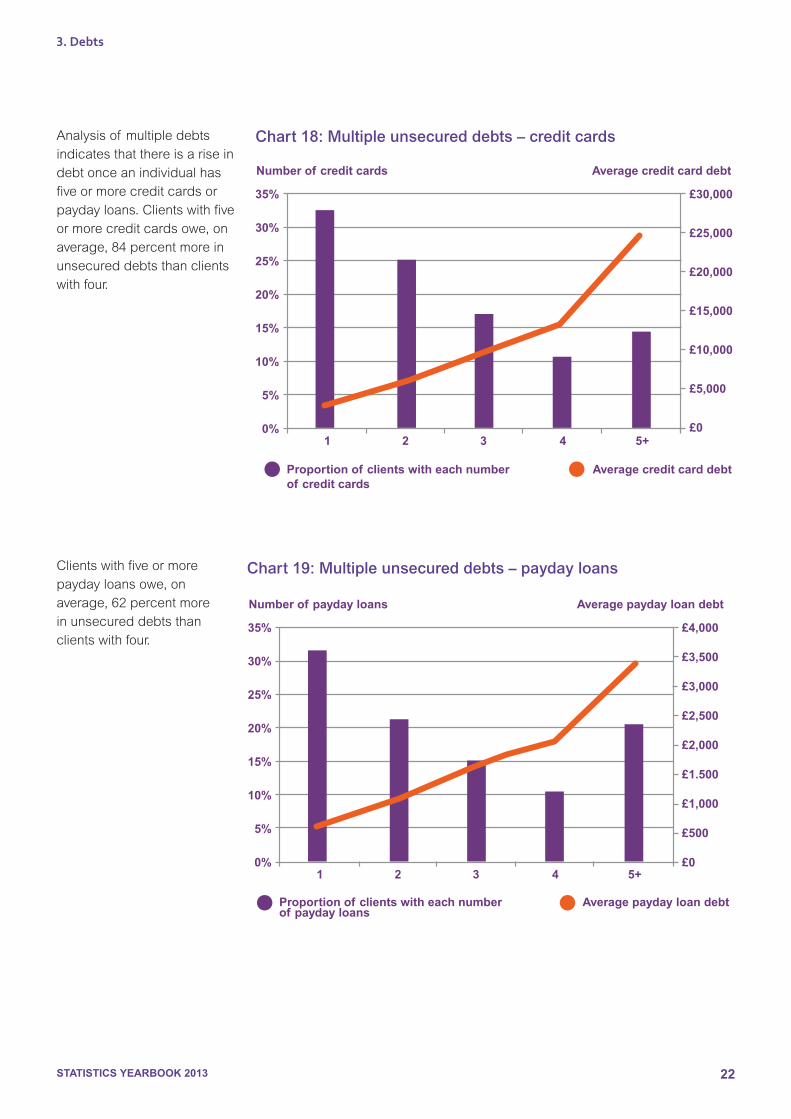
Analysisof multipledebtsindicatesthatthereisariseindebtonceanindividualhasfiveormorecreditcardsorpaydayloans.Clientswithfiveormorecreditcardsowe,onaverage,84percentmoreinunsecureddebtsthanclientswithfour.
35%
30%
25%
20%
15%
10%
5%
0%
£4,000
£3,500
£3,000
£2,500
£2,000
£1.500
£1,000
£500
£01 2 3 4 5+
Number of payday loans Average payday loan debt
Proportion of clients with each number of payday loans
Chart 18: Multiple unsecured debts – credit cards
Chart 19: Multiple unsecured debts – payday loansClientswithfiveormorepaydayloansowe,onaverage,62percentmoreinunsecureddebtsthanclientswithfour.
Average payday loan debt
STATISTICS YEARBOOK 2013 23
Average credit card debt
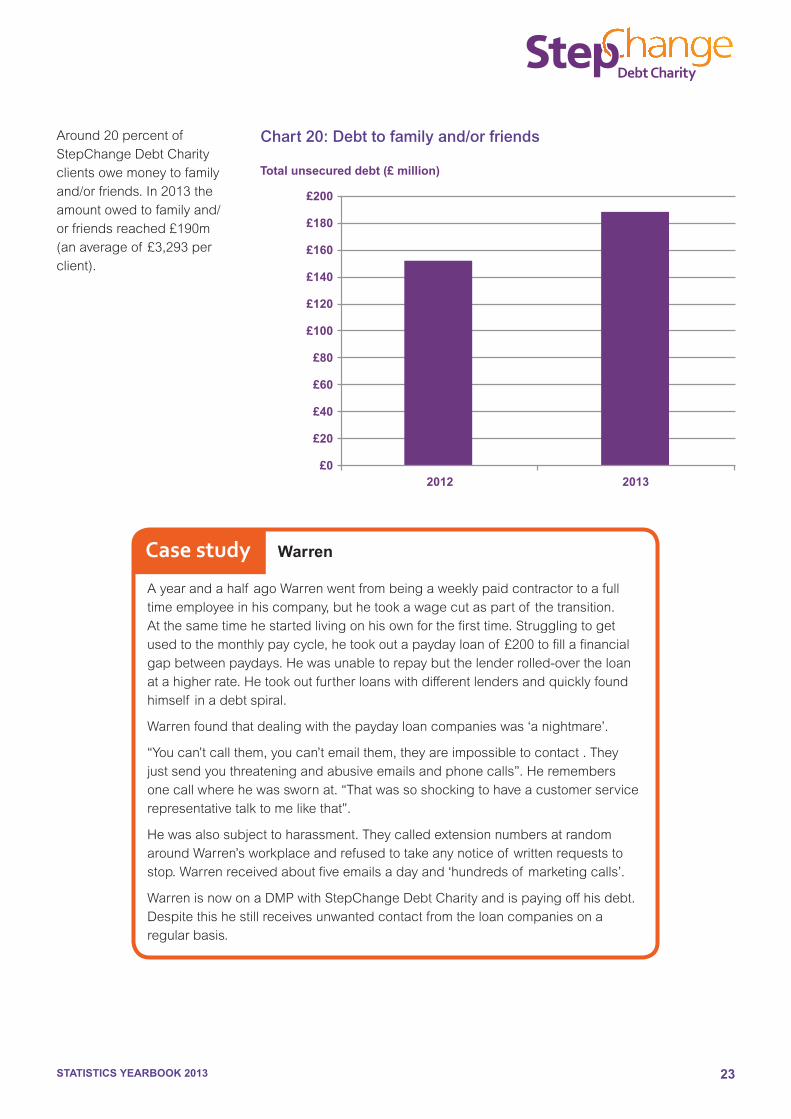
Around20percentof StepChangeDebtCharityclientsowemoneytofamilyand/orfriends.In2013theamountowedtofamilyand/orfriendsreached£190m(anaverageof £3,293perclient).
£200
£180
£160
£140
£120
£100
£80
£60
£40
£20
£02012 2013
Chart 20: Debt to family and/or friends
Ayearandahalf agoWarrenwentfrombeingaweeklypaidcontractortoafulltimeemployeeinhiscompany,buthetookawagecutaspartof thetransition.Atthesametimehestartedlivingonhisownforthefirsttime.Strugglingtogetusedtothemonthlypaycycle,hetookoutapaydayloanof £200tofillafinancialgapbetweenpaydays.Hewasunabletorepaybutthelenderrolled-overtheloanatahigherrate.Hetookoutfurtherloanswithdifferentlendersandquicklyfoundhimself inadebtspiral.
Warrenfoundthatdealingwiththepaydayloancompanieswas‘anightmare’.
“Youcan’tcallthem,youcan’temailthem,theyareimpossibletocontact.Theyjustsendyouthreateningandabusiveemailsandphonecalls”.Heremembersonecallwherehewasswornat.“Thatwassoshockingtohaveacustomerservicerepresentativetalktomelikethat”.
Hewasalsosubjecttoharassment.TheycalledextensionnumbersatrandomaroundWarren’sworkplaceandrefusedtotakeanynoticeof writtenrequeststostop.Warrenreceivedaboutfiveemailsadayand‘hundredsof marketingcalls’.
WarrenisnowonaDMPwithStepChangeDebtCharityandispayingoffhisdebt.Despitethishestillreceivesunwantedcontactfromtheloancompaniesonaregularbasis.
Case study Warren
Total unsecured debt (£ million)
STATISTICS YEARBOOK 2013 24
3. Debts
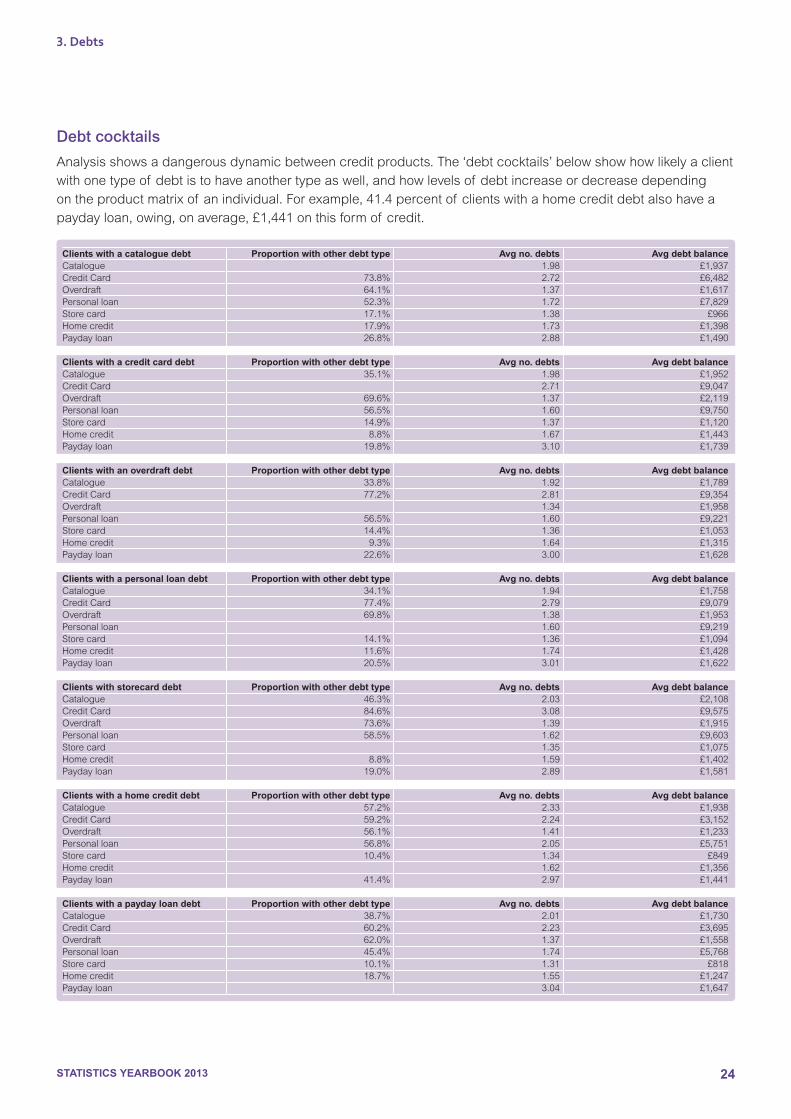
Debt cocktails
Clients with a catalogue debt Proportion with other debt type Avg no. debts Avg debt balanceCatalogue 1.98 £1,937CreditCard 73.8% 2.72 £6,482Overdraft 64.1% 1.37 £1,617Personalloan 52.3% 1.72 £7,829Storecard 17.1% 1.38 £966Homecredit 17.9% 1.73 £1,398Paydayloan 26.8% 2.88 £1,490
Clients with a credit card debt Proportion with other debt type Avg no. debts Avg debt balanceCatalogue 35.1% 1.98 £1,952CreditCard 2.71 £9,047Overdraft 69.6% 1.37 £2,119Personalloan 56.5% 1.60 £9,750Storecard 14.9% 1.37 £1,120Homecredit 8.8% 1.67 £1,443Paydayloan 19.8% 3.10 £1,739
Clients with an overdraft debt Proportion with other debt type Avg no. debts Avg debt balanceCatalogue 33.8% 1.92 £1,789CreditCard 77.2% 2.81 £9,354Overdraft 1.34 £1,958Personalloan 56.5% 1.60 £9,221Storecard 14.4% 1.36 £1,053Homecredit 9.3% 1.64 £1,315Paydayloan 22.6% 3.00 £1,628
Clients with a personal loan debt Proportion with other debt type Avg no. debts Avg debt balanceCatalogue 34.1% 1.94 £1,758CreditCard 77.4% 2.79 £9,079Overdraft 69.8% 1.38 £1,953Personalloan 1.60 £9,219Storecard 14.1% 1.36 £1,094Homecredit 11.6% 1.74 £1,428Paydayloan 20.5% 3.01 £1,622
Clients with storecard debt Proportion with other debt type Avg no. debts Avg debt balanceCatalogue 46.3% 2.03 £2,108CreditCard 84.6% 3.08 £9,575Overdraft 73.6% 1.39 £1,915Personalloan 58.5% 1.62 £9,603Storecard 1.35 £1,075Homecredit 8.8% 1.59 £1,402Paydayloan 19.0% 2.89 £1,581
Clients with a home credit debt Proportion with other debt type Avg no. debts Avg debt balanceCatalogue 57.2% 2.33 £1,938CreditCard 59.2% 2.24 £3,152Overdraft 56.1% 1.41 £1,233Personalloan 56.8% 2.05 £5,751Storecard 10.4% 1.34 £849Homecredit 1.62 £1,356Paydayloan 41.4% 2.97 £1,441Clients with a payday loan debt Proportion with other debt type Avg no. debts Avg debt balanceCatalogue 38.7% 2.01 £1,730CreditCard 60.2% 2.23 £3,695Overdraft 62.0% 1.37 £1,558Personalloan 45.4% 1.74 £5,768Storecard 10.1% 1.31 £818Homecredit 18.7% 1.55 £1,247Paydayloan 3.04 £1,647
Analysisshowsadangerousdynamicbetweencreditproducts.The‘debtcocktails’belowshowhowlikelyaclientwithonetypeof debtistohaveanothertypeaswell,andhowlevelsof debtincreaseordecreasedependingontheproductmatrixof anindividual.Forexample,41.4percentof clientswithahomecreditdebtalsohaveapaydayloan,owing,onaverage,£1,441onthisformof credit.
STATISTICS YEARBOOK 2013 25
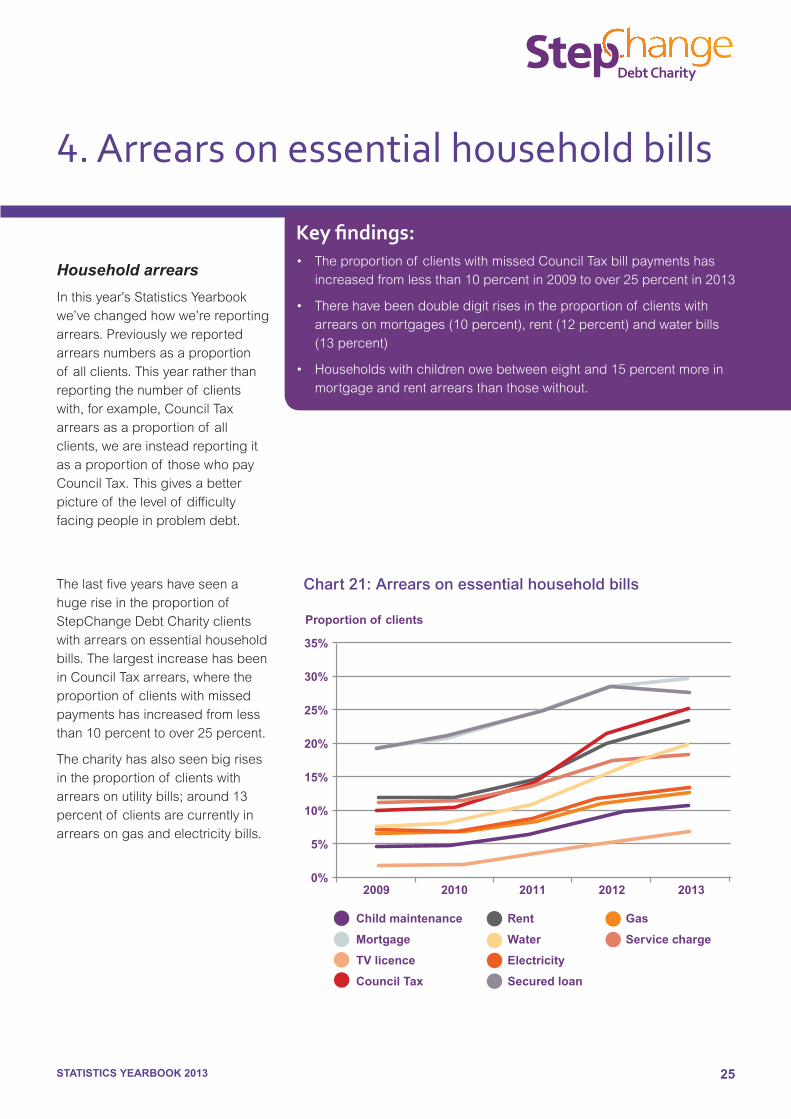
Household arrears
Inthisyear’sStatisticsYearbookwe’vechangedhowwe’rereportingarrears.Previouslywereportedarrearsnumbersasaproportionof allclients.Thisyearratherthanreportingthenumberof clientswith,forexample,CouncilTaxarrearsasaproportionof allclients,weareinsteadreportingitasaproportionof thosewhopayCouncilTax.Thisgivesabetterpictureof thelevelof difficultyfacingpeopleinproblemdebt.
4. Arrears on essential household bills
Key findings:• Theproportionof clientswithmissedCouncilTaxbillpaymentshas
increasedfromlessthan10percentin2009toover25percentin2013
• Therehavebeendoubledigitrisesintheproportionof clientswitharrearsonmortgages(10percent),rent(12percent)andwaterbills(13percent)
• Householdswithchildrenowebetweeneightand15percentmoreinmortgageandrentarrearsthanthosewithout.
Chart 21: Arrears on essential household bills
35%
30%
25%
20%
15%
10%
5%
0%2009 2010 2011 2012 2013
Proportion of clients
Child maintenance
Mortgage
TV licence
Council Tax
Rent
Water
Electricity
Secured loan
Gas
Service charge
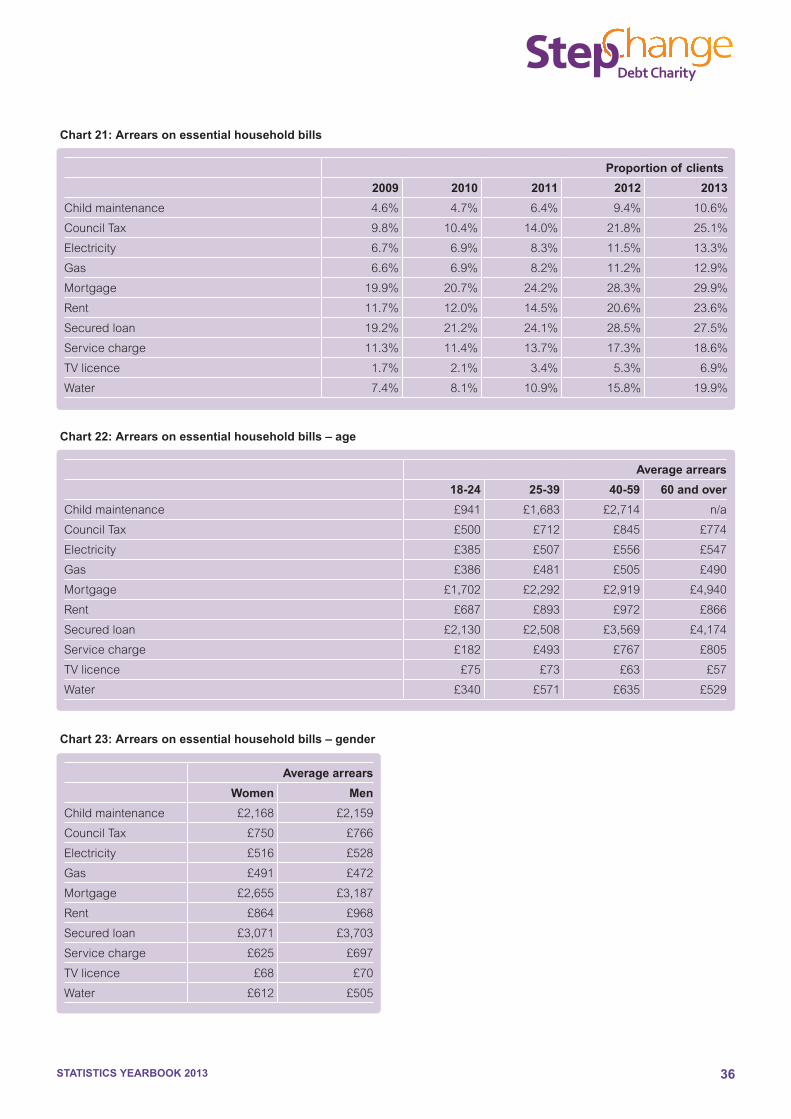
Thelastfiveyearshaveseenahugeriseintheproportionof StepChangeDebtCharityclientswitharrearsonessentialhouseholdbills.ThelargestincreasehasbeeninCouncilTaxarrears,wheretheproportionof clientswithmissedpaymentshasincreasedfromlessthan10percenttoover25percent.
Thecharityhasalsoseenbigrisesintheproportionof clientswitharrearsonutilitybills;around13percentof clientsarecurrentlyinarrearsongasandelectricitybills.
STATISTICS YEARBOOK 2013 26
4. Arrears on household bills
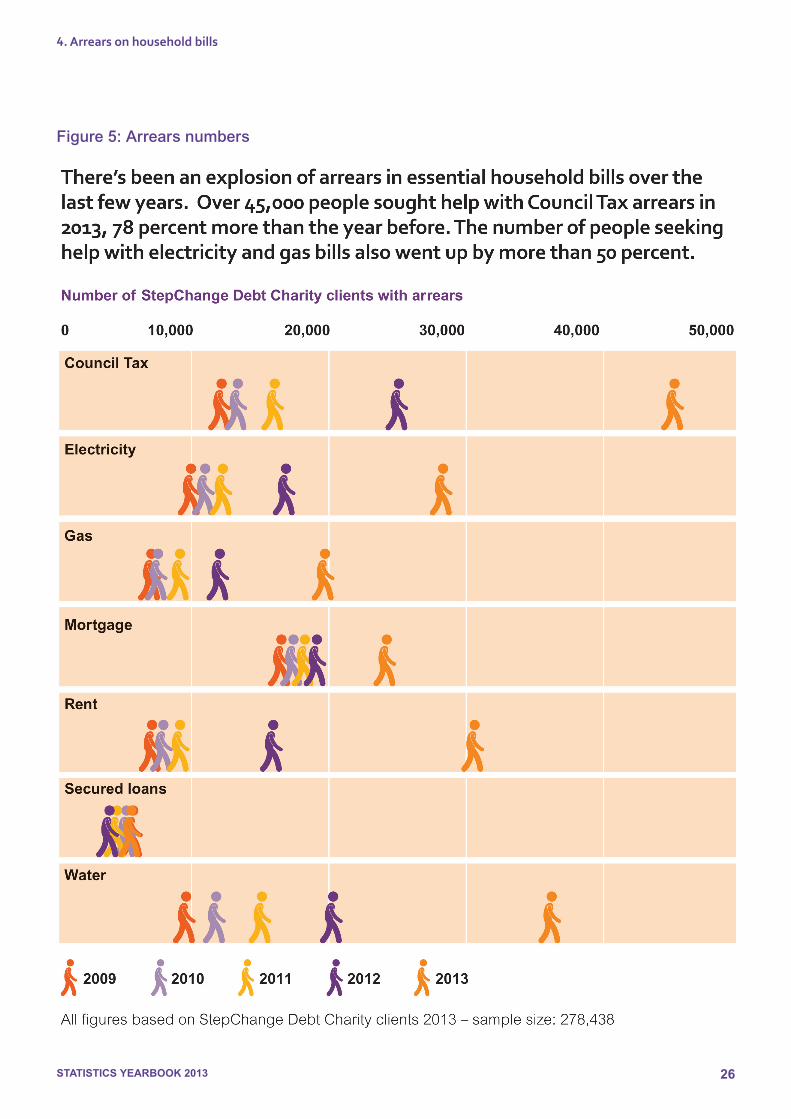
Figure 5: Arrears numbers
STATISTICS YEARBOOK 2013 27
£7,000
£5,000
£4,000
£3,000
£2,000
£1,000
£0
Average arrears
Child m
ainte
nance
Council Ta
xElec
tricit
y
GasMortg
age
Rent
Secure
d loan
Servic
e char
geTV lic
ence
Wat
er
18-24 25-39 40-59 60 and over
£4,000
£3,500
£3,000
£2,500
£2,000
£1,500
£1000
£500
£0
Average arrears
Child m
ainte
nance
Council Ta
xElec
tricit
y
GasMortg
age
Rent
Secure
d loan
Servic
e char
geTV lic
ence
Wat
er
Women Men
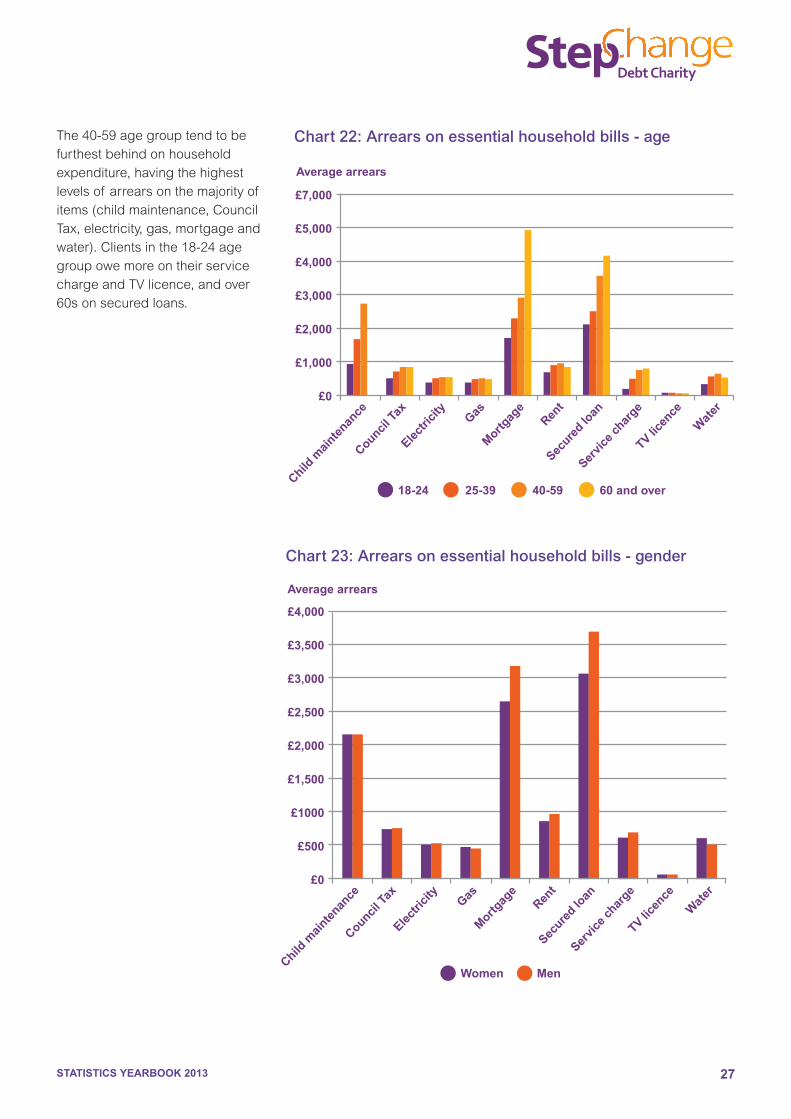
Chart 22: Arrears on essential household bills - age
Chart 23: Arrears on essential household bills - gender
The40-59agegrouptendtobefurthestbehindonhouseholdexpenditure,havingthehighestlevelsof arrearsonthemajorityof items(childmaintenance,CouncilTax,electricity,gas,mortgageandwater).Clientsinthe18-24agegroupowemoreontheirservicechargeandTVlicence,andover60sonsecuredloans.
STATISTICS YEARBOOK 2013 28
4. Arrears on household bills
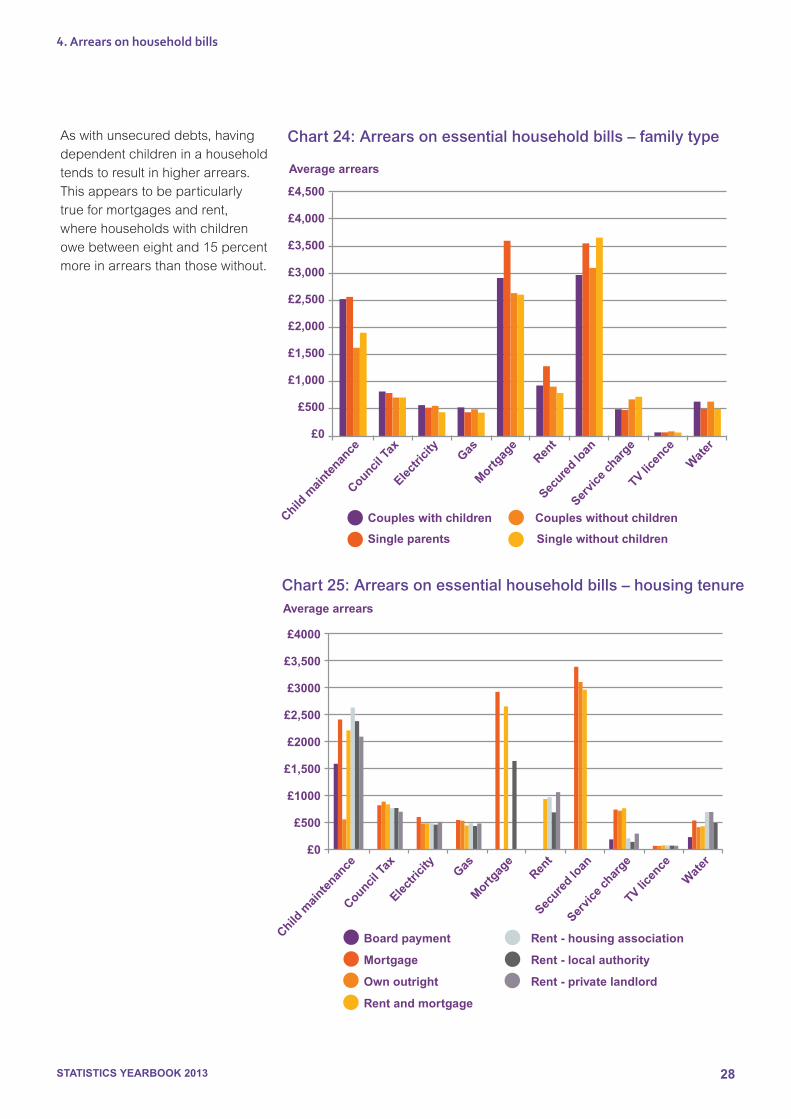
Aswithunsecureddebts,havingdependentchildreninahouseholdtendstoresultinhigherarrears.Thisappearstobeparticularlytrueformortgagesandrent,wherehouseholdswithchildrenowebetweeneightand15percentmoreinarrearsthanthosewithout.
£4,500
£4,000
£3,500
£3,000
£2,500
£2,000
£1,500
£1,000
£500
£0
Average arrears
Child m
ainte
nance
Council Ta
xElec
tricit
y
GasMortg
age
Rent
Secure
d loan
Servic
e char
geTV lic
ence
Wat
er
Couples with children Couples without children
Single parents Single without children
Chart 24: Arrears on essential household bills – family type
Chart 25: Arrears on essential household bills – housing tenure
£4000
£3,500
£3000
£2,500
£2000
£1,500
£1000
£500
£0
Average arrears
Child m
ainte
nance
Council Ta
xElec
tricit
y
GasMortg
age
Rent
Secure
d loan
Servic
e char
geTV lic
ence
Wat
er
Board payment
Mortgage
Own outright
Rent and mortgage
Rent - housing association
Rent - local authority
Rent - private landlord
STATISTICS YEARBOOK 2013 29
5. Social policy
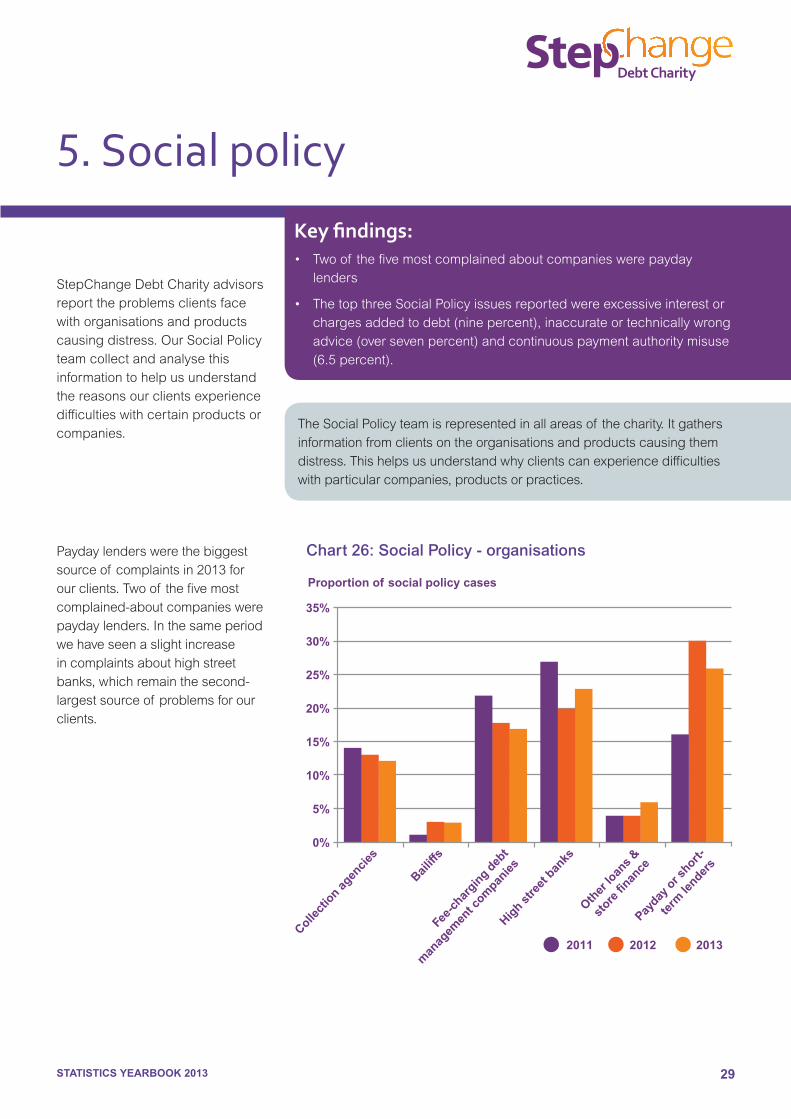
StepChangeDebtCharityadvisorsreporttheproblemsclientsfacewithorganisationsandproductscausingdistress.OurSocialPolicyteamcollectandanalysethisinformationtohelpusunderstandthereasonsourclientsexperiencedifficultieswithcertainproductsorcompanies.
Paydaylenderswerethebiggestsourceof complaintsin2013forourclients.Twoof thefivemostcomplained-aboutcompanieswerepaydaylenders.Inthesameperiodwehaveseenaslightincreaseincomplaintsabouthighstreetbanks,whichremainthesecond-largestsourceof problemsforourclients.
35%
30%
25%
20%
15%
10%
5%
0%
Collect
ion ag
encie
s
Bailiff
sFe
e-ch
argin
g deb
t
man
agem
ent c
ompan
iesHig
h stre
et b
anks
Other
loan
s &
store
finan
cePay
day o
r short-
term
lender
s
2011 2012 2013
Proportion of social policy cases
Key findings:• Twoof thefivemostcomplainedaboutcompanieswerepayday
lenders
• ThetopthreeSocialPolicyissuesreportedwereexcessiveinterestorchargesaddedtodebt(ninepercent),inaccurateortechnicallywrongadvice(oversevenpercent)andcontinuouspaymentauthoritymisuse(6.5percent).
Chart 26: Social Policy - organisations
TheSocialPolicyteamisrepresentedinallareasof thecharity.Itgathersinformationfromclientsontheorganisationsandproductscausingthemdistress.Thishelpsusunderstandwhyclientscanexperiencedifficultieswithparticularcompanies,productsorpractices.
STATISTICS YEARBOOK 2013 30
5. Social policy
10%
9%
8%
7%
6%
5%
4%
3%
2%
1%
0%
Substan
dard
cust
omer
serv
iceMisl
eadin
g advic
eContin
uous pay
men
t
auth
ority m
isuse
Inac
cura
te o
r tec
hnically
wrong ad
vice
Exces
sive i
ntere
st o
r
char
ges ad
ded to
deb
t
Proportion of social policy cases
Chart 27: Social Policy - issues
Dave’sdebtproblemsstartedwiththebreakdownof hismarriagebackin2007.Hehadtoleavethemaritalhomewhilstcontinuingtopayforitandrentatthesametime.Hefinancedalotof thiswithcreditcards.Hetriedtosellthemaritalhomebutputitonthemarketjustasthehousingmarketcollapsed.Heeventuallysolditfora£16,000loss.Ontopof thishehadtochangejobsduetoathreatof redundancyandendedupearningalotlessthanhewasusedto.
“IwaspayingoutmuchmorethanIwasearninguntilitgottoapointwhereIcouldn’tmakepaymentsanymore,whichiswhenIcontactedStepChangeandIwasputontoaDMP.”
Case study Dave
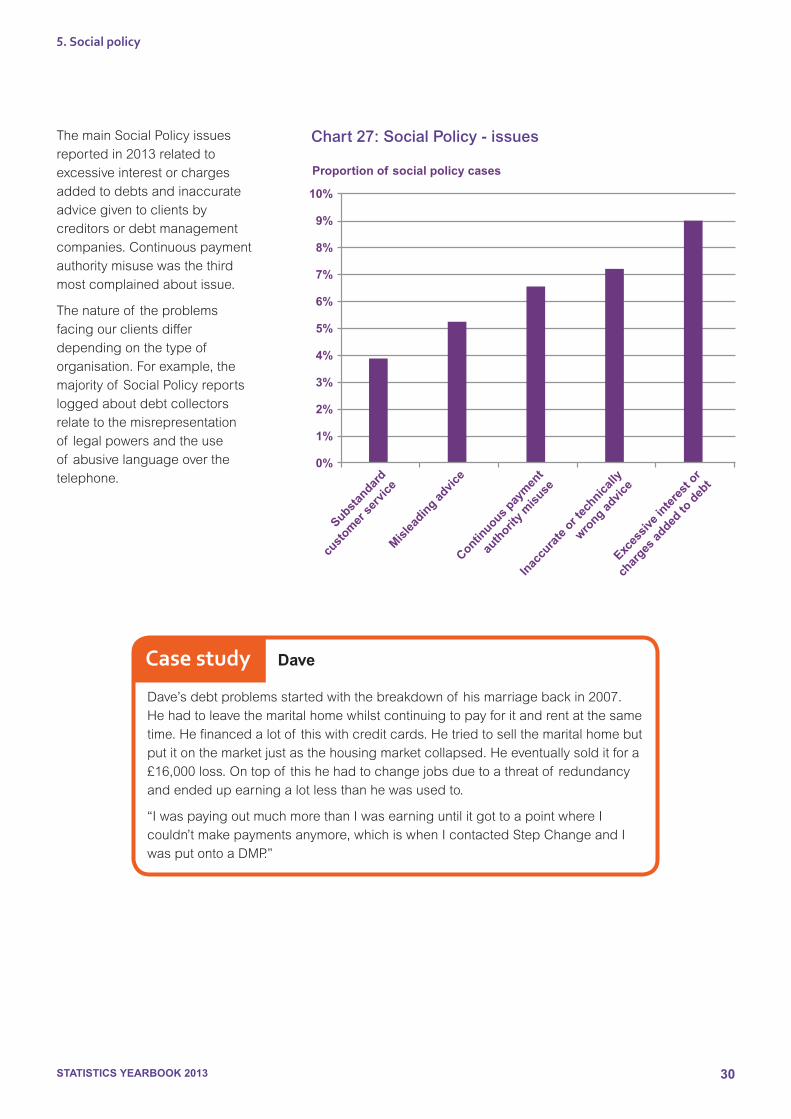
ThemainSocialPolicyissuesreportedin2013relatedtoexcessiveinterestorchargesaddedtodebtsandinaccurateadvicegiventoclientsbycreditorsordebtmanagementcompanies.Continuouspaymentauthoritymisusewasthethirdmostcomplainedaboutissue.
Thenatureof theproblemsfacingourclientsdifferdependingonthetypeof organisation.Forexample,themajorityof SocialPolicyreportsloggedaboutdebtcollectorsrelatetothemisrepresentationof legalpowersandtheuseof abusivelanguageoverthetelephone.

STATISTICS YEARBOOK 2013 31
Figure 6: Social Policy/biggest concerns
STATISTICS YEARBOOK 2013 32
Appendix
2008 2009 2010 2011 2012 2013
Telephone 267,180 335,338 287,120 229,013 222,768 287,165
Online 93,979 152,872 130,472 140,484 147,110 220,698
Overall 361,159 488,210 417,592 369,497 369,878 507,863
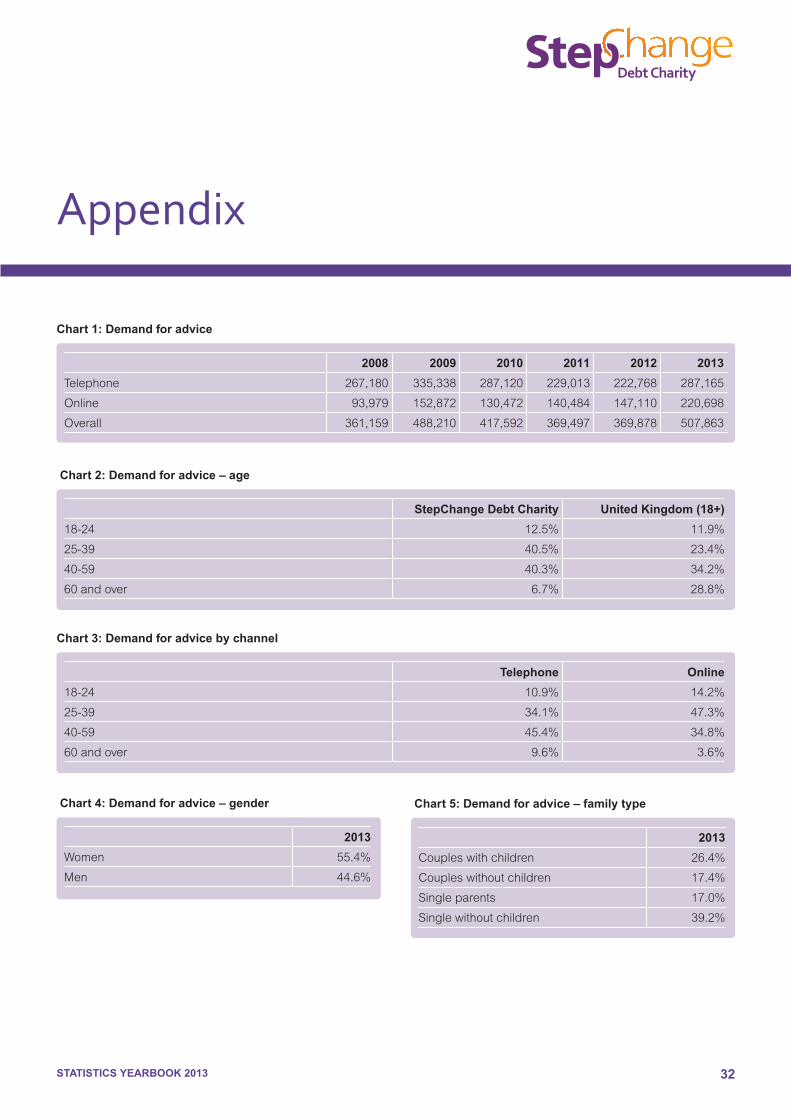
Chart 1: Demand for advice
StepChange Debt Charity United Kingdom (18+)
18-24 12.5% 11.9%
25-39 40.5% 23.4%
40-59 40.3% 34.2%
60andover 6.7% 28.8%
Chart 2: Demand for advice – age
Telephone Online
18-24 10.9% 14.2%
25-39 34.1% 47.3%
40-59 45.4% 34.8%
60andover 9.6% 3.6%
2013
Women 55.4%
Men 44.6%
Chart 4: Demand for advice – gender
2013
Coupleswithchildren 26.4%
Coupleswithoutchildren 17.4%
Singleparents 17.0%
Singlewithoutchildren 39.2%
Chart 5: Demand for advice – family type
Chart 3: Demand for advice by channel
STATISTICS YEARBOOK 2013 33
Appendix
2009 2010 2011 2012 2013
Homeowners 49.1% 48.3% 44.6% 39.0% 33.3%
Renters 50.9% 51.7% 55.4% 61.0% 66.7%
2013
Boardpayment 12.2%
Mortgage 28.8%
Ownoutright 2.1%
Rent&mortgage 2.4%
Rent-housingassociation 11.5%
Rent-localauthority 11.5%
Rent-privatelandlord 31.5%
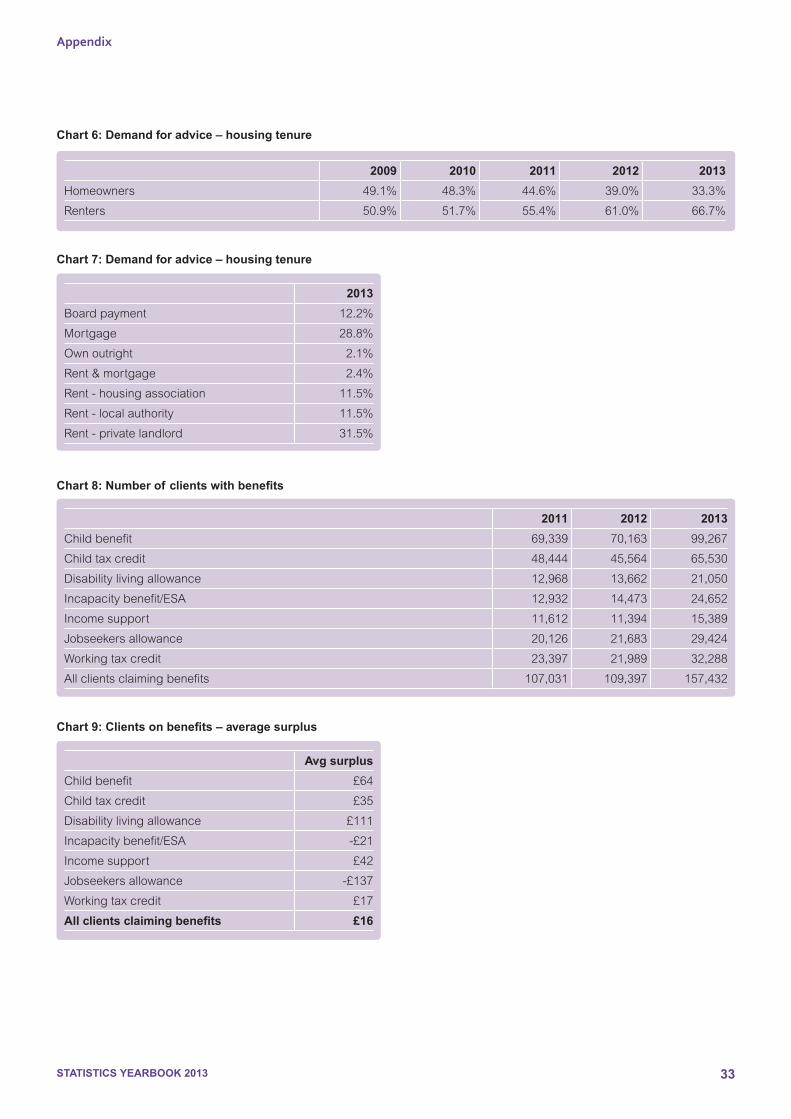
Chart 6: Demand for advice – housing tenure
2011 2012 2013
Childbenefit 69,339 70,163 99,267
Childtaxcredit 48,444 45,564 65,530
Disabilitylivingallowance 12,968 13,662 21,050
Incapacitybenefit/ESA 12,932 14,473 24,652
Incomesupport 11,612 11,394 15,389
Jobseekersallowance 20,126 21,683 29,424
Workingtaxcredit 23,397 21,989 32,288
Allclientsclaimingbenefits 107,031 109,397 157,432
Avg surplus
Childbenefit £64
Childtaxcredit £35
Disabilitylivingallowance £111
Incapacitybenefit/ESA -£21
Incomesupport £42
Jobseekersallowance -£137
Workingtaxcredit £17
All clients claiming benefits £16
Chart 8: Number of clients with benefits
Chart 7: Demand for advice – housing tenure
Chart 9: Clients on benefits – average surplus
STATISTICS YEARBOOK 2013 34
2009 2010 2011 2012 2013
Averageunsecureddebt £24,274 £22,476 £20,023 £17,635 £15,979
Chart 10: Average unsecured debt
Proportion of clients
2011 2012 2013
Under£10,000 40.3% 46.6% 52.0%
£10,000-£19,999 24.8% 24.2% 23.4%
£20,000-£29,999 14.6% 12.7% 11.3%
£30,000-£39,999 8.3% 6.9% 5.7%
£40,000andover 12.1% 9.6% 7.7%
Chart 11: Unsecured debt levels
2009 2010 2011 2012 2013
18-24 £7,524 £6,316 £6,325 £5,471 £4,961
25-39 £20,092 £18,398 £17,678 £15,628 £14,055
40-59 £25,964 £24,902 £24,893 £22,268 £20,552
60andover £26,008 £24,642 £23,937 £22,435 £20,877
Chart 12: Average unsecured debt – age
2013
Women £14,412
Men £17,953
Chart 13: Average unsecured debt – gender
2013
Coupleswithchildren £21,121
Coupleswithoutchildren £20,333
Singleparents £12,450
Singlewithoutchildren £12,134
Chart 14: Average unsecured debt – family type
2013
Employedfull-time £17,016
Employedpart-time £12,835
Full-timecarer £12,295
Lookingafterfamily/home £11,952
Retired £16,600
Self-employed £24,328
Student £7,927
Unemployed £10,259
Chart 15: Average unsecured debt – employment
STATISTICS YEARBOOK 2013 35
Appendix
Number of credit cards Proportion of clients with each number of credit cards
Average credit card debt
1 32.7% £3,0042 25.1% £5,8483 17.1% £9,4594 10.6% £13,3675+ 14.4% £24,607
Chart 16: Types of unsecured debt
Average unsecured debt
Catalogue £1,937Creditcard £9,047Overdraft £1,958Personalloan £9,219Storecard £1,075Homecredit £1,356Paydayloan £1,647
Number of payday loans Proportion of clients with each number of payday loans
Average payday loans debt
1 31.7% £7042 21.5% £1,1143 15.4% £1,6964 10.7% £2,0845+ 20.7% £3,381
Chart 18: Multiple unsecured debts – credit cards
Chart 19: Multiple unsecured debts – payday loans
2012 2013
Average £3,519 £3,293
Totalamount £152,036,642 £189,435,953
Percentof clientsdebtadvised
22.1% 20.6%
Chart 20: Debt to family and/or friends
Chart 17: Number of unsecured debts
Number of debts
Catalogue 2.0Creditcard 2.7Overdraft 1.3Personalloan 1.6Storecard 1.4Homecredit 1.6Paydayloan 3.0
STATISTICS YEARBOOK 2013 36
Proportion of clients
2009 2010 2011 2012 2013
Childmaintenance 4.6% 4.7% 6.4% 9.4% 10.6%
CouncilTax 9.8% 10.4% 14.0% 21.8% 25.1%
Electricity 6.7% 6.9% 8.3% 11.5% 13.3%
Gas 6.6% 6.9% 8.2% 11.2% 12.9%
Mortgage 19.9% 20.7% 24.2% 28.3% 29.9%
Rent 11.7% 12.0% 14.5% 20.6% 23.6%
Securedloan 19.2% 21.2% 24.1% 28.5% 27.5%
Servicecharge 11.3% 11.4% 13.7% 17.3% 18.6%
TVlicence 1.7% 2.1% 3.4% 5.3% 6.9%
Water 7.4% 8.1% 10.9% 15.8% 19.9%
Chart 21: Arrears on essential household bills
Average arrears
18-24 25-39 40-59 60 and over
Childmaintenance £941 £1,683 £2,714 n/a
CouncilTax £500 £712 £845 £774
Electricity £385 £507 £556 £547
Gas £386 £481 £505 £490
Mortgage £1,702 £2,292 £2,919 £4,940
Rent £687 £893 £972 £866
Securedloan £2,130 £2,508 £3,569 £4,174
Servicecharge £182 £493 £767 £805
TVlicence £75 £73 £63 £57
Water £340 £571 £635 £529
Chart 22: Arrears on essential household bills – age
Average arrears
Women Men
Childmaintenance £2,168 £2,159
CouncilTax £750 £766
Electricity £516 £528
Gas £491 £472
Mortgage £2,655 £3,187
Rent £864 £968
Securedloan £3,071 £3,703
Servicecharge £625 £697
TVlicence £68 £70
Water £612 £505
Chart 23: Arrears on essential household bills – gender

37STATISTICS YEARBOOK 2013
Appendix
Average arrears
Couples with children
Couples without children
Single parents Single without children
Childmaintenance £2,524 £2,569 £1,621 £1,912
CouncilTax £822 £800 £712 £711
Electricity £571 £518 £558 £447
Gas £523 £445 £519 £431
Mortgage £2,908 £3,591 £2,633 £2,598
Rent £933 £1,279 £911 £780
Securedloan £2,957 £3,530 £3,097 £3986
Servicecharge £498 £487 £682 £738
TVlicence £69 £59 £73 £69
Water £627 £510 £633 £508
Chart 24: Arrears on essential household bills – family type
Average arrears
Board payment
Mortgage Own outright
Rent & mortgage
Rent - housing
association
Rent - local authority
Rent - private
landlord
Childmaintenance £1,584 £2,412 £550 £2,213 £2,632 £2,379 £2,097
CouncilTax £0 £819 £882 £830 £764 £763 £695
Electricity £0 £596 £474 £481 £485 £451 £503
Gas £0 £534 £523 £455 £470 £415 £478
Mortgage £0 £2,928 £0 £2,666 £0 £1,635 N/A
Rent £0 £0 £0 £920 £959 £678 £1,061
Securedloan £0 £3,390 £3,107 £2,967 £0 £0 £0
Servicecharge £174 £731 £724 £763 £195 £134 £289
TVlicence £0 £59 £61 £67 £75 £72 £68
Water £220 £517 £403 £410 £700 £687 £448
Chart 25: Arrears on essential household bills – housing tenure
Proportion of Social Policy cases
2011 2012 2013
Collectionagencies 14% 13% 12%
Bailiffs 1% 3% 3%
Fee-chargingdebtmanagementcompanies
22% 18% 17%
Highstreetbanks 27% 20% 23%
Otherloans&storefinance 4% 4% 6%
Paydayorshort-termlenders
16% 30% 26%
Chart 26: Social Policy – organisations
Proportion of Social Policy issues
2013
Substandardcustomerservice 4%
Misleadingadvice 5%
Continuouspaymentauthoritymisuse 7%
Inaccurateortechnicallywrongadvice 7%
Excessiveinterestorchargesaddedtodebt 9%
Chart 27: Social Policy - issues
Proportion of clients 2011 2012 2013
Unemployment/redundancy 24.9% 24.9% 23.4%ReducedIncome 23.2% 18.9% 16.4%Lackof budgeting 10.1% 12.3% 13.5%Injury/Illness 9.5% 10.3% 11.3%Separation/divorce 9.7% 9.9% 10.0%Usedcreditforlivingexpenses 3.8% 4.7% 5.4%Increasedpriorityexpenditure 3.1% 3.3% 3.5%IrregularIncome 4.0% 3.8% 3.1%Reducedbenefits 1.0% 1.6% 2.7%Failedbusiness 2.1% 2.1% 2.1%
Figure 1: Reasons for debt
Proportion of clients 2013
Employedfulltime 31.3%Employedparttime 17.0%Fulltimecarer 1.4%
Lookingafterthefamily/home 1.8%Retired 6.5%Self employed 8.6%Student 1.6%Unemployed 31.7%
Figure 2: Employment
Average unsecured debt 2011 2012 2013
Peoplewithamortgage £28,491 £26,304 £24,738Peoplewhoownoutright £20,091 £19,534 £18,536Peoplerentingfromhousingassociation £14,463 £10,999 £11,085Peoplerentingfromlocalauthority £13,075 £10,422 £10,067Peoplerentingfromprivatelandlord £17,275 £14,534 £13,732
Figure 3: Average unsecured debt – housing tenure
Proportion of clients 2013
Catalogue 11%Creditcard 31%Overdraft 14%Personalloan 13%Storecard 3%Homecredit 3%Paydayloan 12%Other 14%
Figure 4: Size of problem by number of debts seen
38STATISTICS YEARBOOK 2013

STATISTICS YEARBOOK 2013 39
2009 2010 2011 2012 2013
Number in arrears
Avg arrears amount
Number in arrears
Avg arrears amount
Number in arrears
Avg arrears amount
Number in arrears
Avg arrears amount
Number in arrears
Avg arrears amount
CouncilTax 13,100 £633 13,353 £675 16,956 £717 25,500 £782 45,561 £756
Electricity 10,939 £408 11,081 £452 12,657 £440 17,443 £488 28,925 £521
Gas 8,368 £361 8,457 £403 9,461 £408 12,356 £455 20,270 £484
Mortgage 17,543 £2,702 17,391 £3,049 18,110 £3,086 18,612 £3,338 24,095 £2,911
Rent 8,246 £723 8,517 £736 10,858 £769 16,942 £828 31,449 £901
Securedloan 5,594 £1,589 5,140 £2,428 4,894 £2,572 4,686 £2,969 5,492 £3,364
Water 10,168 £359 11,014 £404 14,186 £545 20,288 £786 36,410 £574
Figure 5: Arrears numbers
Paydaylenders 1 Excessinterestorchargesaddedtodebt
2 Continuouspaymentauthoritymisuse
3 Irresponsiblelending
4 Intimidating,abusive,orinappropriatelanguageonphonecalls
5 Inaccuracyortechnicallywrongadvice
Highstreetbanks 1 Continuouspaymentauthoritymisuse
2 Inaccuracyortechnicallywrongadvice
3 Refusaltoopenbasicbankaccount
4 Substandardcustomerservice
5 Excessinterestorchargesaddedtodebt
Fee-chargingdebtmanagementcompanies 1 ProvidingmisleadinginformationaboutStepChangeDebtCharity
2 Inaccuracyortechnicallywrongadvice
3 Withholdingornotdisbursingclientpayments
4 Misleadingordeceptiveadvice
5 Excessinterestorchargesforservicesprovided
Debtcollectors 1 Misrepresentinglegalpowers
2 Intimidating,abusive,orinappropriatelanguageonphonecalls
3 Excessinterestorchargesaddedtodebt
4 Excessivephonecallsorcallingatinappropriatetimes
5 Statutorydemandusedinappropriately
Figure 6: Social Policy – biggest concerns
Appendix
© 2014 Foundation for Credit Counselling
Registered Office: Wade House, Merrion Centre, Leeds LS2 8NG
Registered in England No 2757055
Registered Charity No 1016630
For more information about this report:Call: 0207 3914598 Monday to Friday 9am to 6pmEmail: [email protected]: www.stepchange.org
Write to StepChange Debt Charity London Office:6th Floor, Lynton House,7-12 Tavistock SquareLondon WC1H 9LT
For help and advice with problem debts:Call: 0800 138 1111 Monday to Friday 8am to 8pm and Saturday 9am to 4pm
Online: www.stepchange.org


![Jambalaya [yearbook] 1920 plus Medical yearbook 1920](https://img.pdfslide.us/doc/110x75/586cd4c31a28ab0b6b8bf18e/jambalaya-yearbook-1920-plus-medical-yearbook-1920.jpg)