Embed Size (px)
Citation preview

The Statistical Update is also available on the Bank’s website: http://www.bankpng.gov.pg
STATISTICS UPDATE
VVOOLL.. 77 NNOO.. 2233
BBAANNKK OOFF PPAAPPUUAA NNEEWW GGUUIINNEEAA
Fortnight Ending 16 November 2012
In the Statistics Update, the following new information is released: - The average level of total deposits over the fortnight ending 16 November 2012 was 14.8 percent higher
than in the corresponding period last year. During the same period, the average level of total loans outstanding was 9.3 percent higher than in the same period last year (Table 3.1).
- The level of total deposits increased by K195.6 million to K16,819.4 million over the fortnight under review.
Foreign currency deposits increased by K363.4 million, while cheque deposits decreased by K126.2 million, passbook and other demand deposits by K1.4 million and term deposits by K40.2 million. The level of total deposits as at 16 November 2012 was 8.5 percent higher than in the corresponding week last year (Table 3.2).
- The level of total loans increased by K169.8 million to K7,823.7 million over the fortnight under review.
Kina lending increased by K25.5 million and foreign currency lending by K144.3 million. The level of total lending as at 16 November 2012 was 14.8 percent higher than in the corresponding week last year (Table 3.2).
- Total liquid assets decreased by K21.5 million to K8,538.5 million over the fortnight (Table 3.2). This
level represents a liquid asset ratio of 50.8 percent (Table 3.4). - Monetary aggregates and surveys data up to October 2012 (Tables 1.1 – 1.3 & 1.6.1). - Bank of PNG balance sheet up to October 2012 (Table 2.1). - Official interest rates up to 16 November 2012 (Table 2.2). - Commercial banks balance sheet for October 2012 (Table 3.3). - Commercial banks interest rates up to October 2012 (Table 3.6). - Other Financial Institutions balance sheet up to September quarter 2012 (Tables 6.1 - 6.4). - Balance of payments data up to September quarter 2012 (Table 7.1). - Exchange rate data up to 16 November 2012 (Table 7.2). - Government securities transactions data up to 16 November 2012 (Table 8.1).
For further information concerning the content contact: For distribution contact: Manager Information Officer Monetary Policy Unit Public Information Unit Phone: 322 7312 322 7332 Fax: 320 0757 320 0757 E-mail: [email protected]
1.0 Monetary Aggregates & Surveys
1.1 Central Bank Survey (CBS) 31.2 Other Depository Corporations Survey (ODCS) 4
1.3 Depository Corporations Survey (DCS) 51.4 Other Financial Corporations Survey (OFCS) 61.5 Financial Corporation Survey (FCS) 71.6 Monetary and Credit Aggregate Movements
1.6.1 Movements in Monetary Aggregates 8
1.6.2 Movements in Credit Aggregates 8
2.0 Bank of Papua New Guinea
2.1 Balance Sheet 9
2.2 Interest Rates 10
3.0 Commercial Banks
3.1 Principal Assets and Liabilities: Weekly Averages 113.2 Principal Assets and Liabilities: Week Ending Balances 113.3 Balance Sheet 123.4 Liquid Assets 133.5 Lending Commitments 143.6 Interest Rates 14
4.0 Finance Companies and Merchant Banks
4.1 Finance Companies: Balance Sheet 154.2 Finance Companies: Interest Rates 154.3 Merchant Banks: Balance Sheet 164.4 Merchant Banks: Interest Rates 16
5.0 Savings and Loan Societies
5.1 Balance Sheet 17
6.0 Other Financial Institutions
6.1 Superannuation Funds: Balance Sheet 186.2 Life Insurance Companies: Balance Sheet 196.3 Investment Managers: Balance Sheet 206.4 National Development Bank: Balance Sheet 21
7.0 External Sector
7.1 Balance of Payments 227.2 Exchange Rates 237.3 Export Price Index 237.4 Export Volume Index 23
8.0 Other
8.1 Government Securities Transactions 248.2 Private Sector Employment Index 24
TABLE OF CONTENTS
page 2 of 24

Table 1.1: CENTRAL BANK SURVEY (CBS) (K' million)
May-12 Jun-12 Jul-12 Aug-12 Sep-12 Oct-12
Net Foreign Assets 8,416.1 8,257.3 8,012.9 7,835.2 7,990.2 7,992.7
Claims on Nonresidents 8,815.7 8,662.7 8,419.4 8,241.1 8,399.9 8,403.4
Liabilities to Nonresidents 399.6 405.4 406.5 405.9 409.7 410.7
Claims on Other Depository Corporations (ODCs) 7.0 27.1 18.2 8.2 7.9 6.8
Net Claims on Central Government -444.6 -433.7 -572.5 -830.8 -849.6 -910.5
Claims on Central Government 521.5 468.7 477.2 496.0 474.5 626.2
Securities 457.9 462.3 468.7 467.2 467.6 486.8
Loans 63.6 6.4 8.5 28.6 6.2 138.2
Others ... ... ... 0.2 0.7 1.2
Liabilities to Central Government (a) 966.1 902.4 1,049.7 1,326.8 1,324.1 1,536.7
Claims on Other Sectors 17.0 19.5 21.1 17.2 22.3 20.7
Claims on Other Financial Corporations 0.9 0.8 0.7 0.5 0.4 0.2
Claims on Provincial and Local Governments ... ... ... ... ... ...
Claims on Public Nonfinancial Corporations ... ... ... ... ... ...
Claims on Private Sector 16.1 18.7 20.4 16.7 21.9 20.5
Monetary Base 3,975.6 3,686.4 3,531.7 3,461.1 3,530.8 3,610.4
Currency in Circulation 1,486.0 1,606.8 1,618.0 1,591.5 1,580.9 1,554.8
Liabilities to ODCs (b) 2,486.9 2,076.9 1,911.0 1,866.9 1,947.2 2,052.9
Liabilities to Other Sectors 2.7 2.7 2.7 2.7 2.7 2.7
Other Liabilities to ODCs 5,855.1 5,854.8 5,572.7 5,154.4 5,130.3 5,018.2
Deposits and Securities Other than Shares Excluded
from Monetary Base7.2 7.0 6.8 7.1 7.0 6.0
Loans ... ... ... ... ... ...
Financial Derivatives ... ... ... ... ... ...
Shares and Other Equity (c) -1,289.7 -1,156.4 -1,067.4 -1,028.2 -945.7 -979.9
Other Items (Net) -552.7 -521.6 -564.1 -564.5 -551.6 -545.0
(a) The increases in July, August and October 2012 reflects high mineral tax revenue.
(b) Refer to footnote (b) in Table 2.1.
(c) The decreases reflect foreign exchange losses (foreign currency revaluation) resulting from the appreciation of the kina against the US dollar.
page 3 of 24

Table 1.2: OTHER DEPOSITORY CORPORATIONS SURVEY (ODCS) (K' million)
May-12 Jun-12 Jul-12 Aug-12 Sep-12 Oct-12
Net Foreign Assets 850.1 1,140.2 1,205.0 961.5 1,025.6 922.7
Claims on Nonresidents 1,245.7 1,508.7 1,626.6 1,331.4 1,282.9 1,112.0
Liabilities to Nonresidents 395.6 368.5 421.6 369.9 257.3 189.3
Claims on Bank of Papua New Guinea 8,693.4 8,203.5 7,950.2 7,570.3 7,626.0 7,647.0
Currency 315.5 328.6 396.9 409.6 394.5 386.6
Reserve Deposits and Securities Other than Shares (a) 2,487.2 2,077.2 1,961.5 1,867.2 1,947.5 2,053.2
Other Claims on Central Bank (b) 5,890.7 5,797.7 5,591.8 5,293.5 5,284.0 5,207.2
Net Claims on Central Government 861.6 949.1 969.4 949.7 1,148.3 1,022.3
Claims on Central Government 3,929.6 4,005.8 3,945.8 4,096.6 4,094.3 3,966.6
Securities 3,924.2 4,000.3 3,941.3 4,091.7 4,089.9 3,962.7
Loans 3.7 3.5 3.3 3.7 3.2 2.7
Others 1.6 2.0 1.2 1.2 1.2 1.2
Liabilities to Central Government 3,068.0 3,056.7 2,976.4 3,146.9 2,946.0 2,944.3
Claims on Other Sectors 7,975.6 8,143.3 8,200.0 8,447.8 8,578.5 8,673.8
Claims on Other Financial Corporations 33.3 35.3 46.1 45.0 35.9 33.9
Claims on Provincial and Local Governments 0.1 0.1 0.2 0.1 0.1 0.1
Claims on Public Nonfinancial Corporations 134.2 180.5 190.0 456.6 352.5 348.4
Claims on Private Sector 7,808.0 7,927.4 7,963.7 7,946.1 8,190.0 8,291.4
Liabilities to Bank of Papua New Guinea 5.2 5.2 27.3 26.9 5.1 5.1
Transferable Deposits Included in Broad Money 9,458.5 9,295.4 9,545.0 9,231.0 9,200.6 9,314.6
Other Deposits Included in Broad Money 5,504.3 5,636.0 5,584.1 5,613.5 5,621.6 5,628.9
Securities Other than Shares Included in Broad Money 65.2 62.4 63.0 63.5 64.1 64.7
Deposits Excluded from Broad Money 12.8 6.4 6.4 6.5 6.4 7.4
Securities Other than Shares Excluded from Broad
Money 5.3 5.1 5.1 5.2 5.2 5.3
Loans 14.3 11.7 11.7 11.7 11.0 11.0
Financial Derivatives ... ... ... ... ... ...
Insurance Technical Reserves ... ... ... ... ... ...
Shares and Other Equity 4,073.5 4,016.9 4,006.9 4,089.0 4,175.0 4,171.2
Other Items (Net) -758.4 -603.0 -924.9 -1,118.0 -710.6 -942.4
(a) Includes Cash Reserve Requirement (CRR) and Exchange Settlement Account (ESA) deposits of commercial banks.
(b) Includes Central Bank Bills (CBB).
page 4 of 24

TABLE 1.3: DEPOSITORY CORPORATION SURVEY (DCS) (K' million) (a)
May-12 Jun-12 Jul-12 Aug-12 Sep-12 Oct-12
NET FOREIGN ASSETS 9,236.0 9,367.3 9,217.9 8,796.7 9,015.8 8,915.4
Claims on Nonresidents 10,031.1 10,141.3 10,046.0 9,572.5 9,682.8 9,515.4
Liabilities to Nonresidents 795.1 774.0 828.1 775.8 667.0 600.0
DOMESTIC CLAIMS 8,409.6 8,678.2 8,618.0 8,583.9 8,899.5 8,806.3
Net Claims on Central Government 417.0 515.5 396.9 119.0 298.7 111.7
Claims on Central Government 4,451.1 4,474.5 4,423.0 4,592.7 4,568.8 4,592.7
Liabilities to Central Government (b) 4,034.1 3,959.0 4,026.1 4,473.7 4,270.1 4,481.0
Claims on Other Sectors 7,992.6 8,162.7 8,221.1 8,464.9 8,600.8 8,694.6
Claims on Other Financial Corporations
34.3 36.1 46.8 45.5 36.3 34.2
Claims on Provincial and Local Governments
0.1 0.1 0.2 0.1 0.1 0.1
Claims on Public Nonfinancial Corporations
134.2 180.5 190.0 456.6 352.5 348.4
Claims on Private Sector 7,824.0 7,946.0 7,984.1 7,962.7 8,211.9 8,311.9
BROAD MONEY (M3*) 16,210.9 16,281.5 16,422.5 16,099.7 16,082.2 16,185.0
Narrow Money (M1*) 10,633.1 10,577.5 10,770.0 10,416.9 10,390.8 10,486.1
Currency Outside Depository Corporations
1,170.5 1,278.2 1,221.1 1,181.9 1,186.3 1,168.2
Transferable Deposits 9,462.6 9,299.3 9,548.9 9,235.0 9,204.5 9,317.9
Other Deposits 5,512.6 5,641.6 5,589.5 5,619.3 5,627.3 5,634.2
Securities Other than Shares 65.2 62.4 63.0 63.5 64.1 64.7
DEPOSITS EXCLUDED FROM BROAD
MONEY 12.8 6.4 6.4 6.5 6.5 7.4
SECURITIES OTHER THAN SHARES
EXCLUDED FROM BROAD MONEY 5.4 5.2 5.2 5.3 5.3 5.4
LOANS 14.3 11.7 11.7 11.7 11.0 11.0
FINANCIAL DERIVATIVES ... ... ... ... ... ...
INSURANCE TECHNICAL RESERVES ... ... ... ... ... ...
SHARES AND OTHER EQUITY 2,357.9 2,438.7 2,939.5 3,060.9 3,229.3 3,191.3
OTHER ITEMS (NET) (c) -955.7 -698.0 -1,549.4 -1,803.5 -1,419.0 -1,678.4
(a) Beginning in December 2001, the data are based on the extended coverage of the other depository corporations which comprise commercial
banks, merchant banks, finance companies, savings and loans societies and microfinance companies. The depository corporations survey
(DCS) is derived from the central bank survey (Table 1.1) and other depository corporations survey (ODCS) (Table 1.2).
(b) See foot note (a) in Table 1.1.
(c) Other Items (Net) excludes consolidation adjustments which does not correspond to Table 1.1 (CBS) and Table 1.2 (ODCS).
page 5 of 24

Table 1.4: OTHER FINANCIAL CORPORATIONS SURVEY (OFCS) (K' million) (a)
Jun-11 Sep-11 Dec-11 Mar-12 Jun-12 Sep-12
Net Foreign Assets 920.4 642.4 810.0 903.1 811.6 860.6
Claims on Nonresidents (b) 925.5 647.0 819.7 906.1 814.6 863.9
Liabilities to Nonresidents 5.1 4.6 9.7 3.0 3.0 3.3
Claims on Depository Corporations 1,938.2 2,174.2 1,984.9 2,195.8 2,298.2 2,085.6
Currency (c) ... ... ... ... ... ...
Claims on Bank of PNG 1.0 1.0 0.9 1.2 1.2 1.1
Claims on Other Depository Corporations 1,937.2 2,173.2 1,984.0 2,194.6 2,297.0 2,084.5
Deposits 735.1 962.1 721.5 767.6 860.2 648.8
Securities ... ... ... ... ... ...
Shares 1,202.1 1,211.1 1,262.5 1,427.0 1,436.8 1,435.7
Others ... ... ... ... ... ...
Net Claims on Central Government 919.7 950.5 1,236.3 1,299.6 1,303.2 1,531.5
Claims on Central Government 966.1 998.5 1,268.1 1,356.2 1,355.6 1,593.4
Securities 720.4 779.1 1,012.2 1,140.6 1,142.6 1,308.1
Loans 0.7 0.7 1.2 0.7 0.7 0.8
Others 245.0 218.7 254.7 214.9 212.3 284.5
Liabilities to Central Government 46.4 48.0 31.8 56.6 52.4 61.9
Claims on Other Sectors 1,341.6 1,342.9 1,378.0 1,483.6 1,500.0 1,478.3
Claims on Provincial and Local Governments ... ... ... ... ... ...
Claims on Public Nonfinancial Corporations 47.5 50.6 46.1 52.1 58.8 58.6
Claims on Private Sector 1,294.1 1,292.3 1,331.9 1,431.5 1,441.2 1,419.7
Deposits Excluded from Broad Money 14.2 14.4 8.2 7.9 8.1 9.2
Securities Other than Shares Excluded from
Broad Money... ... ... ... ... ...
Loans ... ... ... ... ... ...
Financial Derivatives ... ... ... ... ... ...
Insurance Technical Reserves (d) 5,886.3 5,977.4 6,072.1 6,251.8 6,075.6 6,120.6
Shares and Other Equity 748.1 514.3 807.3 1,010.4 1,303.9 1,363.4
Other Items (Net) -1,529.6 -1,397.1 -1,478.4 -1,388.0 -1,474.6 -1,537.2
(a) The OFC survey is a consolidation of the non-deposit taking institutions' balance sheets. This currently comprises of Licensed
Superannuation Funds, Fund Administrators, Investment Managers,Life Insurance companies, Life Insurance Brokers and the National Development Bank. The coverage excludes other financial institutions outside the Bank's supervision such as the General Insurance
companies. For OFCs, quarterly reports are published as per the periodicity of the data collected.
(b) Investments with nonresident corporations.
(c) Notes and coins (cash in vaults) held by OFCs.
(d) Major liability item of the Superannuation Funds & Life Insurance companies. Refer to footnote (b) in Tables 6.1 and 6.2.
page 6 of 24

TABLE 1.5: FINANCIAL CORPORATIONS SURVEY (FCS) (K' million) (a)
Jun-11 Sep-11 Dec-11 Mar-12 Jun-12 Sep-12
NET FOREIGN ASSETS 9,858.4 10,062.7 10,927.5 10,309.3 10,209.1 9,876.5
Claims on Nonresidents 10,550.0 10,579.4 11,491.2 10,928.2 10,986.1 10,546.8
Liabilities to Nonresidents 691.6 516.7 563.7 618.9 777.0 670.3
DOMESTIC CLAIMS 9,910.5 9,496.0 9,215.8 10,543.3 11,445.5 11,873.0
Net Claims on Central Government 1,061.7 573.5 159.7 1,125.0 1,816.9 1,830.2
Claims on Central Government 4,432.7 4,482.9 5,016.9 5,604.9 5,828.4 6,162.2
Liabilities to Central Government 3,854.8 3,909.4 4,857.3 4,479.8 4,011.5 4,331.9
Claims on Other Sectors 8,848.8 8,922.5 9,056.1 9,418.3 9,628.6 10,042.8
Claims on Provincial and Local Governments 0.3 0.3 0.3 0.1 0.1 0.1
Claims on Public Nonfinancial Corporations 216.6 207.8 201.7 191.8 239.3 411.1
Claims on Private Sector 8,632.0 8,714.4 8,854.1 9,226.4 9,389.2 9,631.6
CURRENCY OUTSIDE FINANCIAL
CORPORATIONS1,077.0 1,074.2 1,188.3 1,085.3 1,277.9 1,186.3
DEPOSITS 11,667.3 12,013.5 12,711.7 13,034.0 13,477.9 13,419.1
SECURITIES OTHER THAN SHARES 61.9 63.5 62.0 64.1 62.4 64.1
LOANS 14.0 12.0 12.0 9.3 6.7 6.0
FINANCIAL DERIVATIVES ... ... ... ... ... ...
INSURANCE TECHNICAL RESERVES 5,886.3 5,947.4 6,072.1 6,251.7 6,075.6 6,120.6
SHARES AND OTHER EQUITY 4,077.8 3,691.7 3,407.5 3,498.9 4,164.4 4,592.6
OTHER ITEMS (NET) (b) -3,015.3 -3,243.7 -3,310.4 -3,090.8 -3,410.3 -3,639.2
(a) Beginning in June 2009, the Financial Corporation Survey (FCS) was constructed with the inclusion of the other financial
corporation (OFC) survey Table 1.4. The FCS is a consolidation of the financial sector's balance sheets comprising of the
Depository Corporation Survey (DCS) Table1.3 and the OFC survey. The FCS provides an indication of the financial sector's
position against resident economic sectors and nonresidents.
(b) Other Items (Net) excludes consolidation adjustments which does not correspond to Table 1.3 (DCS) and Table 1.4 (OFCS).
page 7 of 24

TABLE 1.6.1: MOVEMENTS IN MONETARY AGGREGATES (K' million) (a)
May-12 Jun-12 Jul-12 Aug-12 Sep-12 Oct-12
1.0 NET FOREIGN ASSETS -100.0 131.3 -149.4 -421.2 219.1 -100.4
1.1 Claims on Nonresidents -24.4 110.2 -95.3 -473.5 110.3 -167.4
1.2 Liabilities to Nonresidents 75.6 -21.1 54.1 -52.3 -108.8 -67.0
2.0 DOMESTIC CLAIMS 605.9 268.6 -60.2 -34.1 315.6 -93.2
2.1 Net Claims on Central Government 574.1 98.5 -118.6 -277.9 179.7 -187.0
2.1.1 Claims on Central Government 118.1 23.4 -51.5 169.7 -23.9 23.9
2.1.2 Liabilities to Central Government -456.0 -75.1 67.1 447.6 -203.6 210.9
2.2 Claims on Other Sectors 31.8 170.1 58.4 243.8 135.9 93.8
2.2.1 Claims on Other Financial Corporations 0.5 1.8 10.7 -1.3 -9.2 -2.1
2.2.2 Claims on Provincial and Local Governments ... ... ... ... ... ...
2.2.3 Claims on Public Nonfinancial Corporations -6.9 46.3 9.5 266.6 -104.1 -4.1
2.2.4 Claims on Private Sector 38.2 122.0 38.1 -21.4 249.2 100.0
3.0 DEPOSITS EXCLUDED FROM BROAD MONEY 2.7 - 6.4 ... 0.1 ... 0.9
4.0SECURITIES OTHER THAN SHARES EXCLUDED FROM
BROAD MONEY... - 0.2 ... 0.1 ... 0.1
5.0 LOANS ... - 2.6 ... ... - 0.7 ...
6.0 FINANCIAL DERIVATIVES ... ... ... ... ... ...
7.0 INSURANCE TECHNICAL RESERVES ... ... ... ... ... ...
8.0 SHARES & OTHER EQUITY -186.7 80.8 500.8 121.4 168.4 -38.0
9.0 OTHER ITEMS (NET) 156.3 257.7 -851.4 -254.1 384.3 -259.4
10.0 BROAD MONEY (M3*) (1.0+2.0-3.0-4.0-5.0-6.0-7.0-8.0-9.0) 533.6 70.6 141.0 -322.8 -17.5 102.8
1.0 BROAD MONEY (M3*) (1.1+1.2+1.3) 533.6 70.6 141.0 -322.8 -17.5 102.8
1.1 Narrow Money, M1* (1.1.1+1.1.2) 577.5 -55.6 192.5 -353.1 -26.1 95.3
1.1.1 Curreny Outside Depository Corporations 72.8 107.7 -57.1 -39.2 4.4 -18.1
1.1.2 Transferable Deposits 504.7 -163.3 249.6 -313.9 -30.5 113.4
1.2 Other Deposits -44.5 129.0 -52.1 29.8 8.0 6.9
1.3 Securities Other than Shares 0.6 - 2.8 0.6 0.5 0.6 0.6
ANNUAL GROWTH RATES (%)
M1* 31.0 24.9 27.5 21.4 21.9 18.7
M3* 16.3 13.4 11.5 9.6 10.1 8.0
Domestic Claims (Excl. Claims on Central Government) 6.6 8.0 8.4 12.3 12.7 13.5
(a) Monthly changes, as a result it won't correspond to the Bank's Quarterly Economic Bulletin Table 1.2 (S3), which shows quarterly and annual
changes from the Depository Corporation Survey (DCS).
TABLE 1.6.2: MOVEMENTS IN CREDIT AGGREGATES (K' million) (b)
Sep-11 Dec-11 Mar-12 Jun-12 Sep-12
1.1 Claims on Central Government 50.2 534.0 588.0 223.5 333.8
1.2 Claims on Provincial and Local Government ... ... -0.2 ... ...
1.3 Claims on Nonfinancial Corporation -8.8 -6.1 -9.9 47.5 171.8
1.4 Claims on Private Sector 82.4 139.7 372.3 162.8 242.4
QUARTERLY GROWTH RATES (%)
1.5 Claims on Central Government 1.1 11.9 11.7 4.0 5.7
1.6 Claims on Provincial and Local Government ... ... ... ... ...
1.7 Claims on Nonfinancial Corporation - 4.1 - 2.9 - 4.9 24.8 71.8
1.8 Claims on Private Sector 1.0 1.6 4.2 1.8 2.6
(b) Quarterly movements and changes in Credit aggregates from the Financial Corporation Survey (FCS).
MONEY SUPPLY DETERMINANTS
Page 8 of 24

Table 2.1: BANK OF PAPUA NEW GUINEA BALANCE SHEET (K' million)
May-12 Jun-12 Jul-12 Aug-12 Sep-12 Oct-12
TOTAL LIABILITIES 9,546.9 9,372.8 9,134.9 8,950.4 9,093.0 9,245.2
Currency in Circulation 1,486.0 1,606.8 1,618.0 1,591.5 1,580.9 1,554.8
Deposits 3,463.3 2,989.1 2,970.3 3,203.7 3,281.2 3,598.4
Central Government (a) 966.1 902.4 1,049.7 1,326.8 1,324.1 1,536.7
Other Depository Corporations (b) 2,487.2 2,077.1 1,911.2 1,867.1 1,947.4 2,053.1
Other Sectors 10.0 9.6 9.4 9.8 9.7 8.6
Securities Other than shares 5,853.7 5,853.7 5,572.0 5,152.4 5,128.5 5,016.4
Other Depository Corporations 5,853.6 5,853.6 5,571.9 5,152.3 5,128.4 5,016.3
Other Resident Sectors 0.1 0.1 0.1 0.1 0.1 0.1
Loans ... ... ... ... ... ...
Reverse Repurchase Agreement ... ... ... ... ... ...
Other Depository Corporations ... ... ... ... ... ...
Financial Derivatives ... ... ... ... ... ...
Foreign Liabilities 399.6 405.4 406.5 405.8 409.8 410.7
Other Foreign Liabilities 6.1 12.2 12.4 6.4 6.1 6.1
SDR Allocations (c) 393.5 393.2 394.1 399.4 403.7 404.6
Other Liabilities 57.5 96.0 58.3 53.7 65.9 78.9
Other Depository Corporations 1.2 0.9 0.7 1.8 1.7 1.6
Others 56.3 95.1 57.6 51.9 64.2 77.3
Shares & Other Equity -1,713.2 -1,578.2 -1,490.2 -1,456.7 -1,373.3 -1,414.0
Capital and Reserves (d) -1,713.2 -1,578.2 -1,490.2 -1,456.7 -1,373.3 -1,414.0
TOTAL ASSETS 9,546.9 9,372.8 9,134.9 8,950.4 9,093.0 9,245.2
Foreign Assets 8,816.6 8,663.7 8,420.4 8,242.0 8,401.1 8,404.2
Monetary Gold (e) 136.5 139.9 141.9 146.7 156.3 152.2
SDR Holdings (c) 32.5 32.5 32.6 32.9 33.2 33.3
Foreign Exchange 8,647.5 8,491.3 8,245.9 8,062.4 8,211.6 8,218.7
Claims on Central Government 521.5 468.7 477.2 496.0 474.5 626.2
Securities Other than Shares 457.9 462.3 468.7 467.2 467.6 486.8
Treasury Bills (f) ... ... ... ... ... ...
Inscribed Stocks 457.9 462.3 468.7 467.2 467.6 486.8
Advances (g) 63.6 6.4 8.5 28.8 6.9 139.4
Claims on ODCs 7.0 27.1 18.2 8.2 8.2 6.8
Claims on Other Sectors 16.1 18.7 20.4 16.7 21.9 20.5
Other Financial Corporations ... ... ... ... ... ...
Provincial and Local Governments ... ... ... ... ... ...
Public Nonfinancial Corporations ... ... ... ... ... ...
Private Sector 16.1 18.7 20.4 16.7 21.9 20.5
Shares and Other Equity ... ... ... ... ... ...
Insurance Technical Reserves 1.0 0.8 0.7 0.5 0.4 0.4
Financial Derivatives ... ... ... ... ... ...
Other Assets 0.4 10.1 10.0 0.5 0.2 0.2
Nonfinancial Assets 184.3 183.7 188.0 186.5 186.7 186.9
Fixed Assets 141.4 142.3 142.5 143.3 144.1 145.5
Other Nonfinancial Assets 43.0 41.4 45.5 43.2 42.6 41.4
(a) Refer to footnote (a) in Table 1.1.
(b) The decreases in June, July and August 2012 were mainly due to withdrawals in transferable deposits of commercial banks.
(c) Begining of August 2009, the IMF SDR allocations were reclassified as foreign liabilities and not as 'shares and other equity'
consistent with the methodology in the System of National Accounts (SNA) 2008 and the Balance of Payments Manual, 6th
edition (BPM 6). The IMF member countries pay interest on the SDR allocations and therefore are considered as debt holdings
and not equity. Historical data were revised accordingly.
(d) Refer to footnote (c) in Table 1.1.
(e) From January 2002, gold holdings are valued at market price.
(f) From January 2002, Treasury bills were revised and reported at discount values.
(g) The increase in August and October 2012 reflected borrowing by the Government under the temorary advance facility, while the
declines reflect repayments.
page 9 of 24

Treasury Bills (a) Central Bank Bills (b)
182 days 364 days 28 days 63 days 91 days 182 days
Mar 4.33 4.81 3.02 3.14 3.97 ... 7.00 8.00 6.00
Apr 4.66 5.16 3.04 3.13 3.98 ... 7.00 8.00 6.00
May ... ... 3.13 3.28 4.07 4.70 7.00 8.00 6.00
Jun 4.28 4.73 2.85 3.16 3.66 4.42 7.25 8.25 6.25
Jul 4.23 4.35 2.74 2.97 3.46 4.16 7.50 8.50 6.50
Aug ... ... 2.76 3.01 3.38 4.28 7.50 8.50 6.50
Sep ... ... 2.65 3.01 3.33 4.24 7.75 8.75 6.75
Oct 4.08 4.34 2.69 3.15 3.45 4.14 7.75 8.75 6.75
Nov 4.02 4.32 2.72 3.15 3.47 ... 7.75 8.75 6.75
Dec 3.87 4.18 2.69 3.09 3.31 3.85 7.75 8.75 6.75
2012 - Month ended Jan 3.72 4.15 2.61 3.01 3.19 3.75 7.75 8.75 6.75
Feb ... ... 2.51 2.91 2.93 3.43 7.75 8.75 6.75
Mar 2.90 3.11 2.40 2.79 2.80 3.10 7.75 8.75 6.75
Apr 2.84 2.99 2.29 2.72 2.70 3.09 7.75 8.75 6.75
May 2.55 2.83 1.95 2.39 2.36 2.61 7.75 8.75 6.75
Jun ... 3.05 2.04 2.40 2.49 2.62 7.75 8.75 6.75
Jul ... ... 2.01 2.35 2.56 2.61 7.75 8.75 6.75
Aug 2.85 3.32 2.02 2.41 2.57 2.64 7.75 8.75 6.75
Sep 2.75 3.28 2.02 2.41 2.56 2.70 6.75 7.75 5.75
Oct 2.05 2.99 2.00 2.36 2.50 2.61 6.75 7.75 5.75
2012 - Week ended 26 -Oct 2.05 2.99 2.00 2.36 2.50 2.61 6.75 7.75 5.75
2 -Nov 2.00 2.94 2.00 2.35 2.48 2.60 6.75 7.75 5.75
9 -Nov ... 2.92 2.00 2.33 2.46 2.58 6.75 7.75 5.75
16 -Nov ... 2.87 2.00 2.31 2.44 2.56 6.75 7.75 5.75
(a)
(b)
(c) Monthly benchmark rate announced by the BPNG, which reflects its stance of monetary policy. In June 2011, the Kina Facility Rate (KFR) increased by 25 basis points to 7.25
percent reflecting inflationary pressures arising from strong domestic demand. In July 2011, the KFR was increased further by 25 basis points to 7.50 percent and in September
2011, it was increased by 25 basis points to 7.75 percent. In September 2012, the KFR was reduced by 100 basis points to 6.75 percent .
(d)
The Treasury Bill rate is the weighted average rate at the last auction of the month.
Since 07 September 2005, BPNG has been auctioning separately its Central Bank bills (CBB) from the government's auction of Treasury Bills with the 28 days term. As of 12
May 2006, 63 days term were introduced, while the 91 days term CBB were introduced on 14 May 2008. As of 25 August 2010, new issuance of 182 days term CBB were
introduced.
2011 - Month ended
Table 2.2: BANK OF PAPUA NEW GUINEA INTEREST RATES (%)
Kina
Facility
Rate (c)
Repo
(d)
Reverse
Repo (d)
As a result of the introduction of the term Repo, the weekly Kina Facility was discontinued on 14 April 2003. A margin from the KFR is applied for Repurchase Agreement
Facility (Repo).
page 10 of 24

Year ago Growth Rate (%) (b)
16-Nov-12 9-Nov-12 2-Nov-12 18-Nov-11 2-Nov-12 16-Nov-12
LIABILITIES
Transferable Deposits 11,746.2 11,741.8 11,736.8 9,434.9 24.8 24.5
Cheque Account Deposits 10,688.9 10,686.0 10,682.4 8,531.3 25.6 25.3Passbook & Other Demand Deposits 1,057.3 1,055.8 1,054.4 903.6 16.9 17.0
Other Deposits 4,837.2 4,836.8 4,841.7 5,008.4 - 3.1 - 3.4
Term Deposits 3,760.7 3,762.7 3,764.6 3,813.8 - 0.9 - 1.4Foreign Currency Deposits 1,076.5 1,074.1 1,077.1 1,194.6 - 9.9 - 9.9
Total Deposits 16,583.4 16,578.6 16,578.5 14,443.3 15.1 14.8
ASSETS
Total Lending 7,205.5 7,192.6 7,181.4 6,589.6 9.1 9.3
Kina Lending 6,804.7 6,795.5 6,785.9 6,194.6 9.7 9.8Foreign Currency Lending denominated in kina (c) 400.8 397.1 395.5 395.0 0.1 1.5
Liquid Assets 9,052.5 9,063.2 9,076.7 7,431.7 22.7 21.8
Table 3.2: COMMERCIAL BANKS' PRINCIPAL ASSETS AND LIABILITIES: WEEK ENDING BALANCES (K' million)
Year ago
16-Nov-12 9-Nov-12 2-Nov-12 18-Nov-11
LIABILITIES
Transferable deposits 11,960.0 11,977.5 12,087.6 10,207.6 -127.6 17.2
Cheque Account Deposits 10,828.3 10,853.8 10,954.5 9,248.5 -126.2 17.1Passbook & Other Demand Deposits 1,131.7 1,123.7 1,133.1 959.1 -1.4 18.0
Other Deposits 4,859.4 4,603.2 4,536.2 5,292.1 323.2 - 8.2
Term Deposits 3,664.4 3,672.7 3,704.6 4,145.7 -40.2 - 11.6Foreign Currency Deposits 1,195.0 930.5 831.6 1,146.4 363.4 4.2
Total Deposits 16,819.4 16,580.7 16,623.8 15,499.7 195.6 8.5
ASSETS
Total Lending 7,823.7 7,717.4 7,653.9 6,812.2 169.8 14.8
Kina Lending 7,249.0 7,244.6 7,223.5 6,427.0 25.5 12.8
Foreign Currency Lending
denominated in kina (c) 574.7 472.8 430.4 385.2 144.3 49.2
Liquid Assets 8,538.5 8,427.1 8,560.0 8,359.3 -21.5 2.1
(a)
(b)
period in the previous year.(c)
(d)
(e)
(f) The growth rate is calculated as current week on corresponding week in the previous year.
Year to date weekly average.
The growth is measured by using the current year to date weekly average over the average of the corresponding
Adjusted for foreign exchange fluctuations. Includes balances due from importers under Term Letters of Credit.
Absolute levels.
Table 3.1: COMMERCIAL BANKS' PRINCIPAL ASSETS AND LIABILITIES: WEEKLY AVERAGES (K' million)
Change from the previous fortnight.
Change
over the
Fortnight
(e)
Growth
Rate (%)
(f)
Week Ending (d)
Weekly Average (a)
page 11 of 24

WESTPAC ANZ BSP MAYBANK TOTAL
TOTAL LIABILITIES 3,822.8 5,917.8 11,355.9 488.0 21,584.5
Foreign Liabilities 64.2 1.1 100.3 21.5 187.1
Deposits 2,854.4 4,490.8 9,094.2 280.9 16,720.3
Transferable Deposits 1,621.6 3,105.6 4,288.9 174.3 9,190.4
Other Deposits 1,227.0 1,258.9 2,142.3 106.6 4,734.8
Central Government Deposits 5.8 126.3 2,663.0 ... 2,795.1
Loans ... ... 4.8 ... 4.8
Securities Other than Shares ... ... 79.7 ... 79.7
Financial Derivatives ... ... ... ... ...
Insurance Technical Reserves ... ... ... ... ...
Other Liabilities 201.9 358.7 580.8 42.1 1,183.5
Shares and Other Equity 702.3 1,067.2 1,496.1 143.5 3,409.1
TOTAL ASSETS 3,822.8 5,917.8 11,355.9 488.0 21,584.5
Foreign Assets 387.4 193.2 515.8 6.4 1,102.8
Currency and Deposits with BPNG 379.9 692.2 1,245.1 119.8 2,437.0
Currency 49.2 76.8 250.2 8.0 384.2
Deposits 330.7 615.4 994.9 111.8 2,052.8
Securities Other than Shares 1,421.7 2,739.5 4,403.7 260.0 8,824.9
Loans 1,540.5 2,034.9 3,917.5 97.3 7,590.1
Central Government ... ... 2.7 ... 2.7
Provincial and Local Governments ... ... ... ... 0.0
Public Nonfinancial Corporations 56.0 65.9 205.5 21.0 348.4
Bank of Papua New Guinea ... ... ... ... ...
Other Financial Corporations 3.9 ... 2.4 ... 6.3
Other Depository Corporations ... ... ... ...
Private Sector 1,480.7 1,969.0 3,706.8 76.3 7,232.7
Kina 1,423.7 1,755.0 3,638.0 76.3 6,893.0
Foreign Currency 57.0 213.9 68.8 ... 339.7
Shares and Other Equity ... ... 9.4 ... 9.4
Insurance Technical Reserves ... ... ... 0.1 0.1
Financial Derivatives ... ... ... ... ...
Other Assets 30.4 145.8 238.0 3.8 418.0
Nonfinancial Assets 62.9 112.2 1,026.4 0.6 1,202.1
Note:
(a) Source: Financial Corporations (FC1) - Monthly Statement of Assets and Liabilities.
Table 3.3: COMMERCIAL BANKS' BALANCE SHEET (K' million) (a)
Total deposits and loans do not necessarily equal the amounts in Table 3.2, which shows end of week data, while above captures monthly balances. All months do not end at the end of the week.
End of October 2012
page 12 of 24

Liquid
Assets
(K'm)
Liquid
Assets
Ratio (a)
(%)
Minimum
Requirement
Liquidity Ratio
(%) (b)
Cash Reserve
Requirement
(%) (b)
Free
Reserves
Margin (%)
2011 - Week ended Dec - 30 8594.8 53.9 0.0 6.0 53.9
2012 - Week ended Jan - 20 8959.7 55.0 0.0 6.0 55.0
Jan - 27 8915.3 55.4 0.0 6.0 55.4
Feb - 3 9085.7 56.0 0.0 6.0 56.0
Feb - 10 9013.9 54.7 0.0 6.0 54.7
Feb - 17 9032.3 56.1 0.0 6.0 56.1
Feb - 24 9192.5 56.8 0.0 6.0 56.8
Mar - 2 8912.4 54.8 0.0 6.0 54.8
Mar - 9 8993.1 55.2 0.0 7.0 55.2
Mar - 16 9178.1 56.3 0.0 7.0 56.3
Mar - 23 9289.5 56.8 0.0 7.0 56.8
Mar - 30 9176.0 56.0 0.0 7.0 56.0
Apr - 5 9246.3 56.7 0.0 7.0 56.7
Apr - 13 9407.1 57.1 0.0 7.0 57.1
Apr - 20 9566.7 56.9 0.0 7.0 56.9
Apr - 27 9530.1 57.1 0.0 7.0 57.1
May - 4 9663.0 57.7 0.0 7.0 57.7
May - 11 9808.3 58.2 0.0 7.0 58.2
May - 18 9835.9 58.4 0.0 7.0 58.4
May - 25 9918.3 58.6 0.0 7.0 58.6Jun - 1 9626.8 58.0 0.0 7.0 58.0Jun - 8 9247.9 55.3 0.0 8.0 55.3Jun - 15 9345.4 55.4 0.0 8.0 55.4Jun - 22 9242.4 55.2 0.0 8.0 55.2Jun - 29 9318.8 55.3 0.0 8.0 55.3Jul - 6 9204.2 55.0 0.0 8.0 55.0Jul - 13 9204.4 55.2 0.0 8.0 55.2Jul - 20 9001.4 53.6 0.0 8.0 53.6Jul - 27 9013.6 53.2 0.0 8.0 53.2Aug - 3 8885.0 53.0 0.0 8.0 53.0Aug - 10 8868.3 52.4 0.0 8.0 52.4Aug - 17 8714.9 51.5 0.0 8.0 51.5Aug - 24 8981.5 53.0 0.0 8.0 53.0Aug - 31 8802.9 52.0 0.0 8.0 52.0Sep - 7 8895.2 52.2 0.0 8.0 52.2Sep - 14 8807.6 52.2 0.0 8.0 52.2Sep - 21 8891.2 52.8 0.0 8.0 52.8Sep - 28 8903.8 53.5 0.0 8.0 53.5Oct - 5 9033.6 53.2 0.0 8.0 53.2Oct - 12 8912.0 52.7 0.0 8.0 52.7Oct - 19 8750.1 51.8 0.0 8.0 51.8Oct - 26 8621.5 51.2 0.0 8.0 51.2Nov - 2 8560.0 51.5 0.0 8.0 51.5Nov - 9 8427.1 50.8 0.0 8.0 50.8Nov - 16 8538.5 50.8 0.0 8.0 50.8
(a) The effective liquid assets ratio is the ratio of approved liquid assets, excluding Cash Reserve Requirement (CRR) but including
Repo deposits with BPNG, to total deposits and other prescribed liabilities.
(b) The MLAR is expressed as a percentage of total deposits and other prescribed liabilities of commercial banks.
CRR is a non-interest bearing deposit of commercial banks held at the Central Bank and is expressed as a percentage of
total deposits and other prescribed liabilities. As of 1 October 2010, the CRR was increased from 3 percent to 4 percent of
total deposits and other prescribed liabilities, while the MLAR was reduced from 25 percent to zero percent. On 11 July 2011,
the CRR was increased from 4 percent to 5 percent and again on 8 August 2011 to 6 percent. On 5 March 2012, the CRR
was increased to 7 percent and to 8 percent on 8 June 2012 .
Table 3.4: COMMERCIAL BANK LIQUID ASSETS
page 13 of 24

Jun-11 Sep-11 Dec-11 Mar-12 Jun-12 Sep-12
New and Increased Commitments (K'm) 456.0 246.2 250.6 350.0 342.2 355.0
Cancelled or Reduced Commitments (K'm) -139.0 -178.1 -315.3 -96.2 -203.7 -187.2
Change in Total Outstanding (K'm) 317.0 68.1 -64.7 253.8 138.5 167.8
Total Outstanding (K'm) 7683.4 7751.5 7686.8 7940.6 8079.1 8246.9
Annual percentage Change (%) 11.7 13.1 9.5 7.8 5.2 6.4
Utilisation of Credit Limits (%) 102.4 102.6 100.7 100.4 99.4 101.5
May-12 Jun-12 Jul-12 Aug-12 Sep-12 Oct-12
(%) (%) (%) (%) (%) (%)
Lending 10.70 10.68 10.69 10.67 10.54 10.70
Deposits
Cheque 0.09 0.08 0.09 0.08 0.08 0.01
Other demand 0.34 0.34 0.35 0.37 0.36 0.37
Term Deposits
less than 30 days 1.24 1.21 1.23 1.11 1.10 1.00
30 days to 89 days 1.72 1.58 1.40 1.39 1.37 1.36
90 days to 182 days 2.51 2.03 1.87 1.92 2.17 2.08
183 days to 365 days 1.99 2.22 2.19 1.70 1.66 2.36
366 days and over 2.88 1.67 1.67 2.50 2.92 2.09
Total 0.47 0.44 0.43 0.40 0.40 0.36
Indicator Lending Rate (ILR) Spread 11.45 - 12.20 11.45 - 12.20 11.45 - 12.20 11.45 - 12.20 11.45 - 12.20 11.45 - 12.20
Table 3.5: COMMERCIAL BANKS' LENDING
(a) Weighted averages on total portfolio.
Table 3.6: COMMERCIAL BANKS' INTEREST RATES (a)
page 14 of 24
Oct-11 Sep-12 Oct-12
K'm K'm K'm
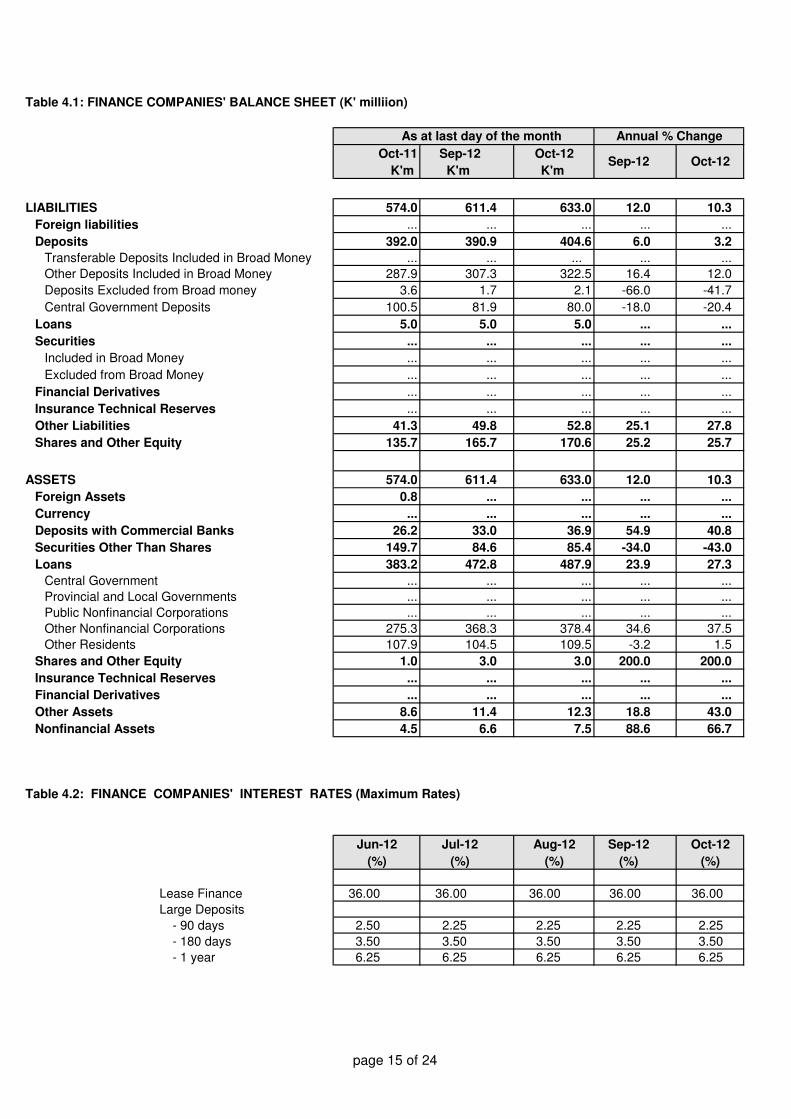
LIABILITIES 574.0 611.4 633.0 12.0 10.3
Foreign liabilities ... ... ... ... ...
Deposits 392.0 390.9 404.6 6.0 3.2
Transferable Deposits Included in Broad Money ... ... ... ... ...
Other Deposits Included in Broad Money 287.9 307.3 322.5 16.4 12.0
Deposits Excluded from Broad money 3.6 1.7 2.1 -66.0 -41.7
Central Government Deposits 100.5 81.9 80.0 -18.0 -20.4
Loans 5.0 5.0 5.0 ... ...
Securities ... ... ... ... ...
Included in Broad Money ... ... ... ... ...
Excluded from Broad Money ... ... ... ... ...
Financial Derivatives ... ... ... ... ...
Insurance Technical Reserves ... ... ... ... ...
Other Liabilities 41.3 49.8 52.8 25.1 27.8
Shares and Other Equity 135.7 165.7 170.6 25.2 25.7
ASSETS 574.0 611.4 633.0 12.0 10.3
Foreign Assets 0.8 ... ... ... ...
Currency ... ... ... ... ...
Deposits with Commercial Banks 26.2 33.0 36.9 54.9 40.8
Securities Other Than Shares 149.7 84.6 85.4 -34.0 -43.0
Loans 383.2 472.8 487.9 23.9 27.3
Central Government ... ... ... ... ...
Provincial and Local Governments ... ... ... ... ...
Public Nonfinancial Corporations ... ... ... ... ...
Other Nonfinancial Corporations 275.3 368.3 378.4 34.6 37.5
Other Residents 107.9 104.5 109.5 -3.2 1.5
Shares and Other Equity 1.0 3.0 3.0 200.0 200.0
Insurance Technical Reserves ... ... ... ... ...
Financial Derivatives ... ... ... ... ...
Other Assets 8.6 11.4 12.3 18.8 43.0
Nonfinancial Assets 4.5 6.6 7.5 88.6 66.7
Jun-12 Jul-12 Aug-12 Sep-12 Oct-12
(%) (%) (%) (%) (%)
Lease Finance 36.00 36.00 36.00 36.00 36.00
Large Deposits
- 90 days 2.50 2.25 2.25 2.25 2.25
- 180 days 3.50 3.50 3.50 3.50 3.50
- 1 year 6.25 6.25 6.25 6.25 6.25
Table 4.2: FINANCE COMPANIES' INTEREST RATES (Maximum Rates)
Table 4.1: FINANCE COMPANIES' BALANCE SHEET (K' milliion)
As at last day of the month Annual % Change
Sep-12 Oct-12
page 15 of 24

Oct-11 Sep-12 Oct-12
K'm K'm K'm
LIABILITIES 425.4 469.3 470.0 11.7 10.5
Foreign liabilities ... ... ... ... ...
Deposits 229.5 274.4 275.9 21.7 20.2
Transferable Deposits Included in Broad Money ... ... ... ... ...
Other Deposits included in Broad Money 222.9 269.2 269.8 23.3 21.0
Deposits Excluded from Broad Money 6.6 5.2 6.1 -26.8 -7.6
Central Government Deposits ... ... ... ... ...
Loans (a) 12.0 6.0 6.0 -50.0 -50.0
Securities ... ... ... ... ...
Included in Broad Money ... ... ... ... ...
Excluded from Broad Money ... ... ... ... ...
Financial Derivatives ... ... ... ... ...
Insurance Technical Reserves ... ... ... ... ...
Other Liabilities 42.5 34.6 31.5 -20.1 -25.9
Shares and Other Equity 141.4 154.3 156.6 10.6 10.7
ASSETS 425.4 469.3 470.0 11.7 10.5
Foreign Assets 6.8 1.3 9.0 -53.6 32.4
Currency ... ... ... ... ...
Deposits with Commercial Banks 20.9 26.9 13.5 -34.9 -35.4
Securities Other Than Shares 69.4 86.7 94.1 58.8 35.6
Loans 263.4 286.2 283.6 11.5 7.7
Central Government ... 0.1 0.1 ... ...
Provincial and Local Governments ... 0.1 0.1 ... ...
Public Nonfinancial Corporations 0.3 ... ... ... ...
Other Nonfinancial Corporations 230.6 266.0 264.4 19.5 14.7
Other Residents 32.5 20.0 19.0 -31.3 -41.5
Shares and Other Equity 25.8 25.8 25.8 ... ...
Insurance Technical Reserves ... ... ... ... ...
Financial Deratives ... ... ... ... ...
Other Assets 8.9 9.5 11.0 2.1 23.6
Nonfinancial Assets 30.2 32.9 33.0 4.4 9.3
Jun-12 Jul-12 Aug-12 Sep-12 Oct-12
(%) (%) (%) (%) (%)
Lease Finance 25.00 25.00 25.00 25.00 25.00
Large Deposits
- 90 days 1.75 1.75 1.75 1.75 1.75
- 180 days 2.00 2.00 2.00 2.00 2.00
- 1 year 2.50 2.50 2.50 2.50 2.50
Table 4.4: MERCHANT BANKS' INTEREST RATES (Maximum Rates)
Table 4.3: MERCHANT BANKS' BALANCE SHEET (K' million)
As at last day of the month Annual % Change
Sep-12 Oct-12
page 16 of 24

Table 5.1: SAVINGS AND LOAN SOCIETIES BALANCE SHEET (a) (K'million)
Sep-12 Oct-12
LIABILITIES 816.6 816.5 824.0 823.9 0.9 ...
Foreign Liabilities ... ... ... ... ... ...
Deposits 374.6 375.1 373.4 373.9 -0.5 0.1
Transferable Deposits Included in Broad Money 0.2 0.2 0.2 0.2 ... ...
Other Deposits Included in Broad Money 374.4 374.9 373.2 373.7 -0.5 0.1
Deposits Excluded from Broad Money ... ... ... ... ... ...
Central Government Deposits ... ... ... ... ... ...
Loans ... ... ... ... ... ...
Securities ... ... ... ... ... ...
Included in Broad Money ... ... ... ... ... ...
Excluded from Broad Money ... ... ... ... ... ...
Financial Derivatives ... ... ... ... ... ...
Insurance Technical Reserves ... ... ... ... ... ...
Other Liabilities 27.5 27.6 28.5 28.2 3.3 -1.1
Shares and Other Equity 414.5 413.9 422.2 421.8 2.0 -0.1
ASSETS 816.6 816.5 824.0 823.9 0.9 ...
Foreign Assets 0.3 0.3 0.3 0.3 ... ...
Currency 0.8 0.8 0.9 0.9 12.5 ...
Deposits with Commercial Banks 79.1 80.2 64.5 64.2 -19.6 -0.5
Securities Other than Shares 93.0 93.0 114.5 115.0 23.1 0.4
Loans 201.3 200.6 200.9 200.4 0.1 -0.2
Central Government ... ... ... ... ... ...
Provincial and Local Governments ... ... ... ... ... ...
Public Nonfinancial Corporations ... ... ... ... ... ...
Other Nonfinancial Corporations ... ... ... ... ... ...
Private (household) 201.3 200.6 200.9 200.4 0.1 -0.2
Shares and Other equity 312.7 312.7 317.3 317.3 1.5 ...
Insurance Technical Reserves 0.1 0.1 0.1 0.1 ... ...
Financial Derivatives ... ... ... ... ... ...
Other Assets 19.3 19.2 14.5 14.6 -24.5 0.7
Nonfinancial Assets 110.0 109.6 111.0 111.1 1.3 0.1
(a) The reporting frequency has changed from bi-annual to quarterly as of March 2004 and further changed from quarterly to monthly
as of March 2010.
Monthly % Change
Jul-12 Aug-12 Sep-12 Oct-12
page 17 of 24

Quarterly
% Change
Sep-11
LIABILITIES 6,216.0 6,333.8 6,725.6 6,772.2 6,907.3 2.0
Foreign Liabilities ... ... ... ... ... ...
Securities Excluded from Broad Money ... ... ... ... ... ...
Loans ... ... ... ... ... ...
Financial Derivatives ... ... ... ... ... ...
Insurance Technical Reserves (b) 5,935.2 6,015.2 6,199.7 6,022.7 6,074.6 0.9
Other Liabilities 91.7 74.8 135.6 128.8 155.2 20.5
Shares and Other Equity (c) 189.1 243.8 390.3 620.7 677.5 9.2
ASSETS 6,216.0 6,333.8 6,725.6 6,772.2 6,907.3 2.0
Foreign Assets (d) 620.5 785.4 873.9 783.7 838.7 7.0
Currency ... ... ... ... ... ...
Deposits with Commercial Banks 837.3 625.2 662.2 716.2 524.8 -26.7
Securities Other than Shares 774.8 1,008.0 1,136.4 1,136.5 1,336.3 ...
Loans 129.1 170.1 129.2 130.1 130.2 0.1
Shares and Other Equity 2,253.2 2,286.6 2,431.6 2,447.2 2,512.4 2.7
Insurance Technical Reserves ... ... ... ... ... ...
Financial Derivatives ... ... ... ... ... ...
Other Assets 521.8 344.2 410.0 412.1 372.4 -9.6
Nonfinancial Assets 1,079.3 1,114.3 1,082.3 1,146.4 1,192.5 4.0
Fixed Assets 532.0 571.2 561.5 622.4 619.2 -0.5
Other Nonfinancial Assets (e) 547.3 543.1 520.8 524.0 573.3 9.4
(a) The reporting frequency is on a quarterly basis.
(b) The major liability item of the Superannuation Funds. These are contributors' funds which are considered assets of the
household sector rather than assets of the superannuation funds. The Superannuation Funds manage these funds for investments.
(c) The increases in December 2011, March and June 2012 were mainly due to high net profits.
(d)
(e)
Mar-12
Consists of nonfinancial assets other than fixed assets, such as investments in property and land.
Claims on nonresident sectors.
Table 6.1: SUPERANNUATION FUNDS BALANCE SHEET (a) (K'million)
Dec-11Sep-11 Sep-12Jun-12
page 18 of 24

Quarterly
% Change
Sep-12
LIABILITIES 369.1 415.8 428.0 406.0 404.2 -0.4
Foreign Liabilities 1.5 ... ... ... ... ...
Securities Excluded from Broad Money ... ... ... ... ... ...
Loans ... ... ... ... ... ...
Financial Derivatives ... ... ... ... ... ...
Insurance Technical Reserves (b) 41.6 56.6 51.9 47.1 45.7 -3.0
Net Equity of Households in Life Insurance Reserves
40.6 45.2 38.9 34.8 33.3 -4.3
Prepaid Premiums & Reserves Against Outstanding Claims
1.0 11.4 13.0 12.3 12.4 0.8
Other Liabilities 76.7 86.2 43.3 43.3 36.1 -16.6
Shares and Other Equity 249.3 273.0 332.8 315.6 322.4 2.2
ASSETS 369.1 415.8 428.0 406.0 404.2 -0.4
Foreign Assets (c) 23.6 27.6 31.9 22.6 25.1 11.1
Currency ... ... ... ... ... ...
Deposits with Commercial Banks 30.7 38.1 39.6 38.1 39.8 4.5
Securities Other than Shares 4.2 4.2 4.2 4.2 4.3 2.4
Loans 0.2 0.2 0.2 0.2 0.2 ...
Shares and Other Equity 43.7 39.3 45.9 43.1 44.0 2.1
Insurance Technical Reserves 19.0 20.0 13.2 6.8 4.0 -41.2
Financial Derivatives ... ... ... ... ... ...
Other Assets (d) 34.8 66.4 73.0 69.6 65.1 -6.5
Nonfinancial Assets 212.9 220.0 220.0 221.4 221.7 0.1
Fixed Assets 193.8 200.1 200.2 202.2 203.3 0.5
Other Nonfinancial Assets (e) 19.1 19.9 19.8 19.2 18.4 -4.2
(a)
(b) The major liability item of the Life Insurance companies. These are contributors' funds which are considered
assets of the household sector rather than assets of the life insurance companies that manage these funds.
(c)
(d)
(e)
Mar-12Dec-11
Table 6.2: LIFE INSURANCE COMPANIES BALANCE SHEET (a) (K'million)
Sep-12Jun-12
Consists of nonfinancial assets other than fixed assets, such as investments in property and land.
Sep-11
The reporting frequency is on a quarterly basis.
Claims on nonresident sectors.
The increase in December 2011 and March 2012 were mainly settlement accounts from Other Financial Corporations.
page 19 of 24

Quarterly
% Change
Sep-12
LIABILITIES 54.0 46.8 46.3 46.1 47.8 3.7
Foreign Liabilities ... ... ... ... ... ...
Securities Excluded from Broad Money ... ... ... ... ... ...
Loans ... ... ... ... ... ...
Financial Derivatives ... ... ... ... ... ...
Insurance Technical Reserves ... ... ... ... ... ...
Other Liabilities 4.1 5.7 5.7 5.4 5.6 3.7
Shares and Other Equity 49.9 41.1 40.6 40.7 42.2 3.7
ASSETS 54.0 46.8 46.3 46.1 47.8 3.7
Foreign Assets (b) 2.9 6.8 0.3 0.1 0.1 ...
Currency ... ... ... ... ... ...
Deposits with Commercial Banks 16.8 11.5 10.5 12.5 6.5 -48.0
Securities Other than Shares ... ... ... 1.9 2.0 5.3
Loans 5.7 5.4 5.4 5.5 5.4 -1.8
Shares and Other Equity 21.0 15.3 19.6 19.7 17.1 -13.2
Insurance Technical Reserves ... ... ... ... ... ...
Financial Derivatives ... ... ... ... ... ...
Other Assets 6.9 7.1 9.9 5.8 16.1 177.6
Nonfinancial Assets 0.7 0.7 0.6 0.6 0.6 ...
Fixed Assets 0.7 0.7 0.6 0.6 0.6 ...
Other Nonfinancial Assets ... ... ... ... ... ...
(a)
(b)
Jun-12Dec-11
Table 6.3: INVESTMENT MANAGERS' BALANCE SHEET (a) (K'million)
Sep-12Mar-12
Investment Managers' claims on nonresident sectors.
The reporting frequency is on a quarterly basis.
Sep-11
page 20 of 24

Quarterly %
Change
Sep-12
LIABILITIES 252.9 263.3 267.1 329.2 345.8 5.0
Foreign Liabilities ... ... ... ... ... ...
Deposits Excluded in Broad Money (b) 14.4 8.2 7.9 8.1 9.2 13.6
Securities Excluded from Broad Money ... ... ... ... ... ...
Loans ... ... ... ... ... ...
Financial Derivatives ... ... ... ... ... ...
Insurance Technical Reserves ... ... ... ... ... ...
Other Liabilities 25.3 28.3 30.5 31.2 34.7 11.2
Shares and Other Equity (c) 213.2 226.8 228.7 289.9 301.9 4.1
ASSETS 252.9 263.3 267.1 329.2 345.8 5.0
Foreign Assets ... ... ... ... ... ...
Currency ... ... ... ... ... ...
Deposits with Commercial Banks 25.6 21.3 18.9 64.3 54.6 -15.1
Securities Other than Shares ... ... ... ... ... ...
Loans 116.4 121.9 120.7 133.7 150.4 12.5
Shares and Other Equity ... ... ... ... ... ...
Insurance Technical Reserves ... ... ... ... ... ...
Financial Derivatives ... ... ... ... ... ...
Other Assets 29.1 31.9 33.1 33.4 35.9 7.5
Nonfinancial Assets 81.8 88.2 94.4 97.8 104.9 7.3
Fixed Assets 81.8 88.2 94.4 97.8 104.9 7.3
Other Nonfinancial Assets ... ... ... ... ... ...
(a)
(b)
(c)
Dec-11
The reporting frequency is on a quarterly basis.
Funds placed with NDB as collateral for loans taken. The decline in December 2011 reflects low value of collateral.
Consists of general reserves, retained earnings and current year results.
Jun-12 Sep-12Sep-11
Table 6.4: NATIONAL DEVELOPMENT BANK BALANCE SHEET (a) (K'million)
Mar-12
page 21 of 24
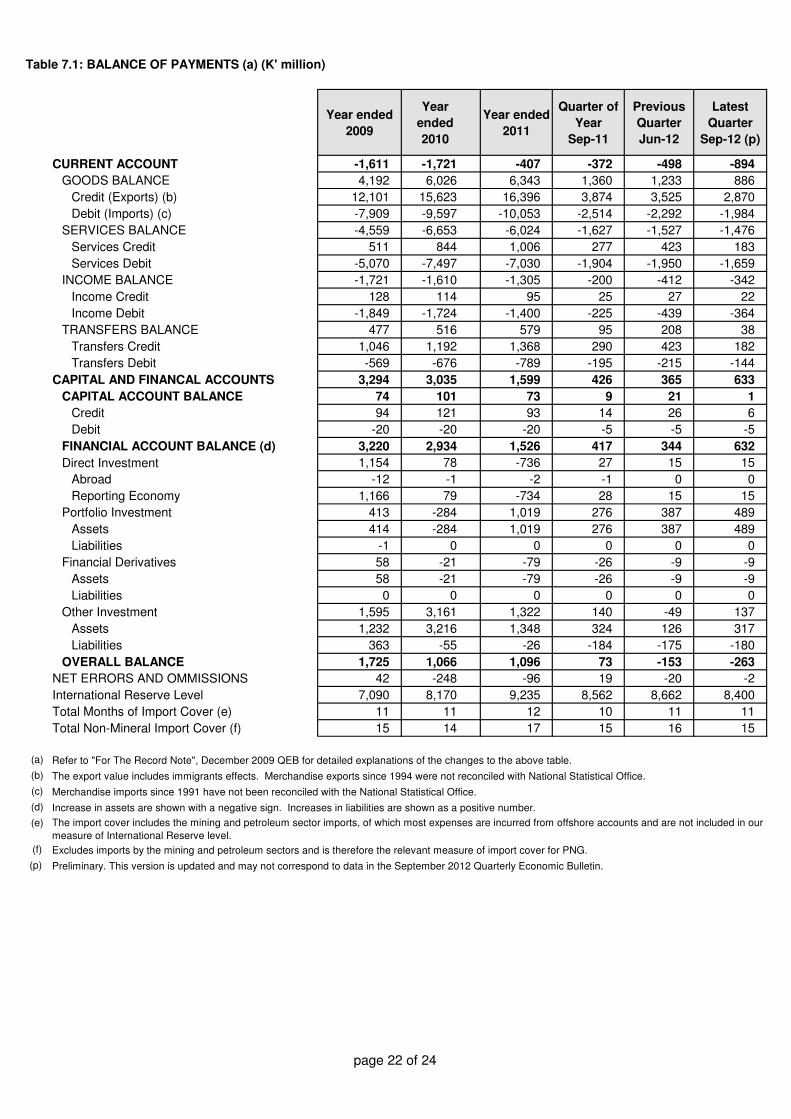
Year ended
2009
Year
ended
2010
Year ended
2011
Quarter of
Year
Sep-11
Previous
Quarter
Jun-12
Latest
Quarter
Sep-12 (p)
CURRENT ACCOUNT -1,611 -1,721 -407 -372 -498 -894
GOODS BALANCE 4,192 6,026 6,343 1,360 1,233 886
Credit (Exports) (b) 12,101 15,623 16,396 3,874 3,525 2,870
Debit (Imports) (c) -7,909 -9,597 -10,053 -2,514 -2,292 -1,984
SERVICES BALANCE -4,559 -6,653 -6,024 -1,627 -1,527 -1,476
Services Credit 511 844 1,006 277 423 183
Services Debit -5,070 -7,497 -7,030 -1,904 -1,950 -1,659
INCOME BALANCE -1,721 -1,610 -1,305 -200 -412 -342
Income Credit 128 114 95 25 27 22
Income Debit -1,849 -1,724 -1,400 -225 -439 -364
TRANSFERS BALANCE 477 516 579 95 208 38
Transfers Credit 1,046 1,192 1,368 290 423 182
Transfers Debit -569 -676 -789 -195 -215 -144
CAPITAL AND FINANCAL ACCOUNTS 3,294 3,035 1,599 426 365 633
CAPITAL ACCOUNT BALANCE 74 101 73 9 21 1
Credit 94 121 93 14 26 6
Debit -20 -20 -20 -5 -5 -5
FINANCIAL ACCOUNT BALANCE (d) 3,220 2,934 1,526 417 344 632
Direct Investment 1,154 78 -736 27 15 15
Abroad -12 -1 -2 -1 0 0
Reporting Economy 1,166 79 -734 28 15 15
Portfolio Investment 413 -284 1,019 276 387 489
Assets 414 -284 1,019 276 387 489
Liabilities -1 0 0 0 0 0
Financial Derivatives 58 -21 -79 -26 -9 -9
Assets 58 -21 -79 -26 -9 -9
Liabilities 0 0 0 0 0 0
Other Investment 1,595 3,161 1,322 140 -49 137
Assets 1,232 3,216 1,348 324 126 317
Liabilities 363 -55 -26 -184 -175 -180
OVERALL BALANCE 1,725 1,066 1,096 73 -153 -263
NET ERRORS AND OMMISSIONS 42 -248 -96 19 -20 -2
International Reserve Level 7,090 8,170 9,235 8,562 8,662 8,400
Total Months of Import Cover (e) 11 11 12 10 11 11
Total Non-Mineral Import Cover (f) 15 14 17 15 16 15
(a)
(b)
(c)
(d)
(e)
(f)
(p)
Table 7.1: BALANCE OF PAYMENTS (a) (K' million)
Refer to "For The Record Note", December 2009 QEB for detailed explanations of the changes to the above table.
The export value includes immigrants effects. Merchandise exports since 1994 were not reconciled with National Statistical Office.
Merchandise imports since 1991 have not been reconciled with the National Statistical Office.
Increase in assets are shown with a negative sign. Increases in liabilities are shown as a positive number.
The import cover includes the mining and petroleum sector imports, of which most expenses are incurred from offshore accounts and are not included in our
measure of International Reserve level.
Excludes imports by the mining and petroleum sectors and is therefore the relevant measure of import cover for PNG.
Preliminary. This version is updated and may not correspond to data in the September 2012 Quarterly Economic Bulletin.
page 22 of 24

US dollar 0.4785 0.4790 0.4800 0.4600 - 0.3 4.0
Australian dollar 0.4638 0.4594 0.4630 0.4608 0.2 0.7
Japanese yen 38.78 38.11 38.09 35.37 1.8 9.6
Euro 0.3748 0.3749 0.3671 0.3413 2.1 9.8
Swiss franc 0.4514 0.4520 0.4437 0.4233 1.7 6.6
UK pound 0.3017 0.2993 0.2989 0.2918 0.9 3.4
NZ dollar 0.5909 0.5862 0.5851 0.6078 1.0 - 2.8
Previous Year
Sep-12 (p) Jun-12 Sep-11
Year Quarter
(a)
(p)
Sep-12 (p) Jun-12 Sep-11
(a)
(p)
Table 7.4: EXPORT VOLUME INDEX (1994 = 100) (a)
See footnote (a), Table 7.3
Preliminary.
90.4
Latest Quarter Previous Quarter Previous Year % Change over
Previous YearPrevious
Quarter
-14.491.2 -13.678.1
Previous Year
Previous
16-Nov-12 9-Nov-12
Table 7.3: EXPORT PRICE INDEX (1994 = 100) (a)
Latest Quarter Previous Quarter
Previous
18-Nov-11Previous
Month19-Oct-12
% Change over
Table 7.2: EXCHANGE RATES (Foreign currency per Kina)
Latest Week ago Month ago Year ago % Change over
1,017.9894.3845.3 -17.0
Refer to "Special Article" March Quarter 2003 (QEB), for an explanation on the methodology to derive the index.
Preliminary.
-5.5
page 23 of 24

Total Stock
Treasury Bills Issued (Stock) 3,220.0 3,134.0 3,214.0 3,134.0
New Issues
Retirement 89.2 86.0 32.5 80.0
Inscribed Stock (a) 3,275.9 3,275.9 3,275.9 3,275.9
New Issues 46.0
3 years and less
above 3 and less than 6 years
above 6 years
Retirement
Bank of Papua New Guinea
Portfolio Transactions
Treasury Bills (Face Value) ... ... ... ...
New Purchases
Sales to Public ... ... ... ...
Retirement
Unsold Stock ... ... ... ...
Inscribed Stock 468.6 481.4 481.4 481.4
New Purchases 12.8
Sales to Public
Retirement
Total BPNG Stock 481.4 481.4 481.4 481.4
(a)
(a)
(b)
(p) Preliminary.
16-Nov-12
160.4168.3
Nov-12
Table 8.2: PRIVATE SECTOR EMPLOYMENT INDEX (a) (b) (MARCH 2002 = 100)
2-Nov-12(to date)
Total private sector employment index excludes the mineral sector.
6.4
Previous
Year
170.7
Latest
Quarter
Jun-12
In September 2005, the Bank revised the Employment Index from 2002 onwards to improve the quality of the data (see September QEB 2005 "For the Record").
1.4
% Change OverPrevious
Quarter
Previous
Quarter
Previous
YearSep-12 (p) Sep-11
Table 8.1: GOVERNMENT SECURITIES TRANSACTIONS
Fortnight Ending
Oct-12
Includes remaining outstanding Private Treaty Loans (PTL).
End of Month
page 24 of 24