Embed Size (px)
Citation preview
Statistics Through Applications
Chapter 1:How Do We Get “Good”
Data?
Copyright © 2004 by W. H. Freeman & Company


Individuals & Variables
• Individuals are the objects described by a set of data.– People, animals, or things
• A Variable is any characteristic of an individual. Variables can take different values for different individuals.– Categorical Variables: places an individual into one of
several categories (Job type, gender, race)– Quantitative Variables: takes numerical values for
which ordering and averaging make sense (age, weight, salary)

Example: A few lines from a teacher’s gradebook
• What individuals does this data describe?
• What variables does this data describe?
• Which of these are categorical?
• Which are quantitative?
Name Sex Homeroom Grade Calc No. Test 1
Hsu, Danny M Blair 12 B319 81
Iris, Francine F Kingsley 12 B298 92
Ruiz, Ricardo M Alfonzo 11 B304 87
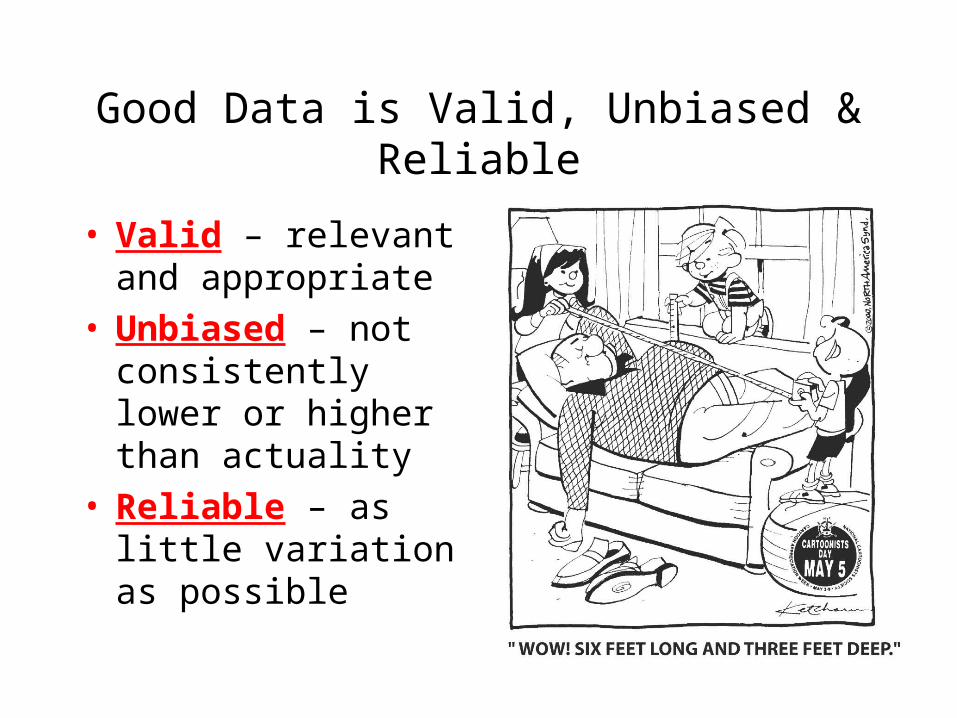
Good Data is Valid, Unbiased & Reliable
• Valid – relevant and appropriate
• Unbiased – not consistently lower or higher than actuality
• Reliable – as little variation as possible

Good Data is Compared Fairly
• Often a rate expressed as a percent or fraction is a more valid measure than a simple count of occurrences
– Two schools both had 1900 students pass TAKS. One school has 2000 students and the other has 2500. Did they perform equally as well?
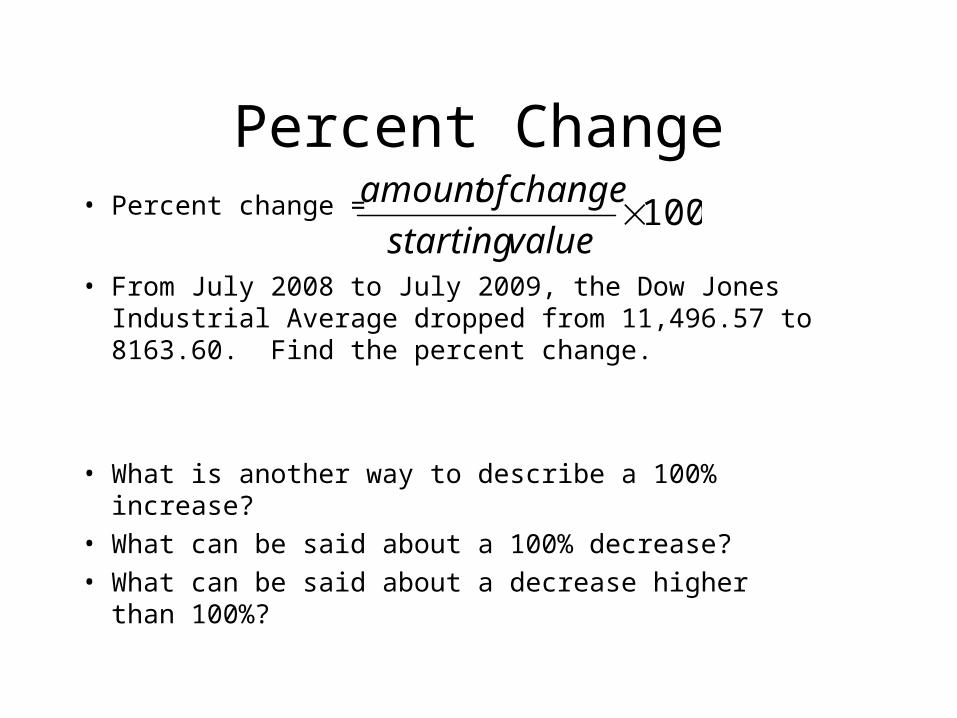
Percent Change• Percent change =
• From July 2008 to July 2009, the Dow Jones Industrial Average dropped from 11,496.57 to 8163.60. Find the percent change.
• What is another way to describe a 100% increase?
• What can be said about a 100% decrease?
• What can be said about a decrease higher than 100%?
100valuestarting
changeofamount

Even Good Data needs to be Read Carefully
• Summertime is Burglary Time – or is it?– An advertisement for a home security system
says, “When you go on vacation, burglars go to work. According to FBI statistics, over 26% of home burglaries take place between Memorial Day and Labor Day.”

• Only one in two cameras is actually in operation, but this could soon increase to as many as one in threeWatford Observer, 2 August 2002
• Whereas five years ago the [professional conduct committee] panels sat for only 90 days a year, in 2000 the number of days was 242 and in 2001 it was 479. This year the number of days will be higher still...General Medical Council newsletter, 13 August 2002
• Westchester County is a suburban area covering 438 square miles immediately north of New York City. The county is home to 800,000 deer.Fine Gardening, September/October 1989
• Continental Airlines once advertised that it had “decreased lost baggae by 100% in the past six months.”
Even Good Data Varies• How Long is a Minute?
– How accurate are you and your classmates at knowing how long a minute is?
– Get a partner and a stopwatch. You will take turns timing and guessing. Using the stopwatch, the timer tells the guesser when to start. When the guesser believes that a minute has passed, he says “Stop.” At that point, the timer stops the stopwatch and records the time that passed to the nearest tenth of a second. Do not tell your partner how much time actually passed!
– Reset the stopwatch and switch roles. Continue timing and measuring until you each person has been timed three times.

Analyzing How Long is a Minute?
• Was your data valid?
• Was either partner’s data biased?
• Which partner was more reliable?
• How about the class as a whole? Add your data (all 6 measures) to the class list and graph.

Use Averages to Improve Reliability
• No measuring process is perfectly reliable.
• The average of several repeated measurements of the same individual is
more reliable (and less variable) than a single measurement.

The Statistical Problem Solving Process - APAC
• A – Ask a question of interest
• P – Produce data
• A – Analyze and describe/graph the data
• C – Conclusion, answering the question
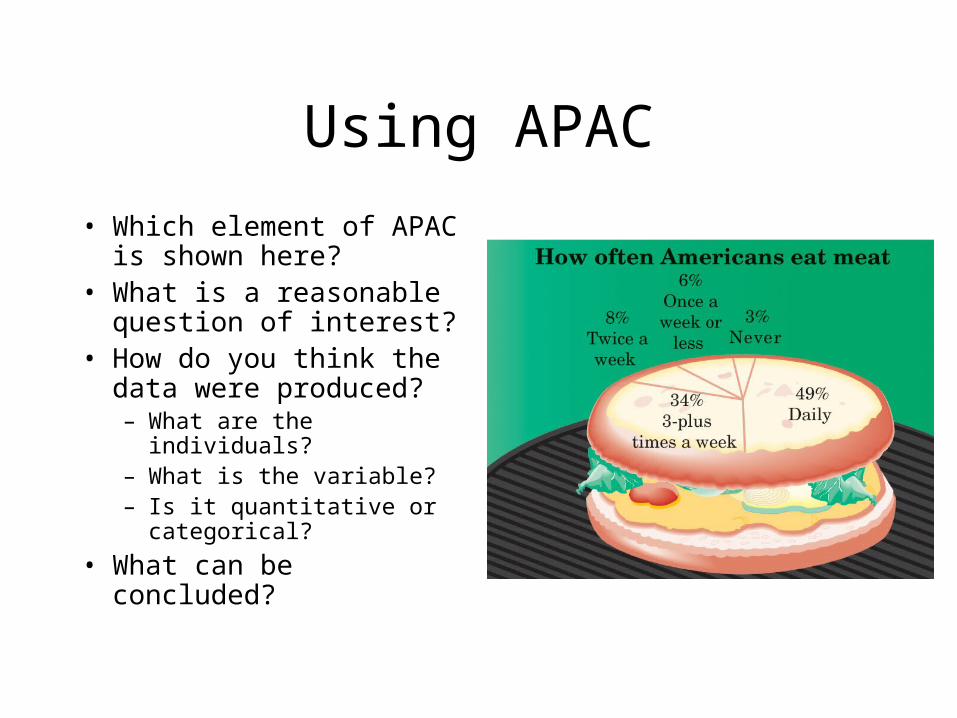
Using APAC
• Which element of APAC is shown here?
• What is a reasonable question of interest?
• How do you think the data were produced?– What are the individuals?– What is the variable?– Is it quantitative or
categorical?
• What can be concluded?
First Homework Problem
• According to the National Institute on Media and the Family, a preschooler’s risk of obesity jumps 6% for every hour of television watched per day. The risk increases by 31% if the TV is in their bedroom.– 1.What element of APAC is given here?– 2. What is a reasonable question of interest in this case?– 3. The actual study that produced these results involved 2761 low-
income adults in New York with children aged 1 to 4 years. Who are the individuals in this study?
– 4. What variable(s) were measured?