Embed Size (px)
Citation preview
STATISTICS!!!STATISTICS!!!
The science of dataThe science of data
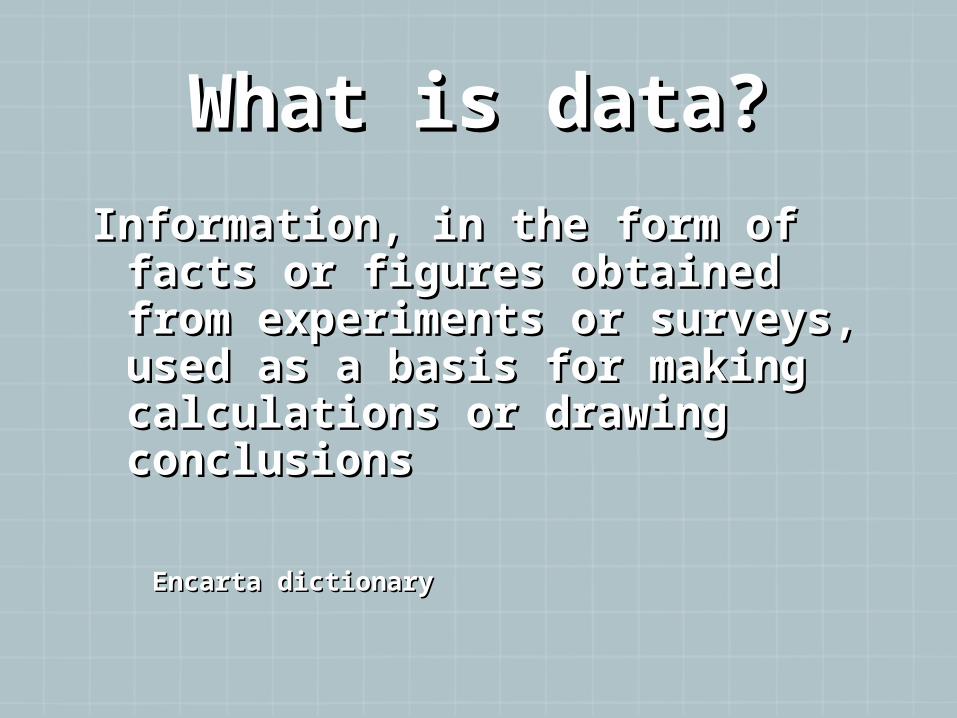
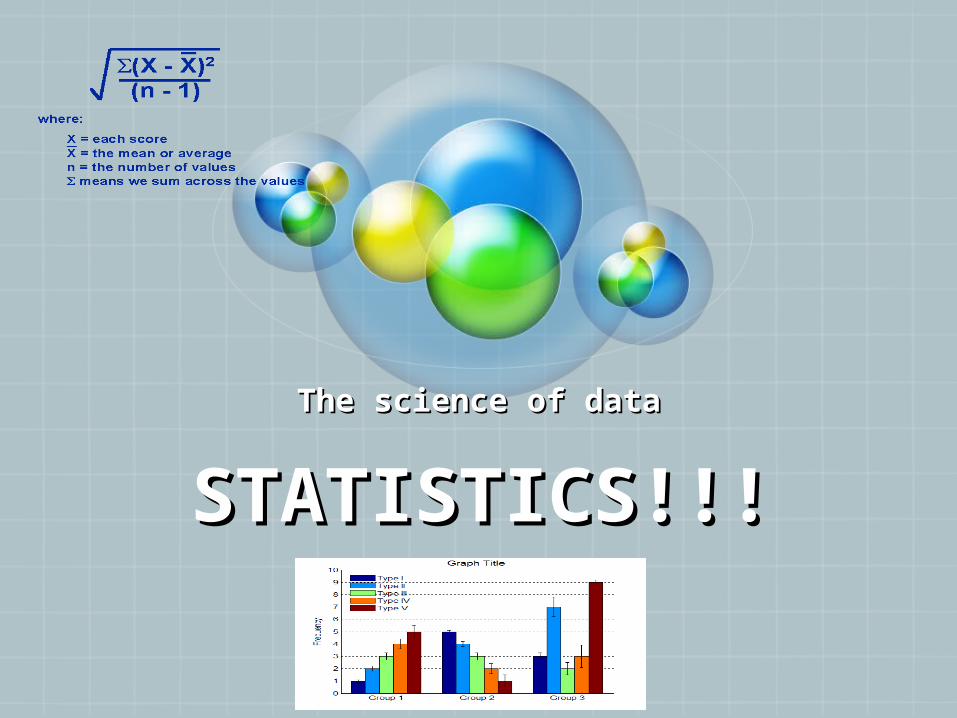
What is data?What is data?
Information, in the form of Information, in the form of facts or figures obtained facts or figures obtained from experiments or from experiments or surveys, used as a basis for surveys, used as a basis for making calculations or making calculations or drawing conclusionsdrawing conclusions
Encarta Encarta dictionary dictionary
Statistics in Statistics in ScienceScience
Data can be collected about a Data can be collected about a population (surveys)population (surveys)
How many individuals are going How many individuals are going to vote for Trump based on his to vote for Trump based on his awesome hairawesome hair
Data can be collected about a Data can be collected about a process (experimentation)process (experimentation)
FMRI tests that determine the FMRI tests that determine the brain activity of those willing to brain activity of those willing to vote for Trumpvote for Trump
Qualitative DataQualitative DataInformation that relates to Information that relates to characteristics or description characteristics or description (observable qualities)(observable qualities)
What is the flaw in this type of science??What is the flaw in this type of science??
Information is often grouped by Information is often grouped by descriptive categorydescriptive category
ExamplesExamplesSpecies of plantSpecies of plantType of insectType of insectShades of colorShades of colorRank of flavor in taste testingRank of flavor in taste testing
Remember: qualitative data can be Remember: qualitative data can be ““scoredscored”” and and evaluated numericallyevaluated numerically
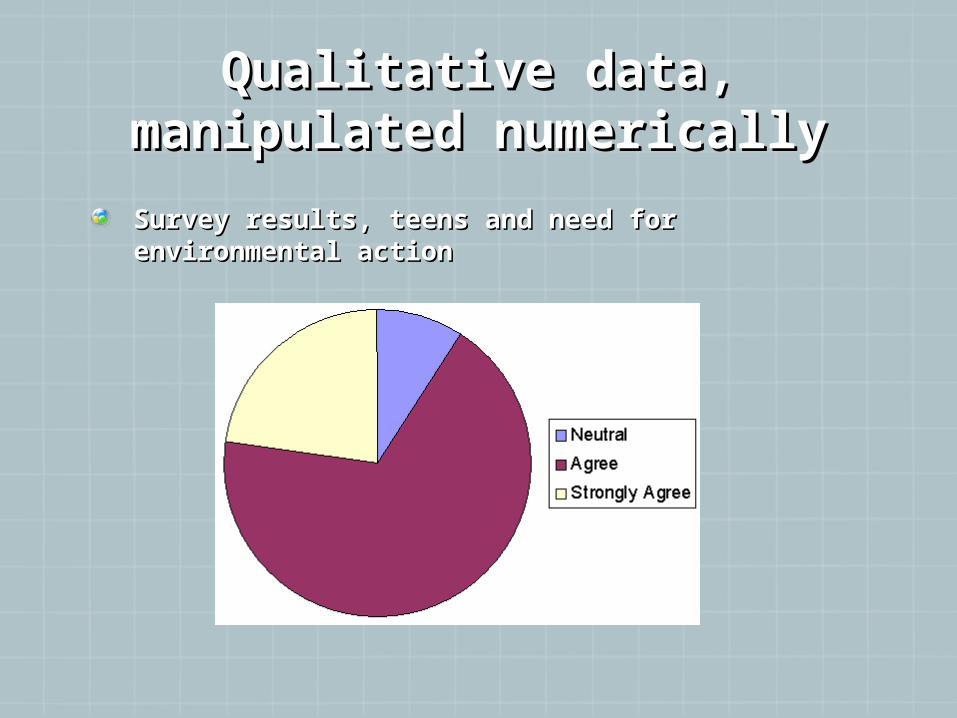
Qualitative data, Qualitative data, manipulated numericallymanipulated numerically
Survey results, teens and need for Survey results, teens and need for environmental actionenvironmental action
Quantitative dataQuantitative data
Quantitative – measured using Quantitative – measured using a naturally occurring a naturally occurring numerical scale numerical scale
ExamplesExamplesChemical concentrationChemical concentrationTemperatureTemperatureLengthLengthWeight…etc.Weight…etc.
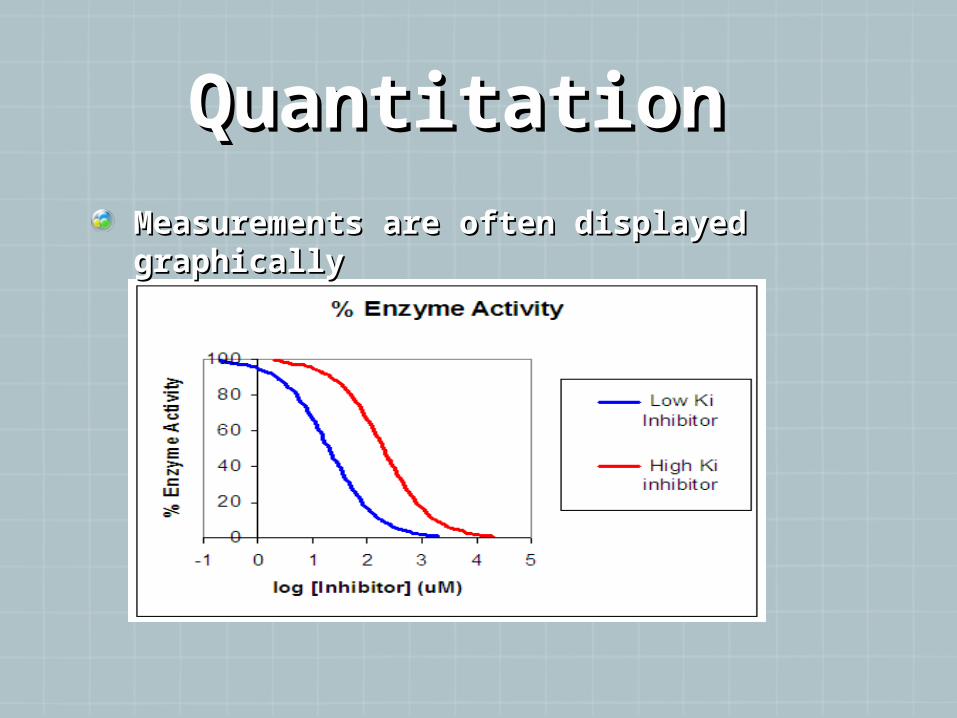
Quantitation Quantitation Measurements are often displayed Measurements are often displayed graphicallygraphically
MeasurementMeasurementIn data collection for Biology, data must In data collection for Biology, data must be measured carefully, using laboratory be measured carefully, using laboratory equipment equipment
((ex. Timers, meter sticks, pH meters, balances , pipettes, ex. Timers, meter sticks, pH meters, balances , pipettes, etc)etc)
The limits of the equipment used add The limits of the equipment used add some uncertainty to the data collected. All some uncertainty to the data collected. All equipment has a certain magnitude of equipment has a certain magnitude of uncertainty. For example, is a ruler that is uncertainty. For example, is a ruler that is mass-produced a good measure of 1 cm? mass-produced a good measure of 1 cm? 1mm? 0.1mm?1mm? 0.1mm?
For quantitative testing, For quantitative testing, you must you must indicate the level of uncertainty of the indicate the level of uncertainty of the tool that you are using for measurement!!tool that you are using for measurement!!
How to determine How to determine uncertainty?uncertainty?
Usually the instrument manufacturer will indicate Usually the instrument manufacturer will indicate this – read what is provided by the manufacturer.this – read what is provided by the manufacturer.
The IB acceptable uncertainty is ½ the smallest The IB acceptable uncertainty is ½ the smallest measurement on the instrument you are using. You measurement on the instrument you are using. You will be marked down if you do not include a valid will be marked down if you do not include a valid uncertainty!uncertainty!
Be sure that the number of significant digits in the Be sure that the number of significant digits in the data table/graph reflects the precision of the data table/graph reflects the precision of the instrument used (for ex. If the manufacturer states instrument used (for ex. If the manufacturer states that the accuracy of a balance is to 0.1g – and your that the accuracy of a balance is to 0.1g – and your average mass is 2.06g, be sure to round the average average mass is 2.06g, be sure to round the average to 2.1g) Your data must be consistent with your to 2.1g) Your data must be consistent with your measurement tool regarding significant figuresmeasurement tool regarding significant figures..
Finding the limitsFinding the limits If the room temperature is read as 25 If the room temperature is read as 25 degrees C, with a thermometer that is degrees C, with a thermometer that is scored at 1 degree intervals – what is scored at 1 degree intervals – what is the range of possible temperatures for the range of possible temperatures for the room?the room?
(+/- 0.5 degrees Celsius - if you read (+/- 0.5 degrees Celsius - if you read 1515ooC, it may in fact be 14.5 or 15.5 C, it may in fact be 14.5 or 15.5 degrees)degrees)

Basic Math Review – 3 Basic Math Review – 3 measures of measures of ““Central Central
TendencyTendency””modemode: value that appears most frequently: value that appears most frequently
medianmedian: When all data are listed from least : When all data are listed from least to greatest, the value at which half of the to greatest, the value at which half of the observations are greater, and half are observations are greater, and half are lesser. lesser.
The most commonly used measure of The most commonly used measure of central tendency is the central tendency is the meanmean, or arithmetic , or arithmetic average (sum of data points divided by the average (sum of data points divided by the number of points) number of points)
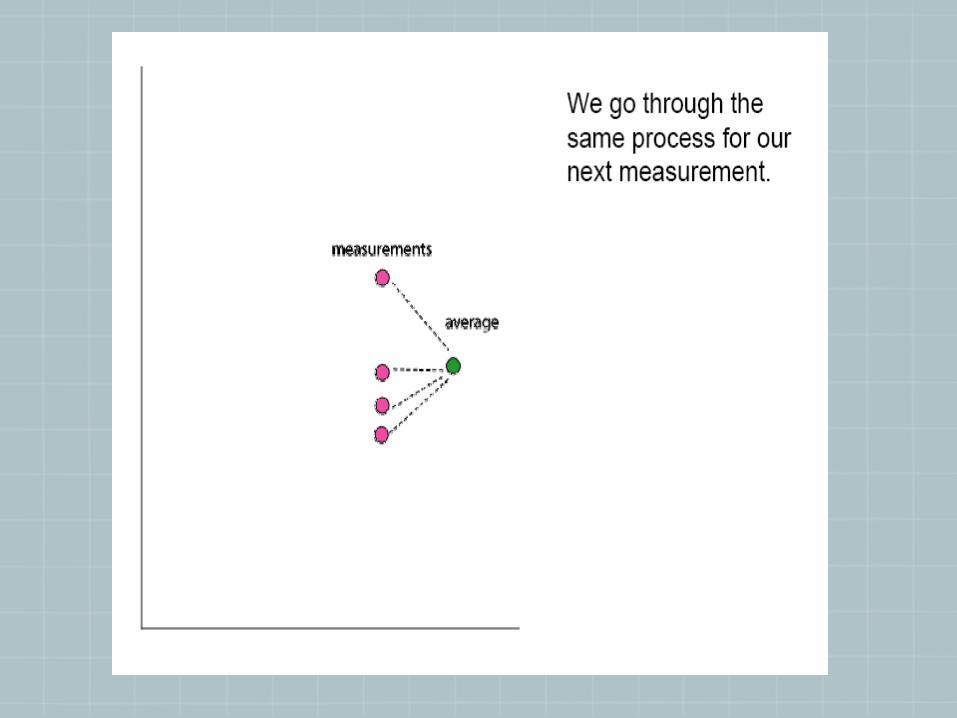
Measures of Measures of AverageAverage
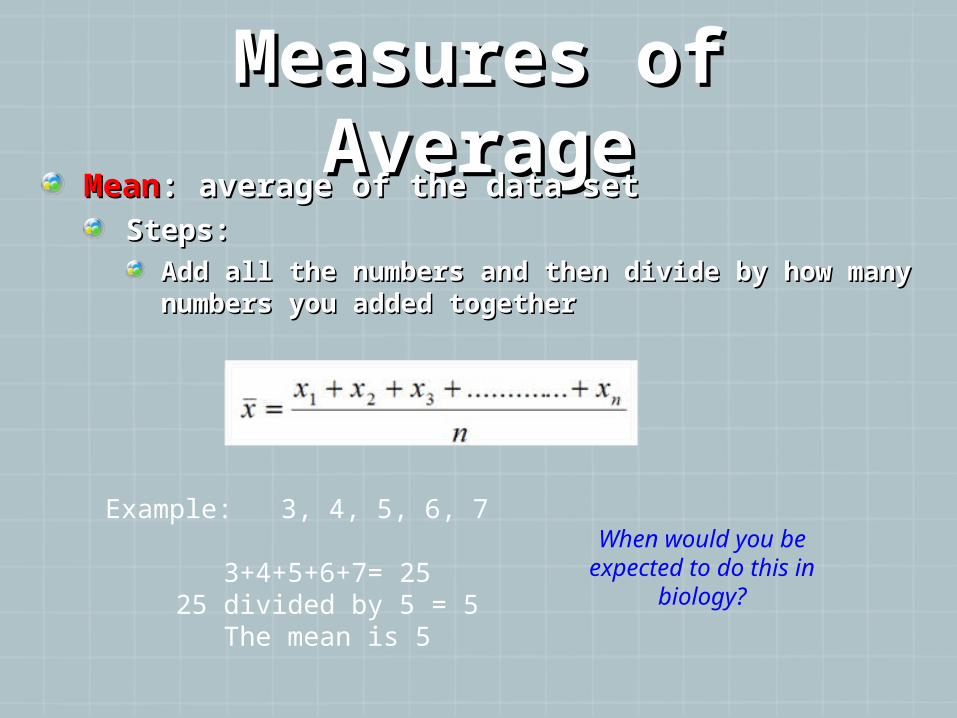
MeanMean: average of the data set: average of the data setSteps:Steps:
Add all the numbers and then divide by how Add all the numbers and then divide by how many numbers you added togethermany numbers you added together
Example: 3, 4, 5, 6, 7
3+4+5+6+7= 25 25 divided by 5 = 5
The mean is 5
When would you be expected to do this in
biology?
Measures of Measures of AverageAverage
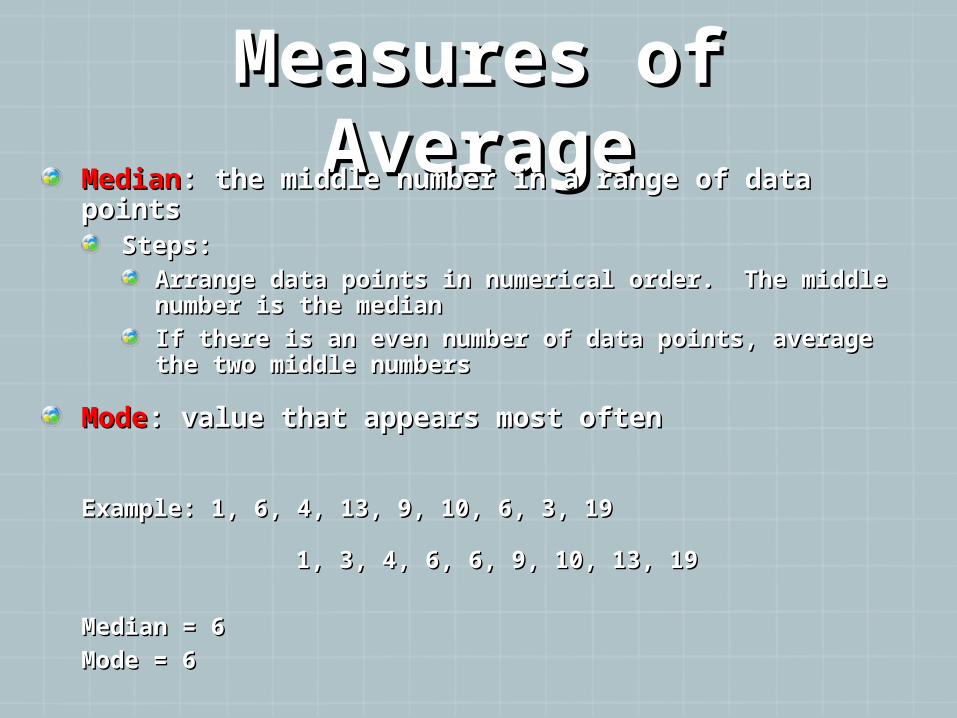
MedianMedian: the middle number in a range of data : the middle number in a range of data pointspoints
Steps:Steps:Arrange data points in numerical order. The middle Arrange data points in numerical order. The middle number is the mediannumber is the medianIf there is an even number of data points, average If there is an even number of data points, average the two middle numbersthe two middle numbers
ModeMode: value that appears most often: value that appears most often
Example: 1, 6, 4, 13, 9, 10, 6, 3, 19Example: 1, 6, 4, 13, 9, 10, 6, 3, 19
1, 3, 4, 6, 6, 9, 10, 13, 191, 3, 4, 6, 6, 9, 10, 13, 19
Median = 6Median = 6Mode = 6Mode = 6
Looking at DataLooking at DataHow accurate is the data? (How close How accurate is the data? (How close are the data to the are the data to the ““realreal”” results?) This results?) This is also considered as BIASis also considered as BIAS
How precise is the data? (All test How precise is the data? (All test systems have some uncertainty, due to systems have some uncertainty, due to limits of measurement) Estimation of limits of measurement) Estimation of the limits of the experimental the limits of the experimental uncertainty is essential. uncertainty is essential.
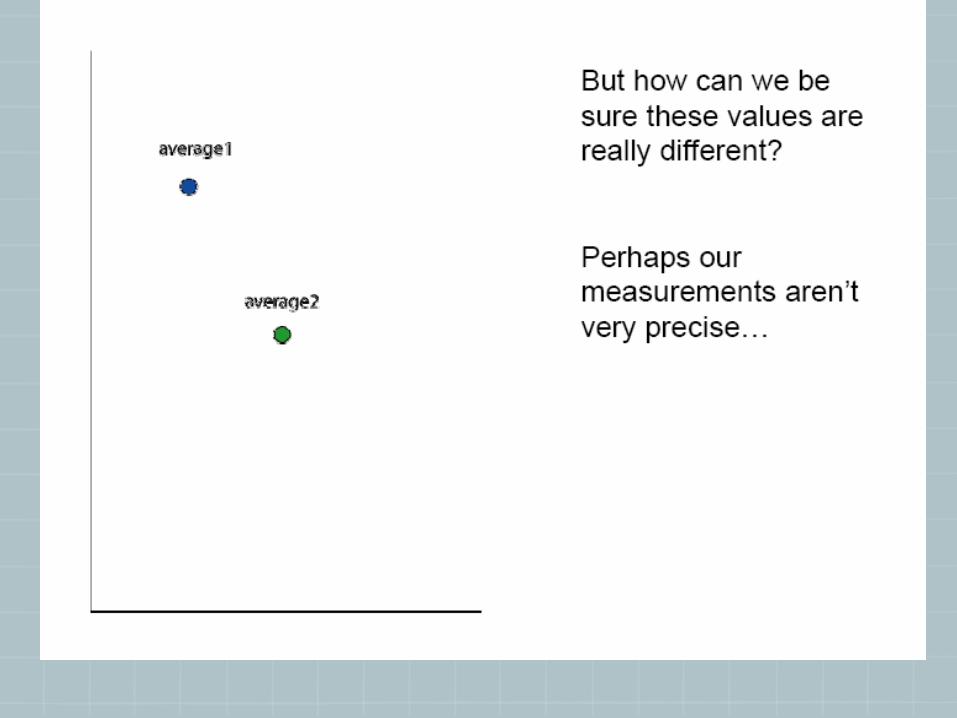
Comparing Comparing AveragesAverages
Once the 2 averages are Once the 2 averages are calculated for each set of calculated for each set of data, the average values data, the average values can be plotted together can be plotted together on a graph, to visualize on a graph, to visualize the relationship between the relationship between the 2the 2
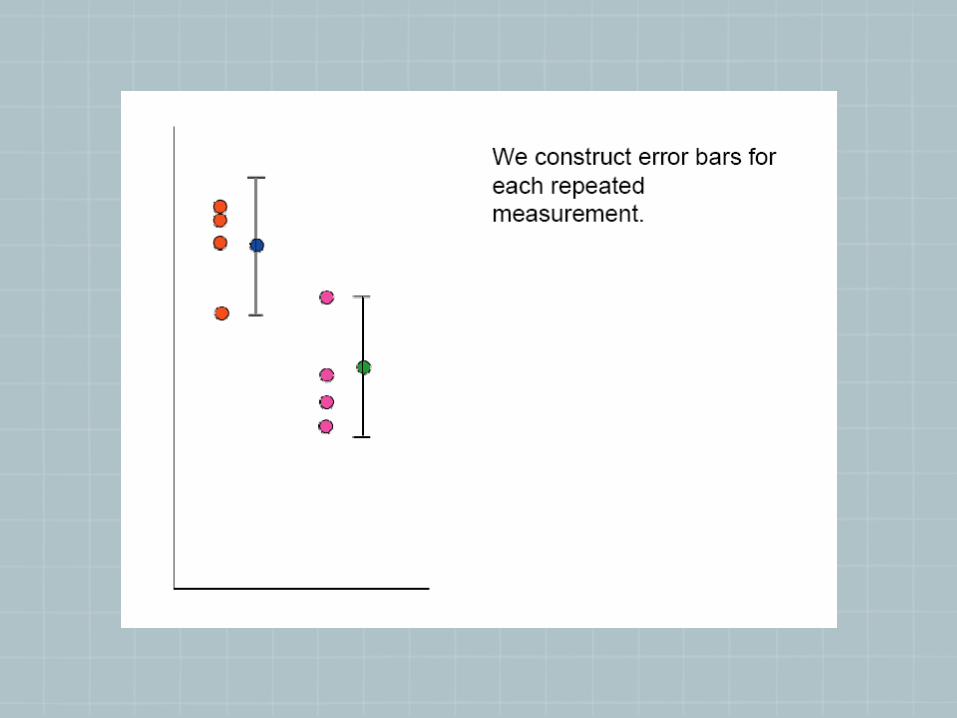

Drawing error Drawing error barsbars
The simplest way to draw an error bar is The simplest way to draw an error bar is to use the mean as the central point, to use the mean as the central point, and to use the distance of the and to use the distance of the measurement that is furthest from the measurement that is furthest from the average as the endpoints of the data average as the endpoints of the data barbar
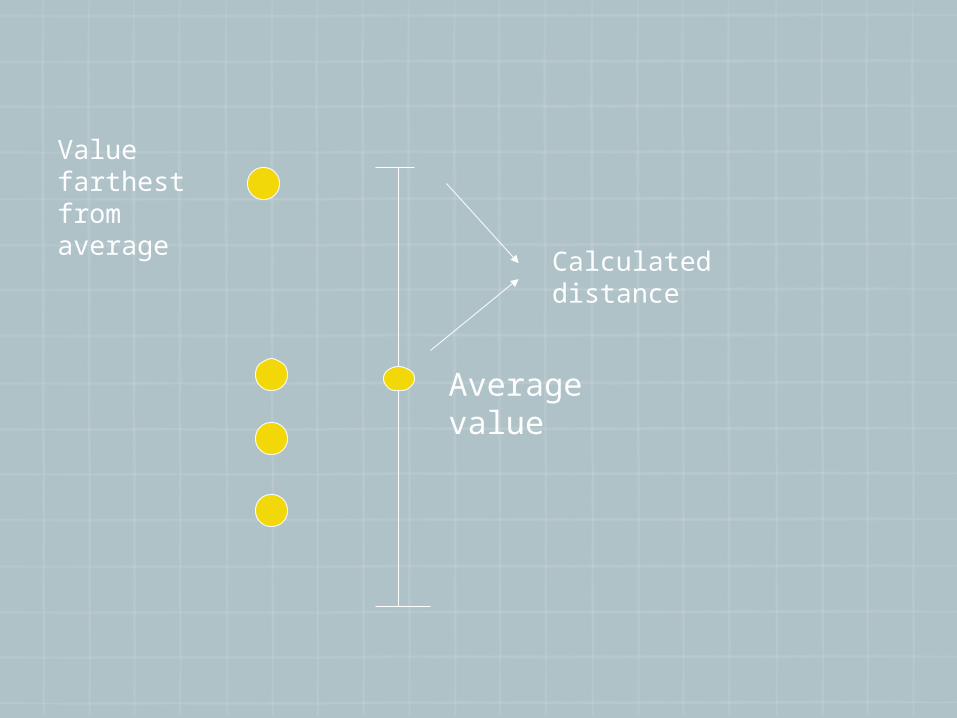
Average value
Value farthest from average
Calculated distance
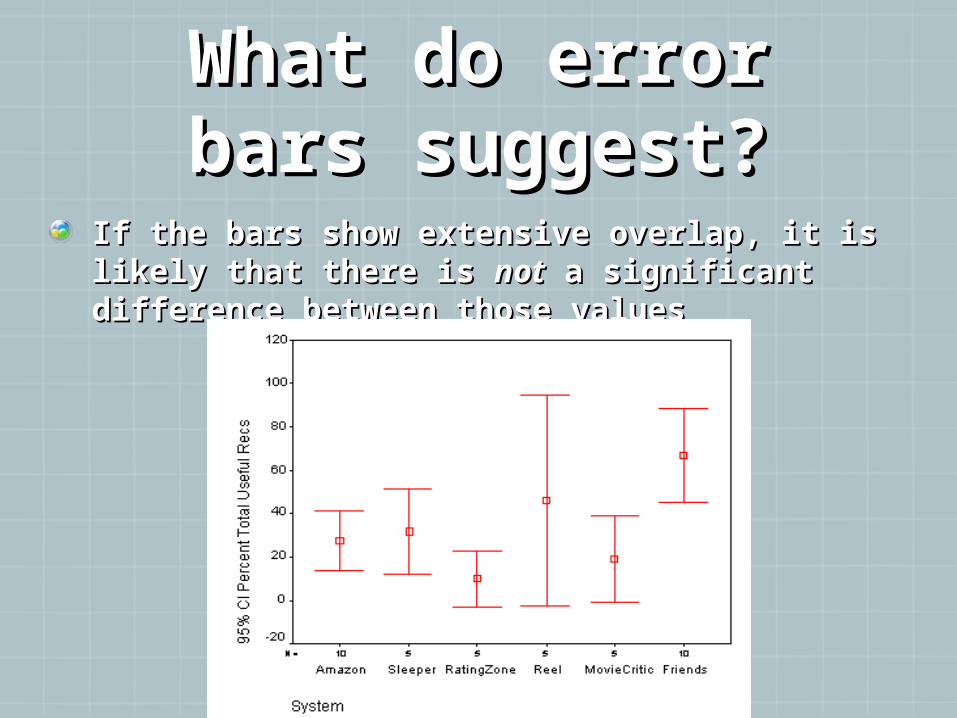
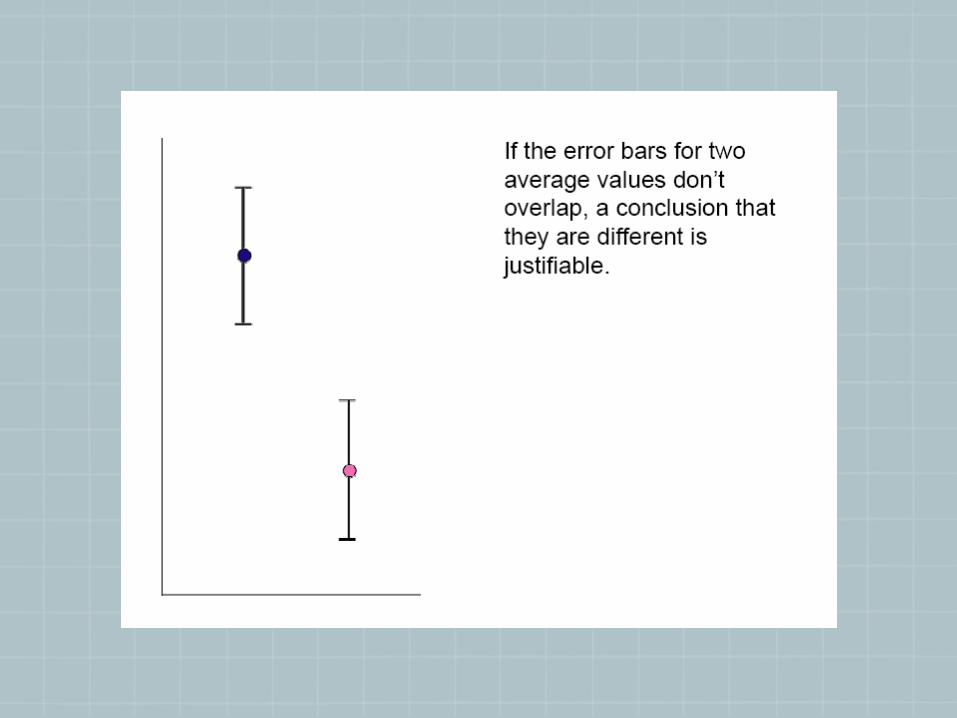
What do error What do error bars suggest?bars suggest?
If the bars show extensive overlap, it is If the bars show extensive overlap, it is likely that there is likely that there is notnot a significant a significant difference between those valuesdifference between those values
Measures of Measures of VariabilityVariabilityA better way to do error barsA better way to do error bars
Standard DeviationStandard DeviationIn normal distribution, about In normal distribution, about 68% of values 68% of values are within are within oneone standard deviation of the standard deviation of the meanmean
Often report data in terms of +/- standard Often report data in terms of +/- standard deviationdeviation
It shows how much It shows how much variationvariation there is from there is from the "average" (mean).the "average" (mean).
If data points are close together, the If data points are close together, the standard deviation with be smallstandard deviation with be small
If data points are spread out, the standard If data points are spread out, the standard deviation will be largerdeviation will be larger
Standard Standard DeviationDeviation
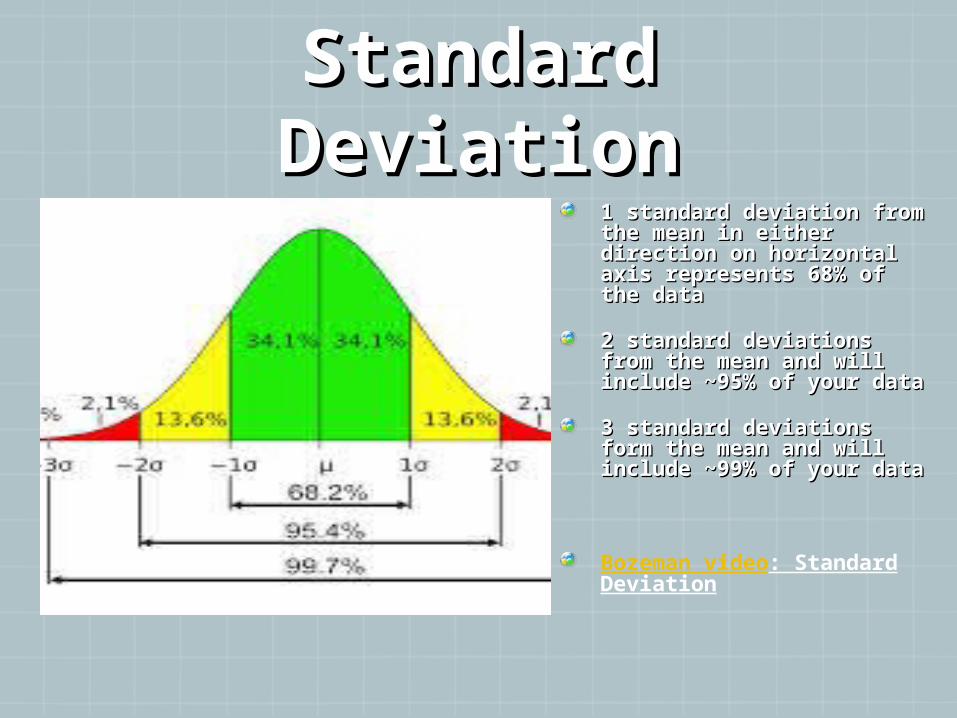
1 standard deviation from 1 standard deviation from the mean in either the mean in either direction on horizontal direction on horizontal axis represents 68% of axis represents 68% of the datathe data
2 standard deviations 2 standard deviations from the mean and will from the mean and will include ~95% of your datainclude ~95% of your data
3 standard deviations 3 standard deviations form the mean and will form the mean and will include ~99% of your datainclude ~99% of your data
Bozeman video: Standard Deviation
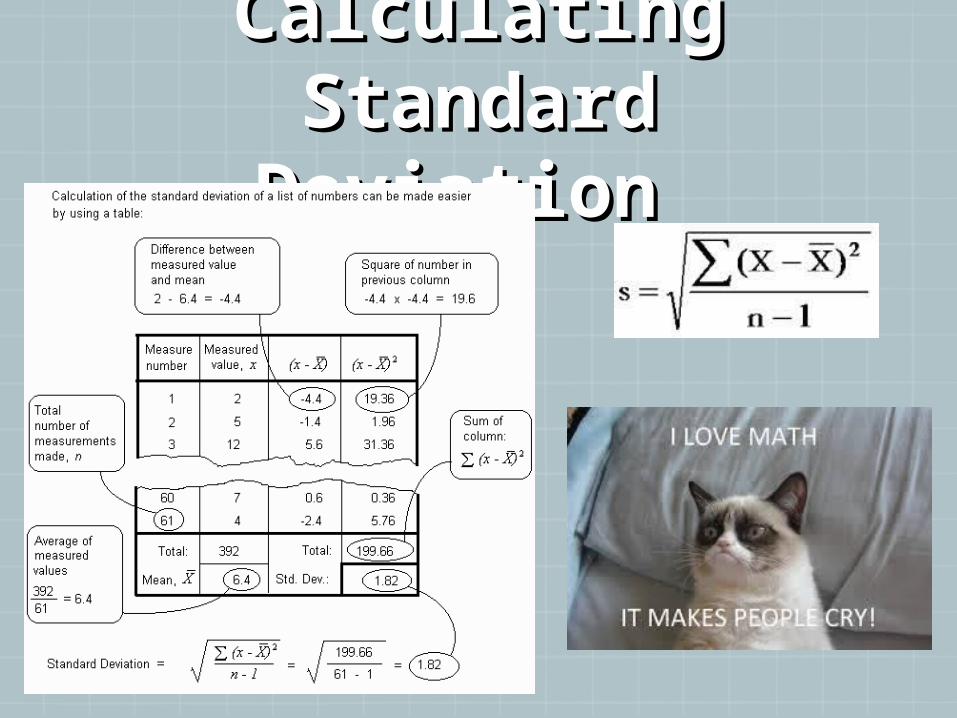
Calculating Calculating Standard Standard Deviation Deviation

Calculating Calculating Standard Standard DeviationDeviationGrades from recent Grades from recent
quiz in AP Biology:quiz in AP Biology:
96, 96, 93, 90, 96, 96, 93, 90, 88, 86, 86, 84, 80, 7088, 86, 86, 84, 80, 70
11stst Step: Step:
find the mean (X)find the mean (X)
Measure Number
Measured Value x (x - X) (x - X)2
1 96 9 812 96 9 813 92 5 254 90 3 95 88 1 16 86 -1 17 86 -1 18 84 -3 99 80 -7 49
10 70 -17 289TOTAL 868 TOTAL 546Mean, X 87 Std Dev
Calculating Calculating Standard Standard DeviationDeviation
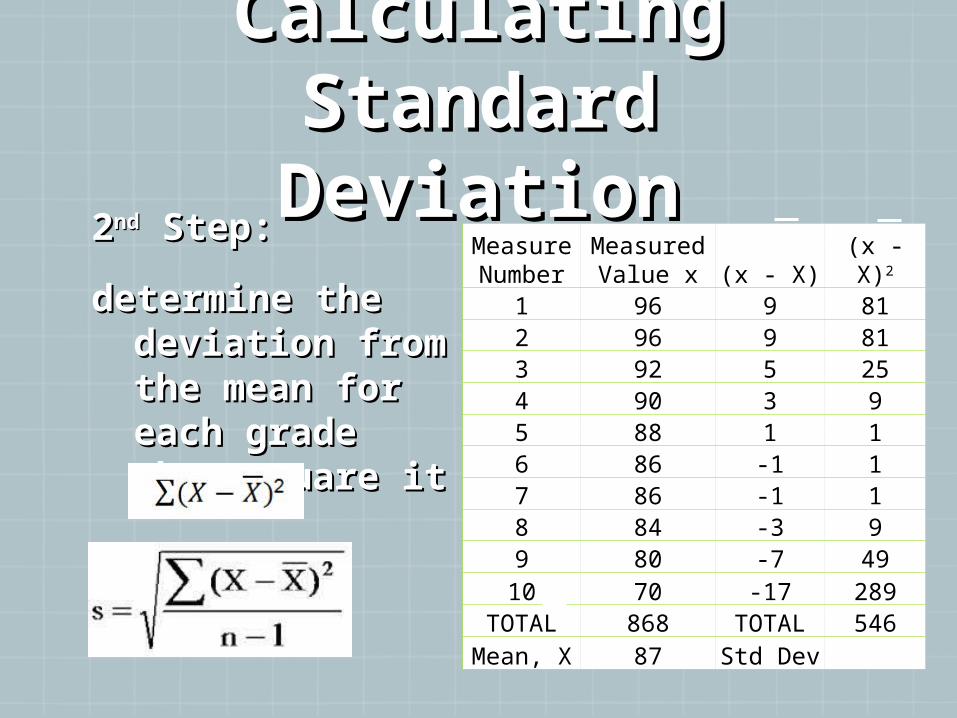
22ndnd Step: Step:
determine the determine the deviation from deviation from the mean for the mean for each grade each grade then square itthen square it
Measure Number
Measured Value x (x - X) (x - X)2
1 96 9 812 96 9 813 92 5 254 90 3 95 88 1 16 86 -1 17 86 -1 18 84 -3 99 80 -7 4910 70 -17 289
TOTAL 868 TOTAL 546Mean, X 87 Std Dev
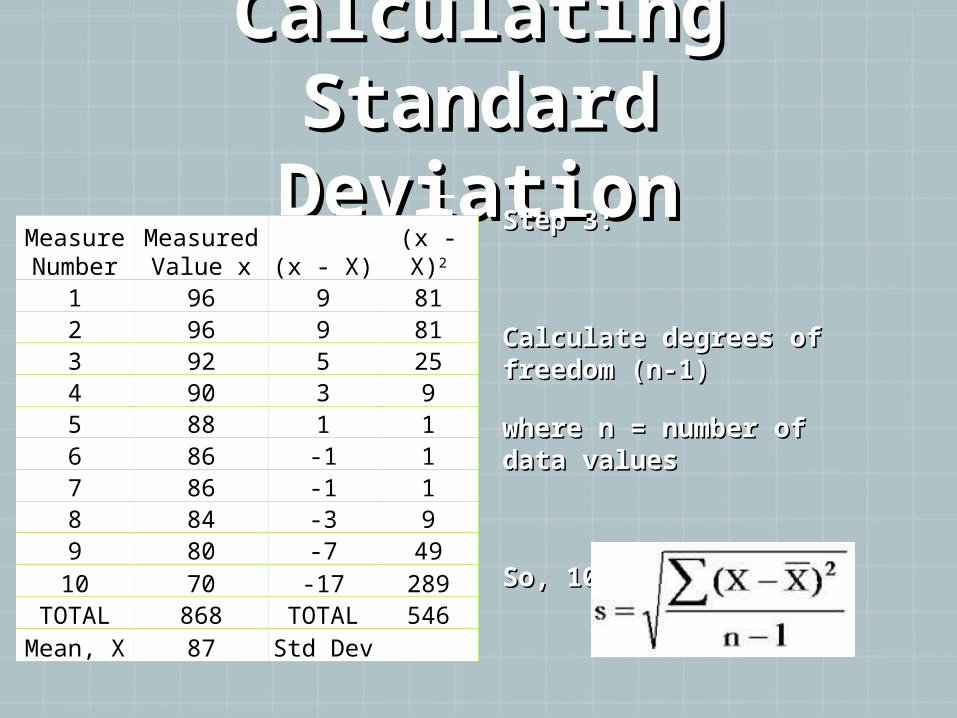
Calculating Calculating Standard Standard DeviationDeviationStep 3:Step 3:
Calculate degrees of Calculate degrees of freedom (n-1)freedom (n-1)
where n = number of where n = number of data valuesdata values
So, 10 – 1 = 9So, 10 – 1 = 9
Measure Number
Measured Value x (x - X) (x - X)2
1 96 9 812 96 9 813 92 5 254 90 3 95 88 1 16 86 -1 17 86 -1 18 84 -3 99 80 -7 4910 70 -17 289
TOTAL 868 TOTAL 546Mean, X 87 Std Dev
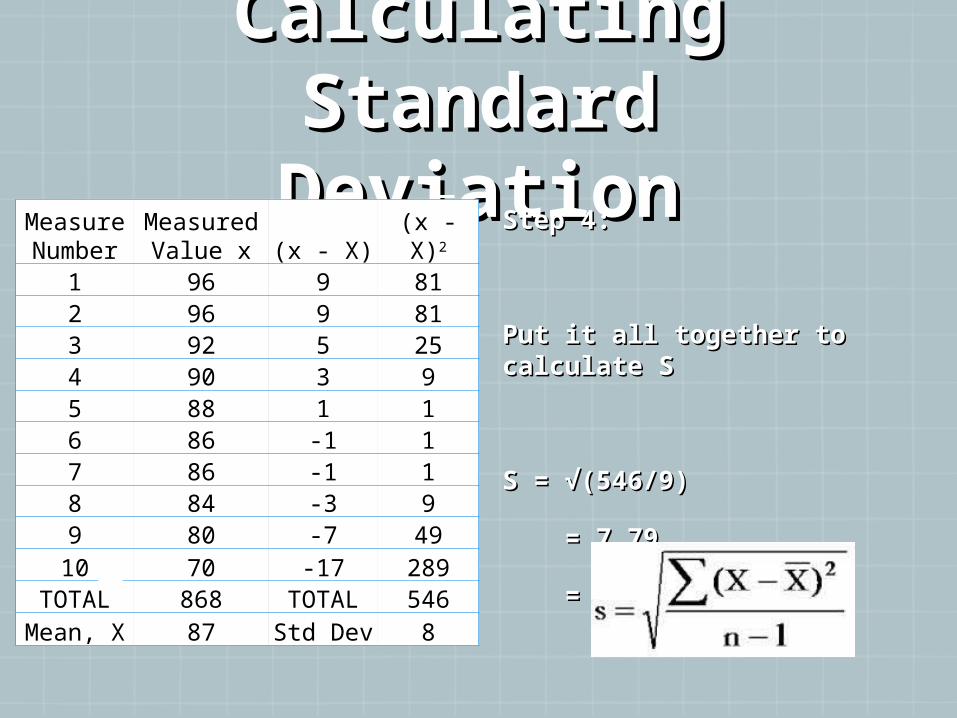
Calculating Calculating Standard Standard DeviationDeviationStep 4:Step 4:
Put it all together to Put it all together to calculate Scalculate S
S = √(546/9)S = √(546/9)
= 7.79= 7.79
= 8= 8
Measure Number
Measured Value x (x - X) (x - X)2
1 96 9 812 96 9 813 92 5 254 90 3 95 88 1 16 86 -1 17 86 -1 18 84 -3 99 80 -7 4910 70 -17 289
TOTAL 868 TOTAL 546Mean, X 87 Std Dev 8
Calculating Calculating Standard ErrorStandard Error
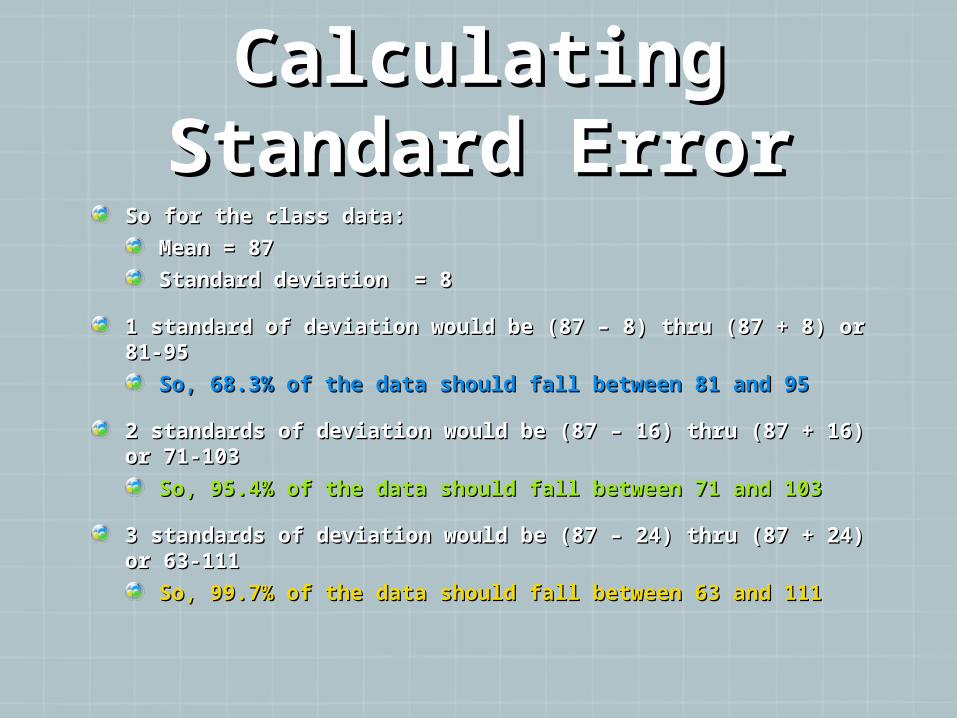
So for the class data:So for the class data:
Mean = 87Mean = 87
Standard deviation = 8Standard deviation = 8
1 standard of deviation would be (87 – 8) thru (87 + 8) or 1 standard of deviation would be (87 – 8) thru (87 + 8) or 81-9581-95
So, 68.3% of the data should fall between 81 and 95 So, 68.3% of the data should fall between 81 and 95
2 standards of deviation would be (87 – 16) thru (87 + 16) 2 standards of deviation would be (87 – 16) thru (87 + 16) or 71-103or 71-103
So, 95.4% of the data should fall between 71 and 103So, 95.4% of the data should fall between 71 and 103
3 standards of deviation would be (87 – 24) thru (87 + 24) 3 standards of deviation would be (87 – 24) thru (87 + 24) or 63-111or 63-111
So, 99.7% of the data should fall between 63 and 111So, 99.7% of the data should fall between 63 and 111
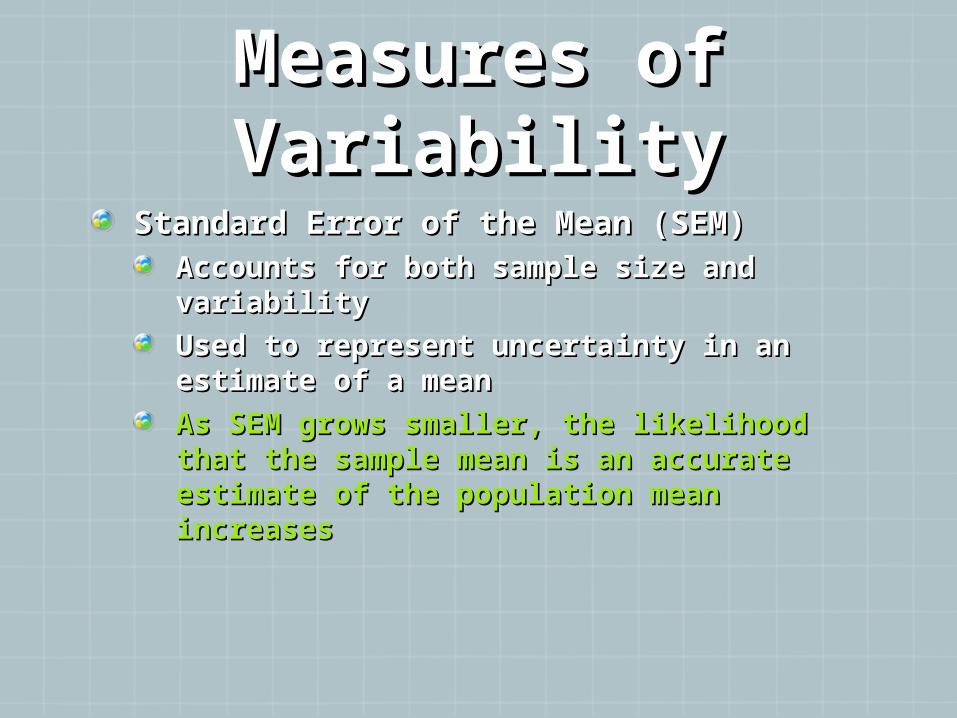
Measures of Measures of VariabilityVariability
Standard Error of the Mean (SEM)Standard Error of the Mean (SEM)Accounts for both sample size and Accounts for both sample size and variabilityvariability
Used to represent uncertainty in an Used to represent uncertainty in an estimate of a meanestimate of a mean
As SEM grows smaller, the likelihood that As SEM grows smaller, the likelihood that the sample mean is an accurate estimate the sample mean is an accurate estimate of the population mean increasesof the population mean increases
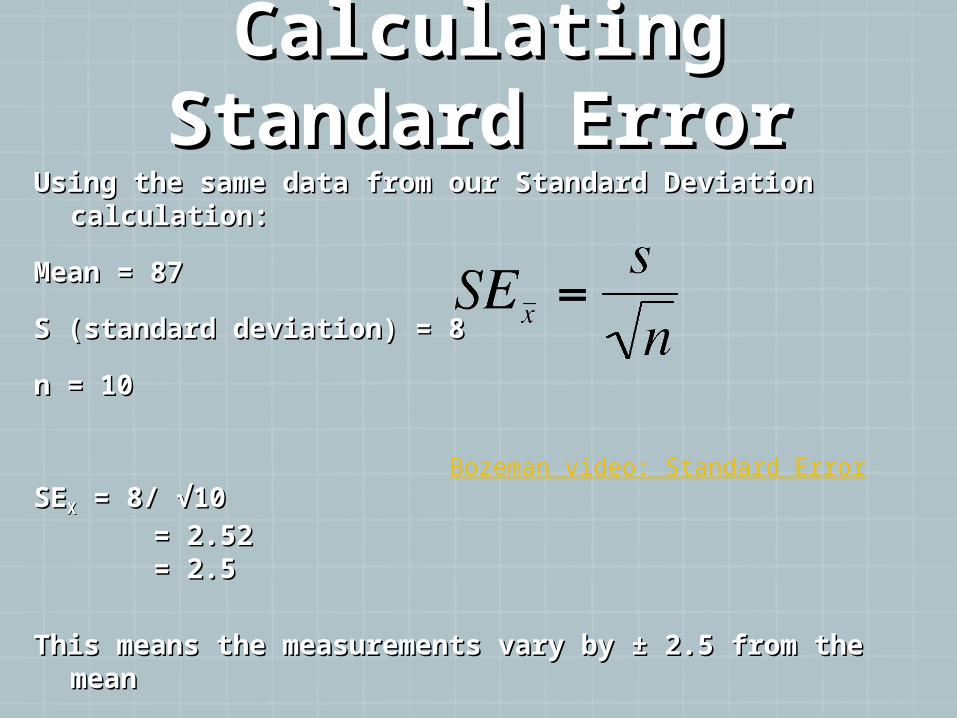
Calculating Calculating Standard ErrorStandard Error
Using the same data from our Standard Deviation Using the same data from our Standard Deviation calculation:calculation:
Mean = 87Mean = 87
S (standard deviation) = 8S (standard deviation) = 8
n = 10n = 10
SESEXX = 8/ √10 = 8/ √10 = 2.52= 2.52 = 2.5= 2.5
This means the measurements vary by This means the measurements vary by ± 2.5 from the ± 2.5 from the meanmean
Bozeman video: Standard Error
Graphing Graphing Standard ErrorStandard Error
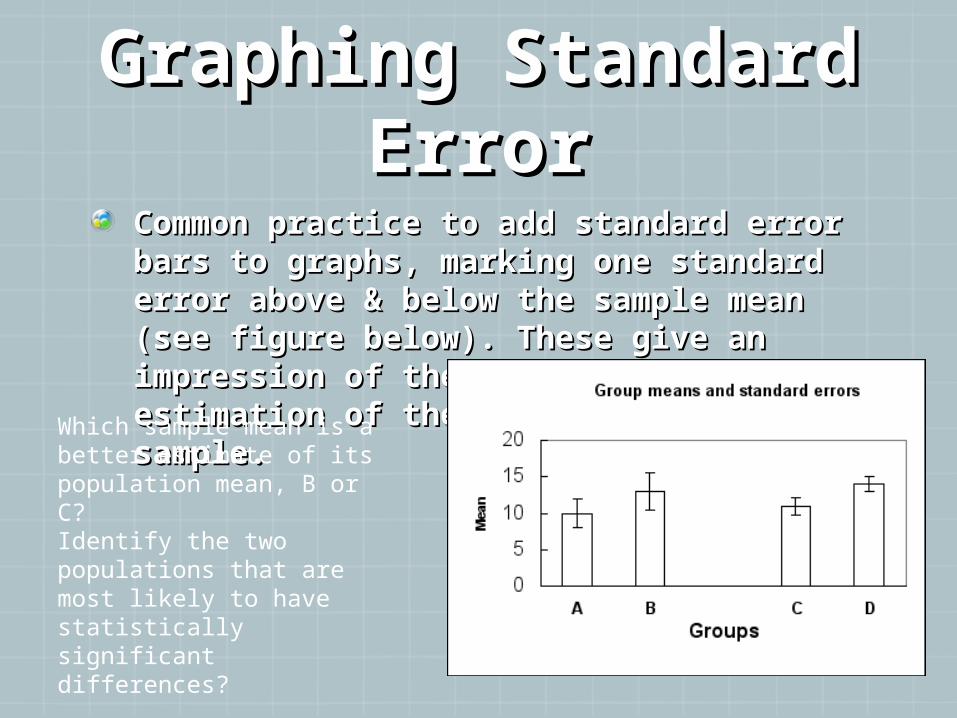
Common practice to add standard error Common practice to add standard error bars to graphs, marking one standard bars to graphs, marking one standard error above & below the sample mean error above & below the sample mean (see figure below). These give an (see figure below). These give an impression of the precision of impression of the precision of estimation of the mean, in each sample.estimation of the mean, in each sample.Which sample mean is a
better estimate of its population mean, B or C?
Identify the two populations that are most likely to have statistically significant differences?
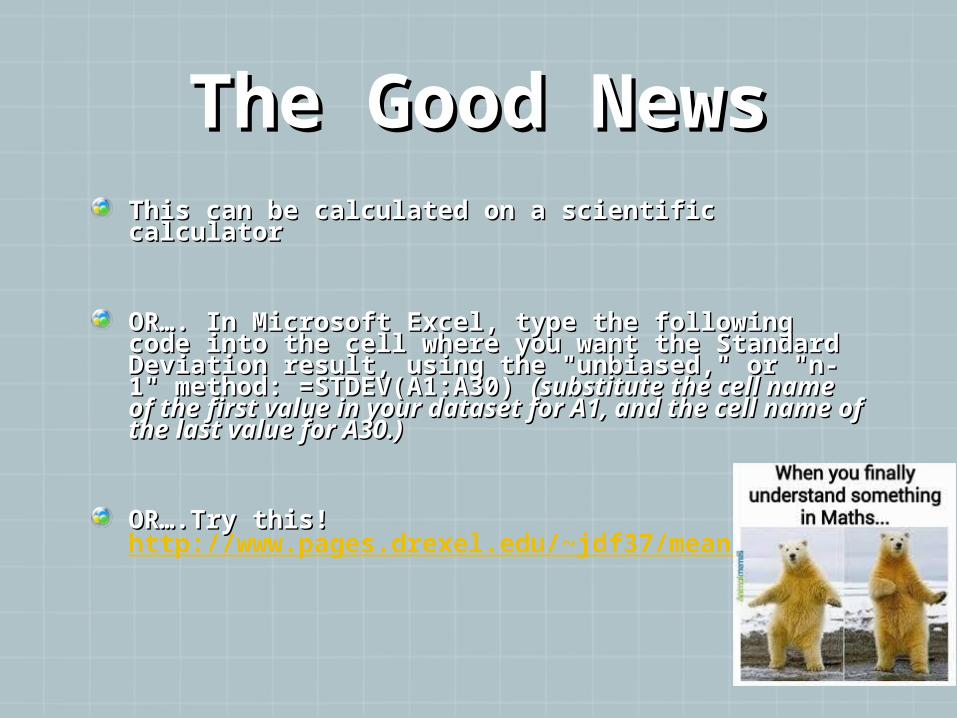
The Good NewsThe Good NewsThis can be calculated on a scientific calculatorThis can be calculated on a scientific calculator
OR…. In Microsoft Excel, type the following OR…. In Microsoft Excel, type the following code into the cell where you want the Standard code into the cell where you want the Standard Deviation result, using the "unbiased," or "n-1" Deviation result, using the "unbiased," or "n-1" method: =STDEV(A1:A30) method: =STDEV(A1:A30) (substitute the cell (substitute the cell name of the first value in your dataset for A1, name of the first value in your dataset for A1, and the cell name of the last value for A30.)and the cell name of the last value for A30.)
OR….Try this! OR….Try this! http://www.pages.drexel.edu/~jdf37/mean.htm
You DO need to know the You DO need to know the concept!concept!
standard deviation is a statistic that tells standard deviation is a statistic that tells how tightly all the various data points are how tightly all the various data points are clustered around the mean in a set of data. clustered around the mean in a set of data.
When the data points are tightly bunched When the data points are tightly bunched together and the bell-shaped curve is together and the bell-shaped curve is steep, the standard deviation is small steep, the standard deviation is small (precise results, smaller standard of (precise results, smaller standard of deviation)deviation)
When the data points are spread apart and When the data points are spread apart and the bell curve is relatively flat, a large the bell curve is relatively flat, a large standard deviation value suggests less standard deviation value suggests less precise resultsprecise results
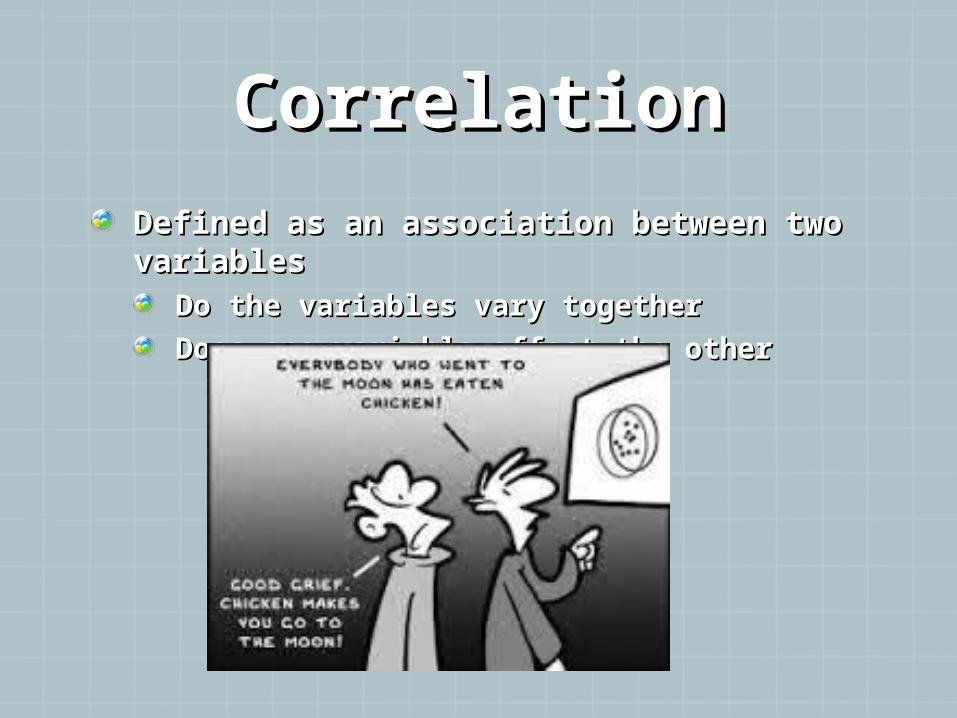
CorrelationCorrelationDefined as an association between two Defined as an association between two variablesvariables
Do the variables vary togetherDo the variables vary together
Does one variable affect the otherDoes one variable affect the other
Correlation cont.Correlation cont.Important to remember that correlation does Important to remember that correlation does not necessarily mean causationnot necessarily mean causation
Here are some true examples:Here are some true examples:Ice cream sales and the number of shark attacks Ice cream sales and the number of shark attacks on swimmers are correlated. on swimmers are correlated. Skirt lengths and stock prices are highly correlated Skirt lengths and stock prices are highly correlated (as stock prices go up, skirt lengths get shorter). (as stock prices go up, skirt lengths get shorter). The number of cavities in elementary school The number of cavities in elementary school children and vocabulary size have a strong positive children and vocabulary size have a strong positive correlation. correlation. Air temperature and the number of earthquakes Air temperature and the number of earthquakes (shake and bake)(shake and bake)
If there is correlation more research would be If there is correlation more research would be necessary to determine whether it is co-necessary to determine whether it is co-incidence or a real relation between the dataincidence or a real relation between the data

THE ENDTHE END
For todayFor today……….……….