Embed Size (px)
Citation preview

Statistics South AfricaPrivate Bag X44
Pretoria 0001
274 Schoeman StreetPretoria
Users enquiries: (012) 310-8600Fax: (012) 310-8500
Main switchboard: (012) 310-8911Fax: (012) 322-3374
E-mail: [email protected]: http://www.statssa.gov.za
Unemployment and employmentin South Africa
Statistics South Africa1998
Dr FM OrkinHead

Published by Statistics South AfricaPrivate Bag X44Pretoria0001
ISBN 0-621-28729-6
Copyright, 1998.
Data from this publication may be applied or processed, provided Statistics South Africa(Stats SA) is acknowledged as the source of the original data; that it is specified that theapplication and/or analysis is the result of the user’s independent processing of the data; andthat neither the basic data nor any reprocessed version or application thereof may be sold oroffered for sale in any form whatsoever without the prior permission of Statistics SouthAfrica.
Statistics South Africa (Stats SA) is the new name for what was previously known as theCentral Statistical Service (CSS).
ContentsPage
Executive summary
The new official definition of the unemployed 1Aims of the report 1Definitions of terms used in this document 2Summary of the report 2
The labour market 2The unemployed and those who are not economically active 4The employed in the October household surveys 5Formal sector employment 5The dynamics of employment 6Poverty and labour market status 6Further analyses 7
Chapter 1: Introduction
Surveys among formal businesses 9Household surveys 10
Re-weighting the OHS surveys 11Differences between OHS surveys over time 11
A new official unemployment rate 11Information on official and expanded definition of unemployment 12Technical notes 13
Handling missing and unspecified values 13Using decimal places 13
Layout of the rest of this report 13Definition of terms 14
Chapter 2: The labour market
Labour market status, 1994-1997 17Labour market status by population group and gender, 1997 18Comparison of labour force participation rates: official andexpanded definitions of unemployment 18Labour market status by location and gender, 1997 19Labour market status by education and gender, 1997 20Labour market status by age and gender, 1997 20
Chapter 3: The unemployed and those not economically active Unemployment rates, 1994-1997 23
Official unemployment rates by population group and gender,1997 25Official unemployment rates by location and gender, 1997 26Official unemployment rates by education and age, 1997 26Official unemployment rates by education and location, 1997 28
Length of time of unemployment 28Length of time of unemployment by gender and populationgroup, 1997 29
Those who are not economically active 29 Chapter 4: The employed Distribution of the employed in economic sectors 32
Distribution of the employed in economic sectors by gender,1997 33Distribution of the employed in economic sectors in urban andnon-urban areas, 1997 34
Distribution of occupations among the employed 34Distribution of occupations by gender, 1997 35Distribution of occupations by gender and population group,1997 36Distribution of occupations in urban and non-urban areas, 1997 36Distribution of occupations by education, 1997 37
Type of employment 38Type of employment by gender and population group, 1997 38
The informal sector 38 Chapter 5: Formal sector employment Total employment in the formal non-agricultural business sector 41 Comparison of formal job losses and gains by sector 41 Sectors in which employment increased 43
The wholesale, retail, motor trade and accommodation sectors 43The financial sector 43
Sectors in which employment decreased 43Community, social and personal services sector (includinggovernment) 43The manufacturing sector 43The mining and quarrying sector 44The construction sector 44The transport sector 44The electricity sector 44
Month-on-month changes in employment 44All sectors: month-on-month changes 45Sectors with overall gains: month-on-month changes 46Sectors with overall losses: month-on-month changes 47
Chapter 6: The dynamics of employment: the specialretrospective survey Movements into and out of employment 49Month-on-month changes in formal, establishment-basedemployment surveys and in the SRS 50
Total formal sector and SRS employment 50 Sectoral comparison 51
Chapter 7: Poverty and labour market status The economic active by income quintile and gender, 1995 55 Unemployment rates by income quintile and gender, 1995 56 Number of employed people per household by income quintile, 1995 56 Number of employed people per household by population
group, 1995 58 Chapter 8: Further analyses and comparisons of data sets Relationships among factors influencing unemployment andoccupation 59 Most important demographic factors affecting unemployment 59 Comparison of employment and unemployment with other economicindicators 61 Formal sector employment comparisons 61 OHS unemployment rates comparisons 61 Most important demographic factors affecting the distribution ofoccupations 61 Issues in comparing data sets 63 Official and expanded unemployment by location and gender 66 Appendix A: Official definitions of employment andunemployment Appendix B: The labour market, including miners
List of TablesPage
Table A: The labour market 3Table 1: The labour market 16Table 2: Labour force participation rates, using both the official and
expanded definitions of unemployment: 1997 19Table 3: The number of unemployed people between 1995 and 1997,
using both the official and the expanded definitions 23Table 4: The estimated number of employed men and women 31Table 5: Distribution of the employed in economic sectors: 1994-1997 32Table 6: Distribution of occupations among the employed, 1994-1997 34Table 7: The employed who are working in the informal sector 39Table 8: Employment in the non-agricultural formal business sector 42Table 9: Summary of 1997 unemployment rates (official definition) by
various groupings 60Table 10: Summary of occupational distribution in 1997 by various
groupings 62 Table 11: October household survey, 1994-1997: unemployment rates 65Table 12: Percentage of the population and of people reclassified for
different definitions of unemployment by population group andgender: 1997 67
List of FiguresPage
Figure A: Official unemployment rates by population group and gender:October 1997 4
Figure B: The percentage of employed in elementary occupations bypopulation group and gender 5
Figure C: Average monthly wages and salaries of men and women ineach income quintile: October 1995 7
Figure 1: Labour market status of the population aged 15 to 65 years:October 1994-October 1997 17
Figure 2: Labour market status by population group and gender: October1997 18
Figure 3: Labour market status by gender and education: October 1997 20Figure 4: Labour market status by gender and age: October 1997 21Figure 5: Unemployment rates, official and expanded: October 1994-
October 1997 24 Figure 6: Official unemployment rates by population group and gender:
October 1997 25Figure 7: Official unemployment rates by gender in urban and non-urban
areas: October 1997 26Figure 8: Official unemployment rates by education and age: October
1997 27
Figure 9: Official unemployment rates by location and education:October 1997 28
Figure 10: Length of time of unemployment by population group andgender: October 1997 29
Figure 11: Reasons for being not economically active (NEA) bypopulation group: October 1997 30
Figure 12: Distribution of the employed in economic sectors: October1997 32
Figure 13: Distribution of the employed in economic sectors by gender:October 1997 33
Figure 14: Occupation by gender among the employed: October 1997 35 Figure 15: Occupation by population group and gender among the
employed: October 1997 36 Figure 16: Occupation by education among the employed: October 1997 37Figure 17: Type of employment by population group and gender: October
1997 38 Figure 18: Employment in formal non-agricultural business sectors: April
1994-December 1997 45 Figure 19: Sectors in which there was an overall gain in employment:
April 1994-December 1997 46Figure 20: Sectors in which there was an overall loss in employment:
April 1994-December 1997 (community services,manufacturing and mining) 47
Figure 21: Sectors in which there was an overall loss in employment:April 1994-December 1997 (transport, construction andelectricity) 48
Figure 22: Comparison of month-on-month changes in formal sector andSRS employment 51
Figure 23: Comparison of month-on-month changes in formal sector andSRS employment in the community, social and personalservices sector 52
Figure 24: Comparison of month-on-month changes in formal sector andSRS employment in the manufacturing sector 53
Figure 25: Comparison of month-on-month changes in formal sector andSRS employment in the transport sector 53
Figure 26: Comparison of month-on-month changes in formal sector andSRS employment in the trade and accommodation sector 54
Figure 27: The percentage of men and women in each income quintilewho are economically active: 1997 56
Figure 28: Official unemployment rates in each income quintile: October1995 57
Figure 29: The percentage of households in each income quintilecontaining no employed people, or one or more employedpeople: October 1995 57
Figure 30: Official and expanded unemployment rates in urban and non-urban areas by gender 66
1
Executive summary
The new official definition of the unemployed
Statistics South Africa (Stats SA), previously known as the Central Statistical Service (CSS),recently revised its definition of the official unemployment rate in line with the mainInternational Labour Organisation (ILO) definition, which is used by more than eighty percentof both developed and less developed countries, and South Africa’s major trading partners (seeAppendix A).
On this new definition, the unemployed are those people within the economically activepopulation who:
(a) did not work during the seven days prior to the interview;(b) want to work and are available to start work within a week of the interview; and(c) have taken active steps to look for work or to start some form of self-employment
in the four weeks prior to the interview.
The economically active population consists of both those who are employed and those whoare unemployed. Its size therefore varies according to the definition of unemployment used.
The official unemployment rate is calculated as the percentage of the economically activepopulation which is unemployed, according to the above definition. The sequence ofcalculation is shown in Table A on p.3.
The new official unemployment rate corresponds to what Stats SA previously called the strictunemployment rate, i.e. using criterion (c) as well as (a) and (b), set out above. By contrast,the expanded unemployment rate does not require criterion (c), but only (a) and (b), and wasthe basis of the official definition used until recently.
Aims of this report
This report brings together information on employment and unemployment from diverseStats SA data sources.
• For employment statistics, two available sources are used – establishment surveysconducted among formal businesses and the public sector, and household surveys.
• For employment, unemployment, and employment in the informal sector, the only sourcepresently available – household surveys – is used.
Stats SA establishment surveys reach formal businesses and the public sector by post and fax.They exclude agriculture, the informal sector and domestic work. The latest revisions to thesesurveys are embodied in the quarterly survey of total employment and earnings (STEE) andthe survey of average monthly earnings (AME), which have been developed as integratedinstruments.
2
The main household surveys referred to in this document are the annual October householdsurveys (OHS) of 1994, 1995, 1996 and 1997, conducted by Stats SA. In these surveys, StatsSA asks informants in 30 000 households for information on the labour market status of allpeople aged 15 to 65 years. The surveys therefore cover informal as well as formal sectoremployment and include the agricultural sector and domestic workers. They also cover avariety of demographic, social and economic topics. In addition to these annual October household surveys, reference will also be made to twoother Stats SA household surveys: • the income and expenditure survey of 1995, during which extra information was collected
from the same households as those visited during the 1995 OHS; and• the special retrospective survey of employment and unemployment (SRS), which was
conducted during September 1997 among a sample of respondents drawn from 12 000households.
People working in the mining and quarrying sector were excluded from household surveycalculations. Because so many workers in this sector reside in inaccessible hostels, they areinadequately covered in a household survey. For supplementary figures which includeminers, see Appendix B.
Definitions of terms used in this document Definitions of all terms used in this document are given on p. 14.
Summary of the report
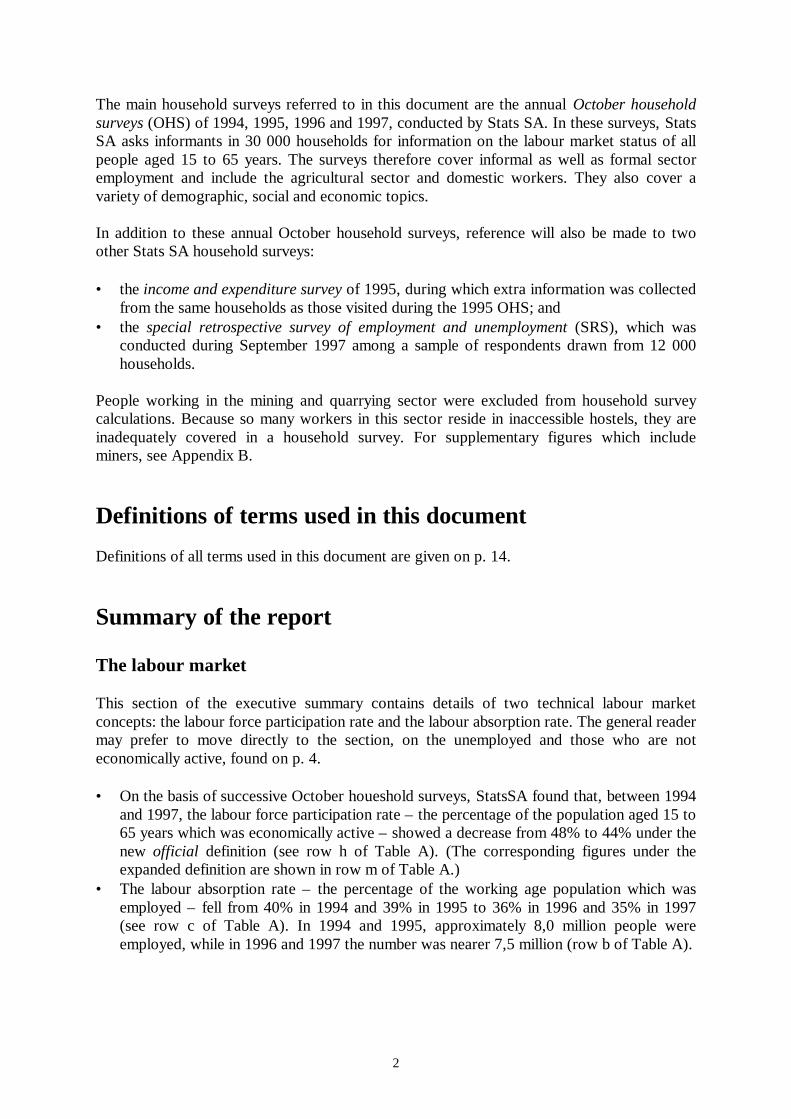
The labour market This section of the executive summary contains details of two technical labour marketconcepts: the labour force participation rate and the labour absorption rate. The general readermay prefer to move directly to the section, on the unemployed and those who are noteconomically active, found on p. 4. • On the basis of successive October houeshold surveys, StatsSA found that, between 1994
and 1997, the labour force participation rate – the percentage of the population aged 15 to65 years which was economically active – showed a decrease from 48% to 44% under thenew official definition (see row h of Table A). (The corresponding figures under theexpanded definition are shown in row m of Table A.)
• The labour absorption rate – the percentage of the working age population which wasemployed – fell from 40% in 1994 and 39% in 1995 to 36% in 1996 and 35% in 1997(see row c of Table A). In 1994 and 1995, approximately 8,0 million people wereemployed, while in 1996 and 1997 the number was nearer 7,5 million (row b of Table A).
3
• The labour absorption rate differed widely between population groups. For men, it rangedbetween 35% for Africans and 68% for whites; for women, it ranged between 22% forAfricans and 44% for whites.
• Completion of school or a tertiary education was related to higher rates of labourabsorption.
• Urban men had the highest labour absorption rate, with 40% of those of working agebeing employed; non-urban women had the lowest, with only 15%.
• There were lower levels of economic activity for men and women in both the 15 to 30years and 46 to 65 years age groups, with peak economic activity in the intermediate 31to 45 years age group.
Table A: The labour market
1: Employed measured by OHS 1994-1997, and labour absorption
1994 1995 1996 1997
a Population 15-65 years (000s)1 20 866 21 324 21 815 22 294
b Employed measured by OHS (000s) 7 971 8 069 7 590 7 548
c=100*b/a Labour absorption rate ( % ) 38,2 37,8 34,8 33 9
2: Official unemployment rate measured by OHS 1994-1997, and corollaries
1994 1995 1996 1997
d Unemployed measured by OHS: officialdefinition (000s)
1 988 1 644 2 019 2 238
e=b+d Economically active (000s) 9 959 9 713 9 609 9 787
f=a-e Not economically active (000s) 2 10 907 11 612 12 206 12 507
g=100*d/e Official unemployment rate ( % ) 20,0 16,9 21,0 22,9
h=100*e/a Labour force participation rate ( % ) 47,7 45,5 44,0 43,9
3: Expanded unemployment rate measured by OHS 1994-97, and corollaries
1994 1995 1996 1997
i Unemployed measured by OHS:expanded definition: (000s)
3 672 3 321 4 197 4 551
j=b+i Economically active (000s) 11 643 11 390 11 787 12 100
k=a-j Not economically active (000s) 9 223 9 934 10 028 10 195
l=100*i/j Expanded unemployment rate ( % ) 31,5 29,2 35,6 37,6
m=100*j/a Labour force participation rate ( % ) 55,8 53,4 54,0 54,3 1. The population figures are derived from preliminary population estimates of Census ‘96. 2. The not-economically active include pensioners, full-time students, disabled, people and full-time homemakers.
4
The unemployed and those who are not economically active
• Unemployment in South Africa has increased since 1995. The official unemployment ratewas 20,0% in 1994, falling to 16,9% in 1995 and then rising to 21,0% in 1996 and to22,9% in 1997. (The expanded unemployment rate was 31,5% in 1994, decreasing to29,2% in 1995 and then rising to 35,6% in 1996 and to 37,6% in 1997.)
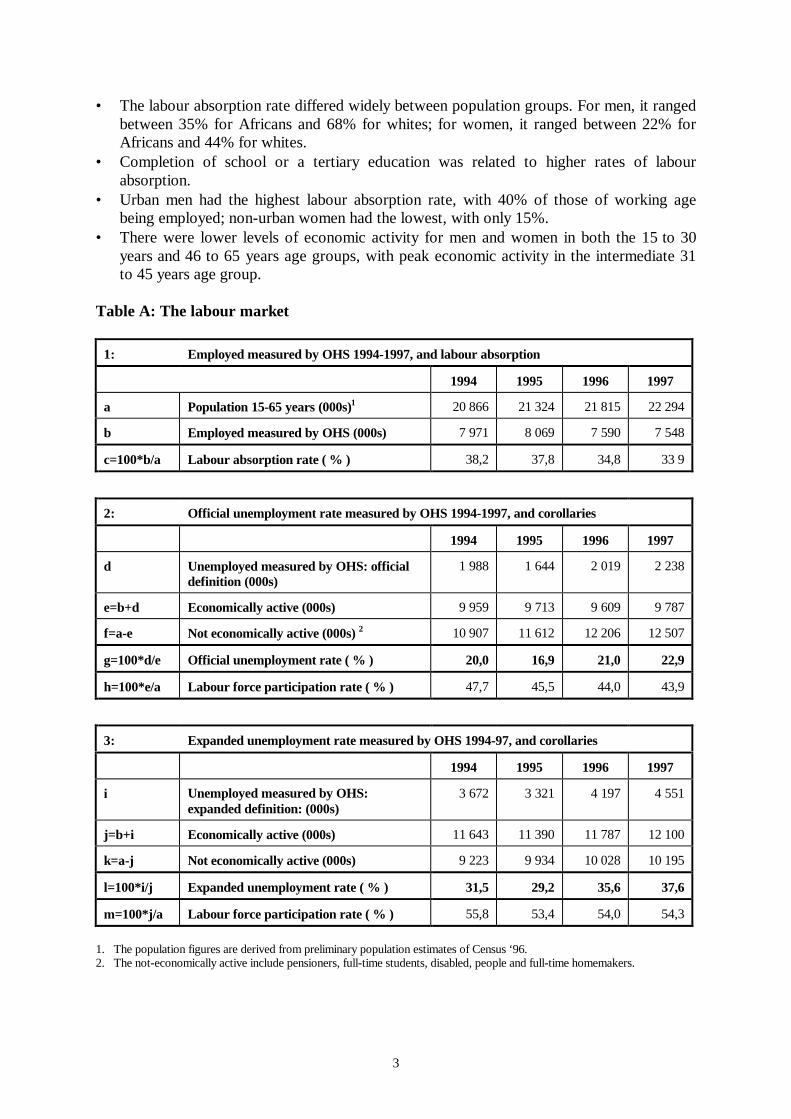
• In 1997, official unemployment rates were highest for African people (29%), followed bycoloured (16%), Indian (10%) and then white (4%) people (see right-most bars in Figure A).
• Official unemployment rates were lower for men than for women overall (19% versus28%), and within each population group (See Figure A). For example, among coloureds14% of men versus 19% of women were unemployed.
• Using the official definition, 10% of the economically active in the oldest age group (46to 65 years), and 19% of those in the middle group (31 to 45 years) were unemployed,compared to 35% of those in the youngest age group (15 to 30 years).
• Twenty-seven percent of all economically active people in non-urban areas wereunemployed in 1997, using the official definition, compared to 22% of those in urbanareas.
• The majority of those who were unemployed in 1997 had been unable to find a job for atleast a year.
• The majority of people who are not economically active are students, retirees or full-timehomemakers.
Figure A: Official unemployment rates by population group and gender: October 1997
5
The employed in the October household surveys • Altogether, approximately 8,0 million people were employed in 1994, decreasing to
approximately 7,5 million in 1997 (see row b of Table A).• In both the formal sector series and the household surveys there was a slight increase in
employment in 1995 compared with 1994, and then a decrease in 1996 and 1997.• The tertiary sector dominated the work opportunities of the economy. At least one in
every two jobs were classified within this sector between 1994 and 1997.• Women in particular tended to work in the tertiary sector – 75% of employed women
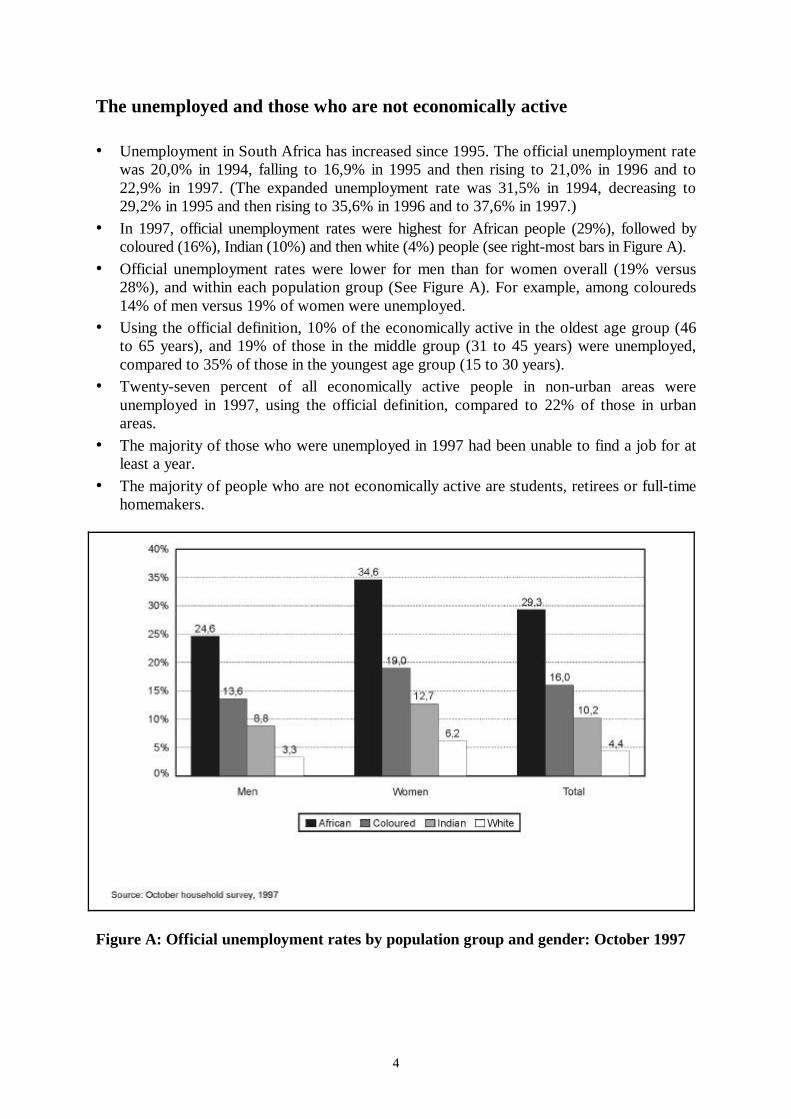
were working in this sector in 1994, decreasing to 69% in 1997.• There was an overall decrease in the number of people employed in elementary
occupations between 1994 and 1997, and in the proportions (from 36% to 28% of alljobs). However, elementary occupations continued to dominate the employment picture.
• Among employed African women almost half (49%) were in elementary jobs in 1997,compared to 41% among employed coloured women. By contrast, among employedAfrican men 24% did elementary work as against 30% of coloured men (see Figure B).
• The vast majority of employed people worked as employees in 1997.
Figure B: The percentage of employed in elementary occupations by population groupand gender: October 1997 Formal sector employment • Since December 1994, the number of jobs in the formal non-agricultural sector has been
gradually decreasing from approximately 5,3 million in December 1994 to approximately5,1 million in December 1997. The decline was not uniform across all sectors.
6
• In two sectors, namely, trade and financial services, new employment was recorded.These sectors accounted for around 20% of all formal sector jobs in December 1997.
• In six of the eight sectors (community, personal and social services; manufacturing;mining and quarrying; construction; and transport and electricity) job losses wererecorded. These six sectors contributed about 80% of jobs to total formal sectoremployment in December 1997.
The dynamics of employment • In the special retrospective survey (SRS) of 1997, 12 000 respondents were asked to
report on their own experiences of employment and unemployment over the 40-monthperiod starting in April 1994 (the time of the first democratic elections in South Africa),and ending in September 1997 (the time of the interview).
• Throughout the 40 months, there were some 1 194 changes of status; 608 in the sample of12 000 were cases where a job was lost, and 587 were cases when an unemployed or noteconomically active person found a job.
• Of the persons in the sample who were employed at the time of the interview, more than93% reported having worked throughout the three-year period, without experiencing asingle episode of unemployment. Conversely, of the unemployed at the time of theinterview, 90% had not worked at any time during the period.
• When comparing month-on-month employment changes in the SRS and those in theformal sector, both showed an overall decrease in employment between June 1994 andSeptember 1997. But the overall decrease was steeper in the formal sector statistics thanin the SRS. This may be due in part to employment opportunities arising in the informalsector.
Poverty and labour market status • In 1995, Stats SA conducted an income and expenditure survey at the same time as the
annual October household survey. On the basis of the data from the second survey,households were divided into five roughly equal groups, or quintiles, according to annualhousehold income.
• For both women and men, there was a steady decrease in the unemployment rate withincreasing household income. Among the poorest fifth of households, 29% ofeconomically active men and 36% of economically active women were unemployed.Conversely, among the wealthiest fifth of households, only 4% of economically activemen and 6% of economically active women were unemployed.
• Thirty-five percent of households in the bottom quintile contained no employed people atall, compared to 23% in the top quintile.
• Conversely, 24% of households in the bottom quintile contained two or more employedpeople, compared to 37% of those in the top quintile.
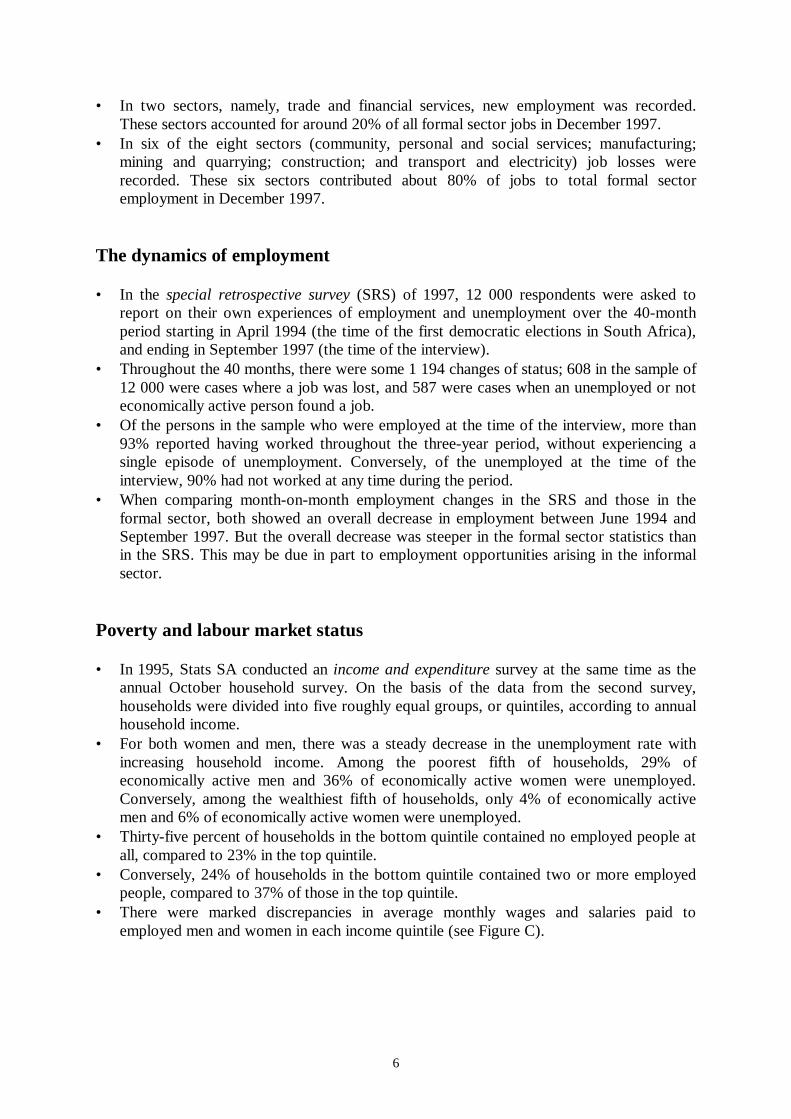
• There were marked discrepancies in average monthly wages and salaries paid toemployed men and women in each income quintile (see Figure C).
7
Figure C: Average monthly wages and salaries of men and women in each incomequintile: October 1995 Further analyses • A time series analysis shows that employment and unemployment change in relation to
the inflation rate, gross domestic product (GDP) and interest rates. Overall,unemployment rises some months after the inflation rate and GDP have decreased andinterest rates have increased.
• A loglinear analysis displays the pattern of simultaneous relationships between officialunemployment rates, occupation of the employed and factors such as age, gender,population group, and urban/non-urban milieu. Population group, gender, education andage are important interacting variables. This is discussed in the subsequent chapters.

PLEASE TURN THE PAGE
9
Chapter 1 Introduction Decision-makers in South Africa are increasingly seeking information on the extent ofemployment and unemployment, not only for policy formulation, but also for thedevelopment of relevant programmes, and for monitoring their progress over time. This report brings together information on employment and unemployment from diverse datasets gathered by Statistics South Africa (previously known as the Central Statistical Service). • For employment statistics, two available sources are used – establishment surveys
conducted among formal businesses and the public sector, and household surveys.• For employment, unemployment, and employment in the informal sector, the only
presently available source – household surveys – is used. Each of these sources, what they cover, and what they exclude, is discussed below.
Surveys among formal businesses The information presented here is based on a series of 17 monthly or quarterly labour surveyscovering formal businesses (including private and public establishments or firms), collectedbetween April 1994 and December 1997. All of these surveys, as well as other establishment-based labour surveys such as the occupational survey, have recently been replaced by threenew cross-sectoral surveys. In particular, the quarterly survey of total employment andearnings (STEE) and the survey of average monthly earnings (AME) have been developed asintegrated instruments to obtain the same information, but more promptly and with betterspread. The following sectors were included in the previous 17 formal business surveys (and are nowincluded in STEE and AME): • mining and quarrying;• manufacturing;• electricity (Eskom only);• construction;• trade;• hotels and guest houses, bed and breakfast accommodation;• transport;• building societies, banking institutions, and insurance companies;• national departments, provincial administrations, and local governments;• parastatal institutions, universities and technikons, and public corporations.
10
The following sectors are excluded: • agriculture, hunting, forestry and fishing;• domestic work in private households;• the informal sector. Information is collected on the number of employees for the last pay day of the referenceperiod (month or quarter); the number of employees appointed and the number who left thebusiness/organisation; the gross salaries and wages paid; and severance, termination andredundancy payments.
Household surveys The main household surveys referred to in this document are the annual October householdsurveys (OHS) of 1994, 1995, 1996 and 1997, conducted by Statistics South Africa (StatsSA). These are general surveys covering a variety of demographic, social and economictopics, as well as employment and unemployment. Stats SA has conducted five October household surveys. The first, undertaken in October1993, is not comparable with later surveys, since it excluded the former Transkei,Bophuthatswana, Venda and Ciskei (TBVC states). • The 1994 OHS was the first household survey that covered the entire country, including
the former TBVC states. Interviews were conducted with respondents in 30 000households in a thousand enumeration areas (EAs). Thirty households were visited ineach EA.
• In 1995, the OHS was again conducted among 30 000 households. However, the samplewas more widely dispersed throughout the country. Three thousand EAs were sampled,and ten households visited in each EA.
• In 1996, the survey was conducted in November. Due to time and financial constraints,16 000 households were visited in 1 600 EAs.
• In 1997, the sample size was once again increased to 30 000 households, and visited as in1995.
In addition to the annual OHS, two other Stats SA household surveys will be referred to inthis report:
• the income and expenditure survey of 1995, during which information was collected fromthe same households as those visited during the 1995 OHS; and
• the special retrospective survey of employment and unemployment (SRS), which wasconducted during September 1997 among a sample of 12 000 respondents drawn one perhousehold. This survey attempted to obtain retrospective information directly fromrespondents rather than from proxy respondents. It covered employment andunemployment trends from April 1994, the time of the country’s first democraticelections, up to the time of the survey.
11
Re-weighting the OHS surveys Previously, OHS surveys were weighted to reflect estimates of population size using the 1991population census. However, the preliminary results of the 1996 population census indicatethat the size of the country’s population had been over-estimated in the demographic modelthat was used to adjust the tally in 1991. • For the purposes of this publication, the data in these surveys have been re-weighted by
population group, gender and age group, on the basis of Stats SA’s preliminary estimatesof the size of the population in 1996. These estimates in turn are based upon the post-enumeration survey (PES), conducted just after the October 1996 population census.Consequently, the population numbers and percentages reported here differ from thosereported previously.
• The PES was designed for establishing the census undercount, rather than to weightsample surveys. A systematic sample of 800 EAs was drawn, stratified by EA type (forexample, by formal and informal settlements). Interviews were conducted in thehouseholds in a particular EA. The sample of households is therefore highly clustered.But it is the best data set that is presently available for weighting purposes.
• To allow for population growth in advance of Census ’96 results, taking October 1996 asthe starting point, the weights for 1994, 1995 and 1997 were further adjusted backwardsand forwards to a population growth rate of 2,07% per annum. This rate was agreed to ina workshop of demographers run jointly by the Financial and Fiscal Commission (FFC)and Stats SA during July 1996.
• This agreed overall population growth rate may be inaccurate, particularly when appliedthe age group 15 to 65 years. This is the age category defined as the working agepopulation, since the overall growth rate differs across diverse age categories. The finalresults of Census ’96 will give a better indication of the numbers and proportions in allage groups.
Differences between OHS surveys over time On the basis of its own experience, and advice from users and consultants from otherstatistical agencies, Stats SA has been attempting to refine and improve the OHSquestionnaire, particularly the component on employment and unemployment. Definitionshave also been refined. The questions or sequence have therefore altered somewhat overtime. Nevertheless, direct comparisons have been sought by re-categorising duringcomputation.
A new official unemployment rate In accordance with widely-accepted international practice, Stats SA has recently changed itsofficial definition of unemployment. The unemployed are defined as those people within theeconomically active population who:
(a) did not work during the seven days prior to the interview; (b) want to work and are available to start work within a week of the interview; and (c) have taken active steps to look for work or to start some form of self-employment
in the four weeks prior to the interview.
12
The economically active population consists of both those who are employed and those whoare unemployed. Its size therefore varies according to the definition of unemployment used. The official unemployment rate is calculated as the percentage of the economically activepopulation which is unemployed, according to the above definition. The sequence ofcalculation is shown in Table 1. The new official unemployment rate corresponds to what Stats SA previously called the strictunemployment rate, i.e. using criterion (c) as well as (a) and (b), as set out above. Bycontrast, the expanded unemployment rate – the official definition used until recently – doesnot require criterion (c), but only (a) and (b). The narrower International Labour Organisation (ILO) definition, which has been adopted byStats SA, is used by more than eighty percent of both developed and less-developed countries,among 114 countries which report their unemployment rate to the ILO, and by South Africa'smajor trading partners (see Appendix A). Among the countries including work-seeking behaviour in their official definition, i.e.criterion (c), the reference period varies. Some countries use the week prior to the interviewas the reference period for work-seeking, others use two or four weeks or a month, and yetothers use the previous year. However, the most common time period is four weeks prior tothe interview. Stats SA has therefore retained this time period for work-seeking in its newofficial definition. In addition to international comparability, Stats SA changed the official definition fortechnical reasons. The reporting by respondents, or proxy respondents, of wanting to workand availability for work are more subjective and unstable than reporting of actual work-seeking behaviour.
Information on official and expanded definition ofunemployment Stats SA has published the expanded as well as the new official definition of the unemploymentrate, partly for comparability with previous OHS reports, and partly because, as the ILO notes,an expanded definition may be appropriate ‘in situations where the conventional means ofseeking work are of limited relevance, where the labour market is unorganised or of limitedscope, where labour absorption is at the time inadequate’. There are various indications thatthese circumstances are applicable to some extent in South Africa. • Among those who are included in the expanded but not the strict definition of
unemployment will be discouraged job-seekers (those who said they were unemployed buthad not taken active steps to find work in the four weeks prior to the interview).
• The SRS shows that the main reasons cited among discouraged work-seekers for havingstopped looking for work are a loss of hope of finding work (33%), a lack of jobs in thearea in which they live (25%) and a lack of money for transport to look for work (18%).
• In a situation where unemployed people know that there are very few, if any, jobsavailable, they may feel that the financial and other costs of work-seeking are notworthwhile.
13
• The main method which people had in mind regarding seeking work, according to thepreliminary findings of the SRS, turns out to be a rather stringent criterion. It involvedgoing in person to workplaces asking for work (72% of unemployed people who hadlooked for work four weeks prior to the interview had taken this step, either as the onlystep or else in combination with other steps).
Technical notes Handling missing and unspecified values Missing values are excluded from calculations of percentages in this publication. Using decimal places In tables and graphs, percentages are indicated to the first decimal place. In the text, forconvenience of use by policy-makers, percentages are rounded to the nearest whole number,except for the aggregate unemployment rates and establishment comparisons, where smalldifferences necessitate the use of a decimal place.
Layout of the rest of this report Chapter 2 examines the four sequential OHSs (1994 to 1997) and focuses on the labourmarket as measured in these surveys, including the economically active, the employed andthe unemployed. Chapter 3 focuses specifically on unemployment, and sets out the unemployment rates usingthe two definitions (official and expanded). Then it examines the length of time that peoplehave been unemployed. Finally, it focuses on those who are out of the labour market, the ‘noteconomically active’, and their reasons for this status. Chapter 4 describes the work situation of the employed, using household survey data, byeconomic sector and by occupation. The type of employment (whether the person is self-employed or an employee or both, or a domestic worker) is also discussed. Chapter 5 reviews employment in the non-agricultural formal business sector, as reflected inStats SA collections from public and private sector establishments. Chapter 6 compares the results of the SRS with those of the business surveys to examinelabour market dynamics. Chapter 7 examines the data concerning poverty from the 1995 income and expendituresurvey, and its links to the labour market, via the 1995 OHS. Chapter 8 looks at some analytical aspects of comparing diverse data sets.
14
Definitions of terms used in this document • A household consists of a single person or a group of people who live together for at least four nights a
week, who eat together and who share resources.• The working age population includes all those aged between 15 and 65 years.• The economically active population consists of both those who are employed and those who are
unemployed. The terms supply of labour and the labour force are used as synonyms for the termeconomically active population.
• Labour market status refers to whether or not a person is in or out of the labour market, i.e. whether ornot he or she is economically active.
• The employed are those who performed work for pay, profit or family gain in the seven days prior tothe household survey interview, or who were absent from work during these seven days but did havesome form of work for pay, profit or family gain during this time.
• The unemployed are those who did not work during the seven days prior to the interview, but werelooking for, or willing to accept, work.
• The unemployment rate is calculated as the percentage of the economically active population which isunemployed. As discussed earlier, there are two unemployment rates, the official and the expanded.
• The people who are out of the labour market or who are not economically active are those in the agecategory 15 to 65 years who are not available for work. This category includes full-time scholars andstudents, full-time homemakers, those who are retired, and those who are unable or unwilling to work.
• The labour force participation rate is calculated as the percentage of the working age populationwhich is economically active (the employed and the unemployed).
• The labour absorption rate is calculated as the percentage of the working age population which isemployed.
• The formal sector includes all businesses which are registered.• The informal sector consists of those businesses which are unregistered. They are generally small in
nature, and are seldom run from business premises, using instead homes, street pavements or otherinformal arrangements.
• Economic sector or industry refers to the type of organisation or business in which the person works,for example, agriculture, forestry and fishing, manufacturing or construction. There are nine economicsectors (domestic work is usually included in the community, personal and social services sector).
• Occupation refers to the actual work the person does, for example, professional, clerical or elementarywork. There are nine broad occupational categories (domestic work is usually included as elementarywork). The same occupation may be carried out in various economic sectors.
• The primary sector includes agriculture, forestry, fishing, mining and quarrying.• The secondary sector includes manufacturing, electricity and other utilities, and construction.• The tertiary sector includes trade, transport, financial and business services, and social, personal and
community services.• Type of employment refers to whether or not the person is self-employed, or works as an employee, or
both, or else works as a domestic worker in a household.• Location refers to whether the person lives in an urban or non-urban area.
⇒ An urban area is one which has been legally proclaimed as being urban. It includes towns,
cities and metropolitan areas.⇒ A semi-urban area is not part of a legally proclaimed urban area, but adjoins it. Informal
settlements are examples of these types of areas.⇒ In this publication, semi-urban areas have been included with urban areas.⇒ All other areas are classified as non-urban, including commercial farms, small settlements,
rural villages and other areas which are further away from towns and cities. • Workers include the self-employed, employers and employees in both the formal and informal sectors.
15
Chapter 2 The labour market This chapter describes the features of the labour market, as depicted by four successiveOctober household surveys (OHSs, 1994-1997). • The target population consists of those in the age category 15 to 65 years (the working
age population) and their labour market status.• These include the employed, the unemployed according to the official and the expanded
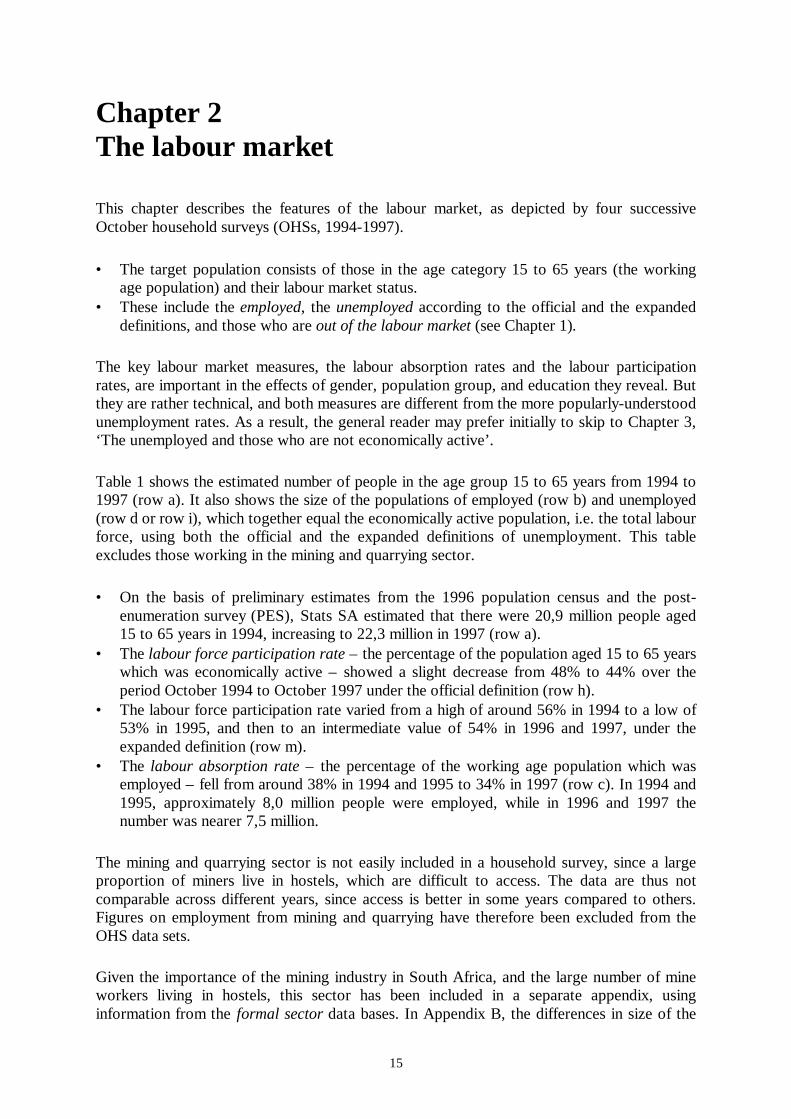
definitions, and those who are out of the labour market (see Chapter 1). The key labour market measures, the labour absorption rates and the labour participationrates, are important in the effects of gender, population group, and education they reveal. Butthey are rather technical, and both measures are different from the more popularly-understoodunemployment rates. As a result, the general reader may prefer initially to skip to Chapter 3,‘The unemployed and those who are not economically active’. Table 1 shows the estimated number of people in the age group 15 to 65 years from 1994 to1997 (row a). It also shows the size of the populations of employed (row b) and unemployed(row d or row i), which together equal the economically active population, i.e. the total labourforce, using both the official and the expanded definitions of unemployment. This tableexcludes those working in the mining and quarrying sector. • On the basis of preliminary estimates from the 1996 population census and the post-
enumeration survey (PES), Stats SA estimated that there were 20,9 million people aged15 to 65 years in 1994, increasing to 22,3 million in 1997 (row a).
• The labour force participation rate – the percentage of the population aged 15 to 65 yearswhich was economically active – showed a slight decrease from 48% to 44% over theperiod October 1994 to October 1997 under the official definition (row h).
• The labour force participation rate varied from a high of around 56% in 1994 to a low of53% in 1995, and then to an intermediate value of 54% in 1996 and 1997, under theexpanded definition (row m).
• The labour absorption rate – the percentage of the working age population which wasemployed – fell from around 38% in 1994 and 1995 to 34% in 1997 (row c). In 1994 and1995, approximately 8,0 million people were employed, while in 1996 and 1997 thenumber was nearer 7,5 million.
The mining and quarrying sector is not easily included in a household survey, since a largeproportion of miners live in hostels, which are difficult to access. The data are thus notcomparable across different years, since access is better in some years compared to others.Figures on employment from mining and quarrying have therefore been excluded from theOHS data sets. Given the importance of the mining industry in South Africa, and the large number of mineworkers living in hostels, this sector has been included in a separate appendix, usinginformation from the formal sector data bases. In Appendix B, the differences in size of the
16
economically active population, consisting of the employed and the unemployed, are shownwhen miners are included.
Table 1: The labour market
(i): Employed measured by OHS 1994-1997, and labour absorption
1994 1995 1996 1997
a Population 15-65 years (000s)1 20 866 21 324 21 815 22 294
b Employed measured by OHS (000s) 7 971 8 069 7 590 7 548
c=100*b/a Labour absorption rate ( % ) 38,2 37,8 34,8 33 9
(ii): Official unemployment rate measured by OHS 1994-1997, and corollaries
1994 1995 1996 1997
d Unemployed measured by OHS: officialdefinition (000s)
1 988 1 644 2 019 2 238
e=b+d Economically active (000s) 9 959 9 713 9 609 9 787
f=a-e Not economically active (000s) 2 10 907 11 612 12 206 12 507
g=100*d/e Official unemployment rate ( % ) 20,0 16,9 21,0 22,9
h=100*e/a Labour force participation rate ( % ) 47,7 45,5 44,0 43,9
(iii): Expanded unemployment rate measured by OHS 1994-97, and corollaries
1994 1995 1996 1997
i Unemployed measured by OHS:expanded definition: (000s)
3 672 3 321 4 197 4 551
j=b+i Economically active (000s) 11 643 11 390 11 787 12 100
k=a-j Not economically active (000s) 9 223 9 934 10 028 10 195
l=100*i/j Expanded unemployment rate ( % ) 31,5 29,2 35,6 37,6
m=100*j/a Labour force participation rate ( % ) 55,8 53,4 54,0 54,3 1. The population figures are derived from preliminary population estimates of Census ‘96. 2. The not-economically active include pensioners, full-time students, disabled people and full-time homemakers.
17
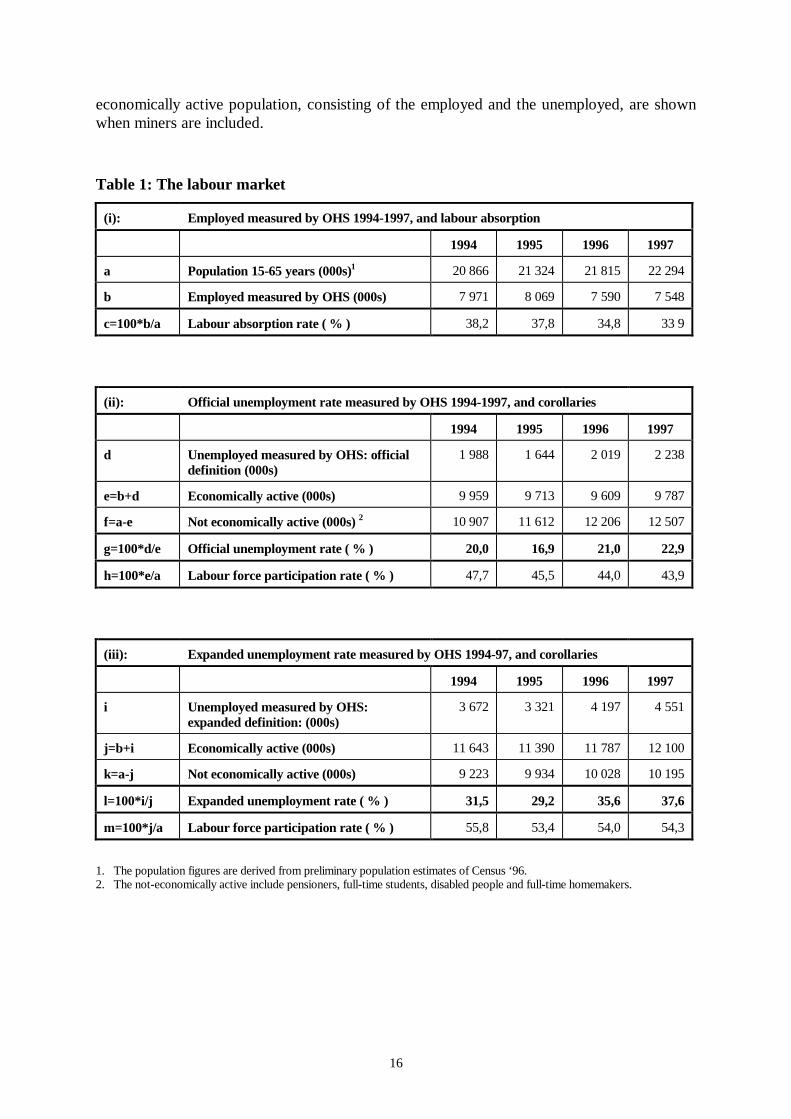
Labour market status, 1994-1997 Figure 1 and the accompanying table (with the graph) show, for 1994 to 1997, the number ofpeople aged 15 to 65 years (the working age population) in three categories – employed,unemployed and not economically active. For each year, breakdowns are provided for boththe official and expanded definitions of employment. • Under both definitions of unemployment, the proportion of those unemployed decreased
between 1994 and 1995, but then increased in 1996 and 1997 to exceed the 1994 levels.• The proportion of those in the age category 15 to 65 who were unemployed, as shown in
this graph, is not the same as the unemployment rate, since the former calculationincludes those who are out of the labour market. The unemployment rate, on the otherhand, is the proportion of the economically active who are unemployed.
Figure 1: Labour market status of the population aged 15 to 65 years: October 1994-October 1997
18
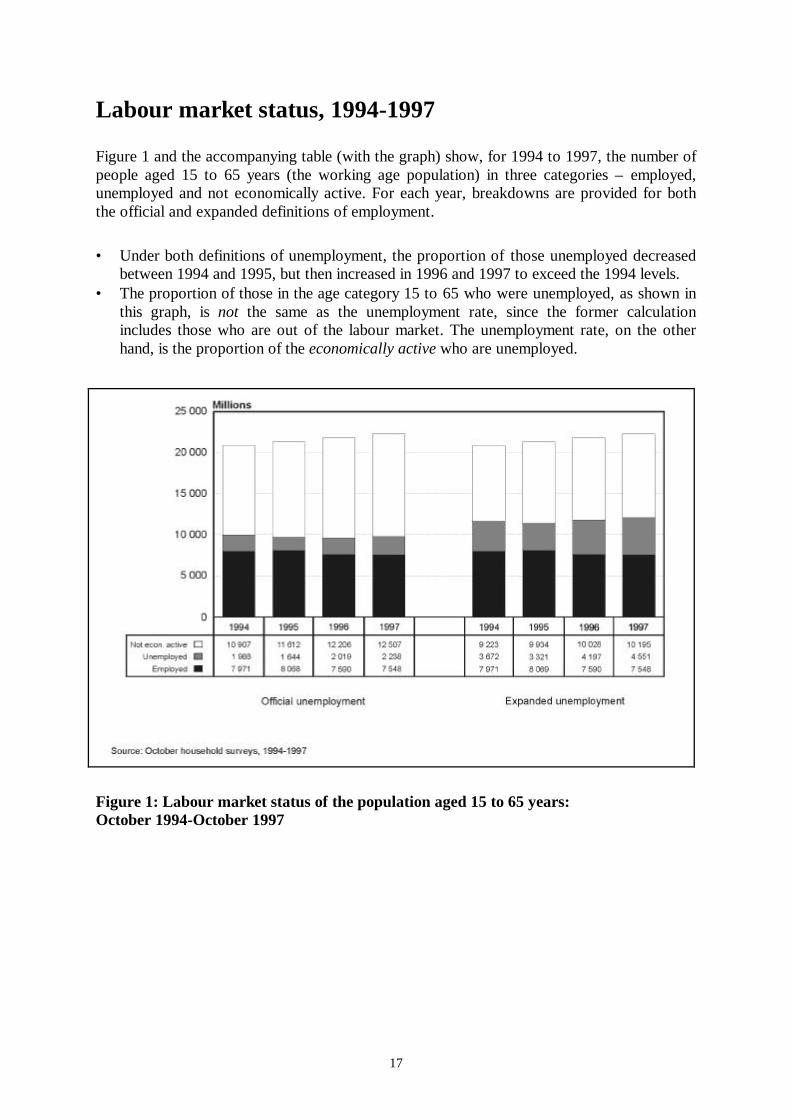
Labour market status by population group and gender, 1997 Figure 2 indicates the percentage of the working age population who were either employed orunemployed or who were not economically active in 1997 by gender and population group,using the official definition. • In all population groups, a higher proportion of men than women was employed.• The labour absorption rate, i.e. the percentage of the working age population which is
employed, differed widely between population groups. For men, it ranged between 35%for Africans and 68% for whites. For women, it ranged between 22% for Africans and44% for whites.
Figure 2: Labour market status by population group and gender: October 1997 Comparison of labour force participation rates: official and expandeddefinitions of unemployment Table 2 shows the percentage of people in the age category 15 to 65 years who wereeconomically active in 1997, in South Africa as a whole, and in urban and non-urban areas,using both the official and expanded definitions of unemployment. • With the official definition, 47% of African men were classified as economically active,
as against 64% of coloured and approximately 70% of Indian and white men; 34% ofAfrican women were classified as economically active, compared with 39% of Indian and47% of coloured and white women.
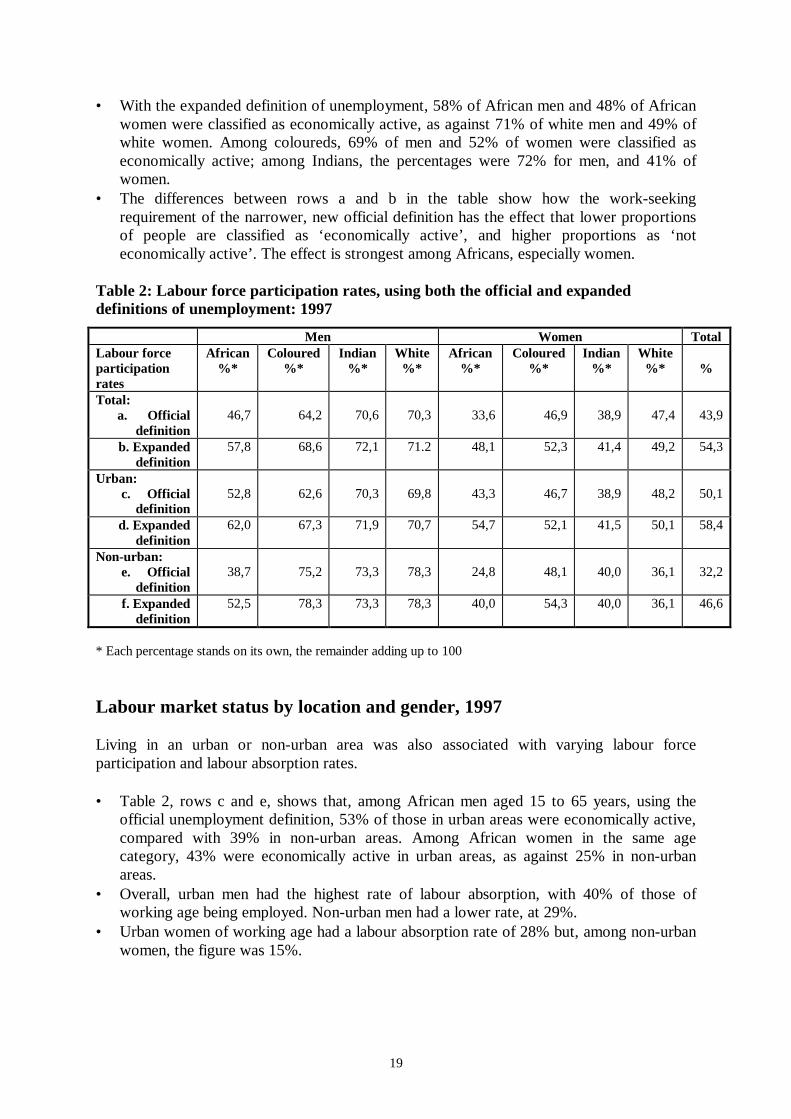
19
• With the expanded definition of unemployment, 58% of African men and 48% of Africanwomen were classified as economically active, as against 71% of white men and 49% ofwhite women. Among coloureds, 69% of men and 52% of women were classified aseconomically active; among Indians, the percentages were 72% for men, and 41% ofwomen.
• The differences between rows a and b in the table show how the work-seekingrequirement of the narrower, new official definition has the effect that lower proportionsof people are classified as ‘economically active’, and higher proportions as ‘noteconomically active’. The effect is strongest among Africans, especially women.
Table 2: Labour force participation rates, using both the official and expandeddefinitions of unemployment: 1997 Men Women Total Labour forceparticipationrates
African %*
Coloured %*
Indian %*
White %*
African %*
Coloured %*
Indian %*
White %*
%
Total: a. Official
definition
46,7
64,2
70,6
70,3
33,6
46,9
38,9
47,4
43,9
b. Expandeddefinition
57,8 68,6 72,1 71.2 48,1 52,3 41,4 49,2 54,3
Urban: c. Official
definition
52,8
62,6
70,3
69,8
43,3
46,7
38,9
48,2
50,1
d. Expandeddefinition
62,0 67,3 71,9 70,7 54,7 52,1 41,5 50,1 58,4
Non-urban: e. Official
definition
38,7
75,2
73,3
78,3
24,8
48,1
40,0
36,1
32,2
f. Expandeddefinition
52,5 78,3 73,3 78,3 40,0 54,3 40,0 36,1 46,6
* Each percentage stands on its own, the remainder adding up to 100 Labour market status by location and gender, 1997 Living in an urban or non-urban area was also associated with varying labour forceparticipation and labour absorption rates. • Table 2, rows c and e, shows that, among African men aged 15 to 65 years, using the
official unemployment definition, 53% of those in urban areas were economically active,compared with 39% in non-urban areas. Among African women in the same agecategory, 43% were economically active in urban areas, as against 25% in non-urbanareas.
• Overall, urban men had the highest rate of labour absorption, with 40% of those ofworking age being employed. Non-urban men had a lower rate, at 29%.
• Urban women of working age had a labour absorption rate of 28% but, among non-urbanwomen, the figure was 15%.
20
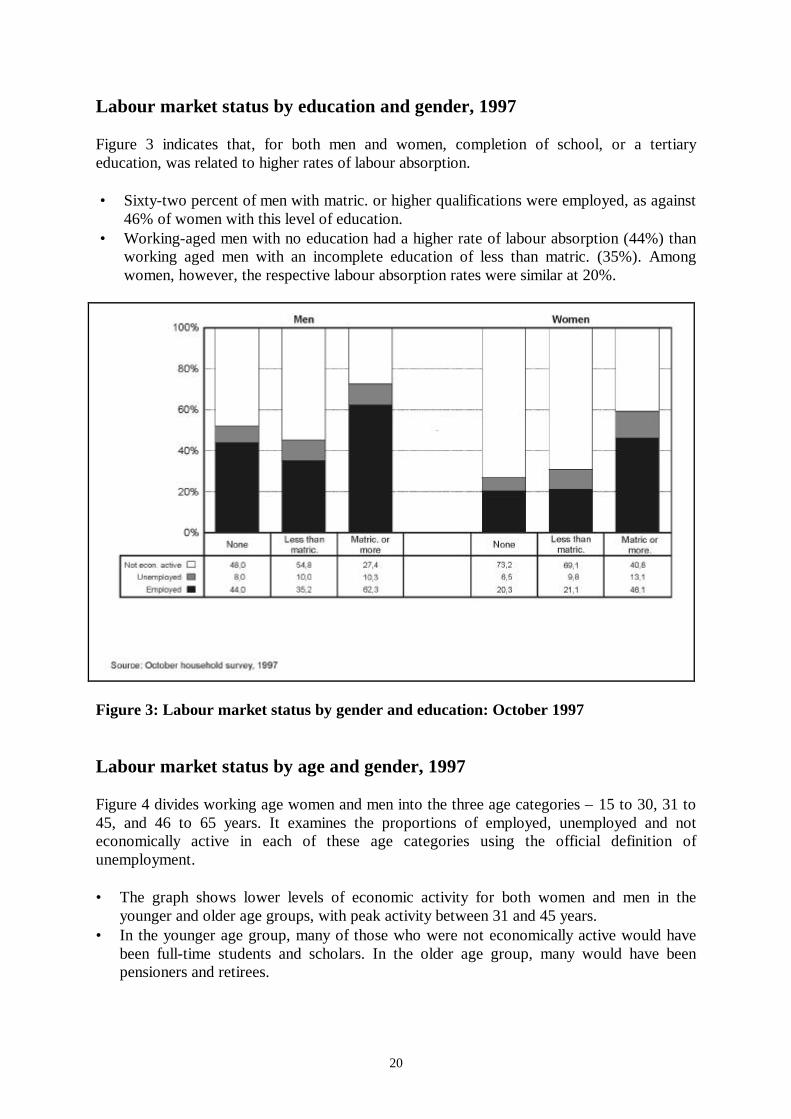
Labour market status by education and gender, 1997 Figure 3 indicates that, for both men and women, completion of school, or a tertiaryeducation, was related to higher rates of labour absorption. • Sixty-two percent of men with matric. or higher qualifications were employed, as against
46% of women with this level of education.• Working-aged men with no education had a higher rate of labour absorption (44%) than
working aged men with an incomplete education of less than matric. (35%). Amongwomen, however, the respective labour absorption rates were similar at 20%.
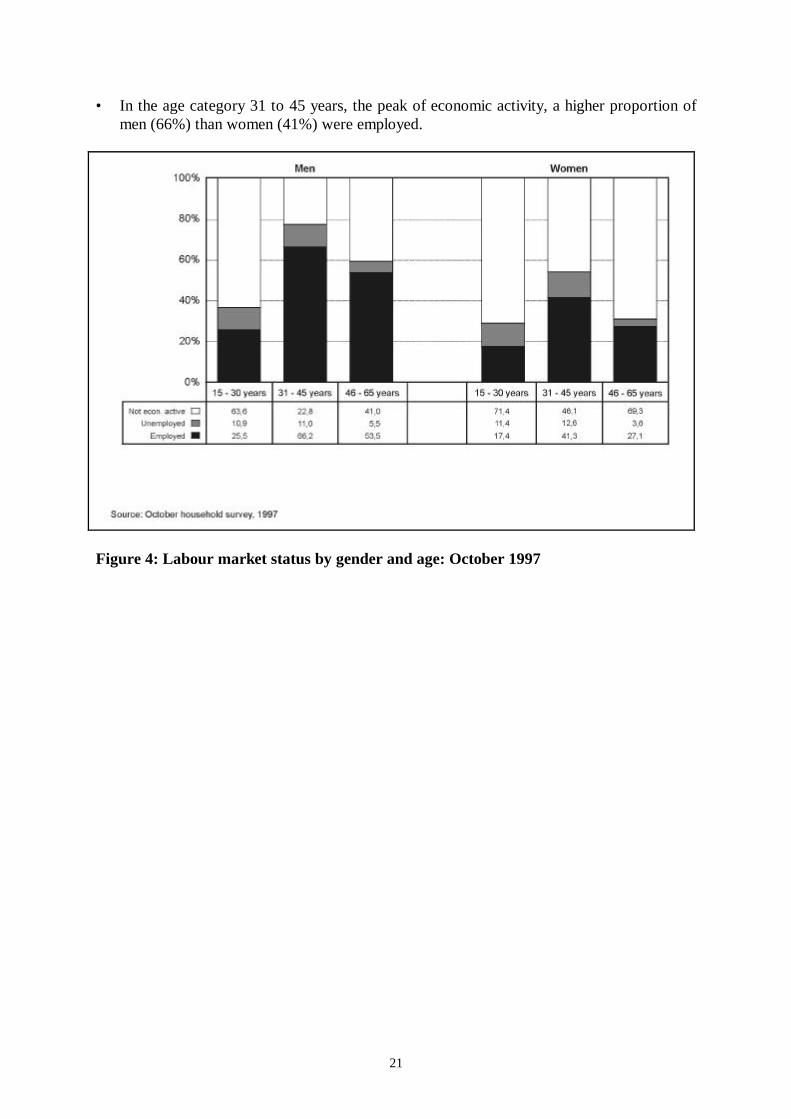
Figure 3: Labour market status by gender and education: October 1997 Labour market status by age and gender, 1997 Figure 4 divides working age women and men into the three age categories – 15 to 30, 31 to45, and 46 to 65 years. It examines the proportions of employed, unemployed and noteconomically active in each of these age categories using the official definition ofunemployment. • The graph shows lower levels of economic activity for both women and men in the
younger and older age groups, with peak activity between 31 and 45 years.• In the younger age group, many of those who were not economically active would have
been full-time students and scholars. In the older age group, many would have beenpensioners and retirees.
21
• In the age category 31 to 45 years, the peak of economic activity, a higher proportion ofmen (66%) than women (41%) were employed.
Figure 4: Labour market status by gender and age: October 1997

PLEASE TURN THE PAGE
23
Chapter 3 The unemployed and those not economicallyactive
This chapter examines unemployment rates using mainly the official definition (see Chapter1), first looking at the trends between 1994 and 1997. Then it focuses on 1997, and breaksdown unemployment rates among men and women by population group, education, locationand age. The length of time that people have been unemployed is examined in the chapter,which concludes by focusing on those who are not economically active, examining why theyare in this category.
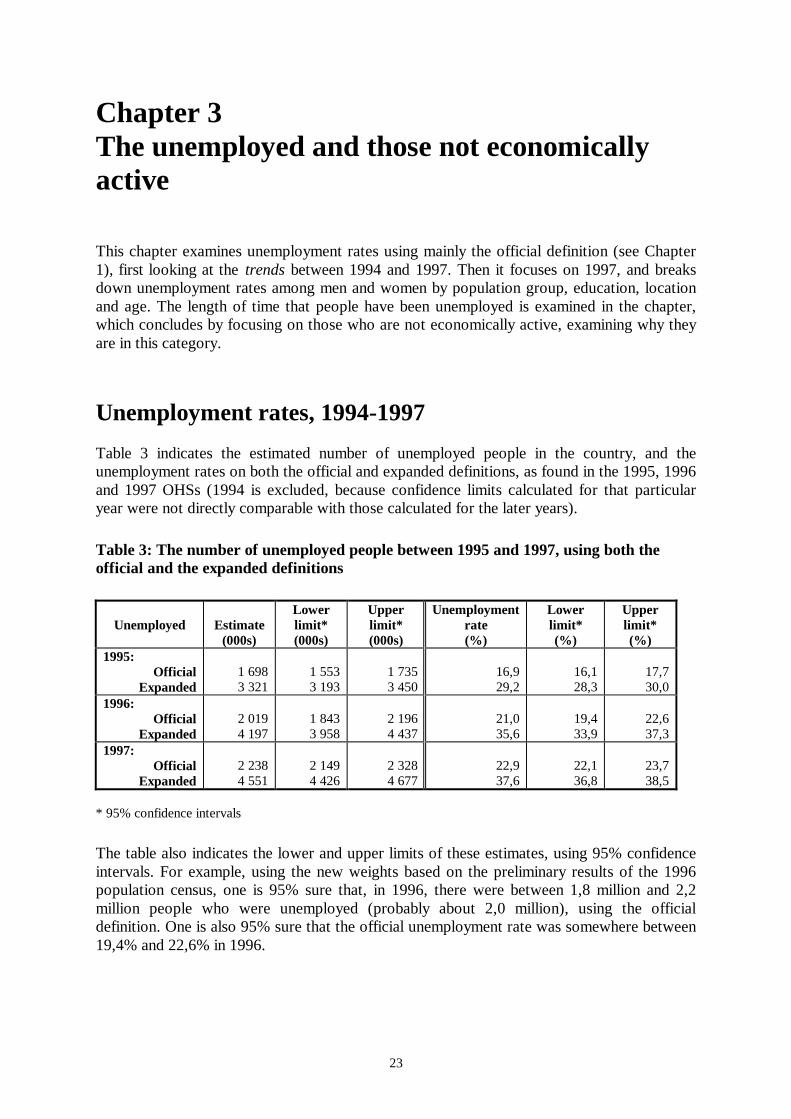
Unemployment rates, 1994-1997 Table 3 indicates the estimated number of unemployed people in the country, and theunemployment rates on both the official and expanded definitions, as found in the 1995, 1996and 1997 OHSs (1994 is excluded, because confidence limits calculated for that particularyear were not directly comparable with those calculated for the later years). Table 3: The number of unemployed people between 1995 and 1997, using both theofficial and the expanded definitions
Unemployed
Estimate
(000s)
Lowerlimit* (000s)
Upperlimit* (000s)
Unemploymentrate (%)
Lowerlimit* (%)
Upperlimit* (%)
1995: Official
Expanded
1 698 3 321
1 553 3 193
1 735 3 450
16,9 29,2
16,1 28,3
17,7 30,0
1996: Official
Expanded
2 019 4 197
1 843 3 958
2 196 4 437
21,0 35,6
19,4 33,9
22,6 37,3
1997: Official
Expanded
2 238 4 551
2 149 4 426
2 328 4 677
22,9 37,6
22,1 36,8
23,7 38,5
* 95% confidence intervals
The table also indicates the lower and upper limits of these estimates, using 95% confidenceintervals. For example, using the new weights based on the preliminary results of the 1996population census, one is 95% sure that, in 1996, there were between 1,8 million and 2,2million people who were unemployed (probably about 2,0 million), using the officialdefinition. One is also 95% sure that the official unemployment rate was somewhere between19,4% and 22,6% in 1996.
24
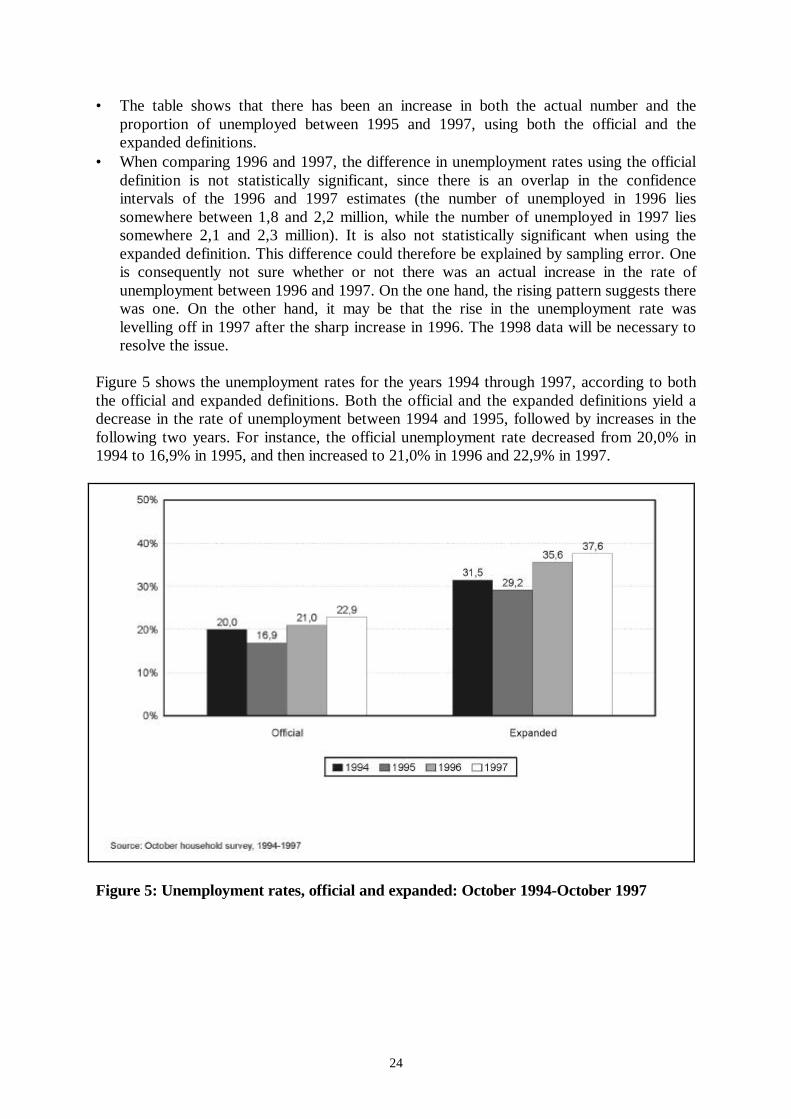
• The table shows that there has been an increase in both the actual number and theproportion of unemployed between 1995 and 1997, using both the official and theexpanded definitions.
• When comparing 1996 and 1997, the difference in unemployment rates using the officialdefinition is not statistically significant, since there is an overlap in the confidenceintervals of the 1996 and 1997 estimates (the number of unemployed in 1996 liessomewhere between 1,8 and 2,2 million, while the number of unemployed in 1997 liessomewhere 2,1 and 2,3 million). It is also not statistically significant when using theexpanded definition. This difference could therefore be explained by sampling error. Oneis consequently not sure whether or not there was an actual increase in the rate ofunemployment between 1996 and 1997. On the one hand, the rising pattern suggests therewas one. On the other hand, it may be that the rise in the unemployment rate waslevelling off in 1997 after the sharp increase in 1996. The 1998 data will be necessary toresolve the issue.
Figure 5 shows the unemployment rates for the years 1994 through 1997, according to boththe official and expanded definitions. Both the official and the expanded definitions yield adecrease in the rate of unemployment between 1994 and 1995, followed by increases in thefollowing two years. For instance, the official unemployment rate decreased from 20,0% in1994 to 16,9% in 1995, and then increased to 21,0% in 1996 and 22,9% in 1997.
Figure 5: Unemployment rates, official and expanded: October 1994-October 1997
25
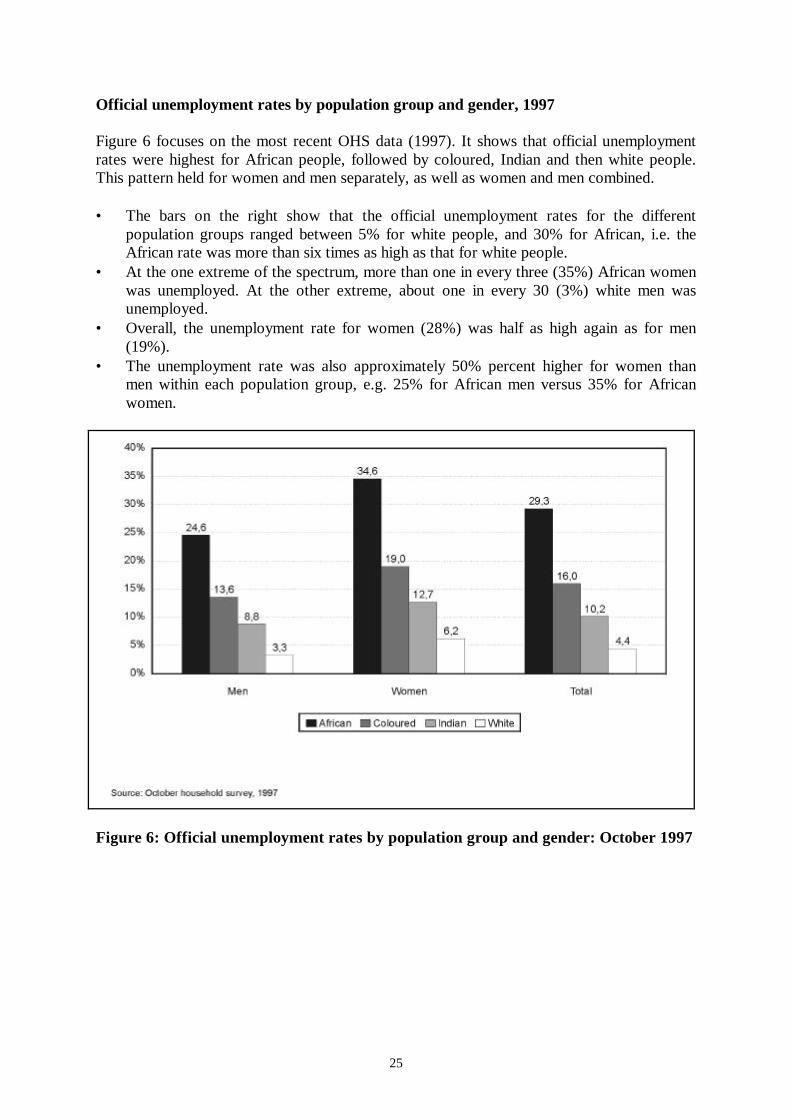
Official unemployment rates by population group and gender, 1997 Figure 6 focuses on the most recent OHS data (1997). It shows that official unemploymentrates were highest for African people, followed by coloured, Indian and then white people.This pattern held for women and men separately, as well as women and men combined. • The bars on the right show that the official unemployment rates for the different
population groups ranged between 5% for white people, and 30% for African, i.e. theAfrican rate was more than six times as high as that for white people.
• At the one extreme of the spectrum, more than one in every three (35%) African womenwas unemployed. At the other extreme, about one in every 30 (3%) white men wasunemployed.
• Overall, the unemployment rate for women (28%) was half as high again as for men(19%).
• The unemployment rate was also approximately 50% percent higher for women thanmen within each population group, e.g. 25% for African men versus 35% for Africanwomen.
Figure 6: Official unemployment rates by population group and gender: October 1997
26
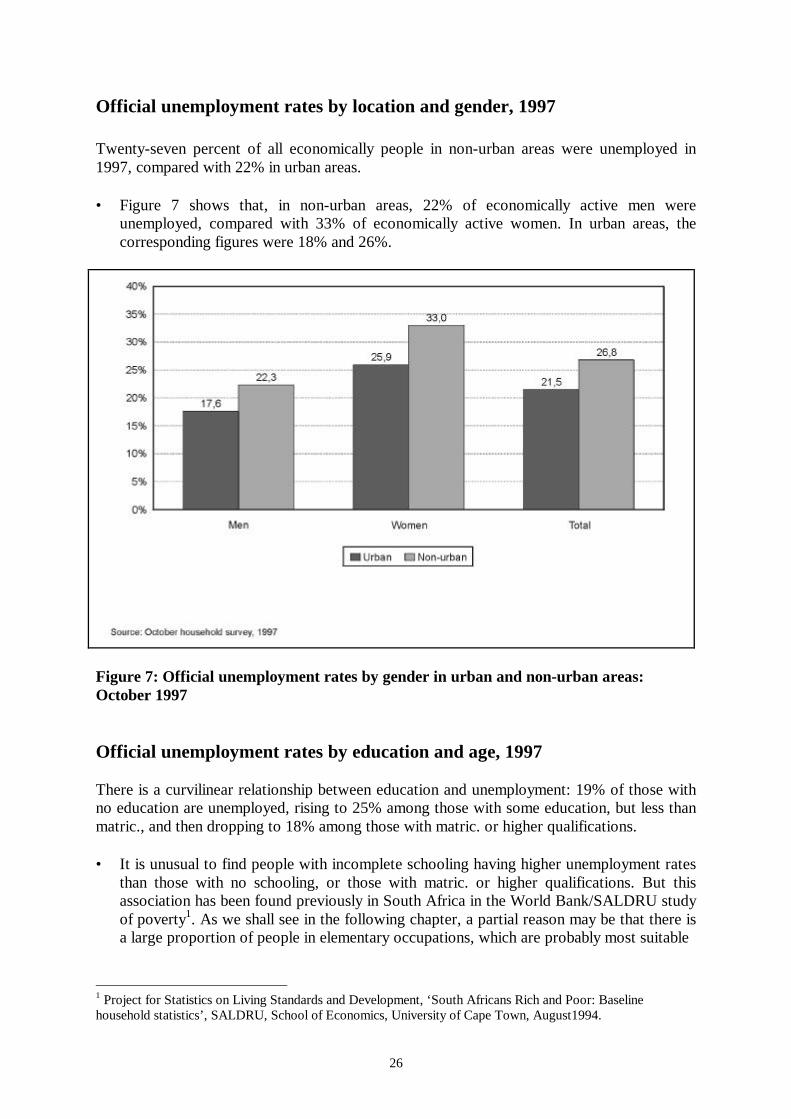
Official unemployment rates by location and gender, 1997 Twenty-seven percent of all economically people in non-urban areas were unemployed in1997, compared with 22% in urban areas.
• Figure 7 shows that, in non-urban areas, 22% of economically active men wereunemployed, compared with 33% of economically active women. In urban areas, thecorresponding figures were 18% and 26%.
Figure 7: Official unemployment rates by gender in urban and non-urban areas:October 1997 Official unemployment rates by education and age, 1997 There is a curvilinear relationship between education and unemployment: 19% of those withno education are unemployed, rising to 25% among those with some education, but less thanmatric., and then dropping to 18% among those with matric. or higher qualifications. • It is unusual to find people with incomplete schooling having higher unemployment rates
than those with no schooling, or those with matric. or higher qualifications. But thisassociation has been found previously in South Africa in the World Bank/SALDRU studyof poverty1. As we shall see in the following chapter, a partial reason may be that there isa large proportion of people in elementary occupations, which are probably most suitable
1 Project for Statistics on Living Standards and Development, ‘South Africans Rich and Poor: Baselinehousehold statistics’, SALDRU, School of Economics, University of Cape Town, August1994.
27
• for people with no education. There is also an increasing proportion of people inprofessional and managerial jobs, accounting for the lower unemployment rate among themore highly educated.
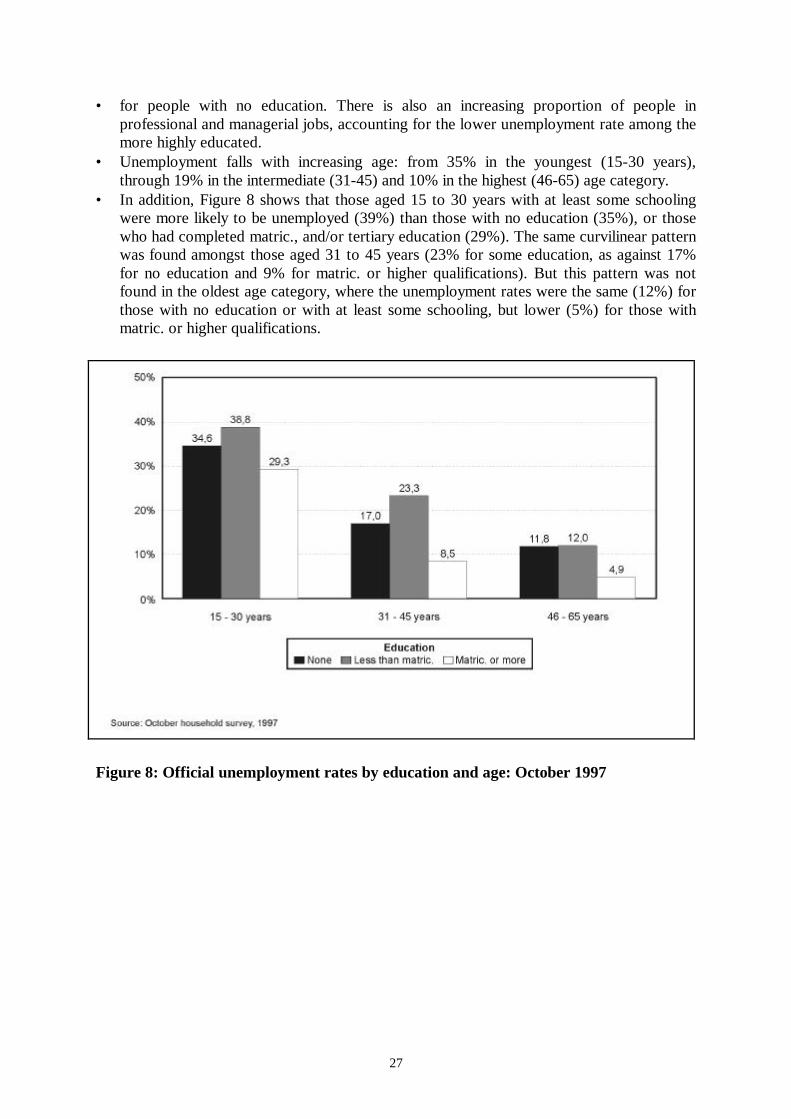
• Unemployment falls with increasing age: from 35% in the youngest (15-30 years),through 19% in the intermediate (31-45) and 10% in the highest (46-65) age category.
• In addition, Figure 8 shows that those aged 15 to 30 years with at least some schoolingwere more likely to be unemployed (39%) than those with no education (35%), or thosewho had completed matric., and/or tertiary education (29%). The same curvilinear patternwas found amongst those aged 31 to 45 years (23% for some education, as against 17%for no education and 9% for matric. or higher qualifications). But this pattern was notfound in the oldest age category, where the unemployment rates were the same (12%) forthose with no education or with at least some schooling, but lower (5%) for those withmatric. or higher qualifications.
Figure 8: Official unemployment rates by education and age: October 1997
28
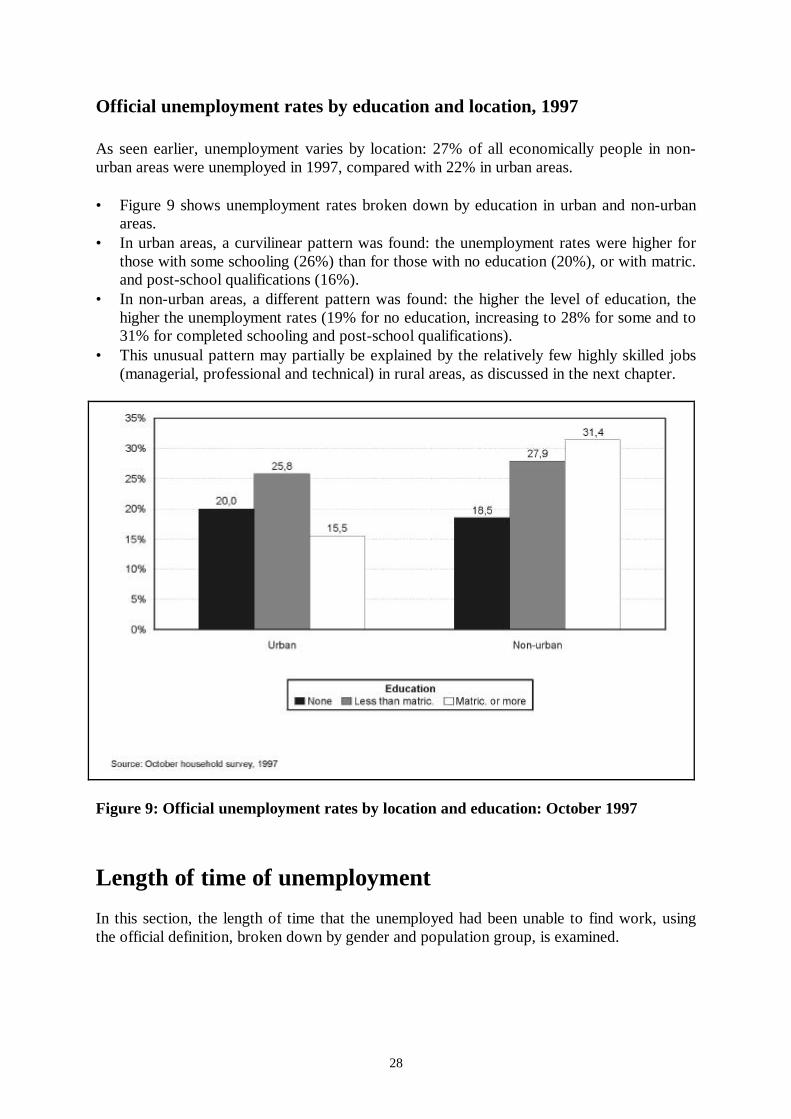
Official unemployment rates by education and location, 1997 As seen earlier, unemployment varies by location: 27% of all economically people in non-urban areas were unemployed in 1997, compared with 22% in urban areas. • Figure 9 shows unemployment rates broken down by education in urban and non-urban
areas.• In urban areas, a curvilinear pattern was found: the unemployment rates were higher for
those with some schooling (26%) than for those with no education (20%), or with matric.and post-school qualifications (16%).
• In non-urban areas, a different pattern was found: the higher the level of education, thehigher the unemployment rates (19% for no education, increasing to 28% for some and to31% for completed schooling and post-school qualifications).
• This unusual pattern may partially be explained by the relatively few highly skilled jobs(managerial, professional and technical) in rural areas, as discussed in the next chapter.
Figure 9: Official unemployment rates by location and education: October 1997
Length of time of unemployment In this section, the length of time that the unemployed had been unable to find work, usingthe official definition, broken down by gender and population group, is examined.
29
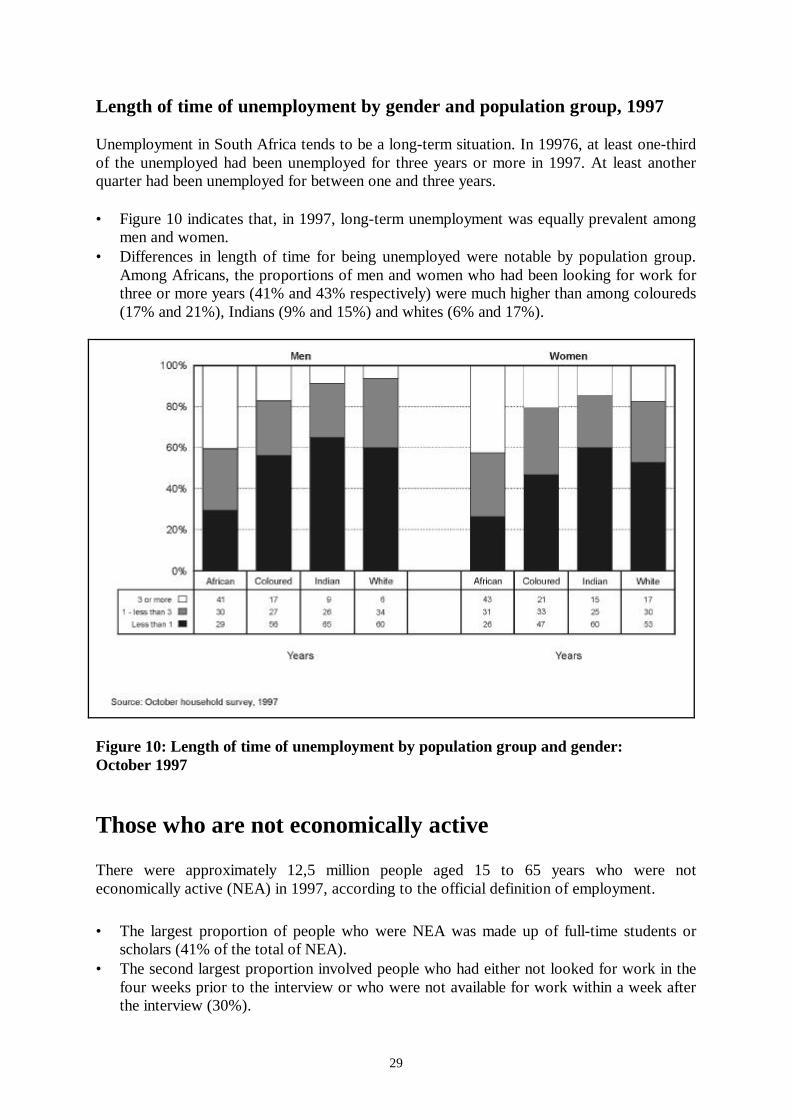
Length of time of unemployment by gender and population group, 1997 Unemployment in South Africa tends to be a long-term situation. In 19976, at least one-thirdof the unemployed had been unemployed for three years or more in 1997. At least anotherquarter had been unemployed for between one and three years. • Figure 10 indicates that, in 1997, long-term unemployment was equally prevalent among
men and women.• Differences in length of time for being unemployed were notable by population group.
Among Africans, the proportions of men and women who had been looking for work forthree or more years (41% and 43% respectively) were much higher than among coloureds(17% and 21%), Indians (9% and 15%) and whites (6% and 17%).
Figure 10: Length of time of unemployment by population group and gender: October 1997
Those who are not economically active There were approximately 12,5 million people aged 15 to 65 years who were noteconomically active (NEA) in 1997, according to the official definition of employment. • The largest proportion of people who were NEA was made up of full-time students or
scholars (41% of the total of NEA).• The second largest proportion involved people who had either not looked for work in the
four weeks prior to the interview or who were not available for work within a week afterthe interview (30%).
30
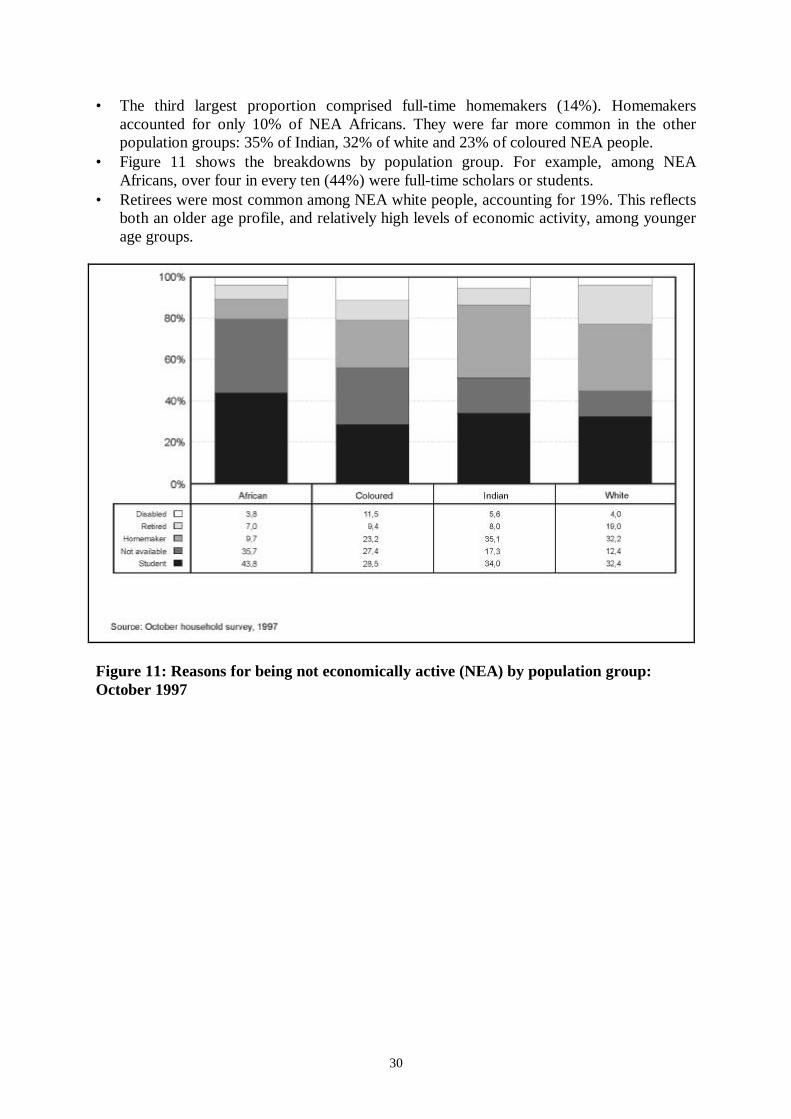
• The third largest proportion comprised full-time homemakers (14%). Homemakersaccounted for only 10% of NEA Africans. They were far more common in the otherpopulation groups: 35% of Indian, 32% of white and 23% of coloured NEA people.
• Figure 11 shows the breakdowns by population group. For example, among NEAAfricans, over four in every ten (44%) were full-time scholars or students.
• Retirees were most common among NEA white people, accounting for 19%. This reflectsboth an older age profile, and relatively high levels of economic activity, among youngerage groups.
Figure 11: Reasons for being not economically active (NEA) by population group:October 1997
31
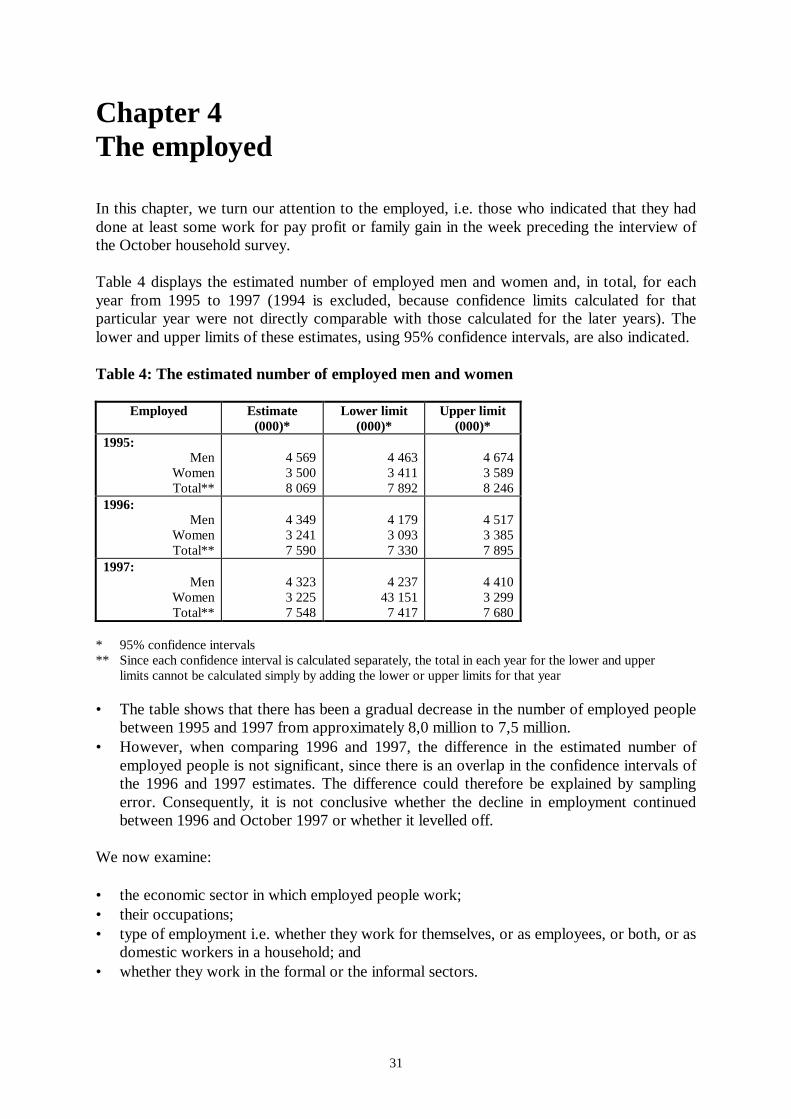
Chapter 4 The employed In this chapter, we turn our attention to the employed, i.e. those who indicated that they haddone at least some work for pay profit or family gain in the week preceding the interview ofthe October household survey. Table 4 displays the estimated number of employed men and women and, in total, for eachyear from 1995 to 1997 (1994 is excluded, because confidence limits calculated for thatparticular year were not directly comparable with those calculated for the later years). Thelower and upper limits of these estimates, using 95% confidence intervals, are also indicated. Table 4: The estimated number of employed men and women
Employed Estimate (000)*
Lower limit (000)*
Upper limit (000)*
1995: Men
Women Total**
4 569 3 500 8 069
4 463 3 411 7 892
4 674 3 589 8 246
1996: Men
Women Total**
4 349 3 241 7 590
4 179 3 093 7 330
4 517 3 385 7 895
1997: Men
Women Total**
4 323 3 225 7 548
4 237
43 151 7 417
4 410 3 299 7 680
* 95% confidence intervals ** Since each confidence interval is calculated separately, the total in each year for the lower and upper limits cannot be calculated simply by adding the lower or upper limits for that year • The table shows that there has been a gradual decrease in the number of employed people
between 1995 and 1997 from approximately 8,0 million to 7,5 million.• However, when comparing 1996 and 1997, the difference in the estimated number of
employed people is not significant, since there is an overlap in the confidence intervals ofthe 1996 and 1997 estimates. The difference could therefore be explained by samplingerror. Consequently, it is not conclusive whether the decline in employment continuedbetween 1996 and October 1997 or whether it levelled off.
We now examine: • the economic sector in which employed people work;• their occupations;• type of employment i.e. whether they work for themselves, or as employees, or both, or as
domestic workers in a household; and• whether they work in the formal or the informal sectors.
32
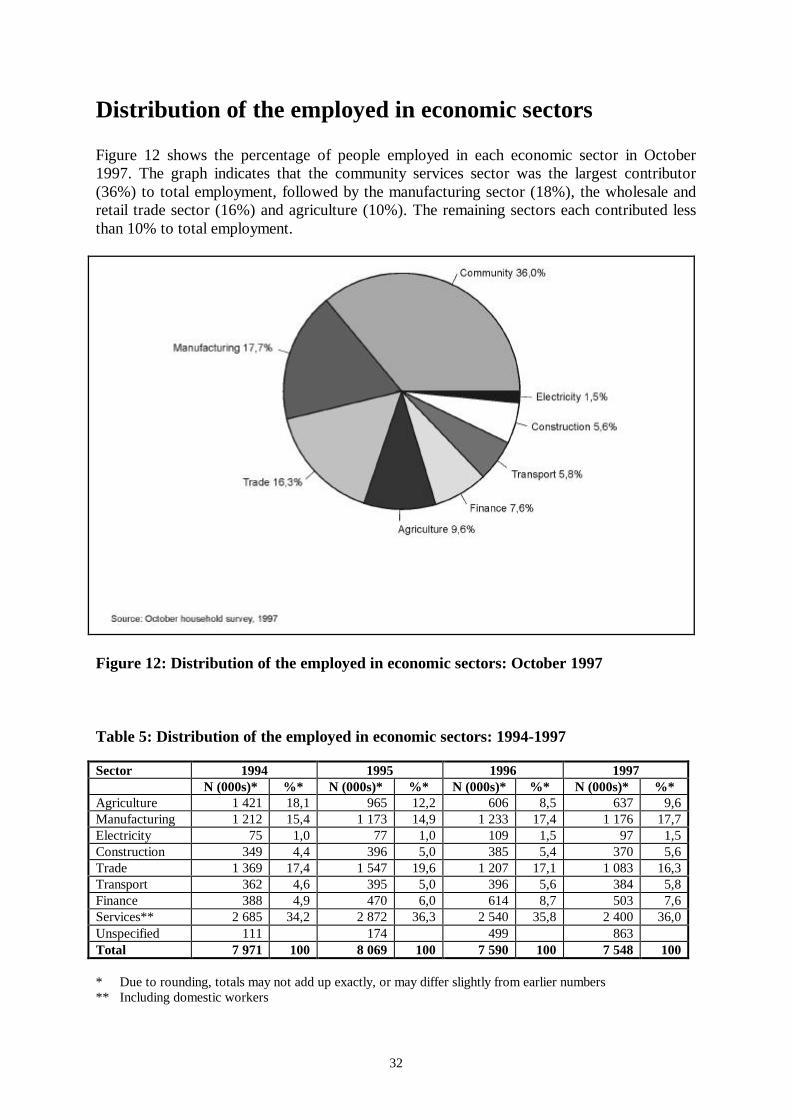
Distribution of the employed in economic sectors Figure 12 shows the percentage of people employed in each economic sector in October1997. The graph indicates that the community services sector was the largest contributor(36%) to total employment, followed by the manufacturing sector (18%), the wholesale andretail trade sector (16%) and agriculture (10%). The remaining sectors each contributed lessthan 10% to total employment.
Figure 12: Distribution of the employed in economic sectors: October 1997 Table 5: Distribution of the employed in economic sectors: 1994-1997 Sector 1994 1995 1996 1997 N (000s)* %* N (000s)* %* N (000s)* %* N (000s)* %* Agriculture 1 421 18,1 965 12,2 606 8,5 637 9,6 Manufacturing 1 212 15,4 1 173 14,9 1 233 17,4 1 176 17,7 Electricity 75 1,0 77 1,0 109 1,5 97 1,5 Construction 349 4,4 396 5,0 385 5,4 370 5,6 Trade 1 369 17,4 1 547 19,6 1 207 17,1 1 083 16,3 Transport 362 4,6 395 5,0 396 5,6 384 5,8 Finance 388 4,9 470 6,0 614 8,7 503 7,6 Services** 2 685 34,2 2 872 36,3 2 540 35,8 2 400 36,0 Unspecified 111 174 499 863 Total 7 971 100 8 069 100 7 590 100 7 548 100 * Due to rounding, totals may not add up exactly, or may differ slightly from earlier numbers ** Including domestic workers
33
Table 5 indicates the actual number and percentage of people employed in each sector in thevarious OHSs from 1994 to 1997. • Altogether, 8,0 million people were employed in 1994, decreasing to 7,5 million in 1997.• The table shows that the proportion of people working in the agricultural sector decreased
appreciably over time, from 18% in 1994 to 10% in 1997.• The proportion in manufacturing increased from 15% to 18% between 1994 and 1997; in
finance, it increased from 5% to 8%. Since the sample sizes are small when broken downby sector, slighter changes may be due to sampling error and should be treated with caution.
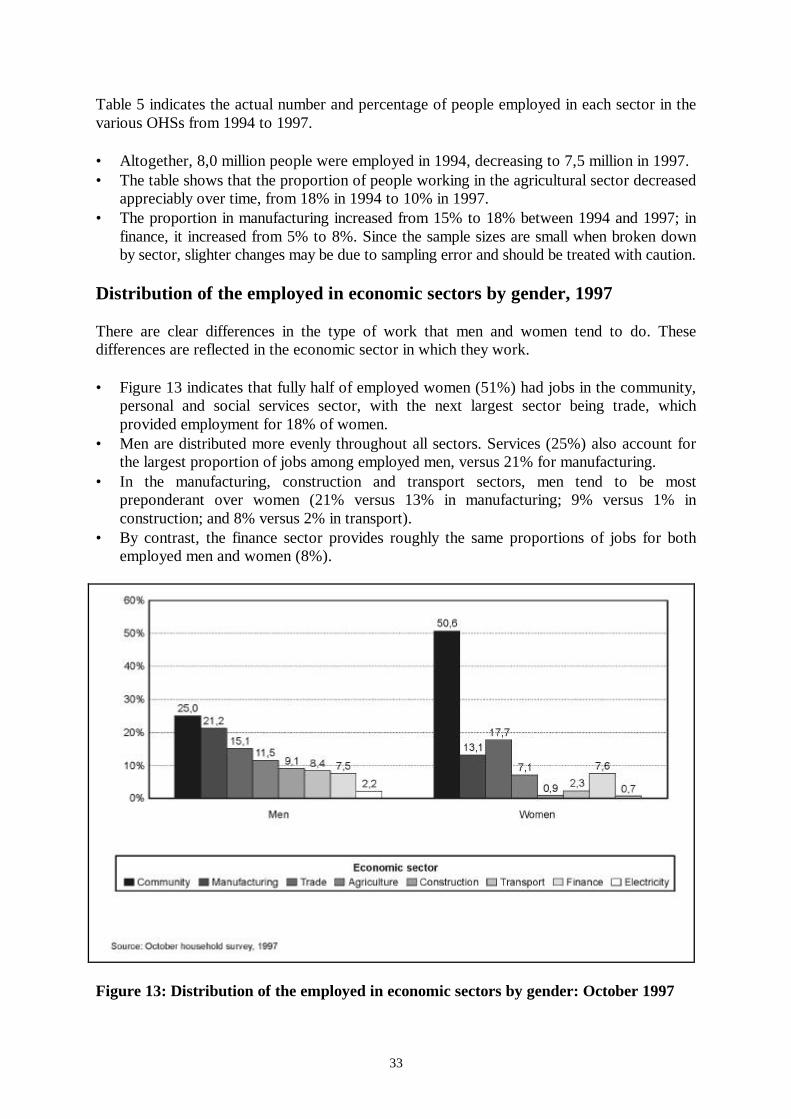
Distribution of the employed in economic sectors by gender, 1997 There are clear differences in the type of work that men and women tend to do. Thesedifferences are reflected in the economic sector in which they work. • Figure 13 indicates that fully half of employed women (51%) had jobs in the community,
personal and social services sector, with the next largest sector being trade, whichprovided employment for 18% of women.
• Men are distributed more evenly throughout all sectors. Services (25%) also account forthe largest proportion of jobs among employed men, versus 21% for manufacturing.
• In the manufacturing, construction and transport sectors, men tend to be mostpreponderant over women (21% versus 13% in manufacturing; 9% versus 1% inconstruction; and 8% versus 2% in transport).
• By contrast, the finance sector provides roughly the same proportions of jobs for bothemployed men and women (8%).
Figure 13: Distribution of the employed in economic sectors by gender: October 1997
34
Distribution of the employed in economic sectors in urban and non-urbanareas, 1997 There were noticeable differences in the distribution of employment by economic sector inurban and non-urban areas of South Africa. • A large proportion of employed people were working in the services sector in October
1997, in both urban (38%) and non-urban areas (32%).• As would be expected, agriculture accounted for the largest share (32%) of jobs in non-
urban areas, while economic sectors such as manufacturing and trade accounted for muchlarger proportions of the workforce in urban areas than in non-urban areas.
• In urban areas, 9% were working in the financial sector in 1997, as against only 4% innon-urban areas.
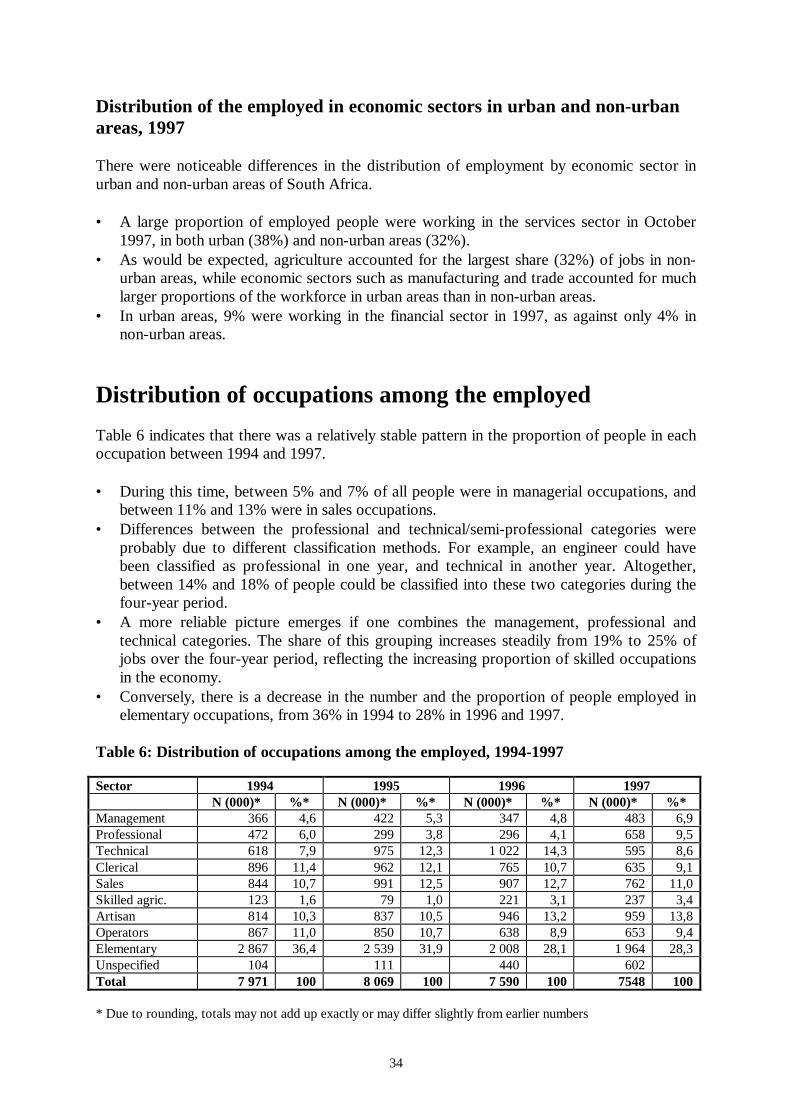
Distribution of occupations among the employed Table 6 indicates that there was a relatively stable pattern in the proportion of people in eachoccupation between 1994 and 1997. • During this time, between 5% and 7% of all people were in managerial occupations, and
between 11% and 13% were in sales occupations.• Differences between the professional and technical/semi-professional categories were
probably due to different classification methods. For example, an engineer could havebeen classified as professional in one year, and technical in another year. Altogether,between 14% and 18% of people could be classified into these two categories during thefour-year period.
• A more reliable picture emerges if one combines the management, professional andtechnical categories. The share of this grouping increases steadily from 19% to 25% ofjobs over the four-year period, reflecting the increasing proportion of skilled occupationsin the economy.
• Conversely, there is a decrease in the number and the proportion of people employed inelementary occupations, from 36% in 1994 to 28% in 1996 and 1997.
Table 6: Distribution of occupations among the employed, 1994-1997
Sector 1994 1995 1996 1997N (000)* %* N (000)* %* N (000)* %* N (000)* %*
Management 366 4,6 422 5,3 347 4,8 483 6,9Professional 472 6,0 299 3,8 296 4,1 658 9,5Technical 618 7,9 975 12,3 1 022 14,3 595 8,6Clerical 896 11,4 962 12,1 765 10,7 635 9,1Sales 844 10,7 991 12,5 907 12,7 762 11,0Skilled agric. 123 1,6 79 1,0 221 3,1 237 3,4Artisan 814 10,3 837 10,5 946 13,2 959 13,8Operators 867 11,0 850 10,7 638 8,9 653 9,4Elementary 2 867 36,4 2 539 31,9 2 008 28,1 1 964 28,3Unspecified 104 111 440 602Total 7 971 100 8 069 100 7 590 100 7548 100
* Due to rounding, totals may not add up exactly or may differ slightly from earlier numbers
35
Distribution of occupations by gender, 1997
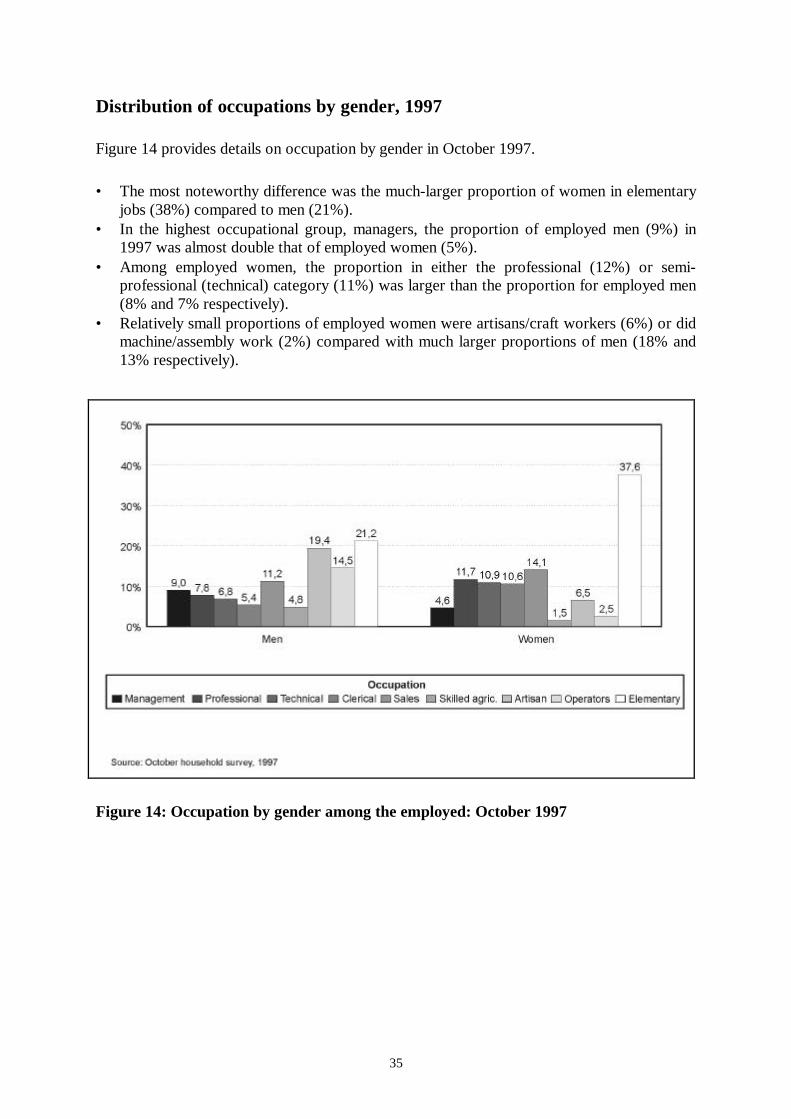
Figure 14 provides details on occupation by gender in October 1997.
• The most noteworthy difference was the much-larger proportion of women in elementaryjobs (38%) compared to men (21%).
• In the highest occupational group, managers, the proportion of employed men (9%) in1997 was almost double that of employed women (5%).
• Among employed women, the proportion in either the professional (12%) or semi-professional (technical) category (11%) was larger than the proportion for employed men(8% and 7% respectively).
• Relatively small proportions of employed women were artisans/craft workers (6%) or didmachine/assembly work (2%) compared with much larger proportions of men (18% and13% respectively).
Figure 14: Occupation by gender among the employed: October 1997
36
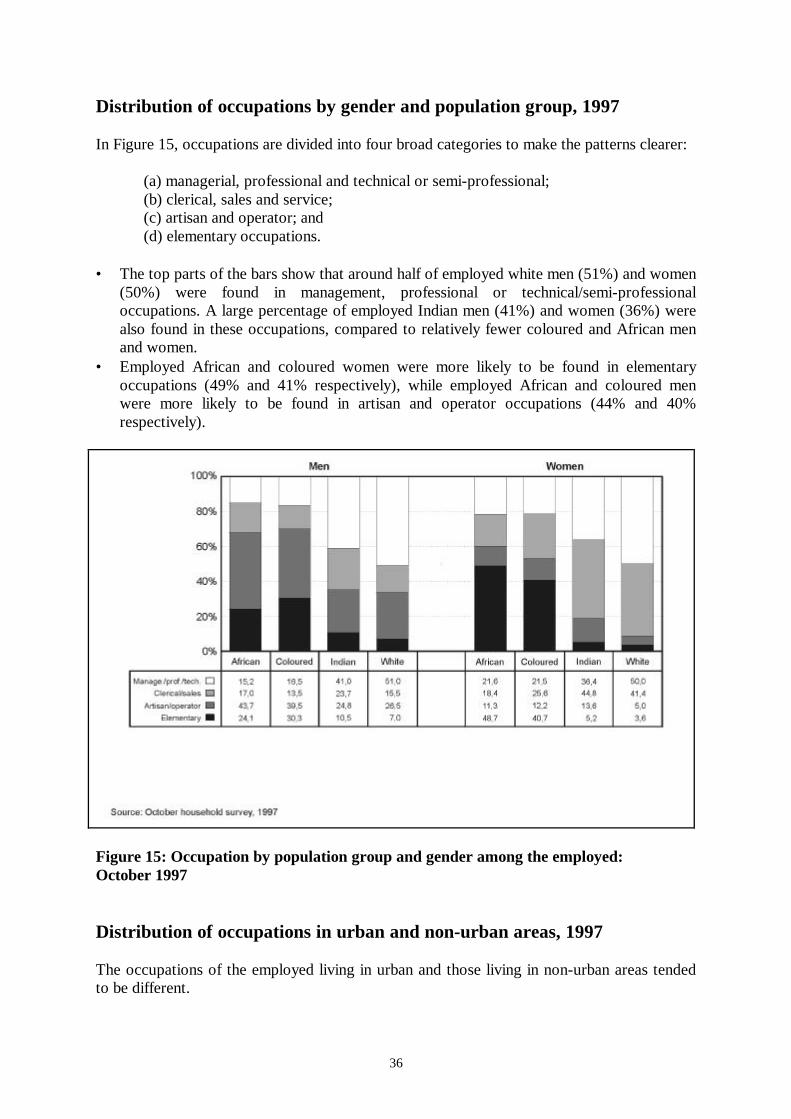
Distribution of occupations by gender and population group, 1997
In Figure 15, occupations are divided into four broad categories to make the patterns clearer:
(a) managerial, professional and technical or semi-professional;(b) clerical, sales and service;(c) artisan and operator; and(d) elementary occupations.
• The top parts of the bars show that around half of employed white men (51%) and women(50%) were found in management, professional or technical/semi-professionaloccupations. A large percentage of employed Indian men (41%) and women (36%) werealso found in these occupations, compared to relatively fewer coloured and African menand women.
• Employed African and coloured women were more likely to be found in elementaryoccupations (49% and 41% respectively), while employed African and coloured menwere more likely to be found in artisan and operator occupations (44% and 40%respectively).
Figure 15: Occupation by population group and gender among the employed: October 1997 Distribution of occupations in urban and non-urban areas, 1997 The occupations of the employed living in urban and those living in non-urban areas tendedto be different.
37
• There were proportionately more workers in elementary occupations in non-urban areas(40%) than in urban ones (25%).
• There were proportionately more people in skilled occupations, for example managers(8% as against 4%), professionals (11% as against 6%), technicians or semi-professionals(10% as against 5%), or clerks (11% as against 3%) in urban compared to non-urbanareas.
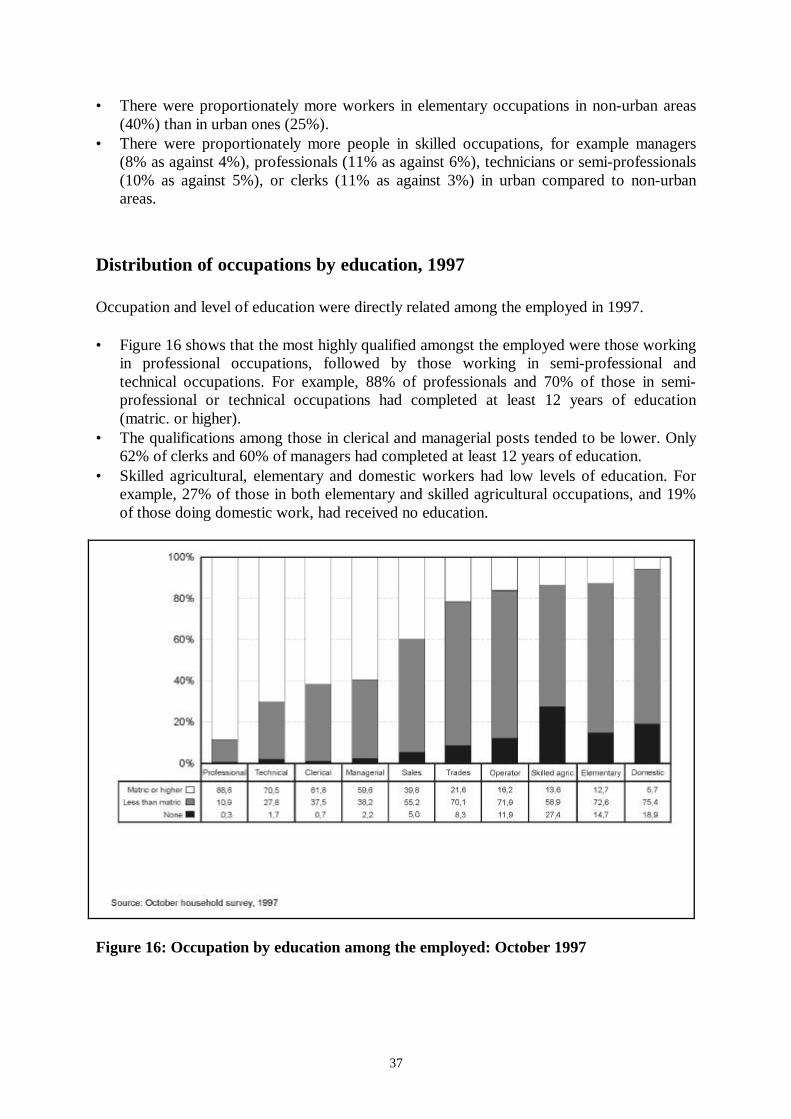
Distribution of occupations by education, 1997 Occupation and level of education were directly related among the employed in 1997. • Figure 16 shows that the most highly qualified amongst the employed were those working
in professional occupations, followed by those working in semi-professional andtechnical occupations. For example, 88% of professionals and 70% of those in semi-professional or technical occupations had completed at least 12 years of education(matric. or higher).
• The qualifications among those in clerical and managerial posts tended to be lower. Only62% of clerks and 60% of managers had completed at least 12 years of education.
• Skilled agricultural, elementary and domestic workers had low levels of education. Forexample, 27% of those in both elementary and skilled agricultural occupations, and 19%of those doing domestic work, had received no education.
Figure 16: Occupation by education among the employed: October 1997
38
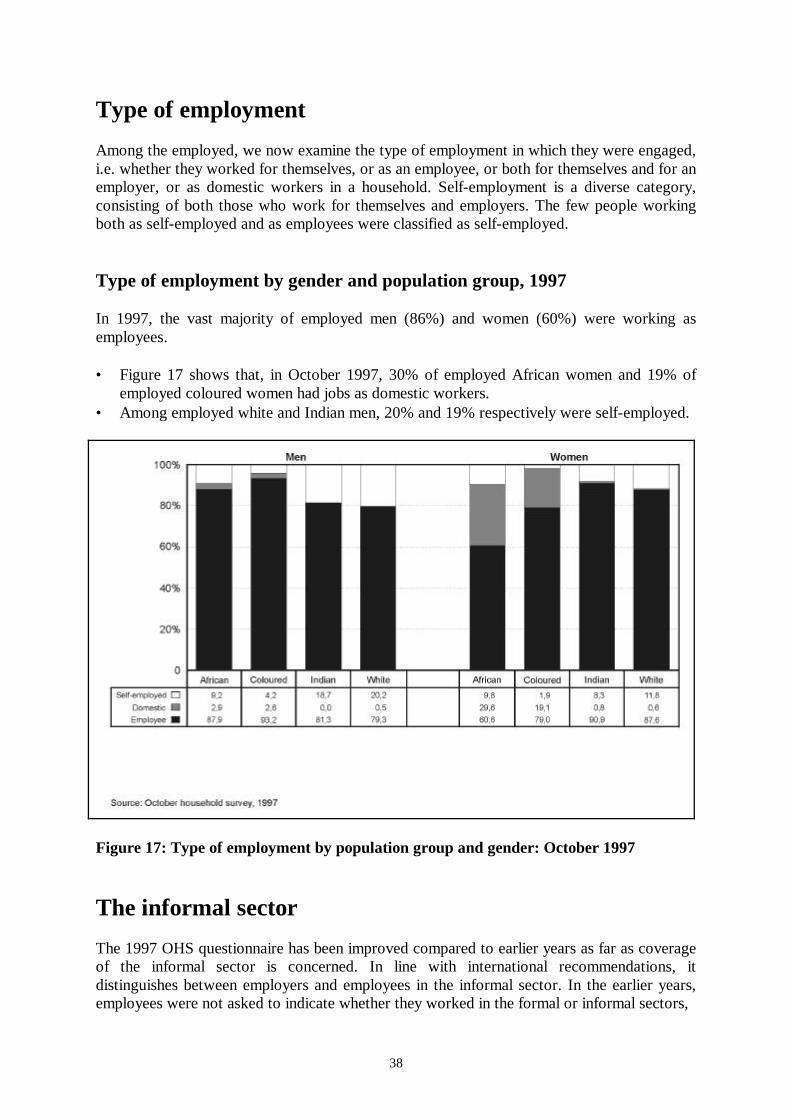
Type of employment Among the employed, we now examine the type of employment in which they were engaged,i.e. whether they worked for themselves, or as an employee, or both for themselves and for anemployer, or as domestic workers in a household. Self-employment is a diverse category,consisting of both those who work for themselves and employers. The few people workingboth as self-employed and as employees were classified as self-employed. Type of employment by gender and population group, 1997 In 1997, the vast majority of employed men (86%) and women (60%) were working asemployees. • Figure 17 shows that, in October 1997, 30% of employed African women and 19% of
employed coloured women had jobs as domestic workers.• Among employed white and Indian men, 20% and 19% respectively were self-employed.
Figure 17: Type of employment by population group and gender: October 1997
The informal sector The 1997 OHS questionnaire has been improved compared to earlier years as far as coverageof the informal sector is concerned. In line with international recommendations, itdistinguishes between employers and employees in the informal sector. In the earlier years,employees were not asked to indicate whether they worked in the formal or informal sectors,
39
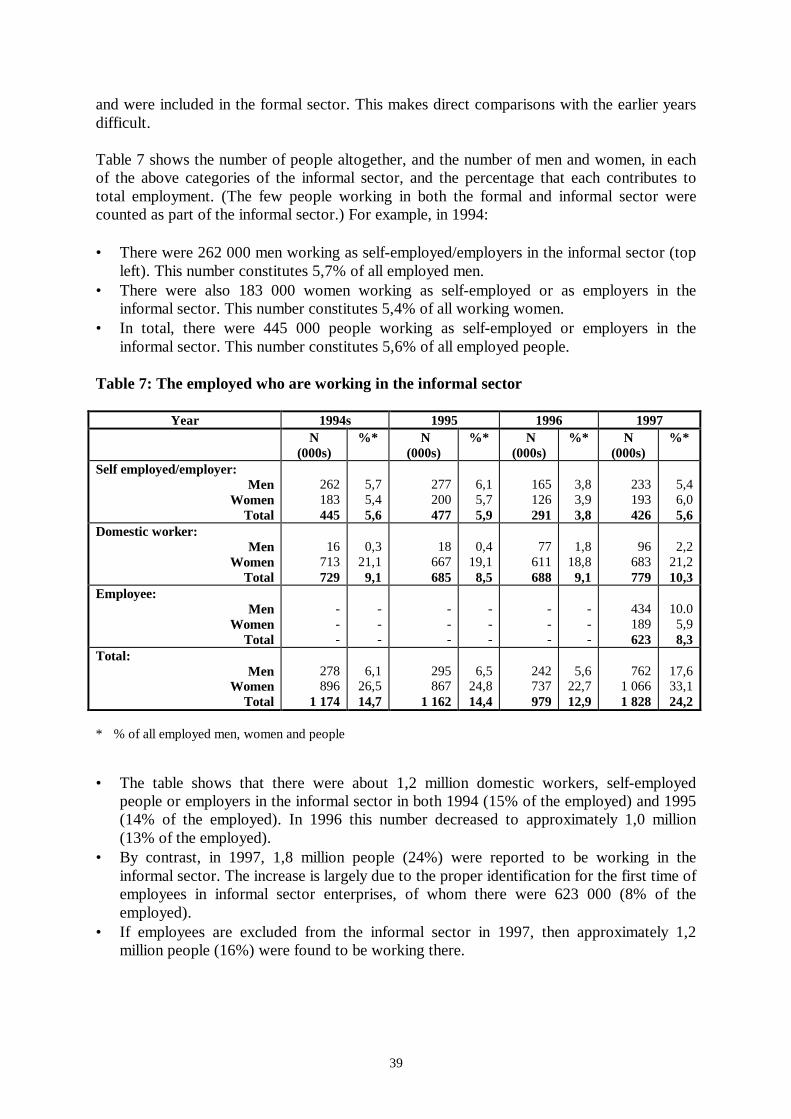
and were included in the formal sector. This makes direct comparisons with the earlier yearsdifficult. Table 7 shows the number of people altogether, and the number of men and women, in eachof the above categories of the informal sector, and the percentage that each contributes tototal employment. (The few people working in both the formal and informal sector werecounted as part of the informal sector.) For example, in 1994: • There were 262 000 men working as self-employed/employers in the informal sector (top
left). This number constitutes 5,7% of all employed men.• There were also 183 000 women working as self-employed or as employers in the
informal sector. This number constitutes 5,4% of all working women.• In total, there were 445 000 people working as self-employed or employers in the
informal sector. This number constitutes 5,6% of all employed people. Table 7: The employed who are working in the informal sector
Year 1994s 1995 1996 1997 N
(000s) %* N
(000s) %* N
(000s) %* N
(000s) %*
Self employed/employer: Men
Women Total
262 183 445
5,7 5,4 5,6
277 200 477
6,1 5,7 5,9
165 126 291
3,8 3,9 3,8
233 193 426
5,4 6,0 5,6
Domestic worker: Men
Women Total
16
713 729
0,3
21,1 9,1
18
667 685
0,4
19,1 8,5
77
611 688
1,8
18,8 9,1
96
683 779
2,2
21,2 10,3
Employee: Men
Women Total
- - -
- - -
- - -
- - -
- - -
- - -
434 189 623
10.0 5,9 8,3
Total: Men
Women Total
278 896
1 174
6,1
26,5 14,7
295 867
1 162
6,5
24,8 14,4
242 737 979
5,6
22,7 12,9
762
1 066 1 828
17,6 33,1 24,2
* % of all employed men, women and people • The table shows that there were about 1,2 million domestic workers, self-employed
people or employers in the informal sector in both 1994 (15% of the employed) and 1995(14% of the employed). In 1996 this number decreased to approximately 1,0 million(13% of the employed).
• By contrast, in 1997, 1,8 million people (24%) were reported to be working in theinformal sector. The increase is largely due to the proper identification for the first time ofemployees in informal sector enterprises, of whom there were 623 000 (8% of theemployed).
• If employees are excluded from the informal sector in 1997, then approximately 1,2million people (16%) were found to be working there.

PLEASE TURN THE PAGE
41
Chapter 5 Formal sector employment In this chapter, we refer to those surveys which Stats SA conducts on a regular basis tocollect information on employment, salaries and wages from the non-agricultural formalbusiness sectors, covering the period April 1994 to December 1997. All statistics include theformer TBVC states. • First, we indicate the year-on-year changes, in total and in each sector, between
December 1994 and December 1997.• Then we indicate the extent of month-on month changes, in total and in each sector, from
April 1994 to December 1997, taking June 1994 as a baseline with an index of 100.
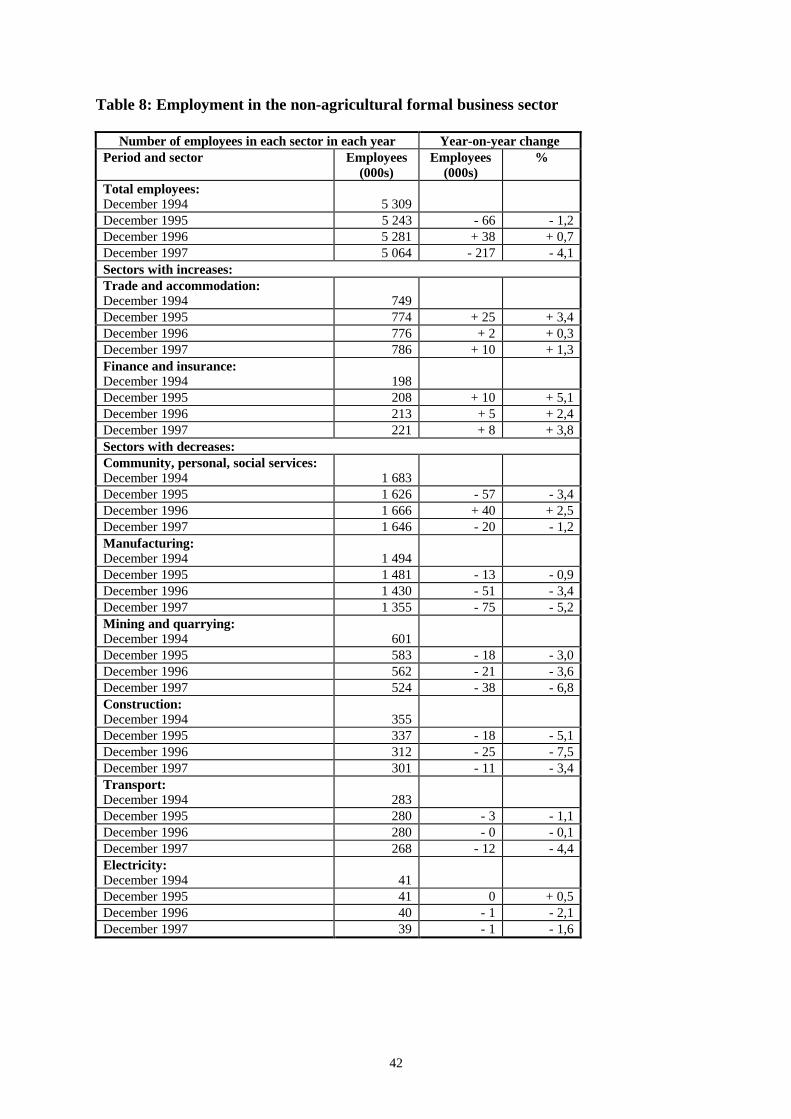
Total employment in the formal non-agricultural businesssector Since December 1994, the number of jobs in the formal non-agricultural sector has beengradually decreasing, except for a slight increase at the end of 1996. Table 8 (overleaf) indicates the following: • In December 1994, employment in this sector stood at a level of approximately 5,31
million employees. The number of employees decreased slightly by 1,2% to 5,24 millionby December 1995.
• During 1996, however, formal employment increased slightly, reaching approximately5,28 million employees at the end of the year, reflecting an annual increase of 0,7%.
• Job losses were again recorded in 1997, when formal employment dropped fromapproximately 5,28 million at December 1996 to about 5,06 million at December 1997,representing a decrease of 4,1%.
Comparison of formal job losses and gains by sector The decline in employment during the period December 1994 to December 1997 was notuniform across all sectors. • In two of the eight sectors, namely trade and the financial sector, new employment was
recorded. These sectors accounted for around 20% of all employment in December 1997.• In six sectors, job losses were recorded: community, social and personal services;
manufacturing; mining and quarrying; construction; transport; and electricity. These sixsectors contributed approximately 81% of jobs to the total formal sector employment atDecember 1997.
42
Table 8: Employment in the non-agricultural formal business sector Number of employees in each sector in each year Year-on-year change
Period and sector Employees (000s)
Employees(000s)
%
Total employees: December 1994
5 309
December 1995 5 243 - 66 - 1,2 December 1996 5 281 + 38 + 0,7 December 1997 5 064 - 217 - 4,1 Sectors with increases: Trade and accommodation: December 1994
749
December 1995 774 + 25 + 3,4 December 1996 776 + 2 + 0,3 December 1997 786 + 10 + 1,3 Finance and insurance: December 1994
198
December 1995 208 + 10 + 5,1 December 1996 213 + 5 + 2,4 December 1997 221 + 8 + 3,8 Sectors with decreases: Community, personal, social services: December 1994
1 683
December 1995 1 626 - 57 - 3,4 December 1996 1 666 + 40 + 2,5 December 1997 1 646 - 20 - 1,2 Manufacturing: December 1994
1 494
December 1995 1 481 - 13 - 0,9 December 1996 1 430 - 51 - 3,4 December 1997 1 355 - 75 - 5,2 Mining and quarrying: December 1994
601
December 1995 583 - 18 - 3,0 December 1996 562 - 21 - 3,6 December 1997 524 - 38 - 6,8 Construction: December 1994
355
December 1995 337 - 18 - 5,1 December 1996 312 - 25 - 7,5 December 1997 301 - 11 - 3,4 Transport: December 1994
283
December 1995 280 - 3 - 1,1 December 1996 280 - 0 - 0,1 December 1997 268 - 12 - 4,4 Electricity: December 1994
41
December 1995 41 0 + 0,5 December 1996 40 - 1 - 2,1 December 1997 39 - 1 - 1,6
43
Sectors in which employment increased The wholesale, retail, motor trade and accommodation sectors • Table 8 shows that, in December 1997, approximately 786 000 people were employed in
the wholesale, retail and motor trade and accommodation sectors, as against about749 000 in December 1994.
• Fifteen percent of formal jobs were found in this sector in December 1997.• The largest year-on-year increase (3,4%) in employment was recorded in December 1995.
The financial sector • Although the financial sector is relatively small, contributing only 4% to total formal
sector employment in December 1997, substantial employment gains were made in itover the four-year period.
• In December 1994, there were approximately 198 000 jobs in the sector. By December1997, however, there were approximately 221 000 people employed in this sector.
• Between December 1994 and December 1995, the number of jobs increased by 5,1%, thelargest year-on-year increase.
Sectors in which employment decreased Community, social and personal services sector (including government) • The community, social and personal services sector (which includes government) is the
largest contributor to formal employment in South Africa. In December 1997, itcontributed 32% to total formal employment.
• Between December 1994 and December 1995, approximately 57 000 jobs were lost inthis sector. However, between December 1995 and December 1996, 40 000 jobs wereadded.
• There was again a drop in employment of 1,2% as at December 1997 compared withDecember 1996.
The manufacturing sector • The manufacturing sector is the second-largest contributor to total formal employment,
with 26% of all formal jobs found here in December 1997.• In December 1994, there were approximately 1,49 million jobs as against approximately
1,36 million jobs in December 1997.• The largest year-on-year drop in employment (5,2%) occurred between December 1996
and December 1997.
44
The mining and quarrying sector • Mining and quarrying contributed 10% to total formal employment in December 1997.• This sector lost 77 000 jobs between December 1994 and December 1997.• The largest year-on-year drop in employment in the sector occurred between December
1996 and December 1997, a loss of 6,8%. The construction sector • The formal construction sector contributed 6% to total formal sector employment in
December 1997.• In spite of the ongoing crisis in supply of housing, this sector showed large job losses.
Between December 1994 and December 1997, 54 000 jobs were lost.• The largest year-on-year drop in employment occurred during 1996, reflecting a loss of
7,5% of jobs at December 1996. This was followed by another year-on-year drop inemployment during 1997, reflecting a loss of 3,4% of jobs at December 1997.
The transport sector • The transport sector, with a contribution of 5% to total formal sector employment in
December 1997, also showed job losses.• Overall, during the period December 1994 to December 1997, this sector recorded job
losses of approximately 15 000.• The largest year-on-year drop in employment occurred during 1997, reflecting a loss of
4,4% at December 1997. The electricity sector • The electricity sector is relatively small, contributing only 0,8% to total formal sector
employment in December 1997.• From December 1994 to December 1997, about 2 000 jobs were lost.• Table 8 shows a slight year-on-year increase in jobs in the sector between December 1994
and December 1995. Thereafter, there has been a steady decrease in jobs.
Month-on-month changes in employment In Table 8, we presented year-on-year changes in formal employment. In this section, weexamine month-on-month changes. • In the following graphs, June 1994 is taken as the starting point for examining month-on-
month changes in employment. This is because, internationally, June is the month usedfor baseline calculations of employment changes.
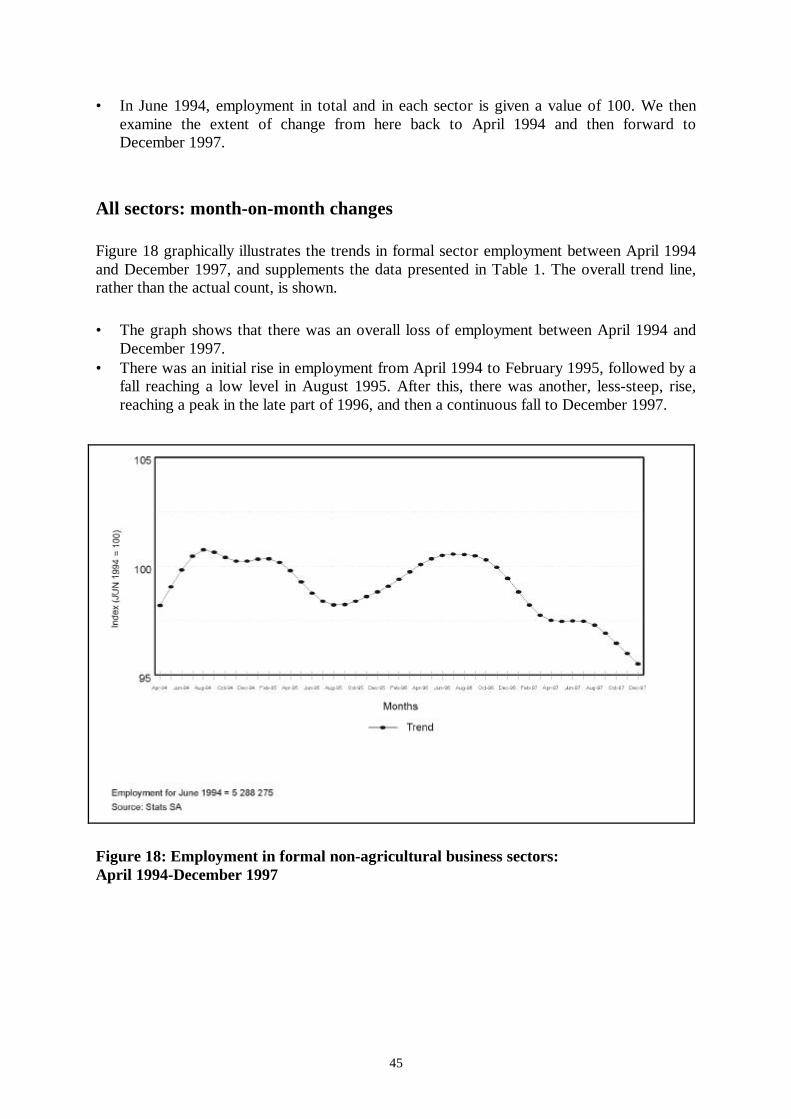
45
• In June 1994, employment in total and in each sector is given a value of 100. We thenexamine the extent of change from here back to April 1994 and then forward toDecember 1997.
All sectors: month-on-month changes Figure 18 graphically illustrates the trends in formal sector employment between April 1994and December 1997, and supplements the data presented in Table 1. The overall trend line,rather than the actual count, is shown. • The graph shows that there was an overall loss of employment between April 1994 and
December 1997.• There was an initial rise in employment from April 1994 to February 1995, followed by a
fall reaching a low level in August 1995. After this, there was another, less-steep, rise,reaching a peak in the late part of 1996, and then a continuous fall to December 1997.
Figure 18: Employment in formal non-agricultural business sectors: April 1994-December 1997
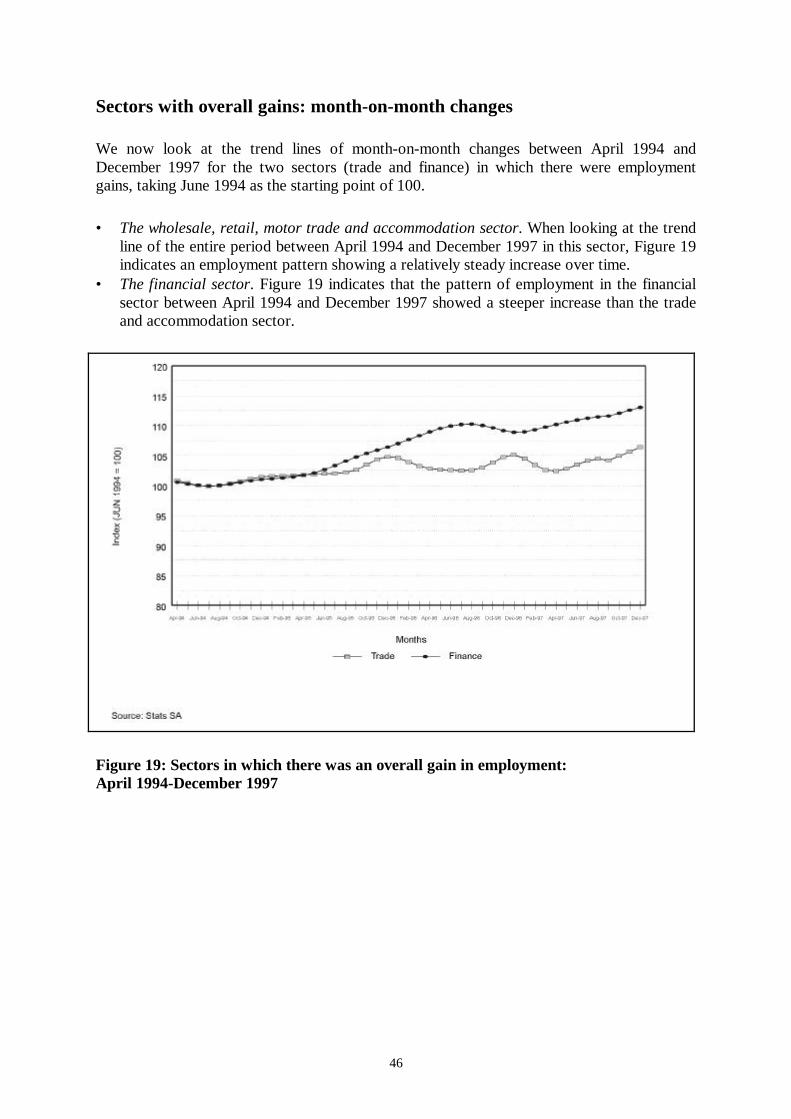
46
Sectors with overall gains: month-on-month changes We now look at the trend lines of month-on-month changes between April 1994 andDecember 1997 for the two sectors (trade and finance) in which there were employmentgains, taking June 1994 as the starting point of 100. • The wholesale, retail, motor trade and accommodation sector. When looking at the trend
line of the entire period between April 1994 and December 1997 in this sector, Figure 19indicates an employment pattern showing a relatively steady increase over time.
• The financial sector. Figure 19 indicates that the pattern of employment in the financialsector between April 1994 and December 1997 showed a steeper increase than the tradeand accommodation sector.
Figure 19: Sectors in which there was an overall gain in employment: April 1994-December 1997
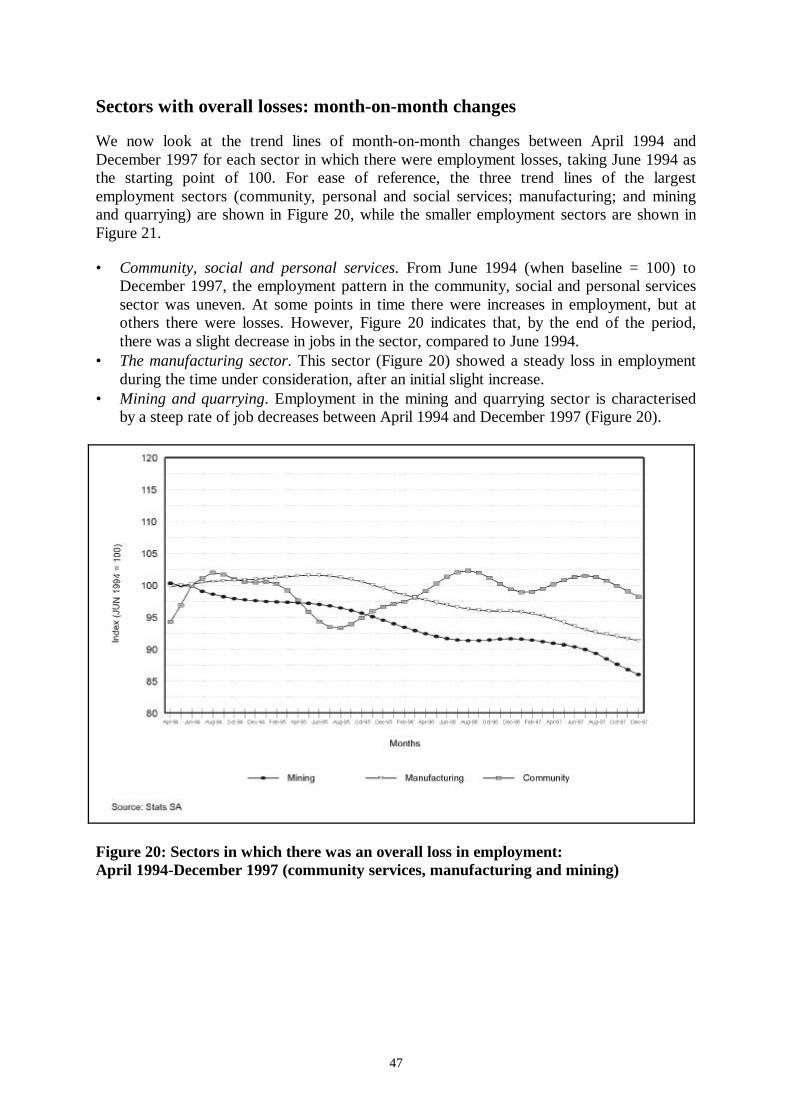
47
Sectors with overall losses: month-on-month changes We now look at the trend lines of month-on-month changes between April 1994 andDecember 1997 for each sector in which there were employment losses, taking June 1994 asthe starting point of 100. For ease of reference, the three trend lines of the largestemployment sectors (community, personal and social services; manufacturing; and miningand quarrying) are shown in Figure 20, while the smaller employment sectors are shown inFigure 21. • Community, social and personal services. From June 1994 (when baseline = 100) to
December 1997, the employment pattern in the community, social and personal servicessector was uneven. At some points in time there were increases in employment, but atothers there were losses. However, Figure 20 indicates that, by the end of the period,there was a slight decrease in jobs in the sector, compared to June 1994.
• The manufacturing sector. This sector (Figure 20) showed a steady loss in employmentduring the time under consideration, after an initial slight increase.
• Mining and quarrying. Employment in the mining and quarrying sector is characterisedby a steep rate of job decreases between April 1994 and December 1997 (Figure 20).
Figure 20: Sectors in which there was an overall loss in employment:April 1994-December 1997 (community services, manufacturing and mining)
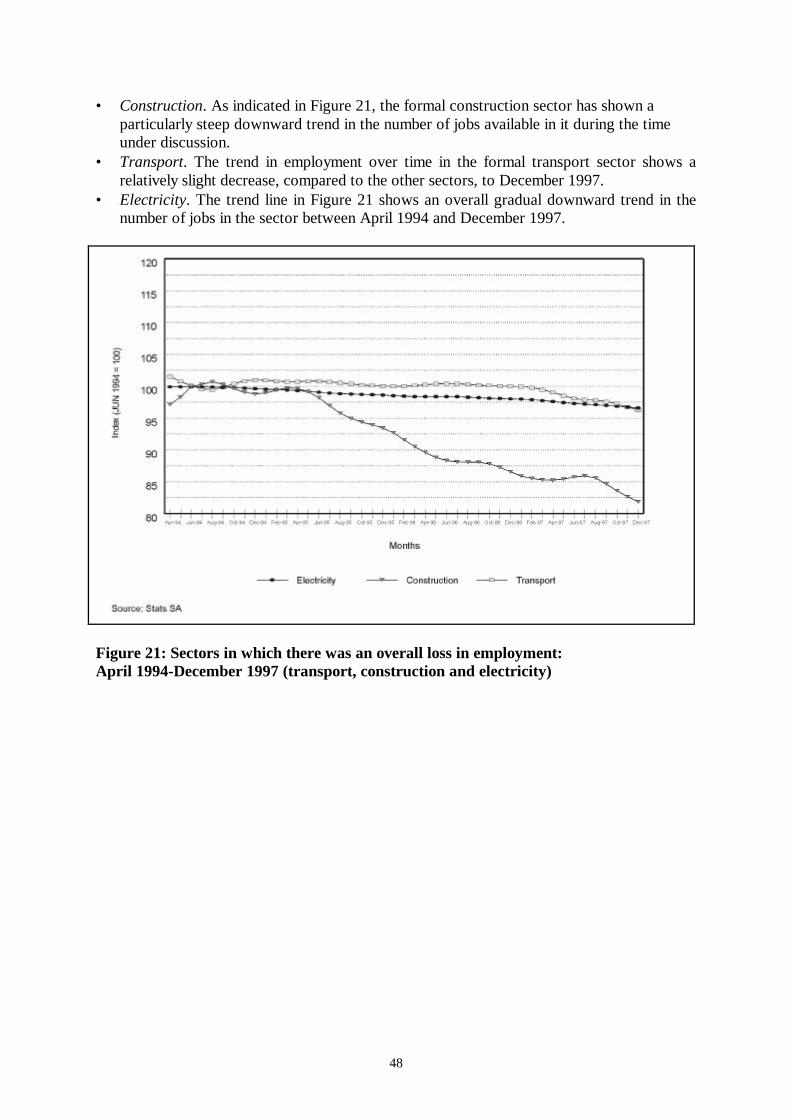
48
• Construction. As indicated in Figure 21, the formal construction sector has shown aparticularly steep downward trend in the number of jobs available in it during the timeunder discussion.
• Transport. The trend in employment over time in the formal transport sector shows arelatively slight decrease, compared to the other sectors, to December 1997.
• Electricity. The trend line in Figure 21 shows an overall gradual downward trend in thenumber of jobs in the sector between April 1994 and December 1997.
Figure 21: Sectors in which there was an overall loss in employment: April 1994-December 1997 (transport, construction and electricity)
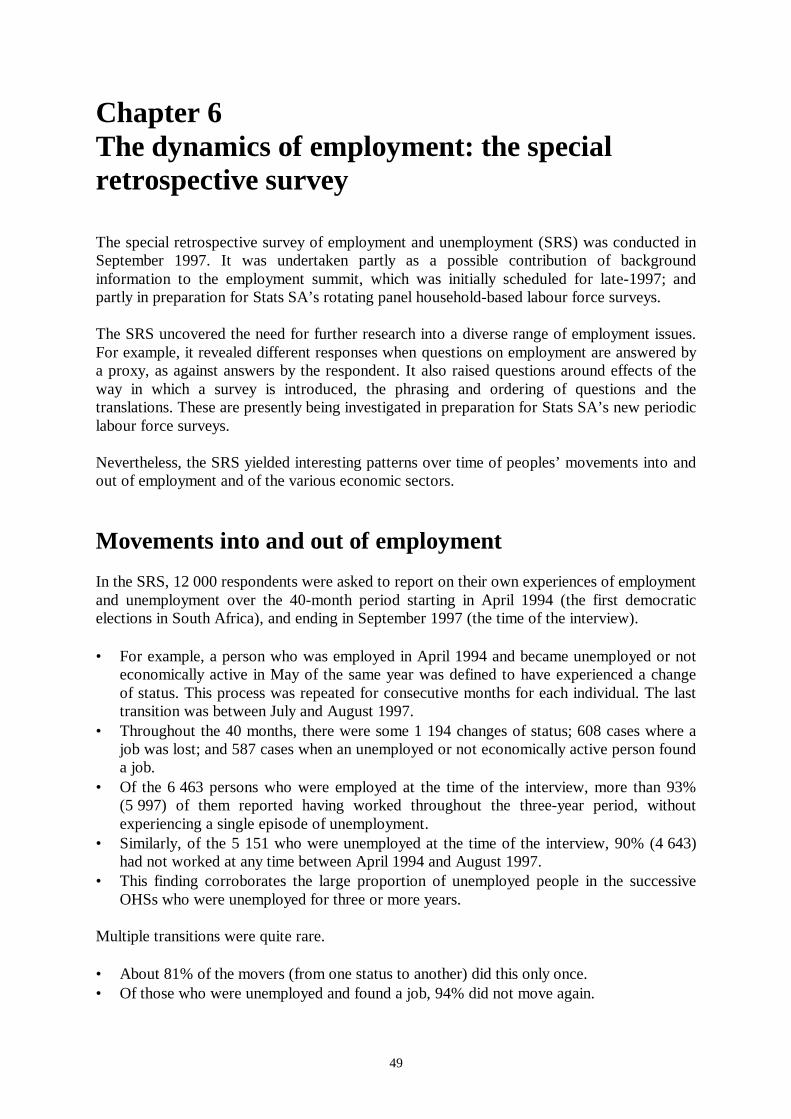
49
Chapter 6 The dynamics of employment: the specialretrospective survey The special retrospective survey of employment and unemployment (SRS) was conducted inSeptember 1997. It was undertaken partly as a possible contribution of backgroundinformation to the employment summit, which was initially scheduled for late-1997; andpartly in preparation for Stats SA’s rotating panel household-based labour force surveys. The SRS uncovered the need for further research into a diverse range of employment issues.For example, it revealed different responses when questions on employment are answered bya proxy, as against answers by the respondent. It also raised questions around effects of theway in which a survey is introduced, the phrasing and ordering of questions and thetranslations. These are presently being investigated in preparation for Stats SA’s new periodiclabour force surveys. Nevertheless, the SRS yielded interesting patterns over time of peoples’ movements into andout of employment and of the various economic sectors.
Movements into and out of employment In the SRS, 12 000 respondents were asked to report on their own experiences of employmentand unemployment over the 40-month period starting in April 1994 (the first democraticelections in South Africa), and ending in September 1997 (the time of the interview). • For example, a person who was employed in April 1994 and became unemployed or not
economically active in May of the same year was defined to have experienced a changeof status. This process was repeated for consecutive months for each individual. The lasttransition was between July and August 1997.
• Throughout the 40 months, there were some 1 194 changes of status; 608 cases where ajob was lost; and 587 cases when an unemployed or not economically active person founda job.
• Of the 6 463 persons who were employed at the time of the interview, more than 93%(5 997) of them reported having worked throughout the three-year period, withoutexperiencing a single episode of unemployment.
• Similarly, of the 5 151 who were unemployed at the time of the interview, 90% (4 643)had not worked at any time between April 1994 and August 1997.
• This finding corroborates the large proportion of unemployed people in the successiveOHSs who were unemployed for three or more years.
Multiple transitions were quite rare. • About 81% of the movers (from one status to another) did this only once.• Of those who were unemployed and found a job, 94% did not move again.
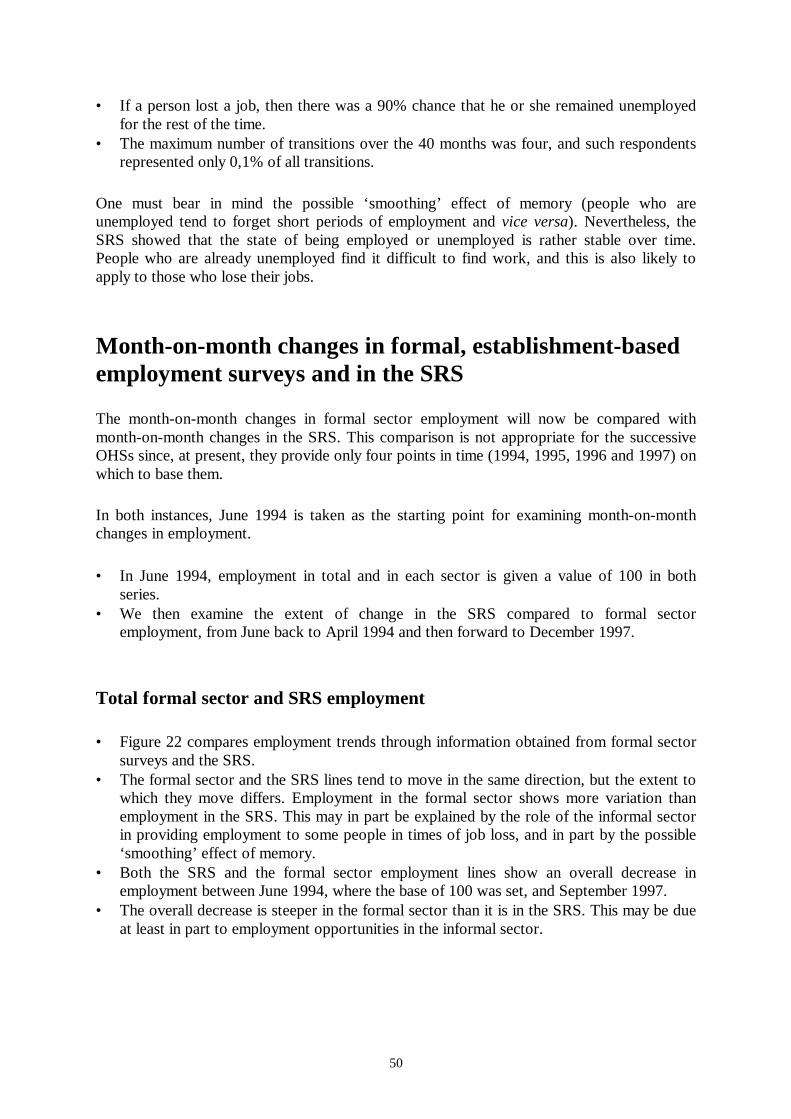
50
• If a person lost a job, then there was a 90% chance that he or she remained unemployedfor the rest of the time.
• The maximum number of transitions over the 40 months was four, and such respondentsrepresented only 0,1% of all transitions.
One must bear in mind the possible ‘smoothing’ effect of memory (people who areunemployed tend to forget short periods of employment and vice versa). Nevertheless, theSRS showed that the state of being employed or unemployed is rather stable over time.People who are already unemployed find it difficult to find work, and this is also likely toapply to those who lose their jobs.
Month-on-month changes in formal, establishment-basedemployment surveys and in the SRS The month-on-month changes in formal sector employment will now be compared withmonth-on-month changes in the SRS. This comparison is not appropriate for the successiveOHSs since, at present, they provide only four points in time (1994, 1995, 1996 and 1997) onwhich to base them. In both instances, June 1994 is taken as the starting point for examining month-on-monthchanges in employment. • In June 1994, employment in total and in each sector is given a value of 100 in both
series.• We then examine the extent of change in the SRS compared to formal sector
employment, from June back to April 1994 and then forward to December 1997.
Total formal sector and SRS employment • Figure 22 compares employment trends through information obtained from formal sector
surveys and the SRS.• The formal sector and the SRS lines tend to move in the same direction, but the extent to
which they move differs. Employment in the formal sector shows more variation thanemployment in the SRS. This may in part be explained by the role of the informal sectorin providing employment to some people in times of job loss, and in part by the possible‘smoothing’ effect of memory.
• Both the SRS and the formal sector employment lines show an overall decrease inemployment between June 1994, where the base of 100 was set, and September 1997.
• The overall decrease is steeper in the formal sector than it is in the SRS. This may be dueat least in part to employment opportunities in the informal sector.
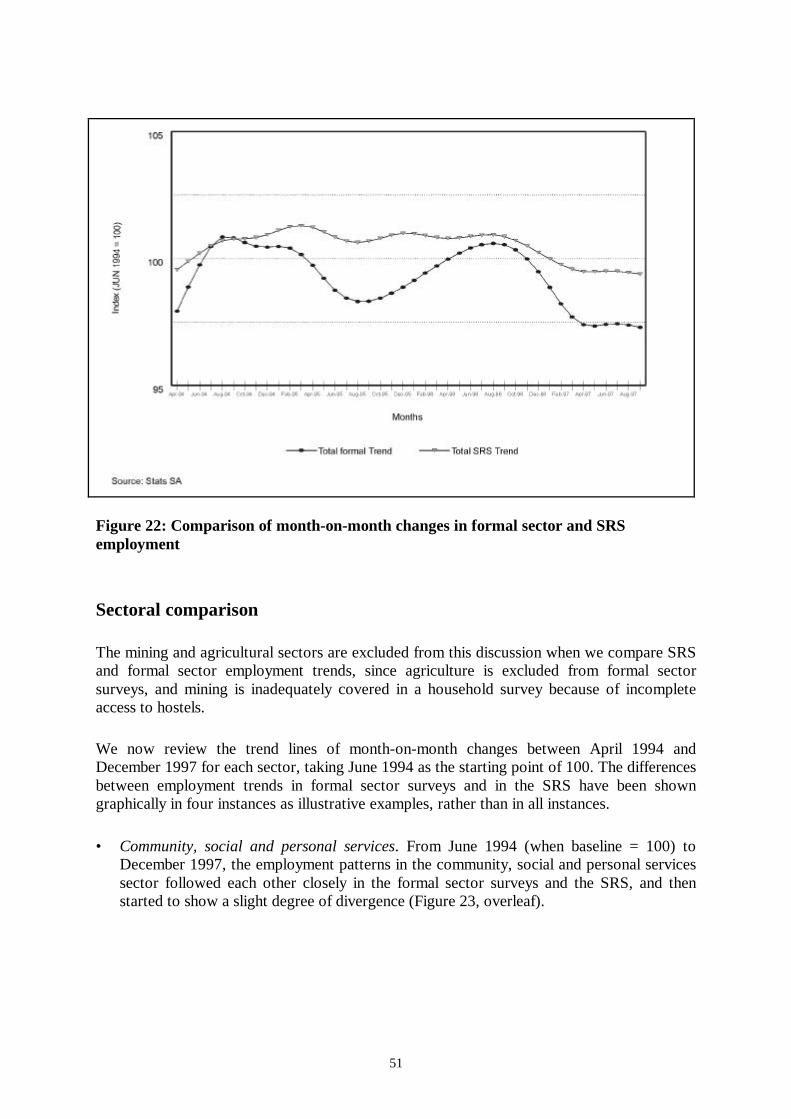
51
Figure 22: Comparison of month-on-month changes in formal sector and SRSemployment
Sectoral comparison The mining and agricultural sectors are excluded from this discussion when we compare SRSand formal sector employment trends, since agriculture is excluded from formal sectorsurveys, and mining is inadequately covered in a household survey because of incompleteaccess to hostels. We now review the trend lines of month-on-month changes between April 1994 andDecember 1997 for each sector, taking June 1994 as the starting point of 100. The differencesbetween employment trends in formal sector surveys and in the SRS have been showngraphically in four instances as illustrative examples, rather than in all instances. • Community, social and personal services. From June 1994 (when baseline = 100) to
December 1997, the employment patterns in the community, social and personal servicessector followed each other closely in the formal sector surveys and the SRS, and thenstarted to show a slight degree of divergence (Figure 23, overleaf).
52
Figure 23: Comparison of month-on-month changes in formal sector and SRSemployment in the community, social and personal services sector
• The manufacturing sector. In formal employment, this sector showed a steady loss inemployment during the time under consideration, after an initial slight increase (seeFigure 24). But in the SRS, it showed an overall slight increase over the time period. Theincrease was larger between late 1995 and early 1997, but then it tailed off. Thedifference may in part be due to some informal sector activity.
• Construction. The formal construction sector has shown a particularly steep downwardtrend in the number of jobs available in it during the time under discussion. This trendwas mirrored, albeit less steeply, in the SRS.
• Transport. The trend in employment over time in the formal transport sector shows arelatively slight decrease. However, in the SRS, there is an overall divergence andincrease in jobs over time, possibly as a result of the growing informal taxi industry(Figure 25).
• Electricity. The trend line shows an overall gradual downward trend in the number of jobsin the sector in both data sets between April 1994 and December 1997.
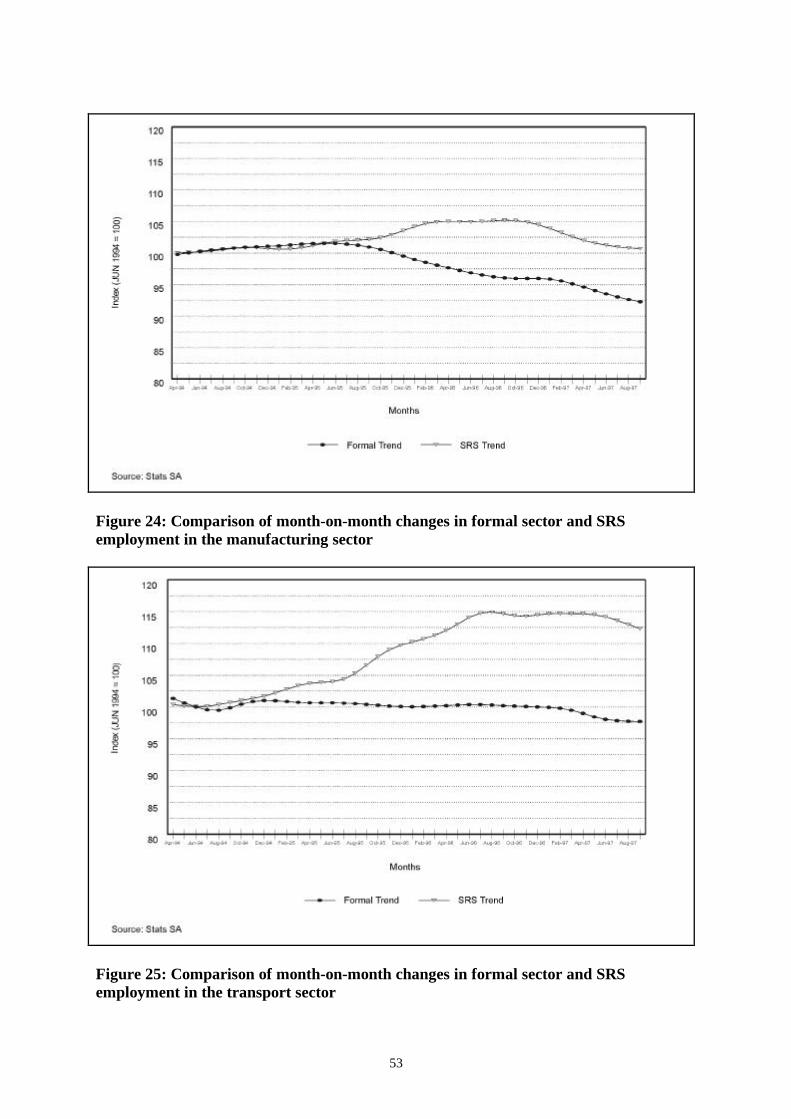
53
Figure 24: Comparison of month-on-month changes in formal sector and SRSemployment in the manufacturing sector
Figure 25: Comparison of month-on-month changes in formal sector and SRSemployment in the transport sector
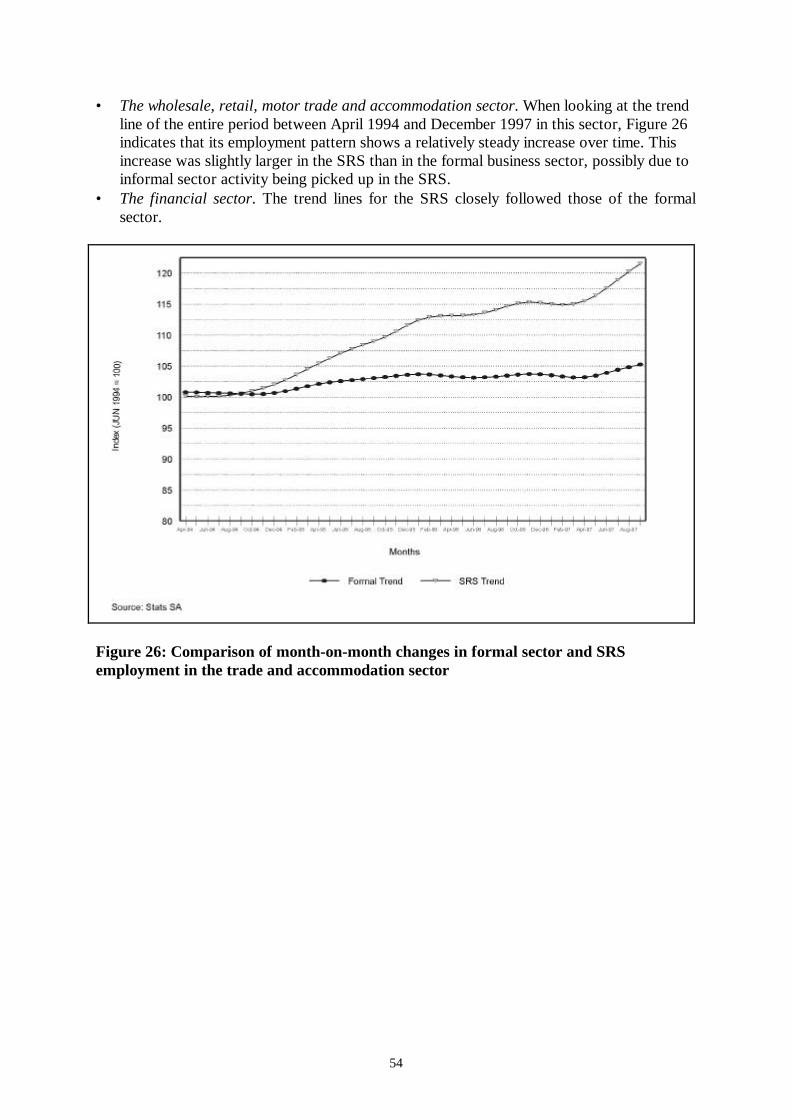
54
• The wholesale, retail, motor trade and accommodation sector. When looking at the trendline of the entire period between April 1994 and December 1997 in this sector, Figure 26indicates that its employment pattern shows a relatively steady increase over time. Thisincrease was slightly larger in the SRS than in the formal business sector, possibly due toinformal sector activity being picked up in the SRS.
• The financial sector. The trend lines for the SRS closely followed those of the formalsector.
Figure 26: Comparison of month-on-month changes in formal sector and SRSemployment in the trade and accommodation sector
55
Chapter 7 Poverty and labour market status
In 1995, Stats SA conducted an income and expenditure survey at the same time as the annualOctober household survey. Each household which answered the OHS questionnaire was alsoapproached to answer a detailed questionnaire about the household’s income and expenditure. On the basis of the data from the second survey, households could be divided nationally intofive roughly equal groups, or quintiles, according to the size of the annual household income.Quintile 1 contains the poorest households – those with annual incomes of R6 868 or less inOctober 1995. Quintile 5 contains the richest households, whose annual incomes wereR52 801 or more in 1995. Household weights in this section are based on the 1991 census rather than on the preliminaryresults from Census ’96, because household weights were not calculated as part of thepreliminary results. Weights for individuals were however based on the post-enumerationsurvey, and preliminary estimates of the population size from Census ’96. The quintile measure used here, in taking total household income rather than income percapita or adult-equivalent, understates the disparities between households in the differentquintiles. The reason is that, on average, poorer households are generally also largerhouseholds. The income per person is thus proportionately lower among the poorest. While it is recognised that income is not necessarily the best or only measure of poverty, forthe purposes of this comparison, it is the most accessible. This section looks at some of the labour market characteristics of households in the differentincome quintiles to show some of the links between labour market status and poverty.
The economically active by income quintile and gender,1995 Figure 27 (overleaf) shows the economically active population (the employed and theunemployed) as a percentage of all those of working age (in the age category 15 to 65 years),using the official definition of unemployment. • Within each quintile there were proportionately fewer economically active women than
men. For example, in quintile 1 (the poorest group), 39% of men were economicallyactive, as against 25% of women.
• For both men and women the higher the income, the more likely the person was to beeconomically active. For example, in quintile 2, only 44% of men and 29% of womenwere economically active, but in quintile 5 (the richest group) 72% of men and 53% ofwomen were economically active.
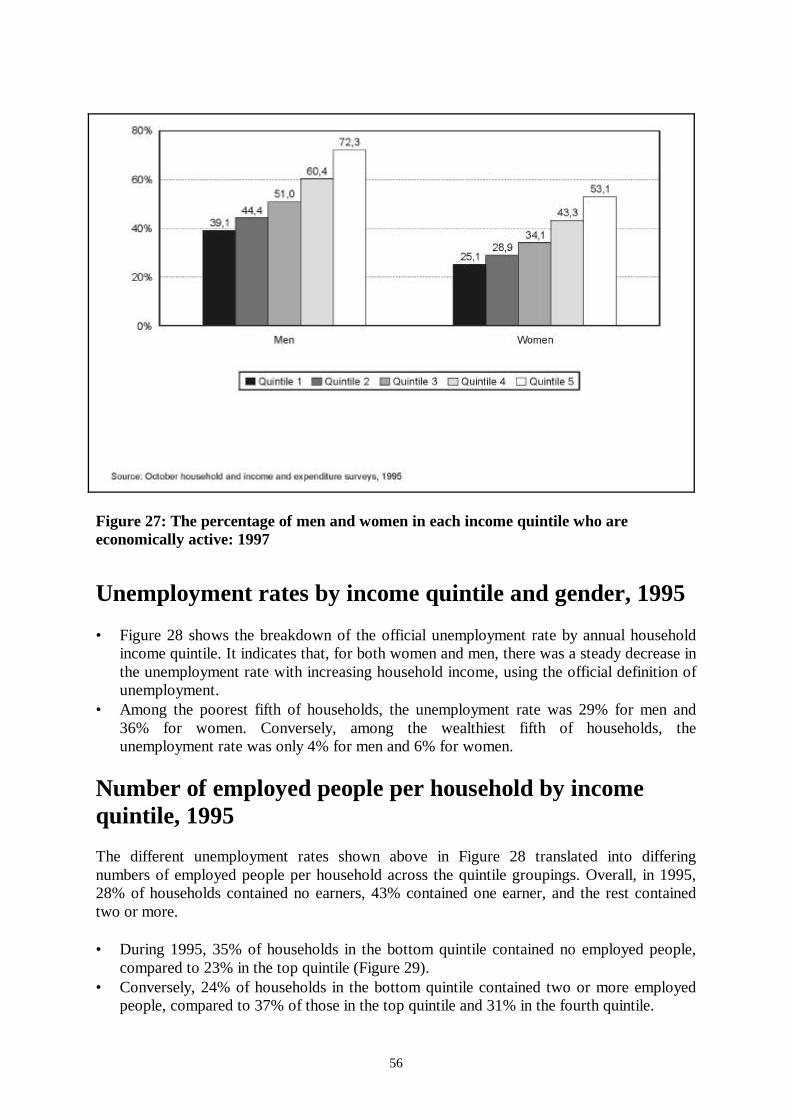
56
Figure 27: The percentage of men and women in each income quintile who are economically active: 1997
Unemployment rates by income quintile and gender, 1995 • Figure 28 shows the breakdown of the official unemployment rate by annual household
income quintile. It indicates that, for both women and men, there was a steady decrease inthe unemployment rate with increasing household income, using the official definition ofunemployment.
• Among the poorest fifth of households, the unemployment rate was 29% for men and36% for women. Conversely, among the wealthiest fifth of households, theunemployment rate was only 4% for men and 6% for women.
Number of employed people per household by incomequintile, 1995 The different unemployment rates shown above in Figure 28 translated into differingnumbers of employed people per household across the quintile groupings. Overall, in 1995,28% of households contained no earners, 43% contained one earner, and the rest containedtwo or more. • During 1995, 35% of households in the bottom quintile contained no employed people,
compared to 23% in the top quintile (Figure 29).• Conversely, 24% of households in the bottom quintile contained two or more employed
people, compared to 37% of those in the top quintile and 31% in the fourth quintile.
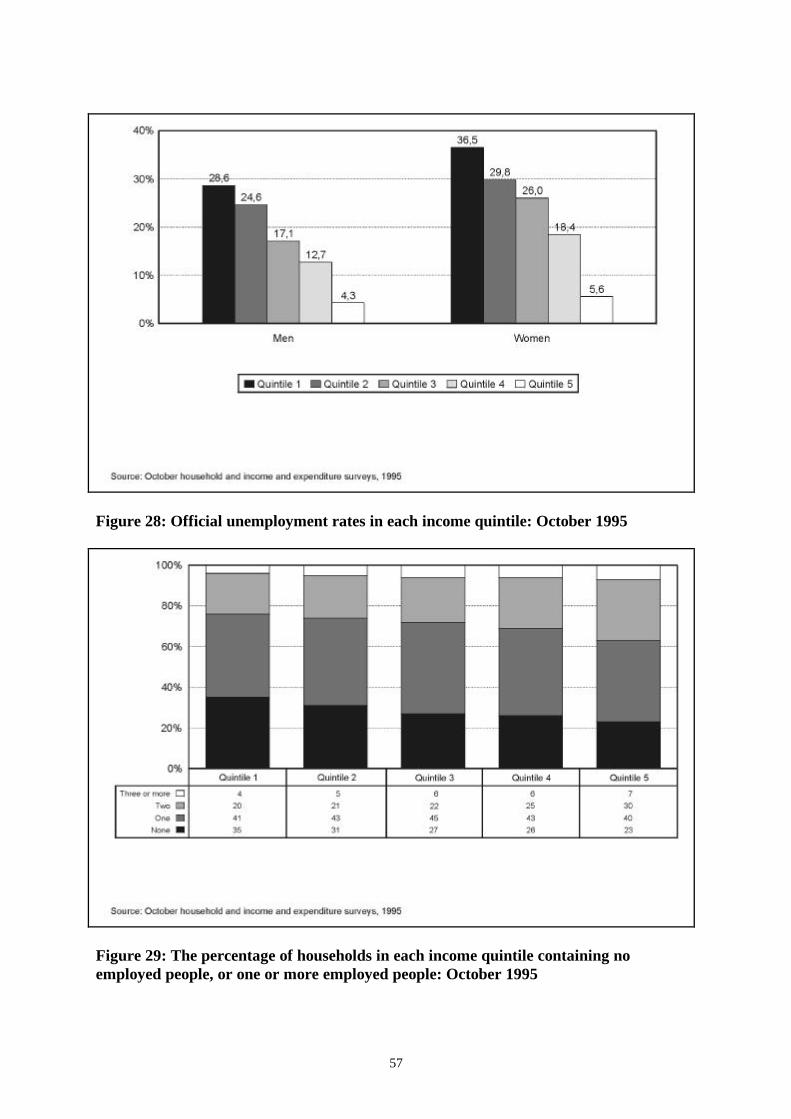
57
Figure 28: Official unemployment rates in each income quintile: October 1995
Figure 29: The percentage of households in each income quintile containing no employed people, or one or more employed people: October 1995

58
Number of employed people per household by population group, 1995 • Thirty-two percent of African households contained no employed people and only 22%
contained two or more.• Among the other population groups, between 41% and 44% of households contained two
or more employed people.• The relatively high proportion, 28%, of white households with no employed people
reflects a high proportion of single-person pensioner or retiree households.
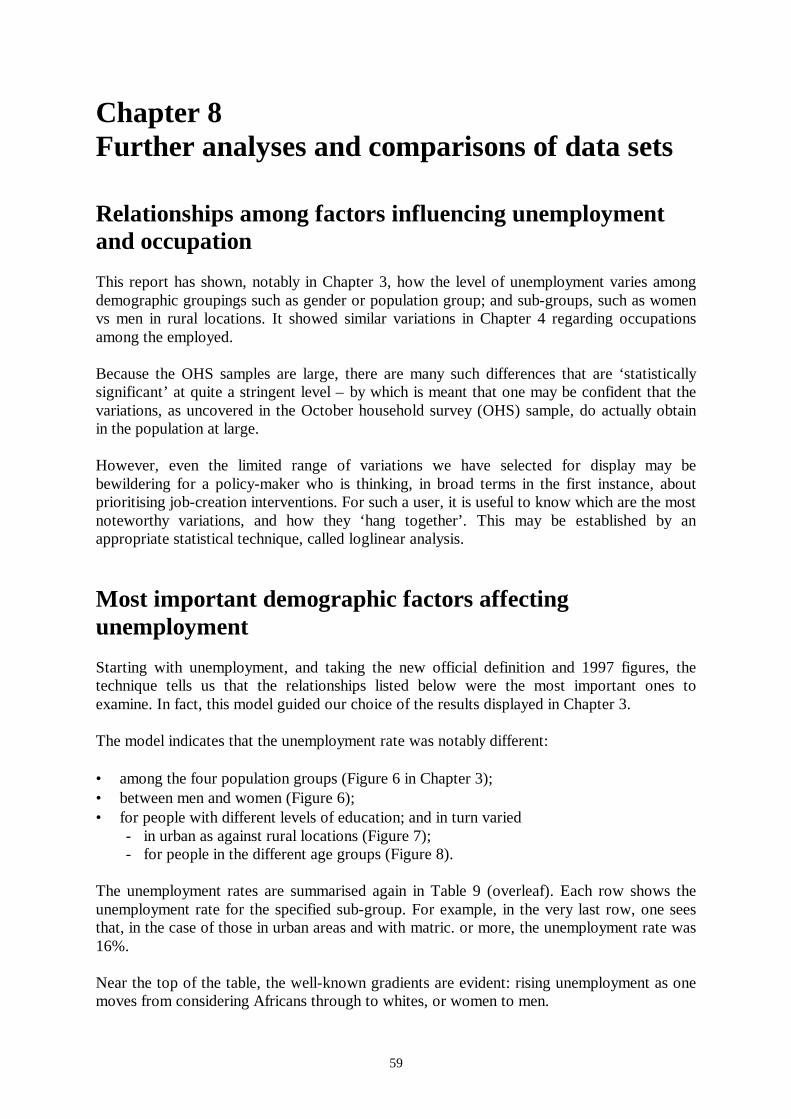
59
Chapter 8 Further analyses and comparisons of data sets
Relationships among factors influencing unemploymentand occupation This report has shown, notably in Chapter 3, how the level of unemployment varies amongdemographic groupings such as gender or population group; and sub-groups, such as womenvs men in rural locations. It showed similar variations in Chapter 4 regarding occupationsamong the employed. Because the OHS samples are large, there are many such differences that are ‘statisticallysignificant’ at quite a stringent level – by which is meant that one may be confident that thevariations, as uncovered in the October household survey (OHS) sample, do actually obtainin the population at large. However, even the limited range of variations we have selected for display may bebewildering for a policy-maker who is thinking, in broad terms in the first instance, aboutprioritising job-creation interventions. For such a user, it is useful to know which are the mostnoteworthy variations, and how they ‘hang together’. This may be established by anappropriate statistical technique, called loglinear analysis.
Most important demographic factors affectingunemployment Starting with unemployment, and taking the new official definition and 1997 figures, thetechnique tells us that the relationships listed below were the most important ones toexamine. In fact, this model guided our choice of the results displayed in Chapter 3. The model indicates that the unemployment rate was notably different: • among the four population groups (Figure 6 in Chapter 3);• between men and women (Figure 6);• for people with different levels of education; and in turn varied - in urban as against rural locations (Figure 7); - for people in the different age groups (Figure 8). The unemployment rates are summarised again in Table 9 (overleaf). Each row shows theunemployment rate for the specified sub-group. For example, in the very last row, one seesthat, in the case of those in urban areas and with matric. or more, the unemployment rate was16%. Near the top of the table, the well-known gradients are evident: rising unemployment as onemoves from considering Africans through to whites, or women to men.
60
The relationship between education and unemployment is more intricate: it was ‘curvilinear’,i.e. unemployment was highest (25%) for those with an intermediate amount of education,and lower for those with none (19%) or with matric. or more (18%). When this result was broken down further, by location and by age, one sees that thecurvilinear relationship between unemployment and education also applied in the young andintermediate age groups, and in urban areas. But in the 46-65 age group the relationship wasroughly linear (the higher the education level, the less the extent of unemployment); and inrural areas the relationship was linear but in the opposite direction (the higher the educationlevel, the greater the extent of unemployment!). It will be important to establish the reasonsfor these patterns, so that policy-makers concerned with education and the labour market candesign appropriate programmes. Table 9: Summary of 1997 unemployment rates (official definition) by variousgroupings
Unemployed % %
Average unemployment rate
23
by population group African Coloured Indian White
29 16 10 4
by gender Women Men
28 19
by education level No education Less than matric. Matric. or more
19 25 18
by education level within age 15-30 yrs
No education Less than matric. Matric. or more
31-45 yrs No education Less than matric. Matric. or more
46-65 yrs No education Less than matric.
Matric. or more
35
19
10
35 39 29
17 24 7
12 12 5
by education level within location Non-urban
No education Less than matric. Matric. or more
Urban No education Less than matric. Matric. or more
27
22
19 28 31
20 26 16
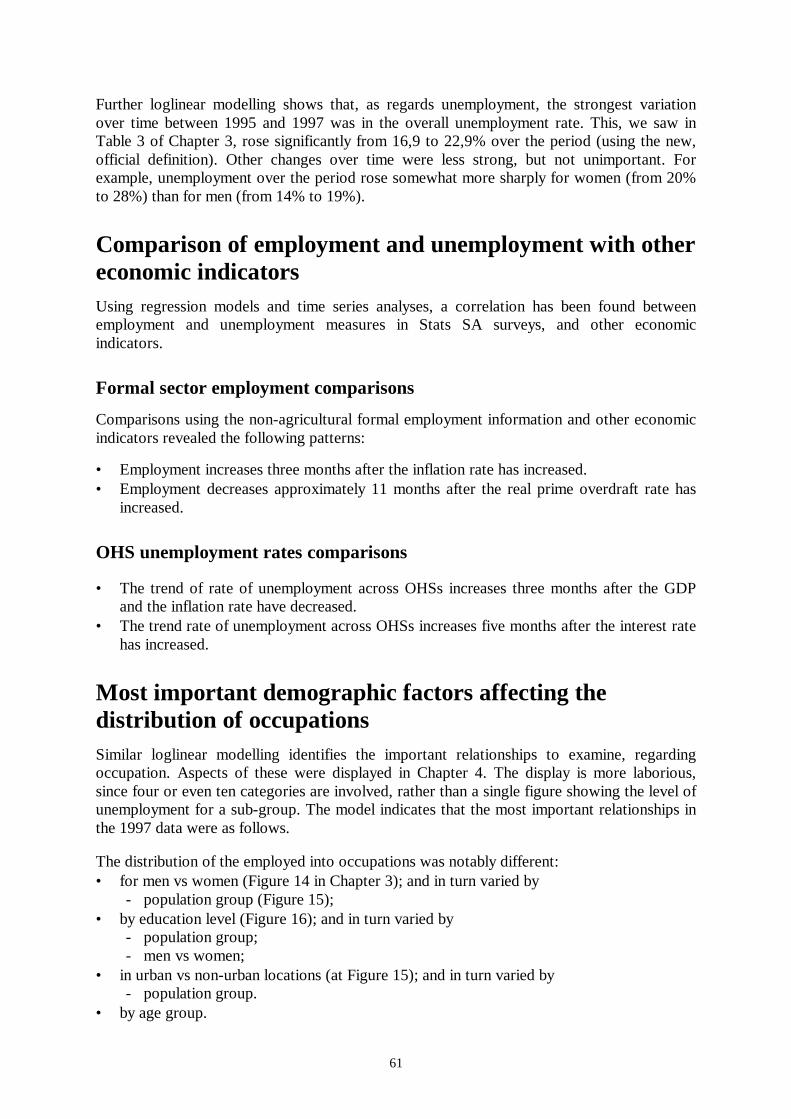
61
Further loglinear modelling shows that, as regards unemployment, the strongest variationover time between 1995 and 1997 was in the overall unemployment rate. This, we saw inTable 3 of Chapter 3, rose significantly from 16,9 to 22,9% over the period (using the new,official definition). Other changes over time were less strong, but not unimportant. Forexample, unemployment over the period rose somewhat more sharply for women (from 20%to 28%) than for men (from 14% to 19%).
Comparison of employment and unemployment with othereconomic indicators Using regression models and time series analyses, a correlation has been found betweenemployment and unemployment measures in Stats SA surveys, and other economicindicators. Formal sector employment comparisons Comparisons using the non-agricultural formal employment information and other economicindicators revealed the following patterns: • Employment increases three months after the inflation rate has increased.• Employment decreases approximately 11 months after the real prime overdraft rate has
increased. OHS unemployment rates comparisons • The trend of rate of unemployment across OHSs increases three months after the GDP
and the inflation rate have decreased.• The trend rate of unemployment across OHSs increases five months after the interest rate
has increased.
Most important demographic factors affecting thedistribution of occupations Similar loglinear modelling identifies the important relationships to examine, regardingoccupation. Aspects of these were displayed in Chapter 4. The display is more laborious,since four or even ten categories are involved, rather than a single figure showing the level ofunemployment for a sub-group. The model indicates that the most important relationships inthe 1997 data were as follows. The distribution of the employed into occupations was notably different:• for men vs women (Figure 14 in Chapter 3); and in turn varied by
- population group (Figure 15);• by education level (Figure 16); and in turn varied by
- population group; - men vs women;
• in urban vs non-urban locations (at Figure 15); and in turn varied by - population group.
• by age group.
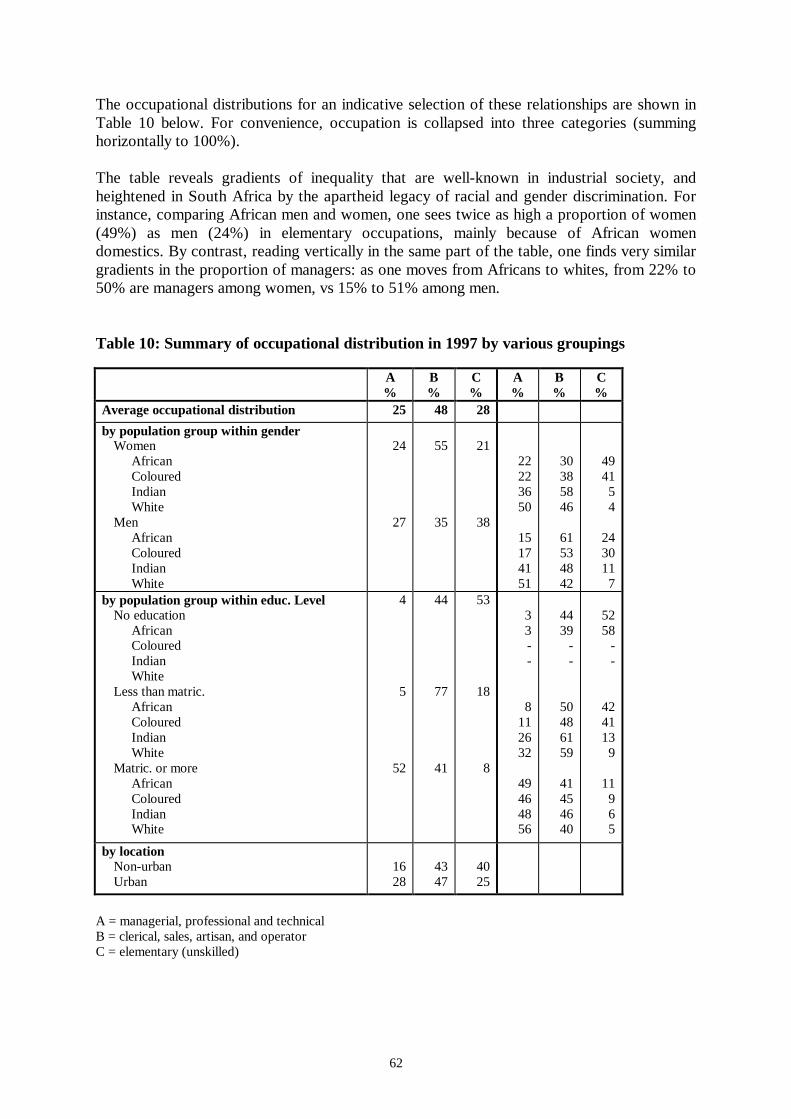
62
The occupational distributions for an indicative selection of these relationships are shown inTable 10 below. For convenience, occupation is collapsed into three categories (summinghorizontally to 100%). The table reveals gradients of inequality that are well-known in industrial society, andheightened in South Africa by the apartheid legacy of racial and gender discrimination. Forinstance, comparing African men and women, one sees twice as high a proportion of women(49%) as men (24%) in elementary occupations, mainly because of African womendomestics. By contrast, reading vertically in the same part of the table, one finds very similargradients in the proportion of managers: as one moves from Africans to whites, from 22% to50% are managers among women, vs 15% to 51% among men. Table 10: Summary of occupational distribution in 1997 by various groupings A
% B %
C %
A %
B %
C %
Average occupational distribution 25 48 28
by population group within gender Women
African Coloured Indian White
Men African Coloured Indian White
24
27
55
35
21
38
22 22 36 50
15 17 41 51
30 38 58 46
61 53 48 42
49 41 5 4
24 30 11 7
by population group within educ. Level No education
African Coloured Indian White
Less than matric. African Coloured Indian White
Matric. or more African Coloured Indian White
4
5
52
44
77
41
53
18
8
3 3 - -
8 11 26 32
49 46 48 56
44 39
- -
50 48 61 59
41 45 46 40
52 58
- -
42 41 13 9
11 9 6 5
by location Non-urban Urban
16 28
43 47
40 25
A = managerial, professional and technical B = clerical, sales, artisan, and operator C = elementary (unskilled)
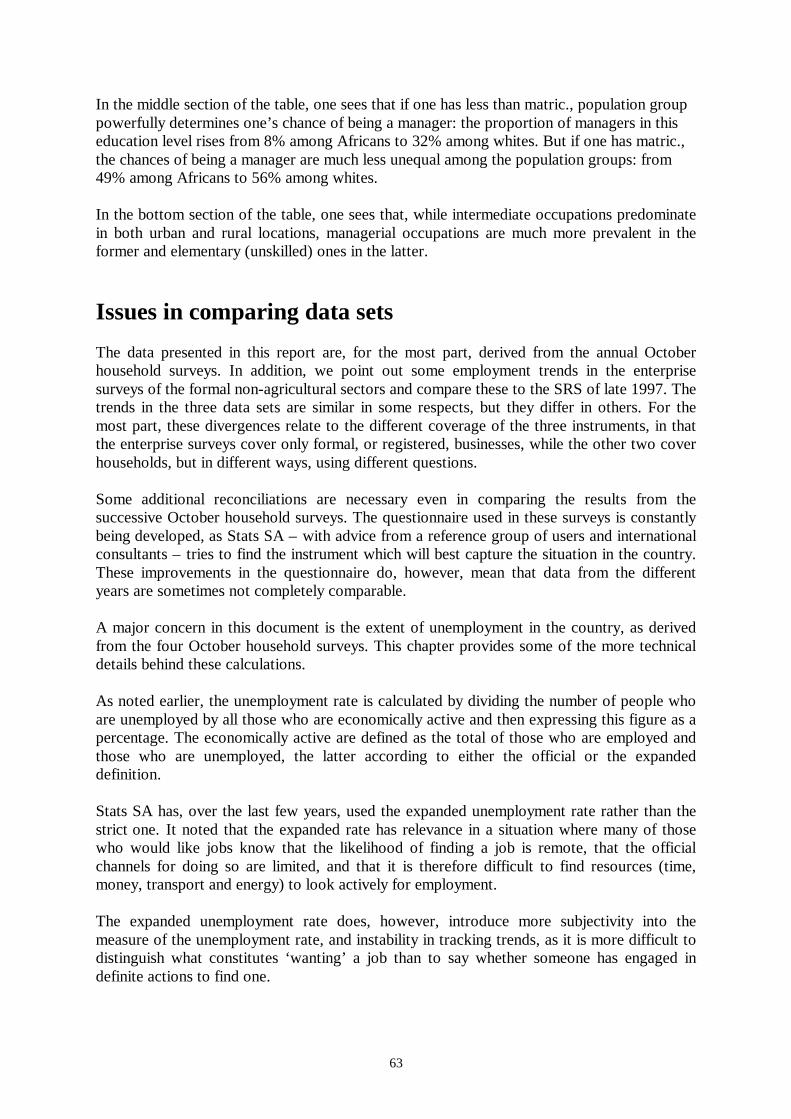
63
In the middle section of the table, one sees that if one has less than matric., population grouppowerfully determines one’s chance of being a manager: the proportion of managers in thiseducation level rises from 8% among Africans to 32% among whites. But if one has matric.,the chances of being a manager are much less unequal among the population groups: from49% among Africans to 56% among whites. In the bottom section of the table, one sees that, while intermediate occupations predominatein both urban and rural locations, managerial occupations are much more prevalent in theformer and elementary (unskilled) ones in the latter.
Issues in comparing data sets The data presented in this report are, for the most part, derived from the annual Octoberhousehold surveys. In addition, we point out some employment trends in the enterprisesurveys of the formal non-agricultural sectors and compare these to the SRS of late 1997. Thetrends in the three data sets are similar in some respects, but they differ in others. For themost part, these divergences relate to the different coverage of the three instruments, in thatthe enterprise surveys cover only formal, or registered, businesses, while the other two coverhouseholds, but in different ways, using different questions. Some additional reconciliations are necessary even in comparing the results from thesuccessive October household surveys. The questionnaire used in these surveys is constantlybeing developed, as Stats SA – with advice from a reference group of users and internationalconsultants – tries to find the instrument which will best capture the situation in the country.These improvements in the questionnaire do, however, mean that data from the differentyears are sometimes not completely comparable. A major concern in this document is the extent of unemployment in the country, as derivedfrom the four October household surveys. This chapter provides some of the more technicaldetails behind these calculations. As noted earlier, the unemployment rate is calculated by dividing the number of people whoare unemployed by all those who are economically active and then expressing this figure as apercentage. The economically active are defined as the total of those who are employed andthose who are unemployed, the latter according to either the official or the expandeddefinition. Stats SA has, over the last few years, used the expanded unemployment rate rather than thestrict one. It noted that the expanded rate has relevance in a situation where many of thosewho would like jobs know that the likelihood of finding a job is remote, that the officialchannels for doing so are limited, and that it is therefore difficult to find resources (time,money, transport and energy) to look actively for employment. The expanded unemployment rate does, however, introduce more subjectivity into themeasure of the unemployment rate, and instability in tracking trends, as it is more difficult todistinguish what constitutes ‘wanting’ a job than to say whether someone has engaged indefinite actions to find one.
64
As noted in Chapter 3, the October household surveys of 1994 to 1995 show a drop in thenew official unemployment rate from 20,0% in 1994 to 16,9% in 1995. Thereafter the rateincreases to 21,0% in 1996 and 22,9% in 1997. For expanded unemployment, the samefour surveys yield a similar pattern – a drop from 31,5% in 1994 to 29,2% in 1995,followed by an increase to 35,6% in 1996 and 37,6% in 1997. Readers may notice that the expanded rate reported here for 1995, namely 29,2%, differsvery slightly from that reported in previous Stats SA publications, i.e. 29,3%. Thedifference results from the use of post-enumeration survey weights from the 1996population census, rather than those of the 1991 census, as well as a slight change in themethod of calculation, necessitated by quite significant changes in the way theemployment questions were phrased and sequenced over the period 1994 to 1997. At some point in all four questionnaires, the informant is asked to categorise each adulthousehold member according to their economic status. Besides the different employmentcategories, there are a number of categories for those who are not economically active(such as full-time homemaker, full-time student, pensioner or retiree, and so on). Thereare also two categorisations for those who could potentially be regarded as unemployed.These are ‘unemployed and looking for work’, and ‘not working, not looking for work’(in 1994, 1995 and 1996) and ‘not working, not looking for work, but available for work’(in 1997). The difficulty is, firstly, how to classify those ‘not working, not looking forwork’ in terms of economic status and, secondly, how to compare the results of thesurveys with this and other differences. One solution – a ‘very expanded’ definition of unemployment – would be to consider allthose not working, but not classified into one of the other categories of the noteconomically active, as unemployed. This has the problematic effect of including amongthe unemployed those people who do not want to work. It is additionally problematic inthe South African context where, in some of the official languages, interviewers wouldhave translated ‘unemployed’ as ‘looking for work’, while others would have translated itsimply as ‘not working’. To arrive at our current definition of expanded unemployment we have, therefore,classified those who were said to be ‘not looking’ for work as not economically active. Inaddition, we have classified as not economically active those who were said to beunwilling to accept a suitable job if it were offered within a week. In order to get to theofficial definition, there is one further set of people who are reclassified fromunemployed to not economically active – those who have not taken active steps to find ajob in the past four weeks. Table 11 compares the three rates of unemployment – the very expanded, the expandedand the official – for the four most recent years of the October household survey. As canbe seen, there are similar trends across the years for all three rates, but at different levels.The very expanded measure ranges between 37,4% and 42,4%. The expanded definitionas above ranges between 29,2% and 37,6%. The official definition ranges between 16,9%and 22,9%.
65
Table 11: October household survey, 1994-1997: unemployment rates Rates of unemployment 1994
% 1995 %
1996 %
1997 %
Very expanded unemployment rate 38,4 37,4 41,7 42,4 Expanded unemployment rate 30,9 29,1 35,6 37,8 Official unemployment rate 19,2 16,9 21,0 22,9 The SRS of late 1997 also asked questions about current employment status of respondents,but with questions once again somewhat differently phrased and ordered to those of theOctober household surveys. Overall, the survey yielded higher levels of unemployment –48,0% on the very expanded definition and 26,7% on the official definition. But thedifference between the very expanded, expanded and official is very similar across allsurveys. Also of interest in this respect is a comparison of the October household survey results withthose of the Project for Statistics on Living Standards and Development (PSLSD) of 1993,often referred to as the World Bank/SALDRU survey. The PSLSD researchers reported thatthe expanded rate of unemployment for the country was 30,1%.2 This is very similar to theexpanded rate in the 1994 and 1995 October household surveys. However, the PSLSD surveyyielded a strict unemployment rate of 12%, somewhat lower than that in the Octoberhousehold surveys. The difference underlines the importance of the work-seeking criterion inthat the PSLSD required that the person had taken active steps to find work within theprevious fortnight, rather than the previous four weeks. The choice of definition for the employment rate is important for several reasons. Firstly,different rates yield different absolute numbers of people who may be said to need jobs. Thestrict definition, by classifying people as not economically active rather than unemployed,categorises them as dependents of earners and potential earners, rather than workseekers.Secondly, we see below how this change in definition affects certain groups or types ofpeople more than others.
2 Project for Statistics on Living Standards and Development, ‘South Africans Rich and Poor: Baselinehousehold statistics’, SALDRU, School of Economics, University of Cape Town, August 1994, p. 142.
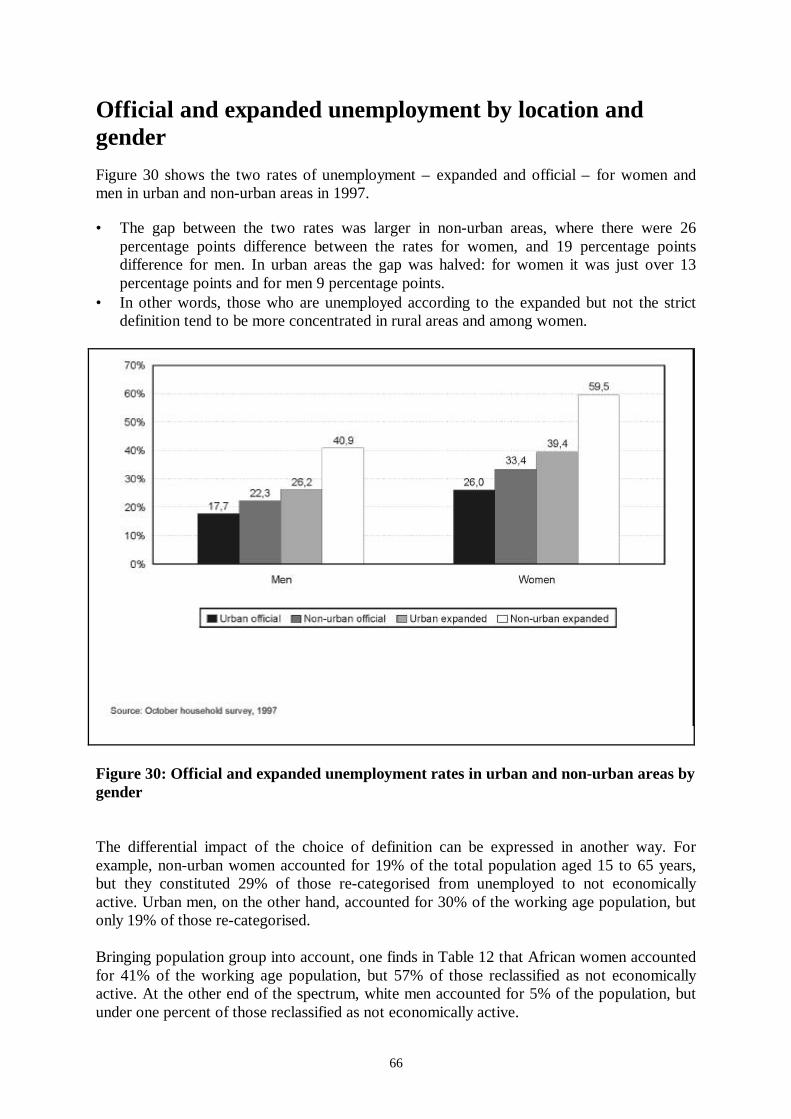
66
Official and expanded unemployment by location andgender Figure 30 shows the two rates of unemployment – expanded and official – for women andmen in urban and non-urban areas in 1997. • The gap between the two rates was larger in non-urban areas, where there were 26
percentage points difference between the rates for women, and 19 percentage pointsdifference for men. In urban areas the gap was halved: for women it was just over 13percentage points and for men 9 percentage points.
• In other words, those who are unemployed according to the expanded but not the strictdefinition tend to be more concentrated in rural areas and among women.
Figure 30: Official and expanded unemployment rates in urban and non-urban areas bygender The differential impact of the choice of definition can be expressed in another way. Forexample, non-urban women accounted for 19% of the total population aged 15 to 65 years,but they constituted 29% of those re-categorised from unemployed to not economicallyactive. Urban men, on the other hand, accounted for 30% of the working age population, butonly 19% of those re-categorised. Bringing population group into account, one finds in Table 12 that African women accountedfor 41% of the working age population, but 57% of those reclassified as not economicallyactive. At the other end of the spectrum, white men accounted for 5% of the population, butunder one percent of those reclassified as not economically active.
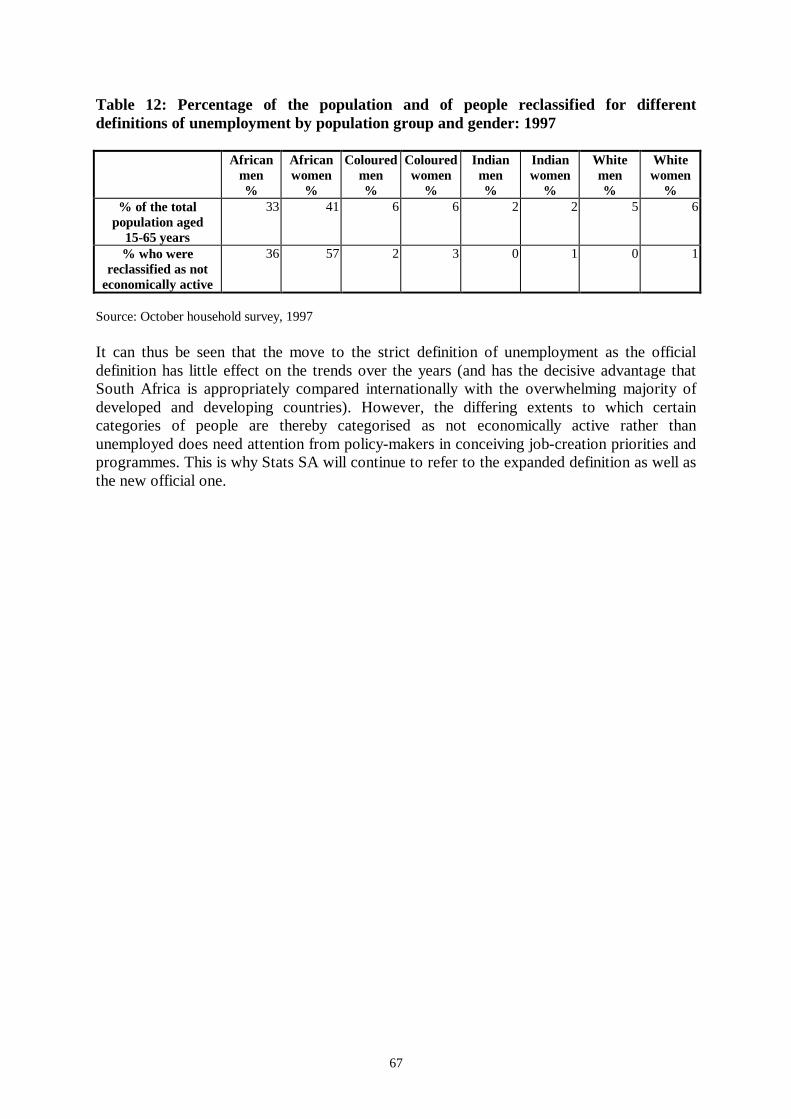
67
Table 12: Percentage of the population and of people reclassified for differentdefinitions of unemployment by population group and gender: 1997 African
men %
Africanwomen
%
Colouredmen %
Colouredwomen
%
Indianmen %
Indianwomen
%
Whitemen %
Whitewomen
% % of the total
population aged 15-65 years
33 41 6 6 2 2 5 6
% who werereclassified as not
economically active
36 57 2 3 0 1 0 1
Source: October household survey, 1997 It can thus be seen that the move to the strict definition of unemployment as the officialdefinition has little effect on the trends over the years (and has the decisive advantage thatSouth Africa is appropriately compared internationally with the overwhelming majority ofdeveloped and developing countries). However, the differing extents to which certaincategories of people are thereby categorised as not economically active rather thanunemployed does need attention from policy-makers in conceiving job-creation priorities andprogrammes. This is why Stats SA will continue to refer to the expanded definition as well asthe new official one.

PLEASE TURN THE PAGE
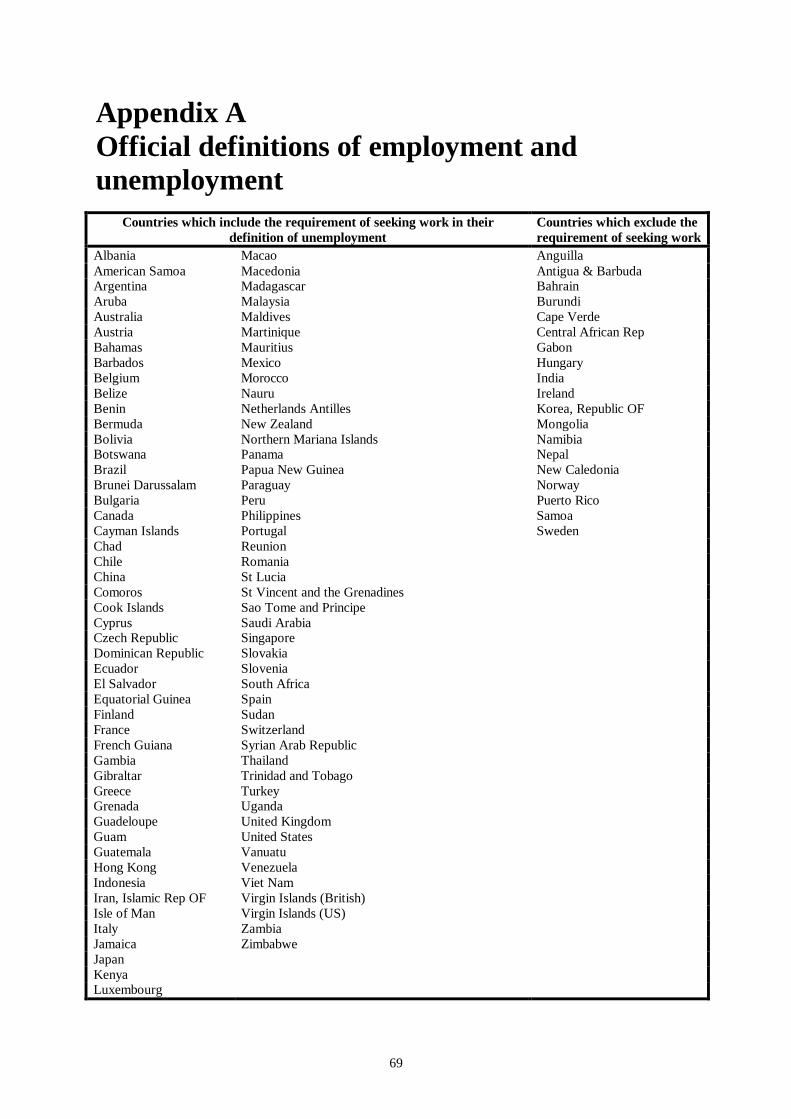
69
Appendix A Official definitions of employment andunemployment
Countries which include the requirement of seeking work in theirdefinition of unemployment
Countries which exclude therequirement of seeking work
Albania Macao Anguilla American Samoa Macedonia Antigua & Barbuda Argentina Madagascar Bahrain Aruba Malaysia Burundi Australia Maldives Cape Verde Austria Martinique Central African Rep Bahamas Mauritius Gabon Barbados Mexico Hungary Belgium Morocco India Belize Nauru Ireland Benin Netherlands Antilles Korea, Republic OF Bermuda New Zealand Mongolia Bolivia Northern Mariana Islands Namibia Botswana Panama Nepal Brazil Papua New Guinea New Caledonia Brunei Darussalam Paraguay Norway Bulgaria Peru Puerto Rico Canada Philippines Samoa Cayman Islands Portugal Sweden Chad Reunion Chile Romania China St Lucia Comoros St Vincent and the Grenadines Cook Islands Sao Tome and Principe Cyprus Saudi Arabia Czech Republic Singapore Dominican Republic Slovakia Ecuador Slovenia El Salvador South Africa Equatorial Guinea Spain Finland Sudan France Switzerland French Guiana Syrian Arab Republic Gambia Thailand Gibraltar Trinidad and Tobago Greece Turkey Grenada Uganda Guadeloupe United Kingdom Guam United States Guatemala Vanuatu Hong Kong Venezuela Indonesia Viet Nam Iran, Islamic Rep OF Virgin Islands (British) Isle of Man Virgin Islands (US) Italy Zambia Jamaica Zimbabwe Japan Kenya Luxembourg

PLEASE TURN THE PAGE
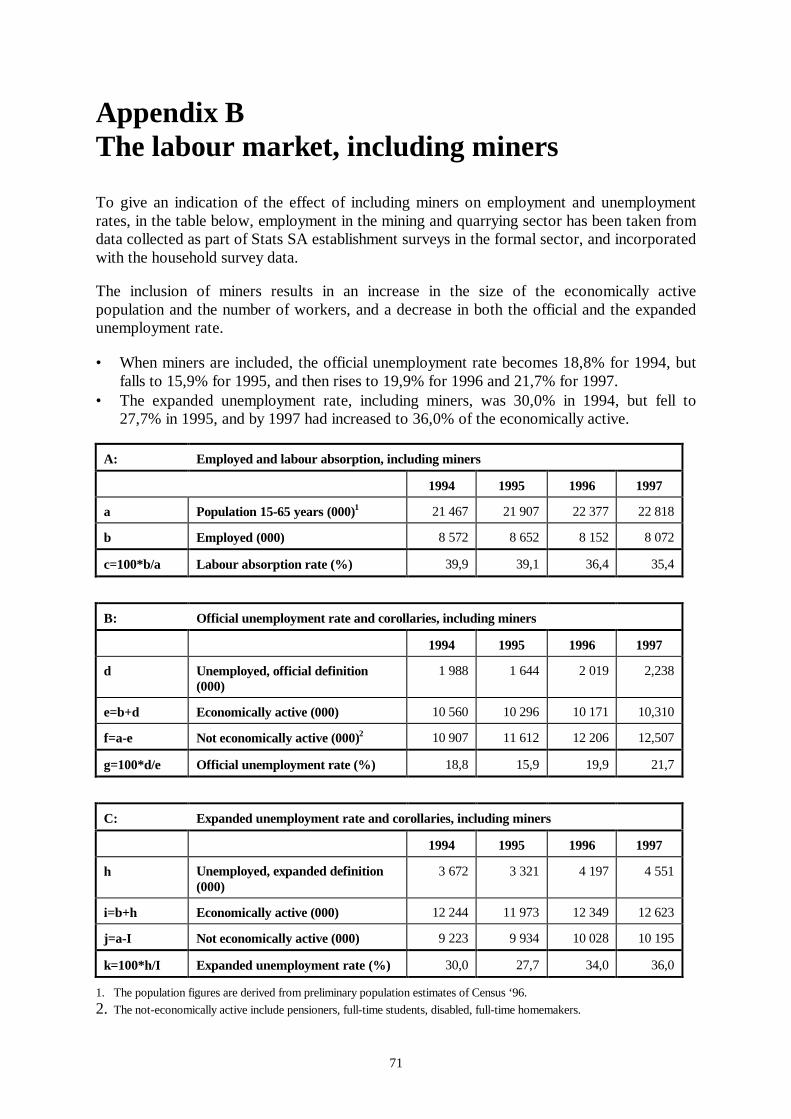
71
Appendix B The labour market, including miners To give an indication of the effect of including miners on employment and unemploymentrates, in the table below, employment in the mining and quarrying sector has been taken fromdata collected as part of Stats SA establishment surveys in the formal sector, and incorporatedwith the household survey data. The inclusion of miners results in an increase in the size of the economically activepopulation and the number of workers, and a decrease in both the official and the expandedunemployment rate. • When miners are included, the official unemployment rate becomes 18,8% for 1994, but
falls to 15,9% for 1995, and then rises to 19,9% for 1996 and 21,7% for 1997.• The expanded unemployment rate, including miners, was 30,0% in 1994, but fell to
27,7% in 1995, and by 1997 had increased to 36,0% of the economically active.
A: Employed and labour absorption, including miners
1994 1995 1996 1997
a Population 15-65 years (000)1 21 467 21 907 22 377 22 818
b Employed (000) 8 572 8 652 8 152 8 072
c=100*b/a Labour absorption rate (%) 39,9 39,1 36,4 35,4
B: Official unemployment rate and corollaries, including miners
1994 1995 1996 1997
d Unemployed, official definition(000)
1 988 1 644 2 019 2,238
e=b+d Economically active (000) 10 560 10 296 10 171 10,310
f=a-e Not economically active (000)2 10 907 11 612 12 206 12,507
g=100*d/e Official unemployment rate (%) 18,8 15,9 19,9 21,7
C: Expanded unemployment rate and corollaries, including miners
1994 1995 1996 1997
h Unemployed, expanded definition(000)
3 672 3 321 4 197 4 551
i=b+h Economically active (000) 12 244 11 973 12 349 12 623
j=a-I Not economically active (000) 9 223 9 934 10 028 10 195
k=100*h/I Expanded unemployment rate (%) 30,0 27,7 34,0 36,0
1. The population figures are derived from preliminary population estimates of Census ‘96.2. The not-economically active include pensioners, full-time students, disabled, full-time homemakers.


![Provincial Profile 2004 - Statistics South AfricaProvincial Profile 2004: Limpopo / Statistics South Africa. Pretoria: Statistics South Africa, 2006 110p. [Report No. 00-91-09(2004)]](https://img.pdfslide.us/doc/110x75/60f89f16f49d1242b4591960/provincial-profile-2004-statistics-south-provincial-profile-2004-limpopo-statistics.jpg)