Embed Size (px)
Citation preview
POPULATION TRENDS, 2016 ISSN 1793-2424
© Department of Statistics, Ministry of Trade & Industry, Republic of Singapore
Reproducing or quoting any part of this publication is permitted, provided this publication is accredited as the source. Please refer to the Statistics Singapore Website Terms of Use (http://www.singstat.gov.sg/terms-of-use) for more details on the conditions of use of this publication.
Statistical activities conducted by the Singapore Department of Statistics are governed by the provisions of the Statistics Act (Cap. 317). The Act guarantees the confidentiality of information collected from individuals and companies. It spells out the legislative authority and responsibility of the Chief Statistician. The Act is available in the Department’s Website (www.singstat.gov.sg).
Singapore Department of Statistics Population Trends, 2016 ► i
PREFACE Population size, structure and changes have important implications for
production, investment and consumption activities as well as community development, social networks and kinship ties. A good understanding of demographic forces and emerging trends is useful for policy makers, planners, businesses and the academia.
The Singapore Department of Statistics compiles, monitors and analyses Singapore’s population statistics and indicators in detail. A report on Population Trends that puts together different aspects of demographic statistics is released annually. Population Trends, 2016 is the twelfth edition of the annual series.
The report comprises five chapters, namely, ‘Population’, ‘Households and Housing’, ‘Family Formation and Dissolution’, ‘Fertility’ and ‘Mortality’. Key definitions and concepts are explained in text boxes in each chapter. Time series of commonly used indicators are included in the Statistical Appendices. Users can also explore the data time series in our e-service SingStat Table Builder at http://www.singstat.gov.sg/tablebuilder.
I would like to thank various government agencies for providing the necessary data for the compilation of indicators released in this report. My sincere appreciation is also extended to all others who have contributed to the successful completion of this report.
Wong Wee Kim Chief Statistician Singapore
September 2016
ii ◄ Population Trends, 2016 Singapore Department of Statistics
Our Vision
A National Statistical System of Quality, Integrity and Expertise.
Our Mission
We Provide Reliable, Relevant and Timely Statistics
to Support Singapore’s Social and Economic Development.
Our Guiding Principles
Professionalism & Expertise
We adhere to professional ethics and proficiently produce quality statistics that comply with international concepts and best practices.
Relevance We constantly innovate our processes and produce statistics that meet users’ needs.
Accessibility We make our statistics readily available.
Confidentiality We protect the confidentiality of information provided to us.
Timeliness & Reliability
We produce statistics that users can depend on and disseminate them at the earliest possible date while maintaining data quality.
Cost Effectiveness
We use resources effectively, minimising respondent burden and leveraging on administrative data.
Singapore Department of Statistics Population Trends, 2016 ► iii
CONTENTS Page
Preface ............................................................................................................................ i
Contents.................................................................................................................... iii
Key Demographic Indicators, 1970 – 2016 ............................................................... vi
POPULATION TRENDS
Chapter 1 Population Population Size and Growth ....................................................................... 3 Age Structure ............................................................................................. 4 Old-Age Support Ratio ............................................................................... 5 Ethnic Composition .................................................................................... 5 Sex Composition ........................................................................................ 6 Marital Status ............................................................................................. 6 Proportion of Singles .................................................................................. 8 Education Profile ...................................................................................... 10 Geographical Distribution ......................................................................... 12
Chapter 2 Households and Housing Resident Households ............................................................................... 18 Type of Dwelling ....................................................................................... 19 Home Ownership ..................................................................................... 20 Household Size ........................................................................................ 21 Household Living Arrangement ................................................................ 22
Chapter 3 Family Formation and Dissolution Marriages ................................................................................................. 24 Age-Specific Marriage Rate ..................................................................... 25 Median Age at First Marriage ................................................................... 26 Marital Dissolution .................................................................................... 27 Age-Specific Divorce Rate ....................................................................... 28 Marriage Duration of Divorcing Couples ................................................... 28
Chapter 4 Fertility Births and Fertility Rate ............................................................................ 29 Ethnic Differentials in Fertility ................................................................... 30 Age-Specific Fertility Rate ........................................................................ 30 Births by Birth Order ................................................................................. 31 Number of Children Born .......................................................................... 32 Average Number of Children Born by Age Group of Females .................. 33 Average Number of Children Born by Educational Attainment
of Females ........................................................................................... 33
iv ◄ Population Trends, 2016 Singapore Department of Statistics
CONTENTS (cont’d)
Page Chapter 5 Mortality
Deaths and Death Rate ............................................................................ 34 Age-Specific Death Rate .......................................................................... 35 Infant Mortality Rate ................................................................................. 35 Life Expectancy ........................................................................................ 36
STATISTICAL APPENDICES
Population A1.1 Population, 1871 – 2016 .................................................................................... 39 A1.2 Old-Age Support Ratio and Age Dependency Ratio, 1947 – 2016 .................... 40 A1.3 Singapore Residents by Age Group, Ethnic Group and Sex, June 2016 ........... 41 A1.4 Singapore Residents by Age Group and Sex, June 1980 – June 2016 ............. 42 A1.5 Singapore Residents Aged 15 Years and Over by Marital Status and
Sex, 1980 – 2015 .......................................................................................... 51 A1.6 Singapore Residents Aged 20 Years and Over by Marital Status, Age
Group and Sex, 2015 .................................................................................... 54 A1.7 Proportion of Singles among Residents Aged 20-49 Years by Age
Group and Sex, 1980 – 2015 ........................................................................ 55 A1.8 Proportion of Singles among Residents Aged 30-49 Years by Age
Group, Highest Qualification Attained and Sex, 1990 – 2015 ....................... 57 A1.9 Singapore Residents Aged 25 Years and Over by Highest Qualification
Attained, Age Group and Sex, 2015 ............................................................. 59 A1.10 Singapore Residents Aged 25 Years and Over by Highest Qualification
Attained and Sex, 1990 – 2015 ..................................................................... 60 A1.11 Literacy Rate and Mean Years of Schooling, 1990 – 2015 ................................ 63 A1.12 Singapore Residents by Age Group and Type of Dwelling, June 2016 ............. 64 A1.13 Singapore Residents by Planning Area/Subzone, Age Group and Sex,
June 2016 ..................................................................................................... 65 A1.14 Singapore Residents by Planning Area/Subzone and Type of Dwelling,
June 2016 ................................................................................................... 101
Households and Housing A2.1 Resident Households by Household Size, 1980 – 2015 .................................. 114 A2.2 Resident Households by Type of Dwelling, 1980 – 2015 ................................. 115 A2.3 Home Ownership Rate Among Resident Households by Type of
Dwelling, 1980 – 2015 ................................................................................ 116 A2.4 Average Household Size of Resident Households by Type of Dwelling,
1980 – 2015 ................................................................................................ 117 A2.5 Resident Households by Age Group of Head and Household Living
Arrangement, 1990 – 2015 ......................................................................... 118
Family Formation and Dissolution A3.1 Total Marriages, 1980 – 2015 .......................................................................... 120 A3.2 Resident Age-Sex Specific Marriage Rate, 1980 – 2015 ................................. 121 A3.3 Total Divorces, 1980 – 2015 ............................................................................ 123 A3.4 Resident Age-Sex Specific Divorce Rate, 1980 – 2015 ................................... 124

Singapore Department of Statistics Population Trends, 2016 ► v
CONTENTS (cont’d) Page
Fertility A4.1 Live-Births and Birth Rates, 1980 – 2015 ........................................................ 126 A4.2 Resident Age-Specific Fertility Rate, 1980 – 2015 ........................................... 127 A4.3 Total Live-Births by Birth Order, 1980 – 2015 .................................................. 128 A4.4 Average Number of Children Born by Age Group of Resident Ever-
Married Females, 1980 – 2015 ................................................................... 129 A4.5 Average Number of Children Born to Resident Ever-Married Females
Aged 40-49 Years by Highest Qualification Attained, 1990 – 2015 ............. 130
Mortality A5.1 Deaths and Death Rates, 1980 – 2015 ............................................................ 131 A5.2 Resident Age-Sex Specific Death Rate, 1980 – 2015...................................... 132 A5.3 Life Expectancy of Singapore Residents at Birth and at Age 65 Years
by Sex, 1980 – 2015 ................................................................................... 141
NOTATIONS
n.a. not availablep preliminary- nil or negligible
NOTES
The Population Trends, 2016 contains statistics that are the most recent available at the time of its preparation.
Figures may not add up to the totals due to rounding.
Longer time series of the indicators can be downloaded here.
vi ◄ Population Trends, 2016 Singapore Department of Statistics
4.7*
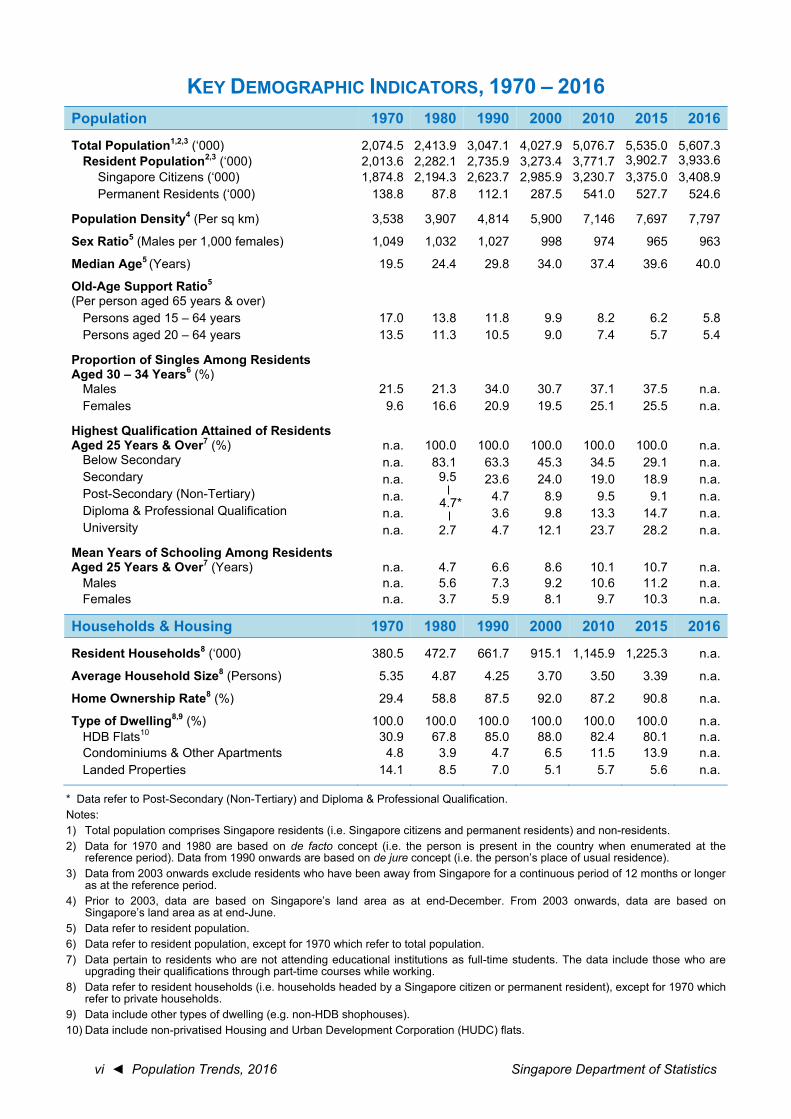
KEY DEMOGRAPHIC INDICATORS, 1970 – 2016 Population 1970 1980 1990 2000 2010 2015 2016
Total Population1,2,3 (‘000) 2,074.5 2,413.9 3,047.1 4,027.9 5,076.7 5,535.0 5,607.3 Resident Population2,3 (‘000) 2,013.6 2,282.1 2,735.9 3,273.4 3,771.7 3,902.7 3,933.6
Singapore Citizens (‘000) 1,874.8 2,194.3 2,623.7 2,985.9 3,230.7 3,375.0 3,408.9 Permanent Residents (‘000) 138.8 87.8 112.1 287.5 541.0 527.7 524.6
Population Density4 (Per sq km) 3,538 3,907 4,814 5,900 7,146 7,697 7,797
Sex Ratio5 (Males per 1,000 females) 1,049 1,032 1,027 998 974 965 963
Median Age5 (Years) 19.5 24.4 29.8 34.0 37.4 39.6 40.0
Old-Age Support Ratio5 (Per person aged 65 years & over)
Persons aged 15 – 64 years 17.0 13.8 11.8 9.9 8.2 6.2 5.8 Persons aged 20 – 64 years 13.5 11.3 10.5 9.0 7.4 5.7 5.4
Proportion of Singles Among Residents Aged 30 – 34 Years6 (%)
Males 21.5 21.3 34.0 30.7 37.1 37.5 n.a.Females 9.6 16.6 20.9 19.5 25.1 25.5 n.a.
Highest Qualification Attained of Residents Aged 25 Years & Over7 (%) n.a. 100.0 100.0 100.0 100.0 100.0 n.a.
Below Secondary n.a. 83.1 63.3 45.3 34.5 29.1 n.a.Secondary n.a. 9.5 23.6 24.0 19.0 18.9 n.a.Post-Secondary (Non-Tertiary) n.a. 4.7 8.9 9.5 9.1 n.a.Diploma & Professional Qualification n.a. 3.6 9.8 13.3 14.7 n.a.University n.a. 2.7 4.7 12.1 23.7 28.2 n.a.
Mean Years of Schooling Among Residents Aged 25 Years & Over7 (Years) n.a. 4.7 6.6 8.6 10.1 10.7 n.a.
Males n.a. 5.6 7.3 9.2 10.6 11.2 n.a.Females n.a. 3.7 5.9 8.1 9.7 10.3 n.a.
Households & Housing 1970 1980 1990 2000 2010 2015 2016
Resident Households8 (‘000) 380.5 472.7 661.7 915.1 1,145.9 1,225.3 n.a.
Average Household Size8 (Persons) 5.35 4.87 4.25 3.70 3.50 3.39 n.a.
Home Ownership Rate8 (%) 29.4 58.8 87.5 92.0 87.2 90.8 n.a.
Type of Dwelling8,9 (%) 100.0 100.0 100.0 100.0 100.0 100.0 n.a.HDB Flats10 30.9 67.8 85.0 88.0 82.4 80.1 n.a.Condominiums & Other Apartments 4.8 3.9 4.7 6.5 11.5 13.9 n.a.Landed Properties 14.1 8.5 7.0 5.1 5.7 5.6 n.a.
* Data refer to Post-Secondary (Non-Tertiary) and Diploma & Professional Qualification.Notes:1) Total population comprises Singapore residents (i.e. Singapore citizens and permanent residents) and non-residents.2) Data for 1970 and 1980 are based on de facto concept (i.e. the person is present in the country when enumerated at the
reference period). Data from 1990 onwards are based on de jure concept (i.e. the person’s place of usual residence).3) Data from 2003 onwards exclude residents who have been away from Singapore for a continuous period of 12 months or longer
as at the reference period.4) Prior to 2003, data are based on Singapore’s land area as at end-December. From 2003 onwards, data are based on
Singapore’s land area as at end-June.5) Data refer to resident population.6) Data refer to resident population, except for 1970 which refer to total population.7) Data pertain to residents who are not attending educational institutions as full-time students. The data include those who are
upgrading their qualifications through part-time courses while working.8) Data refer to resident households (i.e. households headed by a Singapore citizen or permanent resident), except for 1970 which
refer to private households.9) Data include other types of dwelling (e.g. non-HDB shophouses).10) Data include non-privatised Housing and Urban Development Corporation (HUDC) flats.
Singapore Department of Statistics Population Trends, 2016 ► vii
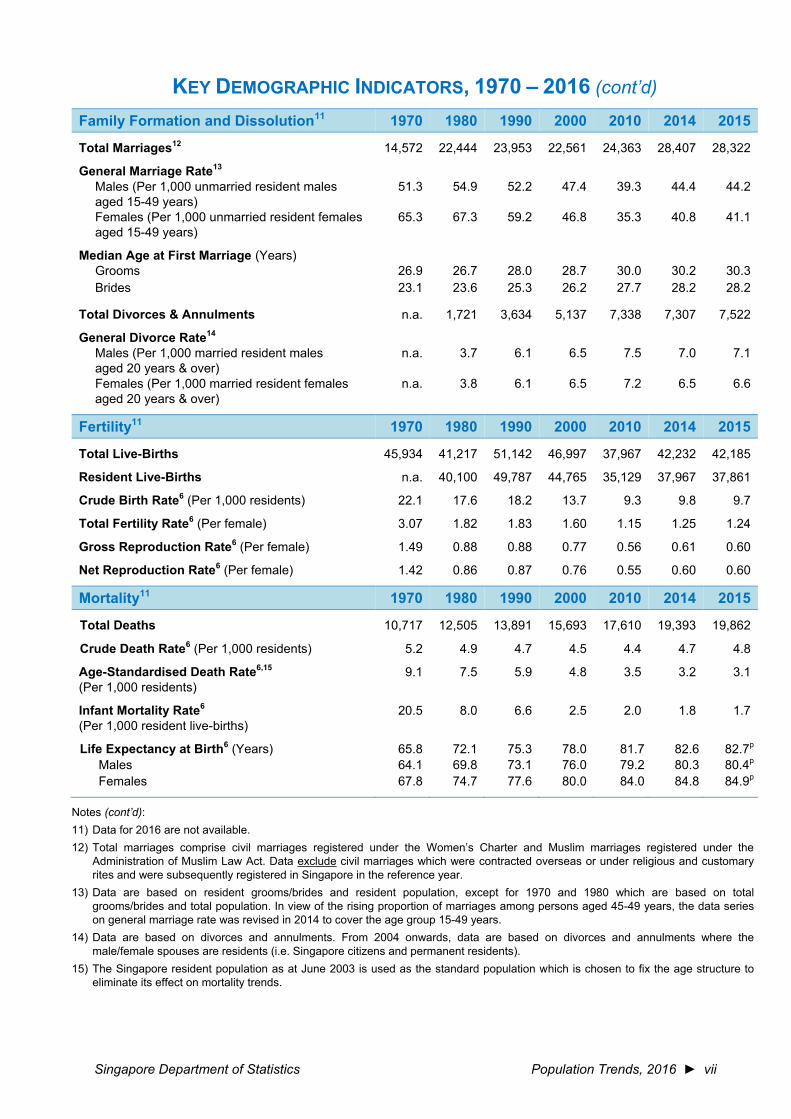
KEY DEMOGRAPHIC INDICATORS, 1970 – 2016 (cont’d) Family Formation and Dissolution11 1970 1980 1990 2000 2010 2014 2015
Total Marriages12 14,572 22,444 23,953 22,561 24,363 28,407 28,322
General Marriage Rate13 Males (Per 1,000 unmarried resident males aged 15-49 years)
51.3 54.9 52.2 47.4 39.3 44.4 44.2
Females (Per 1,000 unmarried resident females aged 15-49 years)
65.3 67.3 59.2 46.8 35.3 40.8 41.1
Median Age at First Marriage (Years) Grooms 26.9 26.7 28.0 28.7 30.0 30.2 30.3 Brides 23.1 23.6 25.3 26.2 27.7 28.2 28.2
Total Divorces & Annulments n.a. 1,721 3,634 5,137 7,338 7,307 7,522
General Divorce Rate14 Males (Per 1,000 married resident males aged 20 years & over)
n.a. 3.7 6.1 6.5 7.5 7.0 7.1
Females (Per 1,000 married resident females aged 20 years & over)
n.a. 3.8 6.1 6.5 7.2 6.5 6.6
Fertility11 1970 1980 1990 2000 2010 2014 2015
Total Live-Births 45,934 41,217 51,142 46,997 37,967 42,232 42,185
Resident Live-Births n.a. 40,100 49,787 44,765 35,129 37,967 37,861
Crude Birth Rate6 (Per 1,000 residents) 22.1 17.6 18.2 13.7 9.3 9.8 9.7
Total Fertility Rate6 (Per female) 3.07 1.82 1.83 1.60 1.15 1.25 1.24
Gross Reproduction Rate6 (Per female) 1.49 0.88 0.88 0.77 0.56 0.61 0.60
Net Reproduction Rate6 (Per female) 1.42 0.86 0.87 0.76 0.55 0.60 0.60
Mortality11 1970 1980 1990 2000 2010 2014 2015
Total Deaths 10,717 12,505 13,891 15,693 17,610 19,393 19,862
Crude Death Rate6 (Per 1,000 residents) 5.2 4.9 4.7 4.5 4.4 4.7 4.8
Age-Standardised Death Rate6,15 (Per 1,000 residents)
9.1 7.5 5.9 4.8 3.5 3.2 3.1
Infant Mortality Rate6 (Per 1,000 resident live-births)
20.5 8.0 6.6 2.5 2.0 1.8 1.7
Life Expectancy at Birth6 (Years) 65.8 72.1 75.3 78.0 81.7 82.6 82.7p Males 64.1 69.8 73.1 76.0 79.2 80.3 80.4p Females 67.8 74.7 77.6 80.0 84.0 84.8 84.9p
Notes (cont’d): 11) Data for 2016 are not available. 12) Total marriages comprise civil marriages registered under the Women’s Charter and Muslim marriages registered under the
Administration of Muslim Law Act. Data exclude civil marriages which were contracted overseas or under religious and customary rites and were subsequently registered in Singapore in the reference year.
13) Data are based on resident grooms/brides and resident population, except for 1970 and 1980 which are based on total grooms/brides and total population. In view of the rising proportion of marriages among persons aged 45-49 years, the data series on general marriage rate was revised in 2014 to cover the age group 15-49 years.
14) Data are based on divorces and annulments. From 2004 onwards, data are based on divorces and annulments where the male/female spouses are residents (i.e. Singapore citizens and permanent residents).
15) The Singapore resident population as at June 2003 is used as the standard population which is chosen to fix the age structure to eliminate its effect on mortality trends.


► 1
Population Trends


Singapore Department of Statistics Population Trends, 2016 ► 3
Chapter 1 Population
Population Size and Growth
As at end-June 2016, Singapore citizens numbered 3.41 million (Table 1.1). Along with 0.52 million permanent residents, there were 3.93 million residents. Non-residents totalled 1.67 million. Altogether, Singapore's total population stood at 5.61 million.
Compared to last year, the resident and citizen population growth for 2016 remained the same at 0.8 per cent and 1.0 per cent respectively. Total population growth has remained relatively stable at about 1.2% to 1.3% since 2014.
Table 1.1 Singapore Population Size and Growth by Residential Status
Year
Number (‘000) Average Annual Growth1 (%)
Total Population
Singapore Residents Non- Residents
Total Population
Singapore Residents Non- ResidentsTotal Citizens PRs Total Citizens PRs
1990 3,047.1 2,735.9 2,623.7 112.1 311.3 2.32 1.72 1.72 2.32 9.0
2000 4,027.9 3,273.4 2,985.9 287.5 754.5 2.8 1.8 1.3 9.9 9.3
2010 5,076.7 3,771.7 3,230.7 541.0 1,305.0 1.8 1.0 0.9 1.5 4.1
2011 5,183.7 3,789.3 3,257.2 532.0 1,394.4 2.1 0.5 0.8 -1.7 6.9
2012 5,312.4 3,818.2 3,285.1 533.1 1,494.2 2.5 0.8 0.9 0.2 7.2
2013 5,399.2 3,844.8 3,313.5 531.2 1,554.4 1.6 0.7 0.9 -0.3 4.0
2014 5,469.7 3,870.7 3,343.0 527.7 1,599.0 1.3 0.7 0.9 -0.7 2.9
2015 5,535.0 3,902.7 3,375.0 527.7 1,632.3 1.2 0.8 1.0 - 2.1
2016 5,607.3 3,933.6 3,408.9 524.6 1,673.7 1.3 0.8 1.0 -0.6 2.5
Notes: (a) ‘-’ denotes nil or negligible. (b) Data from 2003 onwards exclude residents who have been away from Singapore for a continuous period of 12 months
or longer as at the reference period.1 For 1990 and 2000, growth rate refers to the annualised change over the last ten years. From 2010 onwards, growth rate refers
to the change over the previous year. 2 Growth rate is computed using population estimates based on de facto concept (i.e. the person is present in the country when
enumerated at the reference period).
Population
Total population comprises Singapore residents and non-residents. Resident population comprises Singapore citizens and permanent residents. Non-resident population comprises foreigners who are working, studying or living in Singapore but not granted permanent residence, excluding tourists and short-term visitors.
Singapore’s population estimates are compiled using the register-based approach since the Census of Population 2000. The basic count and profile of the population are based on a person’s place of usual residence i.e. de jure concept.

4 ◄ Population Trends, 2016 Singapore Department of Statistics
Age Structure
As at end-June 2016, the median age of the resident population rose to 40.0 years, continuing the upward trend observed over the years (Chart 1.1). Residents aged 65 years and over formed 12.4 per cent of the resident population in 2016, a rise from 11.8 per cent in 2015.
Chart 1.1 Age Distribution of Resident Population
Year Median
Age (Years)
2016 40.0
2015 39.6
2010 37.4
2000 34.0
1990 29.8
Chart 1.2 Age Pyramid of Resident Population
6.07.29.0
11.812.4
0
5
10
15
20
25
Below 15 15-24 25-34 35-44 45-54 55-64 65 & Over
Per Cent
Age Group (Years)
1990
2000
2010
2015
2016
0 100 200
2016
2006
Females
0100200
Males
0-4
Persons ('000)
Age Group(Years)
70-74
85 & Over
60-64
50-54
40-44
30-34
20-24
10-14
80-8475-79
65-69
55-59
45-49
35-39
25-29
15-19
5-9
Persons ('000)

Singapore Department of Statistics Population Trends, 2016 ► 5
Old-Age Support Ratio
The old-age support ratio of residents continued to exhibit a downward trend. The ratio dropped to 5.4 residents aged 20-64 years for each resident aged 65 years and over as at end-June 2016, a decline from the ratio of 5.7 in 2015 (Chart 1.3).
Chart 1.3 Resident Old-Age Support Ratio
Note: For 1971-1979, data refer to total population.
Ethnic Composition
As at end-June 2016, Chinese formed 74.3 per cent of the resident population, followed by the Malays and Indians at 13.4 per cent and 9.1 per cent respectively (Chart 1.4).
Chart 1.4 Ethnic Composition of Resident Population
13.5
5.7
5.4
0
2
4
6
8
10
12
14
16
18
1970 1980 1990 2000 2010 2016
No. of Residents Aged 20-64 YearsPer Resident Aged 65 Years & Over
75.3 74.3
13.8 13.4
8.6 9.1
2.3 3.2
2006 2016
Per Cent
OthersIndiansMalays
Chinese
6 ◄ Population Trends, 2016 Singapore Department of Statistics
Sex Composition
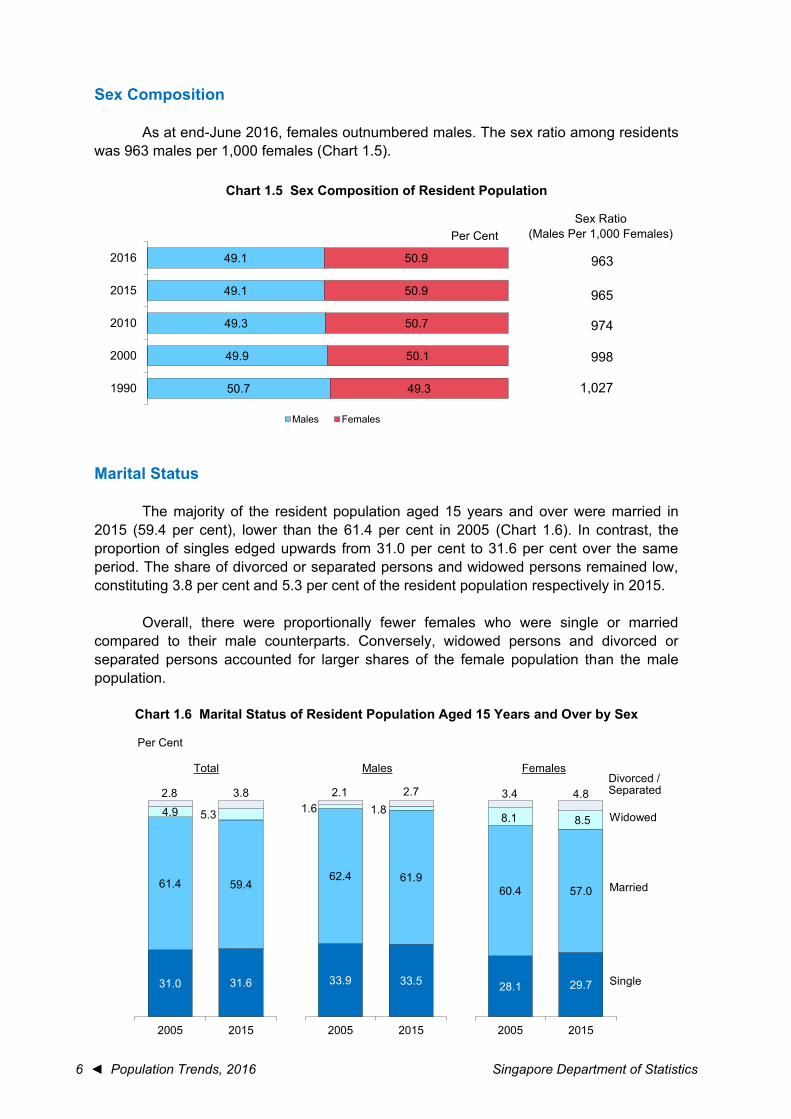
As at end-June 2016, females outnumbered males. The sex ratio among residents was 963 males per 1,000 females (Chart 1.5).
Chart 1.5 Sex Composition of Resident Population
Sex Ratio (Males Per 1,000 Females)
963
965
974
998
1,027
Marital Status
The majority of the resident population aged 15 years and over were married in 2015 (59.4 per cent), lower than the 61.4 per cent in 2005 (Chart 1.6). In contrast, the proportion of singles edged upwards from 31.0 per cent to 31.6 per cent over the same period. The share of divorced or separated persons and widowed persons remained low, constituting 3.8 per cent and 5.3 per cent of the resident population respectively in 2015.
Overall, there were proportionally fewer females who were single or married compared to their male counterparts. Conversely, widowed persons and divorced or separated persons accounted for larger shares of the female population than the male population.
Chart 1.6 Marital Status of Resident Population Aged 15 Years and Over by Sex
50.7
49.9
49.3
49.1
49.1
49.3
50.1
50.7
50.9
50.9
1990
2000
2010
2015
2016
Per Cent
Males Females
Total Males Females
Single
Married
Widowed
Divorced /Separated
31.0 31.6
61.4 59.4
4.9 5.3
2.8 3.8
2005 2015
33.9 33.5
62.4 61.9
1.6 1.82.1 2.7
2005 2015
28.1 29.7
60.4 57.0
8.1 8.5
3.4 4.8
2005 2015
Per Cent
Singapore Department of Statistics Population Trends, 2016 ► 7
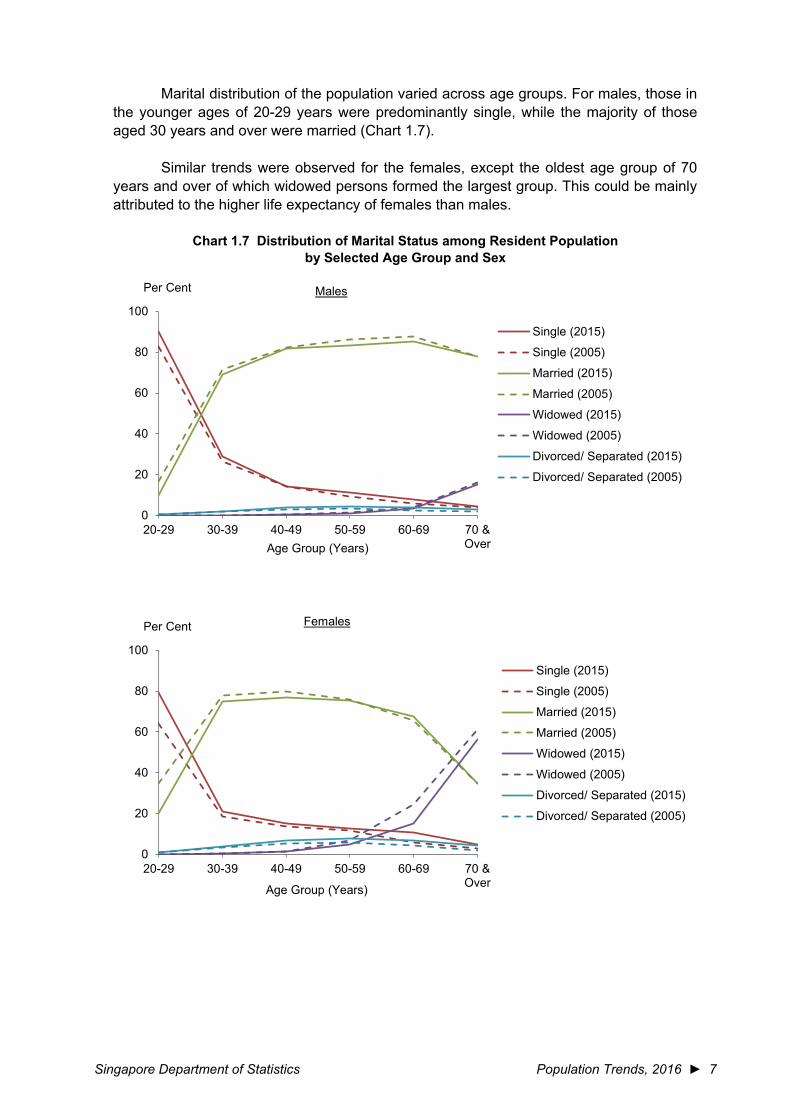
Marital distribution of the population varied across age groups. For males, those in the younger ages of 20-29 years were predominantly single, while the majority of those aged 30 years and over were married (Chart 1.7).
Similar trends were observed for the females, except the oldest age group of 70 years and over of which widowed persons formed the largest group. This could be mainly attributed to the higher life expectancy of females than males.
Chart 1.7 Distribution of Marital Status among Resident Population by Selected Age Group and Sex
0
20
40
60
80
100
20-29 30-39 40-49 50-59 60-69 70 &Over
Single (2015)
Single (2005)
Married (2015)
Married (2005)
Widowed (2015)
Widowed (2005)
Divorced/ Separated (2015)
Divorced/ Separated (2005)
Per Cent
Age Group (Years)
Males
0
20
40
60
80
100
20-29 30-39 40-49 50-59 60-69 70 &Over
Single (2015)
Single (2005)
Married (2015)
Married (2005)
Widowed (2015)
Widowed (2005)
Divorced/ Separated (2015)
Divorced/ Separated (2005)
Per Cent
Age Group (Years)
Females
8 ◄ Population Trends, 2016 Singapore Department of Statistics
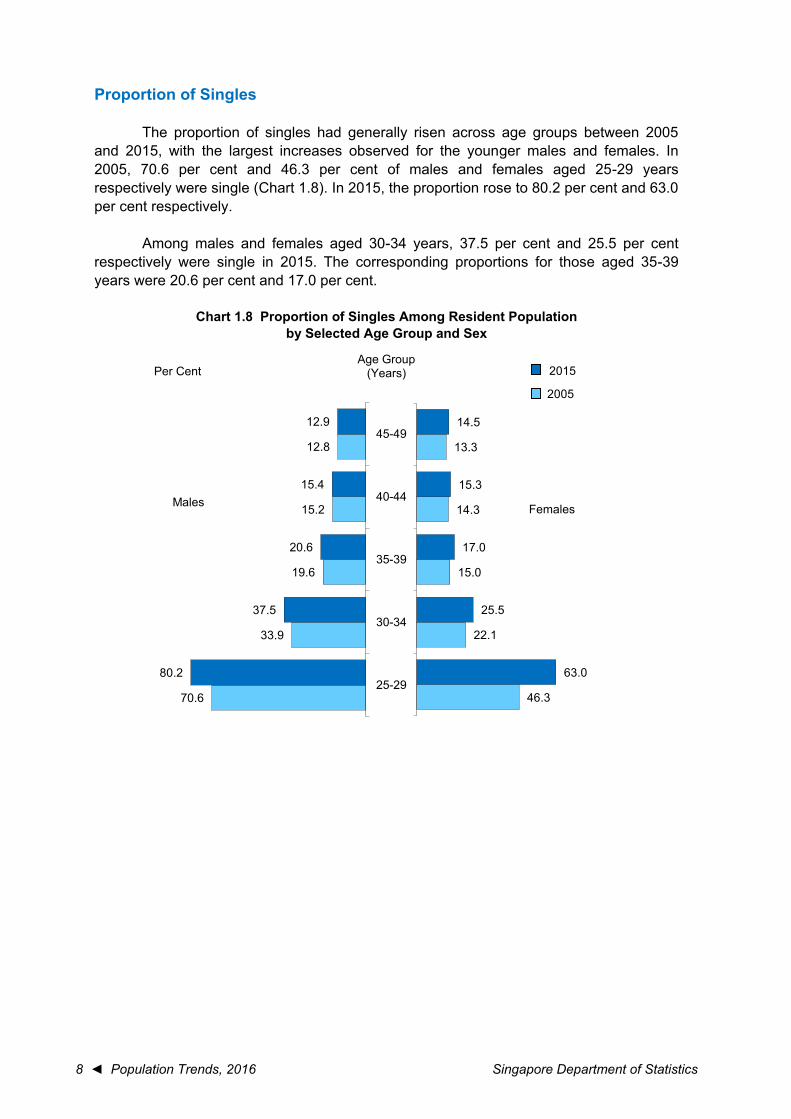
Proportion of Singles
The proportion of singles had generally risen across age groups between 2005 and 2015, with the largest increases observed for the younger males and females. In 2005, 70.6 per cent and 46.3 per cent of males and females aged 25-29 years respectively were single (Chart 1.8). In 2015, the proportion rose to 80.2 per cent and 63.0 per cent respectively.
Among males and females aged 30-34 years, 37.5 per cent and 25.5 per cent respectively were single in 2015. The corresponding proportions for those aged 35-39 years were 20.6 per cent and 17.0 per cent.
Chart 1.8 Proportion of Singles Among Resident Population by Selected Age Group and Sex
70.6
33.9
19.6
15.2
12.8
80.2
37.5
20.6
15.4
12.9
25-29
30-34
35-39
40-44
45-49
Males
46.3
22.1
15.0
14.3
13.3
63.0
25.5
17.0
15.3
14.5
Females
Age Group(Years)Per Cent 2015
2005
Singapore Department of Statistics Population Trends, 2016 ► 9
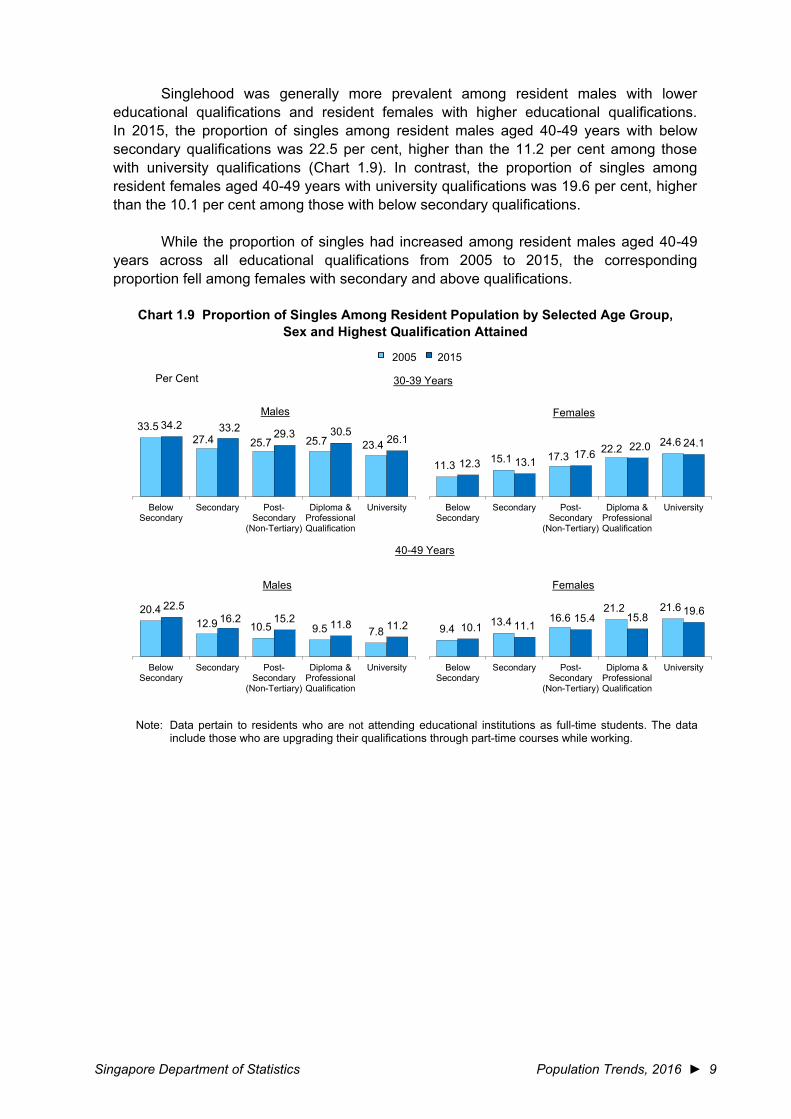
Singlehood was generally more prevalent among resident males with lower educational qualifications and resident females with higher educational qualifications. In 2015, the proportion of singles among resident males aged 40-49 years with below secondary qualifications was 22.5 per cent, higher than the 11.2 per cent among those with university qualifications (Chart 1.9). In contrast, the proportion of singles among resident females aged 40-49 years with university qualifications was 19.6 per cent, higher than the 10.1 per cent among those with below secondary qualifications.
While the proportion of singles had increased among resident males aged 40-49 years across all educational qualifications from 2005 to 2015, the corresponding proportion fell among females with secondary and above qualifications.
Chart 1.9 Proportion of Singles Among Resident Population by Selected Age Group, Sex and Highest Qualification Attained
Note: Data pertain to residents who are not attending educational institutions as full-time students. The data
include those who are upgrading their qualifications through part-time courses while working.
20.412.9 10.5 9.5 7.8
22.516.2 15.2 11.8 11.2
BelowSecondary
Secondary Post-Secondary
(Non-Tertiary)
Diploma &ProfessionalQualification
University
Males
33.527.4 25.7 25.7 23.4
34.2 33.2 29.3 30.526.1
BelowSecondary
Secondary Post-Secondary
(Non-Tertiary)
Diploma &ProfessionalQualification
University
Males
11.3 15.1 17.322.2 24.6
12.3 13.117.6
22.0 24.1
BelowSecondary
Secondary Post-Secondary
(Non-Tertiary)
Diploma &ProfessionalQualification
University
Females
9.4 13.4 16.621.2 21.6
10.1 11.115.4 15.8 19.6
BelowSecondary
Secondary Post-Secondary
(Non-Tertiary)
Diploma &ProfessionalQualification
University
Females
2005 2015
Per Cent 30-39 Years
40-49 Years

10 ◄ Population Trends, 2016 Singapore Department of Statistics
Education Profile1
In 2015, among the resident population aged 25 years and over, the share with at least post-secondary qualifications was 52.0 per cent (Chart 1.10). This was a jump from 38.3 per cent in 2005.
The jump was largely due to the higher proportion of university graduates which rose from 17.5 per cent in 2005 to 28.2 per cent in 2015. Similarly, there was also a higher proportion of diploma & professional qualifications at 14.7 per cent in 2015, compared to 11.6 per cent in 2005.
Chart 1.10 Highest Qualification Attained of Resident Population Aged 25 Years and Over
1 Data pertain to residents who are not attending educational institutions as full-time students. The data include those who are upgrading their qualifications through part-time courses while working.
40.6
21.1
9.111.6
17.5
29.1
18.9
9.114.7
28.2
BelowSecondary
Secondary Post-Secondary(Non-Tertiary)
Diploma &ProfessionalQualification
University
2005 2015Per Cent

Singapore Department of Statistics Population Trends, 2016 ► 11
Across all age groups, the share of residents who attained tertiary qualifications climbed over the past decade (Chart 1.11).
Among residents aged 25-34 years, 52.3 per cent were university graduates in 2015, up from 36.1 per cent in 2005. In comparison, the increase in share was smaller for those with diploma & professional qualifications, from 23.4 per cent to 24.3 per cent over the same period.
Among those aged 35-44 years, 45.3 per cent held university qualifications in 2015, over twice the share of 22.2 per cent in 2005. The proportion holding diploma & professional qualifications also rose to 21.0 per cent in 2015, from 13.1 per cent a decade ago.
Chart 1.11 Highest Qualification Attained of Resident Population Aged 25 Years and Over by Age Group
46.1
27.0
9.77.6 9.6
25.6 24.7
10.9 14.424.3
BelowSecondary
Secondary Post-Secondary
(Non-Tertiary)
Diploma &ProfessionalQualification
University
45-54 Years
11.318.2
11.0
23.436.1
4.59.5 9.4
24.3
52.3
BelowSecondary
Secondary Post-Secondary
(Non-Tertiary)
Diploma &ProfessionalQualification
University
25-34 Years
27.4 26.2
11.2 13.122.2
9.115.2
9.521.0
45.3
BelowSecondary
Secondary Post-Secondary
(Non-Tertiary)
Diploma &ProfessionalQualification
University
35-44 Years
74.5
13.1
4.83.6 4.0
55.6
22.2
7.6 6.48.2
BelowSecondary
Secondary Post-Secondary
(Non-Tertiary)
Diploma &ProfessionalQualification
University
55 Years & Over
2005 2015Per Cent

12 ◄ Population Trends, 2016 Singapore Department of Statistics
Among residents aged 25 years and over, the average number of years of schooling continued to rise and reached 10.7 years in 2015 (Chart 1.12).
Chart 1.12 Mean Years of Schooling Among Resident Population Aged 25 Years and Over by Sex
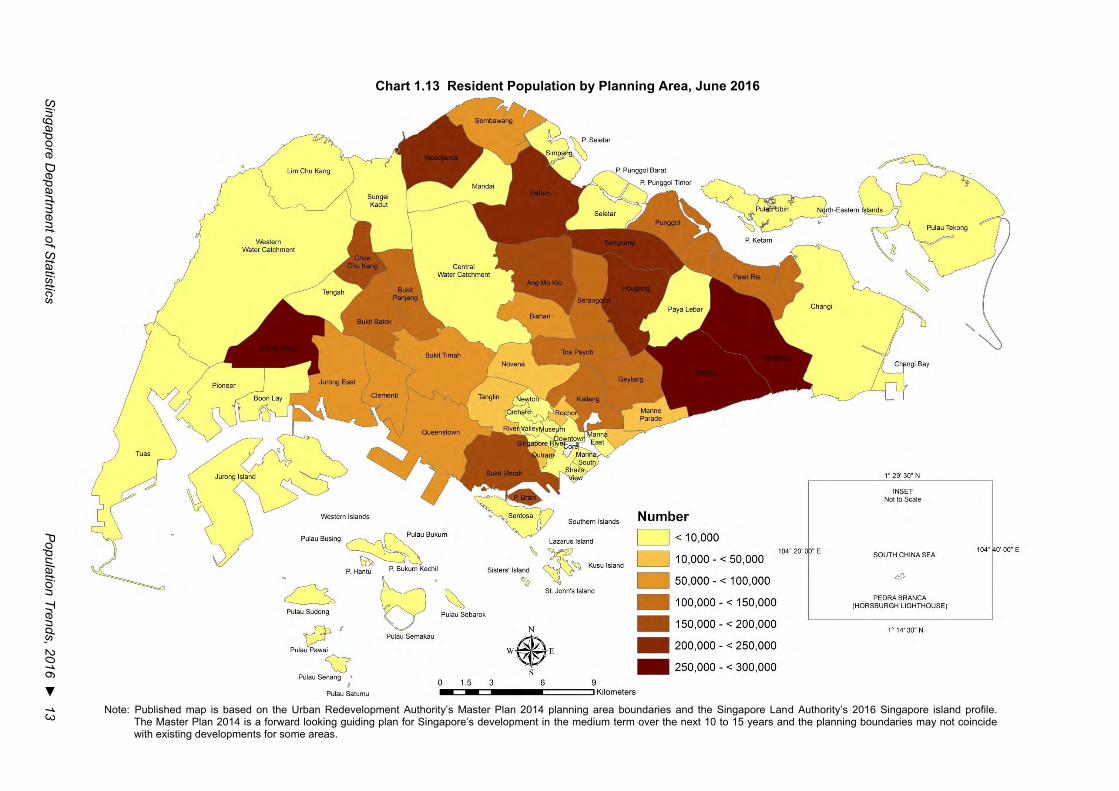
Geographical Distribution
Among the 3.93 million residents in Singapore as at end-Jun 2016, 56.4 per cent were concentrated in ten planning areas2 (Chart 1.13). Bedok with 287,170 residents had the highest number of residents. This was followed by Jurong West and Tampines, each with more than 250,000 residents.
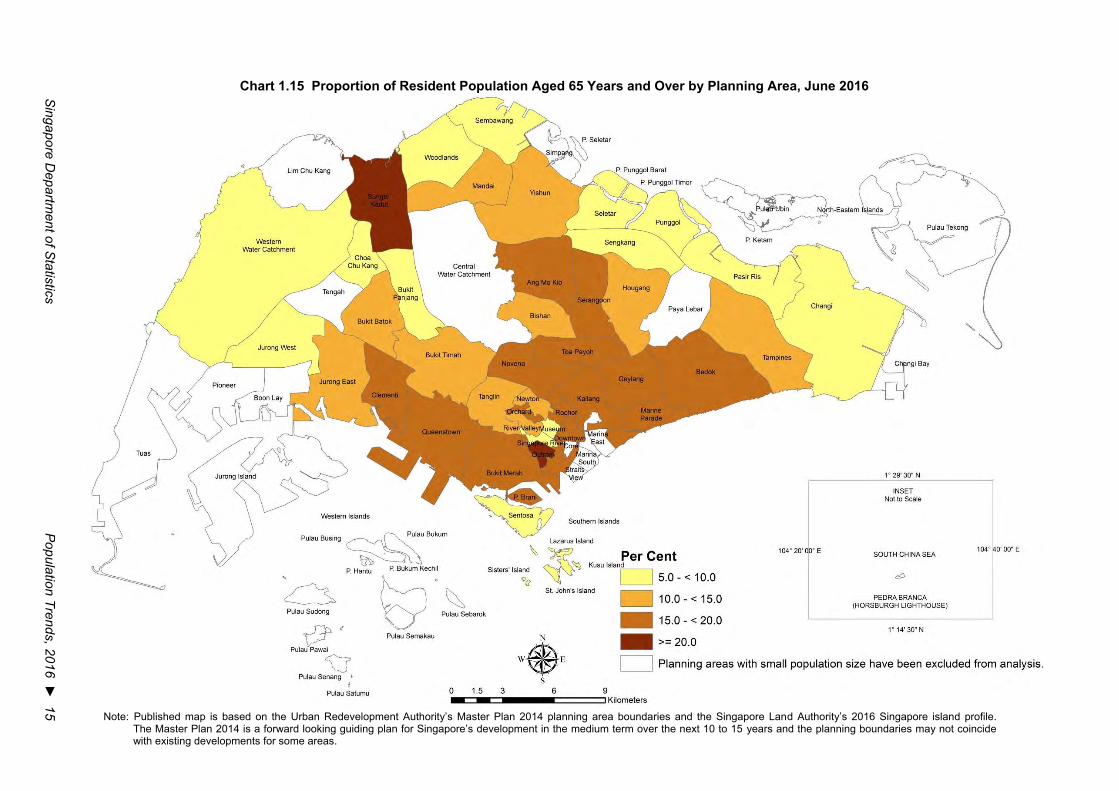
In 2016, the proportion of residents aged 65 years and over was the highest in Sungei Kadut followed by Outram, Rochor, Downtown Core and Bukit Merah planning areas (Chart 1.15). At least 19.2 per cent of the residents in each of these five planning areas were aged 65 years and over.
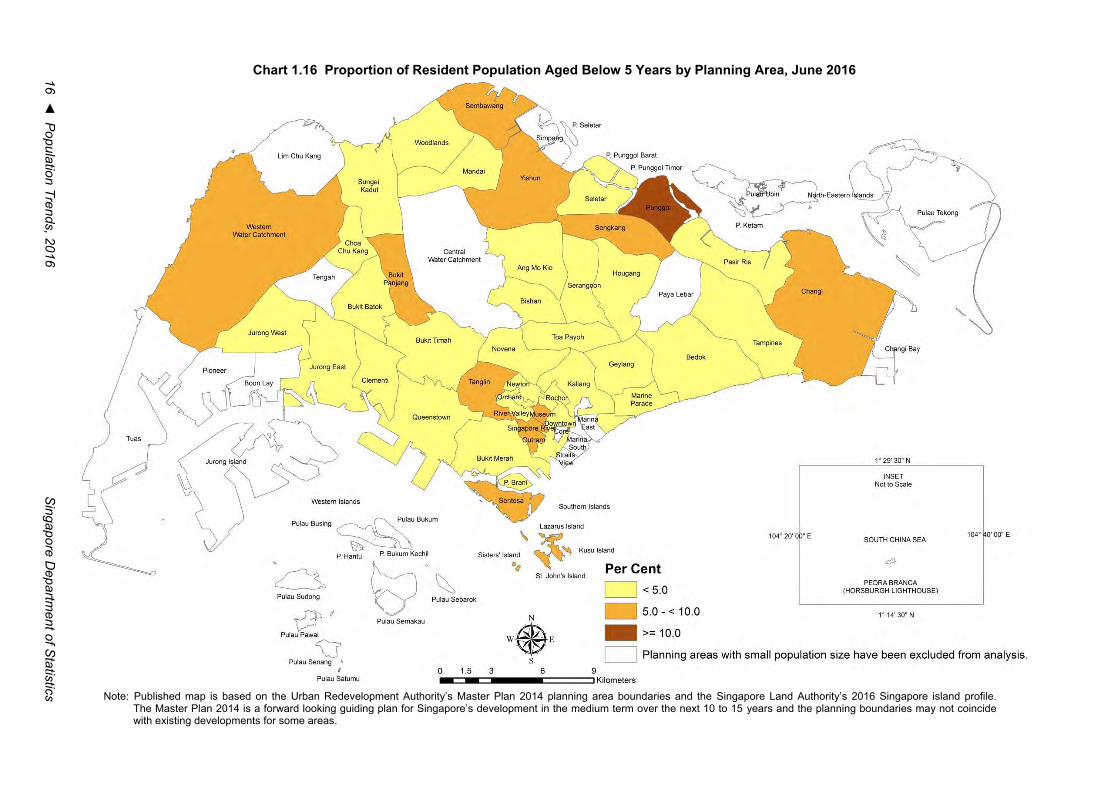
Comparatively, the proportion of children aged below 5 years was generally higher among residents staying in relatively newer estates. In 2016, Punggol had the highest proportion of children at 11.1 per cent (Chart 1.16). Eleven other planning areas each had the proportion of children below 5 years ranging from 5.0 to 8.1 per cent.
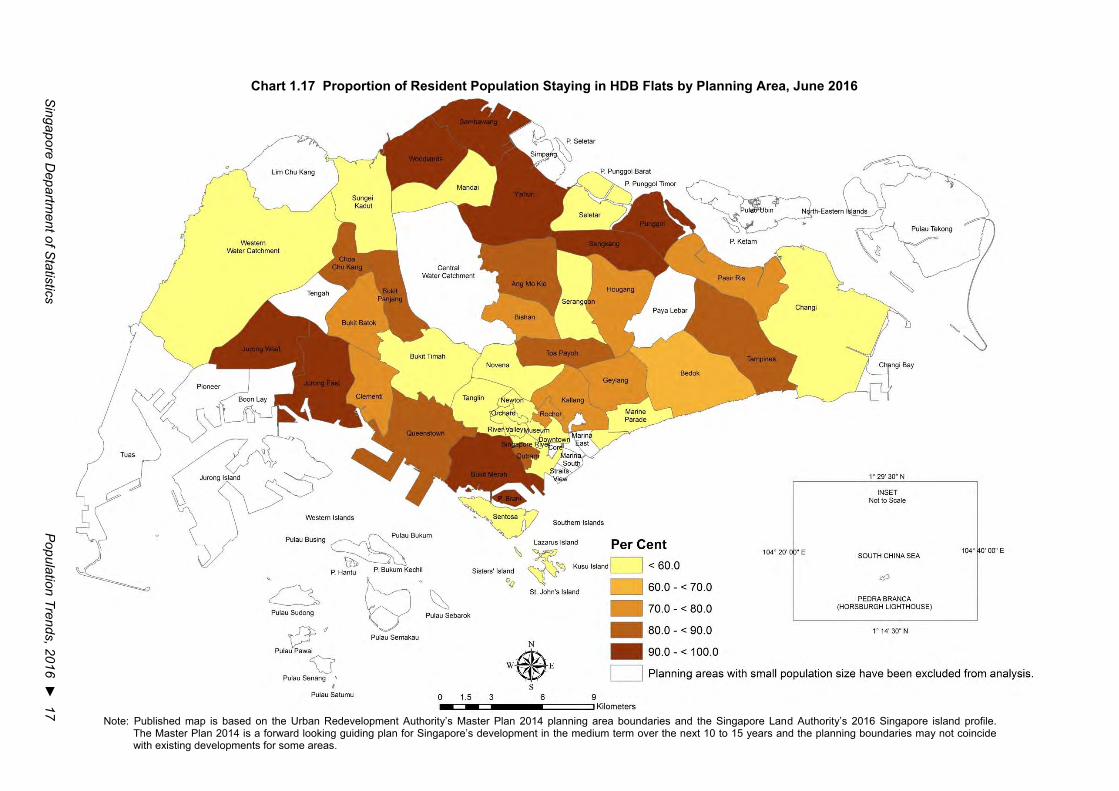
An estimated 3.16 million residents who constituted 80.4 per cent of the residents were staying in HDB flats in 2016 (Chart 1.17). Eight planning areas each had at least 90.0 per cent of the residents staying in HDB flats, with Woodlands having the highest proportion of HDB dwellers, followed by Jurong West.
2 Planning areas refer to areas demarcated in the Urban Redevelopment Authority’s Master Plan 2014.
9.3
Total10.79.9
Males11.2
8.8
Females10.3
4
5
6
7
8
9
10
11
12
2005 2006 2007 2008 2009 2010 2011 2012 2013 2014 2015
Years
Singapore D
epartment of S
tatistics P
opulation Trends, 2016 ► 13
Chart 1.13 Resident Population by Planning Area, June 2016
Note: Published map is based on the Urban Redevelopment Authority’s Master Plan 2014 planning area boundaries and the Singapore Land Authority’s 2016 Singapore island profile. The Master Plan 2014 is a forward looking guiding plan for Singapore’s development in the medium term over the next 10 to 15 years and the planning boundaries may not coincide with existing developments for some areas.
14 ◄ P
opulation Trends, 2016 S
ingapore Departm
ent of Statistics
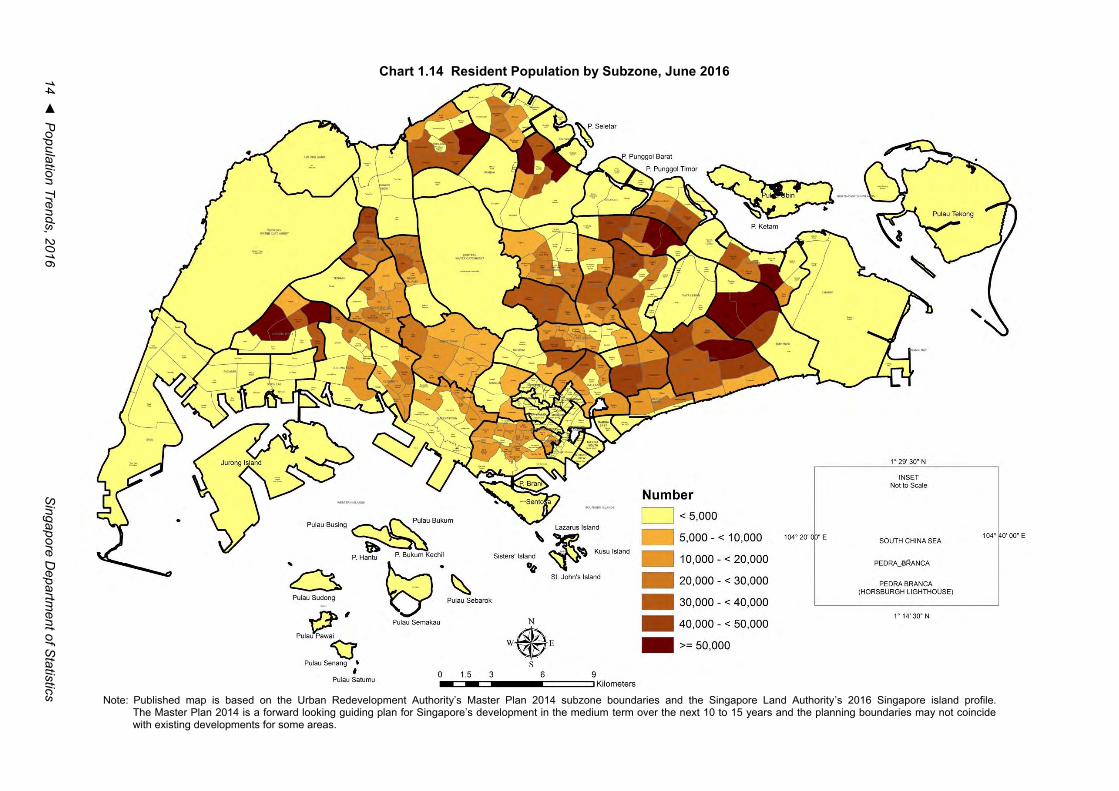
Chart 1.14 Resident Population by Subzone, June 2016
Note: Published map is based on the Urban Redevelopment Authority’s Master Plan 2014 subzone boundaries and the Singapore Land Authority’s 2016 Singapore island profile. The Master Plan 2014 is a forward looking guiding plan for Singapore’s development in the medium term over the next 10 to 15 years and the planning boundaries may not coincide with existing developments for some areas.
Singapore D
epartment of S
tatistics P
opulation Trends, 2016 ► 15
Chart 1.15 Proportion of Resident Population Aged 65 Years and Over by Planning Area, June 2016
Note: Published map is based on the Urban Redevelopment Authority’s Master Plan 2014 planning area boundaries and the Singapore Land Authority’s 2016 Singapore island profile.
The Master Plan 2014 is a forward looking guiding plan for Singapore’s development in the medium term over the next 10 to 15 years and the planning boundaries may not coincide with existing developments for some areas.
16 ◄ P
opulation Trends, 2016 S
ingapore Departm
ent of Statistics
Chart 1.16 Proportion of Resident Population Aged Below 5 Years by Planning Area, June 2016
Note: Published map is based on the Urban Redevelopment Authority’s Master Plan 2014 planning area boundaries and the Singapore Land Authority’s 2016 Singapore island profile. The Master Plan 2014 is a forward looking guiding plan for Singapore’s development in the medium term over the next 10 to 15 years and the planning boundaries may not coincide with existing developments for some areas.
Singapore D
epartment of S
tatistics P
opulation Trends, 2016 ► 17
Chart 1.17 Proportion of Resident Population Staying in HDB Flats by Planning Area, June 2016
Note: Published map is based on the Urban Redevelopment Authority’s Master Plan 2014 planning area boundaries and the Singapore Land Authority’s 2016 Singapore island profile.
The Master Plan 2014 is a forward looking guiding plan for Singapore’s development in the medium term over the next 10 to 15 years and the planning boundaries may not coincide with existing developments for some areas.
18 ◄ Population Trends, 2016 Singapore Department of Statistics
Chapter 2 Households and Housing
Resident Households
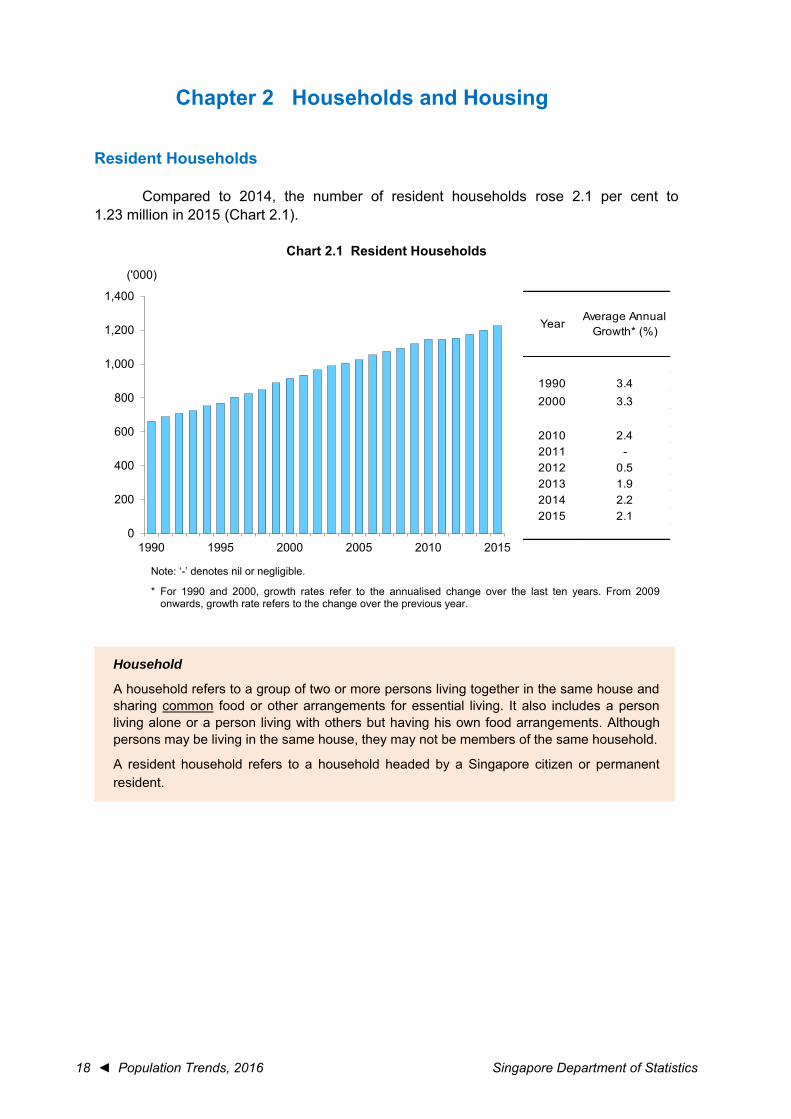
Compared to 2014, the number of resident households rose 2.1 per cent to 1.23 million in 2015 (Chart 2.1).
Chart 2.1 Resident Households
Note: ‘-’ denotes nil or negligible.
* For 1990 and 2000, growth rates refer to the annualised change over the last ten years. From 2009onwards, growth rate refers to the change over the previous year.
0
200
400
600
800
1,000
1,200
1,400
1990 1995 2000 2005 2010 2015
('000)
YearAverage Annual
Growth* (%)
1990 3.42000 3.3
2010 2.42011 -2012 0.52013 1.92014 2.22015 2.1
Household
A household refers to a group of two or more persons living together in the same house and sharing common food or other arrangements for essential living. It also includes a person living alone or a person living with others but having his own food arrangements. Although persons may be living in the same house, they may not be members of the same household.
A resident household refers to a household headed by a Singapore citizen or permanent resident.
Singapore Department of Statistics Population Trends, 2016 ► 19
Type of Dwelling
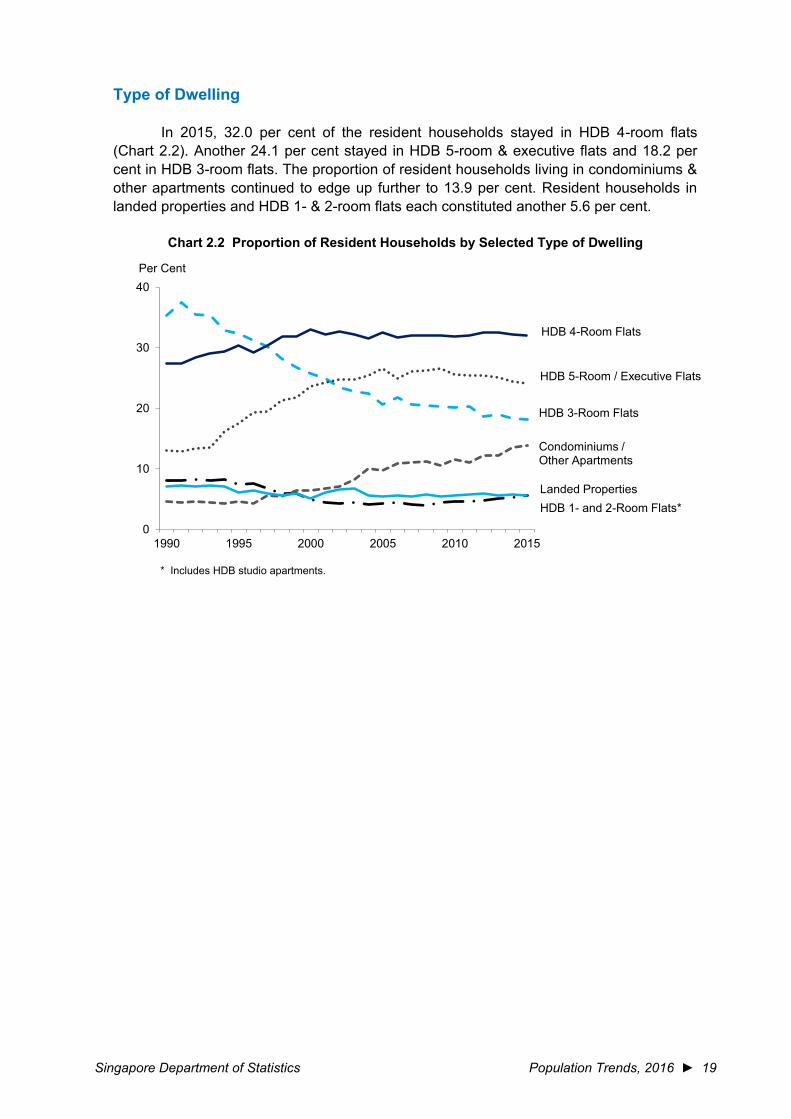
In 2015, 32.0 per cent of the resident households stayed in HDB 4-room flats (Chart 2.2). Another 24.1 per cent stayed in HDB 5-room & executive flats and 18.2 per cent in HDB 3-room flats. The proportion of resident households living in condominiums & other apartments continued to edge up further to 13.9 per cent. Resident households in landed properties and HDB 1- & 2-room flats each constituted another 5.6 per cent.
Chart 2.2 Proportion of Resident Households by Selected Type of Dwelling
* Includes HDB studio apartments.
Per Cent
0
10
20
30
40
1990 1995 2000 2005 2010 2015
HDB 1- and 2-Room Flats*Landed Properties
Condominiums / Other Apartments
HDB 3-Room Flats
HDB 5-Room / Executive Flats
HDB 4-Room Flats
20 ◄ Population Trends, 2016 Singapore Department of Statistics
Home Ownership
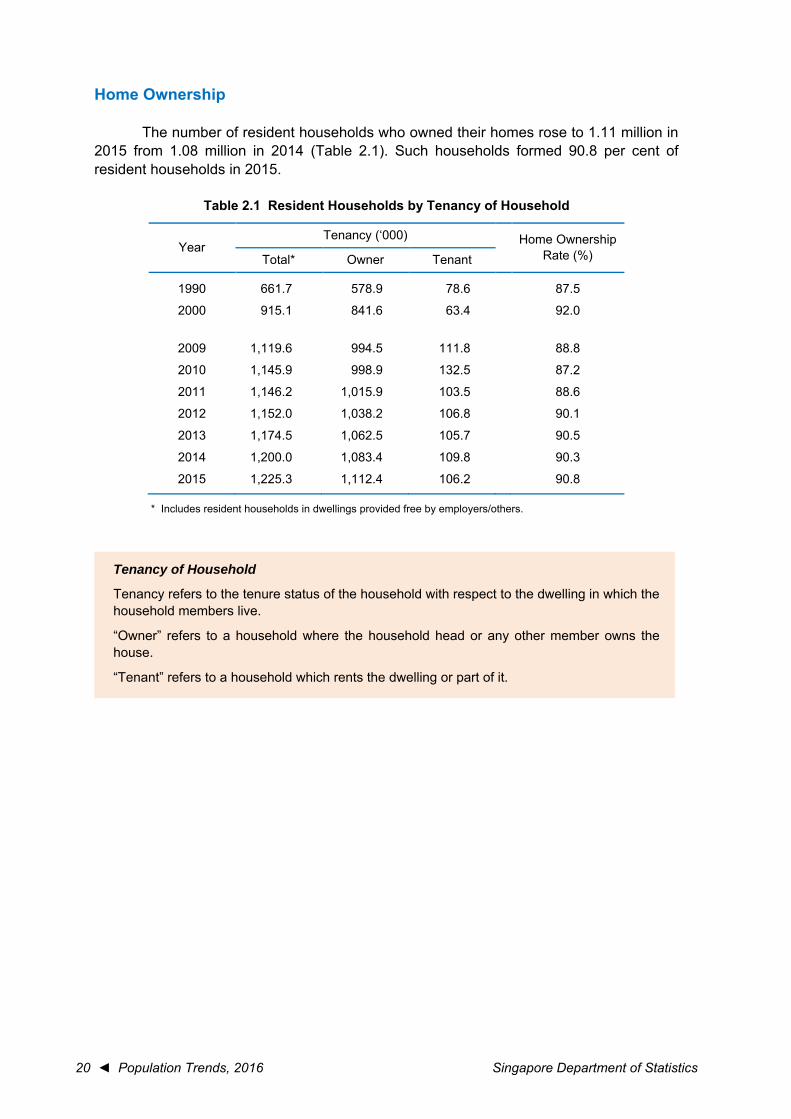
The number of resident households who owned their homes rose to 1.11 million in 2015 from 1.08 million in 2014 (Table 2.1). Such households formed 90.8 per cent of resident households in 2015.
Table 2.1 Resident Households by Tenancy of Household
Year Tenancy (‘000) Home Ownership
Rate (%) Total* Owner Tenant
1990 661.7 578.9 78.6 87.5
2000 915.1 841.6 63.4 92.0
2009 1,119.6 994.5 111.8 88.8
2010 1,145.9 998.9 132.5 87.2
2011 1,146.2 1,015.9 103.5 88.6
2012 1,152.0 1,038.2 106.8 90.1
2013 1,174.5 1,062.5 105.7 90.5
2014 1,200.0 1,083.4 109.8 90.3
2015 1,225.3 1,112.4 106.2 90.8
* Includes resident households in dwellings provided free by employers/others.
Tenancy of Household
Tenancy refers to the tenure status of the household with respect to the dwelling in which the household members live.
“Owner” refers to a household where the household head or any other member owns the house.
“Tenant” refers to a household which rents the dwelling or part of it.
Singapore Department of Statistics Population Trends, 2016 ► 21
Household Size
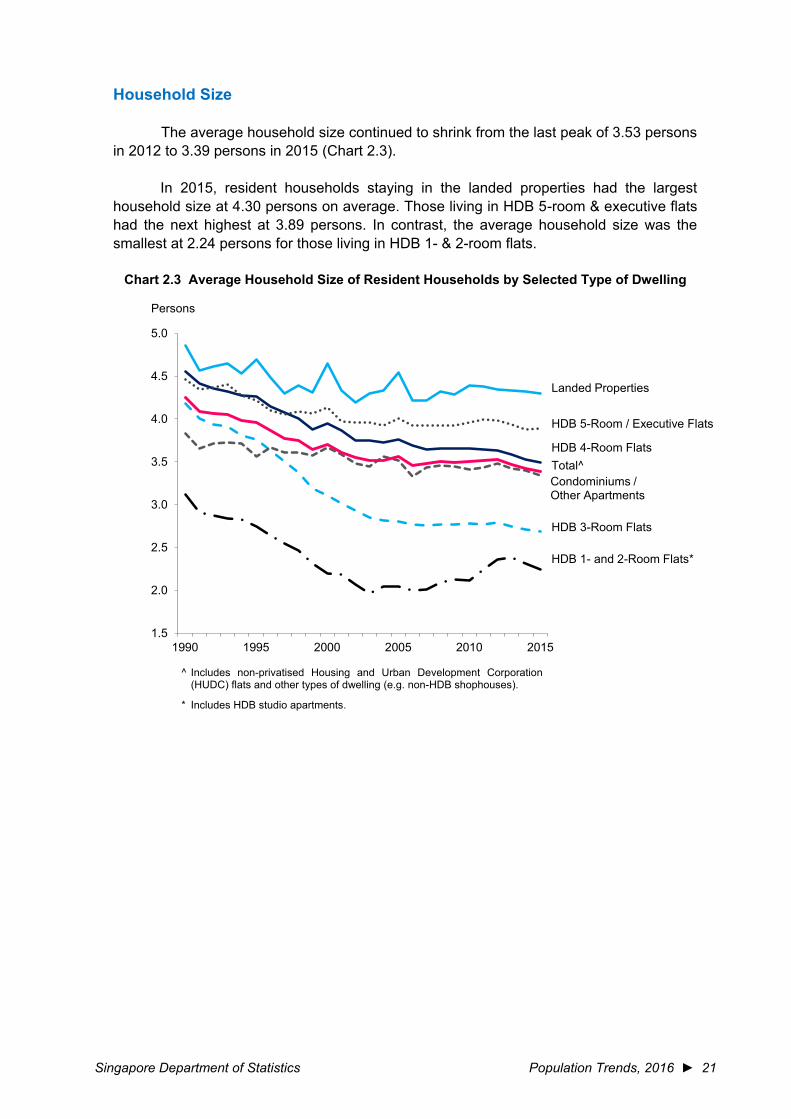
The average household size continued to shrink from the last peak of 3.53 persons in 2012 to 3.39 persons in 2015 (Chart 2.3).
In 2015, resident households staying in the landed properties had the largest household size at 4.30 persons on average. Those living in HDB 5-room & executive flats had the next highest at 3.89 persons. In contrast, the average household size was the smallest at 2.24 persons for those living in HDB 1- & 2-room flats.
Chart 2.3 Average Household Size of Resident Households by Selected Type of Dwelling
^ Includes non-privatised Housing and Urban Development Corporation (HUDC) flats and other types of dwelling (e.g. non-HDB shophouses).
* Includes HDB studio apartments.
1.5
2.0
2.5
3.0
3.5
4.0
4.5
5.0
1990 1995 2000 2005 2010 2015
Persons
HDB 3-Room Flats
HDB 1- and 2-Room Flats*
Condominiums / Other Apartments
HDB 4-Room Flats
HDB 5-Room / Executive Flats
Landed Properties
Total^
22 ◄ Population Trends, 2016 Singapore Department of Statistics
Household Living Arrangement
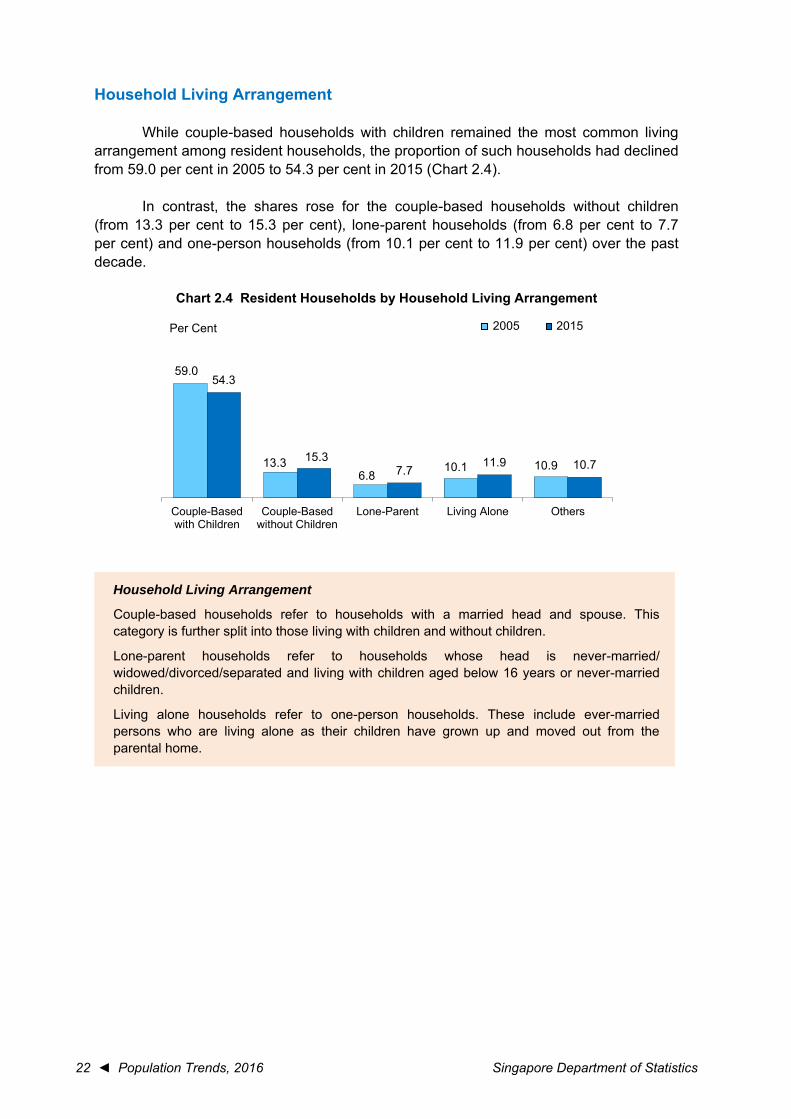
While couple-based households with children remained the most common living arrangement among resident households, the proportion of such households had declined from 59.0 per cent in 2005 to 54.3 per cent in 2015 (Chart 2.4).
In contrast, the shares rose for the couple-based households without children (from 13.3 per cent to 15.3 per cent), lone-parent households (from 6.8 per cent to 7.7 per cent) and one-person households (from 10.1 per cent to 11.9 per cent) over the past decade.
Chart 2.4 Resident Households by Household Living Arrangement
59.0
13.36.8
10.1 10.9
54.3
15.37.7
11.9 10.7
Couple-Basedwith Children
Couple-Basedwithout Children
Lone-Parent Living Alone Others
2005 2015Per Cent
Household Living Arrangement
Couple-based households refer to households with a married head and spouse. This category is further split into those living with children and without children.
Lone-parent households refer to households whose head is never-married/ widowed/divorced/separated and living with children aged below 16 years or never-married children.
Living alone households refer to one-person households. These include ever-married persons who are living alone as their children have grown up and moved out from the parental home.
Singapore Department of Statistics Population Trends, 2016 ► 23
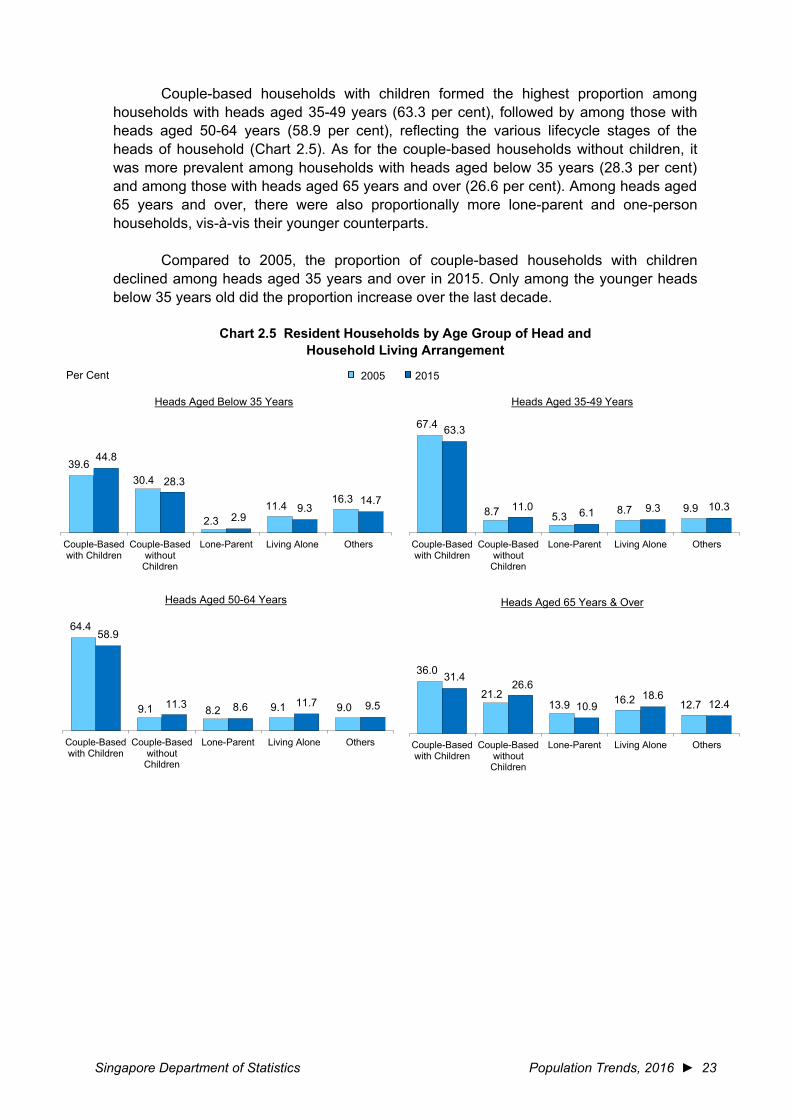
Couple-based households with children formed the highest proportion among households with heads aged 35-49 years (63.3 per cent), followed by among those with heads aged 50-64 years (58.9 per cent), reflecting the various lifecycle stages of the heads of household (Chart 2.5). As for the couple-based households without children, it was more prevalent among households with heads aged below 35 years (28.3 per cent) and among those with heads aged 65 years and over (26.6 per cent). Among heads aged 65 years and over, there were also proportionally more lone-parent and one-person households, vis-à-vis their younger counterparts.
Compared to 2005, the proportion of couple-based households with children declined among heads aged 35 years and over in 2015. Only among the younger heads below 35 years old did the proportion increase over the last decade.
Chart 2.5 Resident Households by Age Group of Head and Household Living Arrangement
39.630.4
2.311.4 16.3
44.8
28.3
2.99.3
14.7
Couple-Basedwith Children
Couple-Basedwithout
Children
Lone-Parent Living Alone Others
Heads Aged Below 35 Years
67.4
8.7 5.3 8.7 9.9
63.3
11.0 6.1 9.3 10.3
Couple-Basedwith Children
Couple-Basedwithout
Children
Lone-Parent Living Alone Others
Heads Aged 35-49 Years
64.4
9.1 8.2 9.1 9.0
58.9
11.3 8.6 11.7 9.5
Couple-Basedwith Children
Couple-Basedwithout
Children
Lone-Parent Living Alone Others
Heads Aged 50-64 Years
36.0
21.213.9 16.2 12.7
31.426.6
10.918.6
12.4
Couple-Basedwith Children
Couple-Basedwithout
Children
Lone-Parent Living Alone Others
Heads Aged 65 Years & Over
2005 2015Per Cent

24 ◄ Population Trends, 2016 Singapore Department of Statistics
Chapter 3 Family Formation and Dissolution
Marriages
In 2015, the total number of marriages (comprising civil and Muslim marriages) registered in Singapore was 28,322, close to the 28,407 marriages in 2014 (Chart 3.1). This was the second highest number of marriages registered in Singapore since the data on total marriages were first available in 1961. 76.4 per cent or 21,639 marriages in 2015 were first marriages where neither party had previously been married.
Chart 3.1 Total Marriages and General Marriage Rate (GMR)
Note: Prior to 1984, data on GMR are based on total grooms/brides and total population comprising residents (i.e. Singapore citizens and permanent residents) and non-residents. In view of the rising proportion of marriages among persons aged 45-49 years, the data series on GMR was revised in 2014 to cover the age group 15-49 years.
0
10
20
30
40
50
60
70
80
0
10
20
30
40
50
1980 1985 1990 1995 2000 2005 2010 2015
Per 1,000 Unmarried Resident Males/Females Aged 15-49 Years('000) Male GMR
Female GMRRemarriagesFirst Marriages
Total Marriages and Divorces
Statistics on marriages comprise civil marriages registered under the Women’s Charter and Muslim marriages registered under the Administration of Muslim Law Act. They are obtained from records maintained by the Registry of Marriages and the Registry of Muslim Marriages.
Statistics on divorces and annulments are obtained from records maintained by the Family Justice Courts and Syariah Court. The records on revocation of divorces are obtained from the Registry of Muslim Marriages. Separations that do not confer on the parties the right to re-marry are not covered.
More details on marriages and divorces are available in the publication “Statistics on Marriages and Divorces, 2015”.
Singapore Department of Statistics Population Trends, 2016 ► 25
Along with the comparable total number of marriages, the general marriage rates were relatively stable in 2015. In 2015, the marriage rate for males was 44.2 marriages per 1,000 unmarried males aged 15-49 years, similar to the 44.4 in 2014. For females, the 2015 rate was 41.1 marriages per 1,000 unmarried females aged 15-49 years, comparable to the 40.8 the year before.
Age-Specific Marriage Rate
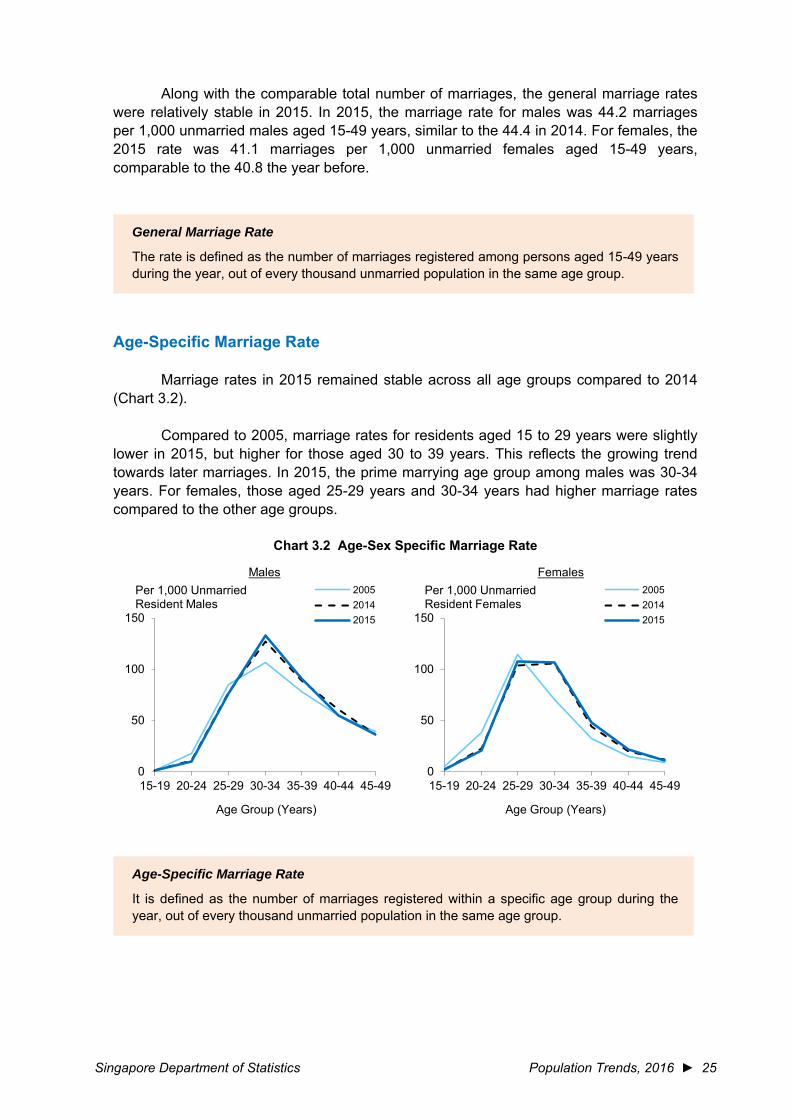
Marriage rates in 2015 remained stable across all age groups compared to 2014 (Chart 3.2).
Compared to 2005, marriage rates for residents aged 15 to 29 years were slightly lower in 2015, but higher for those aged 30 to 39 years. This reflects the growing trend towards later marriages. In 2015, the prime marrying age group among males was 30-34 years. For females, those aged 25-29 years and 30-34 years had higher marriage rates compared to the other age groups.
Chart 3.2 Age-Sex Specific Marriage Rate
0
50
100
150
15-19 20-24 25-29 30-34 35-39 40-44 45-49
Males200520142015
Age Group (Years)
Per 1,000 UnmarriedResident Males
0
50
100
150
15-19 20-24 25-29 30-34 35-39 40-44 45-49
Females200520142015
Age Group (Years)
Per 1,000 UnmarriedResident Females
General Marriage Rate
The rate is defined as the number of marriages registered among persons aged 15-49 years during the year, out of every thousand unmarried population in the same age group.
Age-Specific Marriage Rate
It is defined as the number of marriages registered within a specific age group during the year, out of every thousand unmarried population in the same age group.

26 ◄ Population Trends, 2016 Singapore Department of Statistics
Median Age at First Marriage
Grooms and brides across most educational groups were marrying later in 2015 compared to 2005 (Chart 3.3).
In 2015, the median age at first marriage was the lowest for grooms with post-secondary qualifications at 29.4 years. On the contrary, it was the lowest for brides with secondary & below qualifications at 27.0 years.
Chart 3.3 Median Age at First Marriage of Grooms and Brides by Educational Qualification
* Post-Secondary comprises Post-Secondary (Non-Tertiary), Diploma and Professional Qualification.
2005 2015Years
31.828.5
30.030.5 29.4 30.7
Secondary & Below Post-Secondary* University
Grooms
26.0 26.127.927.0 27.2
28.9
Secondary & Below Post-Secondary* University
Brides
Singapore Department of Statistics Population Trends, 2016 ► 27
Marital Dissolution
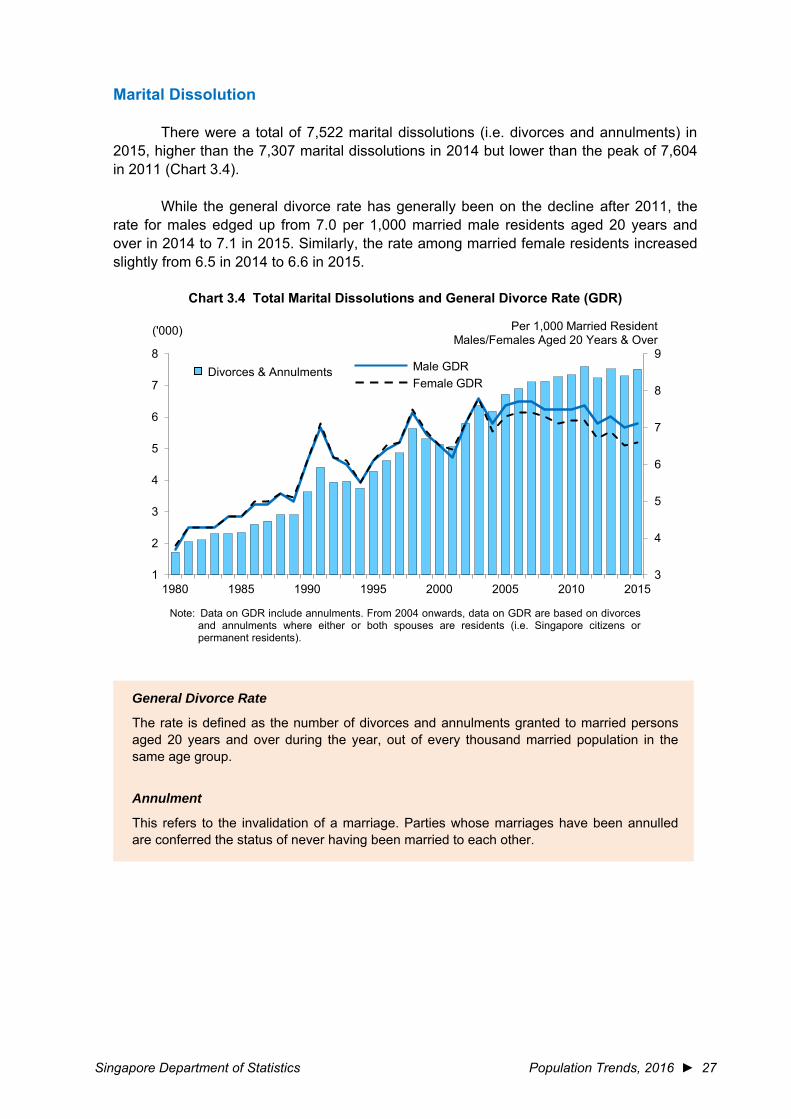
There were a total of 7,522 marital dissolutions (i.e. divorces and annulments) in 2015, higher than the 7,307 marital dissolutions in 2014 but lower than the peak of 7,604 in 2011 (Chart 3.4).
While the general divorce rate has generally been on the decline after 2011, the rate for males edged up from 7.0 per 1,000 married male residents aged 20 years and over in 2014 to 7.1 in 2015. Similarly, the rate among married female residents increased slightly from 6.5 in 2014 to 6.6 in 2015.
Chart 3.4 Total Marital Dissolutions and General Divorce Rate (GDR)
Note: Data on GDR include annulments. From 2004 onwards, data on GDR are based on divorces and annulments where either or both spouses are residents (i.e. Singapore citizens or permanent residents).
3
4
5
6
7
8
9
1
2
3
4
5
6
7
8
1980 1985 1990 1995 2000 2005 2010 2015
Divorces & Annulments
('000) Per 1,000 Married ResidentMales/Females Aged 20 Years & Over
Female GDRMale GDR
General Divorce Rate
The rate is defined as the number of divorces and annulments granted to married persons aged 20 years and over during the year, out of every thousand married population in the same age group.
Annulment
This refers to the invalidation of a marriage. Parties whose marriages have been annulled are conferred the status of never having been married to each other.

28 ◄ Population Trends, 2016 Singapore Department of Statistics
Age-Specific Divorce Rate
Divorce rates were higher among younger persons than their older counterparts in the same year (Chart 3.5). An increase in the divorce rate for the 20-24 years age group was registered between 2014 and 2015, especially for males, while rates remained similar for the other age groups. However when compared to 2005, the 2015 rates for those aged 25 to 34 years were slightly lower while the rates for those aged 40 to 49 years were slightly higher.
Chart 3.5 Age-Sex Specific Divorce Rate
Marriage Duration of Divorcing Couples
The median marriage duration of divorcing couples in 2015 was 10.0 years, longer than the 9.3 years in 2005. Divorces that occurred within 5-9 years of marriage constituted the largest share (30.4 per cent) of divorces in 2015 (Chart 3.6).
Chart 3.6 Divorces by Duration of Marriage
Note: Data exclude annulments.
05
10152025303540
20-24 25-29 30-34 35-39 40-44 45-49 50 &Over
Females
2005
2014
2015
Per 1,000 MarriedResident Females
Age Group (Years)
05
10152025303540
20-24 25-29 30-34 35-39 40-44 45-49 50 &Over
Males
2005
2014
2015
Per 1,000 MarriedResident Males
Age Group (Years)
18.7
35.0
17.311.1
17.919.4
30.4
16.613.0
20.6
Under 5 5-9 10-14 15-19 20 & Over
2005 2015Per Cent
Duration of Marriage (Years)
Age-Specific Divorce Rate
It is defined as the number of divorces and annulments granted to a specific age group during the year, out of every thousand married population in the same age group.
Singapore Department of Statistics Population Trends, 2016 ► 29
Chapter 4 Fertility
Births and Fertility Rate
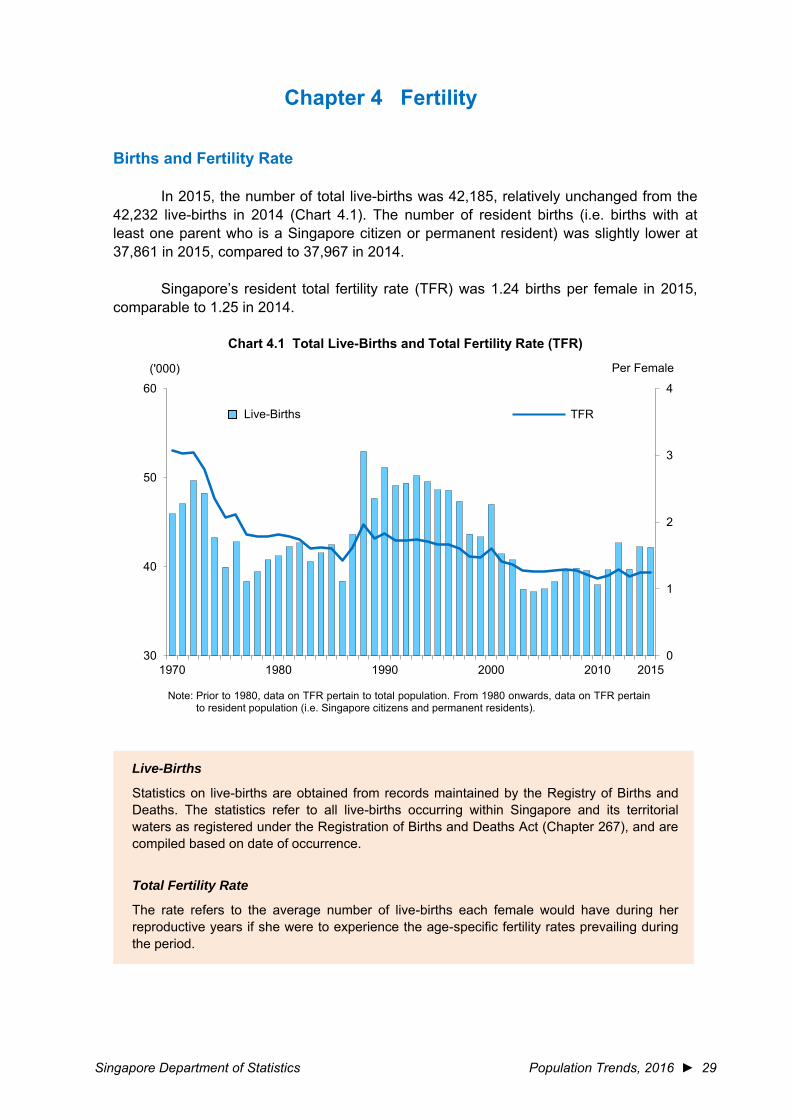
In 2015, the number of total live-births was 42,185, relatively unchanged from the 42,232 live-births in 2014 (Chart 4.1). The number of resident births (i.e. births with at least one parent who is a Singapore citizen or permanent resident) was slightly lower at 37,861 in 2015, compared to 37,967 in 2014.
Singapore’s resident total fertility rate (TFR) was 1.24 births per female in 2015, comparable to 1.25 in 2014.
Chart 4.1 Total Live-Births and Total Fertility Rate (TFR)
Note: Prior to 1980, data on TFR pertain to total population. From 1980 onwards, data on TFR pertain to resident population (i.e. Singapore citizens and permanent residents).
0
1
2
3
4
30
40
50
60
1970 1980 1990 2000 2010 2015
('000) Per Female
Live-Births TFR
Live-Births
Statistics on live-births are obtained from records maintained by the Registry of Births and Deaths. The statistics refer to all live-births occurring within Singapore and its territorial waters as registered under the Registration of Births and Deaths Act (Chapter 267), and are compiled based on date of occurrence.
Total Fertility Rate
The rate refers to the average number of live-births each female would have during her reproductive years if she were to experience the age-specific fertility rates prevailing during the period.
30 ◄ Population Trends, 2016 Singapore Department of Statistics
Ethnic Differentials in Fertility
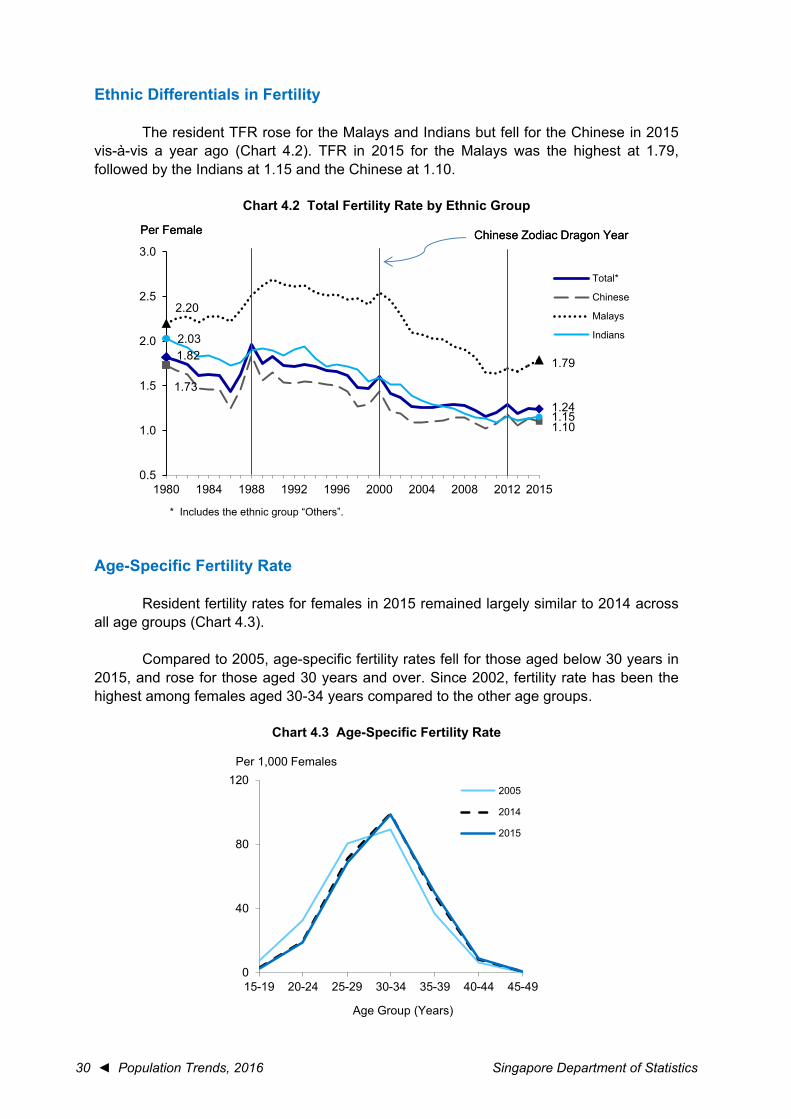
The resident TFR rose for the Malays and Indians but fell for the Chinese in 2015 vis-à-vis a year ago (Chart 4.2). TFR in 2015 for the Malays was the highest at 1.79, followed by the Indians at 1.15 and the Chinese at 1.10.
Chart 4.2 Total Fertility Rate by Ethnic Group
* Includes the ethnic group “Others”.
Age-Specific Fertility Rate
Resident fertility rates for females in 2015 remained largely similar to 2014 across all age groups (Chart 4.3).
Compared to 2005, age-specific fertility rates fell for those aged below 30 years in 2015, and rose for those aged 30 years and over. Since 2002, fertility rate has been the highest among females aged 30-34 years compared to the other age groups.
Chart 4.3 Age-Specific Fertility Rate
1.82
1.24
1.73
1.10
2.20
1.79
2.03
1.15
0.5
1.0
1.5
2.0
2.5
3.0
1980 1984 1988 1992 1996 2000 2004 2008 2012 2015
Total*
Chinese
Malays
Indians
Per Female Chinese Zodiac Dragon YearPer Female Chinese Zodiac Dragon Year
0
40
80
120
15-19 20-24 25-29 30-34 35-39 40-44 45-49
2005
2014
2015
Per 1,000 Females
Age Group (Years)
Singapore Department of Statistics Population Trends, 2016 ► 31
Births by Birth Order
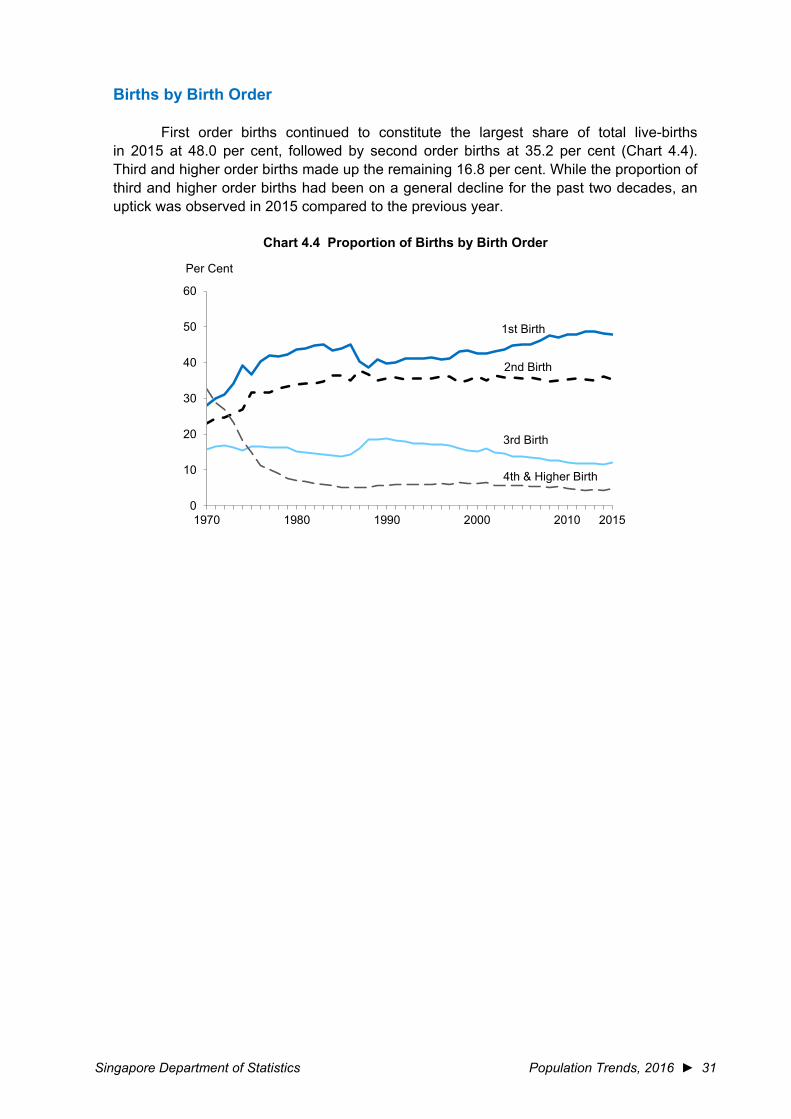
First order births continued to constitute the largest share of total live-births in 2015 at 48.0 per cent, followed by second order births at 35.2 per cent (Chart 4.4). Third and higher order births made up the remaining 16.8 per cent. While the proportion of third and higher order births had been on a general decline for the past two decades, an uptick was observed in 2015 compared to the previous year.
Chart 4.4 Proportion of Births by Birth Order
0
10
20
30
40
50
60
1970 1980 1990 2000 2010 2015
Per Cent
1st Birth
2nd Birth
3rd Birth
4th & Higher Birth
32 ◄ Population Trends, 2016 Singapore Department of Statistics
Number of Children Born
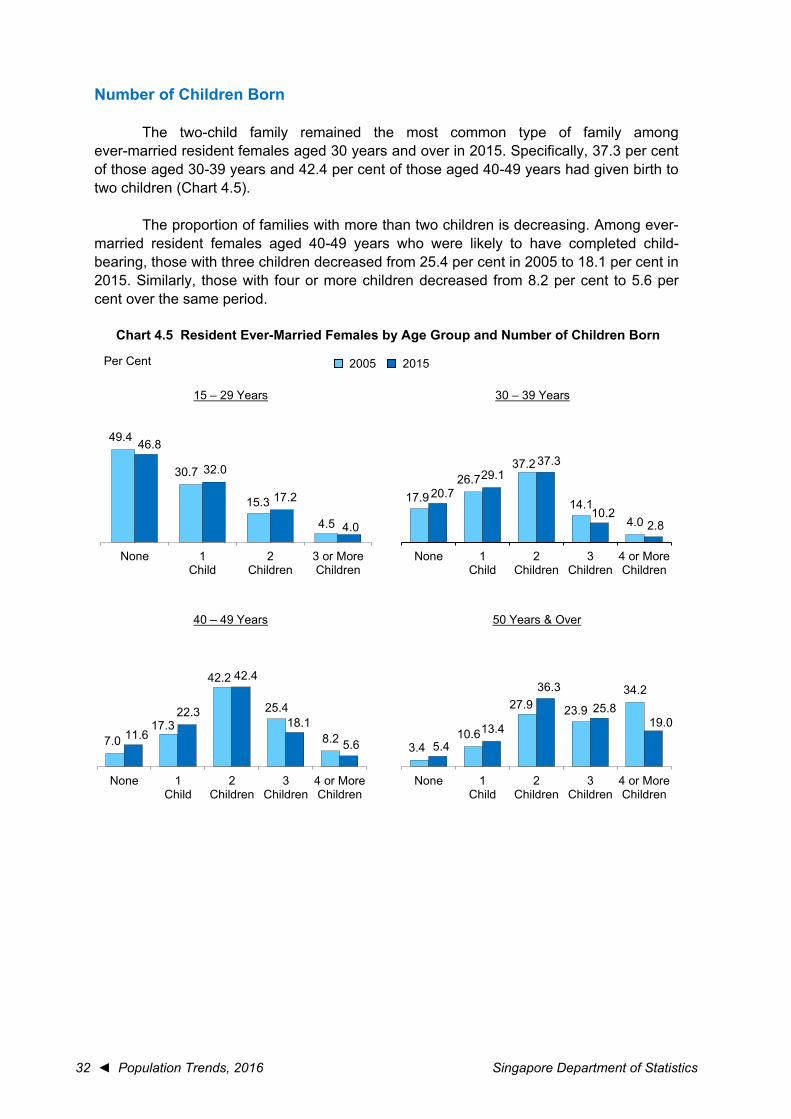
The two-child family remained the most common type of family among ever-married resident females aged 30 years and over in 2015. Specifically, 37.3 per cent of those aged 30-39 years and 42.4 per cent of those aged 40-49 years had given birth to two children (Chart 4.5).
The proportion of families with more than two children is decreasing. Among ever-married resident females aged 40-49 years who were likely to have completed child-bearing, those with three children decreased from 25.4 per cent in 2005 to 18.1 per cent in 2015. Similarly, those with four or more children decreased from 8.2 per cent to 5.6 per cent over the same period.
Chart 4.5 Resident Ever-Married Females by Age Group and Number of Children Born
2005 2015Per Cent
49.4
30.7
15.3
4.5
46.8
32.0
17.2
4.0
None 1Child
2Children
3 or MoreChildren
15 – 29 Years
17.926.7
37.2
14.14.0
20.729.1
37.3
10.22.8
None 1Child
2Children
3Children
4 or MoreChildren
30 – 39 Years
7.017.3
42.2
25.4
8.211.6
22.3
42.4
18.1
5.6
None 1Child
2Children
3Children
4 or MoreChildren
40 – 49 Years
3.410.6
27.9 23.9
34.2
5.413.4
36.3
25.819.0
None 1Child
2Children
3Children
4 or MoreChildren
50 Years & Over
Singapore Department of Statistics Population Trends, 2016 ► 33
Average Number of Children Born by Age Group of Females
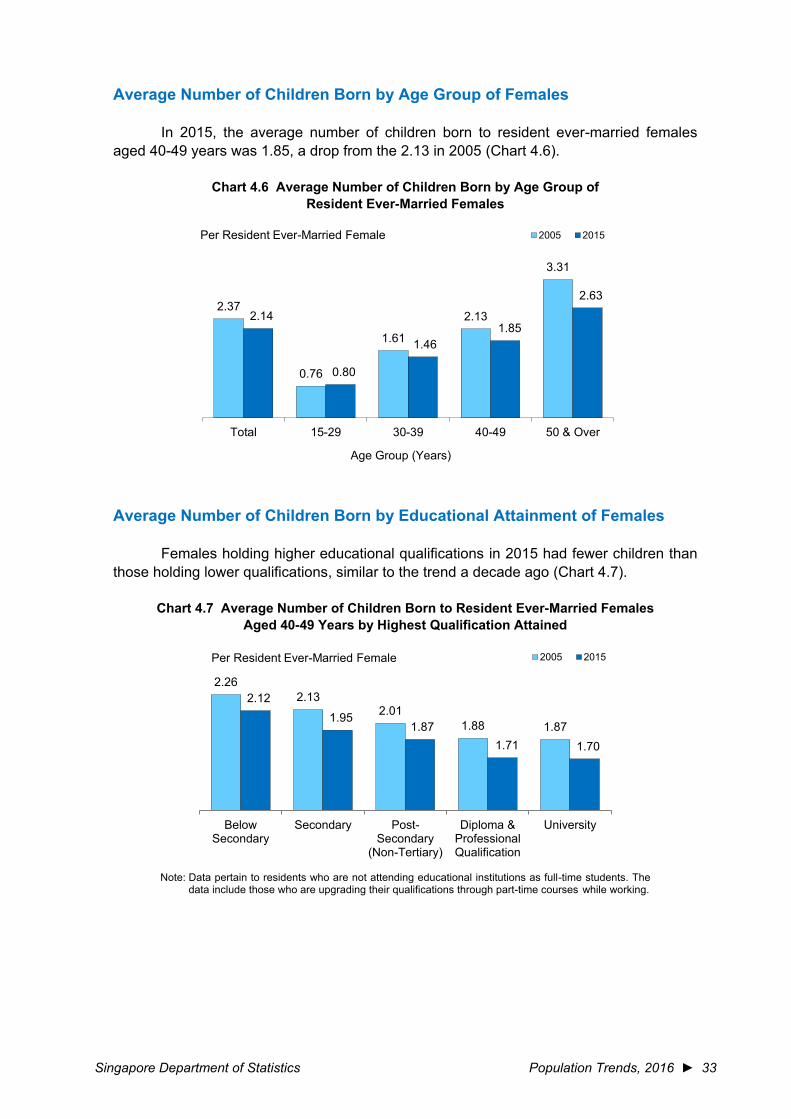
In 2015, the average number of children born to resident ever-married females aged 40-49 years was 1.85, a drop from the 2.13 in 2005 (Chart 4.6).
Chart 4.6 Average Number of Children Born by Age Group of Resident Ever-Married Females
Average Number of Children Born by Educational Attainment of Females
Females holding higher educational qualifications in 2015 had fewer children than those holding lower qualifications, similar to the trend a decade ago (Chart 4.7).
Chart 4.7 Average Number of Children Born to Resident Ever-Married Females Aged 40-49 Years by Highest Qualification Attained
Note: Data pertain to residents who are not attending educational institutions as full-time students. The
data include those who are upgrading their qualifications through part-time courses while working.
2.37
0.76
1.61
2.13
3.31
2.14
0.80
1.461.85
2.63
Total 15-29 30-39 40-49 50 & Over
2005 2015Per Resident Ever-Married Female
Age Group (Years)
2.26 2.13
2.01 1.88 1.87
2.12 1.95
1.87 1.71 1.70
BelowSecondary
Secondary Post-Secondary
(Non-Tertiary)
Diploma &ProfessionalQualification
University
2005 2015Per Resident Ever-Married Female
34 ◄ Population Trends, 2016 Singapore Department of Statistics
Chapter 5 Mortality
Deaths and Death Rates
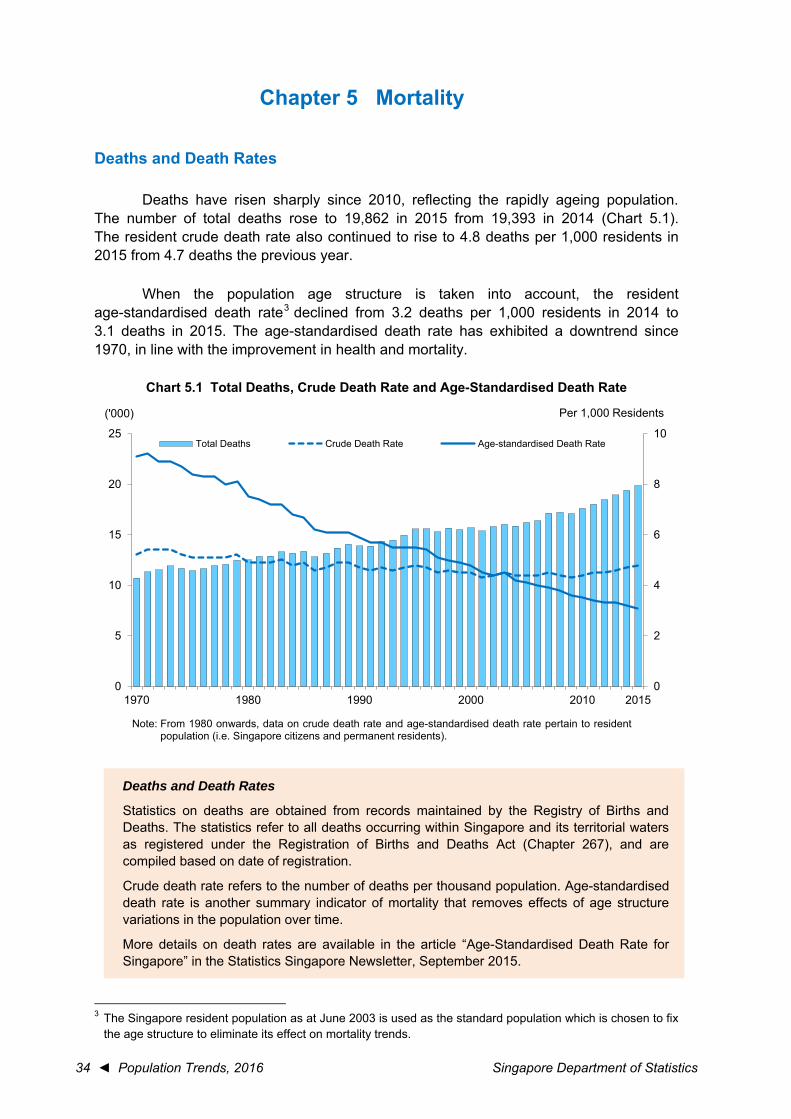
Deaths have risen sharply since 2010, reflecting the rapidly ageing population. The number of total deaths rose to 19,862 in 2015 from 19,393 in 2014 (Chart 5.1). The resident crude death rate also continued to rise to 4.8 deaths per 1,000 residents in 2015 from 4.7 deaths the previous year.
When the population age structure is taken into account, the resident age-standardised death rate3 declined from 3.2 deaths per 1,000 residents in 2014 to 3.1 deaths in 2015. The age-standardised death rate has exhibited a downtrend since 1970, in line with the improvement in health and mortality.
Chart 5.1 Total Deaths, Crude Death Rate and Age-Standardised Death Rate
Note: From 1980 onwards, data on crude death rate and age-standardised death rate pertain to resident population (i.e. Singapore citizens and permanent residents).
3 The Singapore resident population as at June 2003 is used as the standard population which is chosen to fix the age structure to eliminate its effect on mortality trends.
0
2
4
6
8
10
0
5
10
15
20
25
1970 1980 1990 2000 2010 2015
('000)
Total Deaths Crude Death Rate Age-standardised Death Rate
PPP Per 1,000 Residents
Deaths and Death Rates
Statistics on deaths are obtained from records maintained by the Registry of Births and Deaths. The statistics refer to all deaths occurring within Singapore and its territorial waters as registered under the Registration of Births and Deaths Act (Chapter 267), and are compiled based on date of registration.
Crude death rate refers to the number of deaths per thousand population. Age-standardised death rate is another summary indicator of mortality that removes effects of age structure variations in the population over time.
More details on death rates are available in the article “Age-Standardised Death Rate for Singapore” in the Statistics Singapore Newsletter, September 2015.
Singapore Department of Statistics Population Trends, 2016 ► 35
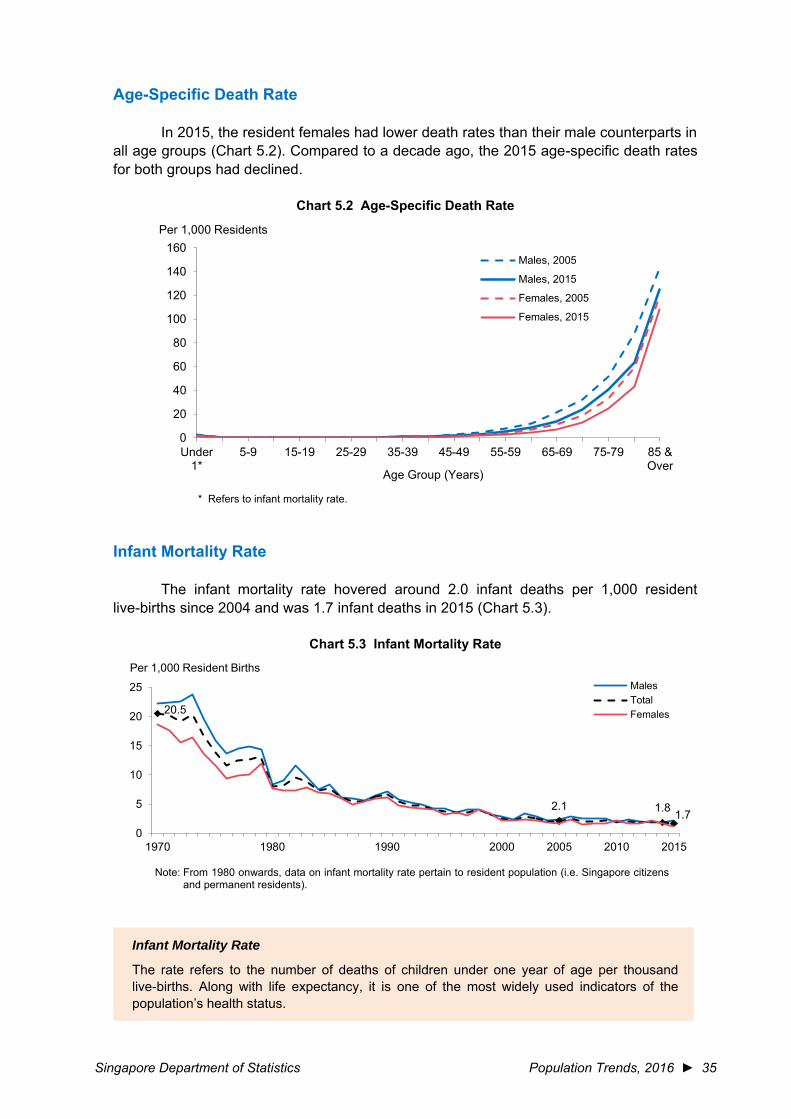
Age-Specific Death Rate
In 2015, the resident females had lower death rates than their male counterparts in all age groups (Chart 5.2). Compared to a decade ago, the 2015 age-specific death rates for both groups had declined.
Chart 5.2 Age-Specific Death Rate
* Refers to infant mortality rate.
Infant Mortality Rate
The infant mortality rate hovered around 2.0 infant deaths per 1,000 resident live-births since 2004 and was 1.7 infant deaths in 2015 (Chart 5.3).
Chart 5.3 Infant Mortality Rate
Note: From 1980 onwards, data on infant mortality rate pertain to resident population (i.e. Singapore citizens
and permanent residents).
0
20
40
60
80
100
120
140
160
Under1*
5-9 15-19 25-29 35-39 45-49 55-59 65-69 75-79 85 &Over
Males, 2005
Males, 2015
Females, 2005
Females, 2015
Per 1,000 Residents
Age Group (Years)
20.5
2.1 1.8 1.70
5
10
15
20
25
1970 1980 1990 2000 2005 2010 2015
MalesTotalFemales
Per 1,000 Resident Births
Infant Mortality Rate
The rate refers to the number of deaths of children under one year of age per thousand live-births. Along with life expectancy, it is one of the most widely used indicators of the population’s health status.
36 ◄ Population Trends, 2016 Singapore Department of Statistics
Life Expectancy
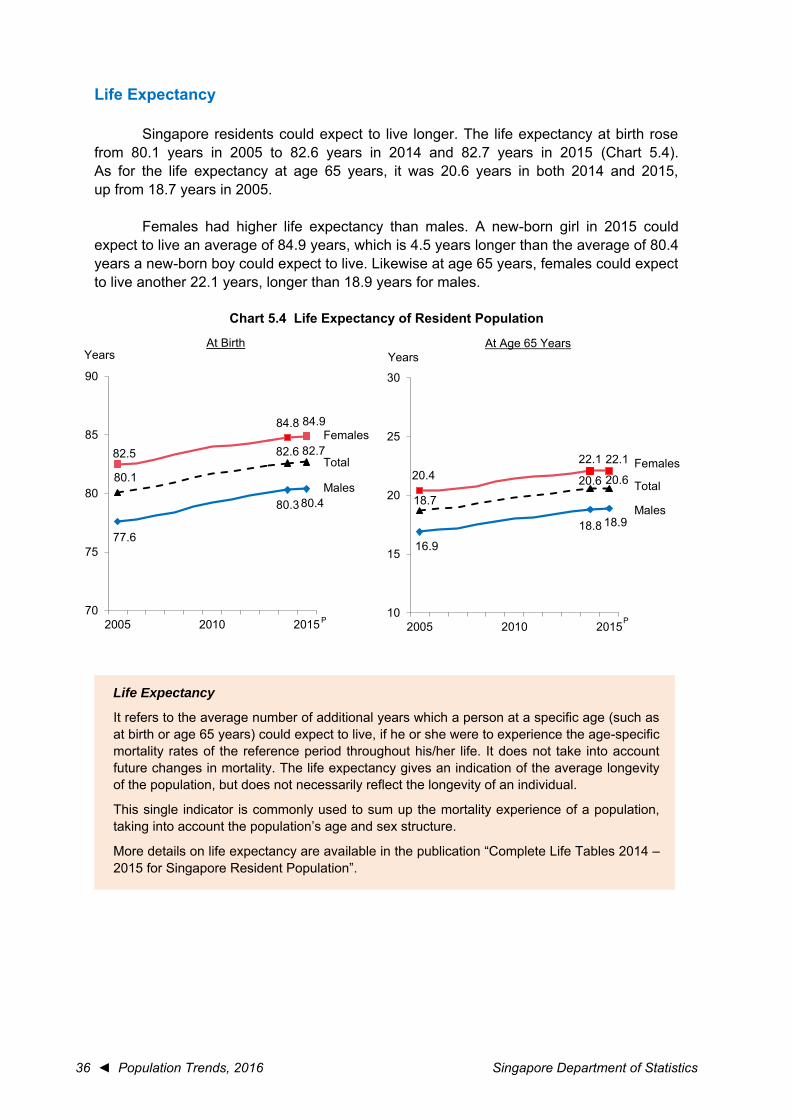
Singapore residents could expect to live longer. The life expectancy at birth rose from 80.1 years in 2005 to 82.6 years in 2014 and 82.7 years in 2015 (Chart 5.4). As for the life expectancy at age 65 years, it was 20.6 years in both 2014 and 2015, up from 18.7 years in 2005.
Females had higher life expectancy than males. A new-born girl in 2015 could expect to live an average of 84.9 years, which is 4.5 years longer than the average of 80.4 years a new-born boy could expect to live. Likewise at age 65 years, females could expect to live another 22.1 years, longer than 18.9 years for males.
Chart 5.4 Life Expectancy of Resident Population
80.1
82.6 82.7
77.6
80.3 80.4
82.5
84.8 84.9
70
75
80
85
90
2005 2010 2015
YearsAt Birth
Females
Total
Males
P
18.7
20.6 20.6
16.9
18.8 18.9
20.422.1 22.1
10
15
20
25
30
2005 2010 2015
YearsAt Age 65 Years
Females
Total
Males
P
Life Expectancy
It refers to the average number of additional years which a person at a specific age (such as at birth or age 65 years) could expect to live, if he or she were to experience the age-specific mortality rates of the reference period throughout his/her life. It does not take into account future changes in mortality. The life expectancy gives an indication of the average longevity of the population, but does not necessarily reflect the longevity of an individual.
This single indicator is commonly used to sum up the mortality experience of a population, taking into account the population’s age and sex structure.
More details on life expectancy are available in the publication “Complete Life Tables 2014 – 2015 for Singapore Resident Population”.
► 37
Statistical Appendices

Singapore Department of Statistics Population Trends, 2016 ► 39
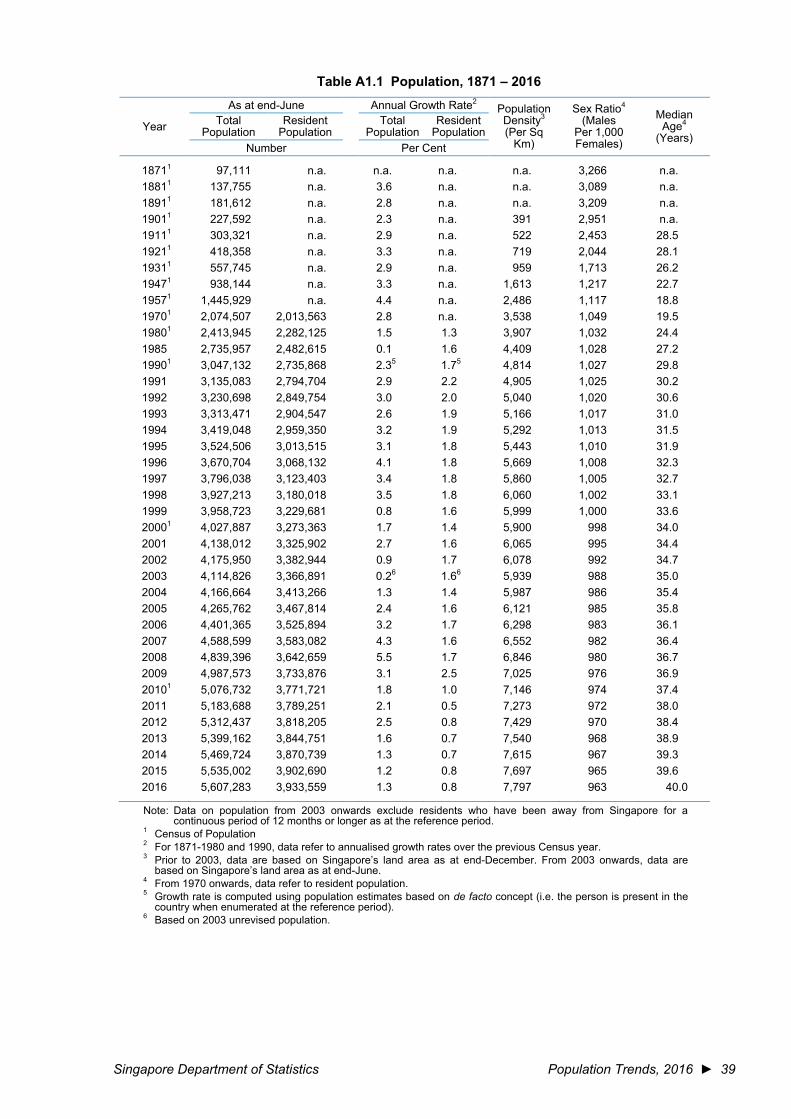
Table A1.1 Population, 1871 – 2016
Year
As at end-June Annual Growth Rate2 Population Density3 (Per Sq
Km)
Sex Ratio4 (Males
Per 1,000 Females)
Median Age4
(Years) Total
Population Resident
Population Total
Population Resident
Population Number Per Cent
18711 97,111 n.a. n.a. n.a. n.a. 3,266 n.a.18811 137,755 n.a. 3.6 n.a. n.a. 3,089 n.a.18911 181,612 n.a. 2.8 n.a. n.a. 3,209 n.a.19011 227,592 n.a. 2.3 n.a. 391 2,951 n.a.19111 303,321 n.a. 2.9 n.a. 522 2,453 28.5 19211 418,358 n.a. 3.3 n.a. 719 2,044 28.1 19311 557,745 n.a. 2.9 n.a. 959 1,713 26.2 19471 938,144 n.a. 3.3 n.a. 1,613 1,217 22.7 19571 1,445,929 n.a. 4.4 n.a. 2,486 1,117 18.8 19701 2,074,507 2,013,563 2.8 n.a. 3,538 1,049 19.5 19801 2,413,945 2,282,125 1.5 1.3 3,907 1,032 24.4 1985 2,735,957 2,482,615 0.1 1.6 4,409 1,028 27.2 19901 3,047,132 2,735,868 2.35 1.75 4,814 1,027 29.8 1991 3,135,083 2,794,704 2.9 2.2 4,905 1,025 30.2 1992 3,230,698 2,849,754 3.0 2.0 5,040 1,020 30.6 1993 3,313,471 2,904,547 2.6 1.9 5,166 1,017 31.0 1994 3,419,048 2,959,350 3.2 1.9 5,292 1,013 31.5 1995 3,524,506 3,013,515 3.1 1.8 5,443 1,010 31.9 1996 3,670,704 3,068,132 4.1 1.8 5,669 1,008 32.3 1997 3,796,038 3,123,403 3.4 1.8 5,860 1,005 32.7 1998 3,927,213 3,180,018 3.5 1.8 6,060 1,002 33.1 1999 3,958,723 3,229,681 0.8 1.6 5,999 1,000 33.6 20001 4,027,887 3,273,363 1.7 1.4 5,900 998 34.0 2001 4,138,012 3,325,902 2.7 1.6 6,065 995 34.4 2002 4,175,950 3,382,944 0.9 1.7 6,078 992 34.7 2003 4,114,826 3,366,891 0.26 1.66 5,939 988 35.0 2004 4,166,664 3,413,266 1.3 1.4 5,987 986 35.4 2005 4,265,762 3,467,814 2.4 1.6 6,121 985 35.8 2006 4,401,365 3,525,894 3.2 1.7 6,298 983 36.1 2007 4,588,599 3,583,082 4.3 1.6 6,552 982 36.4 2008 4,839,396 3,642,659 5.5 1.7 6,846 980 36.7 2009 4,987,573 3,733,876 3.1 2.5 7,025 976 36.9 20101 5,076,732 3,771,721 1.8 1.0 7,146 974 37.4 2011 5,183,688 3,789,251 2.1 0.5 7,273 972 38.0 2012 5,312,437 3,818,205 2.5 0.8 7,429 970 38.4 2013 5,399,162 3,844,751 1.6 0.7 7,540 968 38.9 2014 5,469,724 3,870,739 1.3 0.7 7,615 967 39.3 2015 5,535,002 3,902,690 1.2 0.8 7,697 965 39.6 2016 5,607,283 3,933,559 1.3 0.8 7,797 963 40.0
Note: Data on population from 2003 onwards exclude residents who have been away from Singapore for a continuous period of 12 months or longer as at the reference period.
1 Census of Population 2 For 1871-1980 and 1990, data refer to annualised growth rates over the previous Census year. 3 Prior to 2003, data are based on Singapore’s land area as at end-December. From 2003 onwards, data are
based on Singapore’s land area as at end-June. 4 From 1970 onwards, data refer to resident population. 5 Growth rate is computed using population estimates based on de facto concept (i.e. the person is present in the
country when enumerated at the reference period). 6 Based on 2003 unrevised population.
40 ◄ Population Trends, 2016 Singapore Department of Statistics
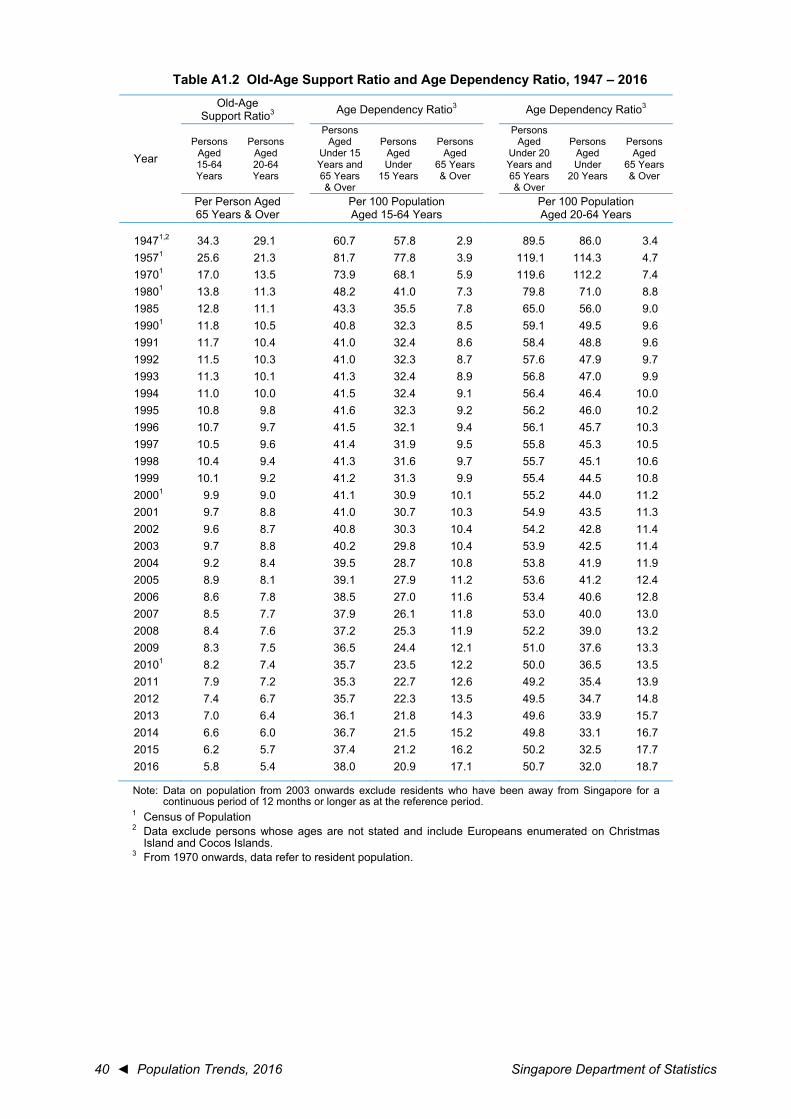
Table A1.2 Old-Age Support Ratio and Age Dependency Ratio, 1947 – 2016
Year
Old-Age Support Ratio3 Age Dependency Ratio3 Age Dependency Ratio3
Persons Aged 15-64Years
Persons Aged 20-64Years
Persons Aged
Under 15 Years and 65 Years & Over
Persons Aged Under
15 Years
Persons Aged
65 Years & Over
Persons Aged
Under 20 Years and 65 Years & Over
Persons Aged Under
20 Years
Persons Aged
65 Years & Over
Per Person Aged 65 Years & Over
Per 100 Population Aged 15-64 Years
Per 100 Population Aged 20-64 Years
19471,2 34.3 29.1 60.7 57.8 2.9 89.5 86.0 3.4 19571 25.6 21.3 81.7 77.8 3.9 119.1 114.3 4.7 19701 17.0 13.5 73.9 68.1 5.9 119.6 112.2 7.4 19801 13.8 11.3 48.2 41.0 7.3 79.8 71.0 8.8 1985 12.8 11.1 43.3 35.5 7.8 65.0 56.0 9.0 19901 11.8 10.5 40.8 32.3 8.5 59.1 49.5 9.6 1991 11.7 10.4 41.0 32.4 8.6 58.4 48.8 9.6 1992 11.5 10.3 41.0 32.3 8.7 57.6 47.9 9.7 1993 11.3 10.1 41.3 32.4 8.9 56.8 47.0 9.9 1994 11.0 10.0 41.5 32.4 9.1 56.4 46.4 10.0 1995 10.8 9.8 41.6 32.3 9.2 56.2 46.0 10.2 1996 10.7 9.7 41.5 32.1 9.4 56.1 45.7 10.3 1997 10.5 9.6 41.4 31.9 9.5 55.8 45.3 10.5 1998 10.4 9.4 41.3 31.6 9.7 55.7 45.1 10.6 1999 10.1 9.2 41.2 31.3 9.9 55.4 44.5 10.8 20001 9.9 9.0 41.1 30.9 10.1 55.2 44.0 11.2 2001 9.7 8.8 41.0 30.7 10.3 54.9 43.5 11.3 2002 9.6 8.7 40.8 30.3 10.4 54.2 42.8 11.4 2003 9.7 8.8 40.2 29.8 10.4 53.9 42.5 11.4 2004 9.2 8.4 39.5 28.7 10.8 53.8 41.9 11.9 2005 8.9 8.1 39.1 27.9 11.2 53.6 41.2 12.4 2006 8.6 7.8 38.5 27.0 11.6 53.4 40.6 12.8 2007 8.5 7.7 37.9 26.1 11.8 53.0 40.0 13.0 2008 8.4 7.6 37.2 25.3 11.9 52.2 39.0 13.2 2009 8.3 7.5 36.5 24.4 12.1 51.0 37.6 13.3 20101 8.2 7.4 35.7 23.5 12.2 50.0 36.5 13.5 2011 7.9 7.2 35.3 22.7 12.6 49.2 35.4 13.9 2012 7.4 6.7 35.7 22.3 13.5 49.5 34.7 14.8 2013 7.0 6.4 36.1 21.8 14.3 49.6 33.9 15.7 2014 6.6 6.0 36.7 21.5 15.2 49.8 33.1 16.7 2015 6.2 5.7 37.4 21.2 16.2 50.2 32.5 17.7 2016 5.8 5.4 38.0 20.9 17.1 50.7 32.0 18.7
Note: Data on population from 2003 onwards exclude residents who have been away from Singapore for a continuous period of 12 months or longer as at the reference period.
1 Census of Population 2 Data exclude persons whose ages are not stated and include Europeans enumerated on Christmas
Island and Cocos Islands. 3 From 1970 onwards, data refer to resident population.

Singapore D
epartment of S
tatistics P
opulation Trends, 2016 ► 41
Table A1.3 Singapore Residents by Age Group, Ethnic Group and Sex, June 2016 Number
Age Group (Years)
Total Chinese Malays Indians Others
Persons Males Females Persons Males Females Persons Males Females Persons Males Females Persons Males Females
Total 3,933,559 1,929,526 2,004,033 2,923,172 1,425,244 1,497,928 525,888 261,564 264,324 356,876 182,935 173,941 127,623 59,783 67,840
0 – 4 187,160 95,678 91,482 130,177 66,943 63,234 33,088 16,992 16,096 17,312 8,635 8,677 6,583 3,108 3,475
5 – 9 201,509 102,426 99,083 135,257 69,259 65,998 31,706 16,267 15,439 25,415 12,637 12,778 9,131 4,263 4,868
10 – 14 207,495 105,589 101,906 137,225 70,290 66,935 35,267 18,121 17,146 25,676 12,722 12,954 9,327 4,456 4,871
15 – 19 239,771 122,911 116,860 165,774 85,383 80,391 42,750 22,160 20,590 22,939 11,463 11,476 8,308 3,905 4,403
20 – 24 260,854 132,046 128,808 184,609 93,681 90,928 47,798 24,538 23,260 22,438 11,125 11,313 6,009 2,702 3,307
25 – 29 279,988 137,243 142,745 204,843 100,380 104,463 46,239 23,559 22,680 22,787 11,136 11,651 6,119 2,168 3,951
30 – 34 285,544 135,596 149,948 208,889 99,734 109,155 38,943 19,575 19,368 27,781 12,869 14,912 9,931 3,418 6,513
35 – 39 301,998 143,553 158,445 220,701 104,108 116,593 30,939 14,936 16,003 35,342 18,172 17,170 15,016 6,337 8,679
40 – 44 313,445 152,466 160,979 231,775 110,080 121,695 31,701 15,354 16,347 33,829 19,315 14,514 16,140 7,717 8,423
45 – 49 301,183 147,517 153,666 223,222 106,909 116,313 35,056 16,950 18,106 29,035 16,798 12,237 13,870 6,860 7,010
50 – 54 315,598 158,202 157,396 235,906 117,173 118,733 43,212 21,342 21,870 26,523 14,316 12,207 9,957 5,371 4,586
55 – 59 299,591 150,315 149,276 232,481 115,891 116,590 38,118 18,982 19,136 22,471 11,865 10,606 6,521 3,577 2,944
60 – 64 251,853 125,130 126,723 202,871 100,764 102,107 28,147 13,619 14,528 16,676 8,377 8,299 4,159 2,370 1,789
65 – 69 198,020 96,349 101,671 163,881 79,855 84,026 18,867 8,838 10,029 12,372 5,945 6,427 2,900 1,711 1,189
70 – 74 103,796 48,691 55,105 88,238 41,479 46,759 8,571 3,806 4,765 5,710 2,656 3,054 1,277 750 527
75 – 79 87,955 38,976 48,979 74,926 33,270 41,656 7,275 3,217 4,058 4,715 1,970 2,745 1,039 519 520
80 – 84 53,556 21,884 31,672 44,620 18,180 26,440 5,087 1,992 3,095 3,171 1,408 1,763 678 304 374
85 & Over 44,243 14,954 29,289 37,777 11,865 25,912 3,124 1,316 1,808 2,684 1,526 1,158 658 247 411

42 ◄ P
opulation Trends, 2016 S
ingapore Departm
ent of Statistics
Table A1.4 Singapore Residents by Age Group and Sex, June 1980 – June 2016 Number
Age Group (Years) 1980 1985 1990 1991 1992 1993 1994 1995 1996 1997 1998 1999
Total
Total 2,282,125 2,482,615 2,735,868 2,794,704 2,849,754 2,904,547 2,959,350 3,013,515 3,068,132 3,123,403 3,180,018 3,229,681 0 – 4 185,840 203,346 224,049 235,519 245,751 248,771 247,022 248,089 245,148 243,259 240,072 232,614 5 – 9 216,630 192,039 205,628 205,807 204,724 210,359 223,824 230,583 242,270 253,311 257,440 256,149
10 – 14 228,146 219,364 198,476 201,155 202,170 206,698 207,032 209,583 209,322 208,388 214,443 228,191 15 – 19 270,536 227,897 223,305 218,157 213,331 204,085 200,002 199,898 202,379 203,429 208,282 208,600 20 – 24 272,178 271,686 238,987 234,658 234,805 237,867 239,253 237,425 231,764 226,764 217,260 213,031 25 – 29 232,795 285,241 290,940 289,839 286,490 281,789 273,264 267,010 263,481 264,769 268,517 270,217 30 – 34 194,250 244,604 298,323 304,022 306,029 307,731 309,334 308,824 309,094 306,773 304,104 296,867 35 – 39 124,696 200,017 255,993 269,191 281,688 291,778 300,133 307,434 313,266 315,944 319,208 322,289 40 – 44 124,089 126,919 206,063 224,210 231,002 240,317 250,783 260,994 273,686 286,259 296,755 305,241 45 – 49 102,962 121,343 128,439 129,004 147,384 166,332 183,764 208,085 225,769 232,426 241,863 252,282 50 – 54 90,174 101,945 118,092 126,490 131,902 133,399 133,810 128,066 128,497 146,576 165,341 182,738 55 – 59 69,447 87,264 100,102 101,397 101,228 103,679 110,127 115,530 123,752 129,003 130,334 130,631 60 – 64 58,449 65,302 83,021 85,729 87,393 89,063 91,308 95,326 96,790 96,766 99,178 105,370
65 – 69 48,422 52,297 59,896 61,988 65,005 68,521 72,439 76,091 78,589 80,324 82,118 84,391 70 – 74 32,753 40,671 45,047 45,868 46,787 47,987 49,283 50,597 52,958 56,176 59,856 63,592 75 – 79 18,320 32,336 32,475 32,802 32,968 33,406 34,178 34,657 35,441 36,422 37,951 80 – 84 7,905 42,684* 17,526 18,856 20,031 20,950 21,460 21,689 21,751 21,859 22,095 22,345
85 & Over 4,533 9,645 10,339 11,231 12,252 13,107 14,116 14,957 15,936 16,731 17,182
* Data refer to age group 75 years & over.

Singapore D
epartment of S
tatistics P
opulation Trends, 2016 ► 43
Table A1.4 Singapore Residents by Age Group and Sex, June 1980 – June 2016 (cont’d) Number
Age Group (Years) 2000 2001 2002 2003 2004 2005 2006 2007 2008 2009
Total
Total 3,273,363 3,325,902 3,382,944 3,366,891 3,413,266 3,467,814 3,525,894 3,583,082 3,642,659 3,733,876 0 – 4 225,705 222,991 217,798 209,903 204,819 199,529 194,479 193,626 193,889 197,788 5 – 9 256,574 254,077 253,192 247,044 240,517 237,237 235,204 229,541 223,622 221,435
10 – 14 235,352 246,972 257,692 259,124 257,283 258,553 256,482 255,292 253,796 248,628 15 – 19 211,286 210,903 209,687 214,074 227,417 234,921 246,547 257,298 262,856 262,775 20 – 24 212,236 214,636 216,313 215,412 215,217 218,951 219,631 218,485 225,385 241,753 25 – 29 267,161 262,754 262,720 250,878 246,713 247,799 251,659 254,523 263,114 274,308 30 – 34 290,290 286,690 289,184 287,304 290,489 293,414 293,251 294,453 289,817 297,240 35 – 39 322,621 322,878 320,753 310,643 302,908 299,153 298,203 301,973 307,243 317,311 40 – 44 312,420 317,996 320,863 318,282 321,057 321,472 323,017 321,049 317,363 312,983 45 – 49 262,201 274,569 286,738 292,791 300,671 307,546 312,858 315,552 318,078 322,497 50 – 54 206,657 223,842 230,367 233,180 244,110 254,168 266,994 279,220 289,189 297,383 55 – 59 125,061 125,449 143,175 157,894 174,788 197,803 214,601 220,983 229,356 239,947 60 – 64 110,503 118,506 123,438 121,724 122,736 117,575 118,242 135,501 153,161 169,696
65 – 69 88,305 89,676 89,587 89,883 96,007 101,088 108,837 113,757 115,185 116,258 70 – 74 66,948 69,048 70,642 70,002 72,485 76,545 78,317 78,631 81,307 87,428 75 – 79 39,644 42,501 45,830 42,863 47,875 51,601 54,413 56,732 59,001 61,490 80 – 84 22,876 23,897 25,213 25,783 26,864 27,879 29,443 31,519 33,882 37,143
85 & Over 17,523 18,517 19,752 20,107 21,310 22,580 23,716 24,947 26,415 27,813
Note: Data from 2003 onwards exclude residents who have been away from Singapore for a continuous period of 12 months or longer as at the reference period.
44 ◄ P
opulation Trends, 2016 S
ingapore Departm
ent of Statistics
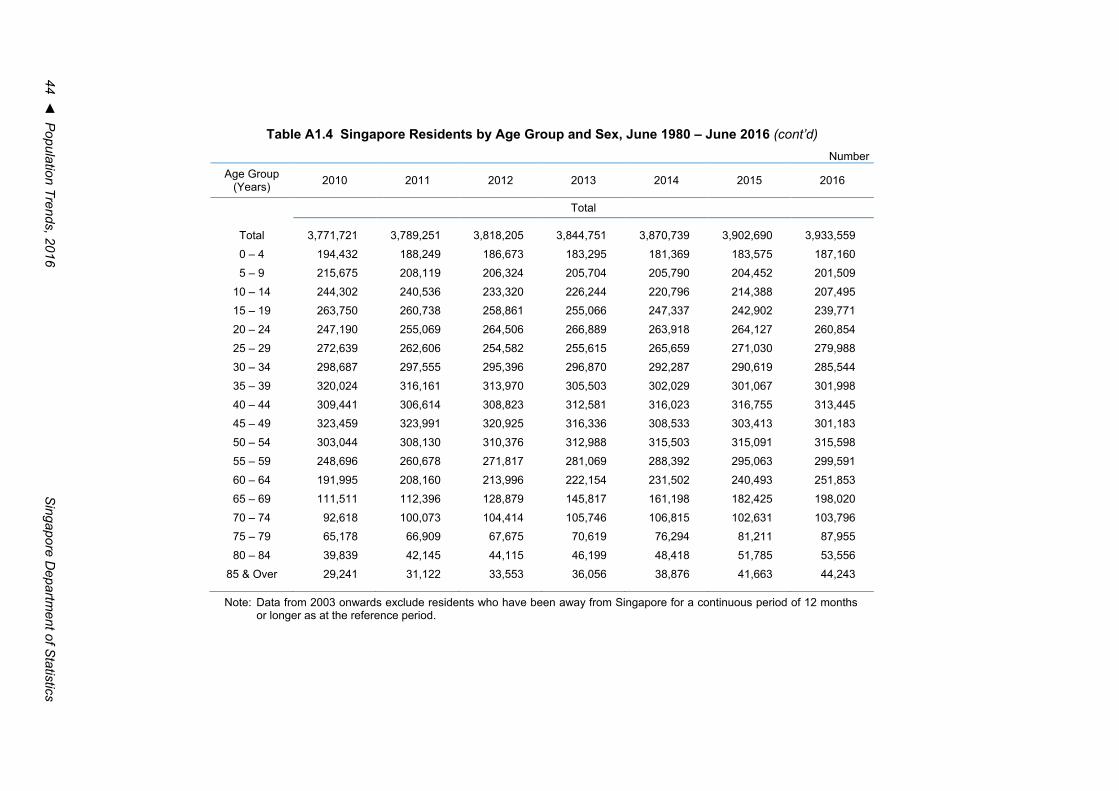
Table A1.4 Singapore Residents by Age Group and Sex, June 1980 – June 2016 (cont’d) Number
Age Group (Years) 2010 2011 2012 2013 2014 2015 2016
Total
Total 3,771,721 3,789,251 3,818,205 3,844,751 3,870,739 3,902,690 3,933,559 0 – 4 194,432 188,249 186,673 183,295 181,369 183,575 187,160 5 – 9 215,675 208,119 206,324 205,704 205,790 204,452 201,509
10 – 14 244,302 240,536 233,320 226,244 220,796 214,388 207,495 15 – 19 263,750 260,738 258,861 255,066 247,337 242,902 239,771 20 – 24 247,190 255,069 264,506 266,889 263,918 264,127 260,854 25 – 29 272,639 262,606 254,582 255,615 265,659 271,030 279,988 30 – 34 298,687 297,555 295,396 296,870 292,287 290,619 285,544 35 – 39 320,024 316,161 313,970 305,503 302,029 301,067 301,998 40 – 44 309,441 306,614 308,823 312,581 316,023 316,755 313,445 45 – 49 323,459 323,991 320,925 316,336 308,533 303,413 301,183 50 – 54 303,044 308,130 310,376 312,988 315,503 315,091 315,598 55 – 59 248,696 260,678 271,817 281,069 288,392 295,063 299,591
60 – 64 191,995 208,160 213,996 222,154 231,502 240,493 251,853 65 – 69 111,511 112,396 128,879 145,817 161,198 182,425 198,020 70 – 74 92,618 100,073 104,414 105,746 106,815 102,631 103,796 75 – 79 65,178 66,909 67,675 70,619 76,294 81,211 87,955 80 – 84 39,839 42,145 44,115 46,199 48,418 51,785 53,556
85 & Over 29,241 31,122 33,553 36,056 38,876 41,663 44,243
Note: Data from 2003 onwards exclude residents who have been away from Singapore for a continuous period of 12 months or longer as at the reference period.
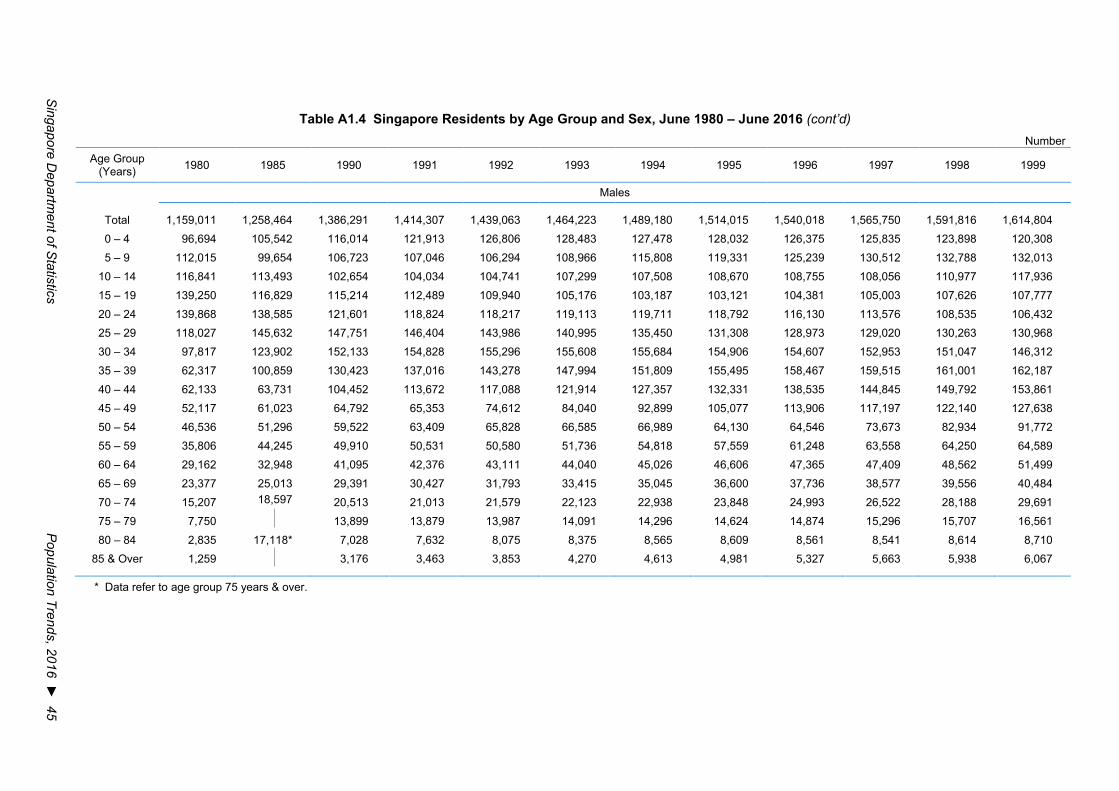
Singapore D
epartment of S
tatistics P
opulation Trends, 2016 ► 45
Table A1.4 Singapore Residents by Age Group and Sex, June 1980 – June 2016 (cont’d) Number
Age Group (Years) 1980 1985 1990 1991 1992 1993 1994 1995 1996 1997 1998 1999
Males
Total 1,159,011 1,258,464 1,386,291 1,414,307 1,439,063 1,464,223 1,489,180 1,514,015 1,540,018 1,565,750 1,591,816 1,614,804 0 – 4 96,694 105,542 116,014 121,913 126,806 128,483 127,478 128,032 126,375 125,835 123,898 120,308 5 – 9 112,015 99,654 106,723 107,046 106,294 108,966 115,808 119,331 125,239 130,512 132,788 132,013
10 – 14 116,841 113,493 102,654 104,034 104,741 107,299 107,508 108,670 108,755 108,056 110,977 117,936 15 – 19 139,250 116,829 115,214 112,489 109,940 105,176 103,187 103,121 104,381 105,003 107,626 107,777 20 – 24 139,868 138,585 121,601 118,824 118,217 119,113 119,711 118,792 116,130 113,576 108,535 106,432 25 – 29 118,027 145,632 147,751 146,404 143,986 140,995 135,450 131,308 128,973 129,020 130,263 130,968 30 – 34 97,817 123,902 152,133 154,828 155,296 155,608 155,684 154,906 154,607 152,953 151,047 146,312 35 – 39 62,317 100,859 130,423 137,016 143,278 147,994 151,809 155,495 158,467 159,515 161,001 162,187 40 – 44 62,133 63,731 104,452 113,672 117,088 121,914 127,357 132,331 138,535 144,845 149,792 153,861 45 – 49 52,117 61,023 64,792 65,353 74,612 84,040 92,899 105,077 113,906 117,197 122,140 127,638 50 – 54 46,536 51,296 59,522 63,409 65,828 66,585 66,989 64,130 64,546 73,673 82,934 91,772 55 – 59 35,806 44,245 49,910 50,531 50,580 51,736 54,818 57,559 61,248 63,558 64,250 64,589 60 – 64 29,162 32,948 41,095 42,376 43,111 44,040 45,026 46,606 47,365 47,409 48,562 51,499
65 – 69 23,377 25,013 29,391 30,427 31,793 33,415 35,045 36,600 37,736 38,577 39,556 40,484 70 – 74 15,207 18,597 20,513 21,013 21,579 22,123 22,938 23,848 24,993 26,522 28,188 29,691 75 – 79 7,750 13,899 13,879 13,987 14,091 14,296 14,624 14,874 15,296 15,707 16,561 80 – 84 2,835 17,118* 7,028 7,632 8,075 8,375 8,565 8,609 8,561 8,541 8,614 8,710
85 & Over 1,259 3,176 3,463 3,853 4,270 4,613 4,981 5,327 5,663 5,938 6,067
* Data refer to age group 75 years & over.
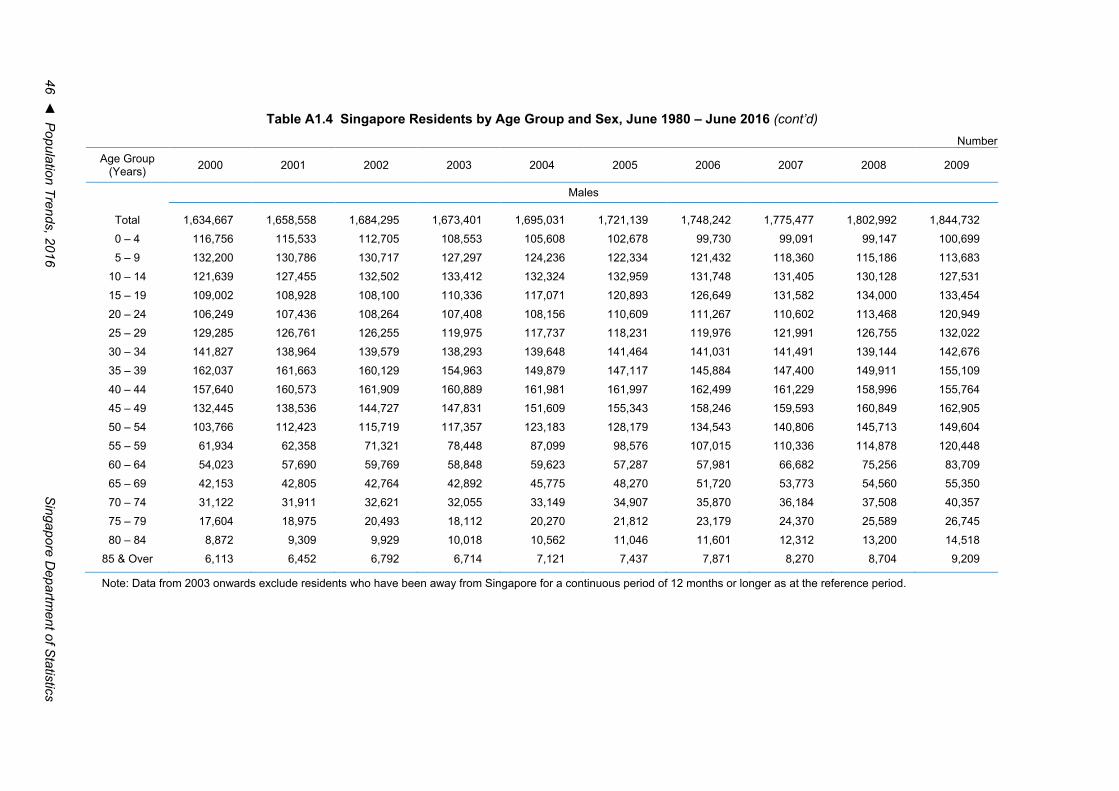
46 ◄ P
opulation Trends, 2016 S
ingapore Departm
ent of Statistics
Table A1.4 Singapore Residents by Age Group and Sex, June 1980 – June 2016 (cont’d) Number
Age Group (Years) 2000 2001 2002 2003 2004 2005 2006 2007 2008 2009
Males
Total 1,634,667 1,658,558 1,684,295 1,673,401 1,695,031 1,721,139 1,748,242 1,775,477 1,802,992 1,844,732 0 – 4 116,756 115,533 112,705 108,553 105,608 102,678 99,730 99,091 99,147 100,699 5 – 9 132,200 130,786 130,717 127,297 124,236 122,334 121,432 118,360 115,186 113,683
10 – 14 121,639 127,455 132,502 133,412 132,324 132,959 131,748 131,405 130,128 127,531 15 – 19 109,002 108,928 108,100 110,336 117,071 120,893 126,649 131,582 134,000 133,454 20 – 24 106,249 107,436 108,264 107,408 108,156 110,609 111,267 110,602 113,468 120,949 25 – 29 129,285 126,761 126,255 119,975 117,737 118,231 119,976 121,991 126,755 132,022 30 – 34 141,827 138,964 139,579 138,293 139,648 141,464 141,031 141,491 139,144 142,676 35 – 39 162,037 161,663 160,129 154,963 149,879 147,117 145,884 147,400 149,911 155,109 40 – 44 157,640 160,573 161,909 160,889 161,981 161,997 162,499 161,229 158,996 155,764 45 – 49 132,445 138,536 144,727 147,831 151,609 155,343 158,246 159,593 160,849 162,905 50 – 54 103,766 112,423 115,719 117,357 123,183 128,179 134,543 140,806 145,713 149,604 55 – 59 61,934 62,358 71,321 78,448 87,099 98,576 107,015 110,336 114,878 120,448 60 – 64 54,023 57,690 59,769 58,848 59,623 57,287 57,981 66,682 75,256 83,709
65 – 69 42,153 42,805 42,764 42,892 45,775 48,270 51,720 53,773 54,560 55,350 70 – 74 31,122 31,911 32,621 32,055 33,149 34,907 35,870 36,184 37,508 40,357 75 – 79 17,604 18,975 20,493 18,112 20,270 21,812 23,179 24,370 25,589 26,745 80 – 84 8,872 9,309 9,929 10,018 10,562 11,046 11,601 12,312 13,200 14,518
85 & Over 6,113 6,452 6,792 6,714 7,121 7,437 7,871 8,270 8,704 9,209
Note: Data from 2003 onwards exclude residents who have been away from Singapore for a continuous period of 12 months or longer as at the reference period.
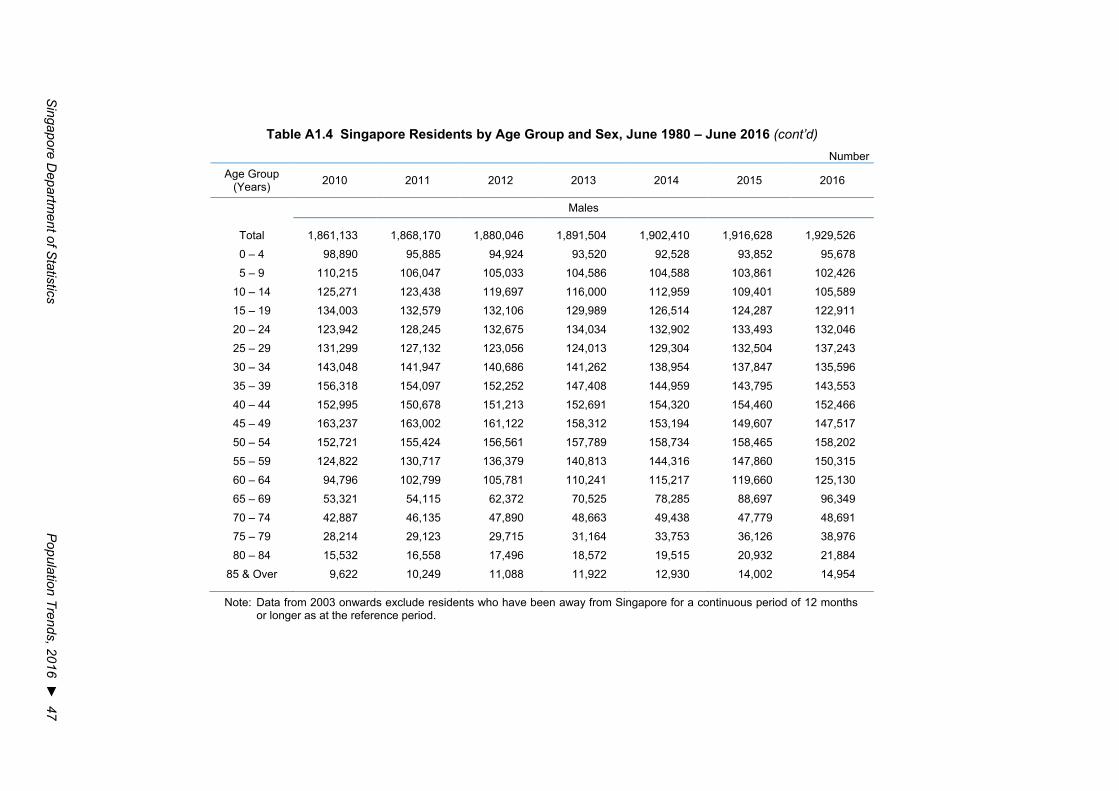
Singapore D
epartment of S
tatistics P
opulation Trends, 2016 ► 47
Table A1.4 Singapore Residents by Age Group and Sex, June 1980 – June 2016 (cont’d) Number
Age Group (Years) 2010 2011 2012 2013 2014 2015 2016
Males
Total 1,861,133 1,868,170 1,880,046 1,891,504 1,902,410 1,916,628 1,929,526 0 – 4 98,890 95,885 94,924 93,520 92,528 93,852 95,678 5 – 9 110,215 106,047 105,033 104,586 104,588 103,861 102,426
10 – 14 125,271 123,438 119,697 116,000 112,959 109,401 105,589 15 – 19 134,003 132,579 132,106 129,989 126,514 124,287 122,911 20 – 24 123,942 128,245 132,675 134,034 132,902 133,493 132,046 25 – 29 131,299 127,132 123,056 124,013 129,304 132,504 137,243 30 – 34 143,048 141,947 140,686 141,262 138,954 137,847 135,596 35 – 39 156,318 154,097 152,252 147,408 144,959 143,795 143,553 40 – 44 152,995 150,678 151,213 152,691 154,320 154,460 152,466 45 – 49 163,237 163,002 161,122 158,312 153,194 149,607 147,517 50 – 54 152,721 155,424 156,561 157,789 158,734 158,465 158,202 55 – 59 124,822 130,717 136,379 140,813 144,316 147,860 150,315
60 – 64 94,796 102,799 105,781 110,241 115,217 119,660 125,130 65 – 69 53,321 54,115 62,372 70,525 78,285 88,697 96,349 70 – 74 42,887 46,135 47,890 48,663 49,438 47,779 48,691 75 – 79 28,214 29,123 29,715 31,164 33,753 36,126 38,976 80 – 84 15,532 16,558 17,496 18,572 19,515 20,932 21,884
85 & Over 9,622 10,249 11,088 11,922 12,930 14,002 14,954
Note: Data from 2003 onwards exclude residents who have been away from Singapore for a continuous period of 12 months or longer as at the reference period.

48 ◄ P
opulation Trends, 2016 S
ingapore Departm
ent of Statistics
Table A1.4 Singapore Residents by Age Group and Sex, June 1980 – June 2016 (cont’d) Number
Age Group (Years) 1980 1985 1990 1991 1992 1993 1994 1995 1996 1997 1998 1999
Females
Total 1,123,114 1,224,150 1,349,577 1,380,397 1,410,691 1,440,324 1,470,171 1,499,500 1,528,113 1,557,653 1,588,202 1,614,877 0 – 4 89,146 97,803 108,035 113,605 118,945 120,288 119,544 120,057 118,773 117,424 116,174 112,306 5 – 9 104,615 92,386 98,905 98,761 98,430 101,393 108,016 111,252 117,031 122,799 124,652 124,136
10 – 14 111,305 105,871 95,822 97,121 97,429 99,399 99,524 100,914 100,567 100,332 103,466 110,255 15 – 19 131,286 111,068 108,091 105,668 103,391 98,909 96,815 96,777 97,998 98,426 100,655 100,823 20 – 24 132,310 133,101 117,386 115,835 116,588 118,754 119,541 118,633 115,634 113,188 108,725 106,600 25 – 29 114,768 139,609 143,189 143,436 142,504 140,794 137,814 135,702 134,508 135,749 138,254 139,249 30 – 34 96,433 120,702 146,190 149,194 150,733 152,122 153,650 153,919 154,488 153,820 153,056 150,555 35 – 39 62,379 99,158 125,570 132,175 138,410 143,785 148,324 151,939 154,799 156,429 158,207 160,102 40 – 44 61,956 63,188 101,611 110,538 113,914 118,404 123,426 128,663 135,151 141,414 146,963 151,380 45 – 49 50,845 60,320 63,647 63,651 72,772 82,292 90,865 103,009 111,862 115,228 119,723 124,644 50 – 54 43,638 50,649 58,570 63,081 66,074 66,814 66,821 63,936 63,951 72,903 82,406 90,966 55 – 59 33,641 43,019 50,192 50,866 50,648 51,944 55,309 57,972 62,504 65,445 66,084 66,042 60 – 64 29,287 32,354 41,926 43,353 44,282 45,023 46,282 48,721 49,426 49,357 50,617 53,871
65 – 69 25,045 27,284 30,505 31,561 33,212 35,106 37,394 39,491 40,853 41,748 42,562 43,907 70 – 74 17,546 22,075 24,534 24,855 25,208 25,865 26,345 26,749 27,965 29,654 31,669 33,901 75 – 79 10,570 18,437 18,597 18,815 18,877 19,110 19,554 19,783 20,145 20,716 21,390 80 – 84 5,070 25,566* 10,498 11,225 11,956 12,575 12,895 13,080 13,189 13,318 13,481 13,635
85 & Over 3,274 6,469 6,876 7,378 7,982 8,494 9,136 9,630 10,273 10,792 11,115
* Data refer to age group 75 years & over.
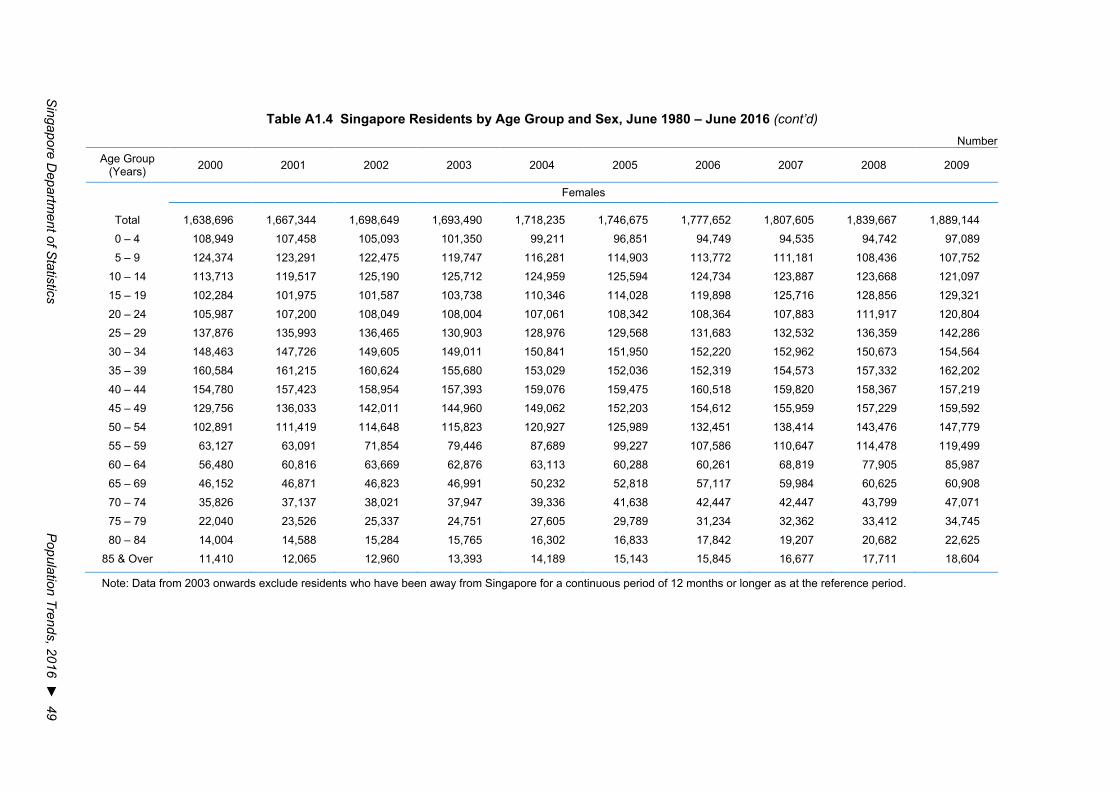
Singapore D
epartment of S
tatistics P
opulation Trends, 2016 ► 49
Table A1.4 Singapore Residents by Age Group and Sex, June 1980 – June 2016 (cont’d) Number
Age Group (Years) 2000 2001 2002 2003 2004 2005 2006 2007 2008 2009
Females
Total 1,638,696 1,667,344 1,698,649 1,693,490 1,718,235 1,746,675 1,777,652 1,807,605 1,839,667 1,889,144 0 – 4 108,949 107,458 105,093 101,350 99,211 96,851 94,749 94,535 94,742 97,089 5 – 9 124,374 123,291 122,475 119,747 116,281 114,903 113,772 111,181 108,436 107,752
10 – 14 113,713 119,517 125,190 125,712 124,959 125,594 124,734 123,887 123,668 121,097 15 – 19 102,284 101,975 101,587 103,738 110,346 114,028 119,898 125,716 128,856 129,321 20 – 24 105,987 107,200 108,049 108,004 107,061 108,342 108,364 107,883 111,917 120,804 25 – 29 137,876 135,993 136,465 130,903 128,976 129,568 131,683 132,532 136,359 142,286 30 – 34 148,463 147,726 149,605 149,011 150,841 151,950 152,220 152,962 150,673 154,564 35 – 39 160,584 161,215 160,624 155,680 153,029 152,036 152,319 154,573 157,332 162,202 40 – 44 154,780 157,423 158,954 157,393 159,076 159,475 160,518 159,820 158,367 157,219 45 – 49 129,756 136,033 142,011 144,960 149,062 152,203 154,612 155,959 157,229 159,592 50 – 54 102,891 111,419 114,648 115,823 120,927 125,989 132,451 138,414 143,476 147,779 55 – 59 63,127 63,091 71,854 79,446 87,689 99,227 107,586 110,647 114,478 119,499 60 – 64 56,480 60,816 63,669 62,876 63,113 60,288 60,261 68,819 77,905 85,987
65 – 69 46,152 46,871 46,823 46,991 50,232 52,818 57,117 59,984 60,625 60,908 70 – 74 35,826 37,137 38,021 37,947 39,336 41,638 42,447 42,447 43,799 47,071 75 – 79 22,040 23,526 25,337 24,751 27,605 29,789 31,234 32,362 33,412 34,745 80 – 84 14,004 14,588 15,284 15,765 16,302 16,833 17,842 19,207 20,682 22,625
85 & Over 11,410 12,065 12,960 13,393 14,189 15,143 15,845 16,677 17,711 18,604
Note: Data from 2003 onwards exclude residents who have been away from Singapore for a continuous period of 12 months or longer as at the reference period.

50 ◄ P
opulation Trends, 2016 S
ingapore Departm
ent of Statistics
Table A1.4 Singapore Residents by Age Group and Sex, June 1980 – June 2016 (cont’d) Number
Age Group (Years) 2010 2011 2012 2013 2014 2015 2016
Females
Total 1,910,588 1,921,081 1,938,159 1,953,247 1,968,329 1,986,062 2,004,033 0 – 4 95,542 92,364 91,749 89,775 88,841 89,723 91,482 5 – 9 105,460 102,072 101,291 101,118 101,202 100,591 99,083
10 – 14 119,031 117,098 113,623 110,244 107,837 104,987 101,906 15 – 19 129,747 128,159 126,755 125,077 120,823 118,615 116,860 20 – 24 123,248 126,824 131,831 132,855 131,016 130,634 128,808 25 – 29 141,340 135,474 131,526 131,602 136,355 138,526 142,745 30 – 34 155,639 155,608 154,710 155,608 153,333 152,772 149,948 35 – 39 163,706 162,064 161,718 158,095 157,070 157,272 158,445 40 – 44 156,446 155,936 157,610 159,890 161,703 162,295 160,979 45 – 49 160,222 160,989 159,803 158,024 155,339 153,806 153,666 50 – 54 150,323 152,706 153,815 155,199 156,769 156,626 157,396 55 – 59 123,874 129,961 135,438 140,256 144,076 147,203 149,276
60 – 64 97,199 105,361 108,215 111,913 116,285 120,833 126,723 65 – 69 58,190 58,281 66,507 75,292 82,913 93,728 101,671 70 – 74 49,731 53,938 56,524 57,083 57,377 54,852 55,105 75 – 79 36,964 37,786 37,960 39,455 42,541 45,085 48,979 80 – 84 24,307 25,587 26,619 27,627 28,903 30,853 31,672
85 & Over 19,619 20,873 22,465 24,134 25,946 27,661 29,289
Note: Data from 2003 onwards exclude residents who have been away from Singapore for a continuous period of 12 months or longer as at the reference period.
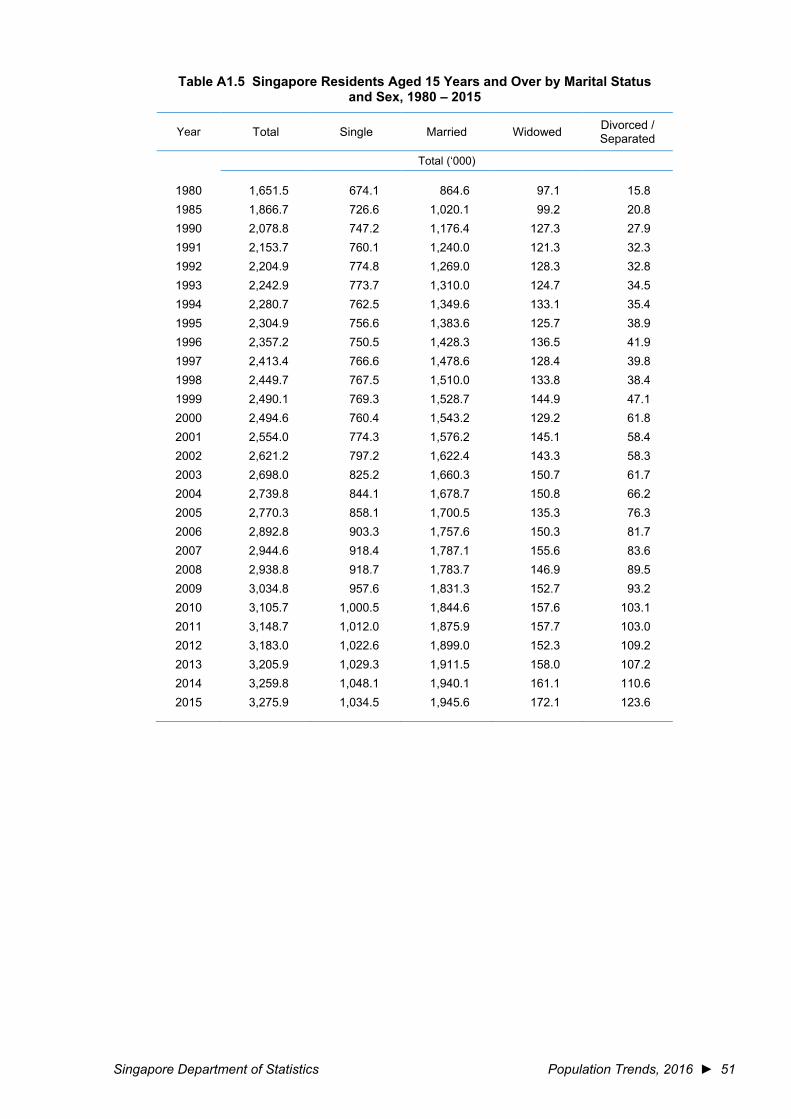
Singapore Department of Statistics Population Trends, 2016 ► 51
Table A1.5 Singapore Residents Aged 15 Years and Over by Marital Status and Sex, 1980 – 2015
Year Total Single Married Widowed Divorced / Separated
Total (‘000)
1980 1,651.5 674.1 864.6 97.1 15.8 1985 1,866.7 726.6 1,020.1 99.2 20.8 1990 2,078.8 747.2 1,176.4 127.3 27.9 1991 2,153.7 760.1 1,240.0 121.3 32.3 1992 2,204.9 774.8 1,269.0 128.3 32.8 1993 2,242.9 773.7 1,310.0 124.7 34.5 1994 2,280.7 762.5 1,349.6 133.1 35.4 1995 2,304.9 756.6 1,383.6 125.7 38.9 1996 2,357.2 750.5 1,428.3 136.5 41.9 1997 2,413.4 766.6 1,478.6 128.4 39.8 1998 2,449.7 767.5 1,510.0 133.8 38.4 1999 2,490.1 769.3 1,528.7 144.9 47.1 2000 2,494.6 760.4 1,543.2 129.2 61.8 2001 2,554.0 774.3 1,576.2 145.1 58.4 2002 2,621.2 797.2 1,622.4 143.3 58.3 2003 2,698.0 825.2 1,660.3 150.7 61.7 2004 2,739.8 844.1 1,678.7 150.8 66.2 2005 2,770.3 858.1 1,700.5 135.3 76.3 2006 2,892.8 903.3 1,757.6 150.3 81.7 2007 2,944.6 918.4 1,787.1 155.6 83.6 2008 2,938.8 918.7 1,783.7 146.9 89.5 2009 3,034.8 957.6 1,831.3 152.7 93.2 2010 3,105.7 1,000.5 1,844.6 157.6 103.1 2011 3,148.7 1,012.0 1,875.9 157.7 103.0 2012 3,183.0 1,022.6 1,899.0 152.3 109.2 2013 3,205.9 1,029.3 1,911.5 158.0 107.2 2014 3,259.8 1,048.1 1,940.1 161.1 110.6 2015 3,275.9 1,034.5 1,945.6 172.1 123.6
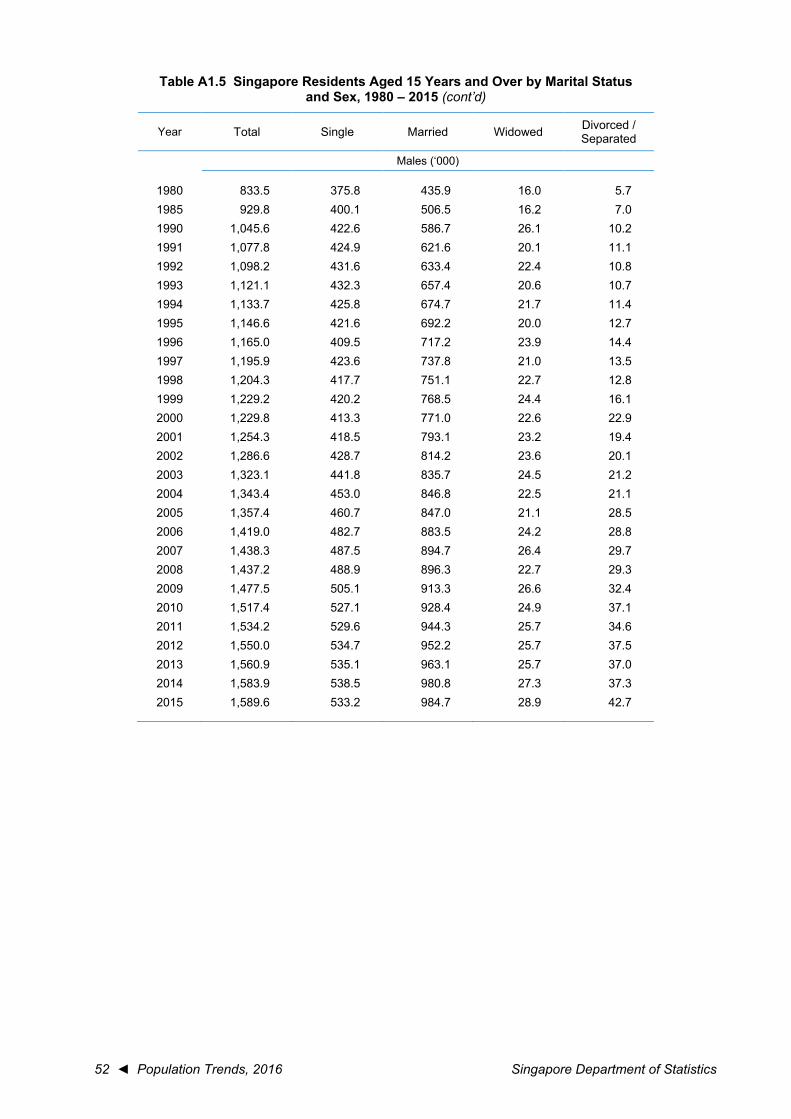
52 ◄ Population Trends, 2016 Singapore Department of Statistics
Table A1.5 Singapore Residents Aged 15 Years and Over by Marital Status and Sex, 1980 – 2015 (cont’d)
Year Total Single Married Widowed Divorced / Separated
Males (‘000)
1980 833.5 375.8 435.9 16.0 5.7 1985 929.8 400.1 506.5 16.2 7.0 1990 1,045.6 422.6 586.7 26.1 10.2 1991 1,077.8 424.9 621.6 20.1 11.1 1992 1,098.2 431.6 633.4 22.4 10.8 1993 1,121.1 432.3 657.4 20.6 10.7 1994 1,133.7 425.8 674.7 21.7 11.4 1995 1,146.6 421.6 692.2 20.0 12.7 1996 1,165.0 409.5 717.2 23.9 14.4 1997 1,195.9 423.6 737.8 21.0 13.5 1998 1,204.3 417.7 751.1 22.7 12.8 1999 1,229.2 420.2 768.5 24.4 16.1 2000 1,229.8 413.3 771.0 22.6 22.9 2001 1,254.3 418.5 793.1 23.2 19.4 2002 1,286.6 428.7 814.2 23.6 20.1 2003 1,323.1 441.8 835.7 24.5 21.2 2004 1,343.4 453.0 846.8 22.5 21.1 2005 1,357.4 460.7 847.0 21.1 28.5 2006 1,419.0 482.7 883.5 24.2 28.8 2007 1,438.3 487.5 894.7 26.4 29.7 2008 1,437.2 488.9 896.3 22.7 29.3 2009 1,477.5 505.1 913.3 26.6 32.4 2010 1,517.4 527.1 928.4 24.9 37.1 2011 1,534.2 529.6 944.3 25.7 34.6 2012 1,550.0 534.7 952.2 25.7 37.5 2013 1,560.9 535.1 963.1 25.7 37.0 2014 1,583.9 538.5 980.8 27.3 37.3 2015 1,589.6 533.2 984.7 28.9 42.7
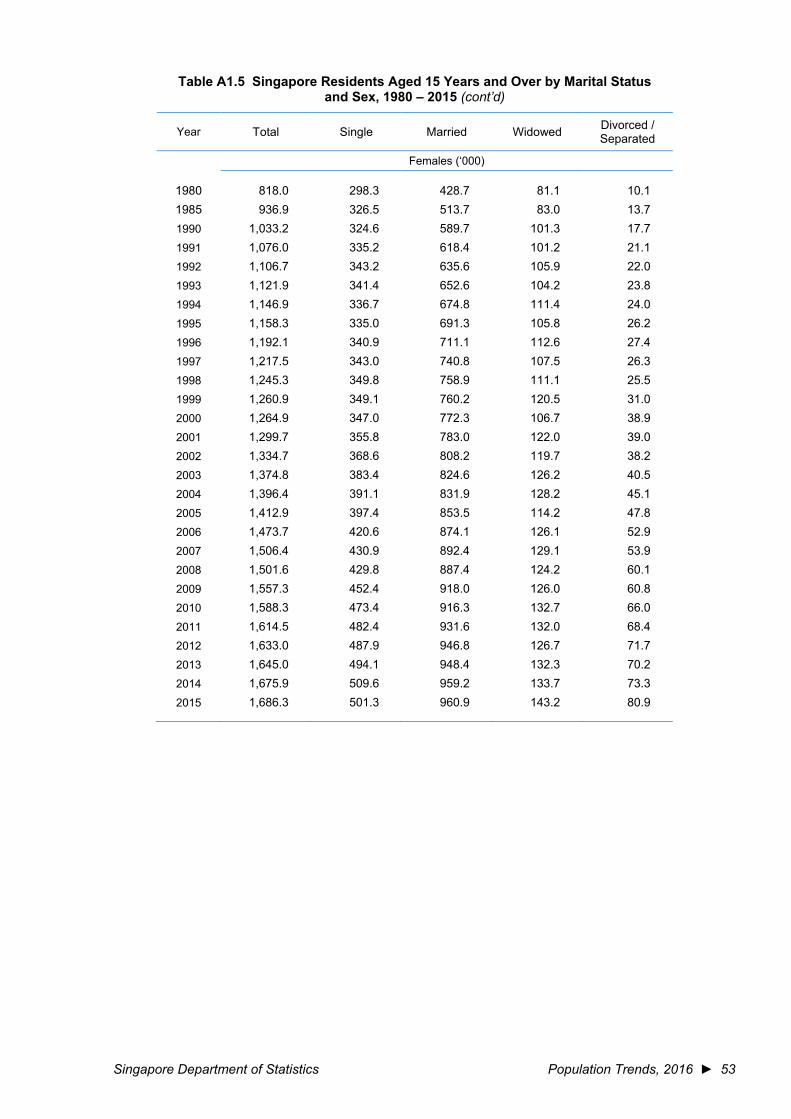
Singapore Department of Statistics Population Trends, 2016 ► 53
Table A1.5 Singapore Residents Aged 15 Years and Over by Marital Status and Sex, 1980 – 2015 (cont’d)
Year Total Single Married Widowed Divorced / Separated
Females (‘000)
1980 818.0 298.3 428.7 81.1 10.1 1985 936.9 326.5 513.7 83.0 13.7 1990 1,033.2 324.6 589.7 101.3 17.7
1991 1,076.0 335.2 618.4 101.2 21.1
1992 1,106.7 343.2 635.6 105.9 22.0
1993 1,121.9 341.4 652.6 104.2 23.8
1994 1,146.9 336.7 674.8 111.4 24.0
1995 1,158.3 335.0 691.3 105.8 26.2
1996 1,192.1 340.9 711.1 112.6 27.4
1997 1,217.5 343.0 740.8 107.5 26.3
1998 1,245.3 349.8 758.9 111.1 25.5
1999 1,260.9 349.1 760.2 120.5 31.0
2000 1,264.9 347.0 772.3 106.7 38.9
2001 1,299.7 355.8 783.0 122.0 39.0
2002 1,334.7 368.6 808.2 119.7 38.2
2003 1,374.8 383.4 824.6 126.2 40.5
2004 1,396.4 391.1 831.9 128.2 45.1
2005 1,412.9 397.4 853.5 114.2 47.8
2006 1,473.7 420.6 874.1 126.1 52.9
2007 1,506.4 430.9 892.4 129.1 53.9
2008 1,501.6 429.8 887.4 124.2 60.1
2009 1,557.3 452.4 918.0 126.0 60.8
2010 1,588.3 473.4 916.3 132.7 66.0
2011 1,614.5 482.4 931.6 132.0 68.4
2012 1,633.0 487.9 946.8 126.7 71.7
2013 1,645.0 494.1 948.4 132.3 70.2
2014 1,675.9 509.6 959.2 133.7 73.3
2015 1,686.3 501.3 960.9 143.2 80.9
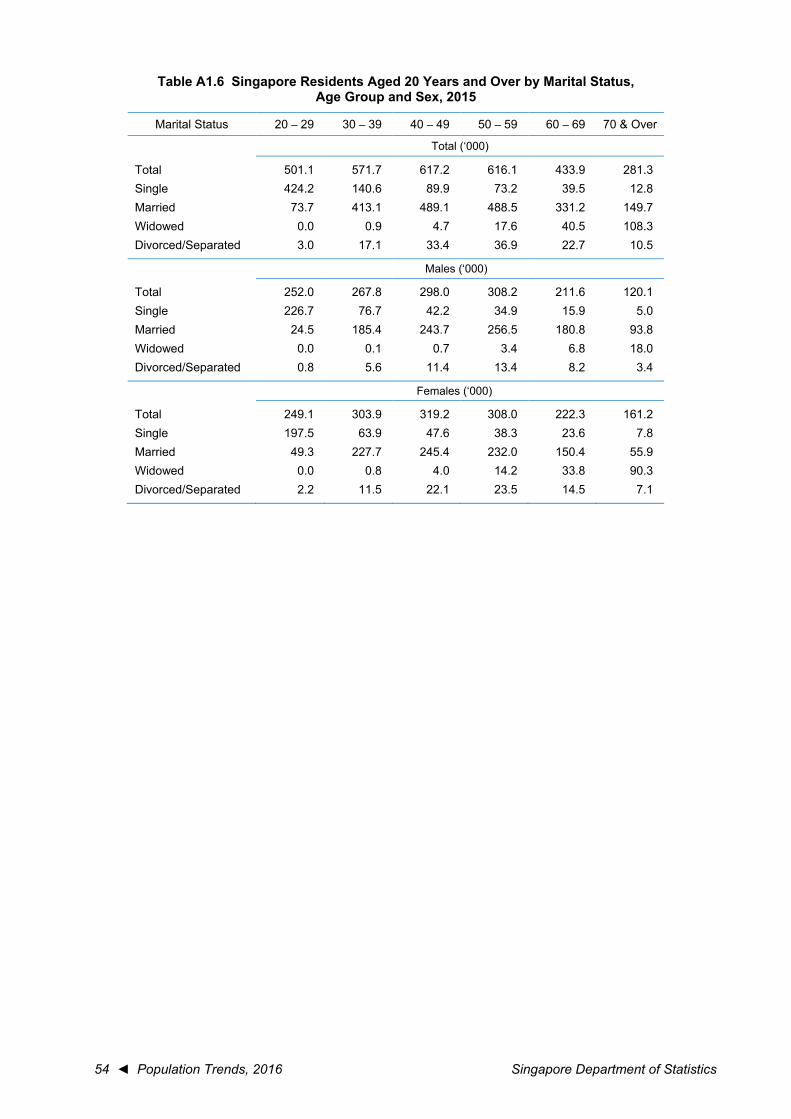
54 ◄ Population Trends, 2016 Singapore Department of Statistics
Table A1.6 Singapore Residents Aged 20 Years and Over by Marital Status, Age Group and Sex, 2015
Marital Status 20 – 29 30 – 39 40 – 49 50 – 59 60 – 69 70 & Over
Total (‘000)
Total 501.1 571.7 617.2 616.1 433.9 281.3 Single 424.2 140.6 89.9 73.2 39.5 12.8 Married 73.7 413.1 489.1 488.5 331.2 149.7 Widowed 0.0 0.9 4.7 17.6 40.5 108.3 Divorced/Separated 3.0 17.1 33.4 36.9 22.7 10.5
Males (‘000)
Total 252.0 267.8 298.0 308.2 211.6 120.1 Single 226.7 76.7 42.2 34.9 15.9 5.0 Married 24.5 185.4 243.7 256.5 180.8 93.8 Widowed 0.0 0.1 0.7 3.4 6.8 18.0 Divorced/Separated 0.8 5.6 11.4 13.4 8.2 3.4
Females (‘000)
Total 249.1 303.9 319.2 308.0 222.3 161.2 Single 197.5 63.9 47.6 38.3 23.6 7.8 Married 49.3 227.7 245.4 232.0 150.4 55.9 Widowed 0.0 0.8 4.0 14.2 33.8 90.3 Divorced/Separated 2.2 11.5 22.1 23.5 14.5 7.1
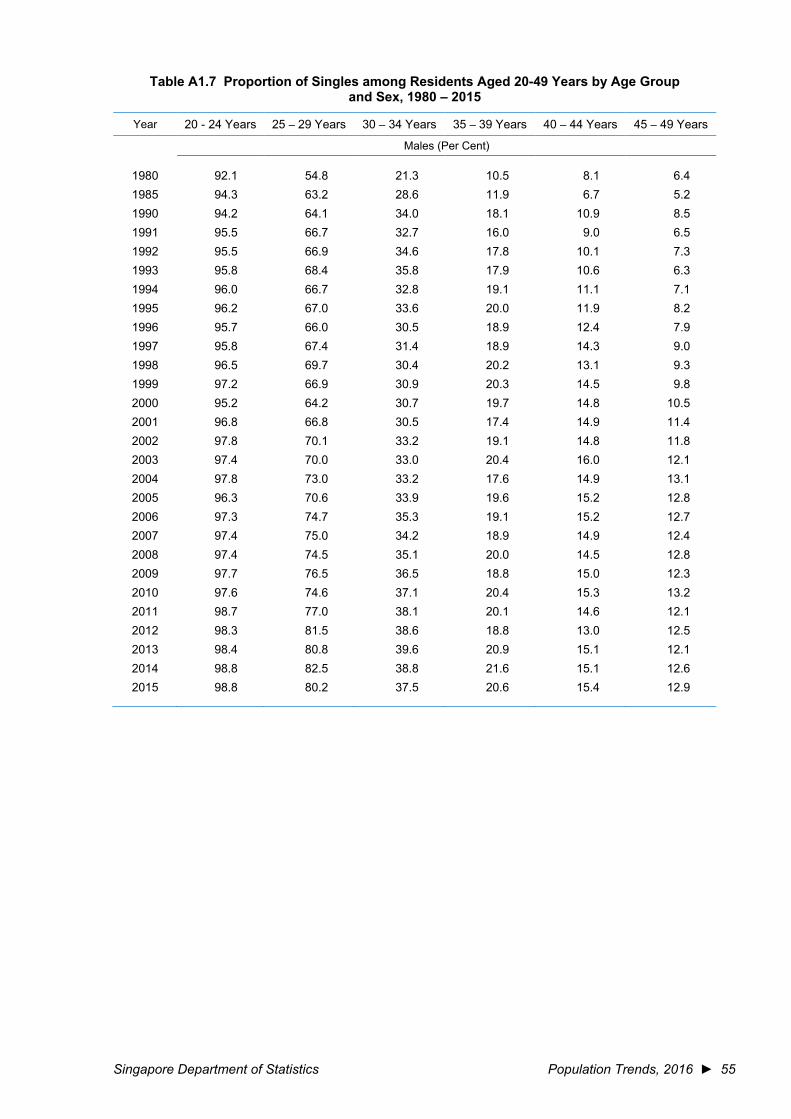
Singapore Department of Statistics Population Trends, 2016 ► 55
Table A1.7 Proportion of Singles among Residents Aged 20-49 Years by Age Group and Sex, 1980 – 2015
Year 20 - 24 Years 25 – 29 Years 30 – 34 Years 35 – 39 Years 40 – 44 Years 45 – 49 Years
Males (Per Cent)
1980 92.1 54.8 21.3 10.5 8.1 6.4 1985 94.3 63.2 28.6 11.9 6.7 5.2 1990 94.2 64.1 34.0 18.1 10.9 8.5 1991 95.5 66.7 32.7 16.0 9.0 6.5 1992 95.5 66.9 34.6 17.8 10.1 7.3 1993 95.8 68.4 35.8 17.9 10.6 6.3 1994 96.0 66.7 32.8 19.1 11.1 7.1 1995 96.2 67.0 33.6 20.0 11.9 8.2 1996 95.7 66.0 30.5 18.9 12.4 7.9 1997 95.8 67.4 31.4 18.9 14.3 9.0 1998 96.5 69.7 30.4 20.2 13.1 9.3 1999 97.2 66.9 30.9 20.3 14.5 9.8 2000 95.2 64.2 30.7 19.7 14.8 10.5 2001 96.8 66.8 30.5 17.4 14.9 11.4 2002 97.8 70.1 33.2 19.1 14.8 11.8 2003 97.4 70.0 33.0 20.4 16.0 12.1 2004 97.8 73.0 33.2 17.6 14.9 13.1 2005 96.3 70.6 33.9 19.6 15.2 12.8 2006 97.3 74.7 35.3 19.1 15.2 12.7 2007 97.4 75.0 34.2 18.9 14.9 12.4 2008 97.4 74.5 35.1 20.0 14.5 12.8 2009 97.7 76.5 36.5 18.8 15.0 12.3 2010 97.6 74.6 37.1 20.4 15.3 13.2 2011 98.7 77.0 38.1 20.1 14.6 12.1 2012 98.3 81.5 38.6 18.8 13.0 12.5 2013 98.4 80.8 39.6 20.9 15.1 12.1 2014 98.8 82.5 38.8 21.6 15.1 12.6 2015 98.8 80.2 37.5 20.6 15.4 12.9
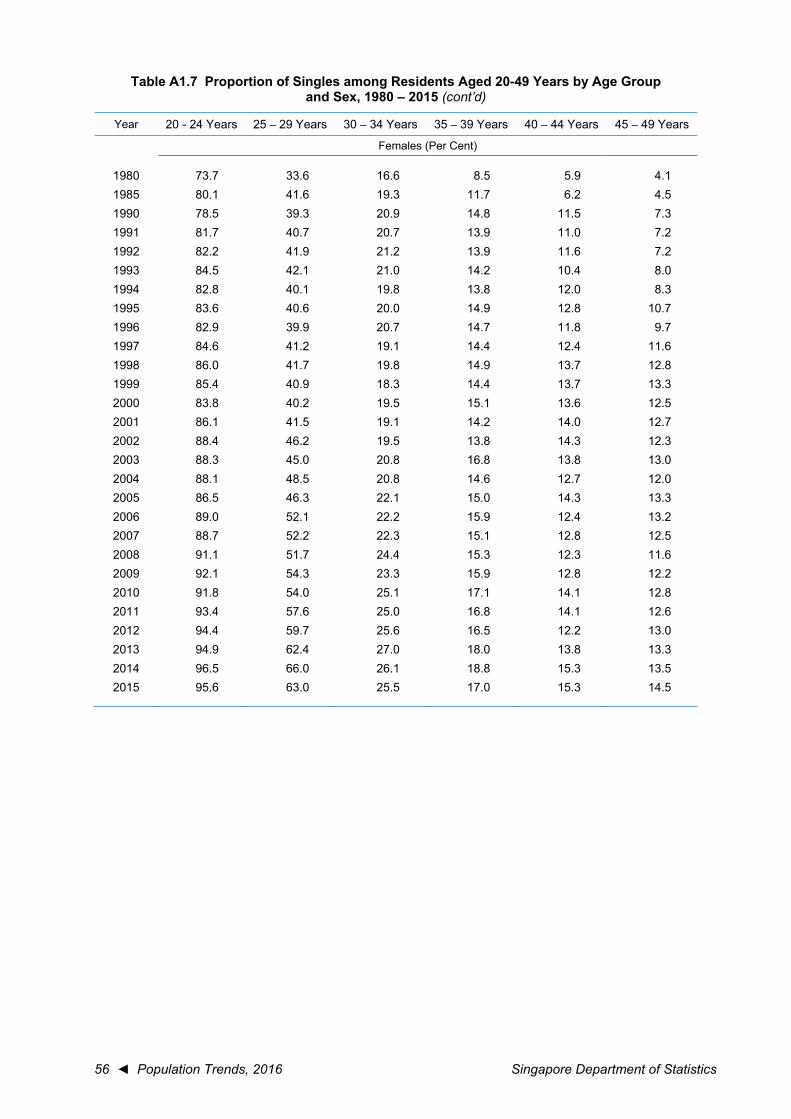
56 ◄ Population Trends, 2016 Singapore Department of Statistics
Table A1.7 Proportion of Singles among Residents Aged 20-49 Years by Age Group and Sex, 1980 – 2015 (cont’d)
Year 20 - 24 Years 25 – 29 Years 30 – 34 Years 35 – 39 Years 40 – 44 Years 45 – 49 Years
Females (Per Cent)
1980 73.7 33.6 16.6 8.5 5.9 4.1 1985 80.1 41.6 19.3 11.7 6.2 4.5 1990 78.5 39.3 20.9 14.8 11.5 7.3 1991 81.7 40.7 20.7 13.9 11.0 7.2 1992 82.2 41.9 21.2 13.9 11.6 7.2 1993 84.5 42.1 21.0 14.2 10.4 8.0 1994 82.8 40.1 19.8 13.8 12.0 8.3 1995 83.6 40.6 20.0 14.9 12.8 10.7 1996 82.9 39.9 20.7 14.7 11.8 9.7 1997 84.6 41.2 19.1 14.4 12.4 11.6 1998 86.0 41.7 19.8 14.9 13.7 12.8 1999 85.4 40.9 18.3 14.4 13.7 13.3 2000 83.8 40.2 19.5 15.1 13.6 12.5 2001 86.1 41.5 19.1 14.2 14.0 12.7 2002 88.4 46.2 19.5 13.8 14.3 12.3 2003 88.3 45.0 20.8 16.8 13.8 13.0 2004 88.1 48.5 20.8 14.6 12.7 12.0 2005 86.5 46.3 22.1 15.0 14.3 13.3 2006 89.0 52.1 22.2 15.9 12.4 13.2 2007 88.7 52.2 22.3 15.1 12.8 12.5 2008 91.1 51.7 24.4 15.3 12.3 11.6 2009 92.1 54.3 23.3 15.9 12.8 12.2 2010 91.8 54.0 25.1 17.1 14.1 12.8 2011 93.4 57.6 25.0 16.8 14.1 12.6 2012 94.4 59.7 25.6 16.5 12.2 13.0 2013 94.9 62.4 27.0 18.0 13.8 13.3 2014 96.5 66.0 26.1 18.8 15.3 13.5 2015 95.6 63.0 25.5 17.0 15.3 14.5
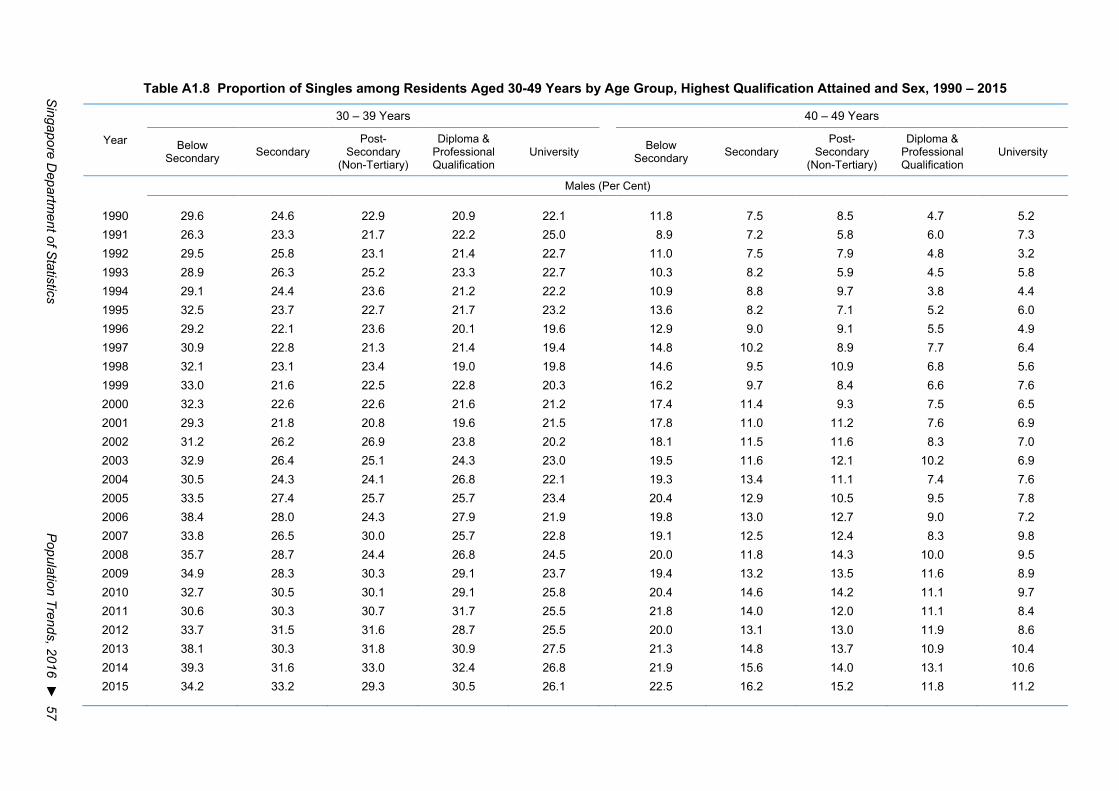
Singapore D
epartment of S
tatistics P
opulation Trends, 2016 ► 57
Table A1.8 Proportion of Singles among Residents Aged 30-49 Years by Age Group, Highest Qualification Attained and Sex, 1990 – 2015
Year
30 – 39 Years 40 – 49 Years
Below Secondary Secondary
Post-Secondary
(Non-Tertiary)
Diploma & Professional Qualification
University Below Secondary Secondary
Post-Secondary
(Non-Tertiary)
Diploma & Professional Qualification
University
Males (Per Cent)
1990 29.6 24.6 22.9 20.9 22.1 11.8 7.5 8.5 4.7 5.2 1991 26.3 23.3 21.7 22.2 25.0 8.9 7.2 5.8 6.0 7.3 1992 29.5 25.8 23.1 21.4 22.7 11.0 7.5 7.9 4.8 3.2 1993 28.9 26.3 25.2 23.3 22.7 10.3 8.2 5.9 4.5 5.8 1994 29.1 24.4 23.6 21.2 22.2 10.9 8.8 9.7 3.8 4.4 1995 32.5 23.7 22.7 21.7 23.2 13.6 8.2 7.1 5.2 6.0 1996 29.2 22.1 23.6 20.1 19.6 12.9 9.0 9.1 5.5 4.9 1997 30.9 22.8 21.3 21.4 19.4 14.8 10.2 8.9 7.7 6.4 1998 32.1 23.1 23.4 19.0 19.8 14.6 9.5 10.9 6.8 5.6 1999 33.0 21.6 22.5 22.8 20.3 16.2 9.7 8.4 6.6 7.6 2000 32.3 22.6 22.6 21.6 21.2 17.4 11.4 9.3 7.5 6.5 2001 29.3 21.8 20.8 19.6 21.5 17.8 11.0 11.2 7.6 6.9 2002 31.2 26.2 26.9 23.8 20.2 18.1 11.5 11.6 8.3 7.0 2003 32.9 26.4 25.1 24.3 23.0 19.5 11.6 12.1 10.2 6.9 2004 30.5 24.3 24.1 26.8 22.1 19.3 13.4 11.1 7.4 7.6 2005 33.5 27.4 25.7 25.7 23.4 20.4 12.9 10.5 9.5 7.8 2006 38.4 28.0 24.3 27.9 21.9 19.8 13.0 12.7 9.0 7.2 2007 33.8 26.5 30.0 25.7 22.8 19.1 12.5 12.4 8.3 9.8 2008 35.7 28.7 24.4 26.8 24.5 20.0 11.8 14.3 10.0 9.5 2009 34.9 28.3 30.3 29.1 23.7 19.4 13.2 13.5 11.6 8.9 2010 32.7 30.5 30.1 29.1 25.8 20.4 14.6 14.2 11.1 9.7 2011 30.6 30.3 30.7 31.7 25.5 21.8 14.0 12.0 11.1 8.4 2012 33.7 31.5 31.6 28.7 25.5 20.0 13.1 13.0 11.9 8.6 2013 38.1 30.3 31.8 30.9 27.5 21.3 14.8 13.7 10.9 10.4 2014 39.3 31.6 33.0 32.4 26.8 21.9 15.6 14.0 13.1 10.6 2015 34.2 33.2 29.3 30.5 26.1 22.5 16.2 15.2 11.8 11.2
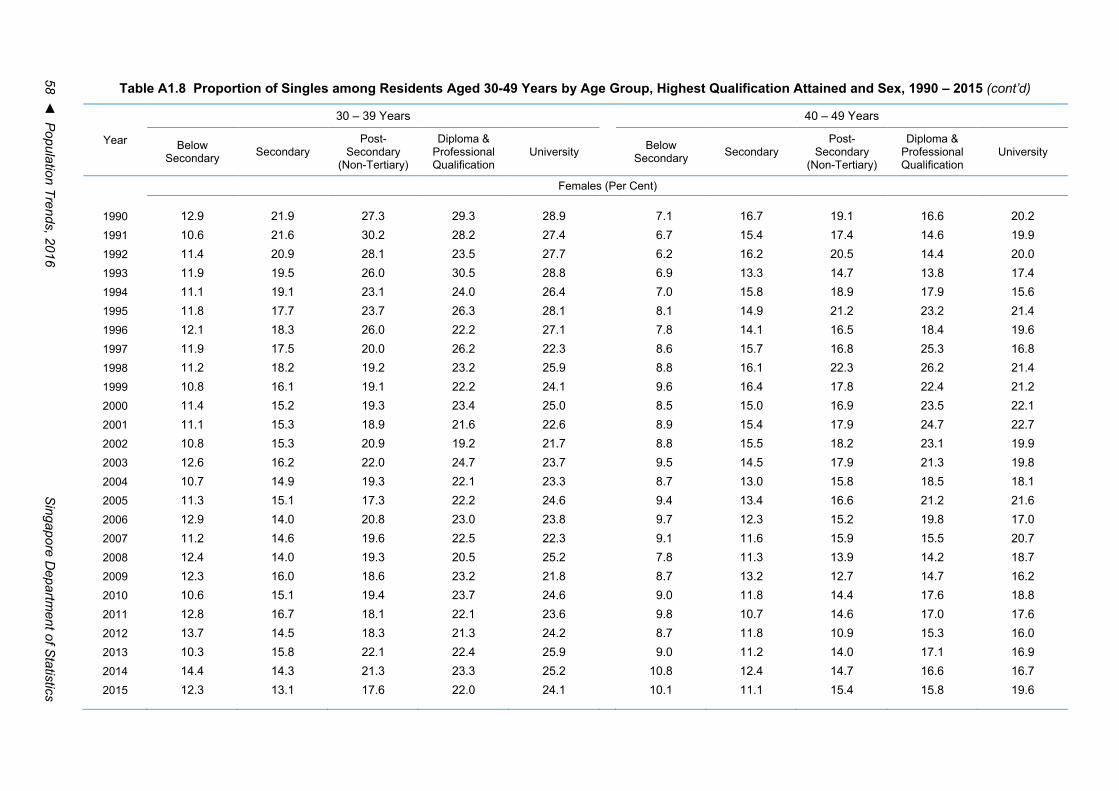
58 ◄ P
opulation Trends, 2016 S
ingapore Departm
ent of Statistics
Table A1.8 Proportion of Singles among Residents Aged 30-49 Years by Age Group, Highest Qualification Attained and Sex, 1990 – 2015 (cont’d)
Year
30 – 39 Years 40 – 49 Years
Below Secondary Secondary
Post-Secondary
(Non-Tertiary)
Diploma & Professional Qualification
University Below Secondary Secondary
Post-Secondary
(Non-Tertiary)
Diploma & Professional Qualification
University
Females (Per Cent)
1990 12.9 21.9 27.3 29.3 28.9 7.1 16.7 19.1 16.6 20.2
1991 10.6 21.6 30.2 28.2 27.4 6.7 15.4 17.4 14.6 19.9
1992 11.4 20.9 28.1 23.5 27.7 6.2 16.2 20.5 14.4 20.0
1993 11.9 19.5 26.0 30.5 28.8 6.9 13.3 14.7 13.8 17.4
1994 11.1 19.1 23.1 24.0 26.4 7.0 15.8 18.9 17.9 15.6
1995 11.8 17.7 23.7 26.3 28.1 8.1 14.9 21.2 23.2 21.4
1996 12.1 18.3 26.0 22.2 27.1 7.8 14.1 16.5 18.4 19.6
1997 11.9 17.5 20.0 26.2 22.3 8.6 15.7 16.8 25.3 16.8
1998 11.2 18.2 19.2 23.2 25.9 8.8 16.1 22.3 26.2 21.4
1999 10.8 16.1 19.1 22.2 24.1 9.6 16.4 17.8 22.4 21.2
2000 11.4 15.2 19.3 23.4 25.0 8.5 15.0 16.9 23.5 22.1
2001 11.1 15.3 18.9 21.6 22.6 8.9 15.4 17.9 24.7 22.7
2002 10.8 15.3 20.9 19.2 21.7 8.8 15.5 18.2 23.1 19.9
2003 12.6 16.2 22.0 24.7 23.7 9.5 14.5 17.9 21.3 19.8
2004 10.7 14.9 19.3 22.1 23.3 8.7 13.0 15.8 18.5 18.1
2005 11.3 15.1 17.3 22.2 24.6 9.4 13.4 16.6 21.2 21.6
2006 12.9 14.0 20.8 23.0 23.8 9.7 12.3 15.2 19.8 17.0
2007 11.2 14.6 19.6 22.5 22.3 9.1 11.6 15.9 15.5 20.7
2008 12.4 14.0 19.3 20.5 25.2 7.8 11.3 13.9 14.2 18.7
2009 12.3 16.0 18.6 23.2 21.8 8.7 13.2 12.7 14.7 16.2
2010 10.6 15.1 19.4 23.7 24.6 9.0 11.8 14.4 17.6 18.8
2011 12.8 16.7 18.1 22.1 23.6 9.8 10.7 14.6 17.0 17.6
2012 13.7 14.5 18.3 21.3 24.2 8.7 11.8 10.9 15.3 16.0
2013 10.3 15.8 22.1 22.4 25.9 9.0 11.2 14.0 17.1 16.9
2014 14.4 14.3 21.3 23.3 25.2 10.8 12.4 14.7 16.6 16.7
2015 12.3 13.1 17.6 22.0 24.1 10.1 11.1 15.4 15.8 19.6
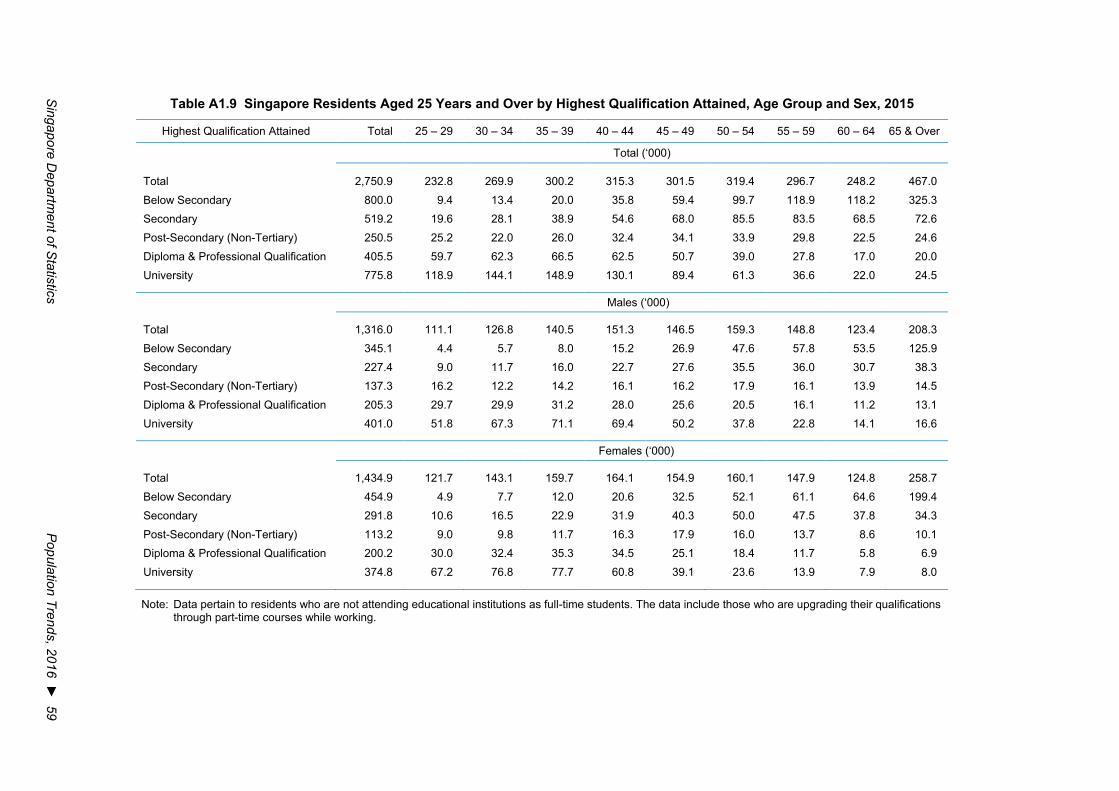
Singapore D
epartment of S
tatistics P
opulation Trends, 2016 ► 59
Table A1.9 Singapore Residents Aged 25 Years and Over by Highest Qualification Attained, Age Group and Sex, 2015
Highest Qualification Attained Total 25 – 29 30 – 34 35 – 39 40 – 44 45 – 49 50 – 54 55 – 59 60 – 64 65 & Over
Total (‘000)
Total 2,750.9 232.8 269.9 300.2 315.3 301.5 319.4 296.7 248.2 467.0 Below Secondary 800.0 9.4 13.4 20.0 35.8 59.4 99.7 118.9 118.2 325.3 Secondary 519.2 19.6 28.1 38.9 54.6 68.0 85.5 83.5 68.5 72.6 Post-Secondary (Non-Tertiary) 250.5 25.2 22.0 26.0 32.4 34.1 33.9 29.8 22.5 24.6 Diploma & Professional Qualification 405.5 59.7 62.3 66.5 62.5 50.7 39.0 27.8 17.0 20.0 University 775.8 118.9 144.1 148.9 130.1 89.4 61.3 36.6 22.0 24.5
Males (‘000)
Total 1,316.0 111.1 126.8 140.5 151.3 146.5 159.3 148.8 123.4 208.3 Below Secondary 345.1 4.4 5.7 8.0 15.2 26.9 47.6 57.8 53.5 125.9 Secondary 227.4 9.0 11.7 16.0 22.7 27.6 35.5 36.0 30.7 38.3 Post-Secondary (Non-Tertiary) 137.3 16.2 12.2 14.2 16.1 16.2 17.9 16.1 13.9 14.5 Diploma & Professional Qualification 205.3 29.7 29.9 31.2 28.0 25.6 20.5 16.1 11.2 13.1 University 401.0 51.8 67.3 71.1 69.4 50.2 37.8 22.8 14.1 16.6
Females (‘000)
Total 1,434.9 121.7 143.1 159.7 164.1 154.9 160.1 147.9 124.8 258.7 Below Secondary 454.9 4.9 7.7 12.0 20.6 32.5 52.1 61.1 64.6 199.4 Secondary 291.8 10.6 16.5 22.9 31.9 40.3 50.0 47.5 37.8 34.3 Post-Secondary (Non-Tertiary) 113.2 9.0 9.8 11.7 16.3 17.9 16.0 13.7 8.6 10.1 Diploma & Professional Qualification 200.2 30.0 32.4 35.3 34.5 25.1 18.4 11.7 5.8 6.9 University 374.8 67.2 76.8 77.7 60.8 39.1 23.6 13.9 7.9 8.0
Note: Data pertain to residents who are not attending educational institutions as full-time students. The data include those who are upgrading their qualifications through part-time courses while working.
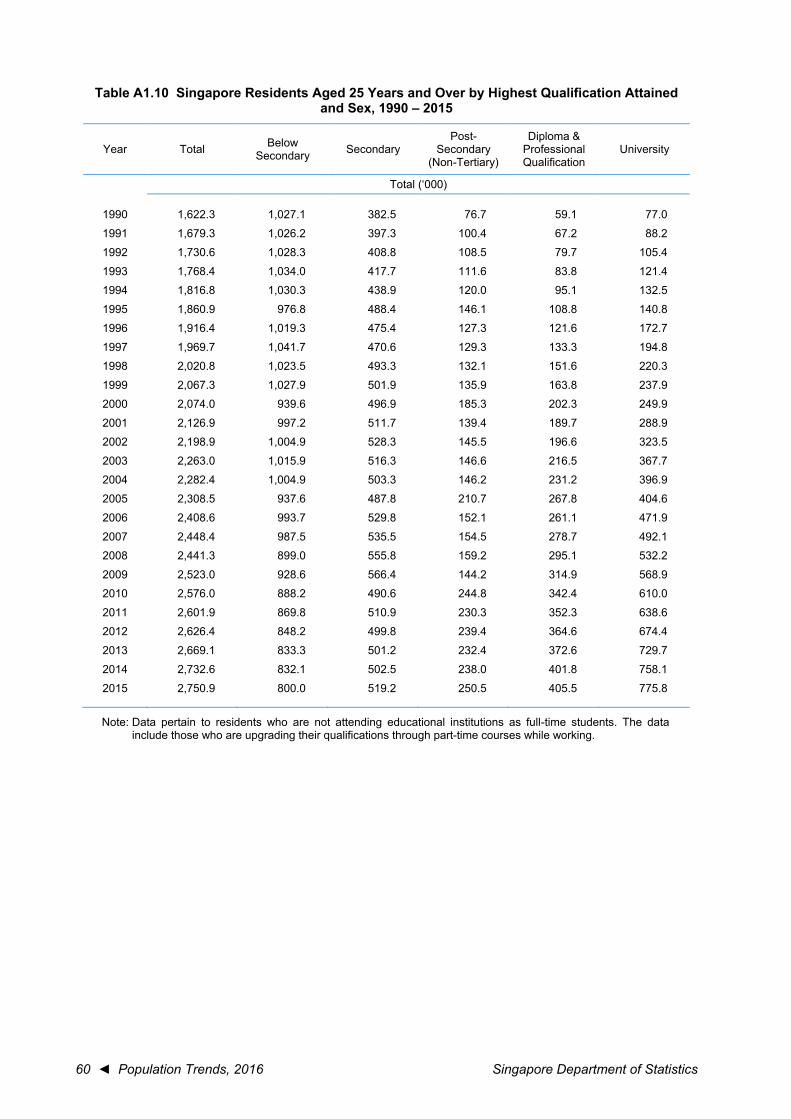
60 ◄ Population Trends, 2016 Singapore Department of Statistics
Table A1.10 Singapore Residents Aged 25 Years and Over by Highest Qualification Attained and Sex, 1990 – 2015
Year Total Below Secondary Secondary
Post-Secondary
(Non-Tertiary)
Diploma & Professional Qualification
University
Total (‘000)
1990 1,622.3 1,027.1 382.5 76.7 59.1 77.0
1991 1,679.3 1,026.2 397.3 100.4 67.2 88.2
1992 1,730.6 1,028.3 408.8 108.5 79.7 105.4
1993 1,768.4 1,034.0 417.7 111.6 83.8 121.4
1994 1,816.8 1,030.3 438.9 120.0 95.1 132.5
1995 1,860.9 976.8 488.4 146.1 108.8 140.8
1996 1,916.4 1,019.3 475.4 127.3 121.6 172.7
1997 1,969.7 1,041.7 470.6 129.3 133.3 194.8
1998 2,020.8 1,023.5 493.3 132.1 151.6 220.3
1999 2,067.3 1,027.9 501.9 135.9 163.8 237.9
2000 2,074.0 939.6 496.9 185.3 202.3 249.9
2001 2,126.9 997.2 511.7 139.4 189.7 288.9
2002 2,198.9 1,004.9 528.3 145.5 196.6 323.5
2003 2,263.0 1,015.9 516.3 146.6 216.5 367.7
2004 2,282.4 1,004.9 503.3 146.2 231.2 396.9
2005 2,308.5 937.6 487.8 210.7 267.8 404.6
2006 2,408.6 993.7 529.8 152.1 261.1 471.9
2007 2,448.4 987.5 535.5 154.5 278.7 492.1
2008 2,441.3 899.0 555.8 159.2 295.1 532.2
2009 2,523.0 928.6 566.4 144.2 314.9 568.9
2010 2,576.0 888.2 490.6 244.8 342.4 610.0
2011 2,601.9 869.8 510.9 230.3 352.3 638.6
2012 2,626.4 848.2 499.8 239.4 364.6 674.4
2013 2,669.1 833.3 501.2 232.4 372.6 729.7
2014 2,732.6 832.1 502.5 238.0 401.8 758.1
2015 2,750.9 800.0 519.2 250.5 405.5 775.8
Note: Data pertain to residents who are not attending educational institutions as full-time students. The data include those who are upgrading their qualifications through part-time courses while working.

Singapore Department of Statistics Population Trends, 2016 ► 61
Table A1.10 Singapore Residents Aged 25 Years and Over by Highest Qualification Attained and Sex, 1990 – 2015 (cont’d)
Year Total Below Secondary Secondary
Post-Secondary
(Non-Tertiary)
Diploma & Professional Qualification
University
Males (‘000)
1990 810.8 491.8 190.7 40.0 40.1 48.1
1991 831.4 486.1 192.0 50.3 46.1 56.9
1992 854.7 484.9 193.4 55.2 52.8 68.4
1993 875.4 486.7 200.3 55.8 55.8 76.8
1994 894.2 480.6 208.1 60.7 61.9 82.9
1995 916.6 445.8 242.2 73.4 68.6 86.5
1996 939.1 474.9 224.7 62.2 73.6 103.6
1997 964.6 478.0 222.3 61.3 83.8 119.3
1998 981.6 468.8 228.9 60.9 90.3 132.9
1999 1,009.3 475.5 232.1 63.7 94.2 143.8
2000 1,012.7 422.3 240.9 93.6 111.1 144.8
2001 1,031.2 451.2 235.4 71.7 105.2 167.7
2002 1,067.3 457.6 240.8 74.9 110.5 183.5
2003 1,096.2 461.6 234.4 73.8 117.2 209.1
2004 1,107.0 453.5 232.4 72.8 124.3 224.0
2005 1,117.6 413.3 230.9 107.9 141.4 224.2
2006 1,164.0 449.8 238.2 78.1 138.7 259.3
2007 1,178.8 448.9 237.7 79.3 147.2 265.7
2008 1,177.6 401.4 248.2 87.6 154.5 285.9
2009 1,210.9 409.7 261.7 71.4 165.8 302.4
2010 1,242.4 388.6 222.4 132.2 177.3 321.9
2011 1,249.5 378.9 225.9 127.5 186.1 331.3
2012 1,259.1 368.0 217.9 132.1 187.4 353.7
2013 1,277.8 360.6 220.7 127.7 189.2 379.7
2014 1,309.9 363.4 217.0 130.2 203.6 395.7
2015 1,316.0 345.1 227.4 137.3 205.3 401.0
Note: Data pertain to residents who are not attending educational institutions as full-time students. The data include those who are upgrading their qualifications through part-time courses while working.
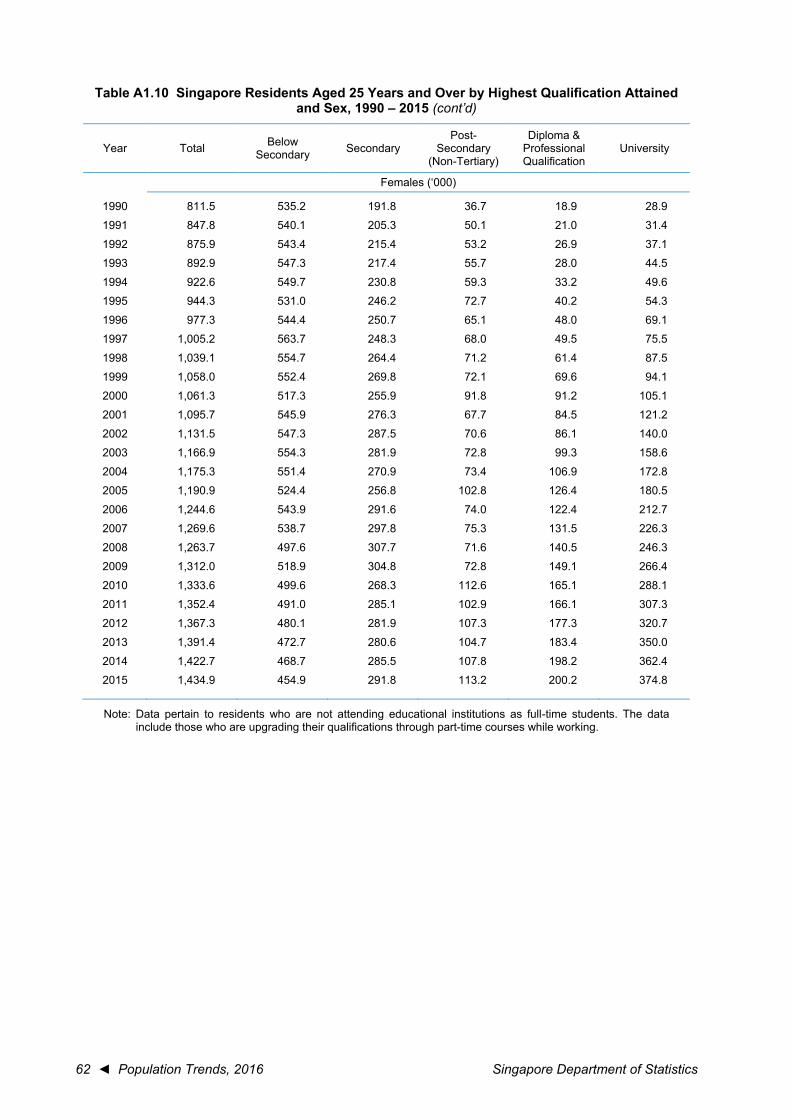
62 ◄ Population Trends, 2016 Singapore Department of Statistics
Table A1.10 Singapore Residents Aged 25 Years and Over by Highest Qualification Attained and Sex, 1990 – 2015 (cont’d)
Year Total Below Secondary Secondary
Post-Secondary
(Non-Tertiary)
Diploma & Professional Qualification
University
Females (‘000)
1990 811.5 535.2 191.8 36.7 18.9 28.9
1991 847.8 540.1 205.3 50.1 21.0 31.4
1992 875.9 543.4 215.4 53.2 26.9 37.1
1993 892.9 547.3 217.4 55.7 28.0 44.5
1994 922.6 549.7 230.8 59.3 33.2 49.6
1995 944.3 531.0 246.2 72.7 40.2 54.3
1996 977.3 544.4 250.7 65.1 48.0 69.1
1997 1,005.2 563.7 248.3 68.0 49.5 75.5
1998 1,039.1 554.7 264.4 71.2 61.4 87.5
1999 1,058.0 552.4 269.8 72.1 69.6 94.1
2000 1,061.3 517.3 255.9 91.8 91.2 105.1
2001 1,095.7 545.9 276.3 67.7 84.5 121.2
2002 1,131.5 547.3 287.5 70.6 86.1 140.0
2003 1,166.9 554.3 281.9 72.8 99.3 158.6
2004 1,175.3 551.4 270.9 73.4 106.9 172.8
2005 1,190.9 524.4 256.8 102.8 126.4 180.5
2006 1,244.6 543.9 291.6 74.0 122.4 212.7
2007 1,269.6 538.7 297.8 75.3 131.5 226.3
2008 1,263.7 497.6 307.7 71.6 140.5 246.3
2009 1,312.0 518.9 304.8 72.8 149.1 266.4
2010 1,333.6 499.6 268.3 112.6 165.1 288.1
2011 1,352.4 491.0 285.1 102.9 166.1 307.3
2012 1,367.3 480.1 281.9 107.3 177.3 320.7
2013 1,391.4 472.7 280.6 104.7 183.4 350.0
2014 1,422.7 468.7 285.5 107.8 198.2 362.4
2015 1,434.9 454.9 291.8 113.2 200.2 374.8
Note: Data pertain to residents who are not attending educational institutions as full-time students. The data include those who are upgrading their qualifications through part-time courses while working.
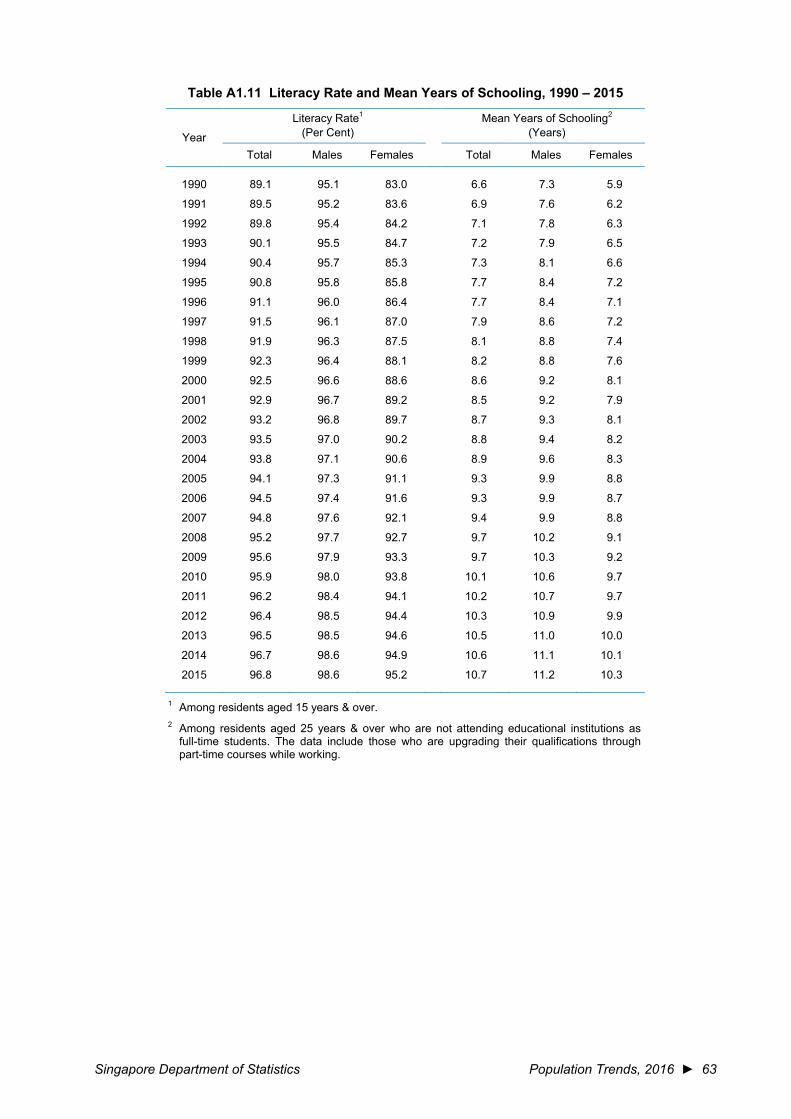
Singapore Department of Statistics Population Trends, 2016 ► 63
Table A1.11 Literacy Rate and Mean Years of Schooling, 1990 – 2015
Year
Literacy Rate1 (Per Cent)
Mean Years of Schooling2 (Years)
Total Males Females Total Males Females
1990 89.1 95.1 83.0 6.6 7.3 5.9
1991 89.5 95.2 83.6 6.9 7.6 6.2
1992 89.8 95.4 84.2 7.1 7.8 6.3
1993 90.1 95.5 84.7 7.2 7.9 6.5
1994 90.4 95.7 85.3 7.3 8.1 6.6
1995 90.8 95.8 85.8 7.7 8.4 7.2
1996 91.1 96.0 86.4 7.7 8.4 7.1
1997 91.5 96.1 87.0 7.9 8.6 7.2
1998 91.9 96.3 87.5 8.1 8.8 7.4
1999 92.3 96.4 88.1 8.2 8.8 7.6
2000 92.5 96.6 88.6 8.6 9.2 8.1
2001 92.9 96.7 89.2 8.5 9.2 7.9
2002 93.2 96.8 89.7 8.7 9.3 8.1
2003 93.5 97.0 90.2 8.8 9.4 8.2
2004 93.8 97.1 90.6 8.9 9.6 8.3
2005 94.1 97.3 91.1 9.3 9.9 8.8
2006 94.5 97.4 91.6 9.3 9.9 8.7
2007 94.8 97.6 92.1 9.4 9.9 8.8
2008 95.2 97.7 92.7 9.7 10.2 9.1
2009 95.6 97.9 93.3 9.7 10.3 9.2
2010 95.9 98.0 93.8 10.1 10.6 9.7
2011 96.2 98.4 94.1 10.2 10.7 9.7
2012 96.4 98.5 94.4 10.3 10.9 9.9
2013 96.5 98.5 94.6 10.5 11.0 10.0
2014 96.7 98.6 94.9 10.6 11.1 10.1
2015 96.8 98.6 95.2 10.7 11.2 10.3
1 Among residents aged 15 years & over. 2 Among residents aged 25 years & over who are not attending educational institutions as
full-time students. The data include those who are upgrading their qualifications through part-time courses while working.
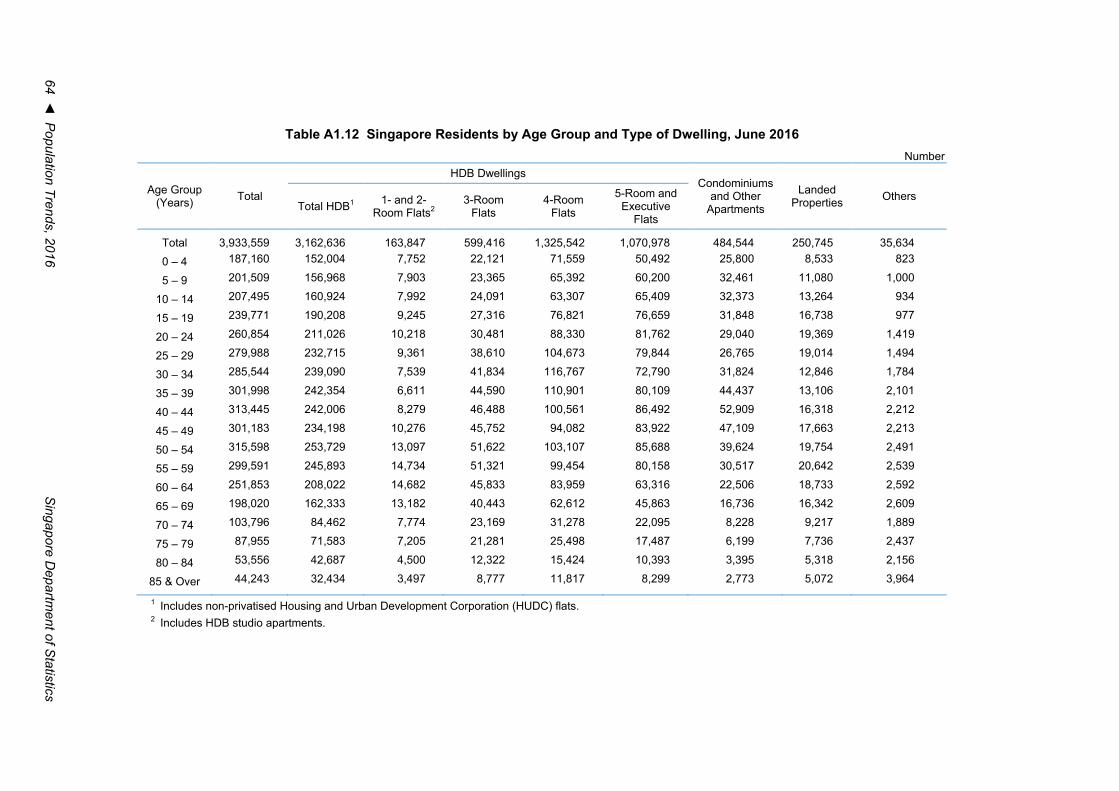
64 ◄ P
opulation Trends, 2016 S
ingapore Departm
ent of Statistics
Table A1.12 Singapore Residents by Age Group and Type of Dwelling, June 2016 Number
Age Group (Years) Total
HDB Dwellings Condominiums
and Other Apartments
Landed Properties Others
Total HDB1 1- and 2-Room Flats2
3-RoomFlats
4-RoomFlats
5-Room andExecutive
Flats
Total 3,933,559 3,162,636 163,847 599,416 1,325,542 1,070,978 484,544 250,745 35,634 0 – 4 187,160 152,004 7,752 22,121 71,559 50,492 25,800 8,533 823
5 – 9 201,509 156,968 7,903 23,365 65,392 60,200 32,461 11,080 1,000
10 – 14 207,495 160,924 7,992 24,091 63,307 65,409 32,373 13,264 934
15 – 19 239,771 190,208 9,245 27,316 76,821 76,659 31,848 16,738 977
20 – 24 260,854 211,026 10,218 30,481 88,330 81,762 29,040 19,369 1,419
25 – 29 279,988 232,715 9,361 38,610 104,673 79,844 26,765 19,014 1,494
30 – 34 285,544 239,090 7,539 41,834 116,767 72,790 31,824 12,846 1,784
35 – 39 301,998 242,354 6,611 44,590 110,901 80,109 44,437 13,106 2,101
40 – 44 313,445 242,006 8,279 46,488 100,561 86,492 52,909 16,318 2,212
45 – 49 301,183 234,198 10,276 45,752 94,082 83,922 47,109 17,663 2,213
50 – 54 315,598 253,729 13,097 51,622 103,107 85,688 39,624 19,754 2,491
55 – 59 299,591 245,893 14,734 51,321 99,454 80,158 30,517 20,642 2,539
60 – 64 251,853 208,022 14,682 45,833 83,959 63,316 22,506 18,733 2,592
65 – 69 198,020 162,333 13,182 40,443 62,612 45,863 16,736 16,342 2,609
70 – 74 103,796 84,462 7,774 23,169 31,278 22,095 8,228 9,217 1,889
75 – 79 87,955 71,583 7,205 21,281 25,498 17,487 6,199 7,736 2,437
80 – 84 53,556 42,687 4,500 12,322 15,424 10,393 3,395 5,318 2,156
85 & Over 44,243 32,434 3,497 8,777 11,817 8,299 2,773 5,072 3,964
1 Includes non-privatised Housing and Urban Development Corporation (HUDC) flats. 2 Includes HDB studio apartments.
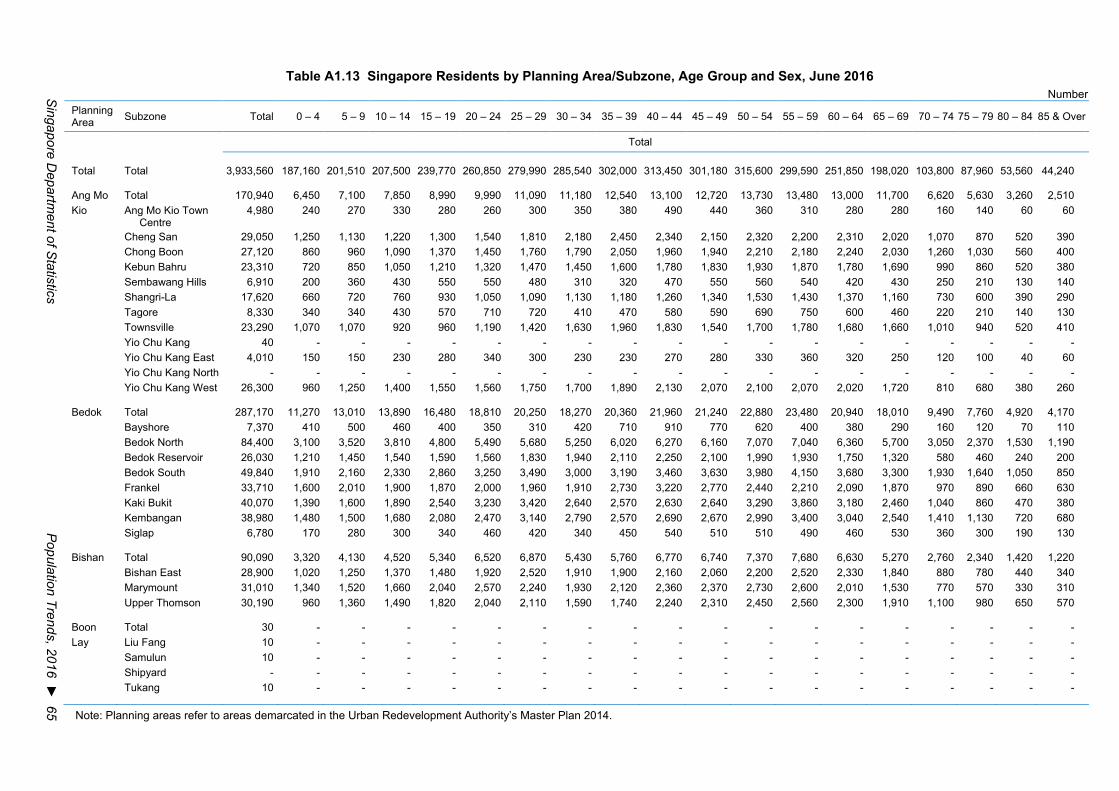
Singapore D
epartment of S
tatistics P
opulation Trends, 2016 ► 65
Table A1.13 Singapore Residents by Planning Area/Subzone, Age Group and Sex, June 2016 Number
Planning Area Subzone Total 0 – 4 5 – 9 10 – 14 15 – 19 20 – 24 25 – 29 30 – 34 35 – 39 40 – 44 45 – 49 50 – 54 55 – 59 60 – 64 65 – 69 70 – 74 75 – 79 80 – 84 85 & Over
Total
Total Total 3,933,560 187,160 201,510 207,500 239,770 260,850 279,990 285,540 302,000 313,450 301,180 315,600 299,590 251,850 198,020 103,800 87,960 53,560 44,240
Ang Mo Total 170,940 6,450 7,100 7,850 8,990 9,990 11,090 11,180 12,540 13,100 12,720 13,730 13,480 13,000 11,700 6,620 5,630 3,260 2,510 Kio Ang Mo Kio Town
Centre 4,980 240 270 330 280 260 300 350 380 490 440 360 310 280 280 160 140 60 60
Cheng San 29,050 1,250 1,130 1,220 1,300 1,540 1,810 2,180 2,450 2,340 2,150 2,320 2,200 2,310 2,020 1,070 870 520 390 Chong Boon 27,120 860 960 1,090 1,370 1,450 1,760 1,790 2,050 1,960 1,940 2,210 2,180 2,240 2,030 1,260 1,030 560 400 Kebun Bahru 23,310 720 850 1,050 1,210 1,320 1,470 1,450 1,600 1,780 1,830 1,930 1,870 1,780 1,690 990 860 520 380 Sembawang Hills 6,910 200 360 430 550 550 480 310 320 470 550 560 540 420 430 250 210 130 140 Shangri-La 17,620 660 720 760 930 1,050 1,090 1,130 1,180 1,260 1,340 1,530 1,430 1,370 1,160 730 600 390 290 Tagore 8,330 340 340 430 570 710 720 410 470 580 590 690 750 600 460 220 210 140 130 Townsville 23,290 1,070 1,070 920 960 1,190 1,420 1,630 1,960 1,830 1,540 1,700 1,780 1,680 1,660 1,010 940 520 410 Yio Chu Kang 40 - - - - - - - - - - - - - - - - - -Yio Chu Kang East 4,010 150 150 230 280 340 300 230 230 270 280 330 360 320 250 120 100 40 60 Yio Chu Kang North - - - - - - - - - - - - - - - - - - - Yio Chu Kang West 26,300 960 1,250 1,400 1,550 1,560 1,750 1,700 1,890 2,130 2,070 2,100 2,070 2,020 1,720 810 680 380 260
Bedok Total 287,170 11,270 13,010 13,890 16,480 18,810 20,250 18,270 20,360 21,960 21,240 22,880 23,480 20,940 18,010 9,490 7,760 4,920 4,170 Bayshore 7,370 410 500 460 400 350 310 420 710 910 770 620 400 380 290 160 120 70 110 Bedok North 84,400 3,100 3,520 3,810 4,800 5,490 5,680 5,250 6,020 6,270 6,160 7,070 7,040 6,360 5,700 3,050 2,370 1,530 1,190 Bedok Reservoir 26,030 1,210 1,450 1,540 1,590 1,560 1,830 1,940 2,110 2,250 2,100 1,990 1,930 1,750 1,320 580 460 240 200 Bedok South 49,840 1,910 2,160 2,330 2,860 3,250 3,490 3,000 3,190 3,460 3,630 3,980 4,150 3,680 3,300 1,930 1,640 1,050 850 Frankel 33,710 1,600 2,010 1,900 1,870 2,000 1,960 1,910 2,730 3,220 2,770 2,440 2,210 2,090 1,870 970 890 660 630 Kaki Bukit 40,070 1,390 1,600 1,890 2,540 3,230 3,420 2,640 2,570 2,630 2,640 3,290 3,860 3,180 2,460 1,040 860 470 380 Kembangan 38,980 1,480 1,500 1,680 2,080 2,470 3,140 2,790 2,570 2,690 2,670 2,990 3,400 3,040 2,540 1,410 1,130 720 680 Siglap 6,780 170 280 300 340 460 420 340 450 540 510 510 490 460 530 360 300 190 130
Bishan Total 90,090 3,320 4,130 4,520 5,340 6,520 6,870 5,430 5,760 6,770 6,740 7,370 7,680 6,630 5,270 2,760 2,340 1,420 1,220 Bishan East 28,900 1,020 1,250 1,370 1,480 1,920 2,520 1,910 1,900 2,160 2,060 2,200 2,520 2,330 1,840 880 780 440 340 Marymount 31,010 1,340 1,520 1,660 2,040 2,570 2,240 1,930 2,120 2,360 2,370 2,730 2,600 2,010 1,530 770 570 330 310 Upper Thomson 30,190 960 1,360 1,490 1,820 2,040 2,110 1,590 1,740 2,240 2,310 2,450 2,560 2,300 1,910 1,100 980 650 570
Boon Total 30 - - - - - - - - - - - - - - - - - -Lay Liu Fang 10 - - - - - - - - - - - - - - - - - -
Samulun 10 - - - - - - - - - - - - - - - - - -Shipyard - - - - - - - - - - - - - - - - - - - Tukang 10 - - - - - - - - - - - - - - - - - -
Note: Planning areas refer to areas demarcated in the Urban Redevelopment Authority’s Master Plan 2014.
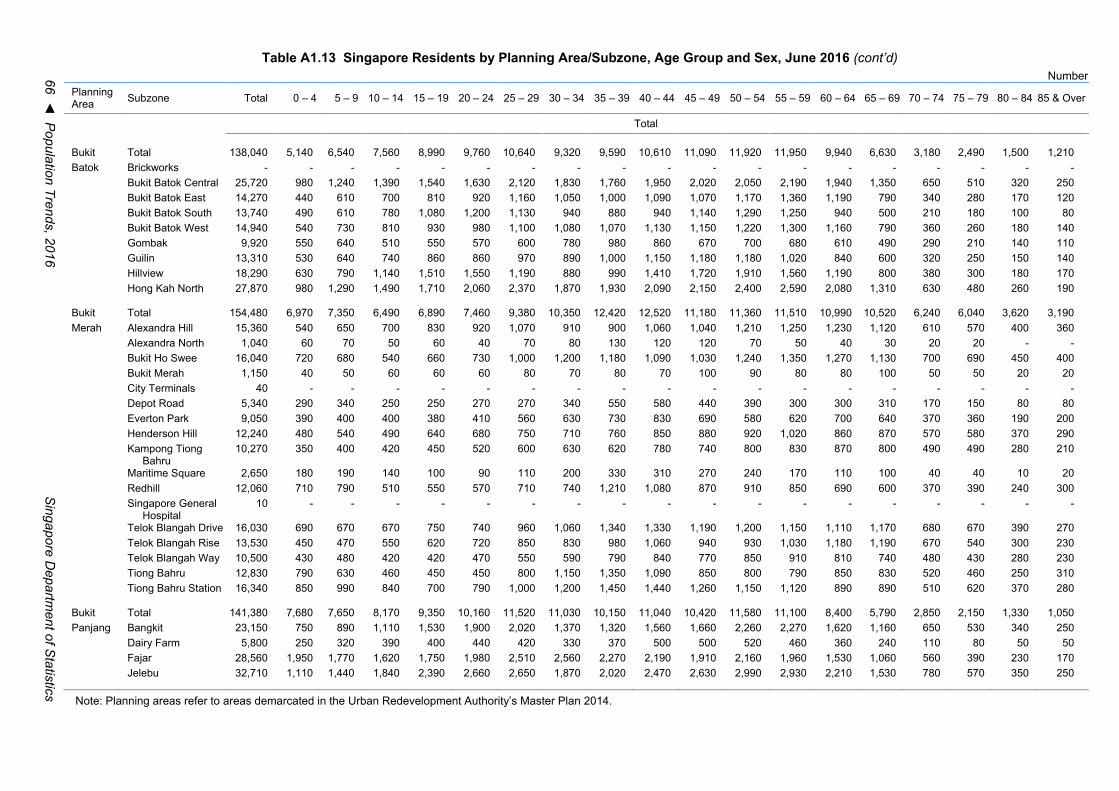
66 ◄ P
opulation Trends, 2016 S
ingapore Departm
ent of Statistics
Table A1.13 Singapore Residents by Planning Area/Subzone, Age Group and Sex, June 2016 (cont’d) Number
Planning Area Subzone Total 0 – 4 5 – 9 10 – 14 15 – 19 20 – 24 25 – 29 30 – 34 35 – 39 40 – 44 45 – 49 50 – 54 55 – 59 60 – 64 65 – 69 70 – 74 75 – 79 80 – 84 85 & Over
Total
Bukit Total 138,040 5,140 6,540 7,560 8,990 9,760 10,640 9,320 9,590 10,610 11,090 11,920 11,950 9,940 6,630 3,180 2,490 1,500 1,210 Batok Brickworks - - - - - - - - - - - - - - - - - - -
Bukit Batok Central 25,720 980 1,240 1,390 1,540 1,630 2,120 1,830 1,760 1,950 2,020 2,050 2,190 1,940 1,350 650 510 320 250 Bukit Batok East 14,270 440 610 700 810 920 1,160 1,050 1,000 1,090 1,070 1,170 1,360 1,190 790 340 280 170 120 Bukit Batok South 13,740 490 610 780 1,080 1,200 1,130 940 880 940 1,140 1,290 1,250 940 500 210 180 100 80 Bukit Batok West 14,940 540 730 810 930 980 1,100 1,080 1,070 1,130 1,150 1,220 1,300 1,160 790 360 260 180 140 Gombak 9,920 550 640 510 550 570 600 780 980 860 670 700 680 610 490 290 210 140 110 Guilin 13,310 530 640 740 860 860 970 890 1,000 1,150 1,180 1,180 1,020 840 600 320 250 150 140 Hillview 18,290 630 790 1,140 1,510 1,550 1,190 880 990 1,410 1,720 1,910 1,560 1,190 800 380 300 180 170 Hong Kah North 27,870 980 1,290 1,490 1,710 2,060 2,370 1,870 1,930 2,090 2,150 2,400 2,590 2,080 1,310 630 480 260 190
Bukit Total 154,480 6,970 7,350 6,490 6,890 7,460 9,380 10,350 12,420 12,520 11,180 11,360 11,510 10,990 10,520 6,240 6,040 3,620 3,190 Merah Alexandra Hill 15,360 540 650 700 830 920 1,070 910 900 1,060 1,040 1,210 1,250 1,230 1,120 610 570 400 360
Alexandra North 1,040 60 70 50 60 40 70 80 130 120 120 70 50 40 30 20 20 - -Bukit Ho Swee 16,040 720 680 540 660 730 1,000 1,200 1,180 1,090 1,030 1,240 1,350 1,270 1,130 700 690 450 400 Bukit Merah 1,150 40 50 60 60 60 80 70 80 70 100 90 80 80 100 50 50 20 20 City Terminals 40 - - - - - - - - - - - - - - - - - -Depot Road 5,340 290 340 250 250 270 270 340 550 580 440 390 300 300 310 170 150 80 80 Everton Park 9,050 390 400 400 380 410 560 630 730 830 690 580 620 700 640 370 360 190 200 Henderson Hill 12,240 480 540 490 640 680 750 710 760 850 880 920 1,020 860 870 570 580 370 290 Kampong Tiong
Bahru 10,270 350 400 420 450 520 600 630 620 780 740 800 830 870 800 490 490 280 210
Maritime Square 2,650 180 190 140 100 90 110 200 330 310 270 240 170 110 100 40 40 10 20 Redhill 12,060 710 790 510 550 570 710 740 1,210 1,080 870 910 850 690 600 370 390 240 300 Singapore General
Hospital 10 - - - - - - - - - - - - - - - - - -
Telok Blangah Drive 16,030 690 670 670 750 740 960 1,060 1,340 1,330 1,190 1,200 1,150 1,110 1,170 680 670 390 270 Telok Blangah Rise 13,530 450 470 550 620 720 850 830 980 1,060 940 930 1,030 1,180 1,190 670 540 300 230 Telok Blangah Way 10,500 430 480 420 420 470 550 590 790 840 770 850 910 810 740 480 430 280 230 Tiong Bahru 12,830 790 630 460 450 450 800 1,150 1,350 1,090 850 800 790 850 830 520 460 250 310 Tiong Bahru Station 16,340 850 990 840 700 790 1,000 1,200 1,450 1,440 1,260 1,150 1,120 890 890 510 620 370 280
Bukit Total 141,380 7,680 7,650 8,170 9,350 10,160 11,520 11,030 10,150 11,040 10,420 11,580 11,100 8,400 5,790 2,850 2,150 1,330 1,050 Panjang Bangkit 23,150 750 890 1,110 1,530 1,900 2,020 1,370 1,320 1,560 1,660 2,260 2,270 1,620 1,160 650 530 340 250
Dairy Farm 5,800 250 320 390 400 440 420 330 370 500 500 520 460 360 240 110 80 50 50 Fajar 28,560 1,950 1,770 1,620 1,750 1,980 2,510 2,560 2,270 2,190 1,910 2,160 1,960 1,530 1,060 560 390 230 170 Jelebu 32,710 1,110 1,440 1,840 2,390 2,660 2,650 1,870 2,020 2,470 2,630 2,990 2,930 2,210 1,530 780 570 350 250
Note: Planning areas refer to areas demarcated in the Urban Redevelopment Authority’s Master Plan 2014.
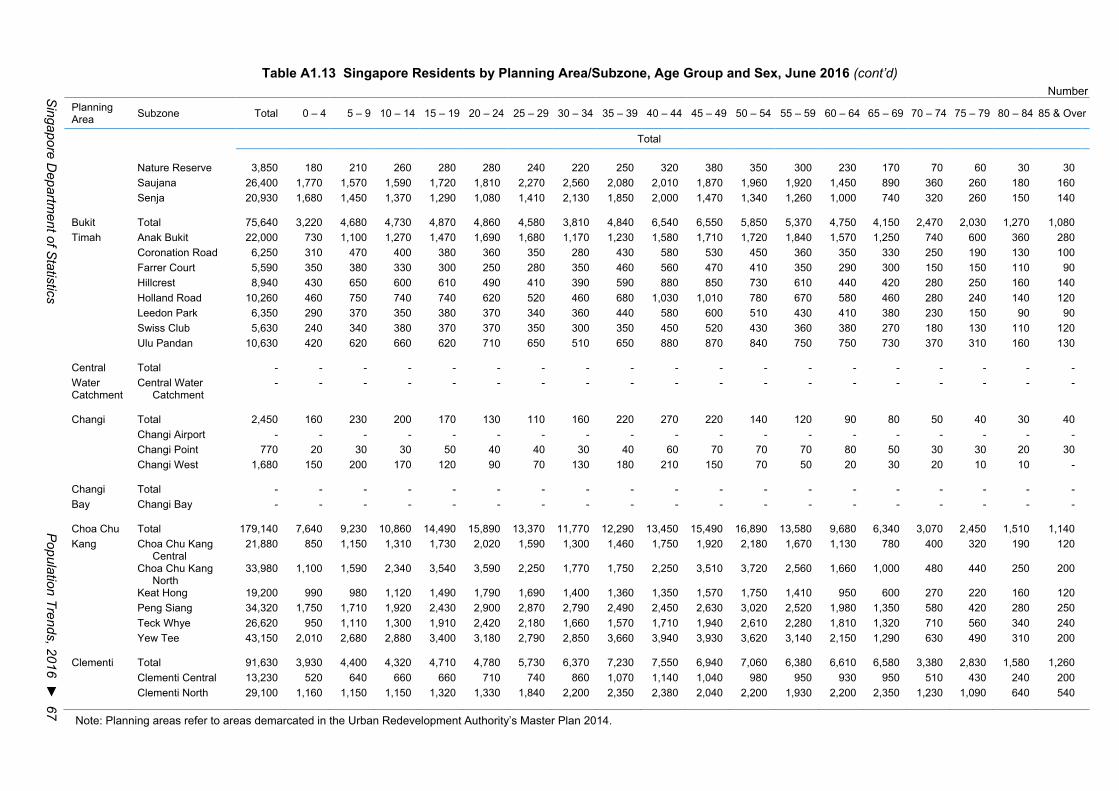
Singapore D
epartment of S
tatistics P
opulation Trends, 2016 ► 67
Table A1.13 Singapore Residents by Planning Area/Subzone, Age Group and Sex, June 2016 (cont’d) Number
Planning Area Subzone Total 0 – 4 5 – 9 10 – 14 15 – 19 20 – 24 25 – 29 30 – 34 35 – 39 40 – 44 45 – 49 50 – 54 55 – 59 60 – 64 65 – 69 70 – 74 75 – 79 80 – 84 85 & Over
Total
Nature Reserve 3,850 180 210 260 280 280 240 220 250 320 380 350 300 230 170 70 60 30 30 Saujana 26,400 1,770 1,570 1,590 1,720 1,810 2,270 2,560 2,080 2,010 1,870 1,960 1,920 1,450 890 360 260 180 160 Senja 20,930 1,680 1,450 1,370 1,290 1,080 1,410 2,130 1,850 2,000 1,470 1,340 1,260 1,000 740 320 260 150 140
Bukit Total 75,640 3,220 4,680 4,730 4,870 4,860 4,580 3,810 4,840 6,540 6,550 5,850 5,370 4,750 4,150 2,470 2,030 1,270 1,080 Timah Anak Bukit 22,000 730 1,100 1,270 1,470 1,690 1,680 1,170 1,230 1,580 1,710 1,720 1,840 1,570 1,250 740 600 360 280
Coronation Road 6,250 310 470 400 380 360 350 280 430 580 530 450 360 350 330 250 190 130 100 Farrer Court 5,590 350 380 330 300 250 280 350 460 560 470 410 350 290 300 150 150 110 90 Hillcrest 8,940 430 650 600 610 490 410 390 590 880 850 730 610 440 420 280 250 160 140 Holland Road 10,260 460 750 740 740 620 520 460 680 1,030 1,010 780 670 580 460 280 240 140 120 Leedon Park 6,350 290 370 350 380 370 340 360 440 580 600 510 430 410 380 230 150 90 90 Swiss Club 5,630 240 340 380 370 370 350 300 350 450 520 430 360 380 270 180 130 110 120 Ulu Pandan 10,630 420 620 660 620 710 650 510 650 880 870 840 750 750 730 370 310 160 130
Central Total - - - - - - - - - - - - - - - - - - - Water Catchment
Central Water Catchment
- - - - - - - - - - - - - - - - - - -
Changi Total 2,450 160 230 200 170 130 110 160 220 270 220 140 120 90 80 50 40 30 40 Changi Airport - - - - - - - - - - - - - - - - - - - Changi Point 770 20 30 30 50 40 40 30 40 60 70 70 70 80 50 30 30 20 30 Changi West 1,680 150 200 170 120 90 70 130 180 210 150 70 50 20 30 20 10 10 -
Changi Total - - - - - - - - - - - - - - - - - - - Bay Changi Bay - - - - - - - - - - - - - - - - - - -
Choa Chu Total 179,140 7,640 9,230 10,860 14,490 15,890 13,370 11,770 12,290 13,450 15,490 16,890 13,580 9,680 6,340 3,070 2,450 1,510 1,140 Kang Choa Chu Kang
Central 21,880 850 1,150 1,310 1,730 2,020 1,590 1,300 1,460 1,750 1,920 2,180 1,670 1,130 780 400 320 190 120
Choa Chu Kang North
33,980 1,100 1,590 2,340 3,540 3,590 2,250 1,770 1,750 2,250 3,510 3,720 2,560 1,660 1,000 480 440 250 200
Keat Hong 19,200 990 980 1,120 1,490 1,790 1,690 1,400 1,360 1,350 1,570 1,750 1,410 950 600 270 220 160 120 Peng Siang 34,320 1,750 1,710 1,920 2,430 2,900 2,870 2,790 2,490 2,450 2,630 3,020 2,520 1,980 1,350 580 420 280 250 Teck Whye 26,620 950 1,110 1,300 1,910 2,420 2,180 1,660 1,570 1,710 1,940 2,610 2,280 1,810 1,320 710 560 340 240 Yew Tee 43,150 2,010 2,680 2,880 3,400 3,180 2,790 2,850 3,660 3,940 3,930 3,620 3,140 2,150 1,290 630 490 310 200
Clementi Total 91,630 3,930 4,400 4,320 4,710 4,780 5,730 6,370 7,230 7,550 6,940 7,060 6,380 6,610 6,580 3,380 2,830 1,580 1,260 Clementi Central 13,230 520 640 660 660 710 740 860 1,070 1,140 1,040 980 950 930 950 510 430 240 200 Clementi North 29,100 1,160 1,150 1,150 1,320 1,330 1,840 2,200 2,350 2,380 2,040 2,200 1,930 2,200 2,350 1,230 1,090 640 540
Note: Planning areas refer to areas demarcated in the Urban Redevelopment Authority’s Master Plan 2014.

68 ◄ P
opulation Trends, 2016 S
ingapore Departm
ent of Statistics
Table A1.13 Singapore Residents by Planning Area/Subzone, Age Group and Sex, June 2016 (cont’d) Number
Planning Area Subzone Total 0 – 4 5 – 9 10 – 14 15 – 19 20 – 24 25 – 29 30 – 34 35 – 39 40 – 44 45 – 49 50 – 54 55 – 59 60 – 64 65 – 69 70 – 74 75 – 79 80 – 84 85 & Over
Total
Clementi West 16,460 680 790 780 870 880 1,020 1,100 1,310 1,360 1,320 1,300 1,260 1,310 1,140 540 420 230 160 Clementi Woods 16,340 880 810 760 830 840 1,100 1,300 1,280 1,240 1,150 1,300 1,100 1,090 1,140 570 510 260 200 Faber 4,320 160 290 270 310 300 310 220 290 360 360 340 310 270 220 120 100 60 40 Pandan 10 - - - - - - - - - - - - - - - - - -Sunset Way 6,170 200 260 280 370 380 440 370 370 430 480 510 480 520 480 230 190 110 80 Toh Tuck 30 - - - - - - - - - - - - - - - - - -West Coast 5,980 340 470 420 360 330 280 310 550 650 540 420 350 300 310 160 100 40 40
Downtown Total 3,710 140 80 100 100 130 220 340 350 380 330 290 280 250 260 140 140 70 130 Core Anson 90 - - - - - - - - - - - - - - - - - -
Bayfront Subzone - - - - - - - - - - - - - - - - - - - Bugis 2,200 60 50 60 80 100 130 130 140 170 160 170 190 190 220 110 120 60 80 Cecil 180 10 10 - - - 10 40 30 20 20 20 10 10 - - - - - Central Subzone 550 30 10 30 10 20 30 60 70 90 70 40 40 30 10 10 - - - City Hall 60 - - - - - - - - - - - - - - - - - -Clifford Pier - - - - - - - - - - - - - - - - - - - Marina Centre 20 - - - - - - - - - - - - - - - - - -Maxwell - - - - - - - - - - - - - - - - - - - Phillip - - - - - - - - - - - - - - - - - - - Raffles Place 60 - - - - - - - - - - - - - - - - - -Tanjong Pagar 550 20 10 10 10 10 30 90 80 70 40 50 30 20 20 10 10 10 40
Geylang Total 115,890 4,540 5,070 5,050 6,070 7,210 8,370 8,010 8,520 8,950 8,430 9,290 9,540 8,420 6,930 3,790 3,520 2,280 1,910 Aljunied 41,050 1,470 1,800 1,740 2,020 2,350 2,820 2,830 3,050 3,520 3,110 3,280 3,330 3,000 2,490 1,340 1,290 840 770 Geylang East 32,730 1,480 1,550 1,390 1,690 1,980 2,260 2,290 2,730 2,590 2,260 2,410 2,460 2,360 2,130 1,100 940 600 520 Kallang Way 50 - - - - - - - - - - - - - - - - - -Kampong Ubi 12,890 460 540 640 750 1,020 1,230 930 910 880 840 1,070 1,220 1,010 670 310 210 120 90 Macpherson 29,180 1,130 1,170 1,280 1,600 1,850 2,050 1,960 1,830 1,960 2,220 2,520 2,550 2,060 1,640 1,040 1,080 720 520
Hougang Total 222,870 8,560 9,640 11,020 13,990 16,270 17,370 15,090 14,870 16,320 16,540 19,250 19,560 16,000 11,720 6,160 4,970 3,090 2,470 Defu Industrial Park 30 - - - - - - - - - - - - - - - - - -Hougang Central 4,730 130 180 240 360 400 400 250 250 290 390 440 450 340 230 120 110 80 70 Hougang East 22,740 1,170 910 940 1,320 1,820 2,130 2,070 1,700 1,470 1,460 1,940 1,950 1,520 1,030 530 380 220 180 Hougang West 48,560 1,480 1,750 2,030 2,870 3,920 4,340 3,210 2,990 3,140 3,400 4,540 4,890 3,890 2,750 1,340 970 620 430 Kangkar 28,770 1,370 1,280 1,480 1,700 1,760 2,150 2,250 2,100 2,350 2,140 2,330 2,250 1,970 1,420 820 700 410 300 Kovan 26,060 1,000 1,200 1,410 1,680 1,970 2,050 1,530 1,720 2,030 1,900 2,120 2,150 1,860 1,390 710 640 340 370 Lorong Ah Soo 33,450 1,120 1,310 1,590 1,970 2,130 2,330 2,180 2,260 2,510 2,530 2,710 2,850 2,540 2,120 1,230 970 620 470
Note: Planning areas refer to areas demarcated in the Urban Redevelopment Authority’s Master Plan 2014.
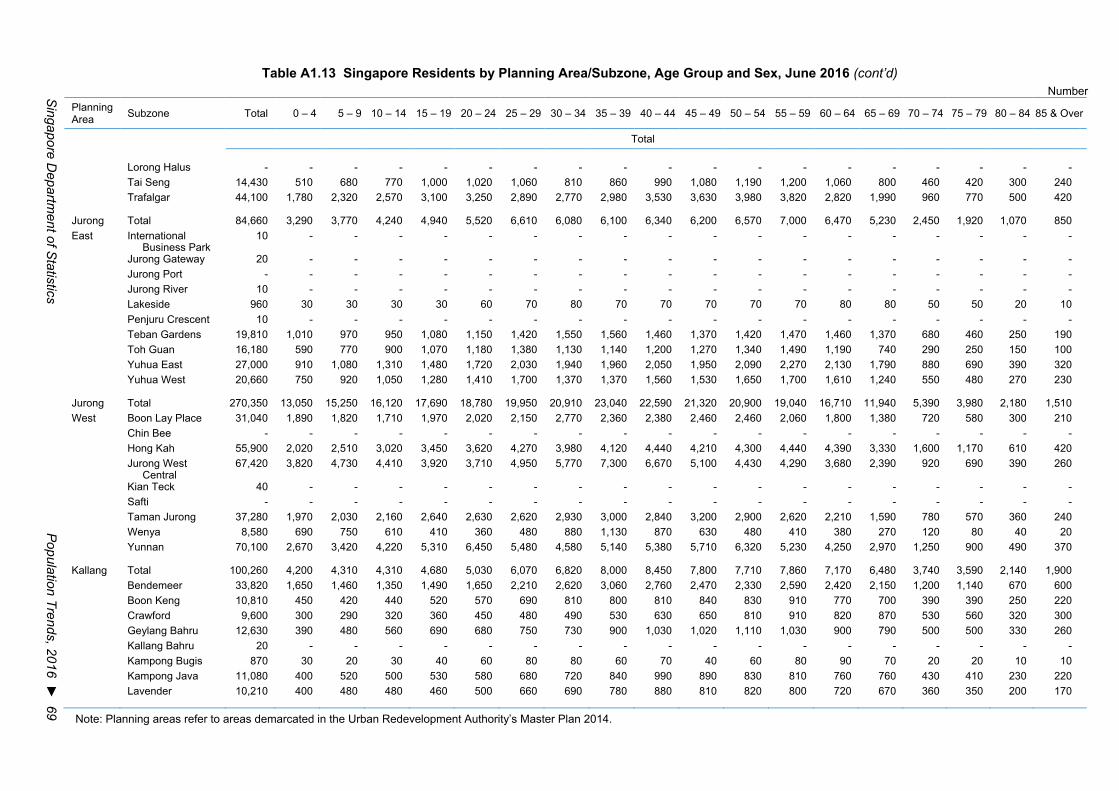
Singapore D
epartment of S
tatistics P
opulation Trends, 2016 ► 69
Table A1.13 Singapore Residents by Planning Area/Subzone, Age Group and Sex, June 2016 (cont’d) Number
Planning Area Subzone Total 0 – 4 5 – 9 10 – 14 15 – 19 20 – 24 25 – 29 30 – 34 35 – 39 40 – 44 45 – 49 50 – 54 55 – 59 60 – 64 65 – 69 70 – 74 75 – 79 80 – 84 85 & Over
Total
Lorong Halus - - - - - - - - - - - - - - - - - - - Tai Seng 14,430 510 680 770 1,000 1,020 1,060 810 860 990 1,080 1,190 1,200 1,060 800 460 420 300 240 Trafalgar 44,100 1,780 2,320 2,570 3,100 3,250 2,890 2,770 2,980 3,530 3,630 3,980 3,820 2,820 1,990 960 770 500 420
Jurong Total 84,660 3,290 3,770 4,240 4,940 5,520 6,610 6,080 6,100 6,340 6,200 6,570 7,000 6,470 5,230 2,450 1,920 1,070 850 East International
Business Park 10 - - - - - - - - - - - - - - - - - -
Jurong Gateway 20 - - - - - - - - - - - - - - - - - -Jurong Port - - - - - - - - - - - - - - - - - - - Jurong River 10 - - - - - - - - - - - - - - - - - -Lakeside 960 30 30 30 30 60 70 80 70 70 70 70 70 80 80 50 50 20 10 Penjuru Crescent 10 - - - - - - - - - - - - - - - - - -Teban Gardens 19,810 1,010 970 950 1,080 1,150 1,420 1,550 1,560 1,460 1,370 1,420 1,470 1,460 1,370 680 460 250 190 Toh Guan 16,180 590 770 900 1,070 1,180 1,380 1,130 1,140 1,200 1,270 1,340 1,490 1,190 740 290 250 150 100 Yuhua East 27,000 910 1,080 1,310 1,480 1,720 2,030 1,940 1,960 2,050 1,950 2,090 2,270 2,130 1,790 880 690 390 320 Yuhua West 20,660 750 920 1,050 1,280 1,410 1,700 1,370 1,370 1,560 1,530 1,650 1,700 1,610 1,240 550 480 270 230
Jurong Total 270,350 13,050 15,250 16,120 17,690 18,780 19,950 20,910 23,040 22,590 21,320 20,900 19,040 16,710 11,940 5,390 3,980 2,180 1,510 West Boon Lay Place 31,040 1,890 1,820 1,710 1,970 2,020 2,150 2,770 2,360 2,380 2,460 2,460 2,060 1,800 1,380 720 580 300 210
Chin Bee - - - - - - - - - - - - - - - - - - - Hong Kah 55,900 2,020 2,510 3,020 3,450 3,620 4,270 3,980 4,120 4,440 4,210 4,300 4,440 4,390 3,330 1,600 1,170 610 420 Jurong West
Central 67,420 3,820 4,730 4,410 3,920 3,710 4,950 5,770 7,300 6,670 5,100 4,430 4,290 3,680 2,390 920 690 390 260
Kian Teck 40 - - - - - - - - - - - - - - - - - -Safti - - - - - - - - - - - - - - - - - - - Taman Jurong 37,280 1,970 2,030 2,160 2,640 2,630 2,620 2,930 3,000 2,840 3,200 2,900 2,620 2,210 1,590 780 570 360 240 Wenya 8,580 690 750 610 410 360 480 880 1,130 870 630 480 410 380 270 120 80 40 20 Yunnan 70,100 2,670 3,420 4,220 5,310 6,450 5,480 4,580 5,140 5,380 5,710 6,320 5,230 4,250 2,970 1,250 900 490 370
Kallang Total 100,260 4,200 4,310 4,310 4,680 5,030 6,070 6,820 8,000 8,450 7,800 7,710 7,860 7,170 6,480 3,740 3,590 2,140 1,900 Bendemeer 33,820 1,650 1,460 1,350 1,490 1,650 2,210 2,620 3,060 2,760 2,470 2,330 2,590 2,420 2,150 1,200 1,140 670 600 Boon Keng 10,810 450 420 440 520 570 690 810 800 810 840 830 910 770 700 390 390 250 220 Crawford 9,600 300 290 320 360 450 480 490 530 630 650 810 910 820 870 530 560 320 300 Geylang Bahru 12,630 390 480 560 690 680 750 730 900 1,030 1,020 1,110 1,030 900 790 500 500 330 260 Kallang Bahru 20 - - - - - - - - - - - - - - - - - -Kampong Bugis 870 30 20 30 40 60 80 80 60 70 40 60 80 90 70 20 20 10 10 Kampong Java 11,080 400 520 500 530 580 680 720 840 990 890 830 810 760 760 430 410 230 220 Lavender 10,210 400 480 480 460 500 660 690 780 880 810 820 800 720 670 360 350 200 170
Note: Planning areas refer to areas demarcated in the Urban Redevelopment Authority’s Master Plan 2014.
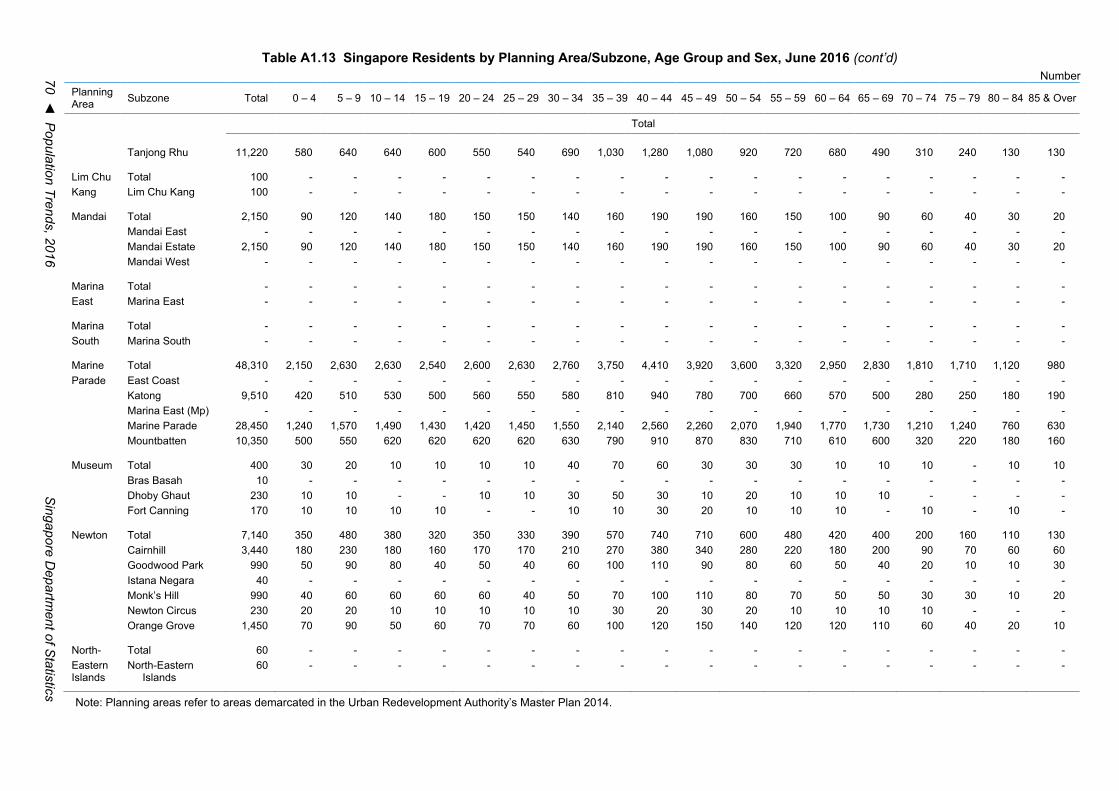
70 ◄ P
opulation Trends, 2016 S
ingapore Departm
ent of Statistics
Table A1.13 Singapore Residents by Planning Area/Subzone, Age Group and Sex, June 2016 (cont’d) Number
Planning Area Subzone Total 0 – 4 5 – 9 10 – 14 15 – 19 20 – 24 25 – 29 30 – 34 35 – 39 40 – 44 45 – 49 50 – 54 55 – 59 60 – 64 65 – 69 70 – 74 75 – 79 80 – 84 85 & Over
Total
Tanjong Rhu 11,220 580 640 640 600 550 540 690 1,030 1,280 1,080 920 720 680 490 310 240 130 130
Lim Chu Total 100 - - - - - - - - - - - - - - - - - -Kang Lim Chu Kang 100 - - - - - - - - - - - - - - - - - -
Mandai Total 2,150 90 120 140 180 150 150 140 160 190 190 160 150 100 90 60 40 30 20 Mandai East - - - - - - - - - - - - - - - - - - - Mandai Estate 2,150 90 120 140 180 150 150 140 160 190 190 160 150 100 90 60 40 30 20 Mandai West - - - - - - - - - - - - - - - - - - -
Marina Total - - - - - - - - - - - - - - - - - - - East Marina East - - - - - - - - - - - - - - - - - - -
Marina Total - - - - - - - - - - - - - - - - - - - South Marina South - - - - - - - - - - - - - - - - - - -
Marine Total 48,310 2,150 2,630 2,630 2,540 2,600 2,630 2,760 3,750 4,410 3,920 3,600 3,320 2,950 2,830 1,810 1,710 1,120 980 Parade East Coast - - - - - - - - - - - - - - - - - - -
Katong 9,510 420 510 530 500 560 550 580 810 940 780 700 660 570 500 280 250 180 190 Marina East (Mp) - - - - - - - - - - - - - - - - - - - Marine Parade 28,450 1,240 1,570 1,490 1,430 1,420 1,450 1,550 2,140 2,560 2,260 2,070 1,940 1,770 1,730 1,210 1,240 760 630 Mountbatten 10,350 500 550 620 620 620 620 630 790 910 870 830 710 610 600 320 220 180 160
Museum Total 400 30 20 10 10 10 10 40 70 60 30 30 30 10 10 10 - 10 10 Bras Basah 10 - - - - - - - - - - - - - - - - - -Dhoby Ghaut 230 10 10 - - 10 10 30 50 30 10 20 10 10 10 - - - -Fort Canning 170 10 10 10 10 - - 10 10 30 20 10 10 10 - 10 - 10 -
Newton Total 7,140 350 480 380 320 350 330 390 570 740 710 600 480 420 400 200 160 110 130 Cairnhill 3,440 180 230 180 160 170 170 210 270 380 340 280 220 180 200 90 70 60 60 Goodwood Park 990 50 90 80 40 50 40 60 100 110 90 80 60 50 40 20 10 10 30 Istana Negara 40 - - - - - - - - - - - - - - - - - -Monk’s Hill 990 40 60 60 60 60 40 50 70 100 110 80 70 50 50 30 30 10 20 Newton Circus 230 20 20 10 10 10 10 10 30 20 30 20 10 10 10 10 - - - Orange Grove 1,450 70 90 50 60 70 70 60 100 120 150 140 120 120 110 60 40 20 10
North- Total 60 - - - - - - - - - - - - - - - - - -Eastern Islands
North-Eastern Islands
60 - - - - - - - - - - - - - - - - - -
Note: Planning areas refer to areas demarcated in the Urban Redevelopment Authority’s Master Plan 2014.
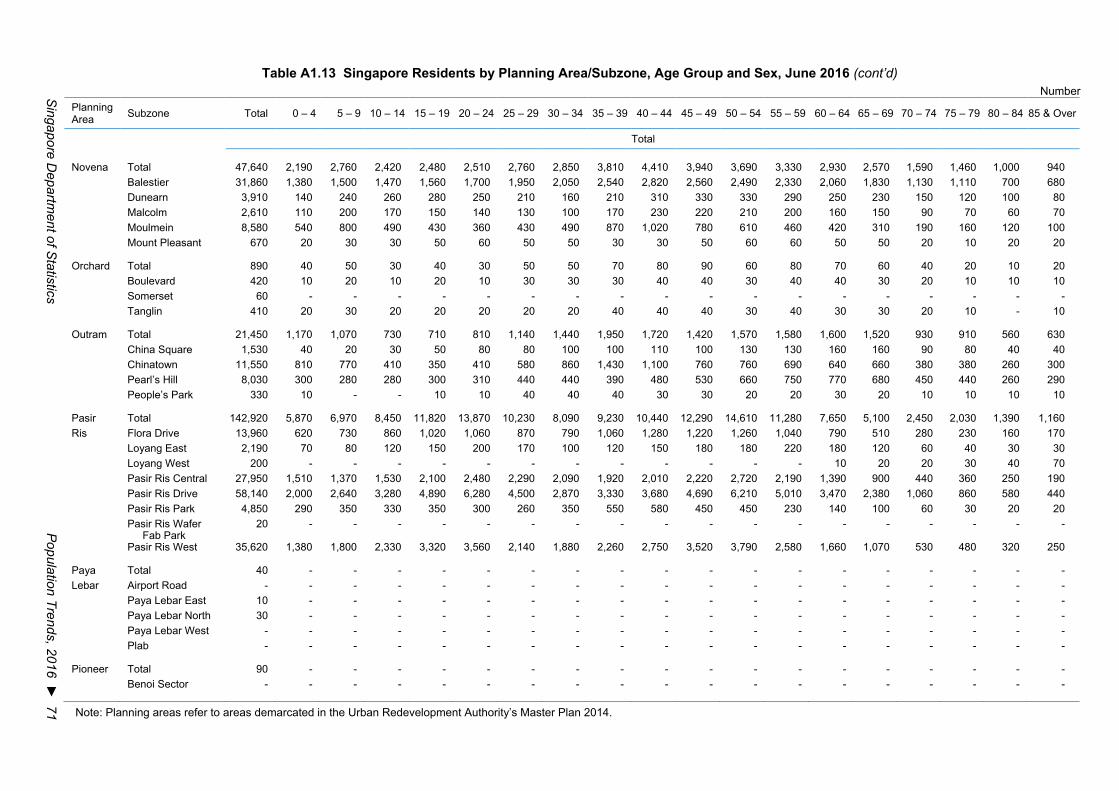
Singapore D
epartment of S
tatistics P
opulation Trends, 2016 ► 71
Table A1.13 Singapore Residents by Planning Area/Subzone, Age Group and Sex, June 2016 (cont’d) Number
Planning Area Subzone Total 0 – 4 5 – 9 10 – 14 15 – 19 20 – 24 25 – 29 30 – 34 35 – 39 40 – 44 45 – 49 50 – 54 55 – 59 60 – 64 65 – 69 70 – 74 75 – 79 80 – 84 85 & Over
Total
Novena Total 47,640 2,190 2,760 2,420 2,480 2,510 2,760 2,850 3,810 4,410 3,940 3,690 3,330 2,930 2,570 1,590 1,460 1,000 940 Balestier 31,860 1,380 1,500 1,470 1,560 1,700 1,950 2,050 2,540 2,820 2,560 2,490 2,330 2,060 1,830 1,130 1,110 700 680 Dunearn 3,910 140 240 260 280 250 210 160 210 310 330 330 290 250 230 150 120 100 80 Malcolm 2,610 110 200 170 150 140 130 100 170 230 220 210 200 160 150 90 70 60 70 Moulmein 8,580 540 800 490 430 360 430 490 870 1,020 780 610 460 420 310 190 160 120 100 Mount Pleasant 670 20 30 30 50 60 50 50 30 30 50 60 60 50 50 20 10 20 20
Orchard Total 890 40 50 30 40 30 50 50 70 80 90 60 80 70 60 40 20 10 20 Boulevard 420 10 20 10 20 10 30 30 30 40 40 30 40 40 30 20 10 10 10 Somerset 60 - - - - - - - - - - - - - - - - - -Tanglin 410 20 30 20 20 20 20 20 40 40 40 30 40 30 30 20 10 - 10
Outram Total 21,450 1,170 1,070 730 710 810 1,140 1,440 1,950 1,720 1,420 1,570 1,580 1,600 1,520 930 910 560 630China Square 1,530 40 20 30 50 80 80 100 100 110 100 130 130 160 160 90 80 40 40Chinatown 11,550 810 770 410 350 410 580 860 1,430 1,100 760 760 690 640 660 380 380 260 300Pearl’s Hill 8,030 300 280 280 300 310 440 440 390 480 530 660 750 770 680 450 440 260 290People’s Park 330 10 - - 10 10 40 40 40 30 30 20 20 30 20 10 10 10 10
Pasir Total 142,920 5,870 6,970 8,450 11,820 13,870 10,230 8,090 9,230 10,440 12,290 14,610 11,280 7,650 5,100 2,450 2,030 1,390 1,160 Ris Flora Drive 13,960 620 730 860 1,020 1,060 870 790 1,060 1,280 1,220 1,260 1,040 790 510 280 230 160 170
Loyang East 2,190 70 80 120 150 200 170 100 120 150 180 180 220 180 120 60 40 30 30 Loyang West 200 - - - - - - - - - - - - 10 20 20 30 40 70 Pasir Ris Central 27,950 1,510 1,370 1,530 2,100 2,480 2,290 2,090 1,920 2,010 2,220 2,720 2,190 1,390 900 440 360 250 190 Pasir Ris Drive 58,140 2,000 2,640 3,280 4,890 6,280 4,500 2,870 3,330 3,680 4,690 6,210 5,010 3,470 2,380 1,060 860 580 440 Pasir Ris Park 4,850 290 350 330 350 300 260 350 550 580 450 450 230 140 100 60 30 20 20 Pasir Ris Wafer
Fab Park 20 - - - - - - - - - - - - - - - - - -
Pasir Ris West 35,620 1,380 1,800 2,330 3,320 3,560 2,140 1,880 2,260 2,750 3,520 3,790 2,580 1,660 1,070 530 480 320 250
Paya Total 40 - - - - - - - - - - - - - - - - - -Lebar Airport Road - - - - - - - - - - - - - - - - - - -
Paya Lebar East 10 - - - - - - - - - - - - - - - - - -Paya Lebar North 30 - - - - - - - - - - - - - - - - - -Paya Lebar West - - - - - - - - - - - - - - - - - - - Plab - - - - - - - - - - - - - - - - - - -
Pioneer Total 90 - - - - - - - - - - - - - - - - - -Benoi Sector - - - - - - - - - - - - - - - - - - -
Note: Planning areas refer to areas demarcated in the Urban Redevelopment Authority’s Master Plan 2014.

72 ◄ P
opulation Trends, 2016 S
ingapore Departm
ent of Statistics
Table A1.13 Singapore Residents by Planning Area/Subzone, Age Group and Sex, June 2016 (cont’d) Number
Planning Area Subzone Total 0 – 4 5 – 9 10 – 14 15 – 19 20 – 24 25 – 29 30 – 34 35 – 39 40 – 44 45 – 49 50 – 54 55 – 59 60 – 64 65 – 69 70 – 74 75 – 79 80 – 84 85 & Over
Total
Gul Basin 20 - - - - - - - - - - - - - - - - - -Gul Circle 40 - - - - - - - - - - - - - - - - - -Joo Koon 30 - - - - - - - - - - - - - - - - - -Pioneer Sector - - - - - - - - - - - - - - - - - - -
Punggol Total 130,380 14,490 10,870 7,460 5,590 4,490 7,840 18,030 16,250 12,600 7,960 6,600 5,430 4,590 3,750 1,780 1,330 740 590 Coney Island - - - - - - - - - - - - - - - - - - - Matilda 37,380 5,210 2,960 1,690 1,320 1,120 2,210 6,670 4,940 3,120 1,920 1,620 1,330 1,210 1,010 460 320 160 130 Northshore 290 10 20 20 30 30 20 10 10 20 30 40 20 20 10 10 10 10 - Punggol Canal - - - - - - - - - - - - - - - - - - - Punggol Field 45,200 2,890 3,860 3,480 2,660 2,050 2,230 3,230 4,890 5,440 3,600 2,880 2,540 1,970 1,530 750 600 340 270 Punggol Town
Centre 11,640 1,850 990 450 300 230 890 2,420 1,770 830 490 400 260 260 230 100 80 50 30
Waterway East 35,860 4,540 3,050 1,830 1,280 1,070 2,490 5,700 4,640 3,190 1,920 1,670 1,280 1,140 970 470 320 180 150
Queenstown Total 99,350 4,800 4,470 4,280 4,730 5,090 6,320 7,460 7,760 8,070 7,580 7,550 6,750 6,250 6,130 3,780 3,920 2,530 1,900 Commonwealth 7,940 290 280 310 340 370 520 530 530 610 590 680 610 520 520 340 390 310 220 Dover 12,590 580 760 690 720 740 770 790 980 1,060 1,050 970 850 710 720 430 390 240 170 Ghim Moh 11,810 560 530 490 560 600 740 810 830 890 820 860 710 720 850 600 600 380 250 Holland Drive 14,000 490 470 500 590 590 840 870 1,020 1,240 1,110 1,040 960 930 1,060 720 760 460 350 Kent Ridge 1,020 20 50 60 40 60 90 80 60 80 100 90 80 80 70 30 30 10 - Margaret Drive 13,660 1,280 780 510 540 490 830 1,780 1,510 1,160 860 780 700 680 680 350 360 220 160 Mei Chin 16,430 580 680 780 940 1,020 1,070 1,010 1,040 1,190 1,300 1,440 1,290 1,170 920 550 670 420 370 National University
of S’pore 290 20 10 10 10 110 50 20 20 20 10 10 10 10 - - - - -
One North 600 40 50 20 30 20 20 50 70 80 80 50 30 20 20 10 - - - Pasir Panjang 1 4,090 210 210 190 220 260 290 310 350 370 350 330 290 250 210 100 80 40 50 Pasir Panjang 2 3,430 150 120 170 210 250 250 230 230 240 270 280 280 330 210 100 70 30 30 Port 130 - - 10 10 10 20 10 10 - 10 10 20 10 10 10 - - - Queensway 280 - 10 10 10 20 20 20 20 30 30 30 10 30 20 10 10 - -Singapore
Polytechnic 170 20 20 10 10 10 10 10 30 20 10 10 10 10 - - - - -
Tanglin Halt 12,920 560 520 530 500 530 810 940 1,070 1,090 1,000 970 920 790 860 550 570 420 300
River Valley Total 9,340 440 500 510 420 450 510 610 890 1,040 920 740 580 520 490 270 200 100 130 Institution Hill 3,370 220 220 190 140 140 190 260 370 430 310 230 160 170 170 70 60 30 20 Leonie Hill 2,530 100 140 150 120 130 130 160 250 310 290 210 150 140 110 60 30 20 20 One Tree Hill 1,860 60 70 100 110 110 90 90 120 150 180 190 160 120 110 80 50 30 40
Note: Planning areas refer to areas demarcated in the Urban Redevelopment Authority’s Master Plan 2014.

Singapore D
epartment of S
tatistics P
opulation Trends, 2016 ► 73
Table A1.13 Singapore Residents by Planning Area/Subzone, Age Group and Sex, June 2016 (cont’d) Number
Planning Area Subzone Total 0 – 4 5 – 9 10 – 14 15 – 19 20 – 24 25 – 29 30 – 34 35 – 39 40 – 44 45 – 49 50 – 54 55 – 59 60 – 64 65 – 69 70 – 74 75 – 79 80 – 84 85 & Over
Total
Oxley 1,400 50 70 70 40 60 90 80 130 120 130 100 100 90 90 60 50 20 40 Paterson 180 10 10 10 10 10 10 20 20 20 20 20 10 10 10 - - - -
Rochor Total 14,270 530 520 550 620 660 870 950 1,200 1,230 1,060 1,090 1,100 1,030 960 580 530 360 410 Bencoolen 1,450 70 50 40 60 70 80 100 100 120 130 120 130 100 90 50 50 50 50 Farrer Park 3,030 110 140 140 140 120 180 210 290 270 230 210 220 220 170 110 80 70 110 Kampong Glam 180 10 10 - - 10 10 10 10 20 10 10 10 10 10 10 10 10 30 Little India 3,700 90 120 140 180 190 230 200 260 320 270 290 320 300 280 160 170 90 100 Mackenzie 120 - 10 10 10 - 10 20 20 20 10 10 - - - - - - - Mount Emily 1,170 60 70 60 30 30 70 120 180 170 100 80 60 50 40 10 20 10 20 Rochor Canal 10 - - - - - - - - - - - - - - - - - -Selegie 250 10 10 10 10 20 10 20 40 30 20 20 20 20 10 10 10 10 10 Sungei Road 2,350 110 70 120 120 130 150 140 160 160 170 190 150 160 180 120 100 80 40 Victoria 2,030 60 40 50 70 90 130 140 150 150 130 170 190 160 190 110 100 60 60
Seletar Total 250 10 20 20 20 10 - 10 10 40 30 30 20 10 10 - 10 - -Pulau Punggol
Barat - - - - - - - - - - - - - - - - - - -
Pulau Punggol Timor
- - - - - - - - - - - - - - - - - - -
Seletar 230 10 20 20 20 10 - 10 10 40 30 30 10 10 - - - - - Seletar Aerospace
Park 20 - - - - - - - - - - - - - - - - - -
Sembawang Total 77,350 4,390 5,220 5,350 5,060 4,560 5,150 6,030 7,100 7,620 6,290 5,850 5,140 3,680 2,430 1,300 1,040 640 510 Admiralty 14,510 990 1,080 1,010 830 700 1,000 1,300 1,370 1,520 1,070 990 890 600 450 280 210 140 80 Sembawang Central 28,830 1,440 1,730 1,890 2,060 1,870 2,080 2,130 2,490 2,760 2,450 2,310 2,060 1,460 870 440 360 230 190 Sembawang East 90 - - - - - - - - - - - - - - - - - -Sembawang North 27,110 1,680 1,990 1,960 1,670 1,550 1,660 2,270 2,720 2,690 2,150 1,910 1,780 1,290 830 400 300 170 110 Sembawang
Springs 5,010 180 310 380 370 310 300 240 390 480 460 440 280 240 200 130 130 80 110
Sembawang Straits 1,750 90 100 100 140 140 120 70 110 160 150 180 130 80 70 50 30 20 10 Senoko North 20 - - - - - - - - - - - - - - - - - -Senoko South 20 - - - - - - - - - - - - - - - - - -The Wharves - - - - - - - - - - - - - - - - - - -
Sengkang Total 219,380 16,650 15,700 13,270 12,660 11,370 14,900 21,950 22,200 20,230 15,800 14,370 13,390 10,250 7,450 3,590 2,730 1,580 1,320 Anchorvale 39,170 3,240 3,110 2,650 1,970 1,630 2,850 4,190 4,000 4,220 2,660 2,160 2,120 1,670 1,260 600 460 220 180
Note: Planning areas refer to areas demarcated in the Urban Redevelopment Authority’s Master Plan 2014.
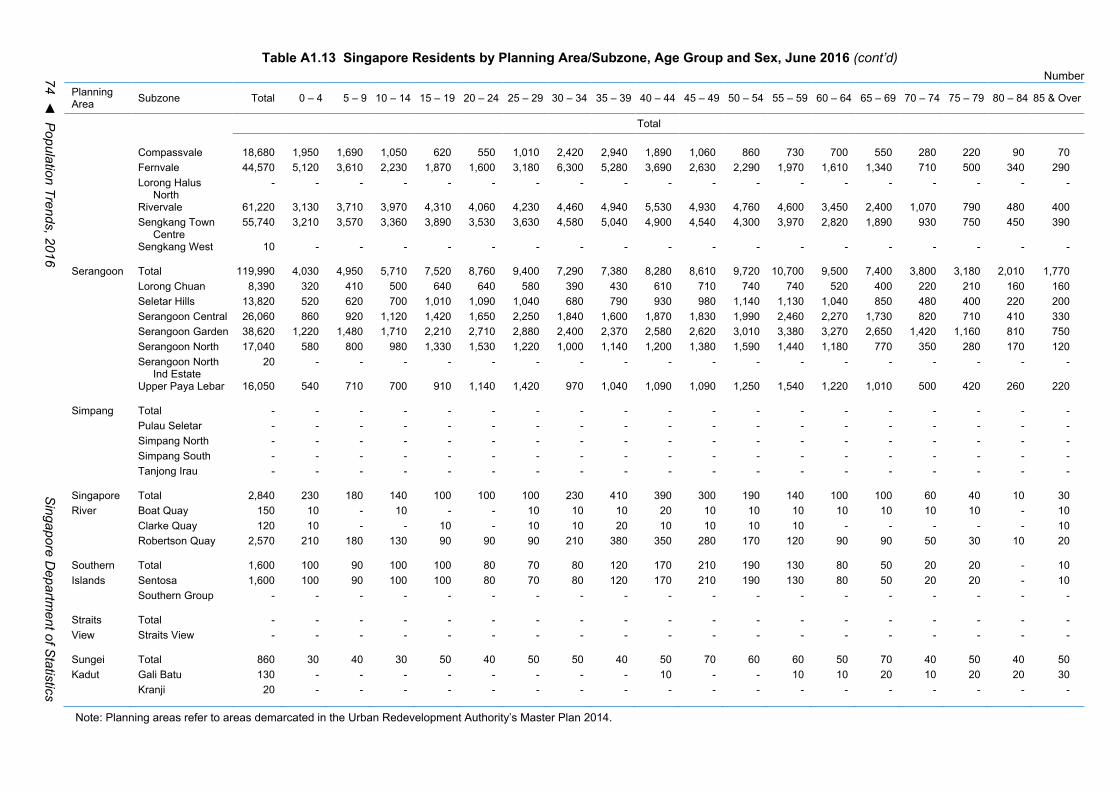
74 ◄ P
opulation Trends, 2016 S
ingapore Departm
ent of Statistics
Table A1.13 Singapore Residents by Planning Area/Subzone, Age Group and Sex, June 2016 (cont’d) Number
Planning Area Subzone Total 0 – 4 5 – 9 10 – 14 15 – 19 20 – 24 25 – 29 30 – 34 35 – 39 40 – 44 45 – 49 50 – 54 55 – 59 60 – 64 65 – 69 70 – 74 75 – 79 80 – 84 85 & Over
Total Compassvale 18,680 1,950 1,690 1,050 620 550 1,010 2,420 2,940 1,890 1,060 860 730 700 550 280 220 90 70 Fernvale 44,570 5,120 3,610 2,230 1,870 1,600 3,180 6,300 5,280 3,690 2,630 2,290 1,970 1,610 1,340 710 500 340 290 Lorong Halus
North - - - - - - - - - - - - - - - - - - -
Rivervale 61,220 3,130 3,710 3,970 4,310 4,060 4,230 4,460 4,940 5,530 4,930 4,760 4,600 3,450 2,400 1,070 790 480 400 Sengkang Town
Centre 55,740 3,210 3,570 3,360 3,890 3,530 3,630 4,580 5,040 4,900 4,540 4,300 3,970 2,820 1,890 930 750 450 390
Sengkang West
10 - - - - - - - - - - - - - - - - - -
Serangoon Total 119,990 4,030 4,950 5,710 7,520 8,760 9,400 7,290 7,380 8,280 8,610 9,720 10,700 9,500 7,400 3,800 3,180 2,010 1,770 Lorong Chuan 8,390 320 410 500 640 640 580 390 430 610 710 740 740 520 400 220 210 160 160 Seletar Hills 13,820 520 620 700 1,010 1,090 1,040 680 790 930 980 1,140 1,130 1,040 850 480 400 220 200 Serangoon Central 26,060 860 920 1,120 1,420 1,650 2,250 1,840 1,600 1,870 1,830 1,990 2,460 2,270 1,730 820 710 410 330 Serangoon Garden 38,620 1,220 1,480 1,710 2,210 2,710 2,880 2,400 2,370 2,580 2,620 3,010 3,380 3,270 2,650 1,420 1,160 810 750 Serangoon North 17,040 580 800 980 1,330 1,530 1,220 1,000 1,140 1,200 1,380 1,590 1,440 1,180 770 350 280 170 120 Serangoon North
Ind Estate 20 - - - - - - - - - - - - - - - - - -
Upper Paya Lebar
16,050 540 710 700 910 1,140 1,420 970 1,040 1,090 1,090 1,250 1,540 1,220 1,010 500 420 260 220
Simpang Total - - - - - - - - - - - - - - - - - - - Pulau Seletar - - - - - - - - - - - - - - - - - - - Simpang North - - - - - - - - - - - - - - - - - - - Simpang South - - - - - - - - - - - - - - - - - - - Tanjong Irau
- - - - - - - - - - - - - - - - - - -
Singapore Total 2,840 230 180 140 100 100 100 230 410 390 300 190 140 100 100 60 40 10 30 River Boat Quay 150 10 - 10 - - 10 10 10 20 10 10 10 10 10 10 10 - 10 Clarke Quay 120 10 - - 10 - 10 10 20 10 10 10 10 - - - - - 10 Robertson Quay
2,570 210 180 130 90 90 90 210 380 350 280 170 120 90 90 50 30 10 20
Southern Total 1,600 100 90 100 100 80 70 80 120 170 210 190 130 80 50 20 20 - 10 Islands Sentosa 1,600 100 90 100 100 80 70 80 120 170 210 190 130 80 50 20 20 - 10 Southern Group
- - - - - - - - - - - - - - - - - - -
Straits Total - - - - - - - - - - - - - - - - - - - View
Straits View - - - - - - - - - - - - - - - - - - -
Sungei Total 860 30 40 30 50 40 50 50 40 50 70 60 60 50 70 40 50 40 50 Kadut Gali Batu 130 - - - - - - - - 10 - - 10 10 20 10 20 20 30 Kranji 20 - - - - - - - - - - - - - - - - - -
Note: Planning areas refer to areas demarcated in the Urban Redevelopment Authority’s Master Plan 2014.
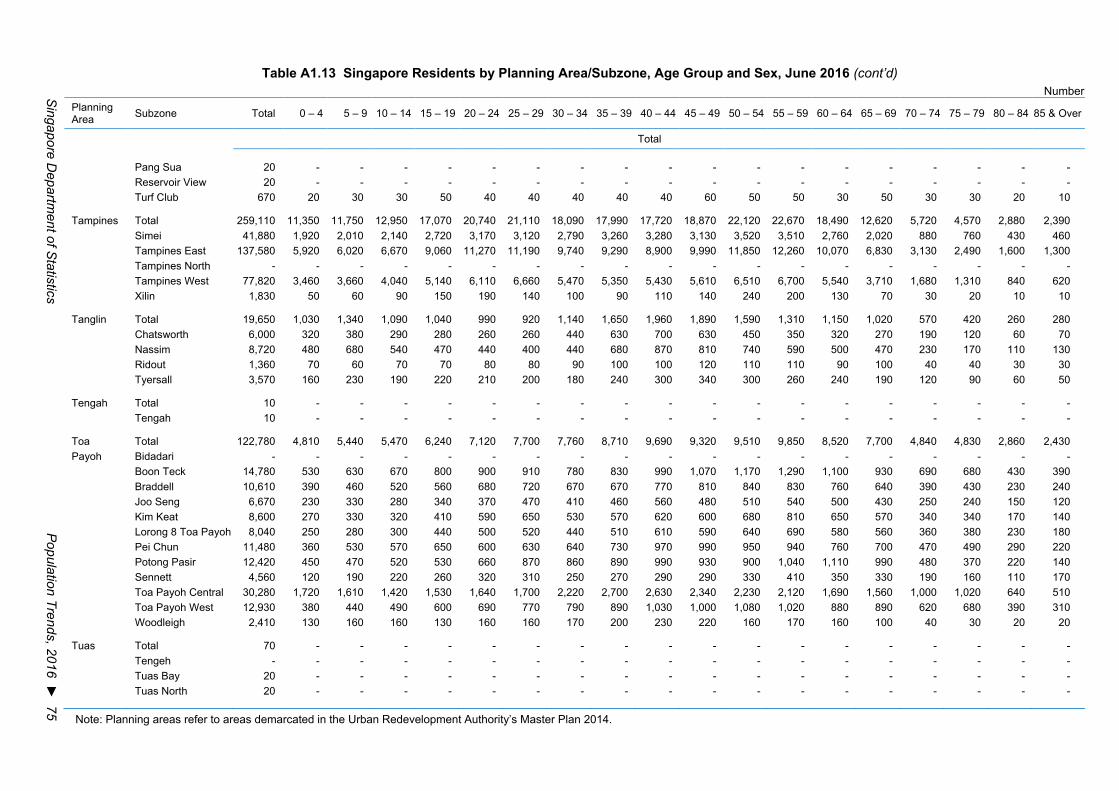
Singapore D
epartment of S
tatistics P
opulation Trends, 2016 ► 75
Table A1.13 Singapore Residents by Planning Area/Subzone, Age Group and Sex, June 2016 (cont’d) Number
Planning Area Subzone Total 0 – 4 5 – 9 10 – 14 15 – 19 20 – 24 25 – 29 30 – 34 35 – 39 40 – 44 45 – 49 50 – 54 55 – 59 60 – 64 65 – 69 70 – 74 75 – 79 80 – 84 85 & Over
Total
Pang Sua 20 - - - - - - - - - - - - - - - - - -Reservoir View 20 - - - - - - - - - - - - - - - - - -Turf Club 670 20 30 30 50 40 40 40 40 40 60 50 50 30 50 30 30 20 10
Tampines Total 259,110 11,350 11,750 12,950 17,070 20,740 21,110 18,090 17,990 17,720 18,870 22,120 22,670 18,490 12,620 5,720 4,570 2,880 2,390 Simei 41,880 1,920 2,010 2,140 2,720 3,170 3,120 2,790 3,260 3,280 3,130 3,520 3,510 2,760 2,020 880 760 430 460 Tampines East 137,580 5,920 6,020 6,670 9,060 11,270 11,190 9,740 9,290 8,900 9,990 11,850 12,260 10,070 6,830 3,130 2,490 1,600 1,300 Tampines North - - - - - - - - - - - - - - - - - - - Tampines West 77,820 3,460 3,660 4,040 5,140 6,110 6,660 5,470 5,350 5,430 5,610 6,510 6,700 5,540 3,710 1,680 1,310 840 620 Xilin 1,830 50 60 90 150 190 140 100 90 110 140 240 200 130 70 30 20 10 10
Tanglin Total 19,650 1,030 1,340 1,090 1,040 990 920 1,140 1,650 1,960 1,890 1,590 1,310 1,150 1,020 570 420 260 280 Chatsworth 6,000 320 380 290 280 260 260 440 630 700 630 450 350 320 270 190 120 60 70 Nassim 8,720 480 680 540 470 440 400 440 680 870 810 740 590 500 470 230 170 110 130 Ridout 1,360 70 60 70 70 80 80 90 100 100 120 110 110 90 100 40 40 30 30 Tyersall 3,570 160 230 190 220 210 200 180 240 300 340 300 260 240 190 120 90 60 50
Tengah Total 10 - - - - - - - - - - - - - - - - - -Tengah 10 - - - - - - - - - - - - - - - - - -
Toa Total 122,780 4,810 5,440 5,470 6,240 7,120 7,700 7,760 8,710 9,690 9,320 9,510 9,850 8,520 7,700 4,840 4,830 2,860 2,430 Payoh Bidadari - - - - - - - - - - - - - - - - - - -
Boon Teck 14,780 530 630 670 800 900 910 780 830 990 1,070 1,170 1,290 1,100 930 690 680 430 390 Braddell 10,610 390 460 520 560 680 720 670 670 770 810 840 830 760 640 390 430 230 240 Joo Seng 6,670 230 330 280 340 370 470 410 460 560 480 510 540 500 430 250 240 150 120 Kim Keat 8,600 270 330 320 410 590 650 530 570 620 600 680 810 650 570 340 340 170 140 Lorong 8 Toa Payoh 8,040 250 280 300 440 500 520 440 510 610 590 640 690 580 560 360 380 230 180 Pei Chun 11,480 360 530 570 650 600 630 640 730 970 990 950 940 760 700 470 490 290 220 Potong Pasir 12,420 450 470 520 530 660 870 860 890 990 930 900 1,040 1,110 990 480 370 220 140 Sennett 4,560 120 190 220 260 320 310 250 270 290 290 330 410 350 330 190 160 110 170 Toa Payoh Central 30,280 1,720 1,610 1,420 1,530 1,640 1,700 2,220 2,700 2,630 2,340 2,230 2,120 1,690 1,560 1,000 1,020 640 510 Toa Payoh West 12,930 380 440 490 600 690 770 790 890 1,030 1,000 1,080 1,020 880 890 620 680 390 310 Woodleigh 2,410 130 160 160 130 160 160 170 200 230 220 160 170 160 100 40 30 20 20
Tuas Total 70 - - - - - - - - - - - - - - - - - -Tengeh - - - - - - - - - - - - - - - - - - - Tuas Bay 20 - - - - - - - - - - - - - - - - - -Tuas North 20 - - - - - - - - - - - - - - - - - -
Note: Planning areas refer to areas demarcated in the Urban Redevelopment Authority’s Master Plan 2014.
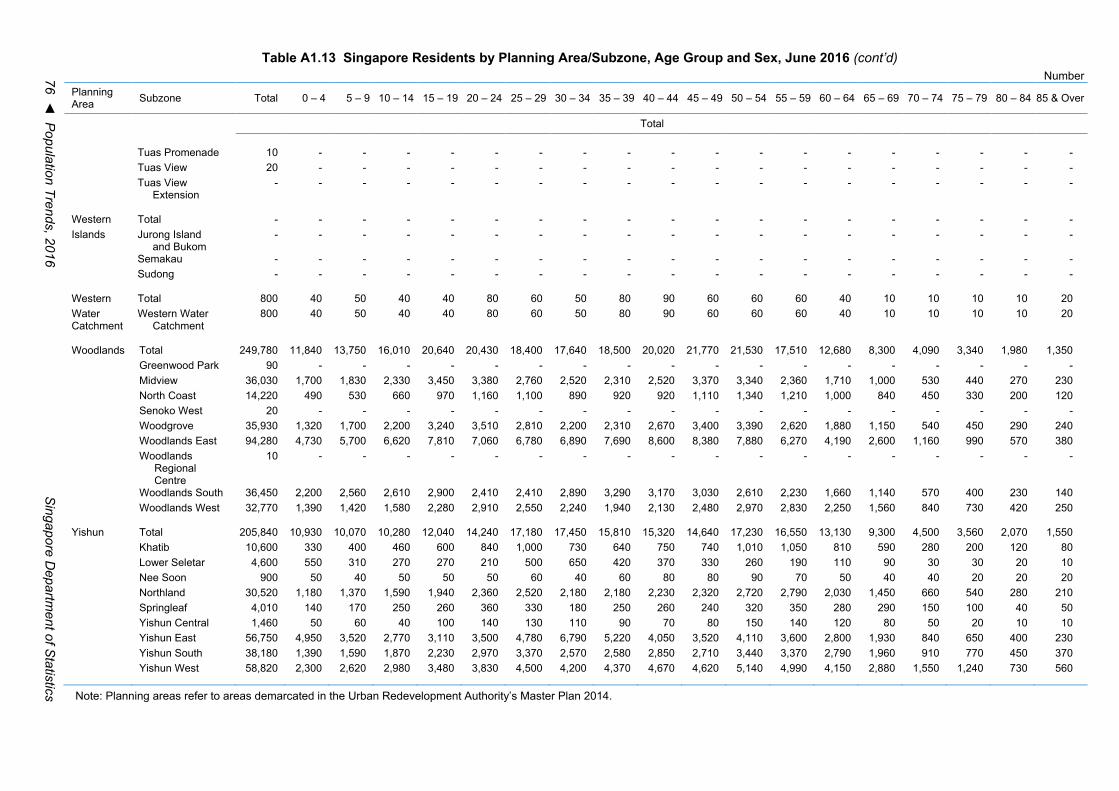
76 ◄ P
opulation Trends, 2016 S
ingapore Departm
ent of Statistics
Table A1.13 Singapore Residents by Planning Area/Subzone, Age Group and Sex, June 2016 (cont’d) Number
Planning Area Subzone Total 0 – 4 5 – 9 10 – 14 15 – 19 20 – 24 25 – 29 30 – 34 35 – 39 40 – 44 45 – 49 50 – 54 55 – 59 60 – 64 65 – 69 70 – 74 75 – 79 80 – 84 85 & Over
Total Tuas Promenade 10 - - - - - - - - - - - - - - - - - - Tuas View 20 - - - - - - - - - - - - - - - - - - Tuas View
Extension
- - - - - - - - - - - - - - - - - - -
Western Total - - - - - - - - - - - - - - - - - - - Islands Jurong Island
and Bukom - - - - - - - - - - - - - - - - - - -
Semakau - - - - - - - - - - - - - - - - - - - Sudong
- - - - - - - - - - - - - - - - - - -
Western Total 800 40 50 40 40 80 60 50 80 90 60 60 60 40 10 10 10 10 20 Water Catchment
Western Water Catchment
800 40 50 40 40 80 60 50 80 90 60 60 60 40 10 10 10 10 20
Woodlands Total 249,780 11,840 13,750 16,010 20,640 20,430 18,400 17,640 18,500 20,020 21,770 21,530 17,510 12,680 8,300 4,090 3,340 1,980 1,350 Greenwood Park 90 - - - - - - - - - - - - - - - - - - Midview 36,030 1,700 1,830 2,330 3,450 3,380 2,760 2,520 2,310 2,520 3,370 3,340 2,360 1,710 1,000 530 440 270 230 North Coast 14,220 490 530 660 970 1,160 1,100 890 920 920 1,110 1,340 1,210 1,000 840 450 330 200 120 Senoko West 20 - - - - - - - - - - - - - - - - - - Woodgrove 35,930 1,320 1,700 2,200 3,240 3,510 2,810 2,200 2,310 2,670 3,400 3,390 2,620 1,880 1,150 540 450 290 240 Woodlands East 94,280 4,730 5,700 6,620 7,810 7,060 6,780 6,890 7,690 8,600 8,380 7,880 6,270 4,190 2,600 1,160 990 570 380 Woodlands
Regional Centre
10 - - - - - - - - - - - - - - - - - -
Woodlands South 36,450 2,200 2,560 2,610 2,900 2,410 2,410 2,890 3,290 3,170 3,030 2,610 2,230 1,660 1,140 570 400 230 140 Woodlands West
32,770 1,390 1,420 1,580 2,280 2,910 2,550 2,240 1,940 2,130 2,480 2,970 2,830 2,250 1,560 840 730 420 250
Yishun Total 205,840 10,930 10,070 10,280 12,040 14,240 17,180 17,450 15,810 15,320 14,640 17,230 16,550 13,130 9,300 4,500 3,560 2,070 1,550 Khatib 10,600 330 400 460 600 840 1,000 730 640 750 740 1,010 1,050 810 590 280 200 120 80 Lower Seletar 4,600 550 310 270 270 210 500 650 420 370 330 260 190 110 90 30 30 20 10 Nee Soon 900 50 40 50 50 50 60 40 60 80 80 90 70 50 40 40 20 20 20 Northland 30,520 1,180 1,370 1,590 1,940 2,360 2,520 2,180 2,180 2,230 2,320 2,720 2,790 2,030 1,450 660 540 280 210 Springleaf 4,010 140 170 250 260 360 330 180 250 260 240 320 350 280 290 150 100 40 50 Yishun Central 1,460 50 60 40 100 140 130 110 90 70 80 150 140 120 80 50 20 10 10 Yishun East 56,750 4,950 3,520 2,770 3,110 3,500 4,780 6,790 5,220 4,050 3,520 4,110 3,600 2,800 1,930 840 650 400 230 Yishun South 38,180 1,390 1,590 1,870 2,230 2,970 3,370 2,570 2,580 2,850 2,710 3,440 3,370 2,790 1,960 910 770 450 370 Yishun West 58,820 2,300 2,620 2,980 3,480 3,830 4,500 4,200 4,370 4,670 4,620 5,140 4,990 4,150 2,880 1,550 1,240 730 560
Note: Planning areas refer to areas demarcated in the Urban Redevelopment Authority’s Master Plan 2014.
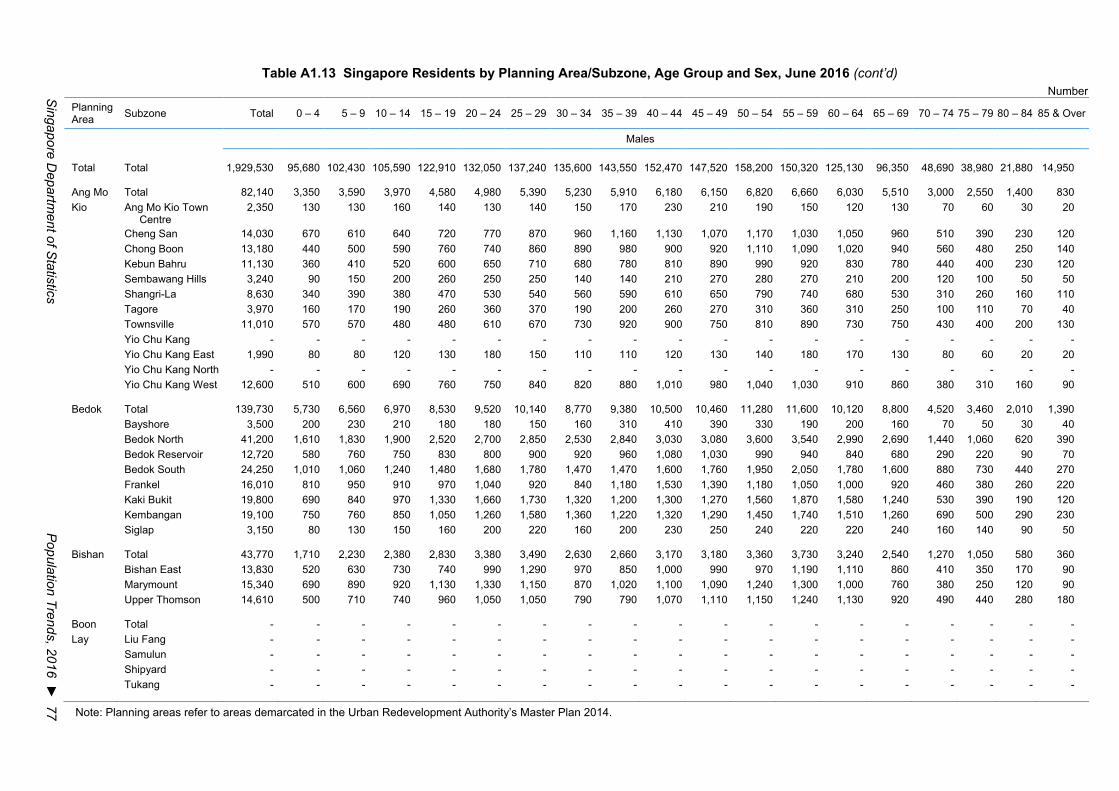
Singapore D
epartment of S
tatistics P
opulation Trends, 2016 ► 77
Table A1.13 Singapore Residents by Planning Area/Subzone, Age Group and Sex, June 2016 (cont’d) Number
Planning Area Subzone Total 0 – 4 5 – 9 10 – 14 15 – 19 20 – 24 25 – 29 30 – 34 35 – 39 40 – 44 45 – 49 50 – 54 55 – 59 60 – 64 65 – 69 70 – 74 75 – 79 80 – 84 85 & Over
Males
Total Total 1,929,530 95,680 102,430 105,590 122,910 132,050 137,240 135,600 143,550 152,470 147,520 158,200 150,320 125,130 96,350 48,690 38,980 21,880 14,950
Ang Mo Total 82,140 3,350 3,590 3,970 4,580 4,980 5,390 5,230 5,910 6,180 6,150 6,820 6,660 6,030 5,510 3,000 2,550 1,400 830 Kio Ang Mo Kio Town
Centre 2,350 130 130 160 140 130 140 150 170 230 210 190 150 120 130 70 60 30 20
Cheng San 14,030 670 610 640 720 770 870 960 1,160 1,130 1,070 1,170 1,030 1,050 960 510 390 230 120 Chong Boon 13,180 440 500 590 760 740 860 890 980 900 920 1,110 1,090 1,020 940 560 480 250 140 Kebun Bahru 11,130 360 410 520 600 650 710 680 780 810 890 990 920 830 780 440 400 230 120 Sembawang Hills 3,240 90 150 200 260 250 250 140 140 210 270 280 270 210 200 120 100 50 50 Shangri-La 8,630 340 390 380 470 530 540 560 590 610 650 790 740 680 530 310 260 160 110 Tagore 3,970 160 170 190 260 360 370 190 200 260 270 310 360 310 250 100 110 70 40 Townsville 11,010 570 570 480 480 610 670 730 920 900 750 810 890 730 750 430 400 200 130 Yio Chu Kang - - - - - - - - - - - - - - - - - - - Yio Chu Kang East 1,990 80 80 120 130 180 150 110 110 120 130 140 180 170 130 80 60 20 20 Yio Chu Kang North - - - - - - - - - - - - - - - - - - - Yio Chu Kang West 12,600 510 600 690 760 750 840 820 880 1,010 980 1,040 1,030 910 860 380 310 160 90
Bedok Total 139,730 5,730 6,560 6,970 8,530 9,520 10,140 8,770 9,380 10,500 10,460 11,280 11,600 10,120 8,800 4,520 3,460 2,010 1,390 Bayshore 3,500 200 230 210 180 180 150 160 310 410 390 330 190 200 160 70 50 30 40 Bedok North 41,200 1,610 1,830 1,900 2,520 2,700 2,850 2,530 2,840 3,030 3,080 3,600 3,540 2,990 2,690 1,440 1,060 620 390 Bedok Reservoir 12,720 580 760 750 830 800 900 920 960 1,080 1,030 990 940 840 680 290 220 90 70 Bedok South 24,250 1,010 1,060 1,240 1,480 1,680 1,780 1,470 1,470 1,600 1,760 1,950 2,050 1,780 1,600 880 730 440 270 Frankel 16,010 810 950 910 970 1,040 920 840 1,180 1,530 1,390 1,180 1,050 1,000 920 460 380 260 220 Kaki Bukit 19,800 690 840 970 1,330 1,660 1,730 1,320 1,200 1,300 1,270 1,560 1,870 1,580 1,240 530 390 190 120 Kembangan 19,100 750 760 850 1,050 1,260 1,580 1,360 1,220 1,320 1,290 1,450 1,740 1,510 1,260 690 500 290 230 Siglap 3,150 80 130 150 160 200 220 160 200 230 250 240 220 220 240 160 140 90 50
Bishan Total 43,770 1,710 2,230 2,380 2,830 3,380 3,490 2,630 2,660 3,170 3,180 3,360 3,730 3,240 2,540 1,270 1,050 580 360 Bishan East 13,830 520 630 730 740 990 1,290 970 850 1,000 990 970 1,190 1,110 860 410 350 170 90 Marymount 15,340 690 890 920 1,130 1,330 1,150 870 1,020 1,100 1,090 1,240 1,300 1,000 760 380 250 120 90 Upper Thomson 14,610 500 710 740 960 1,050 1,050 790 790 1,070 1,110 1,150 1,240 1,130 920 490 440 280 180
Boon Total - - - - - - - - - - - - - - - - - - - Lay Liu Fang - - - - - - - - - - - - - - - - - - -
Samulun - - - - - - - - - - - - - - - - - - - Shipyard - - - - - - - - - - - - - - - - - - - Tukang - - - - - - - - - - - - - - - - - - -
Note: Planning areas refer to areas demarcated in the Urban Redevelopment Authority’s Master Plan 2014.
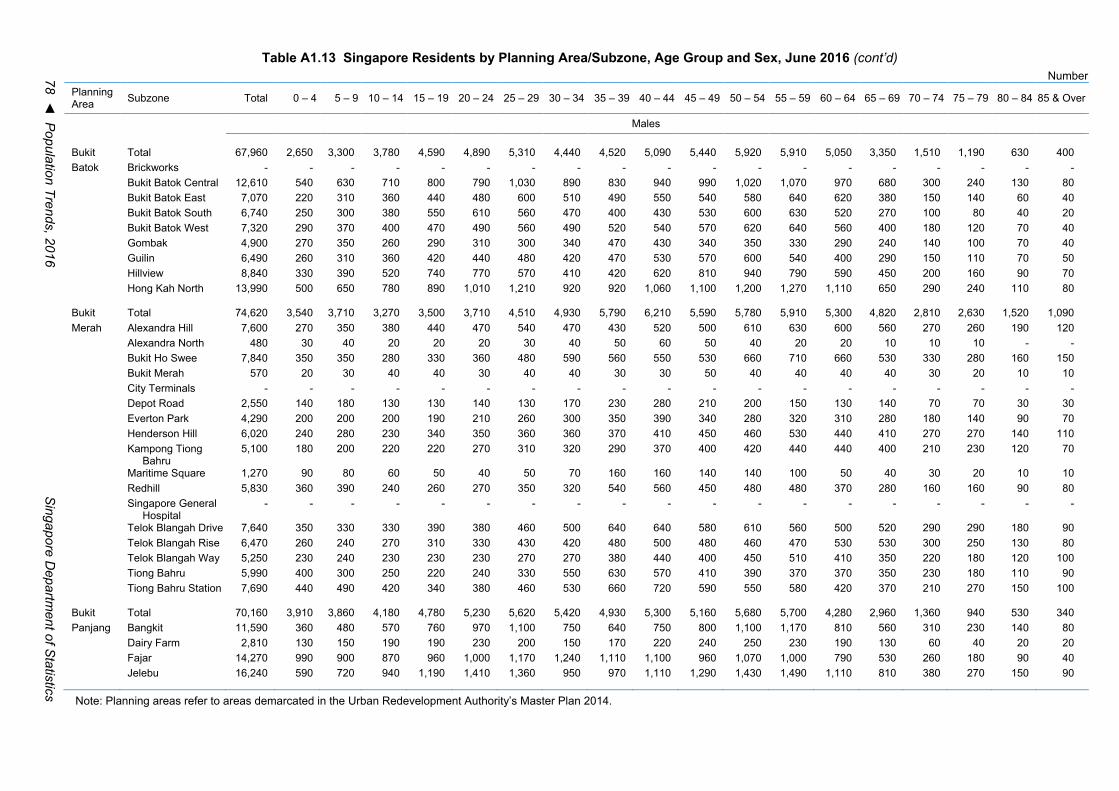
78 ◄ P
opulation Trends, 2016 S
ingapore Departm
ent of Statistics
Table A1.13 Singapore Residents by Planning Area/Subzone, Age Group and Sex, June 2016 (cont’d) Number
Planning Area Subzone Total 0 – 4 5 – 9 10 – 14 15 – 19 20 – 24 25 – 29 30 – 34 35 – 39 40 – 44 45 – 49 50 – 54 55 – 59 60 – 64 65 – 69 70 – 74 75 – 79 80 – 84 85 & Over
Males
Bukit Total 67,960 2,650 3,300 3,780 4,590 4,890 5,310 4,440 4,520 5,090 5,440 5,920 5,910 5,050 3,350 1,510 1,190 630 400 Batok Brickworks - - - - - - - - - - - - - - - - - - -
Bukit Batok Central 12,610 540 630 710 800 790 1,030 890 830 940 990 1,020 1,070 970 680 300 240 130 80 Bukit Batok East 7,070 220 310 360 440 480 600 510 490 550 540 580 640 620 380 150 140 60 40 Bukit Batok South 6,740 250 300 380 550 610 560 470 400 430 530 600 630 520 270 100 80 40 20 Bukit Batok West 7,320 290 370 400 470 490 560 490 520 540 570 620 640 560 400 180 120 70 40 Gombak 4,900 270 350 260 290 310 300 340 470 430 340 350 330 290 240 140 100 70 40 Guilin 6,490 260 310 360 420 440 480 420 470 530 570 600 540 400 290 150 110 70 50 Hillview 8,840 330 390 520 740 770 570 410 420 620 810 940 790 590 450 200 160 90 70 Hong Kah North 13,990 500 650 780 890 1,010 1,210 920 920 1,060 1,100 1,200 1,270 1,110 650 290 240 110 80
Bukit Total 74,620 3,540 3,710 3,270 3,500 3,710 4,510 4,930 5,790 6,210 5,590 5,780 5,910 5,300 4,820 2,810 2,630 1,520 1,090 Merah Alexandra Hill 7,600 270 350 380 440 470 540 470 430 520 500 610 630 600 560 270 260 190 120
Alexandra North 480 30 40 20 20 20 30 40 50 60 50 40 20 20 10 10 10 - -Bukit Ho Swee 7,840 350 350 280 330 360 480 590 560 550 530 660 710 660 530 330 280 160 150 Bukit Merah 570 20 30 40 40 30 40 40 30 30 50 40 40 40 40 30 20 10 10 City Terminals - - - - - - - - - - - - - - - - - - - Depot Road 2,550 140 180 130 130 140 130 170 230 280 210 200 150 130 140 70 70 30 30 Everton Park 4,290 200 200 200 190 210 260 300 350 390 340 280 320 310 280 180 140 90 70 Henderson Hill 6,020 240 280 230 340 350 360 360 370 410 450 460 530 440 410 270 270 140 110 Kampong Tiong
Bahru 5,100 180 200 220 220 270 310 320 290 370 400 420 440 440 400 210 230 120 70
Maritime Square 1,270 90 80 60 50 40 50 70 160 160 140 140 100 50 40 30 20 10 10 Redhill 5,830 360 390 240 260 270 350 320 540 560 450 480 480 370 280 160 160 90 80 Singapore General
Hospital - - - - - - - - - - - - - - - - - - -
Telok Blangah Drive 7,640 350 330 330 390 380 460 500 640 640 580 610 560 500 520 290 290 180 90 Telok Blangah Rise 6,470 260 240 270 310 330 430 420 480 500 480 460 470 530 530 300 250 130 80 Telok Blangah Way 5,250 230 240 230 230 230 270 270 380 440 400 450 510 410 350 220 180 120 100 Tiong Bahru 5,990 400 300 250 220 240 330 550 630 570 410 390 370 370 350 230 180 110 90 Tiong Bahru Station 7,690 440 490 420 340 380 460 530 660 720 590 550 580 420 370 210 270 150 100
Bukit Total 70,160 3,910 3,860 4,180 4,780 5,230 5,620 5,420 4,930 5,300 5,160 5,680 5,700 4,280 2,960 1,360 940 530 340 Panjang Bangkit 11,590 360 480 570 760 970 1,100 750 640 750 800 1,100 1,170 810 560 310 230 140 80
Dairy Farm 2,810 130 150 190 190 230 200 150 170 220 240 250 230 190 130 60 40 20 20 Fajar 14,270 990 900 870 960 1,000 1,170 1,240 1,110 1,100 960 1,070 1,000 790 530 260 180 90 40 Jelebu 16,240 590 720 940 1,190 1,410 1,360 950 970 1,110 1,290 1,430 1,490 1,110 810 380 270 150 90
Note: Planning areas refer to areas demarcated in the Urban Redevelopment Authority’s Master Plan 2014.
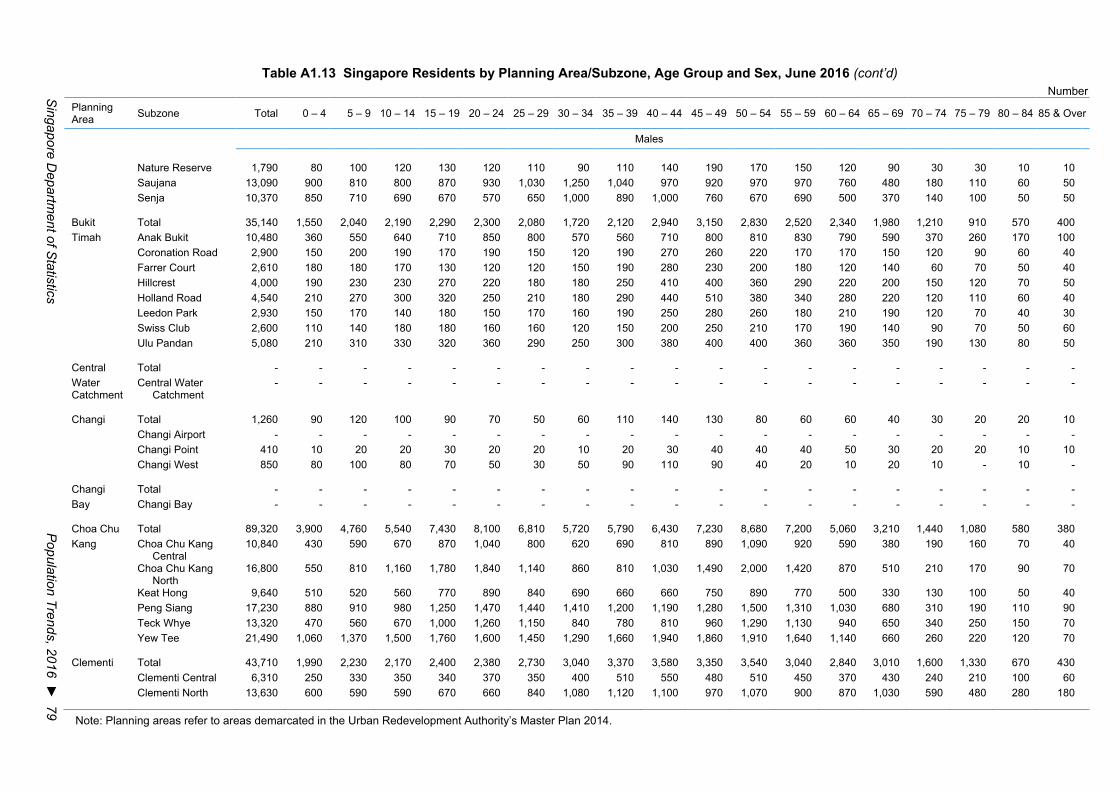
Singapore D
epartment of S
tatistics P
opulation Trends, 2016 ► 79
Table A1.13 Singapore Residents by Planning Area/Subzone, Age Group and Sex, June 2016 (cont’d)
Number Planning Area Subzone Total 0 – 4 5 – 9 10 – 14 15 – 19 20 – 24 25 – 29 30 – 34 35 – 39 40 – 44 45 – 49 50 – 54 55 – 59 60 – 64 65 – 69 70 – 74 75 – 79 80 – 84 85 & Over
Males Nature Reserve 1,790 80 100 120 130 120 110 90 110 140 190 170 150 120 90 30 30 10 10 Saujana 13,090 900 810 800 870 930 1,030 1,250 1,040 970 920 970 970 760 480 180 110 60 50 Senja
10,370 850 710 690 670 570 650 1,000 890 1,000 760 670 690 500 370 140 100 50 50
Bukit Total 35,140 1,550 2,040 2,190 2,290 2,300 2,080 1,720 2,120 2,940 3,150 2,830 2,520 2,340 1,980 1,210 910 570 400 Timah Anak Bukit 10,480 360 550 640 710 850 800 570 560 710 800 810 830 790 590 370 260 170 100 Coronation Road 2,900 150 200 190 170 190 150 120 190 270 260 220 170 170 150 120 90 60 40 Farrer Court 2,610 180 180 170 130 120 120 150 190 280 230 200 180 120 140 60 70 50 40 Hillcrest 4,000 190 230 230 270 220 180 180 250 410 400 360 290 220 200 150 120 70 50 Holland Road 4,540 210 270 300 320 250 210 180 290 440 510 380 340 280 220 120 110 60 40 Leedon Park 2,930 150 170 140 180 150 170 160 190 250 280 260 180 210 190 120 70 40 30 Swiss Club 2,600 110 140 180 180 160 160 120 150 200 250 210 170 190 140 90 70 50 60 Ulu Pandan
5,080 210 310 330 320 360 290 250 300 380 400 400 360 360 350 190 130 80 50
Central Total - - - - - - - - - - - - - - - - - - - Water Catchment
Central Water Catchment
- - - - - - - - - - - - - - - - - - -
Changi Total 1,260 90 120 100 90 70 50 60 110 140 130 80 60 60 40 30 20 20 10 Changi Airport - - - - - - - - - - - - - - - - - - - Changi Point 410 10 20 20 30 20 20 10 20 30 40 40 40 50 30 20 20 10 10 Changi West
850 80 100 80 70 50 30 50 90 110 90 40 20 10 20 10 - 10 -
Changi Total - - - - - - - - - - - - - - - - - - - Bay
Changi Bay - - - - - - - - - - - - - - - - - - -
Choa Chu Total 89,320 3,900 4,760 5,540 7,430 8,100 6,810 5,720 5,790 6,430 7,230 8,680 7,200 5,060 3,210 1,440 1,080 580 380 Kang Choa Chu Kang
Central 10,840 430 590 670 870 1,040 800 620 690 810 890 1,090 920 590 380 190 160 70 40
Choa Chu Kang North
16,800 550 810 1,160 1,780 1,840 1,140 860 810 1,030 1,490 2,000 1,420 870 510 210 170 90 70
Keat Hong 9,640 510 520 560 770 890 840 690 660 660 750 890 770 500 330 130 100 50 40 Peng Siang 17,230 880 910 980 1,250 1,470 1,440 1,410 1,200 1,190 1,280 1,500 1,310 1,030 680 310 190 110 90 Teck Whye 13,320 470 560 670 1,000 1,260 1,150 840 780 810 960 1,290 1,130 940 650 340 250 150 70 Yew Tee
21,490 1,060 1,370 1,500 1,760 1,600 1,450 1,290 1,660 1,940 1,860 1,910 1,640 1,140 660 260 220 120 70
Clementi Total 43,710 1,990 2,230 2,170 2,400 2,380 2,730 3,040 3,370 3,580 3,350 3,540 3,040 2,840 3,010 1,600 1,330 670 430 Clementi Central 6,310 250 330 350 340 370 350 400 510 550 480 510 450 370 430 240 210 100 60 Clementi North 13,630 600 590 590 670 660 840 1,080 1,120 1,100 970 1,070 900 870 1,030 590 480 280 180
Note: Planning areas refer to areas demarcated in the Urban Redevelopment Authority’s Master Plan 2014.
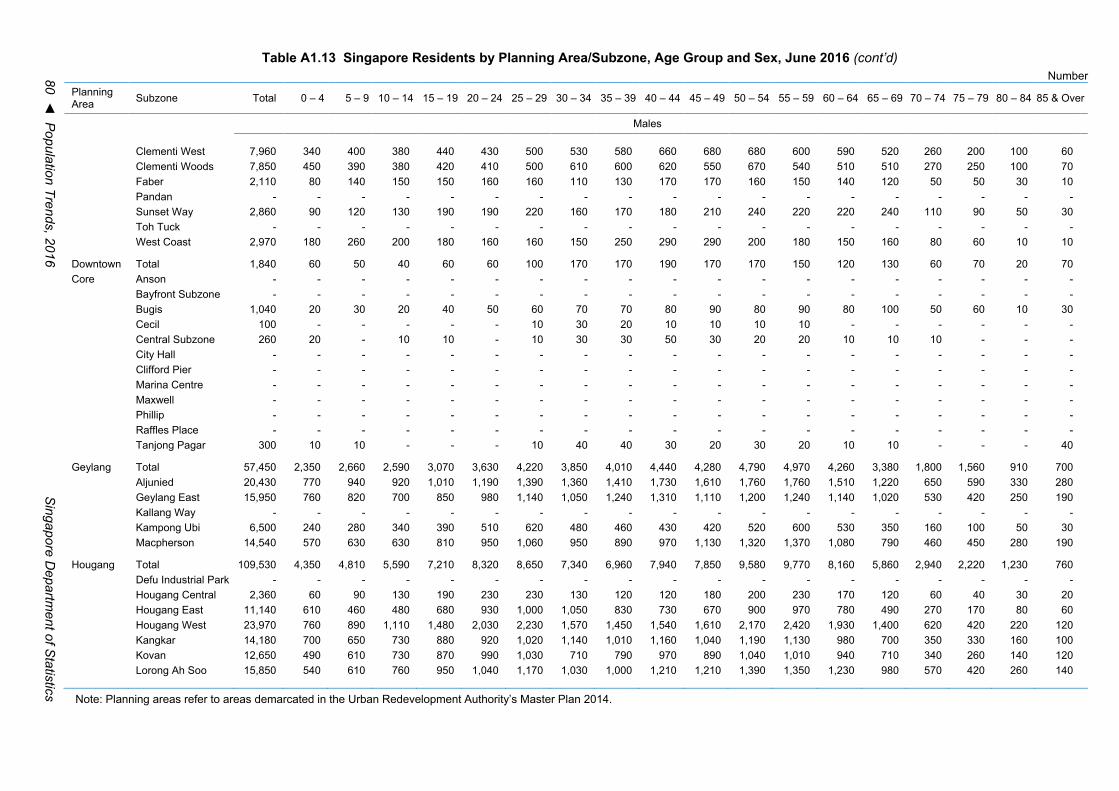
80 ◄ P
opulation Trends, 2016 S
ingapore Departm
ent of Statistics
Table A1.13 Singapore Residents by Planning Area/Subzone, Age Group and Sex, June 2016 (cont’d) Number
Planning Area Subzone Total 0 – 4 5 – 9 10 – 14 15 – 19 20 – 24 25 – 29 30 – 34 35 – 39 40 – 44 45 – 49 50 – 54 55 – 59 60 – 64 65 – 69 70 – 74 75 – 79 80 – 84 85 & Over
Males Clementi West 7,960 340 400 380 440 430 500 530 580 660 680 680 600 590 520 260 200 100 60 Clementi Woods 7,850 450 390 380 420 410 500 610 600 620 550 670 540 510 510 270 250 100 70 Faber 2,110 80 140 150 150 160 160 110 130 170 170 160 150 140 120 50 50 30 10 Pandan - - - - - - - - - - - - - - - - - - - Sunset Way 2,860 90 120 130 190 190 220 160 170 180 210 240 220 220 240 110 90 50 30 Toh Tuck - - - - - - - - - - - - - - - - - - - West Coast
2,970 180 260 200 180 160 160 150 250 290 290 200 180 150 160 80 60 10 10
Downtown Total 1,840 60 50 40 60 60 100 170 170 190 170 170 150 120 130 60 70 20 70 Core Anson - - - - - - - - - - - - - - - - - - - Bayfront Subzone - - - - - - - - - - - - - - - - - - - Bugis 1,040 20 30 20 40 50 60 70 70 80 90 80 90 80 100 50 60 10 30 Cecil 100 - - - - - 10 30 20 10 10 10 10 - - - - - - Central Subzone 260 20 - 10 10 - 10 30 30 50 30 20 20 10 10 10 - - - City Hall - - - - - - - - - - - - - - - - - - - Clifford Pier - - - - - - - - - - - - - - - - - - - Marina Centre - - - - - - - - - - - - - - - - - - - Maxwell - - - - - - - - - - - - - - - - - - - Phillip - - - - - - - - - - - - - - - - - - - Raffles Place - - - - - - - - - - - - - - - - - - - Tanjong Pagar
300 10 10 - - - 10 40 40 30 20 30 20 10 10 - - - 40
Geylang Total 57,450 2,350 2,660 2,590 3,070 3,630 4,220 3,850 4,010 4,440 4,280 4,790 4,970 4,260 3,380 1,800 1,560 910 700 Aljunied 20,430 770 940 920 1,010 1,190 1,390 1,360 1,410 1,730 1,610 1,760 1,760 1,510 1,220 650 590 330 280 Geylang East 15,950 760 820 700 850 980 1,140 1,050 1,240 1,310 1,110 1,200 1,240 1,140 1,020 530 420 250 190 Kallang Way - - - - - - - - - - - - - - - - - - - Kampong Ubi 6,500 240 280 340 390 510 620 480 460 430 420 520 600 530 350 160 100 50 30 Macpherson
14,540 570 630 630 810 950 1,060 950 890 970 1,130 1,320 1,370 1,080 790 460 450 280 190
Hougang Total 109,530 4,350 4,810 5,590 7,210 8,320 8,650 7,340 6,960 7,940 7,850 9,580 9,770 8,160 5,860 2,940 2,220 1,230 760 Defu Industrial Park - - - - - - - - - - - - - - - - - - - Hougang Central 2,360 60 90 130 190 230 230 130 120 120 180 200 230 170 120 60 40 30 20 Hougang East 11,140 610 460 480 680 930 1,000 1,050 830 730 670 900 970 780 490 270 170 80 60 Hougang West 23,970 760 890 1,110 1,480 2,030 2,230 1,570 1,450 1,540 1,610 2,170 2,420 1,930 1,400 620 420 220 120 Kangkar 14,180 700 650 730 880 920 1,020 1,140 1,010 1,160 1,040 1,190 1,130 980 700 350 330 160 100 Kovan 12,650 490 610 730 870 990 1,030 710 790 970 890 1,040 1,010 940 710 340 260 140 120 Lorong Ah Soo 15,850 540 610 760 950 1,040 1,170 1,030 1,000 1,210 1,210 1,390 1,350 1,230 980 570 420 260 140
Note: Planning areas refer to areas demarcated in the Urban Redevelopment Authority’s Master Plan 2014.
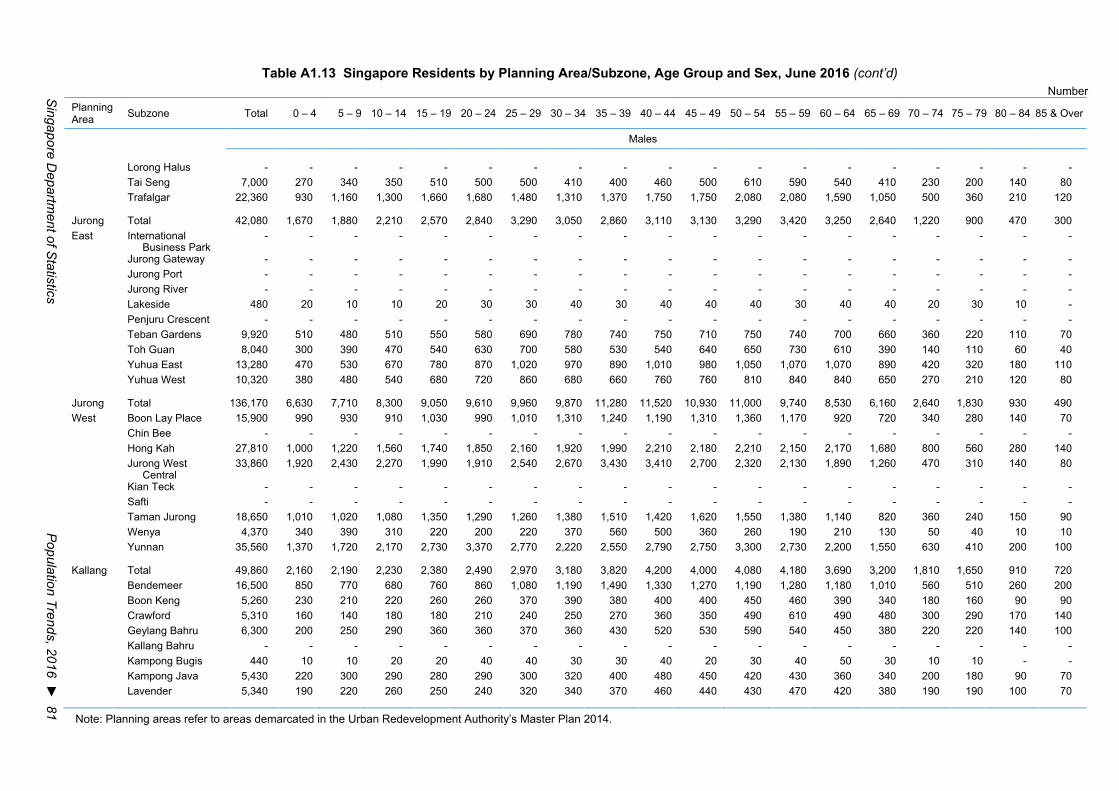
Singapore D
epartment of S
tatistics P
opulation Trends, 2016 ► 81
Table A1.13 Singapore Residents by Planning Area/Subzone, Age Group and Sex, June 2016 (cont’d) Number
Planning Area Subzone Total 0 – 4 5 – 9 10 – 14 15 – 19 20 – 24 25 – 29 30 – 34 35 – 39 40 – 44 45 – 49 50 – 54 55 – 59 60 – 64 65 – 69 70 – 74 75 – 79 80 – 84 85 & Over
Males
Lorong Halus - - - - - - - - - - - - - - - - - - - Tai Seng 7,000 270 340 350 510 500 500 410 400 460 500 610 590 540 410 230 200 140 80 Trafalgar 22,360 930 1,160 1,300 1,660 1,680 1,480 1,310 1,370 1,750 1,750 2,080 2,080 1,590 1,050 500 360 210 120
Jurong Total 42,080 1,670 1,880 2,210 2,570 2,840 3,290 3,050 2,860 3,110 3,130 3,290 3,420 3,250 2,640 1,220 900 470 300 East International
Business Park - - - - - - - - - - - - - - - - - - -
Jurong Gateway - - - - - - - - - - - - - - - - - - - Jurong Port - - - - - - - - - - - - - - - - - - - Jurong River - - - - - - - - - - - - - - - - - - - Lakeside 480 20 10 10 20 30 30 40 30 40 40 40 30 40 40 20 30 10 - Penjuru Crescent - - - - - - - - - - - - - - - - - - - Teban Gardens 9,920 510 480 510 550 580 690 780 740 750 710 750 740 700 660 360 220 110 70 Toh Guan 8,040 300 390 470 540 630 700 580 530 540 640 650 730 610 390 140 110 60 40 Yuhua East 13,280 470 530 670 780 870 1,020 970 890 1,010 980 1,050 1,070 1,070 890 420 320 180 110 Yuhua West 10,320 380 480 540 680 720 860 680 660 760 760 810 840 840 650 270 210 120 80
Jurong Total 136,170 6,630 7,710 8,300 9,050 9,610 9,960 9,870 11,280 11,520 10,930 11,000 9,740 8,530 6,160 2,640 1,830 930 490 West Boon Lay Place 15,900 990 930 910 1,030 990 1,010 1,310 1,240 1,190 1,310 1,360 1,170 920 720 340 280 140 70
Chin Bee - - - - - - - - - - - - - - - - - - - Hong Kah 27,810 1,000 1,220 1,560 1,740 1,850 2,160 1,920 1,990 2,210 2,180 2,210 2,150 2,170 1,680 800 560 280 140 Jurong West
Central 33,860 1,920 2,430 2,270 1,990 1,910 2,540 2,670 3,430 3,410 2,700 2,320 2,130 1,890 1,260 470 310 140 80
Kian Teck - - - - - - - - - - - - - - - - - - - Safti - - - - - - - - - - - - - - - - - - - Taman Jurong 18,650 1,010 1,020 1,080 1,350 1,290 1,260 1,380 1,510 1,420 1,620 1,550 1,380 1,140 820 360 240 150 90 Wenya 4,370 340 390 310 220 200 220 370 560 500 360 260 190 210 130 50 40 10 10 Yunnan 35,560 1,370 1,720 2,170 2,730 3,370 2,770 2,220 2,550 2,790 2,750 3,300 2,730 2,200 1,550 630 410 200 100
Kallang Total 49,860 2,160 2,190 2,230 2,380 2,490 2,970 3,180 3,820 4,200 4,000 4,080 4,180 3,690 3,200 1,810 1,650 910 720 Bendemeer 16,500 850 770 680 760 860 1,080 1,190 1,490 1,330 1,270 1,190 1,280 1,180 1,010 560 510 260 200 Boon Keng 5,260 230 210 220 260 260 370 390 380 400 400 450 460 390 340 180 160 90 90 Crawford 5,310 160 140 180 180 210 240 250 270 360 350 490 610 490 480 300 290 170 140 Geylang Bahru 6,300 200 250 290 360 360 370 360 430 520 530 590 540 450 380 220 220 140 100 Kallang Bahru - - - - - - - - - - - - - - - - - - - Kampong Bugis 440 10 10 20 20 40 40 30 30 40 20 30 40 50 30 10 10 - -Kampong Java 5,430 220 300 290 280 290 300 320 400 480 450 420 430 360 340 200 180 90 70 Lavender 5,340 190 220 260 250 240 320 340 370 460 440 430 470 420 380 190 190 100 70
Note: Planning areas refer to areas demarcated in the Urban Redevelopment Authority’s Master Plan 2014.
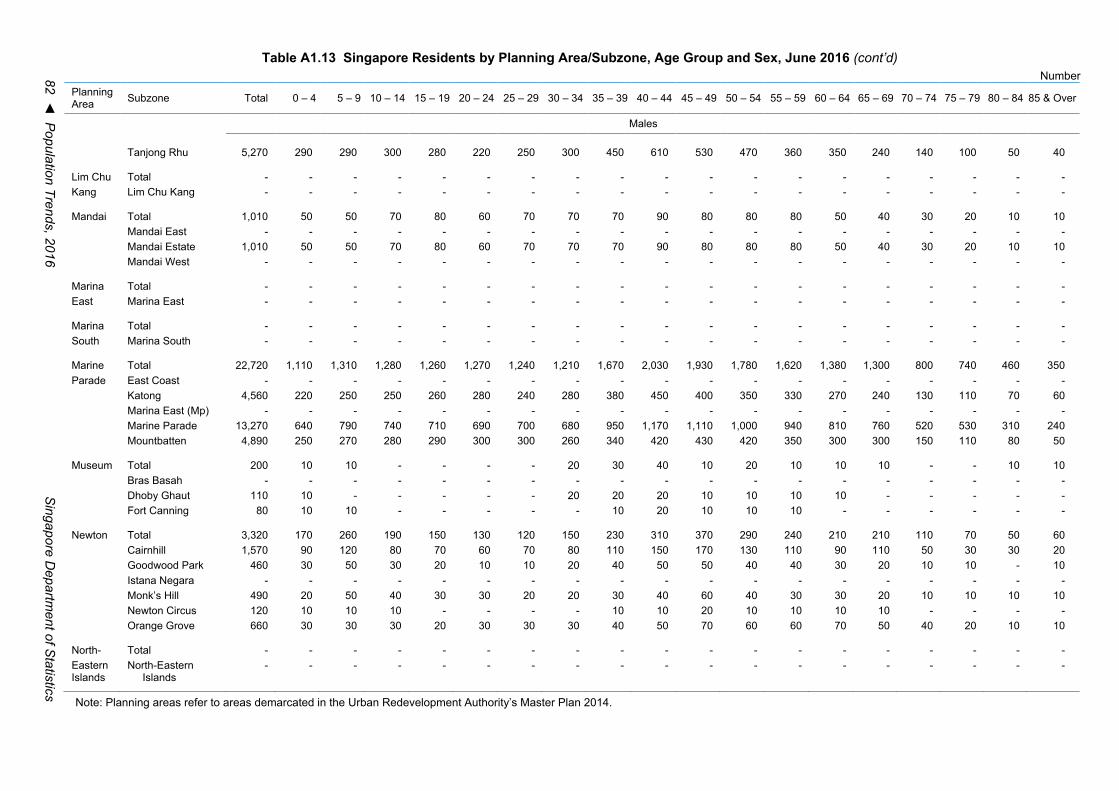
82 ◄ P
opulation Trends, 2016 S
ingapore Departm
ent of Statistics
Table A1.13 Singapore Residents by Planning Area/Subzone, Age Group and Sex, June 2016 (cont’d) Number
Planning Area Subzone Total 0 – 4 5 – 9 10 – 14 15 – 19 20 – 24 25 – 29 30 – 34 35 – 39 40 – 44 45 – 49 50 – 54 55 – 59 60 – 64 65 – 69 70 – 74 75 – 79 80 – 84 85 & Over
Males Tanjong Rhu
5,270 290 290 300 280 220 250 300 450 610 530 470 360 350 240 140 100 50 40
Lim Chu Total - - - - - - - - - - - - - - - - - - - Kang Lim Chu Kang
- - - - - - - - - - - - - - - - - - -
Mandai Total 1,010 50 50 70 80 60 70 70 70 90 80 80 80 50 40 30 20 10 10 Mandai East - - - - - - - - - - - - - - - - - - - Mandai Estate 1,010 50 50 70 80 60 70 70 70 90 80 80 80 50 40 30 20 10 10 Mandai West
- - - - - - - - - - - - - - - - - - -
Marina Total - - - - - - - - - - - - - - - - - - - East
Marina East - - - - - - - - - - - - - - - - - - -
Marina Total - - - - - - - - - - - - - - - - - - - South
Marina South - - - - - - - - - - - - - - - - - - -
Marine Total 22,720 1,110 1,310 1,280 1,260 1,270 1,240 1,210 1,670 2,030 1,930 1,780 1,620 1,380 1,300 800 740 460 350 Parade East Coast - - - - - - - - - - - - - - - - - - - Katong 4,560 220 250 250 260 280 240 280 380 450 400 350 330 270 240 130 110 70 60 Marina East (Mp) - - - - - - - - - - - - - - - - - - - Marine Parade 13,270 640 790 740 710 690 700 680 950 1,170 1,110 1,000 940 810 760 520 530 310 240 Mountbatten
4,890 250 270 280 290 300 300 260 340 420 430 420 350 300 300 150 110 80 50
Museum Total 200 10 10 - - - - 20 30 40 10 20 10 10 10 - - 10 10 Bras Basah - - - - - - - - - - - - - - - - - - - Dhoby Ghaut 110 10 - - - - - 20 20 20 10 10 10 10 - - - - - Fort Canning
80 10 10 - - - - - 10 20 10 10 10 - - - - - -
Newton Total 3,320 170 260 190 150 130 120 150 230 310 370 290 240 210 210 110 70 50 60 Cairnhill 1,570 90 120 80 70 60 70 80 110 150 170 130 110 90 110 50 30 30 20 Goodwood Park 460 30 50 30 20 10 10 20 40 50 50 40 40 30 20 10 10 - 10 Istana Negara - - - - - - - - - - - - - - - - - - - Monk’s Hill 490 20 50 40 30 30 20 20 30 40 60 40 30 30 20 10 10 10 10 Newton Circus 120 10 10 10 - - - - 10 10 20 10 10 10 10 - - - - Orange Grove
660 30 30 30 20 30 30 30 40 50 70 60 60 70 50 40 20 10 10
North- Total - - - - - - - - - - - - - - - - - - - Eastern Islands
North-Eastern Islands
- - - - - - - - - - - - - - - - - - -
Note: Planning areas refer to areas demarcated in the Urban Redevelopment Authority’s Master Plan 2014.
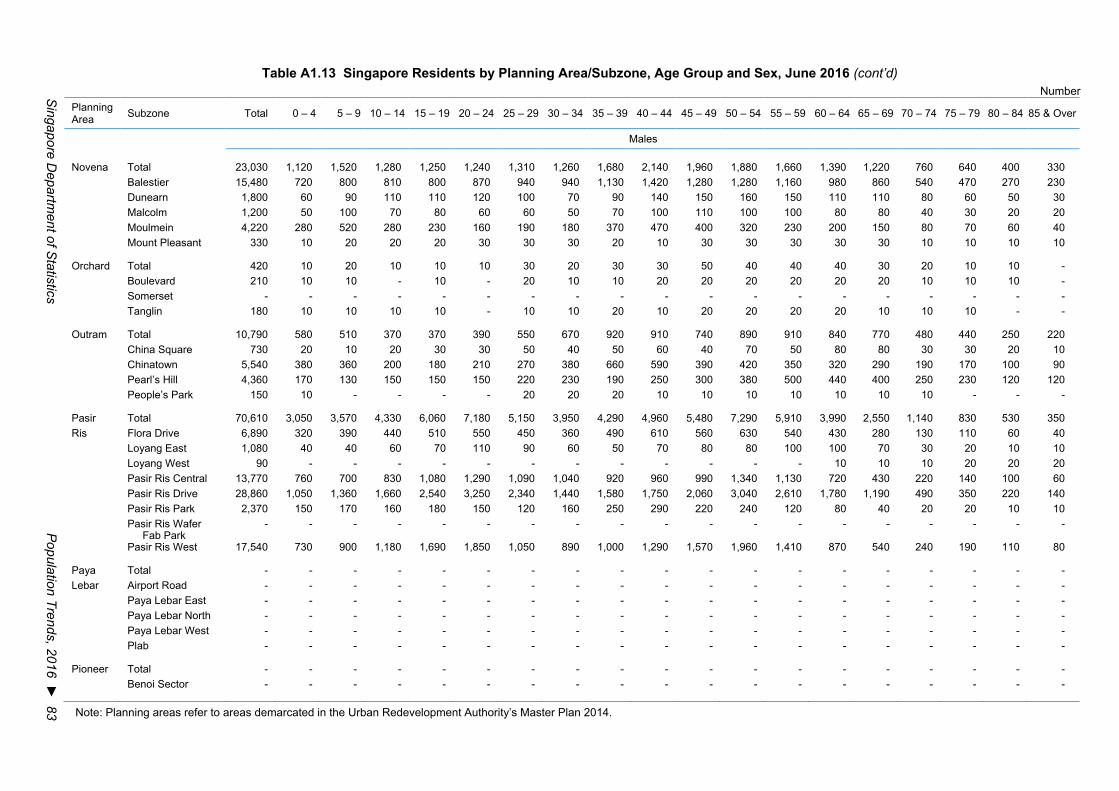
Singapore D
epartment of S
tatistics P
opulation Trends, 2016 ► 83
Table A1.13 Singapore Residents by Planning Area/Subzone, Age Group and Sex, June 2016 (cont’d) Number
Planning Area Subzone Total 0 – 4 5 – 9 10 – 14 15 – 19 20 – 24 25 – 29 30 – 34 35 – 39 40 – 44 45 – 49 50 – 54 55 – 59 60 – 64 65 – 69 70 – 74 75 – 79 80 – 84 85 & Over
Males
Novena Total 23,030 1,120 1,520 1,280 1,250 1,240 1,310 1,260 1,680 2,140 1,960 1,880 1,660 1,390 1,220 760 640 400 330 Balestier 15,480 720 800 810 800 870 940 940 1,130 1,420 1,280 1,280 1,160 980 860 540 470 270 230 Dunearn 1,800 60 90 110 110 120 100 70 90 140 150 160 150 110 110 80 60 50 30 Malcolm 1,200 50 100 70 80 60 60 50 70 100 110 100 100 80 80 40 30 20 20 Moulmein 4,220 280 520 280 230 160 190 180 370 470 400 320 230 200 150 80 70 60 40 Mount Pleasant 330 10 20 20 20 30 30 30 20 10 30 30 30 30 30 10 10 10 10
Orchard Total 420 10 20 10 10 10 30 20 30 30 50 40 40 40 30 20 10 10 - Boulevard 210 10 10 - 10 - 20 10 10 20 20 20 20 20 20 10 10 10 - Somerset - - - - - - - - - - - - - - - - - - - Tanglin 180 10 10 10 10 - 10 10 20 10 20 20 20 20 10 10 10 - -
Outram Total 10,790 580 510 370 370 390 550 670 920 910 740 890 910 840 770 480 440 250 220 China Square 730 20 10 20 30 30 50 40 50 60 40 70 50 80 80 30 30 20 10 Chinatown 5,540 380 360 200 180 210 270 380 660 590 390 420 350 320 290 190 170 100 90 Pearl’s Hill 4,360 170 130 150 150 150 220 230 190 250 300 380 500 440 400 250 230 120 120 People’s Park 150 10 - - - - 20 20 20 10 10 10 10 10 10 10 - - -
Pasir Total 70,610 3,050 3,570 4,330 6,060 7,180 5,150 3,950 4,290 4,960 5,480 7,290 5,910 3,990 2,550 1,140 830 530 350 Ris Flora Drive 6,890 320 390 440 510 550 450 360 490 610 560 630 540 430 280 130 110 60 40
Loyang East 1,080 40 40 60 70 110 90 60 50 70 80 80 100 100 70 30 20 10 10 Loyang West 90 - - - - - - - - - - - - 10 10 10 20 20 20 Pasir Ris Central 13,770 760 700 830 1,080 1,290 1,090 1,040 920 960 990 1,340 1,130 720 430 220 140 100 60 Pasir Ris Drive 28,860 1,050 1,360 1,660 2,540 3,250 2,340 1,440 1,580 1,750 2,060 3,040 2,610 1,780 1,190 490 350 220 140 Pasir Ris Park 2,370 150 170 160 180 150 120 160 250 290 220 240 120 80 40 20 20 10 10 Pasir Ris Wafer
Fab Park - - - - - - - - - - - - - - - - - - -
Pasir Ris West 17,540 730 900 1,180 1,690 1,850 1,050 890 1,000 1,290 1,570 1,960 1,410 870 540 240 190 110 80
Paya Total - - - - - - - - - - - - - - - - - - - Lebar Airport Road - - - - - - - - - - - - - - - - - - -
Paya Lebar East - - - - - - - - - - - - - - - - - - - Paya Lebar North - - - - - - - - - - - - - - - - - - - Paya Lebar West - - - - - - - - - - - - - - - - - - - Plab - - - - - - - - - - - - - - - - - - -
Pioneer Total - - - - - - - - - - - - - - - - - - - Benoi Sector - - - - - - - - - - - - - - - - - - -
Note: Planning areas refer to areas demarcated in the Urban Redevelopment Authority’s Master Plan 2014.

84 ◄ P
opulation Trends, 2016 S
ingapore Departm
ent of Statistics
Table A1.13 Singapore Residents by Planning Area/Subzone, Age Group and Sex, June 2016 (cont’d) Number
Planning Area Subzone Total 0 – 4 5 – 9 10 – 14 15 – 19 20 – 24 25 – 29 30 – 34 35 – 39 40 – 44 45 – 49 50 – 54 55 – 59 60 – 64 65 – 69 70 – 74 75 – 79 80 – 84 85 & Over
Males Gul Basin - - - - - - - - - - - - - - - - - - - Gul Circle - - - - - - - - - - - - - - - - - - - Joo Koon - - - - - - - - - - - - - - - - - - - Pioneer Sector
- - - - - - - - - - - - - - - - - - -
Punggol Total 64,420 7,510 5,620 3,830 2,940 2,250 3,100 8,090 8,270 6,720 4,200 3,460 2,660 2,170 1,730 810 590 310 160 Coney Island - - - - - - - - - - - - - - - - - - - Matilda 18,420 2,710 1,520 860 700 540 780 2,990 2,670 1,710 1,020 840 650 540 450 210 140 70 20 Northshore 150 - 10 10 10 10 10 - 10 10 20 20 20 10 10 - - - - Punggol Canal - - - - - - - - - - - - - - - - - - - Punggol Field 22,300 1,490 1,980 1,760 1,390 1,030 1,080 1,410 2,220 2,780 1,890 1,480 1,270 980 740 330 270 140 80 Punggol Town
Centre 5,730 960 530 210 150 110 300 1,110 960 460 270 230 120 100 110 50 40 20 10
Waterway East
17,820 2,350 1,580 990 690 550 940 2,570 2,430 1,770 1,010 910 600 540 430 220 140 70 40
Queenstown Total 46,940 2,540 2,260 2,170 2,370 2,520 2,930 3,510 3,640 3,920 3,610 3,780 3,230 2,900 2,650 1,610 1,610 1,010 690 Commonwealth 3,730 150 150 150 180 180 280 280 250 270 290 350 310 250 200 130 150 110 80 Dover 6,060 310 390 360 370 360 370 370 460 490 510 480 410 340 310 190 180 110 60 Ghim Moh 5,520 300 260 240 280 300 340 410 370 450 380 430 340 330 350 250 250 170 90 Holland Drive 6,410 270 220 250 280 320 420 410 460 580 520 500 430 380 440 290 310 200 140 Kent Ridge 500 10 20 30 20 30 50 40 30 40 40 50 50 30 40 20 10 10 - Margaret Drive 6,520 680 400 270 260 250 330 810 760 600 400 410 320 300 290 160 150 70 60 Mei Chin 7,770 310 340 410 470 510 490 460 470 570 620 690 640 590 440 220 260 170 130 National University
of S’pore 90 10 10 - - 10 20 10 10 10 10 10 - 10 - - - - -
One North 300 20 20 10 10 10 10 30 30 40 50 30 20 10 10 - - - - Pasir Panjang 1 1,980 110 100 100 110 140 130 140 160 190 150 170 140 130 100 50 40 20 10 Pasir Panjang 2 1,660 60 70 80 110 120 120 120 110 110 130 130 130 170 120 60 30 10 10 Port 70 - - - - 10 10 - 10 - - 10 10 - 10 - - - - Queensway 140 - - - 10 10 10 10 10 20 20 20 10 10 10 10 - - - Singapore
Polytechnic 80 10 10 - 10 10 10 - 10 10 10 - 10 - - - - - -
Tanglin Halt
6,100 290 270 260 270 270 370 450 520 550 500 510 450 340 350 230 220 170 100
River Valley Total 4,340 210 210 220 190 190 230 250 390 510 450 390 300 250 240 130 90 50 50 Institution Hill 1,600 110 90 90 60 60 80 110 160 230 150 130 80 70 80 40 30 10 10 Leonie Hill 1,180 40 60 50 60 60 60 60 110 140 150 110 80 70 60 30 20 10 10 One Tree Hill 830 30 30 40 50 50 40 30 40 70 80 100 90 60 50 40 20 10 10
Note: Planning areas refer to areas demarcated in the Urban Redevelopment Authority’s Master Plan 2014.

Singapore D
epartment of S
tatistics P
opulation Trends, 2016 ► 85
Table A1.13 Singapore Residents by Planning Area/Subzone, Age Group and Sex, June 2016 (cont’d) Number
Planning Area Subzone Total 0 – 4 5 – 9 10 – 14 15 – 19 20 – 24 25 – 29 30 – 34 35 – 39 40 – 44 45 – 49 50 – 54 55 – 59 60 – 64 65 – 69 70 – 74 75 – 79 80 – 84 85 & Over
Males
Oxley 640 20 30 30 20 30 40 40 70 50 60 50 50 40 50 30 20 10 10 Paterson 80 10 - 10 - - - 10 10 10 10 10 10 - - - - - -
Rochor Total 7,200 260 260 260 320 300 430 470 610 670 550 610 610 500 440 280 240 180 250 Bencoolen 680 40 20 20 30 30 40 40 50 60 70 50 80 50 40 20 20 20 20 Farrer Park 1,570 50 80 70 70 50 90 110 160 150 130 130 110 110 80 50 40 30 80 Kampong Glam 120 - - - - - 10 10 10 20 - 10 10 10 - - 10 10 30 Little India 1,950 40 60 70 110 90 130 100 140 180 140 160 180 150 130 70 80 50 70 Mackenzie 60 - 10 - 10 - - 10 10 10 - 10 - - - - - - - Mount Emily 540 30 30 20 10 10 30 50 90 80 60 50 30 30 20 - 10 10 10 Rochor Canal - - - - - - - - - - - - - - - - - - - Selegie 130 10 - - - 10 10 10 20 20 10 10 10 10 - 10 - - 10 Sungei Road 1,190 60 30 60 60 60 70 80 80 90 80 110 90 80 80 60 50 40 10 Victoria 960 30 30 20 40 40 60 60 70 70 60 90 90 70 80 60 40 20 30
Seletar Total 120 - 10 10 10 - - - 10 20 10 10 10 10 - - - - - Pulau Punggol
Barat - - - - - - - - - - - - - - - - - - -
Pulau Punggol Timor
- - - - - - - - - - - - - - - - - - -
Seletar 110 - 10 10 10 - - - 10 20 10 10 10 10 - - - - - Seletar Aerospace
Park - - - - - - - - - - - - - - - - - - -
Sembawang Total 38,320 2,260 2,670 2,780 2,610 2,340 2,550 2,770 3,340 3,640 3,240 3,030 2,590 1,890 1,180 580 450 250 160 Admiralty 7,200 520 550 510 440 380 450 620 640 770 530 540 460 270 200 140 80 50 30 Sembawang Central 14,200 720 860 950 1,060 960 1,110 960 1,180 1,270 1,250 1,180 1,030 790 440 180 150 80 50 Sembawang East - - - - - - - - - - - - - - - - - - - Sembawang North 13,490 870 1,030 1,050 860 790 790 1,050 1,290 1,300 1,150 990 890 640 400 170 140 60 30 Sembawang
Springs 2,440 90 170 200 170 160 150 100 170 200 230 230 150 120 100 70 60 30 40
Sembawang Straits 910 60 60 60 80 60 60 40 40 90 80 90 70 50 30 20 20 10 - Senoko North - - - - - - - - - - - - - - - - - - - Senoko South - - - - - - - - - - - - - - - - - - - The Wharves - - - - - - - - - - - - - - - - - - -
Sengkang Total 107,920 8,480 7,990 6,740 6,530 5,700 6,780 10,140 10,750 10,170 8,170 7,300 6,690 5,080 3,600 1,670 1,200 550 380 Anchorvale 19,190 1,630 1,610 1,340 960 800 1,210 2,010 1,870 2,120 1,470 1,120 1,030 800 600 280 220 80 50
Note: Planning areas refer to areas demarcated in the Urban Redevelopment Authority’s Master Plan 2014.
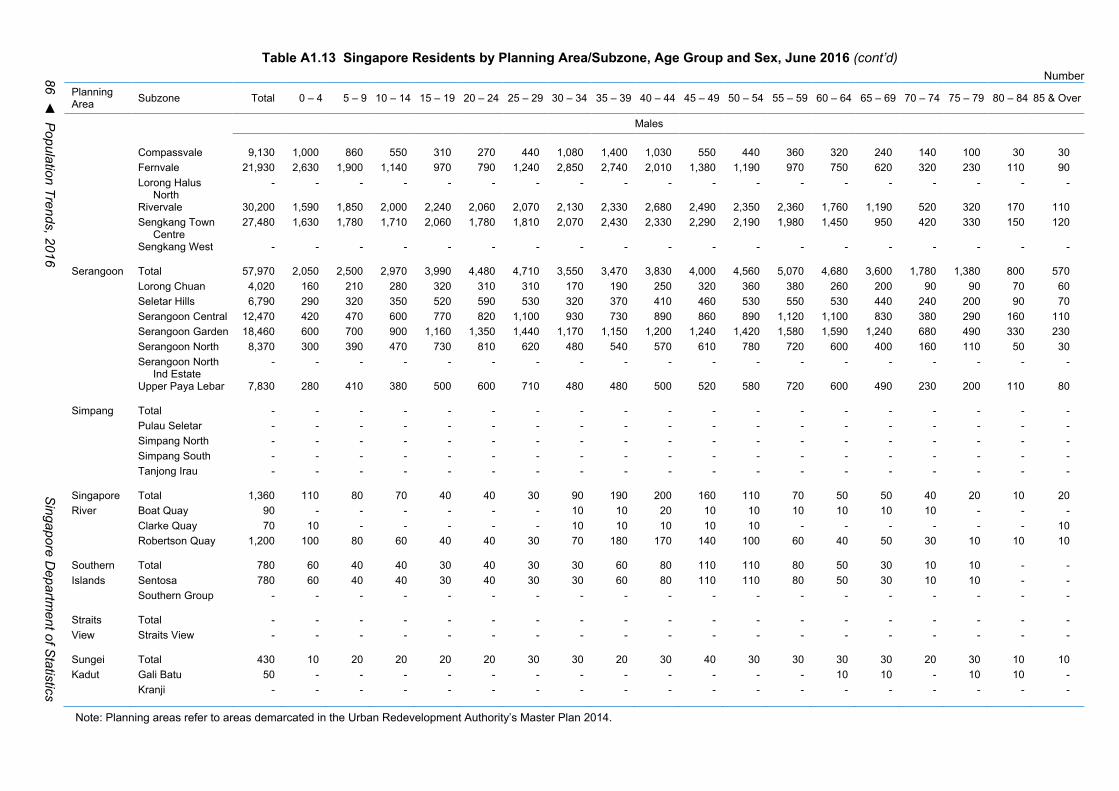
86 ◄ P
opulation Trends, 2016 S
ingapore Departm
ent of Statistics
Table A1.13 Singapore Residents by Planning Area/Subzone, Age Group and Sex, June 2016 (cont’d) Number
Planning Area Subzone Total 0 – 4 5 – 9 10 – 14 15 – 19 20 – 24 25 – 29 30 – 34 35 – 39 40 – 44 45 – 49 50 – 54 55 – 59 60 – 64 65 – 69 70 – 74 75 – 79 80 – 84 85 & Over
Males Compassvale 9,130 1,000 860 550 310 270 440 1,080 1,400 1,030 550 440 360 320 240 140 100 30 30 Fernvale 21,930 2,630 1,900 1,140 970 790 1,240 2,850 2,740 2,010 1,380 1,190 970 750 620 320 230 110 90 Lorong Halus
North - - - - - - - - - - - - - - - - - - -
Rivervale 30,200 1,590 1,850 2,000 2,240 2,060 2,070 2,130 2,330 2,680 2,490 2,350 2,360 1,760 1,190 520 320 170 110 Sengkang Town
Centre 27,480 1,630 1,780 1,710 2,060 1,780 1,810 2,070 2,430 2,330 2,290 2,190 1,980 1,450 950 420 330 150 120
Sengkang West
- - - - - - - - - - - - - - - - - - -
Serangoon Total 57,970 2,050 2,500 2,970 3,990 4,480 4,710 3,550 3,470 3,830 4,000 4,560 5,070 4,680 3,600 1,780 1,380 800 570 Lorong Chuan 4,020 160 210 280 320 310 310 170 190 250 320 360 380 260 200 90 90 70 60 Seletar Hills 6,790 290 320 350 520 590 530 320 370 410 460 530 550 530 440 240 200 90 70 Serangoon Central 12,470 420 470 600 770 820 1,100 930 730 890 860 890 1,120 1,100 830 380 290 160 110 Serangoon Garden 18,460 600 700 900 1,160 1,350 1,440 1,170 1,150 1,200 1,240 1,420 1,580 1,590 1,240 680 490 330 230 Serangoon North 8,370 300 390 470 730 810 620 480 540 570 610 780 720 600 400 160 110 50 30 Serangoon North
Ind Estate - - - - - - - - - - - - - - - - - - -
Upper Paya Lebar
7,830 280 410 380 500 600 710 480 480 500 520 580 720 600 490 230 200 110 80
Simpang Total - - - - - - - - - - - - - - - - - - - Pulau Seletar - - - - - - - - - - - - - - - - - - - Simpang North - - - - - - - - - - - - - - - - - - - Simpang South - - - - - - - - - - - - - - - - - - - Tanjong Irau
- - - - - - - - - - - - - - - - - - -
Singapore Total 1,360 110 80 70 40 40 30 90 190 200 160 110 70 50 50 40 20 10 20 River Boat Quay 90 - - - - - - 10 10 20 10 10 10 10 10 10 - - - Clarke Quay 70 10 - - - - - 10 10 10 10 10 - - - - - - 10 Robertson Quay
1,200 100 80 60 40 40 30 70 180 170 140 100 60 40 50 30 10 10 10
Southern Total 780 60 40 40 30 40 30 30 60 80 110 110 80 50 30 10 10 - - Islands Sentosa 780 60 40 40 30 40 30 30 60 80 110 110 80 50 30 10 10 - - Southern Group
- - - - - - - - - - - - - - - - - - -
Straits Total - - - - - - - - - - - - - - - - - - - View
Straits View - - - - - - - - - - - - - - - - - - -
Sungei Total 430 10 20 20 20 20 30 30 20 30 40 30 30 30 30 20 30 10 10 Kadut Gali Batu 50 - - - - - - - - - - - - 10 10 - 10 10 - Kranji - - - - - - - - - - - - - - - - - - -
Note: Planning areas refer to areas demarcated in the Urban Redevelopment Authority’s Master Plan 2014.
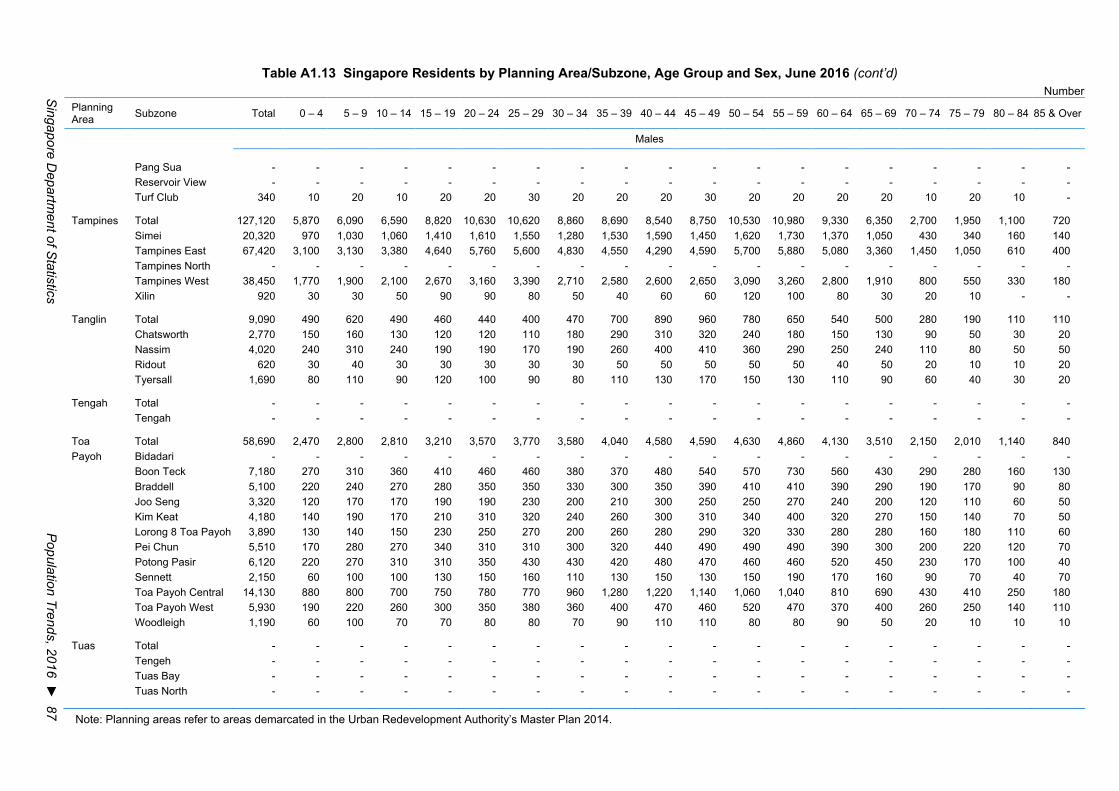
Singapore D
epartment of S
tatistics P
opulation Trends, 2016 ► 87
Table A1.13 Singapore Residents by Planning Area/Subzone, Age Group and Sex, June 2016 (cont’d) Number
Planning Area Subzone Total 0 – 4 5 – 9 10 – 14 15 – 19 20 – 24 25 – 29 30 – 34 35 – 39 40 – 44 45 – 49 50 – 54 55 – 59 60 – 64 65 – 69 70 – 74 75 – 79 80 – 84 85 & Over
Males
Pang Sua - - - - - - - - - - - - - - - - - - - Reservoir View - - - - - - - - - - - - - - - - - - - Turf Club 340 10 20 10 20 20 30 20 20 20 30 20 20 20 20 10 20 10 -
Tampines Total 127,120 5,870 6,090 6,590 8,820 10,630 10,620 8,860 8,690 8,540 8,750 10,530 10,980 9,330 6,350 2,700 1,950 1,100 720 Simei 20,320 970 1,030 1,060 1,410 1,610 1,550 1,280 1,530 1,590 1,450 1,620 1,730 1,370 1,050 430 340 160 140 Tampines East 67,420 3,100 3,130 3,380 4,640 5,760 5,600 4,830 4,550 4,290 4,590 5,700 5,880 5,080 3,360 1,450 1,050 610 400 Tampines North - - - - - - - - - - - - - - - - - - - Tampines West 38,450 1,770 1,900 2,100 2,670 3,160 3,390 2,710 2,580 2,600 2,650 3,090 3,260 2,800 1,910 800 550 330 180 Xilin 920 30 30 50 90 90 80 50 40 60 60 120 100 80 30 20 10 - -
Tanglin Total 9,090 490 620 490 460 440 400 470 700 890 960 780 650 540 500 280 190 110 110 Chatsworth 2,770 150 160 130 120 120 110 180 290 310 320 240 180 150 130 90 50 30 20 Nassim 4,020 240 310 240 190 190 170 190 260 400 410 360 290 250 240 110 80 50 50 Ridout 620 30 40 30 30 30 30 30 50 50 50 50 50 40 50 20 10 10 20 Tyersall 1,690 80 110 90 120 100 90 80 110 130 170 150 130 110 90 60 40 30 20
Tengah Total - - - - - - - - - - - - - - - - - - - Tengah - - - - - - - - - - - - - - - - - - -
Toa Total 58,690 2,470 2,800 2,810 3,210 3,570 3,770 3,580 4,040 4,580 4,590 4,630 4,860 4,130 3,510 2,150 2,010 1,140 840 Payoh Bidadari - - - - - - - - - - - - - - - - - - -
Boon Teck 7,180 270 310 360 410 460 460 380 370 480 540 570 730 560 430 290 280 160 130 Braddell 5,100 220 240 270 280 350 350 330 300 350 390 410 410 390 290 190 170 90 80 Joo Seng 3,320 120 170 170 190 190 230 200 210 300 250 250 270 240 200 120 110 60 50 Kim Keat 4,180 140 190 170 210 310 320 240 260 300 310 340 400 320 270 150 140 70 50 Lorong 8 Toa Payoh 3,890 130 140 150 230 250 270 200 260 280 290 320 330 280 280 160 180 110 60 Pei Chun 5,510 170 280 270 340 310 310 300 320 440 490 490 490 390 300 200 220 120 70 Potong Pasir 6,120 220 270 310 310 350 430 430 420 480 470 460 460 520 450 230 170 100 40 Sennett 2,150 60 100 100 130 150 160 110 130 150 130 150 190 170 160 90 70 40 70 Toa Payoh Central 14,130 880 800 700 750 780 770 960 1,280 1,220 1,140 1,060 1,040 810 690 430 410 250 180 Toa Payoh West 5,930 190 220 260 300 350 380 360 400 470 460 520 470 370 400 260 250 140 110 Woodleigh 1,190 60 100 70 70 80 80 70 90 110 110 80 80 90 50 20 10 10 10
Tuas Total - - - - - - - - - - - - - - - - - - - Tengeh - - - - - - - - - - - - - - - - - - - Tuas Bay - - - - - - - - - - - - - - - - - - - Tuas North - - - - - - - - - - - - - - - - - - -
Note: Planning areas refer to areas demarcated in the Urban Redevelopment Authority’s Master Plan 2014.
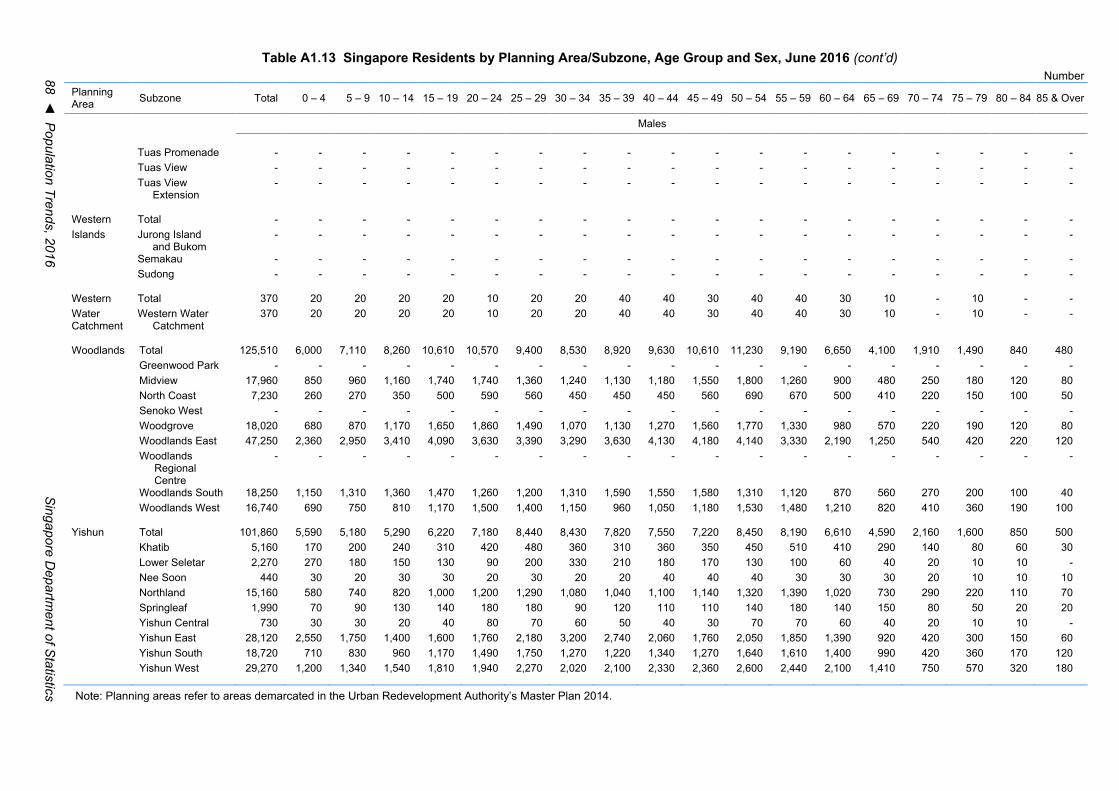
88 ◄ P
opulation Trends, 2016 S
ingapore Departm
ent of Statistics
Table A1.13 Singapore Residents by Planning Area/Subzone, Age Group and Sex, June 2016 (cont’d) Number
Planning Area Subzone Total 0 – 4 5 – 9 10 – 14 15 – 19 20 – 24 25 – 29 30 – 34 35 – 39 40 – 44 45 – 49 50 – 54 55 – 59 60 – 64 65 – 69 70 – 74 75 – 79 80 – 84 85 & Over
Males Tuas Promenade - - - - - - - - - - - - - - - - - - - Tuas View - - - - - - - - - - - - - - - - - - - Tuas View
Extension
- - - - - - - - - - - - - - - - - - -
Western Total - - - - - - - - - - - - - - - - - - - Islands Jurong Island
and Bukom - - - - - - - - - - - - - - - - - - -
Semakau - - - - - - - - - - - - - - - - - - - Sudong
- - - - - - - - - - - - - - - - - - -
Western Total 370 20 20 20 20 10 20 20 40 40 30 40 40 30 10 - 10 - - Water Catchment
Western Water Catchment
370 20 20 20 20 10 20 20 40 40 30 40 40 30 10 - 10 - -
Woodlands Total 125,510 6,000 7,110 8,260 10,610 10,570 9,400 8,530 8,920 9,630 10,610 11,230 9,190 6,650 4,100 1,910 1,490 840 480 Greenwood Park - - - - - - - - - - - - - - - - - - - Midview 17,960 850 960 1,160 1,740 1,740 1,360 1,240 1,130 1,180 1,550 1,800 1,260 900 480 250 180 120 80 North Coast 7,230 260 270 350 500 590 560 450 450 450 560 690 670 500 410 220 150 100 50 Senoko West - - - - - - - - - - - - - - - - - - - Woodgrove 18,020 680 870 1,170 1,650 1,860 1,490 1,070 1,130 1,270 1,560 1,770 1,330 980 570 220 190 120 80 Woodlands East 47,250 2,360 2,950 3,410 4,090 3,630 3,390 3,290 3,630 4,130 4,180 4,140 3,330 2,190 1,250 540 420 220 120 Woodlands
Regional Centre
- - - - - - - - - - - - - - - - - - -
Woodlands South 18,250 1,150 1,310 1,360 1,470 1,260 1,200 1,310 1,590 1,550 1,580 1,310 1,120 870 560 270 200 100 40 Woodlands West
16,740 690 750 810 1,170 1,500 1,400 1,150 960 1,050 1,180 1,530 1,480 1,210 820 410 360 190 100
Yishun Total 101,860 5,590 5,180 5,290 6,220 7,180 8,440 8,430 7,820 7,550 7,220 8,450 8,190 6,610 4,590 2,160 1,600 850 500 Khatib 5,160 170 200 240 310 420 480 360 310 360 350 450 510 410 290 140 80 60 30 Lower Seletar 2,270 270 180 150 130 90 200 330 210 180 170 130 100 60 40 20 10 10 - Nee Soon 440 30 20 30 30 20 30 20 20 40 40 40 30 30 30 20 10 10 10 Northland 15,160 580 740 820 1,000 1,200 1,290 1,080 1,040 1,100 1,140 1,320 1,390 1,020 730 290 220 110 70 Springleaf 1,990 70 90 130 140 180 180 90 120 110 110 140 180 140 150 80 50 20 20 Yishun Central 730 30 30 20 40 80 70 60 50 40 30 70 70 60 40 20 10 10 - Yishun East 28,120 2,550 1,750 1,400 1,600 1,760 2,180 3,200 2,740 2,060 1,760 2,050 1,850 1,390 920 420 300 150 60 Yishun South 18,720 710 830 960 1,170 1,490 1,750 1,270 1,220 1,340 1,270 1,640 1,610 1,400 990 420 360 170 120 Yishun West 29,270 1,200 1,340 1,540 1,810 1,940 2,270 2,020 2,100 2,330 2,360 2,600 2,440 2,100 1,410 750 570 320 180
Note: Planning areas refer to areas demarcated in the Urban Redevelopment Authority’s Master Plan 2014.
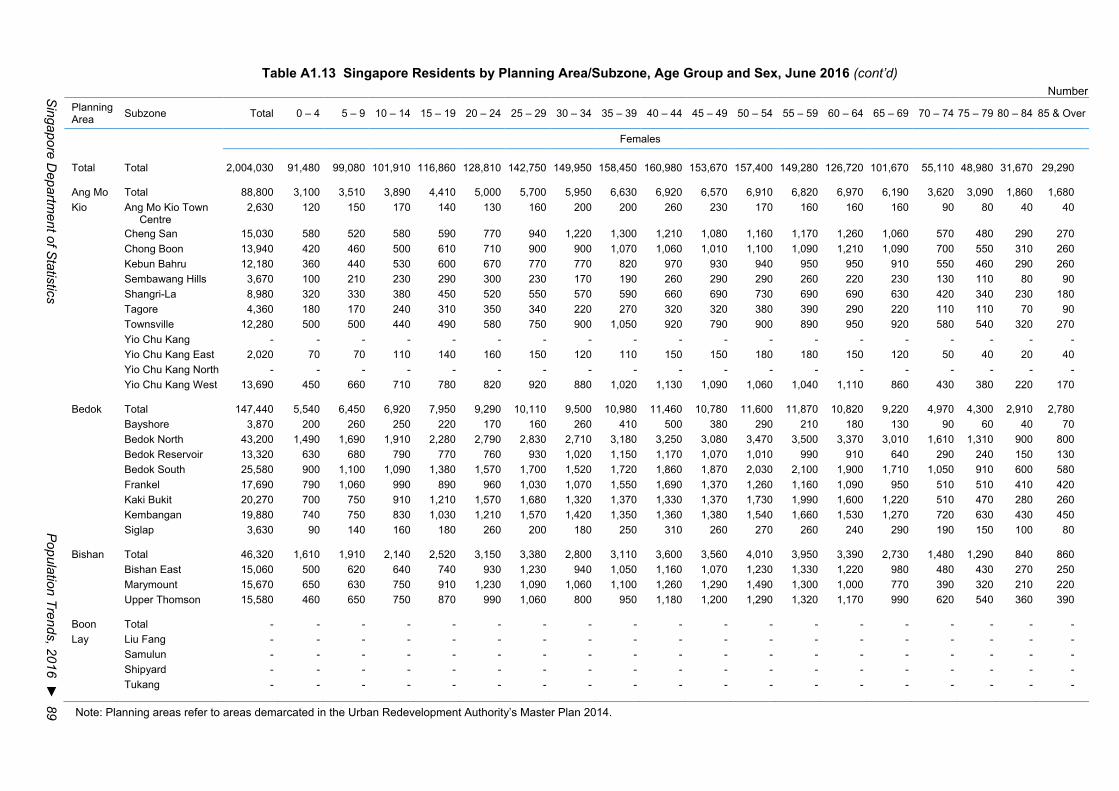
Singapore D
epartment of S
tatistics P
opulation Trends, 2016 ► 89
Table A1.13 Singapore Residents by Planning Area/Subzone, Age Group and Sex, June 2016 (cont’d) Number
Planning Area Subzone Total 0 – 4 5 – 9 10 – 14 15 – 19 20 – 24 25 – 29 30 – 34 35 – 39 40 – 44 45 – 49 50 – 54 55 – 59 60 – 64 65 – 69 70 – 74 75 – 79 80 – 84 85 & Over
Females
Total Total 2,004,030 91,480 99,080 101,910 116,860 128,810 142,750 149,950 158,450 160,980 153,670 157,400 149,280 126,720 101,670 55,110 48,980 31,670 29,290
Ang Mo Total 88,800 3,100 3,510 3,890 4,410 5,000 5,700 5,950 6,630 6,920 6,570 6,910 6,820 6,970 6,190 3,620 3,090 1,860 1,680 Kio Ang Mo Kio Town
Centre 2,630 120 150 170 140 130 160 200 200 260 230 170 160 160 160 90 80 40 40
Cheng San 15,030 580 520 580 590 770 940 1,220 1,300 1,210 1,080 1,160 1,170 1,260 1,060 570 480 290 270 Chong Boon 13,940 420 460 500 610 710 900 900 1,070 1,060 1,010 1,100 1,090 1,210 1,090 700 550 310 260 Kebun Bahru 12,180 360 440 530 600 670 770 770 820 970 930 940 950 950 910 550 460 290 260 Sembawang Hills 3,670 100 210 230 290 300 230 170 190 260 290 290 260 220 230 130 110 80 90 Shangri-La 8,980 320 330 380 450 520 550 570 590 660 690 730 690 690 630 420 340 230 180 Tagore 4,360 180 170 240 310 350 340 220 270 320 320 380 390 290 220 110 110 70 90 Townsville 12,280 500 500 440 490 580 750 900 1,050 920 790 900 890 950 920 580 540 320 270 Yio Chu Kang - - - - - - - - - - - - - - - - - - - Yio Chu Kang East 2,020 70 70 110 140 160 150 120 110 150 150 180 180 150 120 50 40 20 40 Yio Chu Kang North - - - - - - - - - - - - - - - - - - - Yio Chu Kang West 13,690 450 660 710 780 820 920 880 1,020 1,130 1,090 1,060 1,040 1,110 860 430 380 220 170
Bedok Total 147,440 5,540 6,450 6,920 7,950 9,290 10,110 9,500 10,980 11,460 10,780 11,600 11,870 10,820 9,220 4,970 4,300 2,910 2,780 Bayshore 3,870 200 260 250 220 170 160 260 410 500 380 290 210 180 130 90 60 40 70 Bedok North 43,200 1,490 1,690 1,910 2,280 2,790 2,830 2,710 3,180 3,250 3,080 3,470 3,500 3,370 3,010 1,610 1,310 900 800 Bedok Reservoir 13,320 630 680 790 770 760 930 1,020 1,150 1,170 1,070 1,010 990 910 640 290 240 150 130 Bedok South 25,580 900 1,100 1,090 1,380 1,570 1,700 1,520 1,720 1,860 1,870 2,030 2,100 1,900 1,710 1,050 910 600 580 Frankel 17,690 790 1,060 990 890 960 1,030 1,070 1,550 1,690 1,370 1,260 1,160 1,090 950 510 510 410 420 Kaki Bukit 20,270 700 750 910 1,210 1,570 1,680 1,320 1,370 1,330 1,370 1,730 1,990 1,600 1,220 510 470 280 260 Kembangan 19,880 740 750 830 1,030 1,210 1,570 1,420 1,350 1,360 1,380 1,540 1,660 1,530 1,270 720 630 430 450 Siglap 3,630 90 140 160 180 260 200 180 250 310 260 270 260 240 290 190 150 100 80
Bishan Total 46,320 1,610 1,910 2,140 2,520 3,150 3,380 2,800 3,110 3,600 3,560 4,010 3,950 3,390 2,730 1,480 1,290 840 860 Bishan East 15,060 500 620 640 740 930 1,230 940 1,050 1,160 1,070 1,230 1,330 1,220 980 480 430 270 250 Marymount 15,670 650 630 750 910 1,230 1,090 1,060 1,100 1,260 1,290 1,490 1,300 1,000 770 390 320 210 220 Upper Thomson 15,580 460 650 750 870 990 1,060 800 950 1,180 1,200 1,290 1,320 1,170 990 620 540 360 390
Boon Total - - - - - - - - - - - - - - - - - - - Lay Liu Fang - - - - - - - - - - - - - - - - - - -
Samulun - - - - - - - - - - - - - - - - - - - Shipyard - - - - - - - - - - - - - - - - - - - Tukang - - - - - - - - - - - - - - - - - - -
Note: Planning areas refer to areas demarcated in the Urban Redevelopment Authority’s Master Plan 2014.
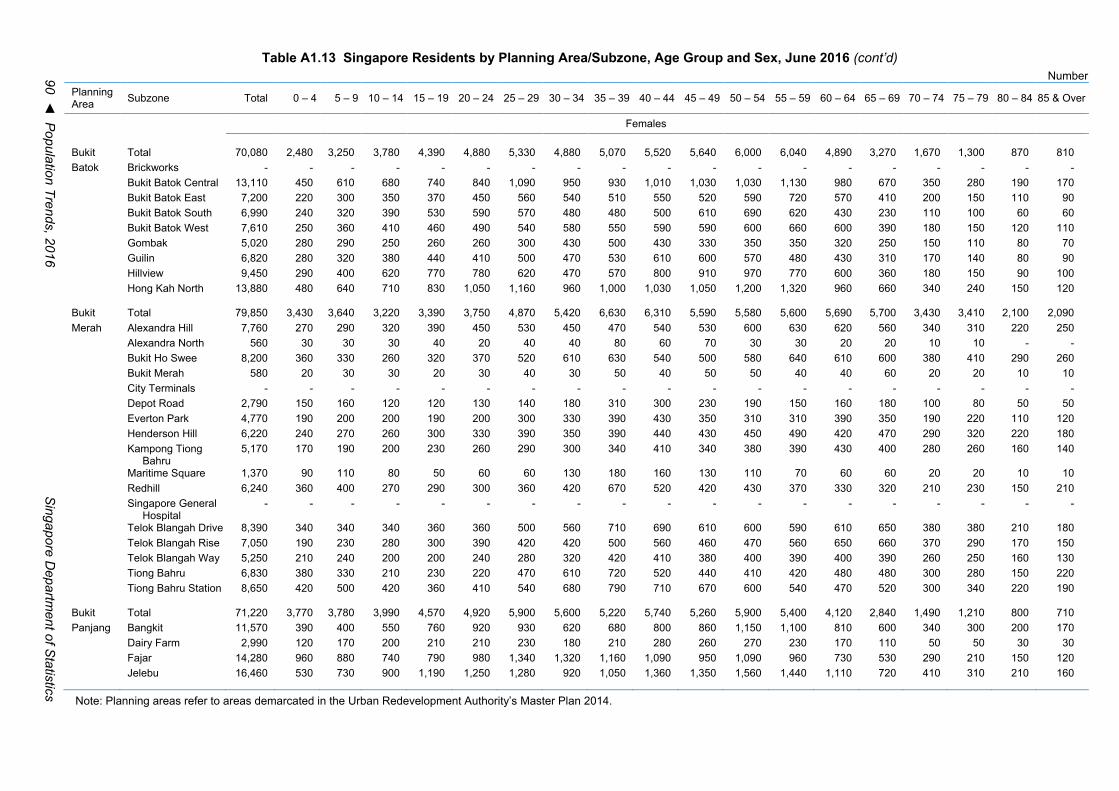
90 ◄ P
opulation Trends, 2016 S
ingapore Departm
ent of Statistics
Table A1.13 Singapore Residents by Planning Area/Subzone, Age Group and Sex, June 2016 (cont’d) Number
Planning Area Subzone Total 0 – 4 5 – 9 10 – 14 15 – 19 20 – 24 25 – 29 30 – 34 35 – 39 40 – 44 45 – 49 50 – 54 55 – 59 60 – 64 65 – 69 70 – 74 75 – 79 80 – 84 85 & Over
Females
Bukit Total 70,080 2,480 3,250 3,780 4,390 4,880 5,330 4,880 5,070 5,520 5,640 6,000 6,040 4,890 3,270 1,670 1,300 870 810 Batok Brickworks - - - - - - - - - - - - - - - - - - -
Bukit Batok Central 13,110 450 610 680 740 840 1,090 950 930 1,010 1,030 1,030 1,130 980 670 350 280 190 170 Bukit Batok East 7,200 220 300 350 370 450 560 540 510 550 520 590 720 570 410 200 150 110 90 Bukit Batok South 6,990 240 320 390 530 590 570 480 480 500 610 690 620 430 230 110 100 60 60 Bukit Batok West 7,610 250 360 410 460 490 540 580 550 590 590 600 660 600 390 180 150 120 110 Gombak 5,020 280 290 250 260 260 300 430 500 430 330 350 350 320 250 150 110 80 70 Guilin 6,820 280 320 380 440 410 500 470 530 610 600 570 480 430 310 170 140 80 90 Hillview 9,450 290 400 620 770 780 620 470 570 800 910 970 770 600 360 180 150 90 100 Hong Kah North 13,880 480 640 710 830 1,050 1,160 960 1,000 1,030 1,050 1,200 1,320 960 660 340 240 150 120
Bukit Total 79,850 3,430 3,640 3,220 3,390 3,750 4,870 5,420 6,630 6,310 5,590 5,580 5,600 5,690 5,700 3,430 3,410 2,100 2,090 Merah Alexandra Hill 7,760 270 290 320 390 450 530 450 470 540 530 600 630 620 560 340 310 220 250
Alexandra North 560 30 30 30 40 20 40 40 80 60 70 30 30 20 20 10 10 - -Bukit Ho Swee 8,200 360 330 260 320 370 520 610 630 540 500 580 640 610 600 380 410 290 260 Bukit Merah 580 20 30 30 20 30 40 30 50 40 50 50 40 40 60 20 20 10 10 City Terminals - - - - - - - - - - - - - - - - - - - Depot Road 2,790 150 160 120 120 130 140 180 310 300 230 190 150 160 180 100 80 50 50 Everton Park 4,770 190 200 200 190 200 300 330 390 430 350 310 310 390 350 190 220 110 120 Henderson Hill 6,220 240 270 260 300 330 390 350 390 440 430 450 490 420 470 290 320 220 180 Kampong Tiong
Bahru 5,170 170 190 200 230 260 290 300 340 410 340 380 390 430 400 280 260 160 140
Maritime Square 1,370 90 110 80 50 60 60 130 180 160 130 110 70 60 60 20 20 10 10 Redhill 6,240 360 400 270 290 300 360 420 670 520 420 430 370 330 320 210 230 150 210 Singapore General
Hospital - - - - - - - - - - - - - - - - - - -
Telok Blangah Drive 8,390 340 340 340 360 360 500 560 710 690 610 600 590 610 650 380 380 210 180 Telok Blangah Rise 7,050 190 230 280 300 390 420 420 500 560 460 470 560 650 660 370 290 170 150 Telok Blangah Way 5,250 210 240 200 200 240 280 320 420 410 380 400 390 400 390 260 250 160 130 Tiong Bahru 6,830 380 330 210 230 220 470 610 720 520 440 410 420 480 480 300 280 150 220 Tiong Bahru Station 8,650 420 500 420 360 410 540 680 790 710 670 600 540 470 520 300 340 220 190
Bukit Total 71,220 3,770 3,780 3,990 4,570 4,920 5,900 5,600 5,220 5,740 5,260 5,900 5,400 4,120 2,840 1,490 1,210 800 710 Panjang Bangkit 11,570 390 400 550 760 920 930 620 680 800 860 1,150 1,100 810 600 340 300 200 170
Dairy Farm 2,990 120 170 200 210 210 230 180 210 280 260 270 230 170 110 50 50 30 30 Fajar 14,280 960 880 740 790 980 1,340 1,320 1,160 1,090 950 1,090 960 730 530 290 210 150 120 Jelebu 16,460 530 730 900 1,190 1,250 1,280 920 1,050 1,360 1,350 1,560 1,440 1,110 720 410 310 210 160
Note: Planning areas refer to areas demarcated in the Urban Redevelopment Authority’s Master Plan 2014.

Singapore D
epartment of S
tatistics P
opulation Trends, 2016 ► 91
Table A1.13 Singapore Residents by Planning Area/Subzone, Age Group and Sex, June 2016 (cont’d) Number
Planning Area Subzone Total 0 – 4 5 – 9 10 – 14 15 – 19 20 – 24 25 – 29 30 – 34 35 – 39 40 – 44 45 – 49 50 – 54 55 – 59 60 – 64 65 – 69 70 – 74 75 – 79 80 – 84 85 & Over
Females
Nature Reserve 2,050 90 110 140 150 160 130 130 140 180 190 180 150 110 80 40 30 20 20 Saujana 13,320 870 760 780 850 880 1,240 1,310 1,040 1,040 950 990 940 690 420 180 160 120 110 Senja 10,550 820 740 680 610 520 760 1,130 950 1,000 700 670 580 500 380 180 160 90 90
Bukit Total 40,500 1,680 2,640 2,550 2,590 2,560 2,500 2,090 2,720 3,600 3,410 3,020 2,850 2,420 2,160 1,260 1,110 690 670 Timah Anak Bukit 11,520 370 550 630 760 850 880 600 670 880 910 910 1,010 780 660 370 340 190 180
Coronation Road 3,350 160 270 210 210 180 200 160 240 310 270 230 190 180 180 130 100 70 60 Farrer Court 2,980 170 200 160 170 130 160 200 270 280 240 210 170 170 160 90 80 60 50 Hillcrest 4,940 240 420 370 340 270 240 220 340 470 450 360 320 230 220 140 140 100 90 Holland Road 5,710 250 480 440 420 370 300 270 390 590 490 400 330 290 240 160 130 80 80 Leedon Park 3,430 140 200 210 200 210 180 200 250 330 320 250 250 200 190 110 80 60 60 Swiss Club 3,030 130 210 200 180 210 200 180 210 250 260 230 190 190 130 90 70 60 60 Ulu Pandan 5,560 210 310 330 300 350 360 260 360 500 470 430 390 390 380 180 180 90 90
Central Total - - - - - - - - - - - - - - - - - - - Water Catchment
Central Water Catchment
- - - - - - - - - - - - - - - - - - -
Changi Total 1,190 80 110 100 80 60 60 100 120 130 90 60 60 40 40 20 20 20 20 Changi Airport - - - - - - - - - - - - - - - - - - - Changi Point 360 10 10 20 20 10 20 20 20 30 30 30 40 30 20 10 10 10 20 Changi West 830 70 100 80 60 50 40 80 100 100 60 30 20 10 20 10 10 - -
Changi Total - - - - - - - - - - - - - - - - - - - Bay Changi Bay - - - - - - - - - - - - - - - - - - -
Choa Chu Total 89,820 3,740 4,470 5,320 7,070 7,790 6,570 6,050 6,500 7,020 8,260 8,220 6,390 4,620 3,130 1,630 1,370 940 760 Kang Choa Chu Kang
Central 11,030 420 560 640 860 970 800 680 780 940 1,020 1,090 760 540 400 220 160 120 90
Choa Chu Kang North
17,180 540 790 1,180 1,760 1,750 1,110 910 950 1,230 2,020 1,720 1,140 790 490 270 270 160 130
Keat Hong 9,560 480 460 560 720 890 860 710 700 690 830 860 640 450 270 140 130 110 80 Peng Siang 17,100 870 800 930 1,190 1,420 1,430 1,370 1,290 1,270 1,350 1,520 1,210 950 670 270 230 170 170 Teck Whye 13,300 480 550 640 910 1,170 1,030 820 790 900 970 1,320 1,140 880 670 370 310 190 170 Yew Tee 21,650 950 1,310 1,380 1,630 1,590 1,340 1,560 2,000 1,990 2,070 1,720 1,500 1,010 640 360 280 190 130
Clementi Total 47,930 1,940 2,180 2,140 2,310 2,400 3,000 3,340 3,860 3,980 3,590 3,520 3,340 3,770 3,570 1,770 1,500 900 830 Clementi Central 6,920 270 310 320 320 340 400 460 560 590 560 470 500 560 520 270 220 140 130 Clementi North 15,470 560 560 560 650 680 1,000 1,120 1,230 1,270 1,070 1,130 1,030 1,330 1,320 640 610 360 360
Note: Planning areas refer to areas demarcated in the Urban Redevelopment Authority’s Master Plan 2014.
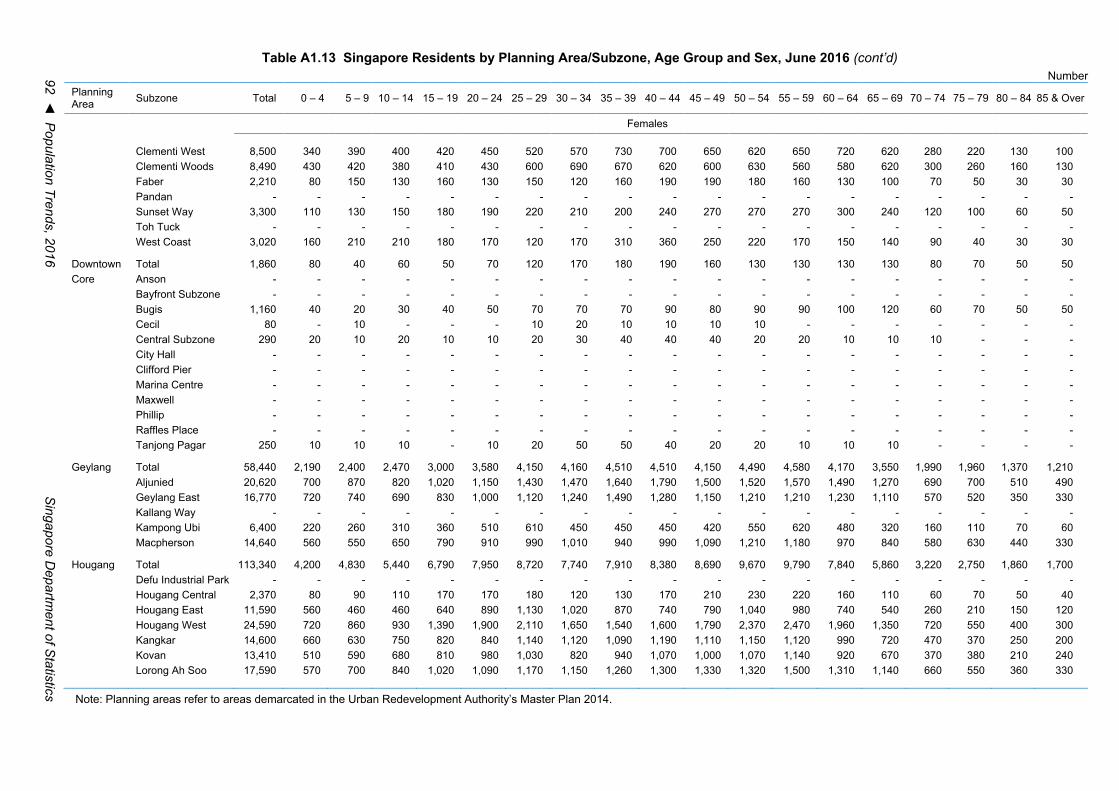
92 ◄ P
opulation Trends, 2016 S
ingapore Departm
ent of Statistics
Table A1.13 Singapore Residents by Planning Area/Subzone, Age Group and Sex, June 2016 (cont’d) Number
Planning Area Subzone Total 0 – 4 5 – 9 10 – 14 15 – 19 20 – 24 25 – 29 30 – 34 35 – 39 40 – 44 45 – 49 50 – 54 55 – 59 60 – 64 65 – 69 70 – 74 75 – 79 80 – 84 85 & Over
Females
Clementi West 8,500 340 390 400 420 450 520 570 730 700 650 620 650 720 620 280 220 130 100 Clementi Woods 8,490 430 420 380 410 430 600 690 670 620 600 630 560 580 620 300 260 160 130 Faber 2,210 80 150 130 160 130 150 120 160 190 190 180 160 130 100 70 50 30 30 Pandan - - - - - - - - - - - - - - - - - - - Sunset Way 3,300 110 130 150 180 190 220 210 200 240 270 270 270 300 240 120 100 60 50 Toh Tuck - - - - - - - - - - - - - - - - - - - West Coast 3,020 160 210 210 180 170 120 170 310 360 250 220 170 150 140 90 40 30 30
Downtown Total 1,860 80 40 60 50 70 120 170 180 190 160 130 130 130 130 80 70 50 50 Core Anson - - - - - - - - - - - - - - - - - - -
Bayfront Subzone - - - - - - - - - - - - - - - - - - - Bugis 1,160 40 20 30 40 50 70 70 70 90 80 90 90 100 120 60 70 50 50 Cecil 80 - 10 - - - 10 20 10 10 10 10 - - - - - - - Central Subzone 290 20 10 20 10 10 20 30 40 40 40 20 20 10 10 10 - - - City Hall - - - - - - - - - - - - - - - - - - - Clifford Pier - - - - - - - - - - - - - - - - - - - Marina Centre - - - - - - - - - - - - - - - - - - - Maxwell - - - - - - - - - - - - - - - - - - - Phillip - - - - - - - - - - - - - - - - - - - Raffles Place - - - - - - - - - - - - - - - - - - - Tanjong Pagar 250 10 10 10 - 10 20 50 50 40 20 20 10 10 10 - - - -
Geylang Total 58,440 2,190 2,400 2,470 3,000 3,580 4,150 4,160 4,510 4,510 4,150 4,490 4,580 4,170 3,550 1,990 1,960 1,370 1,210 Aljunied 20,620 700 870 820 1,020 1,150 1,430 1,470 1,640 1,790 1,500 1,520 1,570 1,490 1,270 690 700 510 490 Geylang East 16,770 720 740 690 830 1,000 1,120 1,240 1,490 1,280 1,150 1,210 1,210 1,230 1,110 570 520 350 330 Kallang Way - - - - - - - - - - - - - - - - - - - Kampong Ubi 6,400 220 260 310 360 510 610 450 450 450 420 550 620 480 320 160 110 70 60 Macpherson 14,640 560 550 650 790 910 990 1,010 940 990 1,090 1,210 1,180 970 840 580 630 440 330
Hougang Total 113,340 4,200 4,830 5,440 6,790 7,950 8,720 7,740 7,910 8,380 8,690 9,670 9,790 7,840 5,860 3,220 2,750 1,860 1,700 Defu Industrial Park - - - - - - - - - - - - - - - - - - - Hougang Central 2,370 80 90 110 170 170 180 120 130 170 210 230 220 160 110 60 70 50 40 Hougang East 11,590 560 460 460 640 890 1,130 1,020 870 740 790 1,040 980 740 540 260 210 150 120 Hougang West 24,590 720 860 930 1,390 1,900 2,110 1,650 1,540 1,600 1,790 2,370 2,470 1,960 1,350 720 550 400 300 Kangkar 14,600 660 630 750 820 840 1,140 1,120 1,090 1,190 1,110 1,150 1,120 990 720 470 370 250 200 Kovan 13,410 510 590 680 810 980 1,030 820 940 1,070 1,000 1,070 1,140 920 670 370 380 210 240 Lorong Ah Soo 17,590 570 700 840 1,020 1,090 1,170 1,150 1,260 1,300 1,330 1,320 1,500 1,310 1,140 660 550 360 330
Note: Planning areas refer to areas demarcated in the Urban Redevelopment Authority’s Master Plan 2014.

Singapore D
epartment of S
tatistics P
opulation Trends, 2016 ► 93
Table A1.13 Singapore Residents by Planning Area/Subzone, Age Group and Sex, June 2016 (cont’d) Number
Planning Area Subzone Total 0 – 4 5 – 9 10 – 14 15 – 19 20 – 24 25 – 29 30 – 34 35 – 39 40 – 44 45 – 49 50 – 54 55 – 59 60 – 64 65 – 69 70 – 74 75 – 79 80 – 84 85 & Over
Females
Lorong Halus - - - - - - - - - - - - - - - - - - - Tai Seng 7,440 250 340 420 490 530 560 410 470 530 580 590 610 510 390 220 220 160 160 Trafalgar 21,740 850 1,160 1,260 1,450 1,570 1,410 1,460 1,610 1,780 1,890 1,900 1,750 1,230 940 460 410 300 310
Jurong Total 42,580 1,620 1,890 2,030 2,370 2,680 3,310 3,030 3,250 3,240 3,060 3,280 3,580 3,230 2,590 1,230 1,030 600 560 East International
Business Park - - - - - - - - - - - - - - - - - - -
Jurong Gateway - - - - - - - - - - - - - - - - - - - Jurong Port - - - - - - - - - - - - - - - - - - - Jurong River - - - - - - - - - - - - - - - - - - - Lakeside 470 10 20 20 20 30 40 40 30 40 30 30 40 40 40 30 20 10 10 Penjuru Crescent - - - - - - - - - - - - - - - - - - - Teban Gardens 9,890 500 490 440 530 570 730 770 820 710 660 670 730 760 710 320 230 140 120 Toh Guan 8,150 300 380 430 520 550 680 550 610 660 630 700 750 590 350 140 130 90 70 Yuhua East 13,720 440 550 640 700 850 1,020 970 1,070 1,040 970 1,040 1,200 1,070 910 460 370 210 210 Yuhua West 10,340 370 450 510 600 680 850 690 710 800 770 840 860 770 590 280 270 160 150
Jurong Total 134,180 6,430 7,540 7,820 8,650 9,170 9,990 11,040 11,760 11,070 10,400 9,900 9,300 8,180 5,780 2,740 2,150 1,260 1,020 West Boon Lay Place 15,140 900 900 800 940 1,020 1,140 1,450 1,130 1,190 1,150 1,100 900 880 660 390 300 160 130
Chin Bee - - - - - - - - - - - - - - - - - - - Hong Kah 28,090 1,030 1,290 1,460 1,710 1,770 2,110 2,070 2,130 2,220 2,030 2,100 2,290 2,220 1,650 800 610 330 280 Jurong West
Central 33,560 1,900 2,300 2,140 1,930 1,800 2,400 3,100 3,860 3,260 2,410 2,100 2,160 1,790 1,130 460 380 250 180
Kian Teck - - - - - - - - - - - - - - - - - - - Safti - - - - - - - - - - - - - - - - - - - Taman Jurong 18,630 960 1,000 1,080 1,290 1,340 1,370 1,550 1,490 1,430 1,580 1,360 1,240 1,070 770 410 330 210 150 Wenya 4,210 350 360 300 190 160 260 510 560 370 270 220 210 170 150 60 40 30 10 Yunnan 34,540 1,300 1,700 2,040 2,580 3,080 2,710 2,360 2,590 2,590 2,950 3,020 2,500 2,050 1,410 620 490 290 270
Kallang Total 50,400 2,040 2,120 2,080 2,300 2,540 3,100 3,650 4,180 4,250 3,810 3,630 3,680 3,480 3,280 1,920 1,940 1,240 1,180 Bendemeer 17,320 800 700 660 730 790 1,130 1,420 1,570 1,440 1,200 1,130 1,320 1,240 1,130 640 630 410 400 Boon Keng 5,550 220 210 220 260 300 330 430 420 410 430 380 450 380 360 210 230 170 140 Crawford 4,290 140 150 150 180 230 240 250 260 260 310 320 300 330 380 230 270 150 150 Geylang Bahru 6,330 190 230 270 330 320 380 370 470 510 480 520 500 450 400 280 280 190 160 Kallang Bahru - - - - - - - - - - - - - - - - - - - Kampong Bugis 430 20 10 10 20 30 40 40 30 30 20 30 40 40 40 10 10 10 10 Kampong Java 5,650 180 220 210 250 280 370 400 450 510 440 410 380 400 420 220 230 140 140 Lavender 4,870 210 260 220 210 260 330 350 400 420 370 390 330 310 300 170 160 100 90
Note: Planning areas refer to areas demarcated in the Urban Redevelopment Authority’s Master Plan 2014.

94 ◄ P
opulation Trends, 2016 S
ingapore Departm
ent of Statistics
Table A1.13 Singapore Residents by Planning Area/Subzone, Age Group and Sex, June 2016 (cont’d) Number
Planning Area Subzone Total 0 – 4 5 – 9 10 – 14 15 – 19 20 – 24 25 – 29 30 – 34 35 – 39 40 – 44 45 – 49 50 – 54 55 – 59 60 – 64 65 – 69 70 – 74 75 – 79 80 – 84 85 & Over
Females Tanjong Rhu
5,950 290 340 340 320 330 290 390 580 670 550 450 350 330 250 160 140 80 90
Lim Chu Total - - - - - - - - - - - - - - - - - - - Kang Lim Chu Kang
- - - - - - - - - - - - - - - - - - -
Mandai Total 1,140 40 70 70 90 100 80 70 90 100 110 80 80 40 50 30 20 10 10 Mandai East - - - - - - - - - - - - - - - - - - - Mandai Estate 1,140 40 70 70 90 100 80 70 90 100 110 80 80 40 50 30 20 10 10 Mandai West
- - - - - - - - - - - - - - - - - - -
Marina Total - - - - - - - - - - - - - - - - - - - East
Marina East - - - - - - - - - - - - - - - - - - -
Marina Total - - - - - - - - - - - - - - - - - - - South
Marina South - - - - - - - - - - - - - - - - - - -
Marine Total 25,590 1,050 1,320 1,360 1,280 1,330 1,390 1,550 2,080 2,380 1,990 1,820 1,690 1,570 1,530 1,010 970 650 630 Parade East Coast - - - - - - - - - - - - - - - - - - - Katong 4,950 200 260 270 250 280 310 310 440 490 380 350 330 300 270 150 150 100 130 Marina East (Mp) - - - - - - - - - - - - - - - - - - - Marine Parade 15,180 600 780 750 720 730 760 870 1,190 1,390 1,160 1,070 1,000 970 970 690 710 450 400 Mountbatten
5,460 250 290 340 320 320 320 370 450 490 440 410 370 310 300 170 120 100 110
Museum Total 210 10 10 10 10 10 10 20 40 30 20 20 20 - - 10 - - - Bras Basah - - - - - - - - - - - - - - - - - - - Dhoby Ghaut 120 10 10 - - 10 10 20 30 10 10 10 10 - - - - - - Fort Canning
90 10 10 - 10 - - 10 10 10 10 - 10 - - - - - -
Newton Total 3,810 180 230 180 170 220 210 250 340 430 340 320 240 210 190 90 90 60 70 Cairnhill 1,860 90 100 90 90 110 100 140 160 230 160 140 110 100 100 40 50 30 40 Goodwood Park 530 20 40 50 20 40 30 40 60 60 40 40 20 30 10 10 10 10 20 Istana Negara - - - - - - - - - - - - - - - - - - - Monk’s Hill 500 20 20 20 30 20 30 30 40 60 50 50 40 20 30 20 20 10 10 Newton Circus 110 10 10 - 10 10 - 10 20 10 10 10 10 10 10 - - - - Orange Grove
790 40 60 20 40 50 50 40 60 70 80 80 60 60 60 20 20 10 10
North- Total - - - - - - - - - - - - - - - - - - - Eastern Islands
North-Eastern Islands
- - - - - - - - - - - - - - - - - - -
Note: Planning areas refer to areas demarcated in the Urban Redevelopment Authority’s Master Plan 2014.
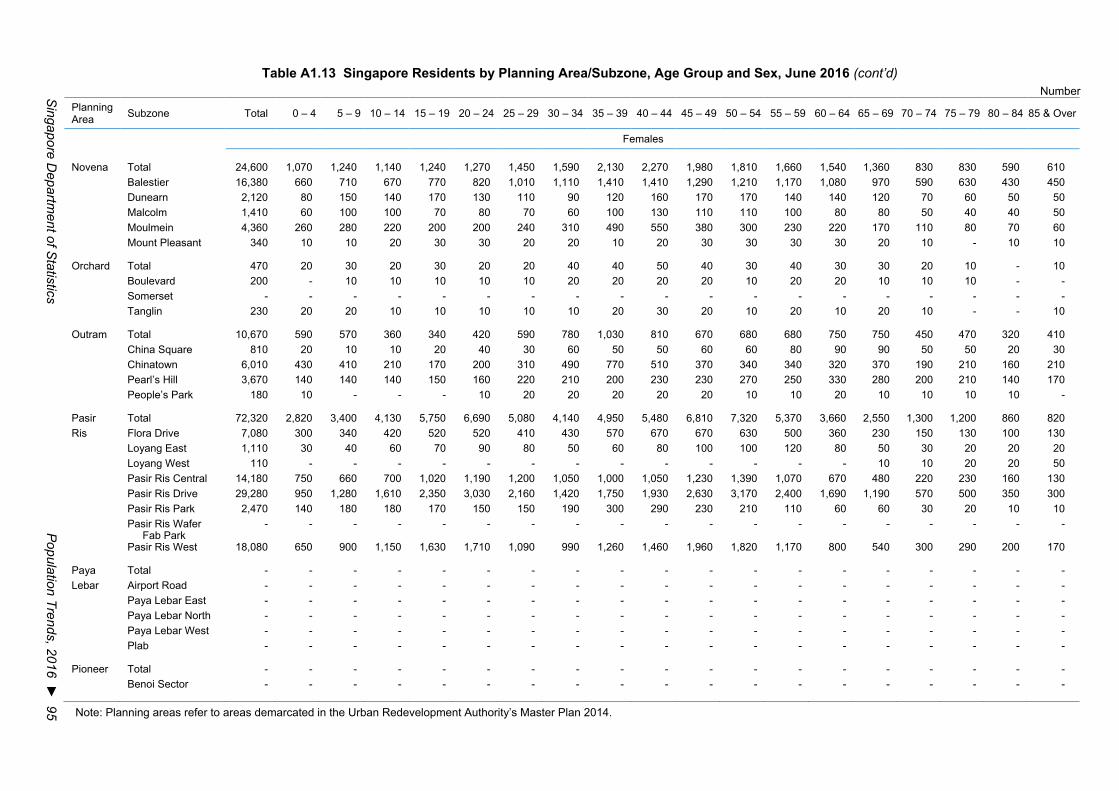
Singapore D
epartment of S
tatistics P
opulation Trends, 2016 ► 95
Table A1.13 Singapore Residents by Planning Area/Subzone, Age Group and Sex, June 2016 (cont’d) Number
Planning Area Subzone Total 0 – 4 5 – 9 10 – 14 15 – 19 20 – 24 25 – 29 30 – 34 35 – 39 40 – 44 45 – 49 50 – 54 55 – 59 60 – 64 65 – 69 70 – 74 75 – 79 80 – 84 85 & Over
Females
Novena Total 24,600 1,070 1,240 1,140 1,240 1,270 1,450 1,590 2,130 2,270 1,980 1,810 1,660 1,540 1,360 830 830 590 610 Balestier 16,380 660 710 670 770 820 1,010 1,110 1,410 1,410 1,290 1,210 1,170 1,080 970 590 630 430 450 Dunearn 2,120 80 150 140 170 130 110 90 120 160 170 170 140 140 120 70 60 50 50 Malcolm 1,410 60 100 100 70 80 70 60 100 130 110 110 100 80 80 50 40 40 50 Moulmein 4,360 260 280 220 200 200 240 310 490 550 380 300 230 220 170 110 80 70 60 Mount Pleasant 340 10 10 20 30 30 20 20 10 20 30 30 30 30 20 10 - 10 10
Orchard Total 470 20 30 20 30 20 20 40 40 50 40 30 40 30 30 20 10 - 10Boulevard 200 - 10 10 10 10 10 20 20 20 20 10 20 20 10 10 10 - -Somerset - - - - - - - - - - - - - - - - - - - Tanglin 230 20 20 10 10 10 10 10 20 30 20 10 20 10 20 10 - - 10
Outram Total 10,670 590 570 360 340 420 590 780 1,030 810 670 680 680 750 750 450 470 320 410 China Square 810 20 10 10 20 40 30 60 50 50 60 60 80 90 90 50 50 20 30 Chinatown 6,010 430 410 210 170 200 310 490 770 510 370 340 340 320 370 190 210 160 210 Pearl’s Hill 3,670 140 140 140 150 160 220 210 200 230 230 270 250 330 280 200 210 140 170 People’s Park 180 10 - - - 10 20 20 20 20 20 10 10 20 10 10 10 10 -
Pasir Total 72,320 2,820 3,400 4,130 5,750 6,690 5,080 4,140 4,950 5,480 6,810 7,320 5,370 3,660 2,550 1,300 1,200 860 820 Ris Flora Drive 7,080 300 340 420 520 520 410 430 570 670 670 630 500 360 230 150 130 100 130
Loyang East 1,110 30 40 60 70 90 80 50 60 80 100 100 120 80 50 30 20 20 20 Loyang West 110 - - - - - - - - - - - - - 10 10 20 20 50 Pasir Ris Central 14,180 750 660 700 1,020 1,190 1,200 1,050 1,000 1,050 1,230 1,390 1,070 670 480 220 230 160 130 Pasir Ris Drive 29,280 950 1,280 1,610 2,350 3,030 2,160 1,420 1,750 1,930 2,630 3,170 2,400 1,690 1,190 570 500 350 300 Pasir Ris Park 2,470 140 180 180 170 150 150 190 300 290 230 210 110 60 60 30 20 10 10 Pasir Ris Wafer
Fab Park - - - - - - - - - - - - - - - - - - -
Pasir Ris West 18,080 650 900 1,150 1,630 1,710 1,090 990 1,260 1,460 1,960 1,820 1,170 800 540 300 290 200 170
Paya Total - - - - - - - - - - - - - - - - - - - Lebar Airport Road - - - - - - - - - - - - - - - - - - -
Paya Lebar East - - - - - - - - - - - - - - - - - - - Paya Lebar North - - - - - - - - - - - - - - - - - - - Paya Lebar West - - - - - - - - - - - - - - - - - - - Plab - - - - - - - - - - - - - - - - - - -
Pioneer Total - - - - - - - - - - - - - - - - - - - Benoi Sector - - - - - - - - - - - - - - - - - - -
Note: Planning areas refer to areas demarcated in the Urban Redevelopment Authority’s Master Plan 2014.
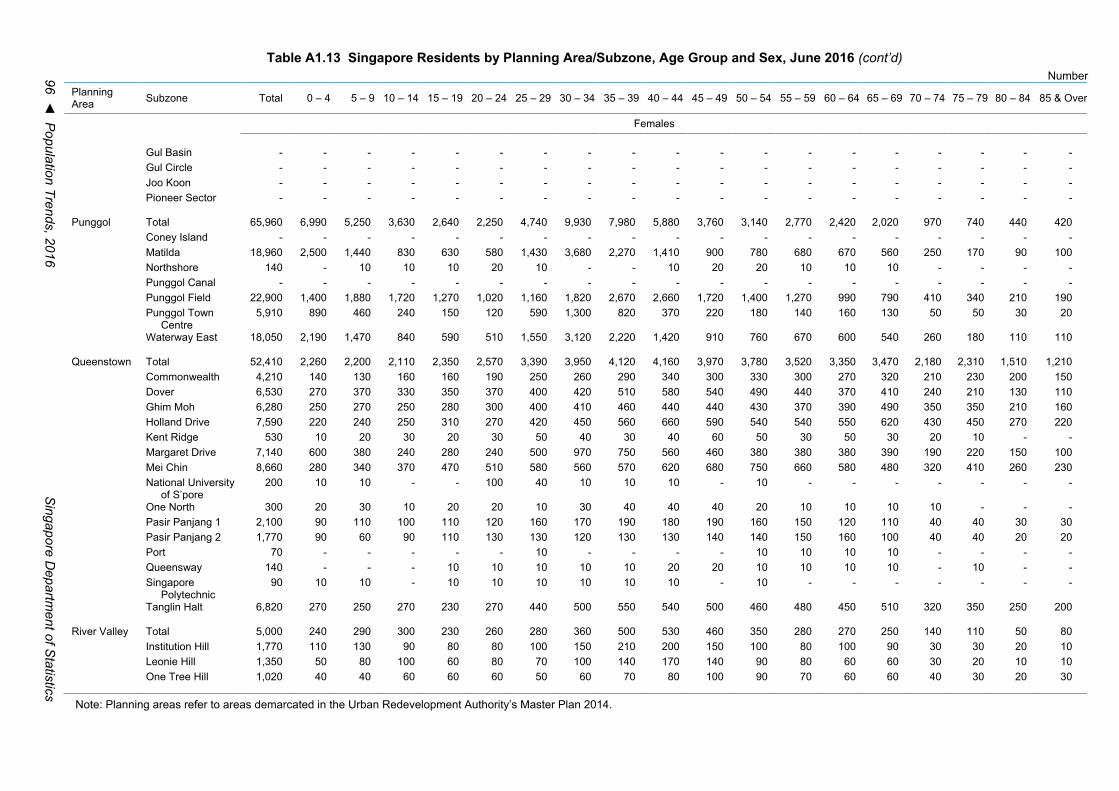
96 ◄ P
opulation Trends, 2016 S
ingapore Departm
ent of Statistics
Table A1.13 Singapore Residents by Planning Area/Subzone, Age Group and Sex, June 2016 (cont’d) Number
Planning Area Subzone Total 0 – 4 5 – 9 10 – 14 15 – 19 20 – 24 25 – 29 30 – 34 35 – 39 40 – 44 45 – 49 50 – 54 55 – 59 60 – 64 65 – 69 70 – 74 75 – 79 80 – 84 85 & Over
Females
Gul Basin - - - - - - - - - - - - - - - - - - - Gul Circle - - - - - - - - - - - - - - - - - - - Joo Koon - - - - - - - - - - - - - - - - - - - Pioneer Sector - - - - - - - - - - - - - - - - - - -
Punggol Total 65,960 6,990 5,250 3,630 2,640 2,250 4,740 9,930 7,980 5,880 3,760 3,140 2,770 2,420 2,020 970 740 440 420 Coney Island - - - - - - - - - - - - - - - - - - - Matilda 18,960 2,500 1,440 830 630 580 1,430 3,680 2,270 1,410 900 780 680 670 560 250 170 90 100 Northshore 140 - 10 10 10 20 10 - - 10 20 20 10 10 10 - - - -Punggol Canal - - - - - - - - - - - - - - - - - - - Punggol Field 22,900 1,400 1,880 1,720 1,270 1,020 1,160 1,820 2,670 2,660 1,720 1,400 1,270 990 790 410 340 210 190 Punggol Town
Centre 5,910 890 460 240 150 120 590 1,300 820 370 220 180 140 160 130 50 50 30 20
Waterway East 18,050 2,190 1,470 840 590 510 1,550 3,120 2,220 1,420 910 760 670 600 540 260 180 110 110
Queenstown Total 52,410 2,260 2,200 2,110 2,350 2,570 3,390 3,950 4,120 4,160 3,970 3,780 3,520 3,350 3,470 2,180 2,310 1,510 1,210 Commonwealth 4,210 140 130 160 160 190 250 260 290 340 300 330 300 270 320 210 230 200 150 Dover 6,530 270 370 330 350 370 400 420 510 580 540 490 440 370 410 240 210 130 110 Ghim Moh 6,280 250 270 250 280 300 400 410 460 440 440 430 370 390 490 350 350 210 160 Holland Drive 7,590 220 240 250 310 270 420 450 560 660 590 540 540 550 620 430 450 270 220 Kent Ridge 530 10 20 30 20 30 50 40 30 40 60 50 30 50 30 20 10 - -Margaret Drive 7,140 600 380 240 280 240 500 970 750 560 460 380 380 380 390 190 220 150 100 Mei Chin 8,660 280 340 370 470 510 580 560 570 620 680 750 660 580 480 320 410 260 230 National University
of S’pore 200 10 10 - - 100 40 10 10 10 - 10 - - - - - - -
One North 300 20 30 10 20 20 10 30 40 40 40 20 10 10 10 10 - - - Pasir Panjang 1 2,100 90 110 100 110 120 160 170 190 180 190 160 150 120 110 40 40 30 30 Pasir Panjang 2 1,770 90 60 90 110 130 130 120 130 130 140 140 150 160 100 40 40 20 20 Port 70 - - - - - 10 - - - - 10 10 10 10 - - - -Queensway 140 - - - 10 10 10 10 10 20 20 10 10 10 10 - 10 - -Singapore
Polytechnic 90 10 10 - 10 10 10 10 10 10 - 10 - - - - - - -
Tanglin Halt 6,820 270 250 270 230 270 440 500 550 540 500 460 480 450 510 320 350 250 200
River Valley Total 5,000 240 290 300 230 260 280 360 500 530 460 350 280 270 250 140 110 50 80 Institution Hill 1,770 110 130 90 80 80 100 150 210 200 150 100 80 100 90 30 30 20 10 Leonie Hill 1,350 50 80 100 60 80 70 100 140 170 140 90 80 60 60 30 20 10 10 One Tree Hill 1,020 40 40 60 60 60 50 60 70 80 100 90 70 60 60 40 30 20 30
Note: Planning areas refer to areas demarcated in the Urban Redevelopment Authority’s Master Plan 2014.

Singapore D
epartment of S
tatistics P
opulation Trends, 2016 ► 97
Table A1.13 Singapore Residents by Planning Area/Subzone, Age Group and Sex, June 2016 (cont’d) Number
Planning Area Subzone Total 0 – 4 5 – 9 10 – 14 15 – 19 20 – 24 25 – 29 30 – 34 35 – 39 40 – 44 45 – 49 50 – 54 55 – 59 60 – 64 65 – 69 70 – 74 75 – 79 80 – 84 85 & Over
Females
Oxley 760 30 40 40 20 40 50 40 70 70 70 60 50 50 50 30 30 10 30 Paterson 100 - 10 10 - - - 10 10 10 10 10 - - - - - - -
Rochor Total 7,070 270 260 300 300 370 440 490 600 570 520 490 490 520 520 300 290 190 160 Bencoolen 770 40 30 30 40 40 40 60 50 60 60 60 50 50 60 20 40 30 30 Farrer Park 1,460 60 70 70 70 70 90 100 140 120 100 90 110 110 100 60 40 40 30 Kampong Glam 60 10 - - - - - 10 10 - 10 10 - - - - - - - Little India 1,750 50 70 70 80 100 110 90 120 140 130 130 140 150 140 90 90 50 30 Mackenzie 60 - - - - - - 10 10 10 10 10 - - - - - - - Mount Emily 630 30 40 40 20 20 40 70 90 80 50 30 30 30 20 10 10 - 10Rochor Canal - - - - - - - - - - - - - - - - - - -Selegie 120 10 10 - - 10 10 10 20 10 10 10 - 10 10 - - 10 - Sungei Road 1,160 50 40 60 60 70 80 70 80 70 90 80 60 80 100 60 50 30 30 Victoria 1,070 30 20 30 30 50 70 80 80 80 70 80 100 90 100 50 60 40 30
Seletar Total 130 - 10 - 10 10 - 10 10 20 10 20 10 10 - - - - - Pulau Punggol
Barat - - - - - - - - - - - - - - - - - - -
Pulau Punggol Timor
- - - - - - - - - - - - - - - - - - -
Seletar 120 - 10 - 10 10 - 10 10 20 10 20 10 10 - - - - - Seletar Aerospace
Park - - - - - - - - - - - - - - - - - - -
Sembawang Total 39,030 2,130 2,560 2,570 2,450 2,220 2,600 3,250 3,760 3,970 3,050 2,820 2,550 1,800 1,250 720 600 400 350 Admiralty 7,320 470 540 500 390 320 550 680 730 750 540 460 430 320 250 140 130 90 50 Sembawang Central 14,630 730 870 940 1,000 910 970 1,170 1,310 1,490 1,200 1,130 1,040 670 440 270 220 150 140 Sembawang East - - - - - - - - - - - - - - - - - - - Sembawang North 13,620 810 960 910 810 760 870 1,230 1,430 1,390 1,000 920 890 650 430 220 160 110 80 Sembawang
Springs 2,570 90 140 170 190 150 150 140 220 270 230 210 130 120 100 60 70 50 70
Sembawang Straits 840 30 40 50 60 80 60 30 70 70 70 90 60 40 40 30 10 10 10 Senoko North - - - - - - - - - - - - - - - - - - - Senoko South - - - - - - - - - - - - - - - - - - - The Wharves - - - - - - - - - - - - - - - - - - -
Sengkang Total 111,470 8,170 7,700 6,520 6,130 5,670 8,120 11,820 11,450 10,060 7,630 7,070 6,700 5,170 3,850 1,930 1,530 1,030 940 Anchorvale 19,990 1,600 1,500 1,310 1,010 820 1,630 2,180 2,140 2,100 1,190 1,040 1,090 870 660 320 250 140 130
Note: Planning areas refer to areas demarcated in the Urban Redevelopment Authority’s Master Plan 2014.
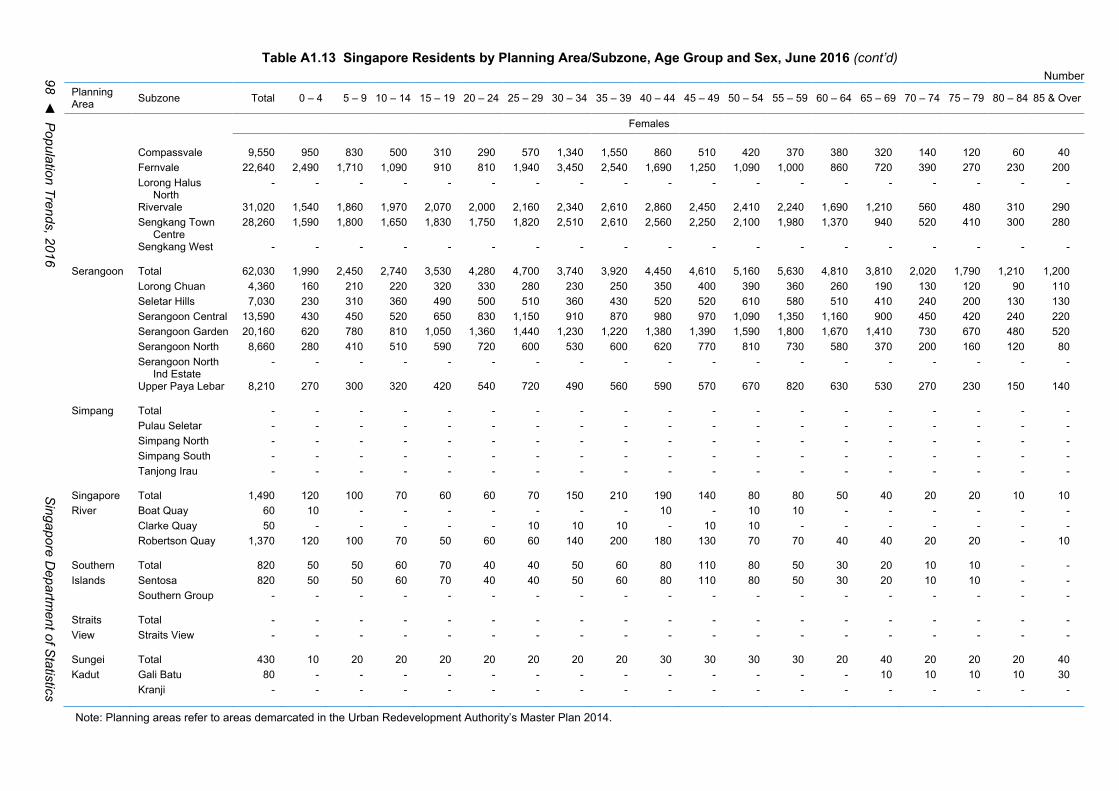
98 ◄ P
opulation Trends, 2016 S
ingapore Departm
ent of Statistics
Table A1.13 Singapore Residents by Planning Area/Subzone, Age Group and Sex, June 2016 (cont’d) Number
Planning Area Subzone Total 0 – 4 5 – 9 10 – 14 15 – 19 20 – 24 25 – 29 30 – 34 35 – 39 40 – 44 45 – 49 50 – 54 55 – 59 60 – 64 65 – 69 70 – 74 75 – 79 80 – 84 85 & Over
Females Compassvale 9,550 950 830 500 310 290 570 1,340 1,550 860 510 420 370 380 320 140 120 60 40 Fernvale 22,640 2,490 1,710 1,090 910 810 1,940 3,450 2,540 1,690 1,250 1,090 1,000 860 720 390 270 230 200 Lorong Halus
North - - - - - - - - - - - - - - - - - - -
Rivervale 31,020 1,540 1,860 1,970 2,070 2,000 2,160 2,340 2,610 2,860 2,450 2,410 2,240 1,690 1,210 560 480 310 290 Sengkang Town
Centre 28,260 1,590 1,800 1,650 1,830 1,750 1,820 2,510 2,610 2,560 2,250 2,100 1,980 1,370 940 520 410 300 280
Sengkang West
- - - - - - - - - - - - - - - - - - -
Serangoon Total 62,030 1,990 2,450 2,740 3,530 4,280 4,700 3,740 3,920 4,450 4,610 5,160 5,630 4,810 3,810 2,020 1,790 1,210 1,200 Lorong Chuan 4,360 160 210 220 320 330 280 230 250 350 400 390 360 260 190 130 120 90 110 Seletar Hills 7,030 230 310 360 490 500 510 360 430 520 520 610 580 510 410 240 200 130 130 Serangoon Central 13,590 430 450 520 650 830 1,150 910 870 980 970 1,090 1,350 1,160 900 450 420 240 220 Serangoon Garden 20,160 620 780 810 1,050 1,360 1,440 1,230 1,220 1,380 1,390 1,590 1,800 1,670 1,410 730 670 480 520 Serangoon North 8,660 280 410 510 590 720 600 530 600 620 770 810 730 580 370 200 160 120 80 Serangoon North
Ind Estate - - - - - - - - - - - - - - - - - - -
Upper Paya Lebar
8,210 270 300 320 420 540 720 490 560 590 570 670 820 630 530 270 230 150 140
Simpang Total - - - - - - - - - - - - - - - - - - - Pulau Seletar - - - - - - - - - - - - - - - - - - - Simpang North - - - - - - - - - - - - - - - - - - - Simpang South - - - - - - - - - - - - - - - - - - - Tanjong Irau
- - - - - - - - - - - - - - - - - - -
Singapore Total 1,490 120 100 70 60 60 70 150 210 190 140 80 80 50 40 20 20 10 10 River Boat Quay 60 10 - - - - - - - 10 - 10 10 - - - - - - Clarke Quay 50 - - - - - 10 10 10 - 10 10 - - - - - - - Robertson Quay
1,370 120 100 70 50 60 60 140 200 180 130 70 70 40 40 20 20 - 10
Southern Total 820 50 50 60 70 40 40 50 60 80 110 80 50 30 20 10 10 - - Islands Sentosa 820 50 50 60 70 40 40 50 60 80 110 80 50 30 20 10 10 - - Southern Group
- - - - - - - - - - - - - - - - - - -
Straits Total - - - - - - - - - - - - - - - - - - - View
Straits View - - - - - - - - - - - - - - - - - - -
Sungei Total 430 10 20 20 20 20 20 20 20 30 30 30 30 20 40 20 20 20 40 Kadut Gali Batu 80 - - - - - - - - - - - - - 10 10 10 10 30 Kranji - - - - - - - - - - - - - - - - - - -
Note: Planning areas refer to areas demarcated in the Urban Redevelopment Authority’s Master Plan 2014.

Singapore D
epartment of S
tatistics P
opulation Trends, 2016 ► 99
Table A1.13 Singapore Residents by Planning Area/Subzone, Age Group and Sex, June 2016 (cont’d)
Number Planning Area Subzone Total 0 – 4 5 – 9 10 – 14 15 – 19 20 – 24 25 – 29 30 – 34 35 – 39 40 – 44 45 – 49 50 – 54 55 – 59 60 – 64 65 – 69 70 – 74 75 – 79 80 – 84 85 & Over
Females Pang Sua - - - - - - - - - - - - - - - - - - - Reservoir View - - - - - - - - - - - - - - - - - - - Turf Club
330 10 10 20 20 20 20 20 20 20 30 30 30 10 30 10 10 10 10
Tampines Total 131,990 5,470 5,660 6,350 8,250 10,110 10,490 9,230 9,300 9,190 10,120 11,590 11,700 9,160 6,270 3,030 2,630 1,790 1,670 Simei 21,560 950 980 1,080 1,310 1,560 1,570 1,510 1,730 1,690 1,680 1,900 1,780 1,390 970 460 410 270 320 Tampines East 70,160 2,820 2,890 3,290 4,410 5,510 5,590 4,910 4,750 4,610 5,400 6,150 6,380 4,990 3,470 1,680 1,450 990 900 Tampines North - - - - - - - - - - - - - - - - - - - Tampines West 39,370 1,680 1,760 1,940 2,470 2,950 3,270 2,760 2,770 2,830 2,960 3,420 3,440 2,730 1,800 880 760 510 440 Xilin
910 20 30 40 60 90 60 50 50 60 90 130 100 50 30 20 10 10 10
Tanglin Total 10,560 540 720 600 580 550 530 670 950 1,070 940 810 660 610 520 290 230 150 170 Chatsworth 3,230 170 210 160 150 140 150 260 340 390 310 210 180 170 140 100 70 40 40 Nassim 4,700 230 360 300 280 250 230 250 420 470 400 380 300 250 240 120 90 60 80 Ridout 740 50 30 40 40 40 40 50 50 50 70 60 50 50 40 20 30 10 20 Tyersall
1,890 80 120 100 110 110 110 100 130 160 170 160 130 130 100 60 50 30 30
Tengah Total - - - - - - - - - - - - - - - - - - - Tengah
- - - - - - - - - - - - - - - - - - -
Toa Total 64,090 2,350 2,640 2,660 3,030 3,550 3,940 4,180 4,670 5,110 4,740 4,870 4,990 4,390 4,190 2,690 2,810 1,720 1,590 Payoh Bidadari - - - - - - - - - - - - - - - - - - - Boon Teck 7,590 260 320 310 390 440 450 400 460 520 530 600 560 540 500 400 400 270 260 Braddell 5,510 170 230 250 290 340 370 340 370 420 420 430 420 370 350 200 260 140 160 Joo Seng 3,350 110 160 120 150 190 240 210 250 260 230 270 270 260 230 120 130 90 70 Kim Keat 4,420 130 150 150 200 290 330 290 310 320 290 340 420 330 300 190 200 100 90 Lorong 8 Toa Payoh 4,150 120 140 150 210 250 250 240 250 330 300 320 360 300 290 200 200 120 120 Pei Chun 5,980 180 250 310 310 290 320 340 410 520 510 470 450 360 400 270 270 170 150 Potong Pasir 6,310 230 200 210 220 310 440 430 470 510 460 450 580 590 530 250 200 130 100 Sennett 2,400 60 90 130 130 170 160 150 140 140 150 180 220 170 170 100 90 70 100 Toa Payoh Central 16,150 840 820 730 780 850 930 1,260 1,420 1,410 1,210 1,180 1,080 880 870 570 610 390 330 Toa Payoh West 7,000 190 230 230 290 340 390 430 490 560 540 560 550 510 490 360 420 250 190 Woodleigh
1,220 60 60 80 60 80 80 100 110 120 110 80 90 80 50 20 10 10 10
Tuas Total - - - - - - - - - - - - - - - - - - - Tengeh - - - - - - - - - - - - - - - - - - - Tuas Bay - - - - - - - - - - - - - - - - - - - Tuas North - - - - - - - - - - - - - - - - - - -
Note: Planning areas refer to areas demarcated in the Urban Redevelopment Authority’s Master Plan 2014.

100 ◄ P
opulation Trends, 2016 S
ingapore Departm
ent of Statistics
Table A1.13 Singapore Residents by Planning Area/Subzone, Age Group and Sex, June 2016 (cont’d) Number
Planning Area Subzone Total 0 – 4 5 – 9 10 – 14 15 – 19 20 – 24 25 – 29 30 – 34 35 – 39 40 – 44 45 – 49 50 – 54 55 – 59 60 – 64 65 – 69 70 – 74 75 – 79 80 – 84 85 & Over
Females
Tuas Promenade - - - - - - - - - - - - - - - - - - - Tuas View - - - - - - - - - - - - - - - - - - - Tuas View
Extension - - - - - - - - - - - - - - - - - - -
Western Total - - - - - - - - - - - - - - - - - - - Islands Jurong Island
and Bukom - - - - - - - - - - - - - - - - - - -
Semakau - - - - - - - - - - - - - - - - - - - Sudong - - - - - - - - - - - - - - - - - - -
Western Total 440 20 30 20 20 70 30 30 40 40 30 30 20 20 - 10 10 10 20 Water Catchment
Western Water Catchment
440 20 30 20 20 70 30 30 40 40 30 30 20 20 - 10 10 10 20
Woodlands Total 124,270 5,850 6,640 7,750 10,040 9,860 9,000 9,120 9,580 10,390 11,160 10,300 8,310 6,030 4,200 2,180 1,850 1,140 870 Greenwood Park - - - - - - - - - - - - - - - - - - - Midview 18,070 850 870 1,180 1,700 1,650 1,400 1,280 1,180 1,340 1,820 1,540 1,100 800 520 280 260 150 150 North Coast 6,980 230 260 310 470 570 530 440 470 470 550 640 530 500 420 240 180 100 70 Senoko West - - - - - - - - - - - - - - - - - - - Woodgrove 17,900 650 830 1,040 1,590 1,640 1,320 1,130 1,180 1,400 1,830 1,630 1,290 900 580 320 270 160 160 Woodlands East 47,030 2,370 2,750 3,210 3,720 3,430 3,390 3,600 4,060 4,470 4,200 3,740 2,940 2,000 1,350 630 570 350 260 Woodlands
Regional Centre
- - - - - - - - - - - - - - - - - - -
Woodlands South 18,200 1,050 1,250 1,250 1,430 1,150 1,210 1,570 1,700 1,630 1,450 1,310 1,110 790 580 300 200 140 100 Woodlands West 16,030 700 670 770 1,110 1,420 1,150 1,090 980 1,080 1,300 1,440 1,350 1,040 750 420 370 230 140
Yishun Total 103,980 5,340 4,890 4,990 5,820 7,060 8,750 9,020 7,990 7,780 7,420 8,780 8,360 6,520 4,710 2,350 1,960 1,210 1,050 Khatib 5,440 160 200 220 290 420 520 370 330 390 390 550 530 400 300 130 120 70 50 Lower Seletar 2,340 290 130 130 140 110 300 320 200 190 160 130 100 40 50 20 20 10 10 Nee Soon 460 20 20 20 30 30 40 20 40 40 40 40 40 20 20 20 10 10 10 Northland 15,370 590 630 770 940 1,160 1,230 1,100 1,140 1,130 1,180 1,400 1,400 1,000 720 370 310 170 140 Springleaf 2,020 70 80 120 120 180 150 90 120 150 140 180 170 140 130 70 50 30 30 Yishun Central 730 20 30 20 50 60 70 50 50 40 50 70 70 60 40 30 20 10 10 Yishun East 28,630 2,400 1,770 1,370 1,510 1,740 2,600 3,590 2,480 1,990 1,770 2,060 1,750 1,400 1,010 420 350 250 170 Yishun South 19,460 680 760 910 1,060 1,480 1,620 1,300 1,360 1,510 1,440 1,800 1,760 1,400 970 490 410 270 250 Yishun West 29,550 1,100 1,280 1,440 1,670 1,890 2,230 2,180 2,280 2,340 2,270 2,540 2,550 2,050 1,470 810 670 410 380
Note: Planning areas refer to areas demarcated in the Urban Redevelopment Authority’s Master Plan 2014.

Singapore D
epartment of S
tatistics P
opulation Trends, 2016 ► 101
Table A1.14 Singapore Residents by Planning Area/Subzone and Type of Dwelling, June 2016 Number
Planning Area Subzone Total
HDB Dwellings Condominiums
and Other Apartments
Landed Properties Others
Total HDB* 1- and 2-Room Flats^
3-RoomFlats
4-RoomFlats
5-Room andExecutive
Flats
Total Total 3,933,560 3,162,640 163,850 599,420 1,325,540 1,070,980 484,540 250,750 35,630 Ang Mo Kio Total 170,940 141,290 12,500 61,840 44,910 22,040 11,960 16,420 1,270
Ang Mo Kio Town Centre
4,980 3,150 - 450 700 2,000 1,800 - 40
Cheng San 29,050 28,900 840 14,320 8,500 5,250 - - 150 Chong Boon 27,120 26,910 1,790 13,180 8,530 3,410 - - 210 Kebun Bahru 23,310 21,860 1,860 11,420 6,290 2,290 - 1,170 270 Sembawang Hills 6,910 - - - - - 170 6,660 80 Shangri-La 17,620 17,250 3,250 7,290 5,070 1,640 - 300 70 Tagore 8,330 - - - - - 2,620 5,540 170 Townsville 23,290 23,220 1,570 7,160 10,380 4,110 - - 70 Yio Chu Kang 40 - - - - - - - -Yio Chu Kang East 4,010 - - - - - 1,620 2,300 90 Yio Chu Kang North - - - - - - - - - Yio Chu Kang West 26,300 20,000 3,190 8,020 5,440 3,350 5,750 460 90
Bedok Total 287,170 189,240 9,890 60,490 70,950 47,910 50,250 44,950 2,740 Bayshore 7,370 - - - - - 6,780 440 140 Bedok North 84,400 74,660 4,040 33,600 25,900 11,130 4,600 4,590 550 Bedok Reservoir 26,030 18,810 - 3,150 9,030 6,620 7,140 30 70 Bedok South 49,840 32,060 1,740 9,350 13,700 7,280 5,560 11,780 440 Frankel 33,710 40 40 - - - 13,980 19,050 640 Kaki Bukit 40,070 38,610 470 6,560 16,050 15,540 500 710 250 Kembangan 38,980 25,060 3,610 7,840 6,260 7,350 5,000 8,360 570 Siglap 6,780 - - - - - 6,690 - 90
Bishan Total 90,090 63,730 1,150 5,320 30,680 26,590 14,940 10,720 700Bishan East 28,900 26,830 290 2,020 11,700 12,820 1,750 - 320Marymount 31,010 23,920 - - 14,690 9,240 4,100 2,880 100Upper Thomson 30,190 12,980 860 3,300 4,290 4,530 9,090 7,840 280
Note: Planning areas refer to areas demarcated in the Urban Redevelopment Authority’s Master Plan 2014. * Includes non-privatised Housing and Urban Development Corporation (HUDC) flats.^ Includes HDB studio apartments.
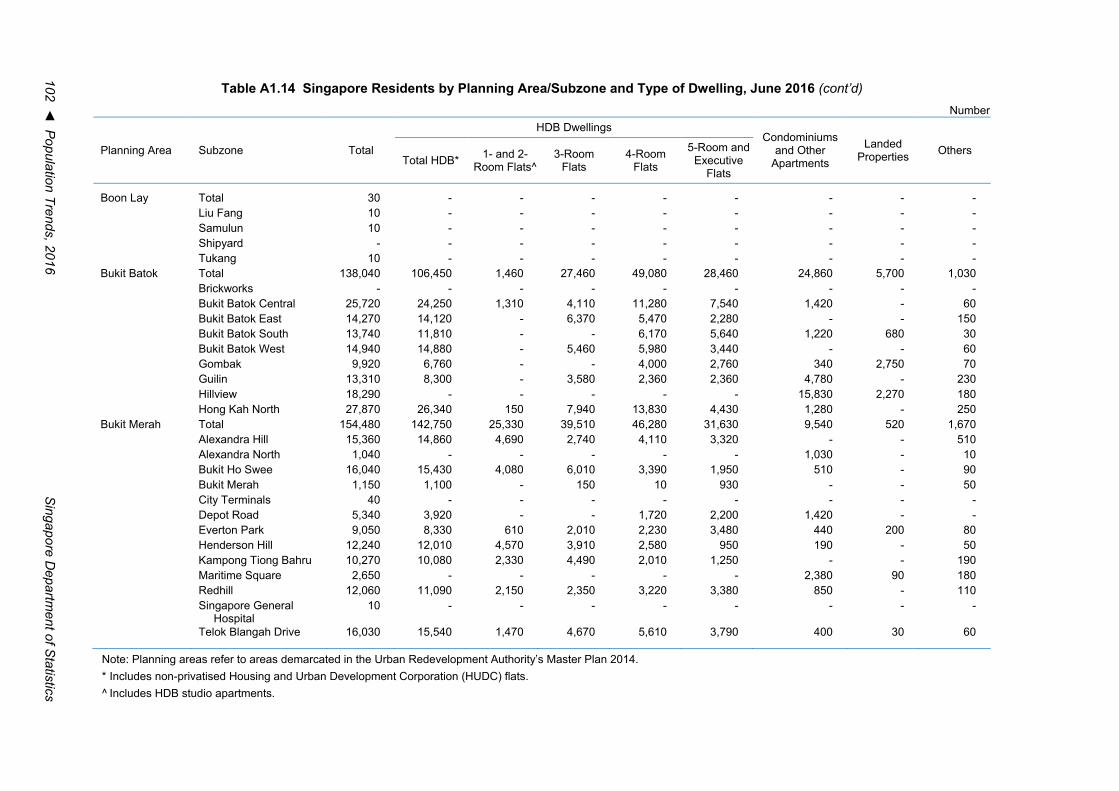
102 ◄ P
opulation Trends, 2016 S
ingapore Departm
ent of Statistics
Table A1.14 Singapore Residents by Planning Area/Subzone and Type of Dwelling, June 2016 (cont’d) Number
Planning Area Subzone Total
HDB Dwellings Condominiums
and Other Apartments
Landed Properties Others
Total HDB* 1- and 2-Room Flats^
3-RoomFlats
4-RoomFlats
5-Room andExecutive
Flats
Boon Lay Total 30 - - - - - - - -Liu Fang 10 - - - - - - - -Samulun 10 - - - - - - - -Shipyard - - - - - - - - - Tukang 10 - - - - - - - -
Bukit Batok Total 138,040 106,450 1,460 27,460 49,080 28,460 24,860 5,700 1,030 Brickworks - - - - - - - - - Bukit Batok Central 25,720 24,250 1,310 4,110 11,280 7,540 1,420 - 60Bukit Batok East 14,270 14,120 - 6,370 5,470 2,280 - - 150Bukit Batok South 13,740 11,810 - - 6,170 5,640 1,220 680 30Bukit Batok West 14,940 14,880 - 5,460 5,980 3,440 - - 60Gombak 9,920 6,760 - - 4,000 2,760 340 2,750 70Guilin 13,310 8,300 - 3,580 2,360 2,360 4,780 - 230Hillview 18,290 - - - - - 15,830 2,270 180Hong Kah North 27,870 26,340 150 7,940 13,830 4,430 1,280 - 250
Bukit Merah Total 154,480 142,750 25,330 39,510 46,280 31,630 9,540 520 1,670Alexandra Hill 15,360 14,860 4,690 2,740 4,110 3,320 - - 510 Alexandra North 1,040 - - - - - 1,030 - 10Bukit Ho Swee 16,040 15,430 4,080 6,010 3,390 1,950 510 - 90Bukit Merah 1,150 1,100 - 150 10 930 - - 50City Terminals 40 - - - - - - - -Depot Road 5,340 3,920 - - 1,720 2,200 1,420 - -Everton Park 9,050 8,330 610 2,010 2,230 3,480 440 200 80 Henderson Hill 12,240 12,010 4,570 3,910 2,580 950 190 - 50Kampong Tiong Bahru 10,270 10,080 2,330 4,490 2,010 1,250 - - 190Maritime Square 2,650 - - - - - 2,380 90 180Redhill 12,060 11,090 2,150 2,350 3,220 3,380 850 - 110Singapore General
Hospital 10 - - - - - - - -
Telok Blangah Drive 16,030 15,540 1,470 4,670 5,610 3,790 400 30 60
Note: Planning areas refer to areas demarcated in the Urban Redevelopment Authority’s Master Plan 2014. * Includes non-privatised Housing and Urban Development Corporation (HUDC) flats.^ Includes HDB studio apartments.
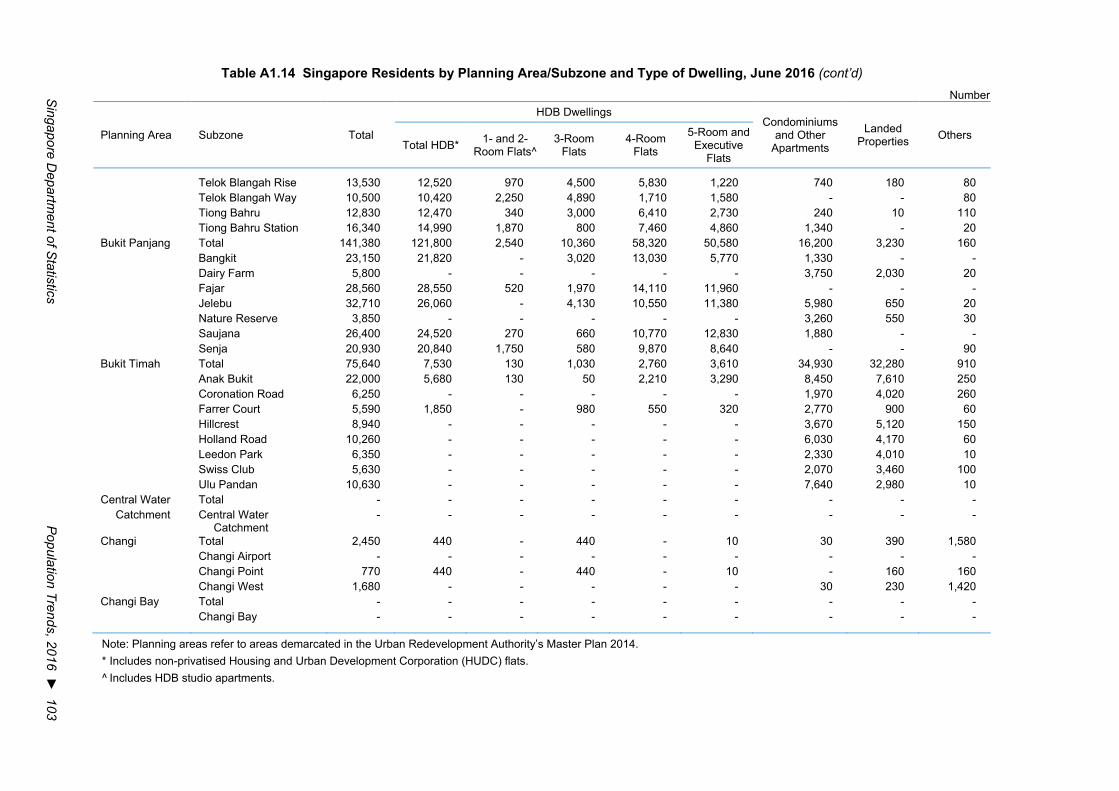
Singapore D
epartment of S
tatistics P
opulation Trends, 2016 ► 103
Table A1.14 Singapore Residents by Planning Area/Subzone and Type of Dwelling, June 2016 (cont’d) Number
Planning Area Subzone Total
HDB Dwellings Condominiums
and Other Apartments
Landed Properties Others
Total HDB* 1- and 2-Room Flats^
3-RoomFlats
4-RoomFlats
5-Room andExecutive
Flats
Telok Blangah Rise 13,530 12,520 970 4,500 5,830 1,220 740 180 80 Telok Blangah Way 10,500 10,420 2,250 4,890 1,710 1,580 - - 80 Tiong Bahru 12,830 12,470 340 3,000 6,410 2,730 240 10 110 Tiong Bahru Station 16,340 14,990 1,870 800 7,460 4,860 1,340 - 20
Bukit Panjang Total 141,380 121,800 2,540 10,360 58,320 50,580 16,200 3,230 160Bangkit 23,150 21,820 - 3,020 13,030 5,770 1,330 - -Dairy Farm 5,800 - - - - - 3,750 2,030 20 Fajar 28,560 28,550 520 1,970 14,110 11,960 - - - Jelebu 32,710 26,060 - 4,130 10,550 11,380 5,980 650 20 Nature Reserve 3,850 - - - - - 3,260 550 30 Saujana 26,400 24,520 270 660 10,770 12,830 1,880 - -Senja 20,930 20,840 1,750 580 9,870 8,640 - - 90
Bukit Timah Total 75,640 7,530 130 1,030 2,760 3,610 34,930 32,280 910 Anak Bukit 22,000 5,680 130 50 2,210 3,290 8,450 7,610 250 Coronation Road 6,250 - - - - - 1,970 4,020 260 Farrer Court 5,590 1,850 - 980 550 320 2,770 900 60 Hillcrest 8,940 - - - - - 3,670 5,120 150 Holland Road 10,260 - - - - - 6,030 4,170 60 Leedon Park 6,350 - - - - - 2,330 4,010 10 Swiss Club 5,630 - - - - - 2,070 3,460 100 Ulu Pandan 10,630 - - - - - 7,640 2,980 10
Central Water Total - - - - - - - - - Catchment Central Water
Catchment - - - - - - - - -
Changi Total 2,450 440 - 440 - 10 30 390 1,580 Changi Airport - - - - - - - - - Changi Point 770 440 - 440 - 10 - 160 160 Changi West 1,680 - - - - - 30 230 1,420
Changi Bay Total - - - - - - - - - Changi Bay - - - - - - - - -
Note: Planning areas refer to areas demarcated in the Urban Redevelopment Authority’s Master Plan 2014. * Includes non-privatised Housing and Urban Development Corporation (HUDC) flats.^ Includes HDB studio apartments.
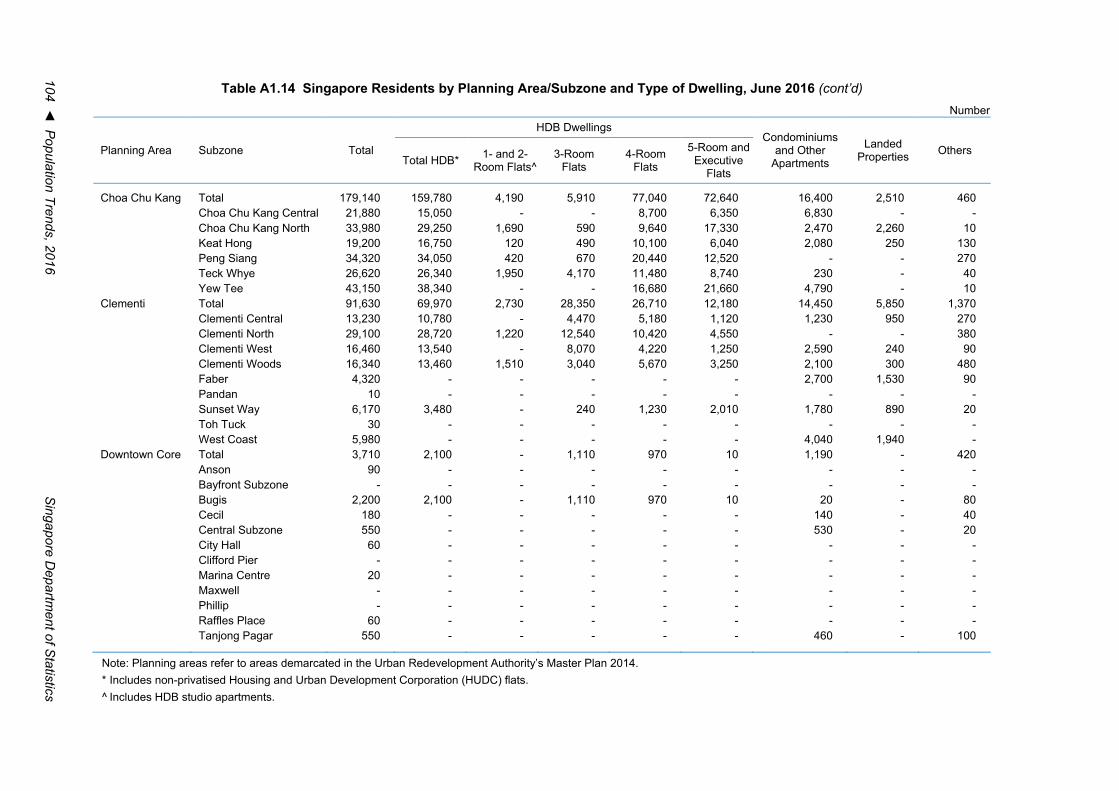
104 ◄ P
opulation Trends, 2016 S
ingapore Departm
ent of Statistics
Table A1.14 Singapore Residents by Planning Area/Subzone and Type of Dwelling, June 2016 (cont’d) Number
Planning Area Subzone Total
HDB Dwellings Condominiums
and Other Apartments
Landed Properties Others
Total HDB* 1- and 2-Room Flats^
3-RoomFlats
4-RoomFlats
5-Room andExecutive
Flats
Choa Chu Kang Total 179,140 159,780 4,190 5,910 77,040 72,640 16,400 2,510 460 Choa Chu Kang Central 21,880 15,050 - - 8,700 6,350 6,830 - -Choa Chu Kang North 33,980 29,250 1,690 590 9,640 17,330 2,470 2,260 10 Keat Hong 19,200 16,750 120 490 10,100 6,040 2,080 250 130 Peng Siang 34,320 34,050 420 670 20,440 12,520 - - 270 Teck Whye 26,620 26,340 1,950 4,170 11,480 8,740 230 - 40Yew Tee 43,150 38,340 - - 16,680 21,660 4,790 - 10
Clementi Total 91,630 69,970 2,730 28,350 26,710 12,180 14,450 5,850 1,370Clementi Central 13,230 10,780 - 4,470 5,180 1,120 1,230 950 270 Clementi North 29,100 28,720 1,220 12,540 10,420 4,550 - - 380 Clementi West 16,460 13,540 - 8,070 4,220 1,250 2,590 240 90 Clementi Woods 16,340 13,460 1,510 3,040 5,670 3,250 2,100 300 480 Faber 4,320 - - - - - 2,700 1,530 90 Pandan 10 - - - - - - - -Sunset Way 6,170 3,480 - 240 1,230 2,010 1,780 890 20 Toh Tuck 30 - - - - - - - -West Coast 5,980 - - - - - 4,040 1,940 -
Downtown Core Total 3,710 2,100 - 1,110 970 10 1,190 - 420Anson 90 - - - - - - - -Bayfront Subzone - - - - - - - - - Bugis 2,200 2,100 - 1,110 970 10 20 - 80Cecil 180 - - - - - 140 - 40Central Subzone 550 - - - - - 530 - 20City Hall 60 - - - - - - - -Clifford Pier - - - - - - - - - Marina Centre 20 - - - - - - - -Maxwell - - - - - - - - - Phillip - - - - - - - - - Raffles Place 60 - - - - - - - -Tanjong Pagar 550 - - - - - 460 - 100
Note: Planning areas refer to areas demarcated in the Urban Redevelopment Authority’s Master Plan 2014. * Includes non-privatised Housing and Urban Development Corporation (HUDC) flats.^ Includes HDB studio apartments.
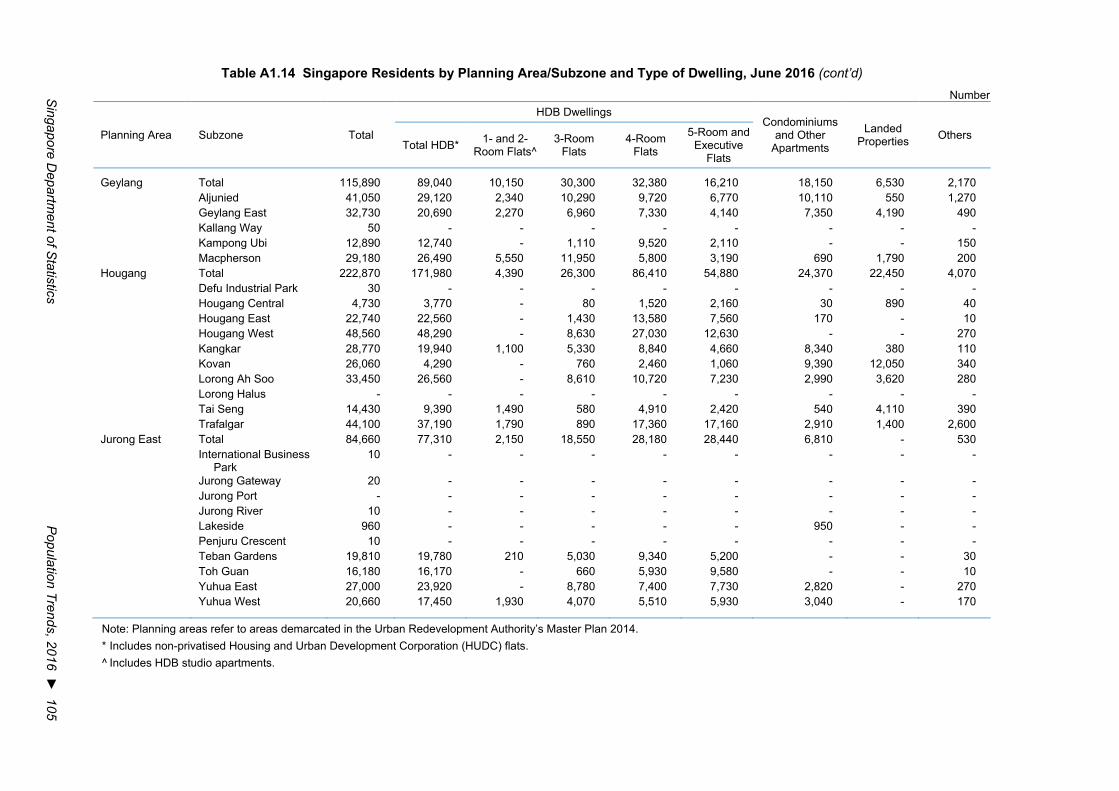
Singapore D
epartment of S
tatistics P
opulation Trends, 2016 ► 105
Table A1.14 Singapore Residents by Planning Area/Subzone and Type of Dwelling, June 2016 (cont’d) Number
Planning Area Subzone Total
HDB Dwellings Condominiums
and Other Apartments
Landed Properties Others
Total HDB* 1- and 2-Room Flats^
3-RoomFlats
4-RoomFlats
5-Room andExecutive
Flats
Geylang Total 115,890 89,040 10,150 30,300 32,380 16,210 18,150 6,530 2,170 Aljunied 41,050 29,120 2,340 10,290 9,720 6,770 10,110 550 1,270 Geylang East 32,730 20,690 2,270 6,960 7,330 4,140 7,350 4,190 490 Kallang Way 50 - - - - - - - -Kampong Ubi 12,890 12,740 - 1,110 9,520 2,110 - - 150 Macpherson 29,180 26,490 5,550 11,950 5,800 3,190 690 1,790 200
Hougang Total 222,870 171,980 4,390 26,300 86,410 54,880 24,370 22,450 4,070 Defu Industrial Park 30 - - - - - - - -Hougang Central 4,730 3,770 - 80 1,520 2,160 30 890 40 Hougang East 22,740 22,560 - 1,430 13,580 7,560 170 - 10Hougang West 48,560 48,290 - 8,630 27,030 12,630 - - 270Kangkar 28,770 19,940 1,100 5,330 8,840 4,660 8,340 380 110Kovan 26,060 4,290 - 760 2,460 1,060 9,390 12,050 340Lorong Ah Soo 33,450 26,560 - 8,610 10,720 7,230 2,990 3,620 280Lorong Halus - - - - - - - - - Tai Seng 14,430 9,390 1,490 580 4,910 2,420 540 4,110 390 Trafalgar 44,100 37,190 1,790 890 17,360 17,160 2,910 1,400 2,600
Jurong East Total 84,660 77,310 2,150 18,550 28,180 28,440 6,810 - 530International Business
Park 10 - - - - - - - -
Jurong Gateway 20 - - - - - - - -Jurong Port - - - - - - - - - Jurong River 10 - - - - - - - -Lakeside 960 - - - - - 950 - -Penjuru Crescent 10 - - - - - - - -Teban Gardens 19,810 19,780 210 5,030 9,340 5,200 - - 30 Toh Guan 16,180 16,170 - 660 5,930 9,580 - - 10 Yuhua East 27,000 23,920 - 8,780 7,400 7,730 2,820 - 270Yuhua West 20,660 17,450 1,930 4,070 5,510 5,930 3,040 - 170
Note: Planning areas refer to areas demarcated in the Urban Redevelopment Authority’s Master Plan 2014. * Includes non-privatised Housing and Urban Development Corporation (HUDC) flats.^ Includes HDB studio apartments.
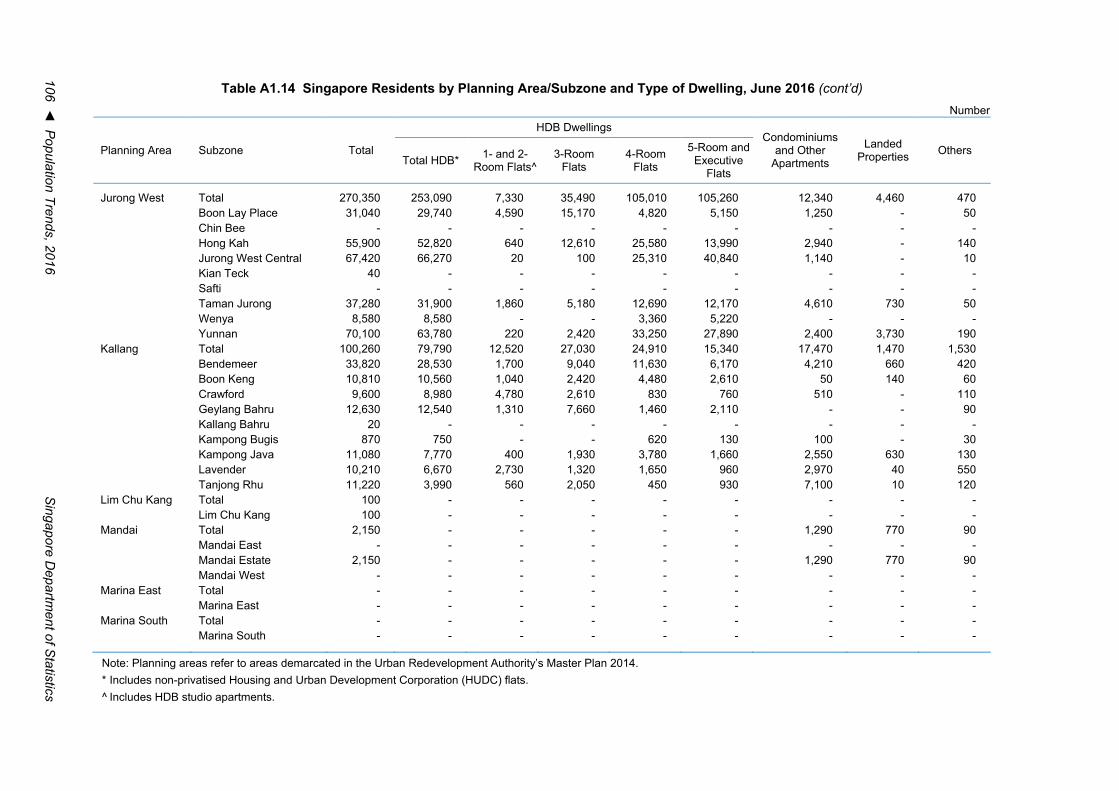
106 ◄ P
opulation Trends, 2016 S
ingapore Departm
ent of Statistics
Table A1.14 Singapore Residents by Planning Area/Subzone and Type of Dwelling, June 2016 (cont’d) Number
Planning Area Subzone Total
HDB Dwellings Condominiums
and Other Apartments
Landed Properties Others
Total HDB* 1- and 2-Room Flats^
3-Room Flats
4-Room Flats
5-Room and Executive
Flats
Jurong West Total 270,350 253,090 7,330 35,490 105,010 105,260 12,340 4,460 470 Boon Lay Place 31,040 29,740 4,590 15,170 4,820 5,150 1,250 - 50 Chin Bee - - - - - - - - - Hong Kah 55,900 52,820 640 12,610 25,580 13,990 2,940 - 140 Jurong West Central 67,420 66,270 20 100 25,310 40,840 1,140 - 10 Kian Teck 40 - - - - - - - - Safti - - - - - - - - - Taman Jurong 37,280 31,900 1,860 5,180 12,690 12,170 4,610 730 50 Wenya 8,580 8,580 - - 3,360 5,220 - - - Yunnan 70,100 63,780 220 2,420 33,250 27,890 2,400 3,730 190 Kallang Total 100,260 79,790 12,520 27,030 24,910 15,340 17,470 1,470 1,530 Bendemeer 33,820 28,530 1,700 9,040 11,630 6,170 4,210 660 420 Boon Keng 10,810 10,560 1,040 2,420 4,480 2,610 50 140 60 Crawford 9,600 8,980 4,780 2,610 830 760 510 - 110 Geylang Bahru 12,630 12,540 1,310 7,660 1,460 2,110 - - 90 Kallang Bahru 20 - - - - - - - - Kampong Bugis 870 750 - - 620 130 100 - 30 Kampong Java 11,080 7,770 400 1,930 3,780 1,660 2,550 630 130 Lavender 10,210 6,670 2,730 1,320 1,650 960 2,970 40 550 Tanjong Rhu 11,220 3,990 560 2,050 450 930 7,100 10 120 Lim Chu Kang Total 100 - - - - - - - - Lim Chu Kang 100 - - - - - - - - Mandai Total 2,150 - - - - - 1,290 770 90 Mandai East - - - - - - - - - Mandai Estate 2,150 - - - - - 1,290 770 90 Mandai West - - - - - - - - - Marina East Total - - - - - - - - - Marina East - - - - - - - - - Marina South Total - - - - - - - - - Marina South - - - - - - - - -
Note: Planning areas refer to areas demarcated in the Urban Redevelopment Authority’s Master Plan 2014. * Includes non-privatised Housing and Urban Development Corporation (HUDC) flats. ^ Includes HDB studio apartments.
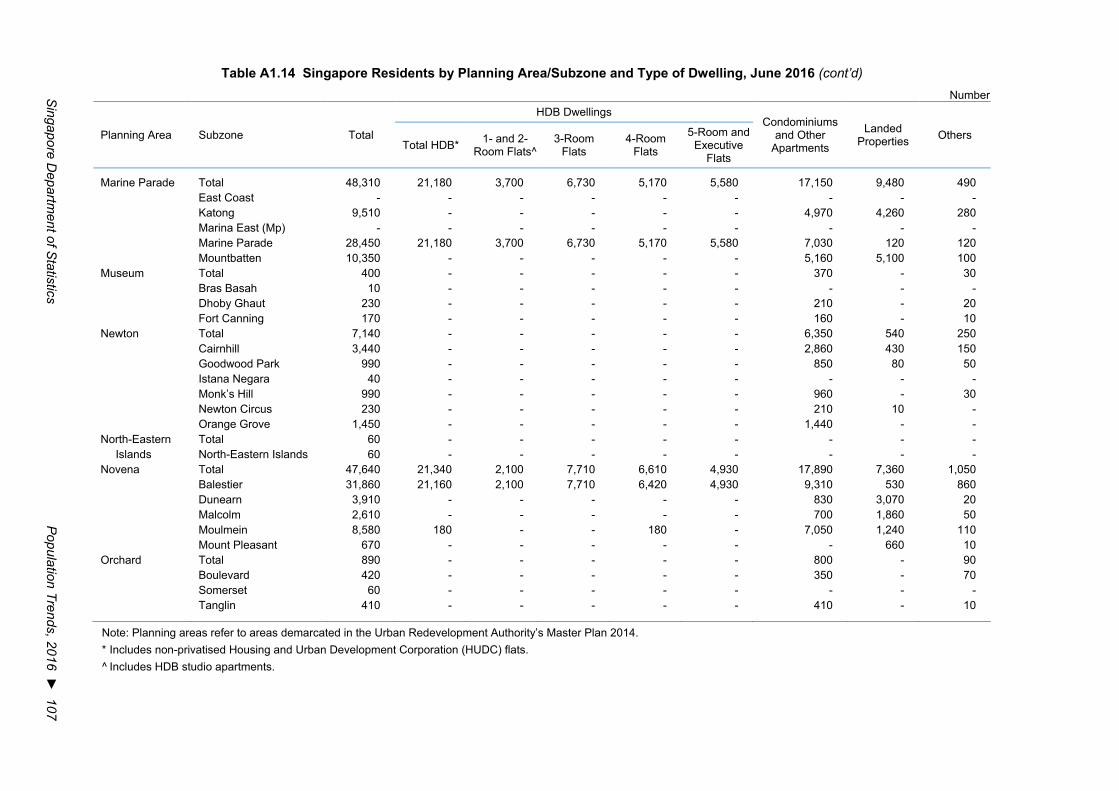
Singapore D
epartment of S
tatistics P
opulation Trends, 2016 ► 107
Table A1.14 Singapore Residents by Planning Area/Subzone and Type of Dwelling, June 2016 (cont’d) Number
Planning Area Subzone Total
HDB Dwellings Condominiums
and Other Apartments
Landed Properties Others
Total HDB* 1- and 2-Room Flats^
3-RoomFlats
4-RoomFlats
5-Room andExecutive
Flats
Marine Parade Total 48,310 21,180 3,700 6,730 5,170 5,580 17,150 9,480 490 East Coast - - - - - - - - - Katong 9,510 - - - - - 4,970 4,260 280 Marina East (Mp) - - - - - - - - - Marine Parade 28,450 21,180 3,700 6,730 5,170 5,580 7,030 120 120 Mountbatten 10,350 - - - - - 5,160 5,100 100
Museum Total 400 - - - - - 370 - 30Bras Basah 10 - - - - - - - -Dhoby Ghaut 230 - - - - - 210 - 20Fort Canning 170 - - - - - 160 - 10
Newton Total 7,140 - - - - - 6,350 540 250Cairnhill 3,440 - - - - - 2,860 430 150Goodwood Park 990 - - - - - 850 80 50Istana Negara 40 - - - - - - - -Monk’s Hill 990 - - - - - 960 - 30Newton Circus 230 - - - - - 210 10 -Orange Grove 1,450 - - - - - 1,440 - -
North-Eastern Total 60 - - - - - - - -Islands North-Eastern Islands 60 - - - - - - - -
Novena Total 47,640 21,340 2,100 7,710 6,610 4,930 17,890 7,360 1,050 Balestier 31,860 21,160 2,100 7,710 6,420 4,930 9,310 530 860 Dunearn 3,910 - - - - - 830 3,070 20 Malcolm 2,610 - - - - - 700 1,860 50 Moulmein 8,580 180 - - 180 - 7,050 1,240 110 Mount Pleasant 670 - - - - - - 660 10
Orchard Total 890 - - - - - 800 - 90Boulevard 420 - - - - - 350 - 70Somerset 60 - - - - - - - -Tanglin 410 - - - - - 410 - 10
Note: Planning areas refer to areas demarcated in the Urban Redevelopment Authority’s Master Plan 2014. * Includes non-privatised Housing and Urban Development Corporation (HUDC) flats.^ Includes HDB studio apartments.
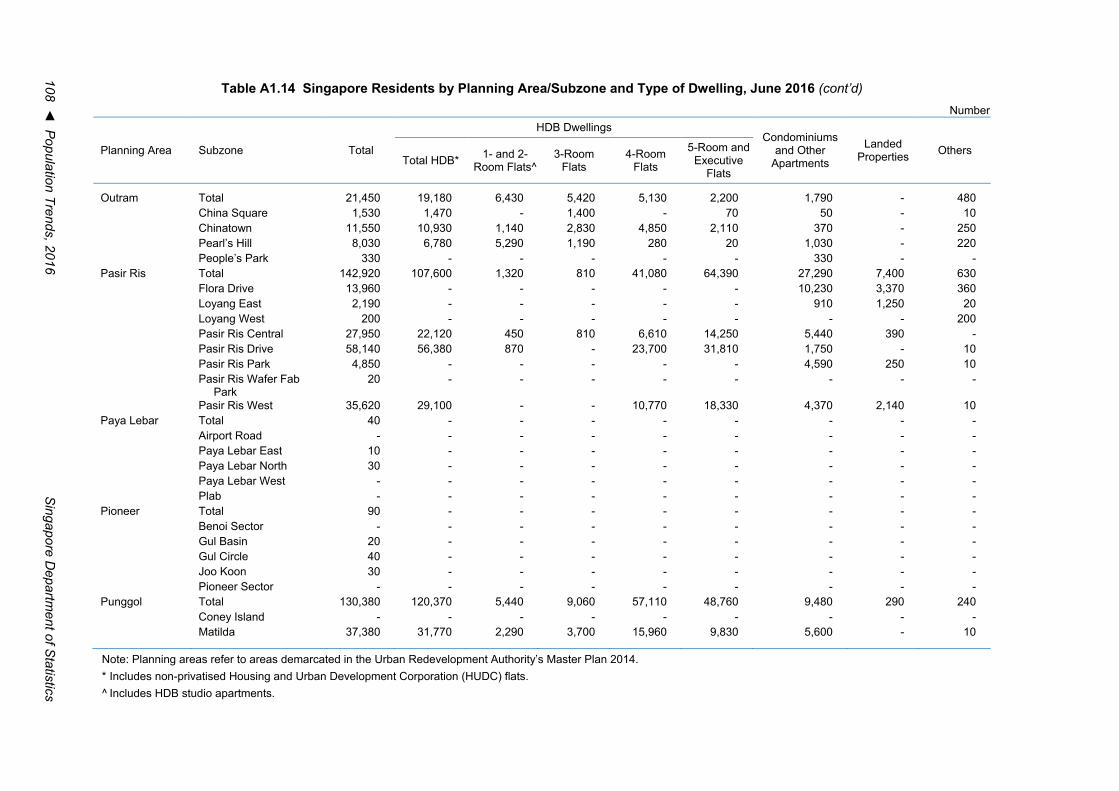
108 ◄ P
opulation Trends, 2016 S
ingapore Departm
ent of Statistics
Table A1.14 Singapore Residents by Planning Area/Subzone and Type of Dwelling, June 2016 (cont’d) Number
Planning Area Subzone Total
HDB Dwellings Condominiums
and Other Apartments
Landed Properties Others
Total HDB* 1- and 2-Room Flats^
3-Room Flats
4-Room Flats
5-Room and Executive
Flats
Outram Total 21,450 19,180 6,430 5,420 5,130 2,200 1,790 - 480 China Square 1,530 1,470 - 1,400 - 70 50 - 10 Chinatown 11,550 10,930 1,140 2,830 4,850 2,110 370 - 250 Pearl’s Hill 8,030 6,780 5,290 1,190 280 20 1,030 - 220 People’s Park 330 - - - - - 330 - - Pasir Ris Total 142,920 107,600 1,320 810 41,080 64,390 27,290 7,400 630 Flora Drive 13,960 - - - - - 10,230 3,370 360 Loyang East 2,190 - - - - - 910 1,250 20 Loyang West 200 - - - - - - - 200 Pasir Ris Central 27,950 22,120 450 810 6,610 14,250 5,440 390 - Pasir Ris Drive 58,140 56,380 870 - 23,700 31,810 1,750 - 10 Pasir Ris Park 4,850 - - - - - 4,590 250 10 Pasir Ris Wafer Fab
Park 20 - - - - - - - -
Pasir Ris West 35,620 29,100 - - 10,770 18,330 4,370 2,140 10 Paya Lebar Total 40 - - - - - - - - Airport Road - - - - - - - - - Paya Lebar East 10 - - - - - - - - Paya Lebar North 30 - - - - - - - - Paya Lebar West - - - - - - - - - Plab - - - - - - - - - Pioneer Total 90 - - - - - - - - Benoi Sector - - - - - - - - - Gul Basin 20 - - - - - - - - Gul Circle 40 - - - - - - - - Joo Koon 30 - - - - - - - - Pioneer Sector - - - - - - - - - Punggol Total 130,380 120,370 5,440 9,060 57,110 48,760 9,480 290 240 Coney Island - - - - - - - - - Matilda 37,380 31,770 2,290 3,700 15,960 9,830 5,600 - 10
Note: Planning areas refer to areas demarcated in the Urban Redevelopment Authority’s Master Plan 2014. * Includes non-privatised Housing and Urban Development Corporation (HUDC) flats. ^ Includes HDB studio apartments.
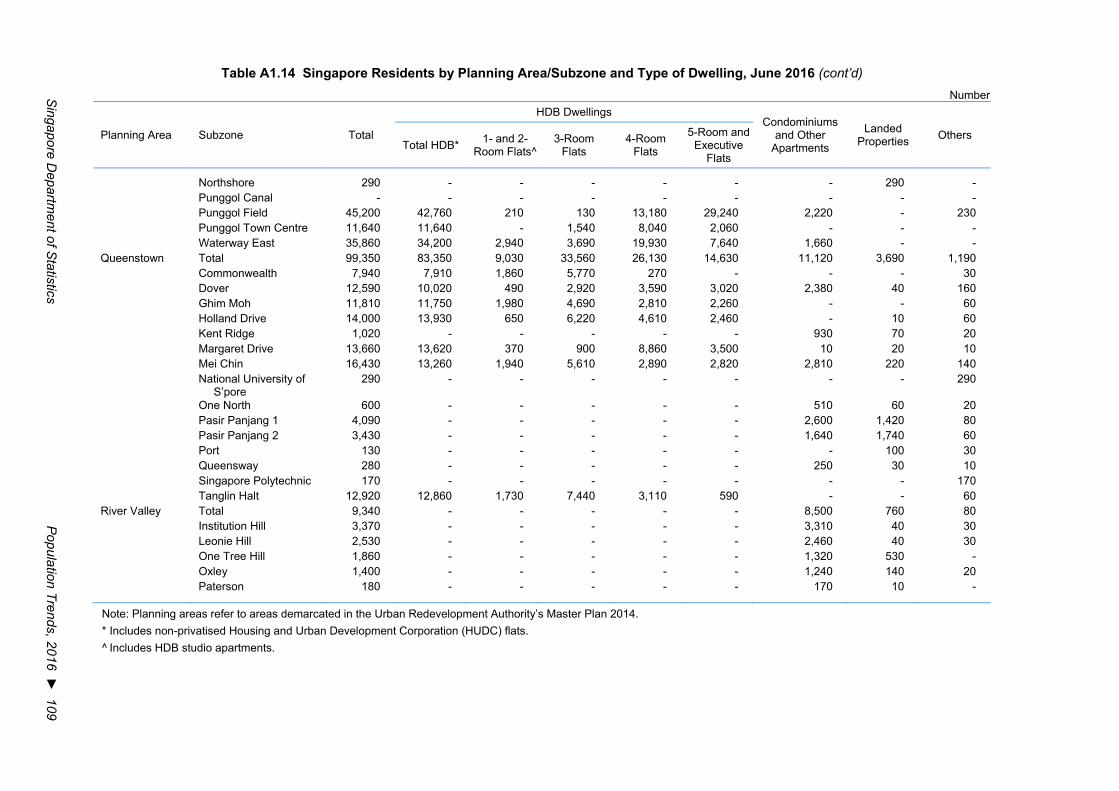
Singapore D
epartment of S
tatistics P
opulation Trends, 2016 ► 109
Table A1.14 Singapore Residents by Planning Area/Subzone and Type of Dwelling, June 2016 (cont’d) Number
Planning Area Subzone Total
HDB Dwellings Condominiums
and Other Apartments
Landed Properties Others
Total HDB* 1- and 2-Room Flats^
3-RoomFlats
4-RoomFlats
5-Room andExecutive
Flats
Northshore 290 - - - - - - 290 - Punggol Canal - - - - - - - - - Punggol Field 45,200 42,760 210 130 13,180 29,240 2,220 - 230Punggol Town Centre 11,640 11,640 - 1,540 8,040 2,060 - - - Waterway East 35,860 34,200 2,940 3,690 19,930 7,640 1,660 - -
Queenstown Total 99,350 83,350 9,030 33,560 26,130 14,630 11,120 3,690 1,190 Commonwealth 7,940 7,910 1,860 5,770 270 - - - 30 Dover 12,590 10,020 490 2,920 3,590 3,020 2,380 40 160 Ghim Moh 11,810 11,750 1,980 4,690 2,810 2,260 - - 60 Holland Drive 14,000 13,930 650 6,220 4,610 2,460 - 10 60 Kent Ridge 1,020 - - - - - 930 70 20 Margaret Drive 13,660 13,620 370 900 8,860 3,500 10 20 10 Mei Chin 16,430 13,260 1,940 5,610 2,890 2,820 2,810 220 140 National University of
S’pore 290 - - - - - - - 290
One North 600 - - - - - 510 60 20 Pasir Panjang 1 4,090 - - - - - 2,600 1,420 80 Pasir Panjang 2 3,430 - - - - - 1,640 1,740 60 Port 130 - - - - - - 100 30 Queensway 280 - - - - - 250 30 10 Singapore Polytechnic 170 - - - - - - - 170 Tanglin Halt 12,920 12,860 1,730 7,440 3,110 590 - - 60
River Valley Total 9,340 - - - - - 8,500 760 80 Institution Hill 3,370 - - - - - 3,310 40 30 Leonie Hill 2,530 - - - - - 2,460 40 30 One Tree Hill 1,860 - - - - - 1,320 530 - Oxley 1,400 - - - - - 1,240 140 20 Paterson 180 - - - - - 170 10 -
Note: Planning areas refer to areas demarcated in the Urban Redevelopment Authority’s Master Plan 2014. * Includes non-privatised Housing and Urban Development Corporation (HUDC) flats.^ Includes HDB studio apartments.
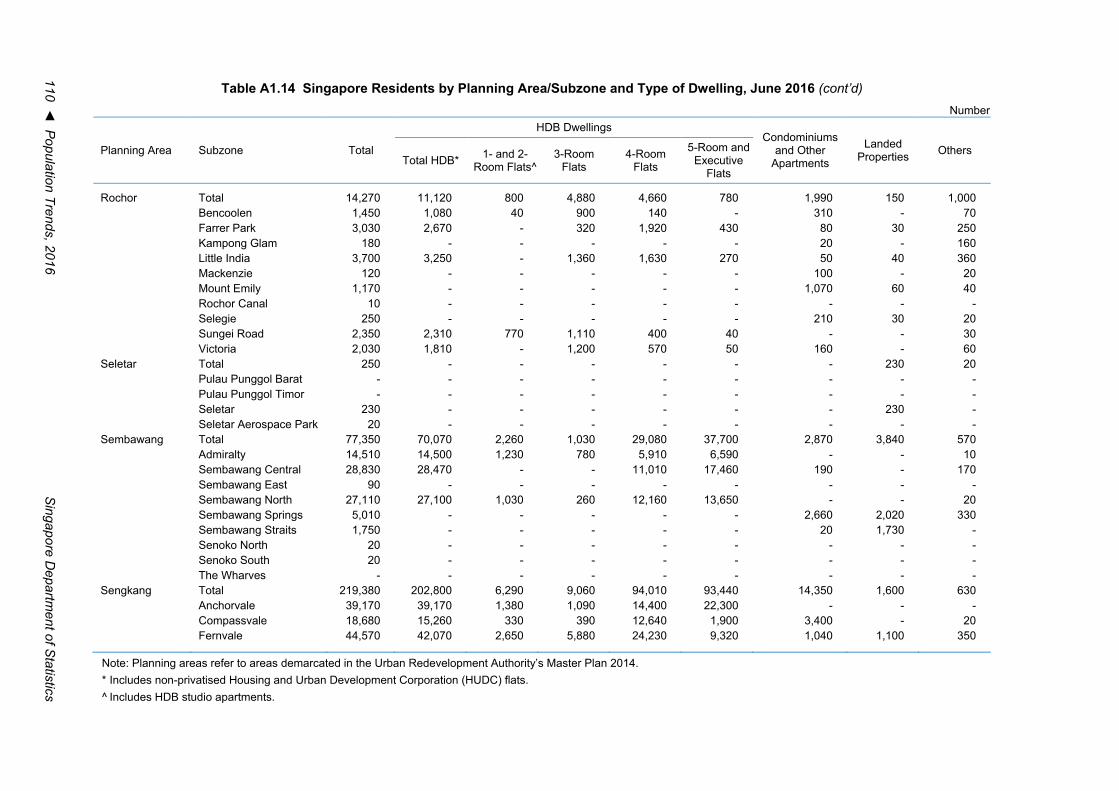
110 ◄ P
opulation Trends, 2016 S
ingapore Departm
ent of Statistics
Table A1.14 Singapore Residents by Planning Area/Subzone and Type of Dwelling, June 2016 (cont’d) Number
Planning Area Subzone Total
HDB Dwellings Condominiums
and Other Apartments
Landed Properties Others
Total HDB* 1- and 2-Room Flats^
3-RoomFlats
4-RoomFlats
5-Room andExecutive
Flats
Rochor Total 14,270 11,120 800 4,880 4,660 780 1,990 150 1,000 Bencoolen 1,450 1,080 40 900 140 - 310 - 70Farrer Park 3,030 2,670 - 320 1,920 430 80 30 250Kampong Glam 180 - - - - - 20 - 160Little India 3,700 3,250 - 1,360 1,630 270 50 40 360Mackenzie 120 - - - - - 100 - 20Mount Emily 1,170 - - - - - 1,070 60 40Rochor Canal 10 - - - - - - - -Selegie 250 - - - - - 210 30 20 Sungei Road 2,350 2,310 770 1,110 400 40 - - 30 Victoria 2,030 1,810 - 1,200 570 50 160 - 60
Seletar Total 250 - - - - - - 230 20Pulau Punggol Barat - - - - - - - - - Pulau Punggol Timor - - - - - - - - - Seletar 230 - - - - - - 230 - Seletar Aerospace Park 20 - - - - - - - -
Sembawang Total 77,350 70,070 2,260 1,030 29,080 37,700 2,870 3,840 570 Admiralty 14,510 14,500 1,230 780 5,910 6,590 - - 10 Sembawang Central 28,830 28,470 - - 11,010 17,460 190 - 170Sembawang East 90 - - - - - - - -Sembawang North 27,110 27,100 1,030 260 12,160 13,650 - - 20 Sembawang Springs 5,010 - - - - - 2,660 2,020 330 Sembawang Straits 1,750 - - - - - 20 1,730 - Senoko North 20 - - - - - - - -Senoko South 20 - - - - - - - -The Wharves - - - - - - - - -
Sengkang Total 219,380 202,800 6,290 9,060 94,010 93,440 14,350 1,600 630 Anchorvale 39,170 39,170 1,380 1,090 14,400 22,300 - - - Compassvale 18,680 15,260 330 390 12,640 1,900 3,400 - 20Fernvale 44,570 42,070 2,650 5,880 24,230 9,320 1,040 1,100 350
Note: Planning areas refer to areas demarcated in the Urban Redevelopment Authority’s Master Plan 2014. * Includes non-privatised Housing and Urban Development Corporation (HUDC) flats.^ Includes HDB studio apartments.
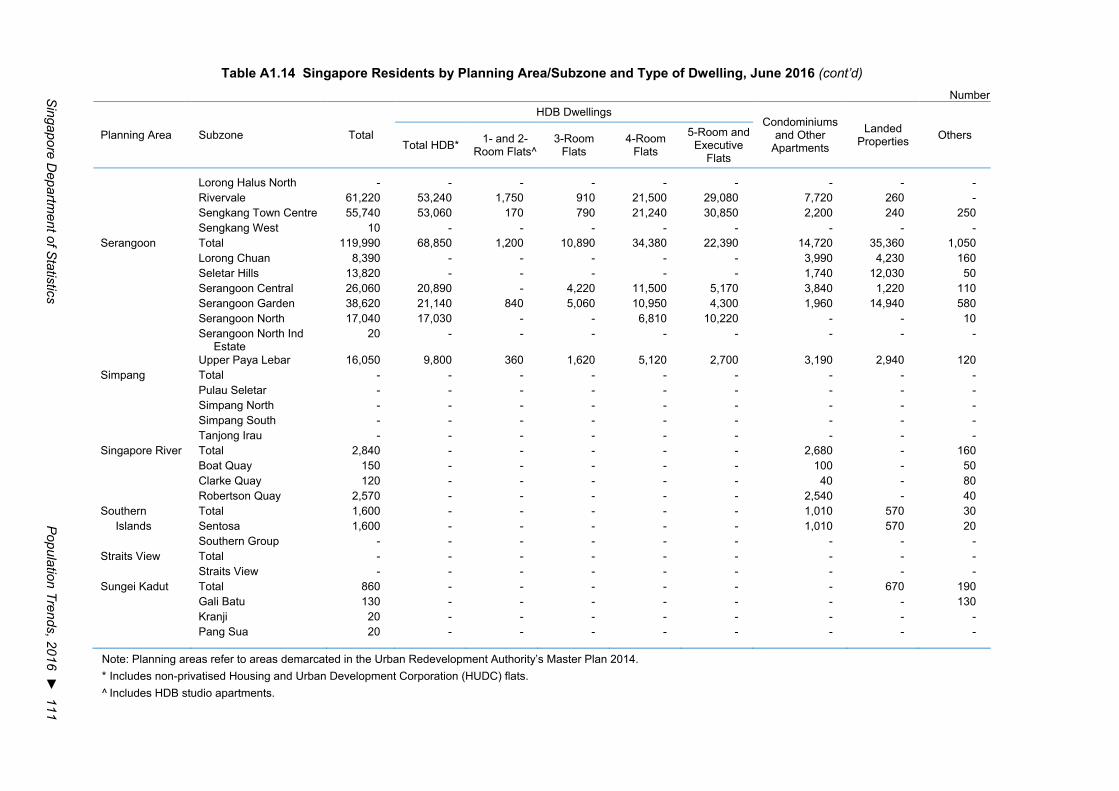
Singapore D
epartment of S
tatistics P
opulation Trends, 2016 ► 111
Table A1.14 Singapore Residents by Planning Area/Subzone and Type of Dwelling, June 2016 (cont’d)
Number
Planning Area Subzone Total
HDB Dwellings Condominiums
and Other Apartments
Landed Properties Others
Total HDB* 1- and 2-Room Flats^
3-Room Flats
4-Room Flats
5-Room and Executive
Flats
Lorong Halus North - - - - - - - - - Rivervale 61,220 53,240 1,750 910 21,500 29,080 7,720 260 - Sengkang Town Centre 55,740 53,060 170 790 21,240 30,850 2,200 240 250 Sengkang West 10 - - - - - - - - Serangoon Total 119,990 68,850 1,200 10,890 34,380 22,390 14,720 35,360 1,050 Lorong Chuan 8,390 - - - - - 3,990 4,230 160 Seletar Hills 13,820 - - - - - 1,740 12,030 50 Serangoon Central 26,060 20,890 - 4,220 11,500 5,170 3,840 1,220 110 Serangoon Garden 38,620 21,140 840 5,060 10,950 4,300 1,960 14,940 580 Serangoon North 17,040 17,030 - - 6,810 10,220 - - 10 Serangoon North Ind
Estate 20 - - - - - - - -
Upper Paya Lebar 16,050 9,800 360 1,620 5,120 2,700 3,190 2,940 120 Simpang Total - - - - - - - - - Pulau Seletar - - - - - - - - - Simpang North - - - - - - - - - Simpang South - - - - - - - - - Tanjong Irau - - - - - - - - - Singapore River Total 2,840 - - - - - 2,680 - 160 Boat Quay 150 - - - - - 100 - 50 Clarke Quay 120 - - - - - 40 - 80 Robertson Quay 2,570 - - - - - 2,540 - 40 Southern Total 1,600 - - - - - 1,010 570 30
Islands Sentosa 1,600 - - - - - 1,010 570 20 Southern Group - - - - - - - - - Straits View Total - - - - - - - - - Straits View - - - - - - - - - Sungei Kadut Total 860 - - - - - - 670 190 Gali Batu 130 - - - - - - - 130 Kranji 20 - - - - - - - - Pang Sua 20 - - - - - - - -
Note: Planning areas refer to areas demarcated in the Urban Redevelopment Authority’s Master Plan 2014. * Includes non-privatised Housing and Urban Development Corporation (HUDC) flats. ^ Includes HDB studio apartments.
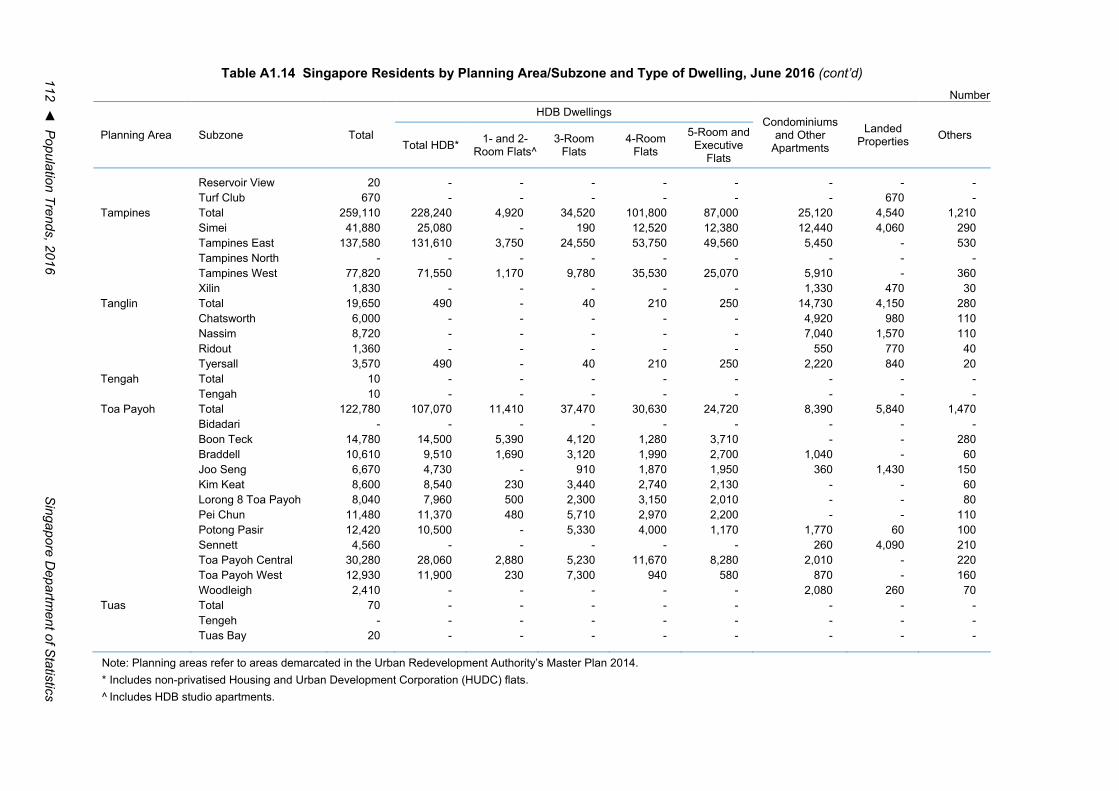
112 ◄ P
opulation Trends, 2016 S
ingapore Departm
ent of Statistics
Table A1.14 Singapore Residents by Planning Area/Subzone and Type of Dwelling, June 2016 (cont’d) Number
Planning Area Subzone Total
HDB Dwellings Condominiums
and Other Apartments
Landed Properties Others
Total HDB* 1- and 2-Room Flats^
3-RoomFlats
4-RoomFlats
5-Room andExecutive
Flats
Reservoir View 20 - - - - - - - -Turf Club 670 - - - - - - 670 -
Tampines Total 259,110 228,240 4,920 34,520 101,800 87,000 25,120 4,540 1,210 Simei 41,880 25,080 - 190 12,520 12,380 12,440 4,060 290 Tampines East 137,580 131,610 3,750 24,550 53,750 49,560 5,450 - 530Tampines North - - - - - - - - - Tampines West 77,820 71,550 1,170 9,780 35,530 25,070 5,910 - 360Xilin 1,830 - - - - - 1,330 470 30
Tanglin Total 19,650 490 - 40 210 250 14,730 4,150 280Chatsworth 6,000 - - - - - 4,920 980 110Nassim 8,720 - - - - - 7,040 1,570 110Ridout 1,360 - - - - - 550 770 40Tyersall 3,570 490 - 40 210 250 2,220 840 20
Tengah Total 10 - - - - - - - -Tengah 10 - - - - - - - -
Toa Payoh Total 122,780 107,070 11,410 37,470 30,630 24,720 8,390 5,840 1,470 Bidadari - - - - - - - - - Boon Teck 14,780 14,500 5,390 4,120 1,280 3,710 - - 280 Braddell 10,610 9,510 1,690 3,120 1,990 2,700 1,040 - 60Joo Seng 6,670 4,730 - 910 1,870 1,950 360 1,430 150Kim Keat 8,600 8,540 230 3,440 2,740 2,130 - - 60Lorong 8 Toa Payoh 8,040 7,960 500 2,300 3,150 2,010 - - 80Pei Chun 11,480 11,370 480 5,710 2,970 2,200 - - 110Potong Pasir 12,420 10,500 - 5,330 4,000 1,170 1,770 60 100Sennett 4,560 - - - - - 260 4,090 210Toa Payoh Central 30,280 28,060 2,880 5,230 11,670 8,280 2,010 - 220Toa Payoh West 12,930 11,900 230 7,300 940 580 870 - 160Woodleigh 2,410 - - - - - 2,080 260 70
Tuas Total 70 - - - - - - - -Tengeh - - - - - - - - - Tuas Bay 20 - - - - - - - -
Note: Planning areas refer to areas demarcated in the Urban Redevelopment Authority’s Master Plan 2014. * Includes non-privatised Housing and Urban Development Corporation (HUDC) flats.^ Includes HDB studio apartments.
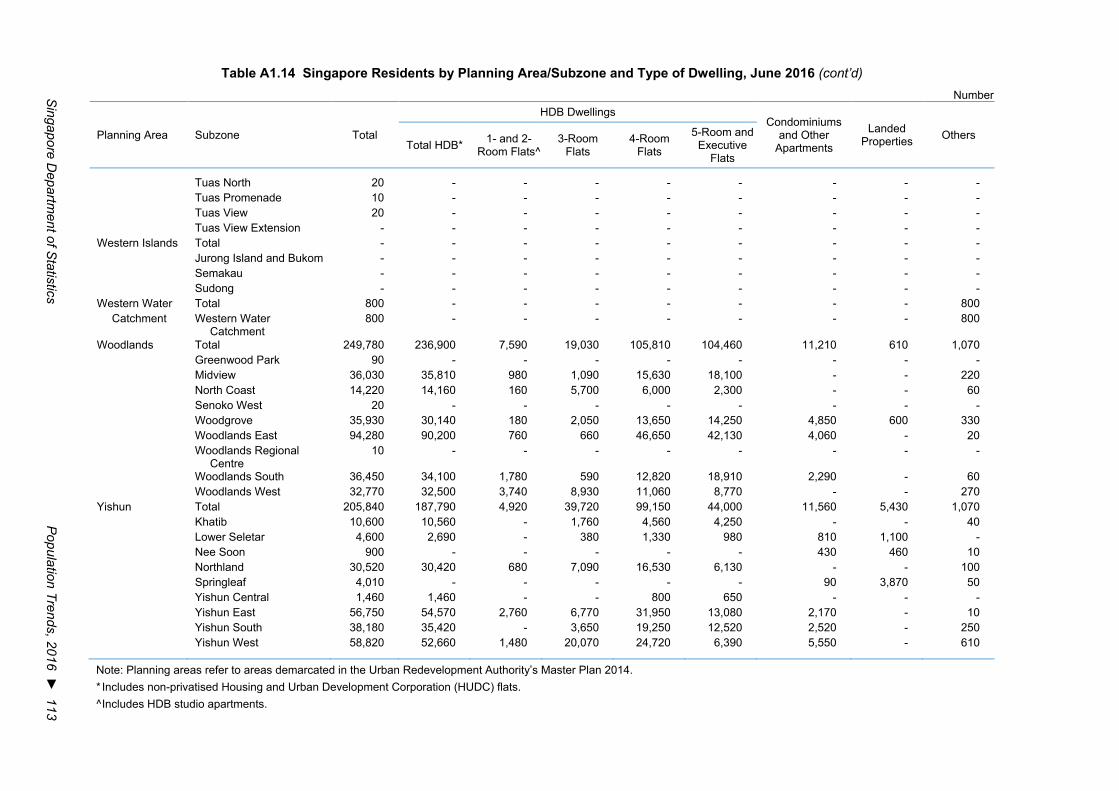
Singapore D
epartment of S
tatistics P
opulation Trends, 2016 ► 113
Table A1.14 Singapore Residents by Planning Area/Subzone and Type of Dwelling, June 2016 (cont’d) Number
Planning Area Subzone Total
HDB Dwellings Condominiums
and Other Apartments
Landed Properties Others
Total HDB* 1- and 2-Room Flats^
3-RoomFlats
4-RoomFlats
5-Room andExecutive
Flats
Tuas North 20 - - - - - - - -Tuas Promenade 10 - - - - - - - -Tuas View 20 - - - - - - - -Tuas View Extension - - - - - - - - -
Western Islands Total - - - - - - - - - Jurong Island and Bukom - - - - - - - - - Semakau - - - - - - - - - Sudong - - - - - - - - -
Western Water Total 800 - - - - - - - 800 Catchment Western Water
Catchment 800 - - - - - - - 800
Woodlands Total 249,780 236,900 7,590 19,030 105,810 104,460 11,210 610 1,070 Greenwood Park 90 - - - - - - - -Midview 36,030 35,810 980 1,090 15,630 18,100 - - 220 North Coast 14,220 14,160 160 5,700 6,000 2,300 - - 60 Senoko West 20 - - - - - - - -Woodgrove 35,930 30,140 180 2,050 13,650 14,250 4,850 600 330 Woodlands East 94,280 90,200 760 660 46,650 42,130 4,060 - 20Woodlands Regional
Centre 10 - - - - - - - -
Woodlands South 36,450 34,100 1,780 590 12,820 18,910 2,290 - 60Woodlands West 32,770 32,500 3,740 8,930 11,060 8,770 - - 270
Yishun Total 205,840 187,790 4,920 39,720 99,150 44,000 11,560 5,430 1,070 Khatib 10,600 10,560 - 1,760 4,560 4,250 - - 40 Lower Seletar 4,600 2,690 - 380 1,330 980 810 1,100 - Nee Soon 900 - - - - - 430 460 10 Northland 30,520 30,420 680 7,090 16,530 6,130 - - 100 Springleaf 4,010 - - - - - 90 3,870 50 Yishun Central 1,460 1,460 - - 800 650 - - - Yishun East 56,750 54,570 2,760 6,770 31,950 13,080 2,170 - 10Yishun South 38,180 35,420 - 3,650 19,250 12,520 2,520 - 250Yishun West 58,820 52,660 1,480 20,070 24,720 6,390 5,550 - 610
Note: Planning areas refer to areas demarcated in the Urban Redevelopment Authority’s Master Plan 2014. * Includes non-privatised Housing and Urban Development Corporation (HUDC) flats.^ Includes HDB studio apartments.
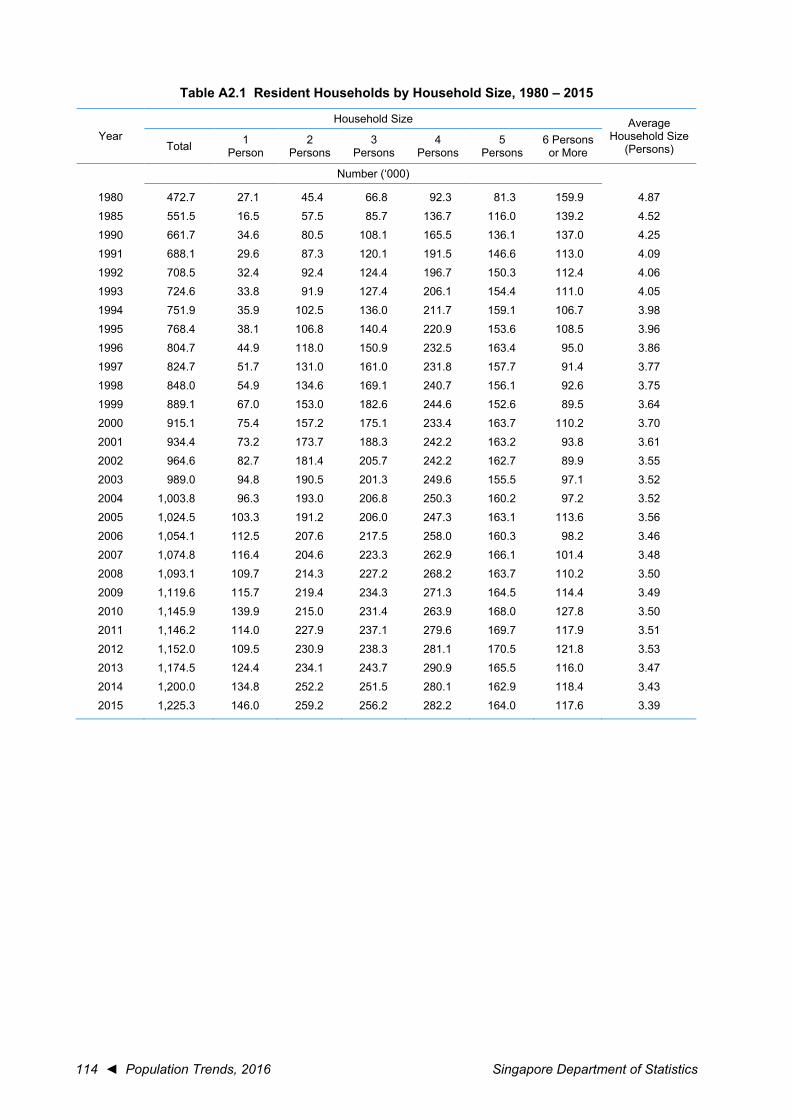
114 ◄ Population Trends, 2016 Singapore Department of Statistics
Table A2.1 Resident Households by Household Size, 1980 – 2015
Year Household Size Average
Household Size (Persons) Total 1
Person 2
Persons 3
Persons 4
Persons 5
Persons 6 Persons or More
Number (‘000)
1980 472.7 27.1 45.4 66.8 92.3 81.3 159.9 4.87 1985 551.5 16.5 57.5 85.7 136.7 116.0 139.2 4.52 1990 661.7 34.6 80.5 108.1 165.5 136.1 137.0 4.25 1991 688.1 29.6 87.3 120.1 191.5 146.6 113.0 4.09 1992 708.5 32.4 92.4 124.4 196.7 150.3 112.4 4.06 1993 724.6 33.8 91.9 127.4 206.1 154.4 111.0 4.05 1994 751.9 35.9 102.5 136.0 211.7 159.1 106.7 3.98 1995 768.4 38.1 106.8 140.4 220.9 153.6 108.5 3.96 1996 804.7 44.9 118.0 150.9 232.5 163.4 95.0 3.86 1997 824.7 51.7 131.0 161.0 231.8 157.7 91.4 3.77 1998 848.0 54.9 134.6 169.1 240.7 156.1 92.6 3.75 1999 889.1 67.0 153.0 182.6 244.6 152.6 89.5 3.64 2000 915.1 75.4 157.2 175.1 233.4 163.7 110.2 3.70 2001 934.4 73.2 173.7 188.3 242.2 163.2 93.8 3.61 2002 964.6 82.7 181.4 205.7 242.2 162.7 89.9 3.55 2003 989.0 94.8 190.5 201.3 249.6 155.5 97.1 3.52 2004 1,003.8 96.3 193.0 206.8 250.3 160.2 97.2 3.52 2005 1,024.5 103.3 191.2 206.0 247.3 163.1 113.6 3.56 2006 1,054.1 112.5 207.6 217.5 258.0 160.3 98.2 3.46 2007 1,074.8 116.4 204.6 223.3 262.9 166.1 101.4 3.48 2008 1,093.1 109.7 214.3 227.2 268.2 163.7 110.2 3.50 2009 1,119.6 115.7 219.4 234.3 271.3 164.5 114.4 3.49 2010 1,145.9 139.9 215.0 231.4 263.9 168.0 127.8 3.50 2011 1,146.2 114.0 227.9 237.1 279.6 169.7 117.9 3.51 2012 1,152.0 109.5 230.9 238.3 281.1 170.5 121.8 3.53 2013 1,174.5 124.4 234.1 243.7 290.9 165.5 116.0 3.47 2014 1,200.0 134.8 252.2 251.5 280.1 162.9 118.4 3.43 2015 1,225.3 146.0 259.2 256.2 282.2 164.0 117.6 3.39
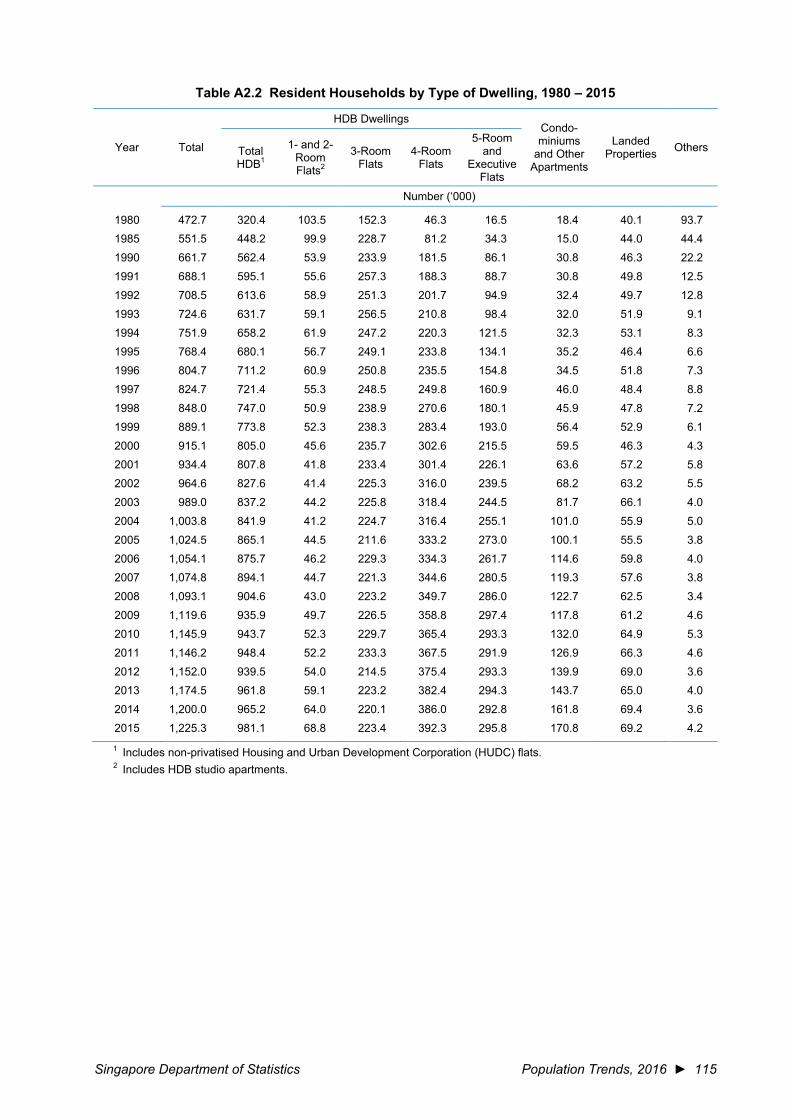
Singapore Department of Statistics Population Trends, 2016 ► 115
Table A2.2 Resident Households by Type of Dwelling, 1980 – 2015
Year Total
HDB Dwellings Condo-miniums
and Other Apartments
Landed Properties Others Total
HDB1
1- and 2-RoomFlats2
3-RoomFlats
4-RoomFlats
5-Roomand
Executive Flats
Number (‘000)
1980 472.7 320.4 103.5 152.3 46.3 16.5 18.4 40.1 93.7 1985 551.5 448.2 99.9 228.7 81.2 34.3 15.0 44.0 44.4 1990 661.7 562.4 53.9 233.9 181.5 86.1 30.8 46.3 22.2 1991 688.1 595.1 55.6 257.3 188.3 88.7 30.8 49.8 12.5 1992 708.5 613.6 58.9 251.3 201.7 94.9 32.4 49.7 12.8 1993 724.6 631.7 59.1 256.5 210.8 98.4 32.0 51.9 9.1 1994 751.9 658.2 61.9 247.2 220.3 121.5 32.3 53.1 8.3 1995 768.4 680.1 56.7 249.1 233.8 134.1 35.2 46.4 6.6 1996 804.7 711.2 60.9 250.8 235.5 154.8 34.5 51.8 7.3 1997 824.7 721.4 55.3 248.5 249.8 160.9 46.0 48.4 8.8 1998 848.0 747.0 50.9 238.9 270.6 180.1 45.9 47.8 7.2 1999 889.1 773.8 52.3 238.3 283.4 193.0 56.4 52.9 6.1 2000 915.1 805.0 45.6 235.7 302.6 215.5 59.5 46.3 4.3 2001 934.4 807.8 41.8 233.4 301.4 226.1 63.6 57.2 5.8 2002 964.6 827.6 41.4 225.3 316.0 239.5 68.2 63.2 5.5 2003 989.0 837.2 44.2 225.8 318.4 244.5 81.7 66.1 4.0
2004 1,003.8 841.9 41.2 224.7 316.4 255.1 101.0 55.9 5.0 2005 1,024.5 865.1 44.5 211.6 333.2 273.0 100.1 55.5 3.8 2006 1,054.1 875.7 46.2 229.3 334.3 261.7 114.6 59.8 4.0 2007 1,074.8 894.1 44.7 221.3 344.6 280.5 119.3 57.6 3.8 2008 1,093.1 904.6 43.0 223.2 349.7 286.0 122.7 62.5 3.4 2009 1,119.6 935.9 49.7 226.5 358.8 297.4 117.8 61.2 4.6 2010 1,145.9 943.7 52.3 229.7 365.4 293.3 132.0 64.9 5.3 2011 1,146.2 948.4 52.2 233.3 367.5 291.9 126.9 66.3 4.6 2012 1,152.0 939.5 54.0 214.5 375.4 293.3 139.9 69.0 3.6 2013 1,174.5 961.8 59.1 223.2 382.4 294.3 143.7 65.0 4.0 2014 1,200.0 965.2 64.0 220.1 386.0 292.8 161.8 69.4 3.6 2015 1,225.3 981.1 68.8 223.4 392.3 295.8 170.8 69.2 4.2
1 Includes non-privatised Housing and Urban Development Corporation (HUDC) flats. 2 Includes HDB studio apartments.
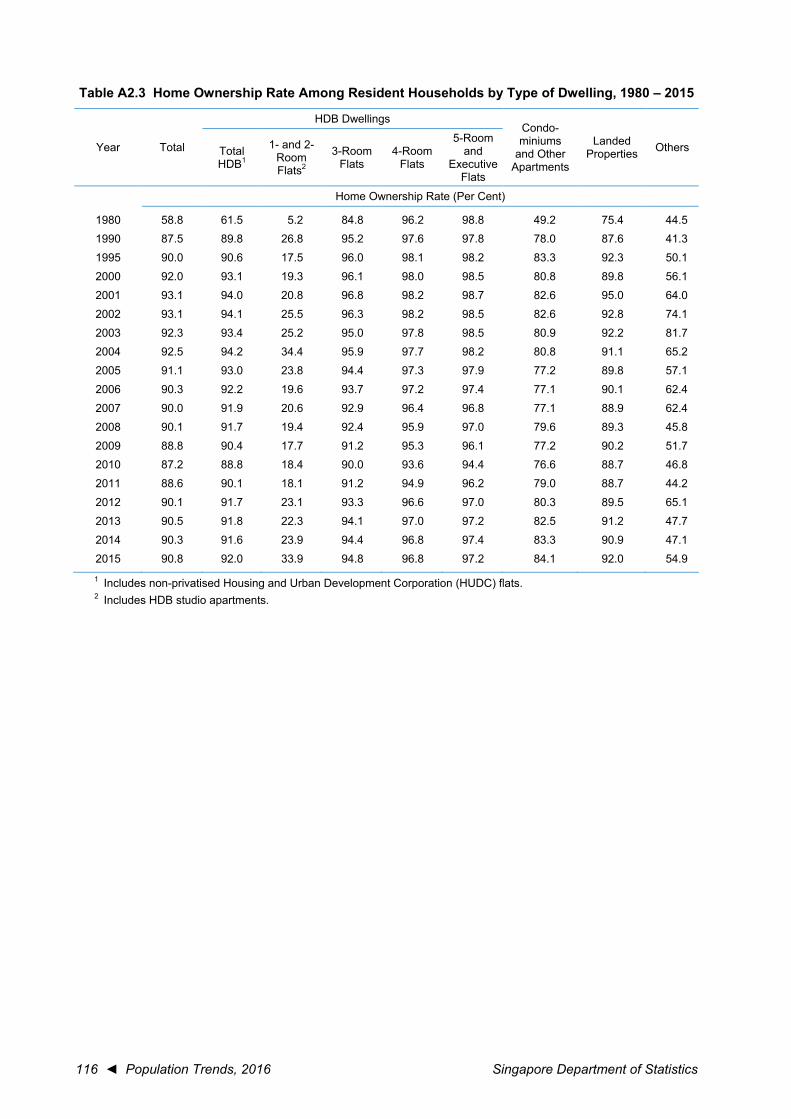
116 ◄ Population Trends, 2016 Singapore Department of Statistics
Table A2.3 Home Ownership Rate Among Resident Households by Type of Dwelling, 1980 – 2015
Year Total
HDB Dwellings Condo-miniums
and Other Apartments
Landed Properties Others Total
HDB1
1- and 2-RoomFlats2
3-RoomFlats
4-RoomFlats
5-Roomand
Executive Flats
Home Ownership Rate (Per Cent)
1980 58.8 61.5 5.2 84.8 96.2 98.8 49.2 75.4 44.5 1990 87.5 89.8 26.8 95.2 97.6 97.8 78.0 87.6 41.3 1995 90.0 90.6 17.5 96.0 98.1 98.2 83.3 92.3 50.1 2000 92.0 93.1 19.3 96.1 98.0 98.5 80.8 89.8 56.1 2001 93.1 94.0 20.8 96.8 98.2 98.7 82.6 95.0 64.0 2002 93.1 94.1 25.5 96.3 98.2 98.5 82.6 92.8 74.1 2003 92.3 93.4 25.2 95.0 97.8 98.5 80.9 92.2 81.7 2004 92.5 94.2 34.4 95.9 97.7 98.2 80.8 91.1 65.2 2005 91.1 93.0 23.8 94.4 97.3 97.9 77.2 89.8 57.1 2006 90.3 92.2 19.6 93.7 97.2 97.4 77.1 90.1 62.4 2007 90.0 91.9 20.6 92.9 96.4 96.8 77.1 88.9 62.4 2008 90.1 91.7 19.4 92.4 95.9 97.0 79.6 89.3 45.8 2009 88.8 90.4 17.7 91.2 95.3 96.1 77.2 90.2 51.7 2010 87.2 88.8 18.4 90.0 93.6 94.4 76.6 88.7 46.8 2011 88.6 90.1 18.1 91.2 94.9 96.2 79.0 88.7 44.2 2012 90.1 91.7 23.1 93.3 96.6 97.0 80.3 89.5 65.1
2013 90.5 91.8 22.3 94.1 97.0 97.2 82.5 91.2 47.7 2014 90.3 91.6 23.9 94.4 96.8 97.4 83.3 90.9 47.1 2015 90.8 92.0 33.9 94.8 96.8 97.2 84.1 92.0 54.9
1 Includes non-privatised Housing and Urban Development Corporation (HUDC) flats. 2 Includes HDB studio apartments.
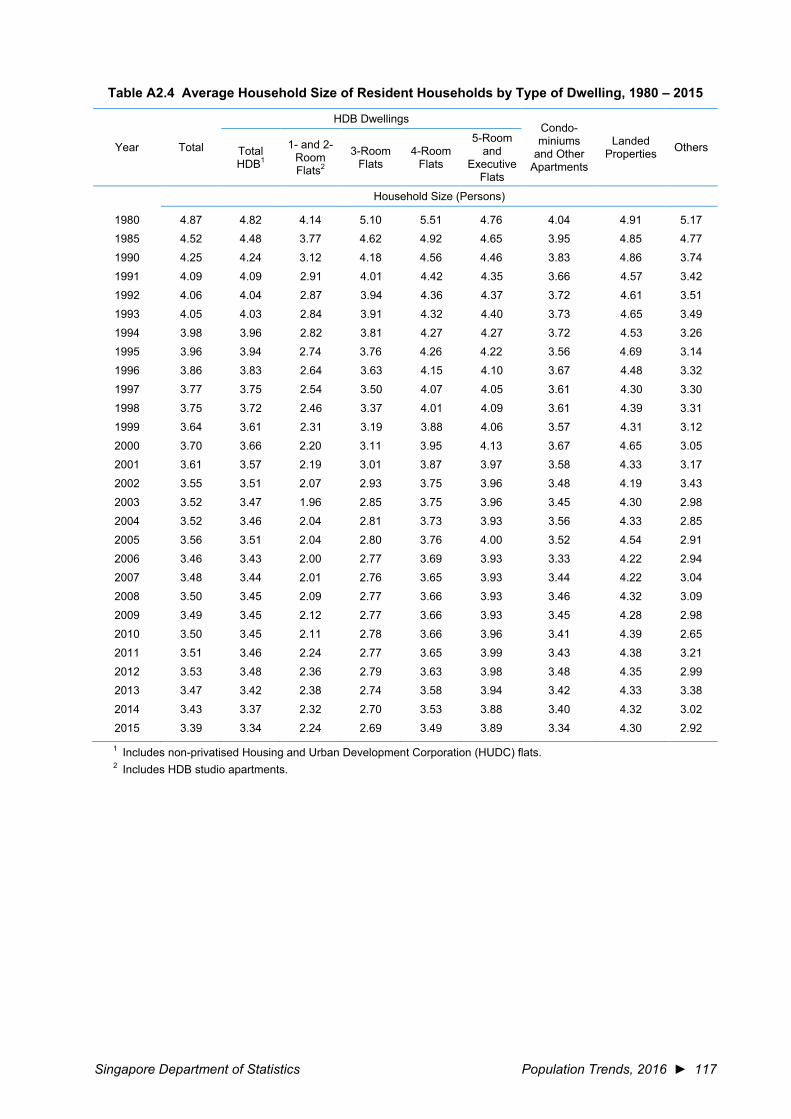
Singapore Department of Statistics Population Trends, 2016 ► 117
Table A2.4 Average Household Size of Resident Households by Type of Dwelling, 1980 – 2015
Year Total
HDB Dwellings Condo-miniums
and Other Apartments
Landed Properties Others Total
HDB1
1- and 2-RoomFlats2
3-RoomFlats
4-RoomFlats
5-Roomand
Executive Flats
Household Size (Persons)
1980 4.87 4.82 4.14 5.10 5.51 4.76 4.04 4.91 5.17 1985 4.52 4.48 3.77 4.62 4.92 4.65 3.95 4.85 4.77 1990 4.25 4.24 3.12 4.18 4.56 4.46 3.83 4.86 3.74 1991 4.09 4.09 2.91 4.01 4.42 4.35 3.66 4.57 3.42 1992 4.06 4.04 2.87 3.94 4.36 4.37 3.72 4.61 3.51 1993 4.05 4.03 2.84 3.91 4.32 4.40 3.73 4.65 3.49 1994 3.98 3.96 2.82 3.81 4.27 4.27 3.72 4.53 3.26 1995 3.96 3.94 2.74 3.76 4.26 4.22 3.56 4.69 3.14 1996 3.86 3.83 2.64 3.63 4.15 4.10 3.67 4.48 3.32 1997 3.77 3.75 2.54 3.50 4.07 4.05 3.61 4.30 3.30 1998 3.75 3.72 2.46 3.37 4.01 4.09 3.61 4.39 3.31 1999 3.64 3.61 2.31 3.19 3.88 4.06 3.57 4.31 3.12 2000 3.70 3.66 2.20 3.11 3.95 4.13 3.67 4.65 3.05 2001 3.61 3.57 2.19 3.01 3.87 3.97 3.58 4.33 3.17 2002 3.55 3.51 2.07 2.93 3.75 3.96 3.48 4.19 3.43 2003 3.52 3.47 1.96 2.85 3.75 3.96 3.45 4.30 2.98
2004 3.52 3.46 2.04 2.81 3.73 3.93 3.56 4.33 2.85 2005 3.56 3.51 2.04 2.80 3.76 4.00 3.52 4.54 2.91 2006 3.46 3.43 2.00 2.77 3.69 3.93 3.33 4.22 2.94 2007 3.48 3.44 2.01 2.76 3.65 3.93 3.44 4.22 3.04 2008 3.50 3.45 2.09 2.77 3.66 3.93 3.46 4.32 3.09 2009 3.49 3.45 2.12 2.77 3.66 3.93 3.45 4.28 2.98 2010 3.50 3.45 2.11 2.78 3.66 3.96 3.41 4.39 2.65 2011 3.51 3.46 2.24 2.77 3.65 3.99 3.43 4.38 3.21 2012 3.53 3.48 2.36 2.79 3.63 3.98 3.48 4.35 2.99 2013 3.47 3.42 2.38 2.74 3.58 3.94 3.42 4.33 3.38 2014 3.43 3.37 2.32 2.70 3.53 3.88 3.40 4.32 3.02 2015 3.39 3.34 2.24 2.69 3.49 3.89 3.34 4.30 2.92
1 Includes non-privatised Housing and Urban Development Corporation (HUDC) flats. 2 Includes HDB studio apartments.
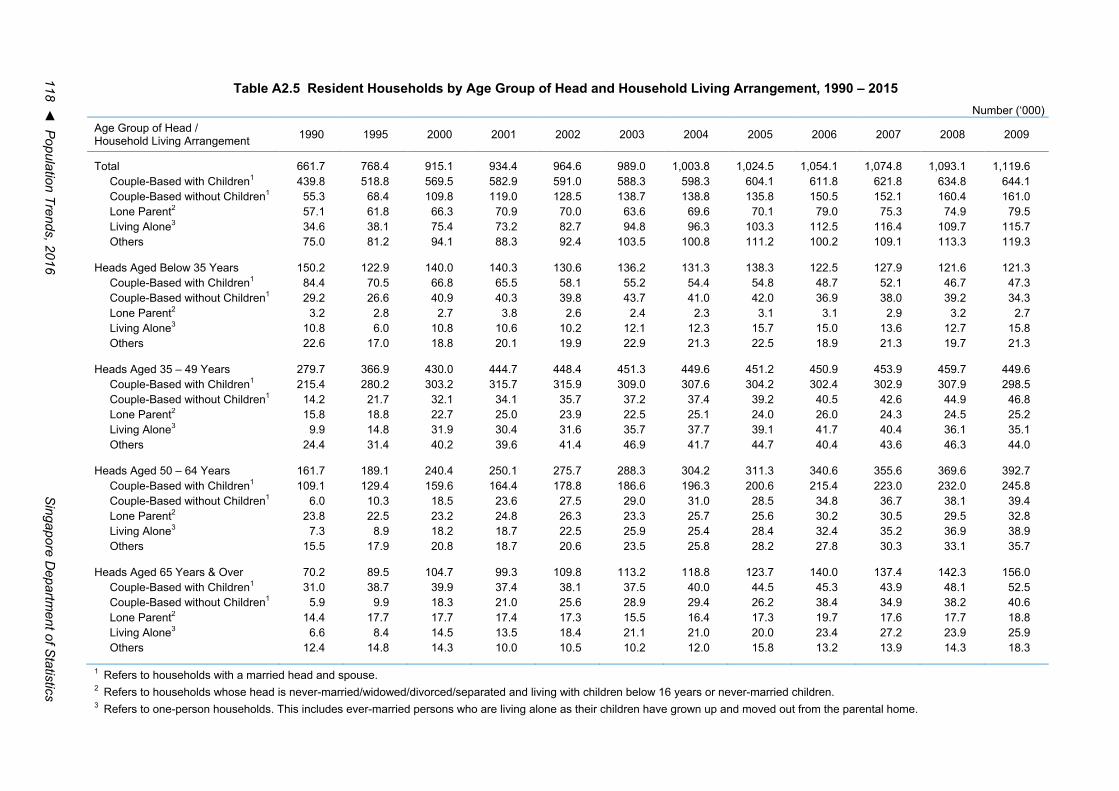
118 ◄ P
opulation Trends, 2016 S
ingapore Departm
ent of Statistics
Table A2.5 Resident Households by Age Group of Head and Household Living Arrangement, 1990 – 2015 Number (‘000)
Age Group of Head / Household Living Arrangement 1990 1995 2000 2001 2002 2003 2004 2005 2006 2007 2008 2009
Total 661.7 768.4 915.1 934.4 964.6 989.0 1,003.8 1,024.5 1,054.1 1,074.8 1,093.1 1,119.6 Couple-Based with Children1 439.8 518.8 569.5 582.9 591.0 588.3 598.3 604.1 611.8 621.8 634.8 644.1 Couple-Based without Children1 55.3 68.4 109.8 119.0 128.5 138.7 138.8 135.8 150.5 152.1 160.4 161.0 Lone Parent2 57.1 61.8 66.3 70.9 70.0 63.6 69.6 70.1 79.0 75.3 74.9 79.5 Living Alone3 34.6 38.1 75.4 73.2 82.7 94.8 96.3 103.3 112.5 116.4 109.7 115.7 Others 75.0 81.2 94.1 88.3 92.4 103.5 100.8 111.2 100.2 109.1 113.3 119.3
Heads Aged Below 35 Years 150.2 122.9 140.0 140.3 130.6 136.2 131.3 138.3 122.5 127.9 121.6 121.3 Couple-Based with Children1 84.4 70.5 66.8 65.5 58.1 55.2 54.4 54.8 48.7 52.1 46.7 47.3 Couple-Based without Children1 29.2 26.6 40.9 40.3 39.8 43.7 41.0 42.0 36.9 38.0 39.2 34.3 Lone Parent2 3.2 2.8 2.7 3.8 2.6 2.4 2.3 3.1 3.1 2.9 3.2 2.7 Living Alone3 10.8 6.0 10.8 10.6 10.2 12.1 12.3 15.7 15.0 13.6 12.7 15.8 Others 22.6 17.0 18.8 20.1 19.9 22.9 21.3 22.5 18.9 21.3 19.7 21.3
Heads Aged 35 – 49 Years 279.7 366.9 430.0 444.7 448.4 451.3 449.6 451.2 450.9 453.9 459.7 449.6 Couple-Based with Children1 215.4 280.2 303.2 315.7 315.9 309.0 307.6 304.2 302.4 302.9 307.9 298.5 Couple-Based without Children1 14.2 21.7 32.1 34.1 35.7 37.2 37.4 39.2 40.5 42.6 44.9 46.8 Lone Parent2 15.8 18.8 22.7 25.0 23.9 22.5 25.1 24.0 26.0 24.3 24.5 25.2 Living Alone3 9.9 14.8 31.9 30.4 31.6 35.7 37.7 39.1 41.7 40.4 36.1 35.1 Others 24.4 31.4 40.2 39.6 41.4 46.9 41.7 44.7 40.4 43.6 46.3 44.0
Heads Aged 50 – 64 Years 161.7 189.1 240.4 250.1 275.7 288.3 304.2 311.3 340.6 355.6 369.6 392.7 Couple-Based with Children1 109.1 129.4 159.6 164.4 178.8 186.6 196.3 200.6 215.4 223.0 232.0 245.8 Couple-Based without Children1 6.0 10.3 18.5 23.6 27.5 29.0 31.0 28.5 34.8 36.7 38.1 39.4 Lone Parent2 23.8 22.5 23.2 24.8 26.3 23.3 25.7 25.6 30.2 30.5 29.5 32.8 Living Alone3 7.3 8.9 18.2 18.7 22.5 25.9 25.4 28.4 32.4 35.2 36.9 38.9 Others 15.5 17.9 20.8 18.7 20.6 23.5 25.8 28.2 27.8 30.3 33.1 35.7
Heads Aged 65 Years & Over 70.2 89.5 104.7 99.3 109.8 113.2 118.8 123.7 140.0 137.4 142.3 156.0 Couple-Based with Children1 31.0 38.7 39.9 37.4 38.1 37.5 40.0 44.5 45.3 43.9 48.1 52.5 Couple-Based without Children1 5.9 9.9 18.3 21.0 25.6 28.9 29.4 26.2 38.4 34.9 38.2 40.6 Lone Parent2 14.4 17.7 17.7 17.4 17.3 15.5 16.4 17.3 19.7 17.6 17.7 18.8 Living Alone3 6.6 8.4 14.5 13.5 18.4 21.1 21.0 20.0 23.4 27.2 23.9 25.9 Others 12.4 14.8 14.3 10.0 10.5 10.2 12.0 15.8 13.2 13.9 14.3 18.3
1 Refers to households with a married head and spouse. 2 Refers to households whose head is never-married/widowed/divorced/separated and living with children below 16 years or never-married children. 3 Refers to one-person households. This includes ever-married persons who are living alone as their children have grown up and moved out from the parental home.
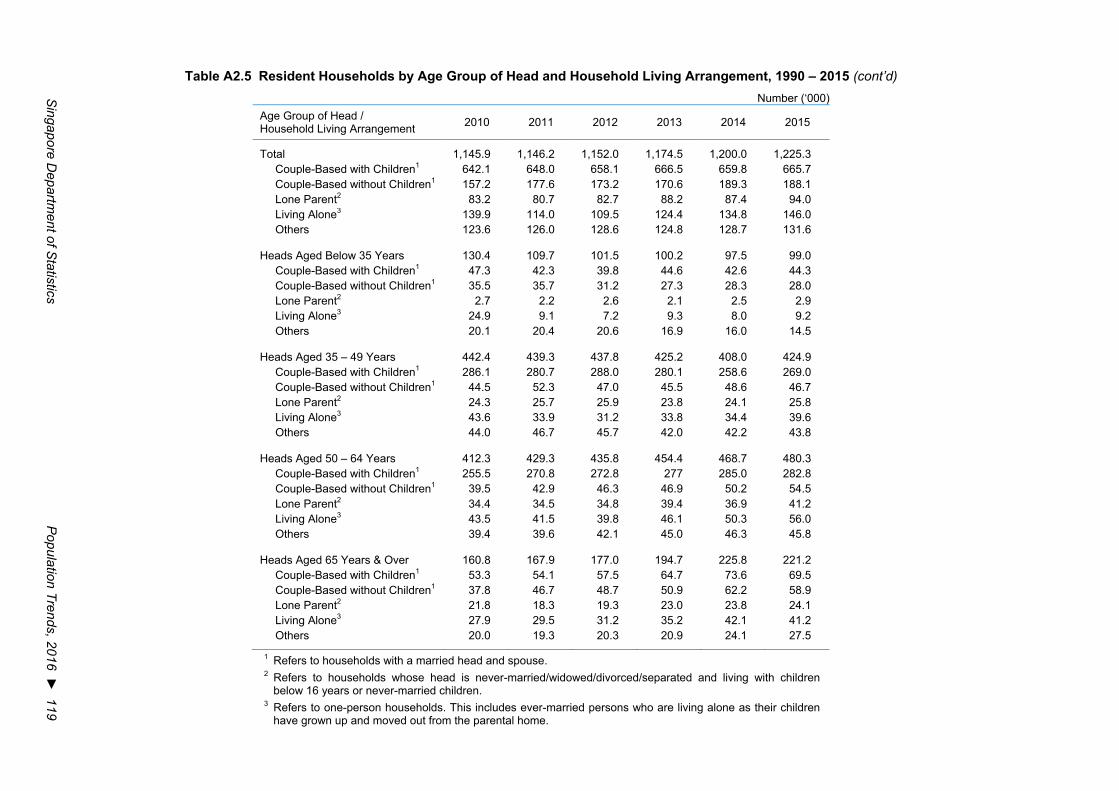
Singapore D
epartment of S
tatistics P
opulation Trends, 2016 ► 119
Table A2.5 Resident Households by Age Group of Head and Household Living Arrangement, 1990 – 2015 (cont’d) Number (‘000)
Age Group of Head / Household Living Arrangement 2010 2011 2012 2013 2014 2015
Total 1,145.9 1,146.2 1,152.0 1,174.5 1,200.0 1,225.3 Couple-Based with Children1 642.1 648.0 658.1 666.5 659.8 665.7 Couple-Based without Children1 157.2 177.6 173.2 170.6 189.3 188.1 Lone Parent2 83.2 80.7 82.7 88.2 87.4 94.0 Living Alone3 139.9 114.0 109.5 124.4 134.8 146.0 Others 123.6 126.0 128.6 124.8 128.7 131.6
Heads Aged Below 35 Years 130.4 109.7 101.5 100.2 97.5 99.0 Couple-Based with Children1 47.3 42.3 39.8 44.6 42.6 44.3 Couple-Based without Children1 35.5 35.7 31.2 27.3 28.3 28.0 Lone Parent2 2.7 2.2 2.6 2.1 2.5 2.9 Living Alone3 24.9 9.1 7.2 9.3 8.0 9.2 Others 20.1 20.4 20.6 16.9 16.0 14.5
Heads Aged 35 – 49 Years 442.4 439.3 437.8 425.2 408.0 424.9 Couple-Based with Children1 286.1 280.7 288.0 280.1 258.6 269.0 Couple-Based without Children1 44.5 52.3 47.0 45.5 48.6 46.7 Lone Parent2 24.3 25.7 25.9 23.8 24.1 25.8 Living Alone3 43.6 33.9 31.2 33.8 34.4 39.6 Others 44.0 46.7 45.7 42.0 42.2 43.8
Heads Aged 50 – 64 Years 412.3 429.3 435.8 454.4 468.7 480.3 Couple-Based with Children1 255.5 270.8 272.8 277 285.0 282.8 Couple-Based without Children1 39.5 42.9 46.3 46.9 50.2 54.5 Lone Parent2 34.4 34.5 34.8 39.4 36.9 41.2 Living Alone3 43.5 41.5 39.8 46.1 50.3 56.0 Others 39.4 39.6 42.1 45.0 46.3 45.8
Heads Aged 65 Years & Over 160.8 167.9 177.0 194.7 225.8 221.2 Couple-Based with Children1 53.3 54.1 57.5 64.7 73.6 69.5 Couple-Based without Children1 37.8 46.7 48.7 50.9 62.2 58.9 Lone Parent2 21.8 18.3 19.3 23.0 23.8 24.1 Living Alone3 27.9 29.5 31.2 35.2 42.1 41.2 Others 20.0 19.3 20.3 20.9 24.1 27.5
1 Refers to households with a married head and spouse. 2 Refers to households whose head is never-married/widowed/divorced/separated and living with children
below 16 years or never-married children. 3 Refers to one-person households. This includes ever-married persons who are living alone as their children
have grown up and moved out from the parental home.
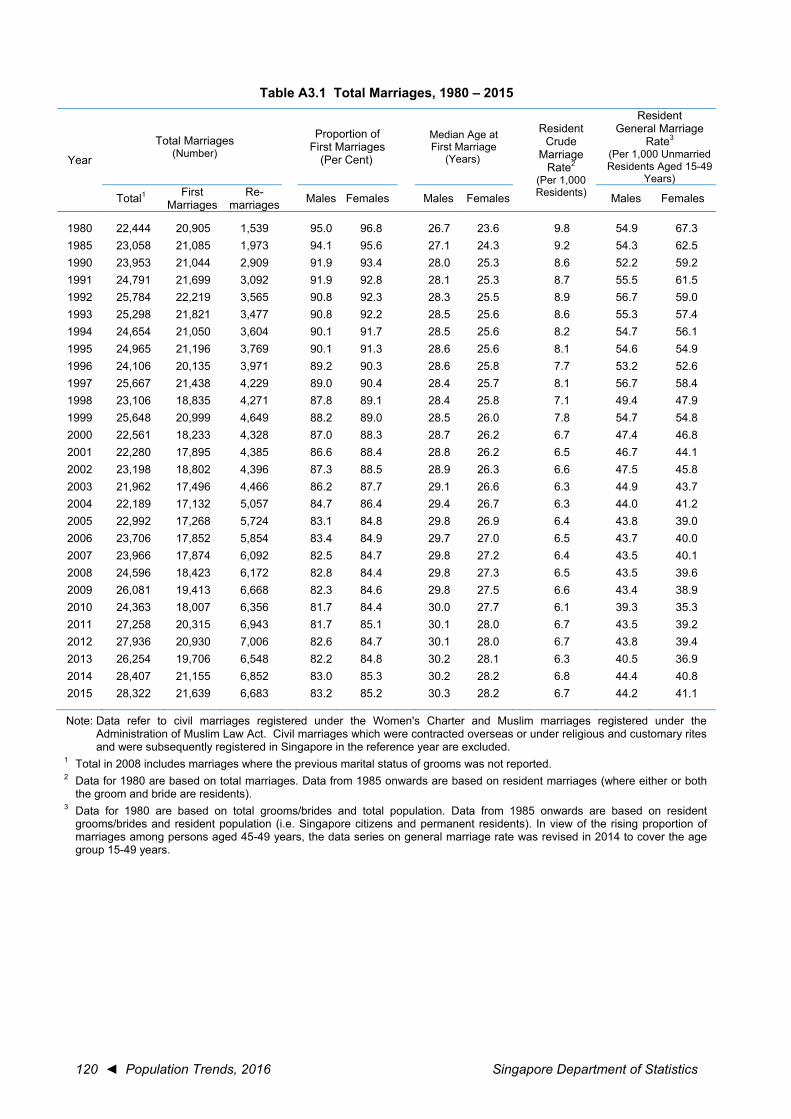
120 ◄ Population Trends, 2016 Singapore Department of Statistics
Table A3.1 Total Marriages, 1980 – 2015
Year
Total Marriages (Number)
Proportion of First Marriages
(Per Cent)
Median Age at First Marriage
(Years)
Resident Crude
Marriage Rate2
(Per 1,000 Residents)
Resident General Marriage
Rate3
(Per 1,000 Unmarried Residents Aged 15-49
Years)
Total1 First Marriages
Re- marriages Males Females Males Females Males Females
1980 22,444 20,905 1,539 95.0 96.8 26.7 23.6 9.8 54.9 67.3 1985 23,058 21,085 1,973 94.1 95.6 27.1 24.3 9.2 54.3 62.5 1990 23,953 21,044 2,909 91.9 93.4 28.0 25.3 8.6 52.2 59.2 1991 24,791 21,699 3,092 91.9 92.8 28.1 25.3 8.7 55.5 61.5 1992 25,784 22,219 3,565 90.8 92.3 28.3 25.5 8.9 56.7 59.0 1993 25,298 21,821 3,477 90.8 92.2 28.5 25.6 8.6 55.3 57.4 1994 24,654 21,050 3,604 90.1 91.7 28.5 25.6 8.2 54.7 56.1 1995 24,965 21,196 3,769 90.1 91.3 28.6 25.6 8.1 54.6 54.9 1996 24,106 20,135 3,971 89.2 90.3 28.6 25.8 7.7 53.2 52.6 1997 25,667 21,438 4,229 89.0 90.4 28.4 25.7 8.1 56.7 58.4 1998 23,106 18,835 4,271 87.8 89.1 28.4 25.8 7.1 49.4 47.9 1999 25,648 20,999 4,649 88.2 89.0 28.5 26.0 7.8 54.7 54.8 2000 22,561 18,233 4,328 87.0 88.3 28.7 26.2 6.7 47.4 46.8 2001 22,280 17,895 4,385 86.6 88.4 28.8 26.2 6.5 46.7 44.1 2002 23,198 18,802 4,396 87.3 88.5 28.9 26.3 6.6 47.5 45.8 2003 21,962 17,496 4,466 86.2 87.7 29.1 26.6 6.3 44.9 43.7 2004 22,189 17,132 5,057 84.7 86.4 29.4 26.7 6.3 44.0 41.2 2005 22,992 17,268 5,724 83.1 84.8 29.8 26.9 6.4 43.8 39.0 2006 23,706 17,852 5,854 83.4 84.9 29.7 27.0 6.5 43.7 40.0 2007 23,966 17,874 6,092 82.5 84.7 29.8 27.2 6.4 43.5 40.1 2008 24,596 18,423 6,172 82.8 84.4 29.8 27.3 6.5 43.5 39.6 2009 26,081 19,413 6,668 82.3 84.6 29.8 27.5 6.6 43.4 38.9 2010 24,363 18,007 6,356 81.7 84.4 30.0 27.7 6.1 39.3 35.3 2011 27,258 20,315 6,943 81.7 85.1 30.1 28.0 6.7 43.5 39.2 2012 27,936 20,930 7,006 82.6 84.7 30.1 28.0 6.7 43.8 39.4 2013 26,254 19,706 6,548 82.2 84.8 30.2 28.1 6.3 40.5 36.9 2014 28,407 21,155 6,852 83.0 85.3 30.2 28.2 6.8 44.4 40.8 2015 28,322 21,639 6,683 83.2 85.2 30.3 28.2 6.7 44.2 41.1
Note: Data refer to civil marriages registered under the Women's Charter and Muslim marriages registered under the Administration of Muslim Law Act. Civil marriages which were contracted overseas or under religious and customary rites and were subsequently registered in Singapore in the reference year are excluded.
1 Total in 2008 includes marriages where the previous marital status of grooms was not reported. 2 Data for 1980 are based on total marriages. Data from 1985 onwards are based on resident marriages (where either or both
the groom and bride are residents). 3 Data for 1980 are based on total grooms/brides and total population. Data from 1985 onwards are based on resident
grooms/brides and resident population (i.e. Singapore citizens and permanent residents). In view of the rising proportion of marriages among persons aged 45-49 years, the data series on general marriage rate was revised in 2014 to cover the age group 15-49 years.
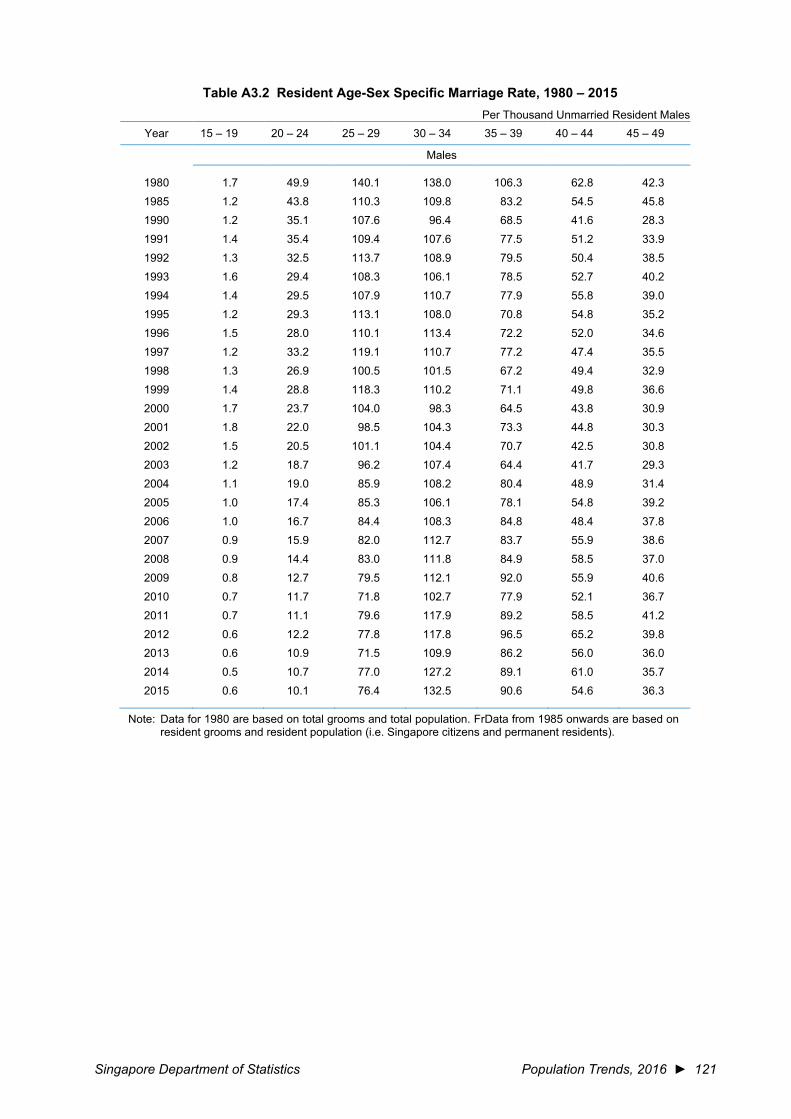
Singapore Department of Statistics Population Trends, 2016 ► 121
Table A3.2 Resident Age-Sex Specific Marriage Rate, 1980 – 2015 Per Thousand Unmarried Resident Males
Year 15 – 19 20 – 24 25 – 29 30 – 34 35 – 39 40 – 44 45 – 49
Males
1980 1.7 49.9 140.1 138.0 106.3 62.8 42.3 1985 1.2 43.8 110.3 109.8 83.2 54.5 45.8 1990 1.2 35.1 107.6 96.4 68.5 41.6 28.3 1991 1.4 35.4 109.4 107.6 77.5 51.2 33.9 1992 1.3 32.5 113.7 108.9 79.5 50.4 38.5 1993 1.6 29.4 108.3 106.1 78.5 52.7 40.2 1994 1.4 29.5 107.9 110.7 77.9 55.8 39.0 1995 1.2 29.3 113.1 108.0 70.8 54.8 35.2 1996 1.5 28.0 110.1 113.4 72.2 52.0 34.6 1997 1.2 33.2 119.1 110.7 77.2 47.4 35.5 1998 1.3 26.9 100.5 101.5 67.2 49.4 32.9 1999 1.4 28.8 118.3 110.2 71.1 49.8 36.6 2000 1.7 23.7 104.0 98.3 64.5 43.8 30.9 2001 1.8 22.0 98.5 104.3 73.3 44.8 30.3 2002 1.5 20.5 101.1 104.4 70.7 42.5 30.8 2003 1.2 18.7 96.2 107.4 64.4 41.7 29.3 2004 1.1 19.0 85.9 108.2 80.4 48.9 31.4 2005 1.0 17.4 85.3 106.1 78.1 54.8 39.2
2006 1.0 16.7 84.4 108.3 84.8 48.4 37.8 2007 0.9 15.9 82.0 112.7 83.7 55.9 38.6 2008 0.9 14.4 83.0 111.8 84.9 58.5 37.0 2009 0.8 12.7 79.5 112.1 92.0 55.9 40.6 2010 0.7 11.7 71.8 102.7 77.9 52.1 36.7 2011 0.7 11.1 79.6 117.9 89.2 58.5 41.2 2012 0.6 12.2 77.8 117.8 96.5 65.2 39.8 2013 0.6 10.9 71.5 109.9 86.2 56.0 36.0 2014 0.5 10.7 77.0 127.2 89.1 61.0 35.7 2015 0.6 10.1 76.4 132.5 90.6 54.6 36.3
Note: Data for 1980 are based on total grooms and total population. FrData from 1985 onwards are based on resident grooms and resident population (i.e. Singapore citizens and permanent residents).
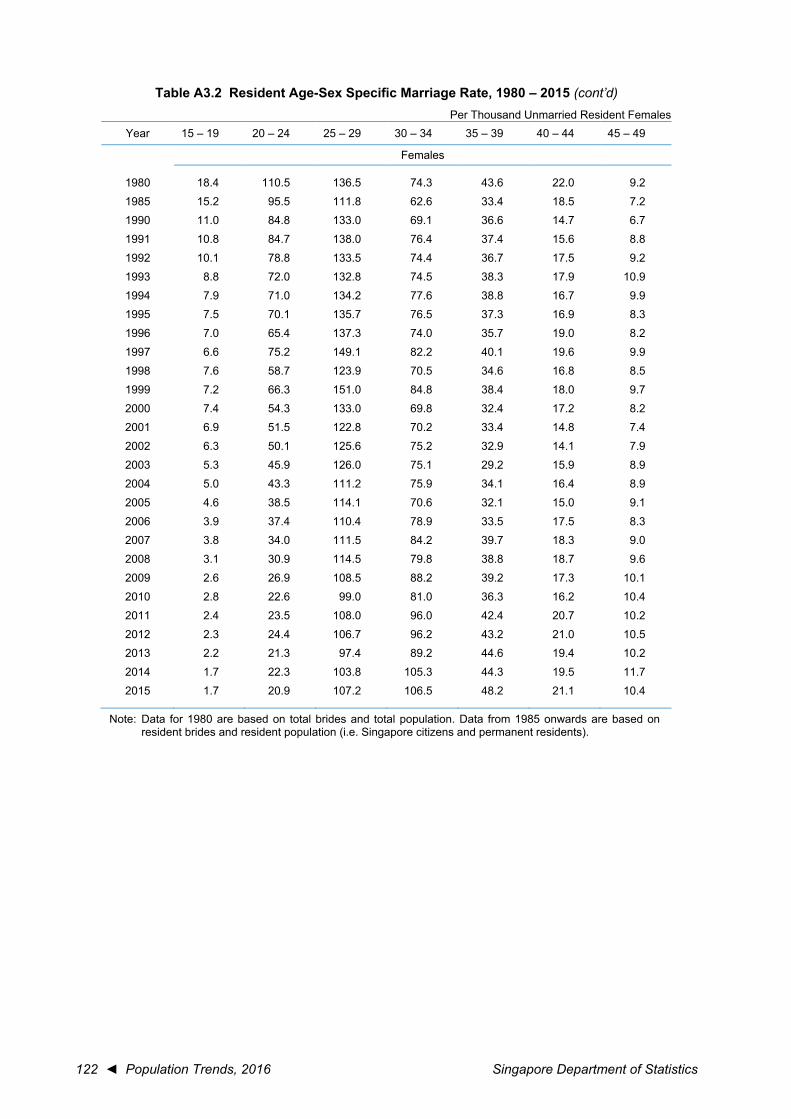
122 ◄ Population Trends, 2016 Singapore Department of Statistics
Table A3.2 Resident Age-Sex Specific Marriage Rate, 1980 – 2015 (cont’d) Per Thousand Unmarried Resident Females
Year 15 – 19 20 – 24 25 – 29 30 – 34 35 – 39 40 – 44 45 – 49
Females
1980 18.4 110.5 136.5 74.3 43.6 22.0 9.2 1985 15.2 95.5 111.8 62.6 33.4 18.5 7.2 1990 11.0 84.8 133.0 69.1 36.6 14.7 6.7 1991 10.8 84.7 138.0 76.4 37.4 15.6 8.8 1992 10.1 78.8 133.5 74.4 36.7 17.5 9.2 1993 8.8 72.0 132.8 74.5 38.3 17.9 10.9 1994 7.9 71.0 134.2 77.6 38.8 16.7 9.9 1995 7.5 70.1 135.7 76.5 37.3 16.9 8.3 1996 7.0 65.4 137.3 74.0 35.7 19.0 8.2 1997 6.6 75.2 149.1 82.2 40.1 19.6 9.9 1998 7.6 58.7 123.9 70.5 34.6 16.8 8.5 1999 7.2 66.3 151.0 84.8 38.4 18.0 9.7 2000 7.4 54.3 133.0 69.8 32.4 17.2 8.2 2001 6.9 51.5 122.8 70.2 33.4 14.8 7.4 2002 6.3 50.1 125.6 75.2 32.9 14.1 7.9 2003 5.3 45.9 126.0 75.1 29.2 15.9 8.9 2004 5.0 43.3 111.2 75.9 34.1 16.4 8.9 2005 4.6 38.5 114.1 70.6 32.1 15.0 9.1
2006 3.9 37.4 110.4 78.9 33.5 17.5 8.3 2007 3.8 34.0 111.5 84.2 39.7 18.3 9.0 2008 3.1 30.9 114.5 79.8 38.8 18.7 9.6 2009 2.6 26.9 108.5 88.2 39.2 17.3 10.1 2010 2.8 22.6 99.0 81.0 36.3 16.2 10.4 2011 2.4 23.5 108.0 96.0 42.4 20.7 10.2 2012 2.3 24.4 106.7 96.2 43.2 21.0 10.5 2013 2.2 21.3 97.4 89.2 44.6 19.4 10.2 2014 1.7 22.3 103.8 105.3 44.3 19.5 11.7 2015 1.7 20.9 107.2 106.5 48.2 21.1 10.4
Note: Data for 1980 are based on total brides and total population. Data from 1985 onwards are based on resident brides and resident population (i.e. Singapore citizens and permanent residents).

Singapore Department of Statistics Population Trends, 2016 ► 123
Table A3.3 Total Divorces, 1980 – 2015
Year Total
Divorces & Annulments
Median Age at Divorce
(Years)
Resident Crude Divorce Rate1,2
(Per 1,000 Residents)
Resident General Divorce Rate1,3
(Per 1,000 Married Residents Aged 20 Years & Over)
Males Females Males Females
1980 1,721 34.0 30.8 0.8 3.7 3.8 1985 2,344 34.8 31.4 0.9 4.6 4.6 1990 3,634 35.9 32.6 1.3 6.1 6.1 1991 4,419 36.7 33.6 1.6 7.0 7.1 1992 3,944 37.2 34.1 1.4 6.2 6.2 1993 3,966 37.0 33.8 1.4 6.0 6.1 1994 3,742 37.3 34.3 1.3 5.5 5.5 1995 4,286 38.2 35.0 1.4 6.1 6.1 1996 4,625 38.4 35.3 1.5 6.4 6.5 1997 4,866 38.2 35.0 1.6 6.6 6.6 1998 5,640 38.7 35.4 1.8 7.4 7.5 1999 5,314 38.9 35.4 1.6 6.8 6.9 2000 5,137 39.0 35.5 1.6 6.5 6.5 2001 5,071 39.0 35.5 1.5 6.2 6.4 2002 5,809 38.7 35.6 1.7 7.1 7.1 2003 6,368 39.2 35.7 1.9 7.8 7.8 2004 6,188 39.0 35.3 1.8 7.1 6.9
2005 6,721 39.1 35.4 1.9 7.6 7.3 2006 6,904 39.6 35.7 1.9 7.7 7.4 2007 7,110 39.8 36.1 2.0 7.7 7.4 2008 7,134 39.9 36.3 1.9 7.5 7.3 2009 7,280 40.5 36.9 1.9 7.5 7.1 2010 7,338 41.0 37.4 1.9 7.5 7.2 2011 7,604 41.3 37.7 2.0 7.6 7.2 2012 7,237 41.6 38.0 1.9 7.1 6.7 2013 7,525 42.4 38.2 1.9 7.3 6.9 2014 7,307 42.6 38.4 1.9 7.0 6.5 2015 7,522 42.9 38.8 1.9 7.1 6.6
1 Data include annulments. 2 From 2004 onwards, data are based on divorces and annulments where either or both spouses are
residents (i.e. Singapore citizens and permanent residents). 3 From 2004 onwards, data are based on divorces and annulments where the male/female spouses are
residents (i.e. Singapore citizens and permanent residents).
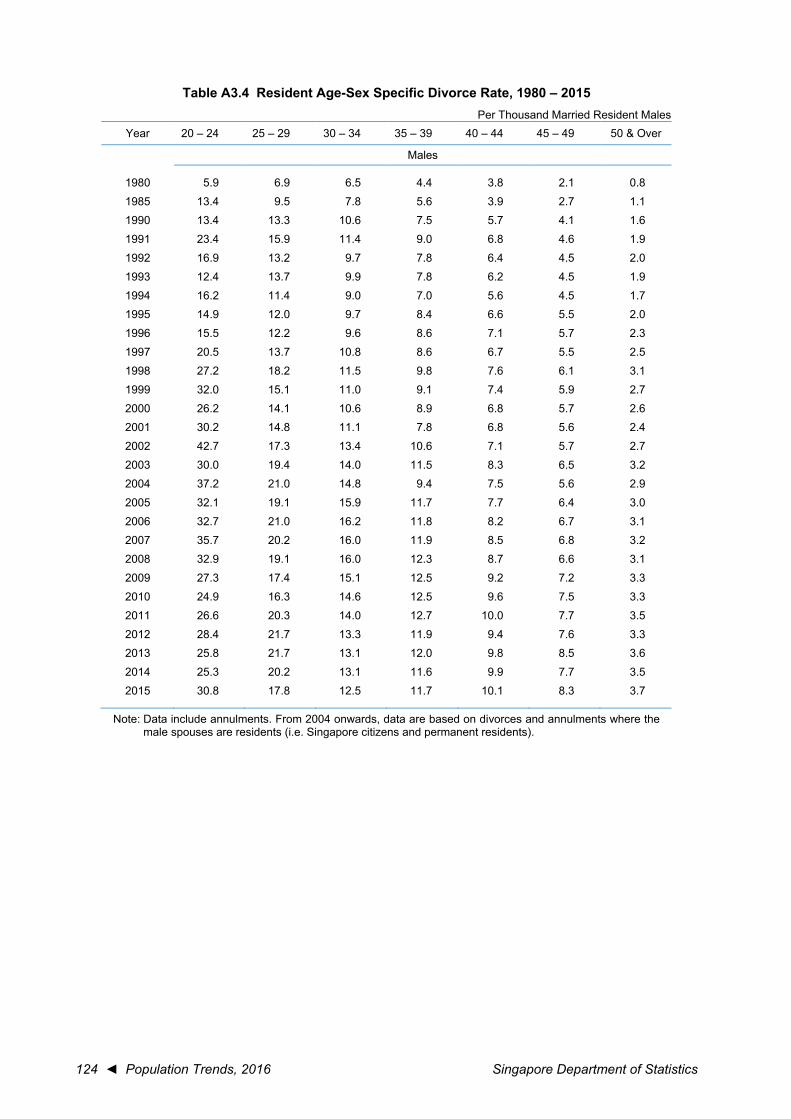
124 ◄ Population Trends, 2016 Singapore Department of Statistics
Table A3.4 Resident Age-Sex Specific Divorce Rate, 1980 – 2015 Per Thousand Married Resident Males
Year 20 – 24 25 – 29 30 – 34 35 – 39 40 – 44 45 – 49 50 & Over
Males
1980 5.9 6.9 6.5 4.4 3.8 2.1 0.8 1985 13.4 9.5 7.8 5.6 3.9 2.7 1.1 1990 13.4 13.3 10.6 7.5 5.7 4.1 1.6 1991 23.4 15.9 11.4 9.0 6.8 4.6 1.9 1992 16.9 13.2 9.7 7.8 6.4 4.5 2.0 1993 12.4 13.7 9.9 7.8 6.2 4.5 1.9 1994 16.2 11.4 9.0 7.0 5.6 4.5 1.7 1995 14.9 12.0 9.7 8.4 6.6 5.5 2.0 1996 15.5 12.2 9.6 8.6 7.1 5.7 2.3 1997 20.5 13.7 10.8 8.6 6.7 5.5 2.5 1998 27.2 18.2 11.5 9.8 7.6 6.1 3.1 1999 32.0 15.1 11.0 9.1 7.4 5.9 2.7 2000 26.2 14.1 10.6 8.9 6.8 5.7 2.6 2001 30.2 14.8 11.1 7.8 6.8 5.6 2.4 2002 42.7 17.3 13.4 10.6 7.1 5.7 2.7 2003 30.0 19.4 14.0 11.5 8.3 6.5 3.2 2004 37.2 21.0 14.8 9.4 7.5 5.6 2.9 2005 32.1 19.1 15.9 11.7 7.7 6.4 3.0
2006 32.7 21.0 16.2 11.8 8.2 6.7 3.1 2007 35.7 20.2 16.0 11.9 8.5 6.8 3.2 2008 32.9 19.1 16.0 12.3 8.7 6.6 3.1 2009 27.3 17.4 15.1 12.5 9.2 7.2 3.3 2010 24.9 16.3 14.6 12.5 9.6 7.5 3.3 2011 26.6 20.3 14.0 12.7 10.0 7.7 3.5 2012 28.4 21.7 13.3 11.9 9.4 7.6 3.3 2013 25.8 21.7 13.1 12.0 9.8 8.5 3.6 2014 25.3 20.2 13.1 11.6 9.9 7.7 3.5 2015 30.8 17.8 12.5 11.7 10.1 8.3 3.7
Note: Data include annulments. From 2004 onwards, data are based on divorces and annulments where the male spouses are residents (i.e. Singapore citizens and permanent residents).
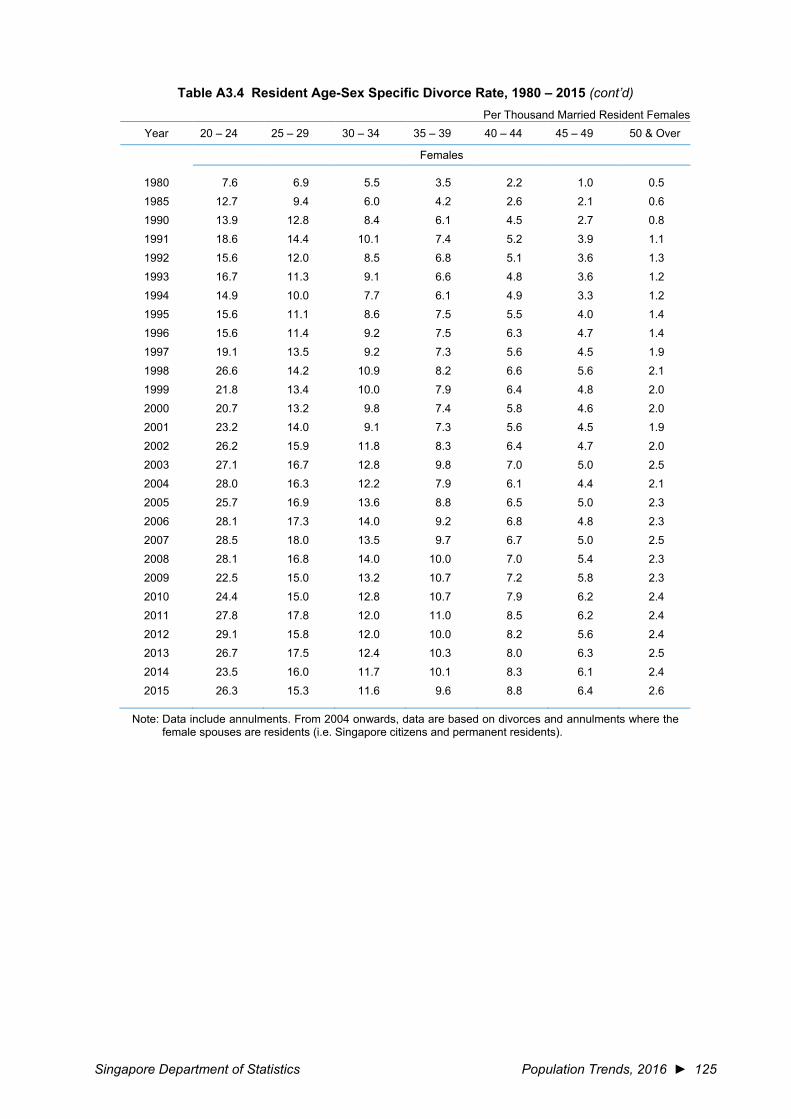
Singapore Department of Statistics Population Trends, 2016 ► 125
Table A3.4 Resident Age-Sex Specific Divorce Rate, 1980 – 2015 (cont’d) Per Thousand Married Resident Females
Year 20 – 24 25 – 29 30 – 34 35 – 39 40 – 44 45 – 49 50 & Over
Females
1980 7.6 6.9 5.5 3.5 2.2 1.0 0.5 1985 12.7 9.4 6.0 4.2 2.6 2.1 0.6 1990 13.9 12.8 8.4 6.1 4.5 2.7 0.8 1991 18.6 14.4 10.1 7.4 5.2 3.9 1.1 1992 15.6 12.0 8.5 6.8 5.1 3.6 1.3 1993 16.7 11.3 9.1 6.6 4.8 3.6 1.2 1994 14.9 10.0 7.7 6.1 4.9 3.3 1.2 1995 15.6 11.1 8.6 7.5 5.5 4.0 1.4 1996 15.6 11.4 9.2 7.5 6.3 4.7 1.4 1997 19.1 13.5 9.2 7.3 5.6 4.5 1.9 1998 26.6 14.2 10.9 8.2 6.6 5.6 2.1 1999 21.8 13.4 10.0 7.9 6.4 4.8 2.0 2000 20.7 13.2 9.8 7.4 5.8 4.6 2.0 2001 23.2 14.0 9.1 7.3 5.6 4.5 1.9 2002 26.2 15.9 11.8 8.3 6.4 4.7 2.0 2003 27.1 16.7 12.8 9.8 7.0 5.0 2.5 2004 28.0 16.3 12.2 7.9 6.1 4.4 2.1 2005 25.7 16.9 13.6 8.8 6.5 5.0 2.3
2006 28.1 17.3 14.0 9.2 6.8 4.8 2.3 2007 28.5 18.0 13.5 9.7 6.7 5.0 2.5 2008 28.1 16.8 14.0 10.0 7.0 5.4 2.3 2009 22.5 15.0 13.2 10.7 7.2 5.8 2.3 2010 24.4 15.0 12.8 10.7 7.9 6.2 2.4 2011 27.8 17.8 12.0 11.0 8.5 6.2 2.4 2012 29.1 15.8 12.0 10.0 8.2 5.6 2.4 2013 26.7 17.5 12.4 10.3 8.0 6.3 2.5 2014 23.5 16.0 11.7 10.1 8.3 6.1 2.4 2015 26.3 15.3 11.6 9.6 8.8 6.4 2.6
Note: Data include annulments. From 2004 onwards, data are based on divorces and annulments where the female spouses are residents (i.e. Singapore citizens and permanent residents).
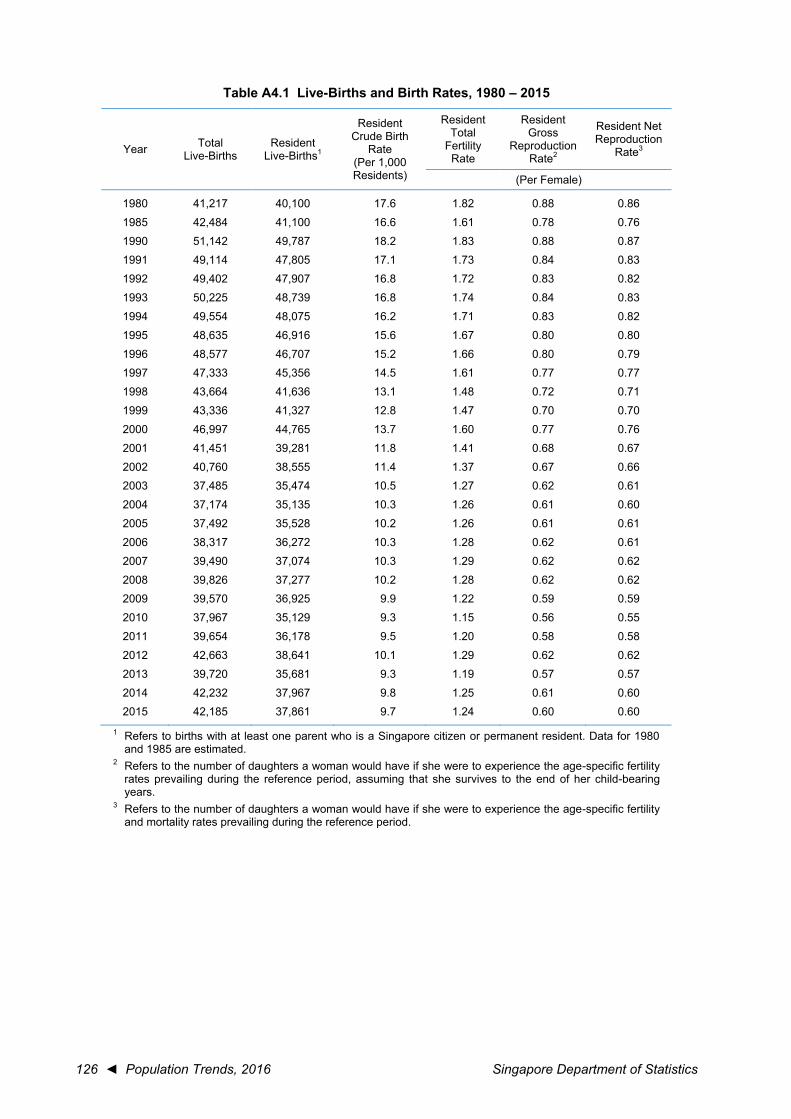
126 ◄ Population Trends, 2016 Singapore Department of Statistics
Table A4.1 Live-Births and Birth Rates, 1980 – 2015
Year Total Live-Births
Resident Live-Births1
Resident Crude Birth
Rate
(Per 1,000 Residents)
Resident Total
Fertility Rate
Resident Gross
Reproduction Rate2
Resident Net Reproduction
Rate3
(Per Female)
1980 41,217 40,100 17.6 1.82 0.88 0.86 1985 42,484 41,100 16.6 1.61 0.78 0.76 1990 51,142 49,787 18.2 1.83 0.88 0.87 1991 49,114 47,805 17.1 1.73 0.84 0.83 1992 49,402 47,907 16.8 1.72 0.83 0.82 1993 50,225 48,739 16.8 1.74 0.84 0.83 1994 49,554 48,075 16.2 1.71 0.83 0.82 1995 48,635 46,916 15.6 1.67 0.80 0.80 1996 48,577 46,707 15.2 1.66 0.80 0.79 1997 47,333 45,356 14.5 1.61 0.77 0.77 1998 43,664 41,636 13.1 1.48 0.72 0.71 1999 43,336 41,327 12.8 1.47 0.70 0.70 2000 46,997 44,765 13.7 1.60 0.77 0.76 2001 41,451 39,281 11.8 1.41 0.68 0.67 2002 40,760 38,555 11.4 1.37 0.67 0.66 2003 37,485 35,474 10.5 1.27 0.62 0.61 2004 37,174 35,135 10.3 1.26 0.61 0.60
2005 37,492 35,528 10.2 1.26 0.61 0.61 2006 38,317 36,272 10.3 1.28 0.62 0.61 2007 39,490 37,074 10.3 1.29 0.62 0.62 2008 39,826 37,277 10.2 1.28 0.62 0.62 2009 39,570 36,925 9.9 1.22 0.59 0.59 2010 37,967 35,129 9.3 1.15 0.56 0.55 2011 39,654 36,178 9.5 1.20 0.58 0.58 2012 42,663 38,641 10.1 1.29 0.62 0.62 2013 39,720 35,681 9.3 1.19 0.57 0.57 2014 42,232 37,967 9.8 1.25 0.61 0.60 2015 42,185 37,861 9.7 1.24 0.60 0.60
1 Refers to births with at least one parent who is a Singapore citizen or permanent resident. Data for 1980 and 1985 are estimated.
2 Refers to the number of daughters a woman would have if she were to experience the age-specific fertility rates prevailing during the reference period, assuming that she survives to the end of her child-bearing years.
3 Refers to the number of daughters a woman would have if she were to experience the age-specific fertility and mortality rates prevailing during the reference period.

Singapore Department of Statistics Population Trends, 2016 ► 127
Table A4.2 Resident Age-Specific Fertility Rate, 1980 – 2015 Per Thousand Females
Year 15 – 19 20 – 24 25 – 29 30 – 34 35 – 39 40 – 44 45 – 49
1980 12.7 84.9 144.5 87.8 28.0 5.8 0.5 1985 9.6 68.0 123.9 85.6 31.1 4.5 0.2 1990 8.3 58.7 136.0 110.8 44.3 7.4 0.1 1991 8.4 53.5 129.2 106.8 41.7 6.5 0.3 1992 7.9 52.1 128.4 107.2 41.7 6.7 0.2 1993 8.3 49.8 130.0 108.8 43.6 7.2 0.2 1994 7.4 46.9 129.2 109.2 42.6 6.7 0.1 1995 6.6 46.9 125.6 107.4 41.3 6.5 0.2 1996 6.8 44.8 122.8 108.5 42.6 7.0 0.2 1997 6.8 42.0 116.9 107.3 41.7 7.0 0.2 1998 7.5 39.7 105.2 96.1 39.8 6.6 0.2 1999 8.4 37.3 105.1 97.5 38.6 6.4 0.2 2000 8.8 42.2 110.1 107.9 43.3 7.6 0.2 2001 8.4 35.7 96.2 94.9 39.5 6.8 0.2 2002 8.0 34.6 91.6 96.2 38.2 5.8 0.2 2003 6.7 32.4 82.2 90.0 36.3 6.1 0.2 2004 6.6 32.2 80.6 89.9 35.6 6.3 0.2 2005 7.2 32.5 80.7 89.2 36.8 6.2 0.2 2006 6.6 30.6 79.6 93.1 38.7 6.4 0.2
2007 6.1 31.2 78.7 94.4 41.5 6.4 0.2 2008 6.1 29.1 78.9 94.6 41.5 6.6 0.2 2009 5.0 25.4 74.2 90.1 42.6 7.0 0.3 2010 4.8 23.3 68.1 86.0 42.2 6.1 0.3 2011 4.7 22.4 73.4 89.5 42.4 7.2 0.3 2012 4.3 22.2 76.7 99.5 46.3 8.0 0.3 2013 3.8 19.7 70.5 90.2 44.7 8.0 0.3 2014 3.3 19.5 71.1 99.3 48.3 8.3 0.3 2015 2.7 18.7 68.7 98.5 49.9 8.9 0.4
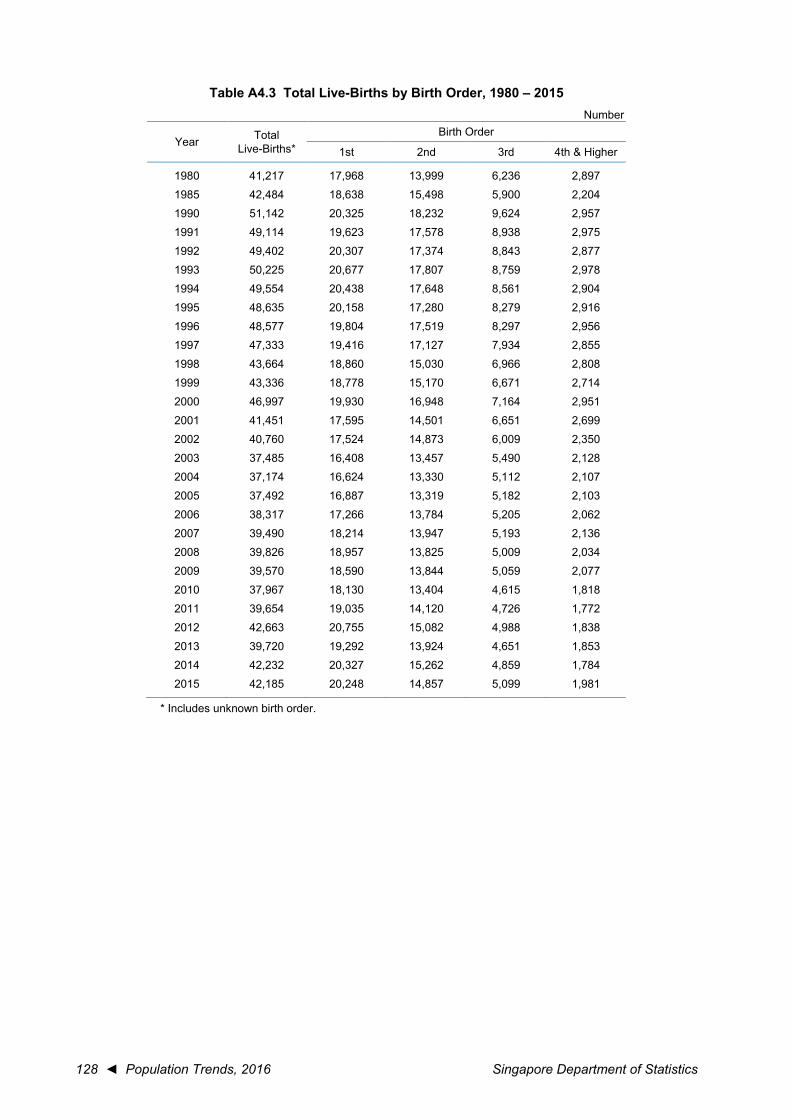
128 ◄ Population Trends, 2016 Singapore Department of Statistics
Table A4.3 Total Live-Births by Birth Order, 1980 – 2015 Number
Year Total Birth Order Live-Births* 1st 2nd 3rd 4th & Higher
1980 41,217 17,968 13,999 6,236 2,897 1985 42,484 18,638 15,498 5,900 2,204 1990 51,142 20,325 18,232 9,624 2,957 1991 49,114 19,623 17,578 8,938 2,975 1992 49,402 20,307 17,374 8,843 2,877 1993 50,225 20,677 17,807 8,759 2,978 1994 49,554 20,438 17,648 8,561 2,904 1995 48,635 20,158 17,280 8,279 2,916 1996 48,577 19,804 17,519 8,297 2,956 1997 47,333 19,416 17,127 7,934 2,855 1998 43,664 18,860 15,030 6,966 2,808 1999 43,336 18,778 15,170 6,671 2,714 2000 46,997 19,930 16,948 7,164 2,951 2001 41,451 17,595 14,501 6,651 2,699 2002 40,760 17,524 14,873 6,009 2,350 2003 37,485 16,408 13,457 5,490 2,128 2004 37,174 16,624 13,330 5,112 2,107 2005 37,492 16,887 13,319 5,182 2,103
2006 38,317 17,266 13,784 5,205 2,062 2007 39,490 18,214 13,947 5,193 2,136 2008 39,826 18,957 13,825 5,009 2,034 2009 39,570 18,590 13,844 5,059 2,077 2010 37,967 18,130 13,404 4,615 1,818 2011 39,654 19,035 14,120 4,726 1,772 2012 42,663 20,755 15,082 4,988 1,838 2013 39,720 19,292 13,924 4,651 1,853 2014 42,232 20,327 15,262 4,859 1,784 2015 42,185 20,248 14,857 5,099 1,981
* Includes unknown birth order.

Singapore Department of Statistics Population Trends, 2016 ► 129
Table A4.4 Average Number of Children Born by Age Group of Resident Ever-Married Females, 1980 – 2015
Per Resident Ever-Married Female Year Total 15 – 29 30 – 39 40 – 49 50 & Over
1980 3.44 1.30 2.65 4.42 4.98 1985 3.14 1.15 2.21 3.53 4.85 1990 2.85 0.98 1.91 2.75 4.69 1991 2.86 1.06 1.94 2.67 4.58 1992 2.83 1.00 1.92 2.60 4.53 1993 2.80 0.98 1.92 2.51 4.43 1994 2.72 0.93 1.90 2.46 4.31 1996 2.57 0.90 1.84 2.30 4.04 1997 2.44 0.82 1.74 2.19 3.74 1998 2.38 0.81 1.68 2.12 3.59 1999 2.38 0.76 1.72 2.15 3.55 2000 2.53 0.81 1.77 2.21 3.85 2001 2.42 0.81 1.73 2.15 3.56 2002 2.40 0.80 1.68 2.15 3.44 2003 2.37 0.69 1.63 2.11 3.37 2004 2.37 0.74 1.62 2.13 3.30 2005 2.37 0.76 1.61 2.13 3.31 2006 2.32 0.77 1.55 2.08 3.15 2007 2.27 0.79 1.50 2.07 3.03
2008 2.26 0.76 1.52 2.06 2.98 2009 2.24 0.80 1.49 2.03 2.93 2010 2.24 0.83 1.49 2.02 2.93 2011 2.21 0.85 1.46 1.99 2.81 2012 2.17 0.80 1.42 1.94 2.75 2013 2.16 0.83 1.44 1.92 2.68 2014 2.16 0.81 1.42 1.87 2.66 2015 2.14 0.80 1.46 1.85 2.63
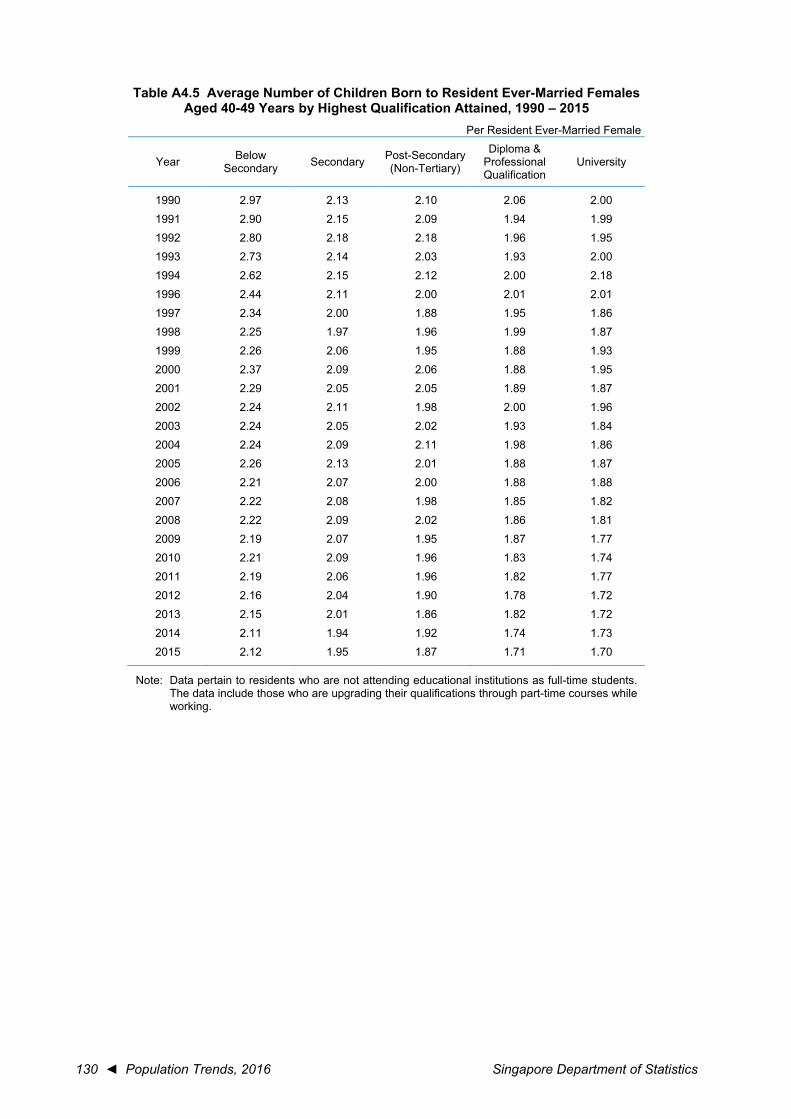
130 ◄ Population Trends, 2016 Singapore Department of Statistics
Table A4.5 Average Number of Children Born to Resident Ever-Married Females Aged 40-49 Years by Highest Qualification Attained, 1990 – 2015
Per Resident Ever-Married Female
Year Below Secondary Secondary Post-Secondary
(Non-Tertiary)
Diploma & Professional Qualification
University
1990 2.97 2.13 2.10 2.06 2.00 1991 2.90 2.15 2.09 1.94 1.99 1992 2.80 2.18 2.18 1.96 1.95 1993 2.73 2.14 2.03 1.93 2.00 1994 2.62 2.15 2.12 2.00 2.18 1996 2.44 2.11 2.00 2.01 2.01 1997 2.34 2.00 1.88 1.95 1.86 1998 2.25 1.97 1.96 1.99 1.87 1999 2.26 2.06 1.95 1.88 1.93 2000 2.37 2.09 2.06 1.88 1.95 2001 2.29 2.05 2.05 1.89 1.87 2002 2.24 2.11 1.98 2.00 1.96 2003 2.24 2.05 2.02 1.93 1.84 2004 2.24 2.09 2.11 1.98 1.86 2005 2.26 2.13 2.01 1.88 1.87 2006 2.21 2.07 2.00 1.88 1.88 2007 2.22 2.08 1.98 1.85 1.82
2008 2.22 2.09 2.02 1.86 1.81 2009 2.19 2.07 1.95 1.87 1.77 2010 2.21 2.09 1.96 1.83 1.74 2011 2.19 2.06 1.96 1.82 1.77 2012 2.16 2.04 1.90 1.78 1.72 2013 2.15 2.01 1.86 1.82 1.72 2014 2.11 1.94 1.92 1.74 1.73 2015 2.12 1.95 1.87 1.71 1.70
Note: Data pertain to residents who are not attending educational institutions as full-time students. The data include those who are upgrading their qualifications through part-time courses while working.

Singapore Department of Statistics Population Trends, 2016 ► 131
Table A5.1 Deaths and Death Rates, 1980 – 2015
Year Total Deaths
Resident Crude Death Rate
Resident Age-
Standardised Death Rate1
Resident Infant
Mortality Rate
Resident Neonatal Mortality Rate2,3
Perinatal Mortality
Rate4
Maternal Mortality
Rate5
Resident Under-5 Mortality Rate6
Total Males Females
(Per 1,000 Residents) (Per 1,000 Resident Live-Births)
(Per 1,000 Live-Births
& Still-Births)
(Per 100,000 Live-Births
& Still-Births)
(Per 1,000 Resident Live-Births)
1980 12,505 4.9 7.5 8.0 8.9 13.4 4.8 11.6 12.1 11.1 1985 13,348 4.9 6.7 7.6 7.0 10.8 4.7 8.2 8.7 7.6 1990 13,891 4.7 5.9 6.6 4.7 7.3 1.9 7.5 7.9 7.1 1991 13,876 4.6 5.7 5.4 3.5 6.4 4.1 6.7 7.1 6.1 1992 14,337 4.7 5.7 4.8 3.0 5.7 4.0 6.1 6.6 5.6 1993 14,461 4.6 5.5 4.7 3.0 5.5 7.9 5.8 6.1 5.4 1994 14,946 4.7 5.5 4.1 2.4 5.1 6.0 5.3 5.8 4.8 1995 15,569 4.8 5.5 3.8 2.0 4.3 4.1 5.0 5.4 4.6 1996 15,590 4.7 5.4 3.6 2.2 4.5 4.1 4.7 5.3 4.0 1997 15,305 4.5 5.1 3.6 2.2 4.4 4.2 4.7 5.1 4.3 1998 15,657 4.6 5.0 4.1 2.4 4.9 13.7 4.5 4.8 4.1 1999 15,516 4.5 4.9 3.3 1.9 4.2 9.2 4.4 4.5 4.4 2000 15,693 4.5 4.8 2.5 1.5 4.3 17.0 3.8 3.9 3.6 2001 15,367 4.3 4.5 2.2 1.1 3.5 9.6 3.5 3.8 3.1 2002 15,820 4.4 4.4 2.9 1.6 3.9 12.2 3.4 3.8 3.0 2003 16,036 4.5 4.5 2.5 1.6 3.6 5.3 3.2 3.6 2.7
2004 15,860 4.4 4.2 2.0 1.1 3.8 5.4 3.0 3.3 2.6 2005 16,215 4.4 4.1 2.1 1.3 3.8 13.3 2.9 3.2 2.6 2006 16,393 4.4 4.0 2.6 1.7 3.8 10.4 2.9 3.2 2.5 2007 17,140 4.5 3.9 2.1 1.2 3.1 7.6 2.9 3.2 2.5 2008 17,222 4.4 3.8 2.1 1.3 3.1 7.5 2.7 3.1 2.3 2009 17,101 4.3 3.6 2.2 1.3 3.2 - 2.8 3.1 2.5 2010 17,610 4.4 3.5 2.0 1.1 3.5 2.6 2.9 3.2 2.5 2011 18,027 4.5 3.4 2.0 1.3 3.9 7.5 2.9 3.1 2.6 2012 18,481 4.5 3.3 1.8 1.1 3.6 2.3 2.7 2.9 2.5 2013 18,938 4.6 3.3 2.0 1.1 2.8 2.5 2.6 2.7 2.5 2014 19,393 4.7 3.2 1.8 1.1 2.9 2.4 2.5 2.8 2.3 2015 19,862 4.8 3.1 1.7 0.8 2.8 7.1 2.4 P 2.8 P 1.9 P
1 The Singapore resident population as at June 2003 is used as the standard population which is chosen to fix the age structure to eliminate its effect on mortality trends.
2 Prior to 1990, data refer to total population. 3 Refers to the number of deaths of persons under 28 days of age per thousand live-births. 4 Refers to the number of still-births and deaths of persons under 7 days of age per thousand live-births and still-births. 5 Refers to the number of maternal deaths (i.e. deaths of mothers) per hundred thousand live-births and still-births. 6 Refers to the probability of a new-born baby in a specified reference period dying before reaching the age of 5, if subject to
age-specific mortality rates of that reference period. This indicator is derived from a life table and expressed as the number of deaths per thousand live-births.

132 ◄ P
opulation Trends, 2016 S
ingapore Departm
ent of Statistics
Table A5.2 Resident Age-Sex Specific Death Rate, 1980 – 2015 Per Thousand Residents
Age Group (Years) 1980 1985 1990 1991 1992 1993 1994 1995 1996 1997 1998 1999
Total
Total 4.9 4.9 4.7 4.6 4.7 4.6 4.7 4.8 4.7 4.5 4.6 4.5 Under 11 8.0 7.6 6.6 5.4 4.8 4.7 4.1 3.8 3.6 3.6 4.1 3.3
1 – 4 0.6 0.3 0.3 0.3 0.3 0.3 0.3 0.3 0.3 0.2 0.3 0.2 5 – 9 0.2 0.2 0.2 0.2 0.2 0.2 0.1 0.2 0.1 0.1 0.1 0.1
10 – 14 0.3 0.2 0.2 0.2 0.3 0.2 0.2 0.2 0.2 0.2 0.2 0.2 15 – 19 0.6 0.6 0.3 0.4 0.4 0.4 0.4 0.4 0.4 0.3 0.3 0.3 20 – 24 0.9 0.6 0.6 0.6 0.6 0.5 0.5 0.5 0.5 0.6 0.4 0.5 25 – 29 0.9 0.8 0.6 0.6 0.6 0.5 0.5 0.4 0.6 0.5 0.5 0.4 30 – 34 1.1 1.0 0.8 0.7 0.7 0.6 0.6 0.7 0.6 0.6 0.6 0.6 35 – 39 1.3 1.4 1.2 1.0 1.0 0.9 1.1 1.0 1.0 0.9 0.9 0.8 40 – 44 2.3 1.9 1.8 1.7 1.7 1.7 1.6 1.5 1.5 1.5 1.4 1.3 45 – 49 4.5 3.6 3.2 2.7 3.0 2.7 2.6 2.8 2.5 2.2 2.3 2.2 50 – 54 7.4 6.6 5.5 5.2 5.0 5.0 4.8 4.6 4.7 4.2 4.1 3.7
55 – 59 12.8 11.9 9.7 9.5 8.6 8.6 8.5 8.4 7.6 7.2 7.1 6.5 60 – 64 20.8 18.7 15.8 15.8 15.4 14.2 14.2 13.8 13.6 12.9 12.8 12.0 65 – 69 33.4 28.5 24.2 24.0 24.3 23.2 23.6 22.9 22.1 21.4 21.4 19.8 70 – 74 48.3 46.4 38.4 38.2 36.7 36.7 38.1 38.0 35.6 33.2 32.8 30.0 75 – 79 74.1 56.2 55.3 56.9 58.9 56.9 59.0 57.8 55.1 53.2 52.9 80 – 84 109.0 86.72 86.0 84.0 82.9 77.5 82.9 82.8 84.5 82.7 83.7 79.4
85 & Over 165.0 133.6 128.5 133.9 132.2 125.7 140.0 132.8 124.9 130.8 139.7
1 Refers to Resident Infant Mortality Rate (per 1,000 resident live-births). 2 Data refer to age group 75 years & over.
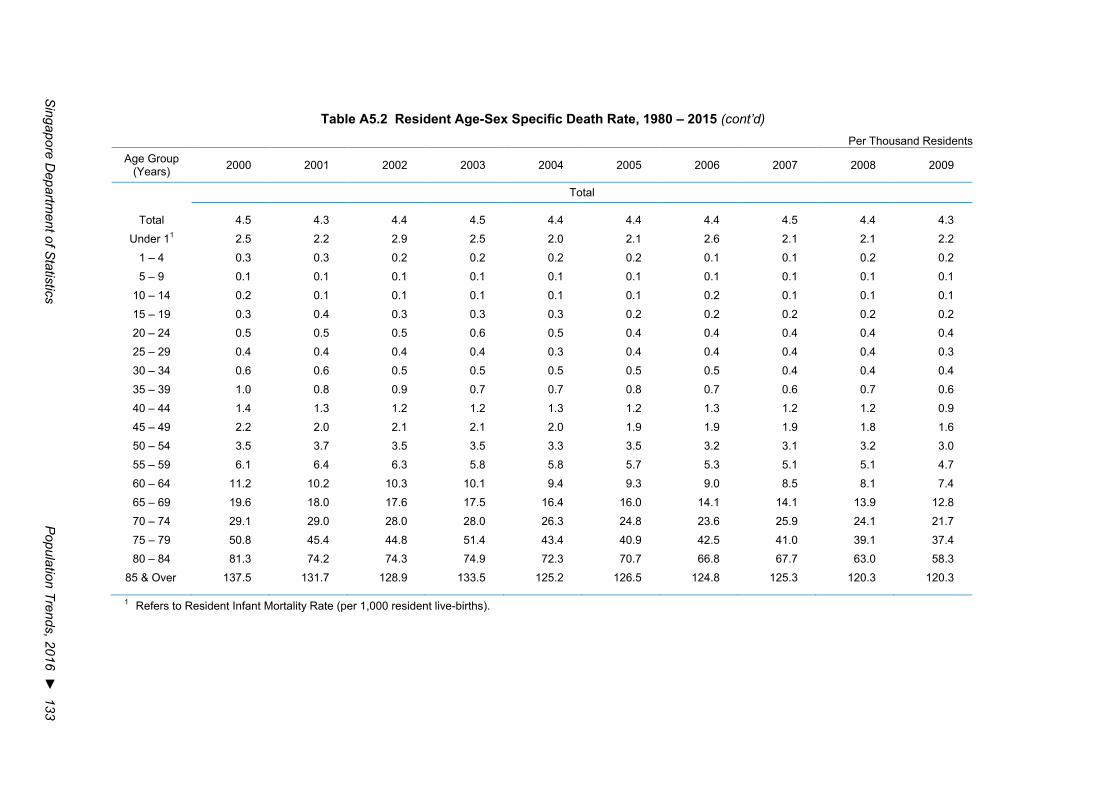
Singapore D
epartment of S
tatistics P
opulation Trends, 2016 ► 133
Table A5.2 Resident Age-Sex Specific Death Rate, 1980 – 2015 (cont’d) Per Thousand Residents
Age Group (Years) 2000 2001 2002 2003 2004 2005 2006 2007 2008 2009
Total
Total 4.5 4.3 4.4 4.5 4.4 4.4 4.4 4.5 4.4 4.3 Under 11 2.5 2.2 2.9 2.5 2.0 2.1 2.6 2.1 2.1 2.2
1 – 4 0.3 0.3 0.2 0.2 0.2 0.2 0.1 0.1 0.2 0.2 5 – 9 0.1 0.1 0.1 0.1 0.1 0.1 0.1 0.1 0.1 0.1
10 – 14 0.2 0.1 0.1 0.1 0.1 0.1 0.2 0.1 0.1 0.1 15 – 19 0.3 0.4 0.3 0.3 0.3 0.2 0.2 0.2 0.2 0.2 20 – 24 0.5 0.5 0.5 0.6 0.5 0.4 0.4 0.4 0.4 0.4 25 – 29 0.4 0.4 0.4 0.4 0.3 0.4 0.4 0.4 0.4 0.3 30 – 34 0.6 0.6 0.5 0.5 0.5 0.5 0.5 0.4 0.4 0.4 35 – 39 1.0 0.8 0.9 0.7 0.7 0.8 0.7 0.6 0.7 0.6 40 – 44 1.4 1.3 1.2 1.2 1.3 1.2 1.3 1.2 1.2 0.9 45 – 49 2.2 2.0 2.1 2.1 2.0 1.9 1.9 1.9 1.8 1.6 50 – 54 3.5 3.7 3.5 3.5 3.3 3.5 3.2 3.1 3.2 3.0 55 – 59 6.1 6.4 6.3 5.8 5.8 5.7 5.3 5.1 5.1 4.7
60 – 64 11.2 10.2 10.3 10.1 9.4 9.3 9.0 8.5 8.1 7.4 65 – 69 19.6 18.0 17.6 17.5 16.4 16.0 14.1 14.1 13.9 12.8 70 – 74 29.1 29.0 28.0 28.0 26.3 24.8 23.6 25.9 24.1 21.7 75 – 79 50.8 45.4 44.8 51.4 43.4 40.9 42.5 41.0 39.1 37.4 80 – 84 81.3 74.2 74.3 74.9 72.3 70.7 66.8 67.7 63.0 58.3
85 & Over 137.5 131.7 128.9 133.5 125.2 126.5 124.8 125.3 120.3 120.3
1 Refers to Resident Infant Mortality Rate (per 1,000 resident live-births).
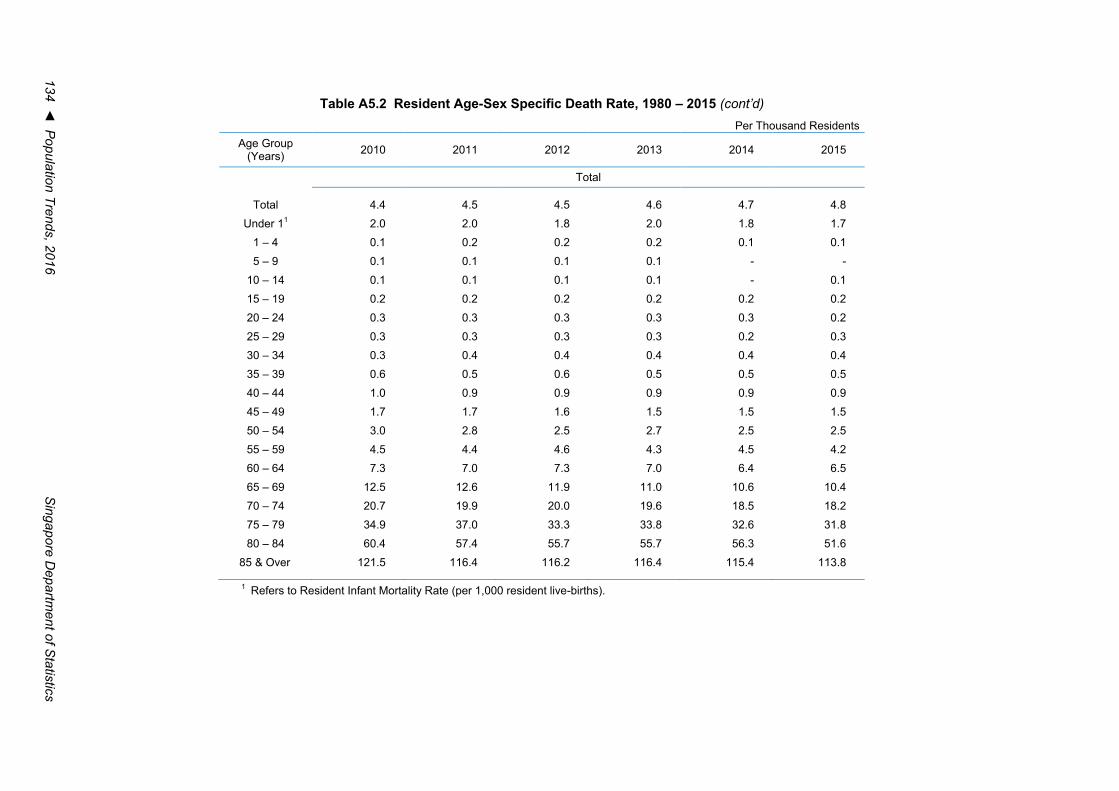
134 ◄ P
opulation Trends, 2016 S
ingapore Departm
ent of Statistics
Table A5.2 Resident Age-Sex Specific Death Rate, 1980 – 2015 (cont’d) Per Thousand Residents
Age Group (Years) 2010 2011 2012 2013 2014 2015
Total
Total 4.4 4.5 4.5 4.6 4.7 4.8 Under 11 2.0 2.0 1.8 2.0 1.8 1.7
1 – 4 0.1 0.2 0.2 0.2 0.1 0.1 5 – 9 0.1 0.1 0.1 0.1 - -
10 – 14 0.1 0.1 0.1 0.1 - 0.1 15 – 19 0.2 0.2 0.2 0.2 0.2 0.2 20 – 24 0.3 0.3 0.3 0.3 0.3 0.2 25 – 29 0.3 0.3 0.3 0.3 0.2 0.3 30 – 34 0.3 0.4 0.4 0.4 0.4 0.4 35 – 39 0.6 0.5 0.6 0.5 0.5 0.5 40 – 44 1.0 0.9 0.9 0.9 0.9 0.9 45 – 49 1.7 1.7 1.6 1.5 1.5 1.5 50 – 54 3.0 2.8 2.5 2.7 2.5 2.5 55 – 59 4.5 4.4 4.6 4.3 4.5 4.2 60 – 64 7.3 7.0 7.3 7.0 6.4 6.5
65 – 69 12.5 12.6 11.9 11.0 10.6 10.4 70 – 74 20.7 19.9 20.0 19.6 18.5 18.2 75 – 79 34.9 37.0 33.3 33.8 32.6 31.8 80 – 84 60.4 57.4 55.7 55.7 56.3 51.6
85 & Over 121.5 116.4 116.2 116.4 115.4 113.8
1 Refers to Resident Infant Mortality Rate (per 1,000 resident live-births).
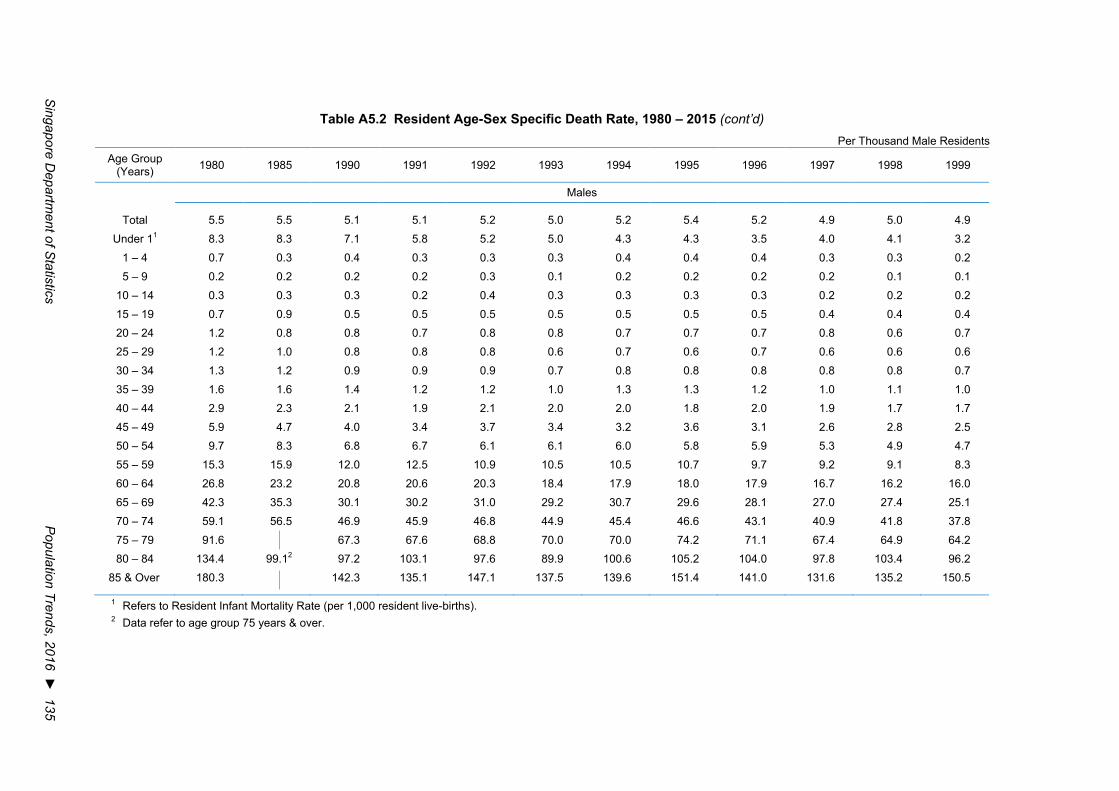
Singapore D
epartment of S
tatistics P
opulation Trends, 2016 ► 135
Table A5.2 Resident Age-Sex Specific Death Rate, 1980 – 2015 (cont’d) Per Thousand Male Residents
Age Group (Years) 1980 1985 1990 1991 1992 1993 1994 1995 1996 1997 1998 1999
Males
Total 5.5 5.5 5.1 5.1 5.2 5.0 5.2 5.4 5.2 4.9 5.0 4.9 Under 11 8.3 8.3 7.1 5.8 5.2 5.0 4.3 4.3 3.5 4.0 4.1 3.2
1 – 4 0.7 0.3 0.4 0.3 0.3 0.3 0.4 0.4 0.4 0.3 0.3 0.2 5 – 9 0.2 0.2 0.2 0.2 0.3 0.1 0.2 0.2 0.2 0.2 0.1 0.1
10 – 14 0.3 0.3 0.3 0.2 0.4 0.3 0.3 0.3 0.3 0.2 0.2 0.2 15 – 19 0.7 0.9 0.5 0.5 0.5 0.5 0.5 0.5 0.5 0.4 0.4 0.4 20 – 24 1.2 0.8 0.8 0.7 0.8 0.8 0.7 0.7 0.7 0.8 0.6 0.7 25 – 29 1.2 1.0 0.8 0.8 0.8 0.6 0.7 0.6 0.7 0.6 0.6 0.6 30 – 34 1.3 1.2 0.9 0.9 0.9 0.7 0.8 0.8 0.8 0.8 0.8 0.7 35 – 39 1.6 1.6 1.4 1.2 1.2 1.0 1.3 1.3 1.2 1.0 1.1 1.0 40 – 44 2.9 2.3 2.1 1.9 2.1 2.0 2.0 1.8 2.0 1.9 1.7 1.7 45 – 49 5.9 4.7 4.0 3.4 3.7 3.4 3.2 3.6 3.1 2.6 2.8 2.5 50 – 54 9.7 8.3 6.8 6.7 6.1 6.1 6.0 5.8 5.9 5.3 4.9 4.7 55 – 59 15.3 15.9 12.0 12.5 10.9 10.5 10.5 10.7 9.7 9.2 9.1 8.3
60 – 64 26.8 23.2 20.8 20.6 20.3 18.4 17.9 18.0 17.9 16.7 16.2 16.0 65 – 69 42.3 35.3 30.1 30.2 31.0 29.2 30.7 29.6 28.1 27.0 27.4 25.1 70 – 74 59.1 56.5 46.9 45.9 46.8 44.9 45.4 46.6 43.1 40.9 41.8 37.8 75 – 79 91.6 67.3 67.6 68.8 70.0 70.0 74.2 71.1 67.4 64.9 64.2 80 – 84 134.4 99.12 97.2 103.1 97.6 89.9 100.6 105.2 104.0 97.8 103.4 96.2
85 & Over 180.3 142.3 135.1 147.1 137.5 139.6 151.4 141.0 131.6 135.2 150.5
1 Refers to Resident Infant Mortality Rate (per 1,000 resident live-births). 2 Data refer to age group 75 years & over.
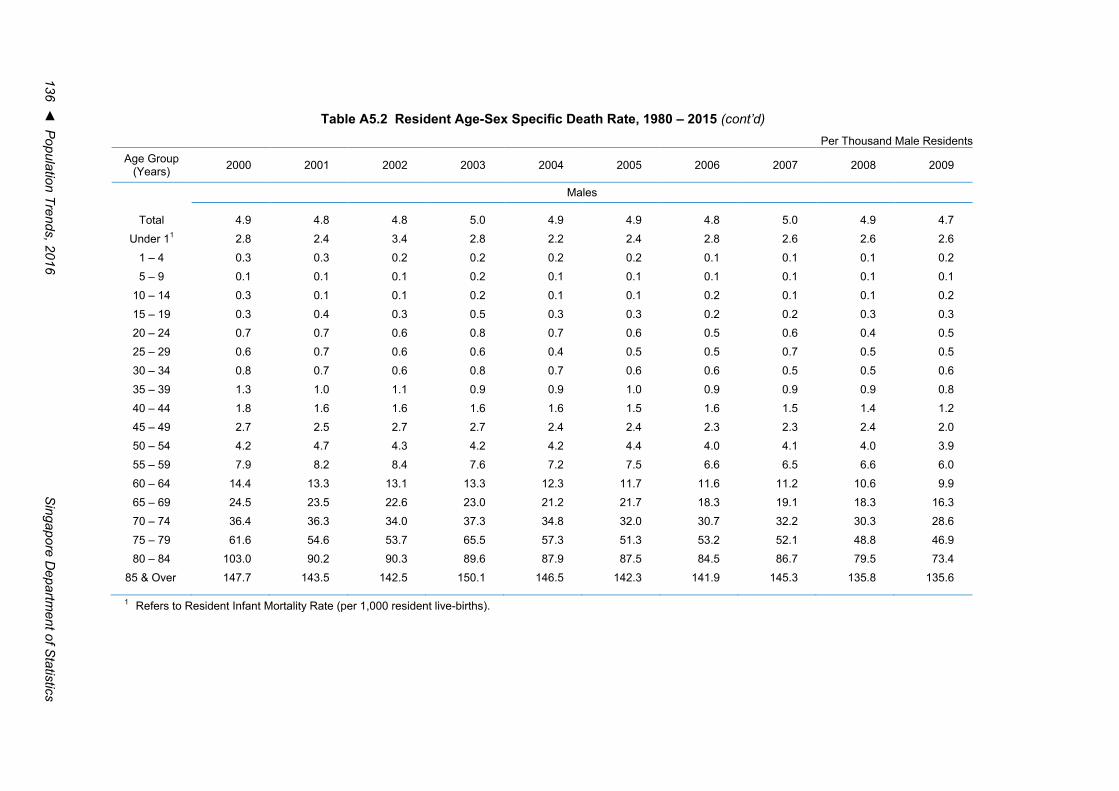
136 ◄ P
opulation Trends, 2016 S
ingapore Departm
ent of Statistics
Table A5.2 Resident Age-Sex Specific Death Rate, 1980 – 2015 (cont’d) Per Thousand Male Residents
Age Group (Years) 2000 2001 2002 2003 2004 2005 2006 2007 2008 2009
Males
Total 4.9 4.8 4.8 5.0 4.9 4.9 4.8 5.0 4.9 4.7 Under 11 2.8 2.4 3.4 2.8 2.2 2.4 2.8 2.6 2.6 2.6
1 – 4 0.3 0.3 0.2 0.2 0.2 0.2 0.1 0.1 0.1 0.2 5 – 9 0.1 0.1 0.1 0.2 0.1 0.1 0.1 0.1 0.1 0.1
10 – 14 0.3 0.1 0.1 0.2 0.1 0.1 0.2 0.1 0.1 0.2 15 – 19 0.3 0.4 0.3 0.5 0.3 0.3 0.2 0.2 0.3 0.3 20 – 24 0.7 0.7 0.6 0.8 0.7 0.6 0.5 0.6 0.4 0.5 25 – 29 0.6 0.7 0.6 0.6 0.4 0.5 0.5 0.7 0.5 0.5 30 – 34 0.8 0.7 0.6 0.8 0.7 0.6 0.6 0.5 0.5 0.6 35 – 39 1.3 1.0 1.1 0.9 0.9 1.0 0.9 0.9 0.9 0.8 40 – 44 1.8 1.6 1.6 1.6 1.6 1.5 1.6 1.5 1.4 1.2 45 – 49 2.7 2.5 2.7 2.7 2.4 2.4 2.3 2.3 2.4 2.0 50 – 54 4.2 4.7 4.3 4.2 4.2 4.4 4.0 4.1 4.0 3.9 55 – 59 7.9 8.2 8.4 7.6 7.2 7.5 6.6 6.5 6.6 6.0
60 – 64 14.4 13.3 13.1 13.3 12.3 11.7 11.6 11.2 10.6 9.9 65 – 69 24.5 23.5 22.6 23.0 21.2 21.7 18.3 19.1 18.3 16.3 70 – 74 36.4 36.3 34.0 37.3 34.8 32.0 30.7 32.2 30.3 28.6 75 – 79 61.6 54.6 53.7 65.5 57.3 51.3 53.2 52.1 48.8 46.9 80 – 84 103.0 90.2 90.3 89.6 87.9 87.5 84.5 86.7 79.5 73.4
85 & Over 147.7 143.5 142.5 150.1 146.5 142.3 141.9 145.3 135.8 135.6
1 Refers to Resident Infant Mortality Rate (per 1,000 resident live-births).
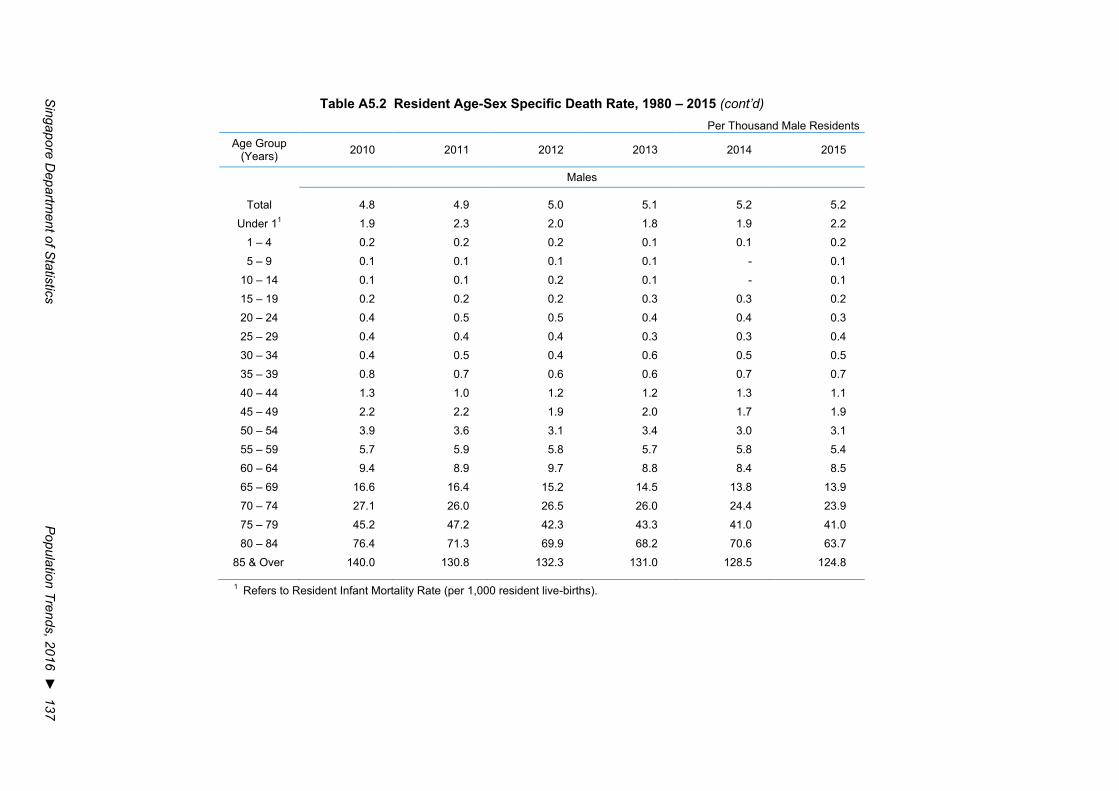
Singapore D
epartment of S
tatistics P
opulation Trends, 2016 ► 137
Table A5.2 Resident Age-Sex Specific Death Rate, 1980 – 2015 (cont’d) Per Thousand Male Residents
Age Group (Years) 2010 2011 2012 2013 2014 2015
Males
Total 4.8 4.9 5.0 5.1 5.2 5.2 Under 11 1.9 2.3 2.0 1.8 1.9 2.2
1 – 4 0.2 0.2 0.2 0.1 0.1 0.2 5 – 9 0.1 0.1 0.1 0.1 - 0.1
10 – 14 0.1 0.1 0.2 0.1 - 0.1 15 – 19 0.2 0.2 0.2 0.3 0.3 0.2 20 – 24 0.4 0.5 0.5 0.4 0.4 0.3 25 – 29 0.4 0.4 0.4 0.3 0.3 0.4 30 – 34 0.4 0.5 0.4 0.6 0.5 0.5 35 – 39 0.8 0.7 0.6 0.6 0.7 0.7 40 – 44 1.3 1.0 1.2 1.2 1.3 1.1 45 – 49 2.2 2.2 1.9 2.0 1.7 1.9 50 – 54 3.9 3.6 3.1 3.4 3.0 3.1 55 – 59 5.7 5.9 5.8 5.7 5.8 5.4 60 – 64 9.4 8.9 9.7 8.8 8.4 8.5
65 – 69 16.6 16.4 15.2 14.5 13.8 13.9 70 – 74 27.1 26.0 26.5 26.0 24.4 23.9 75 – 79 45.2 47.2 42.3 43.3 41.0 41.0 80 – 84 76.4 71.3 69.9 68.2 70.6 63.7
85 & Over 140.0 130.8 132.3 131.0 128.5 124.8
1 Refers to Resident Infant Mortality Rate (per 1,000 resident live-births).
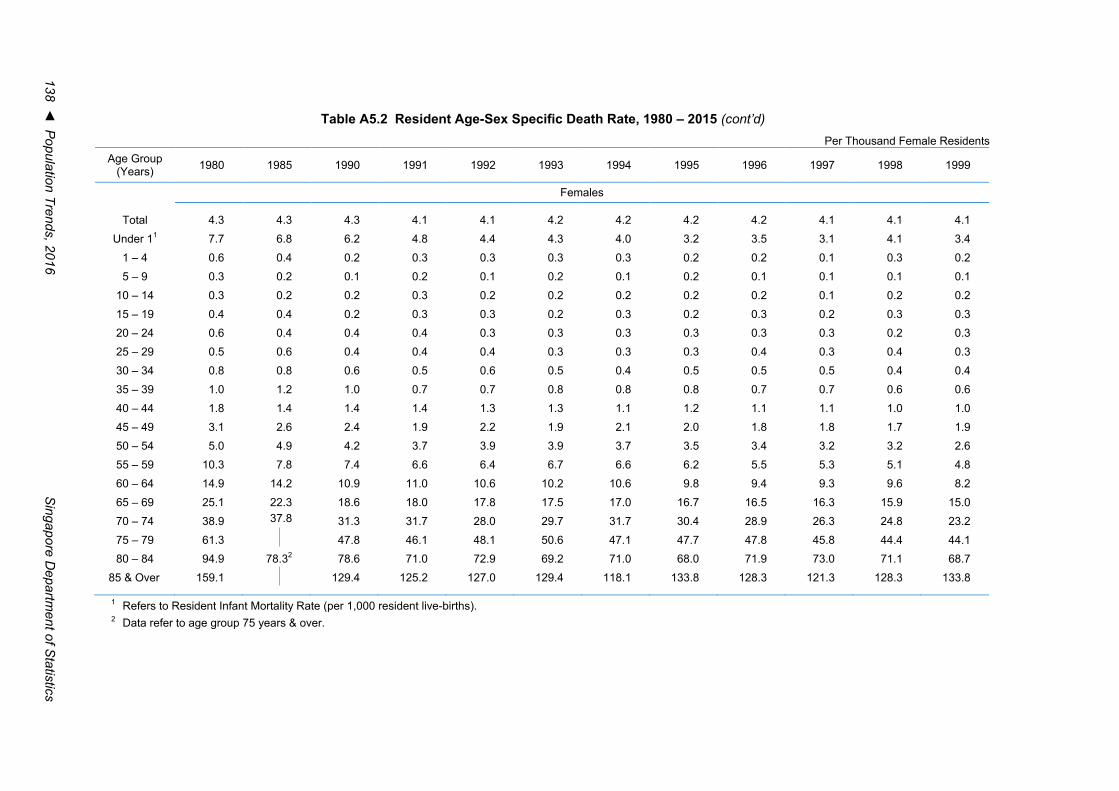
138 ◄ P
opulation Trends, 2016 S
ingapore Departm
ent of Statistics
Table A5.2 Resident Age-Sex Specific Death Rate, 1980 – 2015 (cont’d) Per Thousand Female Residents
Age Group (Years) 1980 1985 1990 1991 1992 1993 1994 1995 1996 1997 1998 1999
Females
Total 4.3 4.3 4.3 4.1 4.1 4.2 4.2 4.2 4.2 4.1 4.1 4.1 Under 11 7.7 6.8 6.2 4.8 4.4 4.3 4.0 3.2 3.5 3.1 4.1 3.4
1 – 4 0.6 0.4 0.2 0.3 0.3 0.3 0.3 0.2 0.2 0.1 0.3 0.2 5 – 9 0.3 0.2 0.1 0.2 0.1 0.2 0.1 0.2 0.1 0.1 0.1 0.1
10 – 14 0.3 0.2 0.2 0.3 0.2 0.2 0.2 0.2 0.2 0.1 0.2 0.2 15 – 19 0.4 0.4 0.2 0.3 0.3 0.2 0.3 0.2 0.3 0.2 0.3 0.3 20 – 24 0.6 0.4 0.4 0.4 0.3 0.3 0.3 0.3 0.3 0.3 0.2 0.3 25 – 29 0.5 0.6 0.4 0.4 0.4 0.3 0.3 0.3 0.4 0.3 0.4 0.3 30 – 34 0.8 0.8 0.6 0.5 0.6 0.5 0.4 0.5 0.5 0.5 0.4 0.4 35 – 39 1.0 1.2 1.0 0.7 0.7 0.8 0.8 0.8 0.7 0.7 0.6 0.6 40 – 44 1.8 1.4 1.4 1.4 1.3 1.3 1.1 1.2 1.1 1.1 1.0 1.0 45 – 49 3.1 2.6 2.4 1.9 2.2 1.9 2.1 2.0 1.8 1.8 1.7 1.9 50 – 54 5.0 4.9 4.2 3.7 3.9 3.9 3.7 3.5 3.4 3.2 3.2 2.6 55 – 59 10.3 7.8 7.4 6.6 6.4 6.7 6.6 6.2 5.5 5.3 5.1 4.8
60 – 64 14.9 14.2 10.9 11.0 10.6 10.2 10.6 9.8 9.4 9.3 9.6 8.2 65 – 69 25.1 22.3 18.6 18.0 17.8 17.5 17.0 16.7 16.5 16.3 15.9 15.0 70 – 74 38.9 37.8 31.3 31.7 28.0 29.7 31.7 30.4 28.9 26.3 24.8 23.2 75 – 79 61.3 47.8 46.1 48.1 50.6 47.1 47.7 47.8 45.8 44.4 44.1 80 – 84 94.9 78.32 78.6 71.0 72.9 69.2 71.0 68.0 71.9 73.0 71.1 68.7
85 & Over 159.1 129.4 125.2 127.0 129.4 118.1 133.8 128.3 121.3 128.3 133.8
1 Refers to Resident Infant Mortality Rate (per 1,000 resident live-births). 2 Data refer to age group 75 years & over.
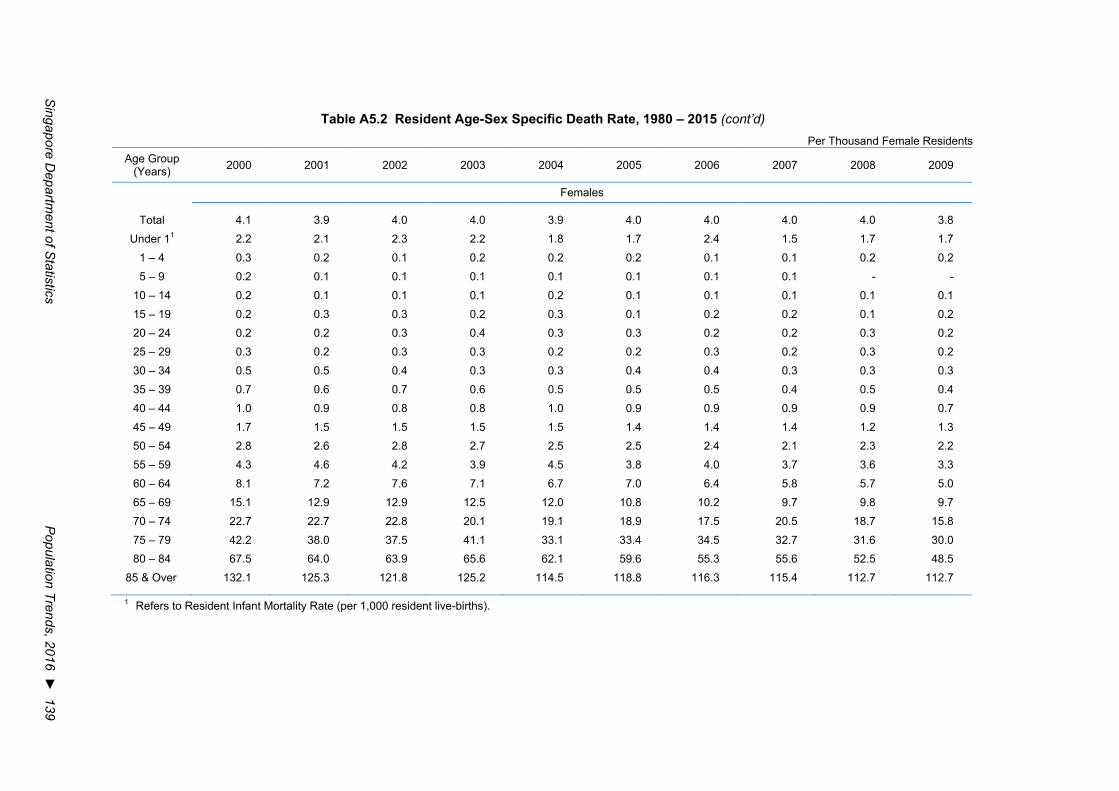
Singapore D
epartment of S
tatistics P
opulation Trends, 2016 ► 139
Table A5.2 Resident Age-Sex Specific Death Rate, 1980 – 2015 (cont’d) Per Thousand Female Residents
Age Group (Years) 2000 2001 2002 2003 2004 2005 2006 2007 2008 2009
Females
Total 4.1 3.9 4.0 4.0 3.9 4.0 4.0 4.0 4.0 3.8 Under 11 2.2 2.1 2.3 2.2 1.8 1.7 2.4 1.5 1.7 1.7
1 – 4 0.3 0.2 0.1 0.2 0.2 0.2 0.1 0.1 0.2 0.2 5 – 9 0.2 0.1 0.1 0.1 0.1 0.1 0.1 0.1 - -
10 – 14 0.2 0.1 0.1 0.1 0.2 0.1 0.1 0.1 0.1 0.1 15 – 19 0.2 0.3 0.3 0.2 0.3 0.1 0.2 0.2 0.1 0.2 20 – 24 0.2 0.2 0.3 0.4 0.3 0.3 0.2 0.2 0.3 0.2 25 – 29 0.3 0.2 0.3 0.3 0.2 0.2 0.3 0.2 0.3 0.2 30 – 34 0.5 0.5 0.4 0.3 0.3 0.4 0.4 0.3 0.3 0.3 35 – 39 0.7 0.6 0.7 0.6 0.5 0.5 0.5 0.4 0.5 0.4 40 – 44 1.0 0.9 0.8 0.8 1.0 0.9 0.9 0.9 0.9 0.7 45 – 49 1.7 1.5 1.5 1.5 1.5 1.4 1.4 1.4 1.2 1.3 50 – 54 2.8 2.6 2.8 2.7 2.5 2.5 2.4 2.1 2.3 2.2 55 – 59 4.3 4.6 4.2 3.9 4.5 3.8 4.0 3.7 3.6 3.3
60 – 64 8.1 7.2 7.6 7.1 6.7 7.0 6.4 5.8 5.7 5.0 65 – 69 15.1 12.9 12.9 12.5 12.0 10.8 10.2 9.7 9.8 9.7 70 – 74 22.7 22.7 22.8 20.1 19.1 18.9 17.5 20.5 18.7 15.8 75 – 79 42.2 38.0 37.5 41.1 33.1 33.4 34.5 32.7 31.6 30.0 80 – 84 67.5 64.0 63.9 65.6 62.1 59.6 55.3 55.6 52.5 48.5
85 & Over 132.1 125.3 121.8 125.2 114.5 118.8 116.3 115.4 112.7 112.7
1 Refers to Resident Infant Mortality Rate (per 1,000 resident live-births).
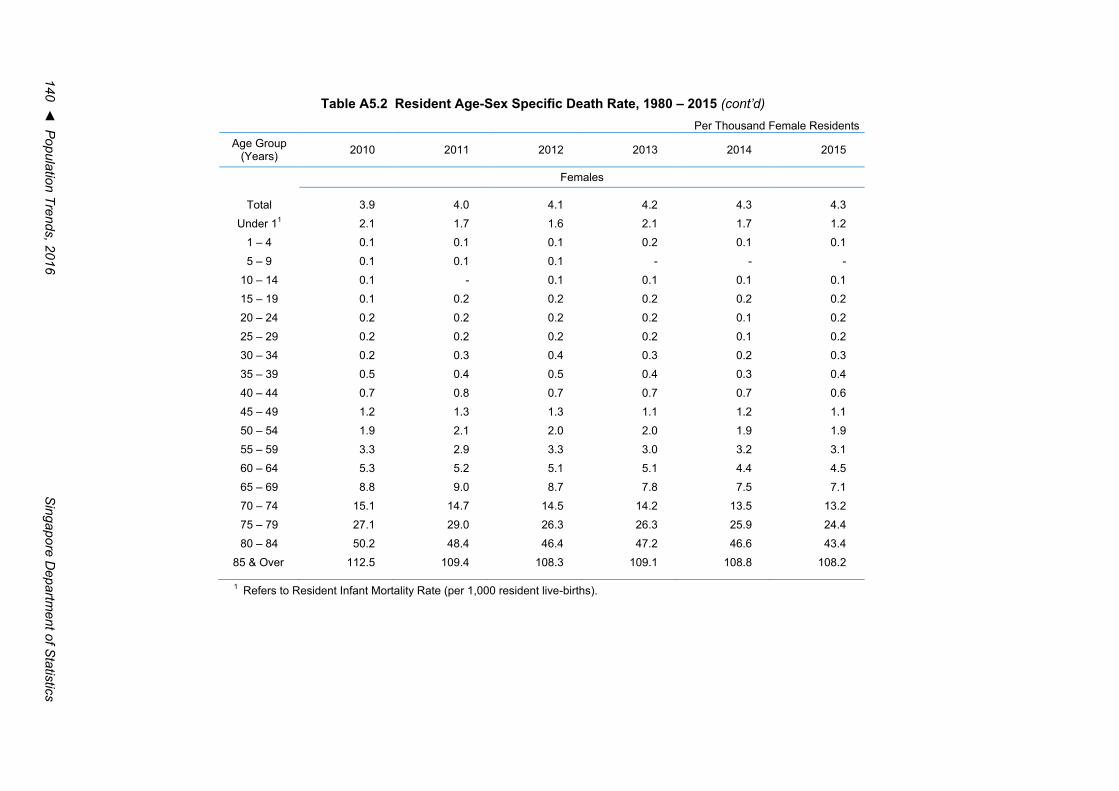
140 ◄ P
opulation Trends, 2016 S
ingapore Departm
ent of Statistics
Table A5.2 Resident Age-Sex Specific Death Rate, 1980 – 2015 (cont’d) Per Thousand Female Residents
Age Group (Years) 2010 2011 2012 2013 2014 2015
Females
Total 3.9 4.0 4.1 4.2 4.3 4.3 Under 11 2.1 1.7 1.6 2.1 1.7 1.2
1 – 4 0.1 0.1 0.1 0.2 0.1 0.1 5 – 9 0.1 0.1 0.1 - - -
10 – 14 0.1 - 0.1 0.1 0.1 0.1 15 – 19 0.1 0.2 0.2 0.2 0.2 0.2 20 – 24 0.2 0.2 0.2 0.2 0.1 0.2 25 – 29 0.2 0.2 0.2 0.2 0.1 0.2 30 – 34 0.2 0.3 0.4 0.3 0.2 0.3 35 – 39 0.5 0.4 0.5 0.4 0.3 0.4 40 – 44 0.7 0.8 0.7 0.7 0.7 0.6 45 – 49 1.2 1.3 1.3 1.1 1.2 1.1 50 – 54 1.9 2.1 2.0 2.0 1.9 1.9 55 – 59 3.3 2.9 3.3 3.0 3.2 3.1 60 – 64 5.3 5.2 5.1 5.1 4.4 4.5
65 – 69 8.8 9.0 8.7 7.8 7.5 7.1 70 – 74 15.1 14.7 14.5 14.2 13.5 13.2 75 – 79 27.1 29.0 26.3 26.3 25.9 24.4 80 – 84 50.2 48.4 46.4 47.2 46.6 43.4
85 & Over 112.5 109.4 108.3 109.1 108.8 108.2
1 Refers to Resident Infant Mortality Rate (per 1,000 resident live-births).

Singapore Department of Statistics Population Trends 2016 ► 141
Table A5.3 Life Expectancy of Singapore Residents at Birth and at Age 65 Years by Sex, 1980 – 2015
Years
Year At Birth At Age 65 Years
Persons Males Females Persons Males Females
1980 72.1 69.8 74.7 14.0 12.6 15.4 1985 73.9 71.5 76.4 14.9 13.6 16.2 1990 75.3 73.1 77.6 15.7 14.5 16.9 1991 75.6 73.5 77.9 15.9 14.6 17.1 1992 75.9 73.8 78.2 15.9 14.7 17.2 1993 76.1 73.9 78.3 15.9 14.6 17.2 1994 76.2 74.1 78.4 15.9 14.6 17.2 1995 76.3 74.1 78.6 16.0 14.6 17.2 1996 76.6 74.4 78.9 16.1 14.7 17.4 1997 76.9 74.8 79.1 16.3 14.9 17.5 1998 77.3 75.3 79.4 16.5 15.2 17.7 1999 77.6 75.6 79.6 16.6 15.3 17.9 2000 78.0 76.0 80.0 16.9 15.6 18.1 2001 78.3 76.3 80.3 17.1 15.9 18.3 2002 78.6 76.6 80.6 17.3 16.1 18.5 2003 79.1 76.6 81.6 18.0 16.2 19.6 2004 79.6 77.1 82.0 18.4 16.5 20.0 2005 80.1 77.6 82.5 18.7 16.9 20.4 2006 80.3 77.8 82.6 18.9 17.1 20.4 2007 80.6 78.1 82.9 19.0 17.2 20.6 2008 80.9 78.4 83.3 19.3 17.5 20.8 2009 81.4 78.9 83.7 19.6 17.8 21.2 2010 81.7 79.2 84.0 19.8 18.0 21.4 2011 81.9 79.5 84.1 20.0 18.1 21.6 2012 82.1 79.8 84.3 20.2 18.4 21.7 2013 82.4 80.1 84.5 20.4 18.6 21.9 2014 82.6 80.3 84.8 20.6 18.8 22.1 2015p 82.7 80.4 84.9 20.6 18.9 22.1
ACKNOWLEDGEMENTS Cover images courtesy of Singapore Tourism Board

PROJECT TEAM
Senior Assistant Director Miss Koh Wee Ling
Assistant Directors Ms Kua Hui Shan
Mr Esmond Seah
Mr Tham Zheng Kang
Statistician Miss Pearl Lim
Managers Ms Seet Ming Lee
Ms Karin Huang
Mr Wong Kwok Wing
Corporate Support Officer Mr Ng Keng Chye

SINGAPORE DEPARTMENT OF STATISTICS INFORMATION DISSEMINATION SERVICES
Statistics Singapore Website
The Statistics Singapore Website was launched by the Singapore Department of Statistics (DOS) in January 1995. Internet users can access the website by connecting to:
http://www.singstat.gov.sg
Key Singapore statistics are available via the following sections: Statistics
which provides access to the latest statistical findings of DOS as well as statistics compiled by Research and Statistics Units (RSUs) in ministries and statutory boards.
Newswhich provides a listing of the news released by DOS and RSUs.
Publicationswhich presents the latest editions of DOS’ publications, papers and articles.
Browse by Themeswhich presents official statistics compiled by DOS and RSUs in the various ministries and statutory boards according to themes. Within each theme, relevant statistics and related press releases, publications and references are provided.
Statistical resources are available via: Publication and Papers
which lists the latest editions of publications released by DOS according to statistical domains at http://www.singstat.gov.sg/publications/publications-and-papers. All softcopy DOS publications are available for free downloading. Statistical tables of DOS publications in Excel format are also available.
Advance Release Calendarwhich provides a six months ahead advance release calendar of key statistical indicators.
The website also provides a convenient gateway to international statistical websites under the “Methodologies & Standards” section:
Guide to International Statisticswhich provides hyperlinks to international databases and classifications, as well as websites of international bodies and other national statistical offices.
IMF Dissemination Standards Bulletin Boardwhich provides metadata about Singapore’s key indicators in the real, fiscal, financial and external sectors, including dissemination practices and information about pre-release access of current indicators.
SingStat Express
SingStat Express is a personalised data delivery service which sends the latest press releases, notices of publication, newsletter, occasional and information papers to subscribers via email. SMS alert service is also available to local users. Subscription details are available from the Statistics Singapore Website (http://www.singstat.gov.sg/express).

SINGAPORE DEPARTMENT OF STATISTICS INFORMATION DISSEMINATION SERVICES (cont’d)
Really Simple Syndication
Really Simple Syndication (RSS) is an easy way to stay updated on the latest statistical news released via the Statistics Singapore Website. The SingStat RSS feed delivers statistical news highlights and hyperlinks to the source documents whenever the updates are posted. More information is available at http://www.singstat.gov.sg/services/really-simple-syndication-(rss).
SingStat Mobile App
SingStat Mobile App provides users with ready access to the latest key Singapore official statistics through their mobile devices while on the go. Users may visualise data for the latest periods with some 200 charts of commonly used statistics from 25 data categories. The app is available for downloading in iOS and Android devices. More information is available at http://www.singstat.gov.sg/services/singstat-mobile-app.
SingStat Table Builder
The SingStat Table Builder contains statistical data series on the Singapore economy and population for users to create customised data tables, plot graphs and charts and export them in different file formats. Explore data trends with the e-service at http://www.singstat.gov.sg/tablebuilder.
E-survey
The E-survey enables business organisations to complete and submit their survey forms through the internet. Using secured encryption protocols, the E-survey ensures that the information transmitted through the net is secured and protected. The system features online helps and validation checks to assist respondents in completing their survey forms. With the E-survey, respondents do away with the tedious paper work and manual tasks of mailing or faxing their survey returns to the Department.
Statistical Enquiries and Feedback
If you have any statistical enquiries or comment or suggestions on our statistical publications and electronic services, you are welcomed to:
Email us at [email protected]
Fax to us at (65) 6332-7689 Call us at 1800-3238118* (local callers)
(65) 6332-7738 (overseas callers)
* Calls from mobile telephone lines to 1800 local toll free number may be subject to mobile airtime chargesas imposed by the relevant mobile service provider.