Embed Size (px)
Citation preview
Singapore Department of Statistics Complete Life Tables 2017 - 2018 ► 1
Complete Life Tables for Singapore Resident Population, 2017-2018
ISSN 2591-7560
© Department of Statistics, Ministry of Trade & Industry, Republic of Singapore Reproducing or quoting any part of this publication is permitted, provided this
publication is accredited as the source. Please refer to the Statistics Singapore Website
Terms of Use (http://www.singstat.gov.sg/terms-of-use) for more details on the
conditions of use of this publication.
Statistical activities conducted by the Singapore Department of Statistics are
governed by the provisions of the Statistics Act (Cap. 317). The Act guarantees
the confidentiality of information collected from individuals and companies. It
spells out the legislative authority and responsibility of the Chief Statistician.
The Act is available in the Department’s Website (www.singstat.gov.sg).

Our Vision
National Statistical Service of Quality, Integrity and Expertise
Our Mission
We deliver Insightful Statistics and Trusted Statistical Services that
Empower Decision Making
Our Guiding Principles
Professionalism & Expertise
We adhere to professional ethics and develop statistical competency to produce quality statistics that comply with international concepts and best practices.
Relevance & Reliability
We produce statistics that users need and trust.
Accessibility We make our statistics readily available through user-friendly platforms.
Confidentiality We protect the confidentiality of information collected by us.
Timeliness We disseminate statistics at the earliest possible date while maintaining data quality.
Innovation We constantly seek ways to improve our processes, leveraging on new technology where feasible, to deliver better products and services to users.
Collaboration We engage users on data needs, data providers and respondents on supply of data, and undertake the role of national statistical coordination.
Effectiveness We optimise resource utilisation, leveraging on administrative and alternative data sources to ease respondent burden.

Singapore Department of Statistics Complete Life Tables, 2017-2018 ► 1
Complete Life Tables for Singapore Resident Population, 2017-2018
Key Trends
1. This publication reports the key trends in life expectancy for the Singapore
resident population in 2018 based on the complete life table. Data for 2018 are
preliminary. The final complete life tables for 2017 and preliminary complete life tables
for 2018 are shown in the Annex. Complete life tables since 2003 and an interactive Life
Expectancy Calculator are available on the Singstat website1.
Life Expectancy at Birth2
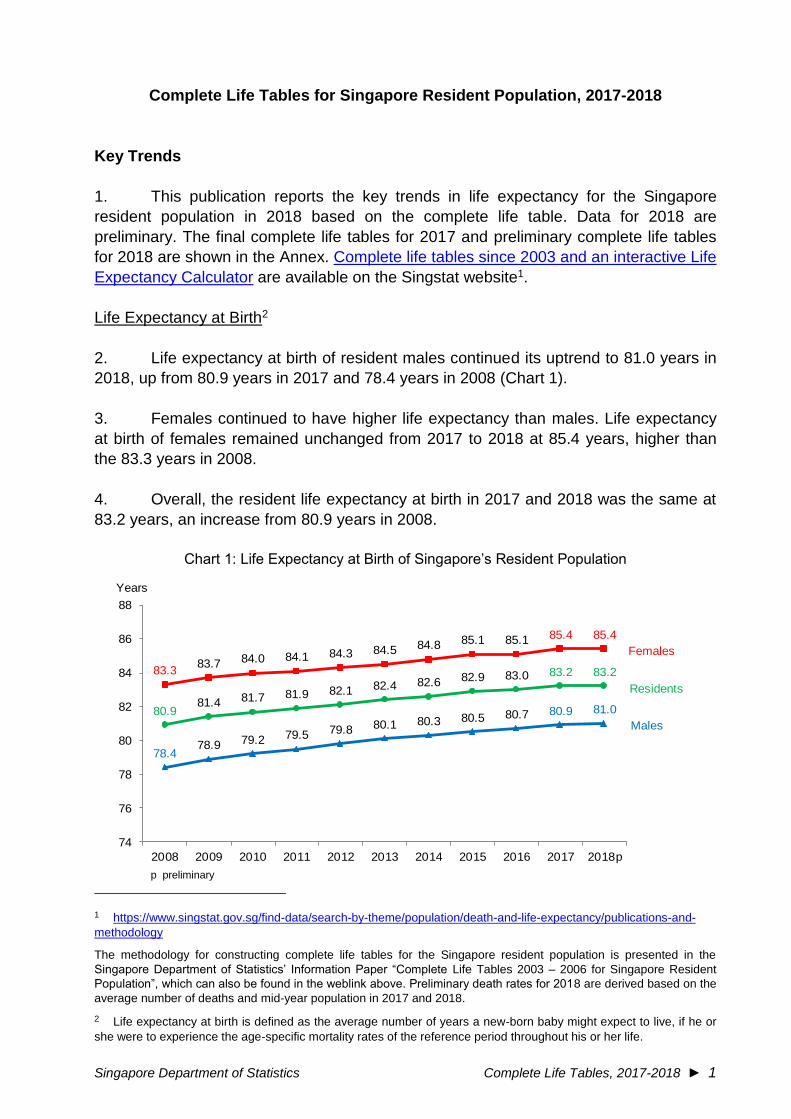
2. Life expectancy at birth of resident males continued its uptrend to 81.0 years in
2018, up from 80.9 years in 2017 and 78.4 years in 2008 (Chart 1).
3. Females continued to have higher life expectancy than males. Life expectancy
at birth of females remained unchanged from 2017 to 2018 at 85.4 years, higher than
the 83.3 years in 2008.
4. Overall, the resident life expectancy at birth in 2017 and 2018 was the same at
83.2 years, an increase from 80.9 years in 2008.
Chart 1: Life Expectancy at Birth of Singapore’s Resident Population
83.383.7 84.0 84.1 84.3 84.5 84.8 85.1 85.1 85.4 85.4
80.981.4 81.7 81.9 82.1 82.4 82.6 82.9 83.0 83.2 83.2
78.478.9 79.2 79.5 79.8 80.1 80.3 80.5 80.7 80.9 81.0
74
76
78
80
82
84
86
88
2008 2009 2010 2011 2012 2013 2014 2015 2016 2017 2018p
Years
Females
Residents
Males
p preliminary
1 https://www.singstat.gov.sg/find-data/search-by-theme/population/death-and-life-expectancy/publications-and-
methodology
The methodology for constructing complete life tables for the Singapore resident population is presented in the
Singapore Department of Statistics’ Information Paper “Complete Life Tables 2003 – 2006 for Singapore Resident
Population”, which can also be found in the weblink above. Preliminary death rates for 2018 are derived based on the
average number of deaths and mid-year population in 2017 and 2018.
2 Life expectancy at birth is defined as the average number of years a new-born baby might expect to live, if he or
she were to experience the age-specific mortality rates of the reference period throughout his or her life.
2 ◄ Complete Life Tables, 2017-2018 Singapore Department of Statistics
Life Expectancy at Age 65 Years3
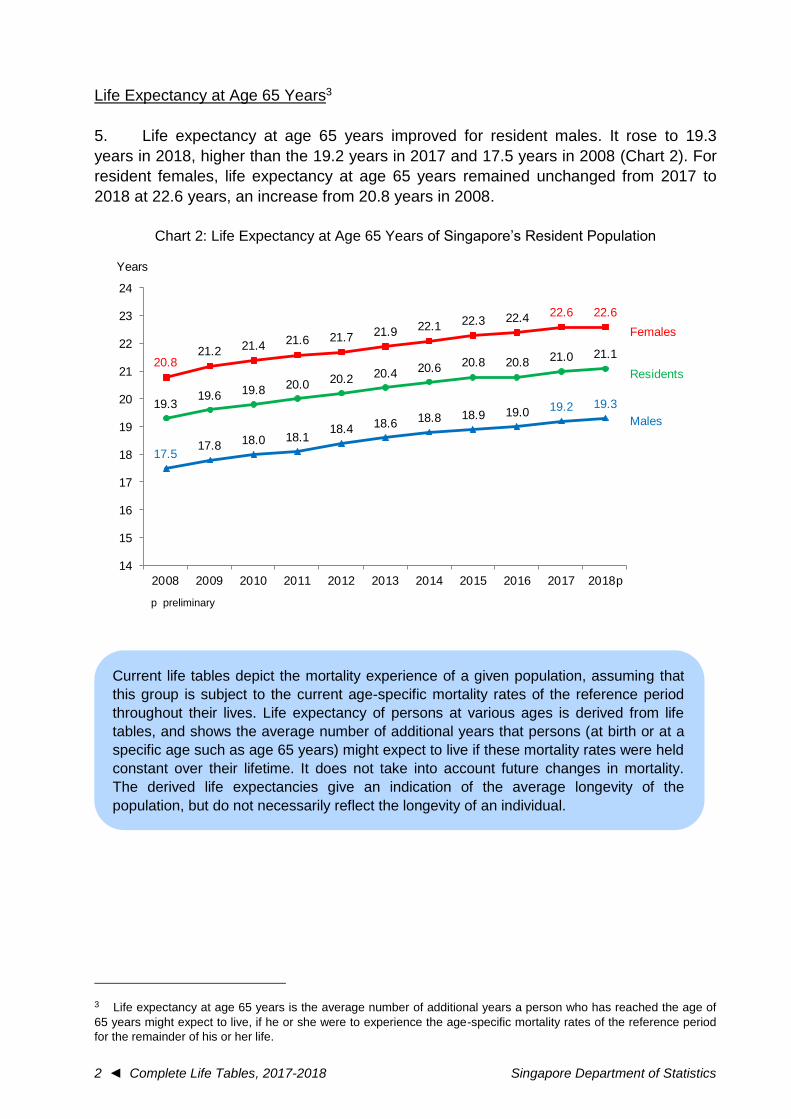
5. Life expectancy at age 65 years improved for resident males. It rose to 19.3
years in 2018, higher than the 19.2 years in 2017 and 17.5 years in 2008 (Chart 2). For
resident females, life expectancy at age 65 years remained unchanged from 2017 to
2018 at 22.6 years, an increase from 20.8 years in 2008.
Chart 2: Life Expectancy at Age 65 Years of Singapore’s Resident Population
20.821.2 21.4 21.6 21.7 21.9 22.1 22.3 22.4 22.6 22.6
19.319.6 19.8 20.0 20.2 20.4 20.6 20.8 20.8 21.0 21.1
17.517.8 18.0 18.1
18.4 18.6 18.8 18.9 19.0 19.2 19.3
14
15
16
17
18
19
20
21
22
23
24
2008 2009 2010 2011 2012 2013 2014 2015 2016 2017 2018p
Years
Females
Residents
Males
p preliminary
3 Life expectancy at age 65 years is the average number of additional years a person who has reached the age of
65 years might expect to live, if he or she were to experience the age-specific mortality rates of the reference period
for the remainder of his or her life.
Current life tables depict the mortality experience of a given population, assuming that
this group is subject to the current age-specific mortality rates of the reference period
throughout their lives. Life expectancy of persons at various ages is derived from life
tables, and shows the average number of additional years that persons (at birth or at a
specific age such as age 65 years) might expect to live if these mortality rates were held
constant over their lifetime. It does not take into account future changes in mortality.
The derived life expectancies give an indication of the average longevity of the
population, but do not necessarily reflect the longevity of an individual.
Singapore Department of Statistics Complete Life Tables, 2017-2018 ► 3
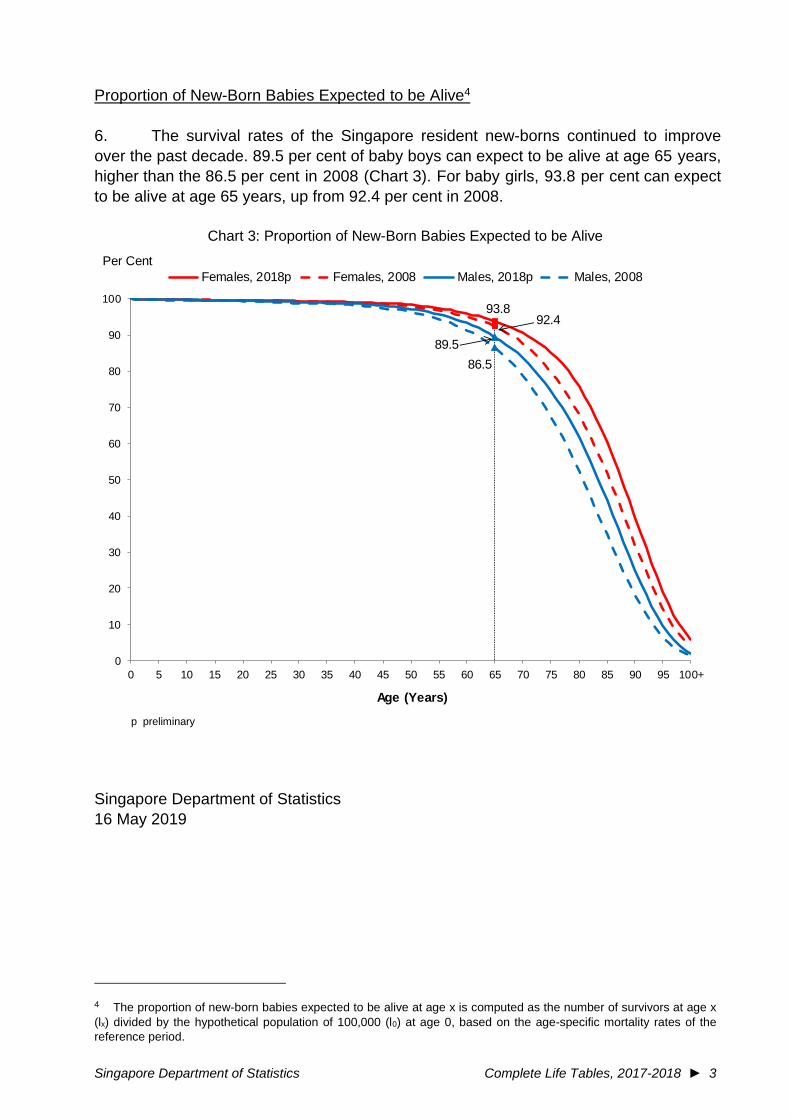
Proportion of New-Born Babies Expected to be Alive4
6. The survival rates of the Singapore resident new-borns continued to improve over the past decade. 89.5 per cent of baby boys can expect to be alive at age 65 years,
higher than the 86.5 per cent in 2008 (Chart 3). For baby girls, 93.8 per cent can expect
to be alive at age 65 years, up from 92.4 per cent in 2008.
Chart 3: Proportion of New-Born Babies Expected to be Alive
93.892.4
89.5
86.5
0
10
20
30
40
50
60
70
80
90
100
0 5 10 15 20 25 30 35 40 45 50 55 60 65 70 75 80 85 90 95 100+
Age (Years)
Females, 2018p Females, 2008 Males, 2018p Males, 2008
Per Cent
p preliminary
Singapore Department of Statistics
16 May 2019
4 The proportion of new-born babies expected to be alive at age x is computed as the number of survivors at age x
(lx) divided by the hypothetical population of 100,000 (l0) at age 0, based on the age-specific mortality rates of the
reference period.

Annex
Singapore Department of Statistics Complete Life Tables, 2017-2018 ► 5
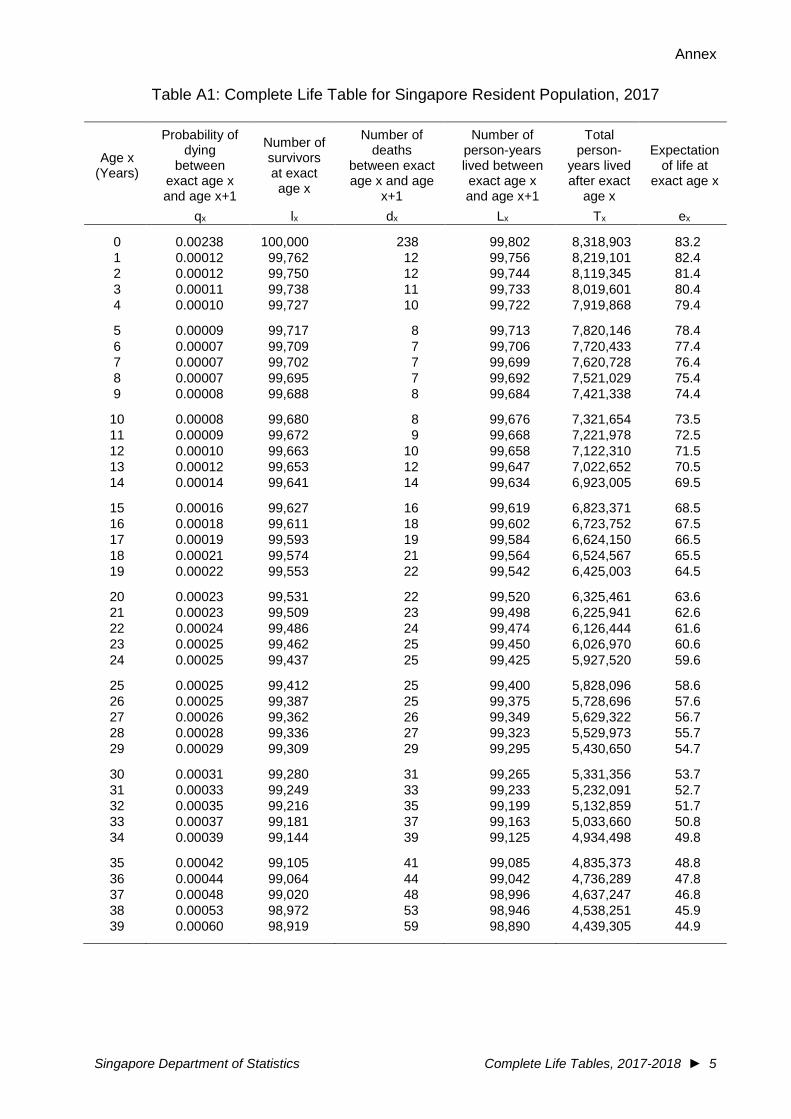
Table A1: Complete Life Table for Singapore Resident Population, 2017
Age x (Years)
Probability of dying
between exact age x and age x+1
Number of survivors at exact age x
Number of deaths
between exact age x and age
x+1
Number of person-years lived between exact age x and age x+1
Total person-
years lived after exact
age x
Expectation of life at
exact age x
qx lx dx Lx Tx ex
0 0.00238 100,000 238 99,802 8,318,903 83.2
1 0.00012 99,762 12 99,756 8,219,101 82.4
2 0.00012 99,750 12 99,744 8,119,345 81.4
3 0.00011 99,738 11 99,733 8,019,601 80.4
4 0.00010 99,727 10 99,722 7,919,868 79.4
5 0.00009 99,717 8 99,713 7,820,146 78.4
6 0.00007 99,709 7 99,706 7,720,433 77.4
7 0.00007 99,702 7 99,699 7,620,728 76.4
8 0.00007 99,695 7 99,692 7,521,029 75.4
9 0.00008 99,688 8 99,684 7,421,338 74.4
10 0.00008 99,680 8 99,676 7,321,654 73.5
11 0.00009 99,672 9 99,668 7,221,978 72.5
12 0.00010 99,663 10 99,658 7,122,310 71.5
13 0.00012 99,653 12 99,647 7,022,652 70.5
14 0.00014 99,641 14 99,634 6,923,005 69.5
15 0.00016 99,627 16 99,619 6,823,371 68.5
16 0.00018 99,611 18 99,602 6,723,752 67.5
17 0.00019 99,593 19 99,584 6,624,150 66.5
18 0.00021 99,574 21 99,564 6,524,567 65.5
19 0.00022 99,553 22 99,542 6,425,003 64.5
20 0.00023 99,531 22 99,520 6,325,461 63.6
21 0.00023 99,509 23 99,498 6,225,941 62.6
22 0.00024 99,486 24 99,474 6,126,444 61.6
23 0.00025 99,462 25 99,450 6,026,970 60.6
24 0.00025 99,437 25 99,425 5,927,520 59.6
25 0.00025 99,412 25 99,400 5,828,096 58.6
26 0.00025 99,387 25 99,375 5,728,696 57.6
27 0.00026 99,362 26 99,349 5,629,322 56.7
28 0.00028 99,336 27 99,323 5,529,973 55.7
29 0.00029 99,309 29 99,295 5,430,650 54.7
30 0.00031 99,280 31 99,265 5,331,356 53.7
31 0.00033 99,249 33 99,233 5,232,091 52.7
32 0.00035 99,216 35 99,199 5,132,859 51.7
33 0.00037 99,181 37 99,163 5,033,660 50.8
34 0.00039 99,144 39 99,125 4,934,498 49.8
35 0.00042 99,105 41 99,085 4,835,373 48.8
36 0.00044 99,064 44 99,042 4,736,289 47.8
37 0.00048 99,020 48 98,996 4,637,247 46.8
38 0.00053 98,972 53 98,946 4,538,251 45.9
39 0.00060 98,919 59 98,890 4,439,305 44.9
Annex
6 ◄ Complete Life Tables, 2017-2018 Singapore Department of Statistics
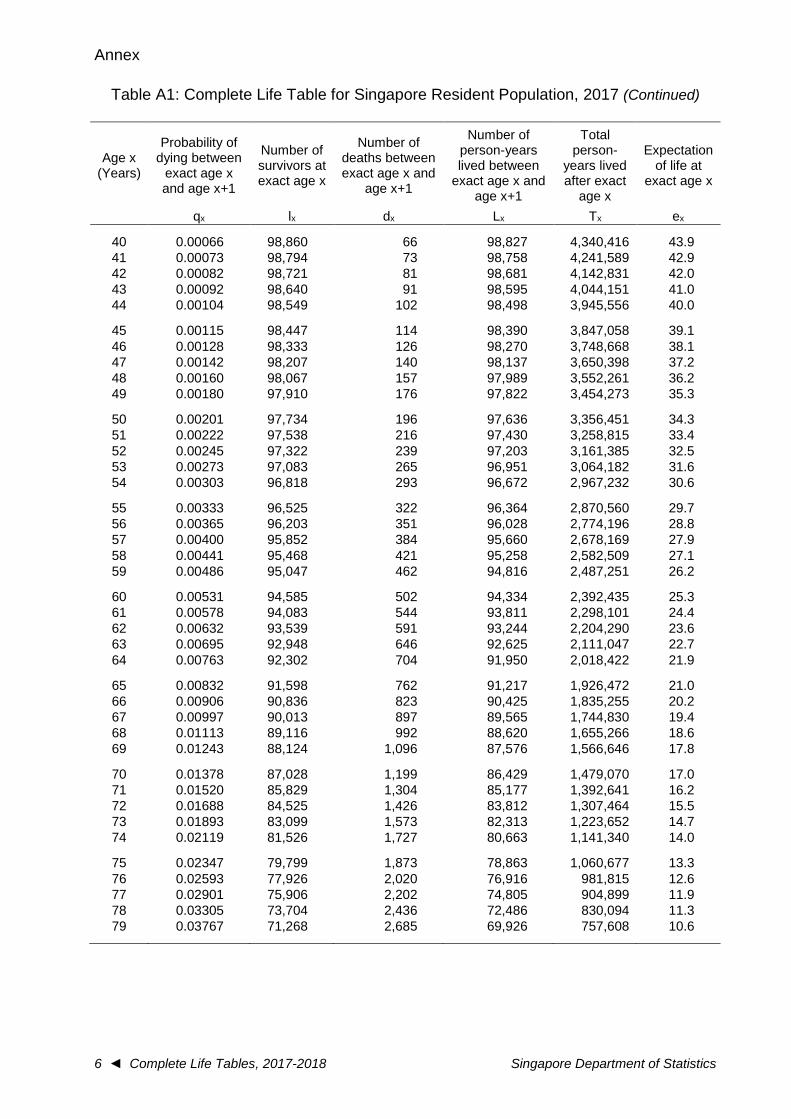
Table A1: Complete Life Table for Singapore Resident Population, 2017 (Continued)
Age x (Years)
Probability of dying between
exact age x and age x+1
Number of survivors at exact age x
Number of deaths between exact age x and
age x+1
Number of person-years lived between
exact age x and age x+1
Total person-
years lived after exact
age x
Expectation of life at
exact age x
qx lx dx Lx Tx ex
40 0.00066 98,860 66 98,827 4,340,416 43.9
41 0.00073 98,794 73 98,758 4,241,589 42.9
42 0.00082 98,721 81 98,681 4,142,831 42.0
43 0.00092 98,640 91 98,595 4,044,151 41.0
44 0.00104 98,549 102 98,498 3,945,556 40.0
45 0.00115 98,447 114 98,390 3,847,058 39.1
46 0.00128 98,333 126 98,270 3,748,668 38.1
47 0.00142 98,207 140 98,137 3,650,398 37.2
48 0.00160 98,067 157 97,989 3,552,261 36.2
49 0.00180 97,910 176 97,822 3,454,273 35.3
50 0.00201 97,734 196 97,636 3,356,451 34.3
51 0.00222 97,538 216 97,430 3,258,815 33.4
52 0.00245 97,322 239 97,203 3,161,385 32.5
53 0.00273 97,083 265 96,951 3,064,182 31.6
54 0.00303 96,818 293 96,672 2,967,232 30.6
55 0.00333 96,525 322 96,364 2,870,560 29.7
56 0.00365 96,203 351 96,028 2,774,196 28.8
57 0.00400 95,852 384 95,660 2,678,169 27.9
58 0.00441 95,468 421 95,258 2,582,509 27.1
59 0.00486 95,047 462 94,816 2,487,251 26.2
60 0.00531 94,585 502 94,334 2,392,435 25.3
61 0.00578 94,083 544 93,811 2,298,101 24.4
62 0.00632 93,539 591 93,244 2,204,290 23.6
63 0.00695 92,948 646 92,625 2,111,047 22.7
64 0.00763 92,302 704 91,950 2,018,422 21.9
65 0.00832 91,598 762 91,217 1,926,472 21.0
66 0.00906 90,836 823 90,425 1,835,255 20.2
67 0.00997 90,013 897 89,565 1,744,830 19.4
68 0.01113 89,116 992 88,620 1,655,266 18.6
69 0.01243 88,124 1,096 87,576 1,566,646 17.8
70 0.01378 87,028 1,199 86,429 1,479,070 17.0
71 0.01520 85,829 1,304 85,177 1,392,641 16.2
72 0.01688 84,525 1,426 83,812 1,307,464 15.5
73 0.01893 83,099 1,573 82,313 1,223,652 14.7
74 0.02119 81,526 1,727 80,663 1,141,340 14.0
75 0.02347 79,799 1,873 78,863 1,060,677 13.3
76 0.02593 77,926 2,020 76,916 981,815 12.6
77 0.02901 75,906 2,202 74,805 904,899 11.9
78 0.03305 73,704 2,436 72,486 830,094 11.3
79 0.03767 71,268 2,685 69,926 757,608 10.6
Annex
Singapore Department of Statistics Complete Life Tables, 2017-2018 ► 7
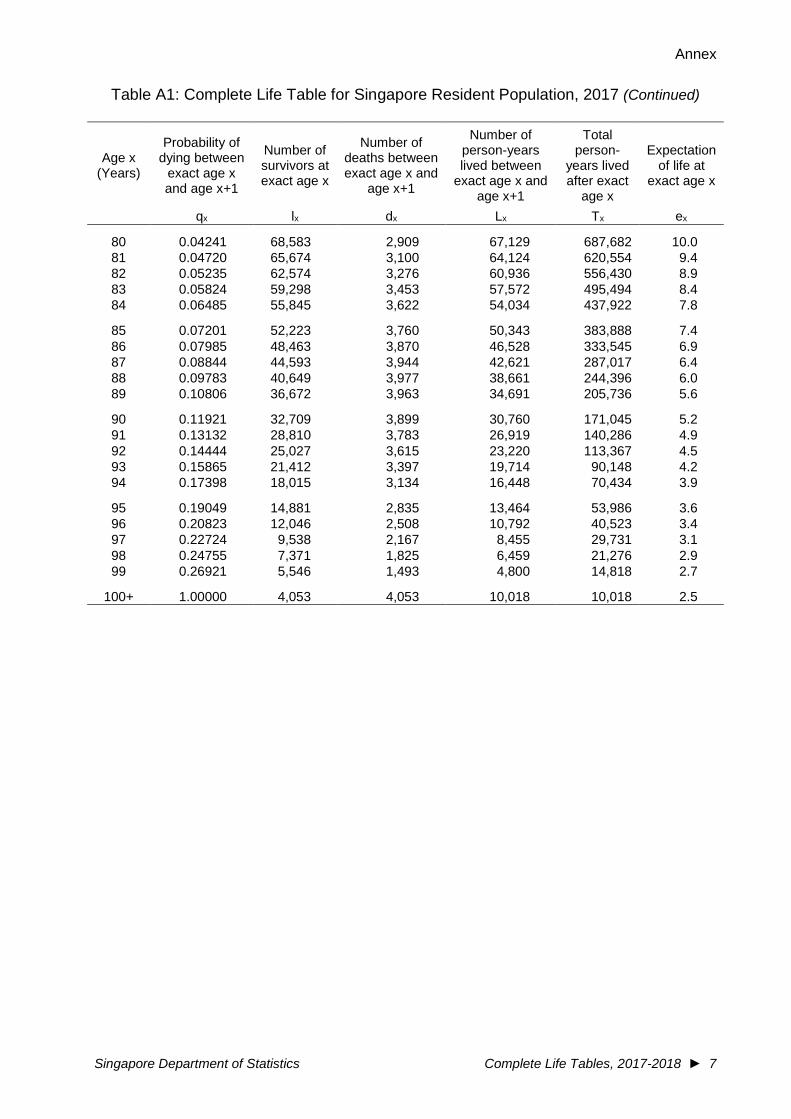
Table A1: Complete Life Table for Singapore Resident Population, 2017 (Continued)
Age x (Years)
Probability of dying between
exact age x and age x+1
Number of survivors at exact age x
Number of deaths between exact age x and
age x+1
Number of person-years lived between
exact age x and age x+1
Total person-
years lived after exact
age x
Expectation of life at
exact age x
qx lx dx Lx Tx ex
80 0.04241 68,583 2,909 67,129 687,682 10.0
81 0.04720 65,674 3,100 64,124 620,554 9.4
82 0.05235 62,574 3,276 60,936 556,430 8.9
83 0.05824 59,298 3,453 57,572 495,494 8.4
84 0.06485 55,845 3,622 54,034 437,922 7.8
85 0.07201 52,223 3,760 50,343 383,888 7.4
86 0.07985 48,463 3,870 46,528 333,545 6.9
87 0.08844 44,593 3,944 42,621 287,017 6.4
88 0.09783 40,649 3,977 38,661 244,396 6.0
89 0.10806 36,672 3,963 34,691 205,736 5.6
90 0.11921 32,709 3,899 30,760 171,045 5.2
91 0.13132 28,810 3,783 26,919 140,286 4.9
92 0.14444 25,027 3,615 23,220 113,367 4.5
93 0.15865 21,412 3,397 19,714 90,148 4.2
94 0.17398 18,015 3,134 16,448 70,434 3.9
95 0.19049 14,881 2,835 13,464 53,986 3.6
96 0.20823 12,046 2,508 10,792 40,523 3.4
97 0.22724 9,538 2,167 8,455 29,731 3.1
98 0.24755 7,371 1,825 6,459 21,276 2.9
99 0.26921 5,546 1,493 4,800 14,818 2.7
100+ 1.00000 4,053 4,053 10,018 10,018 2.5
Annex
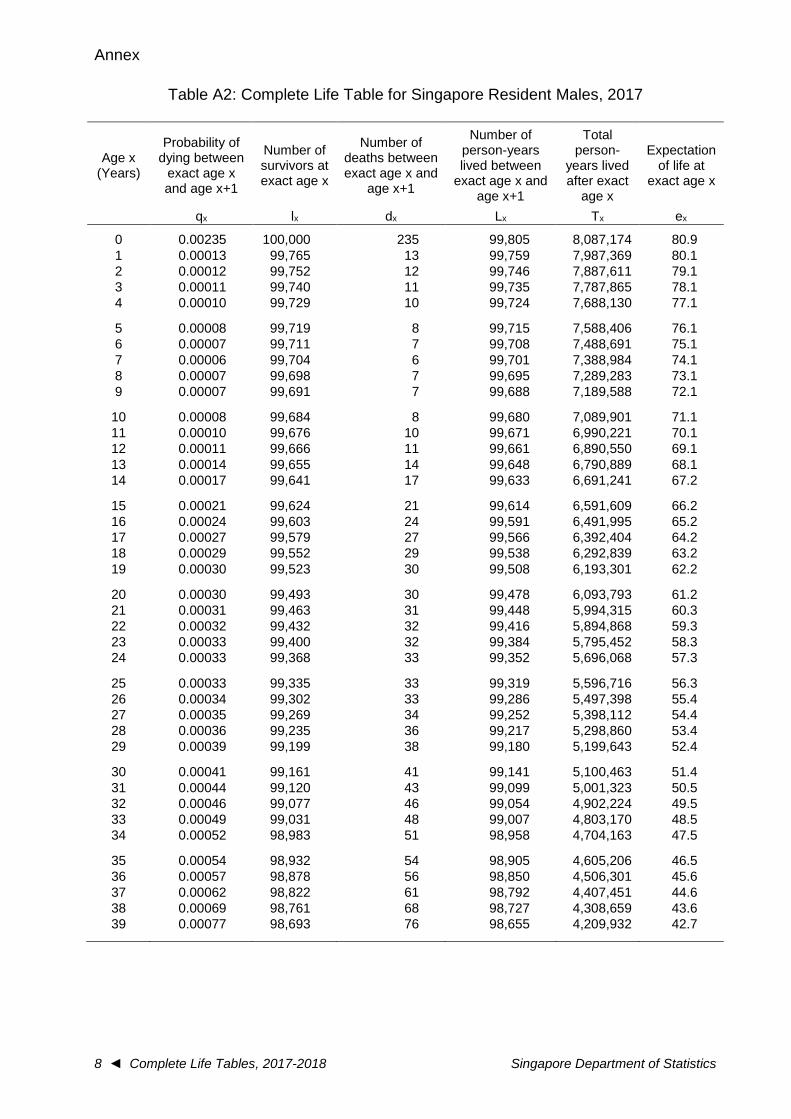
8 ◄ Complete Life Tables, 2017-2018 Singapore Department of Statistics
Table A2: Complete Life Table for Singapore Resident Males, 2017
Age x (Years)
Probability of dying between
exact age x and age x+1
Number of survivors at exact age x
Number of deaths between exact age x and
age x+1
Number of person-years lived between
exact age x and age x+1
Total person-
years lived after exact
age x
Expectation of life at
exact age x
qx lx dx Lx Tx ex
0 0.00235 100,000 235 99,805 8,087,174 80.9
1 0.00013 99,765 13 99,759 7,987,369 80.1
2 0.00012 99,752 12 99,746 7,887,611 79.1
3 0.00011 99,740 11 99,735 7,787,865 78.1
4 0.00010 99,729 10 99,724 7,688,130 77.1
5 0.00008 99,719 8 99,715 7,588,406 76.1
6 0.00007 99,711 7 99,708 7,488,691 75.1
7 0.00006 99,704 6 99,701 7,388,984 74.1
8 0.00007 99,698 7 99,695 7,289,283 73.1
9 0.00007 99,691 7 99,688 7,189,588 72.1
10 0.00008 99,684 8 99,680 7,089,901 71.1
11 0.00010 99,676 10 99,671 6,990,221 70.1
12 0.00011 99,666 11 99,661 6,890,550 69.1
13 0.00014 99,655 14 99,648 6,790,889 68.1
14 0.00017 99,641 17 99,633 6,691,241 67.2
15 0.00021 99,624 21 99,614 6,591,609 66.2
16 0.00024 99,603 24 99,591 6,491,995 65.2
17 0.00027 99,579 27 99,566 6,392,404 64.2
18 0.00029 99,552 29 99,538 6,292,839 63.2
19 0.00030 99,523 30 99,508 6,193,301 62.2
20 0.00030 99,493 30 99,478 6,093,793 61.2
21 0.00031 99,463 31 99,448 5,994,315 60.3
22 0.00032 99,432 32 99,416 5,894,868 59.3
23 0.00033 99,400 32 99,384 5,795,452 58.3
24 0.00033 99,368 33 99,352 5,696,068 57.3
25 0.00033 99,335 33 99,319 5,596,716 56.3
26 0.00034 99,302 33 99,286 5,497,398 55.4
27 0.00035 99,269 34 99,252 5,398,112 54.4
28 0.00036 99,235 36 99,217 5,298,860 53.4
29 0.00039 99,199 38 99,180 5,199,643 52.4
30 0.00041 99,161 41 99,141 5,100,463 51.4
31 0.00044 99,120 43 99,099 5,001,323 50.5
32 0.00046 99,077 46 99,054 4,902,224 49.5
33 0.00049 99,031 48 99,007 4,803,170 48.5
34 0.00052 98,983 51 98,958 4,704,163 47.5
35 0.00054 98,932 54 98,905 4,605,206 46.5
36 0.00057 98,878 56 98,850 4,506,301 45.6
37 0.00062 98,822 61 98,792 4,407,451 44.6
38 0.00069 98,761 68 98,727 4,308,659 43.6
39 0.00077 98,693 76 98,655 4,209,932 42.7
Annex
Singapore Department of Statistics Complete Life Tables, 2017-2018 ► 9
Table A2: Complete Life Table for Singapore Resident Males, 2017 (Continued)
Age x (Years)
Probability of dying between
exact age x and age x+1
Number of survivors at exact age x
Number of deaths between exact age x and
age x+1
Number of person-years lived between
exact age x and age x+1
Total person-
years lived after exact
age x
Expectation of life at
exact age x
qx lx dx Lx Tx ex
40 0.00085 98,617 84 98,575 4,111,277 41.7
41 0.00094 98,533 93 98,487 4,012,702 40.7
42 0.00105 98,440 103 98,389 3,914,216 39.8
43 0.00118 98,337 116 98,279 3,815,827 38.8
44 0.00131 98,221 129 98,157 3,717,548 37.8
45 0.00146 98,092 143 98,021 3,619,392 36.9
46 0.00161 97,949 157 97,871 3,521,371 36.0
47 0.00179 97,792 175 97,705 3,423,501 35.0
48 0.00200 97,617 196 97,519 3,325,796 34.1
49 0.00225 97,421 219 97,312 3,228,277 33.1
50 0.00250 97,202 243 97,081 3,130,966 32.2
51 0.00276 96,959 267 96,826 3,033,885 31.3
52 0.00306 96,692 296 96,544 2,937,060 30.4
53 0.00341 96,396 329 96,232 2,840,516 29.5
54 0.00380 96,067 366 95,884 2,744,284 28.6
55 0.00421 95,701 402 95,500 2,648,400 27.7
56 0.00462 95,299 440 95,079 2,552,900 26.8
57 0.00509 94,859 483 94,618 2,457,821 25.9
58 0.00564 94,376 533 94,110 2,363,204 25.0
59 0.00624 93,843 586 93,550 2,269,094 24.2
60 0.00686 93,257 639 92,938 2,175,544 23.3
61 0.00750 92,618 695 92,271 2,082,607 22.5
62 0.00822 91,923 756 91,545 1,990,336 21.7
63 0.00907 91,167 827 90,754 1,898,791 20.8
64 0.00998 90,340 902 89,889 1,808,038 20.0
65 0.01091 89,438 975 88,951 1,718,149 19.2
66 0.01190 88,463 1,053 87,937 1,629,198 18.4
67 0.01314 87,410 1,148 86,836 1,541,262 17.6
68 0.01474 86,262 1,272 85,626 1,454,426 16.9
69 0.01657 84,990 1,408 84,286 1,368,800 16.1
70 0.01846 83,582 1,543 82,811 1,284,514 15.4
71 0.02042 82,039 1,675 81,202 1,201,703 14.6
72 0.02260 80,364 1,816 79,456 1,120,502 13.9
73 0.02512 78,548 1,973 77,562 1,041,046 13.3
74 0.02779 76,575 2,128 75,511 963,484 12.6
75 0.03049 74,447 2,270 73,312 887,973 11.9
76 0.03339 72,177 2,410 70,972 814,661 11.3
77 0.03701 69,767 2,582 68,476 743,689 10.7
78 0.04173 67,185 2,804 65,783 675,213 10.1
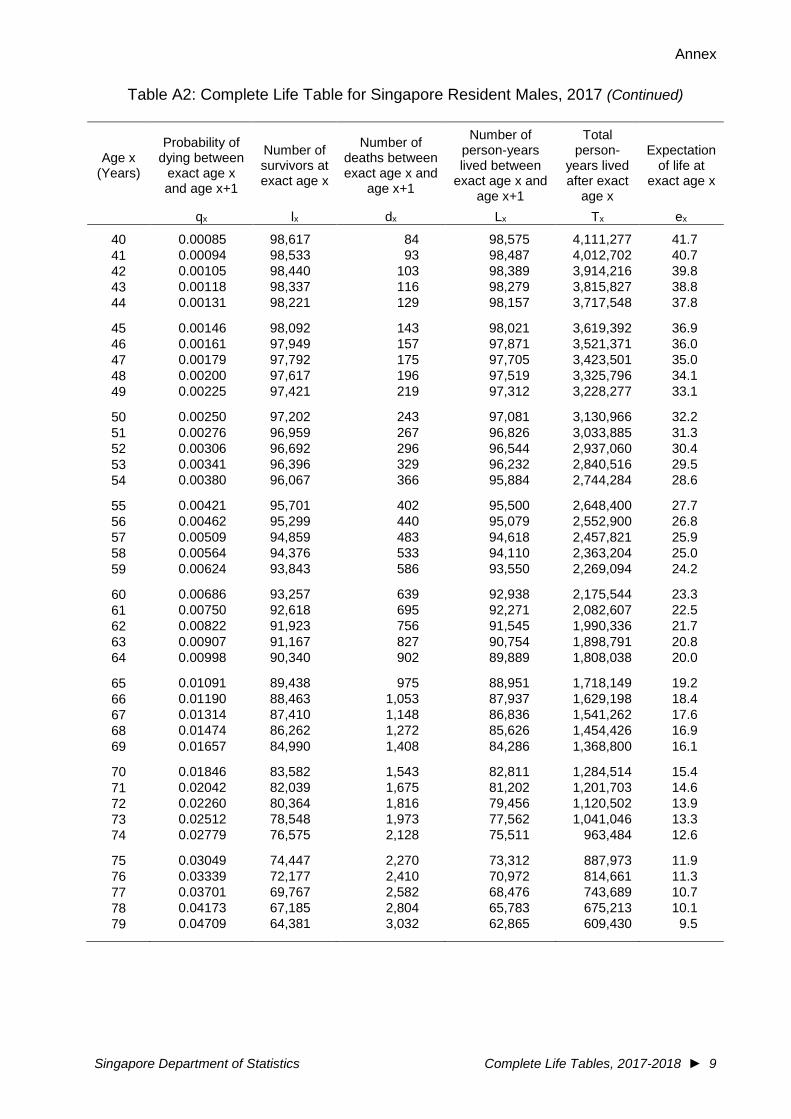
79 0.04709 64,381 3,032 62,865 609,430 9.5

Annex
10 ◄ Complete Life Tables, 2017-2018 Singapore Department of Statistics
Table A2: Complete Life Table for Singapore Resident Males, 2017 (Continued)
Age x (Years)
Probability of dying between
exact age x and age x+1
Number of survivors at exact age x
Number of deaths between exact age x and
age x+1
Number of person-years lived between
exact age x and age x+1
Total person-
years lived after exact
age x
Expectation of life at
exact age x
qx lx dx Lx Tx ex
80 0.05259 61,349 3,226 59,736 546,565 8.9
81 0.05816 58,123 3,380 56,433 486,829 8.4
82 0.06423 54,743 3,516 52,985 430,396 7.9
83 0.07132 51,227 3,653 49,401 377,411 7.4
84 0.07940 47,574 3,777 45,686 328,011 6.9
85 0.08802 43,797 3,855 41,870 282,325 6.4
86 0.09744 39,942 3,892 37,996 240,456 6.0
87 0.10772 36,050 3,883 34,109 202,460 5.6
88 0.11891 32,167 3,825 30,255 168,351 5.2
89 0.13107 28,342 3,715 26,485 138,097 4.9
90 0.14424 24,627 3,552 22,851 111,612 4.5
91 0.15850 21,075 3,340 19,405 88,761 4.2
92 0.17387 17,735 3,084 16,193 69,356 3.9
93 0.19043 14,651 2,790 13,256 53,163 3.6
94 0.20820 11,861 2,469 10,627 39,907 3.4
95 0.22723 9,392 2,134 8,325 29,281 3.1
96 0.24756 7,258 1,797 6,360 20,956 2.9
97 0.26921 5,461 1,470 4,726 14,596 2.7
98 0.29220 3,991 1,166 3,408 9,870 2.5
99 0.31654 2,825 894 2,378 6,462 2.3
100+ 1.00000 1,931 1,931 4,084 4,084 2.1
Annex
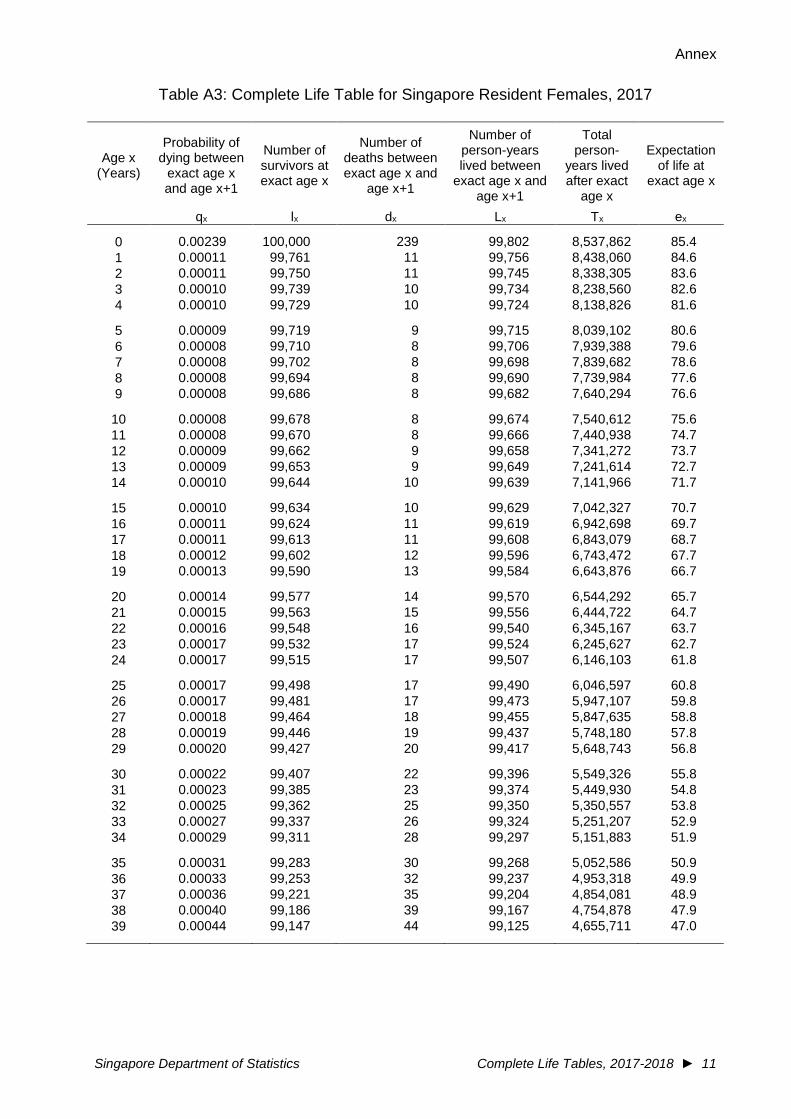
Singapore Department of Statistics Complete Life Tables, 2017-2018 ► 11
Table A3: Complete Life Table for Singapore Resident Females, 2017
Age x (Years)
Probability of dying between
exact age x and age x+1
Number of survivors at exact age x
Number of deaths between exact age x and
age x+1
Number of person-years lived between
exact age x and age x+1
Total person-
years lived after exact
age x
Expectation of life at
exact age x
qx lx dx Lx Tx ex
0 0.00239 100,000 239 99,802 8,537,862 85.4
1 0.00011 99,761 11 99,756 8,438,060 84.6
2 0.00011 99,750 11 99,745 8,338,305 83.6
3 0.00010 99,739 10 99,734 8,238,560 82.6
4 0.00010 99,729 10 99,724 8,138,826 81.6
5 0.00009 99,719 9 99,715 8,039,102 80.6
6 0.00008 99,710 8 99,706 7,939,388 79.6
7 0.00008 99,702 8 99,698 7,839,682 78.6
8 0.00008 99,694 8 99,690 7,739,984 77.6
9 0.00008 99,686 8 99,682 7,640,294 76.6
10 0.00008 99,678 8 99,674 7,540,612 75.6
11 0.00008 99,670 8 99,666 7,440,938 74.7
12 0.00009 99,662 9 99,658 7,341,272 73.7
13 0.00009 99,653 9 99,649 7,241,614 72.7
14 0.00010 99,644 10 99,639 7,141,966 71.7
15 0.00010 99,634 10 99,629 7,042,327 70.7
16 0.00011 99,624 11 99,619 6,942,698 69.7
17 0.00011 99,613 11 99,608 6,843,079 68.7
18 0.00012 99,602 12 99,596 6,743,472 67.7
19 0.00013 99,590 13 99,584 6,643,876 66.7
20 0.00014 99,577 14 99,570 6,544,292 65.7
21 0.00015 99,563 15 99,556 6,444,722 64.7
22 0.00016 99,548 16 99,540 6,345,167 63.7
23 0.00017 99,532 17 99,524 6,245,627 62.7
24 0.00017 99,515 17 99,507 6,146,103 61.8
25 0.00017 99,498 17 99,490 6,046,597 60.8
26 0.00017 99,481 17 99,473 5,947,107 59.8
27 0.00018 99,464 18 99,455 5,847,635 58.8
28 0.00019 99,446 19 99,437 5,748,180 57.8
29 0.00020 99,427 20 99,417 5,648,743 56.8
30 0.00022 99,407 22 99,396 5,549,326 55.8
31 0.00023 99,385 23 99,374 5,449,930 54.8
32 0.00025 99,362 25 99,350 5,350,557 53.8
33 0.00027 99,337 26 99,324 5,251,207 52.9
34 0.00029 99,311 28 99,297 5,151,883 51.9
35 0.00031 99,283 30 99,268 5,052,586 50.9
36 0.00033 99,253 32 99,237 4,953,318 49.9
37 0.00036 99,221 35 99,204 4,854,081 48.9
38 0.00040 99,186 39 99,167 4,754,878 47.9
39 0.00044 99,147 44 99,125 4,655,711 47.0
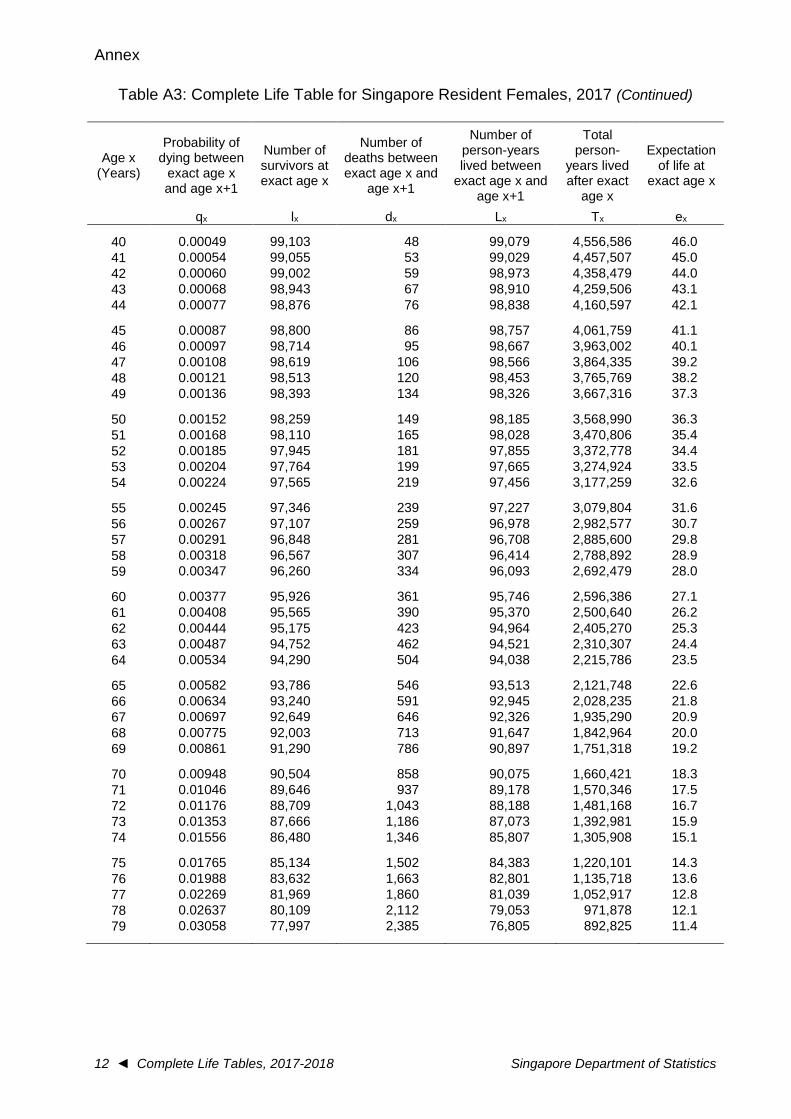
Annex
12 ◄ Complete Life Tables, 2017-2018 Singapore Department of Statistics
Table A3: Complete Life Table for Singapore Resident Females, 2017 (Continued)
Age x (Years)
Probability of dying between
exact age x and age x+1
Number of survivors at exact age x
Number of deaths between exact age x and
age x+1
Number of person-years lived between
exact age x and age x+1
Total person-
years lived after exact
age x
Expectation of life at
exact age x
qx lx dx Lx Tx ex
40 0.00049 99,103 48 99,079 4,556,586 46.0
41 0.00054 99,055 53 99,029 4,457,507 45.0
42 0.00060 99,002 59 98,973 4,358,479 44.0
43 0.00068 98,943 67 98,910 4,259,506 43.1
44 0.00077 98,876 76 98,838 4,160,597 42.1
45 0.00087 98,800 86 98,757 4,061,759 41.1
46 0.00097 98,714 95 98,667 3,963,002 40.1
47 0.00108 98,619 106 98,566 3,864,335 39.2
48 0.00121 98,513 120 98,453 3,765,769 38.2
49 0.00136 98,393 134 98,326 3,667,316 37.3
50 0.00152 98,259 149 98,185 3,568,990 36.3
51 0.00168 98,110 165 98,028 3,470,806 35.4
52 0.00185 97,945 181 97,855 3,372,778 34.4
53 0.00204 97,764 199 97,665 3,274,924 33.5
54 0.00224 97,565 219 97,456 3,177,259 32.6
55 0.00245 97,346 239 97,227 3,079,804 31.6
56 0.00267 97,107 259 96,978 2,982,577 30.7
57 0.00291 96,848 281 96,708 2,885,600 29.8
58 0.00318 96,567 307 96,414 2,788,892 28.9
59 0.00347 96,260 334 96,093 2,692,479 28.0
60 0.00377 95,926 361 95,746 2,596,386 27.1
61 0.00408 95,565 390 95,370 2,500,640 26.2
62 0.00444 95,175 423 94,964 2,405,270 25.3
63 0.00487 94,752 462 94,521 2,310,307 24.4
64 0.00534 94,290 504 94,038 2,215,786 23.5
65 0.00582 93,786 546 93,513 2,121,748 22.6
66 0.00634 93,240 591 92,945 2,028,235 21.8
67 0.00697 92,649 646 92,326 1,935,290 20.9
68 0.00775 92,003 713 91,647 1,842,964 20.0
69 0.00861 91,290 786 90,897 1,751,318 19.2
70 0.00948 90,504 858 90,075 1,660,421 18.3
71 0.01046 89,646 937 89,178 1,570,346 17.5
72 0.01176 88,709 1,043 88,188 1,481,168 16.7
73 0.01353 87,666 1,186 87,073 1,392,981 15.9
74 0.01556 86,480 1,346 85,807 1,305,908 15.1
75 0.01765 85,134 1,502 84,383 1,220,101 14.3
76 0.01988 83,632 1,663 82,801 1,135,718 13.6
77 0.02269 81,969 1,860 81,039 1,052,917 12.8
78 0.02637 80,109 2,112 79,053 971,878 12.1
79 0.03058 77,997 2,385 76,805 892,825 11.4

Annex
Singapore Department of Statistics Complete Life Tables, 2017-2018 ► 13
Table A3: Complete Life Table for Singapore Resident Females, 2017 (Continued)
Age x (Years)
Probability of dying between
exact age x and age x+1
Number of survivors at exact age x
Number of deaths between exact age x and
age x+1
Number of person-years lived between
exact age x and age x+1
Total person-
years lived after exact
age x
Expectation of life at
exact age x
qx lx dx Lx Tx ex
80 0.03491 75,612 2,640 74,292 816,021 10.8
81 0.03929 72,972 2,867 71,539 741,729 10.2
82 0.04402 70,105 3,086 68,562 670,190 9.6
83 0.04945 67,019 3,314 65,362 601,628 9.0
84 0.05558 63,705 3,541 61,935 536,266 8.4
85 0.06227 60,164 3,747 58,291 474,332 7.9
86 0.06965 56,417 3,930 54,452 416,041 7.4
87 0.07778 52,487 4,082 50,446 361,589 6.9
88 0.08670 48,405 4,197 46,307 311,143 6.4
89 0.09649 44,208 4,265 42,076 264,837 6.0
90 0.10718 39,943 4,281 37,803 222,761 5.6
91 0.11885 35,662 4,239 33,543 184,959 5.2
92 0.13155 31,423 4,134 29,356 151,416 4.8
93 0.14533 27,289 3,966 25,306 122,060 4.5
94 0.16024 23,323 3,737 21,455 96,754 4.1
95 0.17634 19,586 3,454 17,859 75,300 3.8
96 0.19366 16,132 3,124 14,570 57,441 3.6
97 0.21225 13,008 2,761 11,628 42,871 3.3
98 0.23213 10,247 2,379 9,058 31,243 3.0
99 0.25333 7,868 1,993 6,872 22,186 2.8
100+ 1.00000 5,875 5,875 15,314 15,314 2.6
Annex
14 ◄ Complete Life Tables, 2017-2018 Singapore Department of Statistics
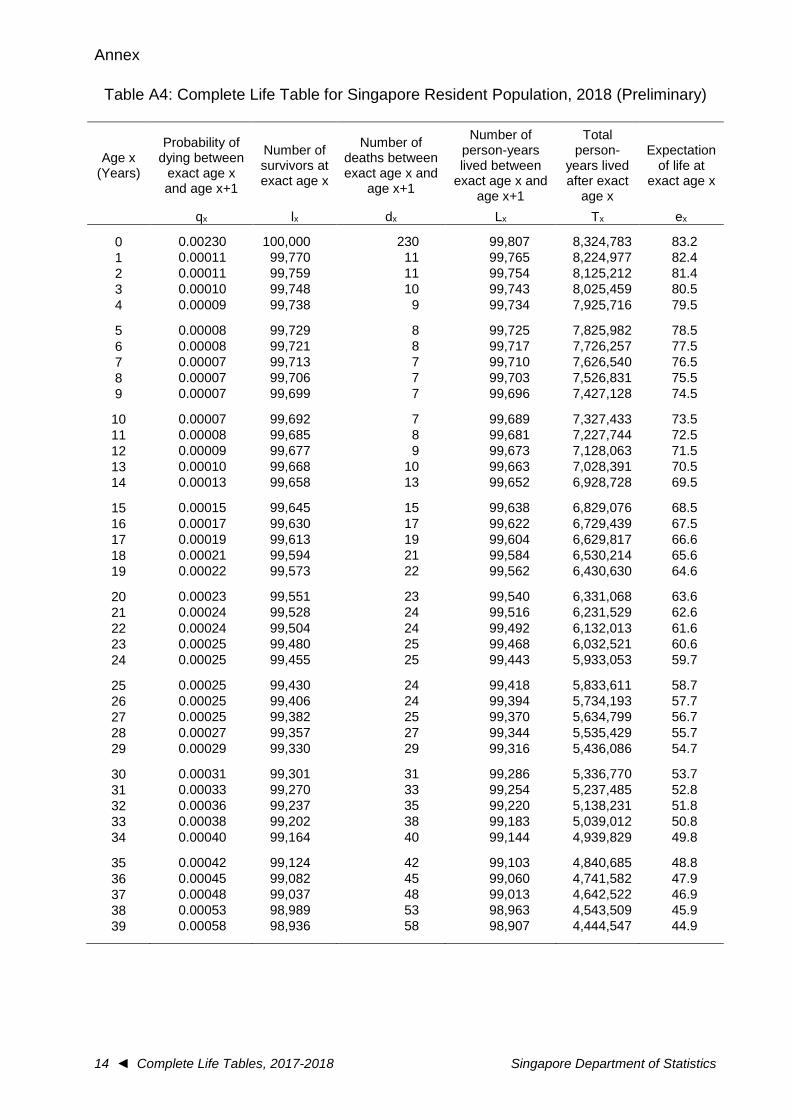
Table A4: Complete Life Table for Singapore Resident Population, 2018 (Preliminary)
Age x (Years)
Probability of dying between
exact age x and age x+1
Number of survivors at exact age x
Number of deaths between exact age x and
age x+1
Number of person-years lived between
exact age x and age x+1
Total person-
years lived after exact
age x
Expectation of life at
exact age x
qx lx dx Lx Tx ex
0 0.00230 100,000 230 99,807 8,324,783 83.2
1 0.00011 99,770 11 99,765 8,224,977 82.4
2 0.00011 99,759 11 99,754 8,125,212 81.4
3 0.00010 99,748 10 99,743 8,025,459 80.5
4 0.00009 99,738 9 99,734 7,925,716 79.5
5 0.00008 99,729 8 99,725 7,825,982 78.5
6 0.00008 99,721 8 99,717 7,726,257 77.5
7 0.00007 99,713 7 99,710 7,626,540 76.5
8 0.00007 99,706 7 99,703 7,526,831 75.5
9 0.00007 99,699 7 99,696 7,427,128 74.5
10 0.00007 99,692 7 99,689 7,327,433 73.5
11 0.00008 99,685 8 99,681 7,227,744 72.5
12 0.00009 99,677 9 99,673 7,128,063 71.5
13 0.00010 99,668 10 99,663 7,028,391 70.5
14 0.00013 99,658 13 99,652 6,928,728 69.5
15 0.00015 99,645 15 99,638 6,829,076 68.5
16 0.00017 99,630 17 99,622 6,729,439 67.5
17 0.00019 99,613 19 99,604 6,629,817 66.6
18 0.00021 99,594 21 99,584 6,530,214 65.6
19 0.00022 99,573 22 99,562 6,430,630 64.6
20 0.00023 99,551 23 99,540 6,331,068 63.6
21 0.00024 99,528 24 99,516 6,231,529 62.6
22 0.00024 99,504 24 99,492 6,132,013 61.6
23 0.00025 99,480 25 99,468 6,032,521 60.6
24 0.00025 99,455 25 99,443 5,933,053 59.7
25 0.00025 99,430 24 99,418 5,833,611 58.7
26 0.00025 99,406 24 99,394 5,734,193 57.7
27 0.00025 99,382 25 99,370 5,634,799 56.7
28 0.00027 99,357 27 99,344 5,535,429 55.7
29 0.00029 99,330 29 99,316 5,436,086 54.7
30 0.00031 99,301 31 99,286 5,336,770 53.7
31 0.00033 99,270 33 99,254 5,237,485 52.8
32 0.00036 99,237 35 99,220 5,138,231 51.8
33 0.00038 99,202 38 99,183 5,039,012 50.8
34 0.00040 99,164 40 99,144 4,939,829 49.8
35 0.00042 99,124 42 99,103 4,840,685 48.8
36 0.00045 99,082 45 99,060 4,741,582 47.9
37 0.00048 99,037 48 99,013 4,642,522 46.9
38 0.00053 98,989 53 98,963 4,543,509 45.9
39 0.00058 98,936 58 98,907 4,444,547 44.9
Annex
Singapore Department of Statistics Complete Life Tables, 2017-2018 ► 15
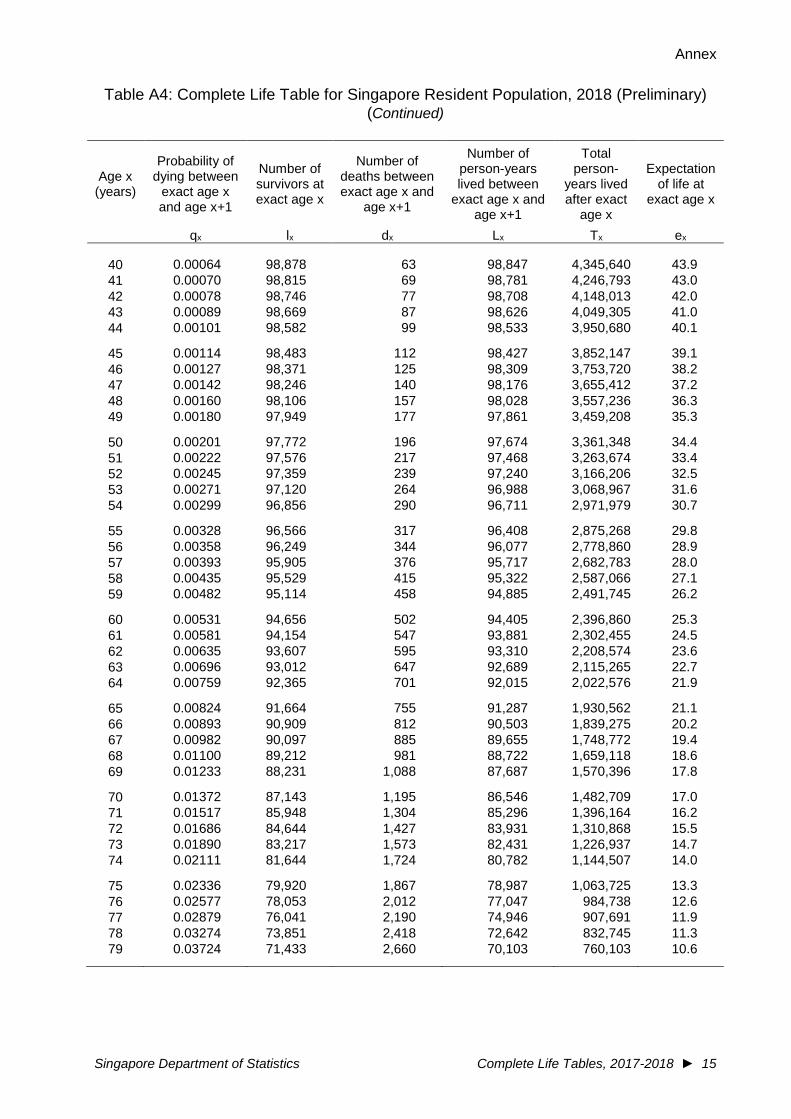
Table A4: Complete Life Table for Singapore Resident Population, 2018 (Preliminary) (Continued)
Age x (years)
Probability of dying between
exact age x and age x+1
Number of survivors at exact age x
Number of deaths between exact age x and
age x+1
Number of person-years lived between
exact age x and age x+1
Total person-
years lived after exact
age x
Expectation of life at
exact age x
qx lx dx Lx Tx ex
40 0.00064 98,878 63 98,847 4,345,640 43.9
41 0.00070 98,815 69 98,781 4,246,793 43.0
42 0.00078 98,746 77 98,708 4,148,013 42.0
43 0.00089 98,669 87 98,626 4,049,305 41.0
44 0.00101 98,582 99 98,533 3,950,680 40.1
45 0.00114 98,483 112 98,427 3,852,147 39.1
46 0.00127 98,371 125 98,309 3,753,720 38.2
47 0.00142 98,246 140 98,176 3,655,412 37.2
48 0.00160 98,106 157 98,028 3,557,236 36.3
49 0.00180 97,949 177 97,861 3,459,208 35.3
50 0.00201 97,772 196 97,674 3,361,348 34.4
51 0.00222 97,576 217 97,468 3,263,674 33.4
52 0.00245 97,359 239 97,240 3,166,206 32.5
53 0.00271 97,120 264 96,988 3,068,967 31.6
54 0.00299 96,856 290 96,711 2,971,979 30.7
55 0.00328 96,566 317 96,408 2,875,268 29.8
56 0.00358 96,249 344 96,077 2,778,860 28.9
57 0.00393 95,905 376 95,717 2,682,783 28.0
58 0.00435 95,529 415 95,322 2,587,066 27.1
59 0.00482 95,114 458 94,885 2,491,745 26.2
60 0.00531 94,656 502 94,405 2,396,860 25.3
61 0.00581 94,154 547 93,881 2,302,455 24.5
62 0.00635 93,607 595 93,310 2,208,574 23.6
63 0.00696 93,012 647 92,689 2,115,265 22.7
64 0.00759 92,365 701 92,015 2,022,576 21.9
65 0.00824 91,664 755 91,287 1,930,562 21.1
66 0.00893 90,909 812 90,503 1,839,275 20.2
67 0.00982 90,097 885 89,655 1,748,772 19.4
68 0.01100 89,212 981 88,722 1,659,118 18.6
69 0.01233 88,231 1,088 87,687 1,570,396 17.8
70 0.01372 87,143 1,195 86,546 1,482,709 17.0
71 0.01517 85,948 1,304 85,296 1,396,164 16.2
72 0.01686 84,644 1,427 83,931 1,310,868 15.5
73 0.01890 83,217 1,573 82,431 1,226,937 14.7
74 0.02111 81,644 1,724 80,782 1,144,507 14.0
75 0.02336 79,920 1,867 78,987 1,063,725 13.3
76 0.02577 78,053 2,012 77,047 984,738 12.6
77 0.02879 76,041 2,190 74,946 907,691 11.9
78 0.03274 73,851 2,418 72,642 832,745 11.3
79 0.03724 71,433 2,660 70,103 760,103 10.6
Annex
16 ◄ Complete Life Tables, 2017-2018 Singapore Department of Statistics
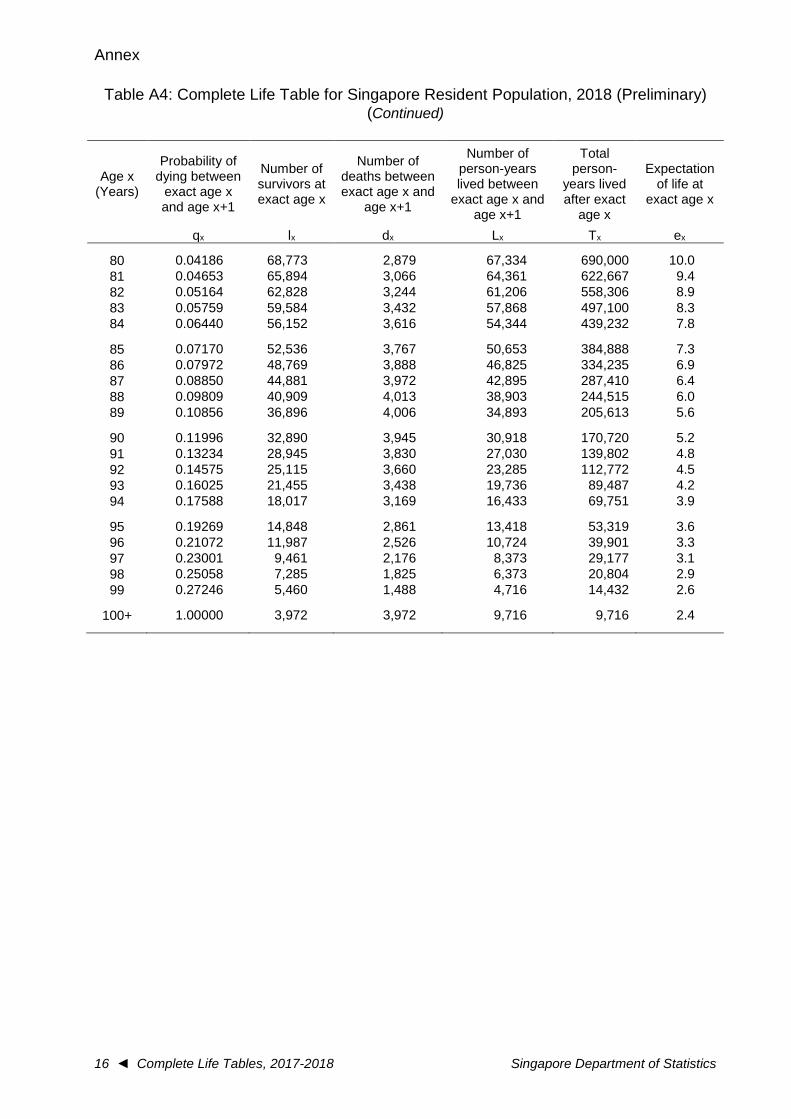
Table A4: Complete Life Table for Singapore Resident Population, 2018 (Preliminary) (Continued)
Age x (Years)
Probability of dying between
exact age x and age x+1
Number of survivors at exact age x
Number of deaths between exact age x and
age x+1
Number of person-years lived between
exact age x and age x+1
Total person-
years lived after exact
age x
Expectation of life at
exact age x
qx lx dx Lx Tx ex
80 0.04186 68,773 2,879 67,334 690,000 10.0
81 0.04653 65,894 3,066 64,361 622,667 9.4
82 0.05164 62,828 3,244 61,206 558,306 8.9
83 0.05759 59,584 3,432 57,868 497,100 8.3
84 0.06440 56,152 3,616 54,344 439,232 7.8
85 0.07170 52,536 3,767 50,653 384,888 7.3
86 0.07972 48,769 3,888 46,825 334,235 6.9
87 0.08850 44,881 3,972 42,895 287,410 6.4
88 0.09809 40,909 4,013 38,903 244,515 6.0
89 0.10856 36,896 4,006 34,893 205,613 5.6
90 0.11996 32,890 3,945 30,918 170,720 5.2
91 0.13234 28,945 3,830 27,030 139,802 4.8
92 0.14575 25,115 3,660 23,285 112,772 4.5
93 0.16025 21,455 3,438 19,736 89,487 4.2
94 0.17588 18,017 3,169 16,433 69,751 3.9
95 0.19269 14,848 2,861 13,418 53,319 3.6
96 0.21072 11,987 2,526 10,724 39,901 3.3
97 0.23001 9,461 2,176 8,373 29,177 3.1
98 0.25058 7,285 1,825 6,373 20,804 2.9
99 0.27246 5,460 1,488 4,716 14,432 2.6
100+ 1.00000 3,972 3,972 9,716 9,716 2.4
Annex
Singapore Department of Statistics Complete Life Tables, 2017-2018 ► 17
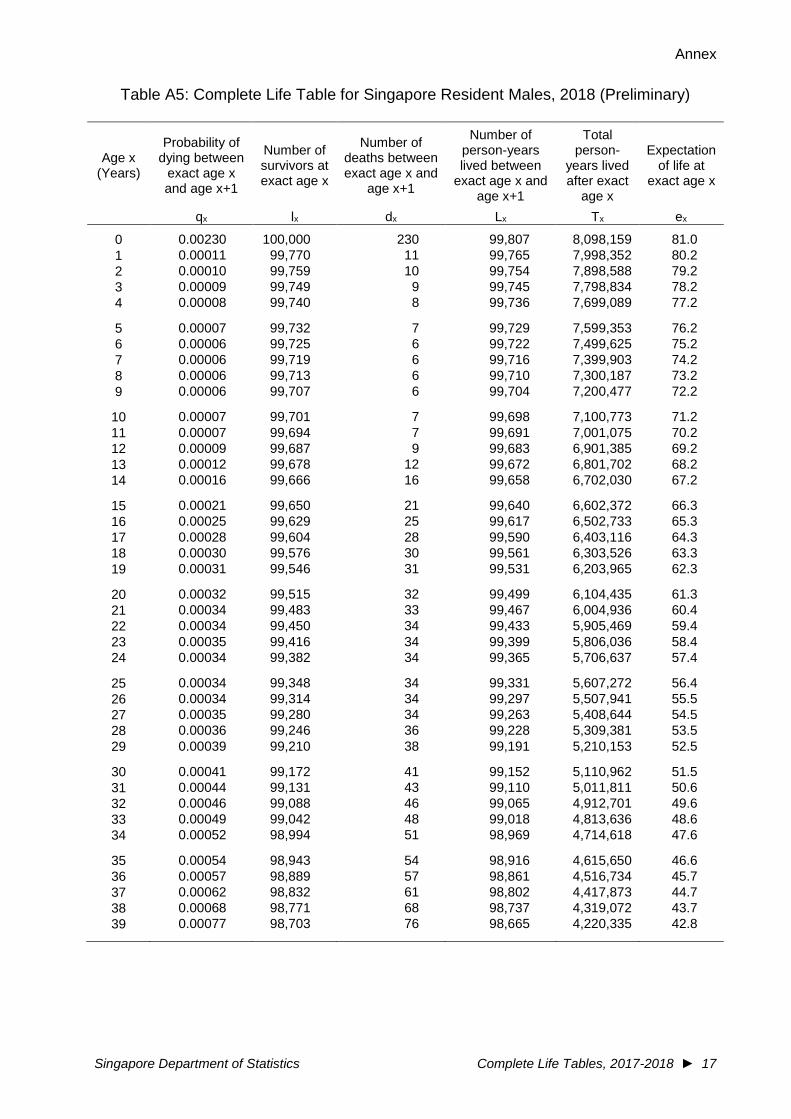
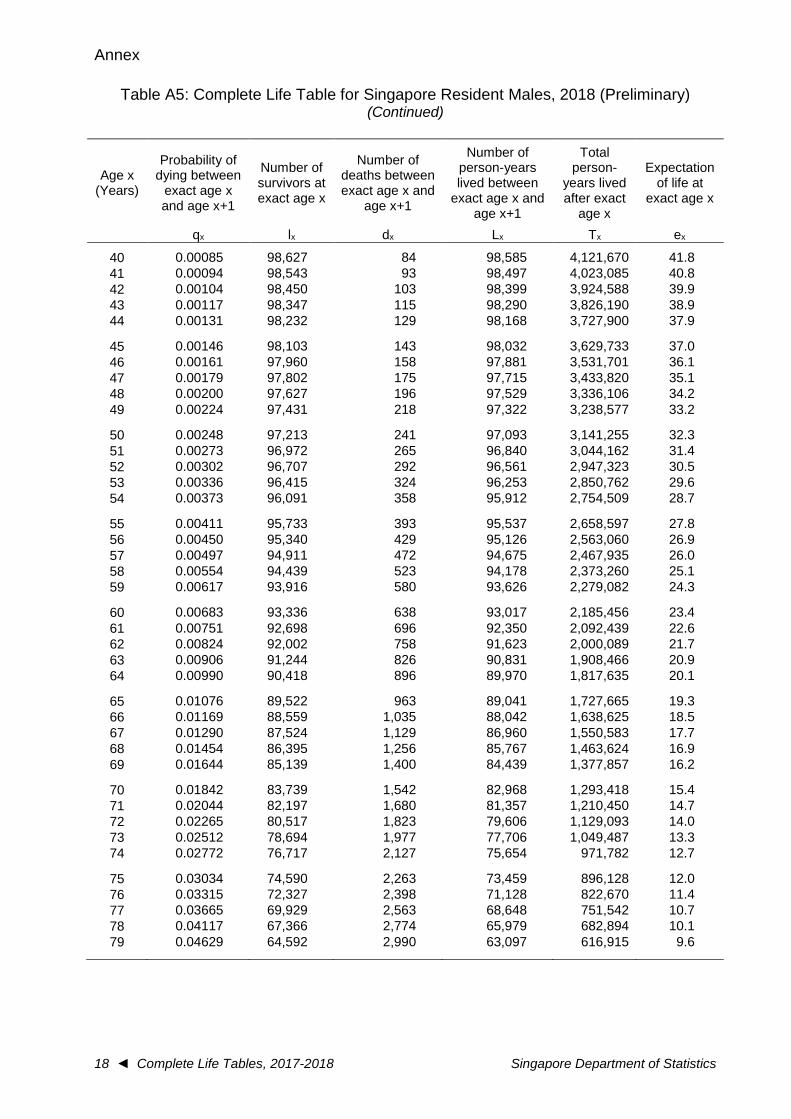
Table A5: Complete Life Table for Singapore Resident Males, 2018 (Preliminary)
Age x (Years)
Probability of dying between
exact age x and age x+1
Number of survivors at exact age x
Number of deaths between exact age x and
age x+1
Number of person-years lived between
exact age x and age x+1
Total person-
years lived after exact
age x
Expectation of life at
exact age x
qx lx dx Lx Tx ex
0 0.00230 100,000 230 99,807 8,098,159 81.0
1 0.00011 99,770 11 99,765 7,998,352 80.2
2 0.00010 99,759 10 99,754 7,898,588 79.2
3 0.00009 99,749 9 99,745 7,798,834 78.2
4 0.00008 99,740 8 99,736 7,699,089 77.2
5 0.00007 99,732 7 99,729 7,599,353 76.2
6 0.00006 99,725 6 99,722 7,499,625 75.2
7 0.00006 99,719 6 99,716 7,399,903 74.2
8 0.00006 99,713 6 99,710 7,300,187 73.2
9 0.00006 99,707 6 99,704 7,200,477 72.2
10 0.00007 99,701 7 99,698 7,100,773 71.2
11 0.00007 99,694 7 99,691 7,001,075 70.2
12 0.00009 99,687 9 99,683 6,901,385 69.2
13 0.00012 99,678 12 99,672 6,801,702 68.2
14 0.00016 99,666 16 99,658 6,702,030 67.2
15 0.00021 99,650 21 99,640 6,602,372 66.3
16 0.00025 99,629 25 99,617 6,502,733 65.3
17 0.00028 99,604 28 99,590 6,403,116 64.3
18 0.00030 99,576 30 99,561 6,303,526 63.3
19 0.00031 99,546 31 99,531 6,203,965 62.3
20 0.00032 99,515 32 99,499 6,104,435 61.3
21 0.00034 99,483 33 99,467 6,004,936 60.4
22 0.00034 99,450 34 99,433 5,905,469 59.4
23 0.00035 99,416 34 99,399 5,806,036 58.4
24 0.00034 99,382 34 99,365 5,706,637 57.4
25 0.00034 99,348 34 99,331 5,607,272 56.4
26 0.00034 99,314 34 99,297 5,507,941 55.5
27 0.00035 99,280 34 99,263 5,408,644 54.5
28 0.00036 99,246 36 99,228 5,309,381 53.5
29 0.00039 99,210 38 99,191 5,210,153 52.5
30 0.00041 99,172 41 99,152 5,110,962 51.5
31 0.00044 99,131 43 99,110 5,011,811 50.6
32 0.00046 99,088 46 99,065 4,912,701 49.6
33 0.00049 99,042 48 99,018 4,813,636 48.6
34 0.00052 98,994 51 98,969 4,714,618 47.6
35 0.00054 98,943 54 98,916 4,615,650 46.6
36 0.00057 98,889 57 98,861 4,516,734 45.7
37 0.00062 98,832 61 98,802 4,417,873 44.7
38 0.00068 98,771 68 98,737 4,319,072 43.7
39 0.00077 98,703 76 98,665 4,220,335 42.8
Annex
18 ◄ Complete Life Tables, 2017-2018 Singapore Department of Statistics
Table A5: Complete Life Table for Singapore Resident Males, 2018 (Preliminary) (Continued)
Age x (Years)
Probability of dying between
exact age x and age x+1
Number of survivors at exact age x
Number of deaths between exact age x and
age x+1
Number of person-years lived between
exact age x and age x+1
Total person-
years lived after exact
age x
Expectation of life at
exact age x
qx lx dx Lx Tx ex
40 0.00085 98,627 84 98,585 4,121,670 41.8
41 0.00094 98,543 93 98,497 4,023,085 40.8
42 0.00104 98,450 103 98,399 3,924,588 39.9
43 0.00117 98,347 115 98,290 3,826,190 38.9
44 0.00131 98,232 129 98,168 3,727,900 37.9
45 0.00146 98,103 143 98,032 3,629,733 37.0
46 0.00161 97,960 158 97,881 3,531,701 36.1
47 0.00179 97,802 175 97,715 3,433,820 35.1
48 0.00200 97,627 196 97,529 3,336,106 34.2
49 0.00224 97,431 218 97,322 3,238,577 33.2
50 0.00248 97,213 241 97,093 3,141,255 32.3
51 0.00273 96,972 265 96,840 3,044,162 31.4
52 0.00302 96,707 292 96,561 2,947,323 30.5
53 0.00336 96,415 324 96,253 2,850,762 29.6
54 0.00373 96,091 358 95,912 2,754,509 28.7
55 0.00411 95,733 393 95,537 2,658,597 27.8
56 0.00450 95,340 429 95,126 2,563,060 26.9
57 0.00497 94,911 472 94,675 2,467,935 26.0
58 0.00554 94,439 523 94,178 2,373,260 25.1
59 0.00617 93,916 580 93,626 2,279,082 24.3
60 0.00683 93,336 638 93,017 2,185,456 23.4
61 0.00751 92,698 696 92,350 2,092,439 22.6
62 0.00824 92,002 758 91,623 2,000,089 21.7
63 0.00906 91,244 826 90,831 1,908,466 20.9
64 0.00990 90,418 896 89,970 1,817,635 20.1
65 0.01076 89,522 963 89,041 1,727,665 19.3
66 0.01169 88,559 1,035 88,042 1,638,625 18.5
67 0.01290 87,524 1,129 86,960 1,550,583 17.7
68 0.01454 86,395 1,256 85,767 1,463,624 16.9
69 0.01644 85,139 1,400 84,439 1,377,857 16.2
70 0.01842 83,739 1,542 82,968 1,293,418 15.4
71 0.02044 82,197 1,680 81,357 1,210,450 14.7
72 0.02265 80,517 1,823 79,606 1,129,093 14.0
73 0.02512 78,694 1,977 77,706 1,049,487 13.3
74 0.02772 76,717 2,127 75,654 971,782 12.7
75 0.03034 74,590 2,263 73,459 896,128 12.0
76 0.03315 72,327 2,398 71,128 822,670 11.4
77 0.03665 69,929 2,563 68,648 751,542 10.7
78 0.04117 67,366 2,774 65,979 682,894 10.1
79 0.04629 64,592 2,990 63,097 616,915 9.6
Annex
Singapore Department of Statistics Complete Life Tables, 2017-2018 ► 19
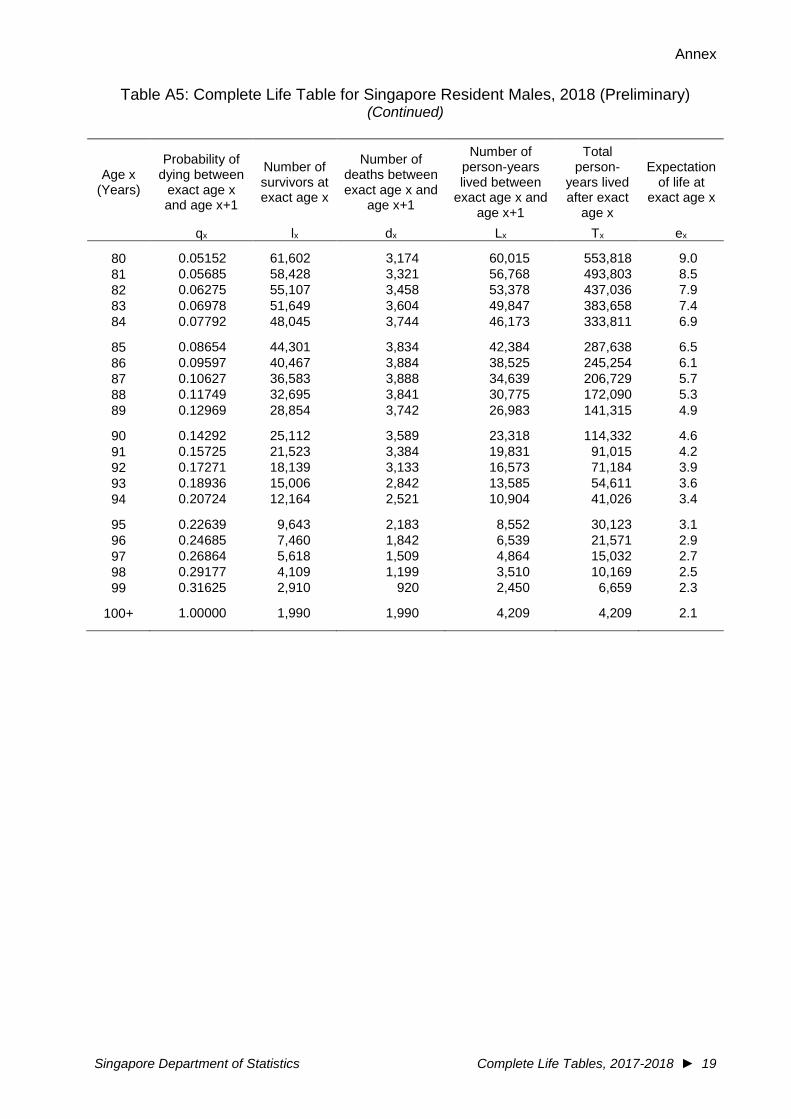
Table A5: Complete Life Table for Singapore Resident Males, 2018 (Preliminary) (Continued)
Age x (Years)
Probability of dying between
exact age x and age x+1
Number of survivors at exact age x
Number of deaths between exact age x and
age x+1
Number of person-years lived between
exact age x and age x+1
Total person-
years lived after exact
age x
Expectation of life at
exact age x
qx lx dx Lx Tx ex
80 0.05152 61,602 3,174 60,015 553,818 9.0
81 0.05685 58,428 3,321 56,768 493,803 8.5
82 0.06275 55,107 3,458 53,378 437,036 7.9
83 0.06978 51,649 3,604 49,847 383,658 7.4
84 0.07792 48,045 3,744 46,173 333,811 6.9
85 0.08654 44,301 3,834 42,384 287,638 6.5
86 0.09597 40,467 3,884 38,525 245,254 6.1
87 0.10627 36,583 3,888 34,639 206,729 5.7
88 0.11749 32,695 3,841 30,775 172,090 5.3
89 0.12969 28,854 3,742 26,983 141,315 4.9
90 0.14292 25,112 3,589 23,318 114,332 4.6
91 0.15725 21,523 3,384 19,831 91,015 4.2
92 0.17271 18,139 3,133 16,573 71,184 3.9
93 0.18936 15,006 2,842 13,585 54,611 3.6
94 0.20724 12,164 2,521 10,904 41,026 3.4
95 0.22639 9,643 2,183 8,552 30,123 3.1
96 0.24685 7,460 1,842 6,539 21,571 2.9
97 0.26864 5,618 1,509 4,864 15,032 2.7
98 0.29177 4,109 1,199 3,510 10,169 2.5
99 0.31625 2,910 920 2,450 6,659 2.3
100+ 1.00000 1,990 1,990 4,209 4,209 2.1
Annex
20 ◄ Complete Life Tables, 2017-2018 Singapore Department of Statistics
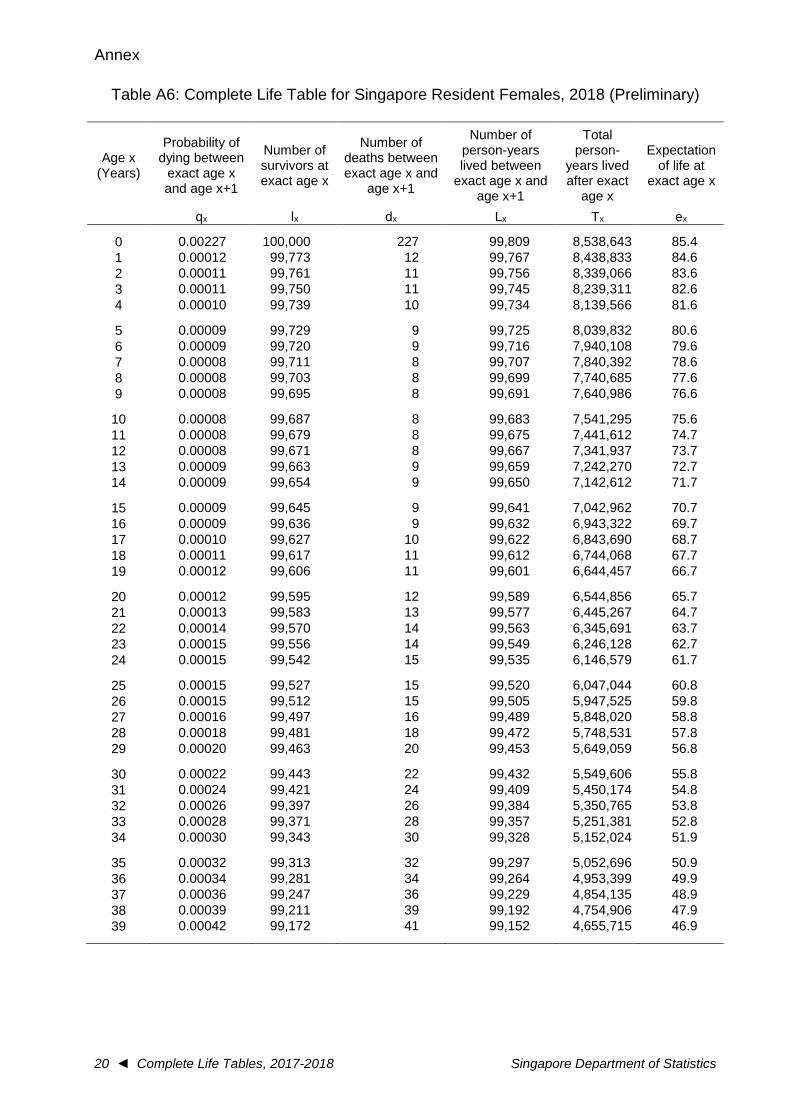
Table A6: Complete Life Table for Singapore Resident Females, 2018 (Preliminary)
Age x (Years)
Probability of dying between
exact age x and age x+1
Number of survivors at exact age x
Number of deaths between exact age x and
age x+1
Number of person-years lived between
exact age x and age x+1
Total person-
years lived after exact
age x
Expectation of life at
exact age x
qx lx dx Lx Tx ex
0 0.00227 100,000 227 99,809 8,538,643 85.4
1 0.00012 99,773 12 99,767 8,438,833 84.6
2 0.00011 99,761 11 99,756 8,339,066 83.6
3 0.00011 99,750 11 99,745 8,239,311 82.6
4 0.00010 99,739 10 99,734 8,139,566 81.6
5 0.00009 99,729 9 99,725 8,039,832 80.6
6 0.00009 99,720 9 99,716 7,940,108 79.6
7 0.00008 99,711 8 99,707 7,840,392 78.6
8 0.00008 99,703 8 99,699 7,740,685 77.6
9 0.00008 99,695 8 99,691 7,640,986 76.6
10 0.00008 99,687 8 99,683 7,541,295 75.6
11 0.00008 99,679 8 99,675 7,441,612 74.7
12 0.00008 99,671 8 99,667 7,341,937 73.7
13 0.00009 99,663 9 99,659 7,242,270 72.7
14 0.00009 99,654 9 99,650 7,142,612 71.7
15 0.00009 99,645 9 99,641 7,042,962 70.7
16 0.00009 99,636 9 99,632 6,943,322 69.7
17 0.00010 99,627 10 99,622 6,843,690 68.7
18 0.00011 99,617 11 99,612 6,744,068 67.7
19 0.00012 99,606 11 99,601 6,644,457 66.7
20 0.00012 99,595 12 99,589 6,544,856 65.7
21 0.00013 99,583 13 99,577 6,445,267 64.7
22 0.00014 99,570 14 99,563 6,345,691 63.7
23 0.00015 99,556 14 99,549 6,246,128 62.7
24 0.00015 99,542 15 99,535 6,146,579 61.7
25 0.00015 99,527 15 99,520 6,047,044 60.8
26 0.00015 99,512 15 99,505 5,947,525 59.8
27 0.00016 99,497 16 99,489 5,848,020 58.8
28 0.00018 99,481 18 99,472 5,748,531 57.8
29 0.00020 99,463 20 99,453 5,649,059 56.8
30 0.00022 99,443 22 99,432 5,549,606 55.8
31 0.00024 99,421 24 99,409 5,450,174 54.8
32 0.00026 99,397 26 99,384 5,350,765 53.8
33 0.00028 99,371 28 99,357 5,251,381 52.8
34 0.00030 99,343 30 99,328 5,152,024 51.9
35 0.00032 99,313 32 99,297 5,052,696 50.9
36 0.00034 99,281 34 99,264 4,953,399 49.9
37 0.00036 99,247 36 99,229 4,854,135 48.9
38 0.00039 99,211 39 99,192 4,754,906 47.9
39 0.00042 99,172 41 99,152 4,655,715 46.9
Annex
Singapore Department of Statistics Complete Life Tables, 2017-2018 ► 21
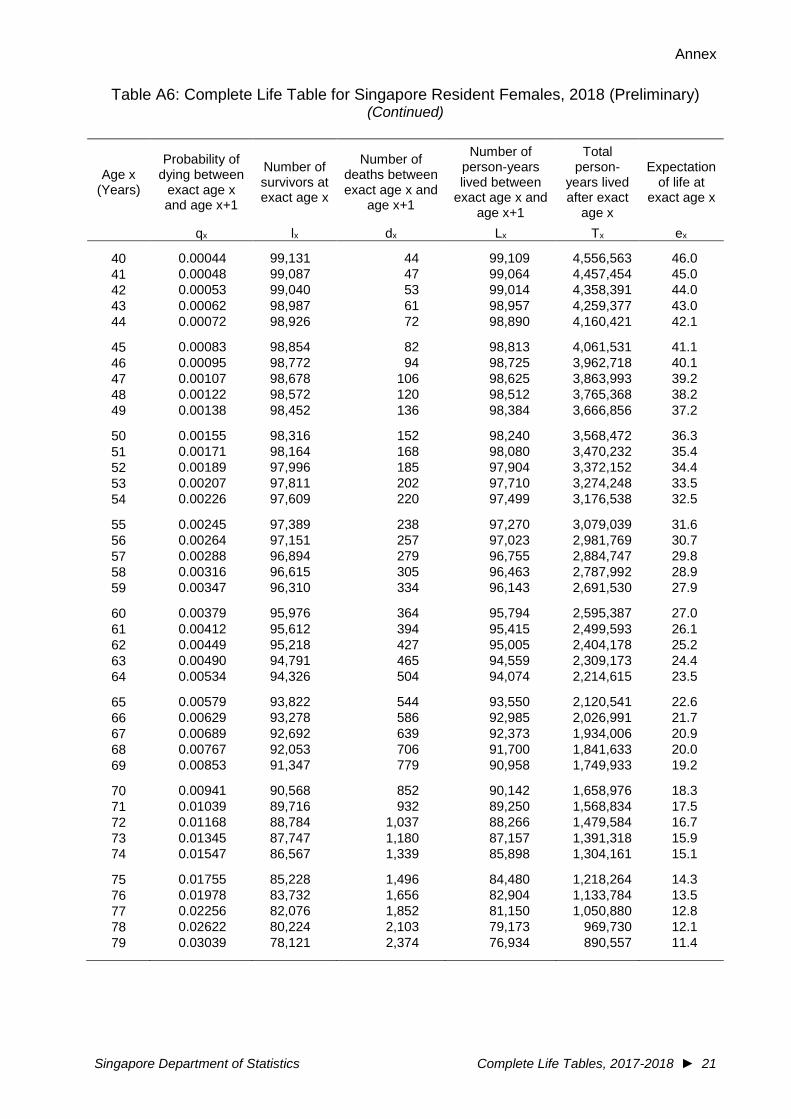
Table A6: Complete Life Table for Singapore Resident Females, 2018 (Preliminary) (Continued)
Age x (Years)
Probability of dying between
exact age x and age x+1
Number of survivors at exact age x
Number of deaths between exact age x and
age x+1
Number of person-years lived between
exact age x and age x+1
Total person-
years lived after exact
age x
Expectation of life at
exact age x
qx lx dx Lx Tx ex
40 0.00044 99,131 44 99,109 4,556,563 46.0
41 0.00048 99,087 47 99,064 4,457,454 45.0
42 0.00053 99,040 53 99,014 4,358,391 44.0
43 0.00062 98,987 61 98,957 4,259,377 43.0
44 0.00072 98,926 72 98,890 4,160,421 42.1
45 0.00083 98,854 82 98,813 4,061,531 41.1
46 0.00095 98,772 94 98,725 3,962,718 40.1
47 0.00107 98,678 106 98,625 3,863,993 39.2
48 0.00122 98,572 120 98,512 3,765,368 38.2
49 0.00138 98,452 136 98,384 3,666,856 37.2
50 0.00155 98,316 152 98,240 3,568,472 36.3
51 0.00171 98,164 168 98,080 3,470,232 35.4
52 0.00189 97,996 185 97,904 3,372,152 34.4
53 0.00207 97,811 202 97,710 3,274,248 33.5
54 0.00226 97,609 220 97,499 3,176,538 32.5
55 0.00245 97,389 238 97,270 3,079,039 31.6
56 0.00264 97,151 257 97,023 2,981,769 30.7
57 0.00288 96,894 279 96,755 2,884,747 29.8
58 0.00316 96,615 305 96,463 2,787,992 28.9
59 0.00347 96,310 334 96,143 2,691,530 27.9
60 0.00379 95,976 364 95,794 2,595,387 27.0
61 0.00412 95,612 394 95,415 2,499,593 26.1
62 0.00449 95,218 427 95,005 2,404,178 25.2
63 0.00490 94,791 465 94,559 2,309,173 24.4
64 0.00534 94,326 504 94,074 2,214,615 23.5
65 0.00579 93,822 544 93,550 2,120,541 22.6
66 0.00629 93,278 586 92,985 2,026,991 21.7
67 0.00689 92,692 639 92,373 1,934,006 20.9
68 0.00767 92,053 706 91,700 1,841,633 20.0
69 0.00853 91,347 779 90,958 1,749,933 19.2
70 0.00941 90,568 852 90,142 1,658,976 18.3
71 0.01039 89,716 932 89,250 1,568,834 17.5
72 0.01168 88,784 1,037 88,266 1,479,584 16.7
73 0.01345 87,747 1,180 87,157 1,391,318 15.9
74 0.01547 86,567 1,339 85,898 1,304,161 15.1
75 0.01755 85,228 1,496 84,480 1,218,264 14.3
76 0.01978 83,732 1,656 82,904 1,133,784 13.5
77 0.02256 82,076 1,852 81,150 1,050,880 12.8
78 0.02622 80,224 2,103 79,173 969,730 12.1
79 0.03039 78,121 2,374 76,934 890,557 11.4
Annex
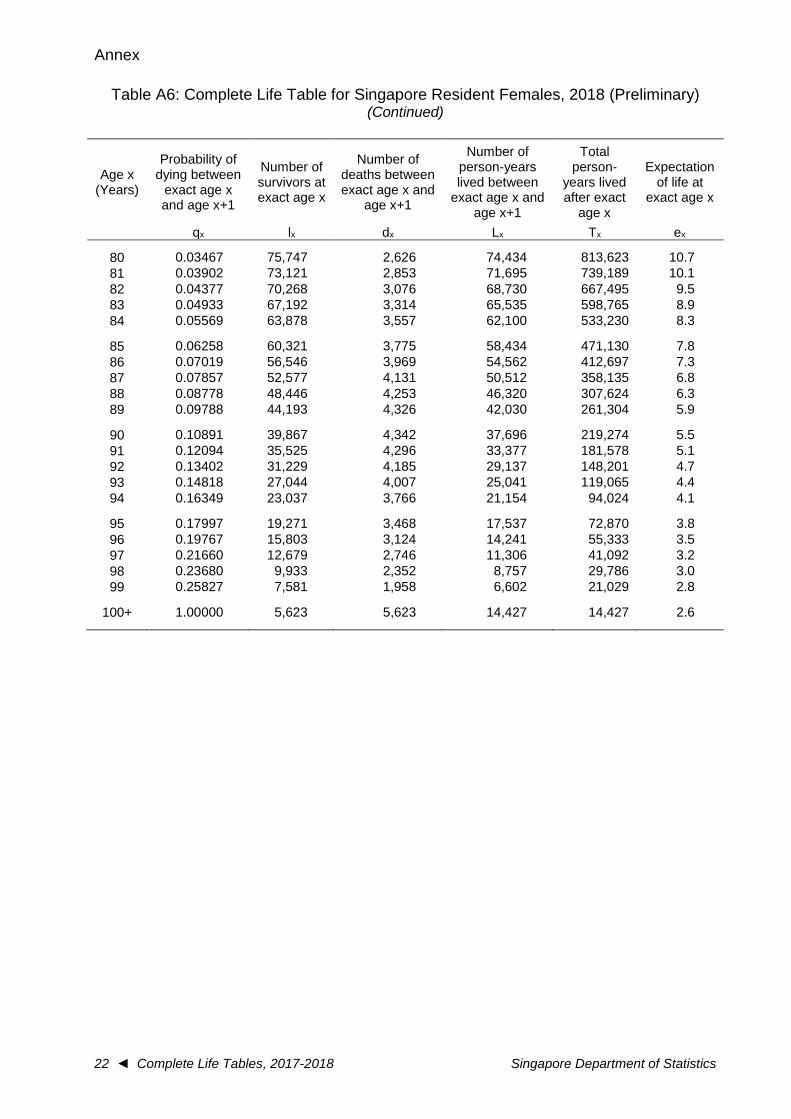
22 ◄ Complete Life Tables, 2017-2018 Singapore Department of Statistics
Table A6: Complete Life Table for Singapore Resident Females, 2018 (Preliminary) (Continued)
Age x (Years)
Probability of dying between
exact age x and age x+1
Number of survivors at exact age x
Number of deaths between exact age x and
age x+1
Number of person-years lived between
exact age x and age x+1
Total person-
years lived after exact
age x
Expectation of life at
exact age x
qx lx dx Lx Tx ex
80 0.03467 75,747 2,626 74,434 813,623 10.7
81 0.03902 73,121 2,853 71,695 739,189 10.1
82 0.04377 70,268 3,076 68,730 667,495 9.5
83 0.04933 67,192 3,314 65,535 598,765 8.9
84 0.05569 63,878 3,557 62,100 533,230 8.3
85 0.06258 60,321 3,775 58,434 471,130 7.8
86 0.07019 56,546 3,969 54,562 412,697 7.3
87 0.07857 52,577 4,131 50,512 358,135 6.8
88 0.08778 48,446 4,253 46,320 307,624 6.3
89 0.09788 44,193 4,326 42,030 261,304 5.9
90 0.10891 39,867 4,342 37,696 219,274 5.5
91 0.12094 35,525 4,296 33,377 181,578 5.1
92 0.13402 31,229 4,185 29,137 148,201 4.7
93 0.14818 27,044 4,007 25,041 119,065 4.4
94 0.16349 23,037 3,766 21,154 94,024 4.1
95 0.17997 19,271 3,468 17,537 72,870 3.8
96 0.19767 15,803 3,124 14,241 55,333 3.5
97 0.21660 12,679 2,746 11,306 41,092 3.2
98 0.23680 9,933 2,352 8,757 29,786 3.0
99 0.25827 7,581 1,958 6,602 21,029 2.8
100+ 1.00000 5,623 5,623 14,427 14,427 2.6
PROJECT TEAM
Senior Assistant Directors
Mr Esmond Seah
Mr Hong Renting
Statisticians
Miss Pearl Lim
Miss Hoon Si Hui
Senior Manager
Ms Seet Ming Lee

SINGAPORE DEPARTMENT OF STATISTICS
INFORMATION DISSEMINATION SERVICES
Statistics Singapore Website
The Statistics Singapore Website was launched by the Singapore Department of Statistics
(DOS) in January 1995. Internet users can access the website by connecting to:
http://www.singstat.gov.sg/
Key Singapore statistics and resources are available via the following sections:
What’s New
Obtain latest data for key economic and social indicators, browse news releases by
DOS and Research and Statistics Units (RSUs) of other public sector agencies.
Find Data
Choose from almost 50 topics to access the relevant statistics, press releases,
infographics, charts, storyboards, videos and references.
Publications
Browse DOS’s publications, papers and articles by topics. All publications are
available for free access.
Advance Release Calendar
View dates of upcoming releases in the half-yearly ahead calendar.
The website also provides a convenient gateway to international statistical websites and
resources:
IMF Dissemination Standards Bulletin Board
View metadata and latest data about Singapore’s key indicators in the real, fiscal,
financial and external sectors, including dissemination practices and information
about pre-release access of current indicators.
International Statistics
Access international databases, websites of international bodies and national
statistical offices.
International Classifications
Access quick links to international economic and social classifications.
SingStat Express
Subscribe to the SingStat Express and receive email and SMS alerts (for local users) on the
latest press releases, notices of publication, occasional and information papers and, newsletters.
Subscription details are available at https://www.singstat.gov.sg/whats-new/sign-up-for-alerts.
SingStat Mobile App
The SingStat Mobile App provides users with ready access to the latest key Singapore
official statistics through their mobile devices while on-the-go. Users may visualise data for the
latest periods with some 200 charts of commonly used statistics from 27 data categories. The app
is continually enhanced to provide more user-friendly features. Users can now receive notifications
on updates to their preferred indicators, organise data categories in the order of their preference,
download tables or share charts via social media and perform computation for quick analyses. The
app is available for downloading in iOS and Android devices. More information is available at
https://www.singstat.gov.sg/our-services-and-tools/singstat-mobile-app.
SINGAPORE DEPARTMENT OF STATISTICS
INFORMATION DISSEMINATION SERVICES (cont’d)
SingStat Table Builder
The SingStat Table Builder contains statistical data series on the Singapore economy and
population for users to create customised data tables, and export them in different file formats and
download multiple tables at one go. APIs are also provided in JSON and CSV formats. Explore
data trends with this e-service at https://www.singstat.gov.sg/tablebuilder.
Really Simple Syndication
Really Simple Syndication (RSS) is an easy way to stay updated on the latest statistical
news released by DOS. The SingStat RSS feed delivers statistical news highlights and hyperlinks
to the source documents whenever the updates are posted. More information is available at
https://www.singstat.gov.sg/whats-new/really-simple-syndication-rss.
E-survey
The E-survey enables business organisations to complete and submit their survey forms
through the internet. Using secured encryption protocols, the E-survey ensures that the information
transmitted through the net is secured and protected. The system features online helps and
validation checks to assist respondents in completing their survey forms. With the E-survey,
respondents do away with the tedious paper work and manual tasks of mailing or faxing their
survey returns to DOS.
Statistical Enquiries and Feedback
If you have any statistical enquiries or feedback on our services, you are welcomed to:
Email us at [email protected]
Fax to us at (65) 6332-7689
Call us at 1800-3238118* (local callers)
(65) 6332-7738 (overseas callers)
* Calls from mobile telephone lines to 1800 local toll free number may be subject to mobile
airtime charges as imposed by the relevant mobile service provider.