Embed Size (px)
Citation preview
Statistics of CommunicationsCommon Carriers
Federal Communications Commission
2000/2001 Edition
Statistics of CommunicationsCommon Carriers
Commissioners
Members of the Federal Communications Commission(As of September 15, 2001)
Michael K. Powell, ChairmanKathleen Q. Abernathy
Michael J. CoppsKevin J. Martin
Federal Communications Commission445 12th Street S.W.
Washington, DC 20554
Statistics of Communications Common Carriers
v
Introduction and Overview
The Statistics of Communications Common Carriers (SOCC), which has been published annually since 1939, isone of the most widely used reference works in the field of telecommunications. It is the only permanent recordof common carrier activity published by the Government Printing Office and sent to repository libraries. Themost recent edition may be purchased by mail from the Superintendent of Documents, Washington, DC 20202-9328, or by calling GPO's Order and Inquiry Desk at (202) 512-1800.
Sources of Information
Much of the material contained in this volume is available well before the SOCC is published by theGovernment Printing Office.
Internet
The Common Carrier Bureau has a home page on the World Wide Web. This home page can be accesseddirectly at www.fcc.gov/ccb or through a link from the main FCC home page at www.fcc.gov. The materialsavailable include orders, notices of proposed rulemaking, statistical reports, public notices, news releases, factsheets, and answers to frequently asked questions (FAQs). Prior to the development of the Internet, anelectronic bulletin board called FCC-State Link had been established to share data electronically with stateagencies, and a portion of the FCC’s Internet site still bears that original name. The FCC-State Link includesall of the files contained in the SOCC and a variety of other reports that are used in the preparation of theSOCC. The FCC-State Link can be reached directly at www.fcc.gov/ccb/stats. The annual carriersubmissions that are used in developing many of the tables in this publication can also be found atwww.fcc.gov/ccb/armis/db.
Duplicating Contractors and Reference Information Center
Several private firms specialize in locating, duplicating, and distributing FCC documents. The Commission'scurrent duplicating contractor is Qualex International (Qualex). Documents may be purchased by callingQualex at (202) 863-2893, or via e-mail at [email protected]. Reports and the summaries used in thepreparation of the SOCC are also available in the FCC's Reference Information Center. This facility is locatedon the Courtyard Level, 445 12th Street S.W., Washington, D.C. The center contains self-service, card- or coin-operated copying machines for use by the general public.
Coverage
Local Telephone Companies
There are approximately 1,300 companies that have historically provided local telephone service in the UnitedStates. These companies, often referred to as incumbent local exchange carriers (ILECs), range in size fromrural cooperatives serving fewer than 100 customers to large holding companies serving millions of telephonelines. In most cases, only larger companies (those with more than $117 million in annual revenues in 2000) arerequired to file information with the FCC, and only telephone companies affiliated with the four largest holdingcompanies are required to file the most extensive information. New telephone service providers, referred to ascompetitive local exchange carriers (CLECs), and providers of wireless telephone service are not required tofile detailed statistical data with the Commission.
Statistics of Communications Common Carriers
vi
In 2000, as shown in the detailed statistics in Tables 2.10 and 2.11, there were 52 reporting ILECs. While thesecompanies account for more than 90% of the local telephone lines served by ILECs, they do not reflect acomplete census of the industry.
Long Distance Companies
More than 700 firms buy access from local telephone companies in order to provide long distance service and alimited amount of information on the larger long distance companies is contained in various tables throughoutthe SOCC. Among long distance carriers, only AT&T and Alascom, which once were regarded as dominantcarriers possessing market power, were ever required to file detailed reports. These data are contained in earliereditions of this publication. The reporting requirements, however, were eliminated when the FCC determinedthat AT&T was no longer a dominant carrier.
Accounting Standards
A new Uniform System of Accounts (USOA) for the telephone industry became effective at the beginning of1988. The detailed tables in this report are based on that system. This year’s tables reflect a number of changesin the Commission’s accounting rules that were adopted in 1999. The most significant of these is thestreamlining of the accounting requirements for certain mid-sized ILECs. The streamlining is based on theaggregate revenue of a company and all its affiliates. Currently, full Class A reporting requirements areimposed only where the aggregate revenues of an ILEC and its affiliates exceed $7 billion. In 2000, onlyBellSouth, Qwest, SBC, and Verizon remained subject to full Class A reporting requirements. The results forthe 30 carriers affiliated with these firms appear in Table 2.10. The amount of state-by-state information variesfrom company to company. Ameritech, now a subsidiary of SBC, has historically maintained a separateoperating company in each state and consequently files information for each state. In contrast, Qwest, formerlyU S WEST, has consolidated its operations into a single company servicing 14 states, and it files aggregatedinformation.
Where the revenues of all affiliated ILECs total less than $7 billion, each of the affiliated ILECs earningrevenues over the reporting threshold is eligible for Class B (streamlined) reporting treatment. Results for themid-sized companies are shown in Table 2.11. The total number of reporting companies (52) is unchangedfrom 1999.
The USOA applies to telephone operating companies. It is not designed to capture the activities of parentholding companies or subsidiaries. Where activities have been transferred from telephone companies to holdingcompanies or subsidiaries, the revenues from those activities cease to be reported by the operating companies.For this reason, along with several other differences between financial and regulatory accounting systems, theresults contained in reports to the FCC may differ markedly from reports to the SEC.
Timing of the SOCC
Most companies report information for the prior calendar year to stockholders and to the Securities andExchange Commission by April 1. At that same time, they provide annual reports on their domestic operationsto the FCC. The basic raw data are made available to the public as soon as received. This statistical summaryis produced after the data has been checked, inquiries on suspect items sent to the carriers, correctedsubmissions received, and the industry tables compiled. Unlike data for domestic operations, corrected data for
Statistics of Communications Common Carriers
vii
international services are typically not received until at least ten months after the end of the year being reported.Summaries of the international data are typically prepared and released in November.
We have shortened the production cycle in order to reduce the delay in publication. This has been done bylagging the publication of international data by one year. Thus, this edition of the SOCC contains theinternational statistics only through 1999. International data for 2000 will be available at the usual time throughthe Internet, from duplicating contractors, and in the FCC’s public reference center, but it will not be publishedin the SOCC until next year.
Other Information Sources
The United States Telephone Association represents most local telephone companies. Like many tradeassociations, it collects information from each of its members. Annually, it prepares, publishes and sellsstatistical publications such as Phone Facts and Statistics of the Local Exchange Carriers.
The Cellular Telecommunications & Internet Association (CTIA) represents the wireless industry. SinceJanuary 1985, it has conducted a semi-annual wireless survey, which consists of data on the wireless industryincluding the number of subscribers, revenues, employees, and average local monthly bill.
The Telecommunications Industry Association’s (TIA) members consist of manufacturers and suppliers of theproducts and services used in telecommunications. TIA publishes annually the MultimediaTelecommunications Market Review and Forecast, which provides an overview of the telecommunicationsindustry.
* * * * * * * * * * * *
The 2000/2001 volume of the Statistics of Communications Common Carriers, was prepared by John Adesalu,Linda Blake, Mike Lehner, and Katie Rangos under the supervision and direction of Alan Feldman. Many ofthe tables appearing in Part 5 are based on the statistical work of other members of the staff of the IndustryAnalysis Division, especially Alex Belinfante and Jim Lande. All have worked long and hard to expand andimprove the publication.
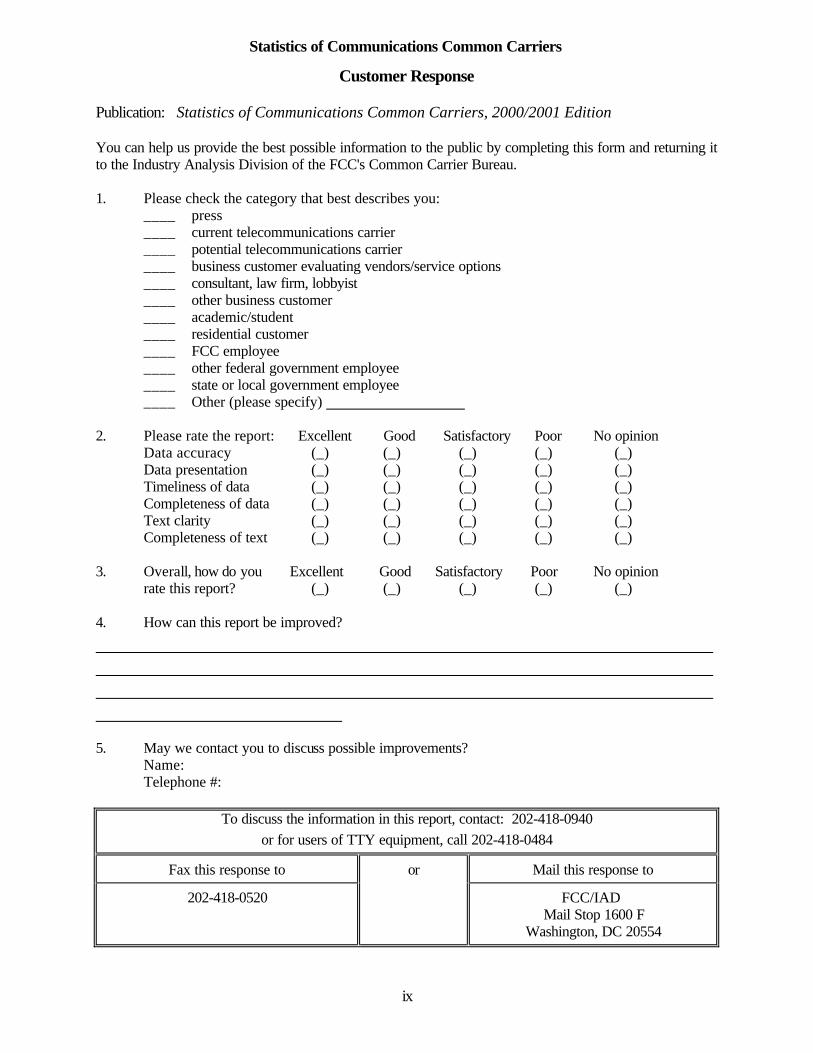
We invite comments and suggestions for further improvements. For your convenience, the survey form on thefollowing page may be used for your response.
Peyton L. Wynns, ChiefIndustry Analysis Division(202) 418-0940
September 15, 2001
Statistics of Communications Common Carriers
ix
Customer Response
Publication: Statistics of Communications Common Carriers, 2000/2001 Edition
You can help us provide the best possible information to the public by completing this form and returning itto the Industry Analysis Division of the FCC's Common Carrier Bureau.
1. Please check the category that best describes you:____ press____ current telecommunications carrier____ potential telecommunications carrier____ business customer evaluating vendors/service options____ consultant, law firm, lobbyist____ other business customer____ academic/student____ residential customer____ FCC employee____ other federal government employee____ state or local government employee____ Other (please specify)
2. Please rate the report: Excellent Good Satisfactory Poor No opinionData accuracy (_) (_) (_) (_) (_)Data presentation (_) (_) (_) (_) (_)Timeliness of data (_) (_) (_) (_) (_)Completeness of data (_) (_) (_) (_) (_)Text clarity (_) (_) (_) (_) (_)Completeness of text (_) (_) (_) (_) (_)
3. Overall, how do you Excellent Good Satisfactory Poor No opinionrate this report? (_) (_) (_) (_) (_)
4. How can this report be improved?
5. May we contact you to discuss possible improvements?Name:Telephone #:
To discuss the information in this report, contact: 202-418-0940
or for users of TTY equipment, call 202-418-0484
Fax this response to or Mail this response to
202-418-0520 FCC/IAD Mail Stop 1600 F
Washington, DC 20554
Statistics of Communications Common Carriers
Table of Contents
Page
Introduction and Overview. . . . . . . . . . . . . . . . . . . . . . . . . . . . . . . . . . . . . . . . . . . . . . . . . . . . . . . . . . . . . . . . . . . . . . . . . . . . . . . . . . . . . . . . . . . . . . . . . . .xi
Part 1. General TablesTable 1.1 - Selected Data of Holding Companies of Reporting Companies as of December 31, 2000. . . . . . . . . . . . . . . . . . . . . . . . . . . . . . . . . . . .3
Table 1.2 - Intercorporate Relations of Communications Carriers and Controlling Companies,December 31, 2000. . . . . . . . . . . . . . . . . . . . . . . . . . . . . . . . . . . . . . . . . . . . . . . . . . . . . . . . . . . . . . . . . . . . . . . . . . . . . . . . . .4
Table 1.3 - Changes Affecting Coverage of Table 1.2. . . . . . . . . . . . . . . . . . . . . . . . . . . . . . . . . . . . . . . . . . . . . . . . . . . . . . . . . . . . . . . . . . . . . . . . . . . . . . . . . . . .6
Table 1.4 - Total Toll Service Revenues by Carrier. . . . . . . . . . . . . . . . . . . . . . . . . . . . . . . . . . . . . . . . . . . . . . . . . . . . . . . . . . . . . . . . . . . . . . . . . . . . . . . . . . . . . . . . .7
Table 1.5 - Shares of Total Toll Service Revenues - Long Distance Carriers Only. . . . . . . . . . . . . . . . . . . . . . . . . . . . . . . . . . . . . . .9
Table 1.6 - Shares of Total Toll Service Revenues - All Long Distance Toll Providers. . . . . . . . . . . . . . . . . . . . . . . . . . . . . . . . . . . . .9
Part 2. Telephone CarriersTable 2.1 - List of Telephone Carriers Reporting to the Commission for the Year Ended
December 31, 2000, Whose Reports Were Used in the Statistical Tabulations in Parts 1 and 2. . . . . . . . . . . . . . . . . . . . . . . . . . . . . . . . . . . . . . . . . . . . . . . . . .13
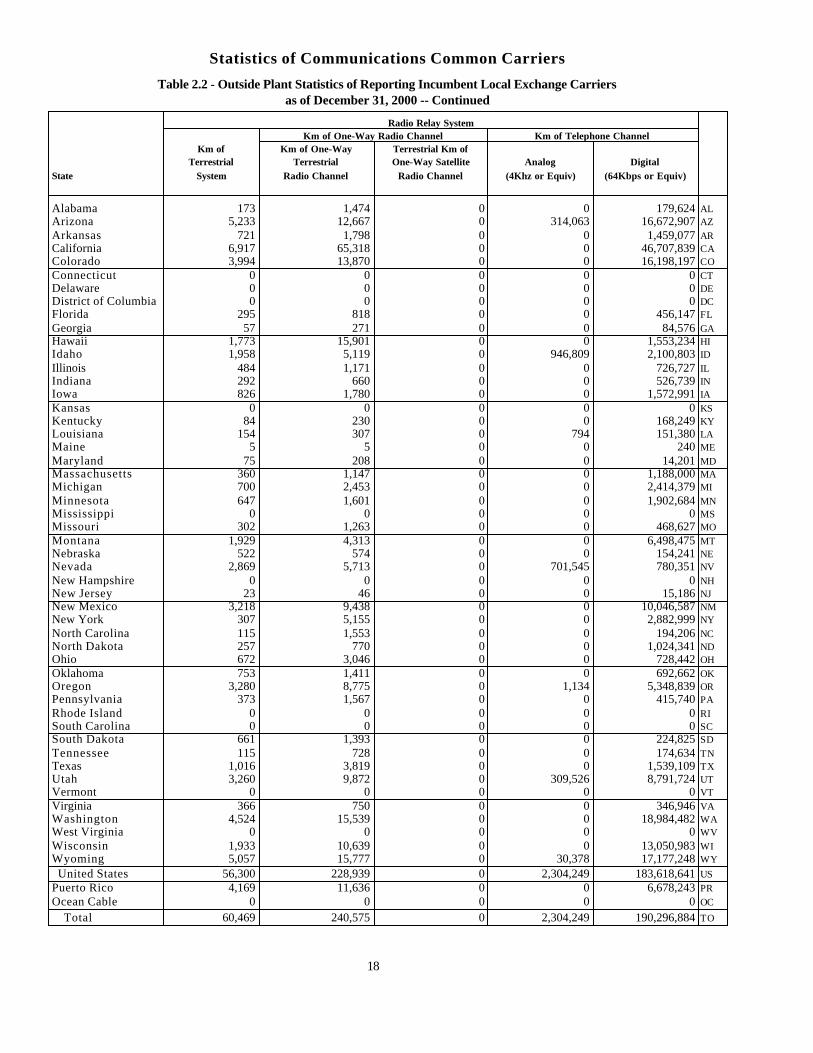
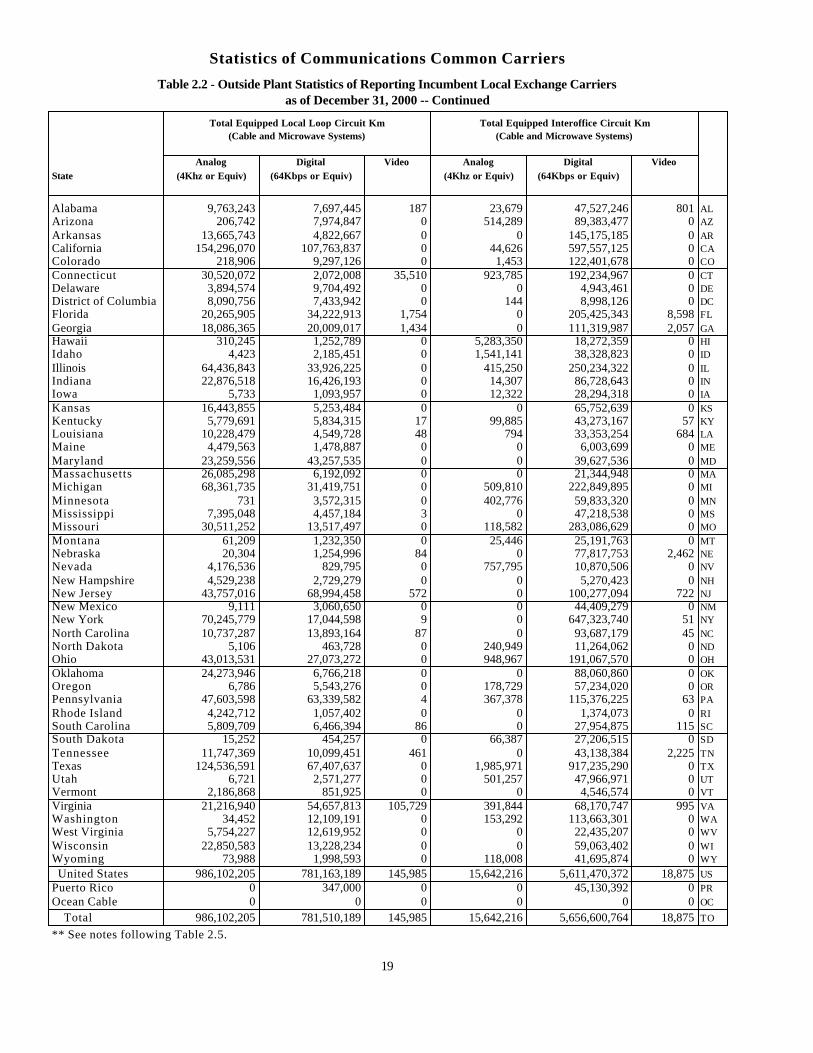
Table 2.2 - Outside Plant Statistics of Reporting Incumbent Local Exchange Carriers as of December 31, 2000. . . . . . . . . . . . . . . . . . . . . . . . . . . . . . .15
Table 2.3 - Switched Access Lines by Type of Technology for Reporting Incumbent Local Exchange Carriersas of December 31, 2000. . . . . . . . . . . . . . . . . . . . . . . . . . . . . . . . . . . . . . . . . . . . . . . . . . . . . . . . . . . . . . . . . . . . . . . . . . . . . . . . . . . . . . . . . . . . . . . . . . . . . . .20
Table 2.4 - Access Lines by Type of Customer for Reporting Incumbent Local Exchange Carriers as ofDecember 31, 2000. . . . . . . . . . . . . . . . . . . . . . . . . . . . . . . . . . . . . . . . . . . . . . . . . . . . . . . . . . . . . . . . . . . . . . . . . . . . . . . . . . . . . . . . . . . . . . . . . . . . . . .22
Table 2.5 - Telephone Calls and Minutes for Reporting Incumbent Local Exchange Carriers--Year EndedDecember 31, 2000. . . . . . . . . . . . . . . . . . . . . . . . . . . . . . . . . . . . . . . . . . . . . . . . . . . . . . . . . . . . . . . . . . . . . . . . . . . . . . . . . . . . . . . . . . . . . . . . . . . . . . .24
Table 2.6 - Operating Statistics of Reporting Incumbent Local Exchange Carriers as of December 31, 2000. . . . . . . . . . . . . . . . . . . . . . . . . . . . . . . . . . .27
Table 2.7 - Communications Plant of Reporting Incumbent Local Exchange Carriers--Year Ended December 31, 2000. . . . . . . . . . . . . . . . . . . . . . . . . . . . . . .42
Table 2.8 - Expenses of Reporting Incumbent Local Exhange Carriers--Year Ended December 31, 1999. . . . . . . . . . . . . . . . . . . . . . . .45
Table 2.9 - Summary of Statistics of All Reporting Incumbent Local Exchange Carriers as of December 31, 2000and for the Year Then Ended. . . . . . . . . . . . . . . . . . . . . . . . . . . . . . . . . . . . . . . . . . . . . . . . . . . . . . . . . . . . . . . . . . . . . . . . . . . . . . . . . . . . . . . . . . . . . . . . . .51
Table 2.10 - Statistics of Reporting Large Incumbent Local Exchange Carriers as of December 31, 2000and for the Year Then Ended. . . . . . . . . . . . . . . . . . . . . . . . . . . . . . . . . . . . . . . . . . . . . . . . . . . . . . . . . . . . . . . . . . . . . . . . . . . . . . . . . . . . . . . . . . . . . . . . . .55
Table 2.11 - Statistics of Reporting Mid-Sized Incumbent Local Exchange Carriers as of December 31, 2000and for the Year Then Ended. . . . . . . . . . . . . . . . . . . . . . . . . . . . . . . . . . . . . . . . . . . . . . . . . . . . . . . . . . . . . . . . . . . . . . . . . . . . . . . . . . . . . . . . . . . . . . . . . .105
Table 2.12 - Jurisdictional Separations Statistics of Reporting Incumbent Local Exchange Carriersas of December 31, 2000 and for the Year Then Ended. . . . . . . . . . . . . . . . . . . . . . . . . . . . . . . . . . . . . . . . . . . . . . . . . . . . . . . . . . . . . . . . . . . . . . . . . . . . . . . . . . . . . . . . . . . . . . . . .121
Table 2.13 - Revenues of Reporting Incumbent Local Exchange Carriers for the Year Ended December 31, 2000. . . . . . . . . . . . . . . . . . . . . . . . . . . . . .130
Table 2.14 - Total Operating Expenses of Reporting Incumbent Local Exchange Carriers for the Year EndedDecember 31, 2000. . . . . . . . . . . . . . . . . . . . . . . . . . . . . . . . . . . . . . . . . . . . . . . . . . . . . . . . . . . . . . . . . . . . . . . . . . . . . . . . . . . . . . . . . . . . . . . . . . . . . . .135
Table 2.15 - Taxes of Reporting Incumbent Local Exchange Carriers for the Year Ended December 31, 2000. . . . . . . . . . . . . . . . . . . . . . . . . . . . . . . . . .136 Table 2.16 - Total Plant in Service of Reporting Incumbent Local Exchange Carriers as of December 31, 2000. . . . . . . . . . . . . . . . . . . . . . . . . . . . . . . . . . . . . . . . . .137
Table 2.17 - Total Other Investments of Reporting Incumbent Local Exchange Carriers as of December 31, 2000. . . . . . . . . . . . . . . . . . . . . . . . . . . . .138
Table 2.18 - Total Reserves of Reporting Incumbent Local Exchange Carriers Reporting as of December 31, 2000. . . . . . . . . . . . . . . . . . . . . . . . . . . . .139
Table 2.19 - Billable Access Lines and Switched Traffic-Sensitive Minutes of Reporting Incumbent LocalExchange Carriers as of December 31, 2000. . . . . . . . . . . . . . . . . . . . . . . . . . . . . . . . . . . . . . . . . . . . . . . . . . . . . . . . . . . . . . .140
Part 3. International TelecommunicationsTable 3.1 - International Message Telephone Service of the Domestic United States for the Year Ending
December 31, 1999. . . . . . . . . . . . . . . . . . . . . . . . . . . . . . . . . . . . . . . . . . . . . . . . . . . . . . . . . . . . . . . . . . . . . . . . . . . . . . . . . . . . . . . . . . . . . . . . . . . . . .147
xi
Statistics of Communications Common Carriers
Table of Contents -- Continued
Page
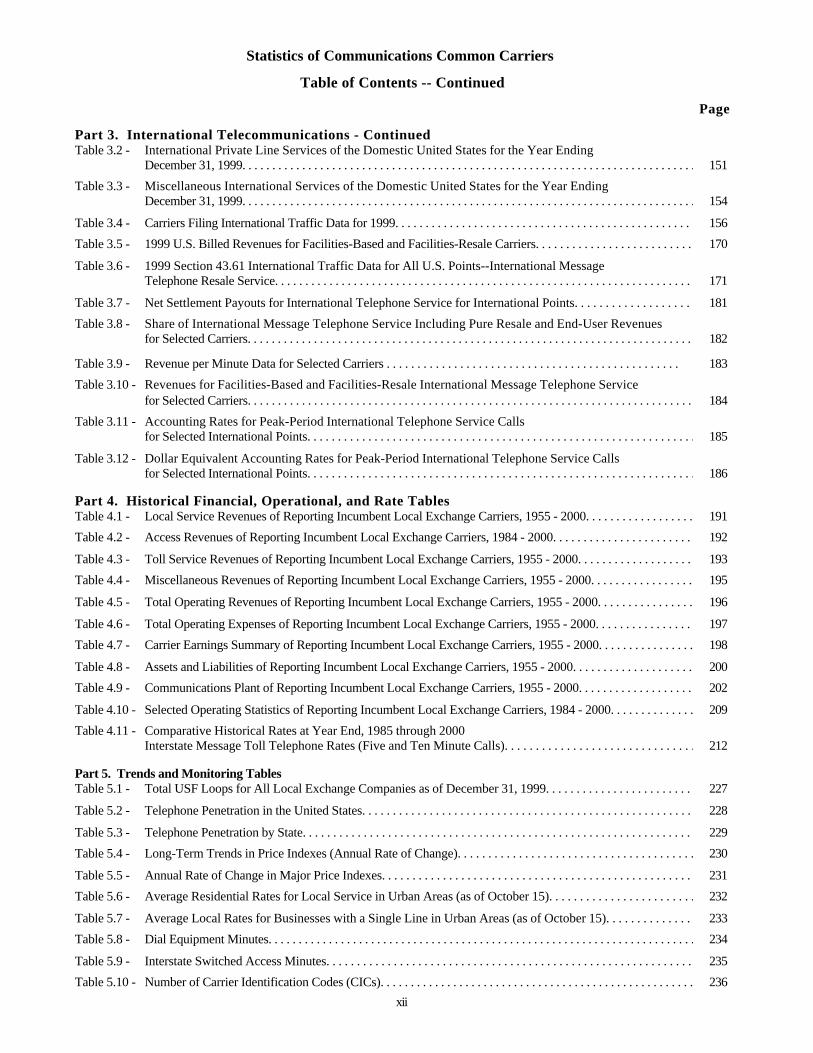
Part 3. International Telecommunications - ContinuedTable 3.2 - International Private Line Services of the Domestic United States for the Year Ending
December 31, 1999. . . . . . . . . . . . . . . . . . . . . . . . . . . . . . . . . . . . . . . . . . . . . . . . . . . . . . . . . . . . . . . . . . . . . . . . . . . . . . . . . . . . . . . . . . . . . . . . . . . . . .151
Table 3.3 - Miscellaneous International Services of the Domestic United States for the Year EndingDecember 31, 1999. . . . . . . . . . . . . . . . . . . . . . . . . . . . . . . . . . . . . . . . . . . . . . . . . . . . . . . . . . . . . . . . . . . . . . . . . . . . . . . . . . . . . . . . . . . . . . . . . . . . . .154
Table 3.4 - Carriers Filing International Traffic Data for 1999. . . . . . . . . . . . . . . . . . . . . . . . . . . . . . . . . . . . . . . . . . . . . . . . . . . . . . . . . . . . . . . . .156
Table 3.5 - 1999 U.S. Billed Revenues for Facilities-Based and Facilities-Resale Carriers. . . . . . . . . . . . . . . . . . . . . . . . . . . . . . . . . . . . . . . . . . . . . . . . . . . . . . . . . . . . . . .170
Table 3.6 - 1999 Section 43.61 International Traffic Data for All U.S. Points--International MessageTelephone Resale Service. . . . . . . . . . . . . . . . . . . . . . . . . . . . . . . . . . . . . . . . . . . . . . . . . . . . . . . . . . . . . . . . . . . . . . . . . . . . . . . . . . . . . . . .171
Table 3.7 - Net Settlement Payouts for International Telephone Service for International Points. . . . . . . . . . . . . . . . . . . . . . . . . . . . . . . . . . . . . . . . . . . . . . .181
Table 3.8 - Share of International Message Telephone Service Including Pure Resale and End-User Revenuesfor Selected Carriers. . . . . . . . . . . . . . . . . . . . . . . . . . . . . . . . . . . . . . . . . . . . . . . . . . . . . . . . . . . . . . . . . . . . . . . . . . . . . . . . . . . . . . . .182
Table 3.9 - Revenue per Minute Data for Selected Carriers . . . . . . . . . . . . . . . . . . . . . . . . . . . . . . . . . . . . . . . . . . . . . . . . 183
Table 3.10 - Revenues for Facilities-Based and Facilities-Resale International Message Telephone Servicefor Selected Carriers. . . . . . . . . . . . . . . . . . . . . . . . . . . . . . . . . . . . . . . . . . . . . . . . . . . . . . . . . . . . . . . . . . . . . . . . . . . . 184
Table 3.11 - Accounting Rates for Peak-Period International Telephone Service Callsfor Selected International Points. . . . . . . . . . . . . . . . . . . . . . . . . . . . . . . . . . . . . . . . . . . . . . . . . . . . . . . . . . . . . . . . . . . . . .185
Table 3.12 - Dollar Equivalent Accounting Rates for Peak-Period International Telephone Service Callsfor Selected International Points. . . . . . . . . . . . . . . . . . . . . . . . . . . . . . . . . . . . . . . . . . . . . . . . . . . . . . . . . . . . . . . . . . . . . .186
Part 4. Historical Financial, Operational, and Rate TablesTable 4.1 - Local Service Revenues of Reporting Incumbent Local Exchange Carriers, 1955 - 2000. . . . . . . . . . . . . . . . . . . . . . . . . . . . . . . . . . . . . . . . . . . . . . . . . . . . . . . . . . . . . . . . . . . . . . . . . . . . . . . . . . . .191
Table 4.2 - Access Revenues of Reporting Incumbent Local Exchange Carriers, 1984 - 2000. . . . . . . . . . . . . . . . . . . . . . . . . . . . . . . . . . . . . . . . . . . . . . . . . . . . . . . . . . . . . . . . . . . . . . . . . . . . . . . . . . . . . . . . . . . .192
Table 4.3 - Toll Service Revenues of Reporting Incumbent Local Exchange Carriers, 1955 - 2000. . . . . . . . . . . . . . . . . . . . . . . . . . . . . . . . . . . . . . . . . . . . . . . . . . . . . . . . . . . . . . . . . . . . . . . . . . . . . . . . . . . . . .193
Table 4.4 - Miscellaneous Revenues of Reporting Incumbent Local Exchange Carriers, 1955 - 2000. . . . . . . . . . . . . . . . . . . . . . . . . . . . . . . . . . . . . . . . . . . . . . . . . . . . . . . . . . . . . . . . . . . . . . . . . . . . . . . . . . .195
Table 4.5 - Total Operating Revenues of Reporting Incumbent Local Exchange Carriers, 1955 - 2000. . . . . . . . . . . . . . . . . . . . . . . . . . . . . . . . . . . . . . . . . . . . . . . . . . . . . . . . . . . . . . . . . . . . . . . . . . . . . . . . . 196
Table 4.6 - Total Operating Expenses of Reporting Incumbent Local Exchange Carriers, 1955 - 2000. . . . . . . . . . . . . . . . . . . . . . . . . . . . . . . . . . . . . . . . . . . . . . . . . . . . . . . . . . . . . . . . . . . . . . . . . . . . . . . . .197
Table 4.7 - Carrier Earnings Summary of Reporting Incumbent Local Exchange Carriers, 1955 - 2000. . . . . . . . . . . . . . . . . . . . . . . . . . . . . . . . . . . . . . . . . . . . . . . . . . . . . . . . . . . . . . . . . . . .198
Table 4.8 - Assets and Liabilities of Reporting Incumbent Local Exchange Carriers, 1955 - 2000. . . . . . . . . . . . . . . . . . . . . . . . . . . . . . . . . . . . . . . . . . . . . . . . . . . . . . . . . . . . . . . . . . . . . . . . . . . . . . . . . . . . . . .200
Table 4.9 - Communications Plant of Reporting Incumbent Local Exchange Carriers, 1955 - 2000. . . . . . . . . . . . . . . . . . . . . . . . . . . . . . . . . . . . . . . . . . . . . . . . . . . . . . . . . . . . . . . . . . . . . . . . . . . . . . . . . . . . .202
Table 4.10 - Selected Operating Statistics of Reporting Incumbent Local Exchange Carriers, 1984 - 2000. . . . . . . . . . . . . . . . . . . . . . . . . . . . . . . . . . . . . . . . . . . . . . . . . . . . . . . . . . . . . . . . . . . . . . . . . . . .209
Table 4.11 - Comparative Historical Rates at Year End, 1985 through 2000Interstate Message Toll Telephone Rates (Five and Ten Minute Calls). . . . . . . . . . . . . . . . . . . . . . . . . . . . . . . . . . . . . . . . . . . . . .212
Part 5. Trends and Monitoring TablesTable 5.1 - Total USF Loops for All Local Exchange Companies as of December 31, 1999. . . . . . . . . . . . . . . . . . . . . . . . . 227
Table 5.2 - Telephone Penetration in the United States. . . . . . . . . . . . . . . . . . . . . . . . . . . . . . . . . . . . . . . . . . . . . . . . . . . . . . . . . . . . . . . . . . . . . . . 228
Table 5.3 - Telephone Penetration by State. . . . . . . . . . . . . . . . . . . . . . . . . . . . . . . . . . . . . . . . . . . . . . . . . . . . . . . . . . . . . . . . . . . . . . . . . . . . . . . . . . . .229
Table 5.4 - Long-Term Trends in Price Indexes (Annual Rate of Change). . . . . . . . . . . . . . . . . . . . . . . . . . . . . . . . . . . . . . . . . . . . . . . . . . . . . . .230
Table 5.5 - Annual Rate of Change in Major Price Indexes. . . . . . . . . . . . . . . . . . . . . . . . . . . . . . . . . . . . . . . . . . . . . . . . . . . . . . . . . . . . . . . . . . . . 231
Table 5.6 - Average Residential Rates for Local Service in Urban Areas (as of October 15). . . . . . . . . . . . . . . . . . . . . . . . . . . . . . . . . . . . . . . . . . . . . . . . . .232
Table 5.7 - Average Local Rates for Businesses with a Single Line in Urban Areas (as of October 15). . . . . . . . . . . . . . . . . . . . . . . . . . . . . . . . . . . . . . . .233
Table 5.8 - Dial Equipment Minutes. . . . . . . . . . . . . . . . . . . . . . . . . . . . . . . . . . . . . . . . . . . . . . . . . . . . . . . . . . . . . . . . . . . . . . . . . . . . . . . . . . . . . . . . . . . . . .234
Table 5.9 - Interstate Switched Access Minutes. . . . . . . . . . . . . . . . . . . . . . . . . . . . . . . . . . . . . . . . . . . . . . . . . . . . . . . . . . . . . . . . . . . . . . . . . . . . . . . .235
Table 5.10 - Number of Carrier Identification Codes (CICs). . . . . . . . . . . . . . . . . . . . . . . . . . . . . . . . . . . . . . . . . . . . . . . . . . . . . . . . . . . . . . . . . . . . .236
xii
Statistics of Communications Common Carriers
Table of Contents -- Continued
Page
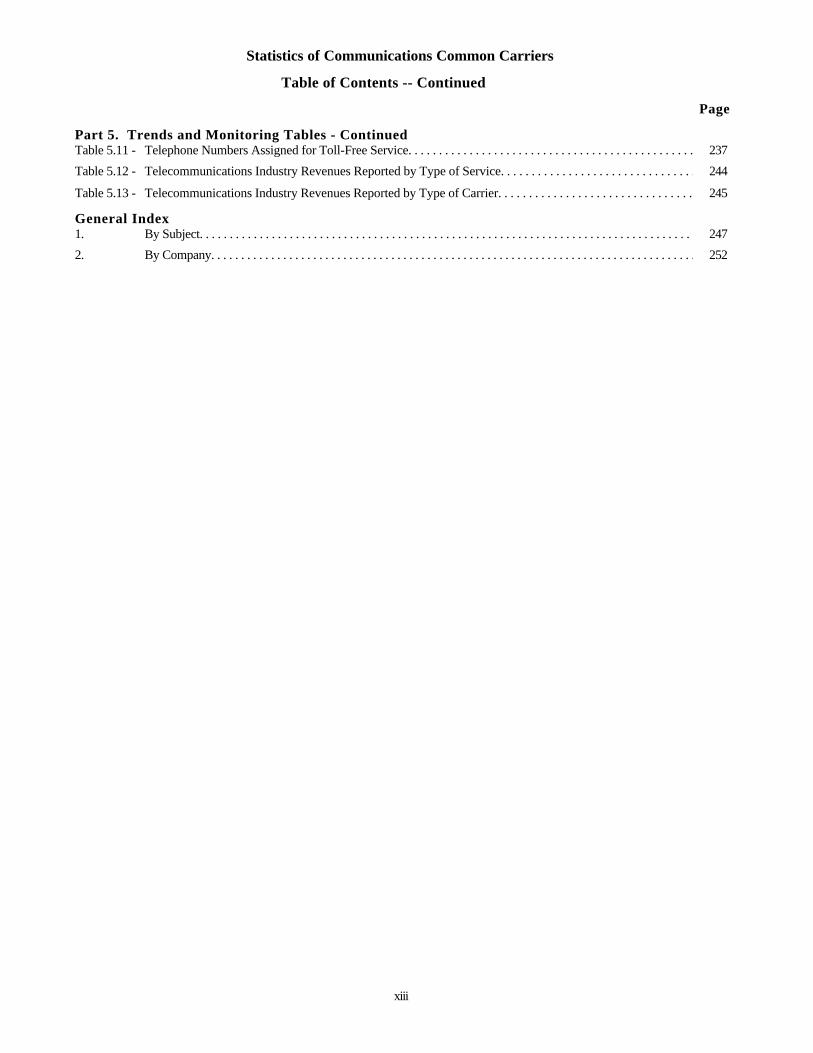
Part 5. Trends and Monitoring Tables - ContinuedTable 5.11 - Telephone Numbers Assigned for Toll-Free Service. . . . . . . . . . . . . . . . . . . . . . . . . . . . . . . . . . . . . . . . . . . . . . . . . . . . . . . . . . . . . . . . . . . . . .237
Table 5.12 - Telecommunications Industry Revenues Reported by Type of Service. . . . . . . . . . . . . . . . . . . . . . . . . . . . . . . . . . . . . . . . . . . . . . . . . . . . . . . . . . . . . . . . . . . . . . . . . . . . . . 244
Table 5.13 - Telecommunications Industry Revenues Reported by Type of Carrier. . . . . . . . . . . . . . . . . . . . . . . . . . . . . . . . . . . . . . . . . . . . . . . . . . . . . . . . . . . . . . . . . . . . . . . . . . 245
General Index1. By Subject. . . . . . . . . . . . . . . . . . . . . . . . . . . . . . . . . . . . . . . . . . . . . . . . . . . . . . . . . . . . . . . . . . . . . . . . . . . . . . . . . . . . . . . . . . . . . . . . . . . . . . . . . . . . . . . . . . . .247
2. By Company. . . . . . . . . . . . . . . . . . . . . . . . . . . . . . . . . . . . . . . . . . . . . . . . . . . . . . . . . . . . . . . . . . . . . . . . . . . . . . . . . . . . . . . . . . . . . . . . . . . . . . . . . . . . . . . . . . .252
xiii

Part 1
General Tables
Statistics of Communications Common Carriers
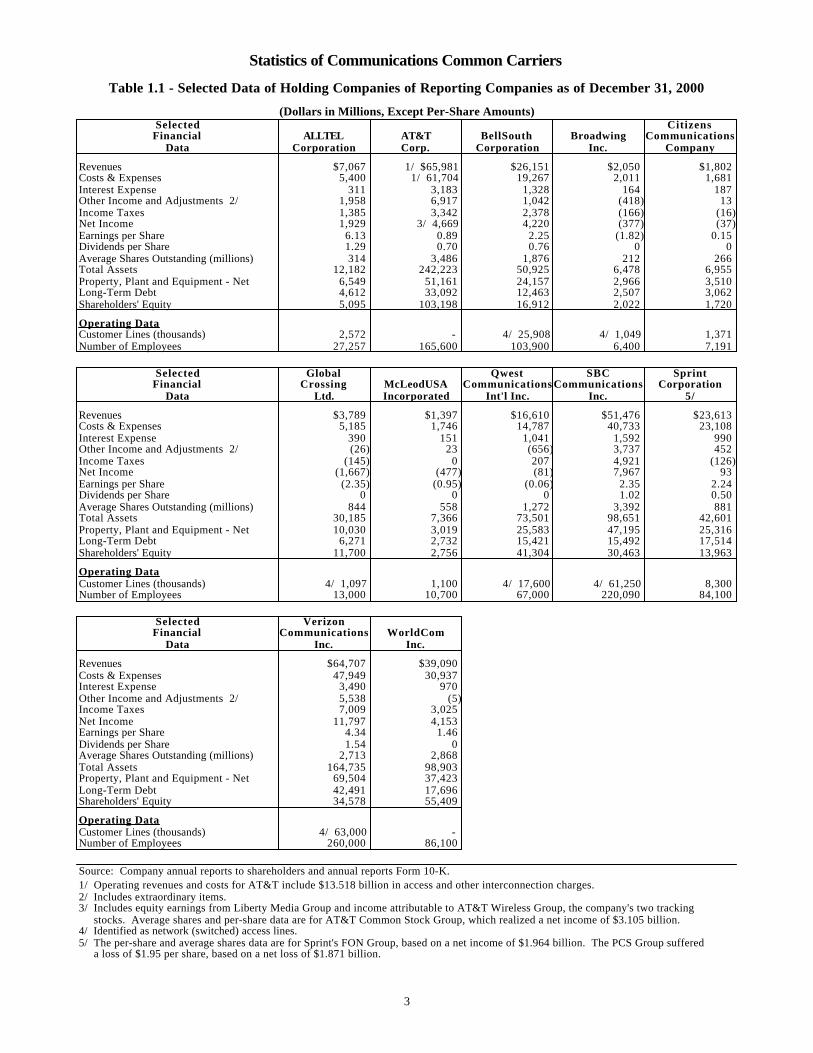
Table 1.1 - Selected Data of Holding Companies of Reporting Companies as of December 31, 2000
(Dollars in Millions, Except Per-Share Amounts)Selected Citizens
Financial ALLTEL AT&T BellSouth Broadwing CommunicationsData Corporation Corp. Corporation Inc. Company
Revenues $7,067 1/ $65,981 $26,151 $2,050 $1,802Costs & Expenses 5,400 1/ 61,704 19,267 2,011 1,681Interest Expense 311 3,183 1,328 164 187Other Income and Adjustments 2/ 1,958 6,917 1,042 (418) 13Income Taxes 1,385 3,342 2,378 (166) (16)Net Income 1,929 3/ 4,669 4,220 (377) (37)Earnings per Share 6.13 0.89 2.25 (1.82) 0.15Dividends per Share 1.29 0.70 0.76 0 0Average Shares Outstanding (millions) 314 3,486 1,876 212 266Total Assets 12,182 242,223 50,925 6,478 6,955Property, Plant and Equipment - Net 6,549 51,161 24,157 2,966 3,510Long-Term Debt 4,612 33,092 12,463 2,507 3,062Shareholders' Equity 5,095 103,198 16,912 2,022 1,720
Operating DataCustomer Lines (thousands) 2,572 - 4/ 25,908 4/ 1,049 1,371Number of Employees 27,257 165,600 103,900 6,400 7,191
Selected Global Qwest SBC SprintFinancial Crossing McLeodUSA Communications Communications Corporation
Data Ltd. Incorporated Int'l Inc. Inc. 5/
Revenues $3,789 $1,397 $16,610 $51,476 $23,613Costs & Expenses 5,185 1,746 14,787 40,733 23,108Interest Expense 390 151 1,041 1,592 990Other Income and Adjustments 2/ (26) 23 (656) 3,737 452Income Taxes (145) 0 207 4,921 (126)Net Income (1,667) (477) (81) 7,967 93Earnings per Share (2.35) (0.95) (0.06) 2.35 2.24Dividends per Share 0 0 0 1.02 0.50Average Shares Outstanding (millions) 844 558 1,272 3,392 881Total Assets 30,185 7,366 73,501 98,651 42,601Property, Plant and Equipment - Net 10,030 3,019 25,583 47,195 25,316Long-Term Debt 6,271 2,732 15,421 15,492 17,514Shareholders' Equity 11,700 2,756 41,304 30,463 13,963
Operating DataCustomer Lines (thousands) 4/ 1,097 1,100 4/ 17,600 4/ 61,250 8,300Number of Employees 13,000 10,700 67,000 220,090 84,100
Selected VerizonFinancial Communications WorldCom
Data Inc. Inc.
Revenues $64,707 $39,090Costs & Expenses 47,949 30,937Interest Expense 3,490 970Other Income and Adjustments 2/ 5,538 (5)Income Taxes 7,009 3,025Net Income 11,797 4,153Earnings per Share 4.34 1.46Dividends per Share 1.54 0Average Shares Outstanding (millions) 2,713 2,868Total Assets 164,735 98,903Property, Plant and Equipment - Net 69,504 37,423Long-Term Debt 42,491 17,696Shareholders' Equity 34,578 55,409
Operating DataCustomer Lines (thousands) 4/ 63,000 - Number of Employees 260,000 86,100
Source: Company annual reports to shareholders and annual reports Form 10-K.1/ Operating revenues and costs for AT&T include $13.518 billion in access and other interconnection charges.2/ Includes extraordinary items.3/ Includes equity earnings from Liberty Media Group and income attributable to AT&T Wireless Group, the company's two tracking stocks. Average shares and per-share data are for AT&T Common Stock Group, which realized a net income of $3.105 billion.4/ Identified as network (switched) access lines.5/ The per-share and average shares data are for Sprint's FON Group, based on a net income of $1.964 billion. The PCS Group suffered a loss of $1.95 per share, based on a net loss of $1.871 billion.
3
Statistics of Communications Common Carriers
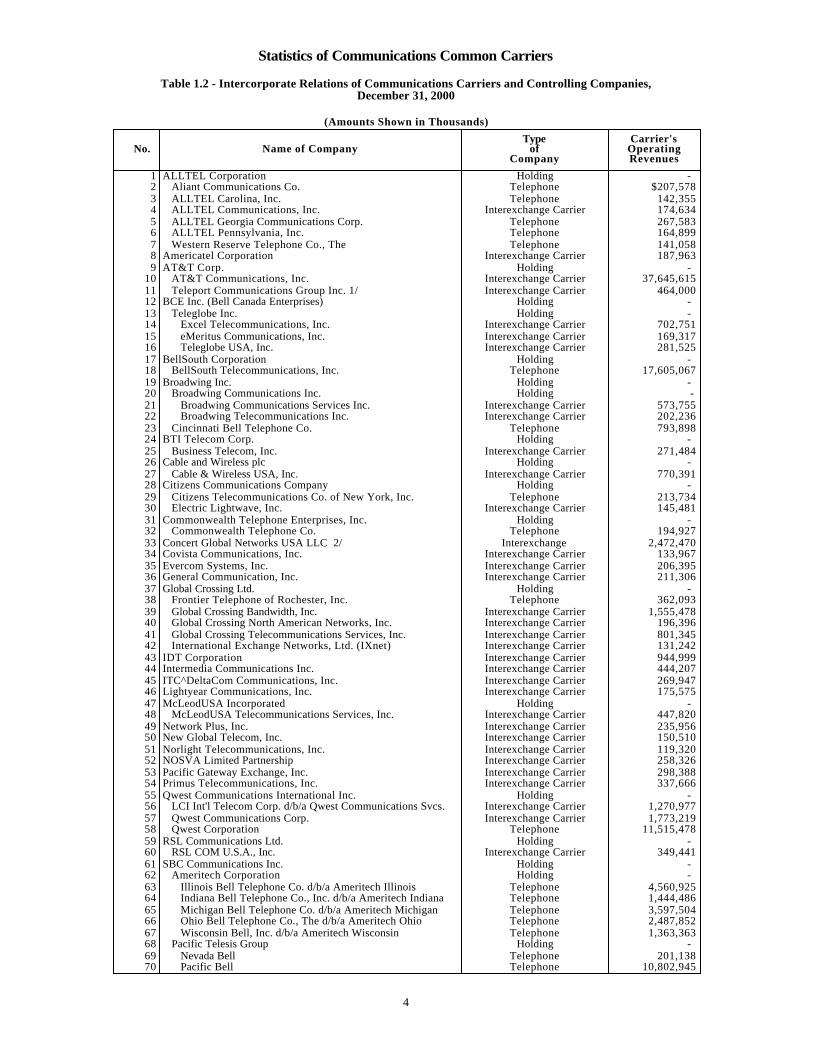
Table 1.2 - Intercorporate Relations of Communications Carriers and Controlling Companies,December 31, 2000
(Amounts Shown in Thousands)
Type Carrier'sNo. Name of Company of Operating
Company Revenues
1 ALLTEL Corporation Holding - 2 Aliant Communications Co. Telephone $207,5783 ALLTEL Carolina, Inc. Telephone 142,3554 ALLTEL Communications, Inc. Interexchange Carrier 174,6345 ALLTEL Georgia Communications Corp. Telephone 267,5836 ALLTEL Pennsylvania, Inc. Telephone 164,8997 Western Reserve Telephone Co., The Telephone 141,0588 Americatel Corporation Interexchange Carrier 187,9639 AT&T Corp. Holding -
10 AT&T Communications, Inc. Interexchange Carrier 37,645,61511 Teleport Communications Group Inc. 1/ Interexchange Carrier 464,00012 BCE Inc. (Bell Canada Enterprises) Holding - 13 Teleglobe Inc. Holding - 14 Excel Telecommunications, Inc. Interexchange Carrier 702,75115 eMeritus Communications, Inc. Interexchange Carrier 169,31716 Teleglobe USA, Inc. Interexchange Carrier 281,52517 BellSouth Corporation Holding - 18 BellSouth Telecommunications, Inc. Telephone 17,605,06719 Broadwing Inc. Holding - 20 Broadwing Communications Inc. Holding - 21 Broadwing Communications Services Inc. Interexchange Carrier 573,75522 Broadwing Telecommunications Inc. Interexchange Carrier 202,23623 Cincinnati Bell Telephone Co. Telephone 793,89824 BTI Telecom Corp. Holding - 25 Business Telecom, Inc. Interexchange Carrier 271,48426 Cable and Wireless plc Holding - 27 Cable & Wireless USA, Inc. Interexchange Carrier 770,39128 Citizens Communications Company Holding - 29 Citizens Telecommunications Co. of New York, Inc. Telephone 213,73430 Electric Lightwave, Inc. Interexchange Carrier 145,48131 Commonwealth Telephone Enterprises, Inc. Holding - 32 Commonwealth Telephone Co. Telephone 194,92733 Concert Global Networks USA LLC 2/ Interexchange 2,472,47034 Covista Communications, Inc. Interexchange Carrier 133,96735 Evercom Systems, Inc. Interexchange Carrier 206,39536 General Communication, Inc. Interexchange Carrier 211,30637 Global Crossing Ltd. Holding - 38 Frontier Telephone of Rochester, Inc. Telephone 362,09339 Global Crossing Bandwidth, Inc. Interexchange Carrier 1,555,47840 Global Crossing North American Networks, Inc. Interexchange Carrier 196,39641 Global Crossing Telecommunications Services, Inc. Interexchange Carrier 801,34542 International Exchange Networks, Ltd. (IXnet) Interexchange Carrier 131,24243 IDT Corporation Interexchange Carrier 944,99944 Intermedia Communications Inc. Interexchange Carrier 444,20745 ITC^DeltaCom Communications, Inc. Interexchange Carrier 269,94746 Lightyear Communications, Inc. Interexchange Carrier 175,57547 McLeodUSA Incorporated Holding - 48 McLeodUSA Telecommunications Services, Inc. Interexchange Carrier 447,82049 Network Plus, Inc. Interexchange Carrier 235,95650 New Global Telecom, Inc. Interexchange Carrier 150,51051 Norlight Telecommunications, Inc. Interexchange Carrier 119,32052 NOSVA Limited Partnership Interexchange Carrier 258,32653 Pacific Gateway Exchange, Inc. Interexchange Carrier 298,38854 Primus Telecommunications, Inc. Interexchange Carrier 337,66655 Qwest Communications International Inc. Holding - 56 LCI Int'l Telecom Corp. d/b/a Qwest Communications Svcs. Interexchange Carrier 1,270,97757 Qwest Communications Corp. Interexchange Carrier 1,773,21958 Qwest Corporation Telephone 11,515,47859 RSL Communications Ltd. Holding - 60 RSL COM U.S.A., Inc. Interexchange Carrier 349,44161 SBC Communications Inc. Holding - 62 Ameritech Corporation Holding - 63 Illinois Bell Telephone Co. d/b/a Ameritech Illinois Telephone 4,560,92564 Indiana Bell Telephone Co., Inc. d/b/a Ameritech Indiana Telephone 1,444,48665 Michigan Bell Telephone Co. d/b/a Ameritech Michigan Telephone 3,597,50466 Ohio Bell Telephone Co., The d/b/a Ameritech Ohio Telephone 2,487,85267 Wisconsin Bell, Inc. d/b/a Ameritech Wisconsin Telephone 1,363,36368 Pacific Telesis Group Holding - 69 Nevada Bell Telephone 201,13870 Pacific Bell Telephone 10,802,945
4
Statistics of Communications Common Carriers
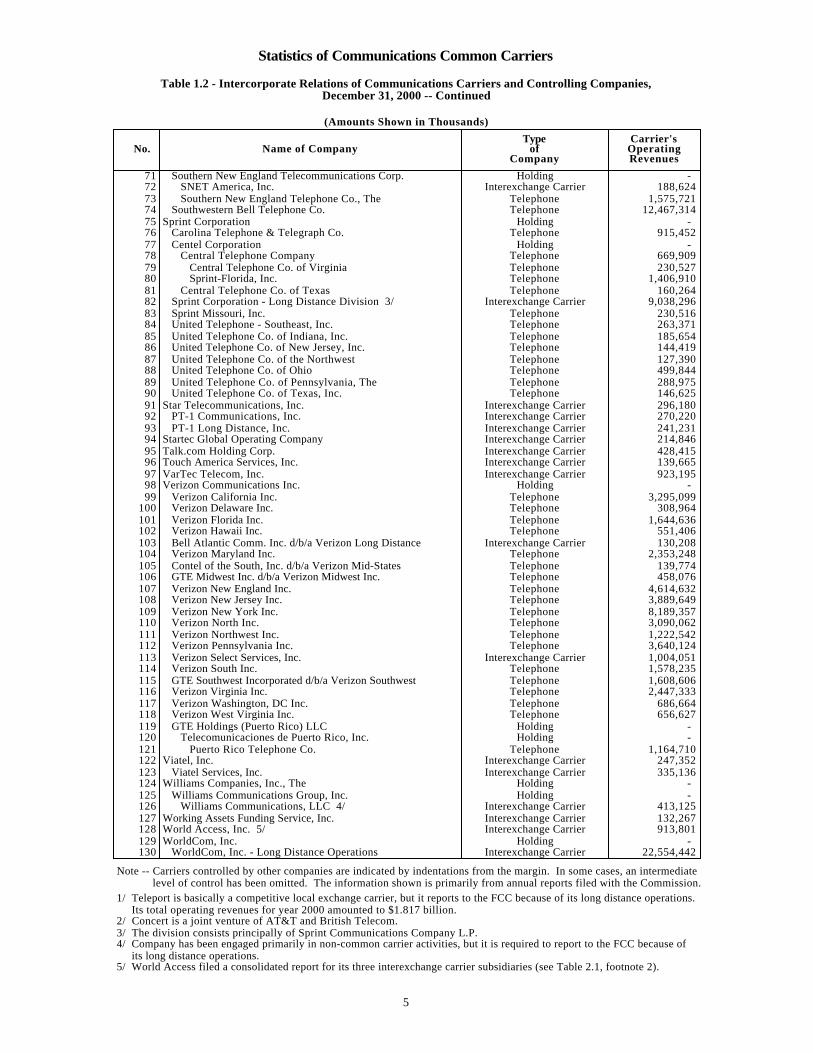
Table 1.2 - Intercorporate Relations of Communications Carriers and Controlling Companies,December 31, 2000 -- Continued
(Amounts Shown in Thousands)
Type Carrier'sNo. Name of Company of Operating
Company Revenues
71 Southern New England Telecommunications Corp. Holding - 72 SNET America, Inc. Interexchange Carrier 188,62473 Southern New England Telephone Co., The Telephone 1,575,72174 Southwestern Bell Telephone Co. Telephone 12,467,31475 Sprint Corporation Holding - 76 Carolina Telephone & Telegraph Co. Telephone 915,45277 Centel Corporation Holding - 78 Central Telephone Company Telephone 669,90979 Central Telephone Co. of Virginia Telephone 230,52780 Sprint-Florida, Inc. Telephone 1,406,91081 Central Telephone Co. of Texas Telephone 160,26482 Sprint Corporation - Long Distance Division 3/ Interexchange Carrier 9,038,29683 Sprint Missouri, Inc. Telephone 230,51684 United Telephone - Southeast, Inc. Telephone 263,37185 United Telephone Co. of Indiana, Inc. Telephone 185,65486 United Telephone Co. of New Jersey, Inc. Telephone 144,41987 United Telephone Co. of the Northwest Telephone 127,39088 United Telephone Co. of Ohio Telephone 499,84489 United Telephone Co. of Pennsylvania, The Telephone 288,97590 United Telephone Co. of Texas, Inc. Telephone 146,62591 Star Telecommunications, Inc. Interexchange Carrier 296,18092 PT-1 Communications, Inc. Interexchange Carrier 270,22093 PT-1 Long Distance, Inc. Interexchange Carrier 241,23194 Startec Global Operating Company Interexchange Carrier 214,84695 Talk.com Holding Corp. Interexchange Carrier 428,41596 Touch America Services, Inc. Interexchange Carrier 139,66597 VarTec Telecom, Inc. Interexchange Carrier 923,19598 Verizon Communications Inc. Holding - 99 Verizon California Inc. Telephone 3,295,099
100 Verizon Delaware Inc. Telephone 308,964101 Verizon Florida Inc. Telephone 1,644,636102 Verizon Hawaii Inc. Telephone 551,406103 Bell Atlantic Comm. Inc. d/b/a Verizon Long Distance Interexchange Carrier 130,208104 Verizon Maryland Inc. Telephone 2,353,248105 Contel of the South, Inc. d/b/a Verizon Mid-States Telephone 139,774106 GTE Midwest Inc. d/b/a Verizon Midwest Inc. Telephone 458,076107 Verizon New England Inc. Telephone 4,614,632108 Verizon New Jersey Inc. Telephone 3,889,649109 Verizon New York Inc. Telephone 8,189,357110 Verizon North Inc. Telephone 3,090,062111 Verizon Northwest Inc. Telephone 1,222,542112 Verizon Pennsylvania Inc. Telephone 3,640,124113 Verizon Select Services, Inc. Interexchange Carrier 1,004,051114 Verizon South Inc. Telephone 1,578,235115 GTE Southwest Incorporated d/b/a Verizon Southwest Telephone 1,608,606116 Verizon Virginia Inc. Telephone 2,447,333117 Verizon Washington, DC Inc. Telephone 686,664118 Verizon West Virginia Inc. Telephone 656,627119 GTE Holdings (Puerto Rico) LLC Holding - 120 Telecomunicaciones de Puerto Rico, Inc. Holding - 121 Puerto Rico Telephone Co. Telephone 1,164,710122 Viatel, Inc. Interexchange Carrier 247,352123 Viatel Services, Inc. Interexchange Carrier 335,136124 Williams Companies, Inc., The Holding - 125 Williams Communications Group, Inc. Holding - 126 Williams Communications, LLC 4/ Interexchange Carrier 413,125127 Working Assets Funding Service, Inc. Interexchange Carrier 132,267128 World Access, Inc. 5/ Interexchange Carrier 913,801129 WorldCom, Inc. Holding - 130 WorldCom, Inc. - Long Distance Operations Interexchange Carrier 22,554,442
Note -- Carriers controlled by other companies are indicated by indentations from the margin. In some cases, an intermediate level of control has been omitted. The information shown is primarily from annual reports filed with the Commission.1/ Teleport is basically a competitive local exchange carrier, but it reports to the FCC because of its long distance operations. Its total operating revenues for year 2000 amounted to $1.817 billion.2/ Concert is a joint venture of AT&T and British Telecom.3/ The division consists principally of Sprint Communications Company L.P.4/ Company has been engaged primarily in non-common carrier activities, but it is required to report to the FCC because of its long distance operations.5/ World Access filed a consolidated report for its three interexchange carrier subsidiaries (see Table 2.1, footnote 2).
5
Statistics of Communications Common Carriers
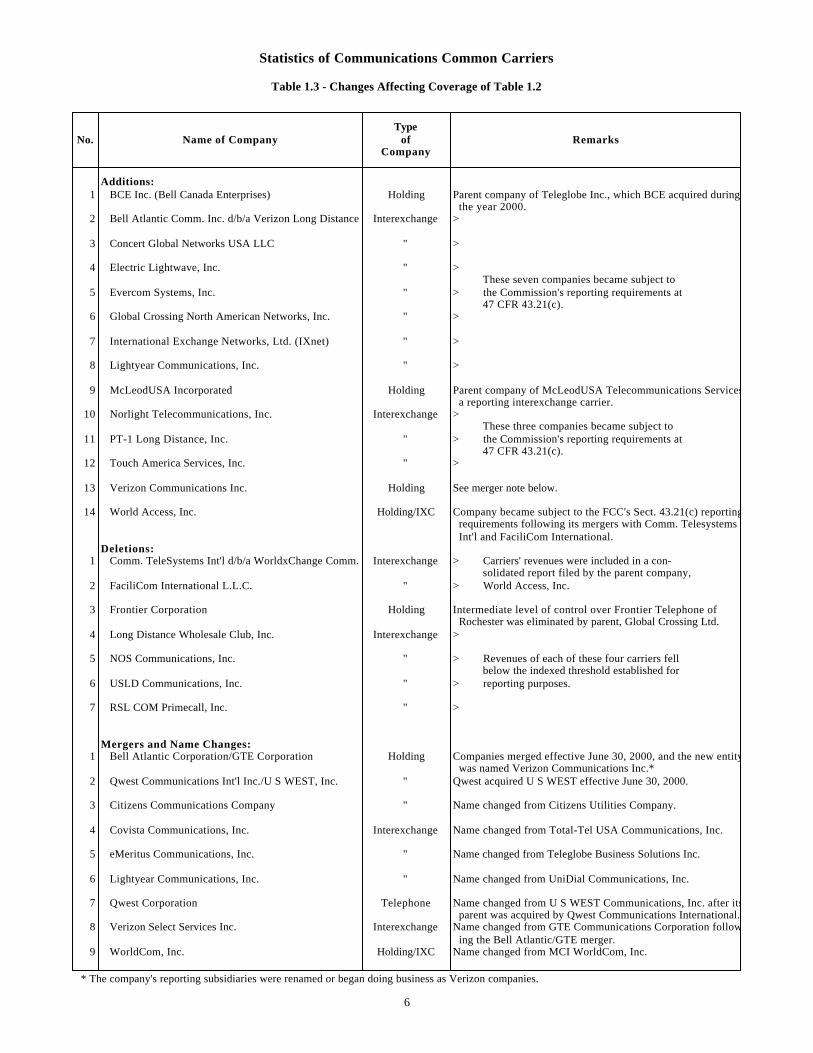
Table 1.3 - Changes Affecting Coverage of Table 1.2
TypeNo. Name of Company of Remarks
Company
Additions:
1 BCE Inc. (Bell Canada Enterprises) Holding Parent company of Teleglobe Inc., which BCE acquired during the year 2000.
2 Bell Atlantic Comm. Inc. d/b/a Verizon Long Distance Interexchange >
3 Concert Global Networks USA LLC " >
4 Electric Lightwave, Inc. " > These seven companies became subject to
5 Evercom Systems, Inc. " > the Commission's reporting requirements at 47 CFR 43.21(c).
6 Global Crossing North American Networks, Inc. " >
7 International Exchange Networks, Ltd. (IXnet) " >
8 Lightyear Communications, Inc. " >
9 McLeodUSA Incorporated Holding Parent company of McLeodUSA Telecommunications Services, a reporting interexchange carrier.
10 Norlight Telecommunications, Inc. Interexchange > These three companies became subject to
11 PT-1 Long Distance, Inc. " > the Commission's reporting requirements at 47 CFR 43.21(c).
12 Touch America Services, Inc. " >
13 Verizon Communications Inc. Holding See merger note below.
14 World Access, Inc. Holding/IXC Company became subject to the FCC's Sect. 43.21(c) reporting requirements following its mergers with Comm. Telesystems
Int'l and FaciliCom International.Deletions:
1 Comm. TeleSystems Int'l d/b/a WorldxChange Comm. Interexchange > Carriers' revenues were included in a con- solidated report filed by the parent company,
2 FaciliCom International L.L.C. " > World Access, Inc.
3 Frontier Corporation Holding Intermediate level of control over Frontier Telephone of Rochester was eliminated by parent, Global Crossing Ltd.
4 Long Distance Wholesale Club, Inc. Interexchange >
5 NOS Communications, Inc. " > Revenues of each of these four carriers fell below the indexed threshold established for
6 USLD Communications, Inc. " > reporting purposes.
7 RSL COM Primecall, Inc. " >
Mergers and Name Changes:1 Bell Atlantic Corporation/GTE Corporation Holding Companies merged effective June 30, 2000, and the new entity
was named Verizon Communications Inc.*2 Qwest Communications Int'l Inc./U S WEST, Inc. " Qwest acquired U S WEST effective June 30, 2000.
3 Citizens Communications Company " Name changed from Citizens Utilities Company.
4 Covista Communications, Inc. Interexchange Name changed from Total-Tel USA Communications, Inc.
5 eMeritus Communications, Inc. " Name changed from Teleglobe Business Solutions Inc.
6 Lightyear Communications, Inc. " Name changed from UniDial Communications, Inc.
7 Qwest Corporation Telephone Name changed from U S WEST Communications, Inc. after its parent was acquired by Qwest Communications International.
8 Verizon Select Services Inc. Interexchange Name changed from GTE Communications Corporation follow- ing the Bell Atlantic/GTE merger.
9 WorldCom, Inc. Holding/IXC Name changed from MCI WorldCom, Inc.
* The company's reporting subsidiaries were renamed or began doing business as Verizon companies.
6
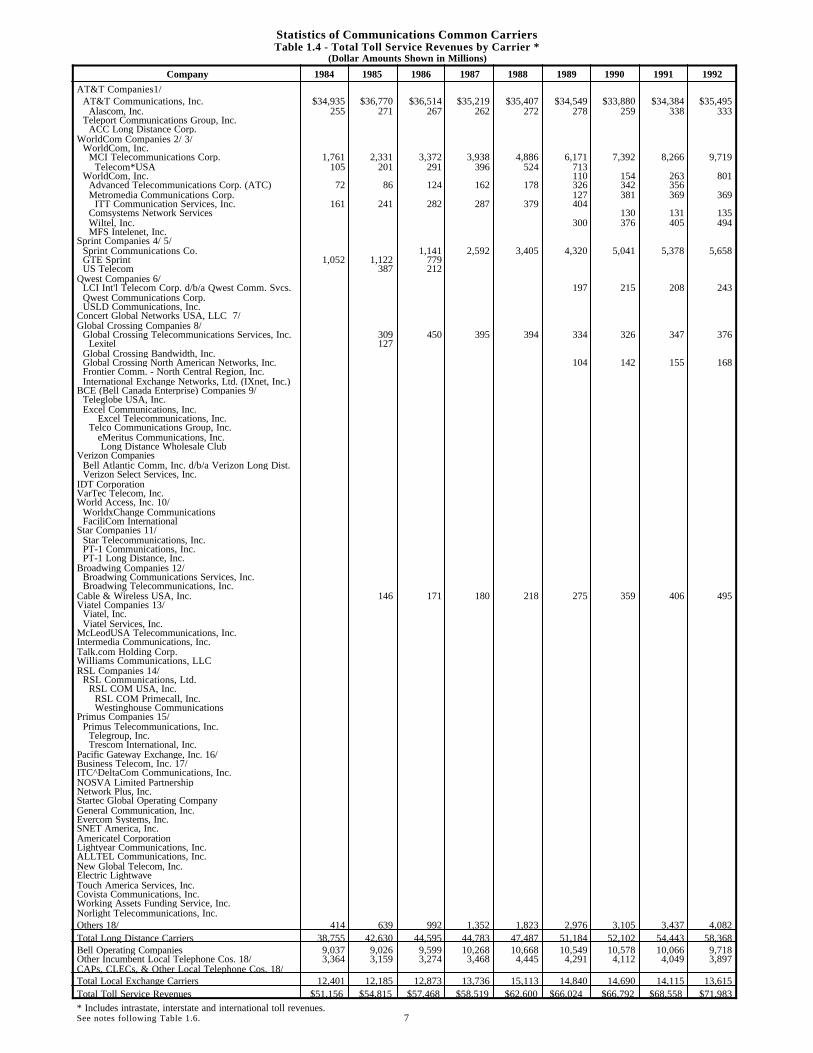
Statistics of Communications Common CarriersTable 1.4 - Total Toll Service Revenues by Carrier *
(Dollar Amounts Shown in Millions)
Company 1984 1985 1986 1987 1988 1989 1990 1991 1992
AT&T Companies1/ AT&T Communications, Inc. $34,935 $36,770 $36,514 $35,219 $35,407 $34,549 $33,880 $34,384 $35,495 Alascom, Inc. 255 271 267 262 272 278 259 338 333 Teleport Communications Group, Inc. ACC Long Distance Corp.WorldCom Companies 2/ 3/ WorldCom, Inc. MCI Telecommunications Corp. 1,761 2,331 3,372 3,938 4,886 6,171 7,392 8,266 9,719 Telecom*USA 105 201 291 396 524 713 WorldCom, Inc. 110 154 263 801 Advanced Telecommunications Corp. (ATC) 72 86 124 162 178 326 342 356 Metromedia Communications Corp. 127 381 369 369 ITT Communication Services, Inc. 161 241 282 287 379 404 Comsystems Network Services 130 131 135 Wiltel, Inc. 300 376 405 494 MFS Intelenet, Inc.Sprint Companies 4/ 5/ Sprint Communications Co. 1,141 2,592 3,405 4,320 5,041 5,378 5,658 GTE Sprint 1,052 1,122 779 US Telecom 387 212Qwest Companies 6/ LCI Int'l Telecom Corp. d/b/a Qwest Comm. Svcs. 197 215 208 243 Qwest Communications Corp. USLD Communications, Inc.Concert Global Networks USA, LLC 7/Global Crossing Companies 8/ Global Crossing Telecommunications Services, Inc. 309 450 395 394 334 326 347 376 Lexitel 127 Global Crossing Bandwidth, Inc. Global Crossing North American Networks, Inc. 104 142 155 168 Frontier Comm. - North Central Region, Inc. International Exchange Networks, Ltd. (IXnet, Inc.)BCE (Bell Canada Enterprise) Companies 9/ Teleglobe USA, Inc. Excel Communications, Inc. Excel Telecommunications, Inc. Telco Communications Group, Inc. eMeritus Communications, Inc. Long Distance Wholesale ClubVerizon Companies Bell Atlantic Comm, Inc. d/b/a Verizon Long Dist. Verizon Select Services, Inc.IDT CorporationVarTec Telecom, Inc.World Access, Inc. 10/ WorldxChange Communications FaciliCom InternationalStar Companies 11/ Star Telecommunications, Inc. PT-1 Communications, Inc. PT-1 Long Distance, Inc.Broadwing Companies 12/ Broadwing Communications Services, Inc. Broadwing Telecommunications, Inc.Cable & Wireless USA, Inc. 146 171 180 218 275 359 406 495Viatel Companies 13/ Viatel, Inc. Viatel Services, Inc.McLeodUSA Telecommunications, Inc.Intermedia Communications, Inc.Talk.com Holding Corp.Williams Communications, LLCRSL Companies 14/ RSL Communications, Ltd. RSL COM USA, Inc. RSL COM Primecall, Inc. Westinghouse CommunicationsPrimus Companies 15/ Primus Telecommunications, Inc. Telegroup, Inc. Trescom International, Inc.Pacific Gateway Exchange, Inc. 16/Business Telecom, Inc. 17/ITC^DeltaCom Communications, Inc.NOSVA Limited PartnershipNetwork Plus, Inc.Startec Global Operating CompanyGeneral Communication, Inc.Evercom Systems, Inc.SNET America, Inc.Americatel CorporationLightyear Communications, Inc.ALLTEL Communications, Inc.New Global Telecom, Inc.Electric LightwaveTouch America Services, Inc.Covista Communications, Inc.Working Assets Funding Service, Inc.Norlight Telecommunications, Inc.Others 18/ 414 639 992 1,352 1,823 2,976 3,105 3,437 4,082Total Long Distance Carriers 38,755 42,630 44,595 44,783 47,487 51,184 52,102 54,443 58,368Bell Operating Companies 9,037 9,026 9,599 10,268 10,668 10,549 10,578 10,066 9,718Other Incumbent Local Telephone Cos. 18/ 3,364 3,159 3,274 3,468 4,445 4,291 4,112 4,049 3,897CAPs, CLECs, & Other Local Telephone Cos. 18/Total Local Exchange Carriers 12,401 12,185 12,873 13,736 15,113 14,840 14,690 14,115 13,615Total Toll Service Revenues $51,156 $54,815 $57,468 $58,519 $62,600 $66,024 $66,792 $68,558 $71,983
* Includes intrastate, interstate and international toll revenues.See notes following Table 1.6. 7
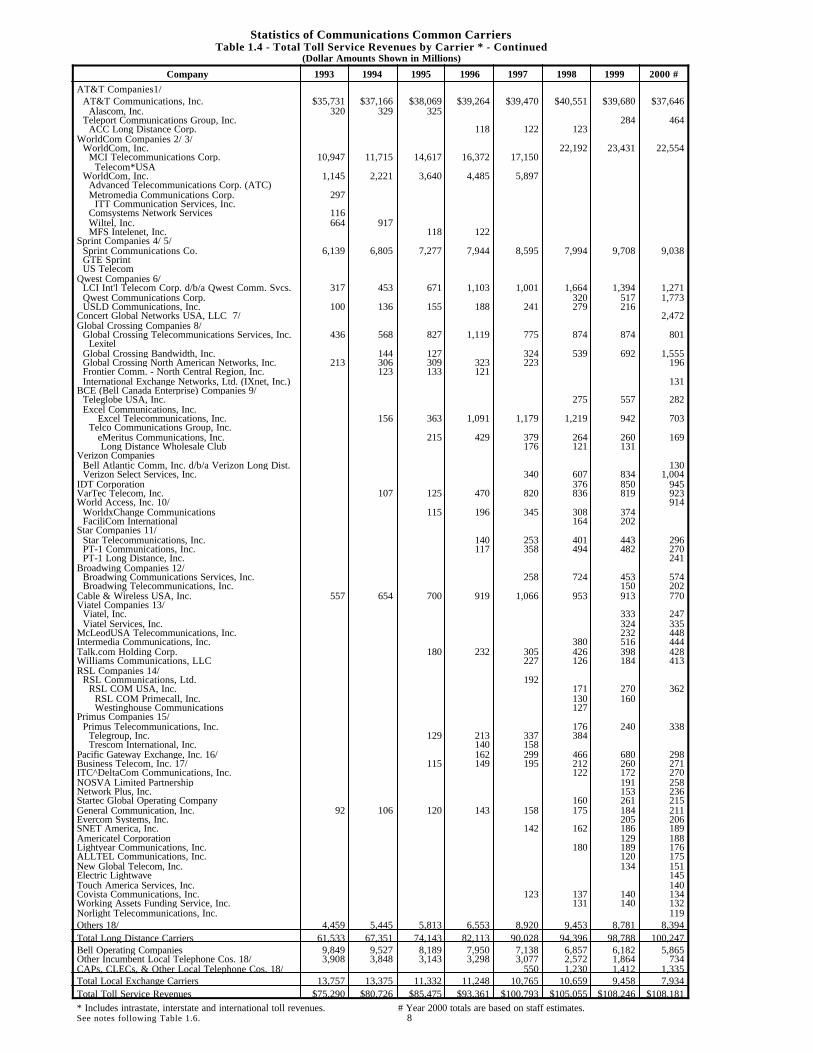
Statistics of Communications Common CarriersTable 1.4 - Total Toll Service Revenues by Carrier * - Continued
(Dollar Amounts Shown in Millions)
Company 1993 1994 1995 1996 1997 1998 1999 2000 #
AT&T Companies1/ AT&T Communications, Inc. $35,731 $37,166 $38,069 $39,264 $39,470 $40,551 $39,680 $37,646 Alascom, Inc. 320 329 325 Teleport Communications Group, Inc. 284 464 ACC Long Distance Corp. 118 122 123WorldCom Companies 2/ 3/ WorldCom, Inc. 22,192 23,431 22,554 MCI Telecommunications Corp. 10,947 11,715 14,617 16,372 17,150 Telecom*USA WorldCom, Inc. 1,145 2,221 3,640 4,485 5,897 Advanced Telecommunications Corp. (ATC) Metromedia Communications Corp. 297 ITT Communication Services, Inc. Comsystems Network Services 116 Wiltel, Inc. 664 917 MFS Intelenet, Inc. 118 122Sprint Companies 4/ 5/ Sprint Communications Co. 6,139 6,805 7,277 7,944 8,595 7,994 9,708 9,038 GTE Sprint US TelecomQwest Companies 6/ LCI Int'l Telecom Corp. d/b/a Qwest Comm. Svcs. 317 453 671 1,103 1,001 1,664 1,394 1,271 Qwest Communications Corp. 320 517 1,773 USLD Communications, Inc. 100 136 155 188 241 279 216Concert Global Networks USA, LLC 7/ 2,472Global Crossing Companies 8/ Global Crossing Telecommunications Services, Inc. 436 568 827 1,119 775 874 874 801 Lexitel Global Crossing Bandwidth, Inc. 144 127 324 539 692 1,555 Global Crossing North American Networks, Inc. 213 306 309 323 223 196 Frontier Comm. - North Central Region, Inc. 123 133 121 International Exchange Networks, Ltd. (IXnet, Inc.) 131BCE (Bell Canada Enterprise) Companies 9/ Teleglobe USA, Inc. 275 557 282 Excel Communications, Inc. Excel Telecommunications, Inc. 156 363 1,091 1,179 1,219 942 703 Telco Communications Group, Inc. eMeritus Communications, Inc. 215 429 379 264 260 169 Long Distance Wholesale Club 176 121 131Verizon Companies Bell Atlantic Comm, Inc. d/b/a Verizon Long Dist. 130 Verizon Select Services, Inc. 340 607 834 1,004IDT Corporation 376 850 945VarTec Telecom, Inc. 107 125 470 820 836 819 923World Access, Inc. 10/ 914 WorldxChange Communications 115 196 345 308 374 FaciliCom International 164 202Star Companies 11/ Star Telecommunications, Inc. 140 253 401 443 296 PT-1 Communications, Inc. 117 358 494 482 270 PT-1 Long Distance, Inc. 241Broadwing Companies 12/ Broadwing Communications Services, Inc. 258 724 453 574 Broadwing Telecommunications, Inc. 150 202Cable & Wireless USA, Inc. 557 654 700 919 1,066 953 913 770Viatel Companies 13/ Viatel, Inc. 333 247 Viatel Services, Inc. 324 335McLeodUSA Telecommunications, Inc. 232 448Intermedia Communications, Inc. 380 516 444Talk.com Holding Corp. 180 232 305 426 398 428Williams Communications, LLC 227 126 184 413RSL Companies 14/ RSL Communications, Ltd. 192 RSL COM USA, Inc. 171 270 362 RSL COM Primecall, Inc. 130 160 Westinghouse Communications 127Primus Companies 15/ Primus Telecommunications, Inc. 176 240 338 Telegroup, Inc. 129 213 337 384 Trescom International, Inc. 140 158Pacific Gateway Exchange, Inc. 16/ 162 299 466 680 298Business Telecom, Inc. 17/ 115 149 195 212 260 271ITC^DeltaCom Communications, Inc. 122 172 270NOSVA Limited Partnership 191 258Network Plus, Inc. 153 236Startec Global Operating Company 160 261 215General Communication, Inc. 92 106 120 143 158 175 184 211Evercom Systems, Inc. 205 206SNET America, Inc. 142 162 186 189Americatel Corporation 129 188Lightyear Communications, Inc. 180 189 176ALLTEL Communications, Inc. 120 175New Global Telecom, Inc. 134 151Electric Lightwave 145Touch America Services, Inc. 140Covista Communications, Inc. 123 137 140 134Working Assets Funding Service, Inc. 131 140 132Norlight Telecommunications, Inc. 119Others 18/ 4,459 5,445 5,813 6,553 8,920 9,453 8,781 8,394Total Long Distance Carriers 61,533 67,351 74,143 82,113 90,028 94,396 98,788 100,247Bell Operating Companies 9,849 9,527 8,189 7,950 7,138 6,857 6,182 5,865Other Incumbent Local Telephone Cos. 18/ 3,908 3,848 3,143 3,298 3,077 2,572 1,864 734CAPs, CLECs, & Other Local Telephone Cos. 18/ 550 1,230 1,412 1,335Total Local Exchange Carriers 13,757 13,375 11,332 11,248 10,765 10,659 9,458 7,934Total Toll Service Revenues $75,290 $80,726 $85,475 $93,361 $100,793 $105,055 $108,246 $108,181
* Includes intrastate, interstate and international toll revenues. # Year 2000 totals are based on staff estimates.See notes following Table 1.6. 8
Statistics of Communications Common Carriers
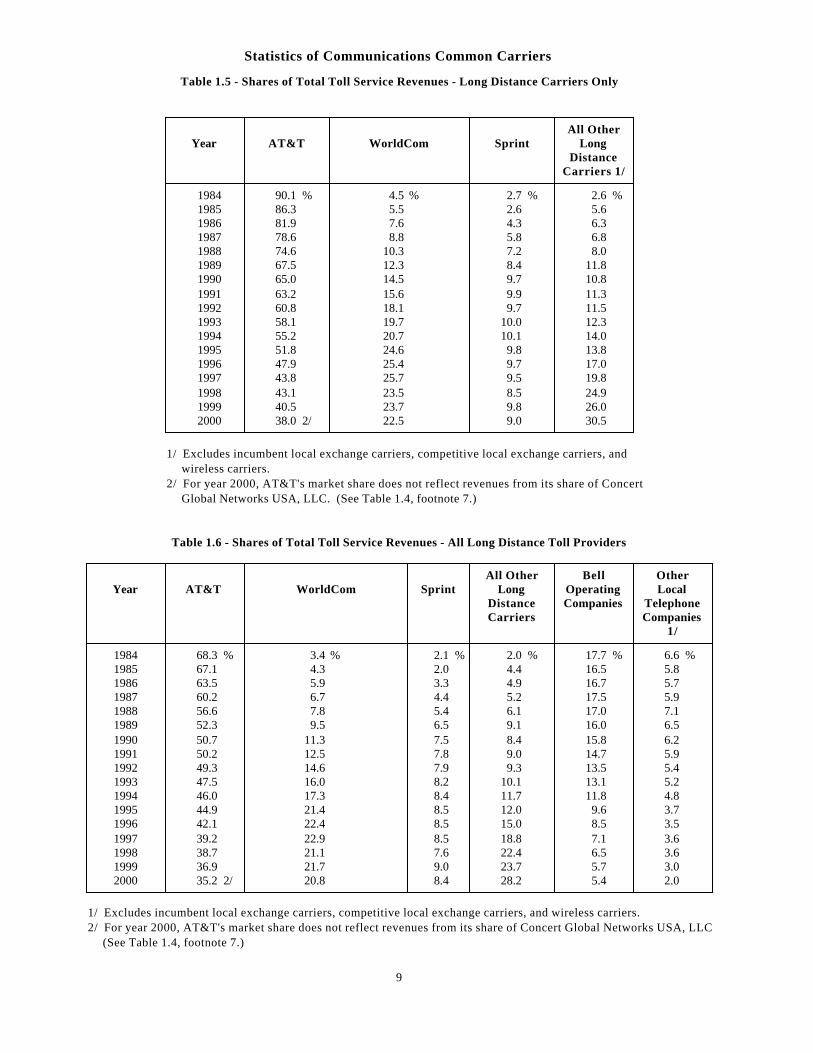
Table 1.5 - Shares of Total Toll Service Revenues - Long Distance Carriers Only
All OtherYear AT&T WorldCom Sprint Long
DistanceCarriers 1/
1984 90.1 % 4.5 % 2.7 % 2.6 %1985 86.3 5.5 2.6 5.61986 81.9 7.6 4.3 6.31987 78.6 8.8 5.8 6.81988 74.6 10.3 7.2 8.01989 67.5 12.3 8.4 11.81990 65.0 14.5 9.7 10.81991 63.2 15.6 9.9 11.31992 60.8 18.1 9.7 11.51993 58.1 19.7 10.0 12.31994 55.2 20.7 10.1 14.01995 51.8 24.6 9.8 13.81996 47.9 25.4 9.7 17.01997 43.8 25.7 9.5 19.81998 43.1 23.5 8.5 24.91999 40.5 23.7 9.8 26.02000 38.0 2/ 22.5 9.0 30.5
1/ Excludes incumbent local exchange carriers, competitive local exchange carriers, and wireless carriers.2/ For year 2000, AT&T's market share does not reflect revenues from its share of Concert Global Networks USA, LLC. (See Table 1.4, footnote 7.)
Table 1.6 - Shares of Total Toll Service Revenues - All Long Distance Toll Providers
All Other Bell OtherYear AT&T WorldCom Sprint Long Operating Local
Distance Companies TelephoneCarriers Companies
1/
1984 68.3 % 3.4 % 2.1 % 2.0 % 17.7 % 6.6 %1985 67.1 4.3 2.0 4.4 16.5 5.81986 63.5 5.9 3.3 4.9 16.7 5.71987 60.2 6.7 4.4 5.2 17.5 5.91988 56.6 7.8 5.4 6.1 17.0 7.11989 52.3 9.5 6.5 9.1 16.0 6.51990 50.7 11.3 7.5 8.4 15.8 6.21991 50.2 12.5 7.8 9.0 14.7 5.91992 49.3 14.6 7.9 9.3 13.5 5.41993 47.5 16.0 8.2 10.1 13.1 5.21994 46.0 17.3 8.4 11.7 11.8 4.81995 44.9 21.4 8.5 12.0 9.6 3.71996 42.1 22.4 8.5 15.0 8.5 3.51997 39.2 22.9 8.5 18.8 7.1 3.61998 38.7 21.1 7.6 22.4 6.5 3.61999 36.9 21.7 9.0 23.7 5.7 3.02000 35.2 2/ 20.8 8.4 28.2 5.4 2.0
1/ Excludes incumbent local exchange carriers, competitive local exchange carriers, and wireless carriers.2/ For year 2000, AT&T's market share does not reflect revenues from its share of Concert Global Networks USA, LLC. (See Table 1.4, footnote 7.)
9
Statistics of Communications Common Carriers
Notes for Tables 1.4 - 1.6
1/ ACC Long Distance Corp. and Teleport Communications Group merged in April of 1998, and the combined company, Teleport Communications Group, merged with AT&T Communications, Inc., in July of that year. AT&T Communications acquired Alascom, Inc., August 7, 1995 and began filing a consolidated revenue statement in 1996.
2/ MCI WorldCom's revenues were revised for 1998 to exclude enhanced services and to be consistent with revenues reported for 1999.
3/ WorldCom, Inc. completed a merger with MCI Communications Corp. in September of 1998 and filed 1998 revenue figures for the combined company, MCI WorldCom, Inc. MCI Communications Corp. and Telecom*USA merged during 1989 and began reporting consolidated revenues in 1990. Metromedia Communications Corp. and ITT Communications Services, Inc., merged during 1988, but reported 1989 revenue separately. LDDS Communications, Inc., and Advanced Telecommunications Corp. merged in 1992. In 1993, LDDS merged with Metromedia Communications Corp. and Comsystems Network Services. For 1993, only the revenues that were received after the merger are included in LDDS's revenues; those preceding the merger are listed individually. LDDS and Wiltel merged January 5, 1995. In May 1995, LDDS changed its name to WorldCom, Inc. WorldCom acquired MFS Intelenet Decenber 31, 1996.
4/ Sprint's revenues were revised for 1998 to exclude enhanced services and to be consistent with revenues reported for 1999.
5/ In July 1986, GTE Sprint and US Telecom merged into US Sprint. The information shown for GTE Sprint and US Telecom for 1986 is for January 1 - June 30. The information shown for Sprint Communications Corp. (then US Sprint) for 1986 is for July 1 - December 31. United Telecommunications, Inc., then majority owner of US Sprint, purchased the remaining interest from GTE in July of 1992. Effective February 16, 1992, the company's name became Sprint Communications Co.
6/ LCI International Telecom Corp. and USLD Communications, Inc., merged in December of 1997 and filed separate revenue statements for the year. Qwest Communications Corp. merged with LCI and USLD Communications, Inc., in June of 1998, and each of the three affiliated companies filed a separate revenue statement for 1998.
7/ Concert Global Networks USA, LLC is a joint venture of AT&T Corp. and British Telecommunications plc.
8/ Global Crossing Ltd. acquired Frontier Corporation September 28, 1999. In 1994, RCI Long Distance, Inc., changed its name to Frontier Corporation.
9/ BCE, Inc. (Bell Canada Enterprises) acquired Teleglobe, Inc. on November 1, 2000. eMeritus Communications was formerly known as Teleglobe Business Solutions, Inc. (previously Telco Holdings, Inc.) Teleglobe USA, Inc., merged with Excel Telecommunications, Inc. and its affiliate in November of 1998. Excel Telecommunications acquired Telco Holdings in October of 1997.
10/ World Access, Inc. acquired WorldxChange Communications December 19, 2000. FaciliCom merged into World Access, Inc. on December 7, 1999. World Access and five of its subsidiaries, including WorldxChange and FaciliCom, filed for Chapter 11 bankruptcy protection in Illinois on April 24, 2001.
11/ Star Telecommunications' s revenues for 1996 - 1998 have been prorated to reflect the decrease in revised revenues reported for 1999. Star filed for Chapter 11 bankruptcy protection in California on March 13, 2001.
12/ Cincinnati Bell Inc., merged with IXC Communications, Inc., on November 9, 1999 and soon began doing business as Broadwing, Inc.
13/ Viatel, Inc. filed for Chapter 11 bankruptcy protection in Delaware on May 2, 2001 and discontinued offering service in the United States at that time. Revenues for year 2000 are from its Form 499-A, Telecommunications Reporting Worksheets.
14/ RSL COM USA bought Westinghouse Communications in August 1998. RSL COM USA filed for Chapter 11 bankruptcy protection in New York on March 16, 2001.
15/ Primus Telecommunications, Inc. acquired TresCom International, Inc., in 1998.
16/ Pacific Gateway Exchange filed Chapter 11 bankruptcy protection in California on December 29, 2001. Revenues are for year ended December 31, 2000 and are from its Form 8-K filed May 31, 2001.
17/ Data for 1996 taken from the Annual Report to the Colorado Public Utilities Commission from telecommunications carriers regulated pursuant to §40-15-301 C.R.S.
18/ Estimated by FCC staff.
10
Part 2
Telephone Carriers
Statistics of Communications Common Carriers
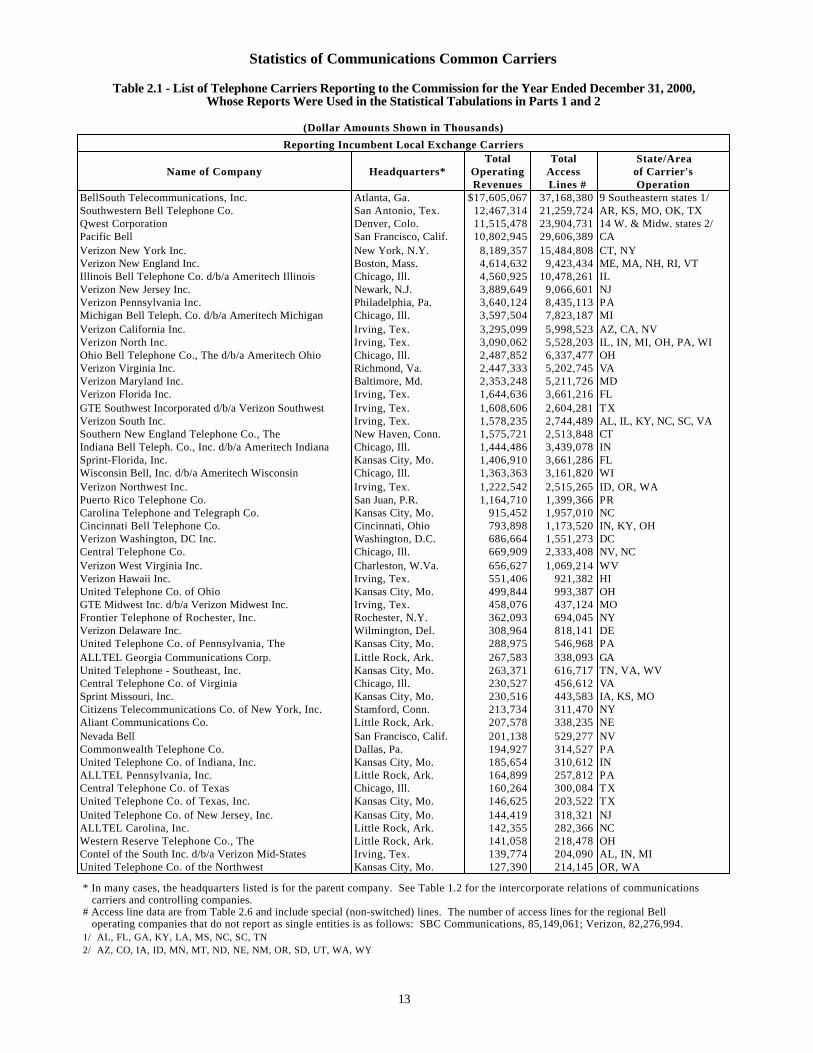
Table 2.1 - List of Telephone Carriers Reporting to the Commission for the Year Ended December 31, 2000,Whose Reports Were Used in the Statistical Tabulations in Parts 1 and 2
(Dollar Amounts Shown in Thousands)
Reporting Incumbent Local Exchange CarriersTotal Total State/Area
Name of Company Headquarters* Operating Access of Carrier'sRevenues Lines # Operation
BellSouth Telecommunications, Inc. Atlanta, Ga. $17,605,067 37,168,380 9 Southeastern states 1/Southwestern Bell Telephone Co. San Antonio, Tex. 12,467,314 21,259,724 AR, KS, MO, OK, TXQwest Corporation Denver, Colo. 11,515,478 23,904,731 14 W. & Midw. states 2/Pacific Bell San Francisco, Calif. 10,802,945 29,606,389 CAVerizon New York Inc. New York, N.Y. 8,189,357 15,484,808 CT, NYVerizon New England Inc. Boston, Mass. 4,614,632 9,423,434 ME, MA, NH, RI, VTIllinois Bell Telephone Co. d/b/a Ameritech Illinois Chicago, Ill. 4,560,925 10,478,261 ILVerizon New Jersey Inc. Newark, N.J. 3,889,649 9,066,601 NJVerizon Pennsylvania Inc. Philadelphia, Pa. 3,640,124 8,435,113 PAMichigan Bell Teleph. Co. d/b/a Ameritech Michigan Chicago, Ill. 3,597,504 7,823,187 MIVerizon California Inc. Irving, Tex. 3,295,099 5,998,523 AZ, CA, NVVerizon North Inc. Irving, Tex. 3,090,062 5,528,203 IL, IN, MI, OH, PA, WIOhio Bell Telephone Co., The d/b/a Ameritech Ohio Chicago, Ill. 2,487,852 6,337,477 OHVerizon Virginia Inc. Richmond, Va. 2,447,333 5,202,745 VAVerizon Maryland Inc. Baltimore, Md. 2,353,248 5,211,726 MDVerizon Florida Inc. Irving, Tex. 1,644,636 3,661,216 FLGTE Southwest Incorporated d/b/a Verizon Southwest Irving, Tex. 1,608,606 2,604,281 TXVerizon South Inc. Irving, Tex. 1,578,235 2,744,489 AL, IL, KY, NC, SC, VASouthern New England Telephone Co., The New Haven, Conn. 1,575,721 2,513,848 CTIndiana Bell Teleph. Co., Inc. d/b/a Ameritech Indiana Chicago, Ill. 1,444,486 3,439,078 INSprint-Florida, Inc. Kansas City, Mo. 1,406,910 3,661,286 FLWisconsin Bell, Inc. d/b/a Ameritech Wisconsin Chicago, Ill. 1,363,363 3,161,820 WIVerizon Northwest Inc. Irving, Tex. 1,222,542 2,515,265 ID, OR, WAPuerto Rico Telephone Co. San Juan, P.R. 1,164,710 1,399,366 PRCarolina Telephone and Telegraph Co. Kansas City, Mo. 915,452 1,957,010 NCCincinnati Bell Telephone Co. Cincinnati, Ohio 793,898 1,173,520 IN, KY, OHVerizon Washington, DC Inc. Washington, D.C. 686,664 1,551,273 DCCentral Telephone Co. Chicago, Ill. 669,909 2,333,408 NV, NCVerizon West Virginia Inc. Charleston, W.Va. 656,627 1,069,214 WVVerizon Hawaii Inc. Irving, Tex. 551,406 921,382 HIUnited Telephone Co. of Ohio Kansas City, Mo. 499,844 993,387 OHGTE Midwest Inc. d/b/a Verizon Midwest Inc. Irving, Tex. 458,076 437,124 MOFrontier Telephone of Rochester, Inc. Rochester, N.Y. 362,093 694,045 NYVerizon Delaware Inc. Wilmington, Del. 308,964 818,141 DEUnited Telephone Co. of Pennsylvania, The Kansas City, Mo. 288,975 546,968 PAALLTEL Georgia Communications Corp. Little Rock, Ark. 267,583 338,093 GAUnited Telephone - Southeast, Inc. Kansas City, Mo. 263,371 616,717 TN, VA, WVCentral Telephone Co. of Virginia Chicago, Ill. 230,527 456,612 VASprint Missouri, Inc. Kansas City, Mo. 230,516 443,583 IA, KS, MOCitizens Telecommunications Co. of New York, Inc. Stamford, Conn. 213,734 311,470 NYAliant Communications Co. Little Rock, Ark. 207,578 338,235 NENevada Bell San Francisco, Calif. 201,138 529,277 NVCommonwealth Telephone Co. Dallas, Pa. 194,927 314,527 PAUnited Telephone Co. of Indiana, Inc. Kansas City, Mo. 185,654 310,612 INALLTEL Pennsylvania, Inc. Little Rock, Ark. 164,899 257,812 PACentral Telephone Co. of Texas Chicago, Ill. 160,264 300,084 TXUnited Telephone Co. of Texas, Inc. Kansas City, Mo. 146,625 203,522 TXUnited Telephone Co. of New Jersey, Inc. Kansas City, Mo. 144,419 318,321 NJALLTEL Carolina, Inc. Little Rock, Ark. 142,355 282,366 NCWestern Reserve Telephone Co., The Little Rock, Ark. 141,058 218,478 OHContel of the South Inc. d/b/a Verizon Mid-States Irving, Tex. 139,774 204,090 AL, IN, MIUnited Telephone Co. of the Northwest Kansas City, Mo. 127,390 214,145 OR, WA
* In many cases, the headquarters listed is for the parent company. See Table 1.2 for the intercorporate relations of communications carriers and controlling companies. # Access line data are from Table 2.6 and include special (non-switched) lines. The number of access lines for the regional Bell operating companies that do not report as single entities is as follows: SBC Communications, 85,149,061; Verizon, 82,276,994. 1/ AL, FL, GA, KY, LA, MS, NC, SC, TN 2/ AZ, CO, IA, ID, MN, MT, ND, NE, NM, OR, SD, UT, WA, WY
13
Statistics of Communications Common Carriers
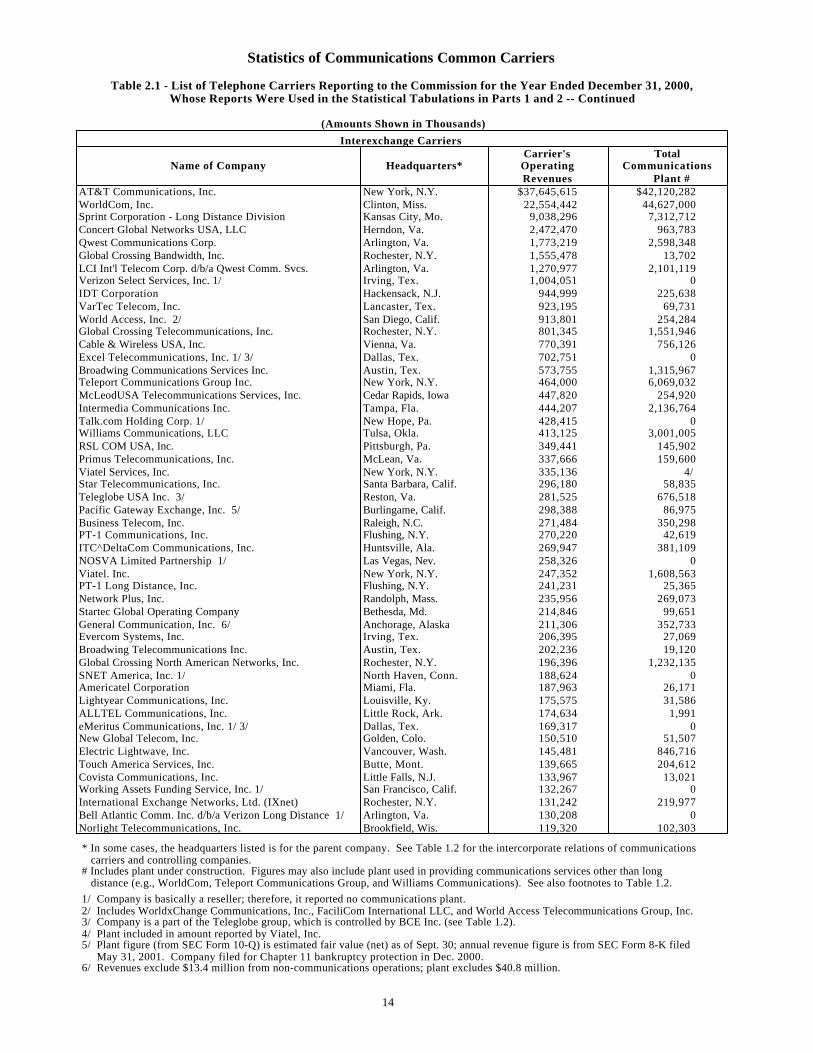
Table 2.1 - List of Telephone Carriers Reporting to the Commission for the Year Ended December 31, 2000,Whose Reports Were Used in the Statistical Tabulations in Parts 1 and 2 -- Continued
(Amounts Shown in Thousands)
Interexchange CarriersCarrier's Total
Name of Company Headquarters* Operating CommunicationsRevenues Plant #
AT&T Communications, Inc. New York, N.Y. $37,645,615 $42,120,282WorldCom, Inc. Clinton, Miss. 22,554,442 44,627,000Sprint Corporation - Long Distance Division Kansas City, Mo. 9,038,296 7,312,712Concert Global Networks USA, LLC Herndon, Va. 2,472,470 963,783Qwest Communications Corp. Arlington, Va. 1,773,219 2,598,348Global Crossing Bandwidth, Inc. Rochester, N.Y. 1,555,478 13,702LCI Int'l Telecom Corp. d/b/a Qwest Comm. Svcs. Arlington, Va. 1,270,977 2,101,119Verizon Select Services, Inc. 1/ Irving, Tex. 1,004,051 0IDT Corporation Hackensack, N.J. 944,999 225,638VarTec Telecom, Inc. Lancaster, Tex. 923,195 69,731World Access, Inc. 2/ San Diego, Calif. 913,801 254,284Global Crossing Telecommunications, Inc. Rochester, N.Y. 801,345 1,551,946Cable & Wireless USA, Inc. Vienna, Va. 770,391 756,126Excel Telecommunications, Inc. 1/ 3/ Dallas, Tex. 702,751 0Broadwing Communications Services Inc. Austin, Tex. 573,755 1,315,967Teleport Communications Group Inc. New York, N.Y. 464,000 6,069,032McLeodUSA Telecommunications Services, Inc. Cedar Rapids, Iowa 447,820 254,920Intermedia Communications Inc. Tampa, Fla. 444,207 2,136,764Talk.com Holding Corp. 1/ New Hope, Pa. 428,415 0Williams Communications, LLC Tulsa, Okla. 413,125 3,001,005RSL COM USA, Inc. Pittsburgh, Pa. 349,441 145,902Primus Telecommunications, Inc. McLean, Va. 337,666 159,600Viatel Services, Inc. New York, N.Y. 335,136 4/ Star Telecommunications, Inc. Santa Barbara, Calif. 296,180 58,835Teleglobe USA Inc. 3/ Reston, Va. 281,525 676,518Pacific Gateway Exchange, Inc. 5/ Burlingame, Calif. 298,388 86,975Business Telecom, Inc. Raleigh, N.C. 271,484 350,298PT-1 Communications, Inc. Flushing, N.Y. 270,220 42,619ITC^DeltaCom Communications, Inc. Huntsville, Ala. 269,947 381,109NOSVA Limited Partnership 1/ Las Vegas, Nev. 258,326 0Viatel. Inc. New York, N.Y. 247,352 1,608,563PT-1 Long Distance, Inc. Flushing, N.Y. 241,231 25,365Network Plus, Inc. Randolph, Mass. 235,956 269,073Startec Global Operating Company Bethesda, Md. 214,846 99,651General Communication, Inc. 6/ Anchorage, Alaska 211,306 352,733Evercom Systems, Inc. Irving, Tex. 206,395 27,069Broadwing Telecommunications Inc. Austin, Tex. 202,236 19,120Global Crossing North American Networks, Inc. Rochester, N.Y. 196,396 1,232,135SNET America, Inc. 1/ North Haven, Conn. 188,624 0Americatel Corporation Miami, Fla. 187,963 26,171Lightyear Communications, Inc. Louisville, Ky. 175,575 31,586ALLTEL Communications, Inc. Little Rock, Ark. 174,634 1,991eMeritus Communications, Inc. 1/ 3/ Dallas, Tex. 169,317 0New Global Telecom, Inc. Golden, Colo. 150,510 51,507Electric Lightwave, Inc. Vancouver, Wash. 145,481 846,716Touch America Services, Inc. Butte, Mont. 139,665 204,612Covista Communications, Inc. Little Falls, N.J. 133,967 13,021Working Assets Funding Service, Inc. 1/ San Francisco, Calif. 132,267 0International Exchange Networks, Ltd. (IXnet) Rochester, N.Y. 131,242 219,977Bell Atlantic Comm. Inc. d/b/a Verizon Long Distance 1/ Arlington, Va. 130,208 0Norlight Telecommunications, Inc. Brookfield, Wis. 119,320 102,303
* In some cases, the headquarters listed is for the parent company. See Table 1.2 for the intercorporate relations of communications carriers and controlling companies. # Includes plant under construction. Figures may also include plant used in providing communications services other than long distance (e.g., WorldCom, Teleport Communications Group, and Williams Communications). See also footnotes to Table 1.2.
1/ Company is basically a reseller; therefore, it reported no communications plant. 2/ Includes WorldxChange Communications, Inc., FaciliCom International LLC, and World Access Telecommunications Group, Inc. 3/ Company is a part of the Teleglobe group, which is controlled by BCE Inc. (see Table 1.2). 4/ Plant included in amount reported by Viatel, Inc. 5/ Plant figure (from SEC Form 10-Q) is estimated fair value (net) as of Sept. 30; annual revenue figure is from SEC Form 8-K filed May 31, 2001. Company filed for Chapter 11 bankruptcy protection in Dec. 2000. 6/ Revenues exclude $13.4 million from non-communications operations; plant excludes $40.8 million.
14
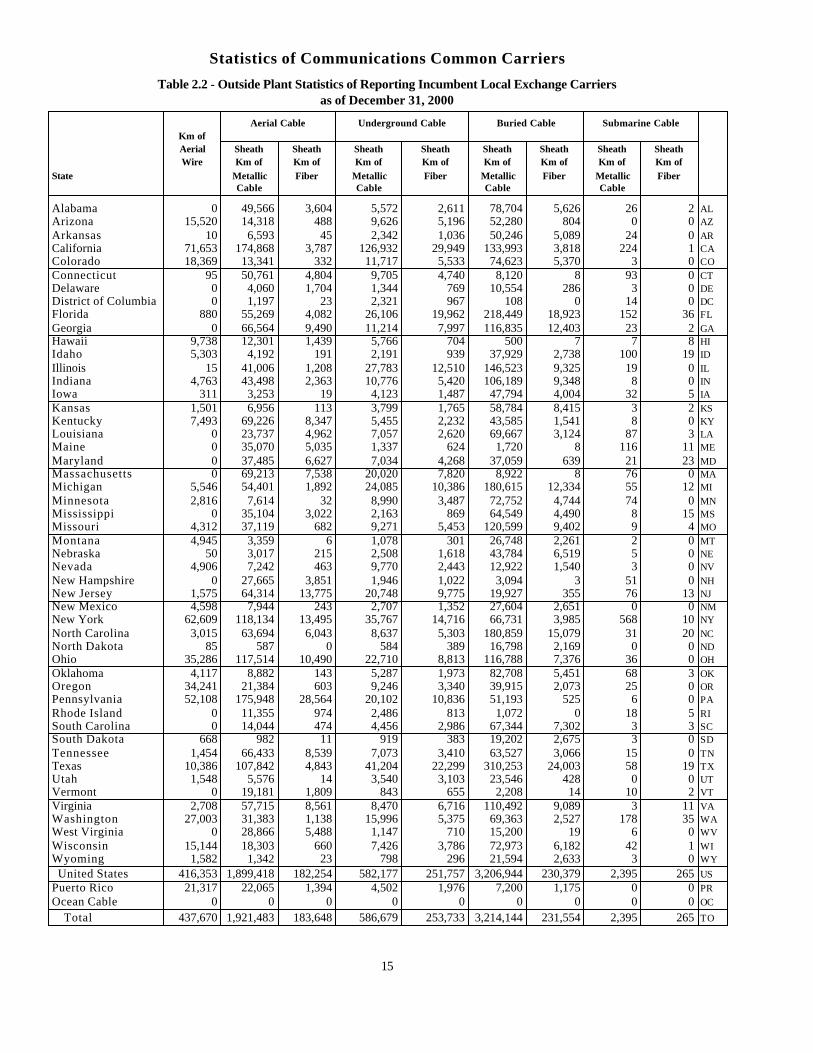
Statistics of Communications Common Carriers
Table 2.2 - Outside Plant Statistics of Reporting Incumbent Local Exchange Carriersas of December 31, 2000
Aerial Cable Underground Cable Buried Cable Submarine CableKm ofAerial Sheath Sheath Sheath Sheath Sheath Sheath Sheath SheathWire Km of Km of Km of Km of Km of Km of Km of Km of
State Metallic Fiber Metallic Fiber Metallic Fiber Metallic FiberCable Cable Cable Cable
Alabama 0 49,566 3,604 5,572 2,611 78,704 5,626 26 2 ALArizona 15,520 14,318 488 9,626 5,196 52,280 804 0 0 AZ
Arkansas 10 6,593 45 2,342 1,036 50,246 5,089 24 0 ARCalifornia 71,653 174,868 3,787 126,932 29,949 133,993 3,818 224 1 CAColorado 18,369 13,341 332 11,717 5,533 74,623 5,370 3 0 CO
Connecticut 95 50,761 4,804 9,705 4,740 8,120 8 93 0 CTDelaware 0 4,060 1,704 1,344 769 10,554 286 3 0 DEDistrict of Columbia 0 1,197 23 2,321 967 108 0 14 0 DCFlorida 880 55,269 4,082 26,106 19,962 218,449 18,923 152 36 FL
Georgia 0 66,564 9,490 11,214 7,997 116,835 12,403 23 2 GAHawaii 9,738 12,301 1,439 5,766 704 500 7 7 8 HIIdaho 5,303 4,192 191 2,191 939 37,929 2,738 100 19 ID
Illinois 15 41,006 1,208 27,783 12,510 146,523 9,325 19 0 ILIndiana 4,763 43,498 2,363 10,776 5,420 106,189 9,348 8 0 INIowa 311 3,253 19 4,123 1,487 47,794 4,004 32 5 IA
Kansas 1,501 6,956 113 3,799 1,765 58,784 8,415 3 2 KSKentucky 7,493 69,226 8,347 5,455 2,232 43,585 1,541 8 0 KYLouisiana 0 23,737 4,962 7,057 2,620 69,667 3,124 87 3 LAMaine 0 35,070 5,035 1,337 624 1,720 8 116 11 ME
Maryland 0 37,485 6,627 7,034 4,268 37,059 639 21 23 MDMassachusetts 0 69,213 7,538 20,020 7,820 8,922 8 76 0 MAMichigan 5,546 54,401 1,892 24,085 10,386 180,615 12,334 55 12 MI
Minnesota 2,816 7,614 32 8,990 3,487 72,752 4,744 74 0 MNMississippi 0 35,104 3,022 2,163 869 64,549 4,490 8 15 MSMissouri 4,312 37,119 682 9,271 5,453 120,599 9,402 9 4 MO
Montana 4,945 3,359 6 1,078 301 26,748 2,261 2 0 MTNebraska 50 3,017 215 2,508 1,618 43,784 6,519 5 0 NENevada 4,906 7,242 463 9,770 2,443 12,922 1,540 3 0 NV
New Hampshire 0 27,665 3,851 1,946 1,022 3,094 3 51 0 NHNew Jersey 1,575 64,314 13,775 20,748 9,775 19,927 355 76 13 NJNew Mexico 4,598 7,944 243 2,707 1,352 27,604 2,651 0 0 NMNew York 62,609 118,134 13,495 35,767 14,716 66,731 3,985 568 10 NY
North Carolina 3,015 63,694 6,043 8,637 5,303 180,859 15,079 31 20 NCNorth Dakota 85 587 0 584 389 16,798 2,169 0 0 NDOhio 35,286 117,514 10,490 22,710 8,813 116,788 7,376 36 0 OH
Oklahoma 4,117 8,882 143 5,287 1,973 82,708 5,451 68 3 OKOregon 34,241 21,384 603 9,246 3,340 39,915 2,073 25 0 ORPennsylvania 52,108 175,948 28,564 20,102 10,836 51,193 525 6 0 PA
Rhode Island 0 11,355 974 2,486 813 1,072 0 18 5 RISouth Carolina 0 14,044 474 4,456 2,986 67,344 7,302 3 3 SCSouth Dakota 668 982 11 919 383 19,202 2,675 3 0 SD
Tennessee 1,454 66,433 8,539 7,073 3,410 63,527 3,066 15 0 TNTexas 10,386 107,842 4,843 41,204 22,299 310,253 24,003 58 19 TXUtah 1,548 5,576 14 3,540 3,103 23,546 428 0 0 UTVermont 0 19,181 1,809 843 655 2,208 14 10 2 VT
Virginia 2,708 57,715 8,561 8,470 6,716 110,492 9,089 3 11 VAWashington 27,003 31,383 1,138 15,996 5,375 69,363 2,527 178 35 WAWest Virginia 0 28,866 5,488 1,147 710 15,200 19 6 0 WV
Wisconsin 15,144 18,303 660 7,426 3,786 72,973 6,182 42 1 WIWyoming 1,582 1,342 23 798 296 21,594 2,633 3 0 WY
United States 416,353 1,899,418 182,254 582,177 251,757 3,206,944 230,379 2,395 265 US
Puerto Rico 21,317 22,065 1,394 4,502 1,976 7,200 1,175 0 0 PR
Ocean Cable 0 0 0 0 0 0 0 0 0 OC
Total 437,670 1,921,483 183,648 586,679 253,733 3,214,144 231,554 2,395 265 TO
15
Statistics of Communications Common Carriers
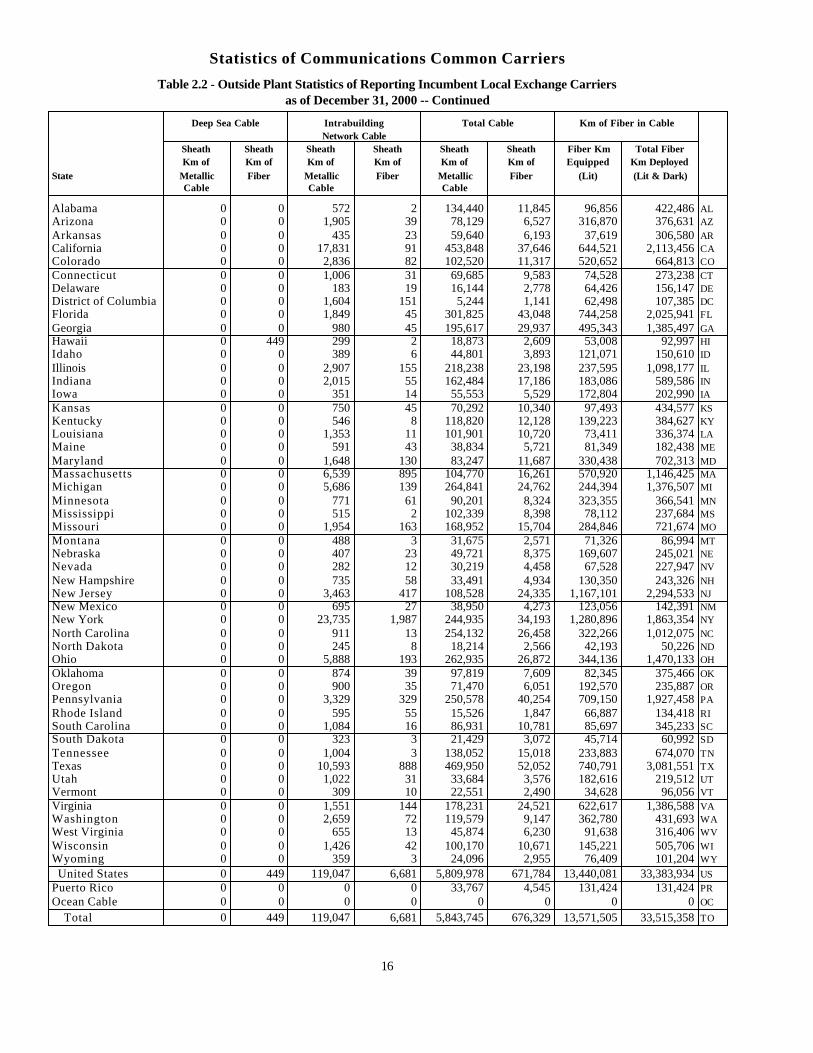
Table 2.2 - Outside Plant Statistics of Reporting Incumbent Local Exchange Carriersas of December 31, 2000 -- Continued
Deep Sea Cable Intrabuilding Total Cable Km of Fiber in CableNetwork Cable
Sheath Sheath Sheath Sheath Sheath Sheath Fiber Km Total FiberKm of Km of Km of Km of Km of Km of Equipped Km Deployed
State Metallic Fiber Metallic Fiber Metallic Fiber (Lit) (Lit & Dark)Cable Cable Cable
Alabama 0 0 572 2 134,440 11,845 96,856 422,486 ALArizona 0 0 1,905 39 78,129 6,527 316,870 376,631 AZ
Arkansas 0 0 435 23 59,640 6,193 37,619 306,580 ARCalifornia 0 0 17,831 91 453,848 37,646 644,521 2,113,456 CAColorado 0 0 2,836 82 102,520 11,317 520,652 664,813 CO
Connecticut 0 0 1,006 31 69,685 9,583 74,528 273,238 CTDelaware 0 0 183 19 16,144 2,778 64,426 156,147 DEDistrict of Columbia 0 0 1,604 151 5,244 1,141 62,498 107,385 DCFlorida 0 0 1,849 45 301,825 43,048 744,258 2,025,941 FL
Georgia 0 0 980 45 195,617 29,937 495,343 1,385,497 GAHawaii 0 449 299 2 18,873 2,609 53,008 92,997 HIIdaho 0 0 389 6 44,801 3,893 121,071 150,610 ID
Illinois 0 0 2,907 155 218,238 23,198 237,595 1,098,177 ILIndiana 0 0 2,015 55 162,484 17,186 183,086 589,586 INIowa 0 0 351 14 55,553 5,529 172,804 202,990 IA
Kansas 0 0 750 45 70,292 10,340 97,493 434,577 KSKentucky 0 0 546 8 118,820 12,128 139,223 384,627 KYLouisiana 0 0 1,353 11 101,901 10,720 73,411 336,374 LAMaine 0 0 591 43 38,834 5,721 81,349 182,438 ME
Maryland 0 0 1,648 130 83,247 11,687 330,438 702,313 MDMassachusetts 0 0 6,539 895 104,770 16,261 570,920 1,146,425 MAMichigan 0 0 5,686 139 264,841 24,762 244,394 1,376,507 MI
Minnesota 0 0 771 61 90,201 8,324 323,355 366,541 MNMississippi 0 0 515 2 102,339 8,398 78,112 237,684 MSMissouri 0 0 1,954 163 168,952 15,704 284,846 721,674 MO
Montana 0 0 488 3 31,675 2,571 71,326 86,994 MTNebraska 0 0 407 23 49,721 8,375 169,607 245,021 NENevada 0 0 282 12 30,219 4,458 67,528 227,947 NV
New Hampshire 0 0 735 58 33,491 4,934 130,350 243,326 NHNew Jersey 0 0 3,463 417 108,528 24,335 1,167,101 2,294,533 NJNew Mexico 0 0 695 27 38,950 4,273 123,056 142,391 NMNew York 0 0 23,735 1,987 244,935 34,193 1,280,896 1,863,354 NY
North Carolina 0 0 911 13 254,132 26,458 322,266 1,012,075 NCNorth Dakota 0 0 245 8 18,214 2,566 42,193 50,226 NDOhio 0 0 5,888 193 262,935 26,872 344,136 1,470,133 OH
Oklahoma 0 0 874 39 97,819 7,609 82,345 375,466 OKOregon 0 0 900 35 71,470 6,051 192,570 235,887 ORPennsylvania 0 0 3,329 329 250,578 40,254 709,150 1,927,458 PA
Rhode Island 0 0 595 55 15,526 1,847 66,887 134,418 RISouth Carolina 0 0 1,084 16 86,931 10,781 85,697 345,233 SCSouth Dakota 0 0 323 3 21,429 3,072 45,714 60,992 SD
Tennessee 0 0 1,004 3 138,052 15,018 233,883 674,070 TNTexas 0 0 10,593 888 469,950 52,052 740,791 3,081,551 TXUtah 0 0 1,022 31 33,684 3,576 182,616 219,512 UTVermont 0 0 309 10 22,551 2,490 34,628 96,056 VT
Virginia 0 0 1,551 144 178,231 24,521 622,617 1,386,588 VAWashington 0 0 2,659 72 119,579 9,147 362,780 431,693 WAWest Virginia 0 0 655 13 45,874 6,230 91,638 316,406 WV
Wisconsin 0 0 1,426 42 100,170 10,671 145,221 505,706 WIWyoming 0 0 359 3 24,096 2,955 76,409 101,204 WY
United States 0 449 119,047 6,681 5,809,978 671,784 13,440,081 33,383,934 US
Puerto Rico 0 0 0 0 33,767 4,545 131,424 131,424 PR
Ocean Cable 0 0 0 0 0 0 0 0 OC
Total 0 449 119,047 6,681 5,843,745 676,329 13,571,505 33,515,358 TO
16
Statistics of Communications Common Carriers
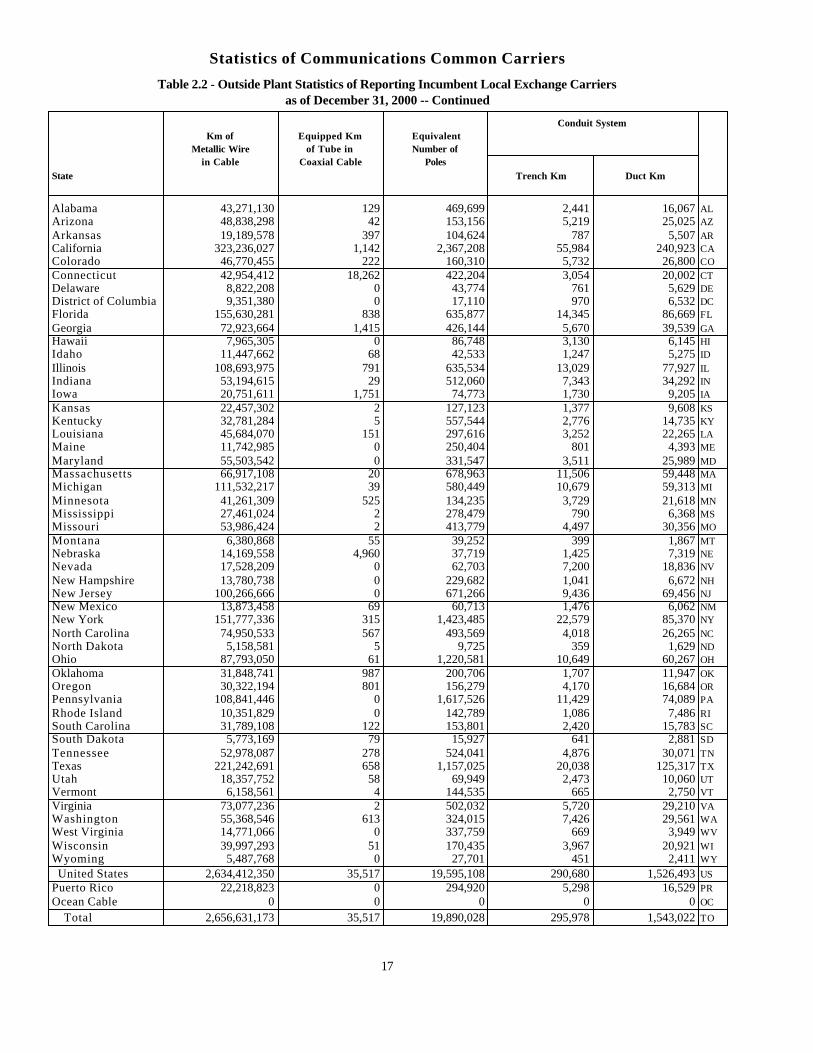
Table 2.2 - Outside Plant Statistics of Reporting Incumbent Local Exchange Carriersas of December 31, 2000 -- Continued
Conduit SystemKm of Equipped Km Equivalent
Metallic Wire of Tube in Number ofin Cable Coaxial Cable Poles
State Trench Km Duct Km
Alabama 43,271,130 129 469,699 2,441 16,067 ALArizona 48,838,298 42 153,156 5,219 25,025 AZ
Arkansas 19,189,578 397 104,624 787 5,507 ARCalifornia 323,236,027 1,142 2,367,208 55,984 240,923 CAColorado 46,770,455 222 160,310 5,732 26,800 CO
Connecticut 42,954,412 18,262 422,204 3,054 20,002 CTDelaware 8,822,208 0 43,774 761 5,629 DEDistrict of Columbia 9,351,380 0 17,110 970 6,532 DCFlorida 155,630,281 838 635,877 14,345 86,669 FL
Georgia 72,923,664 1,415 426,144 5,670 39,539 GAHawaii 7,965,305 0 86,748 3,130 6,145 HIIdaho 11,447,662 68 42,533 1,247 5,275 ID
Illinois 108,693,975 791 635,534 13,029 77,927 ILIndiana 53,194,615 29 512,060 7,343 34,292 INIowa 20,751,611 1,751 74,773 1,730 9,205 IA
Kansas 22,457,302 2 127,123 1,377 9,608 KSKentucky 32,781,284 5 557,544 2,776 14,735 KYLouisiana 45,684,070 151 297,616 3,252 22,265 LAMaine 11,742,985 0 250,404 801 4,393 ME
Maryland 55,503,542 0 331,547 3,511 25,989 MDMassachusetts 66,917,108 20 678,963 11,506 59,448 MAMichigan 111,532,217 39 580,449 10,679 59,313 MI
Minnesota 41,261,309 525 134,235 3,729 21,618 MNMississippi 27,461,024 2 278,479 790 6,368 MSMissouri 53,986,424 2 413,779 4,497 30,356 MO
Montana 6,380,868 55 39,252 399 1,867 MTNebraska 14,169,558 4,960 37,719 1,425 7,319 NENevada 17,528,209 0 62,703 7,200 18,836 NV
New Hampshire 13,780,738 0 229,682 1,041 6,672 NHNew Jersey 100,266,666 0 671,266 9,436 69,456 NJNew Mexico 13,873,458 69 60,713 1,476 6,062 NMNew York 151,777,336 315 1,423,485 22,579 85,370 NY
North Carolina 74,950,533 567 493,569 4,018 26,265 NCNorth Dakota 5,158,581 5 9,725 359 1,629 NDOhio 87,793,050 61 1,220,581 10,649 60,267 OH
Oklahoma 31,848,741 987 200,706 1,707 11,947 OKOregon 30,322,194 801 156,279 4,170 16,684 ORPennsylvania 108,841,446 0 1,617,526 11,429 74,089 PA
Rhode Island 10,351,829 0 142,789 1,086 7,486 RISouth Carolina 31,789,108 122 153,801 2,420 15,783 SCSouth Dakota 5,773,169 79 15,927 641 2,881 SD
Tennessee 52,978,087 278 524,041 4,876 30,071 TNTexas 221,242,691 658 1,157,025 20,038 125,317 TXUtah 18,357,752 58 69,949 2,473 10,060 UTVermont 6,158,561 4 144,535 665 2,750 VT
Virginia 73,077,236 2 502,032 5,720 29,210 VAWashington 55,368,546 613 324,015 7,426 29,561 WAWest Virginia 14,771,066 0 337,759 669 3,949 WV
Wisconsin 39,997,293 51 170,435 3,967 20,921 WIWyoming 5,487,768 0 27,701 451 2,411 WY
United States 2,634,412,350 35,517 19,595,108 290,680 1,526,493 US
Puerto Rico 22,218,823 0 294,920 5,298 16,529 PR
Ocean Cable 0 0 0 0 0 OC
Total 2,656,631,173 35,517 19,890,028 295,978 1,543,022 TO
17
Statistics of Communications Common Carriers
Table 2.2 - Outside Plant Statistics of Reporting Incumbent Local Exchange Carriersas of December 31, 2000 -- Continued
Radio Relay SystemKm of One-Way Radio Channel Km of Telephone Channel
Km of Km of One-Way Terrestrial Km ofTerrestrial Terrestrial One-Way Satellite Analog Digital
State System Radio Channel Radio Channel (4Khz or Equiv) (64Kbps or Equiv)
Alabama 173 1,474 0 0 179,624 ALArizona 5,233 12,667 0 314,063 16,672,907 AZ
Arkansas 721 1,798 0 0 1,459,077 ARCalifornia 6,917 65,318 0 0 46,707,839 CAColorado 3,994 13,870 0 0 16,198,197 CO
Connecticut 0 0 0 0 0 CTDelaware 0 0 0 0 0 DEDistrict of Columbia 0 0 0 0 0 DCFlorida 295 818 0 0 456,147 FL
Georgia 57 271 0 0 84,576 GAHawaii 1,773 15,901 0 0 1,553,234 HIIdaho 1,958 5,119 0 946,809 2,100,803 ID
Illinois 484 1,171 0 0 726,727 ILIndiana 292 660 0 0 526,739 INIowa 826 1,780 0 0 1,572,991 IA
Kansas 0 0 0 0 0 KSKentucky 84 230 0 0 168,249 KYLouisiana 154 307 0 794 151,380 LAMaine 5 5 0 0 240 ME
Maryland 75 208 0 0 14,201 MDMassachusetts 360 1,147 0 0 1,188,000 MAMichigan 700 2,453 0 0 2,414,379 MI
Minnesota 647 1,601 0 0 1,902,684 MNMississippi 0 0 0 0 0 MSMissouri 302 1,263 0 0 468,627 MO
Montana 1,929 4,313 0 0 6,498,475 MTNebraska 522 574 0 0 154,241 NENevada 2,869 5,713 0 701,545 780,351 NV
New Hampshire 0 0 0 0 0 NHNew Jersey 23 46 0 0 15,186 NJNew Mexico 3,218 9,438 0 0 10,046,587 NMNew York 307 5,155 0 0 2,882,999 NY
North Carolina 115 1,553 0 0 194,206 NCNorth Dakota 257 770 0 0 1,024,341 NDOhio 672 3,046 0 0 728,442 OH
Oklahoma 753 1,411 0 0 692,662 OKOregon 3,280 8,775 0 1,134 5,348,839 ORPennsylvania 373 1,567 0 0 415,740 PA
Rhode Island 0 0 0 0 0 RISouth Carolina 0 0 0 0 0 SCSouth Dakota 661 1,393 0 0 224,825 SD
Tennessee 115 728 0 0 174,634 TNTexas 1,016 3,819 0 0 1,539,109 TXUtah 3,260 9,872 0 309,526 8,791,724 UTVermont 0 0 0 0 0 VT
Virginia 366 750 0 0 346,946 VAWashington 4,524 15,539 0 0 18,984,482 WAWest Virginia 0 0 0 0 0 WV
Wisconsin 1,933 10,639 0 0 13,050,983 WIWyoming 5,057 15,777 0 30,378 17,177,248 WY
United States 56,300 228,939 0 2,304,249 183,618,641 US
Puerto Rico 4,169 11,636 0 0 6,678,243 PR
Ocean Cable 0 0 0 0 0 OC
Total 60,469 240,575 0 2,304,249 190,296,884 TO
18
Statistics of Communications Common Carriers
Table 2.2 - Outside Plant Statistics of Reporting Incumbent Local Exchange Carriersas of December 31, 2000 -- Continued
Total Equipped Local Loop Circuit Km Total Equipped Interoffice Circuit Km(Cable and Microwave Systems) (Cable and Microwave Systems)
Analog Digital Video Analog Digital VideoState (4Khz or Equiv) (64Kbps or Equiv) (4Khz or Equiv) (64Kbps or Equiv)
Alabama 9,763,243 7,697,445 187 23,679 47,527,246 801 ALArizona 206,742 7,974,847 0 514,289 89,383,477 0 AZ
Arkansas 13,665,743 4,822,667 0 0 145,175,185 0 ARCalifornia 154,296,070 107,763,837 0 44,626 597,557,125 0 CAColorado 218,906 9,297,126 0 1,453 122,401,678 0 CO
Connecticut 30,520,072 2,072,008 35,510 923,785 192,234,967 0 CTDelaware 3,894,574 9,704,492 0 0 4,943,461 0 DEDistrict of Columbia 8,090,756 7,433,942 0 144 8,998,126 0 DCFlorida 20,265,905 34,222,913 1,754 0 205,425,343 8,598 FL
Georgia 18,086,365 20,009,017 1,434 0 111,319,987 2,057 GAHawaii 310,245 1,252,789 0 5,283,350 18,272,359 0 HIIdaho 4,423 2,185,451 0 1,541,141 38,328,823 0 ID
Illinois 64,436,843 33,926,225 0 415,250 250,234,322 0 ILIndiana 22,876,518 16,426,193 0 14,307 86,728,643 0 INIowa 5,733 1,093,957 0 12,322 28,294,318 0 IA
Kansas 16,443,855 5,253,484 0 0 65,752,639 0 KSKentucky 5,779,691 5,834,315 17 99,885 43,273,167 57 KYLouisiana 10,228,479 4,549,728 48 794 33,353,254 684 LAMaine 4,479,563 1,478,887 0 0 6,003,699 0 ME
Maryland 23,259,556 43,257,535 0 0 39,627,536 0 MDMassachusetts 26,085,298 6,192,092 0 0 21,344,948 0 MAMichigan 68,361,735 31,419,751 0 509,810 222,849,895 0 MI
Minnesota 731 3,572,315 0 402,776 59,833,320 0 MNMississippi 7,395,048 4,457,184 3 0 47,218,538 0 MSMissouri 30,511,252 13,517,497 0 118,582 283,086,629 0 MO
Montana 61,209 1,232,350 0 25,446 25,191,763 0 MTNebraska 20,304 1,254,996 84 0 77,817,753 2,462 NENevada 4,176,536 829,795 0 757,795 10,870,506 0 NV
New Hampshire 4,529,238 2,729,279 0 0 5,270,423 0 NHNew Jersey 43,757,016 68,994,458 572 0 100,277,094 722 NJNew Mexico 9,111 3,060,650 0 0 44,409,279 0 NMNew York 70,245,779 17,044,598 9 0 647,323,740 51 NY
North Carolina 10,737,287 13,893,164 87 0 93,687,179 45 NCNorth Dakota 5,106 463,728 0 240,949 11,264,062 0 NDOhio 43,013,531 27,073,272 0 948,967 191,067,570 0 OH
Oklahoma 24,273,946 6,766,218 0 0 88,060,860 0 OKOregon 6,786 5,543,276 0 178,729 57,234,020 0 ORPennsylvania 47,603,598 63,339,582 4 367,378 115,376,225 63 PA
Rhode Island 4,242,712 1,057,402 0 0 1,374,073 0 RISouth Carolina 5,809,709 6,466,394 86 0 27,954,875 115 SCSouth Dakota 15,252 454,257 0 66,387 27,206,515 0 SD
Tennessee 11,747,369 10,099,451 461 0 43,138,384 2,225 TNTexas 124,536,591 67,407,637 0 1,985,971 917,235,290 0 TXUtah 6,721 2,571,277 0 501,257 47,966,971 0 UTVermont 2,186,868 851,925 0 0 4,546,574 0 VT
Virginia 21,216,940 54,657,813 105,729 391,844 68,170,747 995 VAWashington 34,452 12,109,191 0 153,292 113,663,301 0 WAWest Virginia 5,754,227 12,619,952 0 0 22,435,207 0 WV
Wisconsin 22,850,583 13,228,234 0 0 59,063,402 0 WIWyoming 73,988 1,998,593 0 118,008 41,695,874 0 WY
United States 986,102,205 781,163,189 145,985 15,642,216 5,611,470,372 18,875 US
Puerto Rico 0 347,000 0 0 45,130,392 0 PR
Ocean Cable 0 0 0 0 0 0 OC
Total 986,102,205 781,510,189 145,985 15,642,216 5,656,600,764 18,875 TO
** See notes following Table 2.5.
19
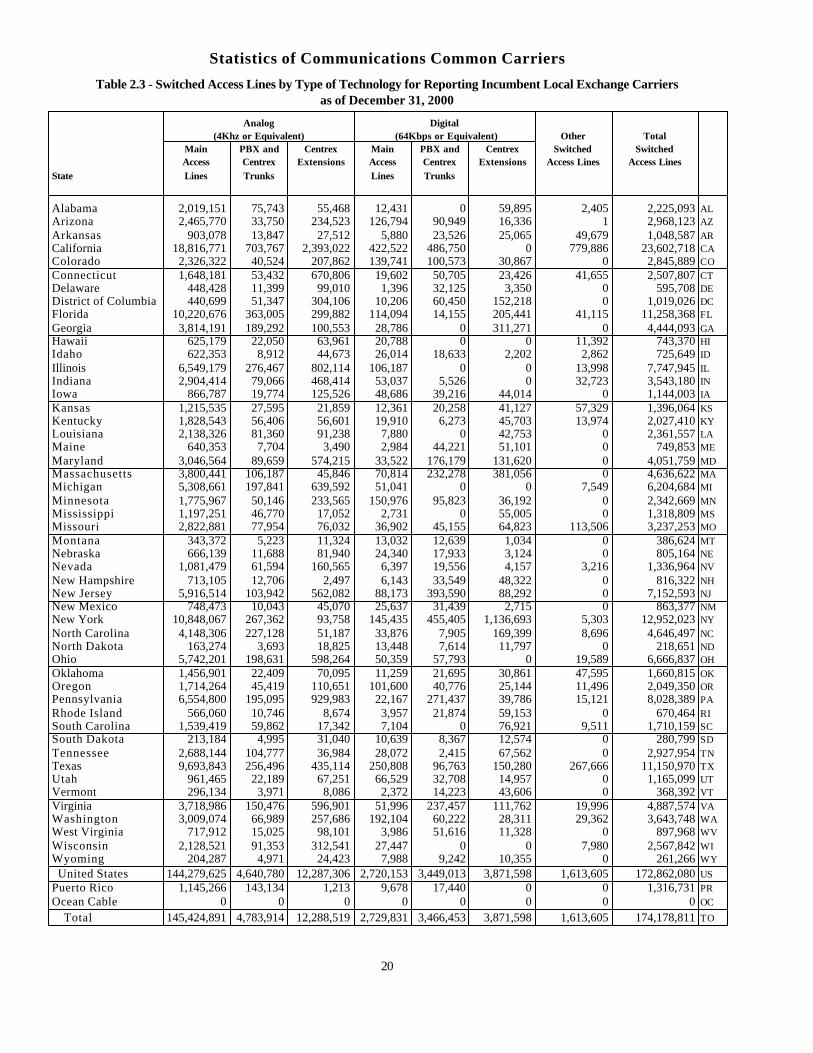
Statistics of Communications Common Carriers
Table 2.3 - Switched Access Lines by Type of Technology for Reporting Incumbent Local Exchange Carriersas of December 31, 2000
Analog Digital(4Khz or Equivalent) (64Kbps or Equivalent) Other Total
Main PBX and Centrex Main PBX and Centrex Switched SwitchedAccess Centrex Extensions Access Centrex Extensions Access Lines Access Lines
State Lines Trunks Lines Trunks
Alabama 2,019,151 75,743 55,468 12,431 0 59,895 2,405 2,225,093 ALArizona 2,465,770 33,750 234,523 126,794 90,949 16,336 1 2,968,123 AZ
Arkansas 903,078 13,847 27,512 5,880 23,526 25,065 49,679 1,048,587 ARCalifornia 18,816,771 703,767 2,393,022 422,522 486,750 0 779,886 23,602,718 CAColorado 2,326,322 40,524 207,862 139,741 100,573 30,867 0 2,845,889 CO
Connecticut 1,648,181 53,432 670,806 19,602 50,705 23,426 41,655 2,507,807 CTDelaware 448,428 11,399 99,010 1,396 32,125 3,350 0 595,708 DEDistrict of Columbia 440,699 51,347 304,106 10,206 60,450 152,218 0 1,019,026 DCFlorida 10,220,676 363,005 299,882 114,094 14,155 205,441 41,115 11,258,368 FL
Georgia 3,814,191 189,292 100,553 28,786 0 311,271 0 4,444,093 GAHawaii 625,179 22,050 63,961 20,788 0 0 11,392 743,370 HIIdaho 622,353 8,912 44,673 26,014 18,633 2,202 2,862 725,649 ID
Illinois 6,549,179 276,467 802,114 106,187 0 0 13,998 7,747,945 ILIndiana 2,904,414 79,066 468,414 53,037 5,526 0 32,723 3,543,180 INIowa 866,787 19,774 125,526 48,686 39,216 44,014 0 1,144,003 IA
Kansas 1,215,535 27,595 21,859 12,361 20,258 41,127 57,329 1,396,064 KSKentucky 1,828,543 56,406 56,601 19,910 6,273 45,703 13,974 2,027,410 KYLouisiana 2,138,326 81,360 91,238 7,880 0 42,753 0 2,361,557 LAMaine 640,353 7,704 3,490 2,984 44,221 51,101 0 749,853 ME
Maryland 3,046,564 89,659 574,215 33,522 176,179 131,620 0 4,051,759 MDMassachusetts 3,800,441 106,187 45,846 70,814 232,278 381,056 0 4,636,622 MAMichigan 5,308,661 197,841 639,592 51,041 0 0 7,549 6,204,684 MI
Minnesota 1,775,967 50,146 233,565 150,976 95,823 36,192 0 2,342,669 MNMississippi 1,197,251 46,770 17,052 2,731 0 55,005 0 1,318,809 MSMissouri 2,822,881 77,954 76,032 36,902 45,155 64,823 113,506 3,237,253 MO
Montana 343,372 5,223 11,324 13,032 12,639 1,034 0 386,624 MTNebraska 666,139 11,688 81,940 24,340 17,933 3,124 0 805,164 NENevada 1,081,479 61,594 160,565 6,397 19,556 4,157 3,216 1,336,964 NV
New Hampshire 713,105 12,706 2,497 6,143 33,549 48,322 0 816,322 NHNew Jersey 5,916,514 103,942 562,082 88,173 393,590 88,292 0 7,152,593 NJNew Mexico 748,473 10,043 45,070 25,637 31,439 2,715 0 863,377 NMNew York 10,848,067 267,362 93,758 145,435 455,405 1,136,693 5,303 12,952,023 NY
North Carolina 4,148,306 227,128 51,187 33,876 7,905 169,399 8,696 4,646,497 NCNorth Dakota 163,274 3,693 18,825 13,448 7,614 11,797 0 218,651 NDOhio 5,742,201 198,631 598,264 50,359 57,793 0 19,589 6,666,837 OH
Oklahoma 1,456,901 22,409 70,095 11,259 21,695 30,861 47,595 1,660,815 OKOregon 1,714,264 45,419 110,651 101,600 40,776 25,144 11,496 2,049,350 ORPennsylvania 6,554,800 195,095 929,983 22,167 271,437 39,786 15,121 8,028,389 PA
Rhode Island 566,060 10,746 8,674 3,957 21,874 59,153 0 670,464 RISouth Carolina 1,539,419 59,862 17,342 7,104 0 76,921 9,511 1,710,159 SCSouth Dakota 213,184 4,995 31,040 10,639 8,367 12,574 0 280,799 SD
Tennessee 2,688,144 104,777 36,984 28,072 2,415 67,562 0 2,927,954 TNTexas 9,693,843 256,496 435,114 250,808 96,763 150,280 267,666 11,150,970 TXUtah 961,465 22,189 67,251 66,529 32,708 14,957 0 1,165,099 UTVermont 296,134 3,971 8,086 2,372 14,223 43,606 0 368,392 VT
Virginia 3,718,986 150,476 596,901 51,996 237,457 111,762 19,996 4,887,574 VAWashington 3,009,074 66,989 257,686 192,104 60,222 28,311 29,362 3,643,748 WAWest Virginia 717,912 15,025 98,101 3,986 51,616 11,328 0 897,968 WV
Wisconsin 2,128,521 91,353 312,541 27,447 0 0 7,980 2,567,842 WIWyoming 204,287 4,971 24,423 7,988 9,242 10,355 0 261,266 WY
United States 144,279,625 4,640,780 12,287,306 2,720,153 3,449,013 3,871,598 1,613,605 172,862,080 US
Puerto Rico 1,145,266 143,134 1,213 9,678 17,440 0 0 1,316,731 PR
Ocean Cable 0 0 0 0 0 0 0 0 OC
Total 145,424,891 4,783,914 12,288,519 2,729,831 3,466,453 3,871,598 1,613,605 174,178,811 TO
20
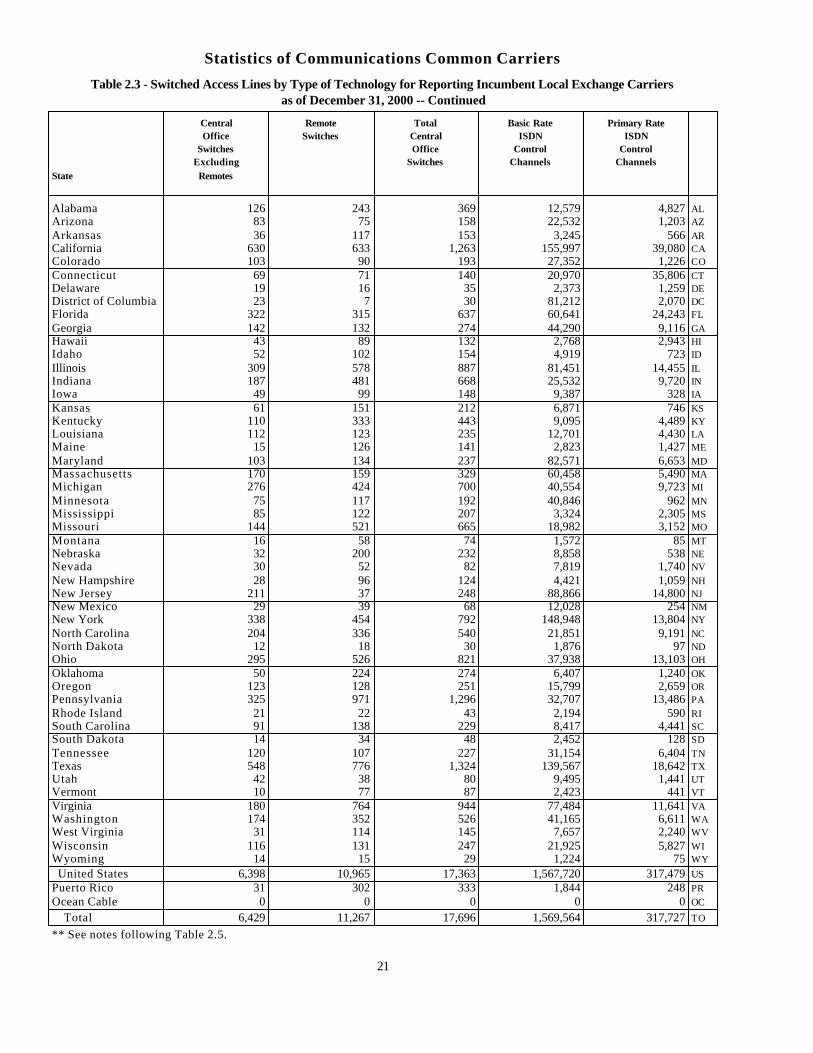
Statistics of Communications Common Carriers
Table 2.3 - Switched Access Lines by Type of Technology for Reporting Incumbent Local Exchange Carriersas of December 31, 2000 -- Continued
Central Remote Total Basic Rate Primary RateOffice Switches Central ISDN ISDN
Switches Office Control ControlExcluding Switches Channels Channels
State Remotes
Alabama 126 243 369 12,579 4,827 ALArizona 83 75 158 22,532 1,203 AZ
Arkansas 36 117 153 3,245 566 ARCalifornia 630 633 1,263 155,997 39,080 CAColorado 103 90 193 27,352 1,226 CO
Connecticut 69 71 140 20,970 35,806 CTDelaware 19 16 35 2,373 1,259 DEDistrict of Columbia 23 7 30 81,212 2,070 DCFlorida 322 315 637 60,641 24,243 FL
Georgia 142 132 274 44,290 9,116 GAHawaii 43 89 132 2,768 2,943 HIIdaho 52 102 154 4,919 723 ID
Illinois 309 578 887 81,451 14,455 ILIndiana 187 481 668 25,532 9,720 INIowa 49 99 148 9,387 328 IA
Kansas 61 151 212 6,871 746 KSKentucky 110 333 443 9,095 4,489 KYLouisiana 112 123 235 12,701 4,430 LAMaine 15 126 141 2,823 1,427 ME
Maryland 103 134 237 82,571 6,653 MDMassachusetts 170 159 329 60,458 5,490 MAMichigan 276 424 700 40,554 9,723 MI
Minnesota 75 117 192 40,846 962 MNMississippi 85 122 207 3,324 2,305 MSMissouri 144 521 665 18,982 3,152 MO
Montana 16 58 74 1,572 85 MTNebraska 32 200 232 8,858 538 NENevada 30 52 82 7,819 1,740 NV
New Hampshire 28 96 124 4,421 1,059 NHNew Jersey 211 37 248 88,866 14,800 NJNew Mexico 29 39 68 12,028 254 NMNew York 338 454 792 148,948 13,804 NY
North Carolina 204 336 540 21,851 9,191 NCNorth Dakota 12 18 30 1,876 97 NDOhio 295 526 821 37,938 13,103 OH
Oklahoma 50 224 274 6,407 1,240 OKOregon 123 128 251 15,799 2,659 ORPennsylvania 325 971 1,296 32,707 13,486 PA
Rhode Island 21 22 43 2,194 590 RISouth Carolina 91 138 229 8,417 4,441 SCSouth Dakota 14 34 48 2,452 128 SD
Tennessee 120 107 227 31,154 6,404 TNTexas 548 776 1,324 139,567 18,642 TXUtah 42 38 80 9,495 1,441 UTVermont 10 77 87 2,423 441 VT
Virginia 180 764 944 77,484 11,641 VAWashington 174 352 526 41,165 6,611 WAWest Virginia 31 114 145 7,657 2,240 WV
Wisconsin 116 131 247 21,925 5,827 WIWyoming 14 15 29 1,224 75 WY
United States 6,398 10,965 17,363 1,567,720 317,479 US
Puerto Rico 31 302 333 1,844 248 PR
Ocean Cable 0 0 0 0 0 OC
Total 6,429 11,267 17,696 1,569,564 317,727 TO
** See notes following Table 2.5.
21
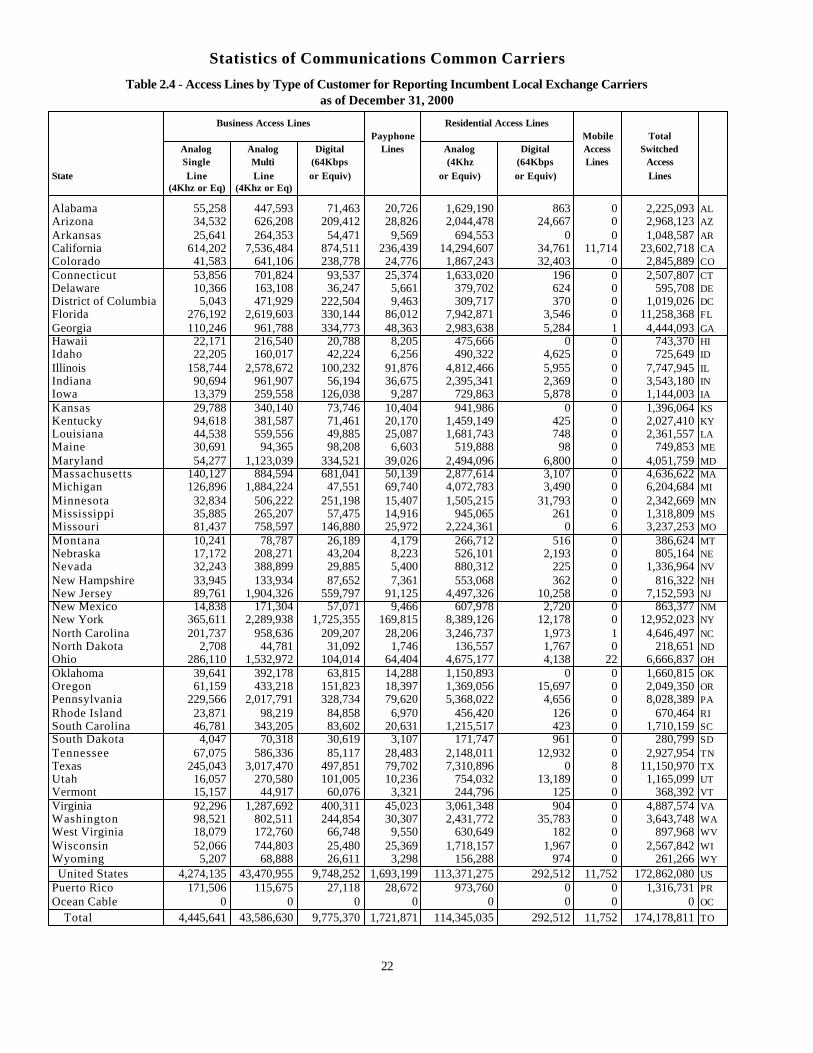
Statistics of Communications Common Carriers
Table 2.4 - Access Lines by Type of Customer for Reporting Incumbent Local Exchange Carriersas of December 31, 2000
Business Access Lines Residential Access LinesPayphone Mobile Total
Analog Analog Digital Lines Analog Digital Access SwitchedSingle Multi (64Kbps (4Khz (64Kbps Lines Access
State Line Line or Equiv) or Equiv) or Equiv) Lines(4Khz or Eq) (4Khz or Eq)
Alabama 55,258 447,593 71,463 20,726 1,629,190 863 0 2,225,093 ALArizona 34,532 626,208 209,412 28,826 2,044,478 24,667 0 2,968,123 AZ
Arkansas 25,641 264,353 54,471 9,569 694,553 0 0 1,048,587 ARCalifornia 614,202 7,536,484 874,511 236,439 14,294,607 34,761 11,714 23,602,718 CAColorado 41,583 641,106 238,778 24,776 1,867,243 32,403 0 2,845,889 CO
Connecticut 53,856 701,824 93,537 25,374 1,633,020 196 0 2,507,807 CTDelaware 10,366 163,108 36,247 5,661 379,702 624 0 595,708 DEDistrict of Columbia 5,043 471,929 222,504 9,463 309,717 370 0 1,019,026 DCFlorida 276,192 2,619,603 330,144 86,012 7,942,871 3,546 0 11,258,368 FL
Georgia 110,246 961,788 334,773 48,363 2,983,638 5,284 1 4,444,093 GAHawaii 22,171 216,540 20,788 8,205 475,666 0 0 743,370 HIIdaho 22,205 160,017 42,224 6,256 490,322 4,625 0 725,649 ID
Illinois 158,744 2,578,672 100,232 91,876 4,812,466 5,955 0 7,747,945 ILIndiana 90,694 961,907 56,194 36,675 2,395,341 2,369 0 3,543,180 INIowa 13,379 259,558 126,038 9,287 729,863 5,878 0 1,144,003 IA
Kansas 29,788 340,140 73,746 10,404 941,986 0 0 1,396,064 KSKentucky 94,618 381,587 71,461 20,170 1,459,149 425 0 2,027,410 KYLouisiana 44,538 559,556 49,885 25,087 1,681,743 748 0 2,361,557 LAMaine 30,691 94,365 98,208 6,603 519,888 98 0 749,853 ME
Maryland 54,277 1,123,039 334,521 39,026 2,494,096 6,800 0 4,051,759 MDMassachusetts 140,127 884,594 681,041 50,139 2,877,614 3,107 0 4,636,622 MAMichigan 126,896 1,884,224 47,551 69,740 4,072,783 3,490 0 6,204,684 MI
Minnesota 32,834 506,222 251,198 15,407 1,505,215 31,793 0 2,342,669 MNMississippi 35,885 265,207 57,475 14,916 945,065 261 0 1,318,809 MSMissouri 81,437 758,597 146,880 25,972 2,224,361 0 6 3,237,253 MO
Montana 10,241 78,787 26,189 4,179 266,712 516 0 386,624 MTNebraska 17,172 208,271 43,204 8,223 526,101 2,193 0 805,164 NENevada 32,243 388,899 29,885 5,400 880,312 225 0 1,336,964 NV
New Hampshire 33,945 133,934 87,652 7,361 553,068 362 0 816,322 NHNew Jersey 89,761 1,904,326 559,797 91,125 4,497,326 10,258 0 7,152,593 NJNew Mexico 14,838 171,304 57,071 9,466 607,978 2,720 0 863,377 NMNew York 365,611 2,289,938 1,725,355 169,815 8,389,126 12,178 0 12,952,023 NY
North Carolina 201,737 958,636 209,207 28,206 3,246,737 1,973 1 4,646,497 NCNorth Dakota 2,708 44,781 31,092 1,746 136,557 1,767 0 218,651 NDOhio 286,110 1,532,972 104,014 64,404 4,675,177 4,138 22 6,666,837 OH
Oklahoma 39,641 392,178 63,815 14,288 1,150,893 0 0 1,660,815 OKOregon 61,159 433,218 151,823 18,397 1,369,056 15,697 0 2,049,350 ORPennsylvania 229,566 2,017,791 328,734 79,620 5,368,022 4,656 0 8,028,389 PA
Rhode Island 23,871 98,219 84,858 6,970 456,420 126 0 670,464 RISouth Carolina 46,781 343,205 83,602 20,631 1,215,517 423 0 1,710,159 SCSouth Dakota 4,047 70,318 30,619 3,107 171,747 961 0 280,799 SD
Tennessee 67,075 586,336 85,117 28,483 2,148,011 12,932 0 2,927,954 TNTexas 245,043 3,017,470 497,851 79,702 7,310,896 0 8 11,150,970 TXUtah 16,057 270,580 101,005 10,236 754,032 13,189 0 1,165,099 UTVermont 15,157 44,917 60,076 3,321 244,796 125 0 368,392 VT
Virginia 92,296 1,287,692 400,311 45,023 3,061,348 904 0 4,887,574 VAWashington 98,521 802,511 244,854 30,307 2,431,772 35,783 0 3,643,748 WAWest Virginia 18,079 172,760 66,748 9,550 630,649 182 0 897,968 WV
Wisconsin 52,066 744,803 25,480 25,369 1,718,157 1,967 0 2,567,842 WIWyoming 5,207 68,888 26,611 3,298 156,288 974 0 261,266 WY
United States 4,274,135 43,470,955 9,748,252 1,693,199 113,371,275 292,512 11,752 172,862,080 US
Puerto Rico 171,506 115,675 27,118 28,672 973,760 0 0 1,316,731 PR
Ocean Cable 0 0 0 0 0 0 0 0 OC
Total 4,445,641 43,586,630 9,775,370 1,721,871 114,345,035 292,512 11,752 174,178,811 TO
22
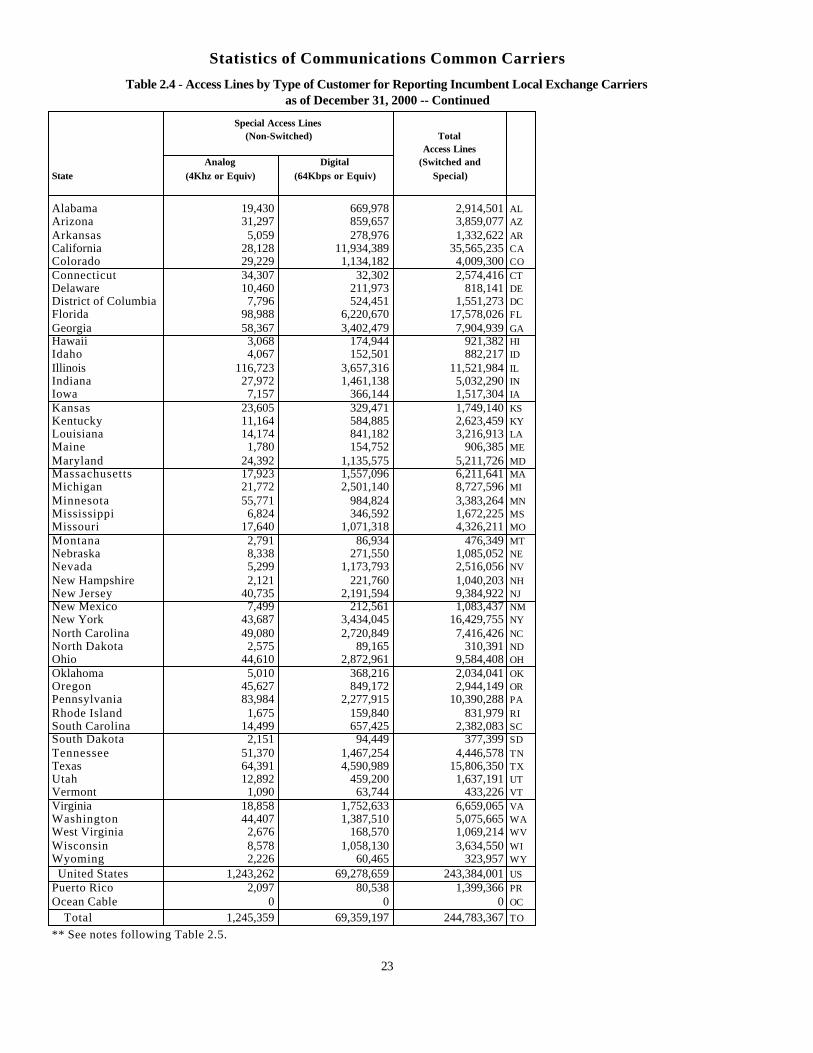
Statistics of Communications Common Carriers
Table 2.4 - Access Lines by Type of Customer for Reporting Incumbent Local Exchange Carriersas of December 31, 2000 -- Continued
Special Access Lines(Non-Switched) Total
Access LinesAnalog Digital (Switched and
State (4Khz or Equiv) (64Kbps or Equiv) Special)
Alabama 19,430 669,978 2,914,501 ALArizona 31,297 859,657 3,859,077 AZ
Arkansas 5,059 278,976 1,332,622 ARCalifornia 28,128 11,934,389 35,565,235 CAColorado 29,229 1,134,182 4,009,300 CO
Connecticut 34,307 32,302 2,574,416 CTDelaware 10,460 211,973 818,141 DEDistrict of Columbia 7,796 524,451 1,551,273 DCFlorida 98,988 6,220,670 17,578,026 FL
Georgia 58,367 3,402,479 7,904,939 GAHawaii 3,068 174,944 921,382 HIIdaho 4,067 152,501 882,217 ID
Illinois 116,723 3,657,316 11,521,984 ILIndiana 27,972 1,461,138 5,032,290 INIowa 7,157 366,144 1,517,304 IA
Kansas 23,605 329,471 1,749,140 KSKentucky 11,164 584,885 2,623,459 KYLouisiana 14,174 841,182 3,216,913 LAMaine 1,780 154,752 906,385 ME
Maryland 24,392 1,135,575 5,211,726 MDMassachusetts 17,923 1,557,096 6,211,641 MAMichigan 21,772 2,501,140 8,727,596 MI
Minnesota 55,771 984,824 3,383,264 MNMississippi 6,824 346,592 1,672,225 MSMissouri 17,640 1,071,318 4,326,211 MO
Montana 2,791 86,934 476,349 MTNebraska 8,338 271,550 1,085,052 NENevada 5,299 1,173,793 2,516,056 NV
New Hampshire 2,121 221,760 1,040,203 NHNew Jersey 40,735 2,191,594 9,384,922 NJNew Mexico 7,499 212,561 1,083,437 NMNew York 43,687 3,434,045 16,429,755 NY
North Carolina 49,080 2,720,849 7,416,426 NCNorth Dakota 2,575 89,165 310,391 NDOhio 44,610 2,872,961 9,584,408 OH
Oklahoma 5,010 368,216 2,034,041 OKOregon 45,627 849,172 2,944,149 ORPennsylvania 83,984 2,277,915 10,390,288 PA
Rhode Island 1,675 159,840 831,979 RISouth Carolina 14,499 657,425 2,382,083 SCSouth Dakota 2,151 94,449 377,399 SD
Tennessee 51,370 1,467,254 4,446,578 TNTexas 64,391 4,590,989 15,806,350 TXUtah 12,892 459,200 1,637,191 UTVermont 1,090 63,744 433,226 VT
Virginia 18,858 1,752,633 6,659,065 VAWashington 44,407 1,387,510 5,075,665 WAWest Virginia 2,676 168,570 1,069,214 WV
Wisconsin 8,578 1,058,130 3,634,550 WIWyoming 2,226 60,465 323,957 WY
United States 1,243,262 69,278,659 243,384,001 US
Puerto Rico 2,097 80,538 1,399,366 PR
Ocean Cable 0 0 0 OC
Total 1,245,359 69,359,197 244,783,367 TO
** See notes following Table 2.5.
23
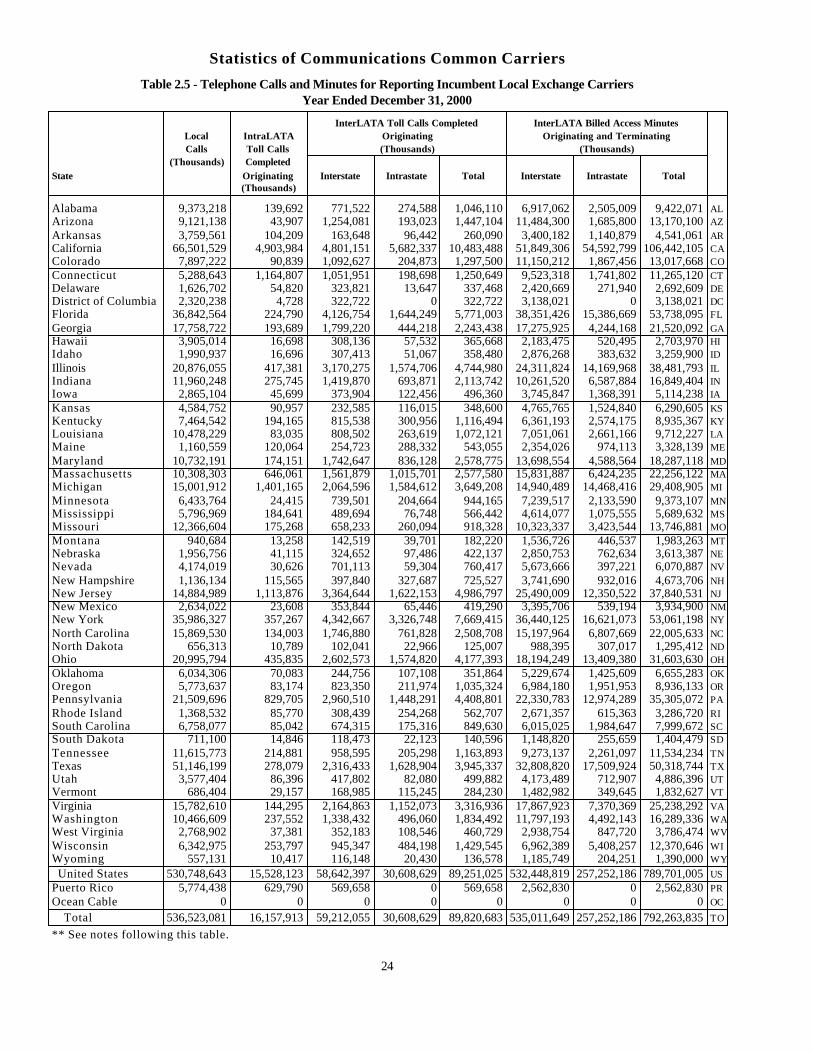
Statistics of Communications Common Carriers
Table 2.5 - Telephone Calls and Minutes for Reporting Incumbent Local Exchange CarriersYear Ended December 31, 2000
InterLATA Toll Calls Completed InterLATA Billed Access MinutesLocal IntraLATA Originating Originating and TerminatingCalls Toll Calls (Thousands) (Thousands)
(Thousands) CompletedState Originating Interstate Intrastate Total Interstate Intrastate Total
(Thousands)
Alabama 9,373,218 139,692 771,522 274,588 1,046,110 6,917,062 2,505,009 9,422,071 ALArizona 9,121,138 43,907 1,254,081 193,023 1,447,104 11,484,300 1,685,800 13,170,100 AZ
Arkansas 3,759,561 104,209 163,648 96,442 260,090 3,400,182 1,140,879 4,541,061 ARCalifornia 66,501,529 4,903,984 4,801,151 5,682,337 10,483,488 51,849,306 54,592,799 106,442,105 CAColorado 7,897,222 90,839 1,092,627 204,873 1,297,500 11,150,212 1,867,456 13,017,668 CO
Connecticut 5,288,643 1,164,807 1,051,951 198,698 1,250,649 9,523,318 1,741,802 11,265,120 CTDelaware 1,626,702 54,820 323,821 13,647 337,468 2,420,669 271,940 2,692,609 DEDistrict of Columbia 2,320,238 4,728 322,722 0 322,722 3,138,021 0 3,138,021 DCFlorida 36,842,564 224,790 4,126,754 1,644,249 5,771,003 38,351,426 15,386,669 53,738,095 FL
Georgia 17,758,722 193,689 1,799,220 444,218 2,243,438 17,275,925 4,244,168 21,520,092 GAHawaii 3,905,014 16,698 308,136 57,532 365,668 2,183,475 520,495 2,703,970 HIIdaho 1,990,937 16,696 307,413 51,067 358,480 2,876,268 383,632 3,259,900 ID
Illinois 20,876,055 417,381 3,170,275 1,574,706 4,744,980 24,311,824 14,169,968 38,481,793 ILIndiana 11,960,248 275,745 1,419,870 693,871 2,113,742 10,261,520 6,587,884 16,849,404 INIowa 2,865,104 45,699 373,904 122,456 496,360 3,745,847 1,368,391 5,114,238 IA
Kansas 4,584,752 90,957 232,585 116,015 348,600 4,765,765 1,524,840 6,290,605 KSKentucky 7,464,542 194,165 815,538 300,956 1,116,494 6,361,193 2,574,175 8,935,367 KYLouisiana 10,478,229 83,035 808,502 263,619 1,072,121 7,051,061 2,661,166 9,712,227 LAMaine 1,160,559 120,064 254,723 288,332 543,055 2,354,026 974,113 3,328,139 ME
Maryland 10,732,191 174,151 1,742,647 836,128 2,578,775 13,698,554 4,588,564 18,287,118 MDMassachusetts 10,308,303 646,061 1,561,879 1,015,701 2,577,580 15,831,887 6,424,235 22,256,122 MAMichigan 15,001,912 1,401,165 2,064,596 1,584,612 3,649,208 14,940,489 14,468,416 29,408,905 MI
Minnesota 6,433,764 24,415 739,501 204,664 944,165 7,239,517 2,133,590 9,373,107 MNMississippi 5,796,969 184,641 489,694 76,748 566,442 4,614,077 1,075,555 5,689,632 MSMissouri 12,366,604 175,268 658,233 260,094 918,328 10,323,337 3,423,544 13,746,881 MO
Montana 940,684 13,258 142,519 39,701 182,220 1,536,726 446,537 1,983,263 MTNebraska 1,956,756 41,115 324,652 97,486 422,137 2,850,753 762,634 3,613,387 NENevada 4,174,019 30,626 701,113 59,304 760,417 5,673,666 397,221 6,070,887 NV
New Hampshire 1,136,134 115,565 397,840 327,687 725,527 3,741,690 932,016 4,673,706 NHNew Jersey 14,884,989 1,113,876 3,364,644 1,622,153 4,986,797 25,490,009 12,350,522 37,840,531 NJNew Mexico 2,634,022 23,608 353,844 65,446 419,290 3,395,706 539,194 3,934,900 NMNew York 35,986,327 357,267 4,342,667 3,326,748 7,669,415 36,440,125 16,621,073 53,061,198 NY
North Carolina 15,869,530 134,003 1,746,880 761,828 2,508,708 15,197,964 6,807,669 22,005,633 NCNorth Dakota 656,313 10,789 102,041 22,966 125,007 988,395 307,017 1,295,412 NDOhio 20,995,794 435,835 2,602,573 1,574,820 4,177,393 18,194,249 13,409,380 31,603,630 OH
Oklahoma 6,034,306 70,083 244,756 107,108 351,864 5,229,674 1,425,609 6,655,283 OKOregon 5,773,637 83,174 823,350 211,974 1,035,324 6,984,180 1,951,953 8,936,133 ORPennsylvania 21,509,696 829,705 2,960,510 1,448,291 4,408,801 22,330,783 12,974,289 35,305,072 PA
Rhode Island 1,368,532 85,770 308,439 254,268 562,707 2,671,357 615,363 3,286,720 RISouth Carolina 6,758,077 85,042 674,315 175,316 849,630 6,015,025 1,984,647 7,999,672 SCSouth Dakota 711,100 14,846 118,473 22,123 140,596 1,148,820 255,659 1,404,479 SD
Tennessee 11,615,773 214,881 958,595 205,298 1,163,893 9,273,137 2,261,097 11,534,234 TNTexas 51,146,199 278,079 2,316,433 1,628,904 3,945,337 32,808,820 17,509,924 50,318,744 TXUtah 3,577,404 86,396 417,802 82,080 499,882 4,173,489 712,907 4,886,396 UTVermont 686,404 29,157 168,985 115,245 284,230 1,482,982 349,645 1,832,627 VT
Virginia 15,782,610 144,295 2,164,863 1,152,073 3,316,936 17,867,923 7,370,369 25,238,292 VAWashington 10,466,609 237,552 1,338,432 496,060 1,834,492 11,797,193 4,492,143 16,289,336 WAWest Virginia 2,768,902 37,381 352,183 108,546 460,729 2,938,754 847,720 3,786,474 WV
Wisconsin 6,342,975 253,797 945,347 484,198 1,429,545 6,962,389 5,408,257 12,370,646 WIWyoming 557,131 10,417 116,148 20,430 136,578 1,185,749 204,251 1,390,000 WY
United States 530,748,643 15,528,123 58,642,397 30,608,629 89,251,025 532,448,819 257,252,186 789,701,005 US
Puerto Rico 5,774,438 629,790 569,658 0 569,658 2,562,830 0 2,562,830 PR
Ocean Cable 0 0 0 0 0 0 0 0 OC
Total 536,523,081 16,157,913 59,212,055 30,608,629 89,820,683 535,011,649 257,252,186 792,263,835 TO
** See notes following this table.
24
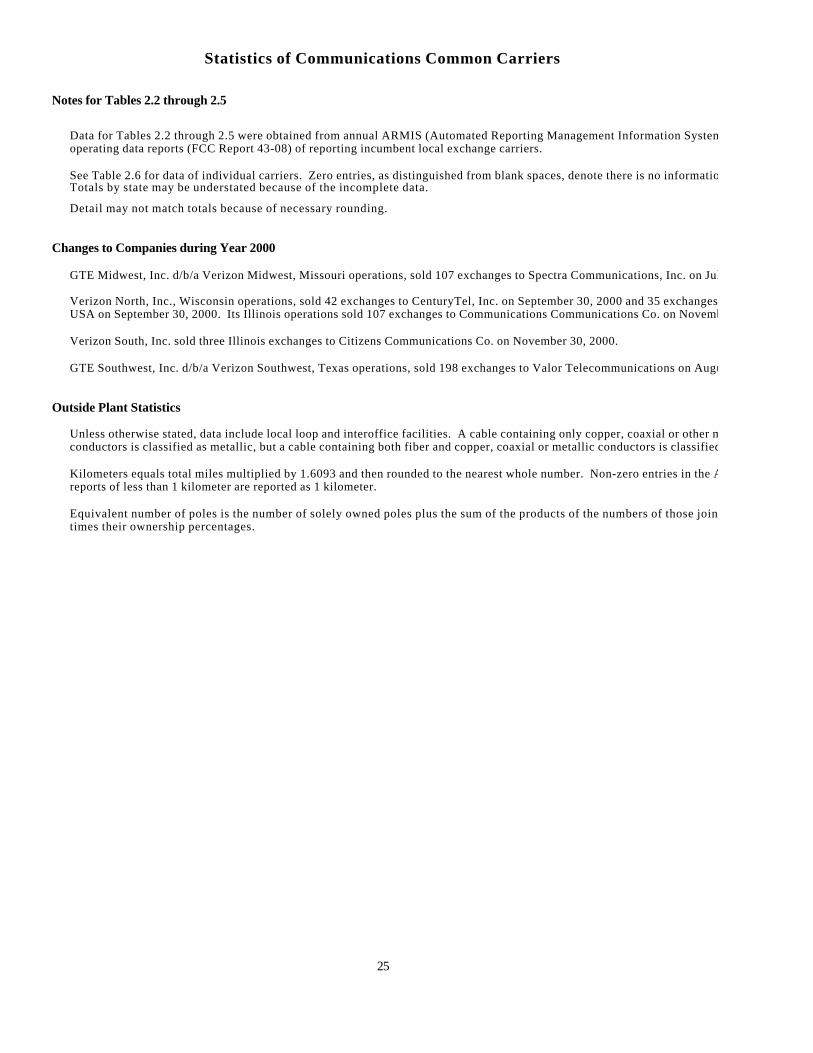
Statistics of Communications Common Carriers
Notes for Tables 2.2 through 2.5
Data for Tables 2.2 through 2.5 were obtained from annual ARMIS (Automated Reporting Management Information System) operating data reports (FCC Report 43-08) of reporting incumbent local exchange carriers.
See Table 2.6 for data of individual carriers. Zero entries, as distinguished from blank spaces, denote there is no information to report. Totals by state may be understated because of the incomplete data.
Detail may not match totals because of necessary rounding.
Changes to Companies during Year 2000
GTE Midwest, Inc. d/b/a Verizon Midwest, Missouri operations, sold 107 exchanges to Spectra Communications, Inc. on July 31, 2000.
Verizon North, Inc., Wisconsin operations, sold 42 exchanges to CenturyTel, Inc. on September 30, 2000 and 35 exchanges to Telephone USA on September 30, 2000. Its Illinois operations sold 107 exchanges to Communications Communications Co. on November 30, 2000.
Verizon South, Inc. sold three Illinois exchanges to Citizens Communications Co. on November 30, 2000.
GTE Southwest, Inc. d/b/a Verizon Southwest, Texas operations, sold 198 exchanges to Valor Telecommunications on August 31, 2000.
Outside Plant Statistics
Unless otherwise stated, data include local loop and interoffice facilities. A cable containing only copper, coaxial or other metallic conductors is classified as metallic, but a cable containing both fiber and copper, coaxial or metallic conductors is classified as fiber. Kilometers equals total miles multiplied by 1.6093 and then rounded to the nearest whole number. Non-zero entries in the ARMIS reports of less than 1 kilometer are reported as 1 kilometer.
Equivalent number of poles is the number of solely owned poles plus the sum of the products of the numbers of those jointly owned times their ownership percentages.
WAWV
WY
25
Statistics of Communications Common Carriers
Notes for Tables 2.2 through 2.5 - Continued
Access Lines
Access lines include WATS and WATS-like access lines, 800 and 800-like access lines, and employee concession lines, but not official/company circuits. Analog access lines are shown in 4Khz equivalents and include access lines from digital switches if the lines themselves are not terminated at the customer's premises as digital lines.
Digital access lines are shown in 64 Kbps equivalents. To be classified as digital, the access lines must be terminated at the customer end as digital lines or be available for use by the customer as digital lines.
Other switched access lines exclude digital centrex extensions, which were included prior to 1991. Switched access lines exclude ISDN control channels, which were included as 64 Kbps equivalents prior to 1991. Switched access lines also exclude WATS and WATS-like access lines, which were included as switched access lines prior to 1997. WATS and WATS-like access lines are classified as special access lines.
Verizon North, Inc., Wisconsin operations, sold 42 exchanges to CenturyTel, Inc. on September 30, 2000 and 35 exchanges to Telephone Figures for switched access lines reported in the ARMIS 43-08 Report for some companies are slightly different from figures for billable access lines reported in the ARMIS annual summary report (FCC Report 43-01) for a variety of reasons, including different reporting requirements, the interpretation of those requirements by the various companies, and the methods different companies use to calculate the number of lines. The majority of the differences come from the fact that derived ISDN channels are included in the count of switched access lines in the ARMIS 43-08, but are not treated as billable access lines in the ARMIS 43-01. Some companies may have included official/company circuits with ARMIS 43-08 access lines. BellSouth Telecommunications, Inc. excluded feature Group A, out-WATS, 800 service, and two-way WATS from access lines. The company reported only CPE and semi-public access lines as public access lines. The company was unable to provide digital PBX & Centrex trunks by technology, reporting analog and digital PBX & Centrex trunks in the analog category.
conductors is classified as metallic, but a cable containing both fiber and copper, coaxial or metallic conductors is classified as fiber. The Ameritech operating companies, now part of SBC, did not report digital PBX & Centrex trunks or Centrex extensions. Pacific Bell did not report digital Centrex extensions.
The following Verizon companies did not report digital PBX & Centrex trunks and digital Centrex extensions by technology: Verizon California, Verizon Florida, Verizon Hawaii, Contel of the South d/b/a Verizon Mid-States, GTE Midwest d/b/a Verizon Midwest, Verizon Northwest, Verizon South, and GTE Southwest d/b/a Verizon Southwest. Puerto Rico Telephone Co. did not report Centrex extensions by technology.
The following ALLTEL companies reported digital PBX trunks as analog: Aliant, ALLTEL Carolina, and ALLTEL Georgia. All of the ALLTEL companies reported digital Centrex extensions as analog. None of them reported digital Centrex trunks.
The Sprint operating companies did not report digital Centrex extensions.
Telephone Calls and Minutes
The number of toll calls is based on originating message volumes and includes outward calls, 800 and 800-like service, directory service, dial-it services (e.g., 900 and 936 services), and optional calling plans. IntraLATA toll calls are carried by the reporting local operating company within a given Local Access and Transport Area (LATA). InterLATA toll calls are directed to and carried by interexchange carriers. Billed access minutes are based on bills sent to interexchange carriers and include total originating and terminating access minutes-of-use, including call set-up time, holding time, and conversation time.
26

Statistics of Communications Common CarriersTable 2.6 - Operating Statistics of Reporting Incumbent Local Exchange Carriers
as of December 31, 20001 2 3
All Regional Mid-SizedReporting Bell Reporting
Items Incumbent Local Operating Incumbent LocalExchange Companies Exchange
Companies Companies* * *
Outside Plant Statistics:Km of Aerial Wire 437,670 367,504 70,166
Aerial Cable: Sheath Km of Metallic Cable 1,921,483 1,690,853 230,630Sheath Km of Fiber 183,648 162,791 20,857
Underground Cable: Sheath Km of Metallic Cable 586,679 562,051 24,628Sheath Km of Fiber 253,733 244,641 9,092
Buried Cable: Sheath Km of Metallic Cable 3,214,144 2,816,333 397,811Sheath Km of Fiber 231,554 205,751 25,803
Submarine Cable: Sheath Km of Metallic Cable 2,395 2,129 266Sheath Km of Metallic Cable 265 235 30
Deep Sea Cable: Sheath Km of Metallic Cable 0 0 0Sheath Km of Fiber 449 449 0
Intrabuilding Network Cable: Sheath Km of Metallic Cable 119,047 117,154 1,893Sheath Km of Fiber 6,681 6,504 177
Total Cable: Sheath Km of Metallic Cable 5,843,745 5,188,516 655,229Sheath Km of Fiber 676,329 620,371 55,958
Km of Fiber in Cable: Fiber Km Equipped (Lit) 13,571,505 12,848,598 722,907 Total Fiber Km Deployed (Lit & Dark) 33,515,358 31,569,086 1,946,272
Km of Metallic Wire in Cable 2,656,631,173 2,530,477,189 126,153,984Equipped Km of Tube in Coaxial Cable 35,517 35,475 42Equivalent Number of Poles 19,890,028 17,769,088 2,120,940Conduit System: Trench Km 295,978 279,311 16,667
Duct Km 1,543,022 1,480,697 62,325
Km of Terrestrial Radio Relay System 60,469 57,056 3,413Km of One-Way Terrestrial Radio Channel 240,575 232,178 8,397Terrestrial Km of One-Way Satellite Radio Channel 0 0 0Km of Telephone Channel on Radio: Analog (4Khz or Equiv) 2,304,249 1,633,750 670,499 Digital (64Kbps or Equiv) 190,296,884 187,527,696 2,769,188
Total Equipped Local Loop Circuit Km: Analog (4Khz or Equiv) 986,102,205 977,486,530 8,615,675 (Cable and Microwave) Digital (64Kbps or Equiv) 781,510,189 764,499,603 17,010,586
Video 145,985 39,512 106,473Total Equipped Interoffice Circuit Km: Analog (4Khz or Equiv) 15,642,216 14,915,467 726,749 (Cable and Microwave) Digital (64Kbps or Equiv) 5,656,600,764 5,411,166,663 245,434,101
Video 18,875 12,790 6,085
Switched Access Lines by Type of Technology:Analog (4Khz or Equiv): Main Access Lines 145,424,891 135,493,110 9,931,781
PBX & Centrex Trunks 4,783,914 4,280,973 502,941Centrex Extensions 12,288,519 11,647,917 640,602
Digital (64Kbps or Equiv): Main Access Lines 2,729,831 2,689,670 40,161PBX & Centrex Trunks 3,466,453 3,323,516 142,937Centrex Extensions 3,871,598 3,857,448 14,150
Other Switched Access Lines 1,613,605 1,608,196 5,409
Total Switched Access Lines 174,178,811 162,900,830 11,277,981
Central Office Switches Excluding Remotes 6,429 5,889 540Remote Switches 11,267 9,527 1,740
Total Central Office Switches 17,696 15,416 2,280
Basic Rate ISDN Control Channels 1,569,564 1,532,868 36,696Primary Rate ISDN Control Channels 317,727 304,416 13,311
Access Lines by Type of Customer:Business Access Lines: Analog Single Line (4Khz or Equiv) 4,445,641 3,743,407 702,234
Analog Multi Line (4Khz or Equiv) 43,586,630 41,306,521 2,280,109Digital (64Kbps or Equiv) 9,775,370 9,578,362 197,008
Payphone Lines 1,721,871 1,674,216 47,655Residential Access Lines: Analog (4Khz or Equiv) 114,345,035 106,294,338 8,050,697
Digital (64Kbps or Equiv) 292,512 292,272 240Mobile Access Lines 11,752 11,714 38
Total Switched Access Lines 174,178,811 162,900,830 11,277,981Special Access Lines (Non-Switched): Analog (4Khz or Equiv) 1,245,359 1,217,488 27,871
Digital (64Kbps or Equiv) 69,359,197 64,380,848 4,978,349
Total Access Lines (Switched and Special) 244,783,367 228,499,166 16,284,201
Telephone Calls and Billed Access Minutes (in Thousands):Local Calls 536,523,081 506,321,745 30,201,336IntraLATA Toll Calls Completed (Originating) 16,157,912 15,573,530 584,382InterLATA Toll Calls Completed: Interstate 59,212,055 54,570,816 4,641,239 (Originating) Intrastate 30,608,629 28,234,189 2,374,440
Total 89,820,684 82,805,006 7,015,678InterLATA Billed Access Minutes: Interstate 535,011,649 500,132,396 34,879,253 (Originating and Terminating) Intrastate 257,252,187 242,321,178 14,931,009
Total 792,263,835 742,453,574 49,810,261
27
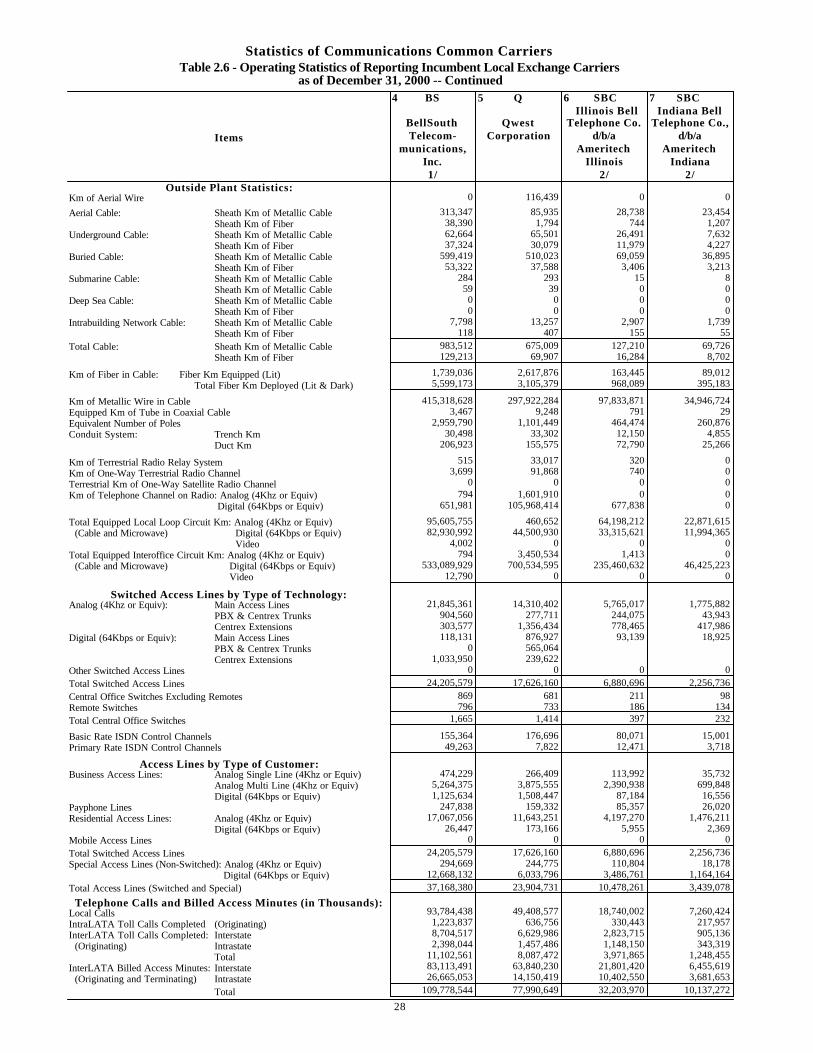
Statistics of Communications Common CarriersTable 2.6 - Operating Statistics of Reporting Incumbent Local Exchange Carriers
as of December 31, 2000 -- Continued4 BS 5 Q 6 SBC 7 SBC
Illinois Bell Indiana BellBellSouth Qwest Telephone Co. Telephone Co.,
Items Telecom- Corporation d/b/a d/b/amunications, Ameritech Ameritech
Inc. Illinois Indiana1/ 2/ 2/
Outside Plant Statistics:Km of Aerial Wire 0 116,439 0 0
Aerial Cable: Sheath Km of Metallic Cable 313,347 85,935 28,738 23,454Sheath Km of Fiber 38,390 1,794 744 1,207
Underground Cable: Sheath Km of Metallic Cable 62,664 65,501 26,491 7,632Sheath Km of Fiber 37,324 30,079 11,979 4,227
Buried Cable: Sheath Km of Metallic Cable 599,419 510,023 69,059 36,895Sheath Km of Fiber 53,322 37,588 3,406 3,213
Submarine Cable: Sheath Km of Metallic Cable 284 293 15 8Sheath Km of Metallic Cable 59 39 0 0
Deep Sea Cable: Sheath Km of Metallic Cable 0 0 0 0Sheath Km of Fiber 0 0 0 0
Intrabuilding Network Cable: Sheath Km of Metallic Cable 7,798 13,257 2,907 1,739Sheath Km of Fiber 118 407 155 55
Total Cable: Sheath Km of Metallic Cable 983,512 675,009 127,210 69,726Sheath Km of Fiber 129,213 69,907 16,284 8,702
Km of Fiber in Cable: Fiber Km Equipped (Lit) 1,739,036 2,617,876 163,445 89,012 Total Fiber Km Deployed (Lit & Dark) 5,599,173 3,105,379 968,089 395,183
Km of Metallic Wire in Cable 415,318,628 297,922,284 97,833,871 34,946,724Equipped Km of Tube in Coaxial Cable 3,467 9,248 791 29Equivalent Number of Poles 2,959,790 1,101,449 464,474 260,876Conduit System: Trench Km 30,498 33,302 12,150 4,855
Duct Km 206,923 155,575 72,790 25,266
Km of Terrestrial Radio Relay System 515 33,017 320 0Km of One-Way Terrestrial Radio Channel 3,699 91,868 740 0Terrestrial Km of One-Way Satellite Radio Channel 0 0 0 0Km of Telephone Channel on Radio: Analog (4Khz or Equiv) 794 1,601,910 0 0 Digital (64Kbps or Equiv) 651,981 105,968,414 677,838 0
Total Equipped Local Loop Circuit Km: Analog (4Khz or Equiv) 95,605,755 460,652 64,198,212 22,871,615 (Cable and Microwave) Digital (64Kbps or Equiv) 82,930,992 44,500,930 33,315,621 11,994,365
Video 4,002 0 0 0Total Equipped Interoffice Circuit Km: Analog (4Khz or Equiv) 794 3,450,534 1,413 0 (Cable and Microwave) Digital (64Kbps or Equiv) 533,089,929 700,534,595 235,460,632 46,425,223
Video 12,790 0 0 0
Switched Access Lines by Type of Technology:Analog (4Khz or Equiv): Main Access Lines 21,845,361 14,310,402 5,765,017 1,775,882
PBX & Centrex Trunks 904,560 277,711 244,075 43,943Centrex Extensions 303,577 1,356,434 778,465 417,986
Digital (64Kbps or Equiv): Main Access Lines 118,131 876,927 93,139 18,925PBX & Centrex Trunks 0 565,064 0 0Centrex Extensions 1,033,950 239,622 0 0
Other Switched Access Lines 0 0 0 0
Total Switched Access Lines 24,205,579 17,626,160 6,880,696 2,256,736
Central Office Switches Excluding Remotes 869 681 211 98Remote Switches 796 733 186 134
Total Central Office Switches 1,665 1,414 397 232
Basic Rate ISDN Control Channels 155,364 176,696 80,071 15,001Primary Rate ISDN Control Channels 49,263 7,822 12,471 3,718
Access Lines by Type of Customer:Business Access Lines: Analog Single Line (4Khz or Equiv) 474,229 266,409 113,992 35,732
Analog Multi Line (4Khz or Equiv) 5,264,375 3,875,555 2,390,938 699,848Digital (64Kbps or Equiv) 1,125,634 1,508,447 87,184 16,556
Payphone Lines 247,838 159,332 85,357 26,020Residential Access Lines: Analog (4Khz or Equiv) 17,067,056 11,643,251 4,197,270 1,476,211
Digital (64Kbps or Equiv) 26,447 173,166 5,955 2,369Mobile Access Lines 0 0 0 0
Total Switched Access Lines 24,205,579 17,626,160 6,880,696 2,256,736Special Access Lines (Non-Switched): Analog (4Khz or Equiv) 294,669 244,775 110,804 18,178
Digital (64Kbps or Equiv) 12,668,132 6,033,796 3,486,761 1,164,164
Total Access Lines (Switched and Special) 37,168,380 23,904,731 10,478,261 3,439,078
Telephone Calls and Billed Access Minutes (in Thousands):Local Calls 93,784,438 49,408,577 18,740,002 7,260,424IntraLATA Toll Calls Completed (Originating) 1,223,837 636,756 330,443 217,957InterLATA Toll Calls Completed: Interstate 8,704,517 6,629,986 2,823,715 905,136 (Originating) Intrastate 2,398,044 1,457,486 1,148,150 343,319
Total 11,102,561 8,087,472 3,971,865 1,248,455InterLATA Billed Access Minutes: Interstate 83,113,491 63,840,230 21,801,420 6,455,619 (Originating and Terminating) Intrastate 26,665,053 14,150,419 10,402,550 3,681,653
Total 109,778,544 77,990,649 32,203,970 10,137,272
28
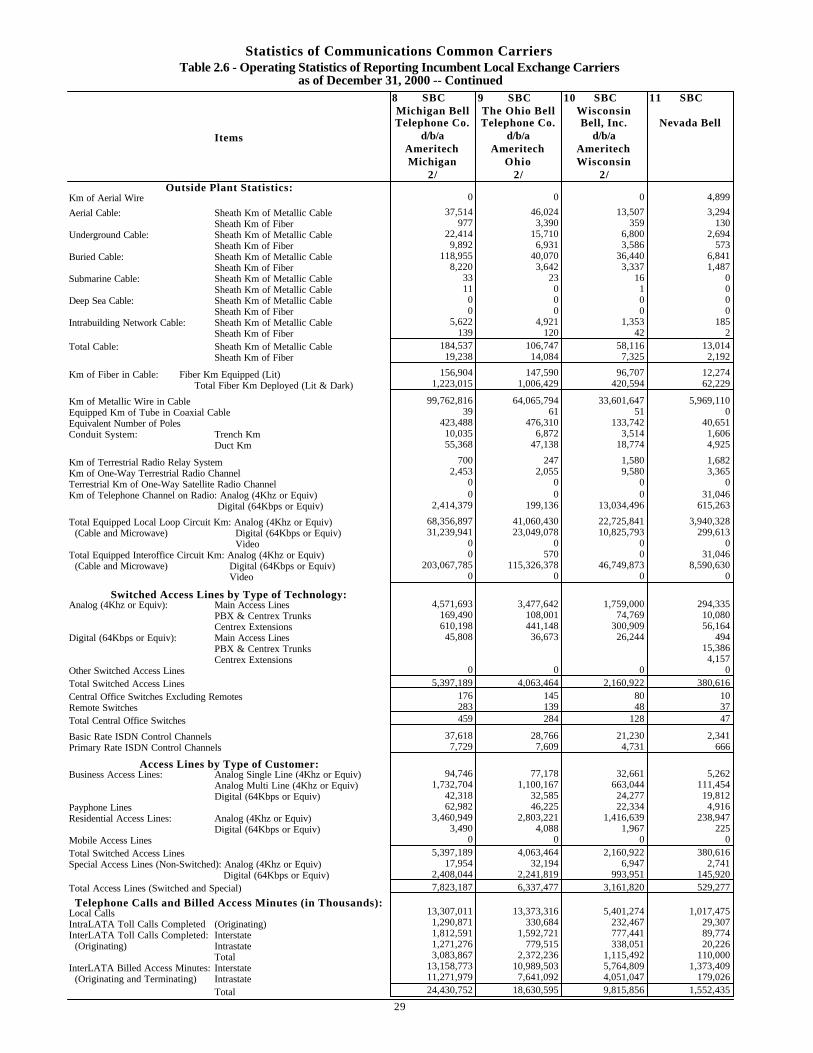
Statistics of Communications Common CarriersTable 2.6 - Operating Statistics of Reporting Incumbent Local Exchange Carriers
as of December 31, 2000 -- Continued8 SBC 9 SBC 10 SBC 11 SBCMichigan Bell The Ohio Bell WisconsinTelephone Co. Telephone Co. Bell, Inc. Nevada Bell
Items d/b/a d/b/a d/b/aAmeritech Ameritech AmeritechMichigan Ohio Wisconsin
2/ 2/ 2/Outside Plant Statistics:
Km of Aerial Wire 0 0 0 4,899
Aerial Cable: Sheath Km of Metallic Cable 37,514 46,024 13,507 3,294Sheath Km of Fiber 977 3,390 359 130
Underground Cable: Sheath Km of Metallic Cable 22,414 15,710 6,800 2,694Sheath Km of Fiber 9,892 6,931 3,586 573
Buried Cable: Sheath Km of Metallic Cable 118,955 40,070 36,440 6,841Sheath Km of Fiber 8,220 3,642 3,337 1,487
Submarine Cable: Sheath Km of Metallic Cable 33 23 16 0Sheath Km of Metallic Cable 11 0 1 0
Deep Sea Cable: Sheath Km of Metallic Cable 0 0 0 0Sheath Km of Fiber 0 0 0 0
Intrabuilding Network Cable: Sheath Km of Metallic Cable 5,622 4,921 1,353 185Sheath Km of Fiber 139 120 42 2
Total Cable: Sheath Km of Metallic Cable 184,537 106,747 58,116 13,014Sheath Km of Fiber 19,238 14,084 7,325 2,192
Km of Fiber in Cable: Fiber Km Equipped (Lit) 156,904 147,590 96,707 12,274 Total Fiber Km Deployed (Lit & Dark) 1,223,015 1,006,429 420,594 62,229
Km of Metallic Wire in Cable 99,762,816 64,065,794 33,601,647 5,969,110Equipped Km of Tube in Coaxial Cable 39 61 51 0Equivalent Number of Poles 423,488 476,310 133,742 40,651Conduit System: Trench Km 10,035 6,872 3,514 1,606
Duct Km 55,368 47,138 18,774 4,925
Km of Terrestrial Radio Relay System 700 247 1,580 1,682Km of One-Way Terrestrial Radio Channel 2,453 2,055 9,580 3,365Terrestrial Km of One-Way Satellite Radio Channel 0 0 0 0Km of Telephone Channel on Radio: Analog (4Khz or Equiv) 0 0 0 31,046 Digital (64Kbps or Equiv) 2,414,379 199,136 13,034,496 615,263
Total Equipped Local Loop Circuit Km: Analog (4Khz or Equiv) 68,356,897 41,060,430 22,725,841 3,940,328 (Cable and Microwave) Digital (64Kbps or Equiv) 31,239,941 23,049,078 10,825,793 299,613
Video 0 0 0 0Total Equipped Interoffice Circuit Km: Analog (4Khz or Equiv) 0 570 0 31,046 (Cable and Microwave) Digital (64Kbps or Equiv) 203,067,785 115,326,378 46,749,873 8,590,630
Video 0 0 0 0
Switched Access Lines by Type of Technology:Analog (4Khz or Equiv): Main Access Lines 4,571,693 3,477,642 1,759,000 294,335
PBX & Centrex Trunks 169,490 108,001 74,769 10,080Centrex Extensions 610,198 441,148 300,909 56,164
Digital (64Kbps or Equiv): Main Access Lines 45,808 36,673 26,244 494PBX & Centrex Trunks 0 0 0 15,386Centrex Extensions 0 0 0 4,157
Other Switched Access Lines 0 0 0 0
Total Switched Access Lines 5,397,189 4,063,464 2,160,922 380,616
Central Office Switches Excluding Remotes 176 145 80 10Remote Switches 283 139 48 37
Total Central Office Switches 459 284 128 47
Basic Rate ISDN Control Channels 37,618 28,766 21,230 2,341Primary Rate ISDN Control Channels 7,729 7,609 4,731 666
Access Lines by Type of Customer:Business Access Lines: Analog Single Line (4Khz or Equiv) 94,746 77,178 32,661 5,262
Analog Multi Line (4Khz or Equiv) 1,732,704 1,100,167 663,044 111,454Digital (64Kbps or Equiv) 42,318 32,585 24,277 19,812
Payphone Lines 62,982 46,225 22,334 4,916Residential Access Lines: Analog (4Khz or Equiv) 3,460,949 2,803,221 1,416,639 238,947
Digital (64Kbps or Equiv) 3,490 4,088 1,967 225Mobile Access Lines 0 0 0 0
Total Switched Access Lines 5,397,189 4,063,464 2,160,922 380,616Special Access Lines (Non-Switched): Analog (4Khz or Equiv) 17,954 32,194 6,947 2,741
Digital (64Kbps or Equiv) 2,408,044 2,241,819 993,951 145,920
Total Access Lines (Switched and Special) 7,823,187 6,337,477 3,161,820 529,277
Telephone Calls and Billed Access Minutes (in Thousands):Local Calls 13,307,011 13,373,316 5,401,274 1,017,475IntraLATA Toll Calls Completed (Originating) 1,290,871 330,684 232,467 29,307InterLATA Toll Calls Completed: Interstate 1,812,591 1,592,721 777,441 89,774 (Originating) Intrastate 1,271,276 779,515 338,051 20,226
Total 3,083,867 2,372,236 1,115,492 110,000InterLATA Billed Access Minutes: Interstate 13,158,773 10,989,503 5,764,809 1,373,409 (Originating and Terminating) Intrastate 11,271,979 7,641,092 4,051,047 179,026
Total 24,430,752 18,630,595 9,815,856 1,552,435
29
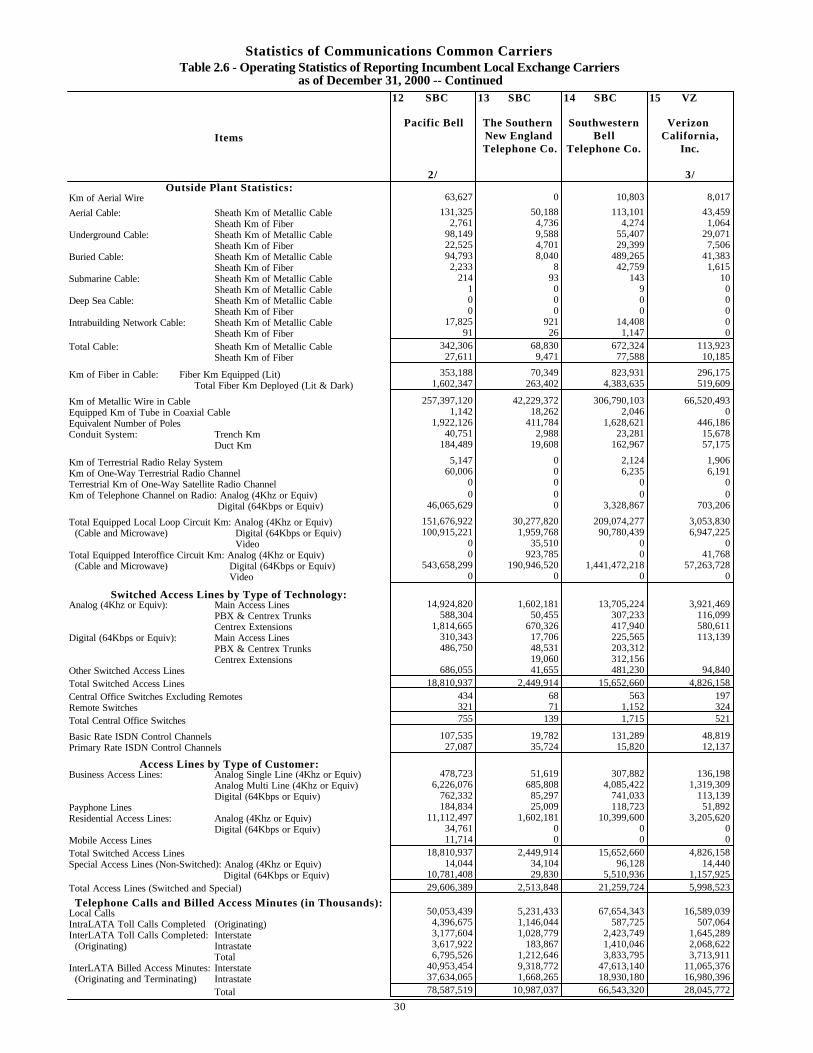
Statistics of Communications Common CarriersTable 2.6 - Operating Statistics of Reporting Incumbent Local Exchange Carriers
as of December 31, 2000 -- Continued12 SBC 13 SBC 14 SBC 15 VZ
Pacific Bell The Southern Southwestern Verizon Items New England Bell California,
Telephone Co. Telephone Co. Inc.
2/ 3/Outside Plant Statistics:
Km of Aerial Wire 63,627 0 10,803 8,017
Aerial Cable: Sheath Km of Metallic Cable 131,325 50,188 113,101 43,459Sheath Km of Fiber 2,761 4,736 4,274 1,064
Underground Cable: Sheath Km of Metallic Cable 98,149 9,588 55,407 29,071Sheath Km of Fiber 22,525 4,701 29,399 7,506
Buried Cable: Sheath Km of Metallic Cable 94,793 8,040 489,265 41,383Sheath Km of Fiber 2,233 8 42,759 1,615
Submarine Cable: Sheath Km of Metallic Cable 214 93 143 10Sheath Km of Metallic Cable 1 0 9 0
Deep Sea Cable: Sheath Km of Metallic Cable 0 0 0 0Sheath Km of Fiber 0 0 0 0
Intrabuilding Network Cable: Sheath Km of Metallic Cable 17,825 921 14,408 0Sheath Km of Fiber 91 26 1,147 0
Total Cable: Sheath Km of Metallic Cable 342,306 68,830 672,324 113,923Sheath Km of Fiber 27,611 9,471 77,588 10,185
Km of Fiber in Cable: Fiber Km Equipped (Lit) 353,188 70,349 823,931 296,175 Total Fiber Km Deployed (Lit & Dark) 1,602,347 263,402 4,383,635 519,609
Km of Metallic Wire in Cable 257,397,120 42,229,372 306,790,103 66,520,493Equipped Km of Tube in Coaxial Cable 1,142 18,262 2,046 0Equivalent Number of Poles 1,922,126 411,784 1,628,621 446,186Conduit System: Trench Km 40,751 2,988 23,281 15,678
Duct Km 184,489 19,608 162,967 57,175
Km of Terrestrial Radio Relay System 5,147 0 2,124 1,906Km of One-Way Terrestrial Radio Channel 60,006 0 6,235 6,191Terrestrial Km of One-Way Satellite Radio Channel 0 0 0 0Km of Telephone Channel on Radio: Analog (4Khz or Equiv) 0 0 0 0 Digital (64Kbps or Equiv) 46,065,629 0 3,328,867 703,206
Total Equipped Local Loop Circuit Km: Analog (4Khz or Equiv) 151,676,922 30,277,820 209,074,277 3,053,830 (Cable and Microwave) Digital (64Kbps or Equiv) 100,915,221 1,959,768 90,780,439 6,947,225
Video 0 35,510 0 0Total Equipped Interoffice Circuit Km: Analog (4Khz or Equiv) 0 923,785 0 41,768 (Cable and Microwave) Digital (64Kbps or Equiv) 543,658,299 190,946,520 1,441,472,218 57,263,728
Video 0 0 0 0
Switched Access Lines by Type of Technology:Analog (4Khz or Equiv): Main Access Lines 14,924,820 1,602,181 13,705,224 3,921,469
PBX & Centrex Trunks 588,304 50,455 307,233 116,099Centrex Extensions 1,814,665 670,326 417,940 580,611
Digital (64Kbps or Equiv): Main Access Lines 310,343 17,706 225,565 113,139PBX & Centrex Trunks 486,750 48,531 203,312 0Centrex Extensions 0 19,060 312,156 0
Other Switched Access Lines 686,055 41,655 481,230 94,840
Total Switched Access Lines 18,810,937 2,449,914 15,652,660 4,826,158
Central Office Switches Excluding Remotes 434 68 563 197Remote Switches 321 71 1,152 324
Total Central Office Switches 755 139 1,715 521
Basic Rate ISDN Control Channels 107,535 19,782 131,289 48,819Primary Rate ISDN Control Channels 27,087 35,724 15,820 12,137
Access Lines by Type of Customer:Business Access Lines: Analog Single Line (4Khz or Equiv) 478,723 51,619 307,882 136,198
Analog Multi Line (4Khz or Equiv) 6,226,076 685,808 4,085,422 1,319,309Digital (64Kbps or Equiv) 762,332 85,297 741,033 113,139
Payphone Lines 184,834 25,009 118,723 51,892Residential Access Lines: Analog (4Khz or Equiv) 11,112,497 1,602,181 10,399,600 3,205,620
Digital (64Kbps or Equiv) 34,761 0 0 0Mobile Access Lines 11,714 0 0 0
Total Switched Access Lines 18,810,937 2,449,914 15,652,660 4,826,158Special Access Lines (Non-Switched): Analog (4Khz or Equiv) 14,044 34,104 96,128 14,440
Digital (64Kbps or Equiv) 10,781,408 29,830 5,510,936 1,157,925
Total Access Lines (Switched and Special) 29,606,389 2,513,848 21,259,724 5,998,523
Telephone Calls and Billed Access Minutes (in Thousands):Local Calls 50,053,439 5,231,433 67,654,343 16,589,039IntraLATA Toll Calls Completed (Originating) 4,396,675 1,146,044 587,725 507,064InterLATA Toll Calls Completed: Interstate 3,177,604 1,028,779 2,423,749 1,645,289 (Originating) Intrastate 3,617,922 183,867 1,410,046 2,068,622
Total 6,795,526 1,212,646 3,833,795 3,713,911InterLATA Billed Access Minutes: Interstate 40,953,454 9,318,772 47,613,140 11,065,376 (Originating and Terminating) Intrastate 37,634,065 1,668,265 18,930,180 16,980,396
Total 78,587,519 10,987,037 66,543,320 28,045,772
30
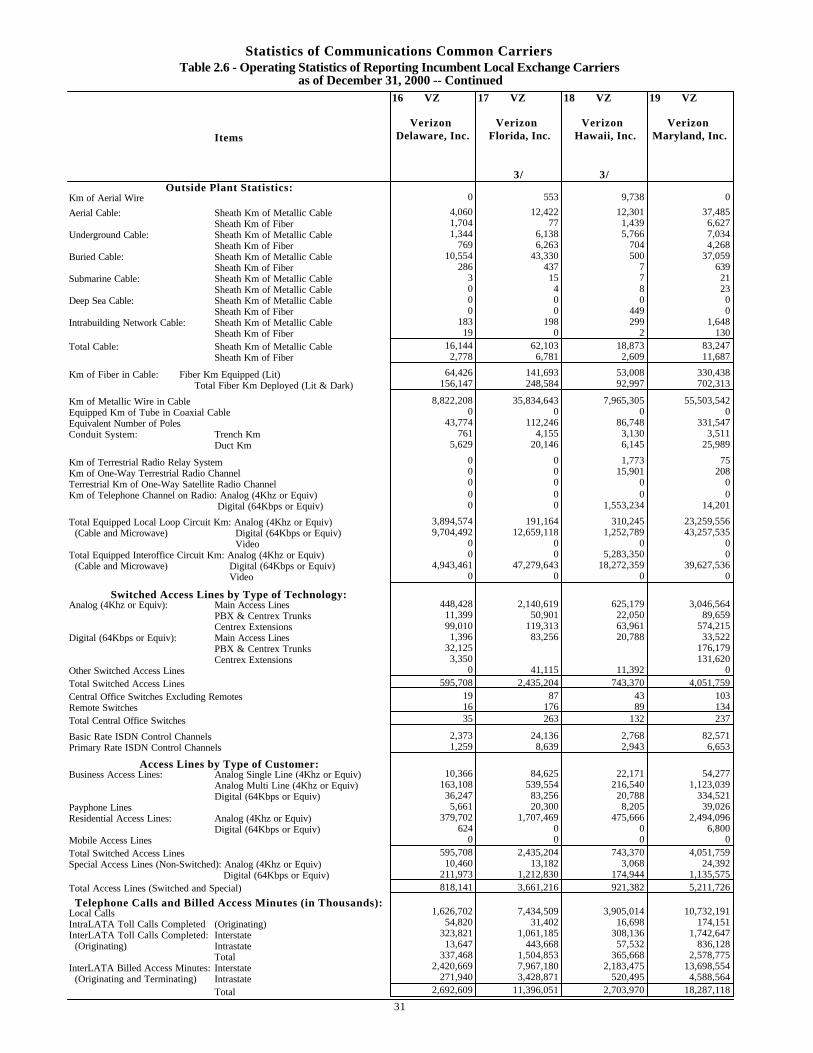
Statistics of Communications Common CarriersTable 2.6 - Operating Statistics of Reporting Incumbent Local Exchange Carriers
as of December 31, 2000 -- Continued16 VZ 17 VZ 18 VZ 19 VZ
Verizon Verizon Verizon Verizon Items Delaware, Inc. Florida, Inc. Hawaii, Inc. Maryland, Inc.
3/ 3/Outside Plant Statistics:
Km of Aerial Wire 0 553 9,738 0
Aerial Cable: Sheath Km of Metallic Cable 4,060 12,422 12,301 37,485Sheath Km of Fiber 1,704 77 1,439 6,627
Underground Cable: Sheath Km of Metallic Cable 1,344 6,138 5,766 7,034Sheath Km of Fiber 769 6,263 704 4,268
Buried Cable: Sheath Km of Metallic Cable 10,554 43,330 500 37,059Sheath Km of Fiber 286 437 7 639
Submarine Cable: Sheath Km of Metallic Cable 3 15 7 21Sheath Km of Metallic Cable 0 4 8 23
Deep Sea Cable: Sheath Km of Metallic Cable 0 0 0 0Sheath Km of Fiber 0 0 449 0
Intrabuilding Network Cable: Sheath Km of Metallic Cable 183 198 299 1,648Sheath Km of Fiber 19 0 2 130
Total Cable: Sheath Km of Metallic Cable 16,144 62,103 18,873 83,247Sheath Km of Fiber 2,778 6,781 2,609 11,687
Km of Fiber in Cable: Fiber Km Equipped (Lit) 64,426 141,693 53,008 330,438 Total Fiber Km Deployed (Lit & Dark) 156,147 248,584 92,997 702,313
Km of Metallic Wire in Cable 8,822,208 35,834,643 7,965,305 55,503,542Equipped Km of Tube in Coaxial Cable 0 0 0 0Equivalent Number of Poles 43,774 112,246 86,748 331,547Conduit System: Trench Km 761 4,155 3,130 3,511
Duct Km 5,629 20,146 6,145 25,989
Km of Terrestrial Radio Relay System 0 0 1,773 75Km of One-Way Terrestrial Radio Channel 0 0 15,901 208Terrestrial Km of One-Way Satellite Radio Channel 0 0 0 0Km of Telephone Channel on Radio: Analog (4Khz or Equiv) 0 0 0 0 Digital (64Kbps or Equiv) 0 0 1,553,234 14,201
Total Equipped Local Loop Circuit Km: Analog (4Khz or Equiv) 3,894,574 191,164 310,245 23,259,556 (Cable and Microwave) Digital (64Kbps or Equiv) 9,704,492 12,659,118 1,252,789 43,257,535
Video 0 0 0 0Total Equipped Interoffice Circuit Km: Analog (4Khz or Equiv) 0 0 5,283,350 0 (Cable and Microwave) Digital (64Kbps or Equiv) 4,943,461 47,279,643 18,272,359 39,627,536
Video 0 0 0 0
Switched Access Lines by Type of Technology:Analog (4Khz or Equiv): Main Access Lines 448,428 2,140,619 625,179 3,046,564
PBX & Centrex Trunks 11,399 50,901 22,050 89,659Centrex Extensions 99,010 119,313 63,961 574,215
Digital (64Kbps or Equiv): Main Access Lines 1,396 83,256 20,788 33,522PBX & Centrex Trunks 32,125 0 0 176,179Centrex Extensions 3,350 0 0 131,620
Other Switched Access Lines 0 41,115 11,392 0
Total Switched Access Lines 595,708 2,435,204 743,370 4,051,759
Central Office Switches Excluding Remotes 19 87 43 103Remote Switches 16 176 89 134
Total Central Office Switches 35 263 132 237
Basic Rate ISDN Control Channels 2,373 24,136 2,768 82,571Primary Rate ISDN Control Channels 1,259 8,639 2,943 6,653
Access Lines by Type of Customer:Business Access Lines: Analog Single Line (4Khz or Equiv) 10,366 84,625 22,171 54,277
Analog Multi Line (4Khz or Equiv) 163,108 539,554 216,540 1,123,039Digital (64Kbps or Equiv) 36,247 83,256 20,788 334,521
Payphone Lines 5,661 20,300 8,205 39,026Residential Access Lines: Analog (4Khz or Equiv) 379,702 1,707,469 475,666 2,494,096
Digital (64Kbps or Equiv) 624 0 0 6,800Mobile Access Lines 0 0 0 0
Total Switched Access Lines 595,708 2,435,204 743,370 4,051,759Special Access Lines (Non-Switched): Analog (4Khz or Equiv) 10,460 13,182 3,068 24,392
Digital (64Kbps or Equiv) 211,973 1,212,830 174,944 1,135,575
Total Access Lines (Switched and Special) 818,141 3,661,216 921,382 5,211,726
Telephone Calls and Billed Access Minutes (in Thousands):Local Calls 1,626,702 7,434,509 3,905,014 10,732,191IntraLATA Toll Calls Completed (Originating) 54,820 31,402 16,698 174,151InterLATA Toll Calls Completed: Interstate 323,821 1,061,185 308,136 1,742,647 (Originating) Intrastate 13,647 443,668 57,532 836,128
Total 337,468 1,504,853 365,668 2,578,775InterLATA Billed Access Minutes: Interstate 2,420,669 7,967,180 2,183,475 13,698,554 (Originating and Terminating) Intrastate 271,940 3,428,871 520,495 4,588,564
Total 2,692,609 11,396,051 2,703,970 18,287,118
31
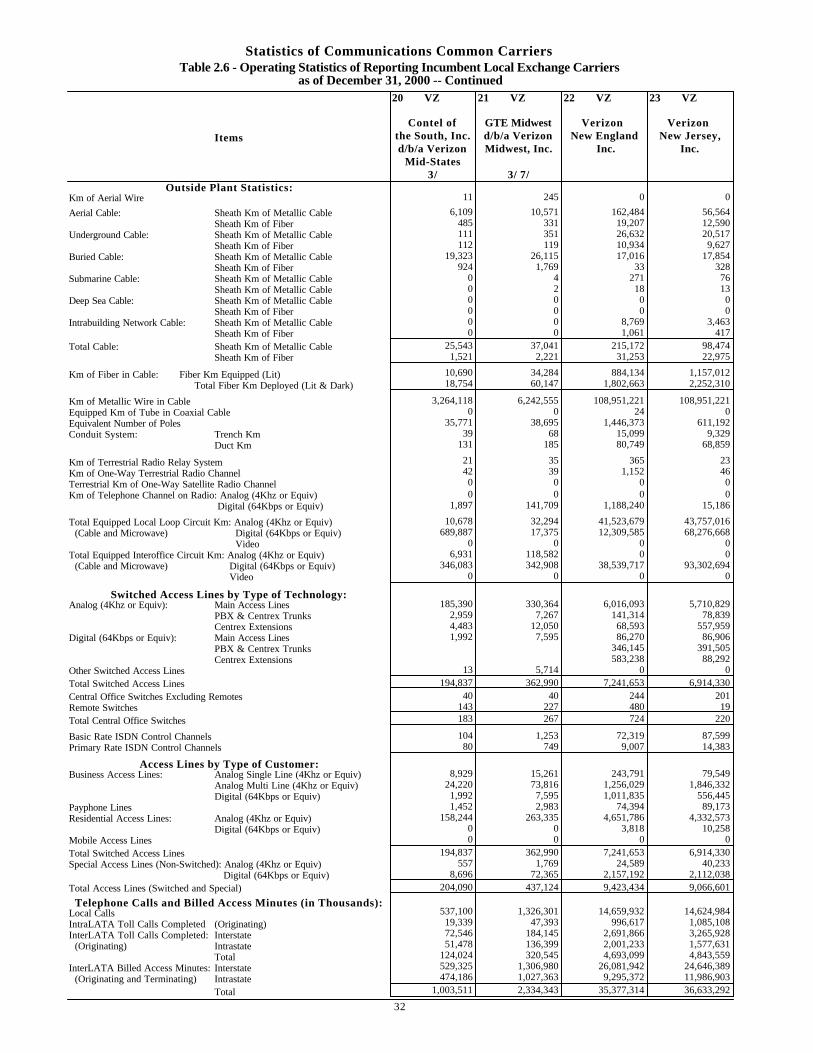
Statistics of Communications Common CarriersTable 2.6 - Operating Statistics of Reporting Incumbent Local Exchange Carriers
as of December 31, 2000 -- Continued20 VZ 21 VZ 22 VZ 23 VZ
Contel of GTE Midwest Verizon Verizon Items the South, Inc. d/b/a Verizon New England New Jersey,
d/b/a Verizon Midwest, Inc. Inc. Inc.Mid-States
3/ 3/ 7/Outside Plant Statistics:
Km of Aerial Wire 11 245 0 0
Aerial Cable: Sheath Km of Metallic Cable 6,109 10,571 162,484 56,564Sheath Km of Fiber 485 331 19,207 12,590
Underground Cable: Sheath Km of Metallic Cable 111 351 26,632 20,517Sheath Km of Fiber 112 119 10,934 9,627
Buried Cable: Sheath Km of Metallic Cable 19,323 26,115 17,016 17,854Sheath Km of Fiber 924 1,769 33 328
Submarine Cable: Sheath Km of Metallic Cable 0 4 271 76Sheath Km of Metallic Cable 0 2 18 13
Deep Sea Cable: Sheath Km of Metallic Cable 0 0 0 0Sheath Km of Fiber 0 0 0 0
Intrabuilding Network Cable: Sheath Km of Metallic Cable 0 0 8,769 3,463Sheath Km of Fiber 0 0 1,061 417
Total Cable: Sheath Km of Metallic Cable 25,543 37,041 215,172 98,474Sheath Km of Fiber 1,521 2,221 31,253 22,975
Km of Fiber in Cable: Fiber Km Equipped (Lit) 10,690 34,284 884,134 1,157,012 Total Fiber Km Deployed (Lit & Dark) 18,754 60,147 1,802,663 2,252,310
Km of Metallic Wire in Cable 3,264,118 6,242,555 108,951,221 108,951,221Equipped Km of Tube in Coaxial Cable 0 0 24 0Equivalent Number of Poles 35,771 38,695 1,446,373 611,192Conduit System: Trench Km 39 68 15,099 9,329
Duct Km 131 185 80,749 68,859
Km of Terrestrial Radio Relay System 21 35 365 23Km of One-Way Terrestrial Radio Channel 42 39 1,152 46Terrestrial Km of One-Way Satellite Radio Channel 0 0 0 0Km of Telephone Channel on Radio: Analog (4Khz or Equiv) 0 0 0 0 Digital (64Kbps or Equiv) 1,897 141,709 1,188,240 15,186
Total Equipped Local Loop Circuit Km: Analog (4Khz or Equiv) 10,678 32,294 41,523,679 43,757,016 (Cable and Microwave) Digital (64Kbps or Equiv) 689,887 17,375 12,309,585 68,276,668
Video 0 0 0 0Total Equipped Interoffice Circuit Km: Analog (4Khz or Equiv) 6,931 118,582 0 0 (Cable and Microwave) Digital (64Kbps or Equiv) 346,083 342,908 38,539,717 93,302,694
Video 0 0 0 0
Switched Access Lines by Type of Technology:Analog (4Khz or Equiv): Main Access Lines 185,390 330,364 6,016,093 5,710,829
PBX & Centrex Trunks 2,959 7,267 141,314 78,839Centrex Extensions 4,483 12,050 68,593 557,959
Digital (64Kbps or Equiv): Main Access Lines 1,992 7,595 86,270 86,906PBX & Centrex Trunks 0 0 346,145 391,505Centrex Extensions 0 0 583,238 88,292
Other Switched Access Lines 13 5,714 0 0
Total Switched Access Lines 194,837 362,990 7,241,653 6,914,330
Central Office Switches Excluding Remotes 40 40 244 201Remote Switches 143 227 480 19
Total Central Office Switches 183 267 724 220
Basic Rate ISDN Control Channels 104 1,253 72,319 87,599Primary Rate ISDN Control Channels 80 749 9,007 14,383
Access Lines by Type of Customer:Business Access Lines: Analog Single Line (4Khz or Equiv) 8,929 15,261 243,791 79,549
Analog Multi Line (4Khz or Equiv) 24,220 73,816 1,256,029 1,846,332Digital (64Kbps or Equiv) 1,992 7,595 1,011,835 556,445
Payphone Lines 1,452 2,983 74,394 89,173Residential Access Lines: Analog (4Khz or Equiv) 158,244 263,335 4,651,786 4,332,573
Digital (64Kbps or Equiv) 0 0 3,818 10,258Mobile Access Lines 0 0 0 0
Total Switched Access Lines 194,837 362,990 7,241,653 6,914,330Special Access Lines (Non-Switched): Analog (4Khz or Equiv) 557 1,769 24,589 40,233
Digital (64Kbps or Equiv) 8,696 72,365 2,157,192 2,112,038
Total Access Lines (Switched and Special) 204,090 437,124 9,423,434 9,066,601
Telephone Calls and Billed Access Minutes (in Thousands):Local Calls 537,100 1,326,301 14,659,932 14,624,984IntraLATA Toll Calls Completed (Originating) 19,339 47,393 996,617 1,085,108InterLATA Toll Calls Completed: Interstate 72,546 184,145 2,691,866 3,265,928 (Originating) Intrastate 51,478 136,399 2,001,233 1,577,631
Total 124,024 320,545 4,693,099 4,843,559InterLATA Billed Access Minutes: Interstate 529,325 1,306,980 26,081,942 24,646,389 (Originating and Terminating) Intrastate 474,186 1,027,363 9,295,372 11,986,903
Total 1,003,511 2,334,343 35,377,314 36,633,292
32
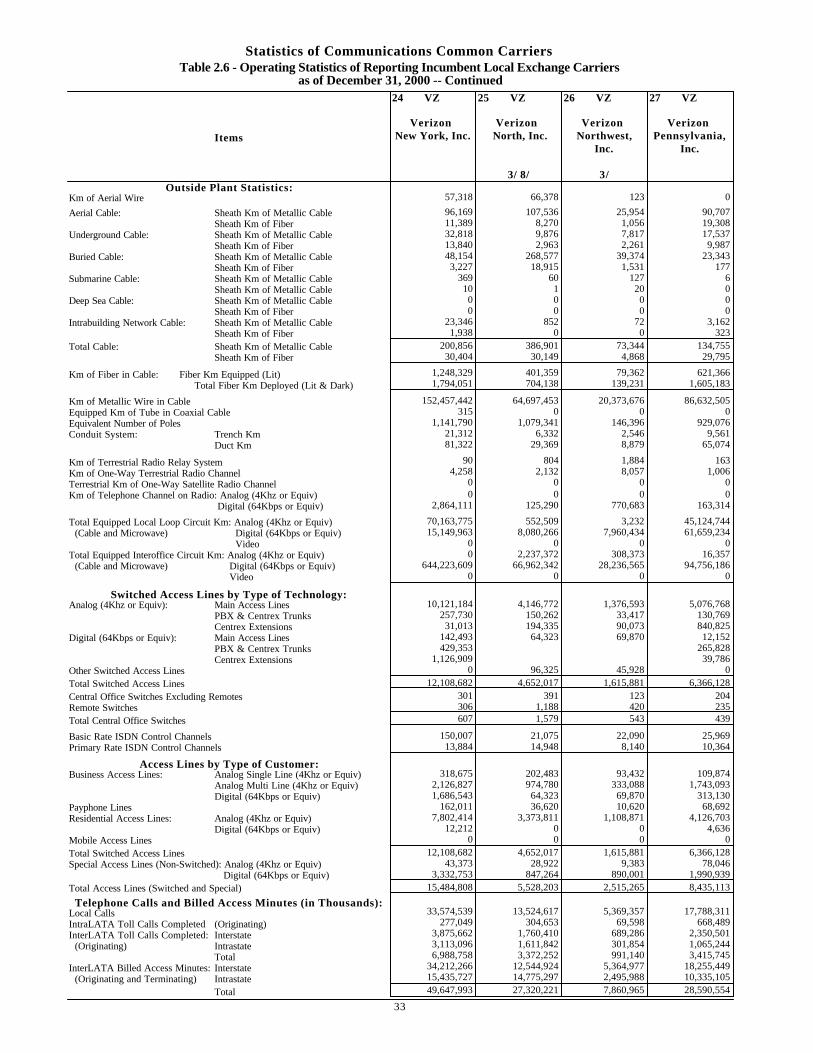
Statistics of Communications Common CarriersTable 2.6 - Operating Statistics of Reporting Incumbent Local Exchange Carriers
as of December 31, 2000 -- Continued24 VZ 25 VZ 26 VZ 27 VZ
Verizon Verizon Verizon Verizon Items New York, Inc. North, Inc. Northwest, Pennsylvania,
Inc. Inc.
3/ 8/ 3/Outside Plant Statistics:
Km of Aerial Wire 57,318 66,378 123 0
Aerial Cable: Sheath Km of Metallic Cable 96,169 107,536 25,954 90,707Sheath Km of Fiber 11,389 8,270 1,056 19,308
Underground Cable: Sheath Km of Metallic Cable 32,818 9,876 7,817 17,537Sheath Km of Fiber 13,840 2,963 2,261 9,987
Buried Cable: Sheath Km of Metallic Cable 48,154 268,577 39,374 23,343Sheath Km of Fiber 3,227 18,915 1,531 177
Submarine Cable: Sheath Km of Metallic Cable 369 60 127 6Sheath Km of Metallic Cable 10 1 20 0
Deep Sea Cable: Sheath Km of Metallic Cable 0 0 0 0Sheath Km of Fiber 0 0 0 0
Intrabuilding Network Cable: Sheath Km of Metallic Cable 23,346 852 72 3,162Sheath Km of Fiber 1,938 0 0 323
Total Cable: Sheath Km of Metallic Cable 200,856 386,901 73,344 134,755Sheath Km of Fiber 30,404 30,149 4,868 29,795
Km of Fiber in Cable: Fiber Km Equipped (Lit) 1,248,329 401,359 79,362 621,366 Total Fiber Km Deployed (Lit & Dark) 1,794,051 704,138 139,231 1,605,183
Km of Metallic Wire in Cable 152,457,442 64,697,453 20,373,676 86,632,505Equipped Km of Tube in Coaxial Cable 315 0 0 0Equivalent Number of Poles 1,141,790 1,079,341 146,396 929,076Conduit System: Trench Km 21,312 6,332 2,546 9,561
Duct Km 81,322 29,369 8,879 65,074
Km of Terrestrial Radio Relay System 90 804 1,884 163Km of One-Way Terrestrial Radio Channel 4,258 2,132 8,057 1,006Terrestrial Km of One-Way Satellite Radio Channel 0 0 0 0Km of Telephone Channel on Radio: Analog (4Khz or Equiv) 0 0 0 0 Digital (64Kbps or Equiv) 2,864,111 125,290 770,683 163,314
Total Equipped Local Loop Circuit Km: Analog (4Khz or Equiv) 70,163,775 552,509 3,232 45,124,744 (Cable and Microwave) Digital (64Kbps or Equiv) 15,149,963 8,080,266 7,960,434 61,659,234
Video 0 0 0 0Total Equipped Interoffice Circuit Km: Analog (4Khz or Equiv) 0 2,237,372 308,373 16,357 (Cable and Microwave) Digital (64Kbps or Equiv) 644,223,609 66,962,342 28,236,565 94,756,186
Video 0 0 0 0
Switched Access Lines by Type of Technology:Analog (4Khz or Equiv): Main Access Lines 10,121,184 4,146,772 1,376,593 5,076,768
PBX & Centrex Trunks 257,730 150,262 33,417 130,769Centrex Extensions 31,013 194,335 90,073 840,825
Digital (64Kbps or Equiv): Main Access Lines 142,493 64,323 69,870 12,152PBX & Centrex Trunks 429,353 0 0 265,828Centrex Extensions 1,126,909 0 0 39,786
Other Switched Access Lines 0 96,325 45,928 0
Total Switched Access Lines 12,108,682 4,652,017 1,615,881 6,366,128
Central Office Switches Excluding Remotes 301 391 123 204Remote Switches 306 1,188 420 235
Total Central Office Switches 607 1,579 543 439
Basic Rate ISDN Control Channels 150,007 21,075 22,090 25,969Primary Rate ISDN Control Channels 13,884 14,948 8,140 10,364
Access Lines by Type of Customer:Business Access Lines: Analog Single Line (4Khz or Equiv) 318,675 202,483 93,432 109,874
Analog Multi Line (4Khz or Equiv) 2,126,827 974,780 333,088 1,743,093Digital (64Kbps or Equiv) 1,686,543 64,323 69,870 313,130
Payphone Lines 162,011 36,620 10,620 68,692Residential Access Lines: Analog (4Khz or Equiv) 7,802,414 3,373,811 1,108,871 4,126,703
Digital (64Kbps or Equiv) 12,212 0 0 4,636Mobile Access Lines 0 0 0 0
Total Switched Access Lines 12,108,682 4,652,017 1,615,881 6,366,128Special Access Lines (Non-Switched): Analog (4Khz or Equiv) 43,373 28,922 9,383 78,046
Digital (64Kbps or Equiv) 3,332,753 847,264 890,001 1,990,939
Total Access Lines (Switched and Special) 15,484,808 5,528,203 2,515,265 8,435,113
Telephone Calls and Billed Access Minutes (in Thousands):Local Calls 33,574,539 13,524,617 5,369,357 17,788,311IntraLATA Toll Calls Completed (Originating) 277,049 304,653 69,598 668,489InterLATA Toll Calls Completed: Interstate 3,875,662 1,760,410 689,286 2,350,501 (Originating) Intrastate 3,113,096 1,611,842 301,854 1,065,244
Total 6,988,758 3,372,252 991,140 3,415,745InterLATA Billed Access Minutes: Interstate 34,212,266 12,544,924 5,364,977 18,255,449 (Originating and Terminating) Intrastate 15,435,727 14,775,297 2,495,988 10,335,105
Total 49,647,993 27,320,221 7,860,965 28,590,554
33
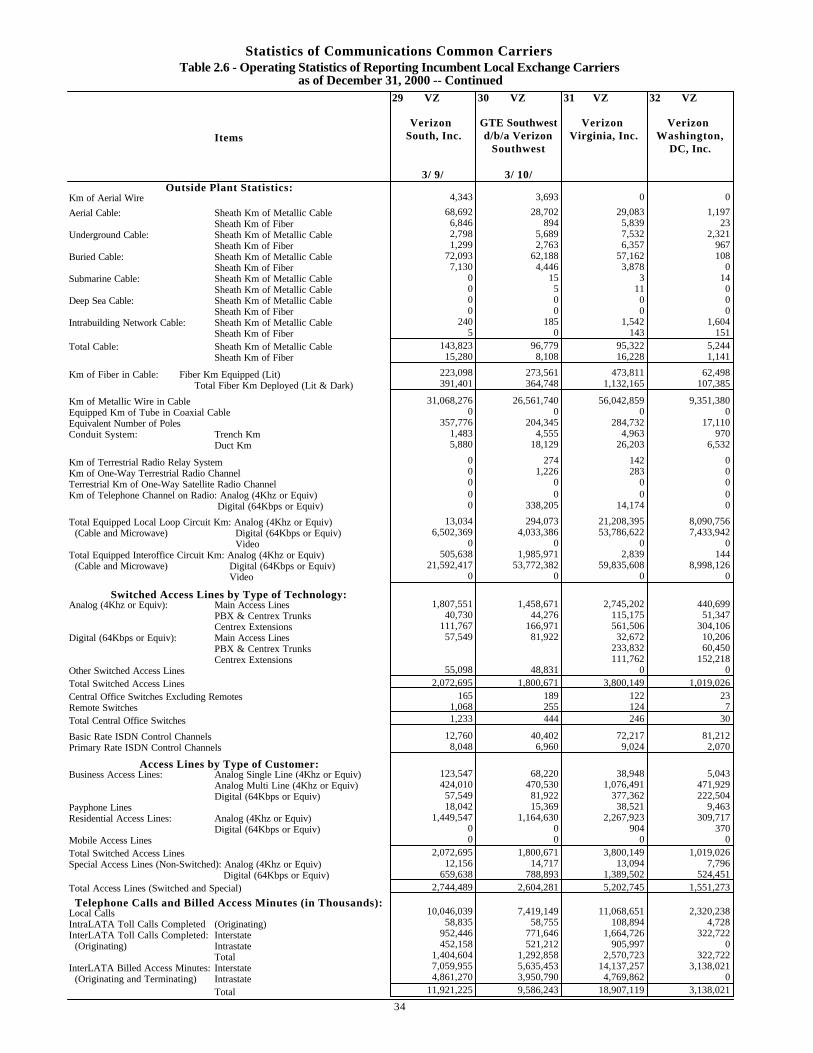
Statistics of Communications Common CarriersTable 2.6 - Operating Statistics of Reporting Incumbent Local Exchange Carriers
as of December 31, 2000 -- Continued29 VZ 30 VZ 31 VZ 32 VZ
Verizon GTE Southwest Verizon Verizon Items South, Inc. d/b/a Verizon Virginia, Inc. Washington,
Southwest DC, Inc.
3/ 9/ 3/ 10/Outside Plant Statistics:
Km of Aerial Wire 4,343 3,693 0 0
Aerial Cable: Sheath Km of Metallic Cable 68,692 28,702 29,083 1,197Sheath Km of Fiber 6,846 894 5,839 23
Underground Cable: Sheath Km of Metallic Cable 2,798 5,689 7,532 2,321Sheath Km of Fiber 1,299 2,763 6,357 967
Buried Cable: Sheath Km of Metallic Cable 72,093 62,188 57,162 108Sheath Km of Fiber 7,130 4,446 3,878 0
Submarine Cable: Sheath Km of Metallic Cable 0 15 3 14Sheath Km of Metallic Cable 0 5 11 0
Deep Sea Cable: Sheath Km of Metallic Cable 0 0 0 0Sheath Km of Fiber 0 0 0 0
Intrabuilding Network Cable: Sheath Km of Metallic Cable 240 185 1,542 1,604Sheath Km of Fiber 5 0 143 151
Total Cable: Sheath Km of Metallic Cable 143,823 96,779 95,322 5,244Sheath Km of Fiber 15,280 8,108 16,228 1,141
Km of Fiber in Cable: Fiber Km Equipped (Lit) 223,098 273,561 473,811 62,498 Total Fiber Km Deployed (Lit & Dark) 391,401 364,748 1,132,165 107,385
Km of Metallic Wire in Cable 31,068,276 26,561,740 56,042,859 9,351,380Equipped Km of Tube in Coaxial Cable 0 0 0 0Equivalent Number of Poles 357,776 204,345 284,732 17,110Conduit System: Trench Km 1,483 4,555 4,963 970
Duct Km 5,880 18,129 26,203 6,532
Km of Terrestrial Radio Relay System 0 274 142 0Km of One-Way Terrestrial Radio Channel 0 1,226 283 0Terrestrial Km of One-Way Satellite Radio Channel 0 0 0 0Km of Telephone Channel on Radio: Analog (4Khz or Equiv) 0 0 0 0 Digital (64Kbps or Equiv) 0 338,205 14,174 0
Total Equipped Local Loop Circuit Km: Analog (4Khz or Equiv) 13,034 294,073 21,208,395 8,090,756 (Cable and Microwave) Digital (64Kbps or Equiv) 6,502,369 4,033,386 53,786,622 7,433,942
Video 0 0 0 0Total Equipped Interoffice Circuit Km: Analog (4Khz or Equiv) 505,638 1,985,971 2,839 144 (Cable and Microwave) Digital (64Kbps or Equiv) 21,592,417 53,772,382 59,835,608 8,998,126
Video 0 0 0 0
Switched Access Lines by Type of Technology:Analog (4Khz or Equiv): Main Access Lines 1,807,551 1,458,671 2,745,202 440,699
PBX & Centrex Trunks 40,730 44,276 115,175 51,347Centrex Extensions 111,767 166,971 561,506 304,106
Digital (64Kbps or Equiv): Main Access Lines 57,549 81,922 32,672 10,206PBX & Centrex Trunks 0 0 233,832 60,450Centrex Extensions 0 0 111,762 152,218
Other Switched Access Lines 55,098 48,831 0 0
Total Switched Access Lines 2,072,695 1,800,671 3,800,149 1,019,026
Central Office Switches Excluding Remotes 165 189 122 23Remote Switches 1,068 255 124 7
Total Central Office Switches 1,233 444 246 30
Basic Rate ISDN Control Channels 12,760 40,402 72,217 81,212Primary Rate ISDN Control Channels 8,048 6,960 9,024 2,070
Access Lines by Type of Customer:Business Access Lines: Analog Single Line (4Khz or Equiv) 123,547 68,220 38,948 5,043
Analog Multi Line (4Khz or Equiv) 424,010 470,530 1,076,491 471,929Digital (64Kbps or Equiv) 57,549 81,922 377,362 222,504
Payphone Lines 18,042 15,369 38,521 9,463Residential Access Lines: Analog (4Khz or Equiv) 1,449,547 1,164,630 2,267,923 309,717
Digital (64Kbps or Equiv) 0 0 904 370Mobile Access Lines 0 0 0 0
Total Switched Access Lines 2,072,695 1,800,671 3,800,149 1,019,026Special Access Lines (Non-Switched): Analog (4Khz or Equiv) 12,156 14,717 13,094 7,796
Digital (64Kbps or Equiv) 659,638 788,893 1,389,502 524,451
Total Access Lines (Switched and Special) 2,744,489 2,604,281 5,202,745 1,551,273
Telephone Calls and Billed Access Minutes (in Thousands):Local Calls 10,046,039 7,419,149 11,068,651 2,320,238IntraLATA Toll Calls Completed (Originating) 58,835 58,755 108,894 4,728InterLATA Toll Calls Completed: Interstate 952,446 771,646 1,664,726 322,722 (Originating) Intrastate 452,158 521,212 905,997 0
Total 1,404,604 1,292,858 2,570,723 322,722InterLATA Billed Access Minutes: Interstate 7,059,955 5,635,453 14,137,257 3,138,021 (Originating and Terminating) Intrastate 4,861,270 3,950,790 4,769,862 0
Total 11,921,225 9,586,243 18,907,119 3,138,021
34

Statistics of Communications Common CarriersTable 2.6 - Operating Statistics of Reporting Incumbent Local Exchange Carriers
as of December 31, 2000 -- Continued33 VZ 34 VZ 35 AL 36 AL
Verizon Puerto Rico Aliant ALLTELItems West Virginia, Telephone Communi- Carolina
Inc. Company cations Inc.Company
3/ 4/ 4/Outside Plant Statistics:
Km of Aerial Wire 0 21,317 0 0
Aerial Cable: Sheath Km of Metallic Cable 28,866 22,065 2,155 4,494Sheath Km of Fiber 5,486 1,394 215 196
Underground Cable: Sheath Km of Metallic Cable 1,147 4,502 564 153Sheath Km of Fiber 710 1,976 395 49
Buried Cable: Sheath Km of Metallic Cable 15,200 7,200 15,385 11,232Sheath Km of Fiber 19 1,175 1,942 338
Submarine Cable: Sheath Km of Metallic Cable 6 0 0 0Sheath Km of Metallic Cable 0 0 0 0
Deep Sea Cable: Sheath Km of Metallic Cable 0 0 0 0Sheath Km of Fiber 0 0 0 0
Intrabuilding Network Cable: Sheath Km of Metallic Cable 655 0 0 0Sheath Km of Fiber 13 0 0 0
Total Cable: Sheath Km of Metallic Cable 45,874 33,767 18,104 15,879Sheath Km of Fiber 6,228 4,545 2,552 583
Km of Fiber in Cable: Fiber Km Equipped (Lit) 91,618 131,424 16,437 11,381 Total Fiber Km Deployed (Lit & Dark) 316,361 131,424 63,983 28,581
Km of Metallic Wire in Cable 14,771,066 22,218,823 3,727,737 2,740,821Equipped Km of Tube in Coaxial Cable 0 0 0 0Equivalent Number of Poles 337,759 294,920 30,554 29,060Conduit System: Trench Km 669 5,298 492 51
Duct Km 3,949 16,529 1,574 268
Km of Terrestrial Radio Relay System 0 4,169 0 0Km of One-Way Terrestrial Radio Channel 0 11,636 0 0Terrestrial Km of One-Way Satellite Radio Channel 0 0 0 0Km of Telephone Channel on Radio: Analog (4Khz or Equiv) 0 0 0 0 Digital (64Kbps or Equiv) 0 6,678,243 0 0
Total Equipped Local Loop Circuit Km: Analog (4Khz or Equiv) 5,754,227 0 0 1,408,066 (Cable and Microwave) Digital (64Kbps or Equiv) 12,619,952 347,000 301,134 4,665
Video 0 0 84 0Total Equipped Interoffice Circuit Km: Analog (4Khz or Equiv) 0 0 0 0 (Cable and Microwave) Digital (64Kbps or Equiv) 22,418,825 45,130,392 52,416,785 538,523
Video 0 0 2,462 0
Switched Access Lines by Type of Technology:Analog (4Khz or Equiv): Main Access Lines 717,912 1,145,266 258,296 217,134
PBX & Centrex Trunks 15,025 143,134 3,997 2,298Centrex Extensions 98,101 1,213 35,695 11,529
Digital (64Kbps or Equiv): Main Access Lines 3,986 9,678 0 75PBX & Centrex Trunks 51,616 17,440 0 0Centrex Extensions 11,328 0 0 0
Other Switched Access Lines 0 0 0 0
Total Switched Access Lines 897,968 1,316,731 297,988 231,036
Central Office Switches Excluding Remotes 31 31 5 14Remote Switches 114 302 153 17
Total Central Office Switches 145 333 158 31
Basic Rate ISDN Control Channels 7,657 1,844 166 733Primary Rate ISDN Control Channels 2,240 248 250 138
Access Lines by Type of Customer:Business Access Lines: Analog Single Line (4Khz or Equiv) 18,079 171,506 7,534 26,956
Analog Multi Line (4Khz or Equiv) 172,760 115,675 93,059 25,149Digital (64Kbps or Equiv) 66,748 27,118 0 75
Payphone Lines 9,550 28,672 3,342 552Residential Access Lines: Analog (4Khz or Equiv) 630,649 973,760 194,053 178,304
Digital (64Kbps or Equiv) 182 0 0 0Mobile Access Lines 0 0 0 0
Total Switched Access Lines 897,968 1,316,731 297,988 231,036Special Access Lines (Non-Switched): Analog (4Khz or Equiv) 2,676 2,097 439 210
Digital (64Kbps or Equiv) 168,570 80,538 39,808 51,120
Total Access Lines (Switched and Special) 1,069,214 1,399,366 338,235 282,366
Telephone Calls and Billed Access Minutes (in Thousands):Local Calls 2,768,902 5,774,438 520,262 491,341IntraLATA Toll Calls Completed (Originating) 37,381 629,790 28,573 41,587InterLATA Toll Calls Completed: Interstate 352,183 569,658 126,833 129,621 (Originating) Intrastate 108,546 0 50,116 48,433
Total 460,729 569,658 176,948 178,054InterLATA Billed Access Minutes: Interstate 2,938,754 2,562,830 868,864 713,363 (Originating and Terminating) Intrastate 847,720 0 292,270 258,381
Total 3,786,474 2,562,830 1,161,134 971,744
35
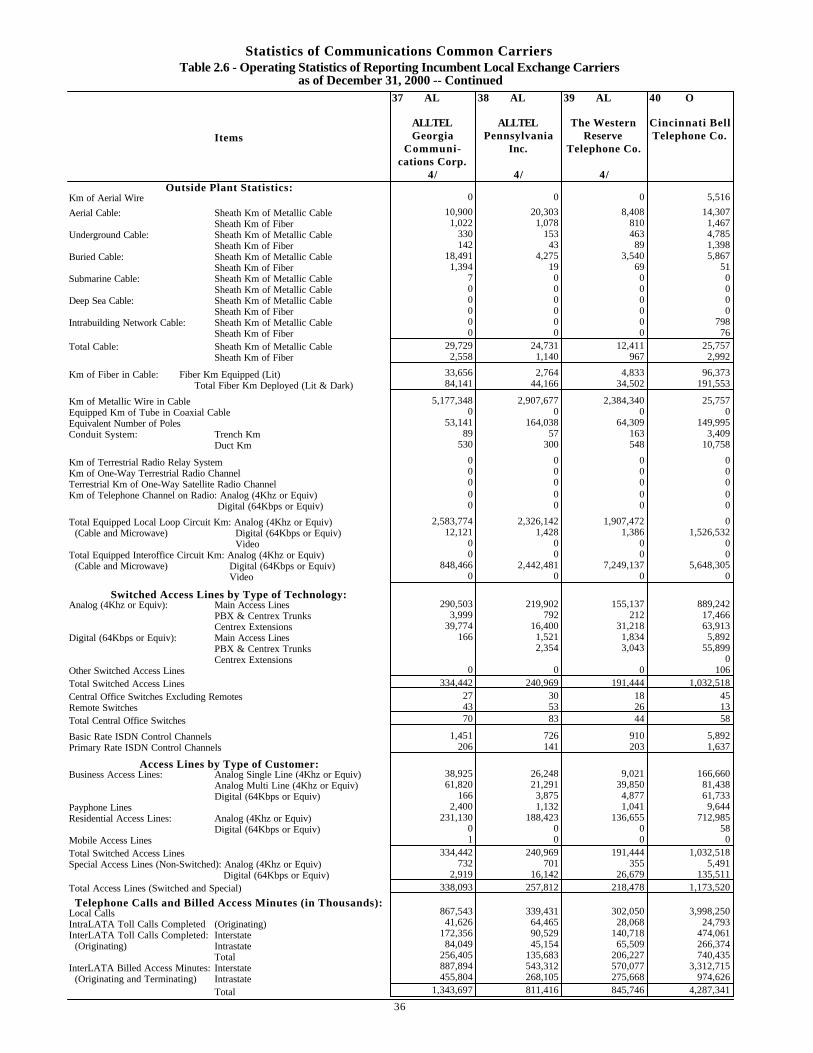
Statistics of Communications Common CarriersTable 2.6 - Operating Statistics of Reporting Incumbent Local Exchange Carriers
as of December 31, 2000 -- Continued37 AL 38 AL 39 AL 40 O
ALLTEL ALLTEL The Western Cincinnati BellItems Georgia Pennsylvania Reserve Telephone Co.
Communi- Inc. Telephone Co.cations Corp.
4/ 4/ 4/Outside Plant Statistics:
Km of Aerial Wire 0 0 0 5,516
Aerial Cable: Sheath Km of Metallic Cable 10,900 20,303 8,408 14,307Sheath Km of Fiber 1,022 1,078 810 1,467
Underground Cable: Sheath Km of Metallic Cable 330 153 463 4,785Sheath Km of Fiber 142 43 89 1,398
Buried Cable: Sheath Km of Metallic Cable 18,491 4,275 3,540 5,867Sheath Km of Fiber 1,394 19 69 51
Submarine Cable: Sheath Km of Metallic Cable 7 0 0 0Sheath Km of Metallic Cable 0 0 0 0
Deep Sea Cable: Sheath Km of Metallic Cable 0 0 0 0Sheath Km of Fiber 0 0 0 0
Intrabuilding Network Cable: Sheath Km of Metallic Cable 0 0 0 798Sheath Km of Fiber 0 0 0 76
Total Cable: Sheath Km of Metallic Cable 29,729 24,731 12,411 25,757Sheath Km of Fiber 2,558 1,140 967 2,992
Km of Fiber in Cable: Fiber Km Equipped (Lit) 33,656 2,764 4,833 96,373 Total Fiber Km Deployed (Lit & Dark) 84,141 44,166 34,502 191,553
Km of Metallic Wire in Cable 5,177,348 2,907,677 2,384,340 25,757Equipped Km of Tube in Coaxial Cable 0 0 0 0Equivalent Number of Poles 53,141 164,038 64,309 149,995Conduit System: Trench Km 89 57 163 3,409
Duct Km 530 300 548 10,758
Km of Terrestrial Radio Relay System 0 0 0 0Km of One-Way Terrestrial Radio Channel 0 0 0 0Terrestrial Km of One-Way Satellite Radio Channel 0 0 0 0Km of Telephone Channel on Radio: Analog (4Khz or Equiv) 0 0 0 0 Digital (64Kbps or Equiv) 0 0 0 0
Total Equipped Local Loop Circuit Km: Analog (4Khz or Equiv) 2,583,774 2,326,142 1,907,472 0 (Cable and Microwave) Digital (64Kbps or Equiv) 12,121 1,428 1,386 1,526,532
Video 0 0 0 0Total Equipped Interoffice Circuit Km: Analog (4Khz or Equiv) 0 0 0 0 (Cable and Microwave) Digital (64Kbps or Equiv) 848,466 2,442,481 7,249,137 5,648,305
Video 0 0 0 0
Switched Access Lines by Type of Technology:Analog (4Khz or Equiv): Main Access Lines 290,503 219,902 155,137 889,242
PBX & Centrex Trunks 3,999 792 212 17,466Centrex Extensions 39,774 16,400 31,218 63,913
Digital (64Kbps or Equiv): Main Access Lines 166 1,521 1,834 5,892PBX & Centrex Trunks 0 2,354 3,043 55,899Centrex Extensions 0 0 0 0
Other Switched Access Lines 0 0 0 106
Total Switched Access Lines 334,442 240,969 191,444 1,032,518
Central Office Switches Excluding Remotes 27 30 18 45Remote Switches 43 53 26 13
Total Central Office Switches 70 83 44 58
Basic Rate ISDN Control Channels 1,451 726 910 5,892Primary Rate ISDN Control Channels 206 141 203 1,637
Access Lines by Type of Customer:Business Access Lines: Analog Single Line (4Khz or Equiv) 38,925 26,248 9,021 166,660
Analog Multi Line (4Khz or Equiv) 61,820 21,291 39,850 81,438Digital (64Kbps or Equiv) 166 3,875 4,877 61,733
Payphone Lines 2,400 1,132 1,041 9,644Residential Access Lines: Analog (4Khz or Equiv) 231,130 188,423 136,655 712,985
Digital (64Kbps or Equiv) 0 0 0 58Mobile Access Lines 1 0 0 0
Total Switched Access Lines 334,442 240,969 191,444 1,032,518Special Access Lines (Non-Switched): Analog (4Khz or Equiv) 732 701 355 5,491
Digital (64Kbps or Equiv) 2,919 16,142 26,679 135,511
Total Access Lines (Switched and Special) 338,093 257,812 218,478 1,173,520
Telephone Calls and Billed Access Minutes (in Thousands):Local Calls 867,543 339,431 302,050 3,998,250IntraLATA Toll Calls Completed (Originating) 41,626 64,465 28,068 24,793InterLATA Toll Calls Completed: Interstate 172,356 90,529 140,718 474,061 (Originating) Intrastate 84,049 45,154 65,509 266,374
Total 256,405 135,683 206,227 740,435InterLATA Billed Access Minutes: Interstate 887,894 543,312 570,077 3,312,715 (Originating and Terminating) Intrastate 455,804 268,105 275,668 974,626
Total 1,343,697 811,416 845,746 4,287,341
36

Statistics of Communications Common CarriersTable 2.6 - Operating Statistics of Reporting Incumbent Local Exchange Carriers
as of December 31, 2000 -- Continued41 O 42 O 43 GC 44 S
Citizens Commonwealth Frontier CarolinaItems Telecommuni- Telephone Telephone Telephone and
cations Co. of Company of Rochester, Telegraph Co. New York, Inc. Inc.
5/ 6/Outside Plant Statistics:
Km of Aerial Wire 2,664 27,395 2,722 82
Aerial Cable: Sheath Km of Metallic Cable 13,471 18,186 9,067 11,846Sheath Km of Fiber 1,299 2,316 875 1,262
Underground Cable: Sheath Km of Metallic Cable 304 78 2,762 1,549Sheath Km of Fiber 72 34 843 956
Buried Cable: Sheath Km of Metallic Cable 13,938 4,675 4,719 82,791Sheath Km of Fiber 689 26 69 6,234
Submarine Cable: Sheath Km of Metallic Cable 199 0 0 23Sheath Km of Metallic Cable 0 0 0 15
Deep Sea Cable: Sheath Km of Metallic Cable 0 0 0 0Sheath Km of Fiber 0 0 0 0
Intrabuilding Network Cable: Sheath Km of Metallic Cable 0 1 474 44Sheath Km of Fiber 0 6 54 5
Total Cable: Sheath Km of Metallic Cable 27,912 22,940 17,022 96,253Sheath Km of Fiber 2,060 2,382 1,841 8,472
Km of Fiber in Cable: Fiber Km Equipped (Lit) 2,060 16,242 34,686 88,161 Total Fiber Km Deployed (Lit & Dark) 2,060 38,983 77,079 240,156
Km of Metallic Wire in Cable 27,912 4,183,178 17,022 18,481,446Equipped Km of Tube in Coaxial Cable 0 0 0 40Equivalent Number of Poles 178,633 121,691 113,482 122,712Conduit System: Trench Km 0 41 1,333 1,110
Duct Km 0 193 4,442 5,691
Km of Terrestrial Radio Relay System 0 0 217 82Km of One-Way Terrestrial Radio Channel 0 0 897 164Terrestrial Km of One-Way Satellite Radio Channel 0 0 0 0Km of Telephone Channel on Radio: Analog (4Khz or Equiv) 0 0 0 0 Digital (64Kbps or Equiv) 0 0 18,888 127,517
Total Equipped Local Loop Circuit Km: Analog (4Khz or Equiv) 324,256 0 0 2,467 (Cable and Microwave) Digital (64Kbps or Equiv) 0 0 2,006,875 2,996,866
Video 0 0 9 0Total Equipped Interoffice Circuit Km: Analog (4Khz or Equiv) 0 0 0 0 (Cable and Microwave) Digital (64Kbps or Equiv) 0 0 4,388,578 19,143,640
Video 0 0 51 0
Switched Access Lines by Type of Technology:Analog (4Khz or Equiv): Main Access Lines 294,044 285,632 478,839 1,124,494
PBX & Centrex Trunks 2,244 2,328 10,365 99,422Centrex Extensions 11,386 26,093 51,839 24
Digital (64Kbps or Equiv): Main Access Lines 0 474 4,838 3,363PBX & Centrex Trunks 0 0 28,226 6,490Centrex Extensions 3,796 0 10,354 0
Other Switched Access Lines 0 0 5,303 0
Total Switched Access Lines 311,470 314,527 589,764 1,233,793
Central Office Switches Excluding Remotes 31 13 7 48Remote Switches 97 454 51 115
Total Central Office Switches 128 467 58 163
Basic Rate ISDN Control Channels 129 451 0 3,363Primary Rate ISDN Control Channels 2 51 0 1,298
Access Lines by Type of Customer:Business Access Lines: Analog Single Line (4Khz or Equiv) 36,007 44,036 13,166 63,928
Analog Multi Line (4Khz or Equiv) 21,250 28,421 157,877 238,154Digital (64Kbps or Equiv) 3,796 454 43,256 9,853
Payphone Lines 2,866 2,273 5,303 3,479Residential Access Lines: Analog (4Khz or Equiv) 247,551 239,323 370,000 918,379
Digital (64Kbps or Equiv) 0 20 162 0Mobile Access Lines 0 0 0 0
Total Switched Access Lines 311,470 314,527 589,764 1,233,793Special Access Lines (Non-Switched): Analog (4Khz or Equiv) 0 0 517 1,776
Digital (64Kbps or Equiv) 0 0 103,764 721,441
Total Access Lines (Switched and Special) 311,470 314,527 694,045 1,957,010
Telephone Calls and Billed Access Minutes (in Thousands):Local Calls 0 684,535 2,468,998 3,951,120IntraLATA Toll Calls Completed (Originating) 86,333 47,091 12,648 6,912InterLATA Toll Calls Completed: Interstate 96,083 143,060 394,094 407,414 (Originating) Intrastate 62,726 100,532 165,757 249,144
Total 158,809 243,592 559,851 656,558InterLATA Billed Access Minutes: Interstate 783,563 602,699 1,648,842 3,968,361 (Originating and Terminating) Intrastate 513,975 514,264 744,908 1,894,581
Total 1,297,538 1,116,963 2,393,750 5,862,942
37
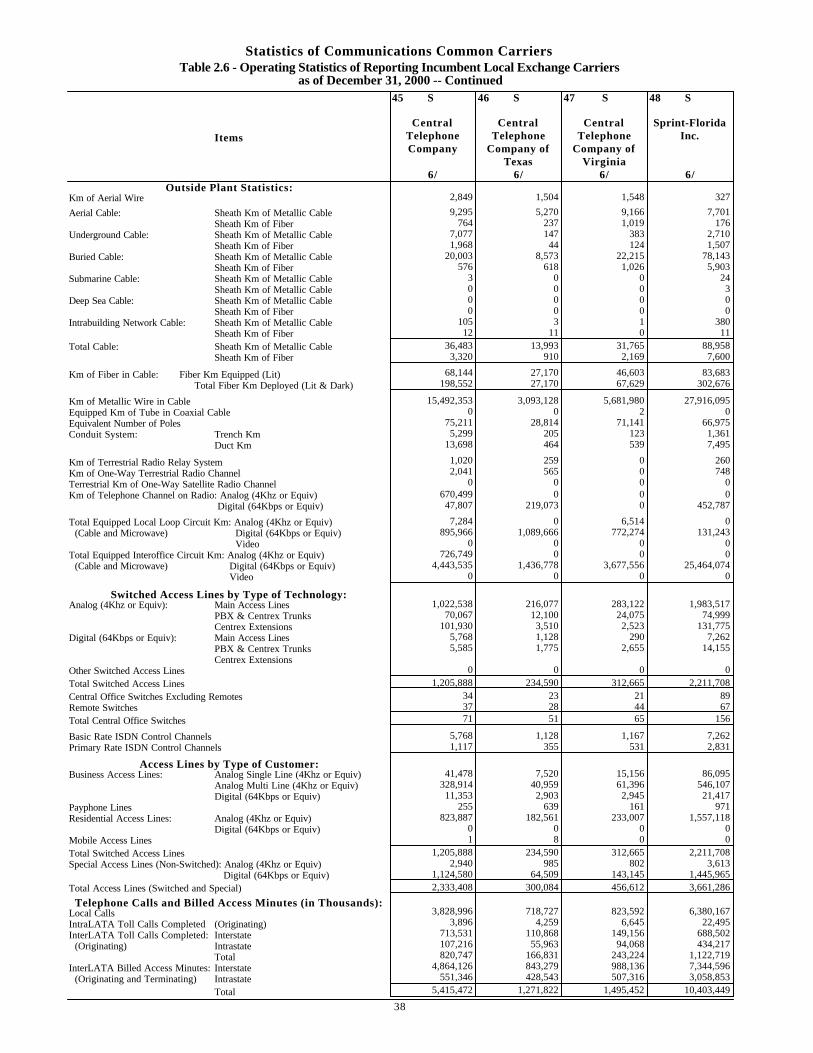
Statistics of Communications Common CarriersTable 2.6 - Operating Statistics of Reporting Incumbent Local Exchange Carriers
as of December 31, 2000 -- Continued45 S 46 S 47 S 48 S
Central Central Central Sprint-FloridaItems Telephone Telephone Telephone Inc.
Company Company of Company ofTexas Virginia
6/ 6/ 6/ 6/Outside Plant Statistics:
Km of Aerial Wire 2,849 1,504 1,548 327
Aerial Cable: Sheath Km of Metallic Cable 9,295 5,270 9,166 7,701Sheath Km of Fiber 764 237 1,019 176
Underground Cable: Sheath Km of Metallic Cable 7,077 147 383 2,710Sheath Km of Fiber 1,968 44 124 1,507
Buried Cable: Sheath Km of Metallic Cable 20,003 8,573 22,215 78,143Sheath Km of Fiber 576 618 1,026 5,903
Submarine Cable: Sheath Km of Metallic Cable 3 0 0 24Sheath Km of Metallic Cable 0 0 0 3
Deep Sea Cable: Sheath Km of Metallic Cable 0 0 0 0Sheath Km of Fiber 0 0 0 0
Intrabuilding Network Cable: Sheath Km of Metallic Cable 105 3 1 380Sheath Km of Fiber 12 11 0 11
Total Cable: Sheath Km of Metallic Cable 36,483 13,993 31,765 88,958Sheath Km of Fiber 3,320 910 2,169 7,600
Km of Fiber in Cable: Fiber Km Equipped (Lit) 68,144 27,170 46,603 83,683 Total Fiber Km Deployed (Lit & Dark) 198,552 27,170 67,629 302,676
Km of Metallic Wire in Cable 15,492,353 3,093,128 5,681,980 27,916,095Equipped Km of Tube in Coaxial Cable 0 0 2 0Equivalent Number of Poles 75,211 28,814 71,141 66,975Conduit System: Trench Km 5,299 205 123 1,361
Duct Km 13,698 464 539 7,495
Km of Terrestrial Radio Relay System 1,020 259 0 260Km of One-Way Terrestrial Radio Channel 2,041 565 0 748Terrestrial Km of One-Way Satellite Radio Channel 0 0 0 0Km of Telephone Channel on Radio: Analog (4Khz or Equiv) 670,499 0 0 0 Digital (64Kbps or Equiv) 47,807 219,073 0 452,787
Total Equipped Local Loop Circuit Km: Analog (4Khz or Equiv) 7,284 0 6,514 0 (Cable and Microwave) Digital (64Kbps or Equiv) 895,966 1,089,666 772,274 131,243
Video 0 0 0 0Total Equipped Interoffice Circuit Km: Analog (4Khz or Equiv) 726,749 0 0 0 (Cable and Microwave) Digital (64Kbps or Equiv) 4,443,535 1,436,778 3,677,556 25,464,074
Video 0 0 0 0
Switched Access Lines by Type of Technology:Analog (4Khz or Equiv): Main Access Lines 1,022,538 216,077 283,122 1,983,517
PBX & Centrex Trunks 70,067 12,100 24,075 74,999Centrex Extensions 101,930 3,510 2,523 131,775
Digital (64Kbps or Equiv): Main Access Lines 5,768 1,128 290 7,262PBX & Centrex Trunks 5,585 1,775 2,655 14,155Centrex Extensions 0 0 0 0
Other Switched Access Lines 0 0 0 0
Total Switched Access Lines 1,205,888 234,590 312,665 2,211,708
Central Office Switches Excluding Remotes 34 23 21 89Remote Switches 37 28 44 67
Total Central Office Switches 71 51 65 156
Basic Rate ISDN Control Channels 5,768 1,128 1,167 7,262Primary Rate ISDN Control Channels 1,117 355 531 2,831
Access Lines by Type of Customer:Business Access Lines: Analog Single Line (4Khz or Equiv) 41,478 7,520 15,156 86,095
Analog Multi Line (4Khz or Equiv) 328,914 40,959 61,396 546,107Digital (64Kbps or Equiv) 11,353 2,903 2,945 21,417
Payphone Lines 255 639 161 971Residential Access Lines: Analog (4Khz or Equiv) 823,887 182,561 233,007 1,557,118
Digital (64Kbps or Equiv) 0 0 0 0Mobile Access Lines 1 8 0 0
Total Switched Access Lines 1,205,888 234,590 312,665 2,211,708Special Access Lines (Non-Switched): Analog (4Khz or Equiv) 2,940 985 802 3,613
Digital (64Kbps or Equiv) 1,124,580 64,509 143,145 1,445,965
Total Access Lines (Switched and Special) 2,333,408 300,084 456,612 3,661,286
Telephone Calls and Billed Access Minutes (in Thousands):Local Calls 3,828,996 718,727 823,592 6,380,167IntraLATA Toll Calls Completed (Originating) 3,896 4,259 6,645 22,495InterLATA Toll Calls Completed: Interstate 713,531 110,868 149,156 688,502 (Originating) Intrastate 107,216 55,963 94,068 434,217
Total 820,747 166,831 243,224 1,122,719InterLATA Billed Access Minutes: Interstate 4,864,126 843,279 988,136 7,344,596 (Originating and Terminating) Intrastate 551,346 428,543 507,316 3,058,853
Total 5,415,472 1,271,822 1,495,452 10,403,449
38
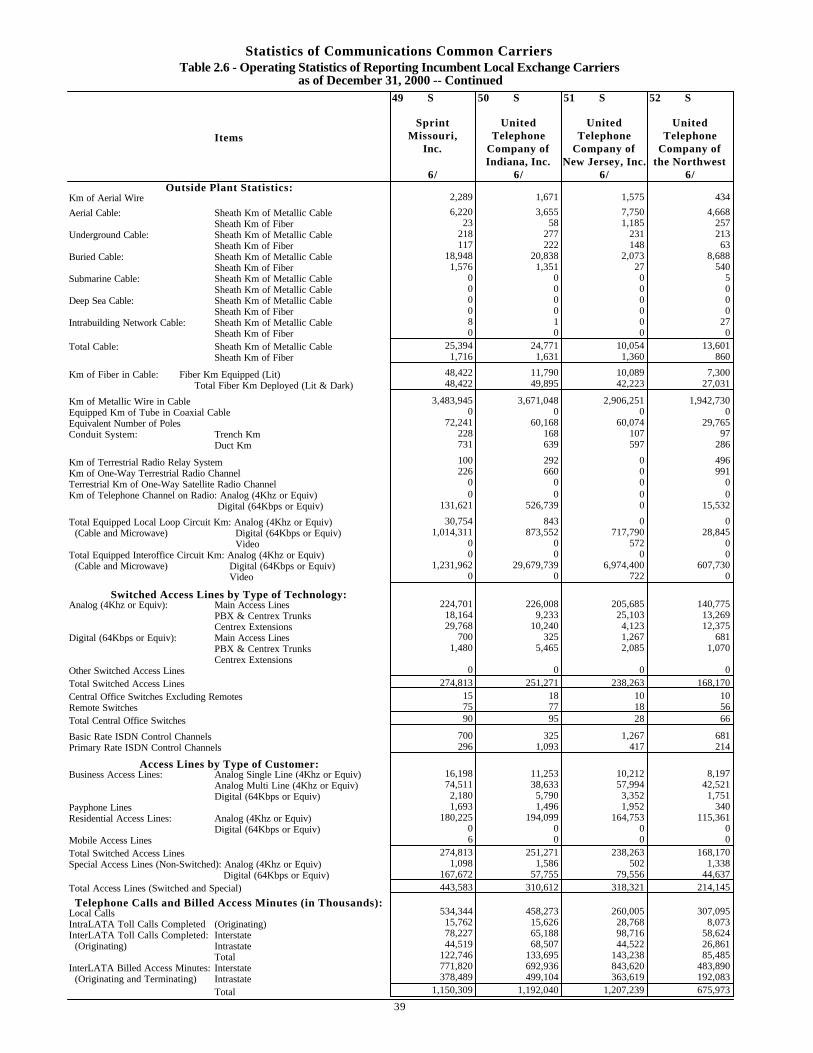
Statistics of Communications Common CarriersTable 2.6 - Operating Statistics of Reporting Incumbent Local Exchange Carriers
as of December 31, 2000 -- Continued49 S 50 S 51 S 52 S
Sprint United United UnitedItems Missouri, Telephone Telephone Telephone
Inc. Company of Company of Company ofIndiana, Inc. New Jersey, Inc. the Northwest
6/ 6/ 6/ 6/Outside Plant Statistics:
Km of Aerial Wire 2,289 1,671 1,575 434
Aerial Cable: Sheath Km of Metallic Cable 6,220 3,655 7,750 4,668Sheath Km of Fiber 23 58 1,185 257
Underground Cable: Sheath Km of Metallic Cable 218 277 231 213Sheath Km of Fiber 117 222 148 63
Buried Cable: Sheath Km of Metallic Cable 18,948 20,838 2,073 8,688Sheath Km of Fiber 1,576 1,351 27 540
Submarine Cable: Sheath Km of Metallic Cable 0 0 0 5Sheath Km of Metallic Cable 0 0 0 0
Deep Sea Cable: Sheath Km of Metallic Cable 0 0 0 0Sheath Km of Fiber 0 0 0 0
Intrabuilding Network Cable: Sheath Km of Metallic Cable 8 1 0 27Sheath Km of Fiber 0 0 0 0
Total Cable: Sheath Km of Metallic Cable 25,394 24,771 10,054 13,601Sheath Km of Fiber 1,716 1,631 1,360 860
Km of Fiber in Cable: Fiber Km Equipped (Lit) 48,422 11,790 10,089 7,300 Total Fiber Km Deployed (Lit & Dark) 48,422 49,895 42,223 27,031
Km of Metallic Wire in Cable 3,483,945 3,671,048 2,906,251 1,942,730Equipped Km of Tube in Coaxial Cable 0 0 0 0Equivalent Number of Poles 72,241 60,168 60,074 29,765Conduit System: Trench Km 228 168 107 97
Duct Km 731 639 597 286
Km of Terrestrial Radio Relay System 100 292 0 496Km of One-Way Terrestrial Radio Channel 226 660 0 991Terrestrial Km of One-Way Satellite Radio Channel 0 0 0 0Km of Telephone Channel on Radio: Analog (4Khz or Equiv) 0 0 0 0 Digital (64Kbps or Equiv) 131,621 526,739 0 15,532
Total Equipped Local Loop Circuit Km: Analog (4Khz or Equiv) 30,754 843 0 0 (Cable and Microwave) Digital (64Kbps or Equiv) 1,014,311 873,552 717,790 28,845
Video 0 0 572 0Total Equipped Interoffice Circuit Km: Analog (4Khz or Equiv) 0 0 0 0 (Cable and Microwave) Digital (64Kbps or Equiv) 1,231,962 29,679,739 6,974,400 607,730
Video 0 0 722 0
Switched Access Lines by Type of Technology:Analog (4Khz or Equiv): Main Access Lines 224,701 226,008 205,685 140,775
PBX & Centrex Trunks 18,164 9,233 25,103 13,269Centrex Extensions 29,768 10,240 4,123 12,375
Digital (64Kbps or Equiv): Main Access Lines 700 325 1,267 681PBX & Centrex Trunks 1,480 5,465 2,085 1,070Centrex Extensions 0 0 0 0
Other Switched Access Lines 0 0 0 0
Total Switched Access Lines 274,813 251,271 238,263 168,170
Central Office Switches Excluding Remotes 15 18 10 10Remote Switches 75 77 18 56
Total Central Office Switches 90 95 28 66
Basic Rate ISDN Control Channels 700 325 1,267 681Primary Rate ISDN Control Channels 296 1,093 417 214
Access Lines by Type of Customer:Business Access Lines: Analog Single Line (4Khz or Equiv) 16,198 11,253 10,212 8,197
Analog Multi Line (4Khz or Equiv) 74,511 38,633 57,994 42,521Digital (64Kbps or Equiv) 2,180 5,790 3,352 1,751
Payphone Lines 1,693 1,496 1,952 340Residential Access Lines: Analog (4Khz or Equiv) 180,225 194,099 164,753 115,361
Digital (64Kbps or Equiv) 0 0 0 0Mobile Access Lines 6 0 0 0
Total Switched Access Lines 274,813 251,271 238,263 168,170Special Access Lines (Non-Switched): Analog (4Khz or Equiv) 1,098 1,586 502 1,338
Digital (64Kbps or Equiv) 167,672 57,755 79,556 44,637
Total Access Lines (Switched and Special) 443,583 310,612 318,321 214,145
Telephone Calls and Billed Access Minutes (in Thousands):Local Calls 534,344 458,273 260,005 307,095IntraLATA Toll Calls Completed (Originating) 15,762 15,626 28,768 8,073InterLATA Toll Calls Completed: Interstate 78,227 65,188 98,716 58,624 (Originating) Intrastate 44,519 68,507 44,522 26,861
Total 122,746 133,695 143,238 85,485InterLATA Billed Access Minutes: Interstate 771,820 692,936 843,620 483,890 (Originating and Terminating) Intrastate 378,489 499,104 363,619 192,083
Total 1,150,309 1,192,040 1,207,239 675,973
39
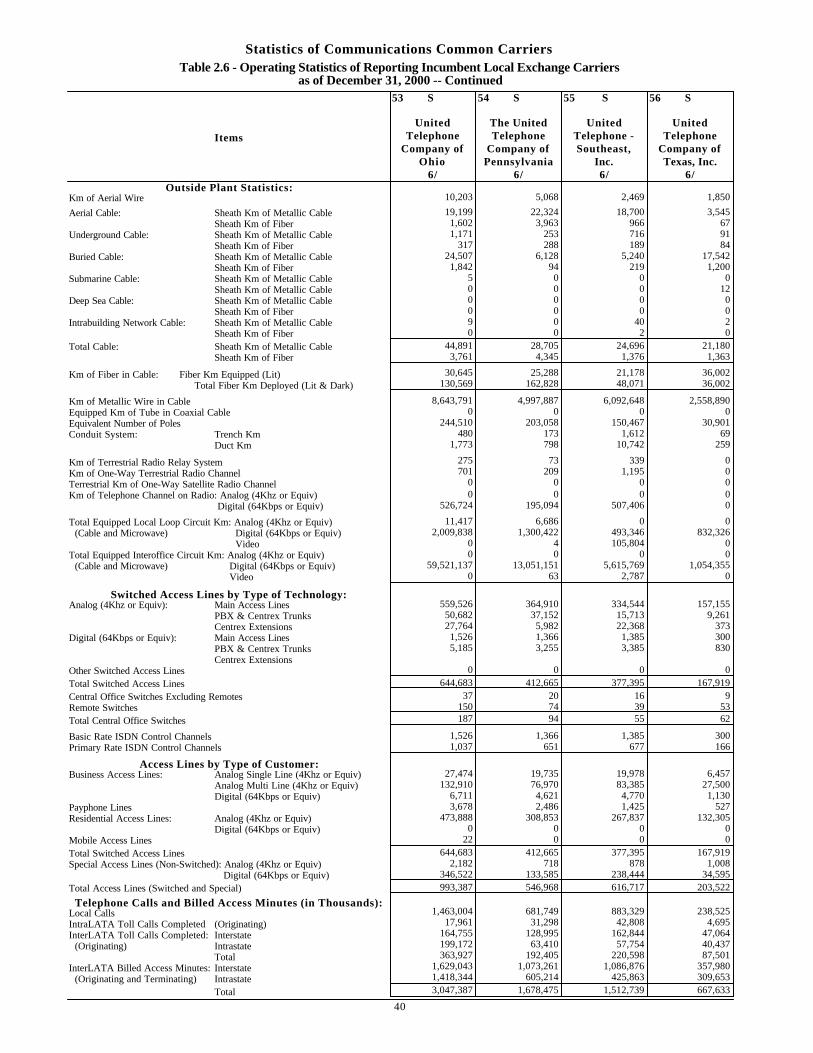
Statistics of Communications Common CarriersTable 2.6 - Operating Statistics of Reporting Incumbent Local Exchange Carriers
as of December 31, 2000 -- Continued53 S 54 S 55 S 56 S
United The United United UnitedItems Telephone Telephone Telephone - Telephone
Company of Company of Southeast, Company ofOhio Pennsylvania Inc. Texas, Inc.
6/ 6/ 6/ 6/Outside Plant Statistics:
Km of Aerial Wire 10,203 5,068 2,469 1,850
Aerial Cable: Sheath Km of Metallic Cable 19,199 22,324 18,700 3,545Sheath Km of Fiber 1,602 3,963 966 67
Underground Cable: Sheath Km of Metallic Cable 1,171 253 716 91Sheath Km of Fiber 317 288 189 84
Buried Cable: Sheath Km of Metallic Cable 24,507 6,128 5,240 17,542Sheath Km of Fiber 1,842 94 219 1,200
Submarine Cable: Sheath Km of Metallic Cable 5 0 0 0Sheath Km of Metallic Cable 0 0 0 12
Deep Sea Cable: Sheath Km of Metallic Cable 0 0 0 0Sheath Km of Fiber 0 0 0 0
Intrabuilding Network Cable: Sheath Km of Metallic Cable 9 0 40 2Sheath Km of Fiber 0 0 2 0
Total Cable: Sheath Km of Metallic Cable 44,891 28,705 24,696 21,180Sheath Km of Fiber 3,761 4,345 1,376 1,363
Km of Fiber in Cable: Fiber Km Equipped (Lit) 30,645 25,288 21,178 36,002 Total Fiber Km Deployed (Lit & Dark) 130,569 162,828 48,071 36,002
Km of Metallic Wire in Cable 8,643,791 4,997,887 6,092,648 2,558,890Equipped Km of Tube in Coaxial Cable 0 0 0 0Equivalent Number of Poles 244,510 203,058 150,467 30,901Conduit System: Trench Km 480 173 1,612 69
Duct Km 1,773 798 10,742 259
Km of Terrestrial Radio Relay System 275 73 339 0Km of One-Way Terrestrial Radio Channel 701 209 1,195 0Terrestrial Km of One-Way Satellite Radio Channel 0 0 0 0Km of Telephone Channel on Radio: Analog (4Khz or Equiv) 0 0 0 0 Digital (64Kbps or Equiv) 526,724 195,094 507,406 0
Total Equipped Local Loop Circuit Km: Analog (4Khz or Equiv) 11,417 6,686 0 0 (Cable and Microwave) Digital (64Kbps or Equiv) 2,009,838 1,300,422 493,346 832,326
Video 0 4 105,804 0Total Equipped Interoffice Circuit Km: Analog (4Khz or Equiv) 0 0 0 0 (Cable and Microwave) Digital (64Kbps or Equiv) 59,521,137 13,051,151 5,615,769 1,054,355
Video 0 63 2,787 0
Switched Access Lines by Type of Technology:Analog (4Khz or Equiv): Main Access Lines 559,526 364,910 334,544 157,155
PBX & Centrex Trunks 50,682 37,152 15,713 9,261Centrex Extensions 27,764 5,982 22,368 373
Digital (64Kbps or Equiv): Main Access Lines 1,526 1,366 1,385 300PBX & Centrex Trunks 5,185 3,255 3,385 830Centrex Extensions 0 0 0 0
Other Switched Access Lines 0 0 0 0
Total Switched Access Lines 644,683 412,665 377,395 167,919
Central Office Switches Excluding Remotes 37 20 16 9Remote Switches 150 74 39 53
Total Central Office Switches 187 94 55 62
Basic Rate ISDN Control Channels 1,526 1,366 1,385 300Primary Rate ISDN Control Channels 1,037 651 677 166
Access Lines by Type of Customer:Business Access Lines: Analog Single Line (4Khz or Equiv) 27,474 19,735 19,978 6,457
Analog Multi Line (4Khz or Equiv) 132,910 76,970 83,385 27,500Digital (64Kbps or Equiv) 6,711 4,621 4,770 1,130
Payphone Lines 3,678 2,486 1,425 527Residential Access Lines: Analog (4Khz or Equiv) 473,888 308,853 267,837 132,305
Digital (64Kbps or Equiv) 0 0 0 0Mobile Access Lines 22 0 0 0
Total Switched Access Lines 644,683 412,665 377,395 167,919Special Access Lines (Non-Switched): Analog (4Khz or Equiv) 2,182 718 878 1,008
Digital (64Kbps or Equiv) 346,522 133,585 238,444 34,595
Total Access Lines (Switched and Special) 993,387 546,968 616,717 203,522
Telephone Calls and Billed Access Minutes (in Thousands):Local Calls 1,463,004 681,749 883,329 238,525IntraLATA Toll Calls Completed (Originating) 17,961 31,298 42,808 4,695InterLATA Toll Calls Completed: Interstate 164,755 128,995 162,844 47,064 (Originating) Intrastate 199,172 63,410 57,754 40,437
Total 363,927 192,405 220,598 87,501InterLATA Billed Access Minutes: Interstate 1,629,043 1,073,261 1,086,876 357,980 (Originating and Terminating) Intrastate 1,418,344 605,214 425,863 309,653
Total 3,047,387 1,678,475 1,512,739 667,633
40
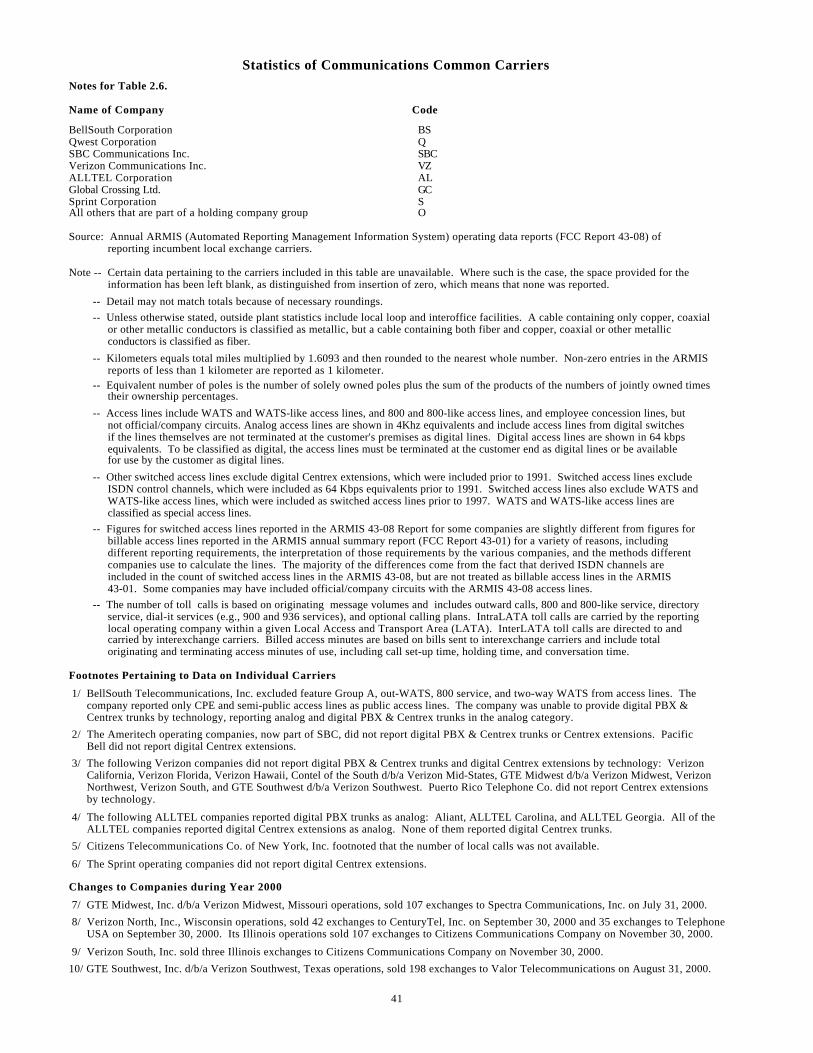
Statistics of Communications Common Carriers
Notes for Table 2.6.
Name of Company Code
BellSouth Corporation BSQwest Corporation QSBC Communications Inc. SBCVerizon Communications Inc. VZALLTEL Corporation ALGlobal Crossing Ltd. GCSprint Corporation SAll others that are part of a holding company group O
Source: Annual ARMIS (Automated Reporting Management Information System) operating data reports (FCC Report 43-08) of reporting incumbent local exchange carriers.
Note -- Certain data pertaining to the carriers included in this table are unavailable. Where such is the case, the space provided for the information has been left blank, as distinguished from insertion of zero, which means that none was reported.
-- Detail may not match totals because of necessary roundings. -- Unless otherwise stated, outside plant statistics include local loop and interoffice facilities. A cable containing only copper, coaxial or other metallic conductors is classified as metallic, but a cable containing both fiber and copper, coaxial or other metallic conductors is classified as fiber.
-- Kilometers equals total miles multiplied by 1.6093 and then rounded to the nearest whole number. Non-zero entries in the ARMIS reports of less than 1 kilometer are reported as 1 kilometer. -- Equivalent number of poles is the number of solely owned poles plus the sum of the products of the numbers of jointly owned times their ownership percentages.
-- Access lines include WATS and WATS-like access lines, and 800 and 800-like access lines, and employee concession lines, but not official/company circuits. Analog access lines are shown in 4Khz equivalents and include access lines from digital switches if the lines themselves are not terminated at the customer's premises as digital lines. Digital access lines are shown in 64 kbps equivalents. To be classified as digital, the access lines must be terminated at the customer end as digital lines or be available for use by the customer as digital lines.
-- Other switched access lines exclude digital Centrex extensions, which were included prior to 1991. Switched access lines exclude ISDN control channels, which were included as 64 Kbps equivalents prior to 1991. Switched access lines also exclude WATS and WATS-like access lines, which were included as switched access lines prior to 1997. WATS and WATS-like access lines are classified as special access lines.
-- Figures for switched access lines reported in the ARMIS 43-08 Report for some companies are slightly different from figures for billable access lines reported in the ARMIS annual summary report (FCC Report 43-01) for a variety of reasons, including different reporting requirements, the interpretation of those requirements by the various companies, and the methods different companies use to calculate the lines. The majority of the differences come from the fact that derived ISDN channels are included in the count of switched access lines in the ARMIS 43-08, but are not treated as billable access lines in the ARMIS 43-01. Some companies may have included official/company circuits with the ARMIS 43-08 access lines.
-- The number of toll calls is based on originating message volumes and includes outward calls, 800 and 800-like service, directory service, dial-it services (e.g., 900 and 936 services), and optional calling plans. IntraLATA toll calls are carried by the reporting local operating company within a given Local Access and Transport Area (LATA). InterLATA toll calls are directed to and carried by interexchange carriers. Billed access minutes are based on bills sent to interexchange carriers and include total originating and terminating access minutes of use, including call set-up time, holding time, and conversation time.
Footnotes Pertaining to Data on Individual Carriers
1/ BellSouth Telecommunications, Inc. excluded feature Group A, out-WATS, 800 service, and two-way WATS from access lines. The company reported only CPE and semi-public access lines as public access lines. The company was unable to provide digital PBX & Centrex trunks by technology, reporting analog and digital PBX & Centrex trunks in the analog category.
2/ The Ameritech operating companies, now part of SBC, did not report digital PBX & Centrex trunks or Centrex extensions. Pacific Bell did not report digital Centrex extensions.
3/ The following Verizon companies did not report digital PBX & Centrex trunks and digital Centrex extensions by technology: Verizon California, Verizon Florida, Verizon Hawaii, Contel of the South d/b/a Verizon Mid-States, GTE Midwest d/b/a Verizon Midwest, Verizon Northwest, Verizon South, and GTE Southwest d/b/a Verizon Southwest. Puerto Rico Telephone Co. did not report Centrex extensions by technology.
4/ The following ALLTEL companies reported digital PBX trunks as analog: Aliant, ALLTEL Carolina, and ALLTEL Georgia. All of the ALLTEL companies reported digital Centrex extensions as analog. None of them reported digital Centrex trunks.
5/ Citizens Telecommunications Co. of New York, Inc. footnoted that the number of local calls was not available.
6/ The Sprint operating companies did not report digital Centrex extensions.
Changes to Companies during Year 2000
7/ GTE Midwest, Inc. d/b/a Verizon Midwest, Missouri operations, sold 107 exchanges to Spectra Communications, Inc. on July 31, 2000.
8/ Verizon North, Inc., Wisconsin operations, sold 42 exchanges to CenturyTel, Inc. on September 30, 2000 and 35 exchanges to Telephone USA on September 30, 2000. Its Illinois operations sold 107 exchanges to Citizens Communications Company on November 30, 2000.
9/ Verizon South, Inc. sold three Illinois exchanges to Citizens Communications Company on November 30, 2000.
10/ GTE Southwest, Inc. d/b/a Verizon Southwest, Texas operations, sold 198 exchanges to Valor Telecommunications on August 31, 2000.
41
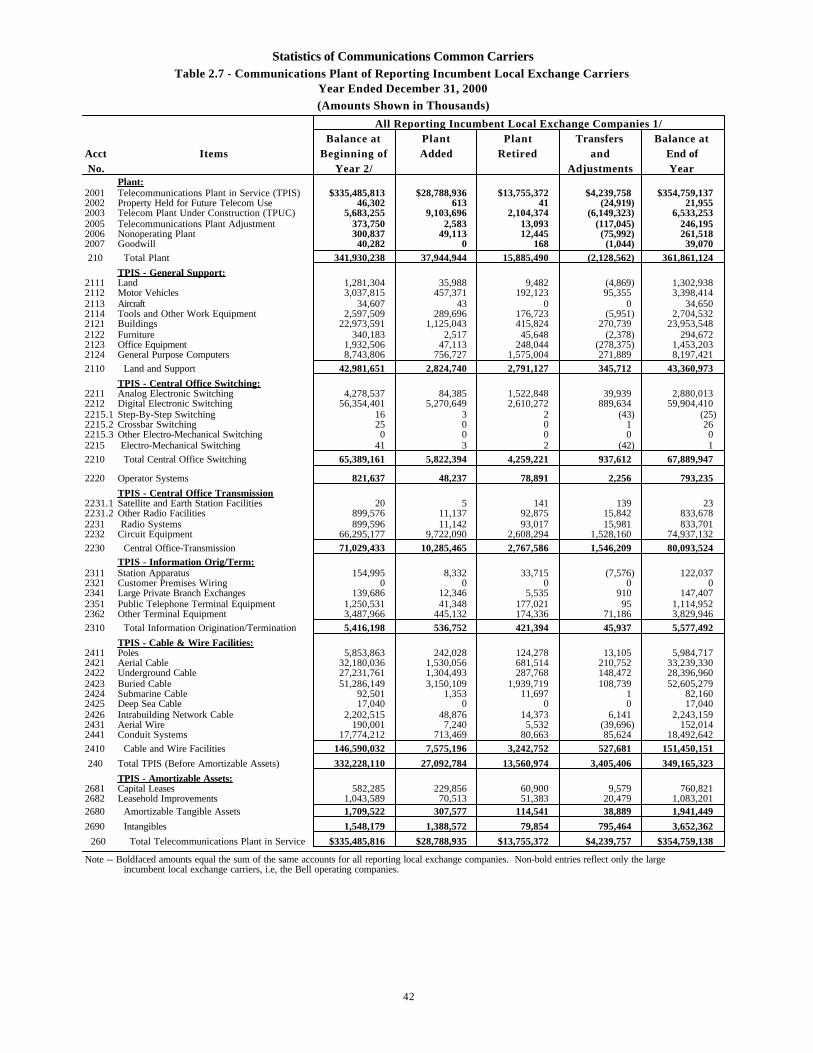
Statistics of Communications Common CarriersTable 2.7 - Communications Plant of Reporting Incumbent Local Exchange Carriers
Year Ended December 31, 2000
(Amounts Shown in Thousands)
All Reporting Incumbent Local Exchange Companies 1/Balance at Plant Plant Transfers Balance at
Acct Items Beginning of Added Retired and End of No. Year 2/ Adjustments Year
Plant:2001 Telecommunications Plant in Service (TPIS) $335,485,813 $28,788,936 $13,755,372 $4,239,758 $354,759,1372002 Property Held for Future Telecom Use 46,302 613 41 (24,919) 21,9552003 Telecom Plant Under Construction (TPUC) 5,683,255 9,103,696 2,104,374 (6,149,323) 6,533,2532005 Telecommunications Plant Adjustment 373,750 2,583 13,093 (117,045) 246,1952006 Nonoperating Plant 300,837 49,113 12,445 (75,992) 261,5182007 Goodwill 40,282 0 168 (1,044) 39,070 210 Total Plant 341,930,238 37,944,944 15,885,490 (2,128,562) 361,861,124
TPIS - General Support:2111 Land 1,281,304 35,988 9,482 (4,869) 1,302,9382112 Motor Vehicles 3,037,815 457,371 192,123 95,355 3,398,4142113 Aircraft 34,607 43 0 0 34,6502114 Tools and Other Work Equipment 2,597,509 289,696 176,723 (5,951) 2,704,5322121 Buildings 22,973,591 1,125,043 415,824 270,739 23,953,5482122 Furniture 340,183 2,517 45,648 (2,378) 294,6722123 Office Equipment 1,932,506 47,113 248,044 (278,375) 1,453,2032124 General Purpose Computers 8,743,806 756,727 1,575,004 271,889 8,197,421
2110 Land and Support 42,981,651 2,824,740 2,791,127 345,712 43,360,973
TPIS - Central Office Switching:2211 Analog Electronic Switching 4,278,537 84,385 1,522,848 39,939 2,880,0132212 Digital Electronic Switching 56,354,401 5,270,649 2,610,272 889,634 59,904,4102215.1 Step-By-Step Switching 16 3 2 (43) (25)2215.2 Crossbar Switching 25 0 0 1 262215.3 Other Electro-Mechanical Switching 0 0 0 0 02215 Electro-Mechanical Switching 41 3 2 (42) 1
2210 Total Central Office Switching 65,389,161 5,822,394 4,259,221 937,612 67,889,947
2220 Operator Systems 821,637 48,237 78,891 2,256 793,235
TPIS - Central Office Transmission2231.1 Satellite and Earth Station Facilities 20 5 141 139 232231.2 Other Radio Facilities 899,576 11,137 92,875 15,842 833,6782231 Radio Systems 899,596 11,142 93,017 15,981 833,7012232 Circuit Equipment 66,295,177 9,722,090 2,608,294 1,528,160 74,937,132
2230 Central Office-Transmission 71,029,433 10,285,465 2,767,586 1,546,209 80,093,524TPIS - Information Orig/Term:
2311 Station Apparatus 154,995 8,332 33,715 (7,576) 122,0372321 Customer Premises Wiring 0 0 0 0 02341 Large Private Branch Exchanges 139,686 12,346 5,535 910 147,4072351 Public Telephone Terminal Equipment 1,250,531 41,348 177,021 95 1,114,9522362 Other Terminal Equipment 3,487,966 445,132 174,336 71,186 3,829,946
2310 Total Information Origination/Termination 5,416,198 536,752 421,394 45,937 5,577,492
TPIS - Cable & Wire Facilities:2411 Poles 5,853,863 242,028 124,278 13,105 5,984,7172421 Aerial Cable 32,180,036 1,530,056 681,514 210,752 33,239,3302422 Underground Cable 27,231,761 1,304,493 287,768 148,472 28,396,9602423 Buried Cable 51,286,149 3,150,109 1,939,719 108,739 52,605,2792424 Submarine Cable 92,501 1,353 11,697 1 82,1602425 Deep Sea Cable 17,040 0 0 0 17,0402426 Intrabuilding Network Cable 2,202,515 48,876 14,373 6,141 2,243,1592431 Aerial Wire 190,001 7,240 5,532 (39,696) 152,0142441 Conduit Systems 17,774,212 713,469 80,663 85,624 18,492,642
2410 Cable and Wire Facilities 146,590,032 7,575,196 3,242,752 527,681 151,450,151
240 Total TPIS (Before Amortizable Assets) 332,228,110 27,092,784 13,560,974 3,405,406 349,165,323
TPIS - Amortizable Assets:2681 Capital Leases 582,285 229,856 60,900 9,579 760,8212682 Leasehold Improvements 1,043,589 70,513 51,383 20,479 1,083,2012680 Amortizable Tangible Assets 1,709,522 307,577 114,541 38,889 1,941,449
2690 Intangibles 1,548,179 1,388,572 79,854 795,464 3,652,362
260 Total Telecommunications Plant in Service $335,485,816 $28,788,935 $13,755,372 $4,239,757 $354,759,138
Note -- Boldfaced amounts equal the sum of the same accounts for all reporting local exchange companies. Non-bold entries reflect only the large incumbent local exchange carriers, i.e, the Bell operating companies.
42
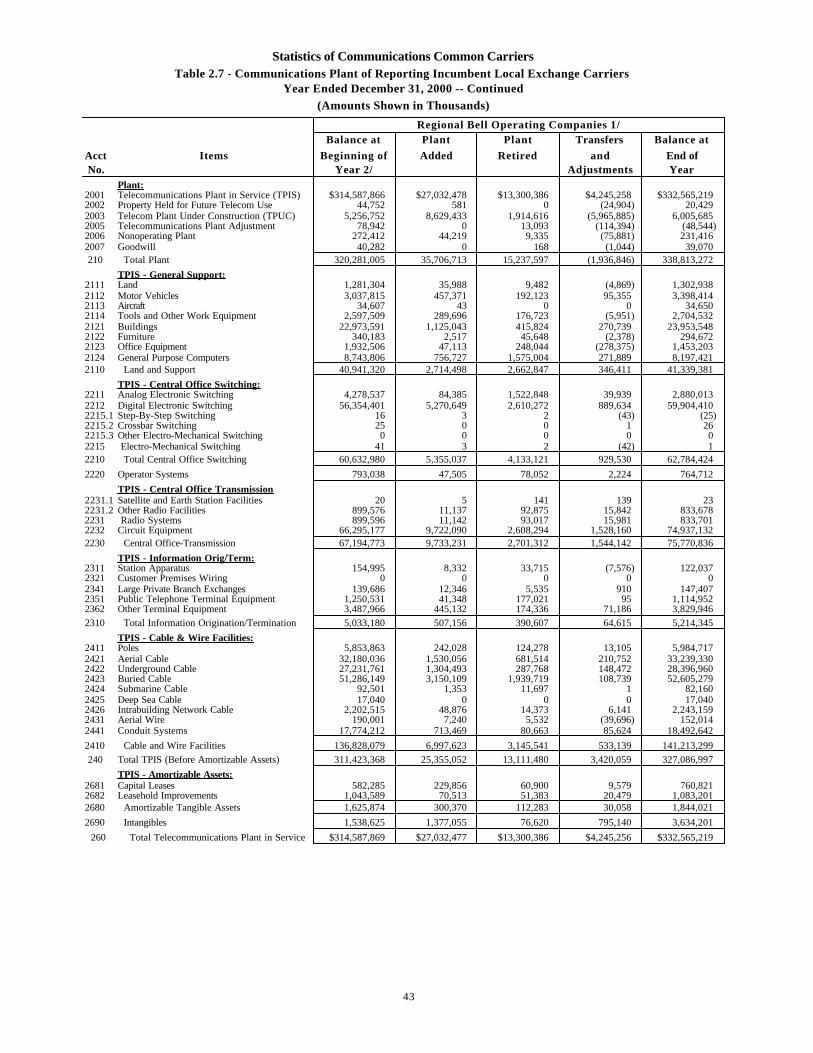
Statistics of Communications Common CarriersTable 2.7 - Communications Plant of Reporting Incumbent Local Exchange Carriers
Year Ended December 31, 2000 -- Continued
(Amounts Shown in Thousands)
Regional Bell Operating Companies 1/Balance at Plant Plant Transfers Balance at
Acct Items Beginning of Added Retired and End of No. Year 2/ Adjustments Year
Plant:2001 Telecommunications Plant in Service (TPIS) $314,587,866 $27,032,478 $13,300,386 $4,245,258 $332,565,2192002 Property Held for Future Telecom Use 44,752 581 0 (24,904) 20,4292003 Telecom Plant Under Construction (TPUC) 5,256,752 8,629,433 1,914,616 (5,965,885) 6,005,6852005 Telecommunications Plant Adjustment 78,942 0 13,093 (114,394) (48,544)2006 Nonoperating Plant 272,412 44,219 9,335 (75,881) 231,4162007 Goodwill 40,282 0 168 (1,044) 39,070 210 Total Plant 320,281,005 35,706,713 15,237,597 (1,936,846) 338,813,272
TPIS - General Support:2111 Land 1,281,304 35,988 9,482 (4,869) 1,302,9382112 Motor Vehicles 3,037,815 457,371 192,123 95,355 3,398,4142113 Aircraft 34,607 43 0 0 34,6502114 Tools and Other Work Equipment 2,597,509 289,696 176,723 (5,951) 2,704,5322121 Buildings 22,973,591 1,125,043 415,824 270,739 23,953,5482122 Furniture 340,183 2,517 45,648 (2,378) 294,6722123 Office Equipment 1,932,506 47,113 248,044 (278,375) 1,453,2032124 General Purpose Computers 8,743,806 756,727 1,575,004 271,889 8,197,4212110 Land and Support 40,941,320 2,714,498 2,662,847 346,411 41,339,381
TPIS - Central Office Switching:2211 Analog Electronic Switching 4,278,537 84,385 1,522,848 39,939 2,880,0132212 Digital Electronic Switching 56,354,401 5,270,649 2,610,272 889,634 59,904,4102215.1 Step-By-Step Switching 16 3 2 (43) (25)2215.2 Crossbar Switching 25 0 0 1 262215.3 Other Electro-Mechanical Switching 0 0 0 0 02215 Electro-Mechanical Switching 41 3 2 (42) 12210 Total Central Office Switching 60,632,980 5,355,037 4,133,121 929,530 62,784,424
2220 Operator Systems 793,038 47,505 78,052 2,224 764,712
TPIS - Central Office Transmission2231.1 Satellite and Earth Station Facilities 20 5 141 139 232231.2 Other Radio Facilities 899,576 11,137 92,875 15,842 833,6782231 Radio Systems 899,596 11,142 93,017 15,981 833,7012232 Circuit Equipment 66,295,177 9,722,090 2,608,294 1,528,160 74,937,1322230 Central Office-Transmission 67,194,773 9,733,231 2,701,312 1,544,142 75,770,836
TPIS - Information Orig/Term:2311 Station Apparatus 154,995 8,332 33,715 (7,576) 122,0372321 Customer Premises Wiring 0 0 0 0 02341 Large Private Branch Exchanges 139,686 12,346 5,535 910 147,4072351 Public Telephone Terminal Equipment 1,250,531 41,348 177,021 95 1,114,9522362 Other Terminal Equipment 3,487,966 445,132 174,336 71,186 3,829,946
2310 Total Information Origination/Termination 5,033,180 507,156 390,607 64,615 5,214,345
TPIS - Cable & Wire Facilities:2411 Poles 5,853,863 242,028 124,278 13,105 5,984,7172421 Aerial Cable 32,180,036 1,530,056 681,514 210,752 33,239,3302422 Underground Cable 27,231,761 1,304,493 287,768 148,472 28,396,9602423 Buried Cable 51,286,149 3,150,109 1,939,719 108,739 52,605,2792424 Submarine Cable 92,501 1,353 11,697 1 82,1602425 Deep Sea Cable 17,040 0 0 0 17,0402426 Intrabuilding Network Cable 2,202,515 48,876 14,373 6,141 2,243,1592431 Aerial Wire 190,001 7,240 5,532 (39,696) 152,0142441 Conduit Systems 17,774,212 713,469 80,663 85,624 18,492,642
2410 Cable and Wire Facilities 136,828,079 6,997,623 3,145,541 533,139 141,213,299
240 Total TPIS (Before Amortizable Assets) 311,423,368 25,355,052 13,111,480 3,420,059 327,086,997
TPIS - Amortizable Assets:2681 Capital Leases 582,285 229,856 60,900 9,579 760,8212682 Leasehold Improvements 1,043,589 70,513 51,383 20,479 1,083,2012680 Amortizable Tangible Assets 1,625,874 300,370 112,283 30,058 1,844,021
2690 Intangibles 1,538,625 1,377,055 76,620 795,140 3,634,201
260 Total Telecommunications Plant in Service $314,587,869 $27,032,477 $13,300,386 $4,245,256 $332,565,219
43
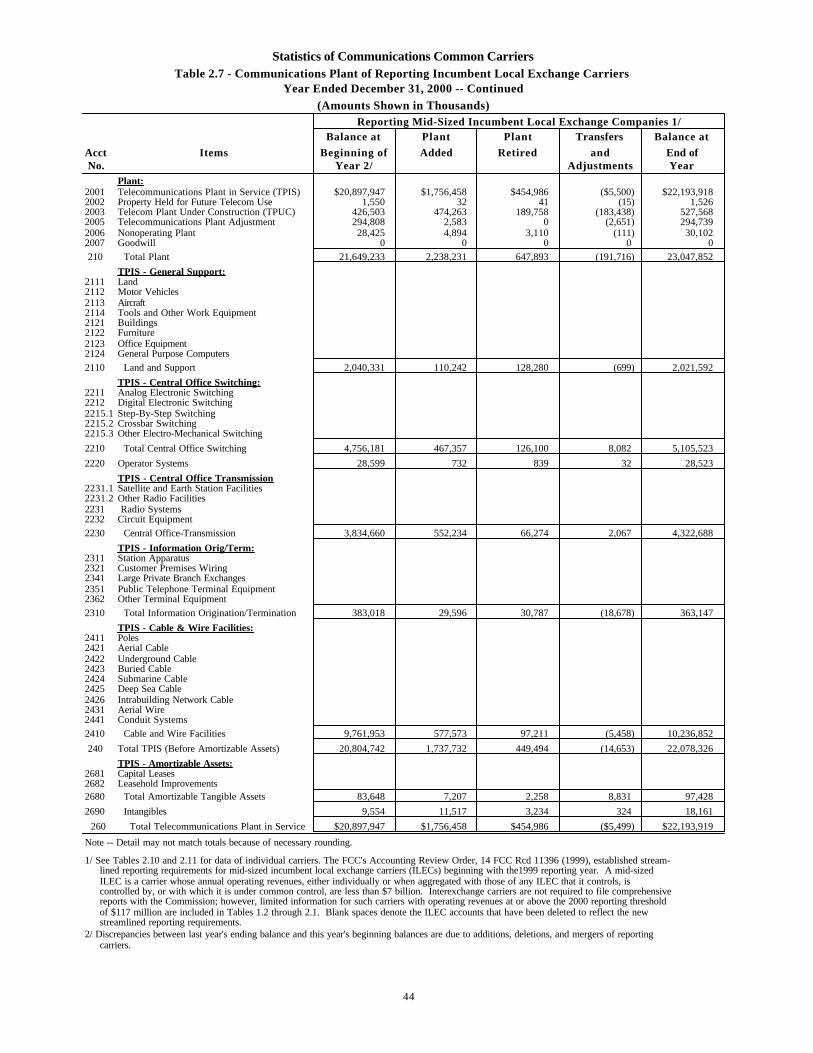
Statistics of Communications Common CarriersTable 2.7 - Communications Plant of Reporting Incumbent Local Exchange Carriers
Year Ended December 31, 2000 -- Continued
(Amounts Shown in Thousands)Reporting Mid-Sized Incumbent Local Exchange Companies 1/
Balance at Plant Plant Transfers Balance at
Acct Items Beginning of Added Retired and End of No. Year 2/ Adjustments Year
Plant:2001 Telecommunications Plant in Service (TPIS) $20,897,947 $1,756,458 $454,986 ($5,500) $22,193,9182002 Property Held for Future Telecom Use 1,550 32 41 (15) 1,5262003 Telecom Plant Under Construction (TPUC) 426,503 474,263 189,758 (183,438) 527,5682005 Telecommunications Plant Adjustment 294,808 2,583 0 (2,651) 294,7392006 Nonoperating Plant 28,425 4,894 3,110 (111) 30,1022007 Goodwill 0 0 0 0 0
210 Total Plant 21,649,233 2,238,231 647,893 (191,716) 23,047,852
TPIS - General Support:2111 Land2112 Motor Vehicles2113 Aircraft2114 Tools and Other Work Equipment2121 Buildings2122 Furniture2123 Office Equipment2124 General Purpose Computers
2110 Land and Support 2,040,331 110,242 128,280 (699) 2,021,592
TPIS - Central Office Switching:2211 Analog Electronic Switching2212 Digital Electronic Switching2215.1 Step-By-Step Switching2215.2 Crossbar Switching2215.3 Other Electro-Mechanical Switching
2210 Total Central Office Switching 4,756,181 467,357 126,100 8,082 5,105,523
2220 Operator Systems 28,599 732 839 32 28,523
TPIS - Central Office Transmission2231.1 Satellite and Earth Station Facilities2231.2 Other Radio Facilities2231 Radio Systems2232 Circuit Equipment
2230 Central Office-Transmission 3,834,660 552,234 66,274 2,067 4,322,688
TPIS - Information Orig/Term:2311 Station Apparatus2321 Customer Premises Wiring2341 Large Private Branch Exchanges2351 Public Telephone Terminal Equipment2362 Other Terminal Equipment
2310 Total Information Origination/Termination 383,018 29,596 30,787 (18,678) 363,147
TPIS - Cable & Wire Facilities:2411 Poles2421 Aerial Cable2422 Underground Cable2423 Buried Cable2424 Submarine Cable2425 Deep Sea Cable2426 Intrabuilding Network Cable2431 Aerial Wire2441 Conduit Systems
2410 Cable and Wire Facilities 9,761,953 577,573 97,211 (5,458) 10,236,852
240 Total TPIS (Before Amortizable Assets) 20,804,742 1,737,732 449,494 (14,653) 22,078,326
TPIS - Amortizable Assets:2681 Capital Leases2682 Leasehold Improvements2680 Total Amortizable Tangible Assets 83,648 7,207 2,258 8,831 97,428
2690 Intangibles 9,554 11,517 3,234 324 18,161
260 Total Telecommunications Plant in Service $20,897,947 $1,756,458 $454,986 ($5,499) $22,193,919
Note -- Detail may not match totals because of necessary rounding.
1/ See Tables 2.10 and 2.11 for data of individual carriers. The FCC's Accounting Review Order, 14 FCC Rcd 11396 (1999), established stream- lined reporting requirements for mid-sized incumbent local exchange carriers (ILECs) beginning with the1999 reporting year. A mid-sized ILEC is a carrier whose annual operating revenues, either individually or when aggregated with those of any ILEC that it controls, is controlled by, or with which it is under common control, are less than $7 billion. Interexchange carriers are not required to file comprehensive reports with the Commission; however, limited information for such carriers with operating revenues at or above the 2000 reporting threshold of $117 million are included in Tables 1.2 through 2.1. Blank spaces denote the ILEC accounts that have been deleted to reflect the new streamlined reporting requirements.2/ Discrepancies between last year's ending balance and this year's beginning balances are due to additions, deletions, and mergers of reporting carriers.
44
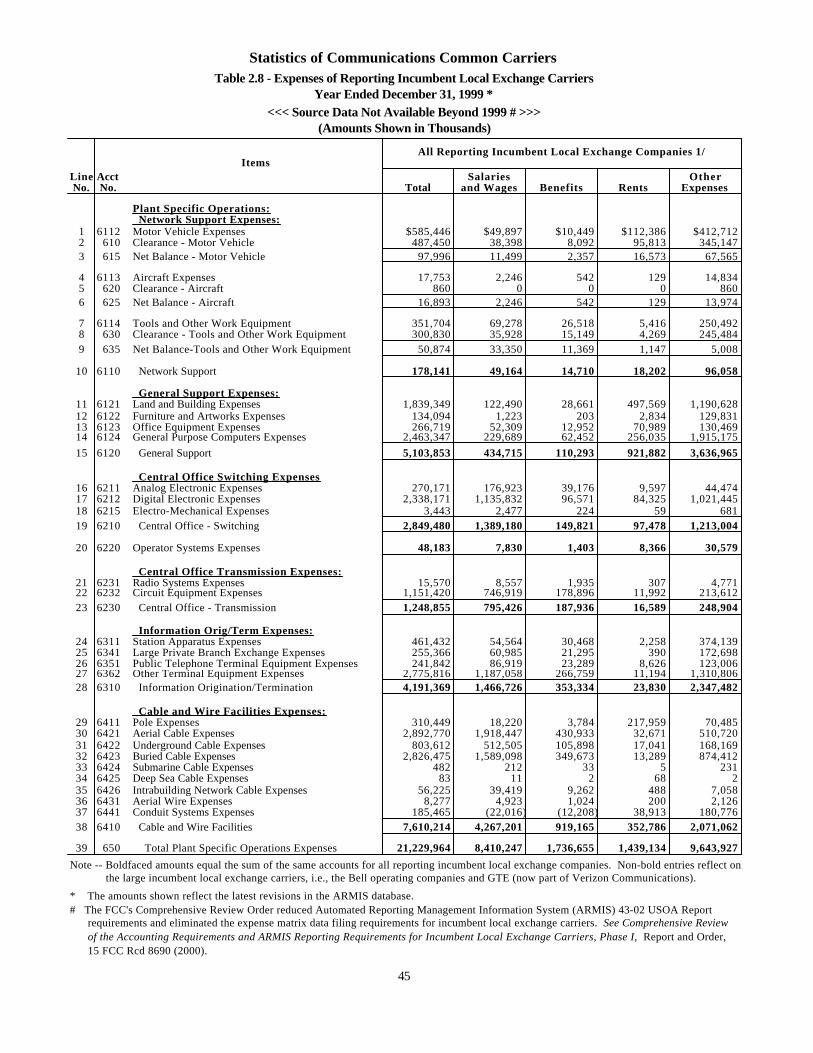
Statistics of Communications Common CarriersTable 2.8 - Expenses of Reporting Incumbent Local Exchange Carriers
Year Ended December 31, 1999 *<<< Source Data Not Available Beyond 1999 # >>>
(Amounts Shown in Thousands)
All Reporting Incumbent Local Exchange Companies 1/Items
Line Acct Salaries OtherNo. No. Total and Wages Benefits Rents Expenses
Plant Specific Operations: Network Support Expenses:
1 6112 Motor Vehicle Expenses $585,446 $49,897 $10,449 $112,386 $412,712 2 610 Clearance - Motor Vehicle 487,450 38,398 8,092 95,813 345,147 3 615 Net Balance - Motor Vehicle 97,996 11,499 2,357 16,573 67,565
4 6113 Aircraft Expenses 17,753 2,246 542 129 14,834 5 620 Clearance - Aircraft 860 0 0 0 860 6 625 Net Balance - Aircraft 16,893 2,246 542 129 13,974
7 6114 Tools and Other Work Equipment 351,704 69,278 26,518 5,416 250,492 8 630 Clearance - Tools and Other Work Equipment 300,830 35,928 15,149 4,269 245,484 9 635 Net Balance-Tools and Other Work Equipment 50,874 33,350 11,369 1,147 5,008
10 6110 Network Support 178,141 49,164 14,710 18,202 96,058
General Support Expenses: 11 6121 Land and Building Expenses 1,839,349 122,490 28,661 497,569 1,190,628 12 6122 Furniture and Artworks Expenses 134,094 1,223 203 2,834 129,831 13 6123 Office Equipment Expenses 266,719 52,309 12,952 70,989 130,469 14 6124 General Purpose Computers Expenses 2,463,347 229,689 62,452 256,035 1,915,175
15 6120 General Support 5,103,853 434,715 110,293 921,882 3,636,965
Central Office Switching Expenses 16 6211 Analog Electronic Expenses 270,171 176,923 39,176 9,597 44,474 17 6212 Digital Electronic Expenses 2,338,171 1,135,832 96,571 84,325 1,021,445 18 6215 Electro-Mechanical Expenses 3,443 2,477 224 59 681 19 6210 Central Office - Switching 2,849,480 1,389,180 149,821 97,478 1,213,004
20 6220 Operator Systems Expenses 48,183 7,830 1,403 8,366 30,579
Central Office Transmission Expenses: 21 6231 Radio Systems Expenses 15,570 8,557 1,935 307 4,771 22 6232 Circuit Equipment Expenses 1,151,420 746,919 178,896 11,992 213,612 23 6230 Central Office - Transmission 1,248,855 795,426 187,936 16,589 248,904
Information Orig/Term Expenses: 24 6311 Station Apparatus Expenses 461,432 54,564 30,468 2,258 374,139 25 6341 Large Private Branch Exchange Expenses 255,366 60,985 21,295 390 172,698 26 6351 Public Telephone Terminal Equipment Expenses 241,842 86,919 23,289 8,626 123,006 27 6362 Other Terminal Equipment Expenses 2,775,816 1,187,058 266,759 11,194 1,310,806 28 6310 Information Origination/Termination 4,191,369 1,466,726 353,334 23,830 2,347,482
Cable and Wire Facilities Expenses: 29 6411 Pole Expenses 310,449 18,220 3,784 217,959 70,485 30 6421 Aerial Cable Expenses 2,892,770 1,918,447 430,933 32,671 510,720 31 6422 Underground Cable Expenses 803,612 512,505 105,898 17,041 168,169 32 6423 Buried Cable Expenses 2,826,475 1,589,098 349,673 13,289 874,412 33 6424 Submarine Cable Expenses 482 212 33 5 231 34 6425 Deep Sea Cable Expenses 83 11 2 68 2 35 6426 Intrabuilding Network Cable Expenses 56,225 39,419 9,262 488 7,058 36 6431 Aerial Wire Expenses 8,277 4,923 1,024 200 2,126 37 6441 Conduit Systems Expenses 185,465 (22,016) (12,208) 38,913 180,776 38 6410 Cable and Wire Facilities 7,610,214 4,267,201 919,165 352,786 2,071,062
39 650 Total Plant Specific Operations Expenses 21,229,964 8,410,247 1,736,655 1,439,134 9,643,927
Note -- Boldfaced amounts equal the sum of the same accounts for all reporting incumbent local exchange companies. Non-bold entries reflect only the large incumbent local exchange carriers, i.e., the Bell operating companies and GTE (now part of Verizon Communications).
* The amounts shown reflect the latest revisions in the ARMIS database.# The FCC's Comprehensive Review Order reduced Automated Reporting Management Information System (ARMIS) 43-02 USOA Report requirements and eliminated the expense matrix data filing requirements for incumbent local exchange carriers. See Comprehensive Review of the Accounting Requirements and ARMIS Reporting Requirements for Incumbent Local Exchange Carriers, Phase I, Report and Order, 15 FCC Rcd 8690 (2000).
45
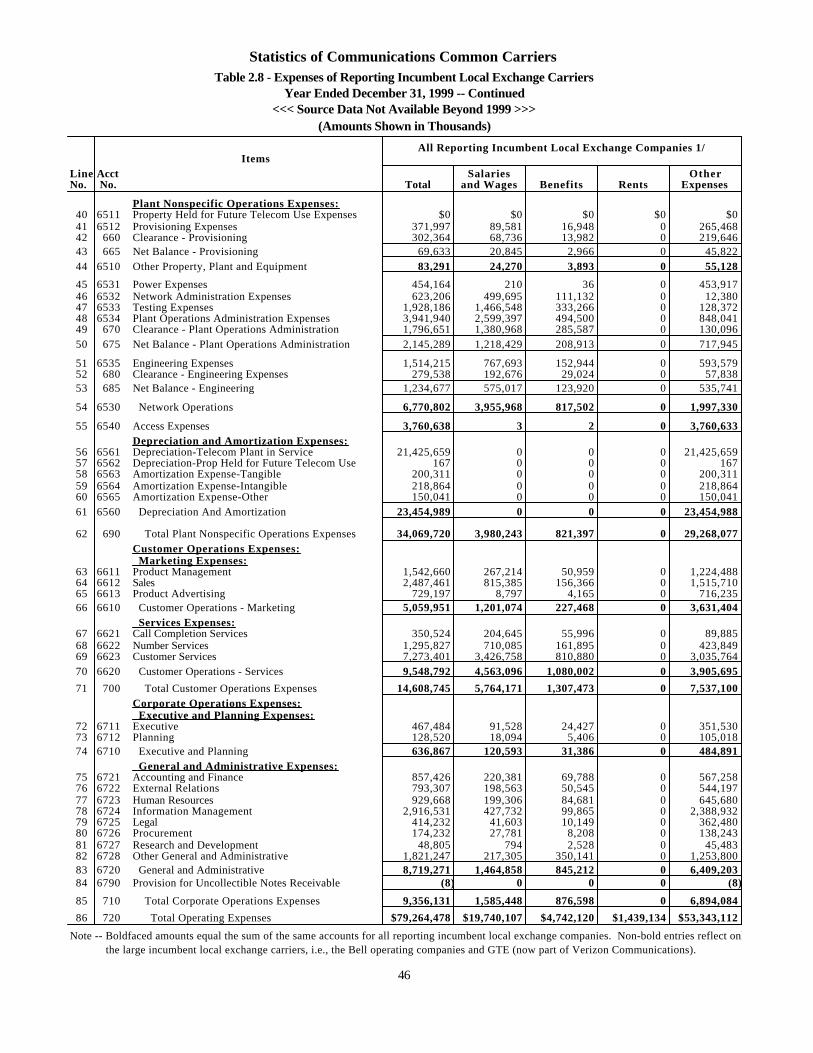
Statistics of Communications Common CarriersTable 2.8 - Expenses of Reporting Incumbent Local Exchange Carriers
Year Ended December 31, 1999 -- Continued<<< Source Data Not Available Beyond 1999 >>>
(Amounts Shown in Thousands)
All Reporting Incumbent Local Exchange Companies 1/Items
Line Acct Salaries OtherNo. No. Total and Wages Benefits Rents Expenses
Plant Nonspecific Operations Expenses: 40 6511 Property Held for Future Telecom Use Expenses $0 $0 $0 $0 $0 41 6512 Provisioning Expenses 371,997 89,581 16,948 0 265,468 42 660 Clearance - Provisioning 302,364 68,736 13,982 0 219,646 43 665 Net Balance - Provisioning 69,633 20,845 2,966 0 45,822 44 6510 Other Property, Plant and Equipment 83,291 24,270 3,893 0 55,128
45 6531 Power Expenses 454,164 210 36 0 453,917 46 6532 Network Administration Expenses 623,206 499,695 111,132 0 12,380 47 6533 Testing Expenses 1,928,186 1,466,548 333,266 0 128,372 48 6534 Plant Operations Administration Expenses 3,941,940 2,599,397 494,500 0 848,041 49 670 Clearance - Plant Operations Administration 1,796,651 1,380,968 285,587 0 130,096 50 675 Net Balance - Plant Operations Administration 2,145,289 1,218,429 208,913 0 717,945
51 6535 Engineering Expenses 1,514,215 767,693 152,944 0 593,579 52 680 Clearance - Engineering Expenses 279,538 192,676 29,024 0 57,838 53 685 Net Balance - Engineering 1,234,677 575,017 123,920 0 535,741
54 6530 Network Operations 6,770,802 3,955,968 817,502 0 1,997,330
55 6540 Access Expenses 3,760,638 3 2 0 3,760,633Depreciation and Amortization Expenses:
56 6561 Depreciation-Telecom Plant in Service 21,425,659 0 0 0 21,425,659 57 6562 Depreciation-Prop Held for Future Telecom Use 167 0 0 0 167 58 6563 Amortization Expense-Tangible 200,311 0 0 0 200,311 59 6564 Amortization Expense-Intangible 218,864 0 0 0 218,864 60 6565 Amortization Expense-Other 150,041 0 0 0 150,041 61 6560 Depreciation And Amortization 23,454,989 0 0 0 23,454,988
62 690 Total Plant Nonspecific Operations Expenses 34,069,720 3,980,243 821,397 0 29,268,077Customer Operations Expenses: Marketing Expenses:
63 6611 Product Management 1,542,660 267,214 50,959 0 1,224,488 64 6612 Sales 2,487,461 815,385 156,366 0 1,515,710 65 6613 Product Advertising 729,197 8,797 4,165 0 716,235 66 6610 Customer Operations - Marketing 5,059,951 1,201,074 227,468 0 3,631,404
Services Expenses: 67 6621 Call Completion Services 350,524 204,645 55,996 0 89,885 68 6622 Number Services 1,295,827 710,085 161,895 0 423,849 69 6623 Customer Services 7,273,401 3,426,758 810,880 0 3,035,764 70 6620 Customer Operations - Services 9,548,792 4,563,096 1,080,002 0 3,905,695
71 700 Total Customer Operations Expenses 14,608,745 5,764,171 1,307,473 0 7,537,100Corporate Operations Expenses: Executive and Planning Expenses:
72 6711 Executive 467,484 91,528 24,427 0 351,530 73 6712 Planning 128,520 18,094 5,406 0 105,018 74 6710 Executive and Planning 636,867 120,593 31,386 0 484,891
General and Administrative Expenses: 75 6721 Accounting and Finance 857,426 220,381 69,788 0 567,258 76 6722 External Relations 793,307 198,563 50,545 0 544,197 77 6723 Human Resources 929,668 199,306 84,681 0 645,680 78 6724 Information Management 2,916,531 427,732 99,865 0 2,388,932 79 6725 Legal 414,232 41,603 10,149 0 362,480 80 6726 Procurement 174,232 27,781 8,208 0 138,243 81 6727 Research and Development 48,805 794 2,528 0 45,483 82 6728 Other General and Administrative 1,821,247 217,305 350,141 0 1,253,800 83 6720 General and Administrative 8,719,271 1,464,858 845,212 0 6,409,203 84 6790 Provision for Uncollectible Notes Receivable (8) 0 0 0 (8)
85 710 Total Corporate Operations Expenses 9,356,131 1,585,448 876,598 0 6,894,084
86 720 Total Operating Expenses $79,264,478 $19,740,107 $4,742,120 $1,439,134 $53,343,112
Note -- Boldfaced amounts equal the sum of the same accounts for all reporting incumbent local exchange companies. Non-bold entries reflect only the large incumbent local exchange carriers, i.e., the Bell operating companies and GTE (now part of Verizon Communications).
46
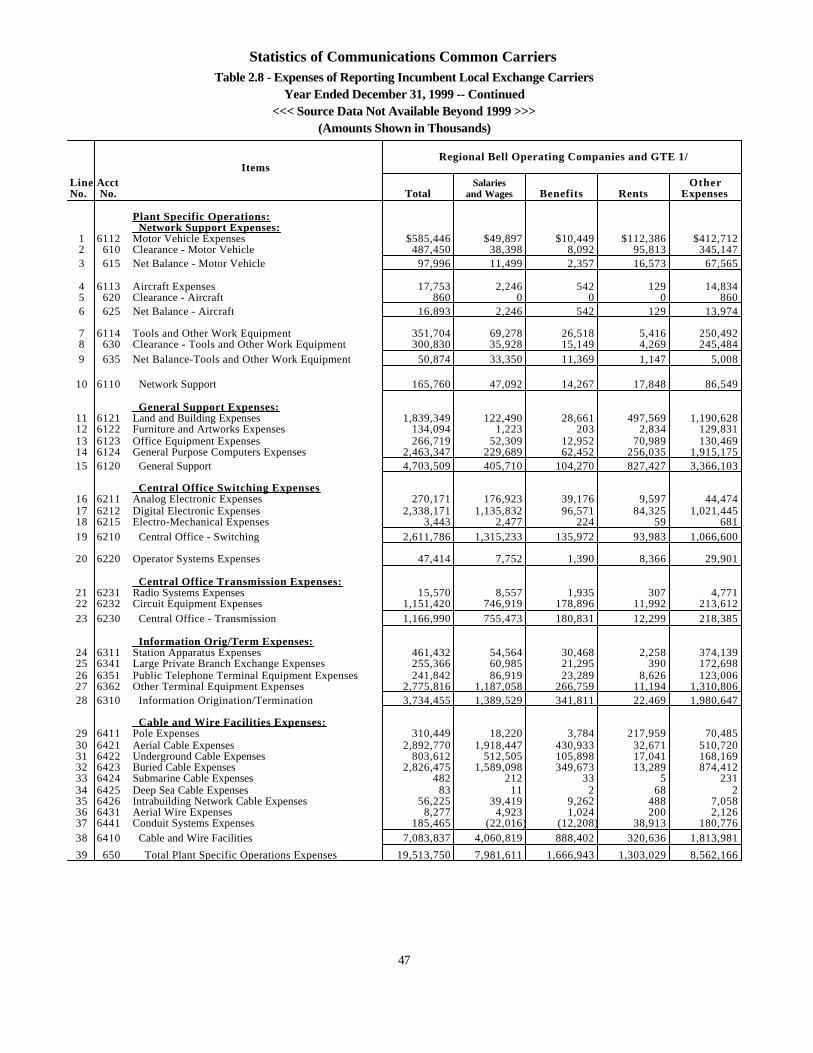
Statistics of Communications Common CarriersTable 2.8 - Expenses of Reporting Incumbent Local Exchange Carriers
Year Ended December 31, 1999 -- Continued<<< Source Data Not Available Beyond 1999 >>>
(Amounts Shown in Thousands)
Regional Bell Operating Companies and GTE 1/Items
Line Acct Salaries OtherNo. No. Total and Wages Benefits Rents Expenses
Plant Specific Operations: Network Support Expenses:
1 6112 Motor Vehicle Expenses $585,446 $49,897 $10,449 $112,386 $412,712 2 610 Clearance - Motor Vehicle 487,450 38,398 8,092 95,813 345,147 3 615 Net Balance - Motor Vehicle 97,996 11,499 2,357 16,573 67,565
4 6113 Aircraft Expenses 17,753 2,246 542 129 14,834 5 620 Clearance - Aircraft 860 0 0 0 860 6 625 Net Balance - Aircraft 16,893 2,246 542 129 13,974
7 6114 Tools and Other Work Equipment 351,704 69,278 26,518 5,416 250,492 8 630 Clearance - Tools and Other Work Equipment 300,830 35,928 15,149 4,269 245,484 9 635 Net Balance-Tools and Other Work Equipment 50,874 33,350 11,369 1,147 5,008
10 6110 Network Support 165,760 47,092 14,267 17,848 86,549
General Support Expenses: 11 6121 Land and Building Expenses 1,839,349 122,490 28,661 497,569 1,190,628 12 6122 Furniture and Artworks Expenses 134,094 1,223 203 2,834 129,831 13 6123 Office Equipment Expenses 266,719 52,309 12,952 70,989 130,469 14 6124 General Purpose Computers Expenses 2,463,347 229,689 62,452 256,035 1,915,175 15 6120 General Support 4,703,509 405,710 104,270 827,427 3,366,103
Central Office Switching Expenses 16 6211 Analog Electronic Expenses 270,171 176,923 39,176 9,597 44,474 17 6212 Digital Electronic Expenses 2,338,171 1,135,832 96,571 84,325 1,021,445 18 6215 Electro-Mechanical Expenses 3,443 2,477 224 59 681 19 6210 Central Office - Switching 2,611,786 1,315,233 135,972 93,983 1,066,600
20 6220 Operator Systems Expenses 47,414 7,752 1,390 8,366 29,901
Central Office Transmission Expenses: 21 6231 Radio Systems Expenses 15,570 8,557 1,935 307 4,771 22 6232 Circuit Equipment Expenses 1,151,420 746,919 178,896 11,992 213,612 23 6230 Central Office - Transmission 1,166,990 755,473 180,831 12,299 218,385
Information Orig/Term Expenses: 24 6311 Station Apparatus Expenses 461,432 54,564 30,468 2,258 374,139 25 6341 Large Private Branch Exchange Expenses 255,366 60,985 21,295 390 172,698 26 6351 Public Telephone Terminal Equipment Expenses 241,842 86,919 23,289 8,626 123,006 27 6362 Other Terminal Equipment Expenses 2,775,816 1,187,058 266,759 11,194 1,310,806 28 6310 Information Origination/Termination 3,734,455 1,389,529 341,811 22,469 1,980,647
Cable and Wire Facilities Expenses: 29 6411 Pole Expenses 310,449 18,220 3,784 217,959 70,485 30 6421 Aerial Cable Expenses 2,892,770 1,918,447 430,933 32,671 510,720 31 6422 Underground Cable Expenses 803,612 512,505 105,898 17,041 168,169 32 6423 Buried Cable Expenses 2,826,475 1,589,098 349,673 13,289 874,412 33 6424 Submarine Cable Expenses 482 212 33 5 231 34 6425 Deep Sea Cable Expenses 83 11 2 68 2 35 6426 Intrabuilding Network Cable Expenses 56,225 39,419 9,262 488 7,058 36 6431 Aerial Wire Expenses 8,277 4,923 1,024 200 2,126 37 6441 Conduit Systems Expenses 185,465 (22,016) (12,208) 38,913 180,776 38 6410 Cable and Wire Facilities 7,083,837 4,060,819 888,402 320,636 1,813,981
39 650 Total Plant Specific Operations Expenses 19,513,750 7,981,611 1,666,943 1,303,029 8,562,166
47
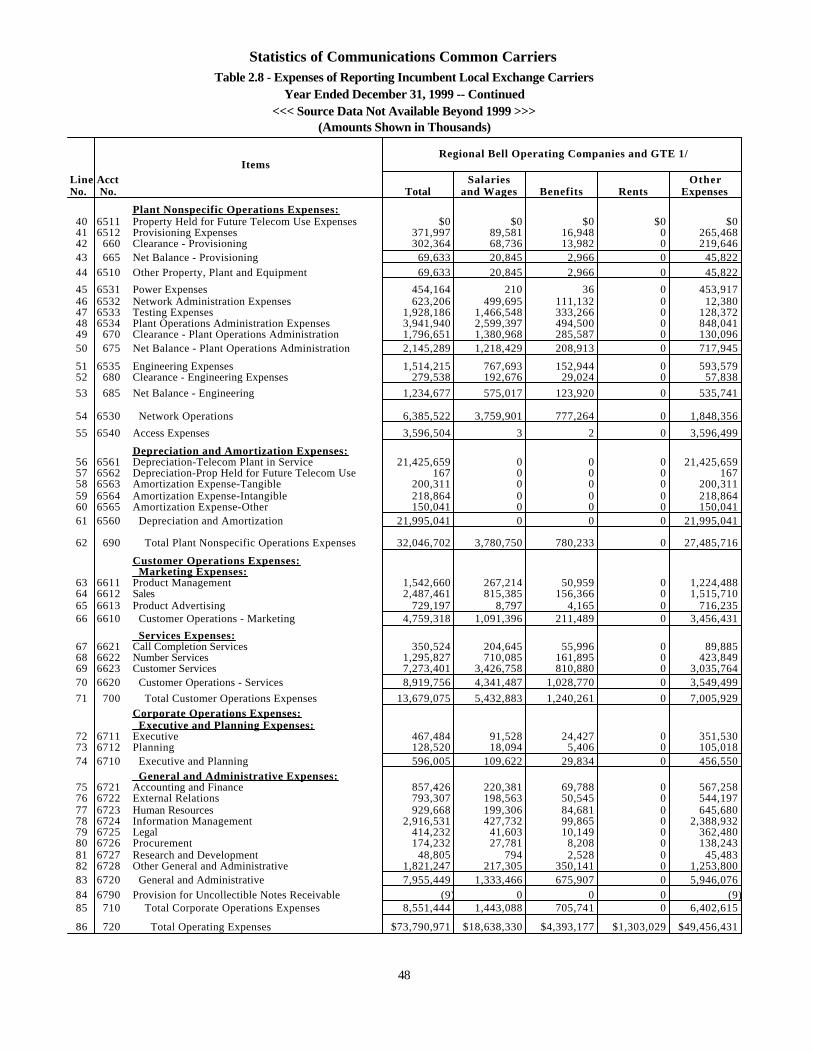
Statistics of Communications Common CarriersTable 2.8 - Expenses of Reporting Incumbent Local Exchange Carriers
Year Ended December 31, 1999 -- Continued<<< Source Data Not Available Beyond 1999 >>>
(Amounts Shown in Thousands)
Regional Bell Operating Companies and GTE 1/Items
Line Acct Salaries OtherNo. No. Total and Wages Benefits Rents Expenses
Plant Nonspecific Operations Expenses: 40 6511 Property Held for Future Telecom Use Expenses $0 $0 $0 $0 $0 41 6512 Provisioning Expenses 371,997 89,581 16,948 0 265,468 42 660 Clearance - Provisioning 302,364 68,736 13,982 0 219,646 43 665 Net Balance - Provisioning 69,633 20,845 2,966 0 45,822 44 6510 Other Property, Plant and Equipment 69,633 20,845 2,966 0 45,822
45 6531 Power Expenses 454,164 210 36 0 453,917 46 6532 Network Administration Expenses 623,206 499,695 111,132 0 12,380 47 6533 Testing Expenses 1,928,186 1,466,548 333,266 0 128,372 48 6534 Plant Operations Administration Expenses 3,941,940 2,599,397 494,500 0 848,041 49 670 Clearance - Plant Operations Administration 1,796,651 1,380,968 285,587 0 130,096 50 675 Net Balance - Plant Operations Administration 2,145,289 1,218,429 208,913 0 717,945
51 6535 Engineering Expenses 1,514,215 767,693 152,944 0 593,579 52 680 Clearance - Engineering Expenses 279,538 192,676 29,024 0 57,838
53 685 Net Balance - Engineering 1,234,677 575,017 123,920 0 535,741
54 6530 Network Operations 6,385,522 3,759,901 777,264 0 1,848,356
55 6540 Access Expenses 3,596,504 3 2 0 3,596,499
Depreciation and Amortization Expenses: 56 6561 Depreciation-Telecom Plant in Service 21,425,659 0 0 0 21,425,659 57 6562 Depreciation-Prop Held for Future Telecom Use 167 0 0 0 167 58 6563 Amortization Expense-Tangible 200,311 0 0 0 200,311 59 6564 Amortization Expense-Intangible 218,864 0 0 0 218,864 60 6565 Amortization Expense-Other 150,041 0 0 0 150,041 61 6560 Depreciation and Amortization 21,995,041 0 0 0 21,995,041
62 690 Total Plant Nonspecific Operations Expenses 32,046,702 3,780,750 780,233 0 27,485,716
Customer Operations Expenses: Marketing Expenses:
63 6611 Product Management 1,542,660 267,214 50,959 0 1,224,488 64 6612 Sales 2,487,461 815,385 156,366 0 1,515,710 65 6613 Product Advertising 729,197 8,797 4,165 0 716,235 66 6610 Customer Operations - Marketing 4,759,318 1,091,396 211,489 0 3,456,431
Services Expenses: 67 6621 Call Completion Services 350,524 204,645 55,996 0 89,885 68 6622 Number Services 1,295,827 710,085 161,895 0 423,849 69 6623 Customer Services 7,273,401 3,426,758 810,880 0 3,035,764 70 6620 Customer Operations - Services 8,919,756 4,341,487 1,028,770 0 3,549,499
71 700 Total Customer Operations Expenses 13,679,075 5,432,883 1,240,261 0 7,005,929Corporate Operations Expenses: Executive and Planning Expenses:
72 6711 Executive 467,484 91,528 24,427 0 351,530 73 6712 Planning 128,520 18,094 5,406 0 105,018 74 6710 Executive and Planning 596,005 109,622 29,834 0 456,550
General and Administrative Expenses: 75 6721 Accounting and Finance 857,426 220,381 69,788 0 567,258 76 6722 External Relations 793,307 198,563 50,545 0 544,197 77 6723 Human Resources 929,668 199,306 84,681 0 645,680 78 6724 Information Management 2,916,531 427,732 99,865 0 2,388,932 79 6725 Legal 414,232 41,603 10,149 0 362,480 80 6726 Procurement 174,232 27,781 8,208 0 138,243 81 6727 Research and Development 48,805 794 2,528 0 45,483 82 6728 Other General and Administrative 1,821,247 217,305 350,141 0 1,253,800 83 6720 General and Administrative 7,955,449 1,333,466 675,907 0 5,946,076 84 6790 Provision for Uncollectible Notes Receivable (9) 0 0 0 (9) 85 710 Total Corporate Operations Expenses 8,551,444 1,443,088 705,741 0 6,402,615
86 720 Total Operating Expenses $73,790,971 $18,638,330 $4,393,177 $1,303,029 $49,456,431
48
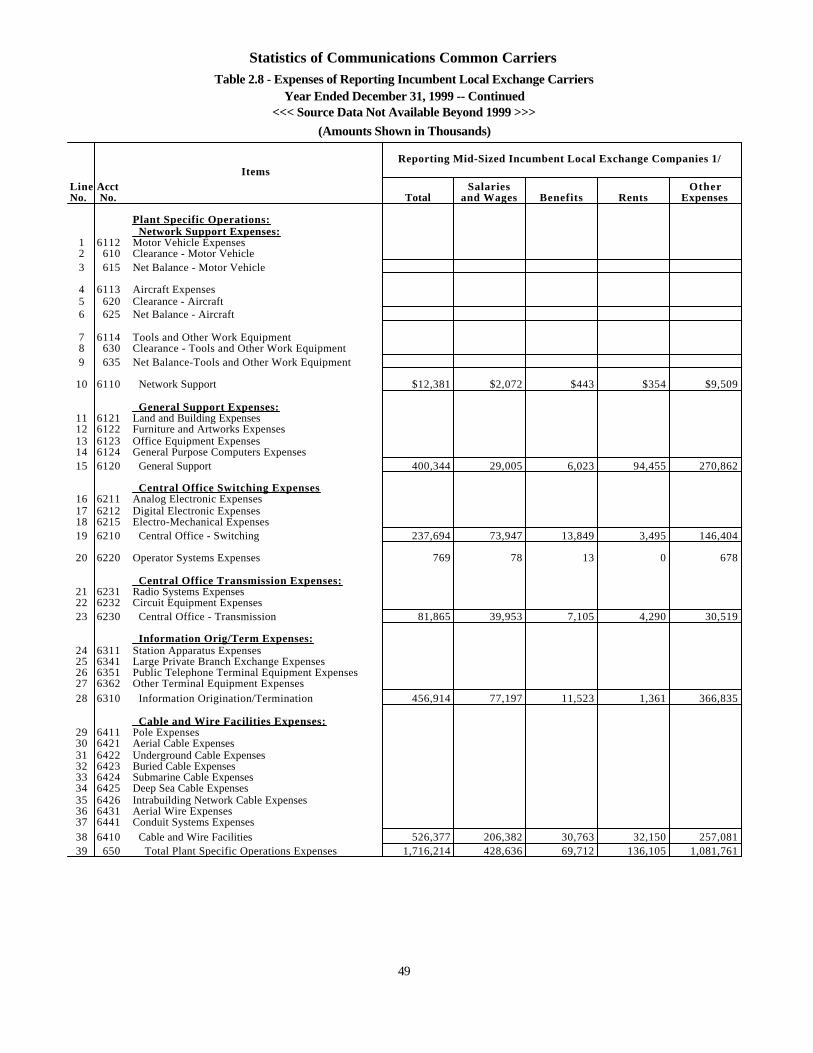
Statistics of Communications Common CarriersTable 2.8 - Expenses of Reporting Incumbent Local Exchange Carriers
Year Ended December 31, 1999 -- Continued<<< Source Data Not Available Beyond 1999 >>>
(Amounts Shown in Thousands)
Reporting Mid-Sized Incumbent Local Exchange Companies 1/ Items
Line Acct Salaries OtherNo. No. Total and Wages Benefits Rents Expenses
Plant Specific Operations: Network Support Expenses:
1 6112 Motor Vehicle Expenses 2 610 Clearance - Motor Vehicle 3 615 Net Balance - Motor Vehicle
4 6113 Aircraft Expenses 5 620 Clearance - Aircraft 6 625 Net Balance - Aircraft
7 6114 Tools and Other Work Equipment 8 630 Clearance - Tools and Other Work Equipment 9 635 Net Balance-Tools and Other Work Equipment
10 6110 Network Support $12,381 $2,072 $443 $354 $9,509
General Support Expenses: 11 6121 Land and Building Expenses 12 6122 Furniture and Artworks Expenses 13 6123 Office Equipment Expenses 14 6124 General Purpose Computers Expenses 15 6120 General Support 400,344 29,005 6,023 94,455 270,862
Central Office Switching Expenses 16 6211 Analog Electronic Expenses 17 6212 Digital Electronic Expenses 18 6215 Electro-Mechanical Expenses 19 6210 Central Office - Switching 237,694 73,947 13,849 3,495 146,404
20 6220 Operator Systems Expenses 769 78 13 0 678
Central Office Transmission Expenses: 21 6231 Radio Systems Expenses 22 6232 Circuit Equipment Expenses 23 6230 Central Office - Transmission 81,865 39,953 7,105 4,290 30,519
Information Orig/Term Expenses: 24 6311 Station Apparatus Expenses 25 6341 Large Private Branch Exchange Expenses 26 6351 Public Telephone Terminal Equipment Expenses 27 6362 Other Terminal Equipment Expenses 28 6310 Information Origination/Termination 456,914 77,197 11,523 1,361 366,835
Cable and Wire Facilities Expenses: 29 6411 Pole Expenses 30 6421 Aerial Cable Expenses 31 6422 Underground Cable Expenses 32 6423 Buried Cable Expenses 33 6424 Submarine Cable Expenses 34 6425 Deep Sea Cable Expenses 35 6426 Intrabuilding Network Cable Expenses 36 6431 Aerial Wire Expenses 37 6441 Conduit Systems Expenses 38 6410 Cable and Wire Facilities 526,377 206,382 30,763 32,150 257,081 39 650 Total Plant Specific Operations Expenses 1,716,214 428,636 69,712 136,105 1,081,761
49
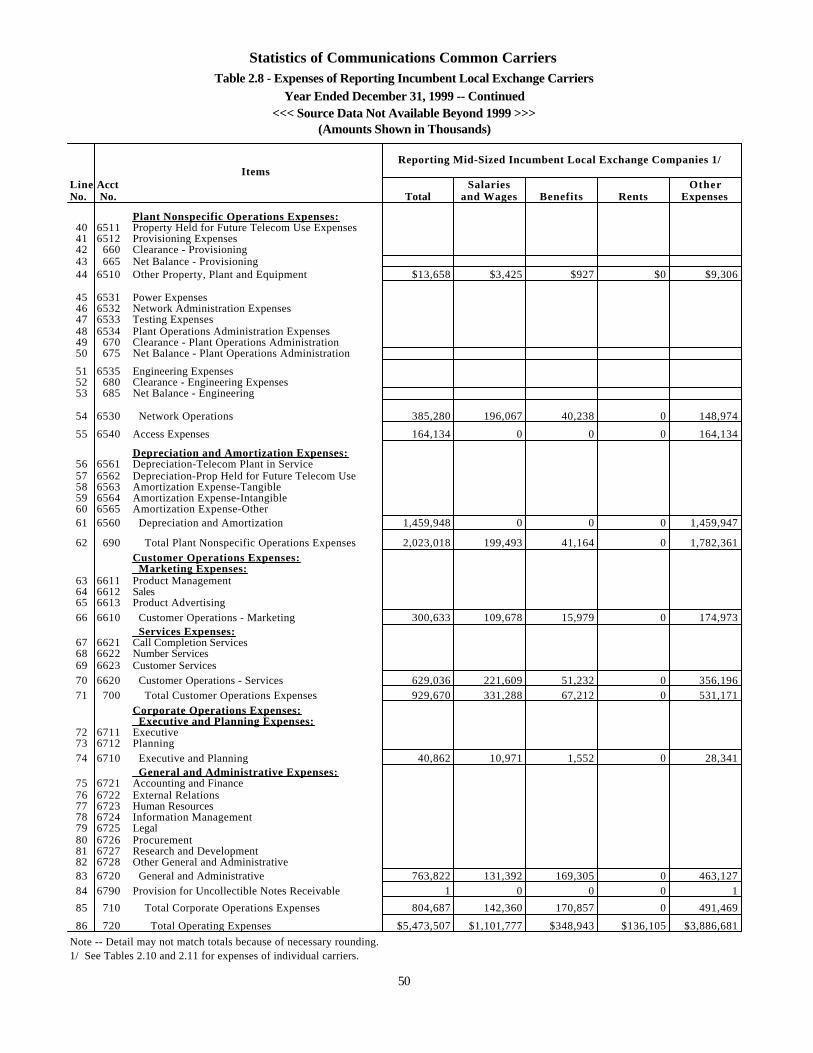
Statistics of Communications Common CarriersTable 2.8 - Expenses of Reporting Incumbent Local Exchange Carriers
Year Ended December 31, 1999 -- Continued<<< Source Data Not Available Beyond 1999 >>>
(Amounts Shown in Thousands)
Reporting Mid-Sized Incumbent Local Exchange Companies 1/ Items
Line Acct Salaries OtherNo. No. Total and Wages Benefits Rents Expenses
Plant Nonspecific Operations Expenses: 40 6511 Property Held for Future Telecom Use Expenses 41 6512 Provisioning Expenses 42 660 Clearance - Provisioning 43 665 Net Balance - Provisioning 44 6510 Other Property, Plant and Equipment $13,658 $3,425 $927 $0 $9,306
45 6531 Power Expenses 46 6532 Network Administration Expenses 47 6533 Testing Expenses 48 6534 Plant Operations Administration Expenses 49 670 Clearance - Plant Operations Administration 50 675 Net Balance - Plant Operations Administration
51 6535 Engineering Expenses 52 680 Clearance - Engineering Expenses 53 685 Net Balance - Engineering
54 6530 Network Operations 385,280 196,067 40,238 0 148,974
55 6540 Access Expenses 164,134 0 0 0 164,134
Depreciation and Amortization Expenses: 56 6561 Depreciation-Telecom Plant in Service 57 6562 Depreciation-Prop Held for Future Telecom Use 58 6563 Amortization Expense-Tangible 59 6564 Amortization Expense-Intangible 60 6565 Amortization Expense-Other 61 6560 Depreciation and Amortization 1,459,948 0 0 0 1,459,947
62 690 Total Plant Nonspecific Operations Expenses 2,023,018 199,493 41,164 0 1,782,361Customer Operations Expenses: Marketing Expenses:
63 6611 Product Management 64 6612 Sales 65 6613 Product Advertising 66 6610 Customer Operations - Marketing 300,633 109,678 15,979 0 174,973
Services Expenses: 67 6621 Call Completion Services 68 6622 Number Services 69 6623 Customer Services 70 6620 Customer Operations - Services 629,036 221,609 51,232 0 356,196 71 700 Total Customer Operations Expenses 929,670 331,288 67,212 0 531,171
Corporate Operations Expenses: Executive and Planning Expenses:
72 6711 Executive 73 6712 Planning 74 6710 Executive and Planning 40,862 10,971 1,552 0 28,341
General and Administrative Expenses: 75 6721 Accounting and Finance 76 6722 External Relations 77 6723 Human Resources 78 6724 Information Management 79 6725 Legal 80 6726 Procurement 81 6727 Research and Development 82 6728 Other General and Administrative 83 6720 General and Administrative 763,822 131,392 169,305 0 463,127 84 6790 Provision for Uncollectible Notes Receivable 1 0 0 0 1
85 710 Total Corporate Operations Expenses 804,687 142,360 170,857 0 491,469
86 720 Total Operating Expenses $5,473,507 $1,101,777 $348,943 $136,105 $3,886,681
Note -- Detail may not match totals because of necessary rounding.1/ See Tables 2.10 and 2.11 for expenses of individual carriers.
50
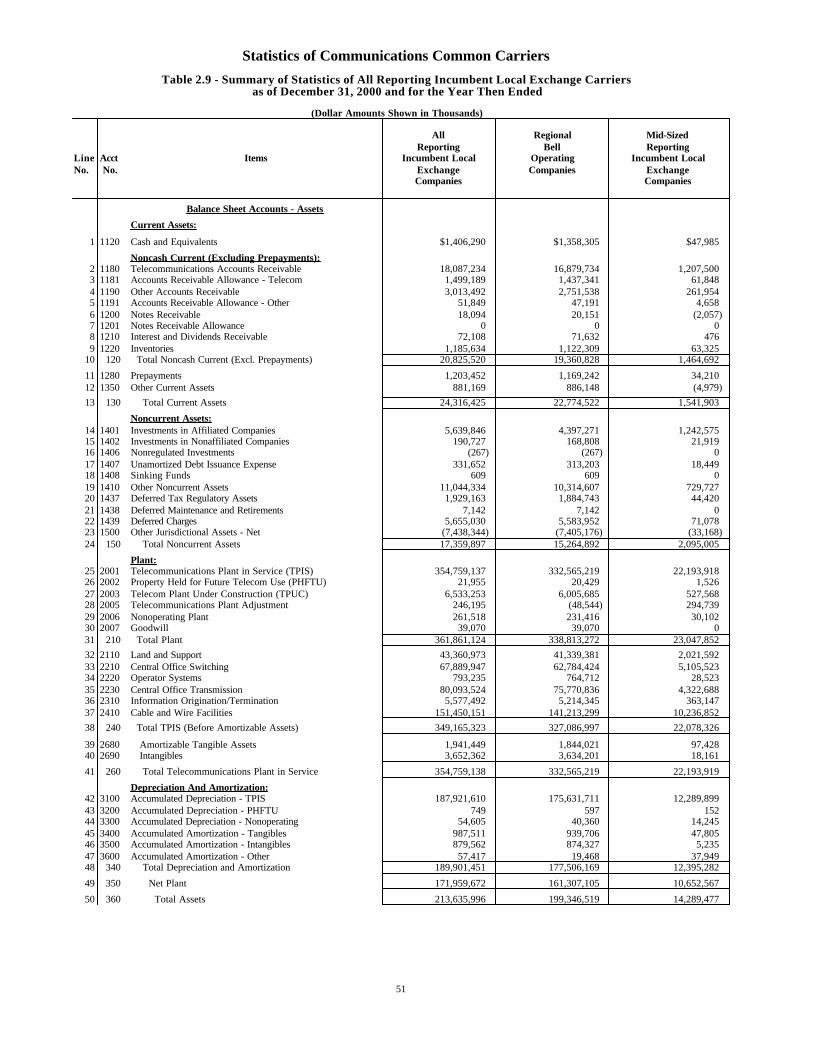
Statistics of Communications Common Carriers
Table 2.9 - Summary of Statistics of All Reporting Incumbent Local Exchange Carriersas of December 31, 2000 and for the Year Then Ended
(Dollar Amounts Shown in Thousands)
All Regional Mid-SizedReporting Bell Reporting
Line Acct Items Incumbent Local Operating Incumbent LocalNo. No. Exchange Companies Exchange
Companies Companies
Balance Sheet Accounts - Assets
Current Assets:
1 1120 Cash and Equivalents $1,406,290 $1,358,305 $47,985
Noncash Current (Excluding Prepayments):2 1180 Telecommunications Accounts Receivable 18,087,234 16,879,734 1,207,5003 1181 Accounts Receivable Allowance - Telecom 1,499,189 1,437,341 61,8484 1190 Other Accounts Receivable 3,013,492 2,751,538 261,9545 1191 Accounts Receivable Allowance - Other 51,849 47,191 4,6586 1200 Notes Receivable 18,094 20,151 (2,057)7 1201 Notes Receivable Allowance 0 0 08 1210 Interest and Dividends Receivable 72,108 71,632 4769 1220 Inventories 1,185,634 1,122,309 63,325
10 120 Total Noncash Current (Excl. Prepayments) 20,825,520 19,360,828 1,464,692
11 1280 Prepayments 1,203,452 1,169,242 34,21012 1350 Other Current Assets 881,169 886,148 (4,979)
13 130 Total Current Assets 24,316,425 22,774,522 1,541,903
Noncurrent Assets:14 1401 Investments in Affiliated Companies 5,639,846 4,397,271 1,242,57515 1402 Investments in Nonaffiliated Companies 190,727 168,808 21,91916 1406 Nonregulated Investments (267) (267) 017 1407 Unamortized Debt Issuance Expense 331,652 313,203 18,44918 1408 Sinking Funds 609 609 019 1410 Other Noncurrent Assets 11,044,334 10,314,607 729,72720 1437 Deferred Tax Regulatory Assets 1,929,163 1,884,743 44,42021 1438 Deferred Maintenance and Retirements 7,142 7,142 022 1439 Deferred Charges 5,655,030 5,583,952 71,07823 1500 Other Jurisdictional Assets - Net (7,438,344) (7,405,176) (33,168)24 150 Total Noncurrent Assets 17,359,897 15,264,892 2,095,005
Plant:25 2001 Telecommunications Plant in Service (TPIS) 354,759,137 332,565,219 22,193,91826 2002 Property Held for Future Telecom Use (PHFTU) 21,955 20,429 1,52627 2003 Telecom Plant Under Construction (TPUC) 6,533,253 6,005,685 527,56828 2005 Telecommunications Plant Adjustment 246,195 (48,544) 294,73929 2006 Nonoperating Plant 261,518 231,416 30,10230 2007 Goodwill 39,070 39,070 031 210 Total Plant 361,861,124 338,813,272 23,047,852
32 2110 Land and Support 43,360,973 41,339,381 2,021,59233 2210 Central Office Switching 67,889,947 62,784,424 5,105,52334 2220 Operator Systems 793,235 764,712 28,52335 2230 Central Office Transmission 80,093,524 75,770,836 4,322,68836 2310 Information Origination/Termination 5,577,492 5,214,345 363,14737 2410 Cable and Wire Facilities 151,450,151 141,213,299 10,236,852
38 240 Total TPIS (Before Amortizable Assets) 349,165,323 327,086,997 22,078,326
39 2680 Amortizable Tangible Assets 1,941,449 1,844,021 97,42840 2690 Intangibles 3,652,362 3,634,201 18,161
41 260 Total Telecommunications Plant in Service 354,759,138 332,565,219 22,193,919
Depreciation And Amortization:42 3100 Accumulated Depreciation - TPIS 187,921,610 175,631,711 12,289,89943 3200 Accumulated Depreciation - PHFTU 749 597 15244 3300 Accumulated Depreciation - Nonoperating 54,605 40,360 14,24545 3400 Accumulated Amortization - Tangibles 987,511 939,706 47,80546 3500 Accumulated Amortization - Intangibles 879,562 874,327 5,23547 3600 Accumulated Amortization - Other 57,417 19,468 37,94948 340 Total Depreciation and Amortization 189,901,451 177,506,169 12,395,282
49 350 Net Plant 171,959,672 161,307,105 10,652,567
50 360 Total Assets 213,635,996 199,346,519 14,289,477
51
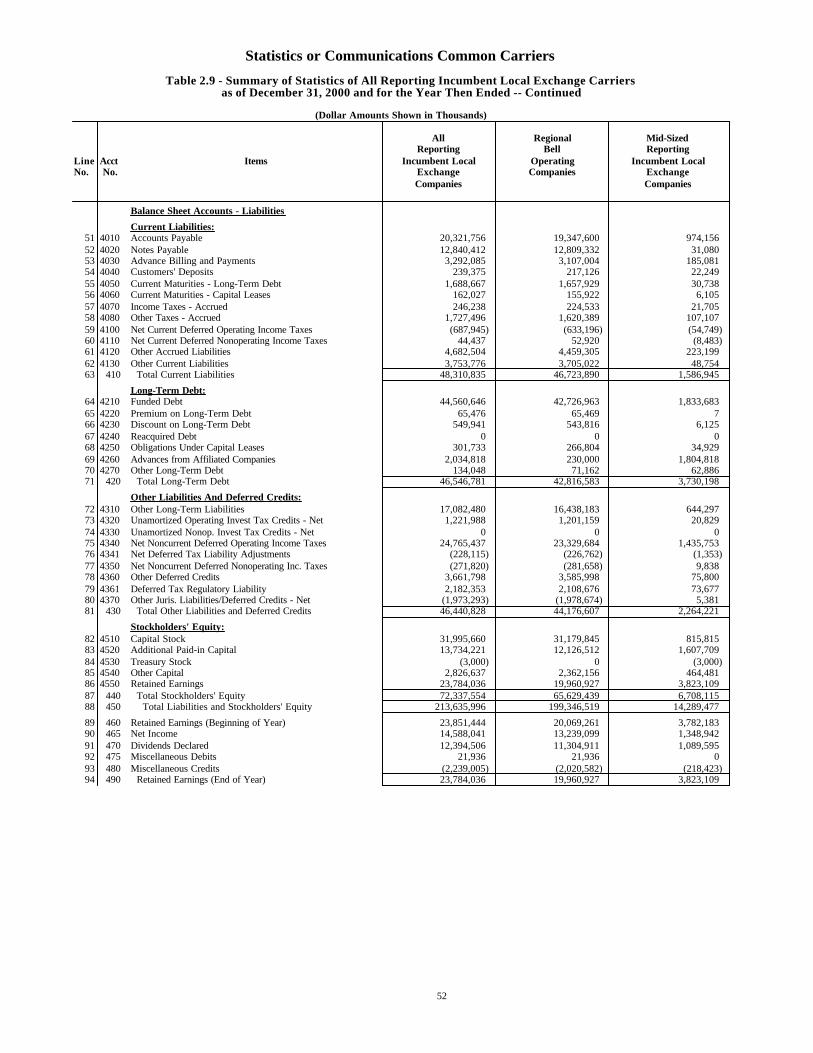
Statistics or Communications Common Carriers
Table 2.9 - Summary of Statistics of All Reporting Incumbent Local Exchange Carriersas of December 31, 2000 and for the Year Then Ended -- Continued
(Dollar Amounts Shown in Thousands)
All Regional Mid-SizedReporting Bell Reporting
Line Acct Items Incumbent Local Operating Incumbent LocalNo. No. Exchange Companies Exchange
Companies Companies
Balance Sheet Accounts - Liabilities
Current Liabilities:51 4010 Accounts Payable 20,321,756 19,347,600 974,15652 4020 Notes Payable 12,840,412 12,809,332 31,08053 4030 Advance Billing and Payments 3,292,085 3,107,004 185,08154 4040 Customers' Deposits 239,375 217,126 22,24955 4050 Current Maturities - Long-Term Debt 1,688,667 1,657,929 30,73856 4060 Current Maturities - Capital Leases 162,027 155,922 6,10557 4070 Income Taxes - Accrued 246,238 224,533 21,70558 4080 Other Taxes - Accrued 1,727,496 1,620,389 107,10759 4100 Net Current Deferred Operating Income Taxes (687,945) (633,196) (54,749)60 4110 Net Current Deferred Nonoperating Income Taxes 44,437 52,920 (8,483)61 4120 Other Accrued Liabilities 4,682,504 4,459,305 223,19962 4130 Other Current Liabilities 3,753,776 3,705,022 48,75463 410 Total Current Liabilities 48,310,835 46,723,890 1,586,945
Long-Term Debt:64 4210 Funded Debt 44,560,646 42,726,963 1,833,68365 4220 Premium on Long-Term Debt 65,476 65,469 766 4230 Discount on Long-Term Debt 549,941 543,816 6,12567 4240 Reacquired Debt 0 0 068 4250 Obligations Under Capital Leases 301,733 266,804 34,92969 4260 Advances from Affiliated Companies 2,034,818 230,000 1,804,81870 4270 Other Long-Term Debt 134,048 71,162 62,88671 420 Total Long-Term Debt 46,546,781 42,816,583 3,730,198
Other Liabilities And Deferred Credits:72 4310 Other Long-Term Liabilities 17,082,480 16,438,183 644,29773 4320 Unamortized Operating Invest Tax Credits - Net 1,221,988 1,201,159 20,82974 4330 Unamortized Nonop. Invest Tax Credits - Net 0 0 075 4340 Net Noncurrent Deferred Operating Income Taxes 24,765,437 23,329,684 1,435,75376 4341 Net Deferred Tax Liability Adjustments (228,115) (226,762) (1,353)77 4350 Net Noncurrent Deferred Nonoperating Inc. Taxes (271,820) (281,658) 9,83878 4360 Other Deferred Credits 3,661,798 3,585,998 75,80079 4361 Deferred Tax Regulatory Liability 2,182,353 2,108,676 73,67780 4370 Other Juris. Liabilities/Deferred Credits - Net (1,973,293) (1,978,674) 5,38181 430 Total Other Liabilities and Deferred Credits 46,440,828 44,176,607 2,264,221
Stockholders' Equity:82 4510 Capital Stock 31,995,660 31,179,845 815,81583 4520 Additional Paid-in Capital 13,734,221 12,126,512 1,607,70984 4530 Treasury Stock (3,000) 0 (3,000)85 4540 Other Capital 2,826,637 2,362,156 464,48186 4550 Retained Earnings 23,784,036 19,960,927 3,823,10987 440 Total Stockholders' Equity 72,337,554 65,629,439 6,708,11588 450 Total Liabilities and Stockholders' Equity 213,635,996 199,346,519 14,289,477
89 460 Retained Earnings (Beginning of Year) 23,851,444 20,069,261 3,782,18390 465 Net Income 14,588,041 13,239,099 1,348,94291 470 Dividends Declared 12,394,506 11,304,911 1,089,59592 475 Miscellaneous Debits 21,936 21,936 093 480 Miscellaneous Credits (2,239,005) (2,020,582) (218,423)94 490 Retained Earnings (End of Year) 23,784,036 19,960,927 3,823,109
52
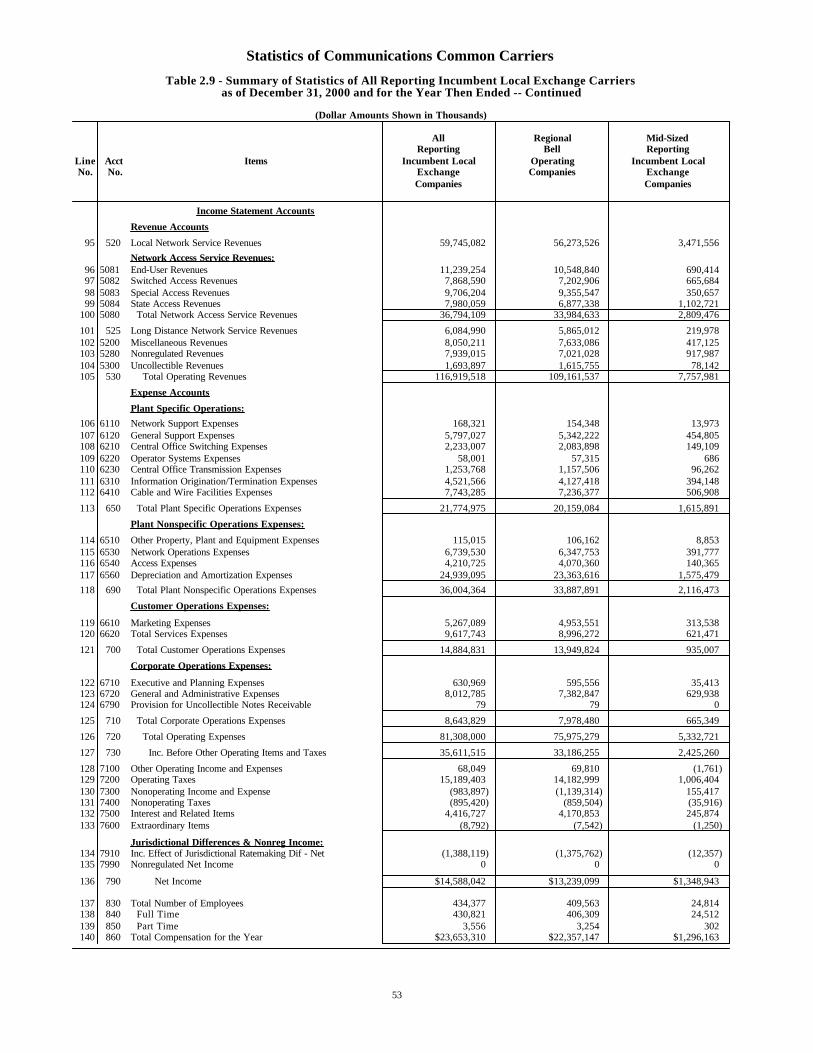
Statistics of Communications Common Carriers
Table 2.9 - Summary of Statistics of All Reporting Incumbent Local Exchange Carriersas of December 31, 2000 and for the Year Then Ended -- Continued
(Dollar Amounts Shown in Thousands)
All Regional Mid-SizedReporting Bell Reporting
Line Acct Items Incumbent Local Operating Incumbent LocalNo. No. Exchange Companies Exchange
Companies Companies
Income Statement Accounts
Revenue Accounts
95 520 Local Network Service Revenues 59,745,082 56,273,526 3,471,556
Network Access Service Revenues:96 5081 End-User Revenues 11,239,254 10,548,840 690,41497 5082 Switched Access Revenues 7,868,590 7,202,906 665,68498 5083 Special Access Revenues 9,706,204 9,355,547 350,65799 5084 State Access Revenues 7,980,059 6,877,338 1,102,721
100 5080 Total Network Access Service Revenues 36,794,109 33,984,633 2,809,476
101 525 Long Distance Network Service Revenues 6,084,990 5,865,012 219,978102 5200 Miscellaneous Revenues 8,050,211 7,633,086 417,125103 5280 Nonregulated Revenues 7,939,015 7,021,028 917,987104 5300 Uncollectible Revenues 1,693,897 1,615,755 78,142105 530 Total Operating Revenues 116,919,518 109,161,537 7,757,981
Expense Accounts
Plant Specific Operations:
106 6110 Network Support Expenses 168,321 154,348 13,973107 6120 General Support Expenses 5,797,027 5,342,222 454,805108 6210 Central Office Switching Expenses 2,233,007 2,083,898 149,109109 6220 Operator Systems Expenses 58,001 57,315 686110 6230 Central Office Transmission Expenses 1,253,768 1,157,506 96,262111 6310 Information Origination/Termination Expenses 4,521,566 4,127,418 394,148112 6410 Cable and Wire Facilities Expenses 7,743,285 7,236,377 506,908
113 650 Total Plant Specific Operations Expenses 21,774,975 20,159,084 1,615,891
Plant Nonspecific Operations Expenses:
114 6510 Other Property, Plant and Equipment Expenses 115,015 106,162 8,853115 6530 Network Operations Expenses 6,739,530 6,347,753 391,777116 6540 Access Expenses 4,210,725 4,070,360 140,365117 6560 Depreciation and Amortization Expenses 24,939,095 23,363,616 1,575,479
118 690 Total Plant Nonspecific Operations Expenses 36,004,364 33,887,891 2,116,473
Customer Operations Expenses:
119 6610 Marketing Expenses 5,267,089 4,953,551 313,538120 6620 Total Services Expenses 9,617,743 8,996,272 621,471
121 700 Total Customer Operations Expenses 14,884,831 13,949,824 935,007
Corporate Operations Expenses:
122 6710 Executive and Planning Expenses 630,969 595,556 35,413123 6720 General and Administrative Expenses 8,012,785 7,382,847 629,938124 6790 Provision for Uncollectible Notes Receivable 79 79 0
125 710 Total Corporate Operations Expenses 8,643,829 7,978,480 665,349
126 720 Total Operating Expenses 81,308,000 75,975,279 5,332,721
127 730 Inc. Before Other Operating Items and Taxes 35,611,515 33,186,255 2,425,260
128 7100 Other Operating Income and Expenses 68,049 69,810 (1,761)129 7200 Operating Taxes 15,189,403 14,182,999 1,006,404130 7300 Nonoperating Income and Expense (983,897) (1,139,314) 155,417131 7400 Nonoperating Taxes (895,420) (859,504) (35,916)132 7500 Interest and Related Items 4,416,727 4,170,853 245,874133 7600 Extraordinary Items (8,792) (7,542) (1,250)
Jurisdictional Differences & Nonreg Income:134 7910 Inc. Effect of Jurisdictional Ratemaking Dif - Net (1,388,119) (1,375,762) (12,357)135 7990 Nonregulated Net Income 0 0 0
136 790 Net Income $14,588,042 $13,239,099 $1,348,943
137 830 Total Number of Employees 434,377 409,563 24,814138 840 Full Time 430,821 406,309 24,512139 850 Part Time 3,556 3,254 302140 860 Total Compensation for the Year $23,653,310 $22,357,147 $1,296,163
53
Statistics of Communications Common Carriers
Notes for Table 2.9.
Source: Annual ARMIS (Automated Reporting Management Information System) USOA Reports (FCC Report 43-02) of reporting incumbent local exchange carriers.
Note -- The FCC's Accounting Review Order, 14 FCC Rcd 11396 (1999), established streamlined reporting requirements for mid-sized incumbent local exchange carriers (ILECs) beginning with the 1999 reporting year. A mid-sized carrier is a carrier whose annual operating revenues, either individually or when aggregated with those of any ILEC that it controls, is controlled by, or with which it is under common control, are less than $7 billion.
-- Detail may not match totals because of necessary roundings.
-- In the account number column, four-digit numbers are used when there is a corresponding account number in the Uniform System of Accounts (USOA). Three-digit numbers correspond to items defined in the ARMIS USOA report (FCC Report 43-02).
NA - Not applicable.
54
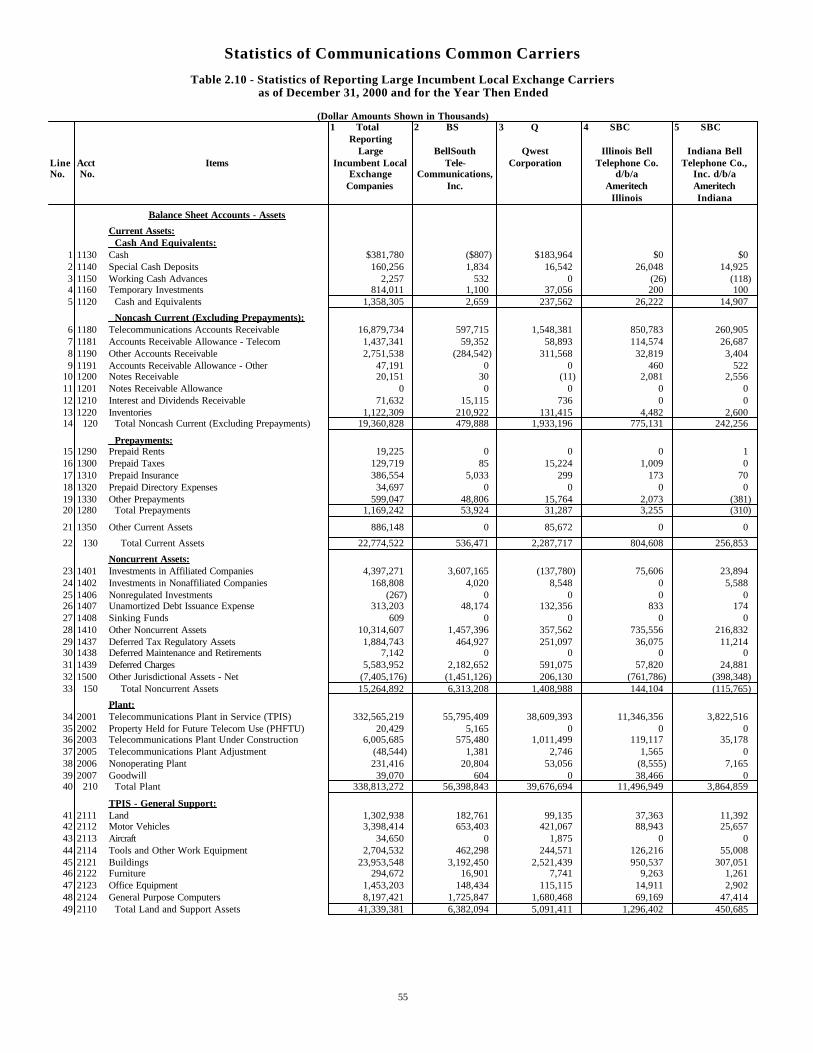
Statistics of Communications Common Carriers
Table 2.10 - Statistics of Reporting Large Incumbent Local Exchange Carriersas of December 31, 2000 and for the Year Then Ended
(Dollar Amounts Shown in Thousands)1 Total 2 BS 3 Q 4 SBC 5 SBC
ReportingLarge BellSouth Qwest Illinois Bell Indiana Bell
Line Acct Items Incumbent Local Tele- Corporation Telephone Co. Telephone Co.,No. No. Exchange Communications, d/b/a Inc. d/b/a
Companies Inc. Ameritech AmeritechIllinois Indiana
Balance Sheet Accounts - Assets
Current Assets: Cash And Equivalents:
1 1130 Cash $381,780 ($807) $183,964 $0 $02 1140 Special Cash Deposits 160,256 1,834 16,542 26,048 14,9253 1150 Working Cash Advances 2,257 532 0 (26) (118)4 1160 Temporary Investments 814,011 1,100 37,056 200 1005 1120 Cash and Equivalents 1,358,305 2,659 237,562 26,222 14,907
Noncash Current (Excluding Prepayments):6 1180 Telecommunications Accounts Receivable 16,879,734 597,715 1,548,381 850,783 260,9057 1181 Accounts Receivable Allowance - Telecom 1,437,341 59,352 58,893 114,574 26,6878 1190 Other Accounts Receivable 2,751,538 (284,542) 311,568 32,819 3,4049 1191 Accounts Receivable Allowance - Other 47,191 0 0 460 522
10 1200 Notes Receivable 20,151 30 (11) 2,081 2,55611 1201 Notes Receivable Allowance 0 0 0 0 012 1210 Interest and Dividends Receivable 71,632 15,115 736 0 013 1220 Inventories 1,122,309 210,922 131,415 4,482 2,60014 120 Total Noncash Current (Excluding Prepayments) 19,360,828 479,888 1,933,196 775,131 242,256
Prepayments:15 1290 Prepaid Rents 19,225 0 0 0 116 1300 Prepaid Taxes 129,719 85 15,224 1,009 017 1310 Prepaid Insurance 386,554 5,033 299 173 7018 1320 Prepaid Directory Expenses 34,697 0 0 0 019 1330 Other Prepayments 599,047 48,806 15,764 2,073 (381)20 1280 Total Prepayments 1,169,242 53,924 31,287 3,255 (310)
21 1350 Other Current Assets 886,148 0 85,672 0 0
22 130 Total Current Assets 22,774,522 536,471 2,287,717 804,608 256,853
Noncurrent Assets:23 1401 Investments in Affiliated Companies 4,397,271 3,607,165 (137,780) 75,606 23,89424 1402 Investments in Nonaffiliated Companies 168,808 4,020 8,548 0 5,58825 1406 Nonregulated Investments (267) 0 0 0 026 1407 Unamortized Debt Issuance Expense 313,203 48,174 132,356 833 17427 1408 Sinking Funds 609 0 0 0 028 1410 Other Noncurrent Assets 10,314,607 1,457,396 357,562 735,556 216,83229 1437 Deferred Tax Regulatory Assets 1,884,743 464,927 251,097 36,075 11,21430 1438 Deferred Maintenance and Retirements 7,142 0 0 0 031 1439 Deferred Charges 5,583,952 2,182,652 591,075 57,820 24,88132 1500 Other Jurisdictional Assets - Net (7,405,176) (1,451,126) 206,130 (761,786) (398,348)33 150 Total Noncurrent Assets 15,264,892 6,313,208 1,408,988 144,104 (115,765)
Plant:34 2001 Telecommunications Plant in Service (TPIS) 332,565,219 55,795,409 38,609,393 11,346,356 3,822,51635 2002 Property Held for Future Telecom Use (PHFTU) 20,429 5,165 0 0 036 2003 Telecommunications Plant Under Construction 6,005,685 575,480 1,011,499 119,117 35,17837 2005 Telecommunications Plant Adjustment (48,544) 1,381 2,746 1,565 038 2006 Nonoperating Plant 231,416 20,804 53,056 (8,555) 7,16539 2007 Goodwill 39,070 604 0 38,466 040 210 Total Plant 338,813,272 56,398,843 39,676,694 11,496,949 3,864,859
TPIS - General Support:41 2111 Land 1,302,938 182,761 99,135 37,363 11,39242 2112 Motor Vehicles 3,398,414 653,403 421,067 88,943 25,65743 2113 Aircraft 34,650 0 1,875 0 044 2114 Tools and Other Work Equipment 2,704,532 462,298 244,571 126,216 55,00845 2121 Buildings 23,953,548 3,192,450 2,521,439 950,537 307,05146 2122 Furniture 294,672 16,901 7,741 9,263 1,26147 2123 Office Equipment 1,453,203 148,434 115,115 14,911 2,90248 2124 General Purpose Computers 8,197,421 1,725,847 1,680,468 69,169 47,41449 2110 Total Land and Support Assets 41,339,381 6,382,094 5,091,411 1,296,402 450,685
55
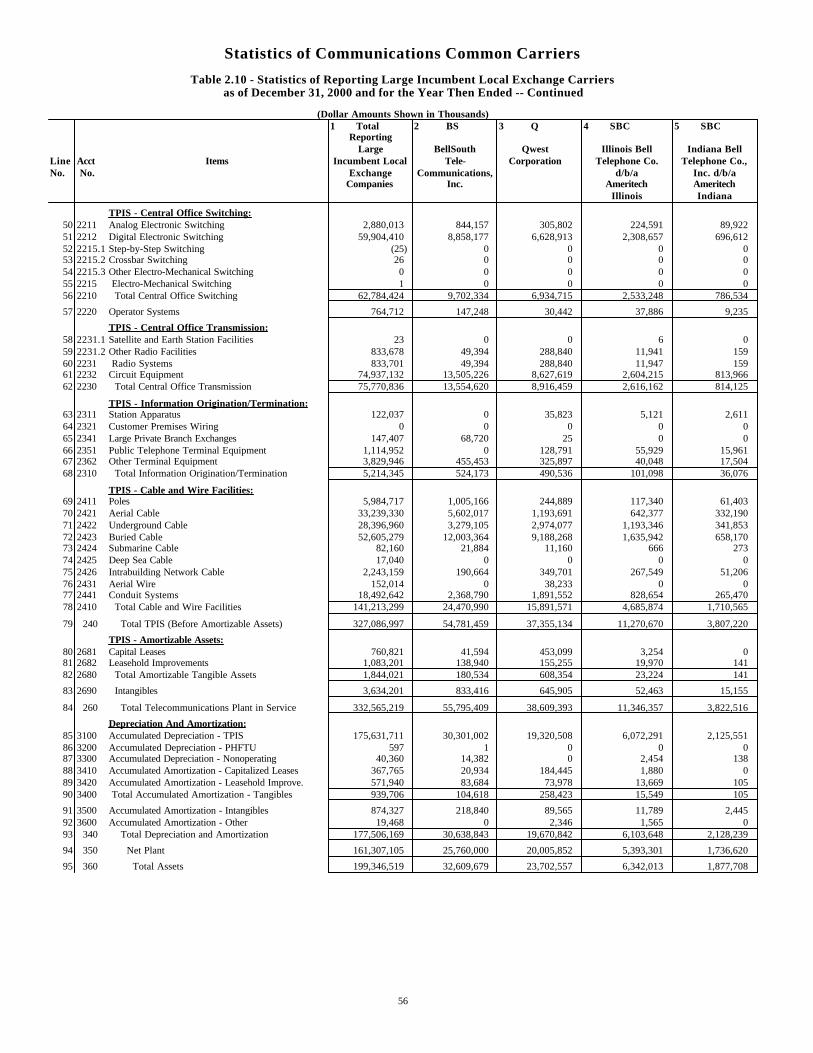
Statistics of Communications Common Carriers
Table 2.10 - Statistics of Reporting Large Incumbent Local Exchange Carriersas of December 31, 2000 and for the Year Then Ended -- Continued
(Dollar Amounts Shown in Thousands)1 Total 2 BS 3 Q 4 SBC 5 SBC
ReportingLarge BellSouth Qwest Illinois Bell Indiana Bell
Line Acct Items Incumbent Local Tele- Corporation Telephone Co. Telephone Co.,No. No. Exchange Communications, d/b/a Inc. d/b/a
Companies Inc. Ameritech AmeritechIllinois Indiana
TPIS - Central Office Switching:50 2211 Analog Electronic Switching 2,880,013 844,157 305,802 224,591 89,92251 2212 Digital Electronic Switching 59,904,410 8,858,177 6,628,913 2,308,657 696,61252 2215.1 Step-by-Step Switching (25) 0 0 0 053 2215.2 Crossbar Switching 26 0 0 0 054 2215.3 Other Electro-Mechanical Switching 0 0 0 0 055 2215 Electro-Mechanical Switching 1 0 0 0 056 2210 Total Central Office Switching 62,784,424 9,702,334 6,934,715 2,533,248 786,534
57 2220 Operator Systems 764,712 147,248 30,442 37,886 9,235
TPIS - Central Office Transmission:58 2231.1 Satellite and Earth Station Facilities 23 0 0 6 059 2231.2 Other Radio Facilities 833,678 49,394 288,840 11,941 15960 2231 Radio Systems 833,701 49,394 288,840 11,947 15961 2232 Circuit Equipment 74,937,132 13,505,226 8,627,619 2,604,215 813,96662 2230 Total Central Office Transmission 75,770,836 13,554,620 8,916,459 2,616,162 814,125
TPIS - Information Origination/Termination:63 2311 Station Apparatus 122,037 0 35,823 5,121 2,61164 2321 Customer Premises Wiring 0 0 0 0 065 2341 Large Private Branch Exchanges 147,407 68,720 25 0 066 2351 Public Telephone Terminal Equipment 1,114,952 0 128,791 55,929 15,96167 2362 Other Terminal Equipment 3,829,946 455,453 325,897 40,048 17,50468 2310 Total Information Origination/Termination 5,214,345 524,173 490,536 101,098 36,076
TPIS - Cable and Wire Facilities:69 2411 Poles 5,984,717 1,005,166 244,889 117,340 61,40370 2421 Aerial Cable 33,239,330 5,602,017 1,193,691 642,377 332,19071 2422 Underground Cable 28,396,960 3,279,105 2,974,077 1,193,346 341,85372 2423 Buried Cable 52,605,279 12,003,364 9,188,268 1,635,942 658,17073 2424 Submarine Cable 82,160 21,884 11,160 666 27374 2425 Deep Sea Cable 17,040 0 0 0 075 2426 Intrabuilding Network Cable 2,243,159 190,664 349,701 267,549 51,20676 2431 Aerial Wire 152,014 0 38,233 0 077 2441 Conduit Systems 18,492,642 2,368,790 1,891,552 828,654 265,47078 2410 Total Cable and Wire Facilities 141,213,299 24,470,990 15,891,571 4,685,874 1,710,565
79 240 Total TPIS (Before Amortizable Assets) 327,086,997 54,781,459 37,355,134 11,270,670 3,807,220
TPIS - Amortizable Assets:80 2681 Capital Leases 760,821 41,594 453,099 3,254 081 2682 Leasehold Improvements 1,083,201 138,940 155,255 19,970 14182 2680 Total Amortizable Tangible Assets 1,844,021 180,534 608,354 23,224 141
83 2690 Intangibles 3,634,201 833,416 645,905 52,463 15,155
84 260 Total Telecommunications Plant in Service 332,565,219 55,795,409 38,609,393 11,346,357 3,822,516
Depreciation And Amortization:85 3100 Accumulated Depreciation - TPIS 175,631,711 30,301,002 19,320,508 6,072,291 2,125,55186 3200 Accumulated Depreciation - PHFTU 597 1 0 0 087 3300 Accumulated Depreciation - Nonoperating 40,360 14,382 0 2,454 13888 3410 Accumulated Amortization - Capitalized Leases 367,765 20,934 184,445 1,880 089 3420 Accumulated Amortization - Leasehold Improve. 571,940 83,684 73,978 13,669 10590 3400 Total Accumulated Amortization - Tangibles 939,706 104,618 258,423 15,549 105
91 3500 Accumulated Amortization - Intangibles 874,327 218,840 89,565 11,789 2,44592 3600 Accumulated Amortization - Other 19,468 0 2,346 1,565 093 340 Total Depreciation and Amortization 177,506,169 30,638,843 19,670,842 6,103,648 2,128,239
94 350 Net Plant 161,307,105 25,760,000 20,005,852 5,393,301 1,736,620
95 360 Total Assets 199,346,519 32,609,679 23,702,557 6,342,013 1,877,708
56
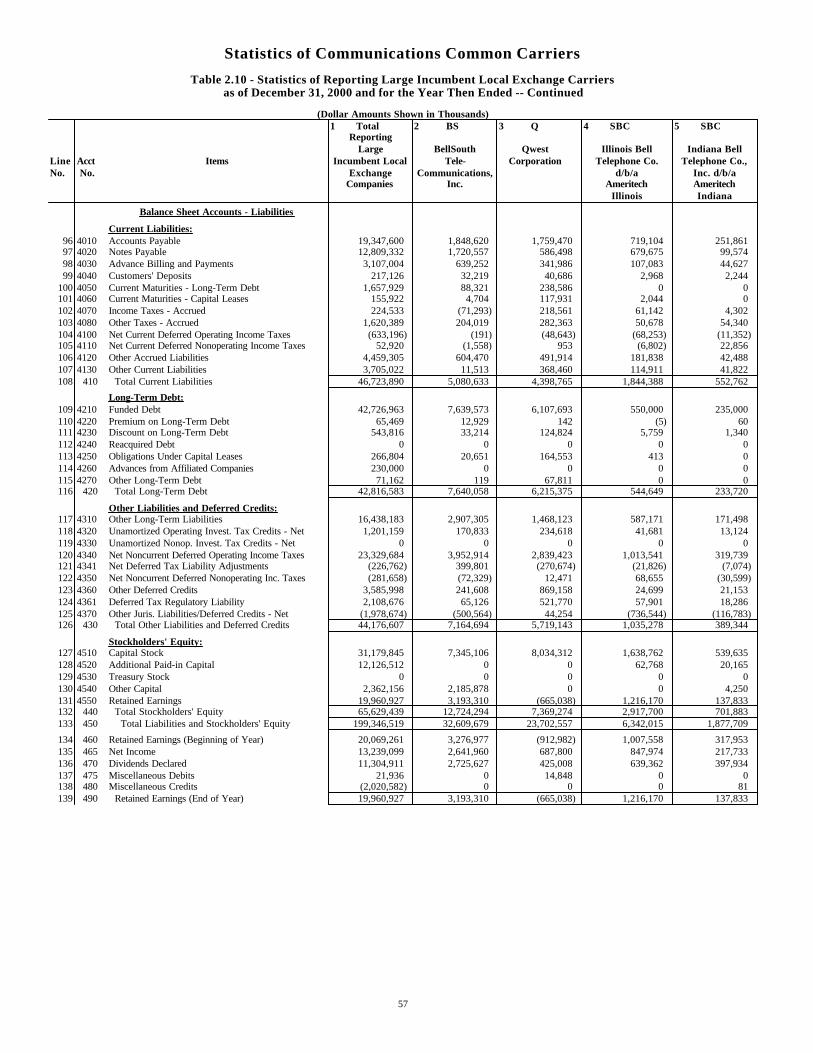
Statistics of Communications Common Carriers
Table 2.10 - Statistics of Reporting Large Incumbent Local Exchange Carriersas of December 31, 2000 and for the Year Then Ended -- Continued
(Dollar Amounts Shown in Thousands)1 Total 2 BS 3 Q 4 SBC 5 SBC
ReportingLarge BellSouth Qwest Illinois Bell Indiana Bell
Line Acct Items Incumbent Local Tele- Corporation Telephone Co. Telephone Co.,No. No. Exchange Communications, d/b/a Inc. d/b/a
Companies Inc. Ameritech AmeritechIllinois Indiana
Balance Sheet Accounts - Liabilities
Current Liabilities:96 4010 Accounts Payable 19,347,600 1,848,620 1,759,470 719,104 251,86197 4020 Notes Payable 12,809,332 1,720,557 586,498 679,675 99,57498 4030 Advance Billing and Payments 3,107,004 639,252 341,986 107,083 44,62799 4040 Customers' Deposits 217,126 32,219 40,686 2,968 2,244
100 4050 Current Maturities - Long-Term Debt 1,657,929 88,321 238,586 0 0101 4060 Current Maturities - Capital Leases 155,922 4,704 117,931 2,044 0102 4070 Income Taxes - Accrued 224,533 (71,293) 218,561 61,142 4,302103 4080 Other Taxes - Accrued 1,620,389 204,019 282,363 50,678 54,340104 4100 Net Current Deferred Operating Income Taxes (633,196) (191) (48,643) (68,253) (11,352)105 4110 Net Current Deferred Nonoperating Income Taxes 52,920 (1,558) 953 (6,802) 22,856106 4120 Other Accrued Liabilities 4,459,305 604,470 491,914 181,838 42,488107 4130 Other Current Liabilities 3,705,022 11,513 368,460 114,911 41,822108 410 Total Current Liabilities 46,723,890 5,080,633 4,398,765 1,844,388 552,762
Long-Term Debt:109 4210 Funded Debt 42,726,963 7,639,573 6,107,693 550,000 235,000110 4220 Premium on Long-Term Debt 65,469 12,929 142 (5) 60111 4230 Discount on Long-Term Debt 543,816 33,214 124,824 5,759 1,340112 4240 Reacquired Debt 0 0 0 0 0113 4250 Obligations Under Capital Leases 266,804 20,651 164,553 413 0114 4260 Advances from Affiliated Companies 230,000 0 0 0 0115 4270 Other Long-Term Debt 71,162 119 67,811 0 0116 420 Total Long-Term Debt 42,816,583 7,640,058 6,215,375 544,649 233,720
Other Liabilities and Deferred Credits:117 4310 Other Long-Term Liabilities 16,438,183 2,907,305 1,468,123 587,171 171,498118 4320 Unamortized Operating Invest. Tax Credits - Net 1,201,159 170,833 234,618 41,681 13,124119 4330 Unamortized Nonop. Invest. Tax Credits - Net 0 0 0 0 0120 4340 Net Noncurrent Deferred Operating Income Taxes 23,329,684 3,952,914 2,839,423 1,013,541 319,739121 4341 Net Deferred Tax Liability Adjustments (226,762) 399,801 (270,674) (21,826) (7,074)122 4350 Net Noncurrent Deferred Nonoperating Inc. Taxes (281,658) (72,329) 12,471 68,655 (30,599)123 4360 Other Deferred Credits 3,585,998 241,608 869,158 24,699 21,153124 4361 Deferred Tax Regulatory Liability 2,108,676 65,126 521,770 57,901 18,286125 4370 Other Juris. Liabilities/Deferred Credits - Net (1,978,674) (500,564) 44,254 (736,544) (116,783)126 430 Total Other Liabilities and Deferred Credits 44,176,607 7,164,694 5,719,143 1,035,278 389,344
Stockholders' Equity:127 4510 Capital Stock 31,179,845 7,345,106 8,034,312 1,638,762 539,635128 4520 Additional Paid-in Capital 12,126,512 0 0 62,768 20,165129 4530 Treasury Stock 0 0 0 0 0130 4540 Other Capital 2,362,156 2,185,878 0 0 4,250131 4550 Retained Earnings 19,960,927 3,193,310 (665,038) 1,216,170 137,833132 440 Total Stockholders' Equity 65,629,439 12,724,294 7,369,274 2,917,700 701,883133 450 Total Liabilities and Stockholders' Equity 199,346,519 32,609,679 23,702,557 6,342,015 1,877,709
134 460 Retained Earnings (Beginning of Year) 20,069,261 3,276,977 (912,982) 1,007,558 317,953135 465 Net Income 13,239,099 2,641,960 687,800 847,974 217,733136 470 Dividends Declared 11,304,911 2,725,627 425,008 639,362 397,934137 475 Miscellaneous Debits 21,936 0 14,848 0 0138 480 Miscellaneous Credits (2,020,582) 0 0 0 81139 490 Retained Earnings (End of Year) 19,960,927 3,193,310 (665,038) 1,216,170 137,833
57
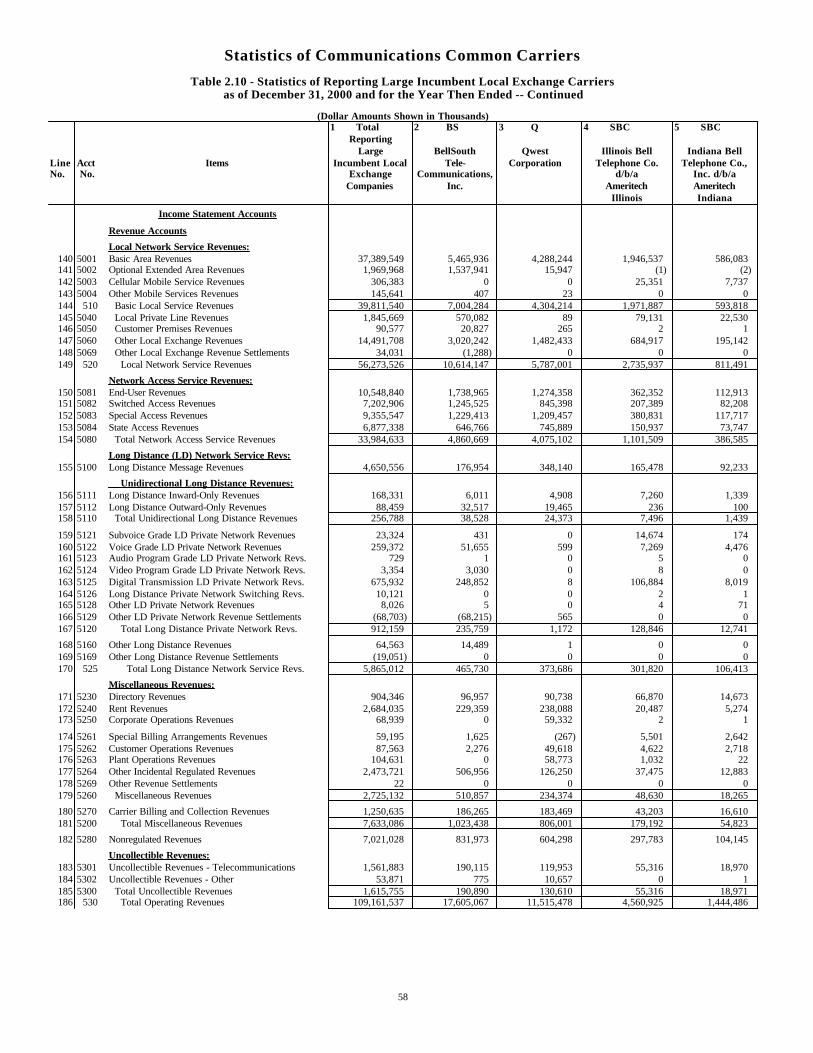
Statistics of Communications Common Carriers
Table 2.10 - Statistics of Reporting Large Incumbent Local Exchange Carriersas of December 31, 2000 and for the Year Then Ended -- Continued
(Dollar Amounts Shown in Thousands)1 Total 2 BS 3 Q 4 SBC 5 SBC
ReportingLarge BellSouth Qwest Illinois Bell Indiana Bell
Line Acct Items Incumbent Local Tele- Corporation Telephone Co. Telephone Co.,No. No. Exchange Communications, d/b/a Inc. d/b/a
Companies Inc. Ameritech AmeritechIllinois Indiana
Income Statement Accounts
Revenue Accounts
Local Network Service Revenues:140 5001 Basic Area Revenues 37,389,549 5,465,936 4,288,244 1,946,537 586,083141 5002 Optional Extended Area Revenues 1,969,968 1,537,941 15,947 (1) (2)142 5003 Cellular Mobile Service Revenues 306,383 0 0 25,351 7,737143 5004 Other Mobile Services Revenues 145,641 407 23 0 0144 510 Basic Local Service Revenues 39,811,540 7,004,284 4,304,214 1,971,887 593,818145 5040 Local Private Line Revenues 1,845,669 570,082 89 79,131 22,530146 5050 Customer Premises Revenues 90,577 20,827 265 2 1147 5060 Other Local Exchange Revenues 14,491,708 3,020,242 1,482,433 684,917 195,142148 5069 Other Local Exchange Revenue Settlements 34,031 (1,288) 0 0 0149 520 Local Network Service Revenues 56,273,526 10,614,147 5,787,001 2,735,937 811,491
Network Access Service Revenues:150 5081 End-User Revenues 10,548,840 1,738,965 1,274,358 362,352 112,913151 5082 Switched Access Revenues 7,202,906 1,245,525 845,398 207,389 82,208152 5083 Special Access Revenues 9,355,547 1,229,413 1,209,457 380,831 117,717153 5084 State Access Revenues 6,877,338 646,766 745,889 150,937 73,747154 5080 Total Network Access Service Revenues 33,984,633 4,860,669 4,075,102 1,101,509 386,585
Long Distance (LD) Network Service Revs:155 5100 Long Distance Message Revenues 4,650,556 176,954 348,140 165,478 92,233
Unidirectional Long Distance Revenues:156 5111 Long Distance Inward-Only Revenues 168,331 6,011 4,908 7,260 1,339157 5112 Long Distance Outward-Only Revenues 88,459 32,517 19,465 236 100158 5110 Total Unidirectional Long Distance Revenues 256,788 38,528 24,373 7,496 1,439
159 5121 Subvoice Grade LD Private Network Revenues 23,324 431 0 14,674 174160 5122 Voice Grade LD Private Network Revenues 259,372 51,655 599 7,269 4,476161 5123 Audio Program Grade LD Private Network Revs. 729 1 0 5 0162 5124 Video Program Grade LD Private Network Revs. 3,354 3,030 0 8 0163 5125 Digital Transmission LD Private Network Revs. 675,932 248,852 8 106,884 8,019164 5126 Long Distance Private Network Switching Revs. 10,121 0 0 2 1165 5128 Other LD Private Network Revenues 8,026 5 0 4 71166 5129 Other LD Private Network Revenue Settlements (68,703) (68,215) 565 0 0167 5120 Total Long Distance Private Network Revs. 912,159 235,759 1,172 128,846 12,741
168 5160 Other Long Distance Revenues 64,563 14,489 1 0 0169 5169 Other Long Distance Revenue Settlements (19,051) 0 0 0 0170 525 Total Long Distance Network Service Revs. 5,865,012 465,730 373,686 301,820 106,413
Miscellaneous Revenues:171 5230 Directory Revenues 904,346 96,957 90,738 66,870 14,673172 5240 Rent Revenues 2,684,035 229,359 238,088 20,487 5,274173 5250 Corporate Operations Revenues 68,939 0 59,332 2 1
174 5261 Special Billing Arrangements Revenues 59,195 1,625 (267) 5,501 2,642175 5262 Customer Operations Revenues 87,563 2,276 49,618 4,622 2,718176 5263 Plant Operations Revenues 104,631 0 58,773 1,032 22177 5264 Other Incidental Regulated Revenues 2,473,721 506,956 126,250 37,475 12,883178 5269 Other Revenue Settlements 22 0 0 0 0179 5260 Miscellaneous Revenues 2,725,132 510,857 234,374 48,630 18,265
180 5270 Carrier Billing and Collection Revenues 1,250,635 186,265 183,469 43,203 16,610181 5200 Total Miscellaneous Revenues 7,633,086 1,023,438 806,001 179,192 54,823
182 5280 Nonregulated Revenues 7,021,028 831,973 604,298 297,783 104,145
Uncollectible Revenues:183 5301 Uncollectible Revenues - Telecommunications 1,561,883 190,115 119,953 55,316 18,970184 5302 Uncollectible Revenues - Other 53,871 775 10,657 0 1185 5300 Total Uncollectible Revenues 1,615,755 190,890 130,610 55,316 18,971186 530 Total Operating Revenues 109,161,537 17,605,067 11,515,478 4,560,925 1,444,486
58
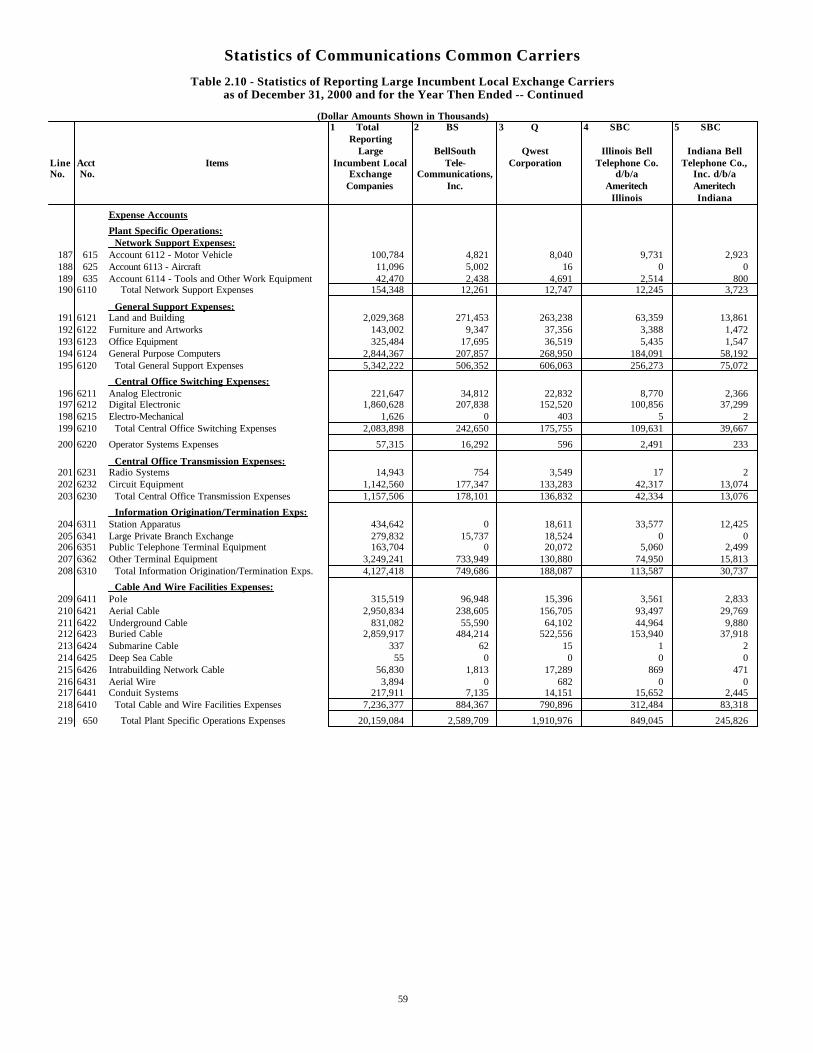
Statistics of Communications Common Carriers
Table 2.10 - Statistics of Reporting Large Incumbent Local Exchange Carriersas of December 31, 2000 and for the Year Then Ended -- Continued
(Dollar Amounts Shown in Thousands)1 Total 2 BS 3 Q 4 SBC 5 SBC
ReportingLarge BellSouth Qwest Illinois Bell Indiana Bell
Line Acct Items Incumbent Local Tele- Corporation Telephone Co. Telephone Co.,No. No. Exchange Communications, d/b/a Inc. d/b/a
Companies Inc. Ameritech AmeritechIllinois Indiana
Expense Accounts
Plant Specific Operations: Network Support Expenses:
187 615 Account 6112 - Motor Vehicle 100,784 4,821 8,040 9,731 2,923188 625 Account 6113 - Aircraft 11,096 5,002 16 0 0189 635 Account 6114 - Tools and Other Work Equipment 42,470 2,438 4,691 2,514 800190 6110 Total Network Support Expenses 154,348 12,261 12,747 12,245 3,723
General Support Expenses:191 6121 Land and Building 2,029,368 271,453 263,238 63,359 13,861192 6122 Furniture and Artworks 143,002 9,347 37,356 3,388 1,472193 6123 Office Equipment 325,484 17,695 36,519 5,435 1,547194 6124 General Purpose Computers 2,844,367 207,857 268,950 184,091 58,192195 6120 Total General Support Expenses 5,342,222 506,352 606,063 256,273 75,072
Central Office Switching Expenses:196 6211 Analog Electronic 221,647 34,812 22,832 8,770 2,366197 6212 Digital Electronic 1,860,628 207,838 152,520 100,856 37,299198 6215 Electro-Mechanical 1,626 0 403 5 2199 6210 Total Central Office Switching Expenses 2,083,898 242,650 175,755 109,631 39,667
200 6220 Operator Systems Expenses 57,315 16,292 596 2,491 233
Central Office Transmission Expenses:201 6231 Radio Systems 14,943 754 3,549 17 2202 6232 Circuit Equipment 1,142,560 177,347 133,283 42,317 13,074203 6230 Total Central Office Transmission Expenses 1,157,506 178,101 136,832 42,334 13,076
Information Origination/Termination Exps:204 6311 Station Apparatus 434,642 0 18,611 33,577 12,425205 6341 Large Private Branch Exchange 279,832 15,737 18,524 0 0206 6351 Public Telephone Terminal Equipment 163,704 0 20,072 5,060 2,499207 6362 Other Terminal Equipment 3,249,241 733,949 130,880 74,950 15,813208 6310 Total Information Origination/Termination Exps. 4,127,418 749,686 188,087 113,587 30,737
Cable And Wire Facilities Expenses:209 6411 Pole 315,519 96,948 15,396 3,561 2,833210 6421 Aerial Cable 2,950,834 238,605 156,705 93,497 29,769211 6422 Underground Cable 831,082 55,590 64,102 44,964 9,880212 6423 Buried Cable 2,859,917 484,214 522,556 153,940 37,918213 6424 Submarine Cable 337 62 15 1 2214 6425 Deep Sea Cable 55 0 0 0 0215 6426 Intrabuilding Network Cable 56,830 1,813 17,289 869 471216 6431 Aerial Wire 3,894 0 682 0 0217 6441 Conduit Systems 217,911 7,135 14,151 15,652 2,445218 6410 Total Cable and Wire Facilities Expenses 7,236,377 884,367 790,896 312,484 83,318
219 650 Total Plant Specific Operations Expenses 20,159,084 2,589,709 1,910,976 849,045 245,826
59
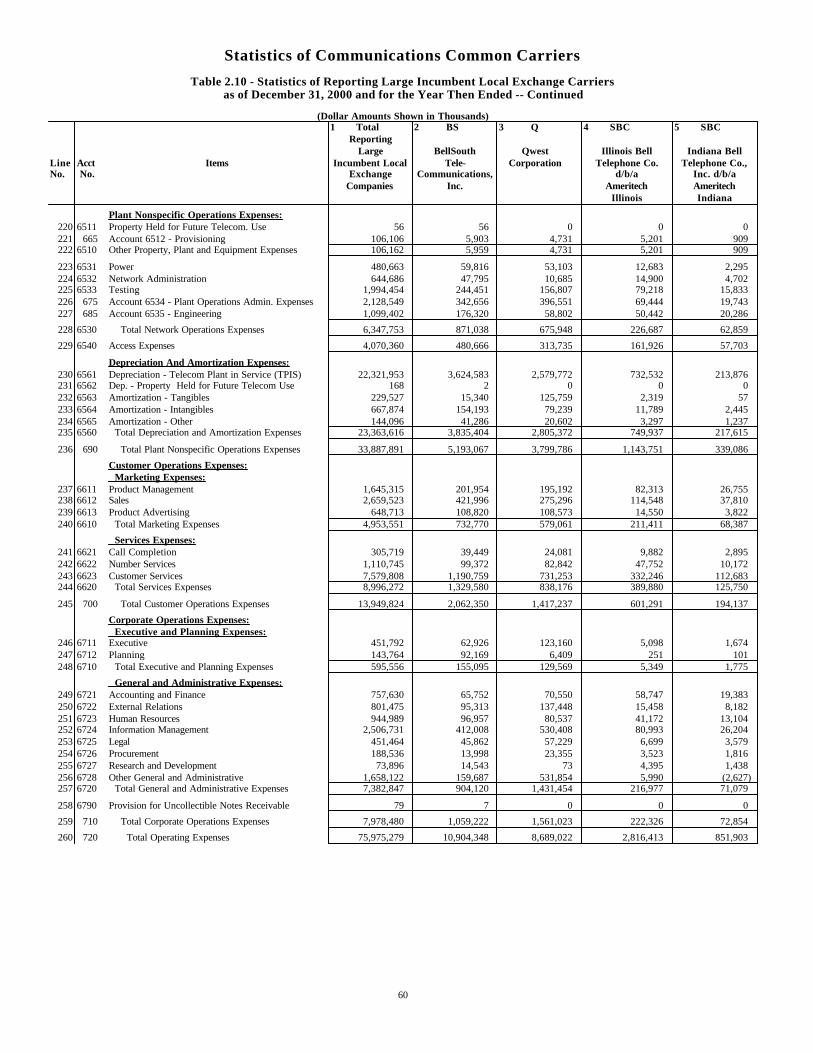
Statistics of Communications Common Carriers
Table 2.10 - Statistics of Reporting Large Incumbent Local Exchange Carriersas of December 31, 2000 and for the Year Then Ended -- Continued
(Dollar Amounts Shown in Thousands)1 Total 2 BS 3 Q 4 SBC 5 SBC
ReportingLarge BellSouth Qwest Illinois Bell Indiana Bell
Line Acct Items Incumbent Local Tele- Corporation Telephone Co. Telephone Co.,No. No. Exchange Communications, d/b/a Inc. d/b/a
Companies Inc. Ameritech AmeritechIllinois Indiana
Plant Nonspecific Operations Expenses:220 6511 Property Held for Future Telecom. Use 56 56 0 0 0221 665 Account 6512 - Provisioning 106,106 5,903 4,731 5,201 909222 6510 Other Property, Plant and Equipment Expenses 106,162 5,959 4,731 5,201 909
223 6531 Power 480,663 59,816 53,103 12,683 2,295224 6532 Network Administration 644,686 47,795 10,685 14,900 4,702225 6533 Testing 1,994,454 244,451 156,807 79,218 15,833226 675 Account 6534 - Plant Operations Admin. Expenses 2,128,549 342,656 396,551 69,444 19,743227 685 Account 6535 - Engineering 1,099,402 176,320 58,802 50,442 20,286
228 6530 Total Network Operations Expenses 6,347,753 871,038 675,948 226,687 62,859
229 6540 Access Expenses 4,070,360 480,666 313,735 161,926 57,703
Depreciation And Amortization Expenses:230 6561 Depreciation - Telecom Plant in Service (TPIS) 22,321,953 3,624,583 2,579,772 732,532 213,876231 6562 Dep. - Property Held for Future Telecom Use 168 2 0 0 0232 6563 Amortization - Tangibles 229,527 15,340 125,759 2,319 57233 6564 Amortization - Intangibles 667,874 154,193 79,239 11,789 2,445234 6565 Amortization - Other 144,096 41,286 20,602 3,297 1,237235 6560 Total Depreciation and Amortization Expenses 23,363,616 3,835,404 2,805,372 749,937 217,615
236 690 Total Plant Nonspecific Operations Expenses 33,887,891 5,193,067 3,799,786 1,143,751 339,086
Customer Operations Expenses: Marketing Expenses:
237 6611 Product Management 1,645,315 201,954 195,192 82,313 26,755238 6612 Sales 2,659,523 421,996 275,296 114,548 37,810239 6613 Product Advertising 648,713 108,820 108,573 14,550 3,822240 6610 Total Marketing Expenses 4,953,551 732,770 579,061 211,411 68,387
Services Expenses:241 6621 Call Completion 305,719 39,449 24,081 9,882 2,895242 6622 Number Services 1,110,745 99,372 82,842 47,752 10,172243 6623 Customer Services 7,579,808 1,190,759 731,253 332,246 112,683244 6620 Total Services Expenses 8,996,272 1,329,580 838,176 389,880 125,750
245 700 Total Customer Operations Expenses 13,949,824 2,062,350 1,417,237 601,291 194,137
Corporate Operations Expenses: Executive and Planning Expenses:
246 6711 Executive 451,792 62,926 123,160 5,098 1,674247 6712 Planning 143,764 92,169 6,409 251 101248 6710 Total Executive and Planning Expenses 595,556 155,095 129,569 5,349 1,775
General and Administrative Expenses:249 6721 Accounting and Finance 757,630 65,752 70,550 58,747 19,383250 6722 External Relations 801,475 95,313 137,448 15,458 8,182251 6723 Human Resources 944,989 96,957 80,537 41,172 13,104252 6724 Information Management 2,506,731 412,008 530,408 80,993 26,204253 6725 Legal 451,464 45,862 57,229 6,699 3,579254 6726 Procurement 188,536 13,998 23,355 3,523 1,816255 6727 Research and Development 73,896 14,543 73 4,395 1,438256 6728 Other General and Administrative 1,658,122 159,687 531,854 5,990 (2,627)257 6720 Total General and Administrative Expenses 7,382,847 904,120 1,431,454 216,977 71,079
258 6790 Provision for Uncollectible Notes Receivable 79 7 0 0 0
259 710 Total Corporate Operations Expenses 7,978,480 1,059,222 1,561,023 222,326 72,854
260 720 Total Operating Expenses 75,975,279 10,904,348 8,689,022 2,816,413 851,903
60
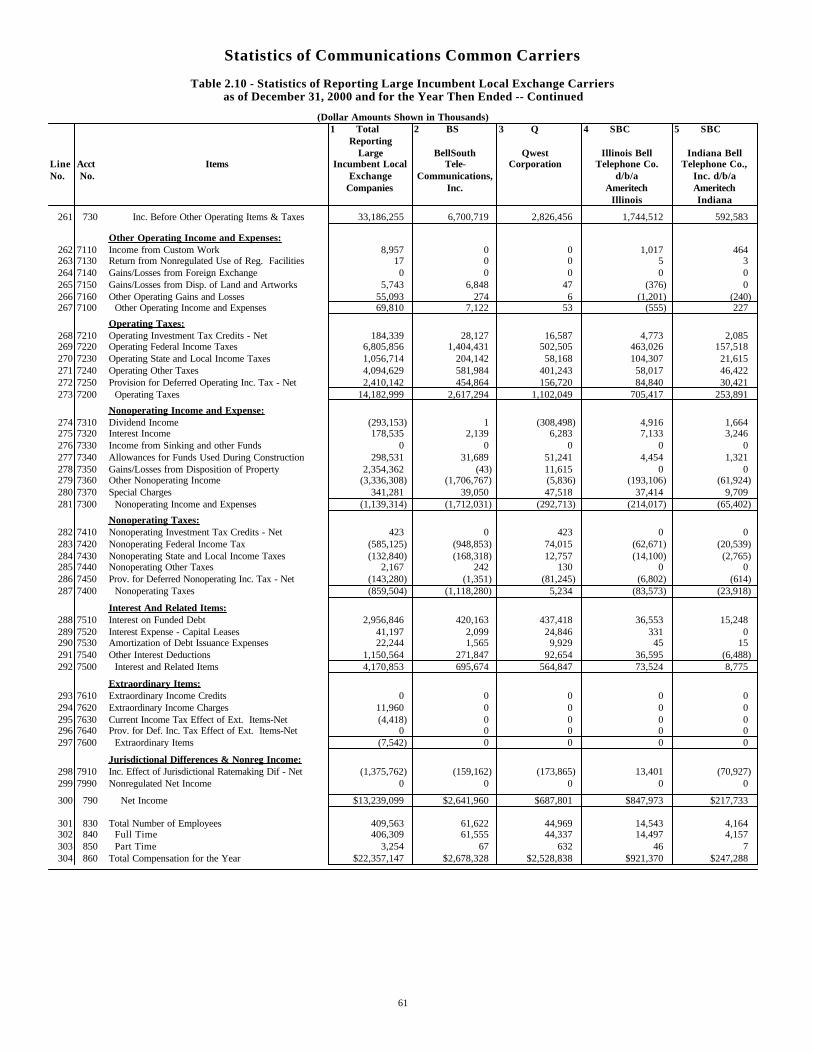
Statistics of Communications Common Carriers
Table 2.10 - Statistics of Reporting Large Incumbent Local Exchange Carriersas of December 31, 2000 and for the Year Then Ended -- Continued
(Dollar Amounts Shown in Thousands)1 Total 2 BS 3 Q 4 SBC 5 SBC
ReportingLarge BellSouth Qwest Illinois Bell Indiana Bell
Line Acct Items Incumbent Local Tele- Corporation Telephone Co. Telephone Co.,No. No. Exchange Communications, d/b/a Inc. d/b/a
Companies Inc. Ameritech AmeritechIllinois Indiana
261 730 Inc. Before Other Operating Items & Taxes 33,186,255 6,700,719 2,826,456 1,744,512 592,583
Other Operating Income and Expenses:262 7110 Income from Custom Work 8,957 0 0 1,017 464263 7130 Return from Nonregulated Use of Reg. Facilities 17 0 0 5 3264 7140 Gains/Losses from Foreign Exchange 0 0 0 0 0265 7150 Gains/Losses from Disp. of Land and Artworks 5,743 6,848 47 (376) 0266 7160 Other Operating Gains and Losses 55,093 274 6 (1,201) (240)267 7100 Other Operating Income and Expenses 69,810 7,122 53 (555) 227
Operating Taxes:268 7210 Operating Investment Tax Credits - Net 184,339 28,127 16,587 4,773 2,085269 7220 Operating Federal Income Taxes 6,805,856 1,404,431 502,505 463,026 157,518270 7230 Operating State and Local Income Taxes 1,056,714 204,142 58,168 104,307 21,615271 7240 Operating Other Taxes 4,094,629 581,984 401,243 58,017 46,422272 7250 Provision for Deferred Operating Inc. Tax - Net 2,410,142 454,864 156,720 84,840 30,421273 7200 Operating Taxes 14,182,999 2,617,294 1,102,049 705,417 253,891
Nonoperating Income and Expense:274 7310 Dividend Income (293,153) 1 (308,498) 4,916 1,664275 7320 Interest Income 178,535 2,139 6,283 7,133 3,246276 7330 Income from Sinking and other Funds 0 0 0 0 0277 7340 Allowances for Funds Used During Construction 298,531 31,689 51,241 4,454 1,321278 7350 Gains/Losses from Disposition of Property 2,354,362 (43) 11,615 0 0279 7360 Other Nonoperating Income (3,336,308) (1,706,767) (5,836) (193,106) (61,924)280 7370 Special Charges 341,281 39,050 47,518 37,414 9,709281 7300 Nonoperating Income and Expenses (1,139,314) (1,712,031) (292,713) (214,017) (65,402)
Nonoperating Taxes:282 7410 Nonoperating Investment Tax Credits - Net 423 0 423 0 0283 7420 Nonoperating Federal Income Tax (585,125) (948,853) 74,015 (62,671) (20,539)284 7430 Nonoperating State and Local Income Taxes (132,840) (168,318) 12,757 (14,100) (2,765)285 7440 Nonoperating Other Taxes 2,167 242 130 0 0286 7450 Prov. for Deferred Nonoperating Inc. Tax - Net (143,280) (1,351) (81,245) (6,802) (614)287 7400 Nonoperating Taxes (859,504) (1,118,280) 5,234 (83,573) (23,918)
Interest And Related Items:288 7510 Interest on Funded Debt 2,956,846 420,163 437,418 36,553 15,248289 7520 Interest Expense - Capital Leases 41,197 2,099 24,846 331 0290 7530 Amortization of Debt Issuance Expenses 22,244 1,565 9,929 45 15291 7540 Other Interest Deductions 1,150,564 271,847 92,654 36,595 (6,488)292 7500 Interest and Related Items 4,170,853 695,674 564,847 73,524 8,775
Extraordinary Items:293 7610 Extraordinary Income Credits 0 0 0 0 0294 7620 Extraordinary Income Charges 11,960 0 0 0 0295 7630 Current Income Tax Effect of Ext. Items-Net (4,418) 0 0 0 0296 7640 Prov. for Def. Inc. Tax Effect of Ext. Items-Net 0 0 0 0 0297 7600 Extraordinary Items (7,542) 0 0 0 0
Jurisdictional Differences & Nonreg Income:298 7910 Inc. Effect of Jurisdictional Ratemaking Dif - Net (1,375,762) (159,162) (173,865) 13,401 (70,927)299 7990 Nonregulated Net Income 0 0 0 0 0
300 790 Net Income $13,239,099 $2,641,960 $687,801 $847,973 $217,733
301 830 Total Number of Employees 409,563 61,622 44,969 14,543 4,164302 840 Full Time 406,309 61,555 44,337 14,497 4,157303 850 Part Time 3,254 67 632 46 7304 860 Total Compensation for the Year $22,357,147 $2,678,328 $2,528,838 $921,370 $247,288
61
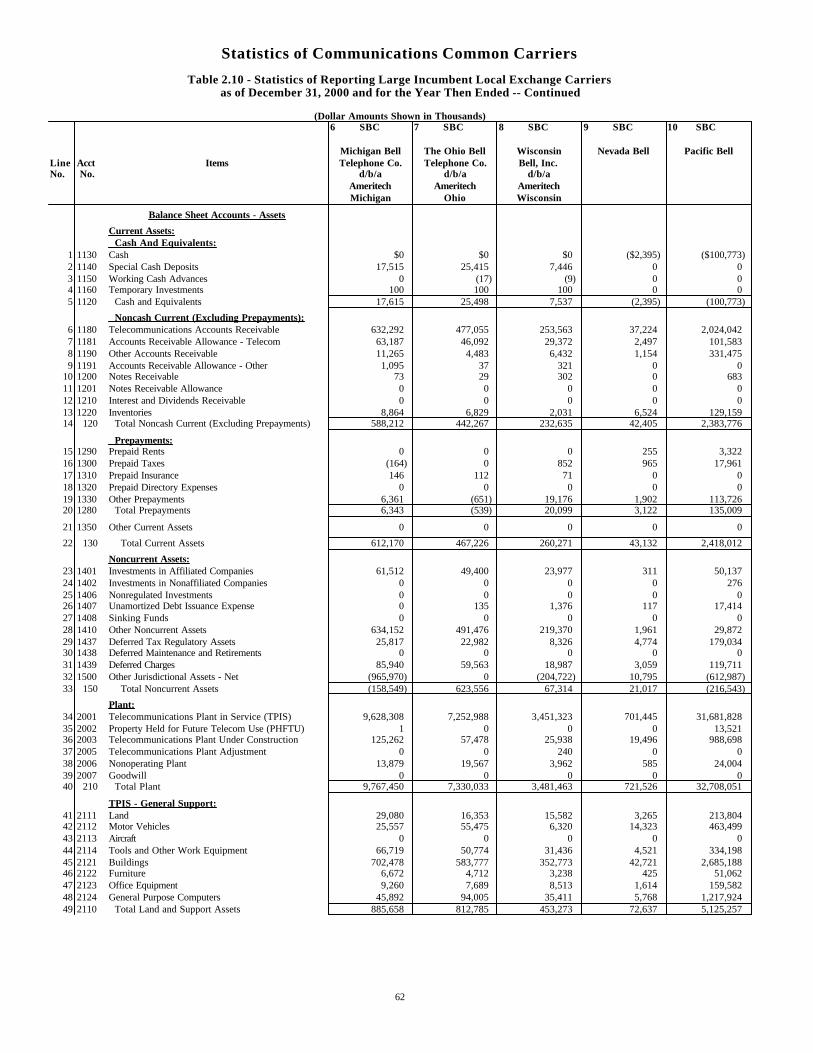
Statistics of Communications Common Carriers
Table 2.10 - Statistics of Reporting Large Incumbent Local Exchange Carriersas of December 31, 2000 and for the Year Then Ended -- Continued
(Dollar Amounts Shown in Thousands)6 SBC 7 SBC 8 SBC 9 SBC 10 SBC
Michigan Bell The Ohio Bell Wisconsin Nevada Bell Pacific BellLine Acct Items Telephone Co. Telephone Co. Bell, Inc.No. No. d/b/a d/b/a d/b/a
Ameritech Ameritech AmeritechMichigan Ohio Wisconsin
Balance Sheet Accounts - Assets
Current Assets: Cash And Equivalents:
1 1130 Cash $0 $0 $0 ($2,395) ($100,773)2 1140 Special Cash Deposits 17,515 25,415 7,446 0 03 1150 Working Cash Advances 0 (17) (9) 0 04 1160 Temporary Investments 100 100 100 0 05 1120 Cash and Equivalents 17,615 25,498 7,537 (2,395) (100,773)
Noncash Current (Excluding Prepayments):6 1180 Telecommunications Accounts Receivable 632,292 477,055 253,563 37,224 2,024,0427 1181 Accounts Receivable Allowance - Telecom 63,187 46,092 29,372 2,497 101,5838 1190 Other Accounts Receivable 11,265 4,483 6,432 1,154 331,4759 1191 Accounts Receivable Allowance - Other 1,095 37 321 0 0
10 1200 Notes Receivable 73 29 302 0 68311 1201 Notes Receivable Allowance 0 0 0 0 012 1210 Interest and Dividends Receivable 0 0 0 0 013 1220 Inventories 8,864 6,829 2,031 6,524 129,15914 120 Total Noncash Current (Excluding Prepayments) 588,212 442,267 232,635 42,405 2,383,776
Prepayments:15 1290 Prepaid Rents 0 0 0 255 3,32216 1300 Prepaid Taxes (164) 0 852 965 17,96117 1310 Prepaid Insurance 146 112 71 0 018 1320 Prepaid Directory Expenses 0 0 0 0 019 1330 Other Prepayments 6,361 (651) 19,176 1,902 113,72620 1280 Total Prepayments 6,343 (539) 20,099 3,122 135,009
21 1350 Other Current Assets 0 0 0 0 0
22 130 Total Current Assets 612,170 467,226 260,271 43,132 2,418,012
Noncurrent Assets:23 1401 Investments in Affiliated Companies 61,512 49,400 23,977 311 50,13724 1402 Investments in Nonaffiliated Companies 0 0 0 0 27625 1406 Nonregulated Investments 0 0 0 0 026 1407 Unamortized Debt Issuance Expense 0 135 1,376 117 17,41427 1408 Sinking Funds 0 0 0 0 028 1410 Other Noncurrent Assets 634,152 491,476 219,370 1,961 29,87229 1437 Deferred Tax Regulatory Assets 25,817 22,982 8,326 4,774 179,03430 1438 Deferred Maintenance and Retirements 0 0 0 0 031 1439 Deferred Charges 85,940 59,563 18,987 3,059 119,71132 1500 Other Jurisdictional Assets - Net (965,970) 0 (204,722) 10,795 (612,987)33 150 Total Noncurrent Assets (158,549) 623,556 67,314 21,017 (216,543)
Plant:34 2001 Telecommunications Plant in Service (TPIS) 9,628,308 7,252,988 3,451,323 701,445 31,681,82835 2002 Property Held for Future Telecom Use (PHFTU) 1 0 0 0 13,52136 2003 Telecommunications Plant Under Construction 125,262 57,478 25,938 19,496 988,69837 2005 Telecommunications Plant Adjustment 0 0 240 0 038 2006 Nonoperating Plant 13,879 19,567 3,962 585 24,00439 2007 Goodwill 0 0 0 0 040 210 Total Plant 9,767,450 7,330,033 3,481,463 721,526 32,708,051
TPIS - General Support:41 2111 Land 29,080 16,353 15,582 3,265 213,80442 2112 Motor Vehicles 25,557 55,475 6,320 14,323 463,49943 2113 Aircraft 0 0 0 0 044 2114 Tools and Other Work Equipment 66,719 50,774 31,436 4,521 334,19845 2121 Buildings 702,478 583,777 352,773 42,721 2,685,18846 2122 Furniture 6,672 4,712 3,238 425 51,06247 2123 Office Equipment 9,260 7,689 8,513 1,614 159,58248 2124 General Purpose Computers 45,892 94,005 35,411 5,768 1,217,92449 2110 Total Land and Support Assets 885,658 812,785 453,273 72,637 5,125,257
62
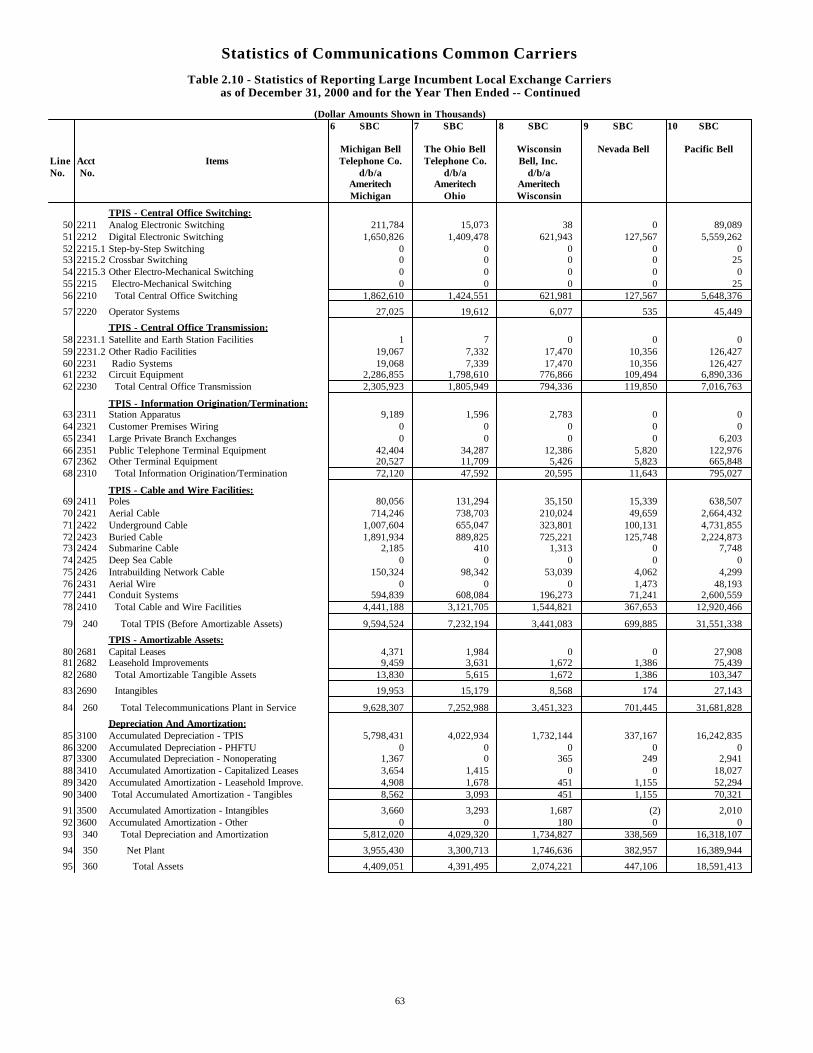
Statistics of Communications Common Carriers
Table 2.10 - Statistics of Reporting Large Incumbent Local Exchange Carriersas of December 31, 2000 and for the Year Then Ended -- Continued
(Dollar Amounts Shown in Thousands)6 SBC 7 SBC 8 SBC 9 SBC 10 SBC
Michigan Bell The Ohio Bell Wisconsin Nevada Bell Pacific BellLine Acct Items Telephone Co. Telephone Co. Bell, Inc.No. No. d/b/a d/b/a d/b/a
Ameritech Ameritech AmeritechMichigan Ohio Wisconsin
TPIS - Central Office Switching:50 2211 Analog Electronic Switching 211,784 15,073 38 0 89,08951 2212 Digital Electronic Switching 1,650,826 1,409,478 621,943 127,567 5,559,26252 2215.1 Step-by-Step Switching 0 0 0 0 053 2215.2 Crossbar Switching 0 0 0 0 2554 2215.3 Other Electro-Mechanical Switching 0 0 0 0 055 2215 Electro-Mechanical Switching 0 0 0 0 2556 2210 Total Central Office Switching 1,862,610 1,424,551 621,981 127,567 5,648,376
57 2220 Operator Systems 27,025 19,612 6,077 535 45,449
TPIS - Central Office Transmission:58 2231.1 Satellite and Earth Station Facilities 1 7 0 0 059 2231.2 Other Radio Facilities 19,067 7,332 17,470 10,356 126,42760 2231 Radio Systems 19,068 7,339 17,470 10,356 126,42761 2232 Circuit Equipment 2,286,855 1,798,610 776,866 109,494 6,890,33662 2230 Total Central Office Transmission 2,305,923 1,805,949 794,336 119,850 7,016,763
TPIS - Information Origination/Termination:63 2311 Station Apparatus 9,189 1,596 2,783 0 064 2321 Customer Premises Wiring 0 0 0 0 065 2341 Large Private Branch Exchanges 0 0 0 0 6,20366 2351 Public Telephone Terminal Equipment 42,404 34,287 12,386 5,820 122,97667 2362 Other Terminal Equipment 20,527 11,709 5,426 5,823 665,84868 2310 Total Information Origination/Termination 72,120 47,592 20,595 11,643 795,027
TPIS - Cable and Wire Facilities:69 2411 Poles 80,056 131,294 35,150 15,339 638,50770 2421 Aerial Cable 714,246 738,703 210,024 49,659 2,664,43271 2422 Underground Cable 1,007,604 655,047 323,801 100,131 4,731,85572 2423 Buried Cable 1,891,934 889,825 725,221 125,748 2,224,87373 2424 Submarine Cable 2,185 410 1,313 0 7,74874 2425 Deep Sea Cable 0 0 0 0 075 2426 Intrabuilding Network Cable 150,324 98,342 53,039 4,062 4,29976 2431 Aerial Wire 0 0 0 1,473 48,19377 2441 Conduit Systems 594,839 608,084 196,273 71,241 2,600,55978 2410 Total Cable and Wire Facilities 4,441,188 3,121,705 1,544,821 367,653 12,920,466
79 240 Total TPIS (Before Amortizable Assets) 9,594,524 7,232,194 3,441,083 699,885 31,551,338
TPIS - Amortizable Assets:80 2681 Capital Leases 4,371 1,984 0 0 27,90881 2682 Leasehold Improvements 9,459 3,631 1,672 1,386 75,43982 2680 Total Amortizable Tangible Assets 13,830 5,615 1,672 1,386 103,347
83 2690 Intangibles 19,953 15,179 8,568 174 27,143
84 260 Total Telecommunications Plant in Service 9,628,307 7,252,988 3,451,323 701,445 31,681,828
Depreciation And Amortization:85 3100 Accumulated Depreciation - TPIS 5,798,431 4,022,934 1,732,144 337,167 16,242,83586 3200 Accumulated Depreciation - PHFTU 0 0 0 0 087 3300 Accumulated Depreciation - Nonoperating 1,367 0 365 249 2,94188 3410 Accumulated Amortization - Capitalized Leases 3,654 1,415 0 0 18,02789 3420 Accumulated Amortization - Leasehold Improve. 4,908 1,678 451 1,155 52,29490 3400 Total Accumulated Amortization - Tangibles 8,562 3,093 451 1,155 70,321
91 3500 Accumulated Amortization - Intangibles 3,660 3,293 1,687 (2) 2,01092 3600 Accumulated Amortization - Other 0 0 180 0 093 340 Total Depreciation and Amortization 5,812,020 4,029,320 1,734,827 338,569 16,318,107
94 350 Net Plant 3,955,430 3,300,713 1,746,636 382,957 16,389,944
95 360 Total Assets 4,409,051 4,391,495 2,074,221 447,106 18,591,413
63
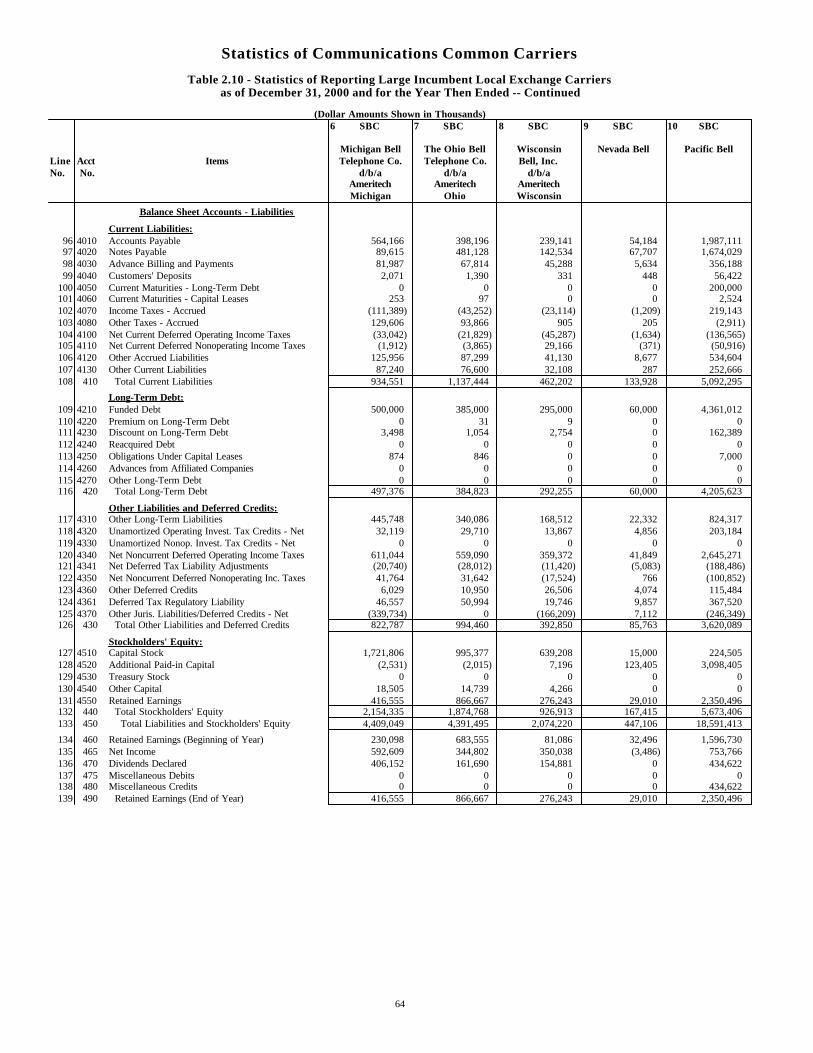
Statistics of Communications Common Carriers
Table 2.10 - Statistics of Reporting Large Incumbent Local Exchange Carriersas of December 31, 2000 and for the Year Then Ended -- Continued
(Dollar Amounts Shown in Thousands)6 SBC 7 SBC 8 SBC 9 SBC 10 SBC
Michigan Bell The Ohio Bell Wisconsin Nevada Bell Pacific BellLine Acct Items Telephone Co. Telephone Co. Bell, Inc.No. No. d/b/a d/b/a d/b/a
Ameritech Ameritech AmeritechMichigan Ohio Wisconsin
Balance Sheet Accounts - Liabilities
Current Liabilities:96 4010 Accounts Payable 564,166 398,196 239,141 54,184 1,987,11197 4020 Notes Payable 89,615 481,128 142,534 67,707 1,674,02998 4030 Advance Billing and Payments 81,987 67,814 45,288 5,634 356,18899 4040 Customers' Deposits 2,071 1,390 331 448 56,422
100 4050 Current Maturities - Long-Term Debt 0 0 0 0 200,000101 4060 Current Maturities - Capital Leases 253 97 0 0 2,524102 4070 Income Taxes - Accrued (111,389) (43,252) (23,114) (1,209) 219,143103 4080 Other Taxes - Accrued 129,606 93,866 905 205 (2,911)104 4100 Net Current Deferred Operating Income Taxes (33,042) (21,829) (45,287) (1,634) (136,565)105 4110 Net Current Deferred Nonoperating Income Taxes (1,912) (3,865) 29,166 (371) (50,916)106 4120 Other Accrued Liabilities 125,956 87,299 41,130 8,677 534,604107 4130 Other Current Liabilities 87,240 76,600 32,108 287 252,666108 410 Total Current Liabilities 934,551 1,137,444 462,202 133,928 5,092,295
Long-Term Debt:109 4210 Funded Debt 500,000 385,000 295,000 60,000 4,361,012110 4220 Premium on Long-Term Debt 0 31 9 0 0111 4230 Discount on Long-Term Debt 3,498 1,054 2,754 0 162,389112 4240 Reacquired Debt 0 0 0 0 0113 4250 Obligations Under Capital Leases 874 846 0 0 7,000114 4260 Advances from Affiliated Companies 0 0 0 0 0115 4270 Other Long-Term Debt 0 0 0 0 0116 420 Total Long-Term Debt 497,376 384,823 292,255 60,000 4,205,623
Other Liabilities and Deferred Credits:117 4310 Other Long-Term Liabilities 445,748 340,086 168,512 22,332 824,317118 4320 Unamortized Operating Invest. Tax Credits - Net 32,119 29,710 13,867 4,856 203,184119 4330 Unamortized Nonop. Invest. Tax Credits - Net 0 0 0 0 0120 4340 Net Noncurrent Deferred Operating Income Taxes 611,044 559,090 359,372 41,849 2,645,271121 4341 Net Deferred Tax Liability Adjustments (20,740) (28,012) (11,420) (5,083) (188,486)122 4350 Net Noncurrent Deferred Nonoperating Inc. Taxes 41,764 31,642 (17,524) 766 (100,852)123 4360 Other Deferred Credits 6,029 10,950 26,506 4,074 115,484124 4361 Deferred Tax Regulatory Liability 46,557 50,994 19,746 9,857 367,520125 4370 Other Juris. Liabilities/Deferred Credits - Net (339,734) 0 (166,209) 7,112 (246,349)126 430 Total Other Liabilities and Deferred Credits 822,787 994,460 392,850 85,763 3,620,089
Stockholders' Equity:127 4510 Capital Stock 1,721,806 995,377 639,208 15,000 224,505128 4520 Additional Paid-in Capital (2,531) (2,015) 7,196 123,405 3,098,405129 4530 Treasury Stock 0 0 0 0 0130 4540 Other Capital 18,505 14,739 4,266 0 0131 4550 Retained Earnings 416,555 866,667 276,243 29,010 2,350,496132 440 Total Stockholders' Equity 2,154,335 1,874,768 926,913 167,415 5,673,406133 450 Total Liabilities and Stockholders' Equity 4,409,049 4,391,495 2,074,220 447,106 18,591,413
134 460 Retained Earnings (Beginning of Year) 230,098 683,555 81,086 32,496 1,596,730135 465 Net Income 592,609 344,802 350,038 (3,486) 753,766136 470 Dividends Declared 406,152 161,690 154,881 0 434,622137 475 Miscellaneous Debits 0 0 0 0 0138 480 Miscellaneous Credits 0 0 0 0 434,622139 490 Retained Earnings (End of Year) 416,555 866,667 276,243 29,010 2,350,496
64
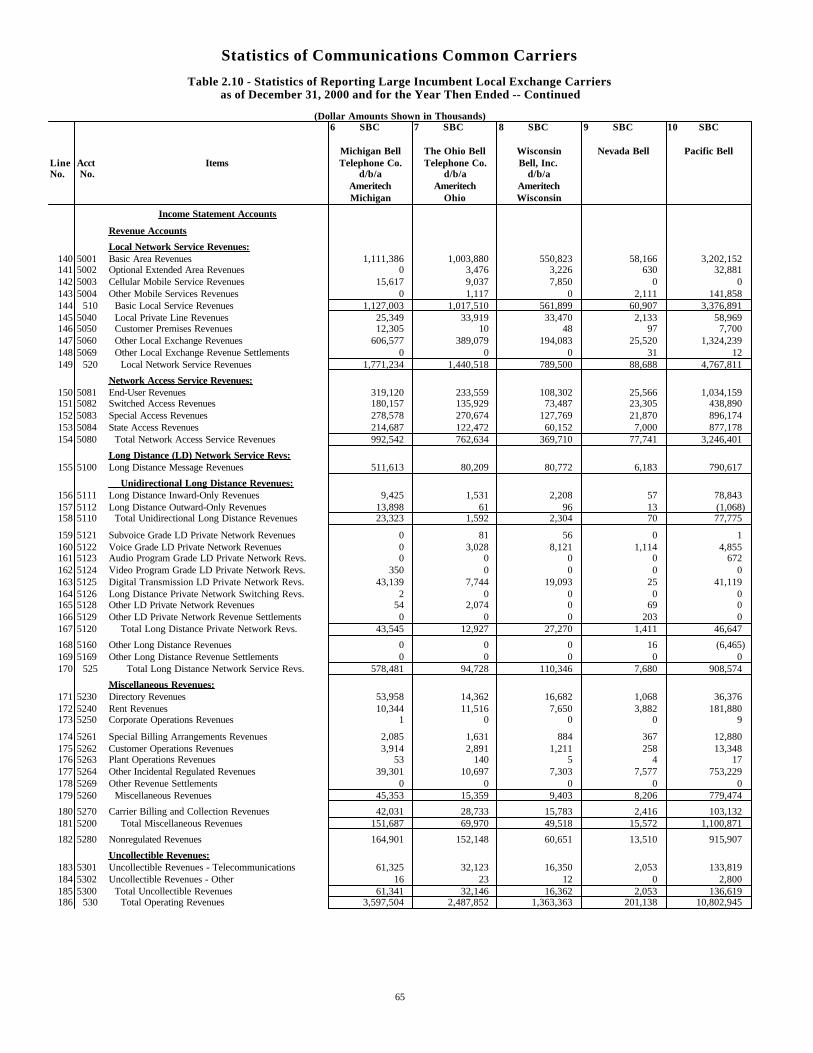
Statistics of Communications Common Carriers
Table 2.10 - Statistics of Reporting Large Incumbent Local Exchange Carriersas of December 31, 2000 and for the Year Then Ended -- Continued
(Dollar Amounts Shown in Thousands)6 SBC 7 SBC 8 SBC 9 SBC 10 SBC
Michigan Bell The Ohio Bell Wisconsin Nevada Bell Pacific BellLine Acct Items Telephone Co. Telephone Co. Bell, Inc.No. No. d/b/a d/b/a d/b/a
Ameritech Ameritech AmeritechMichigan Ohio Wisconsin
Income Statement Accounts
Revenue Accounts
Local Network Service Revenues:140 5001 Basic Area Revenues 1,111,386 1,003,880 550,823 58,166 3,202,152141 5002 Optional Extended Area Revenues 0 3,476 3,226 630 32,881142 5003 Cellular Mobile Service Revenues 15,617 9,037 7,850 0 0143 5004 Other Mobile Services Revenues 0 1,117 0 2,111 141,858144 510 Basic Local Service Revenues 1,127,003 1,017,510 561,899 60,907 3,376,891145 5040 Local Private Line Revenues 25,349 33,919 33,470 2,133 58,969146 5050 Customer Premises Revenues 12,305 10 48 97 7,700147 5060 Other Local Exchange Revenues 606,577 389,079 194,083 25,520 1,324,239148 5069 Other Local Exchange Revenue Settlements 0 0 0 31 12149 520 Local Network Service Revenues 1,771,234 1,440,518 789,500 88,688 4,767,811
Network Access Service Revenues:150 5081 End-User Revenues 319,120 233,559 108,302 25,566 1,034,159151 5082 Switched Access Revenues 180,157 135,929 73,487 23,305 438,890152 5083 Special Access Revenues 278,578 270,674 127,769 21,870 896,174153 5084 State Access Revenues 214,687 122,472 60,152 7,000 877,178154 5080 Total Network Access Service Revenues 992,542 762,634 369,710 77,741 3,246,401
Long Distance (LD) Network Service Revs:155 5100 Long Distance Message Revenues 511,613 80,209 80,772 6,183 790,617
Unidirectional Long Distance Revenues:156 5111 Long Distance Inward-Only Revenues 9,425 1,531 2,208 57 78,843157 5112 Long Distance Outward-Only Revenues 13,898 61 96 13 (1,068)158 5110 Total Unidirectional Long Distance Revenues 23,323 1,592 2,304 70 77,775
159 5121 Subvoice Grade LD Private Network Revenues 0 81 56 0 1160 5122 Voice Grade LD Private Network Revenues 0 3,028 8,121 1,114 4,855161 5123 Audio Program Grade LD Private Network Revs. 0 0 0 0 672162 5124 Video Program Grade LD Private Network Revs. 350 0 0 0 0163 5125 Digital Transmission LD Private Network Revs. 43,139 7,744 19,093 25 41,119164 5126 Long Distance Private Network Switching Revs. 2 0 0 0 0165 5128 Other LD Private Network Revenues 54 2,074 0 69 0166 5129 Other LD Private Network Revenue Settlements 0 0 0 203 0167 5120 Total Long Distance Private Network Revs. 43,545 12,927 27,270 1,411 46,647
168 5160 Other Long Distance Revenues 0 0 0 16 (6,465)169 5169 Other Long Distance Revenue Settlements 0 0 0 0 0170 525 Total Long Distance Network Service Revs. 578,481 94,728 110,346 7,680 908,574
Miscellaneous Revenues:171 5230 Directory Revenues 53,958 14,362 16,682 1,068 36,376172 5240 Rent Revenues 10,344 11,516 7,650 3,882 181,880173 5250 Corporate Operations Revenues 1 0 0 0 9
174 5261 Special Billing Arrangements Revenues 2,085 1,631 884 367 12,880175 5262 Customer Operations Revenues 3,914 2,891 1,211 258 13,348176 5263 Plant Operations Revenues 53 140 5 4 17177 5264 Other Incidental Regulated Revenues 39,301 10,697 7,303 7,577 753,229178 5269 Other Revenue Settlements 0 0 0 0 0179 5260 Miscellaneous Revenues 45,353 15,359 9,403 8,206 779,474
180 5270 Carrier Billing and Collection Revenues 42,031 28,733 15,783 2,416 103,132181 5200 Total Miscellaneous Revenues 151,687 69,970 49,518 15,572 1,100,871
182 5280 Nonregulated Revenues 164,901 152,148 60,651 13,510 915,907
Uncollectible Revenues:183 5301 Uncollectible Revenues - Telecommunications 61,325 32,123 16,350 2,053 133,819184 5302 Uncollectible Revenues - Other 16 23 12 0 2,800185 5300 Total Uncollectible Revenues 61,341 32,146 16,362 2,053 136,619186 530 Total Operating Revenues 3,597,504 2,487,852 1,363,363 201,138 10,802,945
65
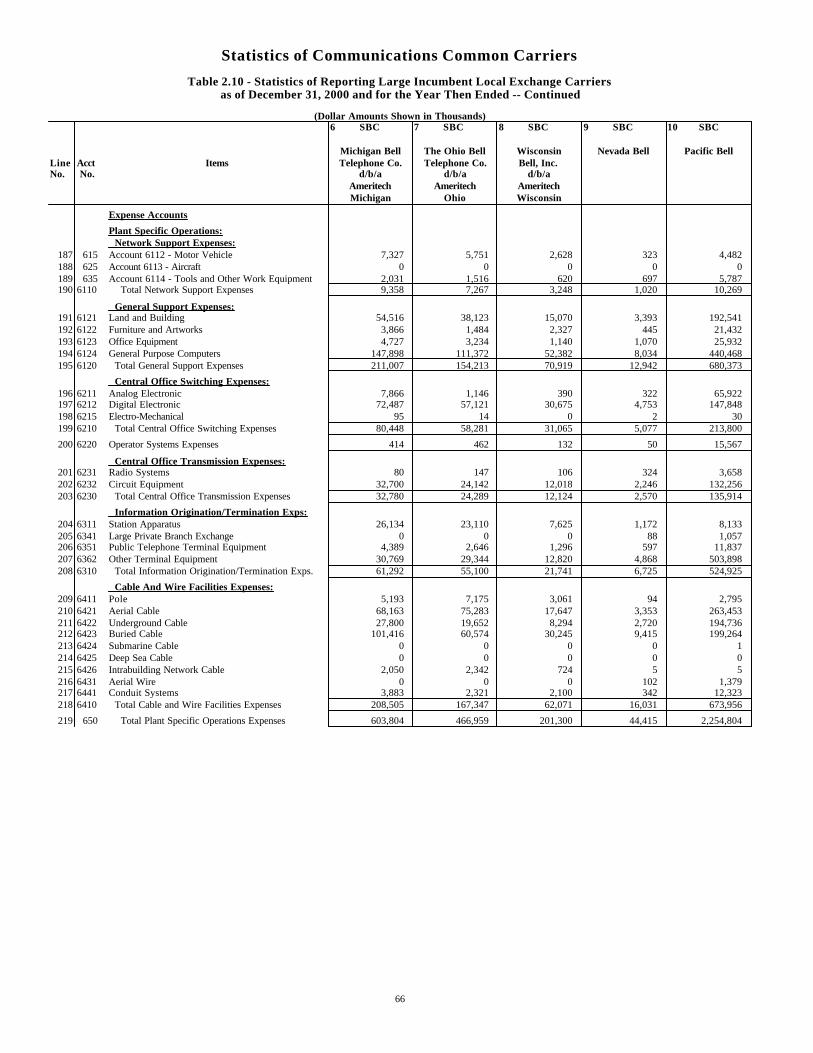
Statistics of Communications Common Carriers
Table 2.10 - Statistics of Reporting Large Incumbent Local Exchange Carriersas of December 31, 2000 and for the Year Then Ended -- Continued
(Dollar Amounts Shown in Thousands)6 SBC 7 SBC 8 SBC 9 SBC 10 SBC
Michigan Bell The Ohio Bell Wisconsin Nevada Bell Pacific BellLine Acct Items Telephone Co. Telephone Co. Bell, Inc.No. No. d/b/a d/b/a d/b/a
Ameritech Ameritech AmeritechMichigan Ohio Wisconsin
Expense Accounts
Plant Specific Operations: Network Support Expenses:
187 615 Account 6112 - Motor Vehicle 7,327 5,751 2,628 323 4,482188 625 Account 6113 - Aircraft 0 0 0 0 0189 635 Account 6114 - Tools and Other Work Equipment 2,031 1,516 620 697 5,787190 6110 Total Network Support Expenses 9,358 7,267 3,248 1,020 10,269
General Support Expenses:191 6121 Land and Building 54,516 38,123 15,070 3,393 192,541192 6122 Furniture and Artworks 3,866 1,484 2,327 445 21,432193 6123 Office Equipment 4,727 3,234 1,140 1,070 25,932194 6124 General Purpose Computers 147,898 111,372 52,382 8,034 440,468195 6120 Total General Support Expenses 211,007 154,213 70,919 12,942 680,373
Central Office Switching Expenses:196 6211 Analog Electronic 7,866 1,146 390 322 65,922197 6212 Digital Electronic 72,487 57,121 30,675 4,753 147,848198 6215 Electro-Mechanical 95 14 0 2 30199 6210 Total Central Office Switching Expenses 80,448 58,281 31,065 5,077 213,800
200 6220 Operator Systems Expenses 414 462 132 50 15,567
Central Office Transmission Expenses:201 6231 Radio Systems 80 147 106 324 3,658202 6232 Circuit Equipment 32,700 24,142 12,018 2,246 132,256203 6230 Total Central Office Transmission Expenses 32,780 24,289 12,124 2,570 135,914
Information Origination/Termination Exps:204 6311 Station Apparatus 26,134 23,110 7,625 1,172 8,133205 6341 Large Private Branch Exchange 0 0 0 88 1,057206 6351 Public Telephone Terminal Equipment 4,389 2,646 1,296 597 11,837207 6362 Other Terminal Equipment 30,769 29,344 12,820 4,868 503,898208 6310 Total Information Origination/Termination Exps. 61,292 55,100 21,741 6,725 524,925
Cable And Wire Facilities Expenses:209 6411 Pole 5,193 7,175 3,061 94 2,795210 6421 Aerial Cable 68,163 75,283 17,647 3,353 263,453211 6422 Underground Cable 27,800 19,652 8,294 2,720 194,736212 6423 Buried Cable 101,416 60,574 30,245 9,415 199,264213 6424 Submarine Cable 0 0 0 0 1214 6425 Deep Sea Cable 0 0 0 0 0215 6426 Intrabuilding Network Cable 2,050 2,342 724 5 5216 6431 Aerial Wire 0 0 0 102 1,379217 6441 Conduit Systems 3,883 2,321 2,100 342 12,323218 6410 Total Cable and Wire Facilities Expenses 208,505 167,347 62,071 16,031 673,956
219 650 Total Plant Specific Operations Expenses 603,804 466,959 201,300 44,415 2,254,804
66
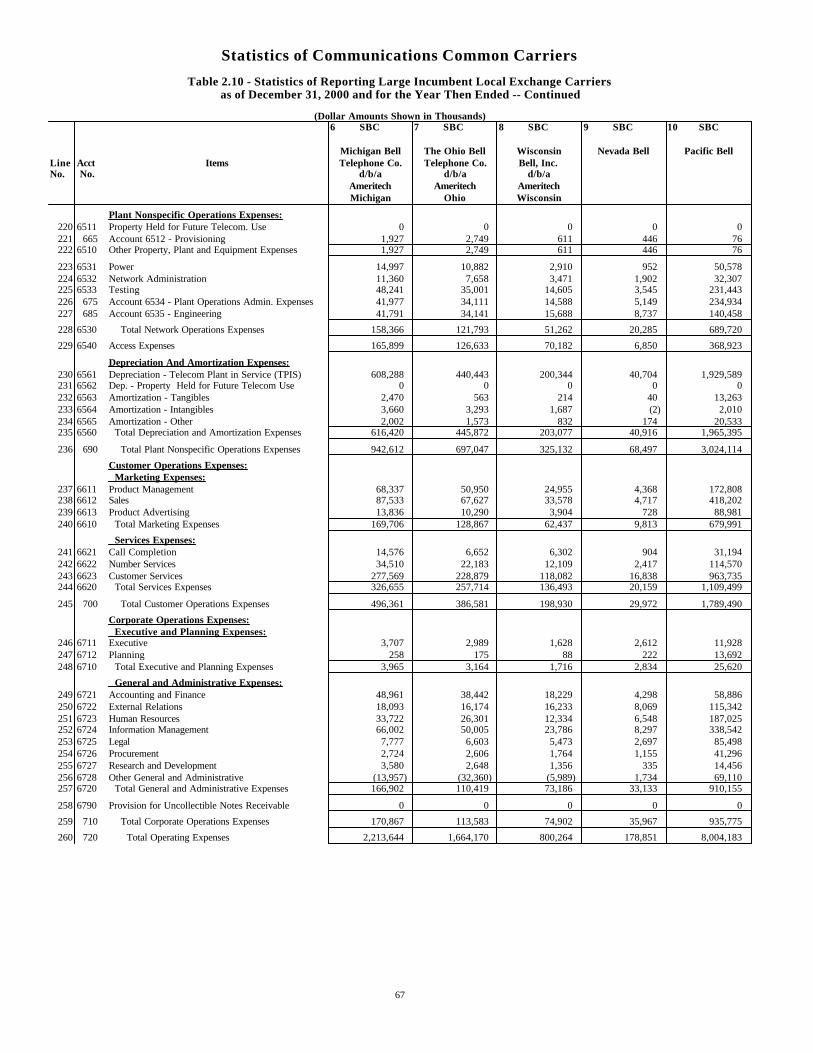
Statistics of Communications Common Carriers
Table 2.10 - Statistics of Reporting Large Incumbent Local Exchange Carriersas of December 31, 2000 and for the Year Then Ended -- Continued
(Dollar Amounts Shown in Thousands)6 SBC 7 SBC 8 SBC 9 SBC 10 SBC
Michigan Bell The Ohio Bell Wisconsin Nevada Bell Pacific BellLine Acct Items Telephone Co. Telephone Co. Bell, Inc.No. No. d/b/a d/b/a d/b/a
Ameritech Ameritech AmeritechMichigan Ohio Wisconsin
Plant Nonspecific Operations Expenses:220 6511 Property Held for Future Telecom. Use 0 0 0 0 0221 665 Account 6512 - Provisioning 1,927 2,749 611 446 76222 6510 Other Property, Plant and Equipment Expenses 1,927 2,749 611 446 76
223 6531 Power 14,997 10,882 2,910 952 50,578224 6532 Network Administration 11,360 7,658 3,471 1,902 32,307225 6533 Testing 48,241 35,001 14,605 3,545 231,443226 675 Account 6534 - Plant Operations Admin. Expenses 41,977 34,111 14,588 5,149 234,934227 685 Account 6535 - Engineering 41,791 34,141 15,688 8,737 140,458
228 6530 Total Network Operations Expenses 158,366 121,793 51,262 20,285 689,720
229 6540 Access Expenses 165,899 126,633 70,182 6,850 368,923
Depreciation And Amortization Expenses:230 6561 Depreciation - Telecom Plant in Service (TPIS) 608,288 440,443 200,344 40,704 1,929,589231 6562 Dep. - Property Held for Future Telecom Use 0 0 0 0 0232 6563 Amortization - Tangibles 2,470 563 214 40 13,263233 6564 Amortization - Intangibles 3,660 3,293 1,687 (2) 2,010234 6565 Amortization - Other 2,002 1,573 832 174 20,533235 6560 Total Depreciation and Amortization Expenses 616,420 445,872 203,077 40,916 1,965,395
236 690 Total Plant Nonspecific Operations Expenses 942,612 697,047 325,132 68,497 3,024,114
Customer Operations Expenses: Marketing Expenses:
237 6611 Product Management 68,337 50,950 24,955 4,368 172,808238 6612 Sales 87,533 67,627 33,578 4,717 418,202239 6613 Product Advertising 13,836 10,290 3,904 728 88,981240 6610 Total Marketing Expenses 169,706 128,867 62,437 9,813 679,991
Services Expenses:241 6621 Call Completion 14,576 6,652 6,302 904 31,194242 6622 Number Services 34,510 22,183 12,109 2,417 114,570243 6623 Customer Services 277,569 228,879 118,082 16,838 963,735244 6620 Total Services Expenses 326,655 257,714 136,493 20,159 1,109,499
245 700 Total Customer Operations Expenses 496,361 386,581 198,930 29,972 1,789,490
Corporate Operations Expenses: Executive and Planning Expenses:
246 6711 Executive 3,707 2,989 1,628 2,612 11,928247 6712 Planning 258 175 88 222 13,692248 6710 Total Executive and Planning Expenses 3,965 3,164 1,716 2,834 25,620
General and Administrative Expenses:249 6721 Accounting and Finance 48,961 38,442 18,229 4,298 58,886250 6722 External Relations 18,093 16,174 16,233 8,069 115,342251 6723 Human Resources 33,722 26,301 12,334 6,548 187,025252 6724 Information Management 66,002 50,005 23,786 8,297 338,542253 6725 Legal 7,777 6,603 5,473 2,697 85,498254 6726 Procurement 2,724 2,606 1,764 1,155 41,296255 6727 Research and Development 3,580 2,648 1,356 335 14,456256 6728 Other General and Administrative (13,957) (32,360) (5,989) 1,734 69,110257 6720 Total General and Administrative Expenses 166,902 110,419 73,186 33,133 910,155
258 6790 Provision for Uncollectible Notes Receivable 0 0 0 0 0
259 710 Total Corporate Operations Expenses 170,867 113,583 74,902 35,967 935,775
260 720 Total Operating Expenses 2,213,644 1,664,170 800,264 178,851 8,004,183
67
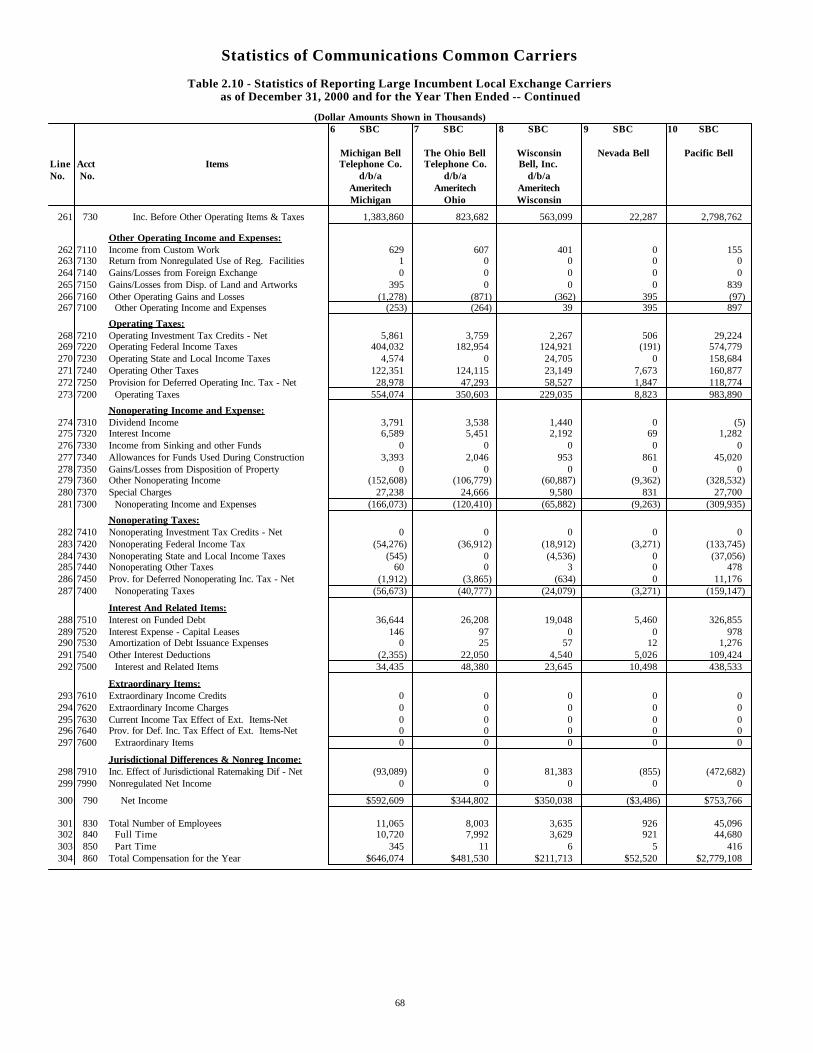
Statistics of Communications Common Carriers
Table 2.10 - Statistics of Reporting Large Incumbent Local Exchange Carriersas of December 31, 2000 and for the Year Then Ended -- Continued
(Dollar Amounts Shown in Thousands)6 SBC 7 SBC 8 SBC 9 SBC 10 SBC
Michigan Bell The Ohio Bell Wisconsin Nevada Bell Pacific BellLine Acct Items Telephone Co. Telephone Co. Bell, Inc.No. No. d/b/a d/b/a d/b/a
Ameritech Ameritech AmeritechMichigan Ohio Wisconsin
261 730 Inc. Before Other Operating Items & Taxes 1,383,860 823,682 563,099 22,287 2,798,762
Other Operating Income and Expenses:262 7110 Income from Custom Work 629 607 401 0 155263 7130 Return from Nonregulated Use of Reg. Facilities 1 0 0 0 0264 7140 Gains/Losses from Foreign Exchange 0 0 0 0 0265 7150 Gains/Losses from Disp. of Land and Artworks 395 0 0 0 839266 7160 Other Operating Gains and Losses (1,278) (871) (362) 395 (97)267 7100 Other Operating Income and Expenses (253) (264) 39 395 897
Operating Taxes:268 7210 Operating Investment Tax Credits - Net 5,861 3,759 2,267 506 29,224269 7220 Operating Federal Income Taxes 404,032 182,954 124,921 (191) 574,779270 7230 Operating State and Local Income Taxes 4,574 0 24,705 0 158,684271 7240 Operating Other Taxes 122,351 124,115 23,149 7,673 160,877272 7250 Provision for Deferred Operating Inc. Tax - Net 28,978 47,293 58,527 1,847 118,774273 7200 Operating Taxes 554,074 350,603 229,035 8,823 983,890
Nonoperating Income and Expense:274 7310 Dividend Income 3,791 3,538 1,440 0 (5)275 7320 Interest Income 6,589 5,451 2,192 69 1,282276 7330 Income from Sinking and other Funds 0 0 0 0 0277 7340 Allowances for Funds Used During Construction 3,393 2,046 953 861 45,020278 7350 Gains/Losses from Disposition of Property 0 0 0 0 0279 7360 Other Nonoperating Income (152,608) (106,779) (60,887) (9,362) (328,532)280 7370 Special Charges 27,238 24,666 9,580 831 27,700281 7300 Nonoperating Income and Expenses (166,073) (120,410) (65,882) (9,263) (309,935)
Nonoperating Taxes:282 7410 Nonoperating Investment Tax Credits - Net 0 0 0 0 0283 7420 Nonoperating Federal Income Tax (54,276) (36,912) (18,912) (3,271) (133,745)284 7430 Nonoperating State and Local Income Taxes (545) 0 (4,536) 0 (37,056)285 7440 Nonoperating Other Taxes 60 0 3 0 478286 7450 Prov. for Deferred Nonoperating Inc. Tax - Net (1,912) (3,865) (634) 0 11,176287 7400 Nonoperating Taxes (56,673) (40,777) (24,079) (3,271) (159,147)
Interest And Related Items:288 7510 Interest on Funded Debt 36,644 26,208 19,048 5,460 326,855289 7520 Interest Expense - Capital Leases 146 97 0 0 978290 7530 Amortization of Debt Issuance Expenses 0 25 57 12 1,276291 7540 Other Interest Deductions (2,355) 22,050 4,540 5,026 109,424292 7500 Interest and Related Items 34,435 48,380 23,645 10,498 438,533
Extraordinary Items:293 7610 Extraordinary Income Credits 0 0 0 0 0294 7620 Extraordinary Income Charges 0 0 0 0 0295 7630 Current Income Tax Effect of Ext. Items-Net 0 0 0 0 0296 7640 Prov. for Def. Inc. Tax Effect of Ext. Items-Net 0 0 0 0 0297 7600 Extraordinary Items 0 0 0 0 0
Jurisdictional Differences & Nonreg Income:298 7910 Inc. Effect of Jurisdictional Ratemaking Dif - Net (93,089) 0 81,383 (855) (472,682)299 7990 Nonregulated Net Income 0 0 0 0 0
300 790 Net Income $592,609 $344,802 $350,038 ($3,486) $753,766
301 830 Total Number of Employees 11,065 8,003 3,635 926 45,096302 840 Full Time 10,720 7,992 3,629 921 44,680303 850 Part Time 345 11 6 5 416304 860 Total Compensation for the Year $646,074 $481,530 $211,713 $52,520 $2,779,108
68
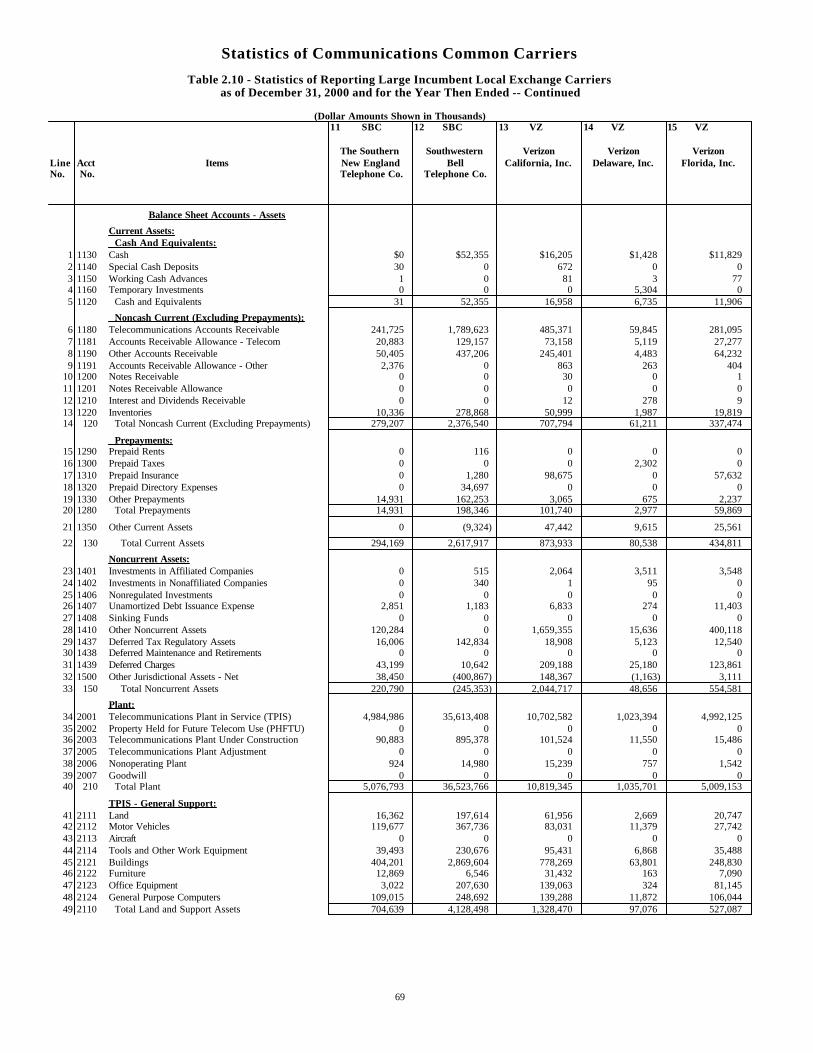
Statistics of Communications Common Carriers
Table 2.10 - Statistics of Reporting Large Incumbent Local Exchange Carriersas of December 31, 2000 and for the Year Then Ended -- Continued
(Dollar Amounts Shown in Thousands)11 SBC 12 SBC 13 VZ 14 VZ 15 VZ
The Southern Southwestern Verizon Verizon VerizonLine Acct Items New England Bell California, Inc. Delaware, Inc. Florida, Inc.No. No. Telephone Co. Telephone Co.
Balance Sheet Accounts - Assets
Current Assets: Cash And Equivalents:
1 1130 Cash $0 $52,355 $16,205 $1,428 $11,8292 1140 Special Cash Deposits 30 0 672 0 03 1150 Working Cash Advances 1 0 81 3 774 1160 Temporary Investments 0 0 0 5,304 05 1120 Cash and Equivalents 31 52,355 16,958 6,735 11,906
Noncash Current (Excluding Prepayments):6 1180 Telecommunications Accounts Receivable 241,725 1,789,623 485,371 59,845 281,0957 1181 Accounts Receivable Allowance - Telecom 20,883 129,157 73,158 5,119 27,2778 1190 Other Accounts Receivable 50,405 437,206 245,401 4,483 64,2329 1191 Accounts Receivable Allowance - Other 2,376 0 863 263 404
10 1200 Notes Receivable 0 0 30 0 111 1201 Notes Receivable Allowance 0 0 0 0 012 1210 Interest and Dividends Receivable 0 0 12 278 913 1220 Inventories 10,336 278,868 50,999 1,987 19,81914 120 Total Noncash Current (Excluding Prepayments) 279,207 2,376,540 707,794 61,211 337,474
Prepayments:15 1290 Prepaid Rents 0 116 0 0 016 1300 Prepaid Taxes 0 0 0 2,302 017 1310 Prepaid Insurance 0 1,280 98,675 0 57,63218 1320 Prepaid Directory Expenses 0 34,697 0 0 019 1330 Other Prepayments 14,931 162,253 3,065 675 2,23720 1280 Total Prepayments 14,931 198,346 101,740 2,977 59,869
21 1350 Other Current Assets 0 (9,324) 47,442 9,615 25,561
22 130 Total Current Assets 294,169 2,617,917 873,933 80,538 434,811
Noncurrent Assets:23 1401 Investments in Affiliated Companies 0 515 2,064 3,511 3,54824 1402 Investments in Nonaffiliated Companies 0 340 1 95 025 1406 Nonregulated Investments 0 0 0 0 026 1407 Unamortized Debt Issuance Expense 2,851 1,183 6,833 274 11,40327 1408 Sinking Funds 0 0 0 0 028 1410 Other Noncurrent Assets 120,284 0 1,659,355 15,636 400,11829 1437 Deferred Tax Regulatory Assets 16,006 142,834 18,908 5,123 12,54030 1438 Deferred Maintenance and Retirements 0 0 0 0 031 1439 Deferred Charges 43,199 10,642 209,188 25,180 123,86132 1500 Other Jurisdictional Assets - Net 38,450 (400,867) 148,367 (1,163) 3,11133 150 Total Noncurrent Assets 220,790 (245,353) 2,044,717 48,656 554,581
Plant:34 2001 Telecommunications Plant in Service (TPIS) 4,984,986 35,613,408 10,702,582 1,023,394 4,992,12535 2002 Property Held for Future Telecom Use (PHFTU) 0 0 0 0 036 2003 Telecommunications Plant Under Construction 90,883 895,378 101,524 11,550 15,48637 2005 Telecommunications Plant Adjustment 0 0 0 0 038 2006 Nonoperating Plant 924 14,980 15,239 757 1,54239 2007 Goodwill 0 0 0 0 040 210 Total Plant 5,076,793 36,523,766 10,819,345 1,035,701 5,009,153
TPIS - General Support:41 2111 Land 16,362 197,614 61,956 2,669 20,74742 2112 Motor Vehicles 119,677 367,736 83,031 11,379 27,74243 2113 Aircraft 0 0 0 0 044 2114 Tools and Other Work Equipment 39,493 230,676 95,431 6,868 35,48845 2121 Buildings 404,201 2,869,604 778,269 63,801 248,83046 2122 Furniture 12,869 6,546 31,432 163 7,09047 2123 Office Equipment 3,022 207,630 139,063 324 81,14548 2124 General Purpose Computers 109,015 248,692 139,288 11,872 106,04449 2110 Total Land and Support Assets 704,639 4,128,498 1,328,470 97,076 527,087
69
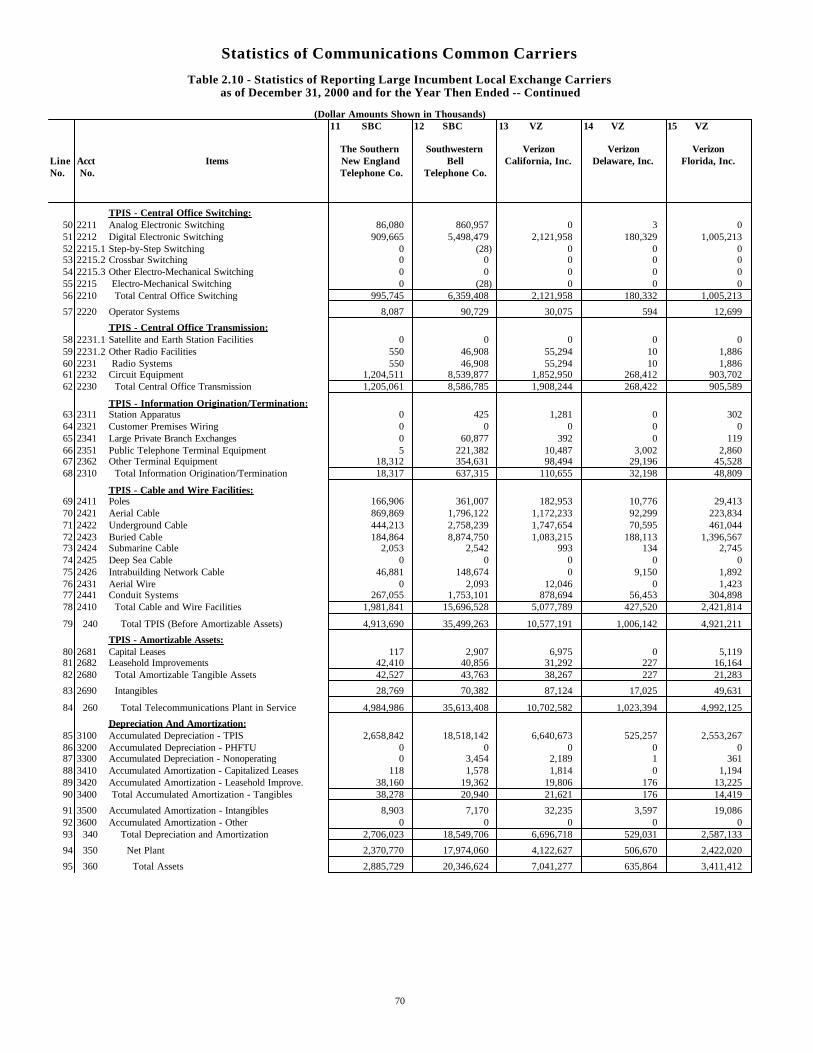
Statistics of Communications Common Carriers
Table 2.10 - Statistics of Reporting Large Incumbent Local Exchange Carriersas of December 31, 2000 and for the Year Then Ended -- Continued
(Dollar Amounts Shown in Thousands)11 SBC 12 SBC 13 VZ 14 VZ 15 VZ
The Southern Southwestern Verizon Verizon VerizonLine Acct Items New England Bell California, Inc. Delaware, Inc. Florida, Inc.No. No. Telephone Co. Telephone Co.
TPIS - Central Office Switching:50 2211 Analog Electronic Switching 86,080 860,957 0 3 051 2212 Digital Electronic Switching 909,665 5,498,479 2,121,958 180,329 1,005,21352 2215.1 Step-by-Step Switching 0 (28) 0 0 053 2215.2 Crossbar Switching 0 0 0 0 054 2215.3 Other Electro-Mechanical Switching 0 0 0 0 055 2215 Electro-Mechanical Switching 0 (28) 0 0 056 2210 Total Central Office Switching 995,745 6,359,408 2,121,958 180,332 1,005,213
57 2220 Operator Systems 8,087 90,729 30,075 594 12,699
TPIS - Central Office Transmission:58 2231.1 Satellite and Earth Station Facilities 0 0 0 0 059 2231.2 Other Radio Facilities 550 46,908 55,294 10 1,88660 2231 Radio Systems 550 46,908 55,294 10 1,88661 2232 Circuit Equipment 1,204,511 8,539,877 1,852,950 268,412 903,70262 2230 Total Central Office Transmission 1,205,061 8,586,785 1,908,244 268,422 905,589
TPIS - Information Origination/Termination:63 2311 Station Apparatus 0 425 1,281 0 30264 2321 Customer Premises Wiring 0 0 0 0 065 2341 Large Private Branch Exchanges 0 60,877 392 0 11966 2351 Public Telephone Terminal Equipment 5 221,382 10,487 3,002 2,86067 2362 Other Terminal Equipment 18,312 354,631 98,494 29,196 45,52868 2310 Total Information Origination/Termination 18,317 637,315 110,655 32,198 48,809
TPIS - Cable and Wire Facilities:69 2411 Poles 166,906 361,007 182,953 10,776 29,41370 2421 Aerial Cable 869,869 1,796,122 1,172,233 92,299 223,83471 2422 Underground Cable 444,213 2,758,239 1,747,654 70,595 461,04472 2423 Buried Cable 184,864 8,874,750 1,083,215 188,113 1,396,56773 2424 Submarine Cable 2,053 2,542 993 134 2,74574 2425 Deep Sea Cable 0 0 0 0 075 2426 Intrabuilding Network Cable 46,881 148,674 0 9,150 1,89276 2431 Aerial Wire 0 2,093 12,046 0 1,42377 2441 Conduit Systems 267,055 1,753,101 878,694 56,453 304,89878 2410 Total Cable and Wire Facilities 1,981,841 15,696,528 5,077,789 427,520 2,421,814
79 240 Total TPIS (Before Amortizable Assets) 4,913,690 35,499,263 10,577,191 1,006,142 4,921,211
TPIS - Amortizable Assets:80 2681 Capital Leases 117 2,907 6,975 0 5,11981 2682 Leasehold Improvements 42,410 40,856 31,292 227 16,16482 2680 Total Amortizable Tangible Assets 42,527 43,763 38,267 227 21,283
83 2690 Intangibles 28,769 70,382 87,124 17,025 49,631
84 260 Total Telecommunications Plant in Service 4,984,986 35,613,408 10,702,582 1,023,394 4,992,125
Depreciation And Amortization:85 3100 Accumulated Depreciation - TPIS 2,658,842 18,518,142 6,640,673 525,257 2,553,26786 3200 Accumulated Depreciation - PHFTU 0 0 0 0 087 3300 Accumulated Depreciation - Nonoperating 0 3,454 2,189 1 36188 3410 Accumulated Amortization - Capitalized Leases 118 1,578 1,814 0 1,19489 3420 Accumulated Amortization - Leasehold Improve. 38,160 19,362 19,806 176 13,22590 3400 Total Accumulated Amortization - Tangibles 38,278 20,940 21,621 176 14,419
91 3500 Accumulated Amortization - Intangibles 8,903 7,170 32,235 3,597 19,08692 3600 Accumulated Amortization - Other 0 0 0 0 093 340 Total Depreciation and Amortization 2,706,023 18,549,706 6,696,718 529,031 2,587,133
94 350 Net Plant 2,370,770 17,974,060 4,122,627 506,670 2,422,020
95 360 Total Assets 2,885,729 20,346,624 7,041,277 635,864 3,411,412
70
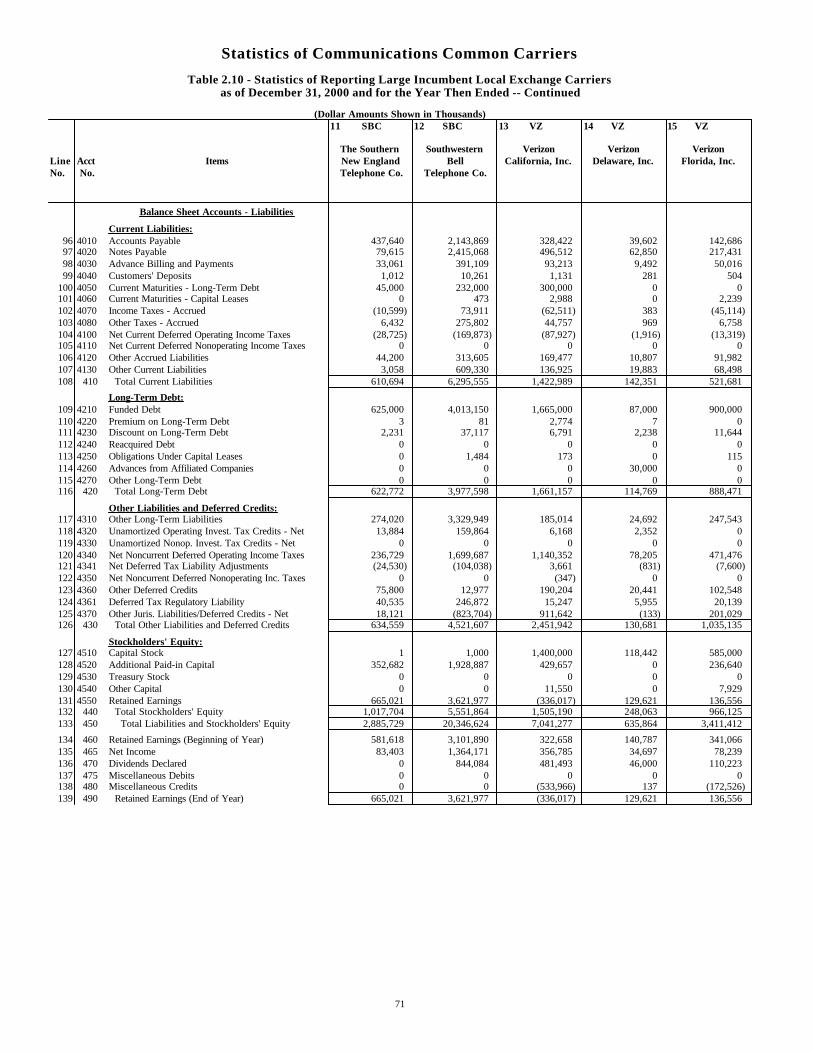
Statistics of Communications Common Carriers
Table 2.10 - Statistics of Reporting Large Incumbent Local Exchange Carriersas of December 31, 2000 and for the Year Then Ended -- Continued
(Dollar Amounts Shown in Thousands)11 SBC 12 SBC 13 VZ 14 VZ 15 VZ
The Southern Southwestern Verizon Verizon VerizonLine Acct Items New England Bell California, Inc. Delaware, Inc. Florida, Inc.No. No. Telephone Co. Telephone Co.
Balance Sheet Accounts - Liabilities
Current Liabilities:96 4010 Accounts Payable 437,640 2,143,869 328,422 39,602 142,68697 4020 Notes Payable 79,615 2,415,068 496,512 62,850 217,43198 4030 Advance Billing and Payments 33,061 391,109 93,213 9,492 50,01699 4040 Customers' Deposits 1,012 10,261 1,131 281 504
100 4050 Current Maturities - Long-Term Debt 45,000 232,000 300,000 0 0101 4060 Current Maturities - Capital Leases 0 473 2,988 0 2,239102 4070 Income Taxes - Accrued (10,599) 73,911 (62,511) 383 (45,114)103 4080 Other Taxes - Accrued 6,432 275,802 44,757 969 6,758104 4100 Net Current Deferred Operating Income Taxes (28,725) (169,873) (87,927) (1,916) (13,319)105 4110 Net Current Deferred Nonoperating Income Taxes 0 0 0 0 0106 4120 Other Accrued Liabilities 44,200 313,605 169,477 10,807 91,982107 4130 Other Current Liabilities 3,058 609,330 136,925 19,883 68,498108 410 Total Current Liabilities 610,694 6,295,555 1,422,989 142,351 521,681
Long-Term Debt:109 4210 Funded Debt 625,000 4,013,150 1,665,000 87,000 900,000110 4220 Premium on Long-Term Debt 3 81 2,774 7 0111 4230 Discount on Long-Term Debt 2,231 37,117 6,791 2,238 11,644112 4240 Reacquired Debt 0 0 0 0 0113 4250 Obligations Under Capital Leases 0 1,484 173 0 115114 4260 Advances from Affiliated Companies 0 0 0 30,000 0115 4270 Other Long-Term Debt 0 0 0 0 0116 420 Total Long-Term Debt 622,772 3,977,598 1,661,157 114,769 888,471
Other Liabilities and Deferred Credits:117 4310 Other Long-Term Liabilities 274,020 3,329,949 185,014 24,692 247,543118 4320 Unamortized Operating Invest. Tax Credits - Net 13,884 159,864 6,168 2,352 0119 4330 Unamortized Nonop. Invest. Tax Credits - Net 0 0 0 0 0120 4340 Net Noncurrent Deferred Operating Income Taxes 236,729 1,699,687 1,140,352 78,205 471,476121 4341 Net Deferred Tax Liability Adjustments (24,530) (104,038) 3,661 (831) (7,600)122 4350 Net Noncurrent Deferred Nonoperating Inc. Taxes 0 0 (347) 0 0123 4360 Other Deferred Credits 75,800 12,977 190,204 20,441 102,548124 4361 Deferred Tax Regulatory Liability 40,535 246,872 15,247 5,955 20,139125 4370 Other Juris. Liabilities/Deferred Credits - Net 18,121 (823,704) 911,642 (133) 201,029126 430 Total Other Liabilities and Deferred Credits 634,559 4,521,607 2,451,942 130,681 1,035,135
Stockholders' Equity:127 4510 Capital Stock 1 1,000 1,400,000 118,442 585,000128 4520 Additional Paid-in Capital 352,682 1,928,887 429,657 0 236,640129 4530 Treasury Stock 0 0 0 0 0130 4540 Other Capital 0 0 11,550 0 7,929131 4550 Retained Earnings 665,021 3,621,977 (336,017) 129,621 136,556132 440 Total Stockholders' Equity 1,017,704 5,551,864 1,505,190 248,063 966,125133 450 Total Liabilities and Stockholders' Equity 2,885,729 20,346,624 7,041,277 635,864 3,411,412
134 460 Retained Earnings (Beginning of Year) 581,618 3,101,890 322,658 140,787 341,066135 465 Net Income 83,403 1,364,171 356,785 34,697 78,239136 470 Dividends Declared 0 844,084 481,493 46,000 110,223137 475 Miscellaneous Debits 0 0 0 0 0138 480 Miscellaneous Credits 0 0 (533,966) 137 (172,526)139 490 Retained Earnings (End of Year) 665,021 3,621,977 (336,017) 129,621 136,556
71
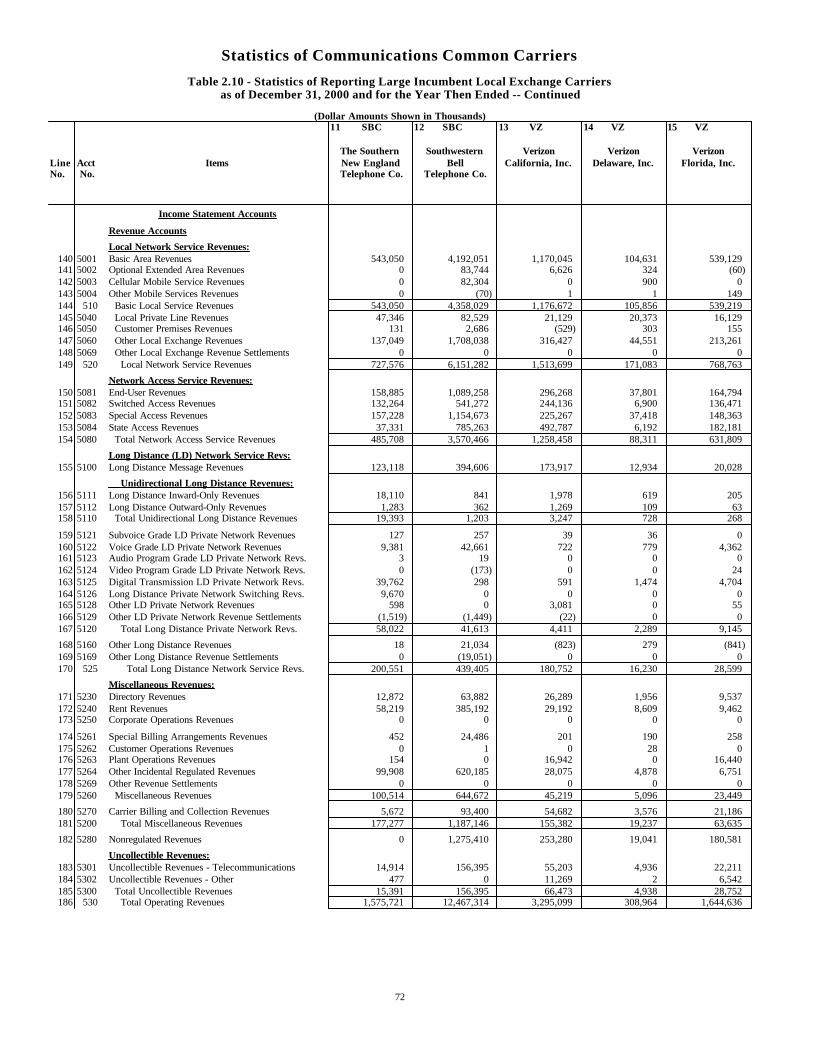
Statistics of Communications Common Carriers
Table 2.10 - Statistics of Reporting Large Incumbent Local Exchange Carriersas of December 31, 2000 and for the Year Then Ended -- Continued
(Dollar Amounts Shown in Thousands)11 SBC 12 SBC 13 VZ 14 VZ 15 VZ
The Southern Southwestern Verizon Verizon VerizonLine Acct Items New England Bell California, Inc. Delaware, Inc. Florida, Inc.No. No. Telephone Co. Telephone Co.
Income Statement Accounts
Revenue Accounts
Local Network Service Revenues:140 5001 Basic Area Revenues 543,050 4,192,051 1,170,045 104,631 539,129141 5002 Optional Extended Area Revenues 0 83,744 6,626 324 (60)142 5003 Cellular Mobile Service Revenues 0 82,304 0 900 0143 5004 Other Mobile Services Revenues 0 (70) 1 1 149144 510 Basic Local Service Revenues 543,050 4,358,029 1,176,672 105,856 539,219145 5040 Local Private Line Revenues 47,346 82,529 21,129 20,373 16,129146 5050 Customer Premises Revenues 131 2,686 (529) 303 155147 5060 Other Local Exchange Revenues 137,049 1,708,038 316,427 44,551 213,261148 5069 Other Local Exchange Revenue Settlements 0 0 0 0 0149 520 Local Network Service Revenues 727,576 6,151,282 1,513,699 171,083 768,763
Network Access Service Revenues:150 5081 End-User Revenues 158,885 1,089,258 296,268 37,801 164,794151 5082 Switched Access Revenues 132,264 541,272 244,136 6,900 136,471152 5083 Special Access Revenues 157,228 1,154,673 225,267 37,418 148,363153 5084 State Access Revenues 37,331 785,263 492,787 6,192 182,181154 5080 Total Network Access Service Revenues 485,708 3,570,466 1,258,458 88,311 631,809
Long Distance (LD) Network Service Revs:155 5100 Long Distance Message Revenues 123,118 394,606 173,917 12,934 20,028
Unidirectional Long Distance Revenues:156 5111 Long Distance Inward-Only Revenues 18,110 841 1,978 619 205157 5112 Long Distance Outward-Only Revenues 1,283 362 1,269 109 63158 5110 Total Unidirectional Long Distance Revenues 19,393 1,203 3,247 728 268
159 5121 Subvoice Grade LD Private Network Revenues 127 257 39 36 0160 5122 Voice Grade LD Private Network Revenues 9,381 42,661 722 779 4,362161 5123 Audio Program Grade LD Private Network Revs. 3 19 0 0 0162 5124 Video Program Grade LD Private Network Revs. 0 (173) 0 0 24163 5125 Digital Transmission LD Private Network Revs. 39,762 298 591 1,474 4,704164 5126 Long Distance Private Network Switching Revs. 9,670 0 0 0 0165 5128 Other LD Private Network Revenues 598 0 3,081 0 55166 5129 Other LD Private Network Revenue Settlements (1,519) (1,449) (22) 0 0167 5120 Total Long Distance Private Network Revs. 58,022 41,613 4,411 2,289 9,145
168 5160 Other Long Distance Revenues 18 21,034 (823) 279 (841)169 5169 Other Long Distance Revenue Settlements 0 (19,051) 0 0 0170 525 Total Long Distance Network Service Revs. 200,551 439,405 180,752 16,230 28,599
Miscellaneous Revenues:171 5230 Directory Revenues 12,872 63,882 26,289 1,956 9,537172 5240 Rent Revenues 58,219 385,192 29,192 8,609 9,462173 5250 Corporate Operations Revenues 0 0 0 0 0
174 5261 Special Billing Arrangements Revenues 452 24,486 201 190 258175 5262 Customer Operations Revenues 0 1 0 28 0176 5263 Plant Operations Revenues 154 0 16,942 0 16,440177 5264 Other Incidental Regulated Revenues 99,908 620,185 28,075 4,878 6,751178 5269 Other Revenue Settlements 0 0 0 0 0179 5260 Miscellaneous Revenues 100,514 644,672 45,219 5,096 23,449
180 5270 Carrier Billing and Collection Revenues 5,672 93,400 54,682 3,576 21,186181 5200 Total Miscellaneous Revenues 177,277 1,187,146 155,382 19,237 63,635
182 5280 Nonregulated Revenues 0 1,275,410 253,280 19,041 180,581
Uncollectible Revenues:183 5301 Uncollectible Revenues - Telecommunications 14,914 156,395 55,203 4,936 22,211184 5302 Uncollectible Revenues - Other 477 0 11,269 2 6,542185 5300 Total Uncollectible Revenues 15,391 156,395 66,473 4,938 28,752186 530 Total Operating Revenues 1,575,721 12,467,314 3,295,099 308,964 1,644,636
72
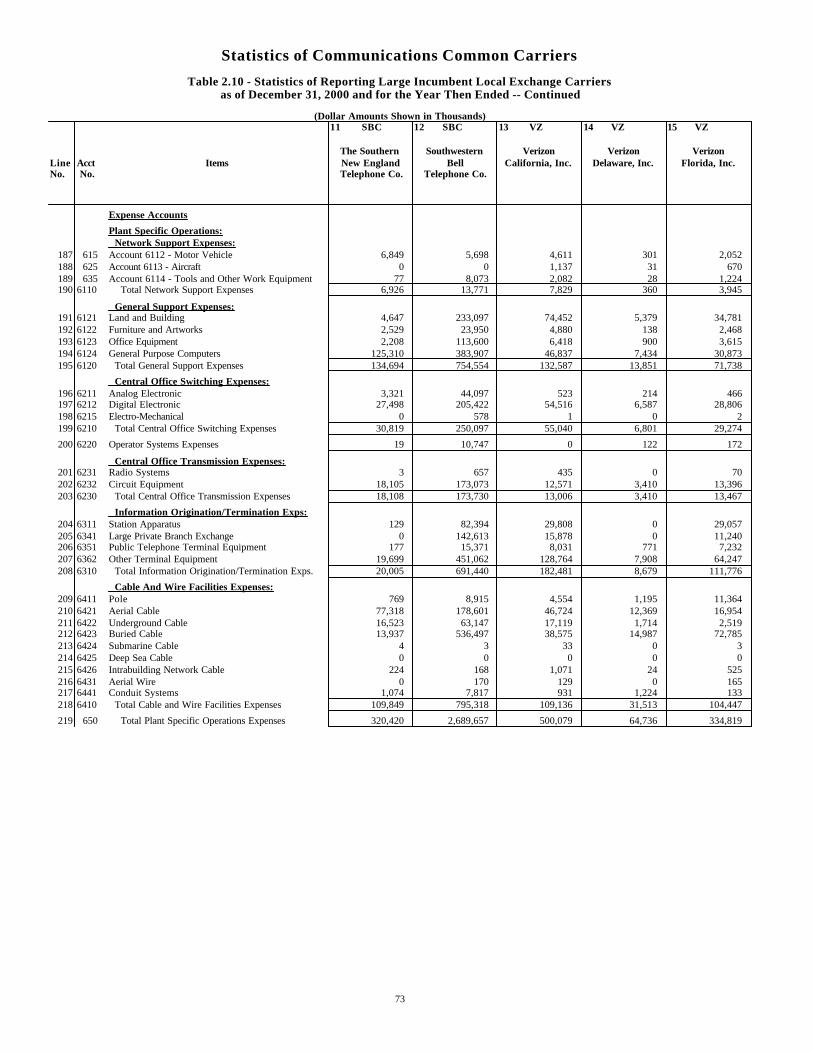
Statistics of Communications Common Carriers
Table 2.10 - Statistics of Reporting Large Incumbent Local Exchange Carriersas of December 31, 2000 and for the Year Then Ended -- Continued
(Dollar Amounts Shown in Thousands)11 SBC 12 SBC 13 VZ 14 VZ 15 VZ
The Southern Southwestern Verizon Verizon VerizonLine Acct Items New England Bell California, Inc. Delaware, Inc. Florida, Inc.No. No. Telephone Co. Telephone Co.
Expense Accounts
Plant Specific Operations: Network Support Expenses:
187 615 Account 6112 - Motor Vehicle 6,849 5,698 4,611 301 2,052188 625 Account 6113 - Aircraft 0 0 1,137 31 670189 635 Account 6114 - Tools and Other Work Equipment 77 8,073 2,082 28 1,224190 6110 Total Network Support Expenses 6,926 13,771 7,829 360 3,945
General Support Expenses:191 6121 Land and Building 4,647 233,097 74,452 5,379 34,781192 6122 Furniture and Artworks 2,529 23,950 4,880 138 2,468193 6123 Office Equipment 2,208 113,600 6,418 900 3,615194 6124 General Purpose Computers 125,310 383,907 46,837 7,434 30,873195 6120 Total General Support Expenses 134,694 754,554 132,587 13,851 71,738
Central Office Switching Expenses:196 6211 Analog Electronic 3,321 44,097 523 214 466197 6212 Digital Electronic 27,498 205,422 54,516 6,587 28,806198 6215 Electro-Mechanical 0 578 1 0 2199 6210 Total Central Office Switching Expenses 30,819 250,097 55,040 6,801 29,274
200 6220 Operator Systems Expenses 19 10,747 0 122 172
Central Office Transmission Expenses:201 6231 Radio Systems 3 657 435 0 70202 6232 Circuit Equipment 18,105 173,073 12,571 3,410 13,396203 6230 Total Central Office Transmission Expenses 18,108 173,730 13,006 3,410 13,467
Information Origination/Termination Exps:204 6311 Station Apparatus 129 82,394 29,808 0 29,057205 6341 Large Private Branch Exchange 0 142,613 15,878 0 11,240206 6351 Public Telephone Terminal Equipment 177 15,371 8,031 771 7,232207 6362 Other Terminal Equipment 19,699 451,062 128,764 7,908 64,247208 6310 Total Information Origination/Termination Exps. 20,005 691,440 182,481 8,679 111,776
Cable And Wire Facilities Expenses:209 6411 Pole 769 8,915 4,554 1,195 11,364210 6421 Aerial Cable 77,318 178,601 46,724 12,369 16,954211 6422 Underground Cable 16,523 63,147 17,119 1,714 2,519212 6423 Buried Cable 13,937 536,497 38,575 14,987 72,785213 6424 Submarine Cable 4 3 33 0 3214 6425 Deep Sea Cable 0 0 0 0 0215 6426 Intrabuilding Network Cable 224 168 1,071 24 525216 6431 Aerial Wire 0 170 129 0 165217 6441 Conduit Systems 1,074 7,817 931 1,224 133218 6410 Total Cable and Wire Facilities Expenses 109,849 795,318 109,136 31,513 104,447
219 650 Total Plant Specific Operations Expenses 320,420 2,689,657 500,079 64,736 334,819
73
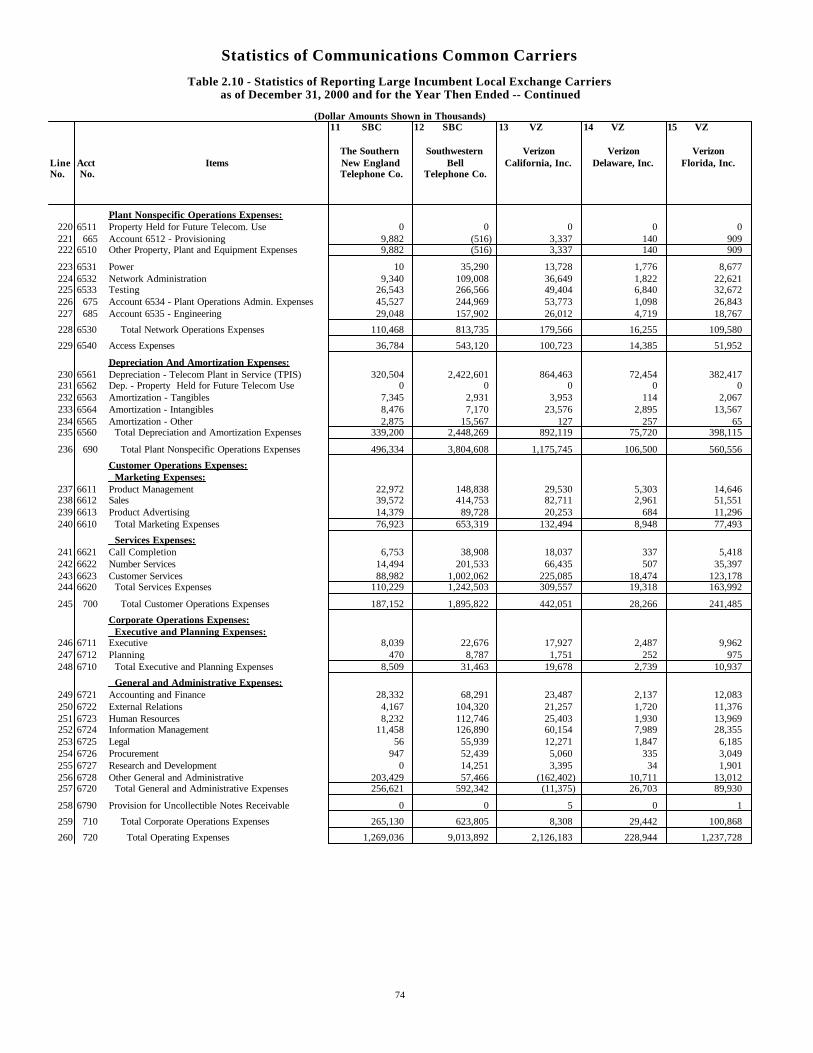
Statistics of Communications Common Carriers
Table 2.10 - Statistics of Reporting Large Incumbent Local Exchange Carriersas of December 31, 2000 and for the Year Then Ended -- Continued
(Dollar Amounts Shown in Thousands)11 SBC 12 SBC 13 VZ 14 VZ 15 VZ
The Southern Southwestern Verizon Verizon VerizonLine Acct Items New England Bell California, Inc. Delaware, Inc. Florida, Inc.No. No. Telephone Co. Telephone Co.
Plant Nonspecific Operations Expenses:220 6511 Property Held for Future Telecom. Use 0 0 0 0 0221 665 Account 6512 - Provisioning 9,882 (516) 3,337 140 909222 6510 Other Property, Plant and Equipment Expenses 9,882 (516) 3,337 140 909
223 6531 Power 10 35,290 13,728 1,776 8,677224 6532 Network Administration 9,340 109,008 36,649 1,822 22,621225 6533 Testing 26,543 266,566 49,404 6,840 32,672226 675 Account 6534 - Plant Operations Admin. Expenses 45,527 244,969 53,773 1,098 26,843227 685 Account 6535 - Engineering 29,048 157,902 26,012 4,719 18,767
228 6530 Total Network Operations Expenses 110,468 813,735 179,566 16,255 109,580
229 6540 Access Expenses 36,784 543,120 100,723 14,385 51,952
Depreciation And Amortization Expenses:230 6561 Depreciation - Telecom Plant in Service (TPIS) 320,504 2,422,601 864,463 72,454 382,417231 6562 Dep. - Property Held for Future Telecom Use 0 0 0 0 0232 6563 Amortization - Tangibles 7,345 2,931 3,953 114 2,067233 6564 Amortization - Intangibles 8,476 7,170 23,576 2,895 13,567234 6565 Amortization - Other 2,875 15,567 127 257 65235 6560 Total Depreciation and Amortization Expenses 339,200 2,448,269 892,119 75,720 398,115
236 690 Total Plant Nonspecific Operations Expenses 496,334 3,804,608 1,175,745 106,500 560,556
Customer Operations Expenses: Marketing Expenses:
237 6611 Product Management 22,972 148,838 29,530 5,303 14,646238 6612 Sales 39,572 414,753 82,711 2,961 51,551239 6613 Product Advertising 14,379 89,728 20,253 684 11,296240 6610 Total Marketing Expenses 76,923 653,319 132,494 8,948 77,493
Services Expenses:241 6621 Call Completion 6,753 38,908 18,037 337 5,418242 6622 Number Services 14,494 201,533 66,435 507 35,397243 6623 Customer Services 88,982 1,002,062 225,085 18,474 123,178244 6620 Total Services Expenses 110,229 1,242,503 309,557 19,318 163,992
245 700 Total Customer Operations Expenses 187,152 1,895,822 442,051 28,266 241,485
Corporate Operations Expenses: Executive and Planning Expenses:
246 6711 Executive 8,039 22,676 17,927 2,487 9,962247 6712 Planning 470 8,787 1,751 252 975248 6710 Total Executive and Planning Expenses 8,509 31,463 19,678 2,739 10,937
General and Administrative Expenses:249 6721 Accounting and Finance 28,332 68,291 23,487 2,137 12,083250 6722 External Relations 4,167 104,320 21,257 1,720 11,376251 6723 Human Resources 8,232 112,746 25,403 1,930 13,969252 6724 Information Management 11,458 126,890 60,154 7,989 28,355253 6725 Legal 56 55,939 12,271 1,847 6,185254 6726 Procurement 947 52,439 5,060 335 3,049255 6727 Research and Development 0 14,251 3,395 34 1,901256 6728 Other General and Administrative 203,429 57,466 (162,402) 10,711 13,012257 6720 Total General and Administrative Expenses 256,621 592,342 (11,375) 26,703 89,930
258 6790 Provision for Uncollectible Notes Receivable 0 0 5 0 1
259 710 Total Corporate Operations Expenses 265,130 623,805 8,308 29,442 100,868
260 720 Total Operating Expenses 1,269,036 9,013,892 2,126,183 228,944 1,237,728
74
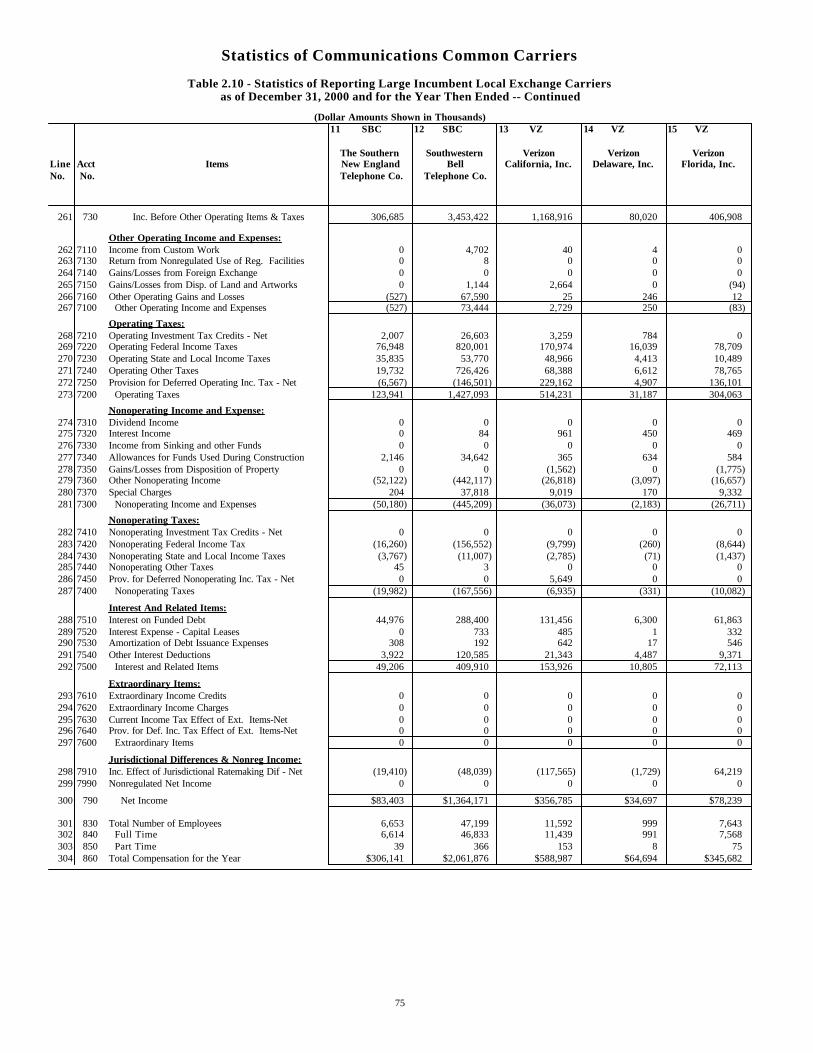
Statistics of Communications Common Carriers
Table 2.10 - Statistics of Reporting Large Incumbent Local Exchange Carriersas of December 31, 2000 and for the Year Then Ended -- Continued
(Dollar Amounts Shown in Thousands)11 SBC 12 SBC 13 VZ 14 VZ 15 VZ
The Southern Southwestern Verizon Verizon VerizonLine Acct Items New England Bell California, Inc. Delaware, Inc. Florida, Inc.No. No. Telephone Co. Telephone Co.
261 730 Inc. Before Other Operating Items & Taxes 306,685 3,453,422 1,168,916 80,020 406,908
Other Operating Income and Expenses:262 7110 Income from Custom Work 0 4,702 40 4 0263 7130 Return from Nonregulated Use of Reg. Facilities 0 8 0 0 0264 7140 Gains/Losses from Foreign Exchange 0 0 0 0 0265 7150 Gains/Losses from Disp. of Land and Artworks 0 1,144 2,664 0 (94)266 7160 Other Operating Gains and Losses (527) 67,590 25 246 12267 7100 Other Operating Income and Expenses (527) 73,444 2,729 250 (83)
Operating Taxes:268 7210 Operating Investment Tax Credits - Net 2,007 26,603 3,259 784 0269 7220 Operating Federal Income Taxes 76,948 820,001 170,974 16,039 78,709270 7230 Operating State and Local Income Taxes 35,835 53,770 48,966 4,413 10,489271 7240 Operating Other Taxes 19,732 726,426 68,388 6,612 78,765272 7250 Provision for Deferred Operating Inc. Tax - Net (6,567) (146,501) 229,162 4,907 136,101273 7200 Operating Taxes 123,941 1,427,093 514,231 31,187 304,063
Nonoperating Income and Expense:274 7310 Dividend Income 0 0 0 0 0275 7320 Interest Income 0 84 961 450 469276 7330 Income from Sinking and other Funds 0 0 0 0 0277 7340 Allowances for Funds Used During Construction 2,146 34,642 365 634 584278 7350 Gains/Losses from Disposition of Property 0 0 (1,562) 0 (1,775)279 7360 Other Nonoperating Income (52,122) (442,117) (26,818) (3,097) (16,657)280 7370 Special Charges 204 37,818 9,019 170 9,332281 7300 Nonoperating Income and Expenses (50,180) (445,209) (36,073) (2,183) (26,711)
Nonoperating Taxes:282 7410 Nonoperating Investment Tax Credits - Net 0 0 0 0 0283 7420 Nonoperating Federal Income Tax (16,260) (156,552) (9,799) (260) (8,644)284 7430 Nonoperating State and Local Income Taxes (3,767) (11,007) (2,785) (71) (1,437)285 7440 Nonoperating Other Taxes 45 3 0 0 0286 7450 Prov. for Deferred Nonoperating Inc. Tax - Net 0 0 5,649 0 0287 7400 Nonoperating Taxes (19,982) (167,556) (6,935) (331) (10,082)
Interest And Related Items:288 7510 Interest on Funded Debt 44,976 288,400 131,456 6,300 61,863289 7520 Interest Expense - Capital Leases 0 733 485 1 332290 7530 Amortization of Debt Issuance Expenses 308 192 642 17 546291 7540 Other Interest Deductions 3,922 120,585 21,343 4,487 9,371292 7500 Interest and Related Items 49,206 409,910 153,926 10,805 72,113
Extraordinary Items:293 7610 Extraordinary Income Credits 0 0 0 0 0294 7620 Extraordinary Income Charges 0 0 0 0 0295 7630 Current Income Tax Effect of Ext. Items-Net 0 0 0 0 0296 7640 Prov. for Def. Inc. Tax Effect of Ext. Items-Net 0 0 0 0 0297 7600 Extraordinary Items 0 0 0 0 0
Jurisdictional Differences & Nonreg Income:298 7910 Inc. Effect of Jurisdictional Ratemaking Dif - Net (19,410) (48,039) (117,565) (1,729) 64,219299 7990 Nonregulated Net Income 0 0 0 0 0
300 790 Net Income $83,403 $1,364,171 $356,785 $34,697 $78,239
301 830 Total Number of Employees 6,653 47,199 11,592 999 7,643302 840 Full Time 6,614 46,833 11,439 991 7,568303 850 Part Time 39 366 153 8 75304 860 Total Compensation for the Year $306,141 $2,061,876 $588,987 $64,694 $345,682
75
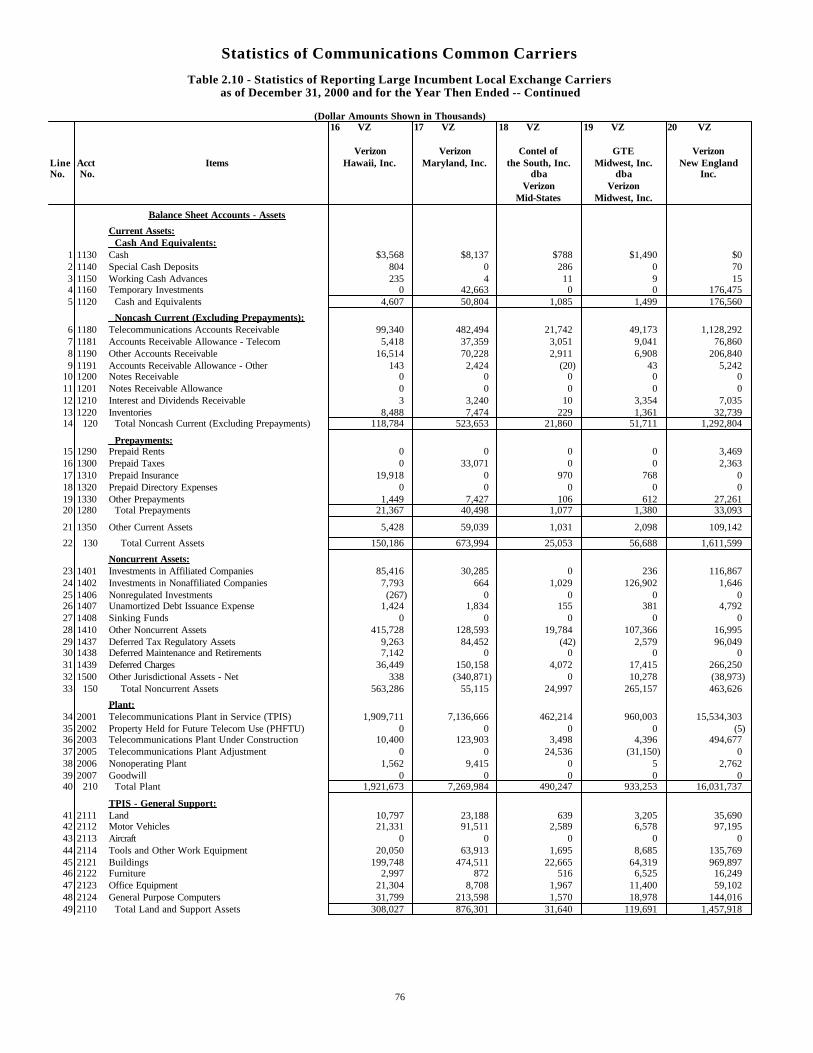
Statistics of Communications Common Carriers
Table 2.10 - Statistics of Reporting Large Incumbent Local Exchange Carriersas of December 31, 2000 and for the Year Then Ended -- Continued
(Dollar Amounts Shown in Thousands)16 VZ 17 VZ 18 VZ 19 VZ 20 VZ
Verizon Verizon Contel of GTE VerizonLine Acct Items Hawaii, Inc. Maryland, Inc. the South, Inc. Midwest, Inc. New EnglandNo. No. dba dba Inc.
Verizon VerizonMid-States Midwest, Inc.
Balance Sheet Accounts - Assets
Current Assets: Cash And Equivalents:
1 1130 Cash $3,568 $8,137 $788 $1,490 $02 1140 Special Cash Deposits 804 0 286 0 703 1150 Working Cash Advances 235 4 11 9 154 1160 Temporary Investments 0 42,663 0 0 176,4755 1120 Cash and Equivalents 4,607 50,804 1,085 1,499 176,560
Noncash Current (Excluding Prepayments):6 1180 Telecommunications Accounts Receivable 99,340 482,494 21,742 49,173 1,128,2927 1181 Accounts Receivable Allowance - Telecom 5,418 37,359 3,051 9,041 76,8608 1190 Other Accounts Receivable 16,514 70,228 2,911 6,908 206,8409 1191 Accounts Receivable Allowance - Other 143 2,424 (20) 43 5,242
10 1200 Notes Receivable 0 0 0 0 011 1201 Notes Receivable Allowance 0 0 0 0 012 1210 Interest and Dividends Receivable 3 3,240 10 3,354 7,03513 1220 Inventories 8,488 7,474 229 1,361 32,73914 120 Total Noncash Current (Excluding Prepayments) 118,784 523,653 21,860 51,711 1,292,804
Prepayments:15 1290 Prepaid Rents 0 0 0 0 3,46916 1300 Prepaid Taxes 0 33,071 0 0 2,36317 1310 Prepaid Insurance 19,918 0 970 768 018 1320 Prepaid Directory Expenses 0 0 0 0 019 1330 Other Prepayments 1,449 7,427 106 612 27,26120 1280 Total Prepayments 21,367 40,498 1,077 1,380 33,093
21 1350 Other Current Assets 5,428 59,039 1,031 2,098 109,142
22 130 Total Current Assets 150,186 673,994 25,053 56,688 1,611,599
Noncurrent Assets:23 1401 Investments in Affiliated Companies 85,416 30,285 0 236 116,86724 1402 Investments in Nonaffiliated Companies 7,793 664 1,029 126,902 1,64625 1406 Nonregulated Investments (267) 0 0 0 026 1407 Unamortized Debt Issuance Expense 1,424 1,834 155 381 4,79227 1408 Sinking Funds 0 0 0 0 028 1410 Other Noncurrent Assets 415,728 128,593 19,784 107,366 16,99529 1437 Deferred Tax Regulatory Assets 9,263 84,452 (42) 2,579 96,04930 1438 Deferred Maintenance and Retirements 7,142 0 0 0 031 1439 Deferred Charges 36,449 150,158 4,072 17,415 266,25032 1500 Other Jurisdictional Assets - Net 338 (340,871) 0 10,278 (38,973)33 150 Total Noncurrent Assets 563,286 55,115 24,997 265,157 463,626
Plant:34 2001 Telecommunications Plant in Service (TPIS) 1,909,711 7,136,666 462,214 960,003 15,534,30335 2002 Property Held for Future Telecom Use (PHFTU) 0 0 0 0 (5)36 2003 Telecommunications Plant Under Construction 10,400 123,903 3,498 4,396 494,67737 2005 Telecommunications Plant Adjustment 0 0 24,536 (31,150) 038 2006 Nonoperating Plant 1,562 9,415 0 5 2,76239 2007 Goodwill 0 0 0 0 040 210 Total Plant 1,921,673 7,269,984 490,247 933,253 16,031,737
TPIS - General Support:41 2111 Land 10,797 23,188 639 3,205 35,69042 2112 Motor Vehicles 21,331 91,511 2,589 6,578 97,19543 2113 Aircraft 0 0 0 0 044 2114 Tools and Other Work Equipment 20,050 63,913 1,695 8,685 135,76945 2121 Buildings 199,748 474,511 22,665 64,319 969,89746 2122 Furniture 2,997 872 516 6,525 16,24947 2123 Office Equipment 21,304 8,708 1,967 11,400 59,10248 2124 General Purpose Computers 31,799 213,598 1,570 18,978 144,01649 2110 Total Land and Support Assets 308,027 876,301 31,640 119,691 1,457,918
76
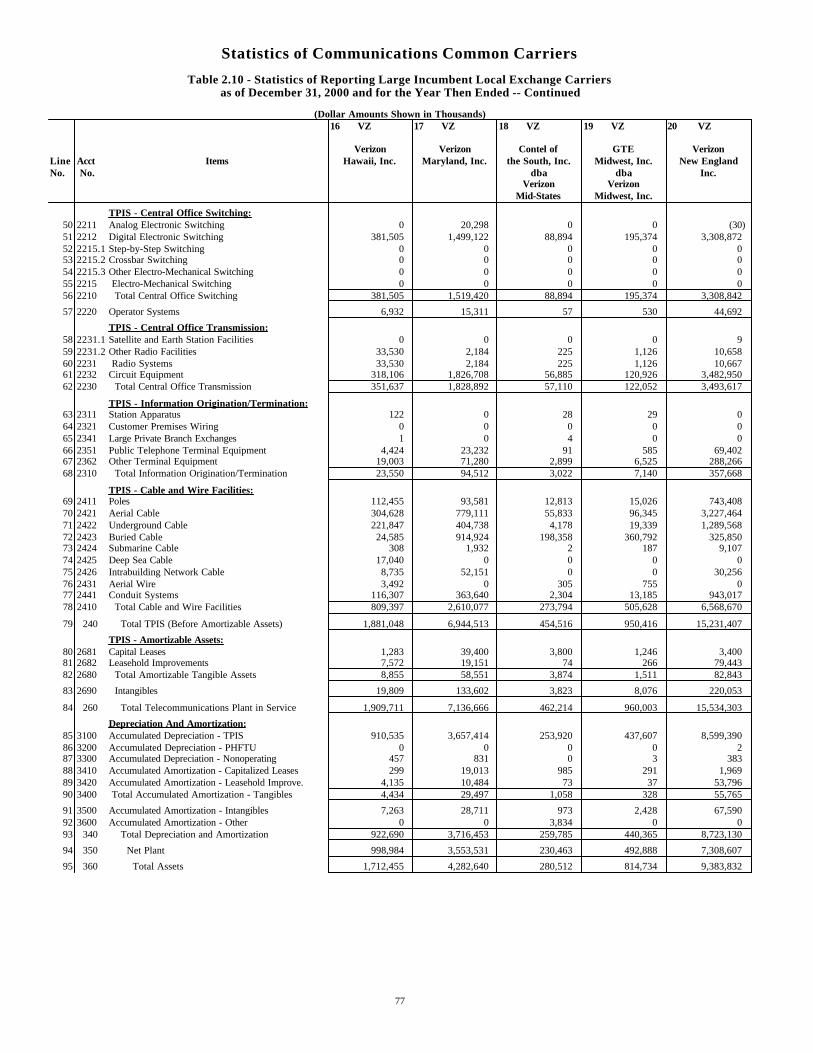
Statistics of Communications Common Carriers
Table 2.10 - Statistics of Reporting Large Incumbent Local Exchange Carriersas of December 31, 2000 and for the Year Then Ended -- Continued
(Dollar Amounts Shown in Thousands)16 VZ 17 VZ 18 VZ 19 VZ 20 VZ
Verizon Verizon Contel of GTE VerizonLine Acct Items Hawaii, Inc. Maryland, Inc. the South, Inc. Midwest, Inc. New EnglandNo. No. dba dba Inc.
Verizon VerizonMid-States Midwest, Inc.
TPIS - Central Office Switching:50 2211 Analog Electronic Switching 0 20,298 0 0 (30)51 2212 Digital Electronic Switching 381,505 1,499,122 88,894 195,374 3,308,87252 2215.1 Step-by-Step Switching 0 0 0 0 053 2215.2 Crossbar Switching 0 0 0 0 054 2215.3 Other Electro-Mechanical Switching 0 0 0 0 055 2215 Electro-Mechanical Switching 0 0 0 0 056 2210 Total Central Office Switching 381,505 1,519,420 88,894 195,374 3,308,842
57 2220 Operator Systems 6,932 15,311 57 530 44,692
TPIS - Central Office Transmission:58 2231.1 Satellite and Earth Station Facilities 0 0 0 0 959 2231.2 Other Radio Facilities 33,530 2,184 225 1,126 10,65860 2231 Radio Systems 33,530 2,184 225 1,126 10,66761 2232 Circuit Equipment 318,106 1,826,708 56,885 120,926 3,482,95062 2230 Total Central Office Transmission 351,637 1,828,892 57,110 122,052 3,493,617
TPIS - Information Origination/Termination:63 2311 Station Apparatus 122 0 28 29 064 2321 Customer Premises Wiring 0 0 0 0 065 2341 Large Private Branch Exchanges 1 0 4 0 066 2351 Public Telephone Terminal Equipment 4,424 23,232 91 585 69,40267 2362 Other Terminal Equipment 19,003 71,280 2,899 6,525 288,26668 2310 Total Information Origination/Termination 23,550 94,512 3,022 7,140 357,668
TPIS - Cable and Wire Facilities:69 2411 Poles 112,455 93,581 12,813 15,026 743,40870 2421 Aerial Cable 304,628 779,111 55,833 96,345 3,227,46471 2422 Underground Cable 221,847 404,738 4,178 19,339 1,289,56872 2423 Buried Cable 24,585 914,924 198,358 360,792 325,85073 2424 Submarine Cable 308 1,932 2 187 9,10774 2425 Deep Sea Cable 17,040 0 0 0 075 2426 Intrabuilding Network Cable 8,735 52,151 0 0 30,25676 2431 Aerial Wire 3,492 0 305 755 077 2441 Conduit Systems 116,307 363,640 2,304 13,185 943,01778 2410 Total Cable and Wire Facilities 809,397 2,610,077 273,794 505,628 6,568,670
79 240 Total TPIS (Before Amortizable Assets) 1,881,048 6,944,513 454,516 950,416 15,231,407
TPIS - Amortizable Assets:80 2681 Capital Leases 1,283 39,400 3,800 1,246 3,40081 2682 Leasehold Improvements 7,572 19,151 74 266 79,44382 2680 Total Amortizable Tangible Assets 8,855 58,551 3,874 1,511 82,843
83 2690 Intangibles 19,809 133,602 3,823 8,076 220,053
84 260 Total Telecommunications Plant in Service 1,909,711 7,136,666 462,214 960,003 15,534,303
Depreciation And Amortization:85 3100 Accumulated Depreciation - TPIS 910,535 3,657,414 253,920 437,607 8,599,39086 3200 Accumulated Depreciation - PHFTU 0 0 0 0 287 3300 Accumulated Depreciation - Nonoperating 457 831 0 3 38388 3410 Accumulated Amortization - Capitalized Leases 299 19,013 985 291 1,96989 3420 Accumulated Amortization - Leasehold Improve. 4,135 10,484 73 37 53,79690 3400 Total Accumulated Amortization - Tangibles 4,434 29,497 1,058 328 55,765
91 3500 Accumulated Amortization - Intangibles 7,263 28,711 973 2,428 67,59092 3600 Accumulated Amortization - Other 0 0 3,834 0 093 340 Total Depreciation and Amortization 922,690 3,716,453 259,785 440,365 8,723,130
94 350 Net Plant 998,984 3,553,531 230,463 492,888 7,308,607
95 360 Total Assets 1,712,455 4,282,640 280,512 814,734 9,383,832
77
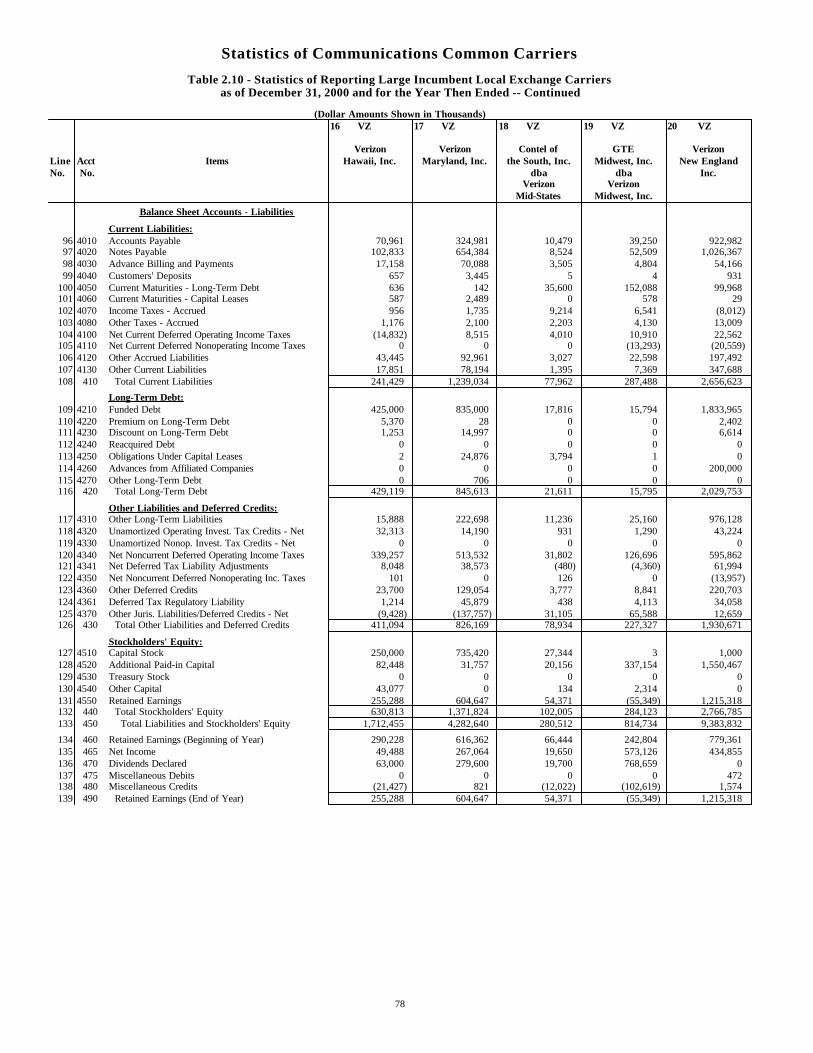
Statistics of Communications Common Carriers
Table 2.10 - Statistics of Reporting Large Incumbent Local Exchange Carriersas of December 31, 2000 and for the Year Then Ended -- Continued
(Dollar Amounts Shown in Thousands)16 VZ 17 VZ 18 VZ 19 VZ 20 VZ
Verizon Verizon Contel of GTE VerizonLine Acct Items Hawaii, Inc. Maryland, Inc. the South, Inc. Midwest, Inc. New EnglandNo. No. dba dba Inc.
Verizon VerizonMid-States Midwest, Inc.
Balance Sheet Accounts - Liabilities
Current Liabilities:96 4010 Accounts Payable 70,961 324,981 10,479 39,250 922,98297 4020 Notes Payable 102,833 654,384 8,524 52,509 1,026,36798 4030 Advance Billing and Payments 17,158 70,088 3,505 4,804 54,16699 4040 Customers' Deposits 657 3,445 5 4 931
100 4050 Current Maturities - Long-Term Debt 636 142 35,600 152,088 99,968101 4060 Current Maturities - Capital Leases 587 2,489 0 578 29102 4070 Income Taxes - Accrued 956 1,735 9,214 6,541 (8,012)103 4080 Other Taxes - Accrued 1,176 2,100 2,203 4,130 13,009104 4100 Net Current Deferred Operating Income Taxes (14,832) 8,515 4,010 10,910 22,562105 4110 Net Current Deferred Nonoperating Income Taxes 0 0 0 (13,293) (20,559)106 4120 Other Accrued Liabilities 43,445 92,961 3,027 22,598 197,492107 4130 Other Current Liabilities 17,851 78,194 1,395 7,369 347,688108 410 Total Current Liabilities 241,429 1,239,034 77,962 287,488 2,656,623
Long-Term Debt:109 4210 Funded Debt 425,000 835,000 17,816 15,794 1,833,965110 4220 Premium on Long-Term Debt 5,370 28 0 0 2,402111 4230 Discount on Long-Term Debt 1,253 14,997 0 0 6,614112 4240 Reacquired Debt 0 0 0 0 0113 4250 Obligations Under Capital Leases 2 24,876 3,794 1 0114 4260 Advances from Affiliated Companies 0 0 0 0 200,000115 4270 Other Long-Term Debt 0 706 0 0 0116 420 Total Long-Term Debt 429,119 845,613 21,611 15,795 2,029,753
Other Liabilities and Deferred Credits:117 4310 Other Long-Term Liabilities 15,888 222,698 11,236 25,160 976,128118 4320 Unamortized Operating Invest. Tax Credits - Net 32,313 14,190 931 1,290 43,224119 4330 Unamortized Nonop. Invest. Tax Credits - Net 0 0 0 0 0120 4340 Net Noncurrent Deferred Operating Income Taxes 339,257 513,532 31,802 126,696 595,862121 4341 Net Deferred Tax Liability Adjustments 8,048 38,573 (480) (4,360) 61,994122 4350 Net Noncurrent Deferred Nonoperating Inc. Taxes 101 0 126 0 (13,957)123 4360 Other Deferred Credits 23,700 129,054 3,777 8,841 220,703124 4361 Deferred Tax Regulatory Liability 1,214 45,879 438 4,113 34,058125 4370 Other Juris. Liabilities/Deferred Credits - Net (9,428) (137,757) 31,105 65,588 12,659126 430 Total Other Liabilities and Deferred Credits 411,094 826,169 78,934 227,327 1,930,671
Stockholders' Equity:127 4510 Capital Stock 250,000 735,420 27,344 3 1,000128 4520 Additional Paid-in Capital 82,448 31,757 20,156 337,154 1,550,467129 4530 Treasury Stock 0 0 0 0 0130 4540 Other Capital 43,077 0 134 2,314 0131 4550 Retained Earnings 255,288 604,647 54,371 (55,349) 1,215,318132 440 Total Stockholders' Equity 630,813 1,371,824 102,005 284,123 2,766,785133 450 Total Liabilities and Stockholders' Equity 1,712,455 4,282,640 280,512 814,734 9,383,832
134 460 Retained Earnings (Beginning of Year) 290,228 616,362 66,444 242,804 779,361135 465 Net Income 49,488 267,064 19,650 573,126 434,855136 470 Dividends Declared 63,000 279,600 19,700 768,659 0137 475 Miscellaneous Debits 0 0 0 0 472138 480 Miscellaneous Credits (21,427) 821 (12,022) (102,619) 1,574139 490 Retained Earnings (End of Year) 255,288 604,647 54,371 (55,349) 1,215,318
78
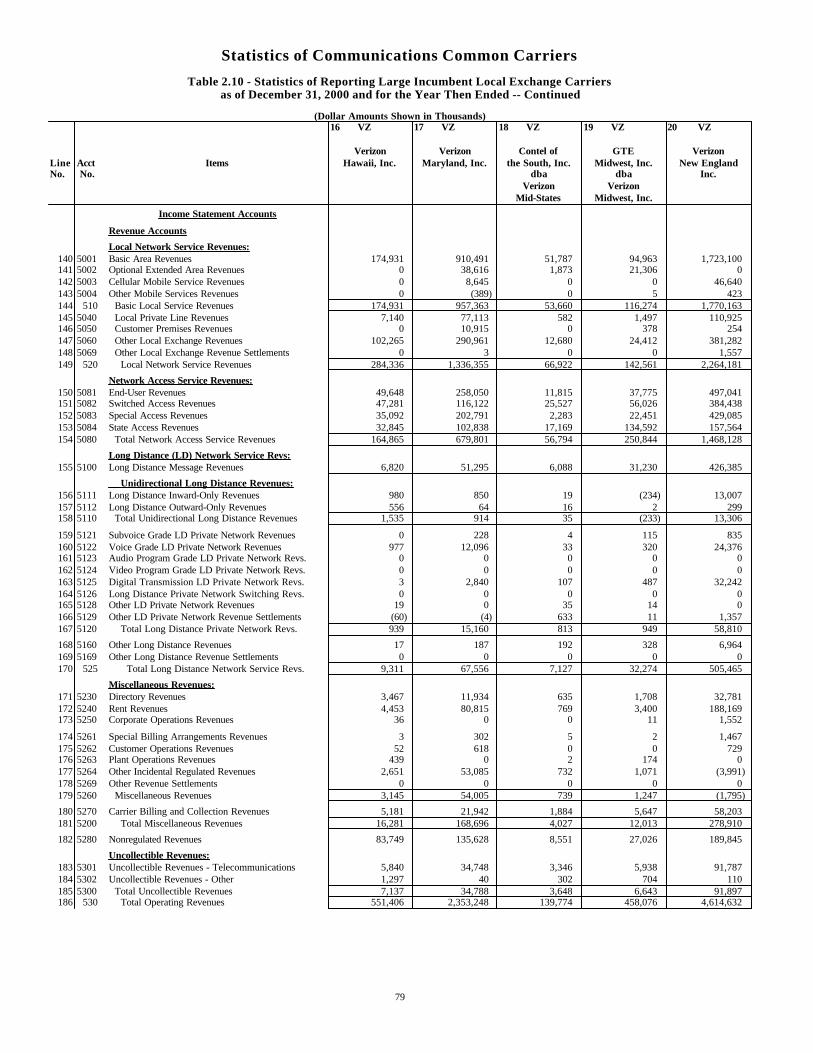
Statistics of Communications Common Carriers
Table 2.10 - Statistics of Reporting Large Incumbent Local Exchange Carriersas of December 31, 2000 and for the Year Then Ended -- Continued
(Dollar Amounts Shown in Thousands)16 VZ 17 VZ 18 VZ 19 VZ 20 VZ
Verizon Verizon Contel of GTE VerizonLine Acct Items Hawaii, Inc. Maryland, Inc. the South, Inc. Midwest, Inc. New EnglandNo. No. dba dba Inc.
Verizon VerizonMid-States Midwest, Inc.
Income Statement Accounts
Revenue Accounts
Local Network Service Revenues:140 5001 Basic Area Revenues 174,931 910,491 51,787 94,963 1,723,100141 5002 Optional Extended Area Revenues 0 38,616 1,873 21,306 0142 5003 Cellular Mobile Service Revenues 0 8,645 0 0 46,640143 5004 Other Mobile Services Revenues 0 (389) 0 5 423144 510 Basic Local Service Revenues 174,931 957,363 53,660 116,274 1,770,163145 5040 Local Private Line Revenues 7,140 77,113 582 1,497 110,925146 5050 Customer Premises Revenues 0 10,915 0 378 254147 5060 Other Local Exchange Revenues 102,265 290,961 12,680 24,412 381,282148 5069 Other Local Exchange Revenue Settlements 0 3 0 0 1,557149 520 Local Network Service Revenues 284,336 1,336,355 66,922 142,561 2,264,181
Network Access Service Revenues:150 5081 End-User Revenues 49,648 258,050 11,815 37,775 497,041151 5082 Switched Access Revenues 47,281 116,122 25,527 56,026 384,438152 5083 Special Access Revenues 35,092 202,791 2,283 22,451 429,085153 5084 State Access Revenues 32,845 102,838 17,169 134,592 157,564154 5080 Total Network Access Service Revenues 164,865 679,801 56,794 250,844 1,468,128
Long Distance (LD) Network Service Revs:155 5100 Long Distance Message Revenues 6,820 51,295 6,088 31,230 426,385
Unidirectional Long Distance Revenues:156 5111 Long Distance Inward-Only Revenues 980 850 19 (234) 13,007157 5112 Long Distance Outward-Only Revenues 556 64 16 2 299158 5110 Total Unidirectional Long Distance Revenues 1,535 914 35 (233) 13,306
159 5121 Subvoice Grade LD Private Network Revenues 0 228 4 115 835160 5122 Voice Grade LD Private Network Revenues 977 12,096 33 320 24,376161 5123 Audio Program Grade LD Private Network Revs. 0 0 0 0 0162 5124 Video Program Grade LD Private Network Revs. 0 0 0 0 0163 5125 Digital Transmission LD Private Network Revs. 3 2,840 107 487 32,242164 5126 Long Distance Private Network Switching Revs. 0 0 0 0 0165 5128 Other LD Private Network Revenues 19 0 35 14 0166 5129 Other LD Private Network Revenue Settlements (60) (4) 633 11 1,357167 5120 Total Long Distance Private Network Revs. 939 15,160 813 949 58,810
168 5160 Other Long Distance Revenues 17 187 192 328 6,964169 5169 Other Long Distance Revenue Settlements 0 0 0 0 0170 525 Total Long Distance Network Service Revs. 9,311 67,556 7,127 32,274 505,465
Miscellaneous Revenues:171 5230 Directory Revenues 3,467 11,934 635 1,708 32,781172 5240 Rent Revenues 4,453 80,815 769 3,400 188,169173 5250 Corporate Operations Revenues 36 0 0 11 1,552
174 5261 Special Billing Arrangements Revenues 3 302 5 2 1,467175 5262 Customer Operations Revenues 52 618 0 0 729176 5263 Plant Operations Revenues 439 0 2 174 0177 5264 Other Incidental Regulated Revenues 2,651 53,085 732 1,071 (3,991)178 5269 Other Revenue Settlements 0 0 0 0 0179 5260 Miscellaneous Revenues 3,145 54,005 739 1,247 (1,795)
180 5270 Carrier Billing and Collection Revenues 5,181 21,942 1,884 5,647 58,203181 5200 Total Miscellaneous Revenues 16,281 168,696 4,027 12,013 278,910
182 5280 Nonregulated Revenues 83,749 135,628 8,551 27,026 189,845
Uncollectible Revenues:183 5301 Uncollectible Revenues - Telecommunications 5,840 34,748 3,346 5,938 91,787184 5302 Uncollectible Revenues - Other 1,297 40 302 704 110185 5300 Total Uncollectible Revenues 7,137 34,788 3,648 6,643 91,897186 530 Total Operating Revenues 551,406 2,353,248 139,774 458,076 4,614,632
79
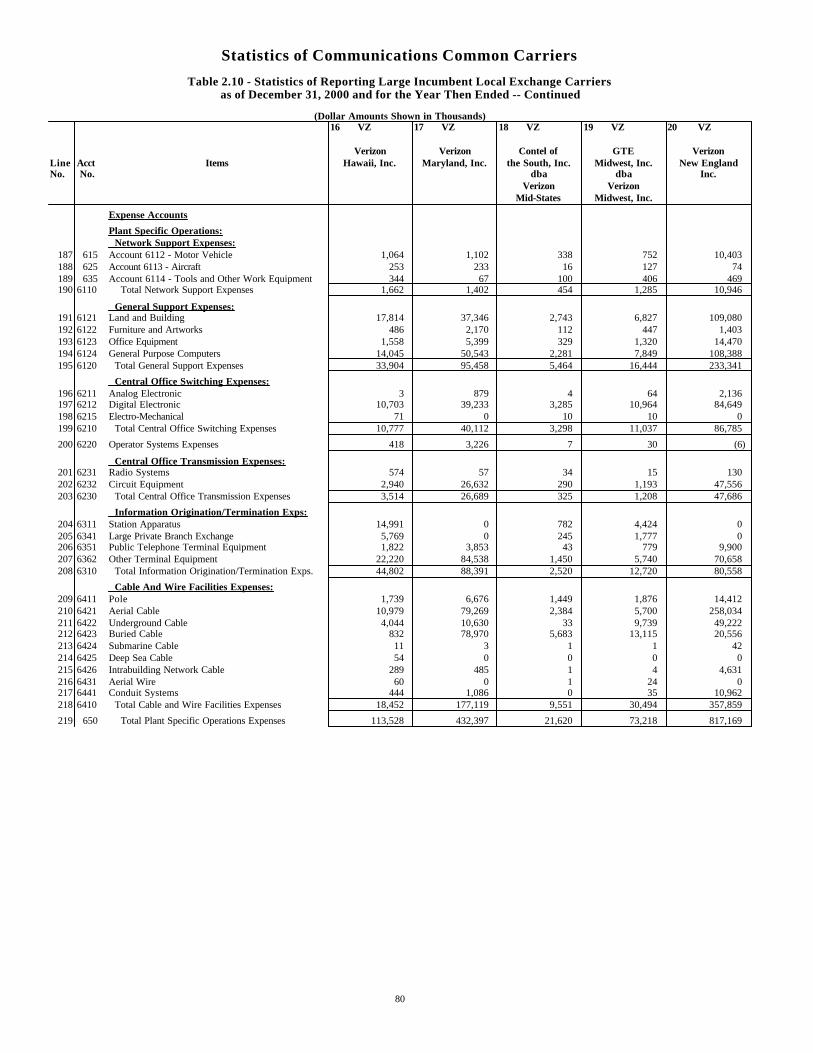
Statistics of Communications Common Carriers
Table 2.10 - Statistics of Reporting Large Incumbent Local Exchange Carriersas of December 31, 2000 and for the Year Then Ended -- Continued
(Dollar Amounts Shown in Thousands)16 VZ 17 VZ 18 VZ 19 VZ 20 VZ
Verizon Verizon Contel of GTE VerizonLine Acct Items Hawaii, Inc. Maryland, Inc. the South, Inc. Midwest, Inc. New EnglandNo. No. dba dba Inc.
Verizon VerizonMid-States Midwest, Inc.
Expense Accounts
Plant Specific Operations: Network Support Expenses:
187 615 Account 6112 - Motor Vehicle 1,064 1,102 338 752 10,403188 625 Account 6113 - Aircraft 253 233 16 127 74189 635 Account 6114 - Tools and Other Work Equipment 344 67 100 406 469190 6110 Total Network Support Expenses 1,662 1,402 454 1,285 10,946
General Support Expenses:191 6121 Land and Building 17,814 37,346 2,743 6,827 109,080192 6122 Furniture and Artworks 486 2,170 112 447 1,403193 6123 Office Equipment 1,558 5,399 329 1,320 14,470194 6124 General Purpose Computers 14,045 50,543 2,281 7,849 108,388195 6120 Total General Support Expenses 33,904 95,458 5,464 16,444 233,341
Central Office Switching Expenses:196 6211 Analog Electronic 3 879 4 64 2,136197 6212 Digital Electronic 10,703 39,233 3,285 10,964 84,649198 6215 Electro-Mechanical 71 0 10 10 0199 6210 Total Central Office Switching Expenses 10,777 40,112 3,298 11,037 86,785
200 6220 Operator Systems Expenses 418 3,226 7 30 (6)
Central Office Transmission Expenses:201 6231 Radio Systems 574 57 34 15 130202 6232 Circuit Equipment 2,940 26,632 290 1,193 47,556203 6230 Total Central Office Transmission Expenses 3,514 26,689 325 1,208 47,686
Information Origination/Termination Exps:204 6311 Station Apparatus 14,991 0 782 4,424 0205 6341 Large Private Branch Exchange 5,769 0 245 1,777 0206 6351 Public Telephone Terminal Equipment 1,822 3,853 43 779 9,900207 6362 Other Terminal Equipment 22,220 84,538 1,450 5,740 70,658208 6310 Total Information Origination/Termination Exps. 44,802 88,391 2,520 12,720 80,558
Cable And Wire Facilities Expenses:209 6411 Pole 1,739 6,676 1,449 1,876 14,412210 6421 Aerial Cable 10,979 79,269 2,384 5,700 258,034211 6422 Underground Cable 4,044 10,630 33 9,739 49,222212 6423 Buried Cable 832 78,970 5,683 13,115 20,556213 6424 Submarine Cable 11 3 1 1 42214 6425 Deep Sea Cable 54 0 0 0 0215 6426 Intrabuilding Network Cable 289 485 1 4 4,631216 6431 Aerial Wire 60 0 1 24 0217 6441 Conduit Systems 444 1,086 0 35 10,962218 6410 Total Cable and Wire Facilities Expenses 18,452 177,119 9,551 30,494 357,859
219 650 Total Plant Specific Operations Expenses 113,528 432,397 21,620 73,218 817,169
80
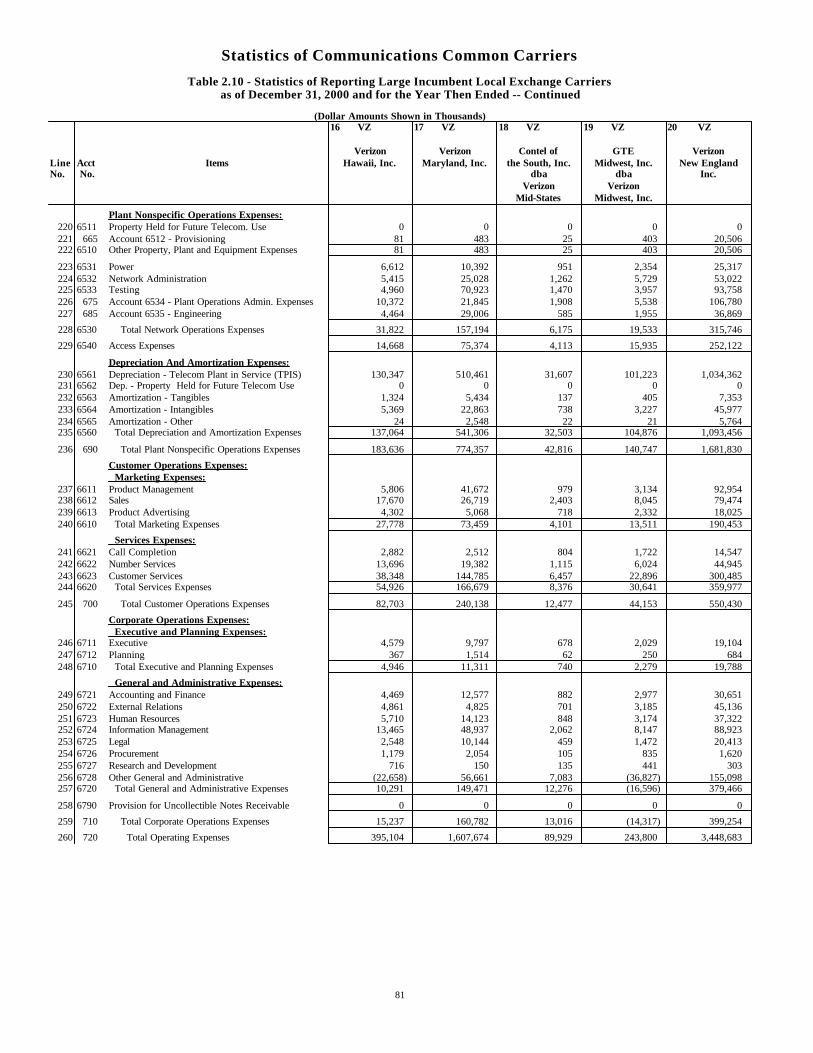
Statistics of Communications Common Carriers
Table 2.10 - Statistics of Reporting Large Incumbent Local Exchange Carriersas of December 31, 2000 and for the Year Then Ended -- Continued
(Dollar Amounts Shown in Thousands)16 VZ 17 VZ 18 VZ 19 VZ 20 VZ
Verizon Verizon Contel of GTE VerizonLine Acct Items Hawaii, Inc. Maryland, Inc. the South, Inc. Midwest, Inc. New EnglandNo. No. dba dba Inc.
Verizon VerizonMid-States Midwest, Inc.
Plant Nonspecific Operations Expenses:220 6511 Property Held for Future Telecom. Use 0 0 0 0 0221 665 Account 6512 - Provisioning 81 483 25 403 20,506222 6510 Other Property, Plant and Equipment Expenses 81 483 25 403 20,506
223 6531 Power 6,612 10,392 951 2,354 25,317224 6532 Network Administration 5,415 25,028 1,262 5,729 53,022225 6533 Testing 4,960 70,923 1,470 3,957 93,758226 675 Account 6534 - Plant Operations Admin. Expenses 10,372 21,845 1,908 5,538 106,780227 685 Account 6535 - Engineering 4,464 29,006 585 1,955 36,869
228 6530 Total Network Operations Expenses 31,822 157,194 6,175 19,533 315,746
229 6540 Access Expenses 14,668 75,374 4,113 15,935 252,122
Depreciation And Amortization Expenses:230 6561 Depreciation - Telecom Plant in Service (TPIS) 130,347 510,461 31,607 101,223 1,034,362231 6562 Dep. - Property Held for Future Telecom Use 0 0 0 0 0232 6563 Amortization - Tangibles 1,324 5,434 137 405 7,353233 6564 Amortization - Intangibles 5,369 22,863 738 3,227 45,977234 6565 Amortization - Other 24 2,548 22 21 5,764235 6560 Total Depreciation and Amortization Expenses 137,064 541,306 32,503 104,876 1,093,456
236 690 Total Plant Nonspecific Operations Expenses 183,636 774,357 42,816 140,747 1,681,830
Customer Operations Expenses: Marketing Expenses:
237 6611 Product Management 5,806 41,672 979 3,134 92,954238 6612 Sales 17,670 26,719 2,403 8,045 79,474239 6613 Product Advertising 4,302 5,068 718 2,332 18,025240 6610 Total Marketing Expenses 27,778 73,459 4,101 13,511 190,453
Services Expenses:241 6621 Call Completion 2,882 2,512 804 1,722 14,547242 6622 Number Services 13,696 19,382 1,115 6,024 44,945243 6623 Customer Services 38,348 144,785 6,457 22,896 300,485244 6620 Total Services Expenses 54,926 166,679 8,376 30,641 359,977
245 700 Total Customer Operations Expenses 82,703 240,138 12,477 44,153 550,430
Corporate Operations Expenses: Executive and Planning Expenses:
246 6711 Executive 4,579 9,797 678 2,029 19,104247 6712 Planning 367 1,514 62 250 684248 6710 Total Executive and Planning Expenses 4,946 11,311 740 2,279 19,788
General and Administrative Expenses:249 6721 Accounting and Finance 4,469 12,577 882 2,977 30,651250 6722 External Relations 4,861 4,825 701 3,185 45,136251 6723 Human Resources 5,710 14,123 848 3,174 37,322252 6724 Information Management 13,465 48,937 2,062 8,147 88,923253 6725 Legal 2,548 10,144 459 1,472 20,413254 6726 Procurement 1,179 2,054 105 835 1,620255 6727 Research and Development 716 150 135 441 303256 6728 Other General and Administrative (22,658) 56,661 7,083 (36,827) 155,098257 6720 Total General and Administrative Expenses 10,291 149,471 12,276 (16,596) 379,466
258 6790 Provision for Uncollectible Notes Receivable 0 0 0 0 0
259 710 Total Corporate Operations Expenses 15,237 160,782 13,016 (14,317) 399,254
260 720 Total Operating Expenses 395,104 1,607,674 89,929 243,800 3,448,683
81
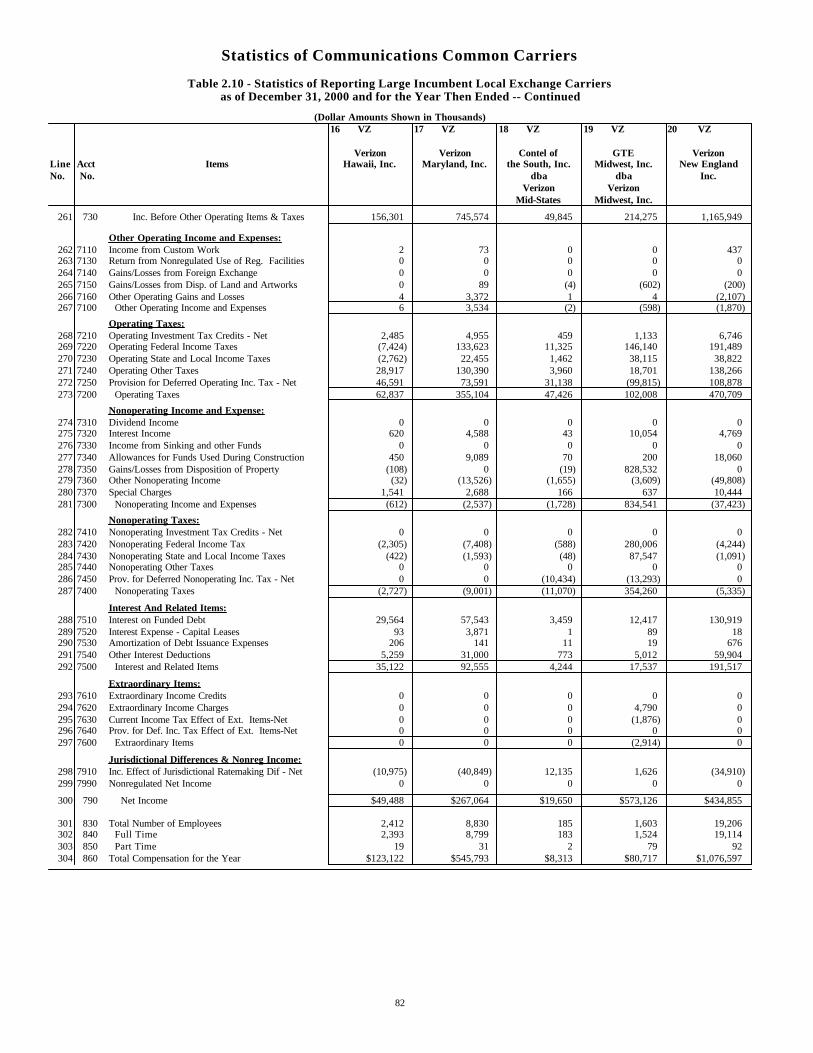
Statistics of Communications Common Carriers
Table 2.10 - Statistics of Reporting Large Incumbent Local Exchange Carriersas of December 31, 2000 and for the Year Then Ended -- Continued
(Dollar Amounts Shown in Thousands)16 VZ 17 VZ 18 VZ 19 VZ 20 VZ
Verizon Verizon Contel of GTE VerizonLine Acct Items Hawaii, Inc. Maryland, Inc. the South, Inc. Midwest, Inc. New EnglandNo. No. dba dba Inc.
Verizon VerizonMid-States Midwest, Inc.
261 730 Inc. Before Other Operating Items & Taxes 156,301 745,574 49,845 214,275 1,165,949
Other Operating Income and Expenses:262 7110 Income from Custom Work 2 73 0 0 437263 7130 Return from Nonregulated Use of Reg. Facilities 0 0 0 0 0264 7140 Gains/Losses from Foreign Exchange 0 0 0 0 0265 7150 Gains/Losses from Disp. of Land and Artworks 0 89 (4) (602) (200)266 7160 Other Operating Gains and Losses 4 3,372 1 4 (2,107)267 7100 Other Operating Income and Expenses 6 3,534 (2) (598) (1,870)
Operating Taxes:268 7210 Operating Investment Tax Credits - Net 2,485 4,955 459 1,133 6,746269 7220 Operating Federal Income Taxes (7,424) 133,623 11,325 146,140 191,489270 7230 Operating State and Local Income Taxes (2,762) 22,455 1,462 38,115 38,822271 7240 Operating Other Taxes 28,917 130,390 3,960 18,701 138,266272 7250 Provision for Deferred Operating Inc. Tax - Net 46,591 73,591 31,138 (99,815) 108,878273 7200 Operating Taxes 62,837 355,104 47,426 102,008 470,709
Nonoperating Income and Expense:274 7310 Dividend Income 0 0 0 0 0275 7320 Interest Income 620 4,588 43 10,054 4,769276 7330 Income from Sinking and other Funds 0 0 0 0 0277 7340 Allowances for Funds Used During Construction 450 9,089 70 200 18,060278 7350 Gains/Losses from Disposition of Property (108) 0 (19) 828,532 0279 7360 Other Nonoperating Income (32) (13,526) (1,655) (3,609) (49,808)280 7370 Special Charges 1,541 2,688 166 637 10,444281 7300 Nonoperating Income and Expenses (612) (2,537) (1,728) 834,541 (37,423)
Nonoperating Taxes:282 7410 Nonoperating Investment Tax Credits - Net 0 0 0 0 0283 7420 Nonoperating Federal Income Tax (2,305) (7,408) (588) 280,006 (4,244)284 7430 Nonoperating State and Local Income Taxes (422) (1,593) (48) 87,547 (1,091)285 7440 Nonoperating Other Taxes 0 0 0 0 0286 7450 Prov. for Deferred Nonoperating Inc. Tax - Net 0 0 (10,434) (13,293) 0287 7400 Nonoperating Taxes (2,727) (9,001) (11,070) 354,260 (5,335)
Interest And Related Items:288 7510 Interest on Funded Debt 29,564 57,543 3,459 12,417 130,919289 7520 Interest Expense - Capital Leases 93 3,871 1 89 18290 7530 Amortization of Debt Issuance Expenses 206 141 11 19 676291 7540 Other Interest Deductions 5,259 31,000 773 5,012 59,904292 7500 Interest and Related Items 35,122 92,555 4,244 17,537 191,517
Extraordinary Items:293 7610 Extraordinary Income Credits 0 0 0 0 0294 7620 Extraordinary Income Charges 0 0 0 4,790 0295 7630 Current Income Tax Effect of Ext. Items-Net 0 0 0 (1,876) 0296 7640 Prov. for Def. Inc. Tax Effect of Ext. Items-Net 0 0 0 0 0297 7600 Extraordinary Items 0 0 0 (2,914) 0
Jurisdictional Differences & Nonreg Income:298 7910 Inc. Effect of Jurisdictional Ratemaking Dif - Net (10,975) (40,849) 12,135 1,626 (34,910)299 7990 Nonregulated Net Income 0 0 0 0 0
300 790 Net Income $49,488 $267,064 $19,650 $573,126 $434,855
301 830 Total Number of Employees 2,412 8,830 185 1,603 19,206302 840 Full Time 2,393 8,799 183 1,524 19,114303 850 Part Time 19 31 2 79 92304 860 Total Compensation for the Year $123,122 $545,793 $8,313 $80,717 $1,076,597
82
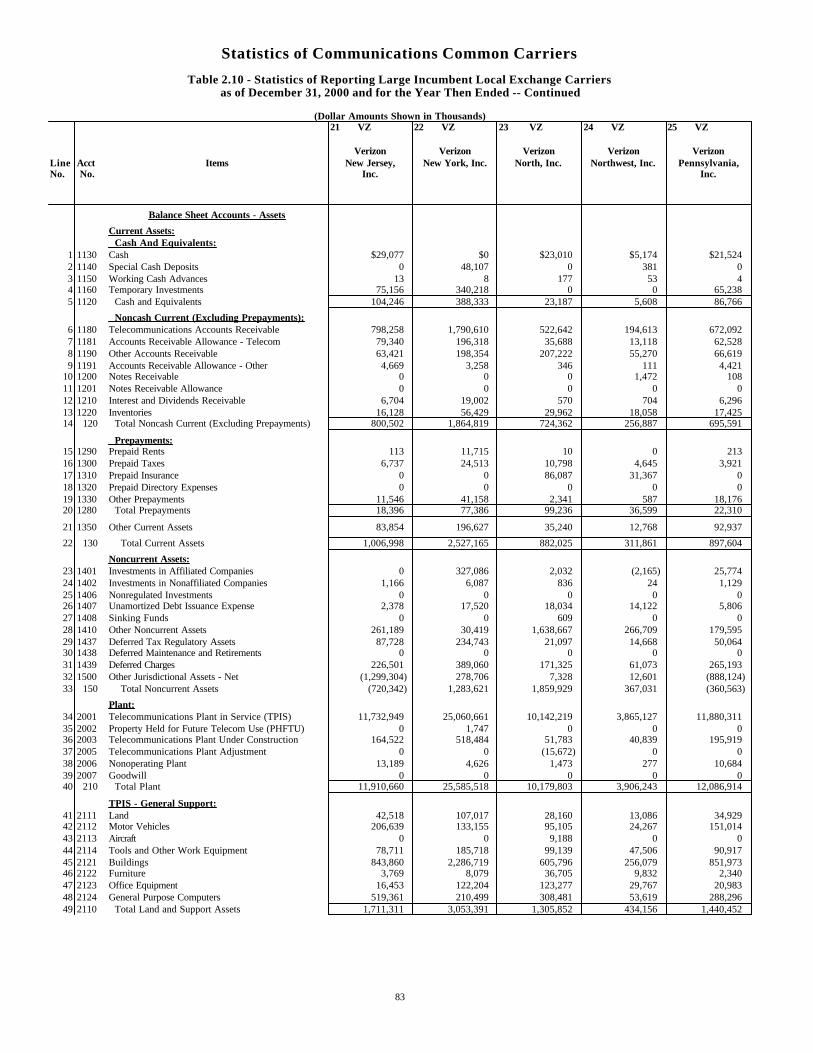
Statistics of Communications Common Carriers
Table 2.10 - Statistics of Reporting Large Incumbent Local Exchange Carriersas of December 31, 2000 and for the Year Then Ended -- Continued
(Dollar Amounts Shown in Thousands)21 VZ 22 VZ 23 VZ 24 VZ 25 VZ
Verizon Verizon Verizon Verizon VerizonLine Acct Items New Jersey, New York, Inc. North, Inc. Northwest, Inc. Pennsylvania,No. No. Inc. Inc.
Balance Sheet Accounts - Assets
Current Assets: Cash And Equivalents:
1 1130 Cash $29,077 $0 $23,010 $5,174 $21,5242 1140 Special Cash Deposits 0 48,107 0 381 03 1150 Working Cash Advances 13 8 177 53 44 1160 Temporary Investments 75,156 340,218 0 0 65,2385 1120 Cash and Equivalents 104,246 388,333 23,187 5,608 86,766
Noncash Current (Excluding Prepayments):6 1180 Telecommunications Accounts Receivable 798,258 1,790,610 522,642 194,613 672,0927 1181 Accounts Receivable Allowance - Telecom 79,340 196,318 35,688 13,118 62,5288 1190 Other Accounts Receivable 63,421 198,354 207,222 55,270 66,6199 1191 Accounts Receivable Allowance - Other 4,669 3,258 346 111 4,421
10 1200 Notes Receivable 0 0 0 1,472 10811 1201 Notes Receivable Allowance 0 0 0 0 012 1210 Interest and Dividends Receivable 6,704 19,002 570 704 6,29613 1220 Inventories 16,128 56,429 29,962 18,058 17,42514 120 Total Noncash Current (Excluding Prepayments) 800,502 1,864,819 724,362 256,887 695,591
Prepayments:15 1290 Prepaid Rents 113 11,715 10 0 21316 1300 Prepaid Taxes 6,737 24,513 10,798 4,645 3,92117 1310 Prepaid Insurance 0 0 86,087 31,367 018 1320 Prepaid Directory Expenses 0 0 0 0 019 1330 Other Prepayments 11,546 41,158 2,341 587 18,17620 1280 Total Prepayments 18,396 77,386 99,236 36,599 22,310
21 1350 Other Current Assets 83,854 196,627 35,240 12,768 92,937
22 130 Total Current Assets 1,006,998 2,527,165 882,025 311,861 897,604
Noncurrent Assets:23 1401 Investments in Affiliated Companies 0 327,086 2,032 (2,165) 25,77424 1402 Investments in Nonaffiliated Companies 1,166 6,087 836 24 1,12925 1406 Nonregulated Investments 0 0 0 0 026 1407 Unamortized Debt Issuance Expense 2,378 17,520 18,034 14,122 5,80627 1408 Sinking Funds 0 0 609 0 028 1410 Other Noncurrent Assets 261,189 30,419 1,638,667 266,709 179,59529 1437 Deferred Tax Regulatory Assets 87,728 234,743 21,097 14,668 50,06430 1438 Deferred Maintenance and Retirements 0 0 0 0 031 1439 Deferred Charges 226,501 389,060 171,325 61,073 265,19332 1500 Other Jurisdictional Assets - Net (1,299,304) 278,706 7,328 12,601 (888,124)33 150 Total Noncurrent Assets (720,342) 1,283,621 1,859,929 367,031 (360,563)
Plant:34 2001 Telecommunications Plant in Service (TPIS) 11,732,949 25,060,661 10,142,219 3,865,127 11,880,31135 2002 Property Held for Future Telecom Use (PHFTU) 0 1,747 0 0 036 2003 Telecommunications Plant Under Construction 164,522 518,484 51,783 40,839 195,91937 2005 Telecommunications Plant Adjustment 0 0 (15,672) 0 038 2006 Nonoperating Plant 13,189 4,626 1,473 277 10,68439 2007 Goodwill 0 0 0 0 040 210 Total Plant 11,910,660 25,585,518 10,179,803 3,906,243 12,086,914
TPIS - General Support:41 2111 Land 42,518 107,017 28,160 13,086 34,92942 2112 Motor Vehicles 206,639 133,155 95,105 24,267 151,01443 2113 Aircraft 0 0 9,188 0 044 2114 Tools and Other Work Equipment 78,711 185,718 99,139 47,506 90,91745 2121 Buildings 843,860 2,286,719 605,796 256,079 851,97346 2122 Furniture 3,769 8,079 36,705 9,832 2,34047 2123 Office Equipment 16,453 122,204 123,277 29,767 20,98348 2124 General Purpose Computers 519,361 210,499 308,481 53,619 288,29649 2110 Total Land and Support Assets 1,711,311 3,053,391 1,305,852 434,156 1,440,452
83
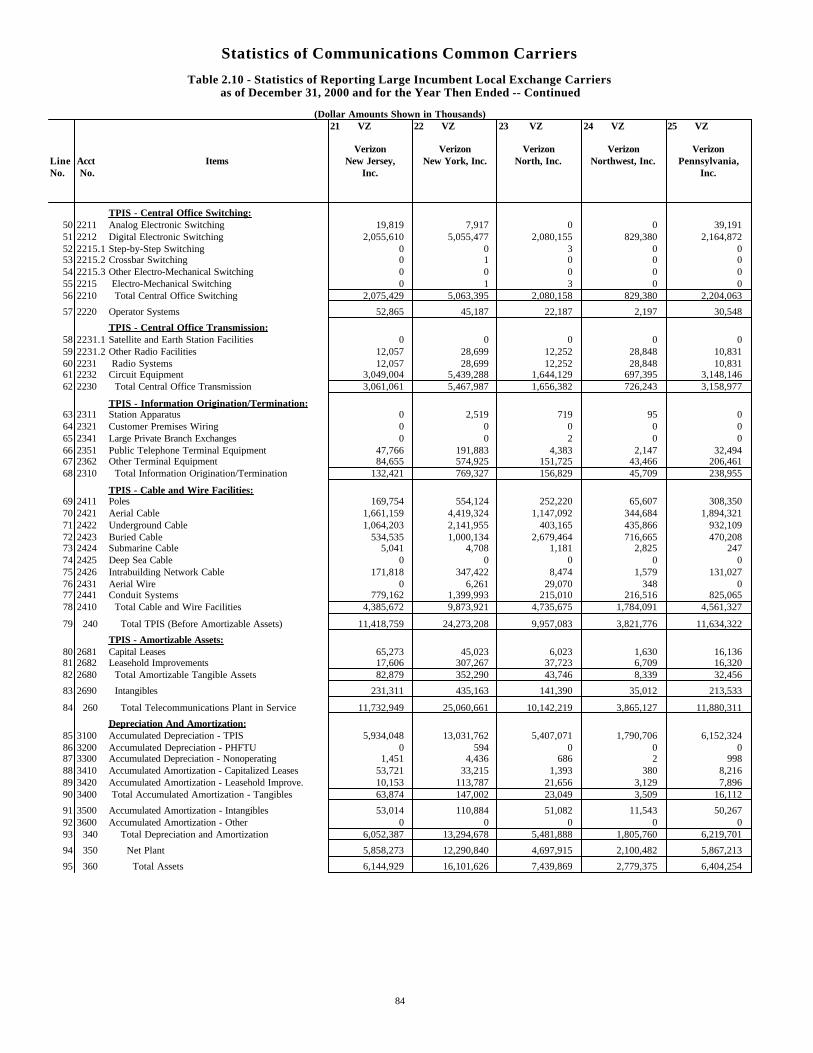
Statistics of Communications Common Carriers
Table 2.10 - Statistics of Reporting Large Incumbent Local Exchange Carriersas of December 31, 2000 and for the Year Then Ended -- Continued
(Dollar Amounts Shown in Thousands)21 VZ 22 VZ 23 VZ 24 VZ 25 VZ
Verizon Verizon Verizon Verizon VerizonLine Acct Items New Jersey, New York, Inc. North, Inc. Northwest, Inc. Pennsylvania,No. No. Inc. Inc.
TPIS - Central Office Switching:50 2211 Analog Electronic Switching 19,819 7,917 0 0 39,19151 2212 Digital Electronic Switching 2,055,610 5,055,477 2,080,155 829,380 2,164,87252 2215.1 Step-by-Step Switching 0 0 3 0 053 2215.2 Crossbar Switching 0 1 0 0 054 2215.3 Other Electro-Mechanical Switching 0 0 0 0 055 2215 Electro-Mechanical Switching 0 1 3 0 056 2210 Total Central Office Switching 2,075,429 5,063,395 2,080,158 829,380 2,204,063
57 2220 Operator Systems 52,865 45,187 22,187 2,197 30,548
TPIS - Central Office Transmission:58 2231.1 Satellite and Earth Station Facilities 0 0 0 0 059 2231.2 Other Radio Facilities 12,057 28,699 12,252 28,848 10,83160 2231 Radio Systems 12,057 28,699 12,252 28,848 10,83161 2232 Circuit Equipment 3,049,004 5,439,288 1,644,129 697,395 3,148,14662 2230 Total Central Office Transmission 3,061,061 5,467,987 1,656,382 726,243 3,158,977
TPIS - Information Origination/Termination:63 2311 Station Apparatus 0 2,519 719 95 064 2321 Customer Premises Wiring 0 0 0 0 065 2341 Large Private Branch Exchanges 0 0 2 0 066 2351 Public Telephone Terminal Equipment 47,766 191,883 4,383 2,147 32,49467 2362 Other Terminal Equipment 84,655 574,925 151,725 43,466 206,46168 2310 Total Information Origination/Termination 132,421 769,327 156,829 45,709 238,955
TPIS - Cable and Wire Facilities:69 2411 Poles 169,754 554,124 252,220 65,607 308,35070 2421 Aerial Cable 1,661,159 4,419,324 1,147,092 344,684 1,894,32171 2422 Underground Cable 1,064,203 2,141,955 403,165 435,866 932,10972 2423 Buried Cable 534,535 1,000,134 2,679,464 716,665 470,20873 2424 Submarine Cable 5,041 4,708 1,181 2,825 24774 2425 Deep Sea Cable 0 0 0 0 075 2426 Intrabuilding Network Cable 171,818 347,422 8,474 1,579 131,02776 2431 Aerial Wire 0 6,261 29,070 348 077 2441 Conduit Systems 779,162 1,399,993 215,010 216,516 825,06578 2410 Total Cable and Wire Facilities 4,385,672 9,873,921 4,735,675 1,784,091 4,561,327
79 240 Total TPIS (Before Amortizable Assets) 11,418,759 24,273,208 9,957,083 3,821,776 11,634,322
TPIS - Amortizable Assets:80 2681 Capital Leases 65,273 45,023 6,023 1,630 16,13681 2682 Leasehold Improvements 17,606 307,267 37,723 6,709 16,32082 2680 Total Amortizable Tangible Assets 82,879 352,290 43,746 8,339 32,456
83 2690 Intangibles 231,311 435,163 141,390 35,012 213,533
84 260 Total Telecommunications Plant in Service 11,732,949 25,060,661 10,142,219 3,865,127 11,880,311
Depreciation And Amortization:85 3100 Accumulated Depreciation - TPIS 5,934,048 13,031,762 5,407,071 1,790,706 6,152,32486 3200 Accumulated Depreciation - PHFTU 0 594 0 0 087 3300 Accumulated Depreciation - Nonoperating 1,451 4,436 686 2 99888 3410 Accumulated Amortization - Capitalized Leases 53,721 33,215 1,393 380 8,21689 3420 Accumulated Amortization - Leasehold Improve. 10,153 113,787 21,656 3,129 7,89690 3400 Total Accumulated Amortization - Tangibles 63,874 147,002 23,049 3,509 16,112
91 3500 Accumulated Amortization - Intangibles 53,014 110,884 51,082 11,543 50,26792 3600 Accumulated Amortization - Other 0 0 0 0 093 340 Total Depreciation and Amortization 6,052,387 13,294,678 5,481,888 1,805,760 6,219,701
94 350 Net Plant 5,858,273 12,290,840 4,697,915 2,100,482 5,867,213
95 360 Total Assets 6,144,929 16,101,626 7,439,869 2,779,375 6,404,254
84
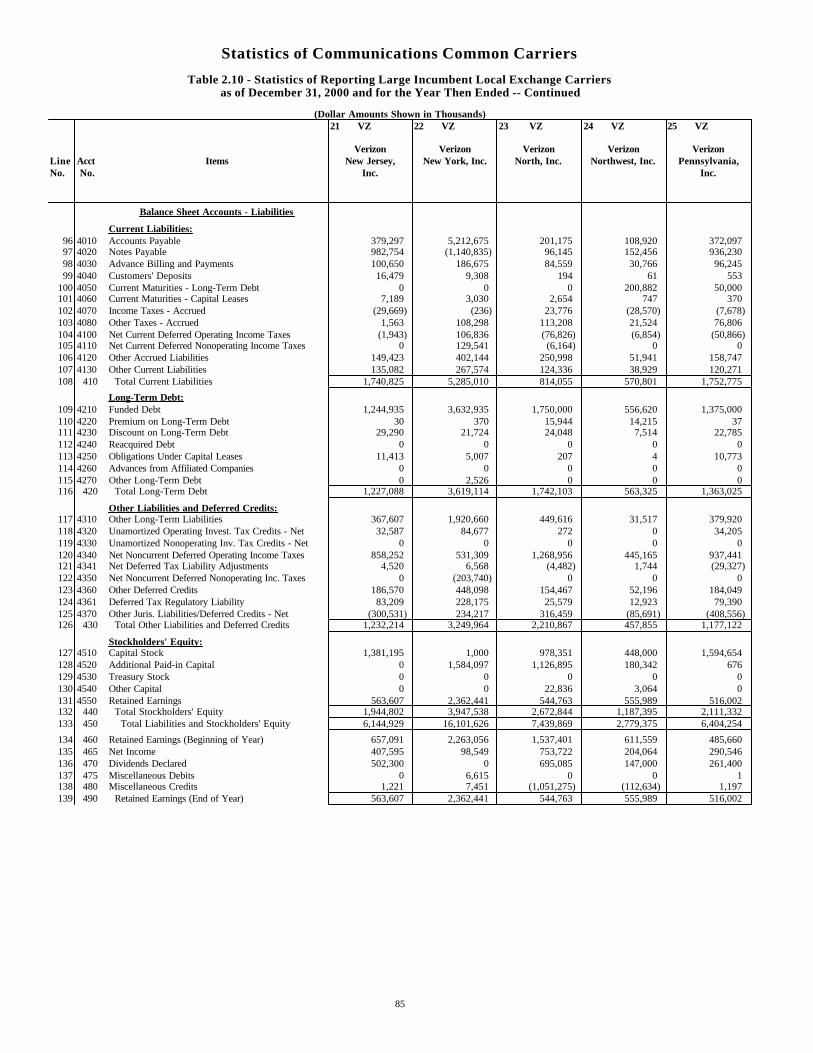
Statistics of Communications Common Carriers
Table 2.10 - Statistics of Reporting Large Incumbent Local Exchange Carriersas of December 31, 2000 and for the Year Then Ended -- Continued
(Dollar Amounts Shown in Thousands)21 VZ 22 VZ 23 VZ 24 VZ 25 VZ
Verizon Verizon Verizon Verizon VerizonLine Acct Items New Jersey, New York, Inc. North, Inc. Northwest, Inc. Pennsylvania,No. No. Inc. Inc.
Balance Sheet Accounts - Liabilities
Current Liabilities:96 4010 Accounts Payable 379,297 5,212,675 201,175 108,920 372,09797 4020 Notes Payable 982,754 (1,140,835) 96,145 152,456 936,23098 4030 Advance Billing and Payments 100,650 186,675 84,559 30,766 96,24599 4040 Customers' Deposits 16,479 9,308 194 61 553
100 4050 Current Maturities - Long-Term Debt 0 0 0 200,882 50,000101 4060 Current Maturities - Capital Leases 7,189 3,030 2,654 747 370102 4070 Income Taxes - Accrued (29,669) (236) 23,776 (28,570) (7,678)103 4080 Other Taxes - Accrued 1,563 108,298 113,208 21,524 76,806104 4100 Net Current Deferred Operating Income Taxes (1,943) 106,836 (76,826) (6,854) (50,866)105 4110 Net Current Deferred Nonoperating Income Taxes 0 129,541 (6,164) 0 0106 4120 Other Accrued Liabilities 149,423 402,144 250,998 51,941 158,747107 4130 Other Current Liabilities 135,082 267,574 124,336 38,929 120,271108 410 Total Current Liabilities 1,740,825 5,285,010 814,055 570,801 1,752,775
Long-Term Debt:109 4210 Funded Debt 1,244,935 3,632,935 1,750,000 556,620 1,375,000110 4220 Premium on Long-Term Debt 30 370 15,944 14,215 37111 4230 Discount on Long-Term Debt 29,290 21,724 24,048 7,514 22,785112 4240 Reacquired Debt 0 0 0 0 0113 4250 Obligations Under Capital Leases 11,413 5,007 207 4 10,773114 4260 Advances from Affiliated Companies 0 0 0 0 0115 4270 Other Long-Term Debt 0 2,526 0 0 0116 420 Total Long-Term Debt 1,227,088 3,619,114 1,742,103 563,325 1,363,025
Other Liabilities and Deferred Credits:117 4310 Other Long-Term Liabilities 367,607 1,920,660 449,616 31,517 379,920118 4320 Unamortized Operating Invest. Tax Credits - Net 32,587 84,677 272 0 34,205119 4330 Unamortized Nonoperating Inv. Tax Credits - Net 0 0 0 0 0120 4340 Net Noncurrent Deferred Operating Income Taxes 858,252 531,309 1,268,956 445,165 937,441121 4341 Net Deferred Tax Liability Adjustments 4,520 6,568 (4,482) 1,744 (29,327)122 4350 Net Noncurrent Deferred Nonoperating Inc. Taxes 0 (203,740) 0 0 0123 4360 Other Deferred Credits 186,570 448,098 154,467 52,196 184,049124 4361 Deferred Tax Regulatory Liability 83,209 228,175 25,579 12,923 79,390125 4370 Other Juris. Liabilities/Deferred Credits - Net (300,531) 234,217 316,459 (85,691) (408,556)126 430 Total Other Liabilities and Deferred Credits 1,232,214 3,249,964 2,210,867 457,855 1,177,122
Stockholders' Equity:127 4510 Capital Stock 1,381,195 1,000 978,351 448,000 1,594,654128 4520 Additional Paid-in Capital 0 1,584,097 1,126,895 180,342 676129 4530 Treasury Stock 0 0 0 0 0130 4540 Other Capital 0 0 22,836 3,064 0131 4550 Retained Earnings 563,607 2,362,441 544,763 555,989 516,002132 440 Total Stockholders' Equity 1,944,802 3,947,538 2,672,844 1,187,395 2,111,332133 450 Total Liabilities and Stockholders' Equity 6,144,929 16,101,626 7,439,869 2,779,375 6,404,254
134 460 Retained Earnings (Beginning of Year) 657,091 2,263,056 1,537,401 611,559 485,660135 465 Net Income 407,595 98,549 753,722 204,064 290,546136 470 Dividends Declared 502,300 0 695,085 147,000 261,400137 475 Miscellaneous Debits 0 6,615 0 0 1138 480 Miscellaneous Credits 1,221 7,451 (1,051,275) (112,634) 1,197139 490 Retained Earnings (End of Year) 563,607 2,362,441 544,763 555,989 516,002
85
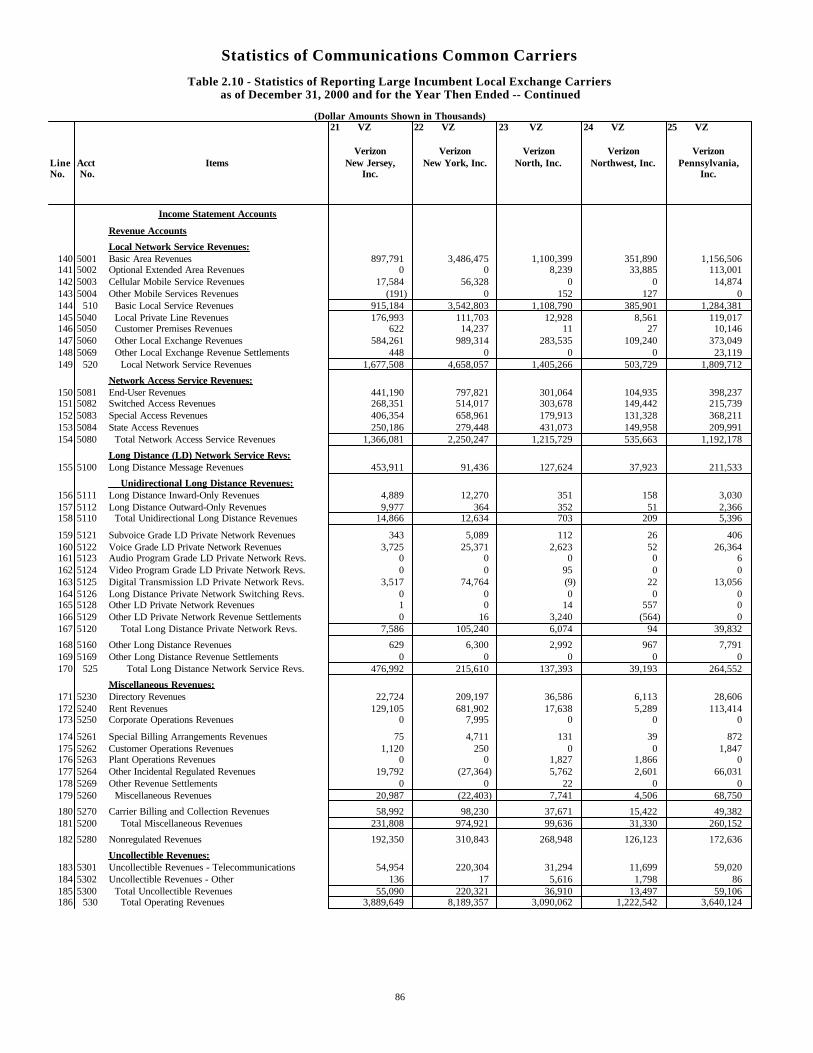
Statistics of Communications Common Carriers
Table 2.10 - Statistics of Reporting Large Incumbent Local Exchange Carriersas of December 31, 2000 and for the Year Then Ended -- Continued
(Dollar Amounts Shown in Thousands)21 VZ 22 VZ 23 VZ 24 VZ 25 VZ
Verizon Verizon Verizon Verizon VerizonLine Acct Items New Jersey, New York, Inc. North, Inc. Northwest, Inc. Pennsylvania,No. No. Inc. Inc.
Income Statement Accounts
Revenue Accounts
Local Network Service Revenues:140 5001 Basic Area Revenues 897,791 3,486,475 1,100,399 351,890 1,156,506141 5002 Optional Extended Area Revenues 0 0 8,239 33,885 113,001142 5003 Cellular Mobile Service Revenues 17,584 56,328 0 0 14,874143 5004 Other Mobile Services Revenues (191) 0 152 127 0144 510 Basic Local Service Revenues 915,184 3,542,803 1,108,790 385,901 1,284,381145 5040 Local Private Line Revenues 176,993 111,703 12,928 8,561 119,017146 5050 Customer Premises Revenues 622 14,237 11 27 10,146147 5060 Other Local Exchange Revenues 584,261 989,314 283,535 109,240 373,049148 5069 Other Local Exchange Revenue Settlements 448 0 0 0 23,119149 520 Local Network Service Revenues 1,677,508 4,658,057 1,405,266 503,729 1,809,712
Network Access Service Revenues:150 5081 End-User Revenues 441,190 797,821 301,064 104,935 398,237151 5082 Switched Access Revenues 268,351 514,017 303,678 149,442 215,739152 5083 Special Access Revenues 406,354 658,961 179,913 131,328 368,211153 5084 State Access Revenues 250,186 279,448 431,073 149,958 209,991154 5080 Total Network Access Service Revenues 1,366,081 2,250,247 1,215,729 535,663 1,192,178
Long Distance (LD) Network Service Revs:155 5100 Long Distance Message Revenues 453,911 91,436 127,624 37,923 211,533
Unidirectional Long Distance Revenues:156 5111 Long Distance Inward-Only Revenues 4,889 12,270 351 158 3,030157 5112 Long Distance Outward-Only Revenues 9,977 364 352 51 2,366158 5110 Total Unidirectional Long Distance Revenues 14,866 12,634 703 209 5,396
159 5121 Subvoice Grade LD Private Network Revenues 343 5,089 112 26 406160 5122 Voice Grade LD Private Network Revenues 3,725 25,371 2,623 52 26,364161 5123 Audio Program Grade LD Private Network Revs. 0 0 0 0 6162 5124 Video Program Grade LD Private Network Revs. 0 0 95 0 0163 5125 Digital Transmission LD Private Network Revs. 3,517 74,764 (9) 22 13,056164 5126 Long Distance Private Network Switching Revs. 0 0 0 0 0165 5128 Other LD Private Network Revenues 1 0 14 557 0166 5129 Other LD Private Network Revenue Settlements 0 16 3,240 (564) 0167 5120 Total Long Distance Private Network Revs. 7,586 105,240 6,074 94 39,832
168 5160 Other Long Distance Revenues 629 6,300 2,992 967 7,791169 5169 Other Long Distance Revenue Settlements 0 0 0 0 0170 525 Total Long Distance Network Service Revs. 476,992 215,610 137,393 39,193 264,552
Miscellaneous Revenues:171 5230 Directory Revenues 22,724 209,197 36,586 6,113 28,606172 5240 Rent Revenues 129,105 681,902 17,638 5,289 113,414173 5250 Corporate Operations Revenues 0 7,995 0 0 0
174 5261 Special Billing Arrangements Revenues 75 4,711 131 39 872175 5262 Customer Operations Revenues 1,120 250 0 0 1,847176 5263 Plant Operations Revenues 0 0 1,827 1,866 0177 5264 Other Incidental Regulated Revenues 19,792 (27,364) 5,762 2,601 66,031178 5269 Other Revenue Settlements 0 0 22 0 0179 5260 Miscellaneous Revenues 20,987 (22,403) 7,741 4,506 68,750
180 5270 Carrier Billing and Collection Revenues 58,992 98,230 37,671 15,422 49,382181 5200 Total Miscellaneous Revenues 231,808 974,921 99,636 31,330 260,152
182 5280 Nonregulated Revenues 192,350 310,843 268,948 126,123 172,636
Uncollectible Revenues:183 5301 Uncollectible Revenues - Telecommunications 54,954 220,304 31,294 11,699 59,020184 5302 Uncollectible Revenues - Other 136 17 5,616 1,798 86185 5300 Total Uncollectible Revenues 55,090 220,321 36,910 13,497 59,106186 530 Total Operating Revenues 3,889,649 8,189,357 3,090,062 1,222,542 3,640,124
86
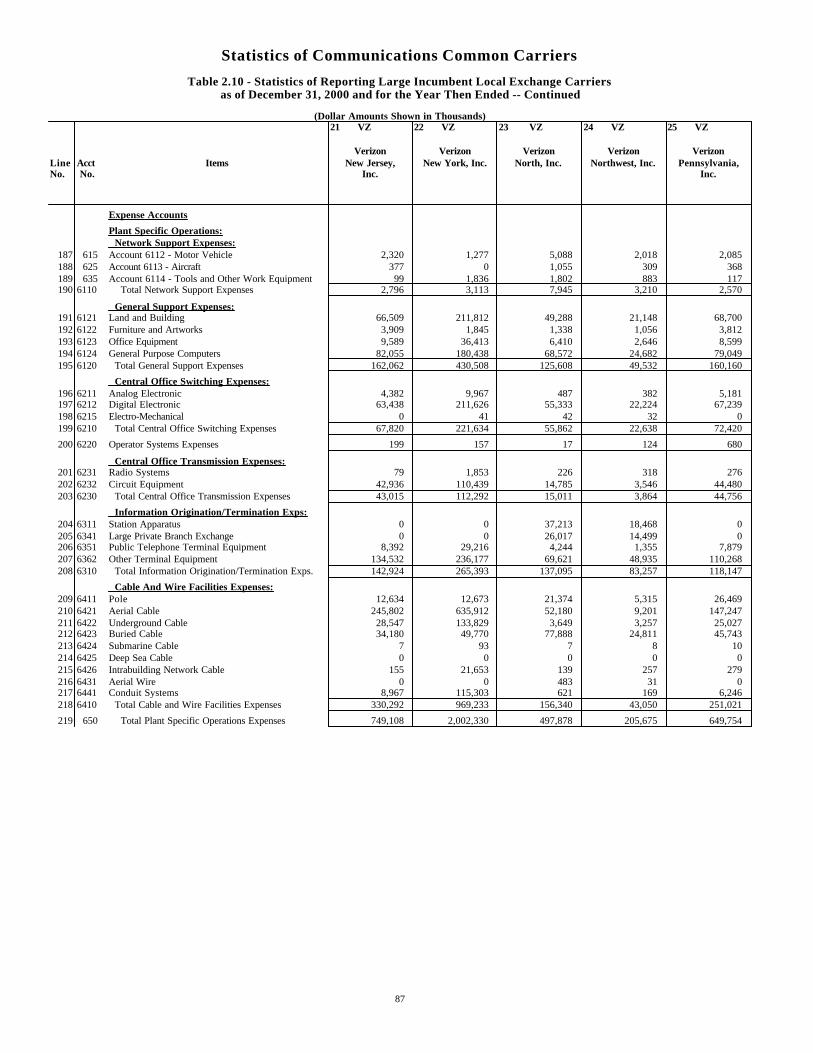
Statistics of Communications Common Carriers
Table 2.10 - Statistics of Reporting Large Incumbent Local Exchange Carriersas of December 31, 2000 and for the Year Then Ended -- Continued
(Dollar Amounts Shown in Thousands)21 VZ 22 VZ 23 VZ 24 VZ 25 VZ
Verizon Verizon Verizon Verizon VerizonLine Acct Items New Jersey, New York, Inc. North, Inc. Northwest, Inc. Pennsylvania,No. No. Inc. Inc.
Expense Accounts
Plant Specific Operations: Network Support Expenses:
187 615 Account 6112 - Motor Vehicle 2,320 1,277 5,088 2,018 2,085188 625 Account 6113 - Aircraft 377 0 1,055 309 368189 635 Account 6114 - Tools and Other Work Equipment 99 1,836 1,802 883 117190 6110 Total Network Support Expenses 2,796 3,113 7,945 3,210 2,570
General Support Expenses:191 6121 Land and Building 66,509 211,812 49,288 21,148 68,700192 6122 Furniture and Artworks 3,909 1,845 1,338 1,056 3,812193 6123 Office Equipment 9,589 36,413 6,410 2,646 8,599194 6124 General Purpose Computers 82,055 180,438 68,572 24,682 79,049195 6120 Total General Support Expenses 162,062 430,508 125,608 49,532 160,160
Central Office Switching Expenses:196 6211 Analog Electronic 4,382 9,967 487 382 5,181197 6212 Digital Electronic 63,438 211,626 55,333 22,224 67,239198 6215 Electro-Mechanical 0 41 42 32 0199 6210 Total Central Office Switching Expenses 67,820 221,634 55,862 22,638 72,420
200 6220 Operator Systems Expenses 199 157 17 124 680
Central Office Transmission Expenses:201 6231 Radio Systems 79 1,853 226 318 276202 6232 Circuit Equipment 42,936 110,439 14,785 3,546 44,480203 6230 Total Central Office Transmission Expenses 43,015 112,292 15,011 3,864 44,756
Information Origination/Termination Exps:204 6311 Station Apparatus 0 0 37,213 18,468 0205 6341 Large Private Branch Exchange 0 0 26,017 14,499 0206 6351 Public Telephone Terminal Equipment 8,392 29,216 4,244 1,355 7,879207 6362 Other Terminal Equipment 134,532 236,177 69,621 48,935 110,268208 6310 Total Information Origination/Termination Exps. 142,924 265,393 137,095 83,257 118,147
Cable And Wire Facilities Expenses:209 6411 Pole 12,634 12,673 21,374 5,315 26,469210 6421 Aerial Cable 245,802 635,912 52,180 9,201 147,247211 6422 Underground Cable 28,547 133,829 3,649 3,257 25,027212 6423 Buried Cable 34,180 49,770 77,888 24,811 45,743213 6424 Submarine Cable 7 93 7 8 10214 6425 Deep Sea Cable 0 0 0 0 0215 6426 Intrabuilding Network Cable 155 21,653 139 257 279216 6431 Aerial Wire 0 0 483 31 0217 6441 Conduit Systems 8,967 115,303 621 169 6,246218 6410 Total Cable and Wire Facilities Expenses 330,292 969,233 156,340 43,050 251,021
219 650 Total Plant Specific Operations Expenses 749,108 2,002,330 497,878 205,675 649,754
87
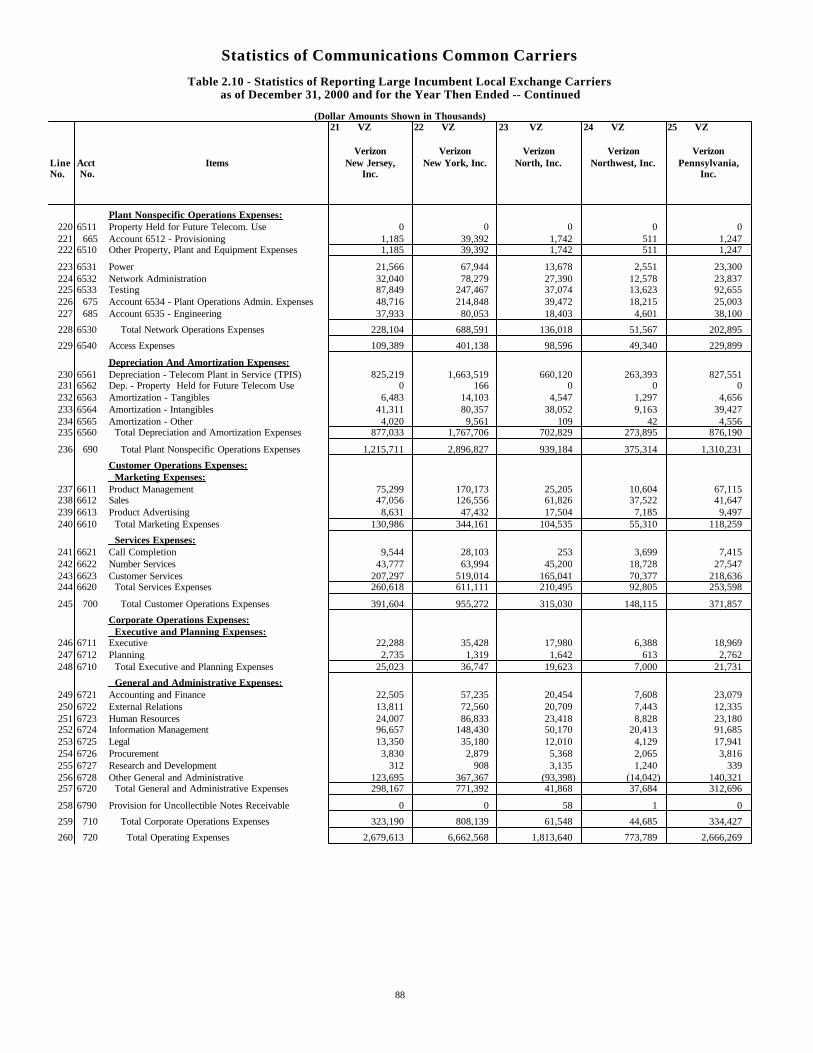
Statistics of Communications Common Carriers
Table 2.10 - Statistics of Reporting Large Incumbent Local Exchange Carriersas of December 31, 2000 and for the Year Then Ended -- Continued
(Dollar Amounts Shown in Thousands)21 VZ 22 VZ 23 VZ 24 VZ 25 VZ
Verizon Verizon Verizon Verizon VerizonLine Acct Items New Jersey, New York, Inc. North, Inc. Northwest, Inc. Pennsylvania,No. No. Inc. Inc.
Plant Nonspecific Operations Expenses:220 6511 Property Held for Future Telecom. Use 0 0 0 0 0221 665 Account 6512 - Provisioning 1,185 39,392 1,742 511 1,247222 6510 Other Property, Plant and Equipment Expenses 1,185 39,392 1,742 511 1,247
223 6531 Power 21,566 67,944 13,678 2,551 23,300224 6532 Network Administration 32,040 78,279 27,390 12,578 23,837225 6533 Testing 87,849 247,467 37,074 13,623 92,655226 675 Account 6534 - Plant Operations Admin. Expenses 48,716 214,848 39,472 18,215 25,003227 685 Account 6535 - Engineering 37,933 80,053 18,403 4,601 38,100
228 6530 Total Network Operations Expenses 228,104 688,591 136,018 51,567 202,895
229 6540 Access Expenses 109,389 401,138 98,596 49,340 229,899
Depreciation And Amortization Expenses:230 6561 Depreciation - Telecom Plant in Service (TPIS) 825,219 1,663,519 660,120 263,393 827,551231 6562 Dep. - Property Held for Future Telecom Use 0 166 0 0 0232 6563 Amortization - Tangibles 6,483 14,103 4,547 1,297 4,656233 6564 Amortization - Intangibles 41,311 80,357 38,052 9,163 39,427234 6565 Amortization - Other 4,020 9,561 109 42 4,556235 6560 Total Depreciation and Amortization Expenses 877,033 1,767,706 702,829 273,895 876,190
236 690 Total Plant Nonspecific Operations Expenses 1,215,711 2,896,827 939,184 375,314 1,310,231
Customer Operations Expenses: Marketing Expenses:
237 6611 Product Management 75,299 170,173 25,205 10,604 67,115238 6612 Sales 47,056 126,556 61,826 37,522 41,647239 6613 Product Advertising 8,631 47,432 17,504 7,185 9,497240 6610 Total Marketing Expenses 130,986 344,161 104,535 55,310 118,259
Services Expenses:241 6621 Call Completion 9,544 28,103 253 3,699 7,415242 6622 Number Services 43,777 63,994 45,200 18,728 27,547243 6623 Customer Services 207,297 519,014 165,041 70,377 218,636244 6620 Total Services Expenses 260,618 611,111 210,495 92,805 253,598
245 700 Total Customer Operations Expenses 391,604 955,272 315,030 148,115 371,857
Corporate Operations Expenses: Executive and Planning Expenses:
246 6711 Executive 22,288 35,428 17,980 6,388 18,969247 6712 Planning 2,735 1,319 1,642 613 2,762248 6710 Total Executive and Planning Expenses 25,023 36,747 19,623 7,000 21,731
General and Administrative Expenses:249 6721 Accounting and Finance 22,505 57,235 20,454 7,608 23,079250 6722 External Relations 13,811 72,560 20,709 7,443 12,335251 6723 Human Resources 24,007 86,833 23,418 8,828 23,180252 6724 Information Management 96,657 148,430 50,170 20,413 91,685253 6725 Legal 13,350 35,180 12,010 4,129 17,941254 6726 Procurement 3,830 2,879 5,368 2,065 3,816255 6727 Research and Development 312 908 3,135 1,240 339256 6728 Other General and Administrative 123,695 367,367 (93,398) (14,042) 140,321257 6720 Total General and Administrative Expenses 298,167 771,392 41,868 37,684 312,696
258 6790 Provision for Uncollectible Notes Receivable 0 0 58 1 0
259 710 Total Corporate Operations Expenses 323,190 808,139 61,548 44,685 334,427
260 720 Total Operating Expenses 2,679,613 6,662,568 1,813,640 773,789 2,666,269
88

Statistics of Communications Common Carriers
Table 2.10 - Statistics of Reporting Large Incumbent Local Exchange Carriersas of December 31, 2000 and for the Year Then Ended -- Continued
(Dollar Amounts Shown in Thousands)21 VZ 22 VZ 23 VZ 24 VZ 25 VZ
Verizon Verizon Verizon Verizon VerizonLine Acct Items New Jersey, New York, Inc. North, Inc. Northwest, Inc. Pennsylvania,No. No. Inc. Inc.
261 730 Inc. Before Other Operating Items & Taxes 1,210,036 1,526,789 1,276,422 448,752 973,855
Other Operating Income and Expenses:262 7110 Income from Custom Work 0 310 45 0 55263 7130 Return from Nonregulated Use of Reg. Facilities 0 0 0 0 0264 7140 Gains/Losses from Foreign Exchange 0 0 0 0 0265 7150 Gains/Losses from Disp. of Land and Artworks (4,646) 0 (949) (1) (14)266 7160 Other Operating Gains and Losses (1,865) 265 21 8 1,848267 7100 Other Operating Income and Expenses (6,511) 575 (883) 7 1,889
Operating Taxes:268 7210 Operating Investment Tax Credits - Net 9,100 9,464 1,100 60 10,250269 7220 Operating Federal Income Taxes 206,550 104,108 262,064 78,622 123,784270 7230 Operating State and Local Income Taxes 46,700 (268) 36,768 5,761 40,643271 7240 Operating Other Taxes 82,551 612,776 150,559 51,251 147,428272 7250 Provision for Deferred Operating Inc. Tax - Net 144,043 101,351 276,452 52,598 119,678273 7200 Operating Taxes 470,744 808,503 724,742 188,172 421,283
Nonoperating Income and Expense:274 7310 Dividend Income 0 0 0 0 0275 7320 Interest Income 9,113 63,000 3,342 836 10,484276 7330 Income from Sinking and other Funds 0 0 0 0 0277 7340 Allowances for Funds Used During Construction 9,599 47,751 2,349 1,832 12,901278 7350 Gains/Losses from Disposition of Property 0 0 382,406 (478) 0279 7360 Other Nonoperating Income (9,970) 34,290 (27,364) (9,090) (40,493)280 7370 Special Charges 2,278 15,092 6,807 3,445 3,003281 7300 Nonoperating Income and Expenses 6,464 129,949 353,927 (10,346) (20,111)
Nonoperating Taxes:282 7410 Nonoperating Investment Tax Credits - Net 0 0 0 0 0283 7420 Nonoperating Federal Income Tax (1,275) 10,210 128,387 (3,474) 776284 7430 Nonoperating State and Local Income Taxes (360) 0 14,496 (243) 246285 7440 Nonoperating Other Taxes 0 1,213 (10) 0 3286 7450 Prov. for Deferred Nonoperating Inc. Tax - Net 0 0 (6,164) 0 0287 7400 Nonoperating Taxes (1,635) 11,423 136,708 (3,717) 1,025
Interest And Related Items:288 7510 Interest on Funded Debt 89,382 246,121 121,133 52,617 101,778289 7520 Interest Expense - Capital Leases 2,505 819 343 120 1,092290 7530 Amortization of Debt Issuance Expenses 230 1,329 1,073 880 386291 7540 Other Interest Deductions 43,404 170,180 9,934 4,917 44,216292 7500 Interest and Related Items 135,521 418,449 132,484 58,535 147,472
Extraordinary Items:293 7610 Extraordinary Income Credits 0 0 0 0 0294 7620 Extraordinary Income Charges 0 0 0 0 0295 7630 Current Income Tax Effect of Ext. Items-Net 0 0 0 0 0296 7640 Prov. for Def. Inc. Tax Effect of Ext. Items-Net 0 0 0 0 0297 7600 Extraordinary Items 0 0 0 0 0
Jurisdictional Differences & Nonreg Income:298 7910 Inc. Effect of Jurisdictional Ratemaking Dif - Net (197,764) (320,389) 118,190 8,640 (95,307)299 7990 Nonregulated Net Income 0 0 0 0 0
300 790 Net Income $407,595 $98,549 $753,722 $204,064 $290,546
301 830 Total Number of Employees 13,774 37,644 13,939 3,906 12,494302 840 Full Time 13,749 37,577 13,666 3,831 12,420303 850 Part Time 25 67 273 75 74304 860 Total Compensation for the Year $941,201 $2,343,141 $743,706 $191,838 $845,715
89
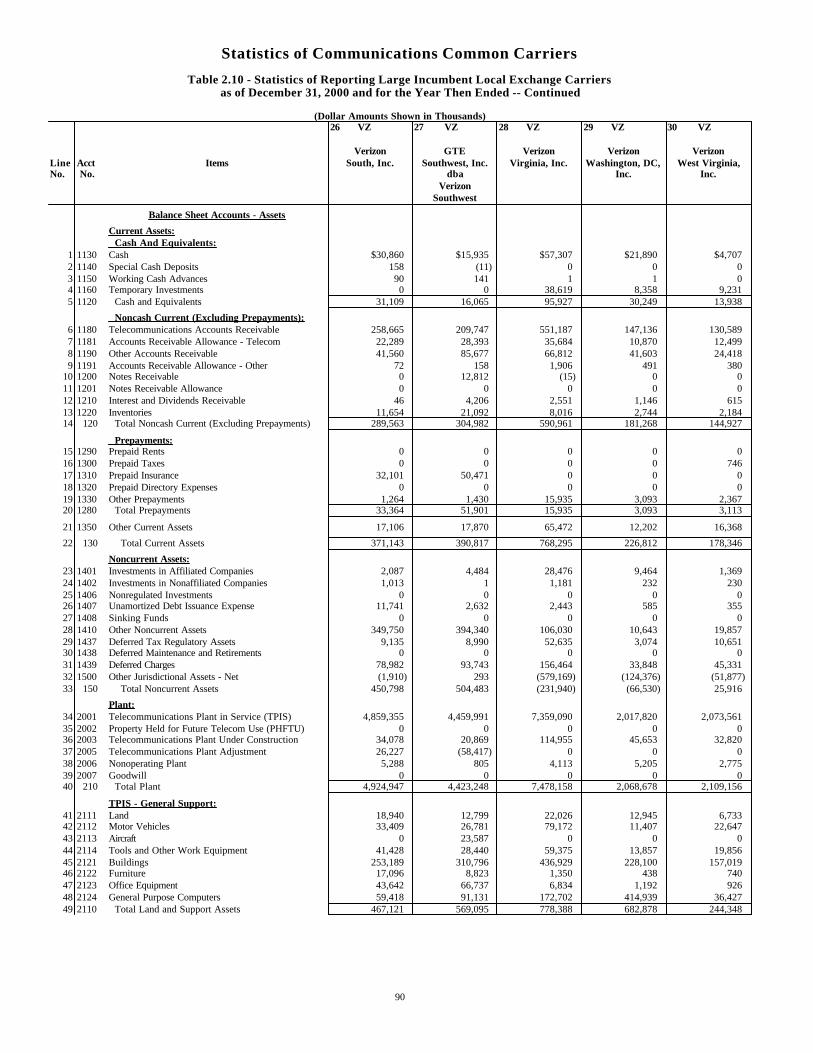
Statistics of Communications Common Carriers
Table 2.10 - Statistics of Reporting Large Incumbent Local Exchange Carriersas of December 31, 2000 and for the Year Then Ended -- Continued
(Dollar Amounts Shown in Thousands)26 VZ 27 VZ 28 VZ 29 VZ 30 VZ
Verizon GTE Verizon Verizon VerizonLine Acct Items South, Inc. Southwest, Inc. Virginia, Inc. Washington, DC, West Virginia,No. No. dba Inc. Inc.
VerizonSouthwest
Balance Sheet Accounts - Assets
Current Assets: Cash And Equivalents:
1 1130 Cash $30,860 $15,935 $57,307 $21,890 $4,7072 1140 Special Cash Deposits 158 (11) 0 0 03 1150 Working Cash Advances 90 141 1 1 04 1160 Temporary Investments 0 0 38,619 8,358 9,2315 1120 Cash and Equivalents 31,109 16,065 95,927 30,249 13,938
Noncash Current (Excluding Prepayments):6 1180 Telecommunications Accounts Receivable 258,665 209,747 551,187 147,136 130,5897 1181 Accounts Receivable Allowance - Telecom 22,289 28,393 35,684 10,870 12,4998 1190 Other Accounts Receivable 41,560 85,677 66,812 41,603 24,4189 1191 Accounts Receivable Allowance - Other 72 158 1,906 491 380
10 1200 Notes Receivable 0 12,812 (15) 0 011 1201 Notes Receivable Allowance 0 0 0 0 012 1210 Interest and Dividends Receivable 46 4,206 2,551 1,146 61513 1220 Inventories 11,654 21,092 8,016 2,744 2,18414 120 Total Noncash Current (Excluding Prepayments) 289,563 304,982 590,961 181,268 144,927
Prepayments:15 1290 Prepaid Rents 0 0 0 0 016 1300 Prepaid Taxes 0 0 0 0 74617 1310 Prepaid Insurance 32,101 50,471 0 0 018 1320 Prepaid Directory Expenses 0 0 0 0 019 1330 Other Prepayments 1,264 1,430 15,935 3,093 2,36720 1280 Total Prepayments 33,364 51,901 15,935 3,093 3,113
21 1350 Other Current Assets 17,106 17,870 65,472 12,202 16,368
22 130 Total Current Assets 371,143 390,817 768,295 226,812 178,346
Noncurrent Assets:23 1401 Investments in Affiliated Companies 2,087 4,484 28,476 9,464 1,36924 1402 Investments in Nonaffiliated Companies 1,013 1 1,181 232 23025 1406 Nonregulated Investments 0 0 0 0 026 1407 Unamortized Debt Issuance Expense 11,741 2,632 2,443 585 35527 1408 Sinking Funds 0 0 0 0 028 1410 Other Noncurrent Assets 349,750 394,340 106,030 10,643 19,85729 1437 Deferred Tax Regulatory Assets 9,135 8,990 52,635 3,074 10,65130 1438 Deferred Maintenance and Retirements 0 0 0 0 031 1439 Deferred Charges 78,982 93,743 156,464 33,848 45,33132 1500 Other Jurisdictional Assets - Net (1,910) 293 (579,169) (124,376) (51,877)33 150 Total Noncurrent Assets 450,798 504,483 (231,940) (66,530) 25,916
Plant:34 2001 Telecommunications Plant in Service (TPIS) 4,859,355 4,459,991 7,359,090 2,017,820 2,073,56135 2002 Property Held for Future Telecom Use (PHFTU) 0 0 0 0 036 2003 Telecommunications Plant Under Construction 34,078 20,869 114,955 45,653 32,82037 2005 Telecommunications Plant Adjustment 26,227 (58,417) 0 0 038 2006 Nonoperating Plant 5,288 805 4,113 5,205 2,77539 2007 Goodwill 0 0 0 0 040 210 Total Plant 4,924,947 4,423,248 7,478,158 2,068,678 2,109,156
TPIS - General Support:41 2111 Land 18,940 12,799 22,026 12,945 6,73342 2112 Motor Vehicles 33,409 26,781 79,172 11,407 22,64743 2113 Aircraft 0 23,587 0 0 044 2114 Tools and Other Work Equipment 41,428 28,440 59,375 13,857 19,85645 2121 Buildings 253,189 310,796 436,929 228,100 157,01946 2122 Furniture 17,096 8,823 1,350 438 74047 2123 Office Equipment 43,642 66,737 6,834 1,192 92648 2124 General Purpose Computers 59,418 91,131 172,702 414,939 36,42749 2110 Total Land and Support Assets 467,121 569,095 778,388 682,878 244,348
90

Statistics of Communications Common Carriers
Table 2.10 - Statistics of Reporting Large Incumbent Local Exchange Carriersas of December 31, 2000 and for the Year Then Ended -- Continued
(Dollar Amounts Shown in Thousands)26 VZ 27 VZ 28 VZ 29 VZ 30 VZ
Verizon GTE Verizon Verizon VerizonLine Acct Items South, Inc. Southwest, Inc. Virginia, Inc. Washington, DC, West Virginia,No. No. dba Inc. Inc.
VerizonSouthwest
TPIS - Central Office Switching:50 2211 Analog Electronic Switching 1 0 37,928 27,392 151 2212 Digital Electronic Switching 1,052,856 948,350 1,425,432 352,383 399,81552 2215.1 Step-by-Step Switching 0 0 0 0 053 2215.2 Crossbar Switching 0 0 0 0 054 2215.3 Other Electro-Mechanical Switching 0 0 0 0 055 2215 Electro-Mechanical Switching 0 0 0 0 056 2210 Total Central Office Switching 1,052,857 948,350 1,463,360 379,775 399,816
57 2220 Operator Systems 7,517 2,898 16,917 15,543 7,077
TPIS - Central Office Transmission:58 2231.1 Satellite and Earth Station Facilities 0 0 0 0 059 2231.2 Other Radio Facilities 2,241 11,335 3,576 606 6,26860 2231 Radio Systems 2,241 11,335 3,576 606 6,26861 2232 Circuit Equipment 797,639 761,856 2,033,696 512,735 461,19762 2230 Total Central Office Transmission 799,880 773,191 2,037,272 513,341 467,465
TPIS - Information Origination/Termination:63 2311 Station Apparatus 879 313 0 0 064 2321 Customer Premises Wiring 0 0 0 0 065 2341 Large Private Branch Exchanges 195 0 0 0 066 2351 Public Telephone Terminal Equipment 1,577 3,449 23,199 5,010 7,18167 2362 Other Terminal Equipment 39,022 69,701 114,063 37,254 19,84868 2310 Total Information Origination/Termination 41,673 73,463 137,262 42,264 27,029
TPIS - Cable and Wire Facilities:69 2411 Poles 166,925 62,379 85,048 4,517 121,15070 2421 Aerial Cable 847,239 404,251 530,973 53,904 487,46571 2422 Underground Cable 149,895 316,079 439,514 156,334 59,03472 2423 Buried Cable 1,190,499 1,051,958 1,308,448 6,223 162,44173 2424 Submarine Cable 27 765 696 669 35974 2425 Deep Sea Cable 0 0 0 0 075 2426 Intrabuilding Network Cable 3,605 3,871 27,987 57,717 10,90376 2431 Aerial Wire 5,244 1,168 0 0 077 2441 Conduit Systems 69,931 179,282 365,941 67,214 48,51878 2410 Total Cable and Wire Facilities 2,433,365 2,019,752 2,758,607 346,578 889,870
79 240 Total TPIS (Before Amortizable Assets) 4,802,413 4,386,749 7,191,806 1,980,379 2,035,605
TPIS - Amortizable Assets:80 2681 Capital Leases 434 3,711 23,718 0 76681 2682 Leasehold Improvements 7,539 12,720 9,713 1,210 4,26682 2680 Total Amortizable Tangible Assets 7,973 16,431 33,431 1,210 5,032
83 2690 Intangibles 48,969 56,811 133,853 36,231 32,924
84 260 Total Telecommunications Plant in Service 4,859,355 4,459,991 7,359,090 2,017,820 2,073,561
Depreciation And Amortization:85 3100 Accumulated Depreciation - TPIS 2,512,362 2,333,169 3,649,421 911,446 1,211,37086 3200 Accumulated Depreciation - PHFTU 0 0 0 0 087 3300 Accumulated Depreciation - Nonoperating 1,983 376 401 1 9288 3410 Accumulated Amortization - Capitalized Leases 101 866 10,955 0 27789 3420 Accumulated Amortization - Leasehold Improve. 4,720 6,940 3,719 874 2,54990 3400 Total Accumulated Amortization - Tangibles 4,821 7,806 14,674 874 2,826
91 3500 Accumulated Amortization - Intangibles 17,048 21,174 31,866 7,540 7,79292 3600 Accumulated Amortization - Other 4,149 7,394 0 0 093 340 Total Depreciation and Amortization 2,540,363 2,369,919 3,696,362 919,861 1,222,080
94 350 Net Plant 2,384,584 2,053,329 3,781,796 1,148,817 887,076
95 360 Total Assets 3,206,525 2,948,629 4,318,151 1,309,099 1,091,338
91
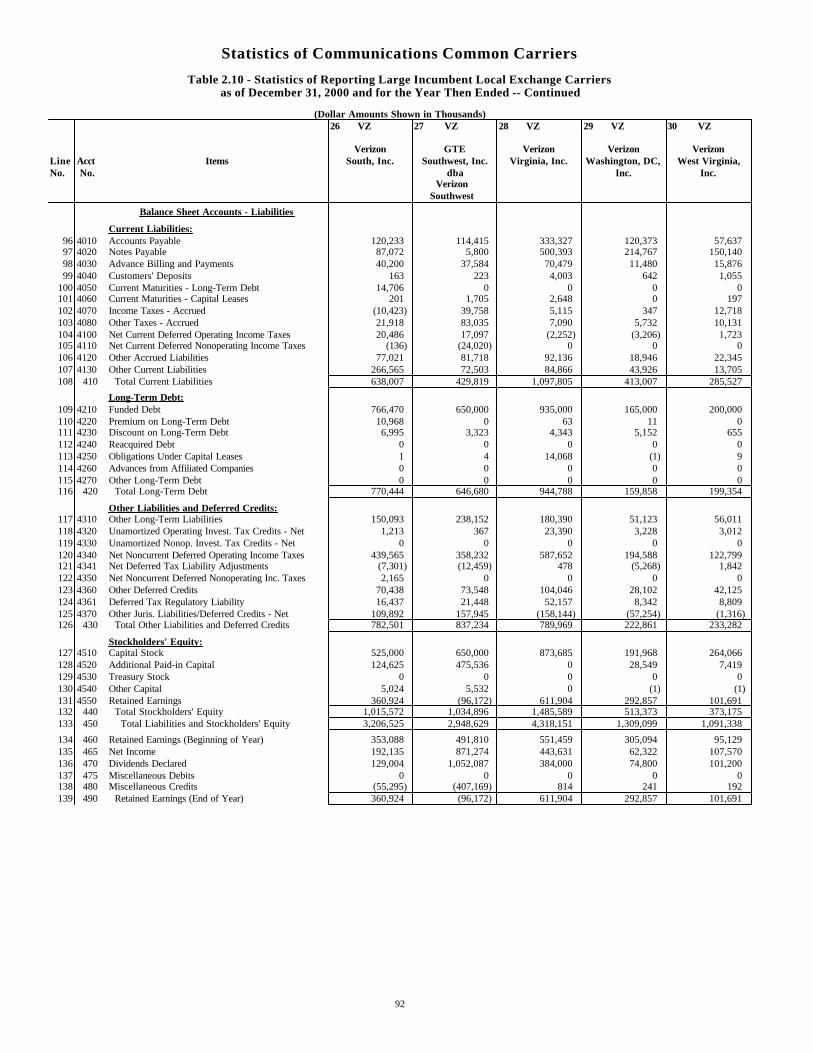
Statistics of Communications Common Carriers
Table 2.10 - Statistics of Reporting Large Incumbent Local Exchange Carriersas of December 31, 2000 and for the Year Then Ended -- Continued
(Dollar Amounts Shown in Thousands)26 VZ 27 VZ 28 VZ 29 VZ 30 VZ
Verizon GTE Verizon Verizon VerizonLine Acct Items South, Inc. Southwest, Inc. Virginia, Inc. Washington, DC, West Virginia,No. No. dba Inc. Inc.
VerizonSouthwest
Balance Sheet Accounts - Liabilities
Current Liabilities:96 4010 Accounts Payable 120,233 114,415 333,327 120,373 57,63797 4020 Notes Payable 87,072 5,800 500,393 214,767 150,14098 4030 Advance Billing and Payments 40,200 37,584 70,479 11,480 15,87699 4040 Customers' Deposits 163 223 4,003 642 1,055
100 4050 Current Maturities - Long-Term Debt 14,706 0 0 0 0101 4060 Current Maturities - Capital Leases 201 1,705 2,648 0 197102 4070 Income Taxes - Accrued (10,423) 39,758 5,115 347 12,718103 4080 Other Taxes - Accrued 21,918 83,035 7,090 5,732 10,131104 4100 Net Current Deferred Operating Income Taxes 20,486 17,097 (2,252) (3,206) 1,723105 4110 Net Current Deferred Nonoperating Income Taxes (136) (24,020) 0 0 0106 4120 Other Accrued Liabilities 77,021 81,718 92,136 18,946 22,345107 4130 Other Current Liabilities 266,565 72,503 84,866 43,926 13,705108 410 Total Current Liabilities 638,007 429,819 1,097,805 413,007 285,527
Long-Term Debt:109 4210 Funded Debt 766,470 650,000 935,000 165,000 200,000110 4220 Premium on Long-Term Debt 10,968 0 63 11 0111 4230 Discount on Long-Term Debt 6,995 3,323 4,343 5,152 655112 4240 Reacquired Debt 0 0 0 0 0113 4250 Obligations Under Capital Leases 1 4 14,068 (1) 9114 4260 Advances from Affiliated Companies 0 0 0 0 0115 4270 Other Long-Term Debt 0 0 0 0 0116 420 Total Long-Term Debt 770,444 646,680 944,788 159,858 199,354
Other Liabilities and Deferred Credits:117 4310 Other Long-Term Liabilities 150,093 238,152 180,390 51,123 56,011118 4320 Unamortized Operating Invest. Tax Credits - Net 1,213 367 23,390 3,228 3,012119 4330 Unamortized Nonop. Invest. Tax Credits - Net 0 0 0 0 0120 4340 Net Noncurrent Deferred Operating Income Taxes 439,565 358,232 587,652 194,588 122,799121 4341 Net Deferred Tax Liability Adjustments (7,301) (12,459) 478 (5,268) 1,842122 4350 Net Noncurrent Deferred Nonoperating Inc. Taxes 2,165 0 0 0 0123 4360 Other Deferred Credits 70,438 73,548 104,046 28,102 42,125124 4361 Deferred Tax Regulatory Liability 16,437 21,448 52,157 8,342 8,809125 4370 Other Juris. Liabilities/Deferred Credits - Net 109,892 157,945 (158,144) (57,254) (1,316)126 430 Total Other Liabilities and Deferred Credits 782,501 837,234 789,969 222,861 233,282
Stockholders' Equity:127 4510 Capital Stock 525,000 650,000 873,685 191,968 264,066128 4520 Additional Paid-in Capital 124,625 475,536 0 28,549 7,419129 4530 Treasury Stock 0 0 0 0 0130 4540 Other Capital 5,024 5,532 0 (1) (1)131 4550 Retained Earnings 360,924 (96,172) 611,904 292,857 101,691132 440 Total Stockholders' Equity 1,015,572 1,034,896 1,485,589 513,373 373,175133 450 Total Liabilities and Stockholders' Equity 3,206,525 2,948,629 4,318,151 1,309,099 1,091,338
134 460 Retained Earnings (Beginning of Year) 353,088 491,810 551,459 305,094 95,129135 465 Net Income 192,135 871,274 443,631 62,322 107,570136 470 Dividends Declared 129,004 1,052,087 384,000 74,800 101,200137 475 Miscellaneous Debits 0 0 0 0 0138 480 Miscellaneous Credits (55,295) (407,169) 814 241 192139 490 Retained Earnings (End of Year) 360,924 (96,172) 611,904 292,857 101,691
92
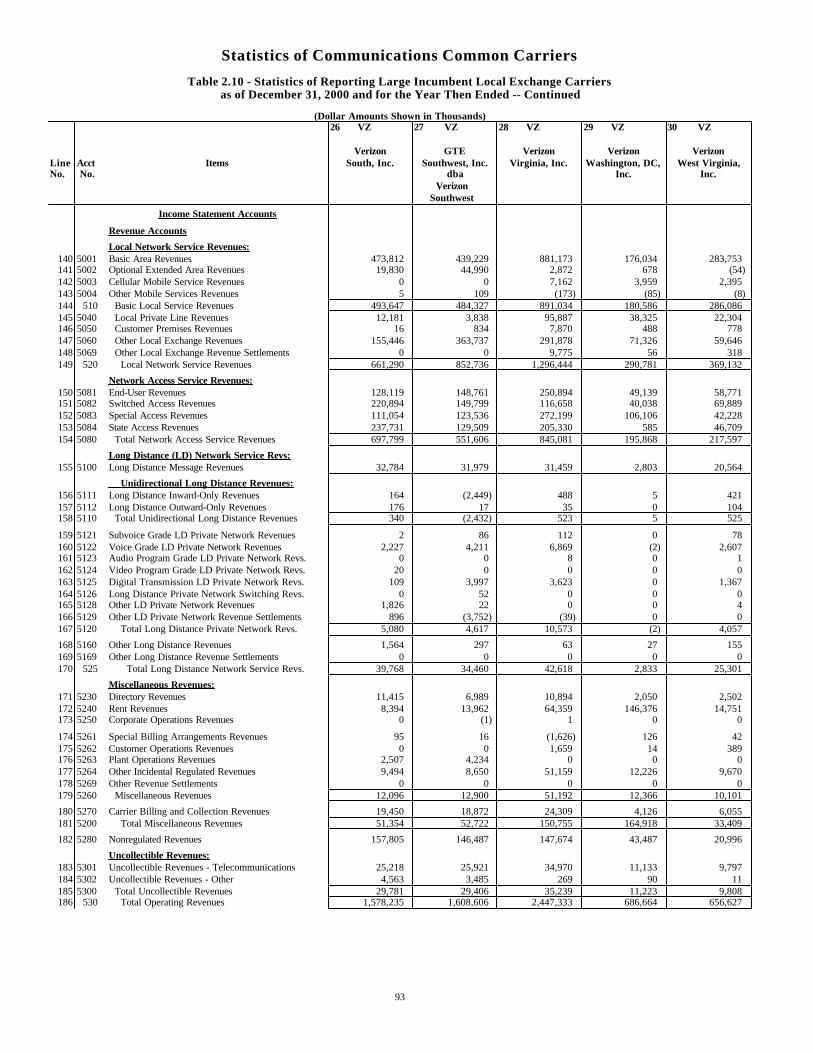
Statistics of Communications Common Carriers
Table 2.10 - Statistics of Reporting Large Incumbent Local Exchange Carriersas of December 31, 2000 and for the Year Then Ended -- Continued
(Dollar Amounts Shown in Thousands)26 VZ 27 VZ 28 VZ 29 VZ 30 VZ
Verizon GTE Verizon Verizon VerizonLine Acct Items South, Inc. Southwest, Inc. Virginia, Inc. Washington, DC, West Virginia,No. No. dba Inc. Inc.
VerizonSouthwest
Income Statement Accounts
Revenue Accounts
Local Network Service Revenues:140 5001 Basic Area Revenues 473,812 439,229 881,173 176,034 283,753141 5002 Optional Extended Area Revenues 19,830 44,990 2,872 678 (54)142 5003 Cellular Mobile Service Revenues 0 0 7,162 3,959 2,395143 5004 Other Mobile Services Revenues 5 109 (173) (85) (8)144 510 Basic Local Service Revenues 493,647 484,327 891,034 180,586 286,086145 5040 Local Private Line Revenues 12,181 3,838 95,887 38,325 22,304146 5050 Customer Premises Revenues 16 834 7,870 488 778147 5060 Other Local Exchange Revenues 155,446 363,737 291,878 71,326 59,646148 5069 Other Local Exchange Revenue Settlements 0 0 9,775 56 318149 520 Local Network Service Revenues 661,290 852,736 1,296,444 290,781 369,132
Network Access Service Revenues:150 5081 End-User Revenues 128,119 148,761 250,894 49,139 58,771151 5082 Switched Access Revenues 220,894 149,799 116,658 40,038 69,889152 5083 Special Access Revenues 111,054 123,536 272,199 106,106 42,228153 5084 State Access Revenues 237,731 129,509 205,330 585 46,709154 5080 Total Network Access Service Revenues 697,799 551,606 845,081 195,868 217,597
Long Distance (LD) Network Service Revs:155 5100 Long Distance Message Revenues 32,784 31,979 31,459 2,803 20,564
Unidirectional Long Distance Revenues:156 5111 Long Distance Inward-Only Revenues 164 (2,449) 488 5 421157 5112 Long Distance Outward-Only Revenues 176 17 35 0 104158 5110 Total Unidirectional Long Distance Revenues 340 (2,432) 523 5 525
159 5121 Subvoice Grade LD Private Network Revenues 2 86 112 0 78160 5122 Voice Grade LD Private Network Revenues 2,227 4,211 6,869 (2) 2,607161 5123 Audio Program Grade LD Private Network Revs. 0 0 8 0 1162 5124 Video Program Grade LD Private Network Revs. 20 0 0 0 0163 5125 Digital Transmission LD Private Network Revs. 109 3,997 3,623 0 1,367164 5126 Long Distance Private Network Switching Revs. 0 52 0 0 0165 5128 Other LD Private Network Revenues 1,826 22 0 0 4166 5129 Other LD Private Network Revenue Settlements 896 (3,752) (39) 0 0167 5120 Total Long Distance Private Network Revs. 5,080 4,617 10,573 (2) 4,057
168 5160 Other Long Distance Revenues 1,564 297 63 27 155169 5169 Other Long Distance Revenue Settlements 0 0 0 0 0170 525 Total Long Distance Network Service Revs. 39,768 34,460 42,618 2,833 25,301
Miscellaneous Revenues:171 5230 Directory Revenues 11,415 6,989 10,894 2,050 2,502172 5240 Rent Revenues 8,394 13,962 64,359 146,376 14,751173 5250 Corporate Operations Revenues 0 (1) 1 0 0
174 5261 Special Billing Arrangements Revenues 95 16 (1,626) 126 42175 5262 Customer Operations Revenues 0 0 1,659 14 389176 5263 Plant Operations Revenues 2,507 4,234 0 0 0177 5264 Other Incidental Regulated Revenues 9,494 8,650 51,159 12,226 9,670178 5269 Other Revenue Settlements 0 0 0 0 0179 5260 Miscellaneous Revenues 12,096 12,900 51,192 12,366 10,101
180 5270 Carrier Billing and Collection Revenues 19,450 18,872 24,309 4,126 6,055181 5200 Total Miscellaneous Revenues 51,354 52,722 150,755 164,918 33,409
182 5280 Nonregulated Revenues 157,805 146,487 147,674 43,487 20,996
Uncollectible Revenues:183 5301 Uncollectible Revenues - Telecommunications 25,218 25,921 34,970 11,133 9,797184 5302 Uncollectible Revenues - Other 4,563 3,485 269 90 11185 5300 Total Uncollectible Revenues 29,781 29,406 35,239 11,223 9,808186 530 Total Operating Revenues 1,578,235 1,608,606 2,447,333 686,664 656,627
93
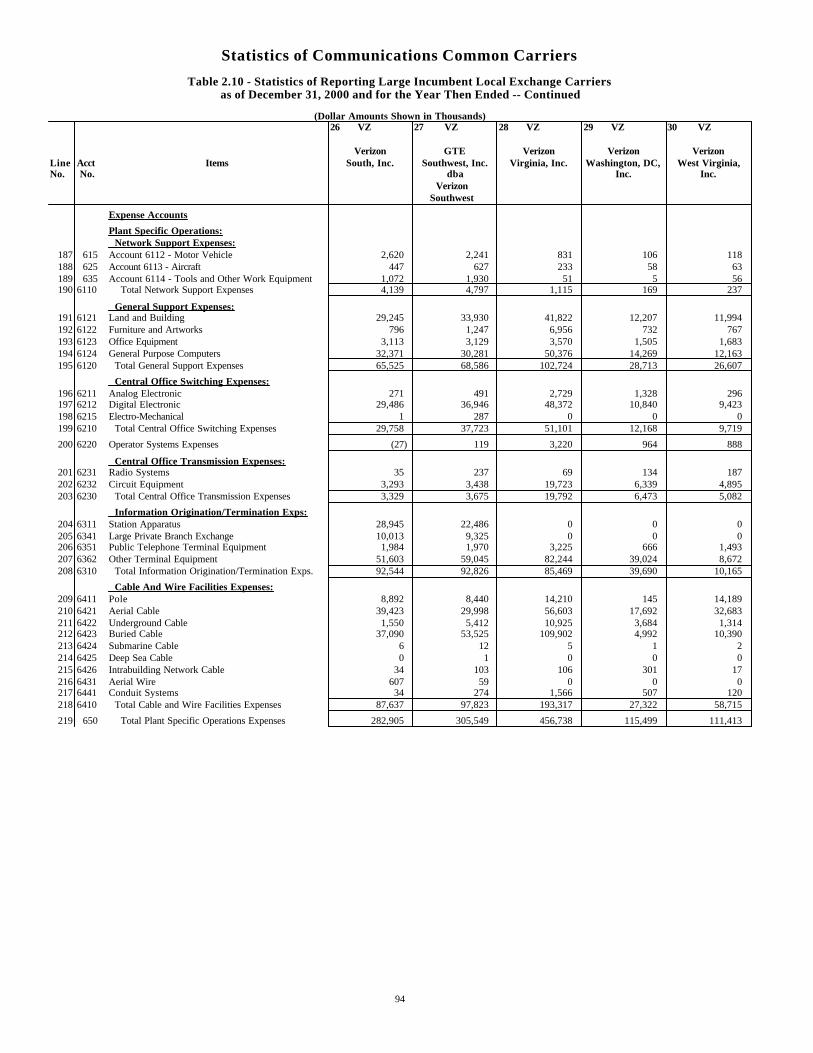
Statistics of Communications Common Carriers
Table 2.10 - Statistics of Reporting Large Incumbent Local Exchange Carriersas of December 31, 2000 and for the Year Then Ended -- Continued
(Dollar Amounts Shown in Thousands)26 VZ 27 VZ 28 VZ 29 VZ 30 VZ
Verizon GTE Verizon Verizon VerizonLine Acct Items South, Inc. Southwest, Inc. Virginia, Inc. Washington, DC, West Virginia,No. No. dba Inc. Inc.
VerizonSouthwest
Expense Accounts
Plant Specific Operations: Network Support Expenses:
187 615 Account 6112 - Motor Vehicle 2,620 2,241 831 106 118188 625 Account 6113 - Aircraft 447 627 233 58 63189 635 Account 6114 - Tools and Other Work Equipment 1,072 1,930 51 5 56190 6110 Total Network Support Expenses 4,139 4,797 1,115 169 237
General Support Expenses:191 6121 Land and Building 29,245 33,930 41,822 12,207 11,994192 6122 Furniture and Artworks 796 1,247 6,956 732 767193 6123 Office Equipment 3,113 3,129 3,570 1,505 1,683194 6124 General Purpose Computers 32,371 30,281 50,376 14,269 12,163195 6120 Total General Support Expenses 65,525 68,586 102,724 28,713 26,607
Central Office Switching Expenses:196 6211 Analog Electronic 271 491 2,729 1,328 296197 6212 Digital Electronic 29,486 36,946 48,372 10,840 9,423198 6215 Electro-Mechanical 1 287 0 0 0199 6210 Total Central Office Switching Expenses 29,758 37,723 51,101 12,168 9,719
200 6220 Operator Systems Expenses (27) 119 3,220 964 888
Central Office Transmission Expenses:201 6231 Radio Systems 35 237 69 134 187202 6232 Circuit Equipment 3,293 3,438 19,723 6,339 4,895203 6230 Total Central Office Transmission Expenses 3,329 3,675 19,792 6,473 5,082
Information Origination/Termination Exps:204 6311 Station Apparatus 28,945 22,486 0 0 0205 6341 Large Private Branch Exchange 10,013 9,325 0 0 0206 6351 Public Telephone Terminal Equipment 1,984 1,970 3,225 666 1,493207 6362 Other Terminal Equipment 51,603 59,045 82,244 39,024 8,672208 6310 Total Information Origination/Termination Exps. 92,544 92,826 85,469 39,690 10,165
Cable And Wire Facilities Expenses:209 6411 Pole 8,892 8,440 14,210 145 14,189210 6421 Aerial Cable 39,423 29,998 56,603 17,692 32,683211 6422 Underground Cable 1,550 5,412 10,925 3,684 1,314212 6423 Buried Cable 37,090 53,525 109,902 4,992 10,390213 6424 Submarine Cable 6 12 5 1 2214 6425 Deep Sea Cable 0 1 0 0 0215 6426 Intrabuilding Network Cable 34 103 106 301 17216 6431 Aerial Wire 607 59 0 0 0217 6441 Conduit Systems 34 274 1,566 507 120218 6410 Total Cable and Wire Facilities Expenses 87,637 97,823 193,317 27,322 58,715
219 650 Total Plant Specific Operations Expenses 282,905 305,549 456,738 115,499 111,413
94
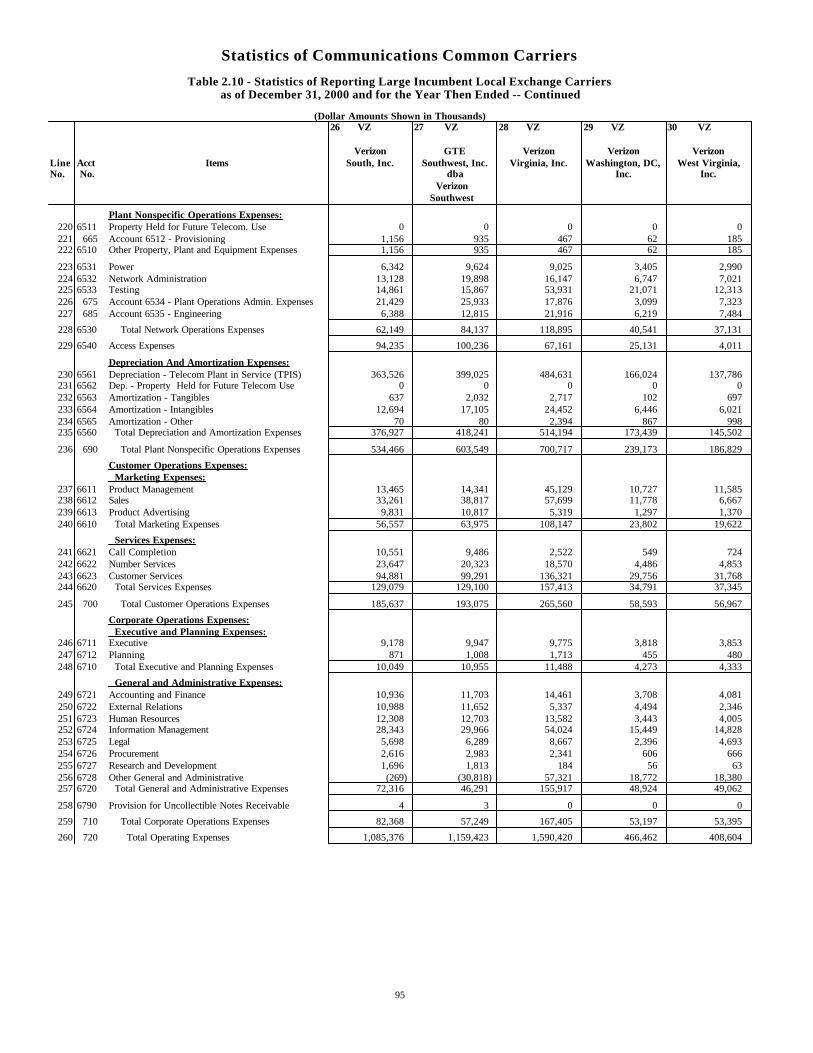
Statistics of Communications Common Carriers
Table 2.10 - Statistics of Reporting Large Incumbent Local Exchange Carriersas of December 31, 2000 and for the Year Then Ended -- Continued
(Dollar Amounts Shown in Thousands)26 VZ 27 VZ 28 VZ 29 VZ 30 VZ
Verizon GTE Verizon Verizon VerizonLine Acct Items South, Inc. Southwest, Inc. Virginia, Inc. Washington, DC, West Virginia,No. No. dba Inc. Inc.
VerizonSouthwest
Plant Nonspecific Operations Expenses:220 6511 Property Held for Future Telecom. Use 0 0 0 0 0221 665 Account 6512 - Provisioning 1,156 935 467 62 185222 6510 Other Property, Plant and Equipment Expenses 1,156 935 467 62 185
223 6531 Power 6,342 9,624 9,025 3,405 2,990224 6532 Network Administration 13,128 19,898 16,147 6,747 7,021225 6533 Testing 14,861 15,867 53,931 21,071 12,313226 675 Account 6534 - Plant Operations Admin. Expenses 21,429 25,933 17,876 3,099 7,323227 685 Account 6535 - Engineering 6,388 12,815 21,916 6,219 7,484
228 6530 Total Network Operations Expenses 62,149 84,137 118,895 40,541 37,131
229 6540 Access Expenses 94,235 100,236 67,161 25,131 4,011
Depreciation And Amortization Expenses:230 6561 Depreciation - Telecom Plant in Service (TPIS) 363,526 399,025 484,631 166,024 137,786231 6562 Dep. - Property Held for Future Telecom Use 0 0 0 0 0232 6563 Amortization - Tangibles 637 2,032 2,717 102 697233 6564 Amortization - Intangibles 12,694 17,105 24,452 6,446 6,021234 6565 Amortization - Other 70 80 2,394 867 998235 6560 Total Depreciation and Amortization Expenses 376,927 418,241 514,194 173,439 145,502
236 690 Total Plant Nonspecific Operations Expenses 534,466 603,549 700,717 239,173 186,829
Customer Operations Expenses: Marketing Expenses:
237 6611 Product Management 13,465 14,341 45,129 10,727 11,585238 6612 Sales 33,261 38,817 57,699 11,778 6,667239 6613 Product Advertising 9,831 10,817 5,319 1,297 1,370240 6610 Total Marketing Expenses 56,557 63,975 108,147 23,802 19,622
Services Expenses:241 6621 Call Completion 10,551 9,486 2,522 549 724242 6622 Number Services 23,647 20,323 18,570 4,486 4,853243 6623 Customer Services 94,881 99,291 136,321 29,756 31,768244 6620 Total Services Expenses 129,079 129,100 157,413 34,791 37,345
245 700 Total Customer Operations Expenses 185,637 193,075 265,560 58,593 56,967
Corporate Operations Expenses: Executive and Planning Expenses:
246 6711 Executive 9,178 9,947 9,775 3,818 3,853247 6712 Planning 871 1,008 1,713 455 480248 6710 Total Executive and Planning Expenses 10,049 10,955 11,488 4,273 4,333
General and Administrative Expenses:249 6721 Accounting and Finance 10,936 11,703 14,461 3,708 4,081250 6722 External Relations 10,988 11,652 5,337 4,494 2,346251 6723 Human Resources 12,308 12,703 13,582 3,443 4,005252 6724 Information Management 28,343 29,966 54,024 15,449 14,828253 6725 Legal 5,698 6,289 8,667 2,396 4,693254 6726 Procurement 2,616 2,983 2,341 606 666255 6727 Research and Development 1,696 1,813 184 56 63256 6728 Other General and Administrative (269) (30,818) 57,321 18,772 18,380257 6720 Total General and Administrative Expenses 72,316 46,291 155,917 48,924 49,062
258 6790 Provision for Uncollectible Notes Receivable 4 3 0 0 0
259 710 Total Corporate Operations Expenses 82,368 57,249 167,405 53,197 53,395
260 720 Total Operating Expenses 1,085,376 1,159,423 1,590,420 466,462 408,604
95
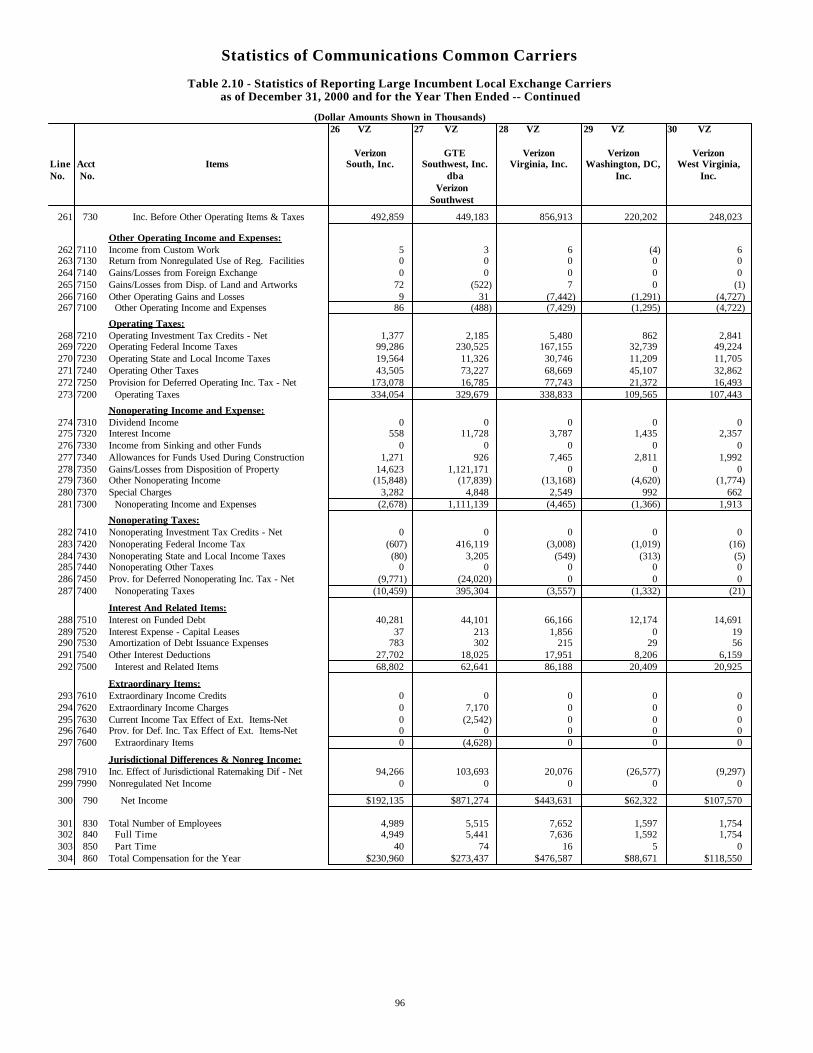
Statistics of Communications Common Carriers
Table 2.10 - Statistics of Reporting Large Incumbent Local Exchange Carriersas of December 31, 2000 and for the Year Then Ended -- Continued
(Dollar Amounts Shown in Thousands)26 VZ 27 VZ 28 VZ 29 VZ 30 VZ
Verizon GTE Verizon Verizon VerizonLine Acct Items South, Inc. Southwest, Inc. Virginia, Inc. Washington, DC, West Virginia,No. No. dba Inc. Inc.
VerizonSouthwest
261 730 Inc. Before Other Operating Items & Taxes 492,859 449,183 856,913 220,202 248,023
Other Operating Income and Expenses:262 7110 Income from Custom Work 5 3 6 (4) 6263 7130 Return from Nonregulated Use of Reg. Facilities 0 0 0 0 0264 7140 Gains/Losses from Foreign Exchange 0 0 0 0 0265 7150 Gains/Losses from Disp. of Land and Artworks 72 (522) 7 0 (1)266 7160 Other Operating Gains and Losses 9 31 (7,442) (1,291) (4,727)267 7100 Other Operating Income and Expenses 86 (488) (7,429) (1,295) (4,722)
Operating Taxes:268 7210 Operating Investment Tax Credits - Net 1,377 2,185 5,480 862 2,841269 7220 Operating Federal Income Taxes 99,286 230,525 167,155 32,739 49,224270 7230 Operating State and Local Income Taxes 19,564 11,326 30,746 11,209 11,705271 7240 Operating Other Taxes 43,505 73,227 68,669 45,107 32,862272 7250 Provision for Deferred Operating Inc. Tax - Net 173,078 16,785 77,743 21,372 16,493273 7200 Operating Taxes 334,054 329,679 338,833 109,565 107,443
Nonoperating Income and Expense:274 7310 Dividend Income 0 0 0 0 0275 7320 Interest Income 558 11,728 3,787 1,435 2,357276 7330 Income from Sinking and other Funds 0 0 0 0 0277 7340 Allowances for Funds Used During Construction 1,271 926 7,465 2,811 1,992278 7350 Gains/Losses from Disposition of Property 14,623 1,121,171 0 0 0279 7360 Other Nonoperating Income (15,848) (17,839) (13,168) (4,620) (1,774)280 7370 Special Charges 3,282 4,848 2,549 992 662281 7300 Nonoperating Income and Expenses (2,678) 1,111,139 (4,465) (1,366) 1,913
Nonoperating Taxes:282 7410 Nonoperating Investment Tax Credits - Net 0 0 0 0 0283 7420 Nonoperating Federal Income Tax (607) 416,119 (3,008) (1,019) (16)284 7430 Nonoperating State and Local Income Taxes (80) 3,205 (549) (313) (5)285 7440 Nonoperating Other Taxes 0 0 0 0 0286 7450 Prov. for Deferred Nonoperating Inc. Tax - Net (9,771) (24,020) 0 0 0287 7400 Nonoperating Taxes (10,459) 395,304 (3,557) (1,332) (21)
Interest And Related Items:288 7510 Interest on Funded Debt 40,281 44,101 66,166 12,174 14,691289 7520 Interest Expense - Capital Leases 37 213 1,856 0 19290 7530 Amortization of Debt Issuance Expenses 783 302 215 29 56291 7540 Other Interest Deductions 27,702 18,025 17,951 8,206 6,159292 7500 Interest and Related Items 68,802 62,641 86,188 20,409 20,925
Extraordinary Items:293 7610 Extraordinary Income Credits 0 0 0 0 0294 7620 Extraordinary Income Charges 0 7,170 0 0 0295 7630 Current Income Tax Effect of Ext. Items-Net 0 (2,542) 0 0 0296 7640 Prov. for Def. Inc. Tax Effect of Ext. Items-Net 0 0 0 0 0297 7600 Extraordinary Items 0 (4,628) 0 0 0
Jurisdictional Differences & Nonreg Income:298 7910 Inc. Effect of Jurisdictional Ratemaking Dif - Net 94,266 103,693 20,076 (26,577) (9,297)299 7990 Nonregulated Net Income 0 0 0 0 0
300 790 Net Income $192,135 $871,274 $443,631 $62,322 $107,570
301 830 Total Number of Employees 4,989 5,515 7,652 1,597 1,754302 840 Full Time 4,949 5,441 7,636 1,592 1,754303 850 Part Time 40 74 16 5 0304 860 Total Compensation for the Year $230,960 $273,437 $476,587 $88,671 $118,550
96
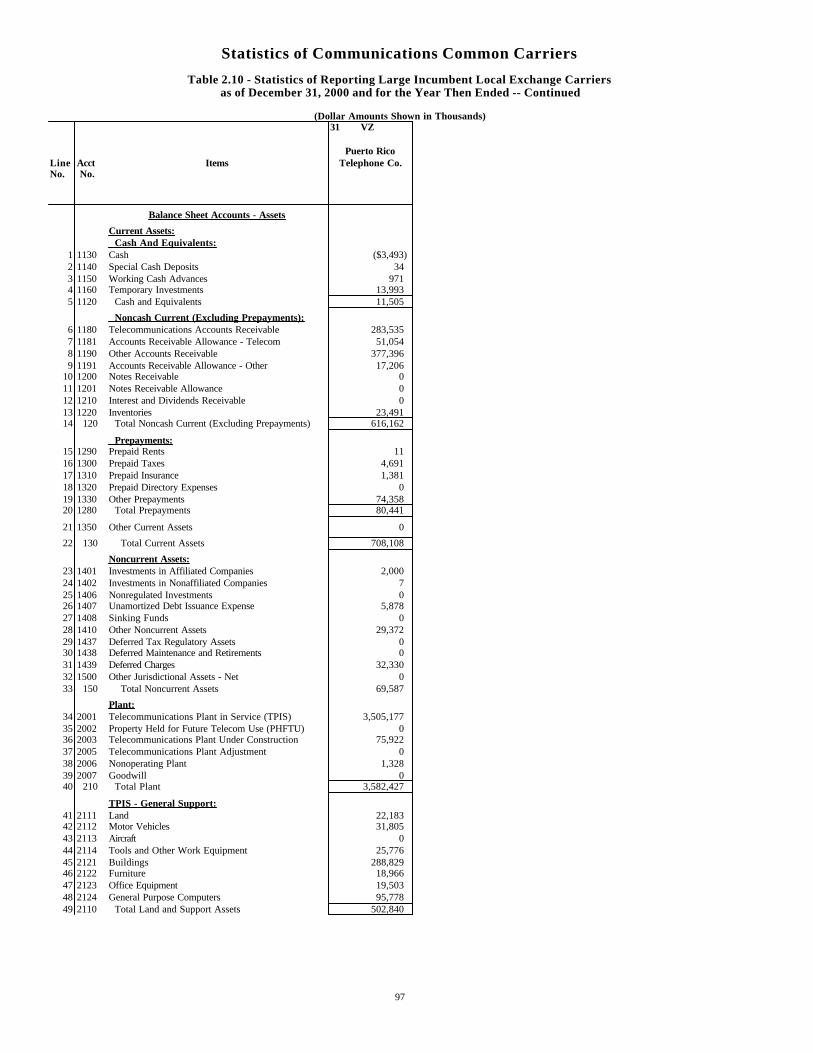
Statistics of Communications Common Carriers
Table 2.10 - Statistics of Reporting Large Incumbent Local Exchange Carriersas of December 31, 2000 and for the Year Then Ended -- Continued
(Dollar Amounts Shown in Thousands)31 VZ
Puerto RicoLine Acct Items Telephone Co.No. No.
Balance Sheet Accounts - Assets
Current Assets: Cash And Equivalents:
1 1130 Cash ($3,493)2 1140 Special Cash Deposits 343 1150 Working Cash Advances 9714 1160 Temporary Investments 13,9935 1120 Cash and Equivalents 11,505
Noncash Current (Excluding Prepayments):6 1180 Telecommunications Accounts Receivable 283,5357 1181 Accounts Receivable Allowance - Telecom 51,0548 1190 Other Accounts Receivable 377,3969 1191 Accounts Receivable Allowance - Other 17,206
10 1200 Notes Receivable 011 1201 Notes Receivable Allowance 012 1210 Interest and Dividends Receivable 013 1220 Inventories 23,49114 120 Total Noncash Current (Excluding Prepayments) 616,162
Prepayments:15 1290 Prepaid Rents 1116 1300 Prepaid Taxes 4,69117 1310 Prepaid Insurance 1,38118 1320 Prepaid Directory Expenses 019 1330 Other Prepayments 74,35820 1280 Total Prepayments 80,441
21 1350 Other Current Assets 0
22 130 Total Current Assets 708,108
Noncurrent Assets:23 1401 Investments in Affiliated Companies 2,00024 1402 Investments in Nonaffiliated Companies 725 1406 Nonregulated Investments 026 1407 Unamortized Debt Issuance Expense 5,87827 1408 Sinking Funds 028 1410 Other Noncurrent Assets 29,37229 1437 Deferred Tax Regulatory Assets 030 1438 Deferred Maintenance and Retirements 031 1439 Deferred Charges 32,33032 1500 Other Jurisdictional Assets - Net 033 150 Total Noncurrent Assets 69,587
Plant:34 2001 Telecommunications Plant in Service (TPIS) 3,505,17735 2002 Property Held for Future Telecom Use (PHFTU) 036 2003 Telecommunications Plant Under Construction 75,92237 2005 Telecommunications Plant Adjustment 038 2006 Nonoperating Plant 1,32839 2007 Goodwill 040 210 Total Plant 3,582,427
TPIS - General Support:41 2111 Land 22,18342 2112 Motor Vehicles 31,80543 2113 Aircraft 044 2114 Tools and Other Work Equipment 25,77645 2121 Buildings 288,82946 2122 Furniture 18,96647 2123 Office Equipment 19,50348 2124 General Purpose Computers 95,77849 2110 Total Land and Support Assets 502,840
97
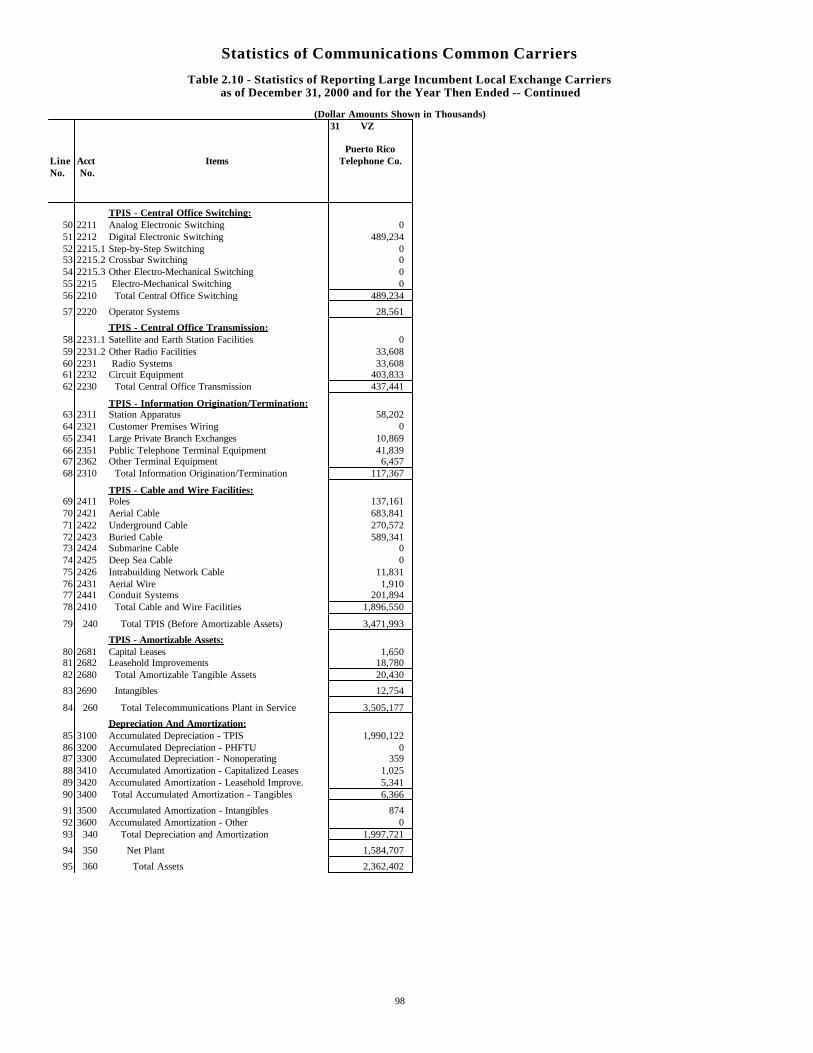
Statistics of Communications Common Carriers
Table 2.10 - Statistics of Reporting Large Incumbent Local Exchange Carriersas of December 31, 2000 and for the Year Then Ended -- Continued
(Dollar Amounts Shown in Thousands)31 VZ
Puerto RicoLine Acct Items Telephone Co.No. No.
TPIS - Central Office Switching:50 2211 Analog Electronic Switching 051 2212 Digital Electronic Switching 489,23452 2215.1 Step-by-Step Switching 053 2215.2 Crossbar Switching 054 2215.3 Other Electro-Mechanical Switching 055 2215 Electro-Mechanical Switching 056 2210 Total Central Office Switching 489,234
57 2220 Operator Systems 28,561
TPIS - Central Office Transmission:58 2231.1 Satellite and Earth Station Facilities 059 2231.2 Other Radio Facilities 33,60860 2231 Radio Systems 33,60861 2232 Circuit Equipment 403,83362 2230 Total Central Office Transmission 437,441
TPIS - Information Origination/Termination:63 2311 Station Apparatus 58,20264 2321 Customer Premises Wiring 065 2341 Large Private Branch Exchanges 10,86966 2351 Public Telephone Terminal Equipment 41,83967 2362 Other Terminal Equipment 6,45768 2310 Total Information Origination/Termination 117,367
TPIS - Cable and Wire Facilities:69 2411 Poles 137,16170 2421 Aerial Cable 683,84171 2422 Underground Cable 270,57272 2423 Buried Cable 589,34173 2424 Submarine Cable 074 2425 Deep Sea Cable 075 2426 Intrabuilding Network Cable 11,83176 2431 Aerial Wire 1,91077 2441 Conduit Systems 201,89478 2410 Total Cable and Wire Facilities 1,896,550
79 240 Total TPIS (Before Amortizable Assets) 3,471,993
TPIS - Amortizable Assets:80 2681 Capital Leases 1,65081 2682 Leasehold Improvements 18,78082 2680 Total Amortizable Tangible Assets 20,430
83 2690 Intangibles 12,754
84 260 Total Telecommunications Plant in Service 3,505,177
Depreciation And Amortization:85 3100 Accumulated Depreciation - TPIS 1,990,12286 3200 Accumulated Depreciation - PHFTU 087 3300 Accumulated Depreciation - Nonoperating 35988 3410 Accumulated Amortization - Capitalized Leases 1,02589 3420 Accumulated Amortization - Leasehold Improve. 5,34190 3400 Total Accumulated Amortization - Tangibles 6,366
91 3500 Accumulated Amortization - Intangibles 87492 3600 Accumulated Amortization - Other 093 340 Total Depreciation and Amortization 1,997,721
94 350 Net Plant 1,584,707
95 360 Total Assets 2,362,402
98
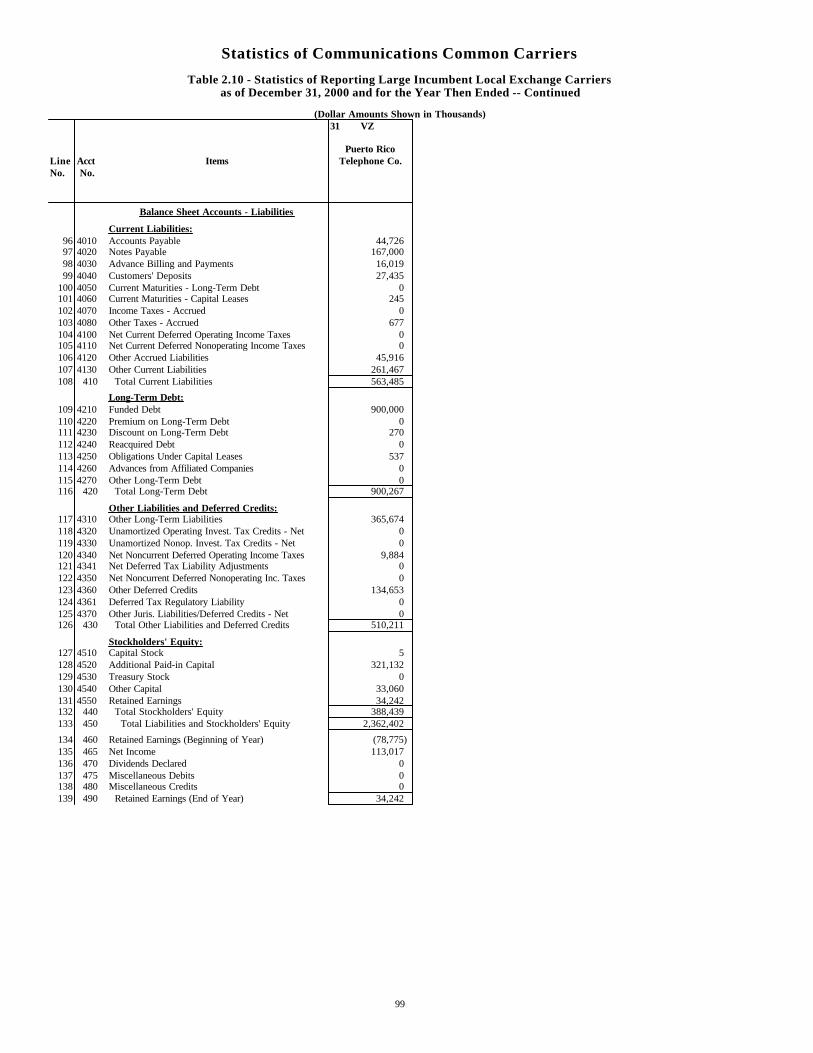
Statistics of Communications Common Carriers
Table 2.10 - Statistics of Reporting Large Incumbent Local Exchange Carriersas of December 31, 2000 and for the Year Then Ended -- Continued
(Dollar Amounts Shown in Thousands)31 VZ
Puerto RicoLine Acct Items Telephone Co.No. No.
Balance Sheet Accounts - Liabilities
Current Liabilities:96 4010 Accounts Payable 44,72697 4020 Notes Payable 167,00098 4030 Advance Billing and Payments 16,01999 4040 Customers' Deposits 27,435
100 4050 Current Maturities - Long-Term Debt 0101 4060 Current Maturities - Capital Leases 245102 4070 Income Taxes - Accrued 0103 4080 Other Taxes - Accrued 677104 4100 Net Current Deferred Operating Income Taxes 0105 4110 Net Current Deferred Nonoperating Income Taxes 0106 4120 Other Accrued Liabilities 45,916107 4130 Other Current Liabilities 261,467108 410 Total Current Liabilities 563,485
Long-Term Debt:109 4210 Funded Debt 900,000110 4220 Premium on Long-Term Debt 0111 4230 Discount on Long-Term Debt 270112 4240 Reacquired Debt 0113 4250 Obligations Under Capital Leases 537114 4260 Advances from Affiliated Companies 0115 4270 Other Long-Term Debt 0116 420 Total Long-Term Debt 900,267
Other Liabilities and Deferred Credits:117 4310 Other Long-Term Liabilities 365,674118 4320 Unamortized Operating Invest. Tax Credits - Net 0119 4330 Unamortized Nonop. Invest. Tax Credits - Net 0120 4340 Net Noncurrent Deferred Operating Income Taxes 9,884121 4341 Net Deferred Tax Liability Adjustments 0122 4350 Net Noncurrent Deferred Nonoperating Inc. Taxes 0123 4360 Other Deferred Credits 134,653124 4361 Deferred Tax Regulatory Liability 0125 4370 Other Juris. Liabilities/Deferred Credits - Net 0126 430 Total Other Liabilities and Deferred Credits 510,211
Stockholders' Equity:127 4510 Capital Stock 5128 4520 Additional Paid-in Capital 321,132129 4530 Treasury Stock 0130 4540 Other Capital 33,060131 4550 Retained Earnings 34,242132 440 Total Stockholders' Equity 388,439133 450 Total Liabilities and Stockholders' Equity 2,362,402
134 460 Retained Earnings (Beginning of Year) (78,775)135 465 Net Income 113,017136 470 Dividends Declared 0137 475 Miscellaneous Debits 0138 480 Miscellaneous Credits 0139 490 Retained Earnings (End of Year) 34,242
99
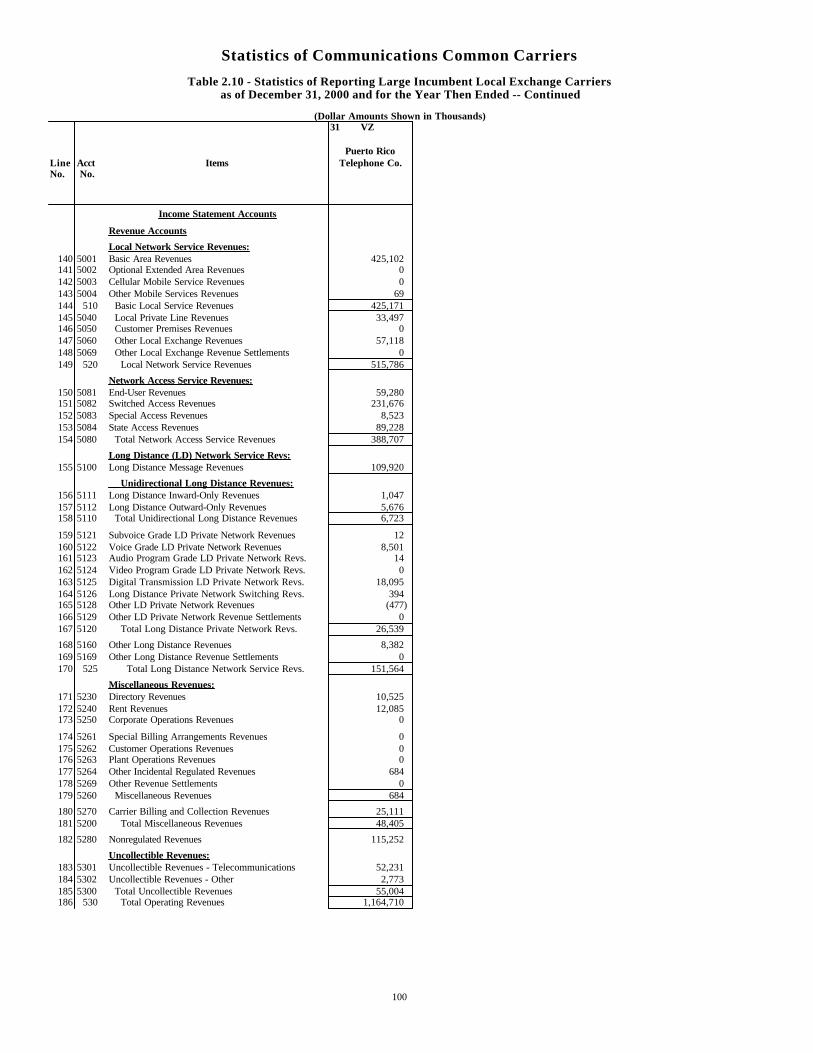
Statistics of Communications Common Carriers
Table 2.10 - Statistics of Reporting Large Incumbent Local Exchange Carriersas of December 31, 2000 and for the Year Then Ended -- Continued
(Dollar Amounts Shown in Thousands)31 VZ
Puerto RicoLine Acct Items Telephone Co.No. No.
Income Statement Accounts
Revenue Accounts
Local Network Service Revenues:140 5001 Basic Area Revenues 425,102141 5002 Optional Extended Area Revenues 0142 5003 Cellular Mobile Service Revenues 0143 5004 Other Mobile Services Revenues 69144 510 Basic Local Service Revenues 425,171145 5040 Local Private Line Revenues 33,497146 5050 Customer Premises Revenues 0147 5060 Other Local Exchange Revenues 57,118148 5069 Other Local Exchange Revenue Settlements 0149 520 Local Network Service Revenues 515,786
Network Access Service Revenues:150 5081 End-User Revenues 59,280151 5082 Switched Access Revenues 231,676152 5083 Special Access Revenues 8,523153 5084 State Access Revenues 89,228154 5080 Total Network Access Service Revenues 388,707
Long Distance (LD) Network Service Revs:155 5100 Long Distance Message Revenues 109,920
Unidirectional Long Distance Revenues:156 5111 Long Distance Inward-Only Revenues 1,047157 5112 Long Distance Outward-Only Revenues 5,676158 5110 Total Unidirectional Long Distance Revenues 6,723
159 5121 Subvoice Grade LD Private Network Revenues 12160 5122 Voice Grade LD Private Network Revenues 8,501161 5123 Audio Program Grade LD Private Network Revs. 14162 5124 Video Program Grade LD Private Network Revs. 0163 5125 Digital Transmission LD Private Network Revs. 18,095164 5126 Long Distance Private Network Switching Revs. 394165 5128 Other LD Private Network Revenues (477)166 5129 Other LD Private Network Revenue Settlements 0167 5120 Total Long Distance Private Network Revs. 26,539
168 5160 Other Long Distance Revenues 8,382169 5169 Other Long Distance Revenue Settlements 0170 525 Total Long Distance Network Service Revs. 151,564
Miscellaneous Revenues:171 5230 Directory Revenues 10,525172 5240 Rent Revenues 12,085173 5250 Corporate Operations Revenues 0
174 5261 Special Billing Arrangements Revenues 0175 5262 Customer Operations Revenues 0176 5263 Plant Operations Revenues 0177 5264 Other Incidental Regulated Revenues 684178 5269 Other Revenue Settlements 0179 5260 Miscellaneous Revenues 684
180 5270 Carrier Billing and Collection Revenues 25,111181 5200 Total Miscellaneous Revenues 48,405
182 5280 Nonregulated Revenues 115,252
Uncollectible Revenues:183 5301 Uncollectible Revenues - Telecommunications 52,231184 5302 Uncollectible Revenues - Other 2,773185 5300 Total Uncollectible Revenues 55,004186 530 Total Operating Revenues 1,164,710
100
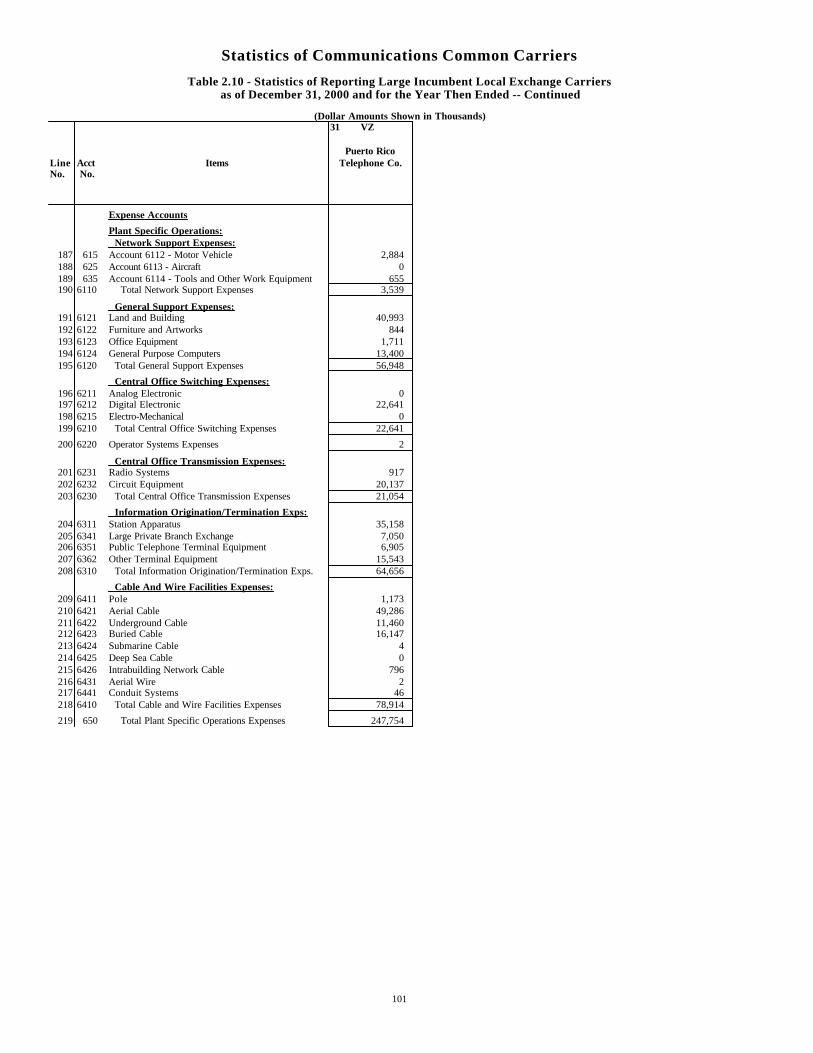
Statistics of Communications Common Carriers
Table 2.10 - Statistics of Reporting Large Incumbent Local Exchange Carriersas of December 31, 2000 and for the Year Then Ended -- Continued
(Dollar Amounts Shown in Thousands)31 VZ
Puerto RicoLine Acct Items Telephone Co.No. No.
Expense Accounts
Plant Specific Operations: Network Support Expenses:
187 615 Account 6112 - Motor Vehicle 2,884188 625 Account 6113 - Aircraft 0189 635 Account 6114 - Tools and Other Work Equipment 655190 6110 Total Network Support Expenses 3,539
General Support Expenses:191 6121 Land and Building 40,993192 6122 Furniture and Artworks 844193 6123 Office Equipment 1,711194 6124 General Purpose Computers 13,400195 6120 Total General Support Expenses 56,948
Central Office Switching Expenses:196 6211 Analog Electronic 0197 6212 Digital Electronic 22,641198 6215 Electro-Mechanical 0199 6210 Total Central Office Switching Expenses 22,641
200 6220 Operator Systems Expenses 2
Central Office Transmission Expenses:201 6231 Radio Systems 917202 6232 Circuit Equipment 20,137203 6230 Total Central Office Transmission Expenses 21,054
Information Origination/Termination Exps:204 6311 Station Apparatus 35,158205 6341 Large Private Branch Exchange 7,050206 6351 Public Telephone Terminal Equipment 6,905207 6362 Other Terminal Equipment 15,543208 6310 Total Information Origination/Termination Exps. 64,656
Cable And Wire Facilities Expenses:209 6411 Pole 1,173210 6421 Aerial Cable 49,286211 6422 Underground Cable 11,460212 6423 Buried Cable 16,147213 6424 Submarine Cable 4214 6425 Deep Sea Cable 0215 6426 Intrabuilding Network Cable 796216 6431 Aerial Wire 2217 6441 Conduit Systems 46218 6410 Total Cable and Wire Facilities Expenses 78,914
219 650 Total Plant Specific Operations Expenses 247,754
101
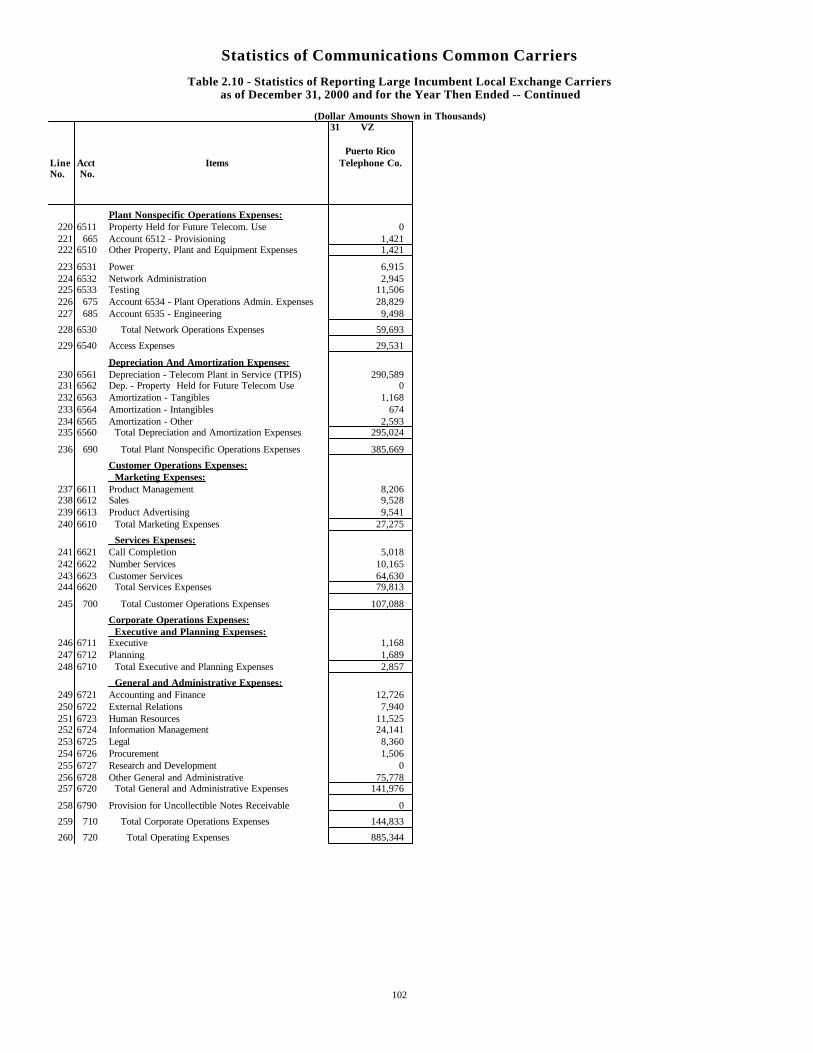
Statistics of Communications Common Carriers
Table 2.10 - Statistics of Reporting Large Incumbent Local Exchange Carriersas of December 31, 2000 and for the Year Then Ended -- Continued
(Dollar Amounts Shown in Thousands)31 VZ
Puerto RicoLine Acct Items Telephone Co.No. No.
Plant Nonspecific Operations Expenses:220 6511 Property Held for Future Telecom. Use 0221 665 Account 6512 - Provisioning 1,421222 6510 Other Property, Plant and Equipment Expenses 1,421
223 6531 Power 6,915224 6532 Network Administration 2,945225 6533 Testing 11,506226 675 Account 6534 - Plant Operations Admin. Expenses 28,829227 685 Account 6535 - Engineering 9,498
228 6530 Total Network Operations Expenses 59,693
229 6540 Access Expenses 29,531
Depreciation And Amortization Expenses:230 6561 Depreciation - Telecom Plant in Service (TPIS) 290,589231 6562 Dep. - Property Held for Future Telecom Use 0232 6563 Amortization - Tangibles 1,168233 6564 Amortization - Intangibles 674234 6565 Amortization - Other 2,593235 6560 Total Depreciation and Amortization Expenses 295,024
236 690 Total Plant Nonspecific Operations Expenses 385,669
Customer Operations Expenses: Marketing Expenses:
237 6611 Product Management 8,206238 6612 Sales 9,528239 6613 Product Advertising 9,541240 6610 Total Marketing Expenses 27,275
Services Expenses:241 6621 Call Completion 5,018242 6622 Number Services 10,165243 6623 Customer Services 64,630244 6620 Total Services Expenses 79,813
245 700 Total Customer Operations Expenses 107,088
Corporate Operations Expenses: Executive and Planning Expenses:
246 6711 Executive 1,168247 6712 Planning 1,689248 6710 Total Executive and Planning Expenses 2,857
General and Administrative Expenses:249 6721 Accounting and Finance 12,726250 6722 External Relations 7,940251 6723 Human Resources 11,525252 6724 Information Management 24,141253 6725 Legal 8,360254 6726 Procurement 1,506255 6727 Research and Development 0256 6728 Other General and Administrative 75,778257 6720 Total General and Administrative Expenses 141,976
258 6790 Provision for Uncollectible Notes Receivable 0
259 710 Total Corporate Operations Expenses 144,833
260 720 Total Operating Expenses 885,344
102
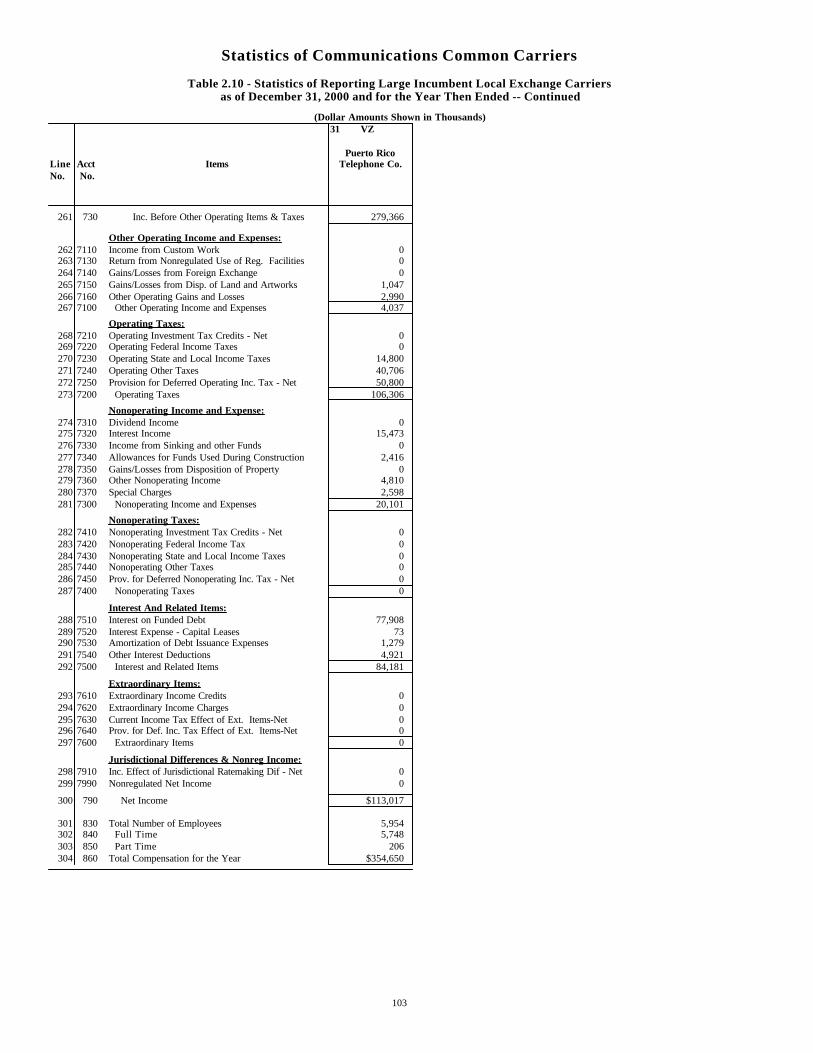
Statistics of Communications Common Carriers
Table 2.10 - Statistics of Reporting Large Incumbent Local Exchange Carriersas of December 31, 2000 and for the Year Then Ended -- Continued
(Dollar Amounts Shown in Thousands)31 VZ
Puerto RicoLine Acct Items Telephone Co.No. No.
261 730 Inc. Before Other Operating Items & Taxes 279,366
Other Operating Income and Expenses:262 7110 Income from Custom Work 0263 7130 Return from Nonregulated Use of Reg. Facilities 0264 7140 Gains/Losses from Foreign Exchange 0265 7150 Gains/Losses from Disp. of Land and Artworks 1,047266 7160 Other Operating Gains and Losses 2,990267 7100 Other Operating Income and Expenses 4,037
Operating Taxes:268 7210 Operating Investment Tax Credits - Net 0269 7220 Operating Federal Income Taxes 0270 7230 Operating State and Local Income Taxes 14,800271 7240 Operating Other Taxes 40,706272 7250 Provision for Deferred Operating Inc. Tax - Net 50,800273 7200 Operating Taxes 106,306
Nonoperating Income and Expense:274 7310 Dividend Income 0275 7320 Interest Income 15,473276 7330 Income from Sinking and other Funds 0277 7340 Allowances for Funds Used During Construction 2,416278 7350 Gains/Losses from Disposition of Property 0279 7360 Other Nonoperating Income 4,810280 7370 Special Charges 2,598281 7300 Nonoperating Income and Expenses 20,101
Nonoperating Taxes:282 7410 Nonoperating Investment Tax Credits - Net 0283 7420 Nonoperating Federal Income Tax 0284 7430 Nonoperating State and Local Income Taxes 0285 7440 Nonoperating Other Taxes 0286 7450 Prov. for Deferred Nonoperating Inc. Tax - Net 0287 7400 Nonoperating Taxes 0
Interest And Related Items:288 7510 Interest on Funded Debt 77,908289 7520 Interest Expense - Capital Leases 73290 7530 Amortization of Debt Issuance Expenses 1,279291 7540 Other Interest Deductions 4,921292 7500 Interest and Related Items 84,181
Extraordinary Items:293 7610 Extraordinary Income Credits 0294 7620 Extraordinary Income Charges 0295 7630 Current Income Tax Effect of Ext. Items-Net 0296 7640 Prov. for Def. Inc. Tax Effect of Ext. Items-Net 0297 7600 Extraordinary Items 0
Jurisdictional Differences & Nonreg Income:298 7910 Inc. Effect of Jurisdictional Ratemaking Dif - Net 0299 7990 Nonregulated Net Income 0
300 790 Net Income $113,017
301 830 Total Number of Employees 5,954302 840 Full Time 5,748303 850 Part Time 206304 860 Total Compensation for the Year $354,650
103
Statistics of Communications Common Carriers
Notes for Table 2.10
Source: Annual ARMIS (Automated Reporting Management Information System) USOA Reports (FCC Report 43-02) of reporting incumbent local exchange carriers.
Note -- Detail may not match totals because of necessary roundings.
-- In the account number column, four-digit numbers are used when there is a corresponding account number in the Uniform System of Accounts (USOA). Three-digit numbers correspond to items defined in the ARMIS USOA report (FCC Report 43-02).
Code letters are shown above the name of each company owned or controlled by a holding company as of December 31, 2000.Name of company Code
BellSouth Corporation BSQwest Corporation QSBC Communications, Inc. SBCVerizon Corporation VZ
NA - Not applicable.
104
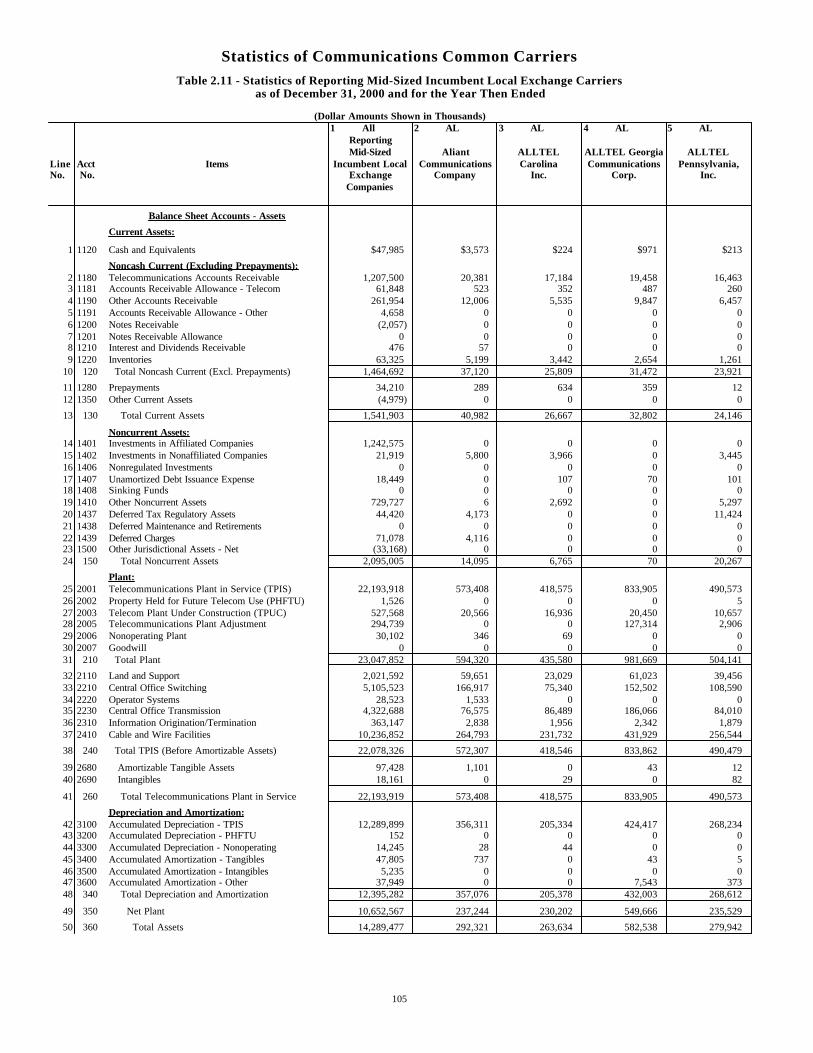
Statistics of Communications Common Carriers
Table 2.11 - Statistics of Reporting Mid-Sized Incumbent Local Exchange Carriersas of December 31, 2000 and for the Year Then Ended
(Dollar Amounts Shown in Thousands)1 All 2 AL 3 AL 4 AL 5 AL
ReportingMid-Sized Aliant ALLTEL ALLTEL Georgia ALLTEL
Line Acct Items Incumbent Local Communications Carolina Communications Pennsylvania,No. No. Exchange Company Inc. Corp. Inc.
Companies
Balance Sheet Accounts - Assets
Current Assets:
1 1120 Cash and Equivalents $47,985 $3,573 $224 $971 $213
Noncash Current (Excluding Prepayments):2 1180 Telecommunications Accounts Receivable 1,207,500 20,381 17,184 19,458 16,4633 1181 Accounts Receivable Allowance - Telecom 61,848 523 352 487 2604 1190 Other Accounts Receivable 261,954 12,006 5,535 9,847 6,4575 1191 Accounts Receivable Allowance - Other 4,658 0 0 0 06 1200 Notes Receivable (2,057) 0 0 0 07 1201 Notes Receivable Allowance 0 0 0 0 08 1210 Interest and Dividends Receivable 476 57 0 0 09 1220 Inventories 63,325 5,199 3,442 2,654 1,261
10 120 Total Noncash Current (Excl. Prepayments) 1,464,692 37,120 25,809 31,472 23,921
11 1280 Prepayments 34,210 289 634 359 1212 1350 Other Current Assets (4,979) 0 0 0 0
13 130 Total Current Assets 1,541,903 40,982 26,667 32,802 24,146
Noncurrent Assets:14 1401 Investments in Affiliated Companies 1,242,575 0 0 0 015 1402 Investments in Nonaffiliated Companies 21,919 5,800 3,966 0 3,44516 1406 Nonregulated Investments 0 0 0 0 017 1407 Unamortized Debt Issuance Expense 18,449 0 107 70 10118 1408 Sinking Funds 0 0 0 0 019 1410 Other Noncurrent Assets 729,727 6 2,692 0 5,29720 1437 Deferred Tax Regulatory Assets 44,420 4,173 0 0 11,42421 1438 Deferred Maintenance and Retirements 0 0 0 0 022 1439 Deferred Charges 71,078 4,116 0 0 023 1500 Other Jurisdictional Assets - Net (33,168) 0 0 0 024 150 Total Noncurrent Assets 2,095,005 14,095 6,765 70 20,267
Plant:25 2001 Telecommunications Plant in Service (TPIS) 22,193,918 573,408 418,575 833,905 490,57326 2002 Property Held for Future Telecom Use (PHFTU) 1,526 0 0 0 527 2003 Telecom Plant Under Construction (TPUC) 527,568 20,566 16,936 20,450 10,65728 2005 Telecommunications Plant Adjustment 294,739 0 0 127,314 2,90629 2006 Nonoperating Plant 30,102 346 69 0 030 2007 Goodwill 0 0 0 0 031 210 Total Plant 23,047,852 594,320 435,580 981,669 504,141
32 2110 Land and Support 2,021,592 59,651 23,029 61,023 39,45633 2210 Central Office Switching 5,105,523 166,917 75,340 152,502 108,59034 2220 Operator Systems 28,523 1,533 0 0 035 2230 Central Office Transmission 4,322,688 76,575 86,489 186,066 84,01036 2310 Information Origination/Termination 363,147 2,838 1,956 2,342 1,87937 2410 Cable and Wire Facilities 10,236,852 264,793 231,732 431,929 256,544
38 240 Total TPIS (Before Amortizable Assets) 22,078,326 572,307 418,546 833,862 490,479
39 2680 Amortizable Tangible Assets 97,428 1,101 0 43 1240 2690 Intangibles 18,161 0 29 0 82
41 260 Total Telecommunications Plant in Service 22,193,919 573,408 418,575 833,905 490,573
Depreciation and Amortization:42 3100 Accumulated Depreciation - TPIS 12,289,899 356,311 205,334 424,417 268,23443 3200 Accumulated Depreciation - PHFTU 152 0 0 0 044 3300 Accumulated Depreciation - Nonoperating 14,245 28 44 0 045 3400 Accumulated Amortization - Tangibles 47,805 737 0 43 546 3500 Accumulated Amortization - Intangibles 5,235 0 0 0 047 3600 Accumulated Amortization - Other 37,949 0 0 7,543 37348 340 Total Depreciation and Amortization 12,395,282 357,076 205,378 432,003 268,612
49 350 Net Plant 10,652,567 237,244 230,202 549,666 235,529
50 360 Total Assets 14,289,477 292,321 263,634 582,538 279,942
105
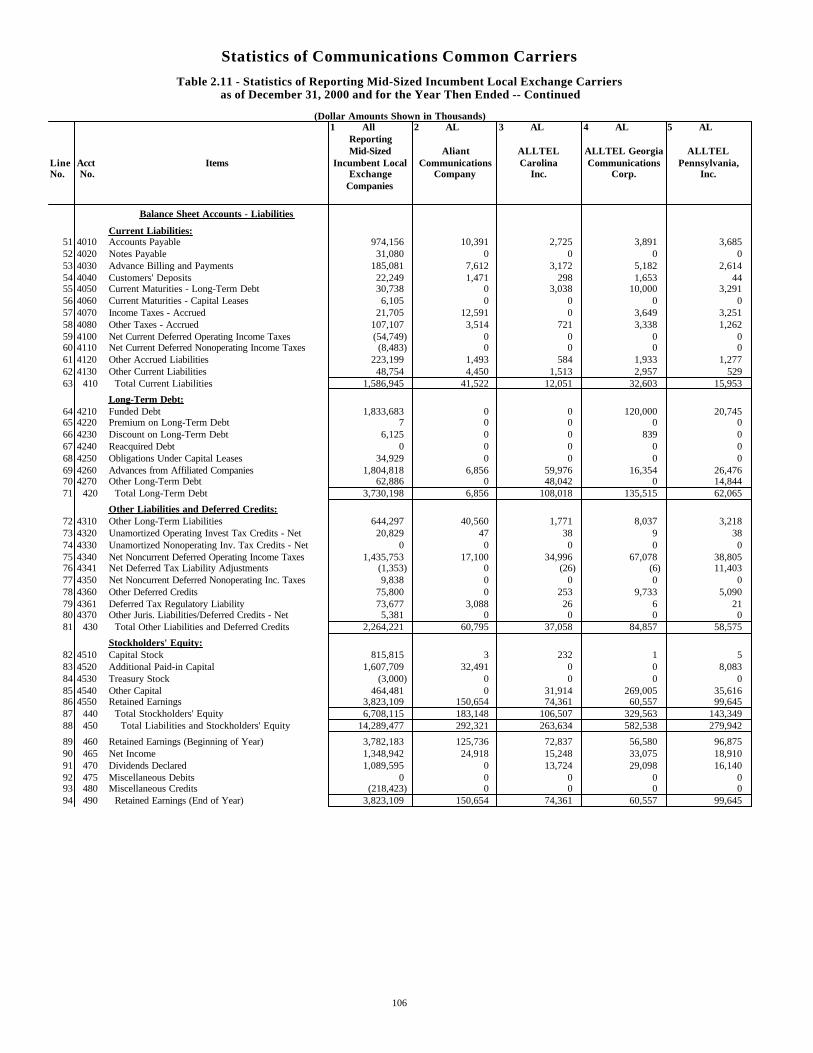
Statistics of Communications Common Carriers
Table 2.11 - Statistics of Reporting Mid-Sized Incumbent Local Exchange Carriersas of December 31, 2000 and for the Year Then Ended -- Continued
(Dollar Amounts Shown in Thousands)1 All 2 AL 3 AL 4 AL 5 AL
ReportingMid-Sized Aliant ALLTEL ALLTEL Georgia ALLTEL
Line Acct Items Incumbent Local Communications Carolina Communications Pennsylvania,No. No. Exchange Company Inc. Corp. Inc.
Companies
Balance Sheet Accounts - Liabilities
Current Liabilities:51 4010 Accounts Payable 974,156 10,391 2,725 3,891 3,68552 4020 Notes Payable 31,080 0 0 0 053 4030 Advance Billing and Payments 185,081 7,612 3,172 5,182 2,61454 4040 Customers' Deposits 22,249 1,471 298 1,653 4455 4050 Current Maturities - Long-Term Debt 30,738 0 3,038 10,000 3,29156 4060 Current Maturities - Capital Leases 6,105 0 0 0 057 4070 Income Taxes - Accrued 21,705 12,591 0 3,649 3,25158 4080 Other Taxes - Accrued 107,107 3,514 721 3,338 1,26259 4100 Net Current Deferred Operating Income Taxes (54,749) 0 0 0 060 4110 Net Current Deferred Nonoperating Income Taxes (8,483) 0 0 0 061 4120 Other Accrued Liabilities 223,199 1,493 584 1,933 1,27762 4130 Other Current Liabilities 48,754 4,450 1,513 2,957 52963 410 Total Current Liabilities 1,586,945 41,522 12,051 32,603 15,953
Long-Term Debt:64 4210 Funded Debt 1,833,683 0 0 120,000 20,74565 4220 Premium on Long-Term Debt 7 0 0 0 066 4230 Discount on Long-Term Debt 6,125 0 0 839 067 4240 Reacquired Debt 0 0 0 0 068 4250 Obligations Under Capital Leases 34,929 0 0 0 069 4260 Advances from Affiliated Companies 1,804,818 6,856 59,976 16,354 26,47670 4270 Other Long-Term Debt 62,886 0 48,042 0 14,84471 420 Total Long-Term Debt 3,730,198 6,856 108,018 135,515 62,065
Other Liabilities and Deferred Credits:72 4310 Other Long-Term Liabilities 644,297 40,560 1,771 8,037 3,21873 4320 Unamortized Operating Invest Tax Credits - Net 20,829 47 38 9 3874 4330 Unamortized Nonoperating Inv. Tax Credits - Net 0 0 0 0 075 4340 Net Noncurrent Deferred Operating Income Taxes 1,435,753 17,100 34,996 67,078 38,80576 4341 Net Deferred Tax Liability Adjustments (1,353) 0 (26) (6) 11,40377 4350 Net Noncurrent Deferred Nonoperating Inc. Taxes 9,838 0 0 0 078 4360 Other Deferred Credits 75,800 0 253 9,733 5,09079 4361 Deferred Tax Regulatory Liability 73,677 3,088 26 6 2180 4370 Other Juris. Liabilities/Deferred Credits - Net 5,381 0 0 0 081 430 Total Other Liabilities and Deferred Credits 2,264,221 60,795 37,058 84,857 58,575
Stockholders' Equity:82 4510 Capital Stock 815,815 3 232 1 583 4520 Additional Paid-in Capital 1,607,709 32,491 0 0 8,08384 4530 Treasury Stock (3,000) 0 0 0 085 4540 Other Capital 464,481 0 31,914 269,005 35,61686 4550 Retained Earnings 3,823,109 150,654 74,361 60,557 99,64587 440 Total Stockholders' Equity 6,708,115 183,148 106,507 329,563 143,34988 450 Total Liabilities and Stockholders' Equity 14,289,477 292,321 263,634 582,538 279,942
89 460 Retained Earnings (Beginning of Year) 3,782,183 125,736 72,837 56,580 96,87590 465 Net Income 1,348,942 24,918 15,248 33,075 18,91091 470 Dividends Declared 1,089,595 0 13,724 29,098 16,14092 475 Miscellaneous Debits 0 0 0 0 093 480 Miscellaneous Credits (218,423) 0 0 0 094 490 Retained Earnings (End of Year) 3,823,109 150,654 74,361 60,557 99,645
106
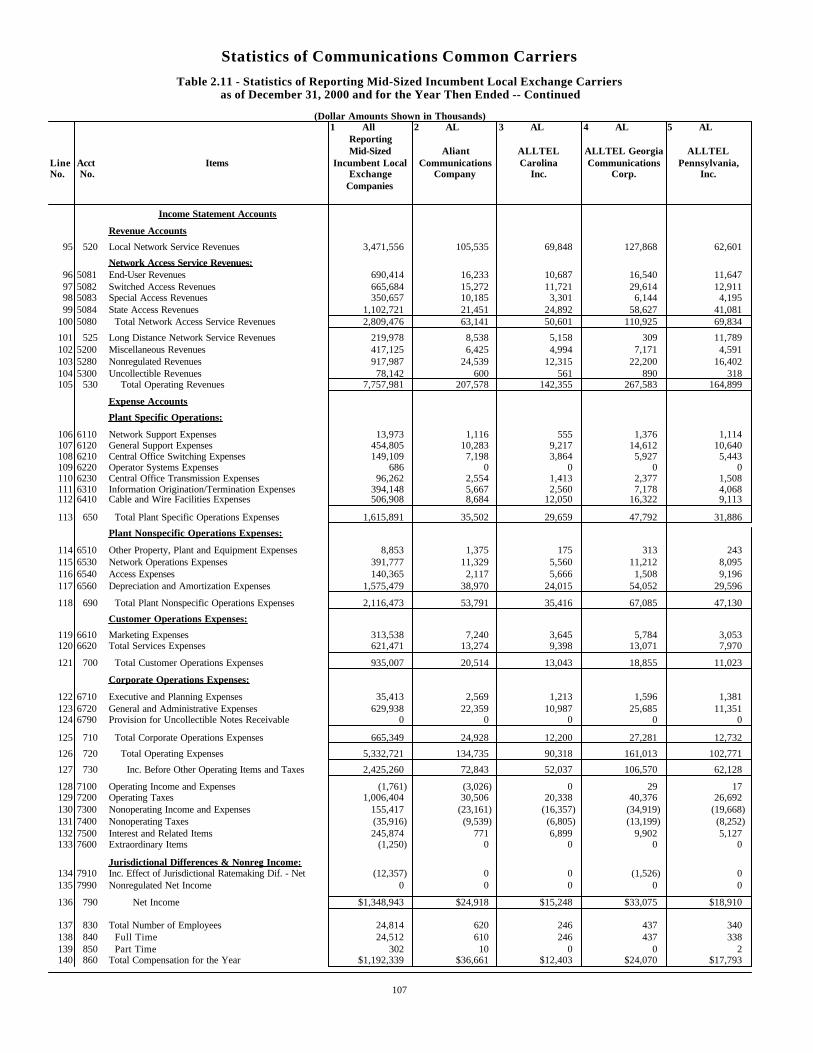
Statistics of Communications Common Carriers
Table 2.11 - Statistics of Reporting Mid-Sized Incumbent Local Exchange Carriersas of December 31, 2000 and for the Year Then Ended -- Continued
(Dollar Amounts Shown in Thousands)1 All 2 AL 3 AL 4 AL 5 AL
ReportingMid-Sized Aliant ALLTEL ALLTEL Georgia ALLTEL
Line Acct Items Incumbent Local Communications Carolina Communications Pennsylvania,No. No. Exchange Company Inc. Corp. Inc.
Companies
Income Statement Accounts
Revenue Accounts
95 520 Local Network Service Revenues 3,471,556 105,535 69,848 127,868 62,601
Network Access Service Revenues:96 5081 End-User Revenues 690,414 16,233 10,687 16,540 11,64797 5082 Switched Access Revenues 665,684 15,272 11,721 29,614 12,91198 5083 Special Access Revenues 350,657 10,185 3,301 6,144 4,19599 5084 State Access Revenues 1,102,721 21,451 24,892 58,627 41,081
100 5080 Total Network Access Service Revenues 2,809,476 63,141 50,601 110,925 69,834
101 525 Long Distance Network Service Revenues 219,978 8,538 5,158 309 11,789102 5200 Miscellaneous Revenues 417,125 6,425 4,994 7,171 4,591103 5280 Nonregulated Revenues 917,987 24,539 12,315 22,200 16,402104 5300 Uncollectible Revenues 78,142 600 561 890 318105 530 Total Operating Revenues 7,757,981 207,578 142,355 267,583 164,899
Expense Accounts
Plant Specific Operations:
106 6110 Network Support Expenses 13,973 1,116 555 1,376 1,114107 6120 General Support Expenses 454,805 10,283 9,217 14,612 10,640108 6210 Central Office Switching Expenses 149,109 7,198 3,864 5,927 5,443109 6220 Operator Systems Expenses 686 0 0 0 0110 6230 Central Office Transmission Expenses 96,262 2,554 1,413 2,377 1,508111 6310 Information Origination/Termination Expenses 394,148 5,667 2,560 7,178 4,068112 6410 Cable and Wire Facilities Expenses 506,908 8,684 12,050 16,322 9,113
113 650 Total Plant Specific Operations Expenses 1,615,891 35,502 29,659 47,792 31,886
Plant Nonspecific Operations Expenses:
114 6510 Other Property, Plant and Equipment Expenses 8,853 1,375 175 313 243115 6530 Network Operations Expenses 391,777 11,329 5,560 11,212 8,095116 6540 Access Expenses 140,365 2,117 5,666 1,508 9,196117 6560 Depreciation and Amortization Expenses 1,575,479 38,970 24,015 54,052 29,596
118 690 Total Plant Nonspecific Operations Expenses 2,116,473 53,791 35,416 67,085 47,130
Customer Operations Expenses:
119 6610 Marketing Expenses 313,538 7,240 3,645 5,784 3,053120 6620 Total Services Expenses 621,471 13,274 9,398 13,071 7,970
121 700 Total Customer Operations Expenses 935,007 20,514 13,043 18,855 11,023
Corporate Operations Expenses:
122 6710 Executive and Planning Expenses 35,413 2,569 1,213 1,596 1,381123 6720 General and Administrative Expenses 629,938 22,359 10,987 25,685 11,351124 6790 Provision for Uncollectible Notes Receivable 0 0 0 0 0
125 710 Total Corporate Operations Expenses 665,349 24,928 12,200 27,281 12,732
126 720 Total Operating Expenses 5,332,721 134,735 90,318 161,013 102,771
127 730 Inc. Before Other Operating Items and Taxes 2,425,260 72,843 52,037 106,570 62,128
128 7100 Operating Income and Expenses (1,761) (3,026) 0 29 17129 7200 Operating Taxes 1,006,404 30,506 20,338 40,376 26,692130 7300 Nonoperating Income and Expenses 155,417 (23,161) (16,357) (34,919) (19,668)131 7400 Nonoperating Taxes (35,916) (9,539) (6,805) (13,199) (8,252)132 7500 Interest and Related Items 245,874 771 6,899 9,902 5,127133 7600 Extraordinary Items (1,250) 0 0 0 0
Jurisdictional Differences & Nonreg Income:134 7910 Inc. Effect of Jurisdictional Ratemaking Dif. - Net (12,357) 0 0 (1,526) 0135 7990 Nonregulated Net Income 0 0 0 0 0
136 790 Net Income $1,348,943 $24,918 $15,248 $33,075 $18,910
137 830 Total Number of Employees 24,814 620 246 437 340138 840 Full Time 24,512 610 246 437 338139 850 Part Time 302 10 0 0 2140 860 Total Compensation for the Year $1,192,339 $36,661 $12,403 $24,070 $17,793
107
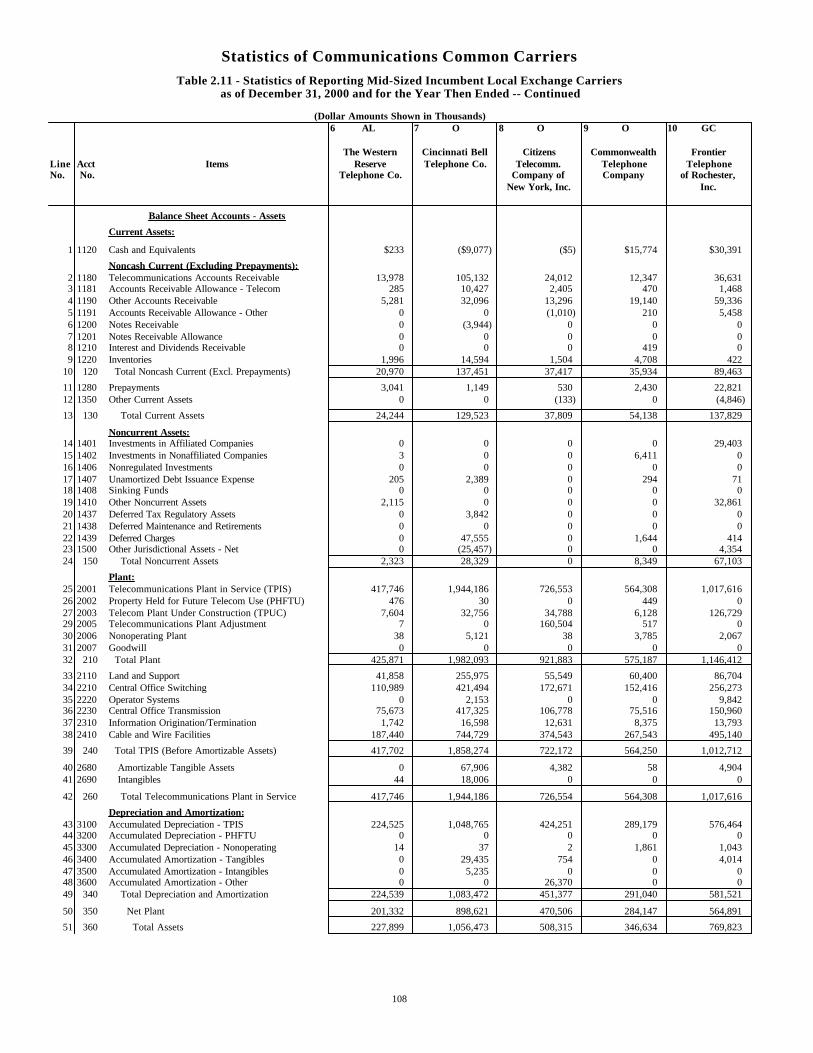
Statistics of Communications Common Carriers
Table 2.11 - Statistics of Reporting Mid-Sized Incumbent Local Exchange Carriersas of December 31, 2000 and for the Year Then Ended -- Continued
(Dollar Amounts Shown in Thousands)6 AL 7 O 8 O 9 O 10 GC
The Western Cincinnati Bell Citizens Commonwealth FrontierLine Acct Items Reserve Telephone Co. Telecomm. Telephone TelephoneNo. No. Telephone Co. Company of Company of Rochester,
New York, Inc. Inc.
Balance Sheet Accounts - Assets
Current Assets:
1 1120 Cash and Equivalents $233 ($9,077) ($5) $15,774 $30,391
Noncash Current (Excluding Prepayments):2 1180 Telecommunications Accounts Receivable 13,978 105,132 24,012 12,347 36,6313 1181 Accounts Receivable Allowance - Telecom 285 10,427 2,405 470 1,4684 1190 Other Accounts Receivable 5,281 32,096 13,296 19,140 59,3365 1191 Accounts Receivable Allowance - Other 0 0 (1,010) 210 5,4586 1200 Notes Receivable 0 (3,944) 0 0 07 1201 Notes Receivable Allowance 0 0 0 0 08 1210 Interest and Dividends Receivable 0 0 0 419 09 1220 Inventories 1,996 14,594 1,504 4,708 422
10 120 Total Noncash Current (Excl. Prepayments) 20,970 137,451 37,417 35,934 89,463
11 1280 Prepayments 3,041 1,149 530 2,430 22,82112 1350 Other Current Assets 0 0 (133) 0 (4,846)
13 130 Total Current Assets 24,244 129,523 37,809 54,138 137,829
Noncurrent Assets:14 1401 Investments in Affiliated Companies 0 0 0 0 29,40315 1402 Investments in Nonaffiliated Companies 3 0 0 6,411 016 1406 Nonregulated Investments 0 0 0 0 017 1407 Unamortized Debt Issuance Expense 205 2,389 0 294 7118 1408 Sinking Funds 0 0 0 0 019 1410 Other Noncurrent Assets 2,115 0 0 0 32,86120 1437 Deferred Tax Regulatory Assets 0 3,842 0 0 021 1438 Deferred Maintenance and Retirements 0 0 0 0 022 1439 Deferred Charges 0 47,555 0 1,644 41423 1500 Other Jurisdictional Assets - Net 0 (25,457) 0 0 4,35424 150 Total Noncurrent Assets 2,323 28,329 0 8,349 67,103
Plant:25 2001 Telecommunications Plant in Service (TPIS) 417,746 1,944,186 726,553 564,308 1,017,61626 2002 Property Held for Future Telecom Use (PHFTU) 476 30 0 449 027 2003 Telecom Plant Under Construction (TPUC) 7,604 32,756 34,788 6,128 126,72929 2005 Telecommunications Plant Adjustment 7 0 160,504 517 030 2006 Nonoperating Plant 38 5,121 38 3,785 2,06731 2007 Goodwill 0 0 0 0 032 210 Total Plant 425,871 1,982,093 921,883 575,187 1,146,412
33 2110 Land and Support 41,858 255,975 55,549 60,400 86,70434 2210 Central Office Switching 110,989 421,494 172,671 152,416 256,27335 2220 Operator Systems 0 2,153 0 0 9,84236 2230 Central Office Transmission 75,673 417,325 106,778 75,516 150,96037 2310 Information Origination/Termination 1,742 16,598 12,631 8,375 13,79338 2410 Cable and Wire Facilities 187,440 744,729 374,543 267,543 495,140
39 240 Total TPIS (Before Amortizable Assets) 417,702 1,858,274 722,172 564,250 1,012,712
40 2680 Amortizable Tangible Assets 0 67,906 4,382 58 4,90441 2690 Intangibles 44 18,006 0 0 0
42 260 Total Telecommunications Plant in Service 417,746 1,944,186 726,554 564,308 1,017,616
Depreciation and Amortization:43 3100 Accumulated Depreciation - TPIS 224,525 1,048,765 424,251 289,179 576,46444 3200 Accumulated Depreciation - PHFTU 0 0 0 0 045 3300 Accumulated Depreciation - Nonoperating 14 37 2 1,861 1,04346 3400 Accumulated Amortization - Tangibles 0 29,435 754 0 4,01447 3500 Accumulated Amortization - Intangibles 0 5,235 0 0 048 3600 Accumulated Amortization - Other 0 0 26,370 0 049 340 Total Depreciation and Amortization 224,539 1,083,472 451,377 291,040 581,521
50 350 Net Plant 201,332 898,621 470,506 284,147 564,891
51 360 Total Assets 227,899 1,056,473 508,315 346,634 769,823
108
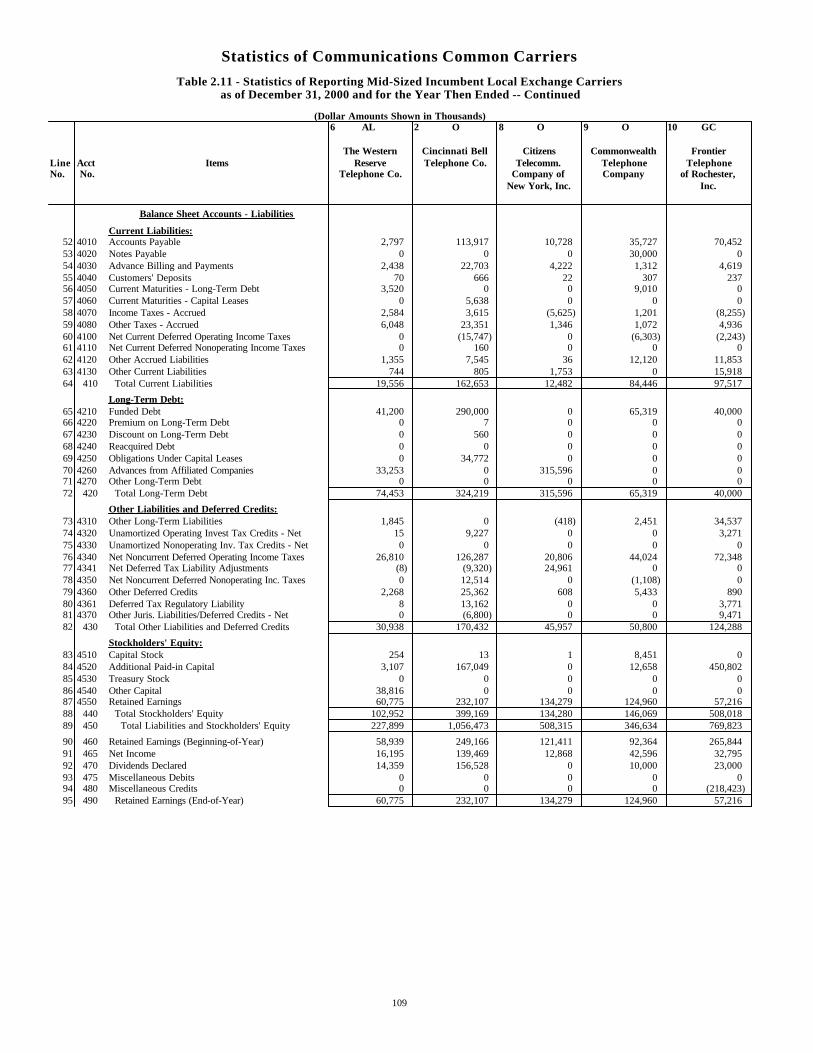
Statistics of Communications Common Carriers
Table 2.11 - Statistics of Reporting Mid-Sized Incumbent Local Exchange Carriersas of December 31, 2000 and for the Year Then Ended -- Continued
(Dollar Amounts Shown in Thousands)6 AL 2 O 8 O 9 O 10 GC
The Western Cincinnati Bell Citizens Commonwealth FrontierLine Acct Items Reserve Telephone Co. Telecomm. Telephone TelephoneNo. No. Telephone Co. Company of Company of Rochester,
New York, Inc. Inc.
Balance Sheet Accounts - Liabilities
Current Liabilities:52 4010 Accounts Payable 2,797 113,917 10,728 35,727 70,45253 4020 Notes Payable 0 0 0 30,000 054 4030 Advance Billing and Payments 2,438 22,703 4,222 1,312 4,61955 4040 Customers' Deposits 70 666 22 307 23756 4050 Current Maturities - Long-Term Debt 3,520 0 0 9,010 057 4060 Current Maturities - Capital Leases 0 5,638 0 0 058 4070 Income Taxes - Accrued 2,584 3,615 (5,625) 1,201 (8,255)59 4080 Other Taxes - Accrued 6,048 23,351 1,346 1,072 4,93660 4100 Net Current Deferred Operating Income Taxes 0 (15,747) 0 (6,303) (2,243)61 4110 Net Current Deferred Nonoperating Income Taxes 0 160 0 0 062 4120 Other Accrued Liabilities 1,355 7,545 36 12,120 11,85363 4130 Other Current Liabilities 744 805 1,753 0 15,91864 410 Total Current Liabilities 19,556 162,653 12,482 84,446 97,517
Long-Term Debt:65 4210 Funded Debt 41,200 290,000 0 65,319 40,00066 4220 Premium on Long-Term Debt 0 7 0 0 067 4230 Discount on Long-Term Debt 0 560 0 0 068 4240 Reacquired Debt 0 0 0 0 069 4250 Obligations Under Capital Leases 0 34,772 0 0 070 4260 Advances from Affiliated Companies 33,253 0 315,596 0 071 4270 Other Long-Term Debt 0 0 0 0 072 420 Total Long-Term Debt 74,453 324,219 315,596 65,319 40,000
Other Liabilities and Deferred Credits:73 4310 Other Long-Term Liabilities 1,845 0 (418) 2,451 34,53774 4320 Unamortized Operating Invest Tax Credits - Net 15 9,227 0 0 3,27175 4330 Unamortized Nonoperating Inv. Tax Credits - Net 0 0 0 0 076 4340 Net Noncurrent Deferred Operating Income Taxes 26,810 126,287 20,806 44,024 72,34877 4341 Net Deferred Tax Liability Adjustments (8) (9,320) 24,961 0 078 4350 Net Noncurrent Deferred Nonoperating Inc. Taxes 0 12,514 0 (1,108) 079 4360 Other Deferred Credits 2,268 25,362 608 5,433 89080 4361 Deferred Tax Regulatory Liability 8 13,162 0 0 3,77181 4370 Other Juris. Liabilities/Deferred Credits - Net 0 (6,800) 0 0 9,47182 430 Total Other Liabilities and Deferred Credits 30,938 170,432 45,957 50,800 124,288
Stockholders' Equity:83 4510 Capital Stock 254 13 1 8,451 084 4520 Additional Paid-in Capital 3,107 167,049 0 12,658 450,80285 4530 Treasury Stock 0 0 0 0 086 4540 Other Capital 38,816 0 0 0 087 4550 Retained Earnings 60,775 232,107 134,279 124,960 57,21688 440 Total Stockholders' Equity 102,952 399,169 134,280 146,069 508,01889 450 Total Liabilities and Stockholders' Equity 227,899 1,056,473 508,315 346,634 769,823
90 460 Retained Earnings (Beginning-of-Year) 58,939 249,166 121,411 92,364 265,84491 465 Net Income 16,195 139,469 12,868 42,596 32,79592 470 Dividends Declared 14,359 156,528 0 10,000 23,00093 475 Miscellaneous Debits 0 0 0 0 094 480 Miscellaneous Credits 0 0 0 0 (218,423)95 490 Retained Earnings (End-of-Year) 60,775 232,107 134,279 124,960 57,216
109
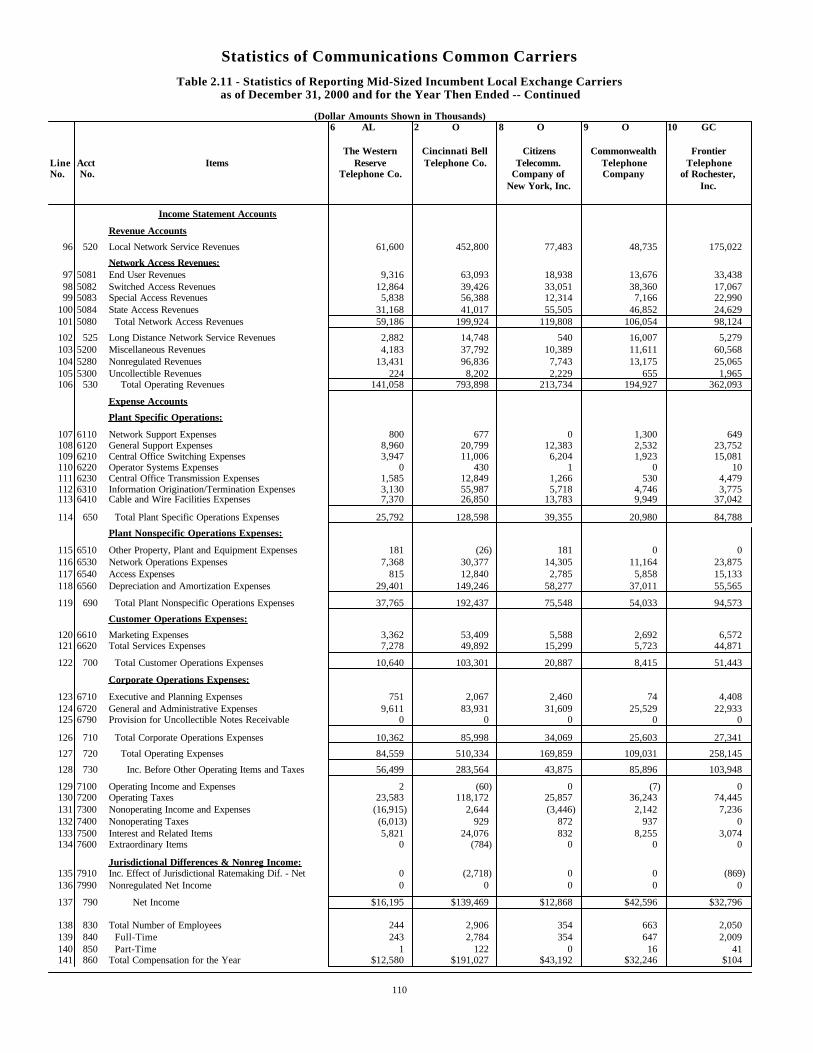
Statistics of Communications Common Carriers
Table 2.11 - Statistics of Reporting Mid-Sized Incumbent Local Exchange Carriersas of December 31, 2000 and for the Year Then Ended -- Continued
(Dollar Amounts Shown in Thousands)6 AL 2 O 8 O 9 O 10 GC
The Western Cincinnati Bell Citizens Commonwealth FrontierLine Acct Items Reserve Telephone Co. Telecomm. Telephone TelephoneNo. No. Telephone Co. Company of Company of Rochester,
New York, Inc. Inc.
Income Statement Accounts
Revenue Accounts
96 520 Local Network Service Revenues 61,600 452,800 77,483 48,735 175,022
Network Access Revenues:97 5081 End User Revenues 9,316 63,093 18,938 13,676 33,43898 5082 Switched Access Revenues 12,864 39,426 33,051 38,360 17,06799 5083 Special Access Revenues 5,838 56,388 12,314 7,166 22,990
100 5084 State Access Revenues 31,168 41,017 55,505 46,852 24,629101 5080 Total Network Access Revenues 59,186 199,924 119,808 106,054 98,124
102 525 Long Distance Network Service Revenues 2,882 14,748 540 16,007 5,279103 5200 Miscellaneous Revenues 4,183 37,792 10,389 11,611 60,568104 5280 Nonregulated Revenues 13,431 96,836 7,743 13,175 25,065105 5300 Uncollectible Revenues 224 8,202 2,229 655 1,965106 530 Total Operating Revenues 141,058 793,898 213,734 194,927 362,093
Expense Accounts
Plant Specific Operations:
107 6110 Network Support Expenses 800 677 0 1,300 649108 6120 General Support Expenses 8,960 20,799 12,383 2,532 23,752109 6210 Central Office Switching Expenses 3,947 11,006 6,204 1,923 15,081110 6220 Operator Systems Expenses 0 430 1 0 10111 6230 Central Office Transmission Expenses 1,585 12,849 1,266 530 4,479112 6310 Information Origination/Termination Expenses 3,130 55,987 5,718 4,746 3,775113 6410 Cable and Wire Facilities Expenses 7,370 26,850 13,783 9,949 37,042
114 650 Total Plant Specific Operations Expenses 25,792 128,598 39,355 20,980 84,788
Plant Nonspecific Operations Expenses:
115 6510 Other Property, Plant and Equipment Expenses 181 (26) 181 0 0116 6530 Network Operations Expenses 7,368 30,377 14,305 11,164 23,875117 6540 Access Expenses 815 12,840 2,785 5,858 15,133118 6560 Depreciation and Amortization Expenses 29,401 149,246 58,277 37,011 55,565
119 690 Total Plant Nonspecific Operations Expenses 37,765 192,437 75,548 54,033 94,573
Customer Operations Expenses:
120 6610 Marketing Expenses 3,362 53,409 5,588 2,692 6,572121 6620 Total Services Expenses 7,278 49,892 15,299 5,723 44,871
122 700 Total Customer Operations Expenses 10,640 103,301 20,887 8,415 51,443
Corporate Operations Expenses:
123 6710 Executive and Planning Expenses 751 2,067 2,460 74 4,408124 6720 General and Administrative Expenses 9,611 83,931 31,609 25,529 22,933125 6790 Provision for Uncollectible Notes Receivable 0 0 0 0 0
126 710 Total Corporate Operations Expenses 10,362 85,998 34,069 25,603 27,341
127 720 Total Operating Expenses 84,559 510,334 169,859 109,031 258,145
128 730 Inc. Before Other Operating Items and Taxes 56,499 283,564 43,875 85,896 103,948
129 7100 Operating Income and Expenses 2 (60) 0 (7) 0130 7200 Operating Taxes 23,583 118,172 25,857 36,243 74,445131 7300 Nonoperating Income and Expenses (16,915) 2,644 (3,446) 2,142 7,236132 7400 Nonoperating Taxes (6,013) 929 872 937 0133 7500 Interest and Related Items 5,821 24,076 832 8,255 3,074134 7600 Extraordinary Items 0 (784) 0 0 0
Jurisdictional Differences & Nonreg Income:135 7910 Inc. Effect of Jurisdictional Ratemaking Dif. - Net 0 (2,718) 0 0 (869)136 7990 Nonregulated Net Income 0 0 0 0 0
137 790 Net Income $16,195 $139,469 $12,868 $42,596 $32,796
138 830 Total Number of Employees 244 2,906 354 663 2,050139 840 Full-Time 243 2,784 354 647 2,009140 850 Part-Time 1 122 0 16 41141 860 Total Compensation for the Year $12,580 $191,027 $43,192 $32,246 $104
110
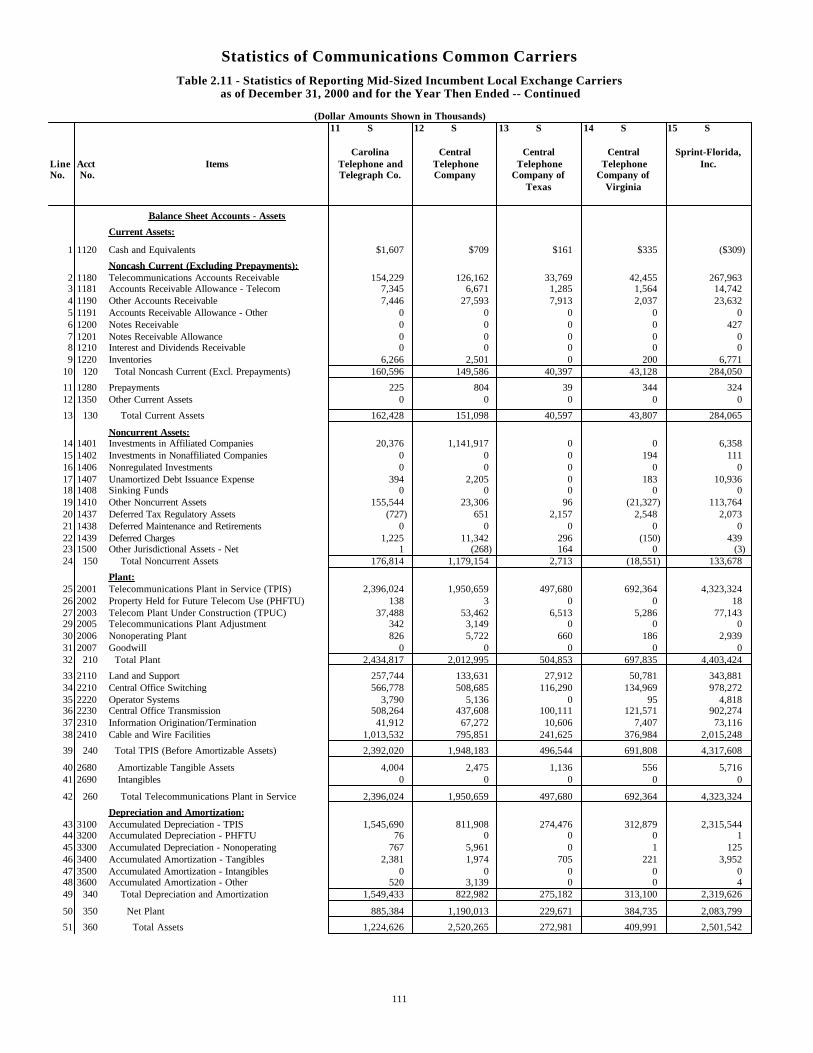
Statistics of Communications Common Carriers
Table 2.11 - Statistics of Reporting Mid-Sized Incumbent Local Exchange Carriersas of December 31, 2000 and for the Year Then Ended -- Continued
(Dollar Amounts Shown in Thousands)11 S 12 S 13 S 14 S 15 S
Carolina Central Central Central Sprint-Florida,Line Acct Items Telephone and Telephone Telephone Telephone Inc.No. No. Telegraph Co. Company Company of Company of
Texas Virginia
Balance Sheet Accounts - Assets
Current Assets:
1 1120 Cash and Equivalents $1,607 $709 $161 $335 ($309)
Noncash Current (Excluding Prepayments):2 1180 Telecommunications Accounts Receivable 154,229 126,162 33,769 42,455 267,9633 1181 Accounts Receivable Allowance - Telecom 7,345 6,671 1,285 1,564 14,7424 1190 Other Accounts Receivable 7,446 27,593 7,913 2,037 23,6325 1191 Accounts Receivable Allowance - Other 0 0 0 0 06 1200 Notes Receivable 0 0 0 0 4277 1201 Notes Receivable Allowance 0 0 0 0 08 1210 Interest and Dividends Receivable 0 0 0 0 09 1220 Inventories 6,266 2,501 0 200 6,771
10 120 Total Noncash Current (Excl. Prepayments) 160,596 149,586 40,397 43,128 284,050
11 1280 Prepayments 225 804 39 344 32412 1350 Other Current Assets 0 0 0 0 0
13 130 Total Current Assets 162,428 151,098 40,597 43,807 284,065
Noncurrent Assets:14 1401 Investments in Affiliated Companies 20,376 1,141,917 0 0 6,35815 1402 Investments in Nonaffiliated Companies 0 0 0 194 11116 1406 Nonregulated Investments 0 0 0 0 017 1407 Unamortized Debt Issuance Expense 394 2,205 0 183 10,93618 1408 Sinking Funds 0 0 0 0 019 1410 Other Noncurrent Assets 155,544 23,306 96 (21,327) 113,76420 1437 Deferred Tax Regulatory Assets (727) 651 2,157 2,548 2,07321 1438 Deferred Maintenance and Retirements 0 0 0 0 022 1439 Deferred Charges 1,225 11,342 296 (150) 43923 1500 Other Jurisdictional Assets - Net 1 (268) 164 0 (3)24 150 Total Noncurrent Assets 176,814 1,179,154 2,713 (18,551) 133,678
Plant:25 2001 Telecommunications Plant in Service (TPIS) 2,396,024 1,950,659 497,680 692,364 4,323,32426 2002 Property Held for Future Telecom Use (PHFTU) 138 3 0 0 1827 2003 Telecom Plant Under Construction (TPUC) 37,488 53,462 6,513 5,286 77,14329 2005 Telecommunications Plant Adjustment 342 3,149 0 0 030 2006 Nonoperating Plant 826 5,722 660 186 2,93931 2007 Goodwill 0 0 0 0 032 210 Total Plant 2,434,817 2,012,995 504,853 697,835 4,403,424
33 2110 Land and Support 257,744 133,631 27,912 50,781 343,88134 2210 Central Office Switching 566,778 508,685 116,290 134,969 978,27235 2220 Operator Systems 3,790 5,136 0 95 4,81836 2230 Central Office Transmission 508,264 437,608 100,111 121,571 902,27437 2310 Information Origination/Termination 41,912 67,272 10,606 7,407 73,11638 2410 Cable and Wire Facilities 1,013,532 795,851 241,625 376,984 2,015,248
39 240 Total TPIS (Before Amortizable Assets) 2,392,020 1,948,183 496,544 691,808 4,317,608
40 2680 Amortizable Tangible Assets 4,004 2,475 1,136 556 5,71641 2690 Intangibles 0 0 0 0 0
42 260 Total Telecommunications Plant in Service 2,396,024 1,950,659 497,680 692,364 4,323,324
Depreciation and Amortization:43 3100 Accumulated Depreciation - TPIS 1,545,690 811,908 274,476 312,879 2,315,54444 3200 Accumulated Depreciation - PHFTU 76 0 0 0 145 3300 Accumulated Depreciation - Nonoperating 767 5,961 0 1 12546 3400 Accumulated Amortization - Tangibles 2,381 1,974 705 221 3,95247 3500 Accumulated Amortization - Intangibles 0 0 0 0 048 3600 Accumulated Amortization - Other 520 3,139 0 0 449 340 Total Depreciation and Amortization 1,549,433 822,982 275,182 313,100 2,319,626
50 350 Net Plant 885,384 1,190,013 229,671 384,735 2,083,799
51 360 Total Assets 1,224,626 2,520,265 272,981 409,991 2,501,542
111

Statistics of Communications Common Carriers
Table 2.11 - Statistics of Reporting Mid-Sized Incumbent Local Exchange Carriersas of December 31, 2000 and for the Year Then Ended -- Continued
(Dollar Amounts Shown in Thousands)11 S 12 S 13 S 14 S 15 S
Carolina Central Central Central Sprint-Florida,Line Acct Items Telephone and Telephone Telephone Telephone Inc.No. No. Telegraph Co. Company Company of Company of
Texas Virginia
Balance Sheet Accounts - Liabilities
Current Liabilities:52 4010 Accounts Payable 123,929 113,746 32,118 28,674 188,93253 4020 Notes Payable 0 0 0 0 054 4030 Advance Billing and Payments 22,496 17,105 3,442 5,224 36,48255 4040 Customers' Deposits 3,861 3,855 1,023 832 2,67556 4050 Current Maturities - Long-Term Debt 0 300 215 532 20057 4060 Current Maturities - Capital Leases 0 0 0 0 1258 4070 Income Taxes - Accrued (2,832) (2,111) 4,783 697 1,29359 4080 Other Taxes - Accrued 4,445 8,885 3,573 985 7,29160 4100 Net Current Deferred Operating Income Taxes (8,794) 902 465 399 (8,426)61 4110 Net Current Deferred Nonoperating Income Taxes 303 (1,952) (121) 58 (380)62 4120 Other Accrued Liabilities 23,753 25,897 1,104 5,991 51,86463 4130 Other Current Liabilities 1,671 8,465 1,067 601 3,25064 410 Total Current Liabilities 168,832 175,091 47,669 43,994 283,193
Long-Term Debt:65 4210 Funded Debt 150,000 124,000 537 98,400 343,00066 4220 Premium on Long-Term Debt 0 0 0 0 067 4230 Discount on Long-Term Debt 639 0 0 0 3,65268 4240 Reacquired Debt 0 0 0 0 069 4250 Obligations Under Capital Leases 0 0 0 0 15770 4260 Advances from Affiliated Companies 166,623 386,263 82,900 19,859 387,63671 4270 Other Long-Term Debt 0 0 0 0 072 420 Total Long-Term Debt 315,984 510,263 83,436 118,259 727,142
Other Liabilities and Deferred Credits:73 4310 Other Long-Term Liabilities 115,988 76,505 0 30,983 129,08074 4320 Unamortized Operating Invest Tax Credits - Net 0 484 52 275 7,37375 4330 Unamortized Nonoperating Inv. Tax Credits - Net 0 0 0 0 076 4340 Net Noncurrent Deferred Operating Income Taxes 99,730 174,156 27,536 56,460 279,54977 4341 Net Deferred Tax Liability Adjustments (11,962) (7,986) 345 (1,682) (2,941)78 4350 Net Noncurrent Deferred Nonoperating Inc. Taxes (3,227) (489) (163) (638) 2,61879 4360 Other Deferred Credits 10,545 8,551 83 364 2,29780 4361 Deferred Tax Regulatory Liability 11,235 8,637 1,812 4,230 5,01481 4370 Other Juris. Liabilities/Deferred Credits - Net (3,697) 3,772 80 415 58782 430 Total Other Liabilities and Deferred Credits 218,612 263,631 29,745 90,406 423,576
Stockholders' Equity:83 4510 Capital Stock 72,530 353,063 63,605 72,743 16,25084 4520 Additional Paid-in Capital 44,100 636,719 0 0 188,14585 4530 Treasury Stock 0 0 0 0 086 4540 Other Capital 31,644 0 0 0 41,15387 4550 Retained Earnings 372,924 581,498 48,526 84,589 822,08488 440 Total Stockholders' Equity 521,199 1,571,280 112,131 157,332 1,067,63289 450 Total Liabilities and Stockholders' Equity 1,224,626 2,520,265 272,981 409,991 2,501,542
90 460 Retained Earnings (Beginning-of-Year) 345,736 497,137 45,705 85,624 760,39091 465 Net Income 133,082 297,803 27,421 36,715 208,91892 470 Dividends Declared 105,894 213,442 24,600 37,750 147,22593 475 Miscellaneous Debits 0 0 0 0 094 480 Miscellaneous Credits 0 0 0 0 095 490 Retained Earnings (End-of-Year) 372,924 581,498 48,526 84,589 822,084
112

Statistics of Communications Common Carriers
Table 2.11 - Statistics of Reporting Mid-Sized Incumbent Local Exchange Carriersas of December 31, 2000 and for the Year Then Ended -- Continued
(Dollar Amounts Shown in Thousands)11 S 12 S 13 S 14 S 15 S
Carolina Central Central Central Sprint-Florida,Line Acct Items Telephone and Telephone Telephone Telephone Inc.No. No. Telegraph Co. Company Company of Company of
Texas Virginia
Income Statement Accounts
Revenue Accounts
96 520 Local Network Service Revenues 411,138 359,483 71,512 100,873 614,469
Network Access Revenues:97 5081 End User Revenues 79,056 69,846 16,263 19,945 145,87798 5082 Switched Access Revenues 60,419 45,433 20,947 16,741 133,08499 5083 Special Access Revenues 35,921 35,004 5,322 7,399 62,892
100 5084 State Access Revenues 110,536 29,672 29,606 34,392 201,855101 5080 Total Network Access Revenues 285,932 179,955 72,138 78,477 543,708
102 525 Long Distance Network Service Revenues 17,608 9,309 2,963 6,277 23,004103 5200 Miscellaneous Revenues 49,445 45,230 4,635 16,790 71,516104 5280 Nonregulated Revenues 160,423 85,655 10,560 30,526 177,447105 5300 Uncollectible Revenues 9,093 9,723 1,545 2,416 23,233106 530 Total Operating Revenues 915,452 669,909 160,264 230,527 1,406,910
Expense Accounts
Plant Specific Operations:
107 6110 Network Support Expenses 1,339 385 36 382 1,137108 6120 General Support Expenses 57,719 45,496 11,042 14,936 81,353109 6210 Central Office Switching Expenses 12,824 18,150 1,929 4,995 25,477110 6220 Operator Systems Expenses 2 165 1 0 66111 6230 Central Office Transmission Expenses 8,536 7,512 1,730 2,637 24,723112 6310 Information Origination/Termination Expenses 72,322 40,604 2,190 14,618 78,182113 6410 Cable and Wire Facilities Expenses 67,311 51,717 9,320 19,845 98,319
114 650 Total Plant Specific Operations Expenses 220,052 164,030 26,247 57,413 309,257
Plant Nonspecific Operations Expenses:
115 6510 Other Property, Plant and Equipment Expenses 2,041 364 12 419 803116 6530 Network Operations Expenses 42,616 46,327 9,550 11,728 73,854117 6540 Access Expenses 12,962 9,601 1,174 6,472 28,863118 6560 Depreciation and Amortization Expenses 200,100 146,602 33,541 38,713 292,489
119 690 Total Plant Nonspecific Operations Expenses 257,719 202,894 44,277 57,332 396,009
Customer Operations Expenses:
120 6610 Marketing Expenses 37,637 34,606 4,711 10,210 62,137121 6620 Total Services Expenses 75,269 79,746 13,034 17,970 124,361
122 700 Total Customer Operations Expenses 112,906 114,352 17,744 28,180 186,499
Corporate Operations Expenses:
123 6710 Executive and Planning Expenses 2,551 2,787 754 655 5,643124 6720 General and Administrative Expenses 59,885 53,428 15,014 15,583 88,909125 6790 Provision for Uncollectible Notes Receivable 0 0 0 0 0
126 710 Total Corporate Operations Expenses 62,436 56,215 15,767 16,238 94,551
127 720 Total Operating Expenses 653,113 537,491 104,035 159,163 986,316
128 730 Inc. Before Other Operating Items and Taxes 262,339 132,418 56,228 71,364 420,594
129 7100 Operating Income and Expenses 19 332 0 0 500130 7200 Operating Taxes 107,816 39,578 22,206 26,549 160,683131 7300 Nonoperating Income and Expenses (596) 246,246 162 657 (387)132 7400 Nonoperating Taxes 494 905 406 404 1,666133 7500 Interest and Related Items 20,370 39,168 5,745 8,415 49,557134 7600 Extraordinary Items 0 0 (466) 0 0
Jurisdictional Differences & Nonreg Income:135 7910 Inc. Effect of Jurisdictional Ratemaking Dif. - Net 0 (1,542) (145) 63 117136 7990 Nonregulated Net Income 0 0 0 0 0
137 790 Net Income $133,082 $297,803 $27,421 $36,715 $208,918
138 830 Total Number of Employees 2,845 2,242 1/ 596 5,301139 840 Full-Time 2,836 2,230 1/ 596 5,231140 850 Part-Time 9 12 1/ 0 70141 860 Total Compensation for the Year $125,549 $115,716 1/ $27,292 $256,307
113
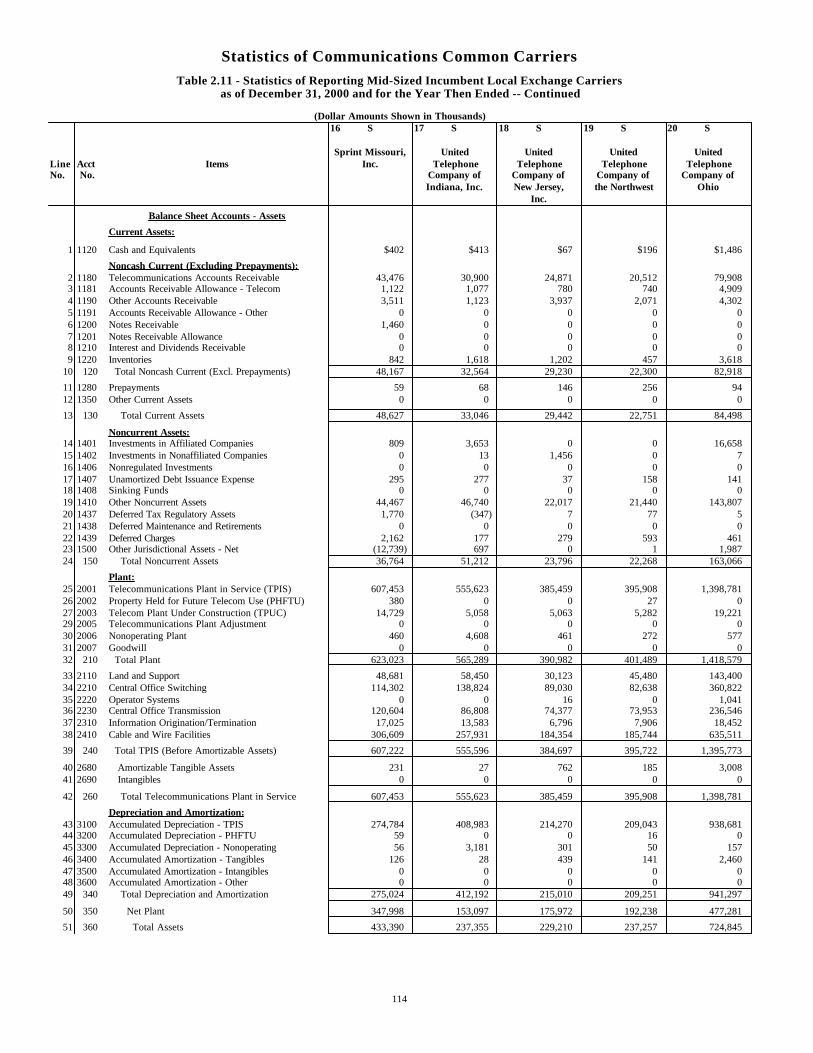
Statistics of Communications Common Carriers
Table 2.11 - Statistics of Reporting Mid-Sized Incumbent Local Exchange Carriersas of December 31, 2000 and for the Year Then Ended -- Continued
(Dollar Amounts Shown in Thousands)16 S 17 S 18 S 19 S 20 S
Sprint Missouri, United United United UnitedLine Acct Items Inc. Telephone Telephone Telephone TelephoneNo. No. Company of Company of Company of Company of
Indiana, Inc. New Jersey, the Northwest OhioInc.
Balance Sheet Accounts - Assets
Current Assets:
1 1120 Cash and Equivalents $402 $413 $67 $196 $1,486
Noncash Current (Excluding Prepayments):2 1180 Telecommunications Accounts Receivable 43,476 30,900 24,871 20,512 79,9083 1181 Accounts Receivable Allowance - Telecom 1,122 1,077 780 740 4,9094 1190 Other Accounts Receivable 3,511 1,123 3,937 2,071 4,3025 1191 Accounts Receivable Allowance - Other 0 0 0 0 06 1200 Notes Receivable 1,460 0 0 0 07 1201 Notes Receivable Allowance 0 0 0 0 08 1210 Interest and Dividends Receivable 0 0 0 0 09 1220 Inventories 842 1,618 1,202 457 3,618
10 120 Total Noncash Current (Excl. Prepayments) 48,167 32,564 29,230 22,300 82,918
11 1280 Prepayments 59 68 146 256 9412 1350 Other Current Assets 0 0 0 0 0
13 130 Total Current Assets 48,627 33,046 29,442 22,751 84,498
Noncurrent Assets:14 1401 Investments in Affiliated Companies 809 3,653 0 0 16,65815 1402 Investments in Nonaffiliated Companies 0 13 1,456 0 716 1406 Nonregulated Investments 0 0 0 0 017 1407 Unamortized Debt Issuance Expense 295 277 37 158 14118 1408 Sinking Funds 0 0 0 0 019 1410 Other Noncurrent Assets 44,467 46,740 22,017 21,440 143,80720 1437 Deferred Tax Regulatory Assets 1,770 (347) 7 77 521 1438 Deferred Maintenance and Retirements 0 0 0 0 022 1439 Deferred Charges 2,162 177 279 593 46123 1500 Other Jurisdictional Assets - Net (12,739) 697 0 1 1,98724 150 Total Noncurrent Assets 36,764 51,212 23,796 22,268 163,066
Plant:25 2001 Telecommunications Plant in Service (TPIS) 607,453 555,623 385,459 395,908 1,398,78126 2002 Property Held for Future Telecom Use (PHFTU) 380 0 0 27 027 2003 Telecom Plant Under Construction (TPUC) 14,729 5,058 5,063 5,282 19,22129 2005 Telecommunications Plant Adjustment 0 0 0 0 030 2006 Nonoperating Plant 460 4,608 461 272 57731 2007 Goodwill 0 0 0 0 032 210 Total Plant 623,023 565,289 390,982 401,489 1,418,579
33 2110 Land and Support 48,681 58,450 30,123 45,480 143,40034 2210 Central Office Switching 114,302 138,824 89,030 82,638 360,82235 2220 Operator Systems 0 0 16 0 1,04136 2230 Central Office Transmission 120,604 86,808 74,377 73,953 236,54637 2310 Information Origination/Termination 17,025 13,583 6,796 7,906 18,45238 2410 Cable and Wire Facilities 306,609 257,931 184,354 185,744 635,511
39 240 Total TPIS (Before Amortizable Assets) 607,222 555,596 384,697 395,722 1,395,773
40 2680 Amortizable Tangible Assets 231 27 762 185 3,00841 2690 Intangibles 0 0 0 0 0
42 260 Total Telecommunications Plant in Service 607,453 555,623 385,459 395,908 1,398,781
Depreciation and Amortization:43 3100 Accumulated Depreciation - TPIS 274,784 408,983 214,270 209,043 938,68144 3200 Accumulated Depreciation - PHFTU 59 0 0 16 045 3300 Accumulated Depreciation - Nonoperating 56 3,181 301 50 15746 3400 Accumulated Amortization - Tangibles 126 28 439 141 2,46047 3500 Accumulated Amortization - Intangibles 0 0 0 0 048 3600 Accumulated Amortization - Other 0 0 0 0 049 340 Total Depreciation and Amortization 275,024 412,192 215,010 209,251 941,297
50 350 Net Plant 347,998 153,097 175,972 192,238 477,281
51 360 Total Assets 433,390 237,355 229,210 237,257 724,845
114
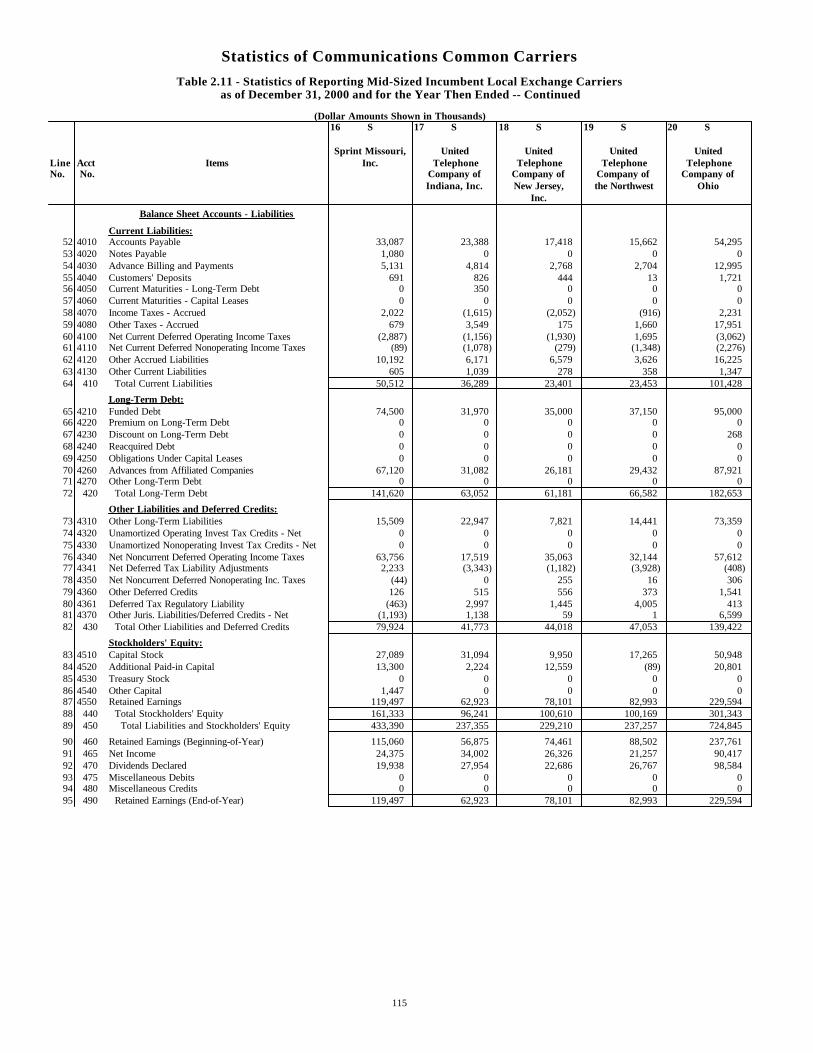
Statistics of Communications Common Carriers
Table 2.11 - Statistics of Reporting Mid-Sized Incumbent Local Exchange Carriersas of December 31, 2000 and for the Year Then Ended -- Continued
(Dollar Amounts Shown in Thousands)16 S 17 S 18 S 19 S 20 S
Sprint Missouri, United United United UnitedLine Acct Items Inc. Telephone Telephone Telephone TelephoneNo. No. Company of Company of Company of Company of
Indiana, Inc. New Jersey, the Northwest OhioInc.
Balance Sheet Accounts - Liabilities
Current Liabilities:52 4010 Accounts Payable 33,087 23,388 17,418 15,662 54,29553 4020 Notes Payable 1,080 0 0 0 054 4030 Advance Billing and Payments 5,131 4,814 2,768 2,704 12,99555 4040 Customers' Deposits 691 826 444 13 1,72156 4050 Current Maturities - Long-Term Debt 0 350 0 0 057 4060 Current Maturities - Capital Leases 0 0 0 0 058 4070 Income Taxes - Accrued 2,022 (1,615) (2,052) (916) 2,23159 4080 Other Taxes - Accrued 679 3,549 175 1,660 17,95160 4100 Net Current Deferred Operating Income Taxes (2,887) (1,156) (1,930) 1,695 (3,062)61 4110 Net Current Deferred Nonoperating Income Taxes (89) (1,078) (279) (1,348) (2,276)62 4120 Other Accrued Liabilities 10,192 6,171 6,579 3,626 16,22563 4130 Other Current Liabilities 605 1,039 278 358 1,34764 410 Total Current Liabilities 50,512 36,289 23,401 23,453 101,428
Long-Term Debt:65 4210 Funded Debt 74,500 31,970 35,000 37,150 95,00066 4220 Premium on Long-Term Debt 0 0 0 0 067 4230 Discount on Long-Term Debt 0 0 0 0 26868 4240 Reacquired Debt 0 0 0 0 069 4250 Obligations Under Capital Leases 0 0 0 0 070 4260 Advances from Affiliated Companies 67,120 31,082 26,181 29,432 87,92171 4270 Other Long-Term Debt 0 0 0 0 072 420 Total Long-Term Debt 141,620 63,052 61,181 66,582 182,653
Other Liabilities and Deferred Credits:73 4310 Other Long-Term Liabilities 15,509 22,947 7,821 14,441 73,35974 4320 Unamortized Operating Invest Tax Credits - Net 0 0 0 0 075 4330 Unamortized Nonoperating Invest Tax Credits - Net 0 0 0 0 076 4340 Net Noncurrent Deferred Operating Income Taxes 63,756 17,519 35,063 32,144 57,61277 4341 Net Deferred Tax Liability Adjustments 2,233 (3,343) (1,182) (3,928) (408)78 4350 Net Noncurrent Deferred Nonoperating Inc. Taxes (44) 0 255 16 30679 4360 Other Deferred Credits 126 515 556 373 1,54180 4361 Deferred Tax Regulatory Liability (463) 2,997 1,445 4,005 41381 4370 Other Juris. Liabilities/Deferred Credits - Net (1,193) 1,138 59 1 6,59982 430 Total Other Liabilities and Deferred Credits 79,924 41,773 44,018 47,053 139,422
Stockholders' Equity:83 4510 Capital Stock 27,089 31,094 9,950 17,265 50,94884 4520 Additional Paid-in Capital 13,300 2,224 12,559 (89) 20,80185 4530 Treasury Stock 0 0 0 0 086 4540 Other Capital 1,447 0 0 0 087 4550 Retained Earnings 119,497 62,923 78,101 82,993 229,59488 440 Total Stockholders' Equity 161,333 96,241 100,610 100,169 301,34389 450 Total Liabilities and Stockholders' Equity 433,390 237,355 229,210 237,257 724,845
90 460 Retained Earnings (Beginning-of-Year) 115,060 56,875 74,461 88,502 237,76191 465 Net Income 24,375 34,002 26,326 21,257 90,41792 470 Dividends Declared 19,938 27,954 22,686 26,767 98,58493 475 Miscellaneous Debits 0 0 0 0 094 480 Miscellaneous Credits 0 0 0 0 095 490 Retained Earnings (End-of-Year) 119,497 62,923 78,101 82,993 229,594
115
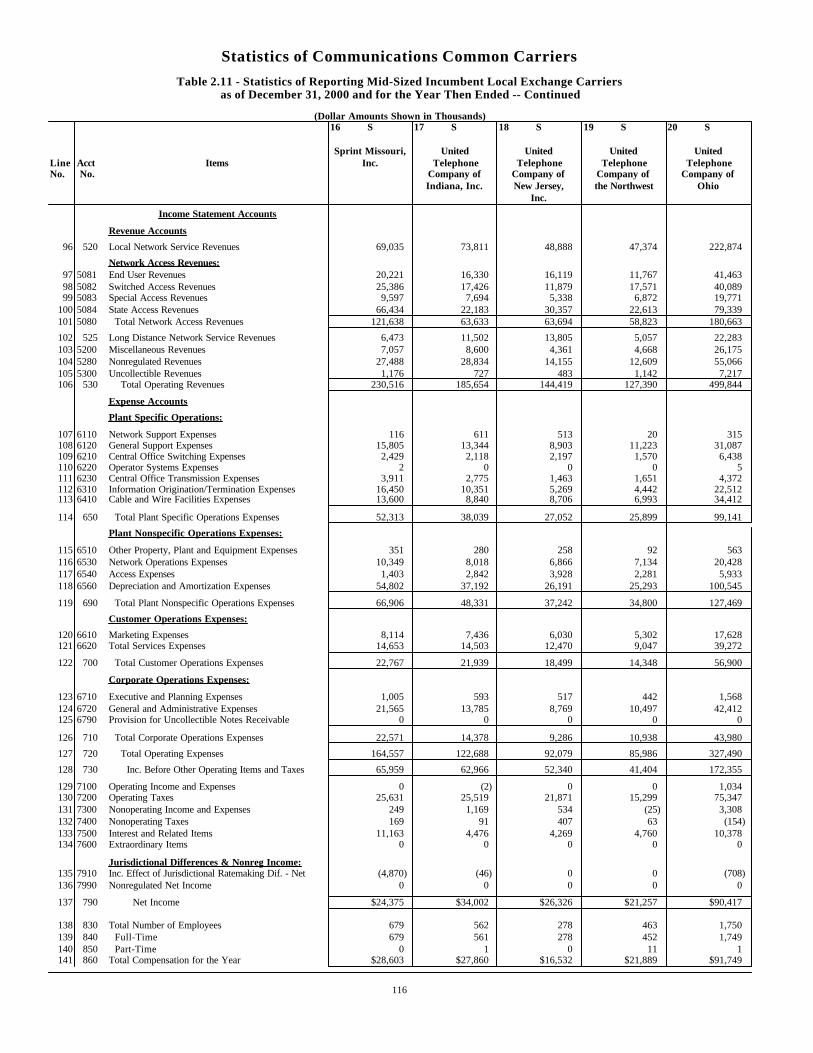
Statistics of Communications Common Carriers
Table 2.11 - Statistics of Reporting Mid-Sized Incumbent Local Exchange Carriersas of December 31, 2000 and for the Year Then Ended -- Continued
(Dollar Amounts Shown in Thousands)16 S 17 S 18 S 19 S 20 S
Sprint Missouri, United United United UnitedLine Acct Items Inc. Telephone Telephone Telephone TelephoneNo. No. Company of Company of Company of Company of
Indiana, Inc. New Jersey, the Northwest OhioInc.
Income Statement Accounts
Revenue Accounts
96 520 Local Network Service Revenues 69,035 73,811 48,888 47,374 222,874
Network Access Revenues:97 5081 End User Revenues 20,221 16,330 16,119 11,767 41,46398 5082 Switched Access Revenues 25,386 17,426 11,879 17,571 40,08999 5083 Special Access Revenues 9,597 7,694 5,338 6,872 19,771
100 5084 State Access Revenues 66,434 22,183 30,357 22,613 79,339101 5080 Total Network Access Revenues 121,638 63,633 63,694 58,823 180,663
102 525 Long Distance Network Service Revenues 6,473 11,502 13,805 5,057 22,283103 5200 Miscellaneous Revenues 7,057 8,600 4,361 4,668 26,175104 5280 Nonregulated Revenues 27,488 28,834 14,155 12,609 55,066105 5300 Uncollectible Revenues 1,176 727 483 1,142 7,217106 530 Total Operating Revenues 230,516 185,654 144,419 127,390 499,844
Expense Accounts
Plant Specific Operations:
107 6110 Network Support Expenses 116 611 513 20 315108 6120 General Support Expenses 15,805 13,344 8,903 11,223 31,087109 6210 Central Office Switching Expenses 2,429 2,118 2,197 1,570 6,438110 6220 Operator Systems Expenses 2 0 0 0 5111 6230 Central Office Transmission Expenses 3,911 2,775 1,463 1,651 4,372112 6310 Information Origination/Termination Expenses 16,450 10,351 5,269 4,442 22,512113 6410 Cable and Wire Facilities Expenses 13,600 8,840 8,706 6,993 34,412
114 650 Total Plant Specific Operations Expenses 52,313 38,039 27,052 25,899 99,141
Plant Nonspecific Operations Expenses:
115 6510 Other Property, Plant and Equipment Expenses 351 280 258 92 563116 6530 Network Operations Expenses 10,349 8,018 6,866 7,134 20,428117 6540 Access Expenses 1,403 2,842 3,928 2,281 5,933118 6560 Depreciation and Amortization Expenses 54,802 37,192 26,191 25,293 100,545
119 690 Total Plant Nonspecific Operations Expenses 66,906 48,331 37,242 34,800 127,469
Customer Operations Expenses:
120 6610 Marketing Expenses 8,114 7,436 6,030 5,302 17,628121 6620 Total Services Expenses 14,653 14,503 12,470 9,047 39,272
122 700 Total Customer Operations Expenses 22,767 21,939 18,499 14,348 56,900
Corporate Operations Expenses:
123 6710 Executive and Planning Expenses 1,005 593 517 442 1,568124 6720 General and Administrative Expenses 21,565 13,785 8,769 10,497 42,412125 6790 Provision for Uncollectible Notes Receivable 0 0 0 0 0
126 710 Total Corporate Operations Expenses 22,571 14,378 9,286 10,938 43,980
127 720 Total Operating Expenses 164,557 122,688 92,079 85,986 327,490
128 730 Inc. Before Other Operating Items and Taxes 65,959 62,966 52,340 41,404 172,355
129 7100 Operating Income and Expenses 0 (2) 0 0 1,034130 7200 Operating Taxes 25,631 25,519 21,871 15,299 75,347131 7300 Nonoperating Income and Expenses 249 1,169 534 (25) 3,308132 7400 Nonoperating Taxes 169 91 407 63 (154)133 7500 Interest and Related Items 11,163 4,476 4,269 4,760 10,378134 7600 Extraordinary Items 0 0 0 0 0
Jurisdictional Differences & Nonreg Income:135 7910 Inc. Effect of Jurisdictional Ratemaking Dif. - Net (4,870) (46) 0 0 (708)136 7990 Nonregulated Net Income 0 0 0 0 0
137 790 Net Income $24,375 $34,002 $26,326 $21,257 $90,417
138 830 Total Number of Employees 679 562 278 463 1,750139 840 Full-Time 679 561 278 452 1,749140 850 Part-Time 0 1 0 11 1141 860 Total Compensation for the Year $28,603 $27,860 $16,532 $21,889 $91,749
116
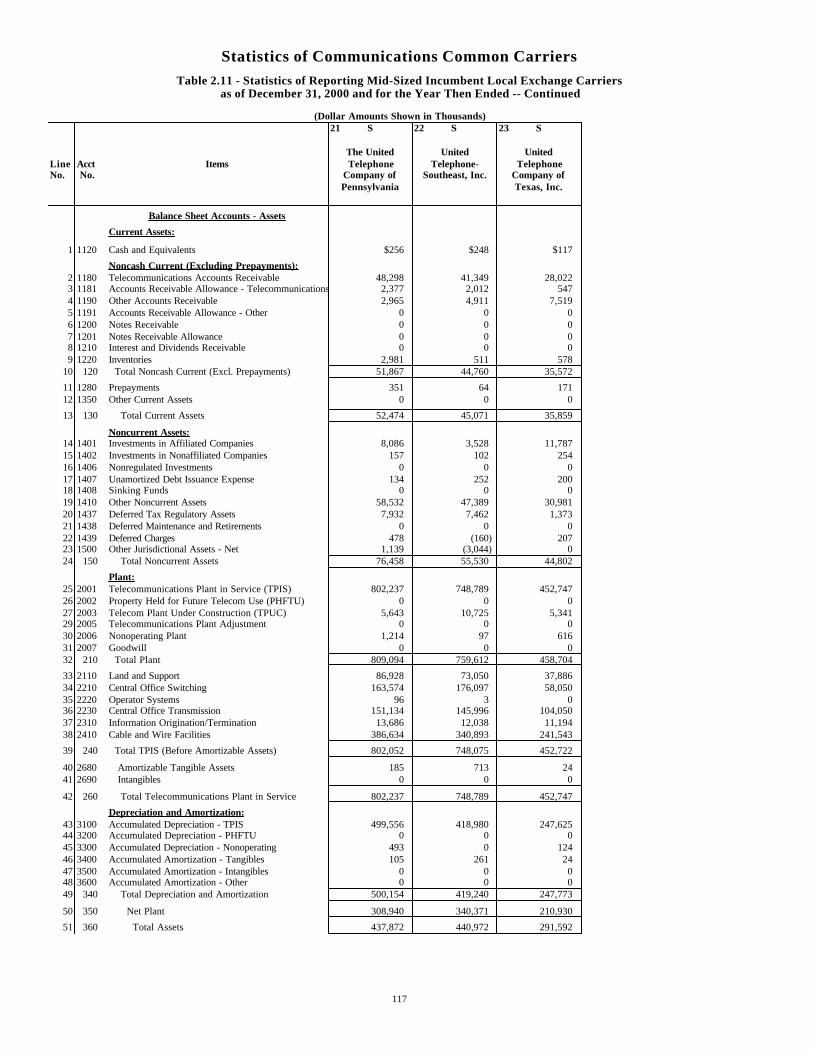
Statistics of Communications Common Carriers
Table 2.11 - Statistics of Reporting Mid-Sized Incumbent Local Exchange Carriersas of December 31, 2000 and for the Year Then Ended -- Continued
(Dollar Amounts Shown in Thousands)21 S 22 S 23 S
The United United UnitedLine Acct Items Telephone Telephone- TelephoneNo. No. Company of Southeast, Inc. Company of
Pennsylvania Texas, Inc.
Balance Sheet Accounts - Assets
Current Assets:
1 1120 Cash and Equivalents $256 $248 $117
Noncash Current (Excluding Prepayments):2 1180 Telecommunications Accounts Receivable 48,298 41,349 28,0223 1181 Accounts Receivable Allowance - Telecommunications 2,377 2,012 5474 1190 Other Accounts Receivable 2,965 4,911 7,5195 1191 Accounts Receivable Allowance - Other 0 0 06 1200 Notes Receivable 0 0 07 1201 Notes Receivable Allowance 0 0 08 1210 Interest and Dividends Receivable 0 0 09 1220 Inventories 2,981 511 578
10 120 Total Noncash Current (Excl. Prepayments) 51,867 44,760 35,572
11 1280 Prepayments 351 64 17112 1350 Other Current Assets 0 0 0
13 130 Total Current Assets 52,474 45,071 35,859
Noncurrent Assets:14 1401 Investments in Affiliated Companies 8,086 3,528 11,78715 1402 Investments in Nonaffiliated Companies 157 102 25416 1406 Nonregulated Investments 0 0 017 1407 Unamortized Debt Issuance Expense 134 252 20018 1408 Sinking Funds 0 0 019 1410 Other Noncurrent Assets 58,532 47,389 30,98120 1437 Deferred Tax Regulatory Assets 7,932 7,462 1,37321 1438 Deferred Maintenance and Retirements 0 0 022 1439 Deferred Charges 478 (160) 20723 1500 Other Jurisdictional Assets - Net 1,139 (3,044) 024 150 Total Noncurrent Assets 76,458 55,530 44,802
Plant:25 2001 Telecommunications Plant in Service (TPIS) 802,237 748,789 452,74726 2002 Property Held for Future Telecom Use (PHFTU) 0 0 027 2003 Telecom Plant Under Construction (TPUC) 5,643 10,725 5,34129 2005 Telecommunications Plant Adjustment 0 0 030 2006 Nonoperating Plant 1,214 97 61631 2007 Goodwill 0 0 032 210 Total Plant 809,094 759,612 458,704
33 2110 Land and Support 86,928 73,050 37,88634 2210 Central Office Switching 163,574 176,097 58,05035 2220 Operator Systems 96 3 036 2230 Central Office Transmission 151,134 145,996 104,05037 2310 Information Origination/Termination 13,686 12,038 11,19438 2410 Cable and Wire Facilities 386,634 340,893 241,543
39 240 Total TPIS (Before Amortizable Assets) 802,052 748,075 452,722
40 2680 Amortizable Tangible Assets 185 713 2441 2690 Intangibles 0 0 0
42 260 Total Telecommunications Plant in Service 802,237 748,789 452,747
Depreciation and Amortization:43 3100 Accumulated Depreciation - TPIS 499,556 418,980 247,62544 3200 Accumulated Depreciation - PHFTU 0 0 045 3300 Accumulated Depreciation - Nonoperating 493 0 12446 3400 Accumulated Amortization - Tangibles 105 261 2447 3500 Accumulated Amortization - Intangibles 0 0 048 3600 Accumulated Amortization - Other 0 0 049 340 Total Depreciation and Amortization 500,154 419,240 247,773
50 350 Net Plant 308,940 340,371 210,930
51 360 Total Assets 437,872 440,972 291,592
117
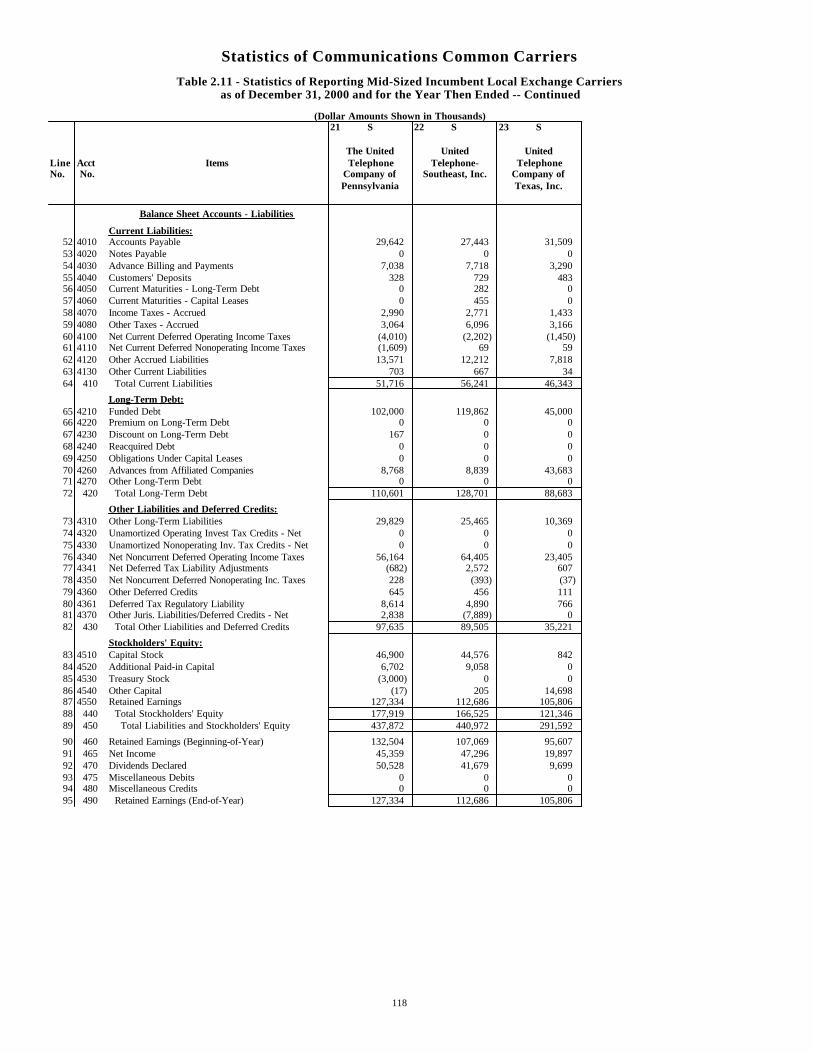
Statistics of Communications Common Carriers
Table 2.11 - Statistics of Reporting Mid-Sized Incumbent Local Exchange Carriersas of December 31, 2000 and for the Year Then Ended -- Continued
(Dollar Amounts Shown in Thousands)21 S 22 S 23 S
The United United UnitedLine Acct Items Telephone Telephone- TelephoneNo. No. Company of Southeast, Inc. Company of
Pennsylvania Texas, Inc.
Balance Sheet Accounts - Liabilities
Current Liabilities:52 4010 Accounts Payable 29,642 27,443 31,50953 4020 Notes Payable 0 0 054 4030 Advance Billing and Payments 7,038 7,718 3,29055 4040 Customers' Deposits 328 729 48356 4050 Current Maturities - Long-Term Debt 0 282 057 4060 Current Maturities - Capital Leases 0 455 058 4070 Income Taxes - Accrued 2,990 2,771 1,43359 4080 Other Taxes - Accrued 3,064 6,096 3,16660 4100 Net Current Deferred Operating Income Taxes (4,010) (2,202) (1,450)61 4110 Net Current Deferred Nonoperating Income Taxes (1,609) 69 5962 4120 Other Accrued Liabilities 13,571 12,212 7,81863 4130 Other Current Liabilities 703 667 3464 410 Total Current Liabilities 51,716 56,241 46,343
Long-Term Debt:65 4210 Funded Debt 102,000 119,862 45,00066 4220 Premium on Long-Term Debt 0 0 067 4230 Discount on Long-Term Debt 167 0 068 4240 Reacquired Debt 0 0 069 4250 Obligations Under Capital Leases 0 0 070 4260 Advances from Affiliated Companies 8,768 8,839 43,68371 4270 Other Long-Term Debt 0 0 072 420 Total Long-Term Debt 110,601 128,701 88,683
Other Liabilities and Deferred Credits:73 4310 Other Long-Term Liabilities 29,829 25,465 10,36974 4320 Unamortized Operating Invest Tax Credits - Net 0 0 075 4330 Unamortized Nonoperating Inv. Tax Credits - Net 0 0 076 4340 Net Noncurrent Deferred Operating Income Taxes 56,164 64,405 23,40577 4341 Net Deferred Tax Liability Adjustments (682) 2,572 60778 4350 Net Noncurrent Deferred Nonoperating Inc. Taxes 228 (393) (37)79 4360 Other Deferred Credits 645 456 11180 4361 Deferred Tax Regulatory Liability 8,614 4,890 76681 4370 Other Juris. Liabilities/Deferred Credits - Net 2,838 (7,889) 082 430 Total Other Liabilities and Deferred Credits 97,635 89,505 35,221
Stockholders' Equity:83 4510 Capital Stock 46,900 44,576 84284 4520 Additional Paid-in Capital 6,702 9,058 085 4530 Treasury Stock (3,000) 0 086 4540 Other Capital (17) 205 14,69887 4550 Retained Earnings 127,334 112,686 105,80688 440 Total Stockholders' Equity 177,919 166,525 121,34689 450 Total Liabilities and Stockholders' Equity 437,872 440,972 291,592
90 460 Retained Earnings (Beginning-of-Year) 132,504 107,069 95,60791 465 Net Income 45,359 47,296 19,89792 470 Dividends Declared 50,528 41,679 9,69993 475 Miscellaneous Debits 0 0 094 480 Miscellaneous Credits 0 0 095 490 Retained Earnings (End-of-Year) 127,334 112,686 105,806
118
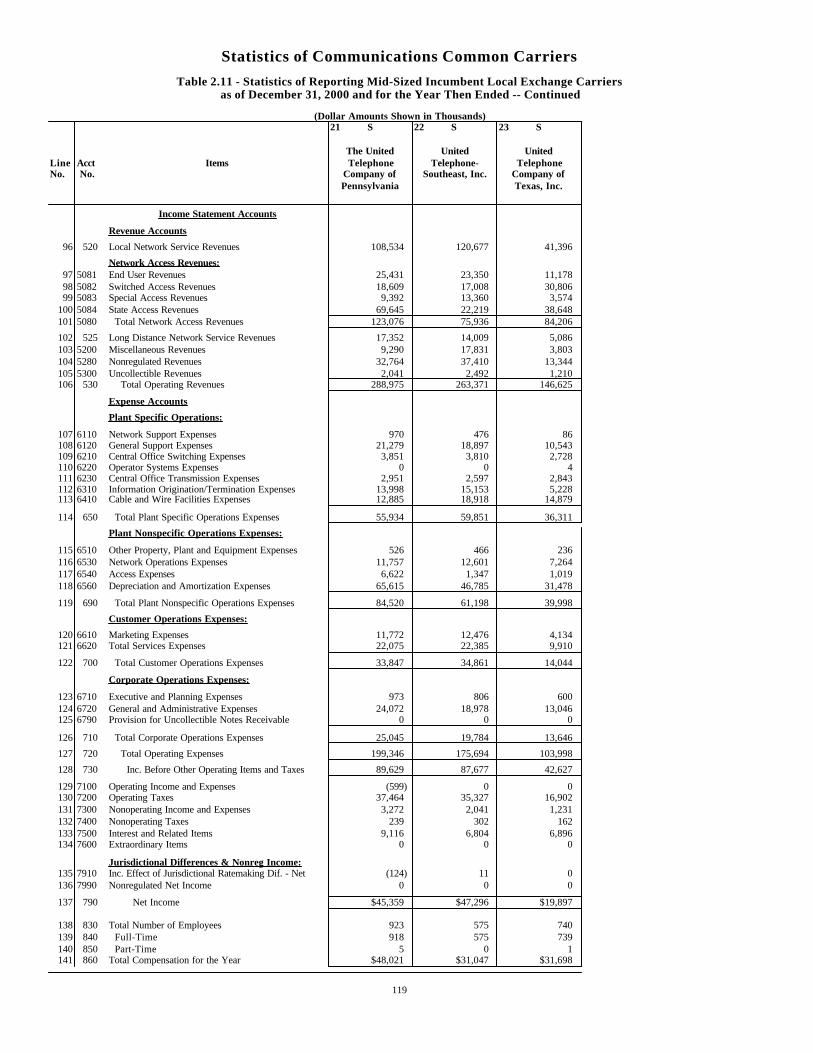
Statistics of Communications Common Carriers
Table 2.11 - Statistics of Reporting Mid-Sized Incumbent Local Exchange Carriersas of December 31, 2000 and for the Year Then Ended -- Continued
(Dollar Amounts Shown in Thousands)21 S 22 S 23 S
The United United UnitedLine Acct Items Telephone Telephone- TelephoneNo. No. Company of Southeast, Inc. Company of
Pennsylvania Texas, Inc.
Income Statement Accounts
Revenue Accounts
96 520 Local Network Service Revenues 108,534 120,677 41,396
Network Access Revenues:97 5081 End User Revenues 25,431 23,350 11,17898 5082 Switched Access Revenues 18,609 17,008 30,80699 5083 Special Access Revenues 9,392 13,360 3,574
100 5084 State Access Revenues 69,645 22,219 38,648101 5080 Total Network Access Revenues 123,076 75,936 84,206
102 525 Long Distance Network Service Revenues 17,352 14,009 5,086103 5200 Miscellaneous Revenues 9,290 17,831 3,803104 5280 Nonregulated Revenues 32,764 37,410 13,344105 5300 Uncollectible Revenues 2,041 2,492 1,210106 530 Total Operating Revenues 288,975 263,371 146,625
Expense Accounts
Plant Specific Operations:
107 6110 Network Support Expenses 970 476 86108 6120 General Support Expenses 21,279 18,897 10,543109 6210 Central Office Switching Expenses 3,851 3,810 2,728110 6220 Operator Systems Expenses 0 0 4111 6230 Central Office Transmission Expenses 2,951 2,597 2,843112 6310 Information Origination/Termination Expenses 13,998 15,153 5,228113 6410 Cable and Wire Facilities Expenses 12,885 18,918 14,879
114 650 Total Plant Specific Operations Expenses 55,934 59,851 36,311
Plant Nonspecific Operations Expenses:
115 6510 Other Property, Plant and Equipment Expenses 526 466 236116 6530 Network Operations Expenses 11,757 12,601 7,264117 6540 Access Expenses 6,622 1,347 1,019118 6560 Depreciation and Amortization Expenses 65,615 46,785 31,478
119 690 Total Plant Nonspecific Operations Expenses 84,520 61,198 39,998
Customer Operations Expenses:
120 6610 Marketing Expenses 11,772 12,476 4,134121 6620 Total Services Expenses 22,075 22,385 9,910
122 700 Total Customer Operations Expenses 33,847 34,861 14,044
Corporate Operations Expenses:
123 6710 Executive and Planning Expenses 973 806 600124 6720 General and Administrative Expenses 24,072 18,978 13,046125 6790 Provision for Uncollectible Notes Receivable 0 0 0
126 710 Total Corporate Operations Expenses 25,045 19,784 13,646
127 720 Total Operating Expenses 199,346 175,694 103,998
128 730 Inc. Before Other Operating Items and Taxes 89,629 87,677 42,627
129 7100 Operating Income and Expenses (599) 0 0130 7200 Operating Taxes 37,464 35,327 16,902131 7300 Nonoperating Income and Expenses 3,272 2,041 1,231132 7400 Nonoperating Taxes 239 302 162133 7500 Interest and Related Items 9,116 6,804 6,896134 7600 Extraordinary Items 0 0 0
Jurisdictional Differences & Nonreg Income:135 7910 Inc. Effect of Jurisdictional Ratemaking Dif. - Net (124) 11 0136 7990 Nonregulated Net Income 0 0 0
137 790 Net Income $45,359 $47,296 $19,897
138 830 Total Number of Employees 923 575 740139 840 Full-Time 918 575 739140 850 Part-Time 5 0 1141 860 Total Compensation for the Year $48,021 $31,047 $31,698
119
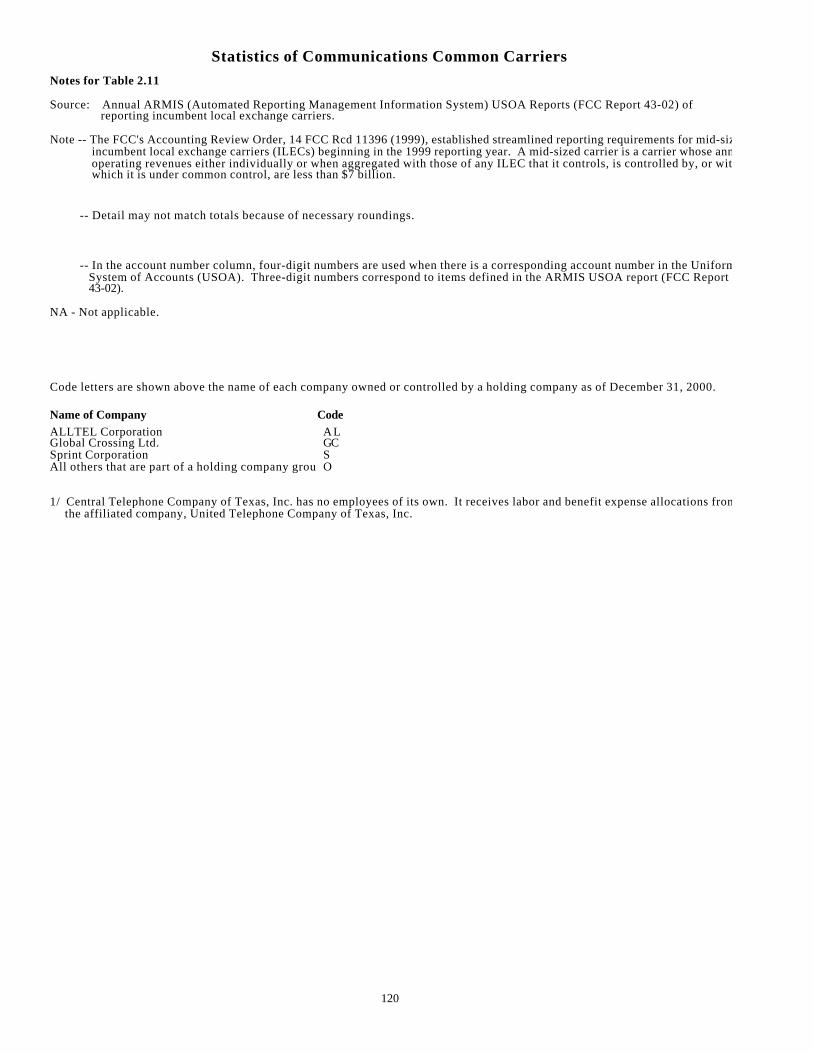
Statistics of Communications Common Carriers
Notes for Table 2.11
Source: Annual ARMIS (Automated Reporting Management Information System) USOA Reports (FCC Report 43-02) of reporting incumbent local exchange carriers.
Note -- The FCC's Accounting Review Order, 14 FCC Rcd 11396 (1999), established streamlined reporting requirements for mid-sized incumbent local exchange carriers (ILECs) beginning in the 1999 reporting year. A mid-sized carrier is a carrier whose annual operating revenues either individually or when aggregated with those of any ILEC that it controls, is controlled by, or with which it is under common control, are less than $7 billion.
-- Detail may not match totals because of necessary roundings.
-- In the account number column, four-digit numbers are used when there is a corresponding account number in the Uniform System of Accounts (USOA). Three-digit numbers correspond to items defined in the ARMIS USOA report (FCC Report 43-02).
NA - Not applicable.
Code letters are shown above the name of each company owned or controlled by a holding company as of December 31, 2000.
Name of Company Code
ALLTEL Corporation A LGlobal Crossing Ltd. GCSprint Corporation SAll others that are part of a holding company group O
1/ Central Telephone Company of Texas, Inc. has no employees of its own. It receives labor and benefit expense allocations from the affiliated company, United Telephone Company of Texas, Inc.
120
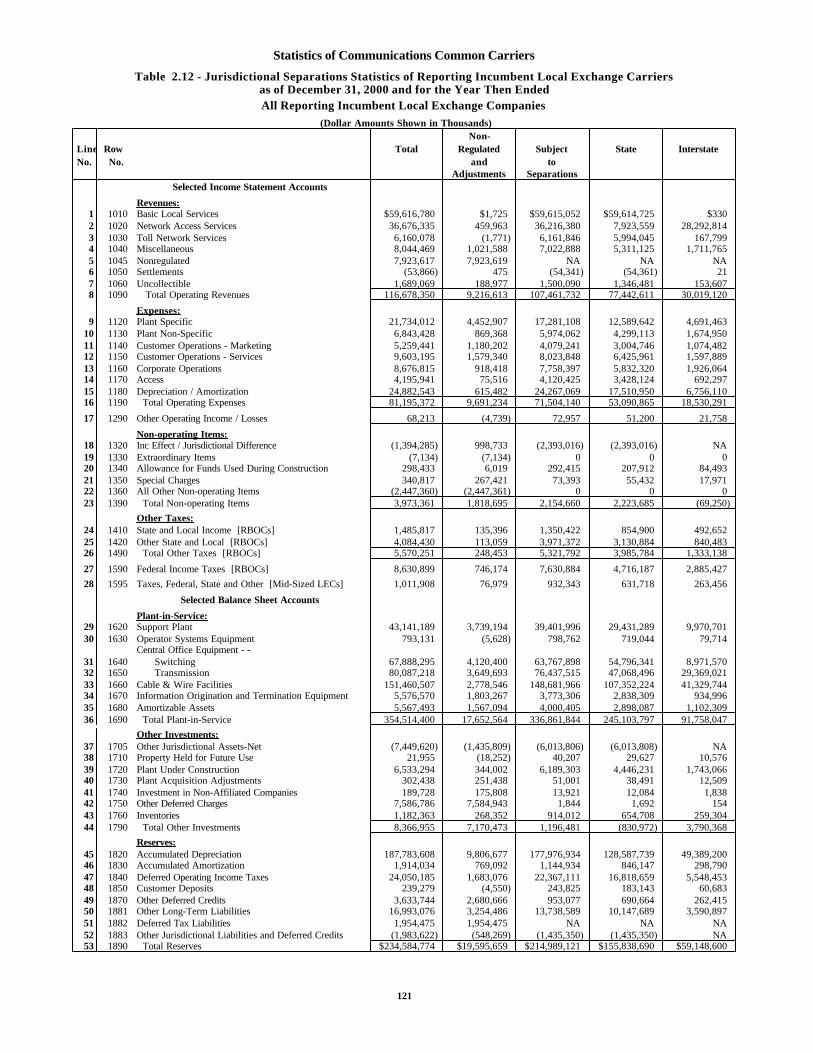
Statistics of Communications Common Carriers
Table 2.12 - Jurisdictional Separations Statistics of Reporting Incumbent Local Exchange Carriersas of December 31, 2000 and for the Year Then EndedAll Reporting Incumbent Local Exchange Companies
(Dollar Amounts Shown in Thousands)Non-
Line Row Total Regulated Subject State InterstateNo. No. and to
Adjustments SeparationsSelected Income Statement Accounts
Revenues:1 1010 Basic Local Services $59,616,780 $1,725 $59,615,052 $59,614,725 $3302 1020 Network Access Services 36,676,335 459,963 36,216,380 7,923,559 28,292,8143 1030 Toll Network Services 6,160,078 (1,771) 6,161,846 5,994,045 167,7994 1040 Miscellaneous 8,044,469 1,021,588 7,022,888 5,311,125 1,711,7655 1045 Nonregulated 7,923,617 7,923,619 NA NA NA 6 1050 Settlements (53,866) 475 (54,341) (54,361) 217 1060 Uncollectible 1,689,069 188,977 1,500,090 1,346,481 153,6078 1090 Total Operating Revenues 116,678,350 9,216,613 107,461,732 77,442,611 30,019,120
Expenses:9 1120 Plant Specific 21,734,012 4,452,907 17,281,108 12,589,642 4,691,463
10 1130 Plant Non-Specific 6,843,428 869,368 5,974,062 4,299,113 1,674,95011 1140 Customer Operations - Marketing 5,259,441 1,180,202 4,079,241 3,004,746 1,074,48212 1150 Customer Operations - Services 9,603,195 1,579,340 8,023,848 6,425,961 1,597,88913 1160 Corporate Operations 8,676,815 918,418 7,758,397 5,832,320 1,926,06414 1170 Access 4,195,941 75,516 4,120,425 3,428,124 692,29715 1180 Depreciation / Amortization 24,882,543 615,482 24,267,069 17,510,950 6,756,11016 1190 Total Operating Expenses 81,195,372 9,691,234 71,504,140 53,090,865 18,530,291
17 1290 Other Operating Income / Losses 68,213 (4,739) 72,957 51,200 21,758
Non-operating Items:18 1320 Inc Effect / Jurisdictional Difference (1,394,285) 998,733 (2,393,016) (2,393,016) NA 19 1330 Extraordinary Items (7,134) (7,134) 0 0 020 1340 Allowance for Funds Used During Construction 298,433 6,019 292,415 207,912 84,49321 1350 Special Charges 340,817 267,421 73,393 55,432 17,97122 1360 All Other Non-operating Items (2,447,360) (2,447,361) 0 0 023 1390 Total Non-operating Items 3,973,361 1,818,695 2,154,660 2,223,685 (69,250)
Other Taxes:24 1410 State and Local Income [RBOCs] 1,485,817 135,396 1,350,422 854,900 492,65225 1420 Other State and Local [RBOCs] 4,084,430 113,059 3,971,372 3,130,884 840,48326 1490 Total Other Taxes [RBOCs] 5,570,251 248,453 5,321,792 3,985,784 1,333,138
27 1590 Federal Income Taxes [RBOCs] 8,630,899 746,174 7,630,884 4,716,187 2,885,427
28 1595 Taxes, Federal, State and Other [Mid-Sized LECs] 1,011,908 76,979 932,343 631,718 263,456
Selected Balance Sheet Accounts
Plant-in-Service:29 1620 Support Plant 43,141,189 3,739,194 39,401,996 29,431,289 9,970,70130 1630 Operator Systems Equipment 793,131 (5,628) 798,762 719,044 79,714
Central Office Equipment - -31 1640 Switching 67,888,295 4,120,400 63,767,898 54,796,341 8,971,57032 1650 Transmission 80,087,218 3,649,693 76,437,515 47,068,496 29,369,02133 1660 Cable & Wire Facilities 151,460,507 2,778,546 148,681,966 107,352,224 41,329,74434 1670 Information Origination and Termination Equipment 5,576,570 1,803,267 3,773,306 2,838,309 934,99635 1680 Amortizable Assets 5,567,493 1,567,094 4,000,405 2,898,087 1,102,30936 1690 Total Plant-in-Service 354,514,400 17,652,564 336,861,844 245,103,797 91,758,047
Other Investments:37 1705 Other Jurisdictional Assets-Net (7,449,620) (1,435,809) (6,013,806) (6,013,808) NA 38 1710 Property Held for Future Use 21,955 (18,252) 40,207 29,627 10,57639 1720 Plant Under Construction 6,533,294 344,002 6,189,303 4,446,231 1,743,06640 1730 Plant Acquisition Adjustments 302,438 251,438 51,001 38,491 12,50941 1740 Investment in Non-Affiliated Companies 189,728 175,808 13,921 12,084 1,83842 1750 Other Deferred Charges 7,586,786 7,584,943 1,844 1,692 15443 1760 Inventories 1,182,363 268,352 914,012 654,708 259,30444 1790 Total Other Investments 8,366,955 7,170,473 1,196,481 (830,972) 3,790,368
Reserves:45 1820 Accumulated Depreciation 187,783,608 9,806,677 177,976,934 128,587,739 49,389,20046 1830 Accumulated Amortization 1,914,034 769,092 1,144,934 846,147 298,79047 1840 Deferred Operating Income Taxes 24,050,185 1,683,076 22,367,111 16,818,659 5,548,45348 1850 Customer Deposits 239,279 (4,550) 243,825 183,143 60,68349 1870 Other Deferred Credits 3,633,744 2,680,666 953,077 690,664 262,41550 1881 Other Long-Term Liabilities 16,993,076 3,254,486 13,738,589 10,147,689 3,590,89751 1882 Deferred Tax Liabilities 1,954,475 1,954,475 NA NA NA 52 1883 Other Jurisdictional Liabilities and Deferred Credits (1,983,622) (548,269) (1,435,350) (1,435,350) NA 53 1890 Total Reserves $234,584,774 $19,595,659 $214,989,121 $155,838,690 $59,148,600
121
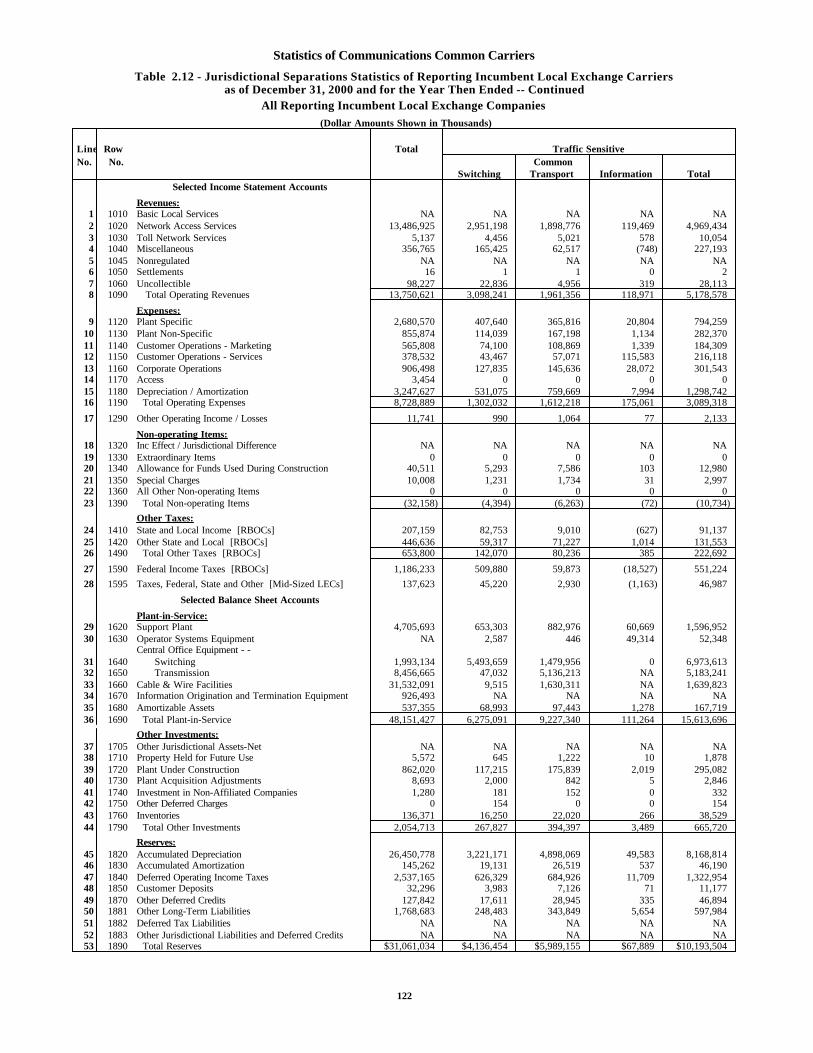
Statistics of Communications Common Carriers
Table 2.12 - Jurisdictional Separations Statistics of Reporting Incumbent Local Exchange Carriersas of December 31, 2000 and for the Year Then Ended -- Continued
All Reporting Incumbent Local Exchange Companies
(Dollar Amounts Shown in Thousands)
Line Row Total Traffic SensitiveNo. No. Common
Switching Transport Information TotalSelected Income Statement Accounts
Revenues:1 1010 Basic Local Services NA NA NA NA NA 2 1020 Network Access Services 13,486,925 2,951,198 1,898,776 119,469 4,969,4343 1030 Toll Network Services 5,137 4,456 5,021 578 10,0544 1040 Miscellaneous 356,765 165,425 62,517 (748) 227,1935 1045 Nonregulated NA NA NA NA NA 6 1050 Settlements 16 1 1 0 27 1060 Uncollectible 98,227 22,836 4,956 319 28,1138 1090 Total Operating Revenues 13,750,621 3,098,241 1,961,356 118,971 5,178,578
Expenses:9 1120 Plant Specific 2,680,570 407,640 365,816 20,804 794,259
10 1130 Plant Non-Specific 855,874 114,039 167,198 1,134 282,37011 1140 Customer Operations - Marketing 565,808 74,100 108,869 1,339 184,30912 1150 Customer Operations - Services 378,532 43,467 57,071 115,583 216,11813 1160 Corporate Operations 906,498 127,835 145,636 28,072 301,54314 1170 Access 3,454 0 0 0 015 1180 Depreciation / Amortization 3,247,627 531,075 759,669 7,994 1,298,74216 1190 Total Operating Expenses 8,728,889 1,302,032 1,612,218 175,061 3,089,318
17 1290 Other Operating Income / Losses 11,741 990 1,064 77 2,133
Non-operating Items:18 1320 Inc Effect / Jurisdictional Difference NA NA NA NA NA 19 1330 Extraordinary Items 0 0 0 0 020 1340 Allowance for Funds Used During Construction 40,511 5,293 7,586 103 12,98021 1350 Special Charges 10,008 1,231 1,734 31 2,99722 1360 All Other Non-operating Items 0 0 0 0 023 1390 Total Non-operating Items (32,158) (4,394) (6,263) (72) (10,734)
Other Taxes:24 1410 State and Local Income [RBOCs] 207,159 82,753 9,010 (627) 91,13725 1420 Other State and Local [RBOCs] 446,636 59,317 71,227 1,014 131,55326 1490 Total Other Taxes [RBOCs] 653,800 142,070 80,236 385 222,692
27 1590 Federal Income Taxes [RBOCs] 1,186,233 509,880 59,873 (18,527) 551,224
28 1595 Taxes, Federal, State and Other [Mid-Sized LECs] 137,623 45,220 2,930 (1,163) 46,987
Selected Balance Sheet Accounts
Plant-in-Service:29 1620 Support Plant 4,705,693 653,303 882,976 60,669 1,596,95230 1630 Operator Systems Equipment NA 2,587 446 49,314 52,348
Central Office Equipment - -31 1640 Switching 1,993,134 5,493,659 1,479,956 0 6,973,61332 1650 Transmission 8,456,665 47,032 5,136,213 NA 5,183,24133 1660 Cable & Wire Facilities 31,532,091 9,515 1,630,311 NA 1,639,82334 1670 Information Origination and Termination Equipment 926,493 NA NA NA NA 35 1680 Amortizable Assets 537,355 68,993 97,443 1,278 167,71936 1690 Total Plant-in-Service 48,151,427 6,275,091 9,227,340 111,264 15,613,696
Other Investments:37 1705 Other Jurisdictional Assets-Net NA NA NA NA NA 38 1710 Property Held for Future Use 5,572 645 1,222 10 1,87839 1720 Plant Under Construction 862,020 117,215 175,839 2,019 295,08240 1730 Plant Acquisition Adjustments 8,693 2,000 842 5 2,84641 1740 Investment in Non-Affiliated Companies 1,280 181 152 0 33242 1750 Other Deferred Charges 0 154 0 0 15443 1760 Inventories 136,371 16,250 22,020 266 38,52944 1790 Total Other Investments 2,054,713 267,827 394,397 3,489 665,720
Reserves:45 1820 Accumulated Depreciation 26,450,778 3,221,171 4,898,069 49,583 8,168,81446 1830 Accumulated Amortization 145,262 19,131 26,519 537 46,19047 1840 Deferred Operating Income Taxes 2,537,165 626,329 684,926 11,709 1,322,95448 1850 Customer Deposits 32,296 3,983 7,126 71 11,17749 1870 Other Deferred Credits 127,842 17,611 28,945 335 46,89450 1881 Other Long-Term Liabilities 1,768,683 248,483 343,849 5,654 597,98451 1882 Deferred Tax Liabilities NA NA NA NA NA 52 1883 Other Jurisdictional Liabilities and Deferred Credits NA NA NA NA NA 53 1890 Total Reserves $31,061,034 $4,136,454 $5,989,155 $67,889 $10,193,504
122
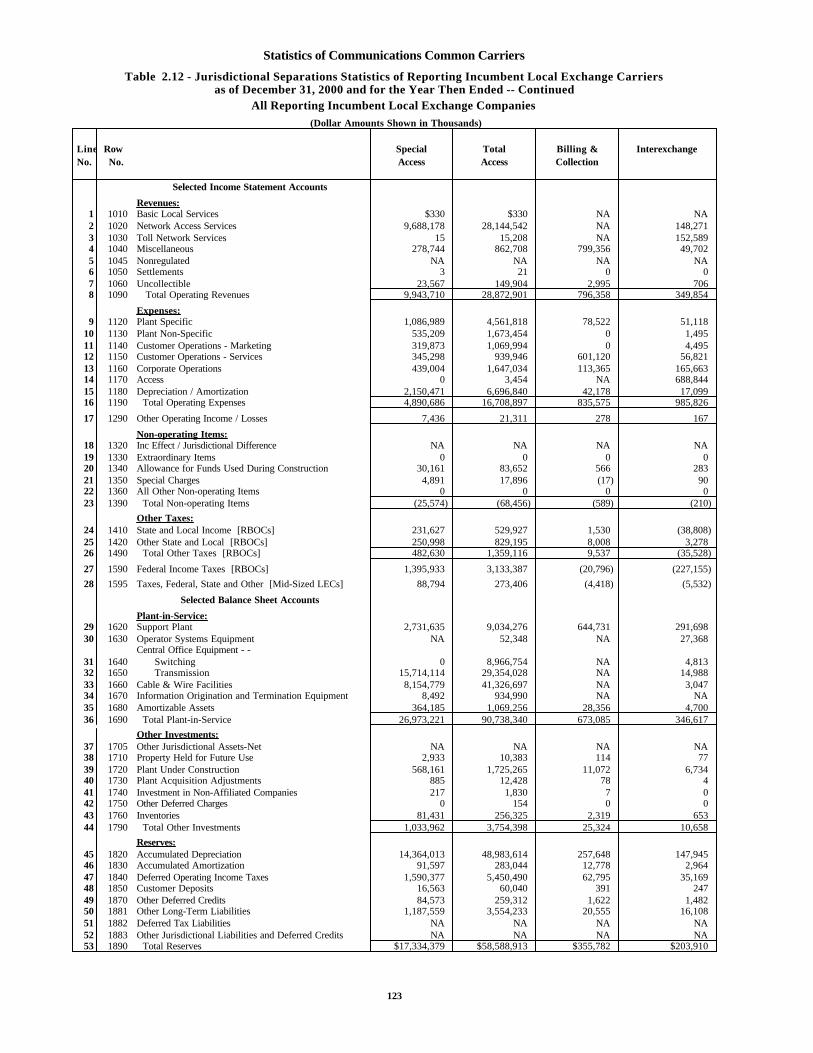
Statistics of Communications Common Carriers
Table 2.12 - Jurisdictional Separations Statistics of Reporting Incumbent Local Exchange Carriersas of December 31, 2000 and for the Year Then Ended -- Continued
All Reporting Incumbent Local Exchange Companies
(Dollar Amounts Shown in Thousands)
Line Row Special Total Billing & InterexchangeNo. No. Access Access Collection
Selected Income Statement Accounts
Revenues:1 1010 Basic Local Services $330 $330 NA NA 2 1020 Network Access Services 9,688,178 28,144,542 NA 148,2713 1030 Toll Network Services 15 15,208 NA 152,5894 1040 Miscellaneous 278,744 862,708 799,356 49,7025 1045 Nonregulated NA NA NA NA 6 1050 Settlements 3 21 0 07 1060 Uncollectible 23,567 149,904 2,995 7068 1090 Total Operating Revenues 9,943,710 28,872,901 796,358 349,854
Expenses:9 1120 Plant Specific 1,086,989 4,561,818 78,522 51,118
10 1130 Plant Non-Specific 535,209 1,673,454 0 1,49511 1140 Customer Operations - Marketing 319,873 1,069,994 0 4,49512 1150 Customer Operations - Services 345,298 939,946 601,120 56,82113 1160 Corporate Operations 439,004 1,647,034 113,365 165,66314 1170 Access 0 3,454 NA 688,84415 1180 Depreciation / Amortization 2,150,471 6,696,840 42,178 17,09916 1190 Total Operating Expenses 4,890,686 16,708,897 835,575 985,826
17 1290 Other Operating Income / Losses 7,436 21,311 278 167
Non-operating Items:18 1320 Inc Effect / Jurisdictional Difference NA NA NA NA 19 1330 Extraordinary Items 0 0 0 020 1340 Allowance for Funds Used During Construction 30,161 83,652 566 28321 1350 Special Charges 4,891 17,896 (17) 9022 1360 All Other Non-operating Items 0 0 0 023 1390 Total Non-operating Items (25,574) (68,456) (589) (210)
Other Taxes:24 1410 State and Local Income [RBOCs] 231,627 529,927 1,530 (38,808)25 1420 Other State and Local [RBOCs] 250,998 829,195 8,008 3,27826 1490 Total Other Taxes [RBOCs] 482,630 1,359,116 9,537 (35,528)
27 1590 Federal Income Taxes [RBOCs] 1,395,933 3,133,387 (20,796) (227,155)
28 1595 Taxes, Federal, State and Other [Mid-Sized LECs] 88,794 273,406 (4,418) (5,532)
Selected Balance Sheet Accounts
Plant-in-Service:29 1620 Support Plant 2,731,635 9,034,276 644,731 291,69830 1630 Operator Systems Equipment NA 52,348 NA 27,368
Central Office Equipment - -31 1640 Switching 0 8,966,754 NA 4,81332 1650 Transmission 15,714,114 29,354,028 NA 14,98833 1660 Cable & Wire Facilities 8,154,779 41,326,697 NA 3,04734 1670 Information Origination and Termination Equipment 8,492 934,990 NA NA 35 1680 Amortizable Assets 364,185 1,069,256 28,356 4,70036 1690 Total Plant-in-Service 26,973,221 90,738,340 673,085 346,617
Other Investments:37 1705 Other Jurisdictional Assets-Net NA NA NA NA 38 1710 Property Held for Future Use 2,933 10,383 114 7739 1720 Plant Under Construction 568,161 1,725,265 11,072 6,73440 1730 Plant Acquisition Adjustments 885 12,428 78 441 1740 Investment in Non-Affiliated Companies 217 1,830 7 042 1750 Other Deferred Charges 0 154 0 043 1760 Inventories 81,431 256,325 2,319 65344 1790 Total Other Investments 1,033,962 3,754,398 25,324 10,658
Reserves:45 1820 Accumulated Depreciation 14,364,013 48,983,614 257,648 147,94546 1830 Accumulated Amortization 91,597 283,044 12,778 2,96447 1840 Deferred Operating Income Taxes 1,590,377 5,450,490 62,795 35,16948 1850 Customer Deposits 16,563 60,040 391 24749 1870 Other Deferred Credits 84,573 259,312 1,622 1,48250 1881 Other Long-Term Liabilities 1,187,559 3,554,233 20,555 16,10851 1882 Deferred Tax Liabilities NA NA NA NA 52 1883 Other Jurisdictional Liabilities and Deferred Credits NA NA NA NA 53 1890 Total Reserves $17,334,379 $58,588,913 $355,782 $203,910
123
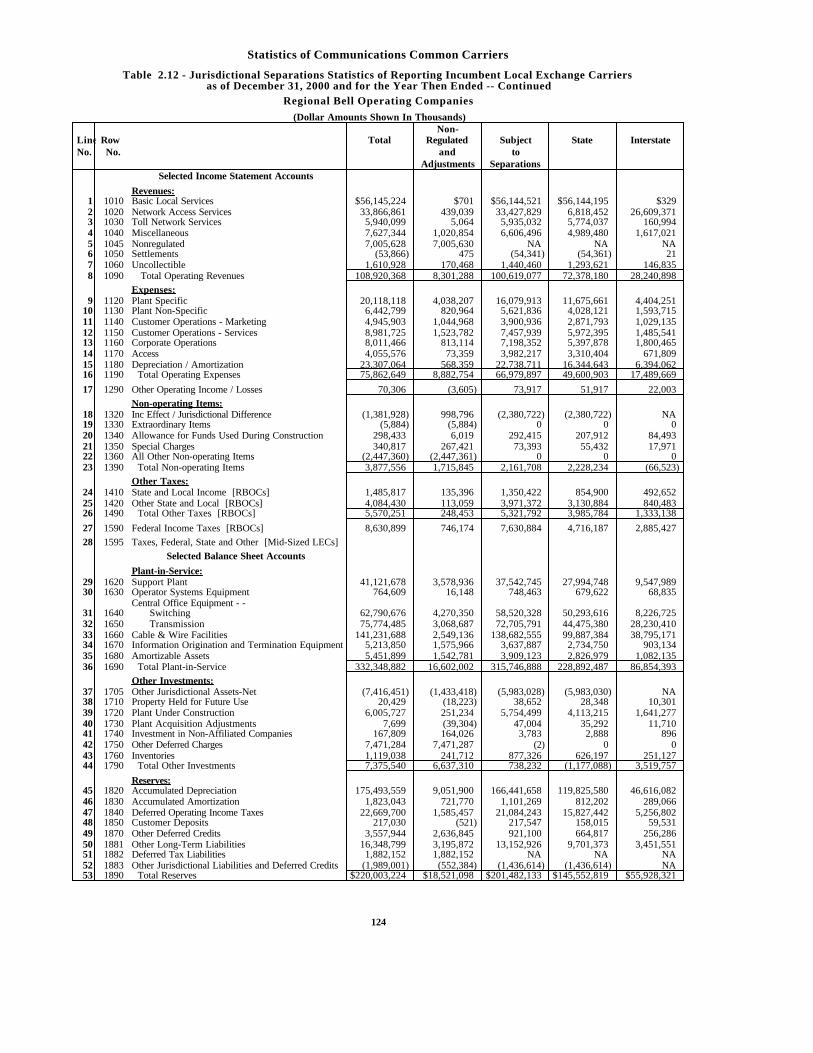
Statistics of Communications Common Carriers
Table 2.12 - Jurisdictional Separations Statistics of Reporting Incumbent Local Exchange Carriersas of December 31, 2000 and for the Year Then Ended -- Continued
Regional Bell Operating Companies
(Dollar Amounts Shown In Thousands)Non-
Line Row Total Regulated Subject State InterstateNo. No. and to
Adjustments SeparationsSelected Income Statement Accounts
Revenues:1 1010 Basic Local Services $56,145,224 $701 $56,144,521 $56,144,195 $3292 1020 Network Access Services 33,866,861 439,039 33,427,829 6,818,452 26,609,3713 1030 Toll Network Services 5,940,099 5,064 5,935,032 5,774,037 160,9944 1040 Miscellaneous 7,627,344 1,020,854 6,606,496 4,989,480 1,617,0215 1045 Nonregulated 7,005,628 7,005,630 NA NA NA 6 1050 Settlements (53,866) 475 (54,341) (54,361) 217 1060 Uncollectible 1,610,928 170,468 1,440,460 1,293,621 146,8358 1090 Total Operating Revenues 108,920,368 8,301,288 100,619,077 72,378,180 28,240,898
Expenses:9 1120 Plant Specific 20,118,118 4,038,207 16,079,913 11,675,661 4,404,251
10 1130 Plant Non-Specific 6,442,799 820,964 5,621,836 4,028,121 1,593,71511 1140 Customer Operations - Marketing 4,945,903 1,044,968 3,900,936 2,871,793 1,029,13512 1150 Customer Operations - Services 8,981,725 1,523,782 7,457,939 5,972,395 1,485,54113 1160 Corporate Operations 8,011,466 813,114 7,198,352 5,397,878 1,800,46514 1170 Access 4,055,576 73,359 3,982,217 3,310,404 671,80915 1180 Depreciation / Amortization 23,307,064 568,359 22,738,711 16,344,643 6,394,06216 1190 Total Operating Expenses 75,862,649 8,882,754 66,979,897 49,600,903 17,489,669
17 1290 Other Operating Income / Losses 70,306 (3,605) 73,917 51,917 22,003
Non-operating Items:18 1320 Inc Effect / Jurisdictional Difference (1,381,928) 998,796 (2,380,722) (2,380,722) NA 19 1330 Extraordinary Items (5,884) (5,884) 0 0 020 1340 Allowance for Funds Used During Construction 298,433 6,019 292,415 207,912 84,49321 1350 Special Charges 340,817 267,421 73,393 55,432 17,97122 1360 All Other Non-operating Items (2,447,360) (2,447,361) 0 0 023 1390 Total Non-operating Items 3,877,556 1,715,845 2,161,708 2,228,234 (66,523)
Other Taxes:24 1410 State and Local Income [RBOCs] 1,485,817 135,396 1,350,422 854,900 492,65225 1420 Other State and Local [RBOCs] 4,084,430 113,059 3,971,372 3,130,884 840,48326 1490 Total Other Taxes [RBOCs] 5,570,251 248,453 5,321,792 3,985,784 1,333,138
27 1590 Federal Income Taxes [RBOCs] 8,630,899 746,174 7,630,884 4,716,187 2,885,427
28 1595 Taxes, Federal, State and Other [Mid-Sized LECs]
Selected Balance Sheet Accounts
Plant-in-Service:29 1620 Support Plant 41,121,678 3,578,936 37,542,745 27,994,748 9,547,98930 1630 Operator Systems Equipment 764,609 16,148 748,463 679,622 68,835
Central Office Equipment - -31 1640 Switching 62,790,676 4,270,350 58,520,328 50,293,616 8,226,72532 1650 Transmission 75,774,485 3,068,687 72,705,791 44,475,380 28,230,41033 1660 Cable & Wire Facilities 141,231,688 2,549,136 138,682,555 99,887,384 38,795,17134 1670 Information Origination and Termination Equipment 5,213,850 1,575,966 3,637,887 2,734,750 903,13435 1680 Amortizable Assets 5,451,899 1,542,781 3,909,123 2,826,979 1,082,13536 1690 Total Plant-in-Service 332,348,882 16,602,002 315,746,888 228,892,487 86,854,393
Other Investments:37 1705 Other Jurisdictional Assets-Net (7,416,451) (1,433,418) (5,983,028) (5,983,030) NA 38 1710 Property Held for Future Use 20,429 (18,223) 38,652 28,348 10,30139 1720 Plant Under Construction 6,005,727 251,234 5,754,499 4,113,215 1,641,27740 1730 Plant Acquisition Adjustments 7,699 (39,304) 47,004 35,292 11,71041 1740 Investment in Non-Affiliated Companies 167,809 164,026 3,783 2,888 89642 1750 Other Deferred Charges 7,471,284 7,471,287 (2) 0 043 1760 Inventories 1,119,038 241,712 877,326 626,197 251,12744 1790 Total Other Investments 7,375,540 6,637,310 738,232 (1,177,088) 3,519,757
Reserves:45 1820 Accumulated Depreciation 175,493,559 9,051,900 166,441,658 119,825,580 46,616,08246 1830 Accumulated Amortization 1,823,043 721,770 1,101,269 812,202 289,06647 1840 Deferred Operating Income Taxes 22,669,700 1,585,457 21,084,243 15,827,442 5,256,80248 1850 Customer Deposits 217,030 (521) 217,547 158,015 59,53149 1870 Other Deferred Credits 3,557,944 2,636,845 921,100 664,817 256,28650 1881 Other Long-Term Liabilities 16,348,799 3,195,872 13,152,926 9,701,373 3,451,55151 1882 Deferred Tax Liabilities 1,882,152 1,882,152 NA NA NA 52 1883 Other Jurisdictional Liabilities and Deferred Credits (1,989,001) (552,384) (1,436,614) (1,436,614) NA 53 1890 Total Reserves $220,003,224 $18,521,098 $201,482,133 $145,552,819 $55,928,321
124
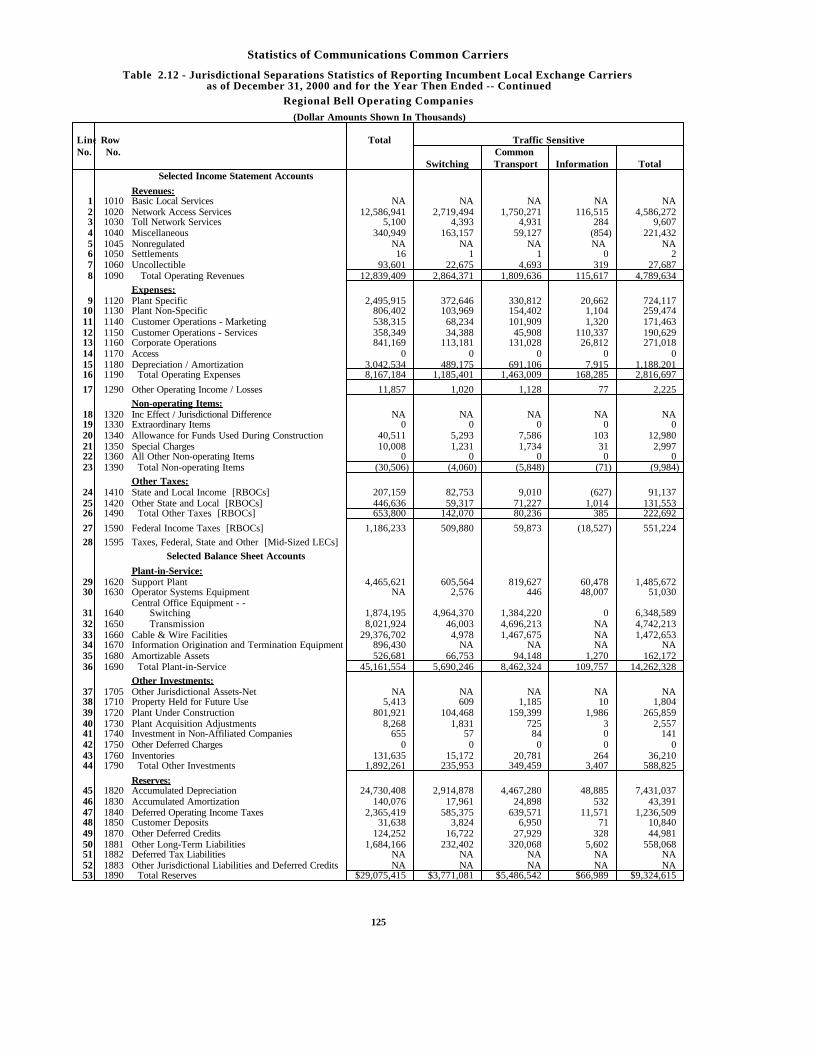
Statistics of Communications Common Carriers
Table 2.12 - Jurisdictional Separations Statistics of Reporting Incumbent Local Exchange Carriersas of December 31, 2000 and for the Year Then Ended -- Continued
Regional Bell Operating Companies
(Dollar Amounts Shown In Thousands)
Line Row Total Traffic SensitiveNo. No. Common
Switching Transport Information TotalSelected Income Statement Accounts
Revenues:1 1010 Basic Local Services NA NA NA NA NA 2 1020 Network Access Services 12,586,941 2,719,494 1,750,271 116,515 4,586,2723 1030 Toll Network Services 5,100 4,393 4,931 284 9,6074 1040 Miscellaneous 340,949 163,157 59,127 (854) 221,4325 1045 Nonregulated NA NA NA NA NA 6 1050 Settlements 16 1 1 0 27 1060 Uncollectible 93,601 22,675 4,693 319 27,6878 1090 Total Operating Revenues 12,839,409 2,864,371 1,809,636 115,617 4,789,634
Expenses:9 1120 Plant Specific 2,495,915 372,646 330,812 20,662 724,117
10 1130 Plant Non-Specific 806,402 103,969 154,402 1,104 259,47411 1140 Customer Operations - Marketing 538,315 68,234 101,909 1,320 171,46312 1150 Customer Operations - Services 358,349 34,388 45,908 110,337 190,62913 1160 Corporate Operations 841,169 113,181 131,028 26,812 271,01814 1170 Access 0 0 0 0 015 1180 Depreciation / Amortization 3,042,534 489,175 691,106 7,915 1,188,20116 1190 Total Operating Expenses 8,167,184 1,185,401 1,463,009 168,285 2,816,697
17 1290 Other Operating Income / Losses 11,857 1,020 1,128 77 2,225
Non-operating Items:18 1320 Inc Effect / Jurisdictional Difference NA NA NA NA NA 19 1330 Extraordinary Items 0 0 0 0 020 1340 Allowance for Funds Used During Construction 40,511 5,293 7,586 103 12,98021 1350 Special Charges 10,008 1,231 1,734 31 2,99722 1360 All Other Non-operating Items 0 0 0 0 023 1390 Total Non-operating Items (30,506) (4,060) (5,848) (71) (9,984)
Other Taxes:24 1410 State and Local Income [RBOCs] 207,159 82,753 9,010 (627) 91,13725 1420 Other State and Local [RBOCs] 446,636 59,317 71,227 1,014 131,55326 1490 Total Other Taxes [RBOCs] 653,800 142,070 80,236 385 222,692
27 1590 Federal Income Taxes [RBOCs] 1,186,233 509,880 59,873 (18,527) 551,224
28 1595 Taxes, Federal, State and Other [Mid-Sized LECs]
Selected Balance Sheet Accounts
Plant-in-Service:29 1620 Support Plant 4,465,621 605,564 819,627 60,478 1,485,67230 1630 Operator Systems Equipment NA 2,576 446 48,007 51,030
Central Office Equipment - -31 1640 Switching 1,874,195 4,964,370 1,384,220 0 6,348,58932 1650 Transmission 8,021,924 46,003 4,696,213 NA 4,742,21333 1660 Cable & Wire Facilities 29,376,702 4,978 1,467,675 NA 1,472,65334 1670 Information Origination and Termination Equipment 896,430 NA NA NA NA 35 1680 Amortizable Assets 526,681 66,753 94,148 1,270 162,17236 1690 Total Plant-in-Service 45,161,554 5,690,246 8,462,324 109,757 14,262,328
Other Investments:37 1705 Other Jurisdictional Assets-Net NA NA NA NA NA 38 1710 Property Held for Future Use 5,413 609 1,185 10 1,80439 1720 Plant Under Construction 801,921 104,468 159,399 1,986 265,85940 1730 Plant Acquisition Adjustments 8,268 1,831 725 3 2,55741 1740 Investment in Non-Affiliated Companies 655 57 84 0 14142 1750 Other Deferred Charges 0 0 0 0 043 1760 Inventories 131,635 15,172 20,781 264 36,21044 1790 Total Other Investments 1,892,261 235,953 349,459 3,407 588,825
Reserves:45 1820 Accumulated Depreciation 24,730,408 2,914,878 4,467,280 48,885 7,431,03746 1830 Accumulated Amortization 140,076 17,961 24,898 532 43,39147 1840 Deferred Operating Income Taxes 2,365,419 585,375 639,571 11,571 1,236,50948 1850 Customer Deposits 31,638 3,824 6,950 71 10,84049 1870 Other Deferred Credits 124,252 16,722 27,929 328 44,98150 1881 Other Long-Term Liabilities 1,684,166 232,402 320,068 5,602 558,06851 1882 Deferred Tax Liabilities NA NA NA NA NA 52 1883 Other Jurisdictional Liabilities and Deferred Credits NA NA NA NA NA 53 1890 Total Reserves $29,075,415 $3,771,081 $5,486,542 $66,989 $9,324,615
125
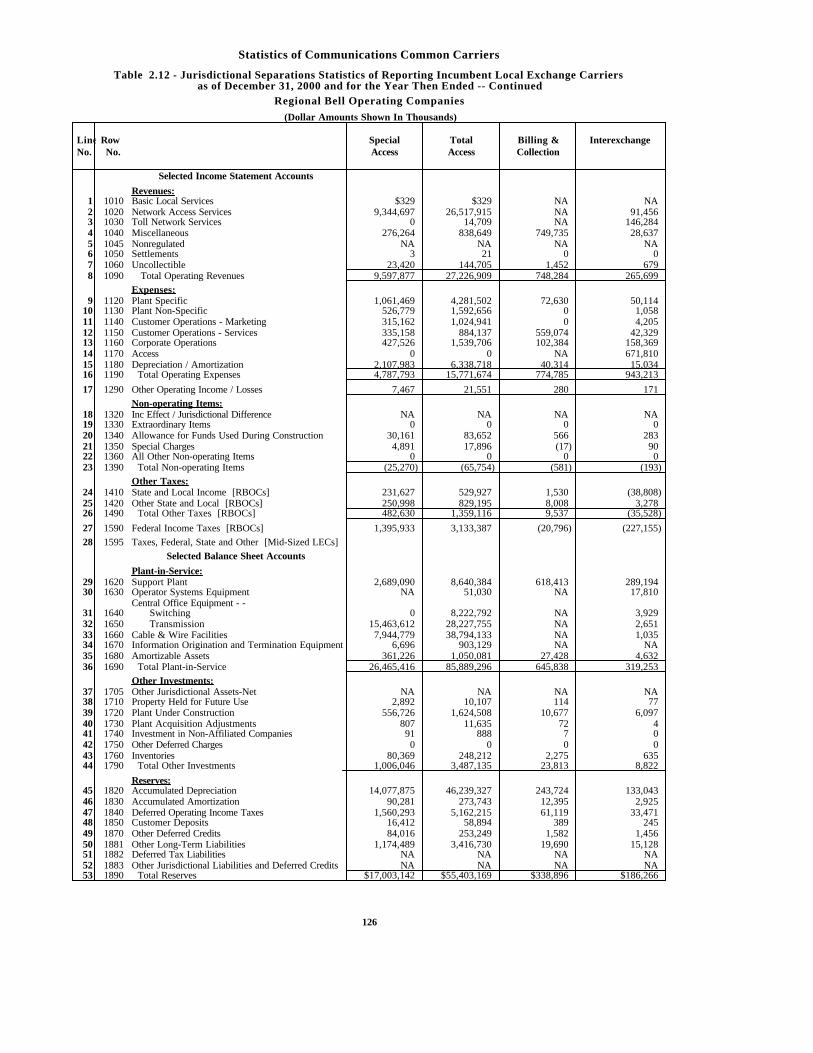
Statistics of Communications Common Carriers
Table 2.12 - Jurisdictional Separations Statistics of Reporting Incumbent Local Exchange Carriersas of December 31, 2000 and for the Year Then Ended -- Continued
Regional Bell Operating Companies
(Dollar Amounts Shown In Thousands)
Line Row Special Total Billing & InterexchangeNo. No. Access Access Collection
Selected Income Statement Accounts
Revenues:1 1010 Basic Local Services $329 $329 NA NA 2 1020 Network Access Services 9,344,697 26,517,915 NA 91,4563 1030 Toll Network Services 0 14,709 NA 146,2844 1040 Miscellaneous 276,264 838,649 749,735 28,6375 1045 Nonregulated NA NA NA NA 6 1050 Settlements 3 21 0 07 1060 Uncollectible 23,420 144,705 1,452 6798 1090 Total Operating Revenues 9,597,877 27,226,909 748,284 265,699
Expenses:9 1120 Plant Specific 1,061,469 4,281,502 72,630 50,114
10 1130 Plant Non-Specific 526,779 1,592,656 0 1,05811 1140 Customer Operations - Marketing 315,162 1,024,941 0 4,20512 1150 Customer Operations - Services 335,158 884,137 559,074 42,32913 1160 Corporate Operations 427,526 1,539,706 102,384 158,36914 1170 Access 0 0 NA 671,81015 1180 Depreciation / Amortization 2,107,983 6,338,718 40,314 15,03416 1190 Total Operating Expenses 4,787,793 15,771,674 774,785 943,213
17 1290 Other Operating Income / Losses 7,467 21,551 280 171
Non-operating Items:18 1320 Inc Effect / Jurisdictional Difference NA NA NA NA 19 1330 Extraordinary Items 0 0 0 020 1340 Allowance for Funds Used During Construction 30,161 83,652 566 28321 1350 Special Charges 4,891 17,896 (17) 9022 1360 All Other Non-operating Items 0 0 0 023 1390 Total Non-operating Items (25,270) (65,754) (581) (193)
Other Taxes:24 1410 State and Local Income [RBOCs] 231,627 529,927 1,530 (38,808)25 1420 Other State and Local [RBOCs] 250,998 829,195 8,008 3,27826 1490 Total Other Taxes [RBOCs] 482,630 1,359,116 9,537 (35,528)
27 1590 Federal Income Taxes [RBOCs] 1,395,933 3,133,387 (20,796) (227,155)
28 1595 Taxes, Federal, State and Other [Mid-Sized LECs]
Selected Balance Sheet Accounts
Plant-in-Service:29 1620 Support Plant 2,689,090 8,640,384 618,413 289,19430 1630 Operator Systems Equipment NA 51,030 NA 17,810
Central Office Equipment - -31 1640 Switching 0 8,222,792 NA 3,92932 1650 Transmission 15,463,612 28,227,755 NA 2,65133 1660 Cable & Wire Facilities 7,944,779 38,794,133 NA 1,03534 1670 Information Origination and Termination Equipment 6,696 903,129 NA NA 35 1680 Amortizable Assets 361,226 1,050,081 27,428 4,63236 1690 Total Plant-in-Service 26,465,416 85,889,296 645,838 319,253
Other Investments:37 1705 Other Jurisdictional Assets-Net NA NA NA NA 38 1710 Property Held for Future Use 2,892 10,107 114 7739 1720 Plant Under Construction 556,726 1,624,508 10,677 6,09740 1730 Plant Acquisition Adjustments 807 11,635 72 441 1740 Investment in Non-Affiliated Companies 91 888 7 042 1750 Other Deferred Charges 0 0 0 043 1760 Inventories 80,369 248,212 2,275 63544 1790 Total Other Investments 1,006,046 3,487,135 23,813 8,822
Reserves:45 1820 Accumulated Depreciation 14,077,875 46,239,327 243,724 133,04346 1830 Accumulated Amortization 90,281 273,743 12,395 2,92547 1840 Deferred Operating Income Taxes 1,560,293 5,162,215 61,119 33,47148 1850 Customer Deposits 16,412 58,894 389 24549 1870 Other Deferred Credits 84,016 253,249 1,582 1,45650 1881 Other Long-Term Liabilities 1,174,489 3,416,730 19,690 15,12851 1882 Deferred Tax Liabilities NA NA NA NA 52 1883 Other Jurisdictional Liabilities and Deferred Credits NA NA NA NA 53 1890 Total Reserves $17,003,142 $55,403,169 $338,896 $186,266
126
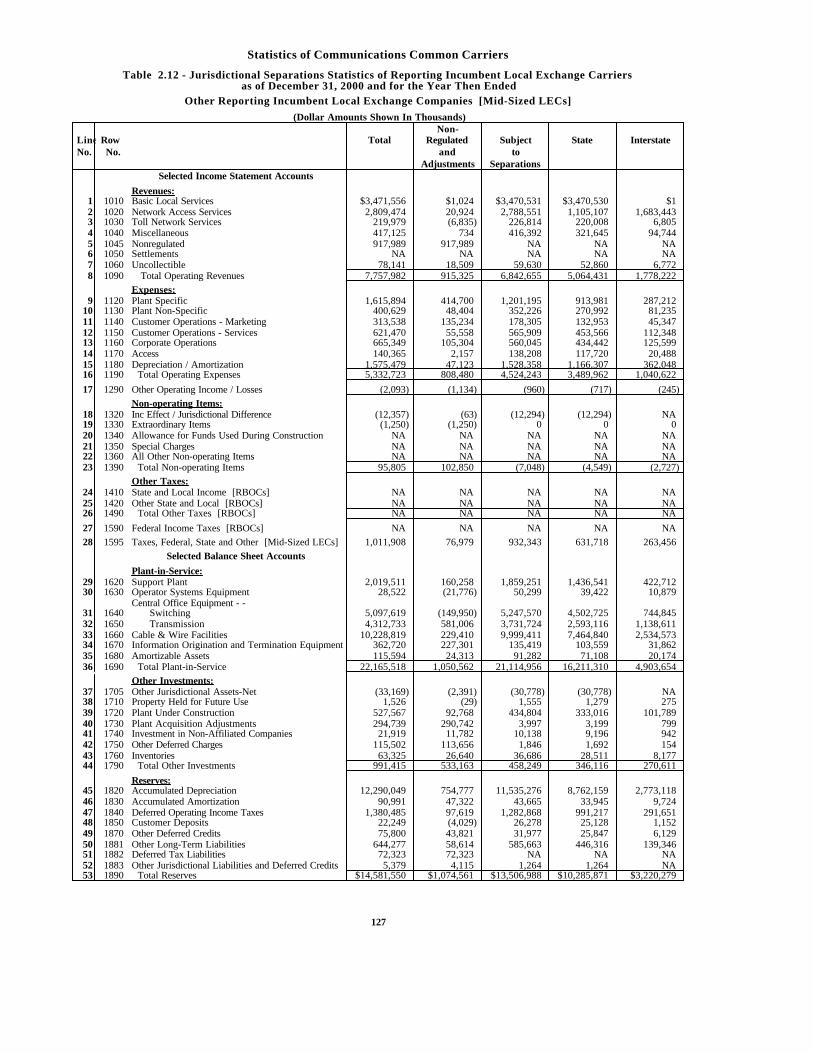
Statistics of Communications Common Carriers
Table 2.12 - Jurisdictional Separations Statistics of Reporting Incumbent Local Exchange Carriersas of December 31, 2000 and for the Year Then Ended
Other Reporting Incumbent Local Exchange Companies [Mid-Sized LECs]
(Dollar Amounts Shown In Thousands)Non-
Line Row Total Regulated Subject State InterstateNo. No. and to
Adjustments SeparationsSelected Income Statement Accounts
Revenues:1 1010 Basic Local Services $3,471,556 $1,024 $3,470,531 $3,470,530 $12 1020 Network Access Services 2,809,474 20,924 2,788,551 1,105,107 1,683,4433 1030 Toll Network Services 219,979 (6,835) 226,814 220,008 6,8054 1040 Miscellaneous 417,125 734 416,392 321,645 94,7445 1045 Nonregulated 917,989 917,989 NA NA NA 6 1050 Settlements NA NA NA NA NA 7 1060 Uncollectible 78,141 18,509 59,630 52,860 6,7728 1090 Total Operating Revenues 7,757,982 915,325 6,842,655 5,064,431 1,778,222
Expenses:9 1120 Plant Specific 1,615,894 414,700 1,201,195 913,981 287,212
10 1130 Plant Non-Specific 400,629 48,404 352,226 270,992 81,23511 1140 Customer Operations - Marketing 313,538 135,234 178,305 132,953 45,34712 1150 Customer Operations - Services 621,470 55,558 565,909 453,566 112,34813 1160 Corporate Operations 665,349 105,304 560,045 434,442 125,59914 1170 Access 140,365 2,157 138,208 117,720 20,48815 1180 Depreciation / Amortization 1,575,479 47,123 1,528,358 1,166,307 362,04816 1190 Total Operating Expenses 5,332,723 808,480 4,524,243 3,489,962 1,040,622
17 1290 Other Operating Income / Losses (2,093) (1,134) (960) (717) (245)
Non-operating Items:18 1320 Inc Effect / Jurisdictional Difference (12,357) (63) (12,294) (12,294) NA 19 1330 Extraordinary Items (1,250) (1,250) 0 0 020 1340 Allowance for Funds Used During Construction NA NA NA NA NA 21 1350 Special Charges NA NA NA NA NA 22 1360 All Other Non-operating Items NA NA NA NA NA 23 1390 Total Non-operating Items 95,805 102,850 (7,048) (4,549) (2,727)
Other Taxes:24 1410 State and Local Income [RBOCs] NA NA NA NA NA 25 1420 Other State and Local [RBOCs] NA NA NA NA NA 26 1490 Total Other Taxes [RBOCs] NA NA NA NA NA
27 1590 Federal Income Taxes [RBOCs] NA NA NA NA NA
28 1595 Taxes, Federal, State and Other [Mid-Sized LECs] 1,011,908 76,979 932,343 631,718 263,456
Selected Balance Sheet Accounts
Plant-in-Service:29 1620 Support Plant 2,019,511 160,258 1,859,251 1,436,541 422,71230 1630 Operator Systems Equipment 28,522 (21,776) 50,299 39,422 10,879
Central Office Equipment - -31 1640 Switching 5,097,619 (149,950) 5,247,570 4,502,725 744,84532 1650 Transmission 4,312,733 581,006 3,731,724 2,593,116 1,138,61133 1660 Cable & Wire Facilities 10,228,819 229,410 9,999,411 7,464,840 2,534,57334 1670 Information Origination and Termination Equipment 362,720 227,301 135,419 103,559 31,86235 1680 Amortizable Assets 115,594 24,313 91,282 71,108 20,17436 1690 Total Plant-in-Service 22,165,518 1,050,562 21,114,956 16,211,310 4,903,654
Other Investments:37 1705 Other Jurisdictional Assets-Net (33,169) (2,391) (30,778) (30,778) NA 38 1710 Property Held for Future Use 1,526 (29) 1,555 1,279 27539 1720 Plant Under Construction 527,567 92,768 434,804 333,016 101,78940 1730 Plant Acquisition Adjustments 294,739 290,742 3,997 3,199 79941 1740 Investment in Non-Affiliated Companies 21,919 11,782 10,138 9,196 94242 1750 Other Deferred Charges 115,502 113,656 1,846 1,692 15443 1760 Inventories 63,325 26,640 36,686 28,511 8,17744 1790 Total Other Investments 991,415 533,163 458,249 346,116 270,611
Reserves:45 1820 Accumulated Depreciation 12,290,049 754,777 11,535,276 8,762,159 2,773,11846 1830 Accumulated Amortization 90,991 47,322 43,665 33,945 9,72447 1840 Deferred Operating Income Taxes 1,380,485 97,619 1,282,868 991,217 291,65148 1850 Customer Deposits 22,249 (4,029) 26,278 25,128 1,15249 1870 Other Deferred Credits 75,800 43,821 31,977 25,847 6,12950 1881 Other Long-Term Liabilities 644,277 58,614 585,663 446,316 139,34651 1882 Deferred Tax Liabilities 72,323 72,323 NA NA NA 52 1883 Other Jurisdictional Liabilities and Deferred Credits 5,379 4,115 1,264 1,264 NA 53 1890 Total Reserves $14,581,550 $1,074,561 $13,506,988 $10,285,871 $3,220,279
127
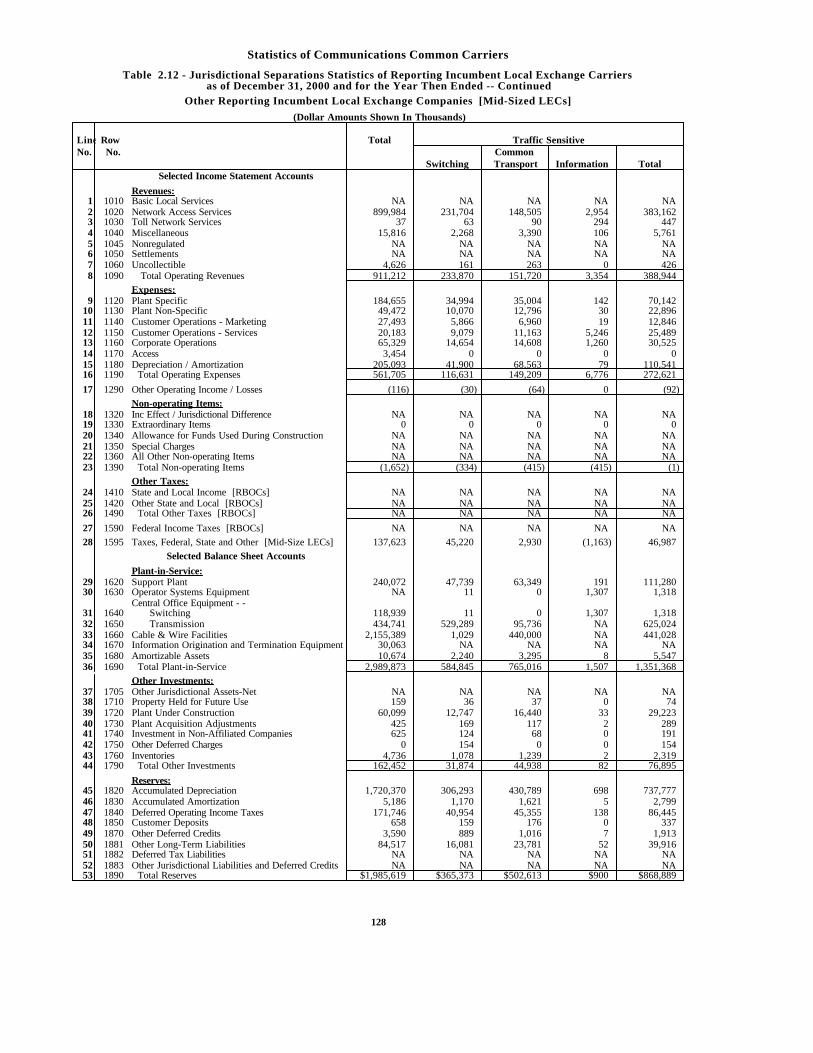
Statistics of Communications Common Carriers
Table 2.12 - Jurisdictional Separations Statistics of Reporting Incumbent Local Exchange Carriersas of December 31, 2000 and for the Year Then Ended -- Continued
Other Reporting Incumbent Local Exchange Companies [Mid-Sized LECs]
(Dollar Amounts Shown In Thousands)
Line Row Total Traffic SensitiveNo. No. Common
Switching Transport Information TotalSelected Income Statement Accounts
Revenues:1 1010 Basic Local Services NA NA NA NA NA 2 1020 Network Access Services 899,984 231,704 148,505 2,954 383,1623 1030 Toll Network Services 37 63 90 294 4474 1040 Miscellaneous 15,816 2,268 3,390 106 5,7615 1045 Nonregulated NA NA NA NA NA 6 1050 Settlements NA NA NA NA NA 7 1060 Uncollectible 4,626 161 263 0 4268 1090 Total Operating Revenues 911,212 233,870 151,720 3,354 388,944
Expenses:9 1120 Plant Specific 184,655 34,994 35,004 142 70,142
10 1130 Plant Non-Specific 49,472 10,070 12,796 30 22,89611 1140 Customer Operations - Marketing 27,493 5,866 6,960 19 12,84612 1150 Customer Operations - Services 20,183 9,079 11,163 5,246 25,48913 1160 Corporate Operations 65,329 14,654 14,608 1,260 30,52514 1170 Access 3,454 0 0 0 015 1180 Depreciation / Amortization 205,093 41,900 68,563 79 110,54116 1190 Total Operating Expenses 561,705 116,631 149,209 6,776 272,621
17 1290 Other Operating Income / Losses (116) (30) (64) 0 (92)
Non-operating Items:18 1320 Inc Effect / Jurisdictional Difference NA NA NA NA NA 19 1330 Extraordinary Items 0 0 0 0 020 1340 Allowance for Funds Used During Construction NA NA NA NA NA 21 1350 Special Charges NA NA NA NA NA 22 1360 All Other Non-operating Items NA NA NA NA NA 23 1390 Total Non-operating Items (1,652) (334) (415) (415) (1)
Other Taxes:24 1410 State and Local Income [RBOCs] NA NA NA NA NA 25 1420 Other State and Local [RBOCs] NA NA NA NA NA 26 1490 Total Other Taxes [RBOCs] NA NA NA NA NA
27 1590 Federal Income Taxes [RBOCs] NA NA NA NA NA
28 1595 Taxes, Federal, State and Other [Mid-Size LECs] 137,623 45,220 2,930 (1,163) 46,987
Selected Balance Sheet Accounts
Plant-in-Service:29 1620 Support Plant 240,072 47,739 63,349 191 111,28030 1630 Operator Systems Equipment NA 11 0 1,307 1,318
Central Office Equipment - -31 1640 Switching 118,939 11 0 1,307 1,31832 1650 Transmission 434,741 529,289 95,736 NA 625,02433 1660 Cable & Wire Facilities 2,155,389 1,029 440,000 NA 441,02834 1670 Information Origination and Termination Equipment 30,063 NA NA NA NA 35 1680 Amortizable Assets 10,674 2,240 3,295 8 5,54736 1690 Total Plant-in-Service 2,989,873 584,845 765,016 1,507 1,351,368
Other Investments:37 1705 Other Jurisdictional Assets-Net NA NA NA NA NA 38 1710 Property Held for Future Use 159 36 37 0 7439 1720 Plant Under Construction 60,099 12,747 16,440 33 29,22340 1730 Plant Acquisition Adjustments 425 169 117 2 28941 1740 Investment in Non-Affiliated Companies 625 124 68 0 19142 1750 Other Deferred Charges 0 154 0 0 15443 1760 Inventories 4,736 1,078 1,239 2 2,31944 1790 Total Other Investments 162,452 31,874 44,938 82 76,895
Reserves:45 1820 Accumulated Depreciation 1,720,370 306,293 430,789 698 737,77746 1830 Accumulated Amortization 5,186 1,170 1,621 5 2,79947 1840 Deferred Operating Income Taxes 171,746 40,954 45,355 138 86,44548 1850 Customer Deposits 658 159 176 0 33749 1870 Other Deferred Credits 3,590 889 1,016 7 1,91350 1881 Other Long-Term Liabilities 84,517 16,081 23,781 52 39,91651 1882 Deferred Tax Liabilities NA NA NA NA NA 52 1883 Other Jurisdictional Liabilities and Deferred Credits NA NA NA NA NA 53 1890 Total Reserves $1,985,619 $365,373 $502,613 $900 $868,889
128
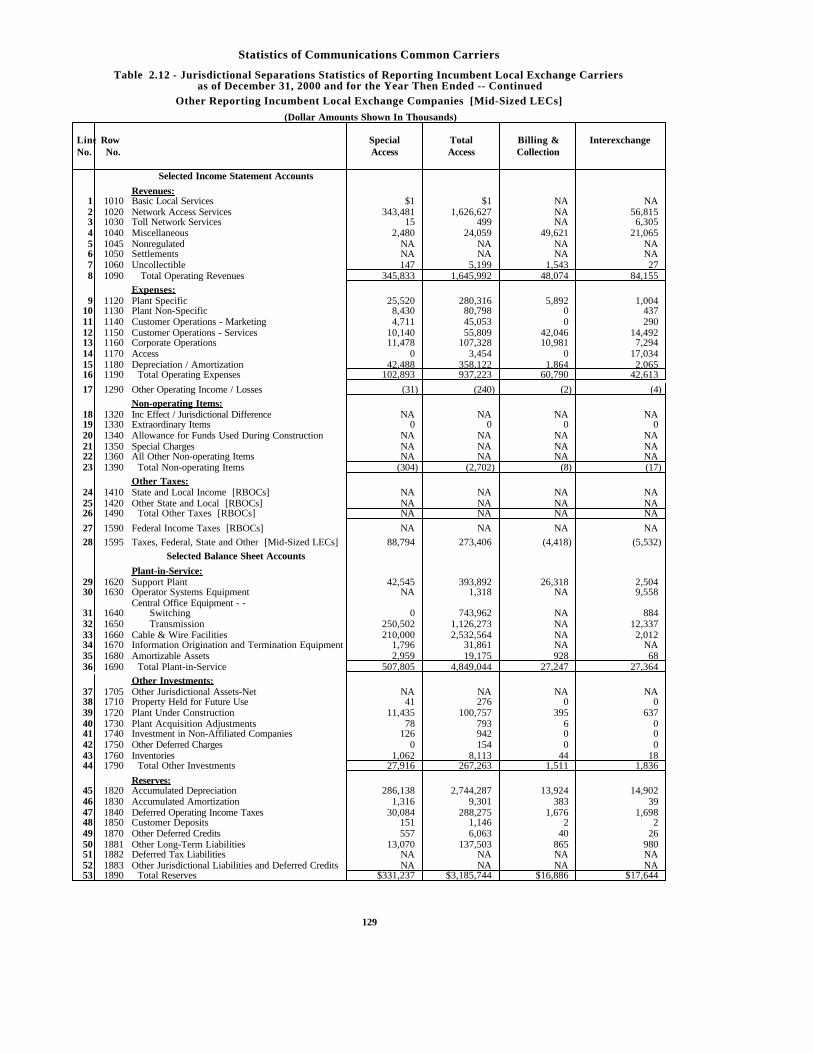
Statistics of Communications Common Carriers
Table 2.12 - Jurisdictional Separations Statistics of Reporting Incumbent Local Exchange Carriersas of December 31, 2000 and for the Year Then Ended -- Continued
Other Reporting Incumbent Local Exchange Companies [Mid-Sized LECs]
(Dollar Amounts Shown In Thousands)
Line Row Special Total Billing & InterexchangeNo. No. Access Access Collection
Selected Income Statement Accounts
Revenues:1 1010 Basic Local Services $1 $1 NA NA 2 1020 Network Access Services 343,481 1,626,627 NA 56,8153 1030 Toll Network Services 15 499 NA 6,3054 1040 Miscellaneous 2,480 24,059 49,621 21,0655 1045 Nonregulated NA NA NA NA 6 1050 Settlements NA NA NA NA 7 1060 Uncollectible 147 5,199 1,543 278 1090 Total Operating Revenues 345,833 1,645,992 48,074 84,155
Expenses:9 1120 Plant Specific 25,520 280,316 5,892 1,004
10 1130 Plant Non-Specific 8,430 80,798 0 43711 1140 Customer Operations - Marketing 4,711 45,053 0 29012 1150 Customer Operations - Services 10,140 55,809 42,046 14,49213 1160 Corporate Operations 11,478 107,328 10,981 7,29414 1170 Access 0 3,454 0 17,03415 1180 Depreciation / Amortization 42,488 358,122 1,864 2,06516 1190 Total Operating Expenses 102,893 937,223 60,790 42,613
17 1290 Other Operating Income / Losses (31) (240) (2) (4)
Non-operating Items:18 1320 Inc Effect / Jurisdictional Difference NA NA NA NA 19 1330 Extraordinary Items 0 0 0 020 1340 Allowance for Funds Used During Construction NA NA NA NA 21 1350 Special Charges NA NA NA NA 22 1360 All Other Non-operating Items NA NA NA NA 23 1390 Total Non-operating Items (304) (2,702) (8) (17)
Other Taxes:24 1410 State and Local Income [RBOCs] NA NA NA NA 25 1420 Other State and Local [RBOCs] NA NA NA NA 26 1490 Total Other Taxes [RBOCs] NA NA NA NA
27 1590 Federal Income Taxes [RBOCs] NA NA NA NA
28 1595 Taxes, Federal, State and Other [Mid-Sized LECs] 88,794 273,406 (4,418) (5,532)
Selected Balance Sheet Accounts
Plant-in-Service:29 1620 Support Plant 42,545 393,892 26,318 2,50430 1630 Operator Systems Equipment NA 1,318 NA 9,558
Central Office Equipment - -31 1640 Switching 0 743,962 NA 88432 1650 Transmission 250,502 1,126,273 NA 12,33733 1660 Cable & Wire Facilities 210,000 2,532,564 NA 2,01234 1670 Information Origination and Termination Equipment 1,796 31,861 NA NA 35 1680 Amortizable Assets 2,959 19,175 928 6836 1690 Total Plant-in-Service 507,805 4,849,044 27,247 27,364
Other Investments:37 1705 Other Jurisdictional Assets-Net NA NA NA NA 38 1710 Property Held for Future Use 41 276 0 039 1720 Plant Under Construction 11,435 100,757 395 63740 1730 Plant Acquisition Adjustments 78 793 6 041 1740 Investment in Non-Affiliated Companies 126 942 0 042 1750 Other Deferred Charges 0 154 0 043 1760 Inventories 1,062 8,113 44 1844 1790 Total Other Investments 27,916 267,263 1,511 1,836
Reserves:45 1820 Accumulated Depreciation 286,138 2,744,287 13,924 14,90246 1830 Accumulated Amortization 1,316 9,301 383 3947 1840 Deferred Operating Income Taxes 30,084 288,275 1,676 1,69848 1850 Customer Deposits 151 1,146 2 249 1870 Other Deferred Credits 557 6,063 40 2650 1881 Other Long-Term Liabilities 13,070 137,503 865 98051 1882 Deferred Tax Liabilities NA NA NA NA 52 1883 Other Jurisdictional Liabilities and Deferred Credits NA NA NA NA 53 1890 Total Reserves $331,237 $3,185,744 $16,886 $17,644
129
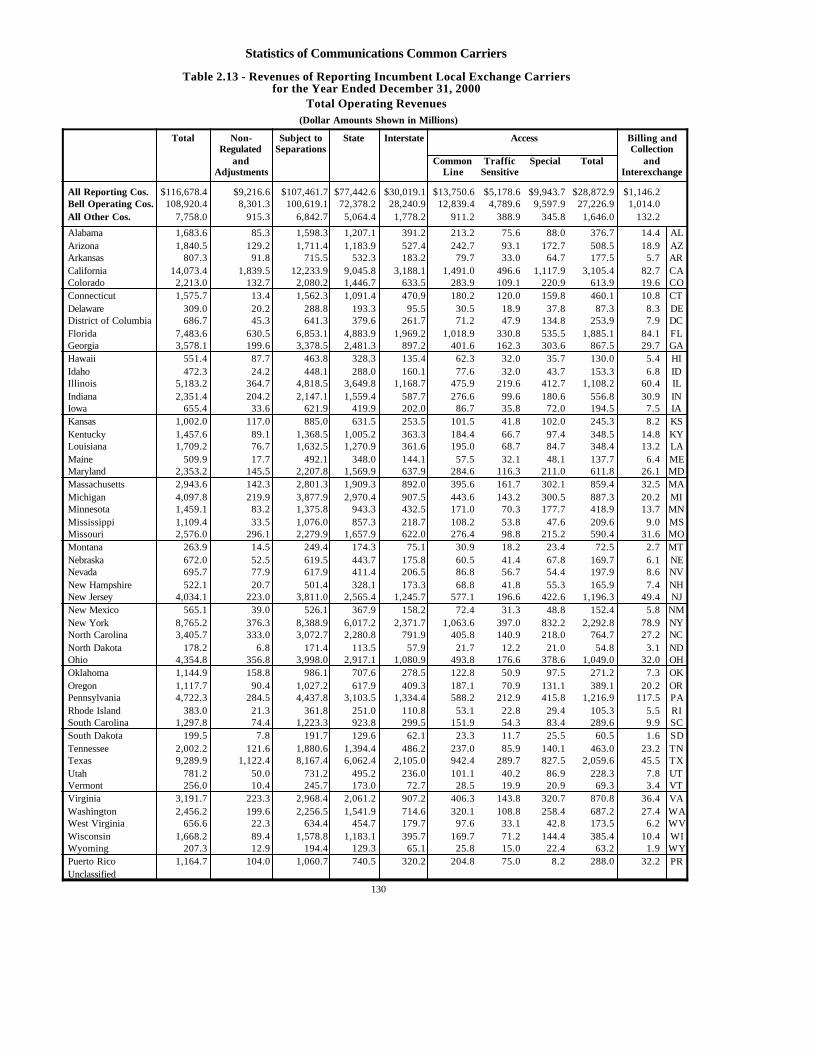
Statistics of Communications Common Carriers
Table 2.13 - Revenues of Reporting Incumbent Local Exchange Carriersfor the Year Ended December 31, 2000
Total Operating Revenues(Dollar Amounts Shown in Millions)
Total Non- Subject to State Interstate Access Billing andRegulated Separations Collection
and Common Traffic Special Total andAdjustments Line Sensitive Interexchange
All Reporting Cos. $116,678.4 $9,216.6 $107,461.7 $77,442.6 $30,019.1 $13,750.6 $5,178.6 $9,943.7 $28,872.9 $1,146.2Bell Operating Cos. 108,920.4 8,301.3 100,619.1 72,378.2 28,240.9 12,839.4 4,789.6 9,597.9 27,226.9 1,014.0All Other Cos. 7,758.0 915.3 6,842.7 5,064.4 1,778.2 911.2 388.9 345.8 1,646.0 132.2
Alabama 1,683.6 85.3 1,598.3 1,207.1 391.2 213.2 75.6 88.0 376.7 14.4 ALArizona 1,840.5 129.2 1,711.4 1,183.9 527.4 242.7 93.1 172.7 508.5 18.9 AZArkansas 807.3 91.8 715.5 532.3 183.2 79.7 33.0 64.7 177.5 5.7 ARCalifornia 14,073.4 1,839.5 12,233.9 9,045.8 3,188.1 1,491.0 496.6 1,117.9 3,105.4 82.7 CAColorado 2,213.0 132.7 2,080.2 1,446.7 633.5 283.9 109.1 220.9 613.9 19.6 COConnecticut 1,575.7 13.4 1,562.3 1,091.4 470.9 180.2 120.0 159.8 460.1 10.8 CTDelaware 309.0 20.2 288.8 193.3 95.5 30.5 18.9 37.8 87.3 8.3 DEDistrict of Columbia 686.7 45.3 641.3 379.6 261.7 71.2 47.9 134.8 253.9 7.9 DCFlorida 7,483.6 630.5 6,853.1 4,883.9 1,969.2 1,018.9 330.8 535.5 1,885.1 84.1 FLGeorgia 3,578.1 199.6 3,378.5 2,481.3 897.2 401.6 162.3 303.6 867.5 29.7 GAHawaii 551.4 87.7 463.8 328.3 135.4 62.3 32.0 35.7 130.0 5.4 HIIdaho 472.3 24.2 448.1 288.0 160.1 77.6 32.0 43.7 153.3 6.8 IDIllinois 5,183.2 364.7 4,818.5 3,649.8 1,168.7 475.9 219.6 412.7 1,108.2 60.4 ILIndiana 2,351.4 204.2 2,147.1 1,559.4 587.7 276.6 99.6 180.6 556.8 30.9 INIowa 655.4 33.6 621.9 419.9 202.0 86.7 35.8 72.0 194.5 7.5 IAKansas 1,002.0 117.0 885.0 631.5 253.5 101.5 41.8 102.0 245.3 8.2 KSKentucky 1,457.6 89.1 1,368.5 1,005.2 363.3 184.4 66.7 97.4 348.5 14.8 KYLouisiana 1,709.2 76.7 1,632.5 1,270.9 361.6 195.0 68.7 84.7 348.4 13.2 LAMaine 509.9 17.7 492.1 348.0 144.1 57.5 32.1 48.1 137.7 6.4 MEMaryland 2,353.2 145.5 2,207.8 1,569.9 637.9 284.6 116.3 211.0 611.8 26.1 MDMassachusetts 2,943.6 142.3 2,801.3 1,909.3 892.0 395.6 161.7 302.1 859.4 32.5 MAMichigan 4,097.8 219.9 3,877.9 2,970.4 907.5 443.6 143.2 300.5 887.3 20.2 MIMinnesota 1,459.1 83.2 1,375.8 943.3 432.5 171.0 70.3 177.7 418.9 13.7 MNMississippi 1,109.4 33.5 1,076.0 857.3 218.7 108.2 53.8 47.6 209.6 9.0 MSMissouri 2,576.0 296.1 2,279.9 1,657.9 622.0 276.4 98.8 215.2 590.4 31.6 MOMontana 263.9 14.5 249.4 174.3 75.1 30.9 18.2 23.4 72.5 2.7 MTNebraska 672.0 52.5 619.5 443.7 175.8 60.5 41.4 67.8 169.7 6.1 NENevada 695.7 77.9 617.9 411.4 206.5 86.8 56.7 54.4 197.9 8.6 NVNew Hampshire 522.1 20.7 501.4 328.1 173.3 68.8 41.8 55.3 165.9 7.4 NHNew Jersey 4,034.1 223.0 3,811.0 2,565.4 1,245.7 577.1 196.6 422.6 1,196.3 49.4 NJNew Mexico 565.1 39.0 526.1 367.9 158.2 72.4 31.3 48.8 152.4 5.8 NMNew York 8,765.2 376.3 8,388.9 6,017.2 2,371.7 1,063.6 397.0 832.2 2,292.8 78.9 NYNorth Carolina 3,405.7 333.0 3,072.7 2,280.8 791.9 405.8 140.9 218.0 764.7 27.2 NCNorth Dakota 178.2 6.8 171.4 113.5 57.9 21.7 12.2 21.0 54.8 3.1 NDOhio 4,354.8 356.8 3,998.0 2,917.1 1,080.9 493.8 176.6 378.6 1,049.0 32.0 OHOklahoma 1,144.9 158.8 986.1 707.6 278.5 122.8 50.9 97.5 271.2 7.3 OKOregon 1,117.7 90.4 1,027.2 617.9 409.3 187.1 70.9 131.1 389.1 20.2 ORPennsylvania 4,722.3 284.5 4,437.8 3,103.5 1,334.4 588.2 212.9 415.8 1,216.9 117.5 PARhode Island 383.0 21.3 361.8 251.0 110.8 53.1 22.8 29.4 105.3 5.5 RISouth Carolina 1,297.8 74.4 1,223.3 923.8 299.5 151.9 54.3 83.4 289.6 9.9 SCSouth Dakota 199.5 7.8 191.7 129.6 62.1 23.3 11.7 25.5 60.5 1.6 SDTennessee 2,002.2 121.6 1,880.6 1,394.4 486.2 237.0 85.9 140.1 463.0 23.2 TNTexas 9,289.9 1,122.4 8,167.4 6,062.4 2,105.0 942.4 289.7 827.5 2,059.6 45.5 TXUtah 781.2 50.0 731.2 495.2 236.0 101.1 40.2 86.9 228.3 7.8 UTVermont 256.0 10.4 245.7 173.0 72.7 28.5 19.9 20.9 69.3 3.4 VTVirginia 3,191.7 223.3 2,968.4 2,061.2 907.2 406.3 143.8 320.7 870.8 36.4 VAWashington 2,456.2 199.6 2,256.5 1,541.9 714.6 320.1 108.8 258.4 687.2 27.4 WAWest Virginia 656.6 22.3 634.4 454.7 179.7 97.6 33.1 42.8 173.5 6.2 WVWisconsin 1,668.2 89.4 1,578.8 1,183.1 395.7 169.7 71.2 144.4 385.4 10.4 WIWyoming 207.3 12.9 194.4 129.3 65.1 25.8 15.0 22.4 63.2 1.9 WYPuerto Rico 1,164.7 104.0 1,060.7 740.5 320.2 204.8 75.0 8.2 288.0 32.2 PRUnclassified
130
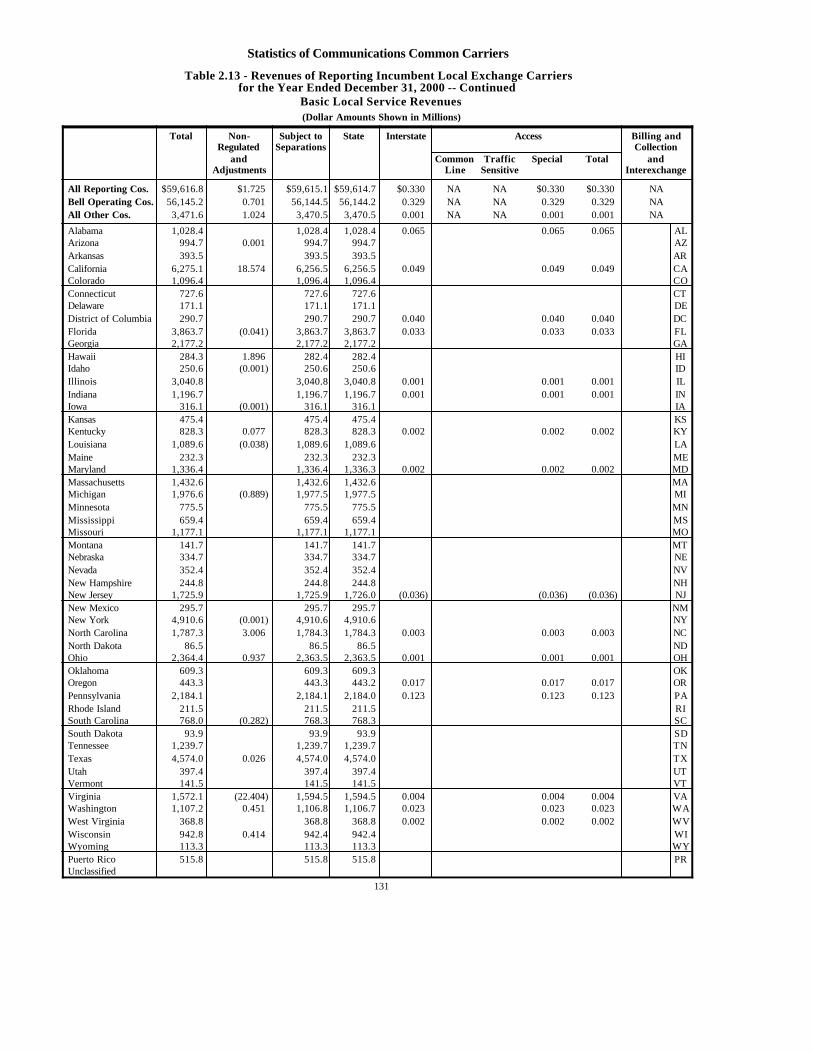
Statistics of Communications Common Carriers
Table 2.13 - Revenues of Reporting Incumbent Local Exchange Carriersfor the Year Ended December 31, 2000 -- Continued
Basic Local Service Revenues(Dollar Amounts Shown in Millions)
Total Non- Subject to State Interstate Access Billing andRegulated Separations Collection
and Common Traffic Special Total andAdjustments Line Sensitive Interexchange
All Reporting Cos. $59,616.8 $1.725 $59,615.1 $59,614.7 $0.330 NA NA $0.330 $0.330 NABell Operating Cos. 56,145.2 0.701 56,144.5 56,144.2 0.329 NA NA 0.329 0.329 NAAll Other Cos. 3,471.6 1.024 3,470.5 3,470.5 0.001 NA NA 0.001 0.001 NA
Alabama 1,028.4 1,028.4 1,028.4 0.065 0.065 0.065 ALArizona 994.7 0.001 994.7 994.7 AZArkansas 393.5 393.5 393.5 ARCalifornia 6,275.1 18.574 6,256.5 6,256.5 0.049 0.049 0.049 CAColorado 1,096.4 1,096.4 1,096.4 COConnecticut 727.6 727.6 727.6 CTDelaware 171.1 171.1 171.1 DEDistrict of Columbia 290.7 290.7 290.7 0.040 0.040 0.040 DCFlorida 3,863.7 (0.041) 3,863.7 3,863.7 0.033 0.033 0.033 FLGeorgia 2,177.2 2,177.2 2,177.2 GAHawaii 284.3 1.896 282.4 282.4 HIIdaho 250.6 (0.001) 250.6 250.6 IDIllinois 3,040.8 3,040.8 3,040.8 0.001 0.001 0.001 ILIndiana 1,196.7 1,196.7 1,196.7 0.001 0.001 0.001 INIowa 316.1 (0.001) 316.1 316.1 IAKansas 475.4 475.4 475.4 KSKentucky 828.3 0.077 828.3 828.3 0.002 0.002 0.002 KYLouisiana 1,089.6 (0.038) 1,089.6 1,089.6 LAMaine 232.3 232.3 232.3 MEMaryland 1,336.4 1,336.4 1,336.3 0.002 0.002 0.002 MDMassachusetts 1,432.6 1,432.6 1,432.6 MAMichigan 1,976.6 (0.889) 1,977.5 1,977.5 MIMinnesota 775.5 775.5 775.5 MNMississippi 659.4 659.4 659.4 MSMissouri 1,177.1 1,177.1 1,177.1 MOMontana 141.7 141.7 141.7 MTNebraska 334.7 334.7 334.7 NENevada 352.4 352.4 352.4 NVNew Hampshire 244.8 244.8 244.8 NHNew Jersey 1,725.9 1,725.9 1,726.0 (0.036) (0.036) (0.036) NJNew Mexico 295.7 295.7 295.7 NMNew York 4,910.6 (0.001) 4,910.6 4,910.6 NYNorth Carolina 1,787.3 3.006 1,784.3 1,784.3 0.003 0.003 0.003 NCNorth Dakota 86.5 86.5 86.5 NDOhio 2,364.4 0.937 2,363.5 2,363.5 0.001 0.001 0.001 OHOklahoma 609.3 609.3 609.3 OKOregon 443.3 443.3 443.2 0.017 0.017 0.017 ORPennsylvania 2,184.1 2,184.1 2,184.0 0.123 0.123 0.123 PARhode Island 211.5 211.5 211.5 RISouth Carolina 768.0 (0.282) 768.3 768.3 SCSouth Dakota 93.9 93.9 93.9 SDTennessee 1,239.7 1,239.7 1,239.7 TNTexas 4,574.0 0.026 4,574.0 4,574.0 TXUtah 397.4 397.4 397.4 UTVermont 141.5 141.5 141.5 VTVirginia 1,572.1 (22.404) 1,594.5 1,594.5 0.004 0.004 0.004 VAWashington 1,107.2 0.451 1,106.8 1,106.7 0.023 0.023 0.023 WAWest Virginia 368.8 368.8 368.8 0.002 0.002 0.002 WVWisconsin 942.8 0.414 942.4 942.4 WIWyoming 113.3 113.3 113.3 WYPuerto Rico 515.8 515.8 515.8 PRUnclassified
131
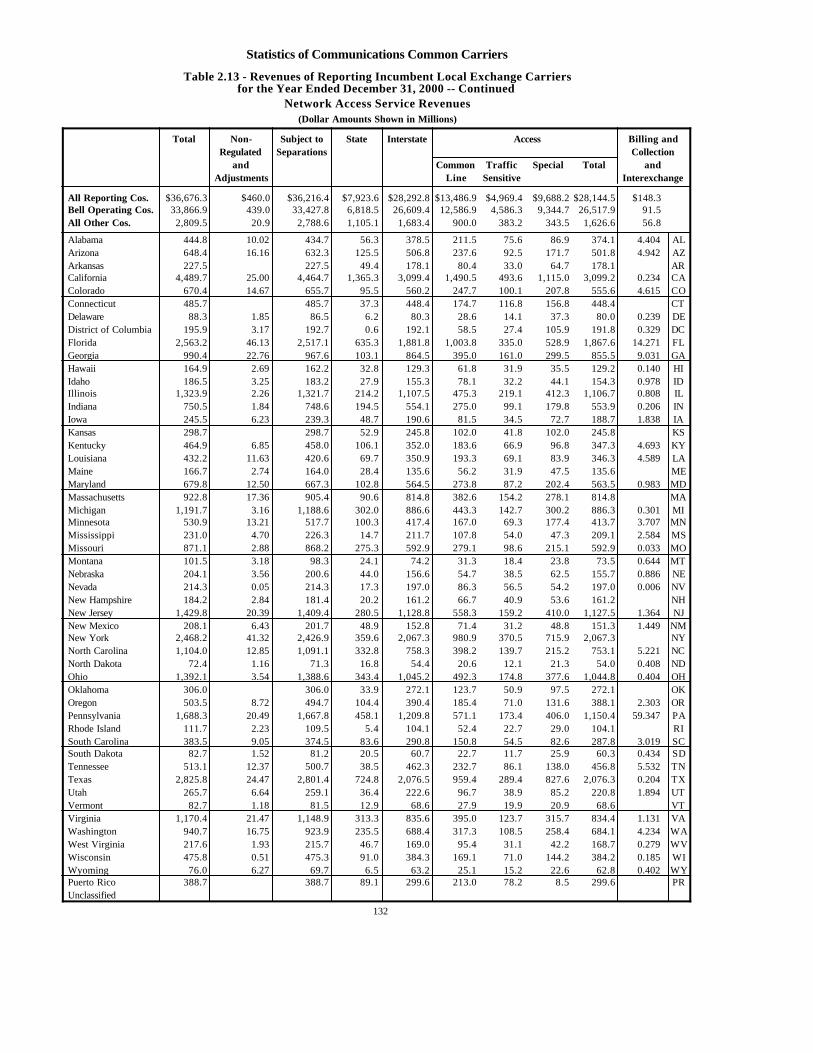
Statistics of Communications Common Carriers
Table 2.13 - Revenues of Reporting Incumbent Local Exchange Carriersfor the Year Ended December 31, 2000 -- Continued
Network Access Service Revenues(Dollar Amounts Shown in Millions)
Total Non- Subject to State Interstate Access Billing andRegulated Separations Collection
and Common Traffic Special Total andAdjustments Line Sensitive Interexchange
All Reporting Cos. $36,676.3 $460.0 $36,216.4 $7,923.6 $28,292.8 $13,486.9 $4,969.4 $9,688.2 $28,144.5 $148.3Bell Operating Cos. 33,866.9 439.0 33,427.8 6,818.5 26,609.4 12,586.9 4,586.3 9,344.7 26,517.9 91.5All Other Cos. 2,809.5 20.9 2,788.6 1,105.1 1,683.4 900.0 383.2 343.5 1,626.6 56.8
Alabama 444.8 10.02 434.7 56.3 378.5 211.5 75.6 86.9 374.1 4.404 ALArizona 648.4 16.16 632.3 125.5 506.8 237.6 92.5 171.7 501.8 4.942 AZArkansas 227.5 227.5 49.4 178.1 80.4 33.0 64.7 178.1 ARCalifornia 4,489.7 25.00 4,464.7 1,365.3 3,099.4 1,490.5 493.6 1,115.0 3,099.2 0.234 CAColorado 670.4 14.67 655.7 95.5 560.2 247.7 100.1 207.8 555.6 4.615 COConnecticut 485.7 485.7 37.3 448.4 174.7 116.8 156.8 448.4 CTDelaware 88.3 1.85 86.5 6.2 80.3 28.6 14.1 37.3 80.0 0.239 DEDistrict of Columbia 195.9 3.17 192.7 0.6 192.1 58.5 27.4 105.9 191.8 0.329 DCFlorida 2,563.2 46.13 2,517.1 635.3 1,881.8 1,003.8 335.0 528.9 1,867.6 14.271 FLGeorgia 990.4 22.76 967.6 103.1 864.5 395.0 161.0 299.5 855.5 9.031 GAHawaii 164.9 2.69 162.2 32.8 129.3 61.8 31.9 35.5 129.2 0.140 HIIdaho 186.5 3.25 183.2 27.9 155.3 78.1 32.2 44.1 154.3 0.978 IDIllinois 1,323.9 2.26 1,321.7 214.2 1,107.5 475.3 219.1 412.3 1,106.7 0.808 ILIndiana 750.5 1.84 748.6 194.5 554.1 275.0 99.1 179.8 553.9 0.206 INIowa 245.5 6.23 239.3 48.7 190.6 81.5 34.5 72.7 188.7 1.838 IAKansas 298.7 298.7 52.9 245.8 102.0 41.8 102.0 245.8 KSKentucky 464.9 6.85 458.0 106.1 352.0 183.6 66.9 96.8 347.3 4.693 KYLouisiana 432.2 11.63 420.6 69.7 350.9 193.3 69.1 83.9 346.3 4.589 LAMaine 166.7 2.74 164.0 28.4 135.6 56.2 31.9 47.5 135.6 MEMaryland 679.8 12.50 667.3 102.8 564.5 273.8 87.2 202.4 563.5 0.983 MDMassachusetts 922.8 17.36 905.4 90.6 814.8 382.6 154.2 278.1 814.8 MAMichigan 1,191.7 3.16 1,188.6 302.0 886.6 443.3 142.7 300.2 886.3 0.301 MIMinnesota 530.9 13.21 517.7 100.3 417.4 167.0 69.3 177.4 413.7 3.707 MNMississippi 231.0 4.70 226.3 14.7 211.7 107.8 54.0 47.3 209.1 2.584 MSMissouri 871.1 2.88 868.2 275.3 592.9 279.1 98.6 215.1 592.9 0.033 MOMontana 101.5 3.18 98.3 24.1 74.2 31.3 18.4 23.8 73.5 0.644 MTNebraska 204.1 3.56 200.6 44.0 156.6 54.7 38.5 62.5 155.7 0.886 NENevada 214.3 0.05 214.3 17.3 197.0 86.3 56.5 54.2 197.0 0.006 NVNew Hampshire 184.2 2.84 181.4 20.2 161.2 66.7 40.9 53.6 161.2 NHNew Jersey 1,429.8 20.39 1,409.4 280.5 1,128.8 558.3 159.2 410.0 1,127.5 1.364 NJNew Mexico 208.1 6.43 201.7 48.9 152.8 71.4 31.2 48.8 151.3 1.449 NMNew York 2,468.2 41.32 2,426.9 359.6 2,067.3 980.9 370.5 715.9 2,067.3 NYNorth Carolina 1,104.0 12.85 1,091.1 332.8 758.3 398.2 139.7 215.2 753.1 5.221 NCNorth Dakota 72.4 1.16 71.3 16.8 54.4 20.6 12.1 21.3 54.0 0.408 NDOhio 1,392.1 3.54 1,388.6 343.4 1,045.2 492.3 174.8 377.6 1,044.8 0.404 OHOklahoma 306.0 306.0 33.9 272.1 123.7 50.9 97.5 272.1 OKOregon 503.5 8.72 494.7 104.4 390.4 185.4 71.0 131.6 388.1 2.303 ORPennsylvania 1,688.3 20.49 1,667.8 458.1 1,209.8 571.1 173.4 406.0 1,150.4 59.347 PARhode Island 111.7 2.23 109.5 5.4 104.1 52.4 22.7 29.0 104.1 RISouth Carolina 383.5 9.05 374.5 83.6 290.8 150.8 54.5 82.6 287.8 3.019 SCSouth Dakota 82.7 1.52 81.2 20.5 60.7 22.7 11.7 25.9 60.3 0.434 SDTennessee 513.1 12.37 500.7 38.5 462.3 232.7 86.1 138.0 456.8 5.532 TNTexas 2,825.8 24.47 2,801.4 724.8 2,076.5 959.4 289.4 827.6 2,076.3 0.204 TXUtah 265.7 6.64 259.1 36.4 222.6 96.7 38.9 85.2 220.8 1.894 UTVermont 82.7 1.18 81.5 12.9 68.6 27.9 19.9 20.9 68.6 VTVirginia 1,170.4 21.47 1,148.9 313.3 835.6 395.0 123.7 315.7 834.4 1.131 VAWashington 940.7 16.75 923.9 235.5 688.4 317.3 108.5 258.4 684.1 4.234 WAWest Virginia 217.6 1.93 215.7 46.7 169.0 95.4 31.1 42.2 168.7 0.279 WVWisconsin 475.8 0.51 475.3 91.0 384.3 169.1 71.0 144.2 384.2 0.185 WIWyoming 76.0 6.27 69.7 6.5 63.2 25.1 15.2 22.6 62.8 0.402 WYPuerto Rico 388.7 388.7 89.1 299.6 213.0 78.2 8.5 299.6 PRUnclassified
132
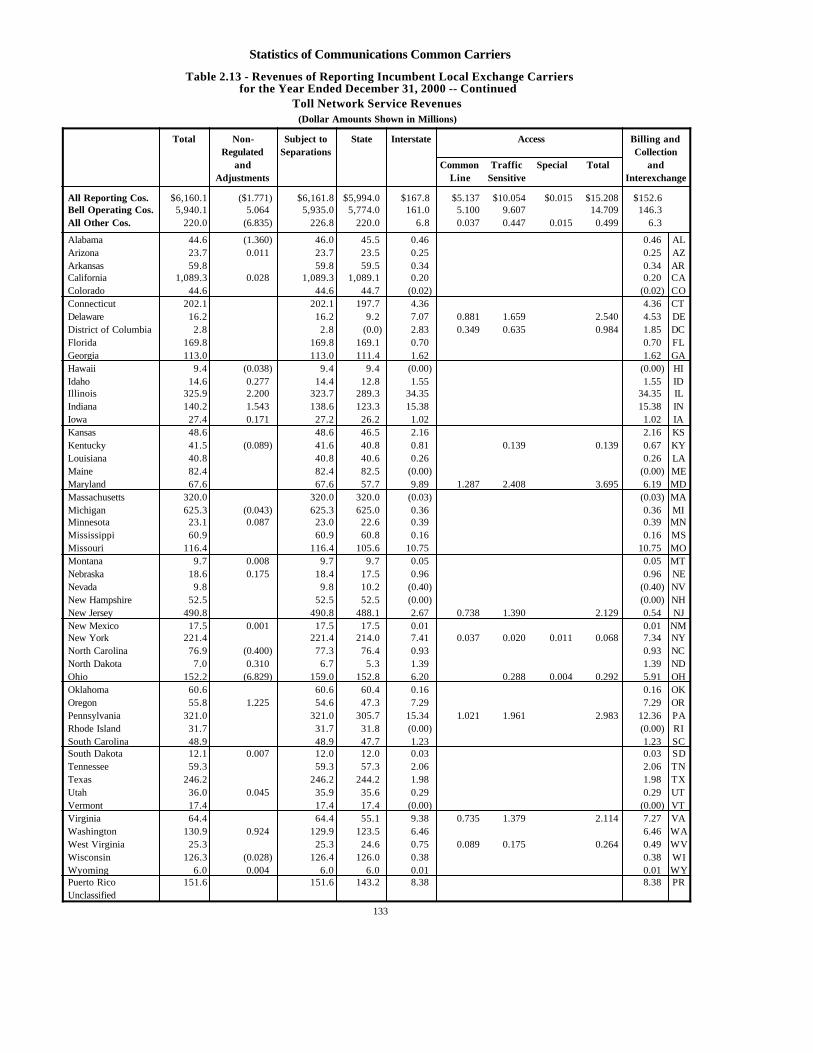
Statistics of Communications Common Carriers
Table 2.13 - Revenues of Reporting Incumbent Local Exchange Carriersfor the Year Ended December 31, 2000 -- Continued
Toll Network Service Revenues(Dollar Amounts Shown in Millions)
Total Non- Subject to State Interstate Access Billing andRegulated Separations Collection
and Common Traffic Special Total andAdjustments Line Sensitive Interexchange
All Reporting Cos. $6,160.1 ($1.771) $6,161.8 $5,994.0 $167.8 $5.137 $10.054 $0.015 $15.208 $152.6Bell Operating Cos. 5,940.1 5.064 5,935.0 5,774.0 161.0 5.100 9.607 14.709 146.3All Other Cos. 220.0 (6.835) 226.8 220.0 6.8 0.037 0.447 0.015 0.499 6.3
Alabama 44.6 (1.360) 46.0 45.5 0.46 0.46 ALArizona 23.7 0.011 23.7 23.5 0.25 0.25 AZArkansas 59.8 59.8 59.5 0.34 0.34 ARCalifornia 1,089.3 0.028 1,089.3 1,089.1 0.20 0.20 CAColorado 44.6 44.6 44.7 (0.02) (0.02) COConnecticut 202.1 202.1 197.7 4.36 4.36 CTDelaware 16.2 16.2 9.2 7.07 0.881 1.659 2.540 4.53 DEDistrict of Columbia 2.8 2.8 (0.0) 2.83 0.349 0.635 0.984 1.85 DCFlorida 169.8 169.8 169.1 0.70 0.70 FLGeorgia 113.0 113.0 111.4 1.62 1.62 GAHawaii 9.4 (0.038) 9.4 9.4 (0.00) (0.00) HIIdaho 14.6 0.277 14.4 12.8 1.55 1.55 IDIllinois 325.9 2.200 323.7 289.3 34.35 34.35 ILIndiana 140.2 1.543 138.6 123.3 15.38 15.38 INIowa 27.4 0.171 27.2 26.2 1.02 1.02 IAKansas 48.6 48.6 46.5 2.16 2.16 KSKentucky 41.5 (0.089) 41.6 40.8 0.81 0.139 0.139 0.67 KYLouisiana 40.8 40.8 40.6 0.26 0.26 LAMaine 82.4 82.4 82.5 (0.00) (0.00) MEMaryland 67.6 67.6 57.7 9.89 1.287 2.408 3.695 6.19 MDMassachusetts 320.0 320.0 320.0 (0.03) (0.03) MAMichigan 625.3 (0.043) 625.3 625.0 0.36 0.36 MIMinnesota 23.1 0.087 23.0 22.6 0.39 0.39 MNMississippi 60.9 60.9 60.8 0.16 0.16 MSMissouri 116.4 116.4 105.6 10.75 10.75 MOMontana 9.7 0.008 9.7 9.7 0.05 0.05 MTNebraska 18.6 0.175 18.4 17.5 0.96 0.96 NENevada 9.8 9.8 10.2 (0.40) (0.40) NVNew Hampshire 52.5 52.5 52.5 (0.00) (0.00) NHNew Jersey 490.8 490.8 488.1 2.67 0.738 1.390 2.129 0.54 NJNew Mexico 17.5 0.001 17.5 17.5 0.01 0.01 NMNew York 221.4 221.4 214.0 7.41 0.037 0.020 0.011 0.068 7.34 NYNorth Carolina 76.9 (0.400) 77.3 76.4 0.93 0.93 NCNorth Dakota 7.0 0.310 6.7 5.3 1.39 1.39 NDOhio 152.2 (6.829) 159.0 152.8 6.20 0.288 0.004 0.292 5.91 OHOklahoma 60.6 60.6 60.4 0.16 0.16 OKOregon 55.8 1.225 54.6 47.3 7.29 7.29 ORPennsylvania 321.0 321.0 305.7 15.34 1.021 1.961 2.983 12.36 PARhode Island 31.7 31.7 31.8 (0.00) (0.00) RISouth Carolina 48.9 48.9 47.7 1.23 1.23 SCSouth Dakota 12.1 0.007 12.0 12.0 0.03 0.03 SDTennessee 59.3 59.3 57.3 2.06 2.06 TNTexas 246.2 246.2 244.2 1.98 1.98 TXUtah 36.0 0.045 35.9 35.6 0.29 0.29 UTVermont 17.4 17.4 17.4 (0.00) (0.00) VTVirginia 64.4 64.4 55.1 9.38 0.735 1.379 2.114 7.27 VAWashington 130.9 0.924 129.9 123.5 6.46 6.46 WAWest Virginia 25.3 25.3 24.6 0.75 0.089 0.175 0.264 0.49 WVWisconsin 126.3 (0.028) 126.4 126.0 0.38 0.38 WIWyoming 6.0 0.004 6.0 6.0 0.01 0.01 WYPuerto Rico 151.6 151.6 143.2 8.38 8.38 PRUnclassified
133
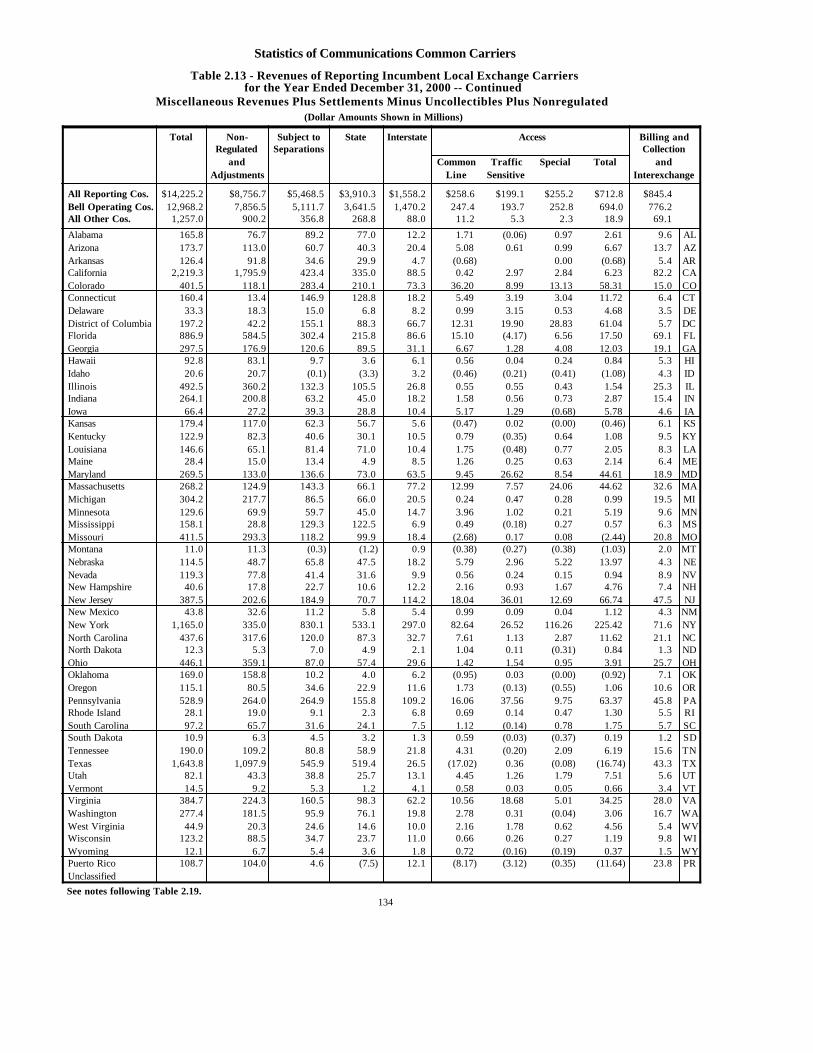
Statistics of Communications Common Carriers
Table 2.13 - Revenues of Reporting Incumbent Local Exchange Carriersfor the Year Ended December 31, 2000 -- Continued
Miscellaneous Revenues Plus Settlements Minus Uncollectibles Plus Nonregulated(Dollar Amounts Shown in Millions)
Total Non- Subject to State Interstate Access Billing andRegulated Separations Collection
and Common Traffic Special Total andAdjustments Line Sensitive Interexchange
All Reporting Cos. $14,225.2 $8,756.7 $5,468.5 $3,910.3 $1,558.2 $258.6 $199.1 $255.2 $712.8 $845.4Bell Operating Cos. 12,968.2 7,856.5 5,111.7 3,641.5 1,470.2 247.4 193.7 252.8 694.0 776.2All Other Cos. 1,257.0 900.2 356.8 268.8 88.0 11.2 5.3 2.3 18.9 69.1
Alabama 165.8 76.7 89.2 77.0 12.2 1.71 (0.06) 0.97 2.61 9.6 ALArizona 173.7 113.0 60.7 40.3 20.4 5.08 0.61 0.99 6.67 13.7 AZArkansas 126.4 91.8 34.6 29.9 4.7 (0.68) 0.00 (0.68) 5.4 ARCalifornia 2,219.3 1,795.9 423.4 335.0 88.5 0.42 2.97 2.84 6.23 82.2 CAColorado 401.5 118.1 283.4 210.1 73.3 36.20 8.99 13.13 58.31 15.0 COConnecticut 160.4 13.4 146.9 128.8 18.2 5.49 3.19 3.04 11.72 6.4 CTDelaware 33.3 18.3 15.0 6.8 8.2 0.99 3.15 0.53 4.68 3.5 DEDistrict of Columbia 197.2 42.2 155.1 88.3 66.7 12.31 19.90 28.83 61.04 5.7 DCFlorida 886.9 584.5 302.4 215.8 86.6 15.10 (4.17) 6.56 17.50 69.1 FLGeorgia 297.5 176.9 120.6 89.5 31.1 6.67 1.28 4.08 12.03 19.1 GAHawaii 92.8 83.1 9.7 3.6 6.1 0.56 0.04 0.24 0.84 5.3 HIIdaho 20.6 20.7 (0.1) (3.3) 3.2 (0.46) (0.21) (0.41) (1.08) 4.3 IDIllinois 492.5 360.2 132.3 105.5 26.8 0.55 0.55 0.43 1.54 25.3 ILIndiana 264.1 200.8 63.2 45.0 18.2 1.58 0.56 0.73 2.87 15.4 INIowa 66.4 27.2 39.3 28.8 10.4 5.17 1.29 (0.68) 5.78 4.6 IAKansas 179.4 117.0 62.3 56.7 5.6 (0.47) 0.02 (0.00) (0.46) 6.1 KSKentucky 122.9 82.3 40.6 30.1 10.5 0.79 (0.35) 0.64 1.08 9.5 KYLouisiana 146.6 65.1 81.4 71.0 10.4 1.75 (0.48) 0.77 2.05 8.3 LAMaine 28.4 15.0 13.4 4.9 8.5 1.26 0.25 0.63 2.14 6.4 MEMaryland 269.5 133.0 136.6 73.0 63.5 9.45 26.62 8.54 44.61 18.9 MDMassachusetts 268.2 124.9 143.3 66.1 77.2 12.99 7.57 24.06 44.62 32.6 MAMichigan 304.2 217.7 86.5 66.0 20.5 0.24 0.47 0.28 0.99 19.5 MIMinnesota 129.6 69.9 59.7 45.0 14.7 3.96 1.02 0.21 5.19 9.6 MNMississippi 158.1 28.8 129.3 122.5 6.9 0.49 (0.18) 0.27 0.57 6.3 MSMissouri 411.5 293.3 118.2 99.9 18.4 (2.68) 0.17 0.08 (2.44) 20.8 MOMontana 11.0 11.3 (0.3) (1.2) 0.9 (0.38) (0.27) (0.38) (1.03) 2.0 MTNebraska 114.5 48.7 65.8 47.5 18.2 5.79 2.96 5.22 13.97 4.3 NENevada 119.3 77.8 41.4 31.6 9.9 0.56 0.24 0.15 0.94 8.9 NVNew Hampshire 40.6 17.8 22.7 10.6 12.2 2.16 0.93 1.67 4.76 7.4 NHNew Jersey 387.5 202.6 184.9 70.7 114.2 18.04 36.01 12.69 66.74 47.5 NJNew Mexico 43.8 32.6 11.2 5.8 5.4 0.99 0.09 0.04 1.12 4.3 NMNew York 1,165.0 335.0 830.1 533.1 297.0 82.64 26.52 116.26 225.42 71.6 NYNorth Carolina 437.6 317.6 120.0 87.3 32.7 7.61 1.13 2.87 11.62 21.1 NCNorth Dakota 12.3 5.3 7.0 4.9 2.1 1.04 0.11 (0.31) 0.84 1.3 NDOhio 446.1 359.1 87.0 57.4 29.6 1.42 1.54 0.95 3.91 25.7 OHOklahoma 169.0 158.8 10.2 4.0 6.2 (0.95) 0.03 (0.00) (0.92) 7.1 OKOregon 115.1 80.5 34.6 22.9 11.6 1.73 (0.13) (0.55) 1.06 10.6 ORPennsylvania 528.9 264.0 264.9 155.8 109.2 16.06 37.56 9.75 63.37 45.8 PARhode Island 28.1 19.0 9.1 2.3 6.8 0.69 0.14 0.47 1.30 5.5 RISouth Carolina 97.2 65.7 31.6 24.1 7.5 1.12 (0.14) 0.78 1.75 5.7 SCSouth Dakota 10.9 6.3 4.5 3.2 1.3 0.59 (0.03) (0.37) 0.19 1.2 SDTennessee 190.0 109.2 80.8 58.9 21.8 4.31 (0.20) 2.09 6.19 15.6 TNTexas 1,643.8 1,097.9 545.9 519.4 26.5 (17.02) 0.36 (0.08) (16.74) 43.3 TXUtah 82.1 43.3 38.8 25.7 13.1 4.45 1.26 1.79 7.51 5.6 UTVermont 14.5 9.2 5.3 1.2 4.1 0.58 0.03 0.05 0.66 3.4 VTVirginia 384.7 224.3 160.5 98.3 62.2 10.56 18.68 5.01 34.25 28.0 VAWashington 277.4 181.5 95.9 76.1 19.8 2.78 0.31 (0.04) 3.06 16.7 WAWest Virginia 44.9 20.3 24.6 14.6 10.0 2.16 1.78 0.62 4.56 5.4 WVWisconsin 123.2 88.5 34.7 23.7 11.0 0.66 0.26 0.27 1.19 9.8 WIWyoming 12.1 6.7 5.4 3.6 1.8 0.72 (0.16) (0.19) 0.37 1.5 WYPuerto Rico 108.7 104.0 4.6 (7.5) 12.1 (8.17) (3.12) (0.35) (11.64) 23.8 PRUnclassified
See notes following Table 2.19.134
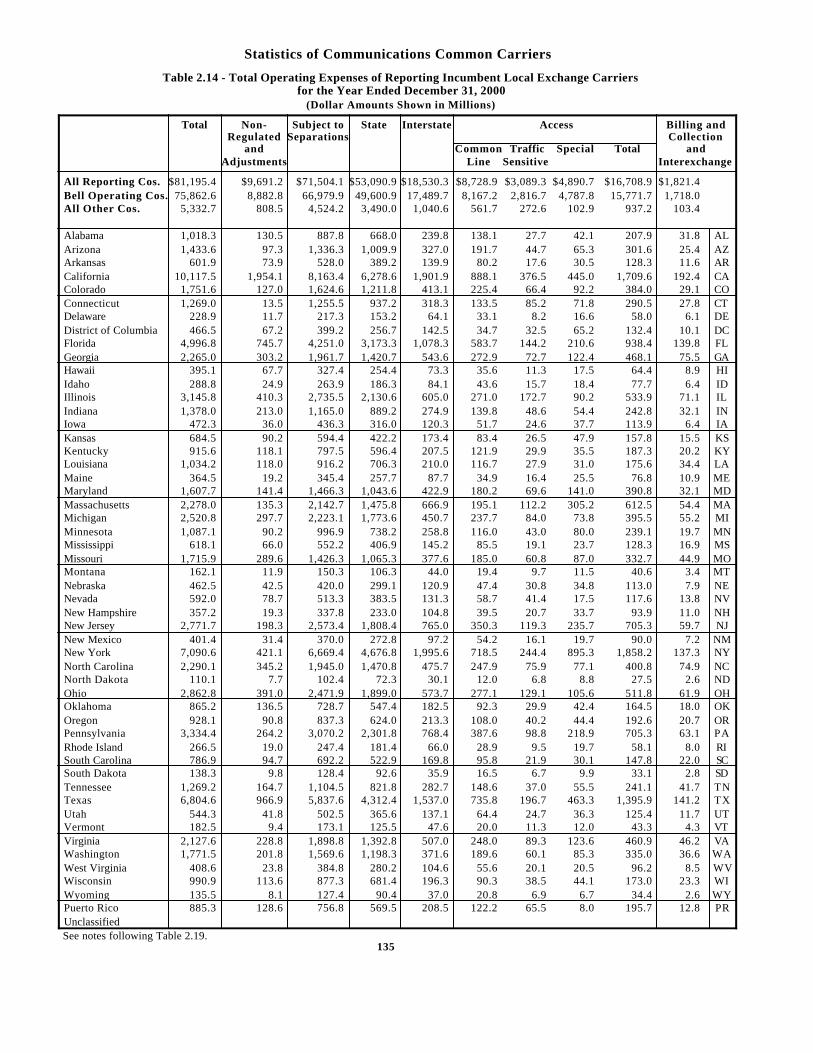
Statistics of Communications Common Carriers
Table 2.14 - Total Operating Expenses of Reporting Incumbent Local Exchange Carriersfor the Year Ended December 31, 2000
(Dollar Amounts Shown in Millions)
Total Non- Subject to State Interstate Access Billing andRegulated Separations Collection
and Common Traffic Special Total andAdjustments Line Sensitive Interexchange
All Reporting Cos. $81,195.4 $9,691.2 $71,504.1 $53,090.9 $18,530.3 $8,728.9 $3,089.3 $4,890.7 $16,708.9 $1,821.4Bell Operating Cos. 75,862.6 8,882.8 66,979.9 49,600.9 17,489.7 8,167.2 2,816.7 4,787.8 15,771.7 1,718.0All Other Cos. 5,332.7 808.5 4,524.2 3,490.0 1,040.6 561.7 272.6 102.9 937.2 103.4
Alabama 1,018.3 130.5 887.8 668.0 239.8 138.1 27.7 42.1 207.9 31.8 ALArizona 1,433.6 97.3 1,336.3 1,009.9 327.0 191.7 44.7 65.3 301.6 25.4 AZArkansas 601.9 73.9 528.0 389.2 139.9 80.2 17.6 30.5 128.3 11.6 ARCalifornia 10,117.5 1,954.1 8,163.4 6,278.6 1,901.9 888.1 376.5 445.0 1,709.6 192.4 CAColorado 1,751.6 127.0 1,624.6 1,211.8 413.1 225.4 66.4 92.2 384.0 29.1 COConnecticut 1,269.0 13.5 1,255.5 937.2 318.3 133.5 85.2 71.8 290.5 27.8 CTDelaware 228.9 11.7 217.3 153.2 64.1 33.1 8.2 16.6 58.0 6.1 DEDistrict of Columbia 466.5 67.2 399.2 256.7 142.5 34.7 32.5 65.2 132.4 10.1 DCFlorida 4,996.8 745.7 4,251.0 3,173.3 1,078.3 583.7 144.2 210.6 938.4 139.8 FLGeorgia 2,265.0 303.2 1,961.7 1,420.7 543.6 272.9 72.7 122.4 468.1 75.5 GAHawaii 395.1 67.7 327.4 254.4 73.3 35.6 11.3 17.5 64.4 8.9 HIIdaho 288.8 24.9 263.9 186.3 84.1 43.6 15.7 18.4 77.7 6.4 IDIllinois 3,145.8 410.3 2,735.5 2,130.6 605.0 271.0 172.7 90.2 533.9 71.1 ILIndiana 1,378.0 213.0 1,165.0 889.2 274.9 139.8 48.6 54.4 242.8 32.1 INIowa 472.3 36.0 436.3 316.0 120.3 51.7 24.6 37.7 113.9 6.4 IAKansas 684.5 90.2 594.4 422.2 173.4 83.4 26.5 47.9 157.8 15.5 KSKentucky 915.6 118.1 797.5 596.4 207.5 121.9 29.9 35.5 187.3 20.2 KYLouisiana 1,034.2 118.0 916.2 706.3 210.0 116.7 27.9 31.0 175.6 34.4 LAMaine 364.5 19.2 345.4 257.7 87.7 34.9 16.4 25.5 76.8 10.9 MEMaryland 1,607.7 141.4 1,466.3 1,043.6 422.9 180.2 69.6 141.0 390.8 32.1 MDMassachusetts 2,278.0 135.3 2,142.7 1,475.8 666.9 195.1 112.2 305.2 612.5 54.4 MAMichigan 2,520.8 297.7 2,223.1 1,773.6 450.7 237.7 84.0 73.8 395.5 55.2 MIMinnesota 1,087.1 90.2 996.9 738.2 258.8 116.0 43.0 80.0 239.1 19.7 MNMississippi 618.1 66.0 552.2 406.9 145.2 85.5 19.1 23.7 128.3 16.9 MSMissouri 1,715.9 289.6 1,426.3 1,065.3 377.6 185.0 60.8 87.0 332.7 44.9 MOMontana 162.1 11.9 150.3 106.3 44.0 19.4 9.7 11.5 40.6 3.4 MTNebraska 462.5 42.5 420.0 299.1 120.9 47.4 30.8 34.8 113.0 7.9 NENevada 592.0 78.7 513.3 383.5 131.3 58.7 41.4 17.5 117.6 13.8 NVNew Hampshire 357.2 19.3 337.8 233.0 104.8 39.5 20.7 33.7 93.9 11.0 NHNew Jersey 2,771.7 198.3 2,573.4 1,808.4 765.0 350.3 119.3 235.7 705.3 59.7 NJNew Mexico 401.4 31.4 370.0 272.8 97.2 54.2 16.1 19.7 90.0 7.2 NMNew York 7,090.6 421.1 6,669.4 4,676.8 1,995.6 718.5 244.4 895.3 1,858.2 137.3 NYNorth Carolina 2,290.1 345.2 1,945.0 1,470.8 475.7 247.9 75.9 77.1 400.8 74.9 NCNorth Dakota 110.1 7.7 102.4 72.3 30.1 12.0 6.8 8.8 27.5 2.6 NDOhio 2,862.8 391.0 2,471.9 1,899.0 573.7 277.1 129.1 105.6 511.8 61.9 OHOklahoma 865.2 136.5 728.7 547.4 182.5 92.3 29.9 42.4 164.5 18.0 OKOregon 928.1 90.8 837.3 624.0 213.3 108.0 40.2 44.4 192.6 20.7 ORPennsylvania 3,334.4 264.2 3,070.2 2,301.8 768.4 387.6 98.8 218.9 705.3 63.1 PARhode Island 266.5 19.0 247.4 181.4 66.0 28.9 9.5 19.7 58.1 8.0 RISouth Carolina 786.9 94.7 692.2 522.9 169.8 95.8 21.9 30.1 147.8 22.0 SCSouth Dakota 138.3 9.8 128.4 92.6 35.9 16.5 6.7 9.9 33.1 2.8 SDTennessee 1,269.2 164.7 1,104.5 821.8 282.7 148.6 37.0 55.5 241.1 41.7 TNTexas 6,804.6 966.9 5,837.6 4,312.4 1,537.0 735.8 196.7 463.3 1,395.9 141.2 TXUtah 544.3 41.8 502.5 365.6 137.1 64.4 24.7 36.3 125.4 11.7 UTVermont 182.5 9.4 173.1 125.5 47.6 20.0 11.3 12.0 43.3 4.3 VTVirginia 2,127.6 228.8 1,898.8 1,392.8 507.0 248.0 89.3 123.6 460.9 46.2 VAWashington 1,771.5 201.8 1,569.6 1,198.3 371.6 189.6 60.1 85.3 335.0 36.6 WAWest Virginia 408.6 23.8 384.8 280.2 104.6 55.6 20.1 20.5 96.2 8.5 WVWisconsin 990.9 113.6 877.3 681.4 196.3 90.3 38.5 44.1 173.0 23.3 WIWyoming 135.5 8.1 127.4 90.4 37.0 20.8 6.9 6.7 34.4 2.6 WYPuerto Rico 885.3 128.6 756.8 569.5 208.5 122.2 65.5 8.0 195.7 12.8 PRUnclassifiedSee notes following Table 2.19.
135
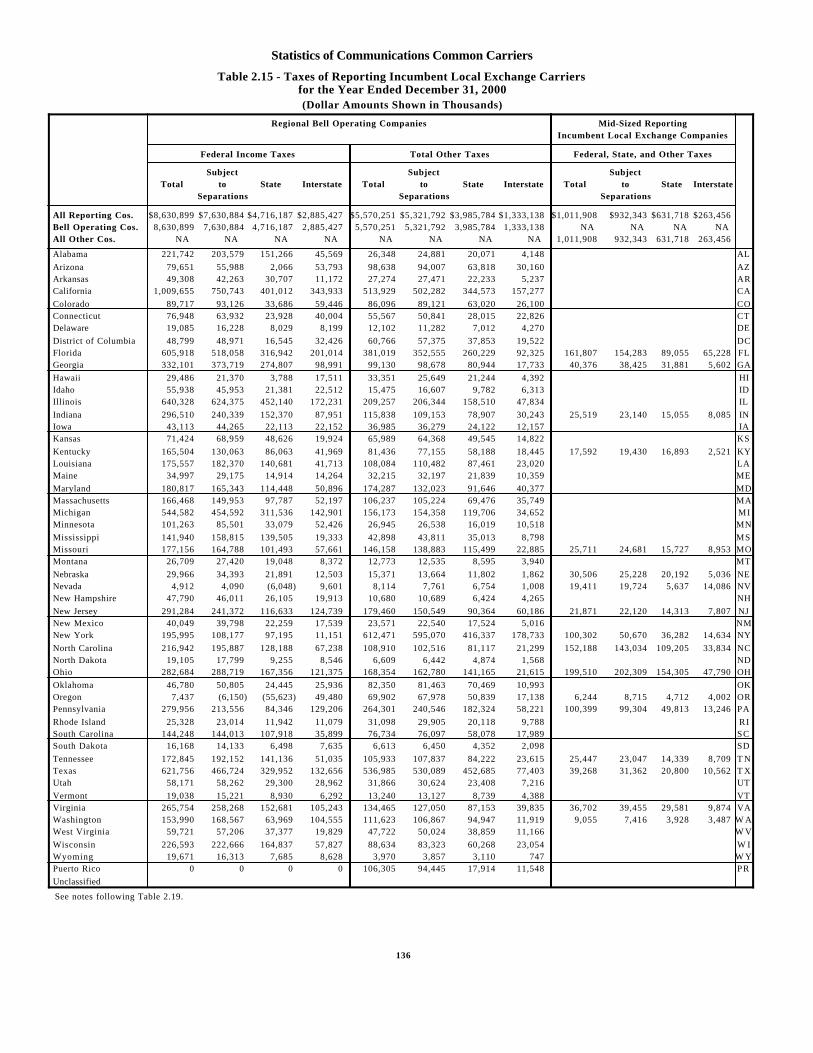
Statistics of Communications Common Carriers
Table 2.15 - Taxes of Reporting Incumbent Local Exchange Carriersfor the Year Ended December 31, 2000(Dollar Amounts Shown in Thousands)
Regional Bell Operating Companies Mid-Sized ReportingIncumbent Local Exchange Companies
Federal Income Taxes Total Other Taxes Federal, State, and Other Taxes
Subject Subject SubjectTotal to State Interstate Total to State Interstate Total to State Interstate
Separations Separations Separations
All Reporting Cos. $8,630,899 $7,630,884 $4,716,187 $2,885,427 $5,570,251 $5,321,792 $3,985,784 $1,333,138 $1,011,908 $932,343 $631,718 $263,456Bell Operating Cos. 8,630,899 7,630,884 4,716,187 2,885,427 5,570,251 5,321,792 3,985,784 1,333,138 NA NA NA NA All Other Cos. NA NA NA NA NA NA NA NA 1,011,908 932,343 631,718 263,456
Alabama 221,742 203,579 151,266 45,569 26,348 24,881 20,071 4,148 AL
Arizona 79,651 55,988 2,066 53,793 98,638 94,007 63,818 30,160 AZArkansas 49,308 42,263 30,707 11,172 27,274 27,471 22,233 5,237 ARCalifornia 1,009,655 750,743 401,012 343,933 513,929 502,282 344,573 157,277 CA
Colorado 89,717 93,126 33,686 59,446 86,096 89,121 63,020 26,100 COConnecticut 76,948 63,932 23,928 40,004 55,567 50,841 28,015 22,826 CTDelaware 19,085 16,228 8,029 8,199 12,102 11,282 7,012 4,270 DE
District of Columbia 48,799 48,971 16,545 32,426 60,766 57,375 37,853 19,522 DCFlorida 605,918 518,058 316,942 201,014 381,019 352,555 260,229 92,325 161,807 154,283 89,055 65,228 FLGeorgia 332,101 373,719 274,807 98,991 99,130 98,678 80,944 17,733 40,376 38,425 31,881 5,602 GA
Hawaii 29,486 21,370 3,788 17,511 33,351 25,649 21,244 4,392 HIIdaho 55,938 45,953 21,381 22,512 15,475 16,607 9,782 6,313 IDIllinois 640,328 624,375 452,140 172,231 209,257 206,344 158,510 47,834 IL
Indiana 296,510 240,339 152,370 87,951 115,838 109,153 78,907 30,243 25,519 23,140 15,055 8,085 INIowa 43,113 44,265 22,113 22,152 36,985 36,279 24,122 12,157 IAKansas 71,424 68,959 48,626 19,924 65,989 64,368 49,545 14,822 KS
Kentucky 165,504 130,063 86,063 41,969 81,436 77,155 58,188 18,445 17,592 19,430 16,893 2,521 KYLouisiana 175,557 182,370 140,681 41,713 108,084 110,482 87,461 23,020 LAMaine 34,997 29,175 14,914 14,264 32,215 32,197 21,839 10,359 ME
Maryland 180,817 165,343 114,448 50,896 174,287 132,023 91,646 40,377 MDMassachusetts 166,468 149,953 97,787 52,197 106,237 105,224 69,476 35,749 MAMichigan 544,582 454,592 311,536 142,901 156,173 154,358 119,706 34,652 MIMinnesota 101,263 85,501 33,079 52,426 26,945 26,538 16,019 10,518 MN
Mississippi 141,940 158,815 139,505 19,333 42,898 43,811 35,013 8,798 MSMissouri 177,156 164,788 101,493 57,661 146,158 138,883 115,499 22,885 25,711 24,681 15,727 8,953 MOMontana 26,709 27,420 19,048 8,372 12,773 12,535 8,595 3,940 MT
Nebraska 29,966 34,393 21,891 12,503 15,371 13,664 11,802 1,862 30,506 25,228 20,192 5,036 NENevada 4,912 4,090 (6,048) 9,601 8,114 7,761 6,754 1,008 19,411 19,724 5,637 14,086 NVNew Hampshire 47,790 46,011 26,105 19,913 10,680 10,689 6,424 4,265 NH
New Jersey 291,284 241,372 116,633 124,739 179,460 150,549 90,364 60,186 21,871 22,120 14,313 7,807 NJNew Mexico 40,049 39,798 22,259 17,539 23,571 22,540 17,524 5,016 NMNew York 195,995 108,177 97,195 11,151 612,471 595,070 416,337 178,733 100,302 50,670 36,282 14,634 NY
North Carolina 216,942 195,887 128,188 67,238 108,910 102,516 81,117 21,299 152,188 143,034 109,205 33,834 NCNorth Dakota 19,105 17,799 9,255 8,546 6,609 6,442 4,874 1,568 NDOhio 282,684 288,719 167,356 121,375 168,354 162,780 141,165 21,615 199,510 202,309 154,305 47,790 OH
Oklahoma 46,780 50,805 24,445 25,936 82,350 81,463 70,469 10,993 OKOregon 7,437 (6,150) (55,623) 49,480 69,902 67,978 50,839 17,138 6,244 8,715 4,712 4,002 ORPennsylvania 279,956 213,556 84,346 129,206 264,301 240,546 182,324 58,221 100,399 99,304 49,813 13,246 PA
Rhode Island 25,328 23,014 11,942 11,079 31,098 29,905 20,118 9,788 RISouth Carolina 144,248 144,013 107,918 35,899 76,734 76,097 58,078 17,989 SCSouth Dakota 16,168 14,133 6,498 7,635 6,613 6,450 4,352 2,098 SD
Tennessee 172,845 192,152 141,136 51,035 105,933 107,837 84,222 23,615 25,447 23,047 14,339 8,709 T NTexas 621,756 466,724 329,952 132,656 536,985 530,089 452,685 77,403 39,268 31,362 20,800 10,562 T XUtah 58,171 58,262 29,300 28,962 31,866 30,624 23,408 7,216 UT
Vermont 19,038 15,221 8,930 6,292 13,240 13,127 8,739 4,388 VTVirginia 265,754 258,268 152,681 105,243 134,465 127,050 87,153 39,835 36,702 39,455 29,581 9,874 VAWashington 153,990 168,567 63,969 104,555 111,623 106,867 94,947 11,919 9,055 7,416 3,928 3,487 W AWest Virginia 59,721 57,206 37,377 19,829 47,722 50,024 38,859 11,166 W V
Wisconsin 226,593 222,666 164,837 57,827 88,634 83,323 60,268 23,054 W IWyoming 19,671 16,313 7,685 8,628 3,970 3,857 3,110 747 W YPuerto Rico 0 0 0 0 106,305 94,445 17,914 11,548 PR
Unclassified
See notes following Table 2.19.
136
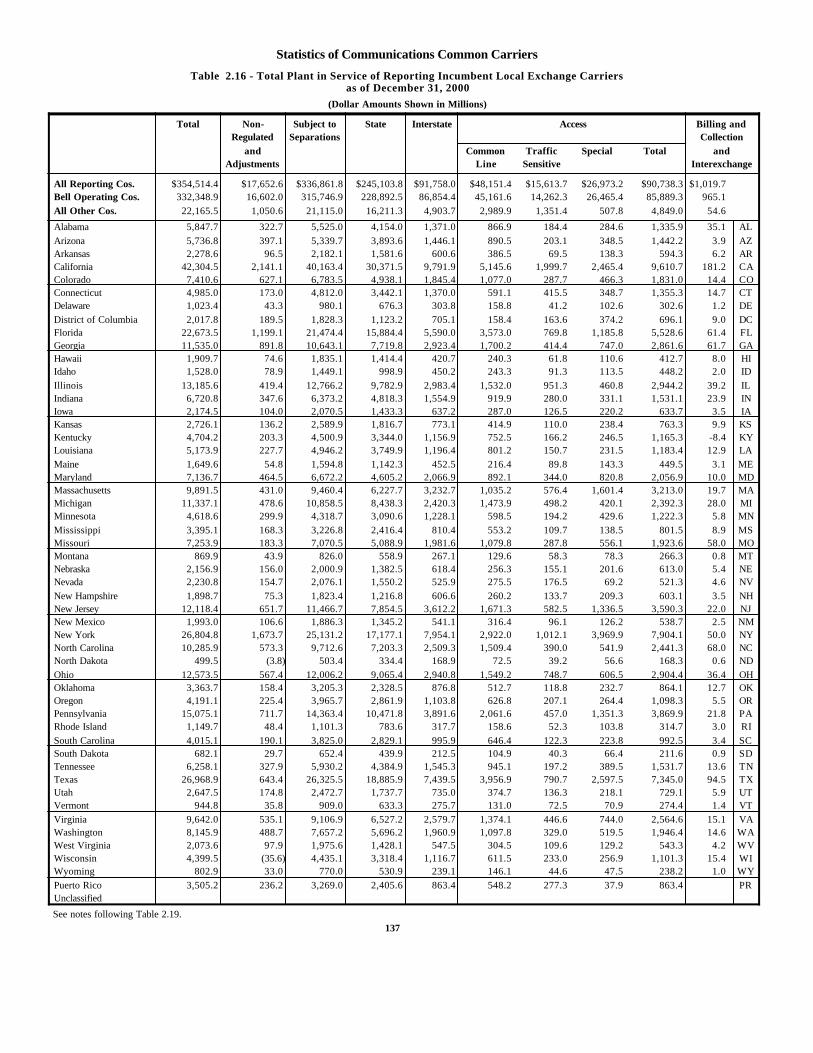
Statistics of Communications Common Carriers
Table 2.16 - Total Plant in Service of Reporting Incumbent Local Exchange Carriersas of December 31, 2000
(Dollar Amounts Shown in Millions)
Total Non- Subject to State Interstate Access Billing andRegulated Separations Collection
and Common Traffic Special Total andAdjustments Line Sensitive Interexchange
All Reporting Cos. $354,514.4 $17,652.6 $336,861.8 $245,103.8 $91,758.0 $48,151.4 $15,613.7 $26,973.2 $90,738.3 $1,019.7Bell Operating Cos. 332,348.9 16,602.0 315,746.9 228,892.5 86,854.4 45,161.6 14,262.3 26,465.4 85,889.3 965.1
All Other Cos. 22,165.5 1,050.6 21,115.0 16,211.3 4,903.7 2,989.9 1,351.4 507.8 4,849.0 54.6
Alabama 5,847.7 322.7 5,525.0 4,154.0 1,371.0 866.9 184.4 284.6 1,335.9 35.1 AL
Arizona 5,736.8 397.1 5,339.7 3,893.6 1,446.1 890.5 203.1 348.5 1,442.2 3.9 AZArkansas 2,278.6 96.5 2,182.1 1,581.6 600.6 386.5 69.5 138.3 594.3 6.2 ARCalifornia 42,304.5 2,141.1 40,163.4 30,371.5 9,791.9 5,145.6 1,999.7 2,465.4 9,610.7 181.2 CAColorado 7,410.6 627.1 6,783.5 4,938.1 1,845.4 1,077.0 287.7 466.3 1,831.0 14.4 COConnecticut 4,985.0 173.0 4,812.0 3,442.1 1,370.0 591.1 415.5 348.7 1,355.3 14.7 CTDelaware 1,023.4 43.3 980.1 676.3 303.8 158.8 41.2 102.6 302.6 1.2 DE
District of Columbia 2,017.8 189.5 1,828.3 1,123.2 705.1 158.4 163.6 374.2 696.1 9.0 DCFlorida 22,673.5 1,199.1 21,474.4 15,884.4 5,590.0 3,573.0 769.8 1,185.8 5,528.6 61.4 FLGeorgia 11,535.0 891.8 10,643.1 7,719.8 2,923.4 1,700.2 414.4 747.0 2,861.6 61.7 GAHawaii 1,909.7 74.6 1,835.1 1,414.4 420.7 240.3 61.8 110.6 412.7 8.0 HIIdaho 1,528.0 78.9 1,449.1 998.9 450.2 243.3 91.3 113.5 448.2 2.0 ID
Illinois 13,185.6 419.4 12,766.2 9,782.9 2,983.4 1,532.0 951.3 460.8 2,944.2 39.2 ILIndiana 6,720.8 347.6 6,373.2 4,818.3 1,554.9 919.9 280.0 331.1 1,531.1 23.9 INIowa 2,174.5 104.0 2,070.5 1,433.3 637.2 287.0 126.5 220.2 633.7 3.5 IAKansas 2,726.1 136.2 2,589.9 1,816.7 773.1 414.9 110.0 238.4 763.3 9.9 KSKentucky 4,704.2 203.3 4,500.9 3,344.0 1,156.9 752.5 166.2 246.5 1,165.3 -8.4 KYLouisiana 5,173.9 227.7 4,946.2 3,749.9 1,196.4 801.2 150.7 231.5 1,183.4 12.9 LA
Maine 1,649.6 54.8 1,594.8 1,142.3 452.5 216.4 89.8 143.3 449.5 3.1 MEMaryland 7,136.7 464.5 6,672.2 4,605.2 2,066.9 892.1 344.0 820.8 2,056.9 10.0 MDMassachusetts 9,891.5 431.0 9,460.4 6,227.7 3,232.7 1,035.2 576.4 1,601.4 3,213.0 19.7 MAMichigan 11,337.1 478.6 10,858.5 8,438.3 2,420.3 1,473.9 498.2 420.1 2,392.3 28.0 MIMinnesota 4,618.6 299.9 4,318.7 3,090.6 1,228.1 598.5 194.2 429.6 1,222.3 5.8 MN
Mississippi 3,395.1 168.3 3,226.8 2,416.4 810.4 553.2 109.7 138.5 801.5 8.9 MSMissouri 7,253.9 183.3 7,070.5 5,088.9 1,981.6 1,079.8 287.8 556.1 1,923.6 58.0 MOMontana 869.9 43.9 826.0 558.9 267.1 129.6 58.3 78.3 266.3 0.8 MTNebraska 2,156.9 156.0 2,000.9 1,382.5 618.4 256.3 155.1 201.6 613.0 5.4 NENevada 2,230.8 154.7 2,076.1 1,550.2 525.9 275.5 176.5 69.2 521.3 4.6 NV
New Hampshire 1,898.7 75.3 1,823.4 1,216.8 606.6 260.2 133.7 209.3 603.1 3.5 NHNew Jersey 12,118.4 651.7 11,466.7 7,854.5 3,612.2 1,671.3 582.5 1,336.5 3,590.3 22.0 NJNew Mexico 1,993.0 106.6 1,886.3 1,345.2 541.1 316.4 96.1 126.2 538.7 2.5 NMNew York 26,804.8 1,673.7 25,131.2 17,177.1 7,954.1 2,922.0 1,012.1 3,969.9 7,904.1 50.0 NYNorth Carolina 10,285.9 573.3 9,712.6 7,203.3 2,509.3 1,509.4 390.0 541.9 2,441.3 68.0 NCNorth Dakota 499.5 (3.8) 503.4 334.4 168.9 72.5 39.2 56.6 168.3 0.6 ND
Ohio 12,573.5 567.4 12,006.2 9,065.4 2,940.8 1,549.2 748.7 606.5 2,904.4 36.4 OHOklahoma 3,363.7 158.4 3,205.3 2,328.5 876.8 512.7 118.8 232.7 864.1 12.7 OKOregon 4,191.1 225.4 3,965.7 2,861.9 1,103.8 626.8 207.1 264.4 1,098.3 5.5 ORPennsylvania 15,075.1 711.7 14,363.4 10,471.8 3,891.6 2,061.6 457.0 1,351.3 3,869.9 21.8 PARhode Island 1,149.7 48.4 1,101.3 783.6 317.7 158.6 52.3 103.8 314.7 3.0 RI
South Carolina 4,015.1 190.1 3,825.0 2,829.1 995.9 646.4 122.3 223.8 992.5 3.4 SCSouth Dakota 682.1 29.7 652.4 439.9 212.5 104.9 40.3 66.4 211.6 0.9 SDTennessee 6,258.1 327.9 5,930.2 4,384.9 1,545.3 945.1 197.2 389.5 1,531.7 13.6 TNTexas 26,968.9 643.4 26,325.5 18,885.9 7,439.5 3,956.9 790.7 2,597.5 7,345.0 94.5 TXUtah 2,647.5 174.8 2,472.7 1,737.7 735.0 374.7 136.3 218.1 729.1 5.9 UTVermont 944.8 35.8 909.0 633.3 275.7 131.0 72.5 70.9 274.4 1.4 VT
Virginia 9,642.0 535.1 9,106.9 6,527.2 2,579.7 1,374.1 446.6 744.0 2,564.6 15.1 VAWashington 8,145.9 488.7 7,657.2 5,696.2 1,960.9 1,097.8 329.0 519.5 1,946.4 14.6 WAWest Virginia 2,073.6 97.9 1,975.6 1,428.1 547.5 304.5 109.6 129.2 543.3 4.2 WVWisconsin 4,399.5 (35.6) 4,435.1 3,318.4 1,116.7 611.5 233.0 256.9 1,101.3 15.4 WIWyoming 802.9 33.0 770.0 530.9 239.1 146.1 44.6 47.5 238.2 1.0 WY
Puerto Rico 3,505.2 236.2 3,269.0 2,405.6 863.4 548.2 277.3 37.9 863.4 PRUnclassified
See notes following Table 2.19.
137
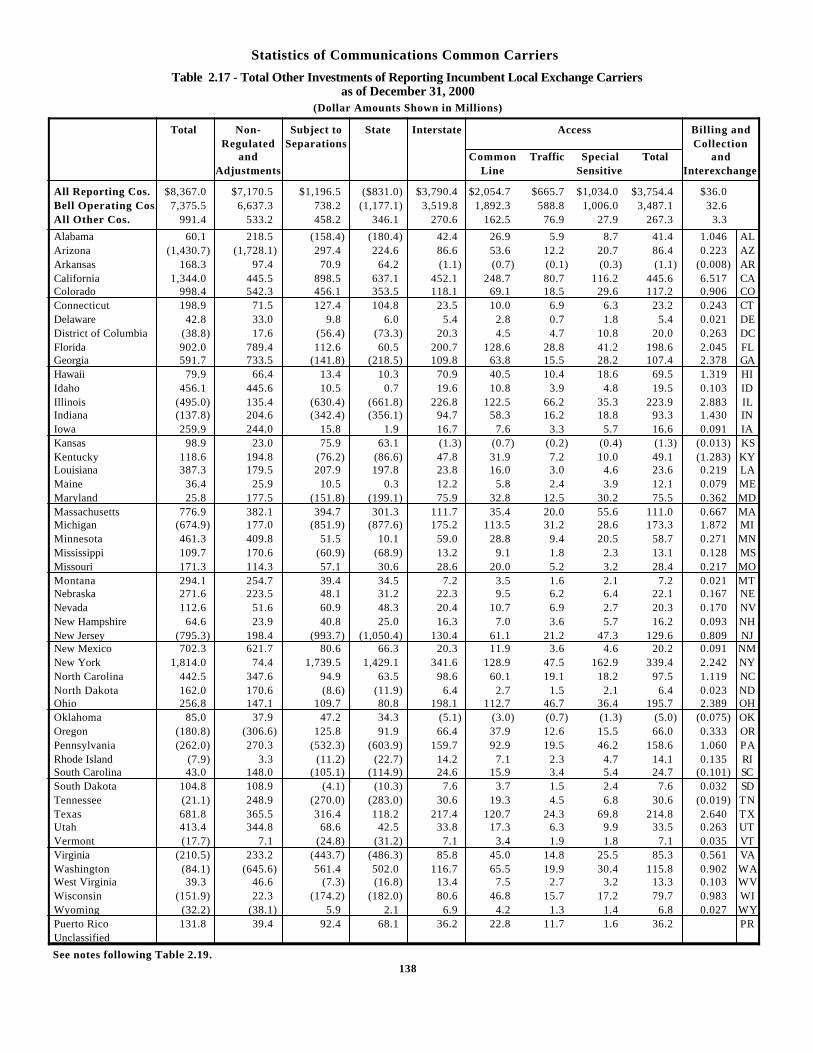
Statistics of Communications Common Carriers
Table 2.17 - Total Other Investments of Reporting Incumbent Local Exchange Carriersas of December 31, 2000
(Dollar Amounts Shown in Millions)
Total Non- Subject to State Interstate Access Billing andRegulated Separations Collection
and Common Traffic Special Total andAdjustments Line Sensitive Interexchange
All Reporting Cos. $8,367.0 $7,170.5 $1,196.5 ($831.0) $3,790.4 $2,054.7 $665.7 $1,034.0 $3,754.4 $36.0Bell Operating Cos. 7,375.5 6,637.3 738.2 (1,177.1) 3,519.8 1,892.3 588.8 1,006.0 3,487.1 32.6All Other Cos. 991.4 533.2 458.2 346.1 270.6 162.5 76.9 27.9 267.3 3.3
Alabama 60.1 218.5 (158.4) (180.4) 42.4 26.9 5.9 8.7 41.4 1.046 ALArizona (1,430.7) (1,728.1) 297.4 224.6 86.6 53.6 12.2 20.7 86.4 0.223 AZArkansas 168.3 97.4 70.9 64.2 (1.1) (0.7) (0.1) (0.3) (1.1) (0.008) ARCalifornia 1,344.0 445.5 898.5 637.1 452.1 248.7 80.7 116.2 445.6 6.517 CAColorado 998.4 542.3 456.1 353.5 118.1 69.1 18.5 29.6 117.2 0.906 COConnecticut 198.9 71.5 127.4 104.8 23.5 10.0 6.9 6.3 23.2 0.243 CTDelaware 42.8 33.0 9.8 6.0 5.4 2.8 0.7 1.8 5.4 0.021 DEDistrict of Columbia (38.8) 17.6 (56.4) (73.3) 20.3 4.5 4.7 10.8 20.0 0.263 DCFlorida 902.0 789.4 112.6 60.5 200.7 128.6 28.8 41.2 198.6 2.045 FLGeorgia 591.7 733.5 (141.8) (218.5) 109.8 63.8 15.5 28.2 107.4 2.378 GAHawaii 79.9 66.4 13.4 10.3 70.9 40.5 10.4 18.6 69.5 1.319 HIIdaho 456.1 445.6 10.5 0.7 19.6 10.8 3.9 4.8 19.5 0.103 IDIllinois (495.0) 135.4 (630.4) (661.8) 226.8 122.5 66.2 35.3 223.9 2.883 ILIndiana (137.8) 204.6 (342.4) (356.1) 94.7 58.3 16.2 18.8 93.3 1.430 INIowa 259.9 244.0 15.8 1.9 16.7 7.6 3.3 5.7 16.6 0.091 IAKansas 98.9 23.0 75.9 63.1 (1.3) (0.7) (0.2) (0.4) (1.3) (0.013) KSKentucky 118.6 194.8 (76.2) (86.6) 47.8 31.9 7.2 10.0 49.1 (1.283) KYLouisiana 387.3 179.5 207.9 197.8 23.8 16.0 3.0 4.6 23.6 0.219 LAMaine 36.4 25.9 10.5 0.3 12.2 5.8 2.4 3.9 12.1 0.079 MEMaryland 25.8 177.5 (151.8) (199.1) 75.9 32.8 12.5 30.2 75.5 0.362 MDMassachusetts 776.9 382.1 394.7 301.3 111.7 35.4 20.0 55.6 111.0 0.667 MAMichigan (674.9) 177.0 (851.9) (877.6) 175.2 113.5 31.2 28.6 173.3 1.872 MIMinnesota 461.3 409.8 51.5 10.1 59.0 28.8 9.4 20.5 58.7 0.271 MNMississippi 109.7 170.6 (60.9) (68.9) 13.2 9.1 1.8 2.3 13.1 0.128 MSMissouri 171.3 114.3 57.1 30.6 28.6 20.0 5.2 3.2 28.4 0.217 MOMontana 294.1 254.7 39.4 34.5 7.2 3.5 1.6 2.1 7.2 0.021 MTNebraska 271.6 223.5 48.1 31.2 22.3 9.5 6.2 6.4 22.1 0.167 NENevada 112.6 51.6 60.9 48.3 20.4 10.7 6.9 2.7 20.3 0.170 NVNew Hampshire 64.6 23.9 40.8 25.0 16.3 7.0 3.6 5.7 16.2 0.093 NHNew Jersey (795.3) 198.4 (993.7) (1,050.4) 130.4 61.1 21.2 47.3 129.6 0.809 NJNew Mexico 702.3 621.7 80.6 66.3 20.3 11.9 3.6 4.6 20.2 0.091 NMNew York 1,814.0 74.4 1,739.5 1,429.1 341.6 128.9 47.5 162.9 339.4 2.242 NYNorth Carolina 442.5 347.6 94.9 63.5 98.6 60.1 19.1 18.2 97.5 1.119 NCNorth Dakota 162.0 170.6 (8.6) (11.9) 6.4 2.7 1.5 2.1 6.4 0.023 NDOhio 256.8 147.1 109.7 80.8 198.1 112.7 46.7 36.4 195.7 2.389 OHOklahoma 85.0 37.9 47.2 34.3 (5.1) (3.0) (0.7) (1.3) (5.0) (0.075) OKOregon (180.8) (306.6) 125.8 91.9 66.4 37.9 12.6 15.5 66.0 0.333 ORPennsylvania (262.0) 270.3 (532.3) (603.9) 159.7 92.9 19.5 46.2 158.6 1.060 PARhode Island (7.9) 3.3 (11.2) (22.7) 14.2 7.1 2.3 4.7 14.1 0.135 RISouth Carolina 43.0 148.0 (105.1) (114.9) 24.6 15.9 3.4 5.4 24.7 (0.101) SCSouth Dakota 104.8 108.9 (4.1) (10.3) 7.6 3.7 1.5 2.4 7.6 0.032 SDTennessee (21.1) 248.9 (270.0) (283.0) 30.6 19.3 4.5 6.8 30.6 (0.019) TNTexas 681.8 365.5 316.4 118.2 217.4 120.7 24.3 69.8 214.8 2.640 TXUtah 413.4 344.8 68.6 42.5 33.8 17.3 6.3 9.9 33.5 0.263 UTVermont (17.7) 7.1 (24.8) (31.2) 7.1 3.4 1.9 1.8 7.1 0.035 VTVirginia (210.5) 233.2 (443.7) (486.3) 85.8 45.0 14.8 25.5 85.3 0.561 VAWashington (84.1) (645.6) 561.4 502.0 116.7 65.5 19.9 30.4 115.8 0.902 WAWest Virginia 39.3 46.6 (7.3) (16.8) 13.4 7.5 2.7 3.2 13.3 0.103 WVWisconsin (151.9) 22.3 (174.2) (182.0) 80.6 46.8 15.7 17.2 79.7 0.983 WIWyoming (32.2) (38.1) 5.9 2.1 6.9 4.2 1.3 1.4 6.8 0.027 WYPuerto Rico 131.8 39.4 92.4 68.1 36.2 22.8 11.7 1.6 36.2 PRUnclassified
See notes following Table 2.19.138
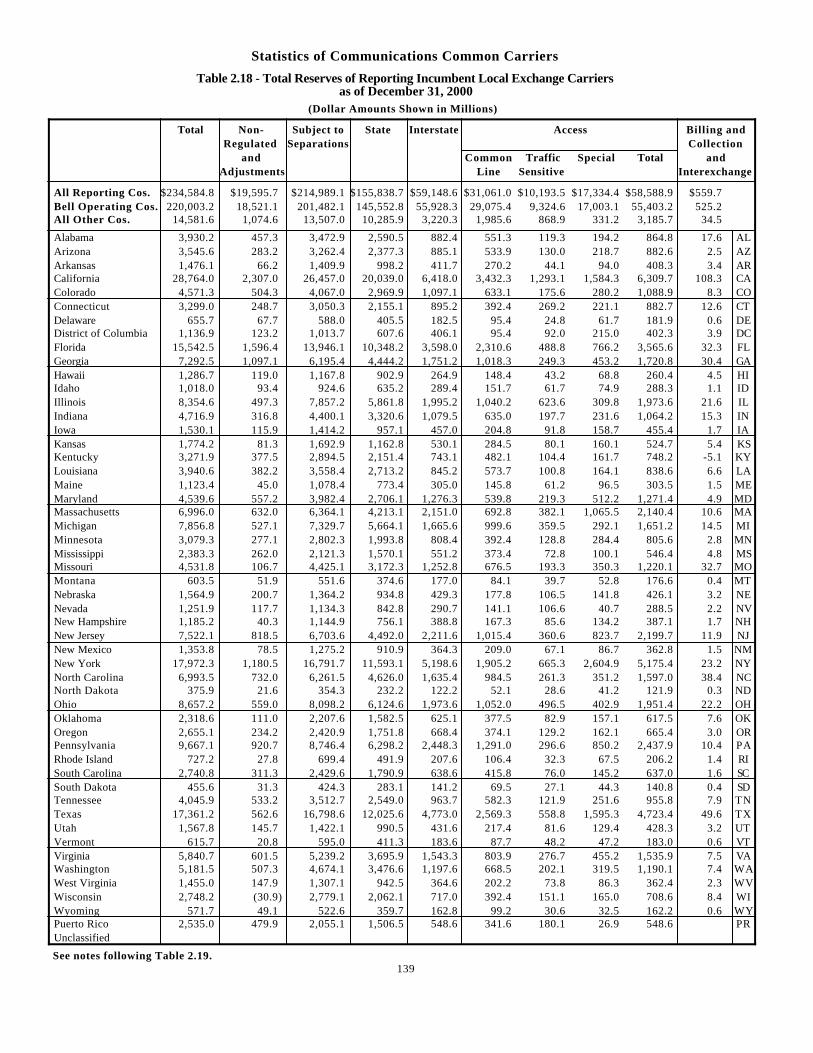
Statistics of Communications Common Carriers
Table 2.18 - Total Reserves of Reporting Incumbent Local Exchange Carriersas of December 31, 2000
(Dollar Amounts Shown in Millions)
Total Non- Subject to State Interstate Access Billing andRegulated Separations Collection
and Common Traffic Special Total andAdjustments Line Sensitive Interexchange
All Reporting Cos. $234,584.8 $19,595.7 $214,989.1 $155,838.7 $59,148.6 $31,061.0 $10,193.5 $17,334.4 $58,588.9 $559.7Bell Operating Cos. 220,003.2 18,521.1 201,482.1 145,552.8 55,928.3 29,075.4 9,324.6 17,003.1 55,403.2 525.2All Other Cos. 14,581.6 1,074.6 13,507.0 10,285.9 3,220.3 1,985.6 868.9 331.2 3,185.7 34.5
Alabama 3,930.2 457.3 3,472.9 2,590.5 882.4 551.3 119.3 194.2 864.8 17.6 ALArizona 3,545.6 283.2 3,262.4 2,377.3 885.1 533.9 130.0 218.7 882.6 2.5 AZArkansas 1,476.1 66.2 1,409.9 998.2 411.7 270.2 44.1 94.0 408.3 3.4 ARCalifornia 28,764.0 2,307.0 26,457.0 20,039.0 6,418.0 3,432.3 1,293.1 1,584.3 6,309.7 108.3 CAColorado 4,571.3 504.3 4,067.0 2,969.9 1,097.1 633.1 175.6 280.2 1,088.9 8.3 COConnecticut 3,299.0 248.7 3,050.3 2,155.1 895.2 392.4 269.2 221.1 882.7 12.6 CTDelaware 655.7 67.7 588.0 405.5 182.5 95.4 24.8 61.7 181.9 0.6 DEDistrict of Columbia 1,136.9 123.2 1,013.7 607.6 406.1 95.4 92.0 215.0 402.3 3.9 DCFlorida 15,542.5 1,596.4 13,946.1 10,348.2 3,598.0 2,310.6 488.8 766.2 3,565.6 32.3 FLGeorgia 7,292.5 1,097.1 6,195.4 4,444.2 1,751.2 1,018.3 249.3 453.2 1,720.8 30.4 GAHawaii 1,286.7 119.0 1,167.8 902.9 264.9 148.4 43.2 68.8 260.4 4.5 HIIdaho 1,018.0 93.4 924.6 635.2 289.4 151.7 61.7 74.9 288.3 1.1 IDIllinois 8,354.6 497.3 7,857.2 5,861.8 1,995.2 1,040.2 623.6 309.8 1,973.6 21.6 ILIndiana 4,716.9 316.8 4,400.1 3,320.6 1,079.5 635.0 197.7 231.6 1,064.2 15.3 INIowa 1,530.1 115.9 1,414.2 957.1 457.0 204.8 91.8 158.7 455.4 1.7 IAKansas 1,774.2 81.3 1,692.9 1,162.8 530.1 284.5 80.1 160.1 524.7 5.4 KSKentucky 3,271.9 377.5 2,894.5 2,151.4 743.1 482.1 104.4 161.7 748.2 -5.1 KYLouisiana 3,940.6 382.2 3,558.4 2,713.2 845.2 573.7 100.8 164.1 838.6 6.6 LAMaine 1,123.4 45.0 1,078.4 773.4 305.0 145.8 61.2 96.5 303.5 1.5 MEMaryland 4,539.6 557.2 3,982.4 2,706.1 1,276.3 539.8 219.3 512.2 1,271.4 4.9 MDMassachusetts 6,996.0 632.0 6,364.1 4,213.1 2,151.0 692.8 382.1 1,065.5 2,140.4 10.6 MAMichigan 7,856.8 527.1 7,329.7 5,664.1 1,665.6 999.6 359.5 292.1 1,651.2 14.5 MIMinnesota 3,079.3 277.1 2,802.3 1,993.8 808.4 392.4 128.8 284.4 805.6 2.8 MNMississippi 2,383.3 262.0 2,121.3 1,570.1 551.2 373.4 72.8 100.1 546.4 4.8 MSMissouri 4,531.8 106.7 4,425.1 3,172.3 1,252.8 676.5 193.3 350.3 1,220.1 32.7 MOMontana 603.5 51.9 551.6 374.6 177.0 84.1 39.7 52.8 176.6 0.4 MTNebraska 1,564.9 200.7 1,364.2 934.8 429.3 177.8 106.5 141.8 426.1 3.2 NENevada 1,251.9 117.7 1,134.3 842.8 290.7 141.1 106.6 40.7 288.5 2.2 NVNew Hampshire 1,185.2 40.3 1,144.9 756.1 388.8 167.3 85.6 134.2 387.1 1.7 NHNew Jersey 7,522.1 818.5 6,703.6 4,492.0 2,211.6 1,015.4 360.6 823.7 2,199.7 11.9 NJNew Mexico 1,353.8 78.5 1,275.2 910.9 364.3 209.0 67.1 86.7 362.8 1.5 NMNew York 17,972.3 1,180.5 16,791.7 11,593.1 5,198.6 1,905.2 665.3 2,604.9 5,175.4 23.2 NYNorth Carolina 6,993.5 732.0 6,261.5 4,626.0 1,635.4 984.5 261.3 351.2 1,597.0 38.4 NCNorth Dakota 375.9 21.6 354.3 232.2 122.2 52.1 28.6 41.2 121.9 0.3 NDOhio 8,657.2 559.0 8,098.2 6,124.6 1,973.6 1,052.0 496.5 402.9 1,951.4 22.2 OHOklahoma 2,318.6 111.0 2,207.6 1,582.5 625.1 377.5 82.9 157.1 617.5 7.6 OKOregon 2,655.1 234.2 2,420.9 1,751.8 668.4 374.1 129.2 162.1 665.4 3.0 ORPennsylvania 9,667.1 920.7 8,746.4 6,298.2 2,448.3 1,291.0 296.6 850.2 2,437.9 10.4 PARhode Island 727.2 27.8 699.4 491.9 207.6 106.4 32.3 67.5 206.2 1.4 RISouth Carolina 2,740.8 311.3 2,429.6 1,790.9 638.6 415.8 76.0 145.2 637.0 1.6 SCSouth Dakota 455.6 31.3 424.3 283.1 141.2 69.5 27.1 44.3 140.8 0.4 SDTennessee 4,045.9 533.2 3,512.7 2,549.0 963.7 582.3 121.9 251.6 955.8 7.9 TNTexas 17,361.2 562.6 16,798.6 12,025.6 4,773.0 2,569.3 558.8 1,595.3 4,723.4 49.6 TXUtah 1,567.8 145.7 1,422.1 990.5 431.6 217.4 81.6 129.4 428.3 3.2 UTVermont 615.7 20.8 595.0 411.3 183.6 87.7 48.2 47.2 183.0 0.6 VTVirginia 5,840.7 601.5 5,239.2 3,695.9 1,543.3 803.9 276.7 455.2 1,535.9 7.5 VAWashington 5,181.5 507.3 4,674.1 3,476.6 1,197.6 668.5 202.1 319.5 1,190.1 7.4 WAWest Virginia 1,455.0 147.9 1,307.1 942.5 364.6 202.2 73.8 86.3 362.4 2.3 WVWisconsin 2,748.2 (30.9) 2,779.1 2,062.1 717.0 392.4 151.1 165.0 708.6 8.4 WIWyoming 571.7 49.1 522.6 359.7 162.8 99.2 30.6 32.5 162.2 0.6 WYPuerto Rico 2,535.0 479.9 2,055.1 1,506.5 548.6 341.6 180.1 26.9 548.6 PRUnclassified
See notes following Table 2.19.139
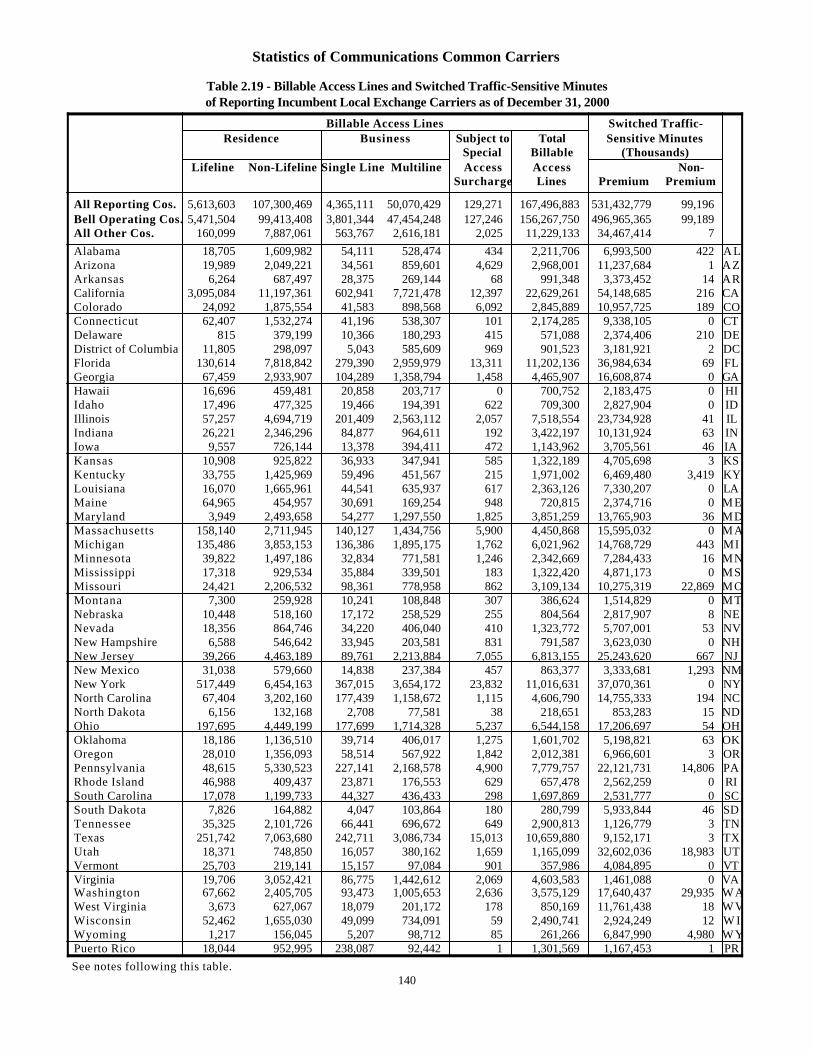
Statistics of Communications Common Carriers
Table 2.19 - Billable Access Lines and Switched Traffic-Sensitive Minutesof Reporting Incumbent Local Exchange Carriers as of December 31, 2000
Billable Access Lines Switched Traffic-Residence Business Subject to Total Sensitive Minutes
Special Billable (Thousands)Lifeline Non-Lifeline Single Line Multiline Access Access Non-
Surcharge Lines Premium Premium
All Reporting Cos. 5,613,603 107,300,469 4,365,111 50,070,429 129,271 167,496,883 531,432,779 99,196Bell Operating Cos. 5,471,504 99,413,408 3,801,344 47,454,248 127,246 156,267,750 496,965,365 99,189All Other Cos. 160,099 7,887,061 563,767 2,616,181 2,025 11,229,133 34,467,414 7
Alabama 18,705 1,609,982 54,111 528,474 434 2,211,706 6,993,500 422 A LArizona 19,989 2,049,221 34,561 859,601 4,629 2,968,001 11,237,684 1 A ZArkansas 6,264 687,497 28,375 269,144 68 991,348 3,373,452 14 ARCalifornia 3,095,084 11,197,361 602,941 7,721,478 12,397 22,629,261 54,148,685 216 CAColorado 24,092 1,875,554 41,583 898,568 6,092 2,845,889 10,957,725 189 COConnecticut 62,407 1,532,274 41,196 538,307 101 2,174,285 9,338,105 0 CTDelaware 815 379,199 10,366 180,293 415 571,088 2,374,406 210 DEDistrict of Columbia 11,805 298,097 5,043 585,609 969 901,523 3,181,921 2 DCFlorida 130,614 7,818,842 279,390 2,959,979 13,311 11,202,136 36,984,634 69 FLGeorgia 67,459 2,933,907 104,289 1,358,794 1,458 4,465,907 16,608,874 0 GAHawaii 16,696 459,481 20,858 203,717 0 700,752 2,183,475 0 HIIdaho 17,496 477,325 19,466 194,391 622 709,300 2,827,904 0 IDIllinois 57,257 4,694,719 201,409 2,563,112 2,057 7,518,554 23,734,928 41 ILIndiana 26,221 2,346,296 84,877 964,611 192 3,422,197 10,131,924 63 INIowa 9,557 726,144 13,378 394,411 472 1,143,962 3,705,561 46 IAKansas 10,908 925,822 36,933 347,941 585 1,322,189 4,705,698 3 KSKentucky 33,755 1,425,969 59,496 451,567 215 1,971,002 6,469,480 3,419 KYLouisiana 16,070 1,665,961 44,541 635,937 617 2,363,126 7,330,207 0 LAMaine 64,965 454,957 30,691 169,254 948 720,815 2,374,716 0 MEMaryland 3,949 2,493,658 54,277 1,297,550 1,825 3,851,259 13,765,903 36 MDMassachusetts 158,140 2,711,945 140,127 1,434,756 5,900 4,450,868 15,595,032 0 MAMichigan 135,486 3,853,153 136,386 1,895,175 1,762 6,021,962 14,768,729 443 MIMinnesota 39,822 1,497,186 32,834 771,581 1,246 2,342,669 7,284,433 16 MNMississippi 17,318 929,534 35,884 339,501 183 1,322,420 4,871,173 0 MSMissouri 24,421 2,206,532 98,361 778,958 862 3,109,134 10,275,319 22,869 MOMontana 7,300 259,928 10,241 108,848 307 386,624 1,514,829 0 MTNebraska 10,448 518,160 17,172 258,529 255 804,564 2,817,907 8 NENevada 18,356 864,746 34,220 406,040 410 1,323,772 5,707,001 53 NVNew Hampshire 6,588 546,642 33,945 203,581 831 791,587 3,623,030 0 NHNew Jersey 39,266 4,463,189 89,761 2,213,884 7,055 6,813,155 25,243,620 667 NJNew Mexico 31,038 579,660 14,838 237,384 457 863,377 3,333,681 1,293 NMNew York 517,449 6,454,163 367,015 3,654,172 23,832 11,016,631 37,070,361 0 NYNorth Carolina 67,404 3,202,160 177,439 1,158,672 1,115 4,606,790 14,755,333 194 NCNorth Dakota 6,156 132,168 2,708 77,581 38 218,651 853,283 15 NDOhio 197,695 4,449,199 177,699 1,714,328 5,237 6,544,158 17,206,697 54 OHOklahoma 18,186 1,136,510 39,714 406,017 1,275 1,601,702 5,198,821 63 OKOregon 28,010 1,356,093 58,514 567,922 1,842 2,012,381 6,966,601 3 ORPennsylvania 48,615 5,330,523 227,141 2,168,578 4,900 7,779,757 22,121,731 14,806 PARhode Island 46,988 409,437 23,871 176,553 629 657,478 2,562,259 0 RISouth Carolina 17,078 1,199,733 44,327 436,433 298 1,697,869 2,531,777 0 SCSouth Dakota 7,826 164,882 4,047 103,864 180 280,799 5,933,844 46 SDTennessee 35,325 2,101,726 66,441 696,672 649 2,900,813 1,126,779 3 TNTexas 251,742 7,063,680 242,711 3,086,734 15,013 10,659,880 9,152,171 3 TXUtah 18,371 748,850 16,057 380,162 1,659 1,165,099 32,602,036 18,983 UTVermont 25,703 219,141 15,157 97,084 901 357,986 4,084,895 0 VTVirginia 19,706 3,052,421 86,775 1,442,612 2,069 4,603,583 1,461,088 0 VAWashington 67,662 2,405,705 93,473 1,005,653 2,636 3,575,129 17,640,437 29,935 W AWest Virginia 3,673 627,067 18,079 201,172 178 850,169 11,761,438 18 W VWisconsin 52,462 1,655,030 49,099 734,091 59 2,490,741 2,924,249 12 W IWyoming 1,217 156,045 5,207 98,712 85 261,266 6,847,990 4,980 W YPuerto Rico 18,044 952,995 238,087 92,442 1 1,301,569 1,167,453 1 PR
See notes following this table.140

Statistics of Communications Common Carriers
Notes for Tables 2.12 through 2.19
Data for these tables were obtained from the ARMIS (Automated Reporting Management Information System) reports(FCC Report 43-01) filed by incumbent local exchange companies with operating revenues for the year 1999 equal to orin excess of $114 million. The FCC's Accounting Review Order, 14 Rcd 11396 (1999), established streamlined reportingrequirements for mid-sized incumbent local exchange carriers (ILECs) beginning in the 1999 reporting year. A mid-sizedcarrier is a carrier whose annual operating revenues either individually or when aggregated with those of any ILEC itcontrols, is controlled by, or with which it is under common control, are less than $7 billion.
The reports are filed on a study-area basis and include financial and operational data on revenues, expenses, investment,access lines and minutes of use.
Information presented in these tables was received from 9 companies for 121 study areas representing all the states (exceptAlaska), the District of Columbia and the Commonwealth of Puerto Rico. One small GTE (now Verizon) study area coversportions of states; data from this study area are labeled unclassified. Data for all tables are derived from the 2000 calendar-year submissions from the companies.
Detail may not match totals because of necessary roundings.
Detail and totals shown may not match detail or totals shown elsewhere in this publication or from sources which have similardata element names. Some of the reasons are:
1. The Commission's instructions to the companies as to which data sub-elements should be included when reporting aparticular data element may vary among the different ARMIS reports.
2. Some companies may interpret the Commission's instructions differently.
3. Some companies may use different internal data bases to compile data for different ARMIS reports; e.g., Qwestincludes data for Malheur Telephone Company in its 43-01 data submission for the company's Oregon study area; however,the company does not include data from Malheur in its 43-02 (ARMIS USOA report) data submission, which is aggregatedat the total company level.
4. Some companies discover discrepancies and refile data for one ARMIS report but not another.
5. Tables 2.12 - 2.19 do not include Commonwealth Telephone Company since that carrier does not provide data for allcolumns requested in the ARMIS 43-01.
Both Commission and company personnel are working to detect and correct discrepancies in the data and to clarify thereporting requirements.
The nine companies that filed ARMIS 43-01 data from which these tables were derived are:
Large Incumbent LECs Mid-Sized Incumbent LECs
1. BellSouth Corporation 5. ALLTEL Corporation 2. Qwest Corporation 6. Cincinnati Bell Telephone Co. 3. SBC Communications, Inc. 7. Citizens Utilities Company and subsidiaries 4. Verizon Corporation 8. Frontier Telephone of Rochester, Inc.
9. Sprint Corporation
141
Statistics of Communications Common Carriers
Notes for Tables 2.12 through 2.18
The total column reflects the operating results for each of the rows itemized in these tables, and it includes all regulated andnonregulated company operations for each row. These amounts are presented prior to separation between state andinterstate jurisdictions.
Subtracting all non-regulated and adjustments from the total column gives the subject-to-separations column, which reflectsthat portion of each row that must be allocated between state and interstate jurisdictions pursuant to part 36 of theCommission's rules.
The state and interstate columns reflect the allocation of the amount in the subject-to-separations column into its state andinterstate components pursuant to those rules. In some instances, the interstate column also reflects Commission-prescribed adjustments made after the separations process. These adjustments are made only at the interstate level; consequently, thestate and interstate columns may not necessarily add up to the subject-to-separations column.
All the remaining columns concern the further sub-division of the interstate column amount into various elements pursuant topart 69 of the Commission's rules.
The common line access element columns reflect costs that are recovered through subscriber line charges and a carriercommon line charge assessed upon all interexchange carriers that use local exchange common line facilities for the provisionof interstate or foreign telecommunications services. These costs are allocated to the pay telephone or inside wire columnswhere applicable, with any residual allocated to the base factor portion column. For some rows where no allocation isspecified, the entire common line cost is shown in the total column.
The traffic-sensitive access element columns reflect costs associated with traffic-sensitive plant engineered to handle theanticipated volume of calls. The switching column reflects that portion of each row associated with the connection of tolllines, or toll lines to local central offices, exclusive of equal access costs if the exchange carrier has a separate equal accesselement. The equal access column includes only initial incremental expenditures for hardware and other equipment, andinitial incremental presubscription costs related to the provision of equal access which would not be required absent theprovision of equal access. This column applies to only those carriers having a separate equal access rate element. Thetransport column reflects that portion of each line item applicable to charges assessed upon all interexchange carriers whouse switching or transport facilities that are apportioned to the transport element or elements for purposes of apportioningnet investment. The information column reflects that portion of each row applicable to charges assessed upon all inter-exchange carriers that are connected to assistance boards through interexchange directory assistance trunks.
The special access column reflects that portion of each row applicable to the total of all sub-elements that have been established for the use of equipment or facilities assigned to the special access element for purposes of apportioning netinvestment.
The total access column reflects the sum of the common line total column, the traffic-sensitive total column, and the specialthe special access column.
The billing and collection column reflects that portion of each row applicable to billing and collection services.
The interexchange column reflects that portion of each row applicable to interexchange services.
The mid-sized LECs do not file rows 1340, 1350, and 1360 in Table 2.12.
The mid-sized LECs do not file rows 1410, 1420, 1490, and 1590 for taxes, but file row 1595, federal, state, and other. Thisis reflected in Tables 2.12 and 2.15.
142
Statistics of Communications Common Carriers
Notes for Table 2.19
Billable Access Lines
Figures for billable access lines reported in the ARMIS 43-01 report for some companies are slightly differentfrom figures for switched access lines reported in the ARMIS 43-08 report for a variety of reasons, includingdifferent reporting requirements, the interpretation of those requirements by the various companies, and themethods different companies use to calculate the number of lines. The majority of the differences come fromthe fact that WATS, WATS-like, and derived ISDN channels are not treated as billable access lines in the ARMIS 43-01, but are included in the count of access lines in the ARMIS 43-08. Some companies may haveincluded company official lines in their ARMIS 43-08 report.
Definitions of the billable access columns in the table follow:
1. Residence lifeline - customer premises terminations (CPTs) for which the residence interstate subscriber linecharge is reduced or waived. A CPT is a line termination at the customer premise, rather than at the centraloffice. CPTs are commonly referred to as billable units.
2. Residence non-lifeline - CPTs subject to the residence interstate subscriber line charge excluding lifelineCPTs.
3. Business single line - CPTs subject to the single-line business interstate subscriber line charge, excludingcompany official, mobile radiotelephone and public telephones.
4. Business multiline - CPTs subject to the multiline business interstate subscriber line charge, includingmultiline semi-public lines, PBX trunks, Centrex CU trunks, hotel/motel LD trunks and Centrex CO lines.
5. Special access - lines subject to a $25 surcharge. The surcharge applies to lines connecting two customerpremise locations, one of which is a PBX that may connect to the public switched network.
6. Total billable access lines - the sum of the aforementioned five columns of data.
Traffic-Sensitive Minutes of Use
Total premium traffic-sensitive MOU are calculated by dividing adjusted premium line termination revenuesby the line termination rate, calculated pursuant to section 69.205 of the FCC rules.
Total non-premium traffic-sensitive MOU are calculated by dividing the adjusted non-premium traffic-sensitiveline termination revenues by the product of the line termination rate and 0.45, calculated pursuant to section69.113 of the FCC rules.
143
Part 3
International Telecommunications
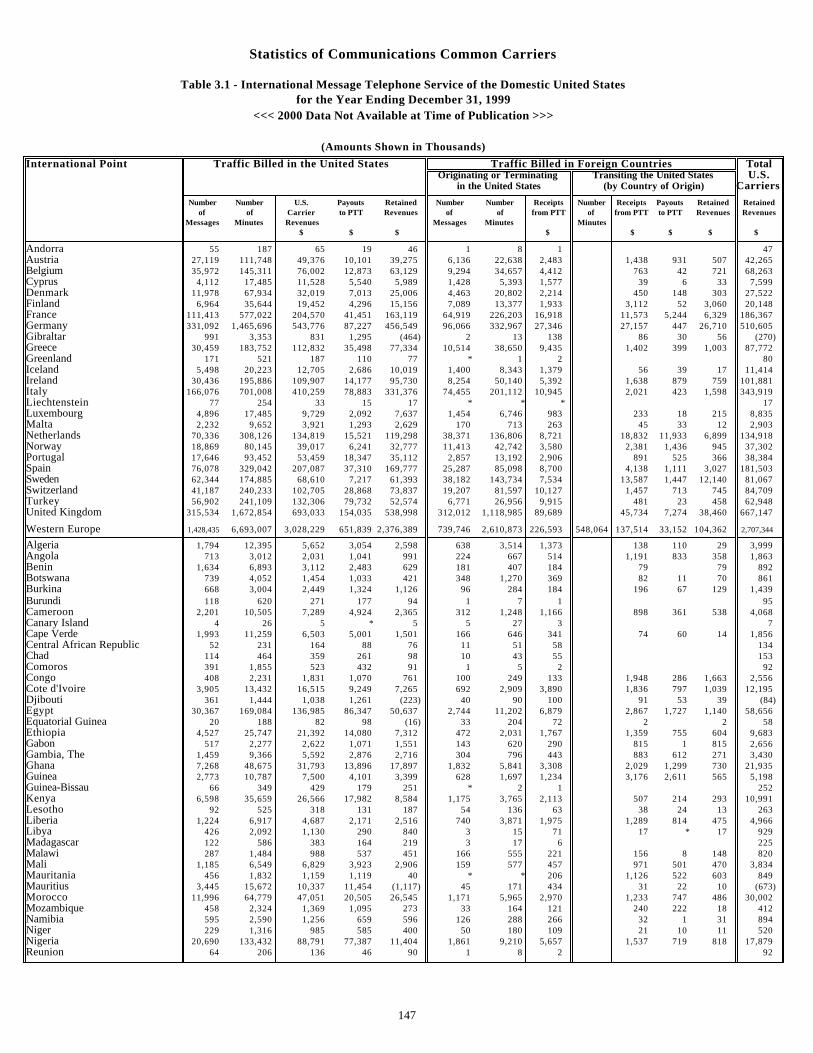
Statistics of Communications Common Carriers
Table 3.1 - International Message Telephone Service of the Domestic United Statesfor the Year Ending December 31, 1999
<<< 2000 Data Not Available at Time of Publication >>>
(Amounts Shown in Thousands)
International Point Traffic Billed in the United States Traffic Billed in Foreign Countries TotalOriginating or Terminating Transiting the United States U.S.
in the United States (by Country of Origin) Carriers
Number Number U.S. Payouts Retained Number Number Receipts Number Receipts Payouts Retained Retainedof of Carrier to PTT Revenues of of from PTT of from PTT to PTT Revenues Revenues
Messages Minutes Revenues Messages Minutes Minutes$ $ $ $ $ $ $ $
Andorra 55 187 65 19 46 1 8 1 47Austria 27,119 111,748 49,376 10,101 39,275 6,136 22,638 2,483 1,438 931 507 42,265Belgium 35,972 145,311 76,002 12,873 63,129 9,294 34,657 4,412 763 42 721 68,263Cyprus 4,112 17,485 11,528 5,540 5,989 1,428 5,393 1,577 39 6 33 7,599Denmark 11,978 67,934 32,019 7,013 25,006 4,463 20,802 2,214 450 148 303 27,522Finland 6,964 35,644 19,452 4,296 15,156 7,089 13,377 1,933 3,112 52 3,060 20,148France 111,413 577,022 204,570 41,451 163,119 64,919 226,203 16,918 11,573 5,244 6,329 186,367Germany 331,092 1,465,696 543,776 87,227 456,549 96,066 332,967 27,346 27,157 447 26,710 510,605Gibraltar 991 3,353 831 1,295 (464) 2 13 138 86 30 56 (270)Greece 30,459 183,752 112,832 35,498 77,334 10,514 38,650 9,435 1,402 399 1,003 87,772Greenland 171 521 187 110 77 * 1 2 80Iceland 5,498 20,223 12,705 2,686 10,019 1,400 8,343 1,379 56 39 17 11,414Ireland 30,436 195,886 109,907 14,177 95,730 8,254 50,140 5,392 1,638 879 759 101,881Italy 166,076 701,008 410,259 78,883 331,376 74,455 201,112 10,945 2,021 423 1,598 343,919Liechtenstein 77 254 33 15 17 * * * 17Luxembourg 4,896 17,485 9,729 2,092 7,637 1,454 6,746 983 233 18 215 8,835Malta 2,232 9,652 3,921 1,293 2,629 170 713 263 45 33 12 2,903Netherlands 70,336 308,126 134,819 15,521 119,298 38,371 136,806 8,721 18,832 11,933 6,899 134,918Norway 18,869 80,145 39,017 6,241 32,777 11,413 42,742 3,580 2,381 1,436 945 37,302Portugal 17,646 93,452 53,459 18,347 35,112 2,857 13,192 2,906 891 525 366 38,384Spain 76,078 329,042 207,087 37,310 169,777 25,287 85,098 8,700 4,138 1,111 3,027 181,503Sweden 62,344 174,885 68,610 7,217 61,393 38,182 143,734 7,534 13,587 1,447 12,140 81,067Switzerland 41,187 240,233 102,705 28,868 73,837 19,207 81,597 10,127 1,457 713 745 84,709Turkey 56,902 241,109 132,306 79,732 52,574 6,771 26,956 9,915 481 23 458 62,948United Kingdom 315,534 1,672,854 693,033 154,035 538,998 312,012 1,118,985 89,689 45,734 7,274 38,460 667,147
Western Europe 1,428,435 6,693,007 3,028,229 651,839 2,376,389 739,746 2,610,873 226,593 548,064 137,514 33,152 104,362 2,707,344
Algeria 1,794 12,395 5,652 3,054 2,598 638 3,514 1,373 138 110 29 3,999Angola 713 3,012 2,031 1,041 991 224 667 514 1,191 833 358 1,863Benin 1,634 6,893 3,112 2,483 629 181 407 184 79 79 892Botswana 739 4,052 1,454 1,033 421 348 1,270 369 82 11 70 861Burkina 668 3,004 2,449 1,324 1,126 96 284 184 196 67 129 1,439Burundi 118 620 271 177 94 1 7 1 95Cameroon 2,201 10,505 7,289 4,924 2,365 312 1,248 1,166 898 361 538 4,068Canary Island 4 26 5 * 5 5 27 3 7Cape Verde 1,993 11,259 6,503 5,001 1,501 166 646 341 74 60 14 1,856Central African Republic 52 231 164 88 76 11 51 58 134Chad 114 464 359 261 98 10 43 55 153Comoros 391 1,855 523 432 91 1 5 2 92Congo 408 2,231 1,831 1,070 761 100 249 133 1,948 286 1,663 2,556Cote d'Ivoire 3,905 13,432 16,515 9,249 7,265 692 2,909 3,890 1,836 797 1,039 12,195Djibouti 361 1,444 1,038 1,261 (223) 40 90 100 91 53 39 (84)Egypt 30,367 169,084 136,985 86,347 50,637 2,744 11,202 6,879 2,867 1,727 1,140 58,656Equatorial Guinea 20 188 82 98 (16) 33 204 72 2 2 58Ethiopia 4,527 25,747 21,392 14,080 7,312 472 2,031 1,767 1,359 755 604 9,683Gabon 517 2,277 2,622 1,071 1,551 143 620 290 815 1 815 2,656Gambia, The 1,459 9,366 5,592 2,876 2,716 304 796 443 883 612 271 3,430Ghana 7,268 48,675 31,793 13,896 17,897 1,832 5,841 3,308 2,029 1,299 730 21,935Guinea 2,773 10,787 7,500 4,101 3,399 628 1,697 1,234 3,176 2,611 565 5,198Guinea-Bissau 66 349 429 179 251 * 2 1 252Kenya 6,598 35,659 26,566 17,982 8,584 1,175 3,765 2,113 507 214 293 10,991Lesotho 92 525 318 131 187 54 136 63 38 24 13 263Liberia 1,224 6,917 4,687 2,171 2,516 740 3,871 1,975 1,289 814 475 4,966Libya 426 2,092 1,130 290 840 3 15 71 17 * 17 929Madagascar 122 586 383 164 219 3 17 6 225Malawi 287 1,484 988 537 451 166 555 221 156 8 148 820Mali 1,185 6,549 6,829 3,923 2,906 159 577 457 971 501 470 3,834Mauritania 456 1,832 1,159 1,119 40 * * 206 1,126 522 603 849Mauritius 3,445 15,672 10,337 11,454 (1,117) 45 171 434 31 22 10 (673)Morocco 11,996 64,779 47,051 20,505 26,545 1,171 5,965 2,970 1,233 747 486 30,002Mozambique 458 2,324 1,369 1,095 273 33 164 121 240 222 18 412Namibia 595 2,590 1,256 659 596 126 288 266 32 1 31 894Niger 229 1,316 985 585 400 50 180 109 21 10 11 520Nigeria 20,690 133,432 88,791 77,387 11,404 1,861 9,210 5,657 1,537 719 818 17,879Reunion 64 206 136 46 90 1 8 2 92
147
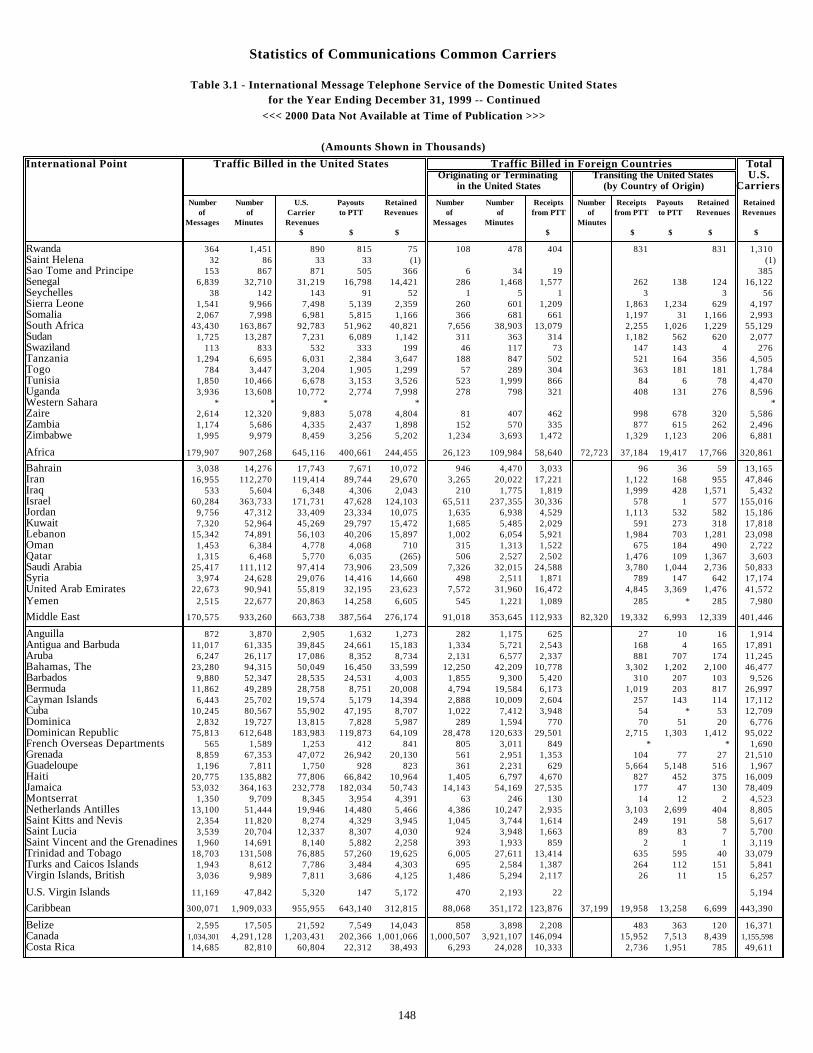
Statistics of Communications Common Carriers
Table 3.1 - International Message Telephone Service of the Domestic United Statesfor the Year Ending December 31, 1999 -- Continued
<<< 2000 Data Not Available at Time of Publication >>>
(Amounts Shown in Thousands)
International Point Traffic Billed in the United States Traffic Billed in Foreign Countries TotalOriginating or Terminating Transiting the United States U.S.
in the United States (by Country of Origin) Carriers
Number Number U.S. Payouts Retained Number Number Receipts Number Receipts Payouts Retained Retainedof of Carrier to PTT Revenues of of from PTT of from PTT to PTT Revenues Revenues
Messages Minutes Revenues Messages Minutes Minutes$ $ $ $ $ $ $ $
Rwanda 364 1,451 890 815 75 108 478 404 831 831 1,310Saint Helena 32 86 33 33 (1) (1)Sao Tome and Principe 153 867 871 505 366 6 34 19 385Senegal 6,839 32,710 31,219 16,798 14,421 286 1,468 1,577 262 138 124 16,122Seychelles 38 142 143 91 52 1 5 1 3 3 56Sierra Leone 1,541 9,966 7,498 5,139 2,359 260 601 1,209 1,863 1,234 629 4,197Somalia 2,067 7,998 6,981 5,815 1,166 366 681 661 1,197 31 1,166 2,993South Africa 43,430 163,867 92,783 51,962 40,821 7,656 38,903 13,079 2,255 1,026 1,229 55,129Sudan 1,725 13,287 7,231 6,089 1,142 311 363 314 1,182 562 620 2,077Swaziland 113 833 532 333 199 46 117 73 147 143 4 276Tanzania 1,294 6,695 6,031 2,384 3,647 188 847 502 521 164 356 4,505Togo 784 3,447 3,204 1,905 1,299 57 289 304 363 181 181 1,784Tunisia 1,850 10,466 6,678 3,153 3,526 523 1,999 866 84 6 78 4,470Uganda 3,936 13,608 10,772 2,774 7,998 278 798 321 408 131 276 8,596Western Sahara * * * * *Zaire 2,614 12,320 9,883 5,078 4,804 81 407 462 998 678 320 5,586Zambia 1,174 5,686 4,335 2,437 1,898 152 570 335 877 615 262 2,496Zimbabwe 1,995 9,979 8,459 3,256 5,202 1,234 3,693 1,472 1,329 1,123 206 6,881
Africa 179,907 907,268 645,116 400,661 244,455 26,123 109,984 58,640 72,723 37,184 19,417 17,766 320,861
Bahrain 3,038 14,276 17,743 7,671 10,072 946 4,470 3,033 96 36 59 13,165Iran 16,955 112,270 119,414 89,744 29,670 3,265 20,022 17,221 1,122 168 955 47,846Iraq 533 5,604 6,348 4,306 2,043 210 1,775 1,819 1,999 428 1,571 5,432Israel 60,284 363,733 171,731 47,628 124,103 65,511 237,355 30,336 578 1 577 155,016Jordan 9,756 47,312 33,409 23,334 10,075 1,635 6,938 4,529 1,113 532 582 15,186Kuwait 7,320 52,964 45,269 29,797 15,472 1,685 5,485 2,029 591 273 318 17,818Lebanon 15,342 74,891 56,103 40,206 15,897 1,002 6,054 5,921 1,984 703 1,281 23,098Oman 1,453 6,384 4,778 4,068 710 315 1,313 1,522 675 184 490 2,722Qatar 1,315 6,468 5,770 6,035 (265) 506 2,527 2,502 1,476 109 1,367 3,603Saudi Arabia 25,417 111,112 97,414 73,906 23,509 7,326 32,015 24,588 3,780 1,044 2,736 50,833Syria 3,974 24,628 29,076 14,416 14,660 498 2,511 1,871 789 147 642 17,174United Arab Emirates 22,673 90,941 55,819 32,195 23,623 7,572 31,960 16,472 4,845 3,369 1,476 41,572Yemen 2,515 22,677 20,863 14,258 6,605 545 1,221 1,089 285 * 285 7,980
Middle East 170,575 933,260 663,738 387,564 276,174 91,018 353,645 112,933 82,320 19,332 6,993 12,339 401,446
Anguilla 872 3,870 2,905 1,632 1,273 282 1,175 625 27 10 16 1,914Antigua and Barbuda 11,017 61,335 39,845 24,661 15,183 1,334 5,721 2,543 168 4 165 17,891Aruba 6,247 26,117 17,086 8,352 8,734 2,131 6,577 2,337 881 707 174 11,245Bahamas, The 23,280 94,315 50,049 16,450 33,599 12,250 42,209 10,778 3,302 1,202 2,100 46,477Barbados 9,880 52,347 28,535 24,531 4,003 1,855 9,300 5,420 310 207 103 9,526Bermuda 11,862 49,289 28,758 8,751 20,008 4,794 19,584 6,173 1,019 203 817 26,997Cayman Islands 6,443 25,702 19,574 5,179 14,394 2,888 10,009 2,604 257 143 114 17,112Cuba 10,245 80,567 55,902 47,195 8,707 1,022 7,412 3,948 54 * 53 12,709Dominica 2,832 19,727 13,815 7,828 5,987 289 1,594 770 70 51 20 6,776Dominican Republic 75,813 612,648 183,983 119,873 64,109 28,478 120,633 29,501 2,715 1,303 1,412 95,022French Overseas Departments 565 1,589 1,253 412 841 805 3,011 849 * * 1,690Grenada 8,859 67,353 47,072 26,942 20,130 561 2,951 1,353 104 77 27 21,510Guadeloupe 1,196 7,811 1,750 928 823 361 2,231 629 5,664 5,148 516 1,967Haiti 20,775 135,882 77,806 66,842 10,964 1,405 6,797 4,670 827 452 375 16,009Jamaica 53,032 364,163 232,778 182,034 50,743 14,143 54,169 27,535 177 47 130 78,409Montserrat 1,350 9,709 8,345 3,954 4,391 63 246 130 14 12 2 4,523Netherlands Antilles 13,100 51,444 19,946 14,480 5,466 4,386 10,247 2,935 3,103 2,699 404 8,805Saint Kitts and Nevis 2,354 11,820 8,274 4,329 3,945 1,045 3,744 1,614 249 191 58 5,617Saint Lucia 3,539 20,704 12,337 8,307 4,030 924 3,948 1,663 89 83 7 5,700Saint Vincent and the Grenadines 1,960 14,691 8,140 5,882 2,258 393 1,933 859 2 1 1 3,119Trinidad and Tobago 18,703 131,508 76,885 57,260 19,625 6,005 27,611 13,414 635 595 40 33,079Turks and Caicos Islands 1,943 8,612 7,786 3,484 4,303 695 2,584 1,387 264 112 151 5,841Virgin Islands, British 3,036 9,989 7,811 3,686 4,125 1,486 5,294 2,117 26 11 15 6,257
U.S. Virgin Islands 11,169 47,842 5,320 147 5,172 470 2,193 22 5,194
Caribbean 300,071 1,909,033 955,955 643,140 312,815 88,068 351,172 123,876 37,199 19,958 13,258 6,699 443,390
Belize 2,595 17,505 21,592 7,549 14,043 858 3,898 2,208 483 363 120 16,371Canada 1,034,301 4,291,128 1,203,431 202,366 1,001,066 1,000,507 3,921,107 146,094 15,952 7,513 8,439 1,155,598Costa Rica 14,685 82,810 60,804 22,312 38,493 6,293 24,028 10,333 2,736 1,951 785 49,611
148
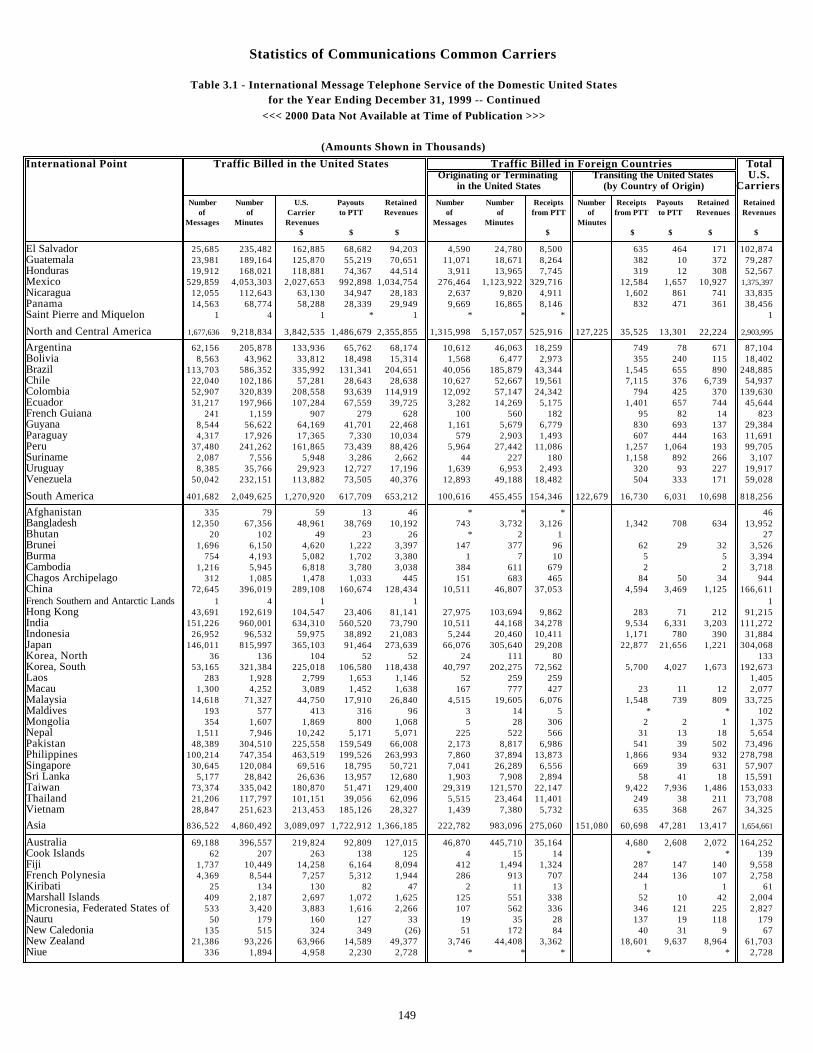
Statistics of Communications Common Carriers
Table 3.1 - International Message Telephone Service of the Domestic United Statesfor the Year Ending December 31, 1999 -- Continued
<<< 2000 Data Not Available at Time of Publication >>>
(Amounts Shown in Thousands)
International Point Traffic Billed in the United States Traffic Billed in Foreign Countries TotalOriginating or Terminating Transiting the United States U.S.
in the United States (by Country of Origin) Carriers
Number Number U.S. Payouts Retained Number Number Receipts Number Receipts Payouts Retained Retainedof of Carrier to PTT Revenues of of from PTT of from PTT to PTT Revenues Revenues
Messages Minutes Revenues Messages Minutes Minutes$ $ $ $ $ $ $ $
El Salvador 25,685 235,482 162,885 68,682 94,203 4,590 24,780 8,500 635 464 171 102,874Guatemala 23,981 189,164 125,870 55,219 70,651 11,071 18,671 8,264 382 10 372 79,287Honduras 19,912 168,021 118,881 74,367 44,514 3,911 13,965 7,745 319 12 308 52,567Mexico 529,859 4,053,303 2,027,653 992,898 1,034,754 276,464 1,123,922 329,716 12,584 1,657 10,927 1,375,397Nicaragua 12,055 112,643 63,130 34,947 28,183 2,637 9,820 4,911 1,602 861 741 33,835Panama 14,563 68,774 58,288 28,339 29,949 9,669 16,865 8,146 832 471 361 38,456Saint Pierre and Miquelon 1 4 1 * 1 * * * 1
North and Central America 1,677,636 9,218,834 3,842,535 1,486,679 2,355,855 1,315,998 5,157,057 525,916 127,225 35,525 13,301 22,224 2,903,995
Argentina 62,156 205,878 133,936 65,762 68,174 10,612 46,063 18,259 749 78 671 87,104Bolivia 8,563 43,962 33,812 18,498 15,314 1,568 6,477 2,973 355 240 115 18,402Brazil 113,703 586,352 335,992 131,341 204,651 40,056 185,879 43,344 1,545 655 890 248,885Chile 22,040 102,186 57,281 28,643 28,638 10,627 52,667 19,561 7,115 376 6,739 54,937Colombia 52,907 320,839 208,558 93,639 114,919 12,092 57,147 24,342 794 425 370 139,630Ecuador 31,217 197,966 107,284 67,559 39,725 3,282 14,269 5,175 1,401 657 744 45,644French Guiana 241 1,159 907 279 628 100 560 182 95 82 14 823Guyana 8,544 56,622 64,169 41,701 22,468 1,161 5,679 6,779 830 693 137 29,384Paraguay 4,317 17,926 17,365 7,330 10,034 579 2,903 1,493 607 444 163 11,691Peru 37,480 241,262 161,865 73,439 88,426 5,964 27,442 11,086 1,257 1,064 193 99,705Suriname 2,087 7,556 5,948 3,286 2,662 44 227 180 1,158 892 266 3,107Uruguay 8,385 35,766 29,923 12,727 17,196 1,639 6,953 2,493 320 93 227 19,917Venezuela 50,042 232,151 113,882 73,505 40,376 12,893 49,188 18,482 504 333 171 59,028
South America 401,682 2,049,625 1,270,920 617,709 653,212 100,616 455,455 154,346 122,679 16,730 6,031 10,698 818,256
Afghanistan 335 79 59 13 46 * * * 46Bangladesh 12,350 67,356 48,961 38,769 10,192 743 3,732 3,126 1,342 708 634 13,952Bhutan 20 102 49 23 26 * 2 1 27Brunei 1,696 6,150 4,620 1,222 3,397 147 377 96 62 29 32 3,526Burma 754 4,193 5,082 1,702 3,380 1 7 10 5 5 3,394Cambodia 1,216 5,945 6,818 3,780 3,038 384 611 679 2 2 3,718Chagos Archipelago 312 1,085 1,478 1,033 445 151 683 465 84 50 34 944China 72,645 396,019 289,108 160,674 128,434 10,511 46,807 37,053 4,594 3,469 1,125 166,611French Southern and Antarctic Lands 1 4 1 1 1Hong Kong 43,691 192,619 104,547 23,406 81,141 27,975 103,694 9,862 283 71 212 91,215India 151,226 960,001 634,310 560,520 73,790 10,511 44,168 34,278 9,534 6,331 3,203 111,272Indonesia 26,952 96,532 59,975 38,892 21,083 5,244 20,460 10,411 1,171 780 390 31,884Japan 146,011 815,997 365,103 91,464 273,639 66,076 305,640 29,208 22,877 21,656 1,221 304,068Korea, North 36 136 104 52 52 24 111 80 133Korea, South 53,165 321,384 225,018 106,580 118,438 40,797 202,275 72,562 5,700 4,027 1,673 192,673Laos 283 1,928 2,799 1,653 1,146 52 259 259 1,405Macau 1,300 4,252 3,089 1,452 1,638 167 777 427 23 11 12 2,077Malaysia 14,618 71,327 44,750 17,910 26,840 4,515 19,605 6,076 1,548 739 809 33,725Maldives 193 577 413 316 96 3 14 5 * * 102Mongolia 354 1,607 1,869 800 1,068 5 28 306 2 2 1 1,375Nepal 1,511 7,946 10,242 5,171 5,071 225 522 566 31 13 18 5,654Pakistan 48,389 304,510 225,558 159,549 66,008 2,173 8,817 6,986 541 39 502 73,496Philippines 100,214 747,354 463,519 199,526 263,993 7,860 37,894 13,873 1,866 934 932 278,798Singapore 30,645 120,084 69,516 18,795 50,721 7,041 26,289 6,556 669 39 631 57,907Sri Lanka 5,177 28,842 26,636 13,957 12,680 1,903 7,908 2,894 58 41 18 15,591Taiwan 73,374 335,042 180,870 51,471 129,400 29,319 121,570 22,147 9,422 7,936 1,486 153,033Thailand 21,206 117,797 101,151 39,056 62,096 5,515 23,464 11,401 249 38 211 73,708Vietnam 28,847 251,623 213,453 185,126 28,327 1,439 7,380 5,732 635 368 267 34,325
Asia 836,522 4,860,492 3,089,097 1,722,912 1,366,185 222,782 983,096 275,060 151,080 60,698 47,281 13,417 1,654,661
Australia 69,188 396,557 219,824 92,809 127,015 46,870 445,710 35,164 4,680 2,608 2,072 164,252Cook Islands 62 207 263 138 125 4 15 14 * * 139Fiji 1,737 10,449 14,258 6,164 8,094 412 1,494 1,324 287 147 140 9,558French Polynesia 4,369 8,544 7,257 5,312 1,944 286 913 707 244 136 107 2,758Kiribati 25 134 130 82 47 2 11 13 1 1 61Marshall Islands 409 2,187 2,697 1,072 1,625 125 551 338 52 10 42 2,004Micronesia, Federated States of 533 3,420 3,883 1,616 2,266 107 562 336 346 121 225 2,827Nauru 50 179 160 127 33 19 35 28 137 19 118 179New Caledonia 135 515 324 349 (26) 51 172 84 40 31 9 67New Zealand 21,386 93,226 63,966 14,589 49,377 3,746 44,408 3,362 18,601 9,637 8,964 61,703Niue 336 1,894 4,958 2,230 2,728 * * * * * 2,728
149
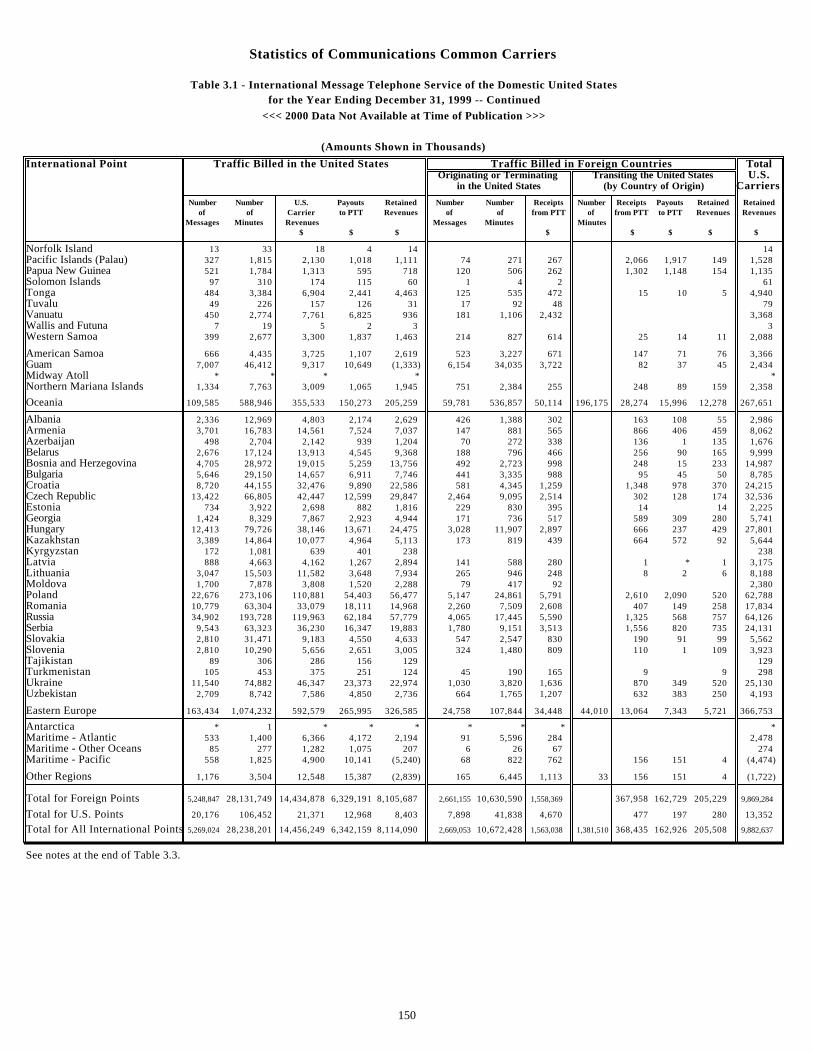
Statistics of Communications Common Carriers
Table 3.1 - International Message Telephone Service of the Domestic United Statesfor the Year Ending December 31, 1999 -- Continued
<<< 2000 Data Not Available at Time of Publication >>>
(Amounts Shown in Thousands)
International Point Traffic Billed in the United States Traffic Billed in Foreign Countries TotalOriginating or Terminating Transiting the United States U.S.
in the United States (by Country of Origin) Carriers
Number Number U.S. Payouts Retained Number Number Receipts Number Receipts Payouts Retained Retainedof of Carrier to PTT Revenues of of from PTT of from PTT to PTT Revenues Revenues
Messages Minutes Revenues Messages Minutes Minutes$ $ $ $ $ $ $ $
Norfolk Island 13 33 18 4 14 14Pacific Islands (Palau) 327 1,815 2,130 1,018 1,111 74 271 267 2,066 1,917 149 1,528Papua New Guinea 521 1,784 1,313 595 718 120 506 262 1,302 1,148 154 1,135Solomon Islands 97 310 174 115 60 1 4 2 61Tonga 484 3,384 6,904 2,441 4,463 125 535 472 15 10 5 4,940Tuvalu 49 226 157 126 31 17 92 48 79Vanuatu 450 2,774 7,761 6,825 936 181 1,106 2,432 3,368Wallis and Futuna 7 19 5 2 3 3Western Samoa 399 2,677 3,300 1,837 1,463 214 827 614 25 14 11 2,088
American Samoa 666 4,435 3,725 1,107 2,619 523 3,227 671 147 71 76 3,366Guam 7,007 46,412 9,317 10,649 (1,333) 6,154 34,035 3,722 82 37 45 2,434Midway Atoll * * * * *Northern Mariana Islands 1,334 7,763 3,009 1,065 1,945 751 2,384 255 248 89 159 2,358
Oceania 109,585 588,946 355,533 150,273 205,259 59,781 536,857 50,114 196,175 28,274 15,996 12,278 267,651
Albania 2,336 12,969 4,803 2,174 2,629 426 1,388 302 163 108 55 2,986Armenia 3,701 16,783 14,561 7,524 7,037 147 881 565 866 406 459 8,062Azerbaijan 498 2,704 2,142 939 1,204 70 272 338 136 1 135 1,676Belarus 2,676 17,124 13,913 4,545 9,368 188 796 466 256 90 165 9,999Bosnia and Herzegovina 4,705 28,972 19,015 5,259 13,756 492 2,723 998 248 15 233 14,987Bulgaria 5,646 29,150 14,657 6,911 7,746 441 3,335 988 95 45 50 8,785Croatia 8,720 44,155 32,476 9,890 22,586 581 4,345 1,259 1,348 978 370 24,215Czech Republic 13,422 66,805 42,447 12,599 29,847 2,464 9,095 2,514 302 128 174 32,536Estonia 734 3,922 2,698 882 1,816 229 830 395 14 14 2,225Georgia 1,424 8,329 7,867 2,923 4,944 171 736 517 589 309 280 5,741Hungary 12,413 79,726 38,146 13,671 24,475 3,028 11,907 2,897 666 237 429 27,801Kazakhstan 3,389 14,864 10,077 4,964 5,113 173 819 439 664 572 92 5,644Kyrgyzstan 172 1,081 639 401 238 238Latvia 888 4,663 4,162 1,267 2,894 141 588 280 1 * 1 3,175Lithuania 3,047 15,503 11,582 3,648 7,934 265 946 248 8 2 6 8,188Moldova 1,700 7,878 3,808 1,520 2,288 79 417 92 2,380Poland 22,676 273,106 110,881 54,403 56,477 5,147 24,861 5,791 2,610 2,090 520 62,788Romania 10,779 63,304 33,079 18,111 14,968 2,260 7,509 2,608 407 149 258 17,834Russia 34,902 193,728 119,963 62,184 57,779 4,065 17,445 5,590 1,325 568 757 64,126Serbia 9,543 63,323 36,230 16,347 19,883 1,780 9,151 3,513 1,556 820 735 24,131Slovakia 2,810 31,471 9,183 4,550 4,633 547 2,547 830 190 91 99 5,562Slovenia 2,810 10,290 5,656 2,651 3,005 324 1,480 809 110 1 109 3,923Tajikistan 89 306 286 156 129 129Turkmenistan 105 453 375 251 124 45 190 165 9 9 298Ukraine 11,540 74,882 46,347 23,373 22,974 1,030 3,820 1,636 870 349 520 25,130Uzbekistan 2,709 8,742 7,586 4,850 2,736 664 1,765 1,207 632 383 250 4,193
Eastern Europe 163,434 1,074,232 592,579 265,995 326,585 24,758 107,844 34,448 44,010 13,064 7,343 5,721 366,753
Antarctica * 1 * * * * * * *Maritime - Atlantic 533 1,400 6,366 4,172 2,194 91 5,596 284 2,478Maritime - Other Oceans 85 277 1,282 1,075 207 6 26 67 274Maritime - Pacific 558 1,825 4,900 10,141 (5,240) 68 822 762 156 151 4 (4,474)
Other Regions 1,176 3,504 12,548 15,387 (2,839) 165 6,445 1,113 33 156 151 4 (1,722)
Total for Foreign Points 5,248,847 28,131,749 14,434,878 6,329,191 8,105,687 2,661,155 10,630,590 1,558,369 367,958 162,729 205,229 9,869,284
Total for U.S. Points 20,176 106,452 21,371 12,968 8,403 7,898 41,838 4,670 477 197 280 13,352
Total for All International Points 5,269,024 28,238,201 14,456,249 6,342,159 8,114,090 2,669,053 10,672,428 1,563,038 1,381,510 368,435 162,926 205,508 9,882,637
See notes at the end of Table 3.3.
150
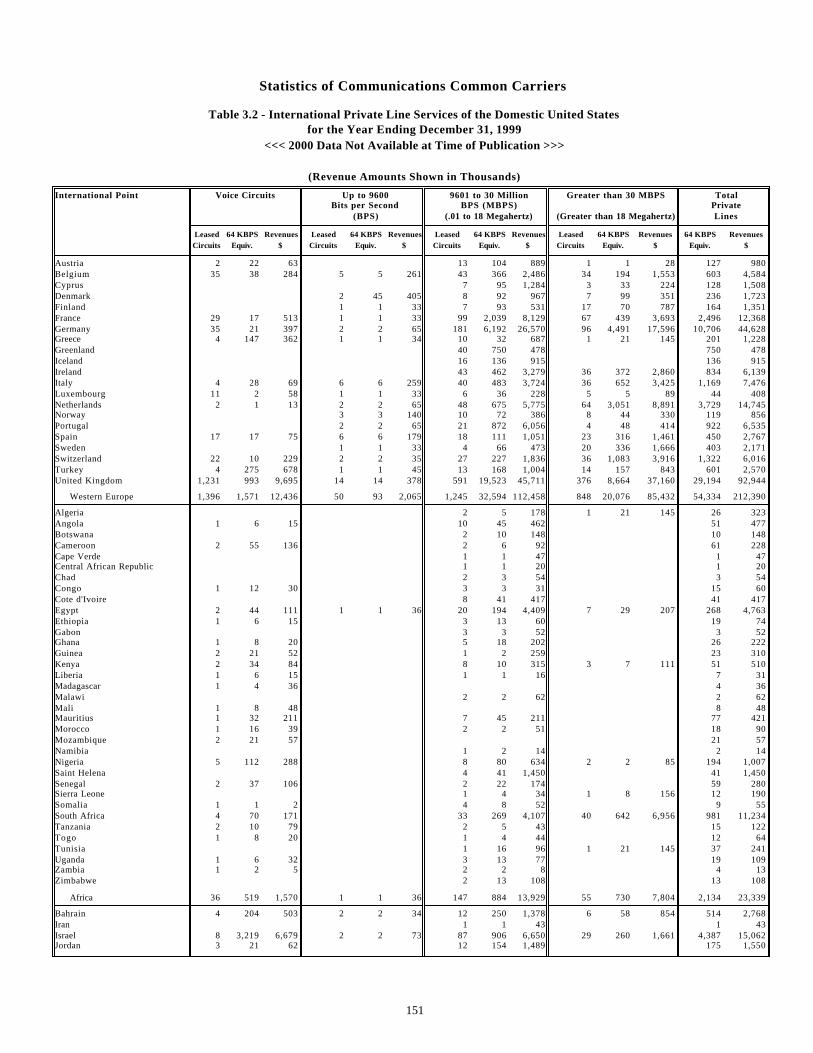
Statistics of Communications Common Carriers
Table 3.2 - International Private Line Services of the Domestic United Statesfor the Year Ending December 31, 1999
<<< 2000 Data Not Available at Time of Publication >>>
(Revenue Amounts Shown in Thousands)
International Point Voice Circuits Up to 9600 9601 to 30 Million Greater than 30 MBPS TotalBits per Second BPS (MBPS) Private
(BPS) (.01 to 18 Megahertz) (Greater than 18 Megahertz) Lines
Leased 64 KBPS Revenues Leased 64 KBPS Revenues Leased 64 KBPS Revenues Leased 64 KBPS Revenues 64 KBPS RevenuesCircuits Equiv. $ Circuits Equiv. $ Circuits Equiv. $ Circuits Equiv. $ Equiv. $
Austria 2 22 63 13 104 889 1 1 28 127 980Belgium 35 38 284 5 5 261 43 366 2,486 34 194 1,553 603 4,584Cyprus 7 95 1,284 3 33 224 128 1,508Denmark 2 45 405 8 92 967 7 99 351 236 1,723Finland 1 1 33 7 93 531 17 70 787 164 1,351France 29 17 513 1 1 33 99 2,039 8,129 67 439 3,693 2,496 12,368Germany 35 21 397 2 2 65 181 6,192 26,570 96 4,491 17,596 10,706 44,628Greece 4 147 362 1 1 34 10 32 687 1 21 145 201 1,228Greenland 40 750 478 750 478Iceland 16 136 915 136 915Ireland 43 462 3,279 36 372 2,860 834 6,139Italy 4 28 69 6 6 259 40 483 3,724 36 652 3,425 1,169 7,476Luxembourg 11 2 58 1 1 33 6 36 228 5 5 89 44 408Netherlands 2 1 13 2 2 65 48 675 5,775 64 3,051 8,891 3,729 14,745Norway 3 3 140 10 72 386 8 44 330 119 856Portugal 2 2 65 21 872 6,056 4 48 414 922 6,535Spain 17 17 75 6 6 179 18 111 1,051 23 316 1,461 450 2,767Sweden 1 1 33 4 66 473 20 336 1,666 403 2,171Switzerland 22 10 229 2 2 35 27 227 1,836 36 1,083 3,916 1,322 6,016Turkey 4 275 678 1 1 45 13 168 1,004 14 157 843 601 2,570United Kingdom 1,231 993 9,695 14 14 378 591 19,523 45,711 376 8,664 37,160 29,194 92,944
Western Europe 1,396 1,571 12,436 50 93 2,065 1,245 32,594 112,458 848 20,076 85,432 54,334 212,390
Algeria 2 5 178 1 21 145 26 323Angola 1 6 15 10 45 462 51 477Botswana 2 10 148 10 148Cameroon 2 55 136 2 6 92 61 228Cape Verde 1 1 47 1 47Central African Republic 1 1 20 1 20Chad 2 3 54 3 54Congo 1 12 30 3 3 31 15 60Cote d'Ivoire 8 41 417 41 417Egypt 2 44 111 1 1 36 20 194 4,409 7 29 207 268 4,763Ethiopia 1 6 15 3 13 60 19 74Gabon 3 3 52 3 52Ghana 1 8 20 5 18 202 26 222Guinea 2 21 52 1 2 259 23 310Kenya 2 34 84 8 10 315 3 7 111 51 510Liberia 1 6 15 1 1 16 7 31Madagascar 1 4 36 4 36Malawi 2 2 62 2 62Mali 1 8 48 8 48Mauritius 1 32 211 7 45 211 77 421Morocco 1 16 39 2 2 51 18 90Mozambique 2 21 57 21 57Namibia 1 2 14 2 14Nigeria 5 112 288 8 80 634 2 2 85 194 1,007Saint Helena 4 41 1,450 41 1,450Senegal 2 37 106 2 22 174 59 280Sierra Leone 1 4 34 1 8 156 12 190Somalia 1 1 2 4 8 52 9 55South Africa 4 70 171 33 269 4,107 40 642 6,956 981 11,234Tanzania 2 10 79 2 5 43 15 122Togo 1 8 20 1 4 44 12 64Tunisia 1 16 96 1 21 145 37 241Uganda 1 6 32 3 13 77 19 109Zambia 1 2 5 2 2 8 4 13Zimbabwe 2 13 108 13 108
Africa 36 519 1,570 1 1 36 147 884 13,929 55 730 7,804 2,134 23,339
Bahrain 4 204 503 2 2 34 12 250 1,378 6 58 854 514 2,768Iran 1 1 43 1 43Israel 8 3,219 6,679 2 2 73 87 906 6,650 29 260 1,661 4,387 15,062Jordan 3 21 62 12 154 1,489 175 1,550
151
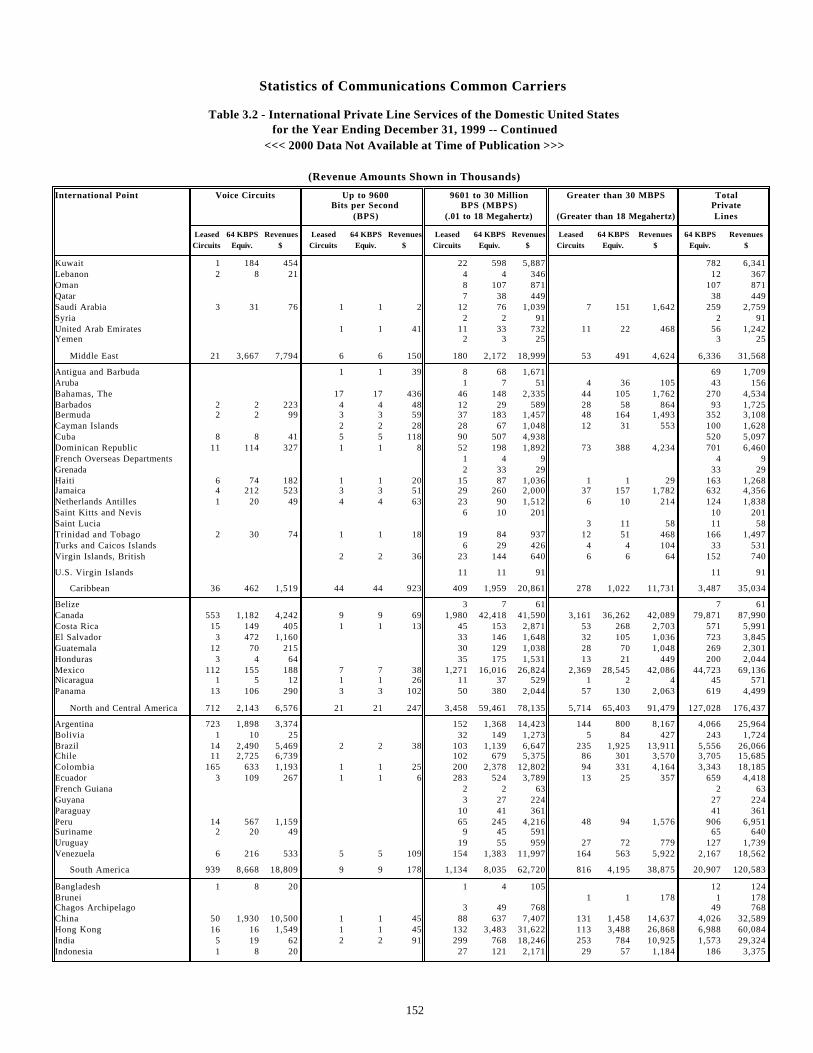
Statistics of Communications Common Carriers
Table 3.2 - International Private Line Services of the Domestic United Statesfor the Year Ending December 31, 1999 -- Continued
<<< 2000 Data Not Available at Time of Publication >>>
(Revenue Amounts Shown in Thousands)
International Point Voice Circuits Up to 9600 9601 to 30 Million Greater than 30 MBPS TotalBits per Second BPS (MBPS) Private
(BPS) (.01 to 18 Megahertz) (Greater than 18 Megahertz) Lines
Leased 64 KBPS Revenues Leased 64 KBPS Revenues Leased 64 KBPS Revenues Leased 64 KBPS Revenues 64 KBPS RevenuesCircuits Equiv. $ Circuits Equiv. $ Circuits Equiv. $ Circuits Equiv. $ Equiv. $
Kuwait 1 184 454 22 598 5,887 782 6,341Lebanon 2 8 21 4 4 346 12 367Oman 8 107 871 107 871Qatar 7 38 449 38 449Saudi Arabia 3 31 76 1 1 2 12 76 1,039 7 151 1,642 259 2,759Syria 2 2 91 2 91United Arab Emirates 1 1 41 11 33 732 11 22 468 56 1,242Yemen 2 3 25 3 25
Middle East 21 3,667 7,794 6 6 150 180 2,172 18,999 53 491 4,624 6,336 31,568
Antigua and Barbuda 1 1 39 8 68 1,671 69 1,709Aruba 1 7 51 4 36 105 43 156Bahamas, The 17 17 436 46 148 2,335 44 105 1,762 270 4,534Barbados 2 2 223 4 4 48 12 29 589 28 58 864 93 1,725Bermuda 2 2 99 3 3 59 37 183 1,457 48 164 1,493 352 3,108Cayman Islands 2 2 28 28 67 1,048 12 31 553 100 1,628Cuba 8 8 41 5 5 118 90 507 4,938 520 5,097Dominican Republic 11 114 327 1 1 8 52 198 1,892 73 388 4,234 701 6,460French Overseas Departments 1 4 9 4 9Grenada 2 33 29 33 29Haiti 6 74 182 1 1 20 15 87 1,036 1 1 29 163 1,268Jamaica 4 212 523 3 3 51 29 260 2,000 37 157 1,782 632 4,356Netherlands Antilles 1 20 49 4 4 63 23 90 1,512 6 10 214 124 1,838Saint Kitts and Nevis 6 10 201 10 201Saint Lucia 3 11 58 11 58Trinidad and Tobago 2 30 74 1 1 18 19 84 937 12 51 468 166 1,497Turks and Caicos Islands 6 29 426 4 4 104 33 531Virgin Islands, British 2 2 36 23 144 640 6 6 64 152 740
U.S. Virgin Islands 11 11 91 11 91
Caribbean 36 462 1,519 44 44 923 409 1,959 20,861 278 1,022 11,731 3,487 35,034
Belize 3 7 61 7 61Canada 553 1,182 4,242 9 9 69 1,980 42,418 41,590 3,161 36,262 42,089 79,871 87,990Costa Rica 15 149 405 1 1 13 45 153 2,871 53 268 2,703 571 5,991El Salvador 3 472 1,160 33 146 1,648 32 105 1,036 723 3,845Guatemala 12 70 215 30 129 1,038 28 70 1,048 269 2,301Honduras 3 4 64 35 175 1,531 13 21 449 200 2,044Mexico 112 155 188 7 7 38 1,271 16,016 26,824 2,369 28,545 42,086 44,723 69,136Nicaragua 1 5 12 1 1 26 11 37 529 1 2 4 45 571Panama 13 106 290 3 3 102 50 380 2,044 57 130 2,063 619 4,499
North and Central America 712 2,143 6,576 21 21 247 3,458 59,461 78,135 5,714 65,403 91,479 127,028 176,437
Argentina 723 1,898 3,374 152 1,368 14,423 144 800 8,167 4,066 25,964Bolivia 1 10 25 32 149 1,273 5 84 427 243 1,724Brazil 14 2,490 5,469 2 2 38 103 1,139 6,647 235 1,925 13,911 5,556 26,066Chile 11 2,725 6,739 102 679 5,375 86 301 3,570 3,705 15,685Colombia 165 633 1,193 1 1 25 200 2,378 12,802 94 331 4,164 3,343 18,185Ecuador 3 109 267 1 1 6 283 524 3,789 13 25 357 659 4,418French Guiana 2 2 63 2 63Guyana 3 27 224 27 224Paraguay 10 41 361 41 361Peru 14 567 1,159 65 245 4,216 48 94 1,576 906 6,951Suriname 2 20 49 9 45 591 65 640Uruguay 19 55 959 27 72 779 127 1,739Venezuela 6 216 533 5 5 109 154 1,383 11,997 164 563 5,922 2,167 18,562
South America 939 8,668 18,809 9 9 178 1,134 8,035 62,720 816 4,195 38,875 20,907 120,583
Bangladesh 1 8 20 1 4 105 12 124Brunei 1 1 178 1 178Chagos Archipelago 3 49 768 49 768China 50 1,930 10,500 1 1 45 88 637 7,407 131 1,458 14,637 4,026 32,589Hong Kong 16 16 1,549 1 1 45 132 3,483 31,622 113 3,488 26,868 6,988 60,084India 5 19 62 2 2 91 299 768 18,246 253 784 10,925 1,573 29,324Indonesia 1 8 20 27 121 2,171 29 57 1,184 186 3,375
152
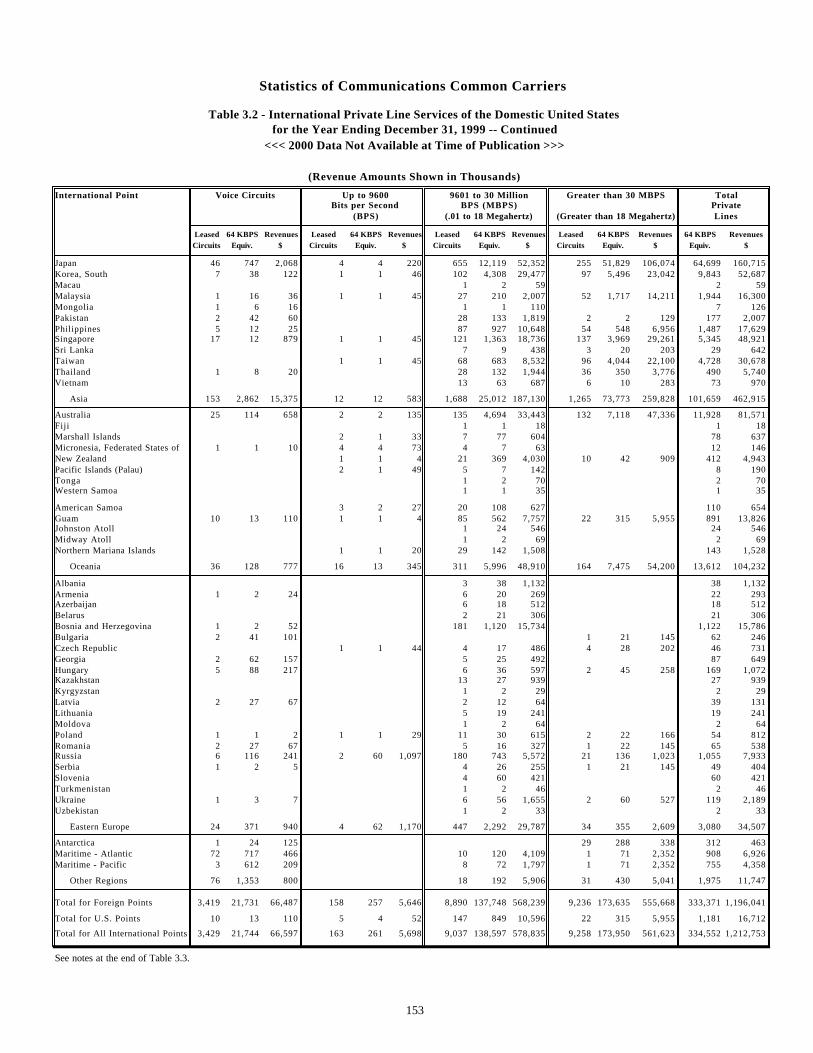
Statistics of Communications Common Carriers
Table 3.2 - International Private Line Services of the Domestic United Statesfor the Year Ending December 31, 1999 -- Continued
<<< 2000 Data Not Available at Time of Publication >>>
(Revenue Amounts Shown in Thousands)
International Point Voice Circuits Up to 9600 9601 to 30 Million Greater than 30 MBPS TotalBits per Second BPS (MBPS) Private
(BPS) (.01 to 18 Megahertz) (Greater than 18 Megahertz) Lines
Leased 64 KBPS Revenues Leased 64 KBPS Revenues Leased 64 KBPS Revenues Leased 64 KBPS Revenues 64 KBPS RevenuesCircuits Equiv. $ Circuits Equiv. $ Circuits Equiv. $ Circuits Equiv. $ Equiv. $
Japan 46 747 2,068 4 4 220 655 12,119 52,352 255 51,829 106,074 64,699 160,715Korea, South 7 38 122 1 1 46 102 4,308 29,477 97 5,496 23,042 9,843 52,687Macau 1 2 59 2 59Malaysia 1 16 36 1 1 45 27 210 2,007 52 1,717 14,211 1,944 16,300Mongolia 1 6 16 1 1 110 7 126Pakistan 2 42 60 28 133 1,819 2 2 129 177 2,007Philippines 5 12 25 87 927 10,648 54 548 6,956 1,487 17,629Singapore 17 12 879 1 1 45 121 1,363 18,736 137 3,969 29,261 5,345 48,921Sri Lanka 7 9 438 3 20 203 29 642Taiwan 1 1 45 68 683 8,532 96 4,044 22,100 4,728 30,678Thailand 1 8 20 28 132 1,944 36 350 3,776 490 5,740Vietnam 13 63 687 6 10 283 73 970
Asia 153 2,862 15,375 12 12 583 1,688 25,012 187,130 1,265 73,773 259,828 101,659 462,915
Australia 25 114 658 2 2 135 135 4,694 33,443 132 7,118 47,336 11,928 81,571Fiji 1 1 18 1 18Marshall Islands 2 1 33 7 77 604 78 637Micronesia, Federated States of 1 1 10 4 4 73 4 7 63 12 146New Zealand 1 1 4 21 369 4,030 10 42 909 412 4,943Pacific Islands (Palau) 2 1 49 5 7 142 8 190Tonga 1 2 70 2 70Western Samoa 1 1 35 1 35
American Samoa 3 2 27 20 108 627 110 654Guam 10 13 110 1 1 4 85 562 7,757 22 315 5,955 891 13,826Johnston Atoll 1 24 546 24 546Midway Atoll 1 2 69 2 69Northern Mariana Islands 1 1 20 29 142 1,508 143 1,528
Oceania 36 128 777 16 13 345 311 5,996 48,910 164 7,475 54,200 13,612 104,232
Albania 3 38 1,132 38 1,132Armenia 1 2 24 6 20 269 22 293Azerbaijan 6 18 512 18 512Belarus 2 21 306 21 306Bosnia and Herzegovina 1 2 52 181 1,120 15,734 1,122 15,786Bulgaria 2 41 101 1 21 145 62 246Czech Republic 1 1 44 4 17 486 4 28 202 46 731Georgia 2 62 157 5 25 492 87 649Hungary 5 88 217 6 36 597 2 45 258 169 1,072Kazakhstan 13 27 939 27 939Kyrgyzstan 1 2 29 2 29Latvia 2 27 67 2 12 64 39 131Lithuania 5 19 241 19 241Moldova 1 2 64 2 64Poland 1 1 2 1 1 29 11 30 615 2 22 166 54 812Romania 2 27 67 5 16 327 1 22 145 65 538Russia 6 116 241 2 60 1,097 180 743 5,572 21 136 1,023 1,055 7,933Serbia 1 2 5 4 26 255 1 21 145 49 404Slovenia 4 60 421 60 421Turkmenistan 1 2 46 2 46Ukraine 1 3 7 6 56 1,655 2 60 527 119 2,189Uzbekistan 1 2 33 2 33
Eastern Europe 24 371 940 4 62 1,170 447 2,292 29,787 34 355 2,609 3,080 34,507
Antarctica 1 24 125 29 288 338 312 463Maritime - Atlantic 72 717 466 10 120 4,109 1 71 2,352 908 6,926Maritime - Pacific 3 612 209 8 72 1,797 1 71 2,352 755 4,358
Other Regions 76 1,353 800 18 192 5,906 31 430 5,041 1,975 11,747
Total for Foreign Points 3,419 21,731 66,487 158 257 5,646 8,890 137,748 568,239 9,236 173,635 555,668 333,371 1,196,041
Total for U.S. Points 10 13 110 5 4 52 147 849 10,596 22 315 5,955 1,181 16,712
Total for All International Points 3,429 21,744 66,597 163 261 5,698 9,037 138,597 578,835 9,258 173,950 561,623 334,552 1,212,753
See notes at the end of Table 3.3.
153
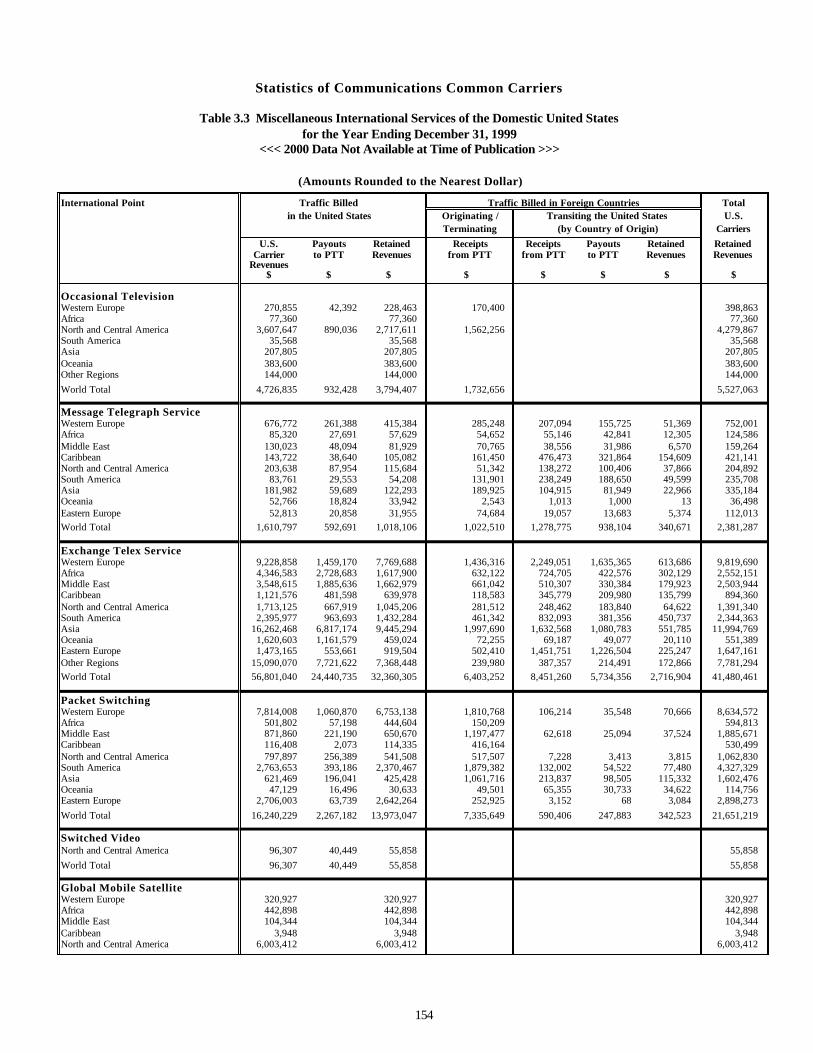
Statistics of Communications Common Carriers
Table 3.3 Miscellaneous International Services of the Domestic United Statesfor the Year Ending December 31, 1999
<<< 2000 Data Not Available at Time of Publication >>>
(Amounts Rounded to the Nearest Dollar)
International Point Traffic Billed Traffic Billed in Foreign Countries Totalin the United States Originating / Transiting the United States U.S.
Terminating (by Country of Origin) Carriers
U.S. Payouts Retained Receipts Receipts Payouts Retained RetainedCarrier to PTT Revenues from PTT from PTT to PTT Revenues Revenues
Revenues$ $ $ $ $ $ $ $
Occasional Television Western Europe 270,855 42,392 228,463 170,400 398,863Africa 77,360 77,360 77,360North and Central America 3,607,647 890,036 2,717,611 1,562,256 4,279,867South America 35,568 35,568 35,568Asia 207,805 207,805 207,805Oceania 383,600 383,600 383,600Other Regions 144,000 144,000 144,000
World Total 4,726,835 932,428 3,794,407 1,732,656 5,527,063
Message Telegraph Service Western Europe 676,772 261,388 415,384 285,248 207,094 155,725 51,369 752,001Africa 85,320 27,691 57,629 54,652 55,146 42,841 12,305 124,586Middle East 130,023 48,094 81,929 70,765 38,556 31,986 6,570 159,264Caribbean 143,722 38,640 105,082 161,450 476,473 321,864 154,609 421,141North and Central America 203,638 87,954 115,684 51,342 138,272 100,406 37,866 204,892South America 83,761 29,553 54,208 131,901 238,249 188,650 49,599 235,708Asia 181,982 59,689 122,293 189,925 104,915 81,949 22,966 335,184Oceania 52,766 18,824 33,942 2,543 1,013 1,000 13 36,498Eastern Europe 52,813 20,858 31,955 74,684 19,057 13,683 5,374 112,013
World Total 1,610,797 592,691 1,018,106 1,022,510 1,278,775 938,104 340,671 2,381,287
Exchange Telex Service Western Europe 9,228,858 1,459,170 7,769,688 1,436,316 2,249,051 1,635,365 613,686 9,819,690Africa 4,346,583 2,728,683 1,617,900 632,122 724,705 422,576 302,129 2,552,151Middle East 3,548,615 1,885,636 1,662,979 661,042 510,307 330,384 179,923 2,503,944Caribbean 1,121,576 481,598 639,978 118,583 345,779 209,980 135,799 894,360North and Central America 1,713,125 667,919 1,045,206 281,512 248,462 183,840 64,622 1,391,340South America 2,395,977 963,693 1,432,284 461,342 832,093 381,356 450,737 2,344,363Asia 16,262,468 6,817,174 9,445,294 1,997,690 1,632,568 1,080,783 551,785 11,994,769Oceania 1,620,603 1,161,579 459,024 72,255 69,187 49,077 20,110 551,389Eastern Europe 1,473,165 553,661 919,504 502,410 1,451,751 1,226,504 225,247 1,647,161Other Regions 15,090,070 7,721,622 7,368,448 239,980 387,357 214,491 172,866 7,781,294
World Total 56,801,040 24,440,735 32,360,305 6,403,252 8,451,260 5,734,356 2,716,904 41,480,461
Packet Switching Western Europe 7,814,008 1,060,870 6,753,138 1,810,768 106,214 35,548 70,666 8,634,572Africa 501,802 57,198 444,604 150,209 594,813Middle East 871,860 221,190 650,670 1,197,477 62,618 25,094 37,524 1,885,671Caribbean 116,408 2,073 114,335 416,164 530,499North and Central America 797,897 256,389 541,508 517,507 7,228 3,413 3,815 1,062,830South America 2,763,653 393,186 2,370,467 1,879,382 132,002 54,522 77,480 4,327,329Asia 621,469 196,041 425,428 1,061,716 213,837 98,505 115,332 1,602,476Oceania 47,129 16,496 30,633 49,501 65,355 30,733 34,622 114,756Eastern Europe 2,706,003 63,739 2,642,264 252,925 3,152 68 3,084 2,898,273
World Total 16,240,229 2,267,182 13,973,047 7,335,649 590,406 247,883 342,523 21,651,219
Switched Video North and Central America 96,307 40,449 55,858 55,858
World Total 96,307 40,449 55,858 55,858
Global Mobile Satellite Western Europe 320,927 320,927 320,927Africa 442,898 442,898 442,898Middle East 104,344 104,344 104,344Caribbean 3,948 3,948 3,948North and Central America 6,003,412 6,003,412 6,003,412
154
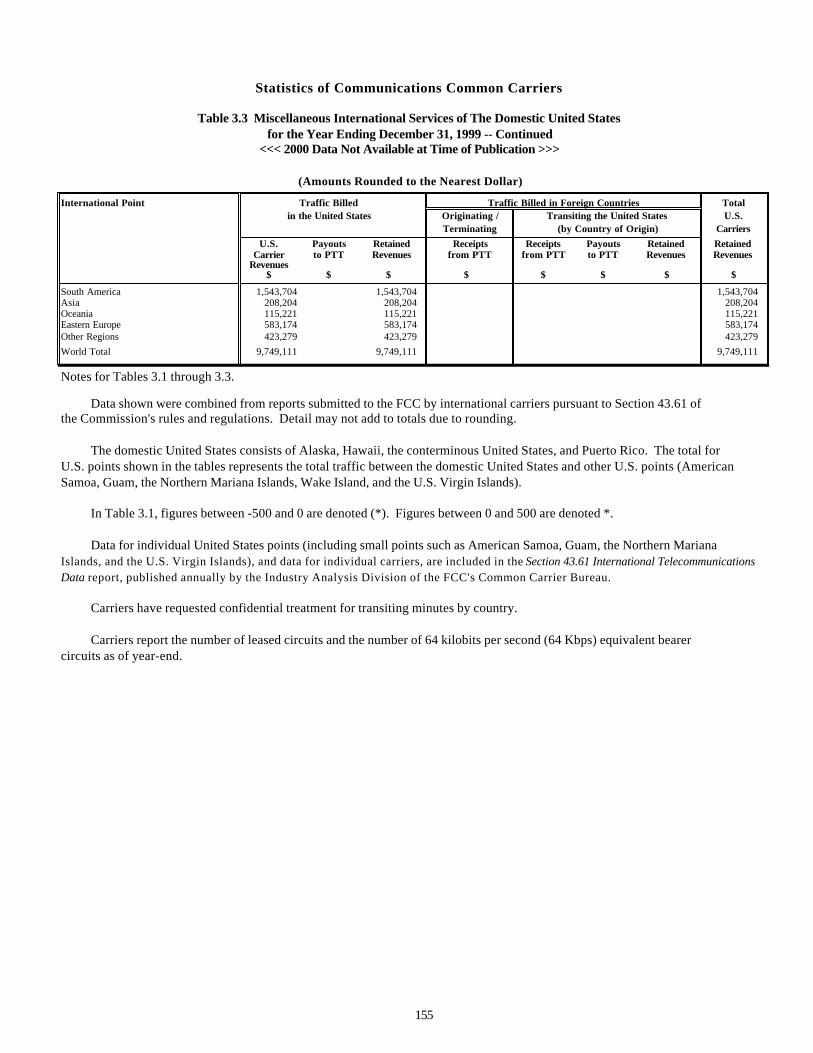
Statistics of Communications Common Carriers
Table 3.3 Miscellaneous International Services of The Domestic United Statesfor the Year Ending December 31, 1999 -- Continued
<<< 2000 Data Not Available at Time of Publication >>>
(Amounts Rounded to the Nearest Dollar)
International Point Traffic Billed Traffic Billed in Foreign Countries Totalin the United States Originating / Transiting the United States U.S.
Terminating (by Country of Origin) Carriers
U.S. Payouts Retained Receipts Receipts Payouts Retained RetainedCarrier to PTT Revenues from PTT from PTT to PTT Revenues Revenues
Revenues$ $ $ $ $ $ $ $
South America 1,543,704 1,543,704 1,543,704Asia 208,204 208,204 208,204Oceania 115,221 115,221 115,221Eastern Europe 583,174 583,174 583,174Other Regions 423,279 423,279 423,279
World Total 9,749,111 9,749,111 9,749,111
Notes for Tables 3.1 through 3.3.
Data shown were combined from reports submitted to the FCC by international carriers pursuant to Section 43.61 of the Commission's rules and regulations. Detail may not add to totals due to rounding.
The domestic United States consists of Alaska, Hawaii, the conterminous United States, and Puerto Rico. The total for U.S. points shown in the tables represents the total traffic between the domestic United States and other U.S. points (American Samoa, Guam, the Northern Mariana Islands, Wake Island, and the U.S. Virgin Islands).
In Table 3.1, figures between -500 and 0 are denoted (*). Figures between 0 and 500 are denoted *.
Data for individual United States points (including small points such as American Samoa, Guam, the Northern Mariana Islands, and the U.S. Virgin Islands), and data for individual carriers, are included in the Section 43.61 International Telecommunications Data report, published annually by the Industry Analysis Division of the FCC's Common Carrier Bureau.
Carriers have requested confidential treatment for transiting minutes by country.
Carriers report the number of leased circuits and the number of 64 kilobits per second (64 Kbps) equivalent bearercircuits as of year-end.
155
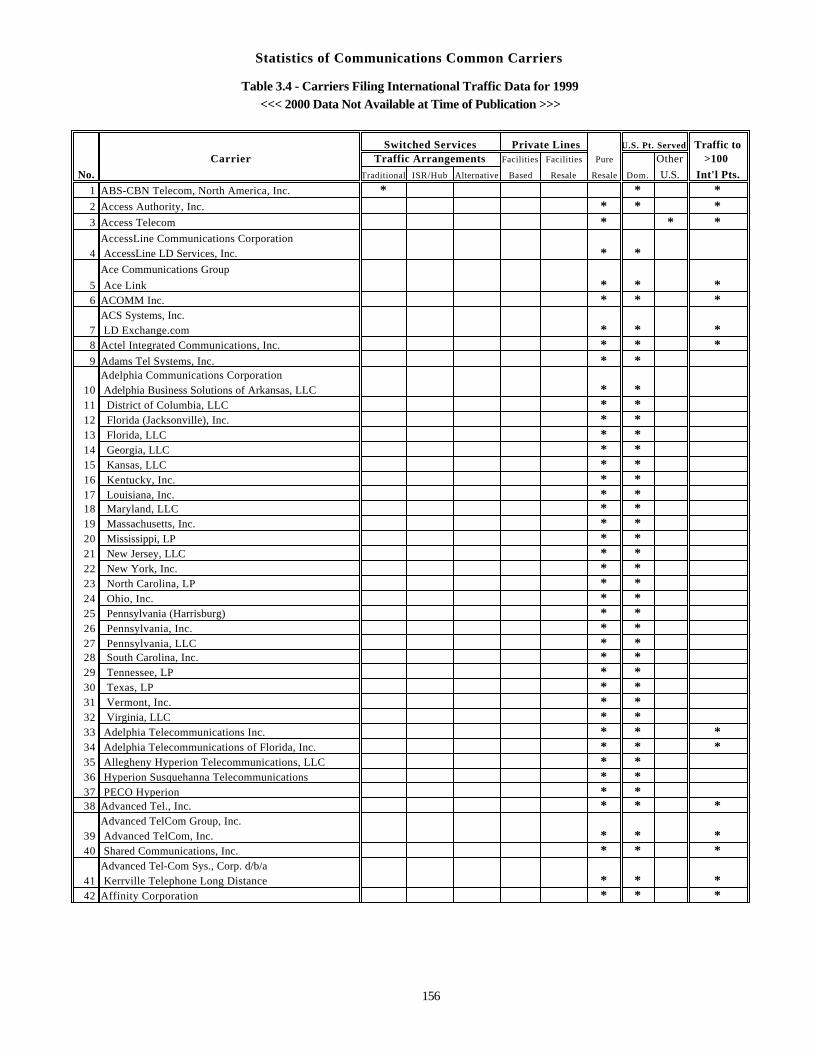
Statistics of Communications Common Carriers
Table 3.4 - Carriers Filing International Traffic Data for 1999<<< 2000 Data Not Available at Time of Publication >>>
Switched Services Private Lines U.S. Pt. Served Traffic toCarrier Traffic Arrangements Facilities Facilities Pure Other >100
No. Traditional ISR/Hub Alternative Based Resale Resale Dom. U.S. Int'l Pts.
1 ABS-CBN Telecom, North America, Inc. * * *2 Access Authority, Inc. * * *3 Access Telecom * * *
AccessLine Communications Corporation4 AccessLine LD Services, Inc. * *
Ace Communications Group
5 Ace Link * * *6 ACOMM Inc. * * *
ACS Systems, Inc.7 LD Exchange.com * * *8 Actel Integrated Communications, Inc. * * *9 Adams Tel Systems, Inc. * *
Adelphia Communications Corporation10 Adelphia Business Solutions of Arkansas, LLC * *11 District of Columbia, LLC * *12 Florida (Jacksonville), Inc. * *13 Florida, LLC * *14 Georgia, LLC * *15 Kansas, LLC * *16 Kentucky, Inc. * *17 Louisiana, Inc. * *18 Maryland, LLC * *19 Massachusetts, Inc. * *20 Mississippi, LP * *21 New Jersey, LLC * *22 New York, Inc. * *23 North Carolina, LP * *24 Ohio, Inc. * *25 Pennsylvania (Harrisburg) * *26 Pennsylvania, Inc. * *27 Pennsylvania, LLC * *28 South Carolina, Inc. * *29 Tennessee, LP * *30 Texas, LP * *31 Vermont, Inc. * *32 Virginia, LLC * *33 Adelphia Telecommunications Inc. * * *34 Adelphia Telecommunications of Florida, Inc. * * *35 Allegheny Hyperion Telecommunications, LLC * *36 Hyperion Susquehanna Telecommunications * *37 PECO Hyperion * *38 Advanced Tel., Inc. * * *
Advanced TelCom Group, Inc.39 Advanced TelCom, Inc. * * *40 Shared Communications, Inc. * * *
Advanced Tel-Com Sys., Corp. d/b/a41 Kerrville Telephone Long Distance * * *42 Affinity Corporation * * *
156
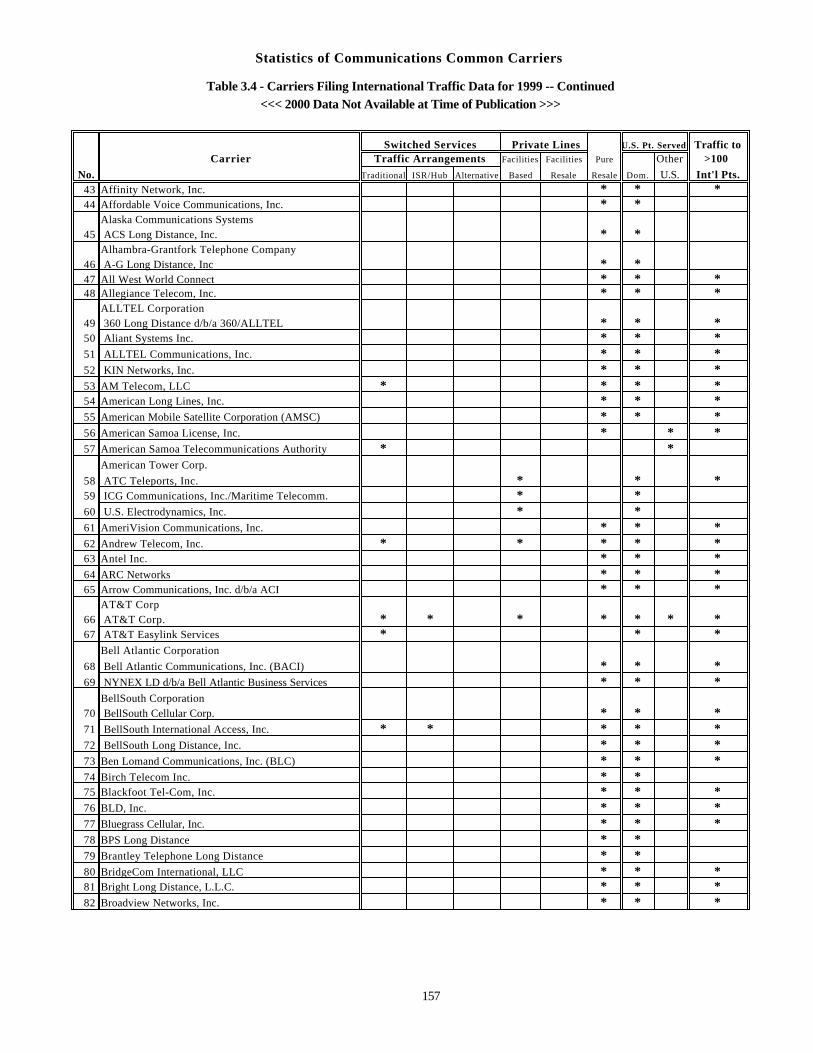
Statistics of Communications Common Carriers
Table 3.4 - Carriers Filing International Traffic Data for 1999 -- Continued<<< 2000 Data Not Available at Time of Publication >>>
Switched Services Private Lines U.S. Pt. Served Traffic toCarrier Traffic Arrangements Facilities Facilities Pure Other >100
No. Traditional ISR/Hub Alternative Based Resale Resale Dom. U.S. Int'l Pts.43 Affinity Network, Inc. * * *44 Affordable Voice Communications, Inc. * *
Alaska Communications Systems45 ACS Long Distance, Inc. * *
Alhambra-Grantfork Telephone Company46 A-G Long Distance, Inc * *47 All West World Connect * * *48 Allegiance Telecom, Inc. * * *
ALLTEL Corporation49 360 Long Distance d/b/a 360/ALLTEL * * *50 Aliant Systems Inc. * * *51 ALLTEL Communications, Inc. * * *52 KIN Networks, Inc. * * *53 AM Telecom, LLC * * * *54 American Long Lines, Inc. * * *55 American Mobile Satellite Corporation (AMSC) * * *56 American Samoa License, Inc. * * *57 American Samoa Telecommunications Authority * *
American Tower Corp.
58 ATC Teleports, Inc. * * *59 ICG Communications, Inc./Maritime Telecomm. * *60 U.S. Electrodynamics, Inc. * *61 AmeriVision Communications, Inc. * * *62 Andrew Telecom, Inc. * * * * *63 Antel Inc. * * *64 ARC Networks * * *65 Arrow Communications, Inc. d/b/a ACI * * *
AT&T Corp66 AT&T Corp. * * * * * * *67 AT&T Easylink Services * * *
Bell Atlantic Corporation
68 Bell Atlantic Communications, Inc. (BACI) * * *69 NYNEX LD d/b/a Bell Atlantic Business Services * * *
BellSouth Corporation70 BellSouth Cellular Corp. * * *71 BellSouth International Access, Inc. * * * * *72 BellSouth Long Distance, Inc. * * *73 Ben Lomand Communications, Inc. (BLC) * * *74 Birch Telecom Inc. * *75 Blackfoot Tel-Com, Inc. * * *76 BLD, Inc. * * *77 Bluegrass Cellular, Inc. * * *78 BPS Long Distance * *79 Brantley Telephone Long Distance * *80 BridgeCom International, LLC * * *81 Bright Long Distance, L.L.C. * * *82 Broadview Networks, Inc. * * *
157
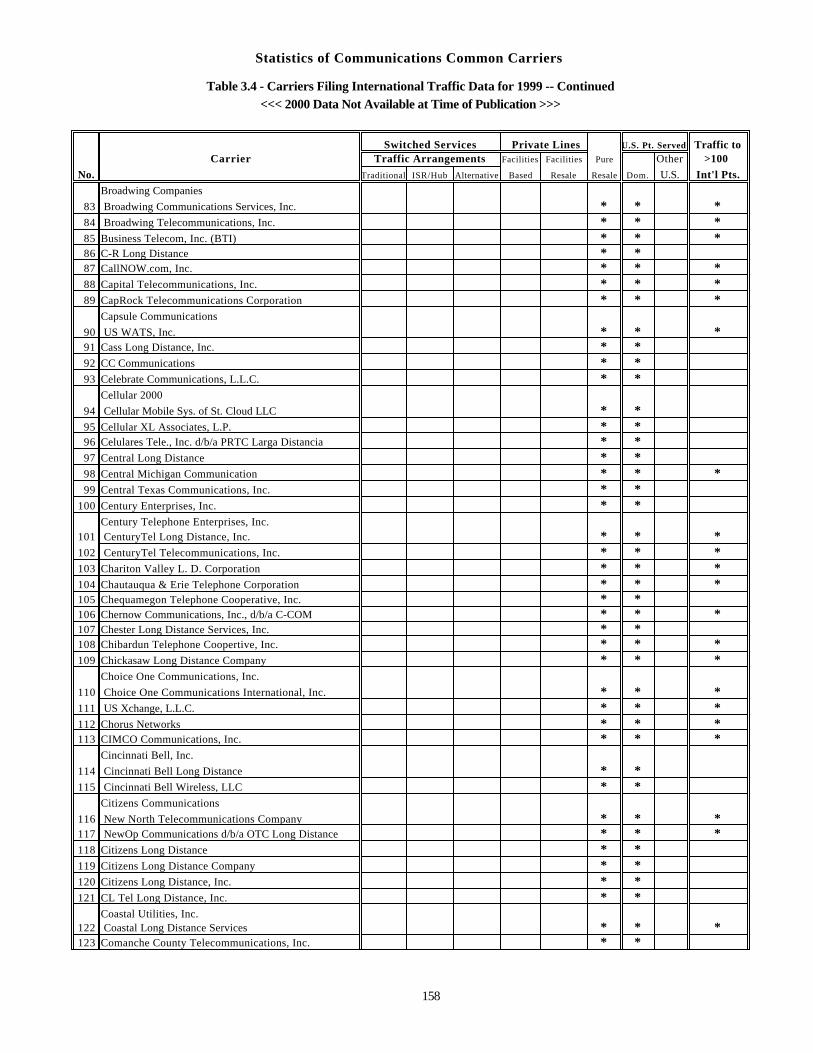
Statistics of Communications Common Carriers
Table 3.4 - Carriers Filing International Traffic Data for 1999 -- Continued<<< 2000 Data Not Available at Time of Publication >>>
Switched Services Private Lines U.S. Pt. Served Traffic toCarrier Traffic Arrangements Facilities Facilities Pure Other >100
No. Traditional ISR/Hub Alternative Based Resale Resale Dom. U.S. Int'l Pts.
Broadwing Companies
83 Broadwing Communications Services, Inc. * * *84 Broadwing Telecommunications, Inc. * * *85 Business Telecom, Inc. (BTI) * * *86 C-R Long Distance * *87 CallNOW.com, Inc. * * *88 Capital Telecommunications, Inc. * * *89 CapRock Telecommunications Corporation * * *
Capsule Communications
90 US WATS, Inc. * * *91 Cass Long Distance, Inc. * *92 CC Communications * *93 Celebrate Communications, L.L.C. * *
Cellular 2000
94 Cellular Mobile Sys. of St. Cloud LLC * *95 Cellular XL Associates, L.P. * *96 Celulares Tele., Inc. d/b/a PRTC Larga Distancia * *97 Central Long Distance * *98 Central Michigan Communication * * *99 Central Texas Communications, Inc. * *
100 Century Enterprises, Inc. * *Century Telephone Enterprises, Inc.
101 CenturyTel Long Distance, Inc. * * *102 CenturyTel Telecommunications, Inc. * * *103 Chariton Valley L. D. Corporation * * *104 Chautauqua & Erie Telephone Corporation * * *105 Chequamegon Telephone Cooperative, Inc. * *106 Chernow Communications, Inc., d/b/a C-COM * * *107 Chester Long Distance Services, Inc. * *108 Chibardun Telephone Coopertive, Inc. * * *109 Chickasaw Long Distance Company * * *
Choice One Communications, Inc.
110 Choice One Communications International, Inc. * * *111 US Xchange, L.L.C. * * *112 Chorus Networks * * *113 CIMCO Communications, Inc. * * *
Cincinnati Bell, Inc.
114 Cincinnati Bell Long Distance * *115 Cincinnati Bell Wireless, LLC * *
Citizens Communications
116 New North Telecommunications Company * * *117 NewOp Communications d/b/a OTC Long Distance * * *118 Citizens Long Distance * *119 Citizens Long Distance Company * *120 Citizens Long Distance, Inc. * *121 CL Tel Long Distance, Inc. * *
Coastal Utilities, Inc.122 Coastal Long Distance Services * * *123 Comanche County Telecommunications, Inc. * *
158
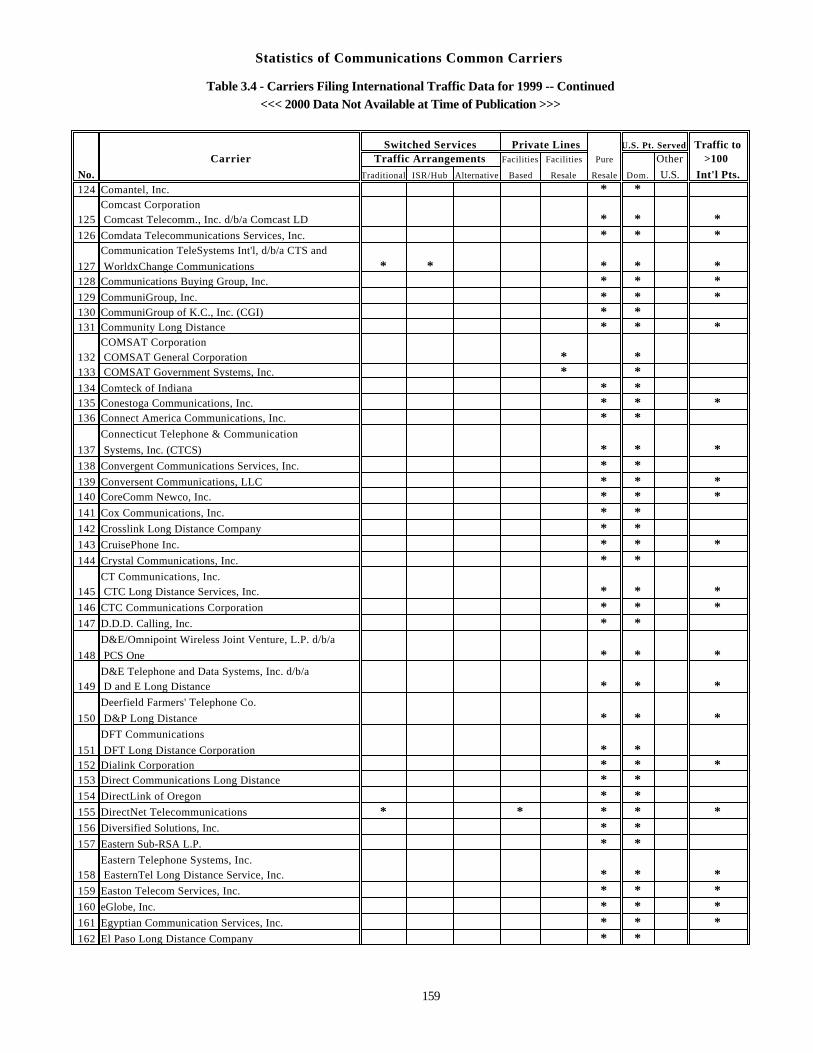
Statistics of Communications Common Carriers
Table 3.4 - Carriers Filing International Traffic Data for 1999 -- Continued<<< 2000 Data Not Available at Time of Publication >>>
Switched Services Private Lines U.S. Pt. Served Traffic toCarrier Traffic Arrangements Facilities Facilities Pure Other >100
No. Traditional ISR/Hub Alternative Based Resale Resale Dom. U.S. Int'l Pts.124 Comantel, Inc. * *
Comcast Corporation125 Comcast Telecomm., Inc. d/b/a Comcast LD * * *126 Comdata Telecommunications Services, Inc. * * *
Communication TeleSystems Int'l, d/b/a CTS and
127 WorldxChange Communications * * * * *128 Communications Buying Group, Inc. * * *129 CommuniGroup, Inc. * * *130 CommuniGroup of K.C., Inc. (CGI) * *131 Community Long Distance * * *
COMSAT Corporation132 COMSAT General Corporation * *133 COMSAT Government Systems, Inc. * *134 Comteck of Indiana * *135 Conestoga Communications, Inc. * * *136 Connect America Communications, Inc. * *
Connecticut Telephone & Communication
137 Systems, Inc. (CTCS) * * *138 Convergent Communications Services, Inc. * *139 Conversent Communications, LLC * * *140 CoreComm Newco, Inc. * * *141 Cox Communications, Inc. * *142 Crosslink Long Distance Company * *143 CruisePhone Inc. * * *144 Crystal Communications, Inc. * *
CT Communications, Inc.145 CTC Long Distance Services, Inc. * * *146 CTC Communications Corporation * * *147 D.D.D. Calling, Inc. * *
D&E/Omnipoint Wireless Joint Venture, L.P. d/b/a
148 PCS One * * *D&E Telephone and Data Systems, Inc. d/b/a
149 D and E Long Distance * * *Deerfield Farmers' Telephone Co.
150 D&P Long Distance * * *DFT Communications
151 DFT Long Distance Corporation * *152 Dialink Corporation * * *153 Direct Communications Long Distance * *154 DirectLink of Oregon * *155 DirectNet Telecommunications * * * * *156 Diversified Solutions, Inc. * *157 Eastern Sub-RSA L.P. * *
Eastern Telephone Systems, Inc.158 EasternTel Long Distance Service, Inc. * * *159 Easton Telecom Services, Inc. * * *160 eGlobe, Inc. * * *161 Egyptian Communication Services, Inc. * * *162 El Paso Long Distance Company * *
159
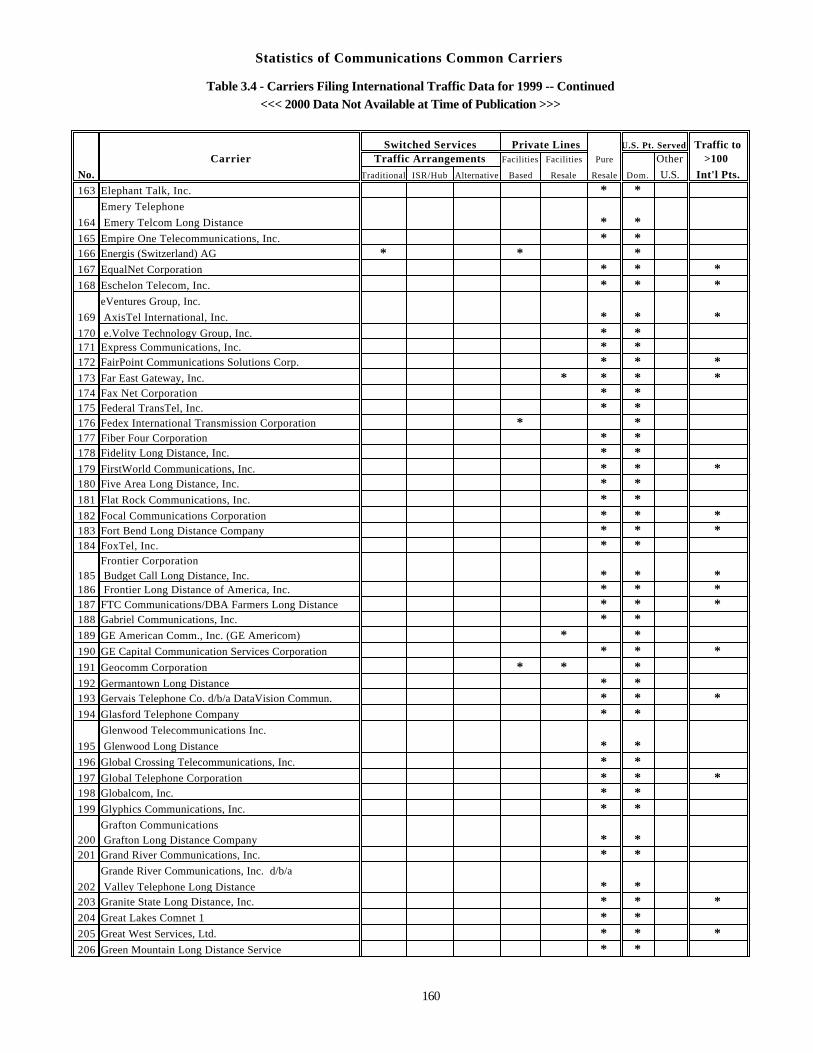
Statistics of Communications Common Carriers
Table 3.4 - Carriers Filing International Traffic Data for 1999 -- Continued<<< 2000 Data Not Available at Time of Publication >>>
Switched Services Private Lines U.S. Pt. Served Traffic toCarrier Traffic Arrangements Facilities Facilities Pure Other >100
No. Traditional ISR/Hub Alternative Based Resale Resale Dom. U.S. Int'l Pts.
163 Elephant Talk, Inc. * *Emery Telephone
164 Emery Telcom Long Distance * *165 Empire One Telecommunications, Inc. * *166 Energis (Switzerland) AG * * *167 EqualNet Corporation * * *168 Eschelon Telecom, Inc. * * *
eVentures Group, Inc.
169 AxisTel International, Inc. * * *170 e.Volve Technology Group, Inc. * *171 Express Communications, Inc. * *172 FairPoint Communications Solutions Corp. * * *173 Far East Gateway, Inc. * * * *174 Fax Net Corporation * *175 Federal TransTel, Inc. * *176 Fedex International Transmission Corporation * *177 Fiber Four Corporation * *178 Fidelity Long Distance, Inc. * *179 FirstWorld Communications, Inc. * * *180 Five Area Long Distance, Inc. * *181 Flat Rock Communications, Inc. * *182 Focal Communications Corporation * * *183 Fort Bend Long Distance Company * * *184 FoxTel, Inc. * *
Frontier Corporation185 Budget Call Long Distance, Inc. * * *186 Frontier Long Distance of America, Inc. * * *187 FTC Communications/DBA Farmers Long Distance * * *188 Gabriel Communications, Inc. * *189 GE American Comm., Inc. (GE Americom) * *190 GE Capital Communication Services Corporation * * *191 Geocomm Corporation * * *192 Germantown Long Distance * *193 Gervais Telephone Co. d/b/a DataVision Commun. * * *194 Glasford Telephone Company * *
Glenwood Telecommunications Inc.
195 Glenwood Long Distance * *196 Global Crossing Telecommunications, Inc. * *197 Global Telephone Corporation * * *198 Globalcom, Inc. * *199 Glyphics Communications, Inc. * *
Grafton Communications200 Grafton Long Distance Company * *201 Grand River Communications, Inc. * *
Grande River Communications, Inc. d/b/a
202 Valley Telephone Long Distance * *203 Granite State Long Distance, Inc. * * *204 Great Lakes Comnet 1 * *205 Great West Services, Ltd. * * *206 Green Mountain Long Distance Service * *
160
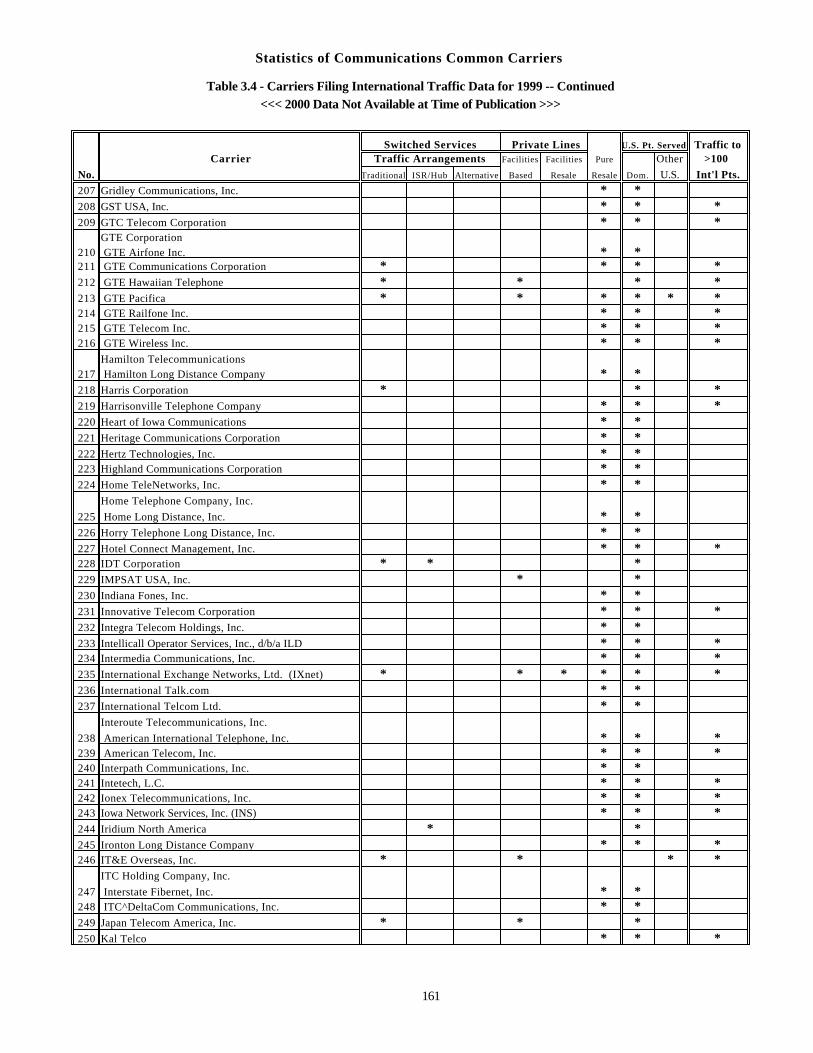
Statistics of Communications Common Carriers
Table 3.4 - Carriers Filing International Traffic Data for 1999 -- Continued<<< 2000 Data Not Available at Time of Publication >>>
Switched Services Private Lines U.S. Pt. Served Traffic toCarrier Traffic Arrangements Facilities Facilities Pure Other >100
No. Traditional ISR/Hub Alternative Based Resale Resale Dom. U.S. Int'l Pts.
207 Gridley Communications, Inc. * *208 GST USA, Inc. * * *209 GTC Telecom Corporation * * *
GTE Corporation210 GTE Airfone Inc. * *211 GTE Communications Corporation * * * *212 GTE Hawaiian Telephone * * * *213 GTE Pacifica * * * * * *214 GTE Railfone Inc. * * *215 GTE Telecom Inc. * * *216 GTE Wireless Inc. * * *
Hamilton Telecommunications217 Hamilton Long Distance Company * *218 Harris Corporation * * *219 Harrisonville Telephone Company * * *220 Heart of Iowa Communications * *221 Heritage Communications Corporation * *222 Hertz Technologies, Inc. * *223 Highland Communications Corporation * *224 Home TeleNetworks, Inc. * *
Home Telephone Company, Inc.
225 Home Long Distance, Inc. * *226 Horry Telephone Long Distance, Inc. * *227 Hotel Connect Management, Inc. * * *228 IDT Corporation * * *229 IMPSAT USA, Inc. * *230 Indiana Fones, Inc. * *231 Innovative Telecom Corporation * * *232 Integra Telecom Holdings, Inc. * *233 Intellicall Operator Services, Inc., d/b/a ILD * * *234 Intermedia Communications, Inc. * * *235 International Exchange Networks, Ltd. (IXnet) * * * * * *236 International Talk.com * *237 International Telcom Ltd. * *
Interoute Telecommunications, Inc.
238 American International Telephone, Inc. * * *239 American Telecom, Inc. * * *240 Interpath Communications, Inc. * *241 Intetech, L.C. * * *242 Ionex Telecommunications, Inc. * * *243 Iowa Network Services, Inc. (INS) * * *244 Iridium North America * *245 Ironton Long Distance Company * * *246 IT&E Overseas, Inc. * * * *
ITC Holding Company, Inc.
247 Interstate Fibernet, Inc. * *248 ITC^DeltaCom Communications, Inc. * *249 Japan Telecom America, Inc. * * *250 Kal Telco * * *
161
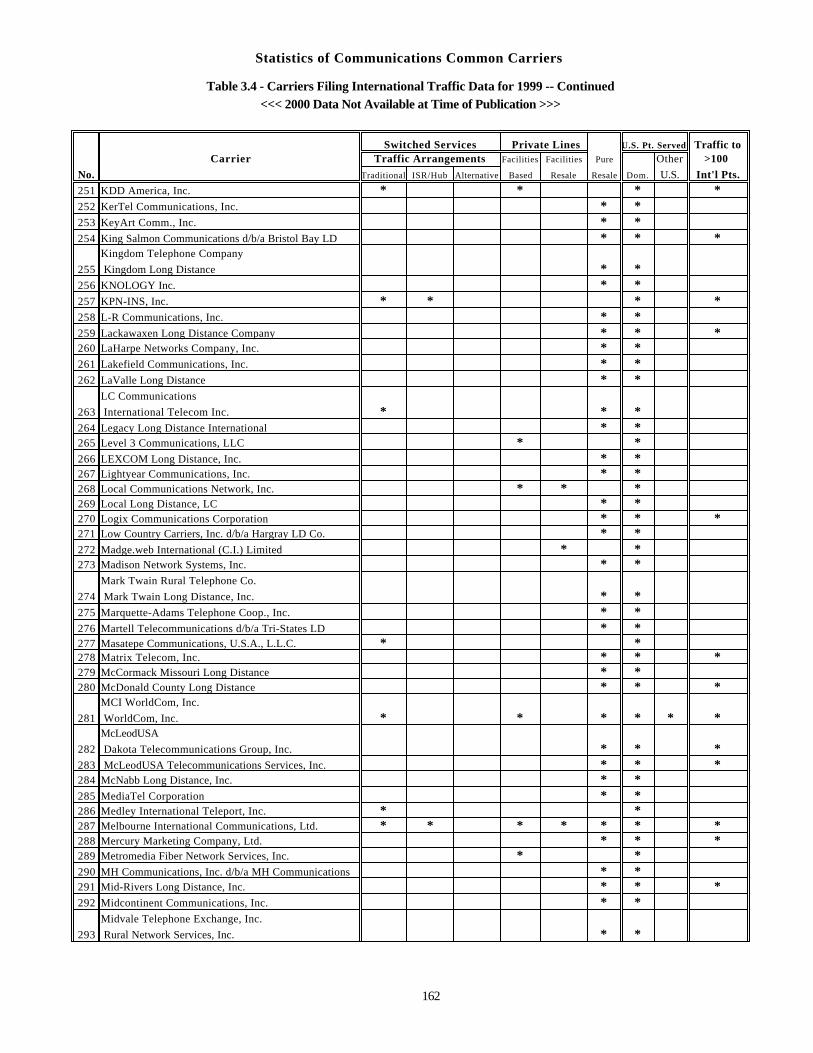
Statistics of Communications Common Carriers
Table 3.4 - Carriers Filing International Traffic Data for 1999 -- Continued<<< 2000 Data Not Available at Time of Publication >>>
Switched Services Private Lines U.S. Pt. Served Traffic toCarrier Traffic Arrangements Facilities Facilities Pure Other >100
No. Traditional ISR/Hub Alternative Based Resale Resale Dom. U.S. Int'l Pts.
251 KDD America, Inc. * * * *252 KerTel Communications, Inc. * *253 KeyArt Comm., Inc. * *254 King Salmon Communications d/b/a Bristol Bay LD * * *
Kingdom Telephone Company
255 Kingdom Long Distance * *256 KNOLOGY Inc. * *257 KPN-INS, Inc. * * * *258 L-R Communications, Inc. * *259 Lackawaxen Long Distance Company * * *260 LaHarpe Networks Company, Inc. * *261 Lakefield Communications, Inc. * *262 LaValle Long Distance * *
LC Communications
263 International Telecom Inc. * * *264 Legacy Long Distance International * *265 Level 3 Communications, LLC * *266 LEXCOM Long Distance, Inc. * *267 Lightyear Communications, Inc. * *268 Local Communications Network, Inc. * * *269 Local Long Distance, LC * *270 Logix Communications Corporation * * *271 Low Country Carriers, Inc. d/b/a Hargray LD Co. * *272 Madge.web International (C.I.) Limited * *273 Madison Network Systems, Inc. * *
Mark Twain Rural Telephone Co.
274 Mark Twain Long Distance, Inc. * *275 Marquette-Adams Telephone Coop., Inc. * *276 Martell Telecommunications d/b/a Tri-States LD * *277 Masatepe Communications, U.S.A., L.L.C. * *278 Matrix Telecom, Inc. * * *279 McCormack Missouri Long Distance * *280 McDonald County Long Distance * * *
MCI WorldCom, Inc.
281 WorldCom, Inc. * * * * * *McLeodUSA
282 Dakota Telecommunications Group, Inc. * * *283 McLeodUSA Telecommunications Services, Inc. * * *284 McNabb Long Distance, Inc. * *285 MediaTel Corporation * *286 Medley International Teleport, Inc. * *287 Melbourne International Communications, Ltd. * * * * * * *288 Mercury Marketing Company, Ltd. * * *289 Metromedia Fiber Network Services, Inc. * *290 MH Communications, Inc. d/b/a MH Communications * *291 Mid-Rivers Long Distance, Inc. * * *292 Midcontinent Communications, Inc. * *
Midvale Telephone Exchange, Inc.
293 Rural Network Services, Inc. * *
162
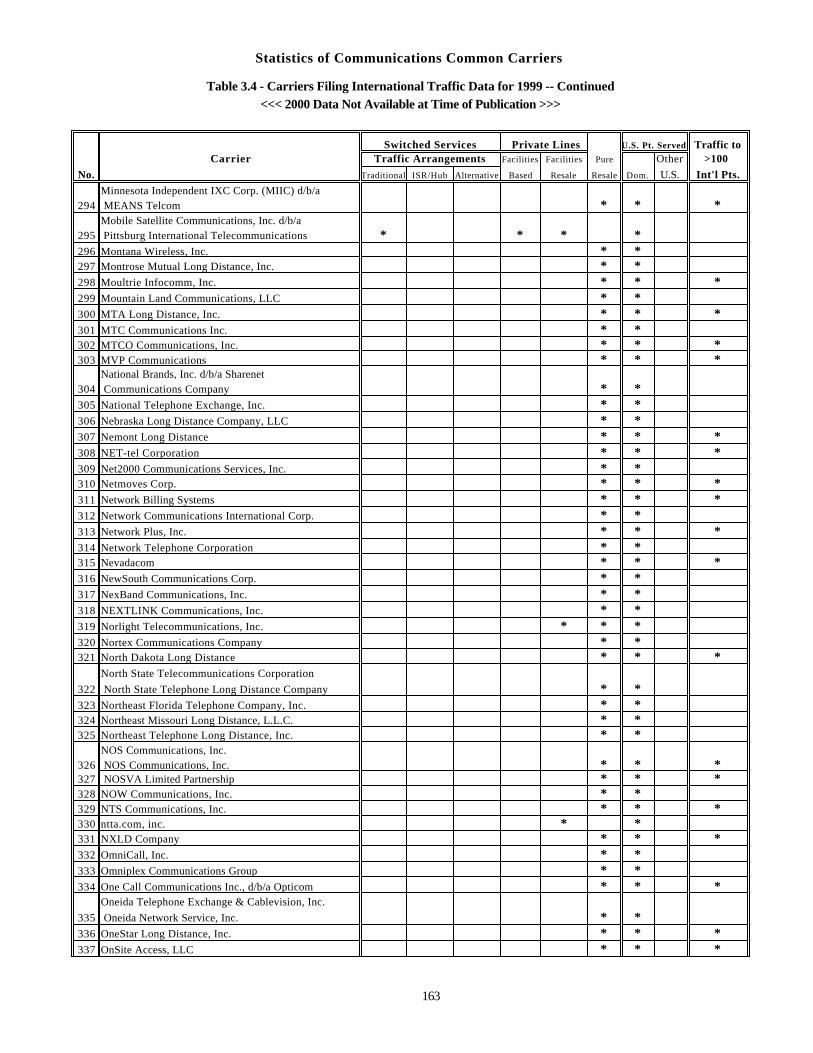
Statistics of Communications Common Carriers
Table 3.4 - Carriers Filing International Traffic Data for 1999 -- Continued<<< 2000 Data Not Available at Time of Publication >>>
Switched Services Private Lines U.S. Pt. Served Traffic toCarrier Traffic Arrangements Facilities Facilities Pure Other >100
No. Traditional ISR/Hub Alternative Based Resale Resale Dom. U.S. Int'l Pts.
Minnesota Independent IXC Corp. (MIIC) d/b/a294 MEANS Telcom * * *
Mobile Satellite Communications, Inc. d/b/a 295 Pittsburg International Telecommunications * * * *296 Montana Wireless, Inc. * *297 Montrose Mutual Long Distance, Inc. * *298 Moultrie Infocomm, Inc. * * *299 Mountain Land Communications, LLC * *300 MTA Long Distance, Inc. * * *301 MTC Communications Inc. * *302 MTCO Communications, Inc. * * *303 MVP Communications * * *
National Brands, Inc. d/b/a Sharenet304 Communications Company * *305 National Telephone Exchange, Inc. * *306 Nebraska Long Distance Company, LLC * *307 Nemont Long Distance * * *308 NET-tel Corporation * * *309 Net2000 Communications Services, Inc. * *310 Netmoves Corp. * * *311 Network Billing Systems * * *312 Network Communications International Corp. * *313 Network Plus, Inc. * * *314 Network Telephone Corporation * *315 Nevadacom * * *316 NewSouth Communications Corp. * *317 NexBand Communications, Inc. * *318 NEXTLINK Communications, Inc. * *319 Norlight Telecommunications, Inc. * * *320 Nortex Communications Company * *321 North Dakota Long Distance * * *
North State Telecommunications Corporation
322 North State Telephone Long Distance Company * *323 Northeast Florida Telephone Company, Inc. * *324 Northeast Missouri Long Distance, L.L.C. * *325 Northeast Telephone Long Distance, Inc. * *
NOS Communications, Inc.326 NOS Communications, Inc. * * *327 NOSVA Limited Partnership * * *328 NOW Communications, Inc. * *329 NTS Communications, Inc. * * *330 ntta.com, inc. * *331 NXLD Company * * *332 OmniCall, Inc. * *333 Omniplex Communications Group * *334 One Call Communications Inc., d/b/a Opticom * * *
Oneida Telephone Exchange & Cablevision, Inc.
335 Oneida Network Service, Inc. * *336 OneStar Long Distance, Inc. * * *337 OnSite Access, LLC * * *
163
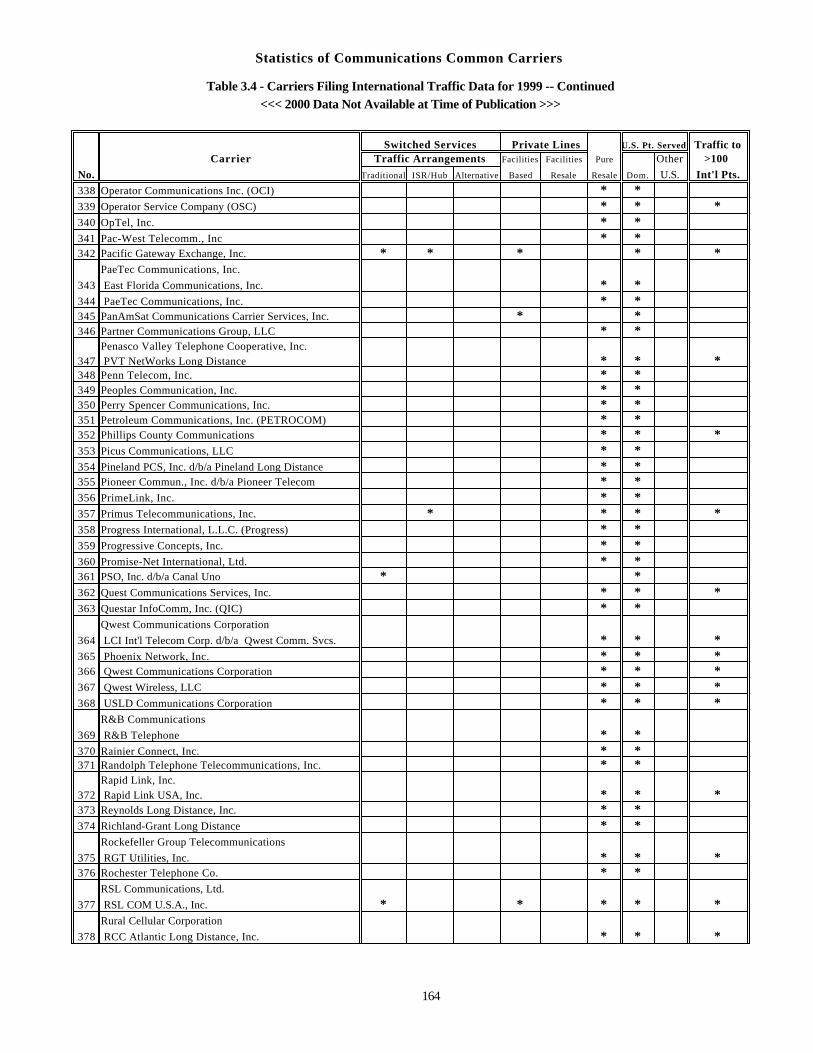
Statistics of Communications Common Carriers
Table 3.4 - Carriers Filing International Traffic Data for 1999 -- Continued<<< 2000 Data Not Available at Time of Publication >>>
Switched Services Private Lines U.S. Pt. Served Traffic toCarrier Traffic Arrangements Facilities Facilities Pure Other >100
No. Traditional ISR/Hub Alternative Based Resale Resale Dom. U.S. Int'l Pts.
338 Operator Communications Inc. (OCI) * *339 Operator Service Company (OSC) * * *340 OpTel, Inc. * *341 Pac-West Telecomm., Inc * *342 Pacific Gateway Exchange, Inc. * * * * *
PaeTec Communications, Inc.
343 East Florida Communications, Inc. * *344 PaeTec Communications, Inc. * *345 PanAmSat Communications Carrier Services, Inc. * *346 Partner Communications Group, LLC * *
Penasco Valley Telephone Cooperative, Inc.347 PVT NetWorks Long Distance * * *348 Penn Telecom, Inc. * *349 Peoples Communication, Inc. * *350 Perry Spencer Communications, Inc. * *351 Petroleum Communications, Inc. (PETROCOM) * *352 Phillips County Communications * * *353 Picus Communications, LLC * *354 Pineland PCS, Inc. d/b/a Pineland Long Distance * *355 Pioneer Commun., Inc. d/b/a Pioneer Telecom * *356 PrimeLink, Inc. * *357 Primus Telecommunications, Inc. * * * *358 Progress International, L.L.C. (Progress) * *359 Progressive Concepts, Inc. * *360 Promise-Net International, Ltd. * *361 PSO, Inc. d/b/a Canal Uno * *362 Quest Communications Services, Inc. * * *363 Questar InfoComm, Inc. (QIC) * *
Qwest Communications Corporation
364 LCI Int'l Telecom Corp. d/b/a Qwest Comm. Svcs. * * *365 Phoenix Network, Inc. * * *366 Qwest Communications Corporation * * *367 Qwest Wireless, LLC * * *368 USLD Communications Corporation * * *
R&B Communications
369 R&B Telephone * *370 Rainier Connect, Inc. * *371 Randolph Telephone Telecommunications, Inc. * *
Rapid Link, Inc.372 Rapid Link USA, Inc. * * *373 Reynolds Long Distance, Inc. * *374 Richland-Grant Long Distance * *
Rockefeller Group Telecommunications
375 RGT Utilities, Inc. * * *376 Rochester Telephone Co. * *
RSL Communications, Ltd.
377 RSL COM U.S.A., Inc. * * * * *Rural Cellular Corporation
378 RCC Atlantic Long Distance, Inc. * * *
164
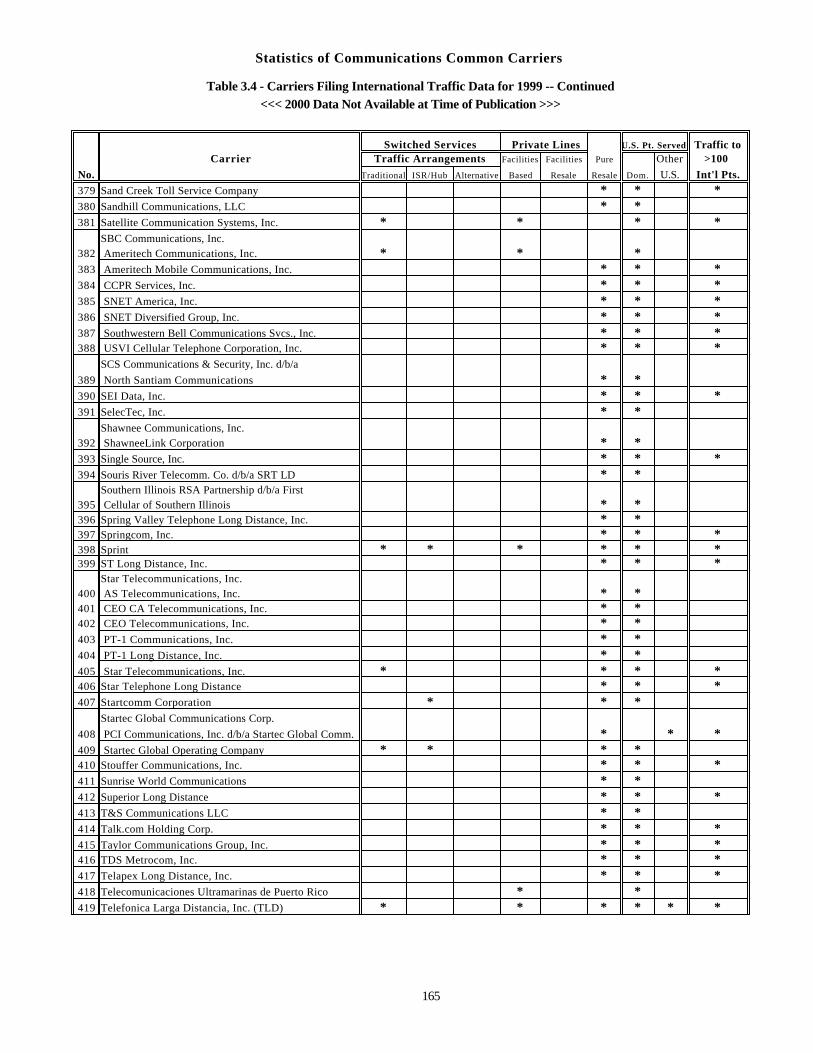
Statistics of Communications Common Carriers
Table 3.4 - Carriers Filing International Traffic Data for 1999 -- Continued<<< 2000 Data Not Available at Time of Publication >>>
Switched Services Private Lines U.S. Pt. Served Traffic toCarrier Traffic Arrangements Facilities Facilities Pure Other >100
No. Traditional ISR/Hub Alternative Based Resale Resale Dom. U.S. Int'l Pts.
379 Sand Creek Toll Service Company * * *380 Sandhill Communications, LLC * *381 Satellite Communication Systems, Inc. * * * *
SBC Communications, Inc.382 Ameritech Communications, Inc. * * *383 Ameritech Mobile Communications, Inc. * * *384 CCPR Services, Inc. * * *385 SNET America, Inc. * * *386 SNET Diversified Group, Inc. * * *387 Southwestern Bell Communications Svcs., Inc. * * *388 USVI Cellular Telephone Corporation, Inc. * * *
SCS Communications & Security, Inc. d/b/a
389 North Santiam Communications * *390 SEI Data, Inc. * * *391 SelecTec, Inc. * *
Shawnee Communications, Inc.392 ShawneeLink Corporation * *393 Single Source, Inc. * * *394 Souris River Telecomm. Co. d/b/a SRT LD * *
Southern Illinois RSA Partnership d/b/a First395 Cellular of Southern Illinois * *396 Spring Valley Telephone Long Distance, Inc. * *397 Springcom, Inc. * * *398 Sprint * * * * * *399 ST Long Distance, Inc. * * *
Star Telecommunications, Inc.400 AS Telecommunications, Inc. * *401 CEO CA Telecommunications, Inc. * *402 CEO Telecommunications, Inc. * *403 PT-1 Communications, Inc. * *404 PT-1 Long Distance, Inc. * *405 Star Telecommunications, Inc. * * * *406 Star Telephone Long Distance * * *407 Startcomm Corporation * * *
Startec Global Communications Corp.
408 PCI Communications, Inc. d/b/a Startec Global Comm. * * *409 Startec Global Operating Company * * * *410 Stouffer Communications, Inc. * * *411 Sunrise World Communications * *412 Superior Long Distance * * *413 T&S Communications LLC * *414 Talk.com Holding Corp. * * *415 Taylor Communications Group, Inc. * * *416 TDS Metrocom, Inc. * * *417 Telapex Long Distance, Inc. * * *418 Telecomunicaciones Ultramarinas de Puerto Rico * *419 Telefonica Larga Distancia, Inc. (TLD) * * * * * *
165
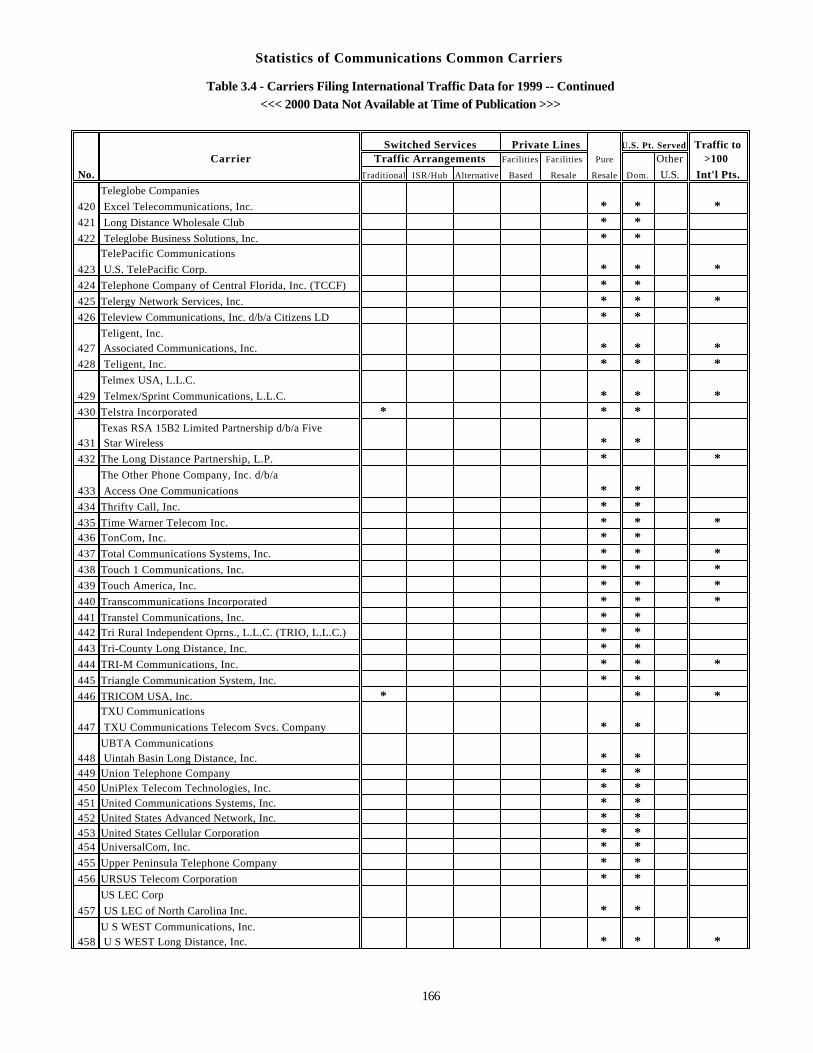
Statistics of Communications Common Carriers
Table 3.4 - Carriers Filing International Traffic Data for 1999 -- Continued<<< 2000 Data Not Available at Time of Publication >>>
Switched Services Private Lines U.S. Pt. Served Traffic toCarrier Traffic Arrangements Facilities Facilities Pure Other >100
No. Traditional ISR/Hub Alternative Based Resale Resale Dom. U.S. Int'l Pts.
Teleglobe Companies
420 Excel Telecommunications, Inc. * * *421 Long Distance Wholesale Club * *422 Teleglobe Business Solutions, Inc. * *
TelePacific Communications
423 U.S. TelePacific Corp. * * *424 Telephone Company of Central Florida, Inc. (TCCF) * *425 Telergy Network Services, Inc. * * *426 Teleview Communications, Inc. d/b/a Citizens LD * *
Teligent, Inc.427 Associated Communications, Inc. * * *428 Teligent, Inc. * * *
Telmex USA, L.L.C.
429 Telmex/Sprint Communications, L.L.C. * * *430 Telstra Incorporated * * *
Texas RSA 15B2 Limited Partnership d/b/a Five 431 Star Wireless * *432 The Long Distance Partnership, L.P. * *
The Other Phone Company, Inc. d/b/a
433 Access One Communications * *434 Thrifty Call, Inc. * *435 Time Warner Telecom Inc. * * *436 TonCom, Inc. * *437 Total Communications Systems, Inc. * * *438 Touch 1 Communications, Inc. * * *439 Touch America, Inc. * * *440 Transcommunications Incorporated * * *441 Transtel Communications, Inc. * *442 Tri Rural Independent Oprns., L.L.C. (TRIO, L.L.C.) * *443 Tri-County Long Distance, Inc. * *444 TRI-M Communications, Inc. * * *445 Triangle Communication System, Inc. * *446 TRICOM USA, Inc. * * *
TXU Communications
447 TXU Communications Telecom Svcs. Company * *UBTA Communications
448 Uintah Basin Long Distance, Inc. * *449 Union Telephone Company * *450 UniPlex Telecom Technologies, Inc. * *451 United Communications Systems, Inc. * *452 United States Advanced Network, Inc. * *453 United States Cellular Corporation * *454 UniversalCom, Inc. * *455 Upper Peninsula Telephone Company * *456 URSUS Telecom Corporation * *
US LEC Corp
457 US LEC of North Carolina Inc. * *U S WEST Communications, Inc.
458 U S WEST Long Distance, Inc. * * *
166
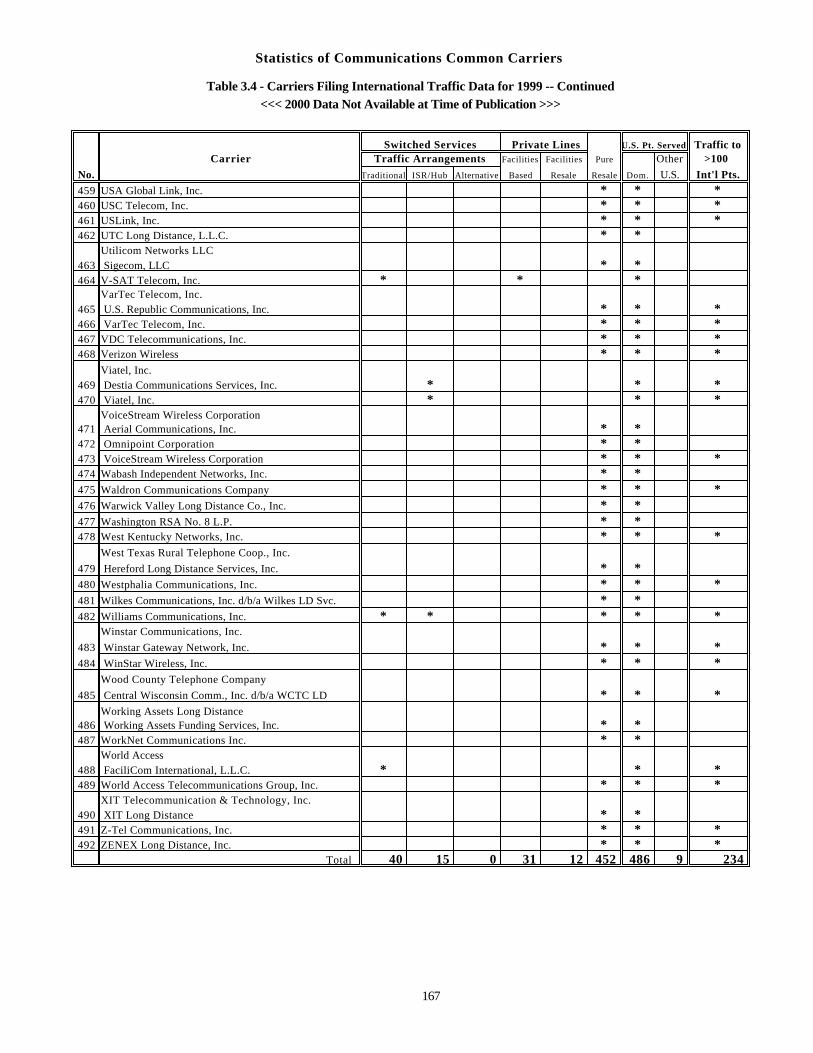
Statistics of Communications Common Carriers
Table 3.4 - Carriers Filing International Traffic Data for 1999 -- Continued<<< 2000 Data Not Available at Time of Publication >>>
Switched Services Private Lines U.S. Pt. Served Traffic toCarrier Traffic Arrangements Facilities Facilities Pure Other >100
No. Traditional ISR/Hub Alternative Based Resale Resale Dom. U.S. Int'l Pts.
459 USA Global Link, Inc. * * *460 USC Telecom, Inc. * * *461 USLink, Inc. * * *462 UTC Long Distance, L.L.C. * *
Utilicom Networks LLC463 Sigecom, LLC * *464 V-SAT Telecom, Inc. * * *
VarTec Telecom, Inc.465 U.S. Republic Communications, Inc. * * *466 VarTec Telecom, Inc. * * *467 VDC Telecommunications, Inc. * * *468 Verizon Wireless * * *
Viatel, Inc.469 Destia Communications Services, Inc. * * *470 Viatel, Inc. * * *
VoiceStream Wireless Corporation471 Aerial Communications, Inc. * *472 Omnipoint Corporation * *473 VoiceStream Wireless Corporation * * *474 Wabash Independent Networks, Inc. * *475 Waldron Communications Company * * *476 Warwick Valley Long Distance Co., Inc. * *477 Washington RSA No. 8 L.P. * *478 West Kentucky Networks, Inc. * * *
West Texas Rural Telephone Coop., Inc.
479 Hereford Long Distance Services, Inc. * *480 Westphalia Communications, Inc. * * *481 Wilkes Communications, Inc. d/b/a Wilkes LD Svc. * *482 Williams Communications, Inc. * * * * *
Winstar Communications, Inc.
483 Winstar Gateway Network, Inc. * * *484 WinStar Wireless, Inc. * * *
Wood County Telephone Company
485 Central Wisconsin Comm., Inc. d/b/a WCTC LD * * *Working Assets Long Distance
486 Working Assets Funding Services, Inc. * *487 WorkNet Communications Inc. * *
World Access488 FaciliCom International, L.L.C. * * *489 World Access Telecommunications Group, Inc. * * *
XIT Telecommunication & Technology, Inc.490 XIT Long Distance * *491 Z-Tel Communications, Inc. * * *492 ZENEX Long Distance, Inc. * * *
Total 40 15 0 31 12 452 486 9 234
167
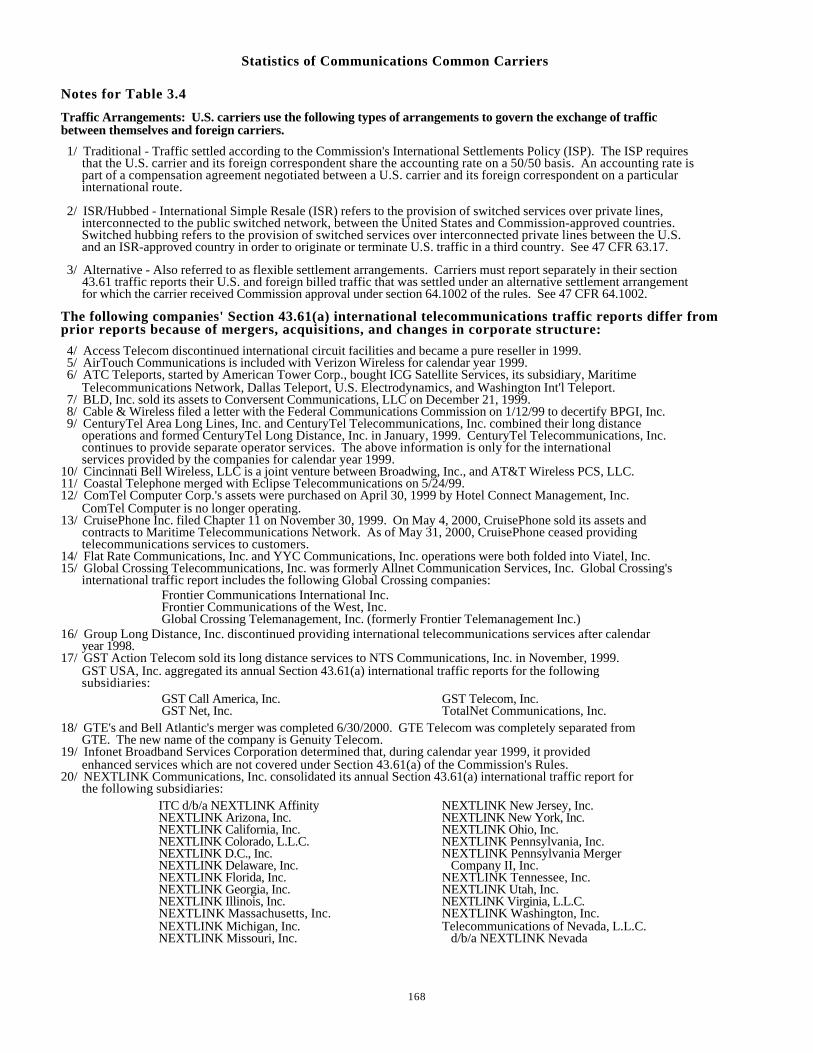
Statistics of Communications Common Carriers
Notes for Table 3.4
Traffic Arrangements: U.S. carriers use the following types of arrangements to govern the exchange of trafficbetween themselves and foreign carriers.
1/ Traditional - Traffic settled according to the Commission's International Settlements Policy (ISP). The ISP requires that the U.S. carrier and its foreign correspondent share the accounting rate on a 50/50 basis. An accounting rate is part of a compensation agreement negotiated between a U.S. carrier and its foreign correspondent on a particular international route.
2/ ISR/Hubbed - International Simple Resale (ISR) refers to the provision of switched services over private lines, interconnected to the public switched network, between the United States and Commission-approved countries. Switched hubbing refers to the provision of switched services over interconnected private lines between the U.S. and an ISR-approved country in order to originate or terminate U.S. traffic in a third country. See 47 CFR 63.17.
3/ Alternative - Also referred to as flexible settlement arrangements. Carriers must report separately in their section 43.61 traffic reports their U.S. and foreign billed traffic that was settled under an alternative settlement arrangement for which the carrier received Commission approval under section 64.1002 of the rules. See 47 CFR 64.1002.
The following companies' Section 43.61(a) international telecommunications traffic reports differ from prior reports because of mergers, acquisitions, and changes in corporate structure:
4/ Access Telecom discontinued international circuit facilities and became a pure reseller in 1999. 5/ AirTouch Communications is included with Verizon Wireless for calendar year 1999. 6/ ATC Teleports, started by American Tower Corp., bought ICG Satellite Services, its subsidiary, Maritime Telecommunications Network, Dallas Teleport, U.S. Electrodynamics, and Washington Int'l Teleport. 7/ BLD, Inc. sold its assets to Conversent Communications, LLC on December 21, 1999. 8/ Cable & Wireless filed a letter with the Federal Communications Commission on 1/12/99 to decertify BPGI, Inc. 9/ CenturyTel Area Long Lines, Inc. and CenturyTel Telecommunications, Inc. combined their long distance operations and formed CenturyTel Long Distance, Inc. in January, 1999. CenturyTel Telecommunications, Inc. continues to provide separate operator services. The above information is only for the international services provided by the companies for calendar year 1999.10/ Cincinnati Bell Wireless, LLC is a joint venture between Broadwing, Inc., and AT&T Wireless PCS, LLC.11/ Coastal Telephone merged with Eclipse Telecommunications on 5/24/99.12/ ComTel Computer Corp.'s assets were purchased on April 30, 1999 by Hotel Connect Management, Inc. ComTel Computer is no longer operating.13/ CruisePhone Inc. filed Chapter 11 on November 30, 1999. On May 4, 2000, CruisePhone sold its assets and contracts to Maritime Telecommunications Network. As of May 31, 2000, CruisePhone ceased providing telecommunications services to customers. 14/ Flat Rate Communications, Inc. and YYC Communications, Inc. operations were both folded into Viatel, Inc.15/ Global Crossing Telecommunications, Inc. was formerly Allnet Communication Services, Inc. Global Crossing's international traffic report includes the following Global Crossing companies:
Frontier Communications International Inc. Frontier Communications of the West, Inc. Global Crossing Telemanagement, Inc. (formerly Frontier Telemanagement Inc.)
16/ Group Long Distance, Inc. discontinued providing international telecommunications services after calendar year 1998.17/ GST Action Telecom sold its long distance services to NTS Communications, Inc. in November, 1999. GST USA, Inc. aggregated its annual Section 43.61(a) international traffic reports for the following subsidiaries:
GST Call America, Inc. GST Telecom, Inc. GST Net, Inc. TotalNet Communications, Inc.
18/ GTE's and Bell Atlantic's merger was completed 6/30/2000. GTE Telecom was completely separated from GTE. The new name of the company is Genuity Telecom.19/ Infonet Broadband Services Corporation determined that, during calendar year 1999, it provided enhanced services which are not covered under Section 43.61(a) of the Commission's Rules.20/ NEXTLINK Communications, Inc. consolidated its annual Section 43.61(a) international traffic report for the following subsidiaries:
ITC d/b/a NEXTLINK Affinity NEXTLINK New Jersey, Inc. NEXTLINK Arizona, Inc. NEXTLINK New York, Inc. NEXTLINK California, Inc. NEXTLINK Ohio, Inc. NEXTLINK Colorado, L.L.C. NEXTLINK Pennsylvania, Inc. NEXTLINK D.C., Inc. NEXTLINK Pennsylvania Merger NEXTLINK Delaware, Inc. Company II, Inc. NEXTLINK Florida, Inc. NEXTLINK Tennessee, Inc. NEXTLINK Georgia, Inc. NEXTLINK Utah, Inc. NEXTLINK Illinois, Inc. NEXTLINK Virginia, L.L.C. NEXTLINK Massachusetts, Inc. NEXTLINK Washington, Inc. NEXTLINK Michigan, Inc. Telecommunications of Nevada, L.L.C. NEXTLINK Missouri, Inc. d/b/a NEXTLINK Nevada
168
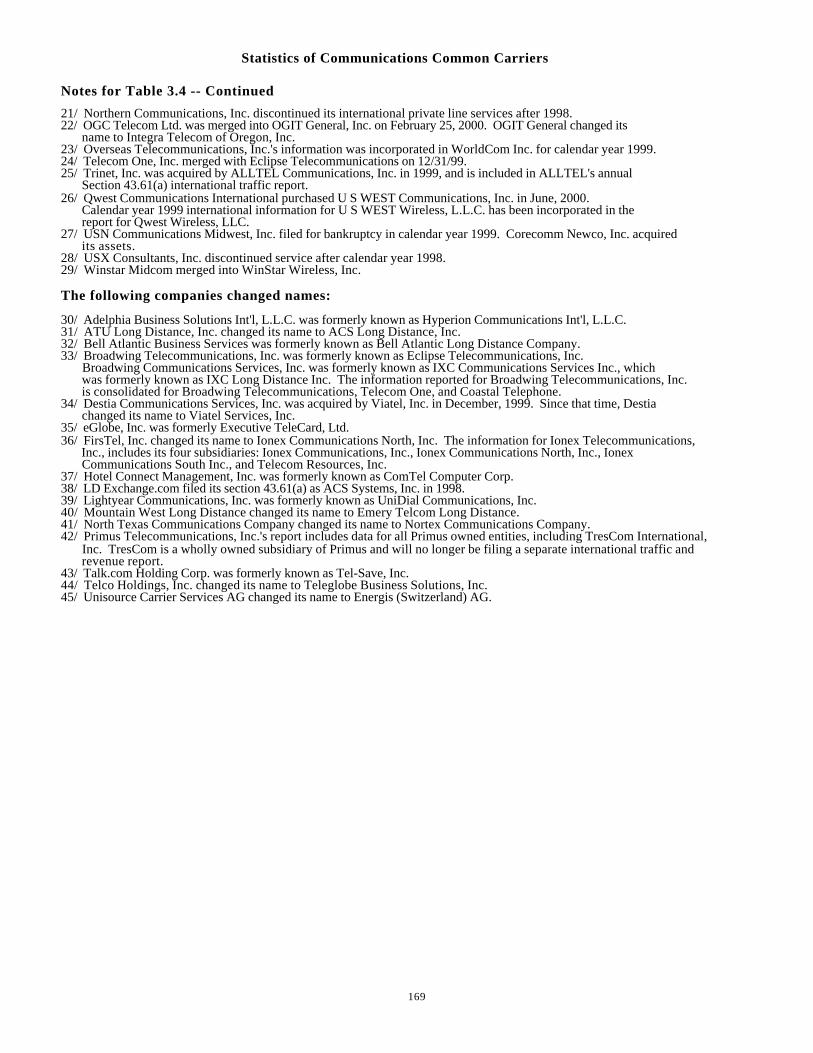
Statistics of Communications Common Carriers
Notes for Table 3.4 -- Continued
21/ Northern Communications, Inc. discontinued its international private line services after 1998.22/ OGC Telecom Ltd. was merged into OGIT General, Inc. on February 25, 2000. OGIT General changed its name to Integra Telecom of Oregon, Inc.23/ Overseas Telecommunications, Inc.'s information was incorporated in WorldCom Inc. for calendar year 1999.24/ Telecom One, Inc. merged with Eclipse Telecommunications on 12/31/99.25/ Trinet, Inc. was acquired by ALLTEL Communications, Inc. in 1999, and is included in ALLTEL's annual Section 43.61(a) international traffic report.26/ Qwest Communications International purchased U S WEST Communications, Inc. in June, 2000. Calendar year 1999 international information for U S WEST Wireless, L.L.C. has been incorporated in the report for Qwest Wireless, LLC.27/ USN Communications Midwest, Inc. filed for bankruptcy in calendar year 1999. Corecomm Newco, Inc. acquired its assets.28/ USX Consultants, Inc. discontinued service after calendar year 1998.29/ Winstar Midcom merged into WinStar Wireless, Inc.
The following companies changed names:
30/ Adelphia Business Solutions Int'l, L.L.C. was formerly known as Hyperion Communications Int'l, L.L.C.31/ ATU Long Distance, Inc. changed its name to ACS Long Distance, Inc.32/ Bell Atlantic Business Services was formerly known as Bell Atlantic Long Distance Company.33/ Broadwing Telecommunications, Inc. was formerly known as Eclipse Telecommunications, Inc. Broadwing Communications Services, Inc. was formerly known as IXC Communications Services Inc., which was formerly known as IXC Long Distance Inc. The information reported for Broadwing Telecommunications, Inc. is consolidated for Broadwing Telecommunications, Telecom One, and Coastal Telephone.34/ Destia Communications Services, Inc. was acquired by Viatel, Inc. in December, 1999. Since that time, Destia changed its name to Viatel Services, Inc.35/ eGlobe, Inc. was formerly Executive TeleCard, Ltd.36/ FirsTel, Inc. changed its name to Ionex Communications North, Inc. The information for Ionex Telecommunications, Inc., includes its four subsidiaries: Ionex Communications, Inc., Ionex Communications North, Inc., Ionex Communications South Inc., and Telecom Resources, Inc.37/ Hotel Connect Management, Inc. was formerly known as ComTel Computer Corp. 38/ LD Exchange.com filed its section 43.61(a) as ACS Systems, Inc. in 1998.39/ Lightyear Communications, Inc. was formerly known as UniDial Communications, Inc.40/ Mountain West Long Distance changed its name to Emery Telcom Long Distance.41/ North Texas Communications Company changed its name to Nortex Communications Company.42/ Primus Telecommunications, Inc.'s report includes data for all Primus owned entities, including TresCom International, Inc. TresCom is a wholly owned subsidiary of Primus and will no longer be filing a separate international traffic and revenue report.43/ Talk.com Holding Corp. was formerly known as Tel-Save, Inc.44/ Telco Holdings, Inc. changed its name to Teleglobe Business Solutions, Inc.45/ Unisource Carrier Services AG changed its name to Energis (Switzerland) AG.
169
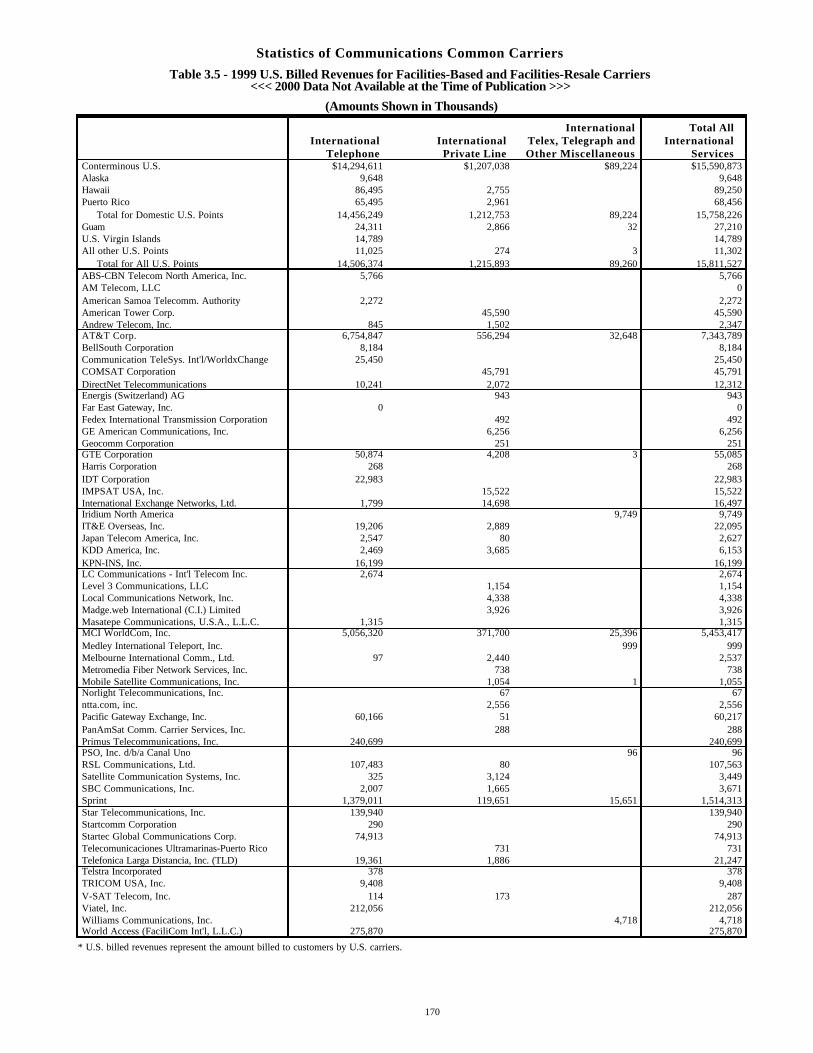
Statistics of Communications Common Carriers
Table 3.5 - 1999 U.S. Billed Revenues for Facilities-Based and Facilities-Resale Carriers<<< 2000 Data Not Available at the Time of Publication >>>
(Amounts Shown in Thousands)
International Total All International International Telex, Telegraph and International
Telephone Private Line Other Miscellaneous Services Conterminous U.S. $14,294,611 $1,207,038 $89,224 $15,590,873Alaska 9,648 9,648Hawaii 86,495 2,755 89,250Puerto Rico 65,495 2,961 68,456 Total for Domestic U.S. Points 14,456,249 1,212,753 89,224 15,758,226Guam 24,311 2,866 32 27,210U.S. Virgin Islands 14,789 14,789All other U.S. Points 11,025 274 3 11,302 Total for All U.S. Points 14,506,374 1,215,893 89,260 15,811,527ABS-CBN Telecom North America, Inc. 5,766 5,766AM Telecom, LLC 0American Samoa Telecomm. Authority 2,272 2,272American Tower Corp. 45,590 45,590Andrew Telecom, Inc. 845 1,502 2,347AT&T Corp. 6,754,847 556,294 32,648 7,343,789BellSouth Corporation 8,184 8,184Communication TeleSys. Int'l/WorldxChange 25,450 25,450COMSAT Corporation 45,791 45,791DirectNet Telecommunications 10,241 2,072 12,312Energis (Switzerland) AG 943 943Far East Gateway, Inc. 0 0Fedex International Transmission Corporation 492 492GE American Communications, Inc. 6,256 6,256Geocomm Corporation 251 251GTE Corporation 50,874 4,208 3 55,085Harris Corporation 268 268IDT Corporation 22,983 22,983IMPSAT USA, Inc. 15,522 15,522International Exchange Networks, Ltd. 1,799 14,698 16,497Iridium North America 9,749 9,749IT&E Overseas, Inc. 19,206 2,889 22,095Japan Telecom America, Inc. 2,547 80 2,627KDD America, Inc. 2,469 3,685 6,153KPN-INS, Inc. 16,199 16,199LC Communications - Int'l Telecom Inc. 2,674 2,674Level 3 Communications, LLC 1,154 1,154Local Communications Network, Inc. 4,338 4,338Madge.web International (C.I.) Limited 3,926 3,926Masatepe Communications, U.S.A., L.L.C. 1,315 1,315MCI WorldCom, Inc. 5,056,320 371,700 25,396 5,453,417Medley International Teleport, Inc. 999 999Melbourne International Comm., Ltd. 97 2,440 2,537Metromedia Fiber Network Services, Inc. 738 738Mobile Satellite Communications, Inc. 1,054 1 1,055Norlight Telecommunications, Inc. 67 67ntta.com, inc. 2,556 2,556Pacific Gateway Exchange, Inc. 60,166 51 60,217PanAmSat Comm. Carrier Services, Inc. 288 288Primus Telecommunications, Inc. 240,699 240,699PSO, Inc. d/b/a Canal Uno 96 96RSL Communications, Ltd. 107,483 80 107,563Satellite Communication Systems, Inc. 325 3,124 3,449SBC Communications, Inc. 2,007 1,665 3,671Sprint 1,379,011 119,651 15,651 1,514,313Star Telecommunications, Inc. 139,940 139,940Startcomm Corporation 290 290Startec Global Communications Corp. 74,913 74,913Telecomunicaciones Ultramarinas-Puerto Rico 731 731Telefonica Larga Distancia, Inc. (TLD) 19,361 1,886 21,247Telstra Incorporated 378 378TRICOM USA, Inc. 9,408 9,408V-SAT Telecom, Inc. 114 173 287Viatel, Inc. 212,056 212,056Williams Communications, Inc. 4,718 4,718World Access (FaciliCom Int'l, L.L.C.) 275,870 275,870
* U.S. billed revenues represent the amount billed to customers by U.S. carriers.
170
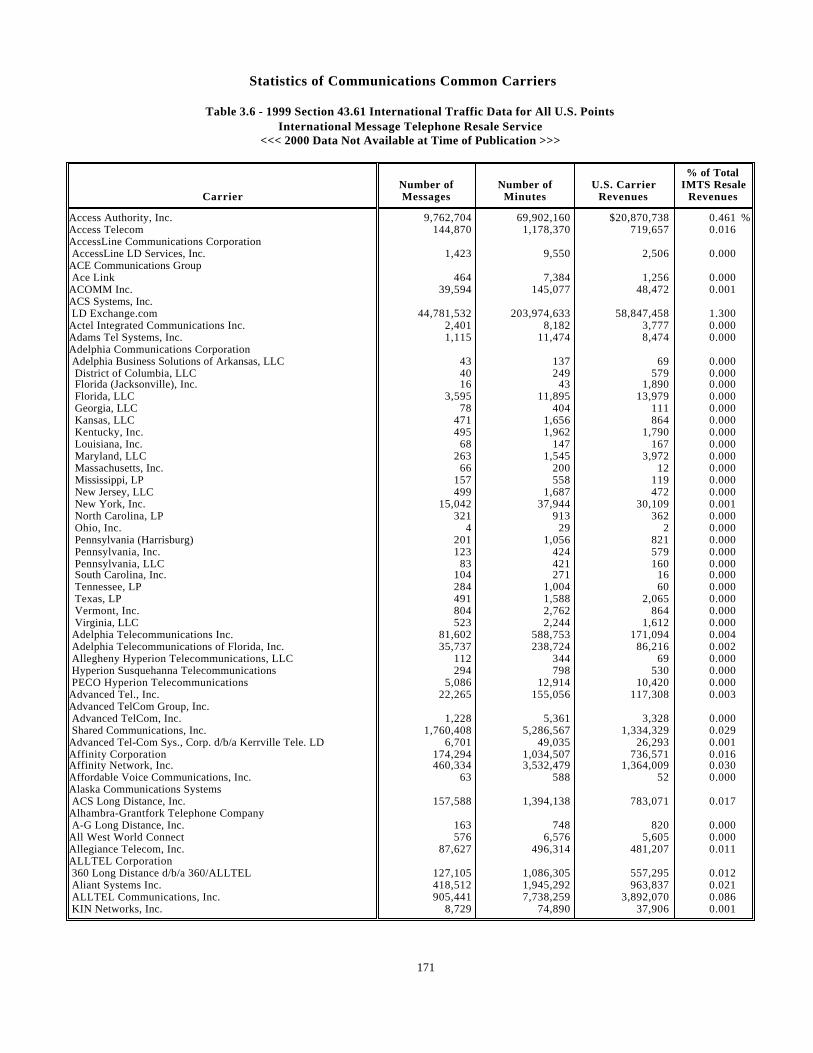
Statistics of Communications Common Carriers
Table 3.6 - 1999 Section 43.61 International Traffic Data for All U.S. PointsInternational Message Telephone Resale Service
<<< 2000 Data Not Available at Time of Publication >>>
% of Total Number of Number of U.S. Carrier IMTS Resale
Carrier Messages Minutes Revenues Revenues
Access Authority, Inc. 9,762,704 69,902,160 $20,870,738 0.461 %Access Telecom 144,870 1,178,370 719,657 0.016AccessLine Communications Corporation AccessLine LD Services, Inc. 1,423 9,550 2,506 0.000ACE Communications Group Ace Link 464 7,384 1,256 0.000ACOMM Inc. 39,594 145,077 48,472 0.001ACS Systems, Inc. LD Exchange.com 44,781,532 203,974,633 58,847,458 1.300Actel Integrated Communications Inc. 2,401 8,182 3,777 0.000Adams Tel Systems, Inc. 1,115 11,474 8,474 0.000Adelphia Communications Corporation Adelphia Business Solutions of Arkansas, LLC 43 137 69 0.000 District of Columbia, LLC 40 249 579 0.000 Florida (Jacksonville), Inc. 16 43 1,890 0.000 Florida, LLC 3,595 11,895 13,979 0.000 Georgia, LLC 78 404 111 0.000 Kansas, LLC 471 1,656 864 0.000 Kentucky, Inc. 495 1,962 1,790 0.000 Louisiana, Inc. 68 147 167 0.000 Maryland, LLC 263 1,545 3,972 0.000 Massachusetts, Inc. 66 200 12 0.000 Mississippi, LP 157 558 119 0.000 New Jersey, LLC 499 1,687 472 0.000 New York, Inc. 15,042 37,944 30,109 0.001 North Carolina, LP 321 913 362 0.000 Ohio, Inc. 4 29 2 0.000 Pennsylvania (Harrisburg) 201 1,056 821 0.000 Pennsylvania, Inc. 123 424 579 0.000 Pennsylvania, LLC 83 421 160 0.000 South Carolina, Inc. 104 271 16 0.000 Tennessee, LP 284 1,004 60 0.000 Texas, LP 491 1,588 2,065 0.000 Vermont, Inc. 804 2,762 864 0.000 Virginia, LLC 523 2,244 1,612 0.000 Adelphia Telecommunications Inc. 81,602 588,753 171,094 0.004 Adelphia Telecommunications of Florida, Inc. 35,737 238,724 86,216 0.002 Allegheny Hyperion Telecommunications, LLC 112 344 69 0.000 Hyperion Susquehanna Telecommunications 294 798 530 0.000 PECO Hyperion Telecommunications 5,086 12,914 10,420 0.000Advanced Tel., Inc. 22,265 155,056 117,308 0.003Advanced TelCom Group, Inc. Advanced TelCom, Inc. 1,228 5,361 3,328 0.000 Shared Communications, Inc. 1,760,408 5,286,567 1,334,329 0.029Advanced Tel-Com Sys., Corp. d/b/a Kerrville Tele. LD 6,701 49,035 26,293 0.001Affinity Corporation 174,294 1,034,507 736,571 0.016Affinity Network, Inc. 460,334 3,532,479 1,364,009 0.030Affordable Voice Communications, Inc. 63 588 52 0.000Alaska Communications Systems ACS Long Distance, Inc. 157,588 1,394,138 783,071 0.017Alhambra-Grantfork Telephone Company A-G Long Distance, Inc. 163 748 820 0.000All West World Connect 576 6,576 5,605 0.000Allegiance Telecom, Inc. 87,627 496,314 481,207 0.011ALLTEL Corporation 360 Long Distance d/b/a 360/ALLTEL 127,105 1,086,305 557,295 0.012 Aliant Systems Inc. 418,512 1,945,292 963,837 0.021 ALLTEL Communications, Inc. 905,441 7,738,259 3,892,070 0.086 KIN Networks, Inc. 8,729 74,890 37,906 0.001
171
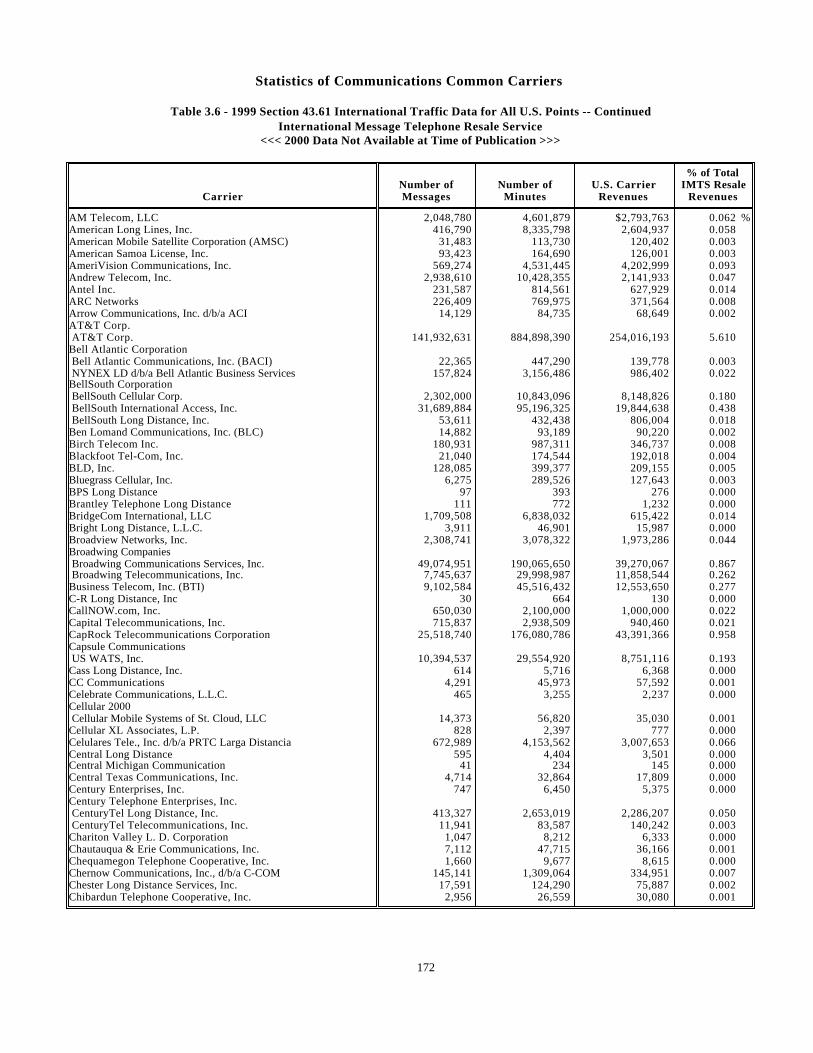
Statistics of Communications Common Carriers
Table 3.6 - 1999 Section 43.61 International Traffic Data for All U.S. Points -- ContinuedInternational Message Telephone Resale Service
<<< 2000 Data Not Available at Time of Publication >>>
% of Total Number of Number of U.S. Carrier IMTS Resale
Carrier Messages Minutes Revenues Revenues
AM Telecom, LLC 2,048,780 4,601,879 $2,793,763 0.062 %American Long Lines, Inc. 416,790 8,335,798 2,604,937 0.058American Mobile Satellite Corporation (AMSC) 31,483 113,730 120,402 0.003American Samoa License, Inc. 93,423 164,690 126,001 0.003AmeriVision Communications, Inc. 569,274 4,531,445 4,202,999 0.093Andrew Telecom, Inc. 2,938,610 10,428,355 2,141,933 0.047Antel Inc. 231,587 814,561 627,929 0.014ARC Networks 226,409 769,975 371,564 0.008Arrow Communications, Inc. d/b/a ACI 14,129 84,735 68,649 0.002AT&T Corp. AT&T Corp. 141,932,631 884,898,390 254,016,193 5.610Bell Atlantic Corporation Bell Atlantic Communications, Inc. (BACI) 22,365 447,290 139,778 0.003 NYNEX LD d/b/a Bell Atlantic Business Services 157,824 3,156,486 986,402 0.022BellSouth Corporation BellSouth Cellular Corp. 2,302,000 10,843,096 8,148,826 0.180 BellSouth International Access, Inc. 31,689,884 95,196,325 19,844,638 0.438 BellSouth Long Distance, Inc. 53,611 432,438 806,004 0.018Ben Lomand Communications, Inc. (BLC) 14,882 93,189 90,220 0.002Birch Telecom Inc. 180,931 987,311 346,737 0.008Blackfoot Tel-Com, Inc. 21,040 174,544 192,018 0.004BLD, Inc. 128,085 399,377 209,155 0.005Bluegrass Cellular, Inc. 6,275 289,526 127,643 0.003BPS Long Distance 97 393 276 0.000Brantley Telephone Long Distance 111 772 1,232 0.000BridgeCom International, LLC 1,709,508 6,838,032 615,422 0.014Bright Long Distance, L.L.C. 3,911 46,901 15,987 0.000Broadview Networks, Inc. 2,308,741 3,078,322 1,973,286 0.044Broadwing Companies Broadwing Communications Services, Inc. 49,074,951 190,065,650 39,270,067 0.867 Broadwing Telecommunications, Inc. 7,745,637 29,998,987 11,858,544 0.262Business Telecom, Inc. (BTI) 9,102,584 45,516,432 12,553,650 0.277C-R Long Distance, Inc 30 664 130 0.000CallNOW.com, Inc. 650,030 2,100,000 1,000,000 0.022Capital Telecommunications, Inc. 715,837 2,938,509 940,460 0.021CapRock Telecommunications Corporation 25,518,740 176,080,786 43,391,366 0.958Capsule Communications US WATS, Inc. 10,394,537 29,554,920 8,751,116 0.193Cass Long Distance, Inc. 614 5,716 6,368 0.000CC Communications 4,291 45,973 57,592 0.001Celebrate Communications, L.L.C. 465 3,255 2,237 0.000Cellular 2000 Cellular Mobile Systems of St. Cloud, LLC 14,373 56,820 35,030 0.001Cellular XL Associates, L.P. 828 2,397 777 0.000Celulares Tele., Inc. d/b/a PRTC Larga Distancia 672,989 4,153,562 3,007,653 0.066Central Long Distance 595 4,404 3,501 0.000Central Michigan Communication 41 234 145 0.000Central Texas Communications, Inc. 4,714 32,864 17,809 0.000Century Enterprises, Inc. 747 6,450 5,375 0.000Century Telephone Enterprises, Inc. CenturyTel Long Distance, Inc. 413,327 2,653,019 2,286,207 0.050 CenturyTel Telecommunications, Inc. 11,941 83,587 140,242 0.003Chariton Valley L. D. Corporation 1,047 8,212 6,333 0.000Chautauqua & Erie Communications, Inc. 7,112 47,715 36,166 0.001Chequamegon Telephone Cooperative, Inc. 1,660 9,677 8,615 0.000Chernow Communications, Inc., d/b/a C-COM 145,141 1,309,064 334,951 0.007Chester Long Distance Services, Inc. 17,591 124,290 75,887 0.002Chibardun Telephone Cooperative, Inc. 2,956 26,559 30,080 0.001
172
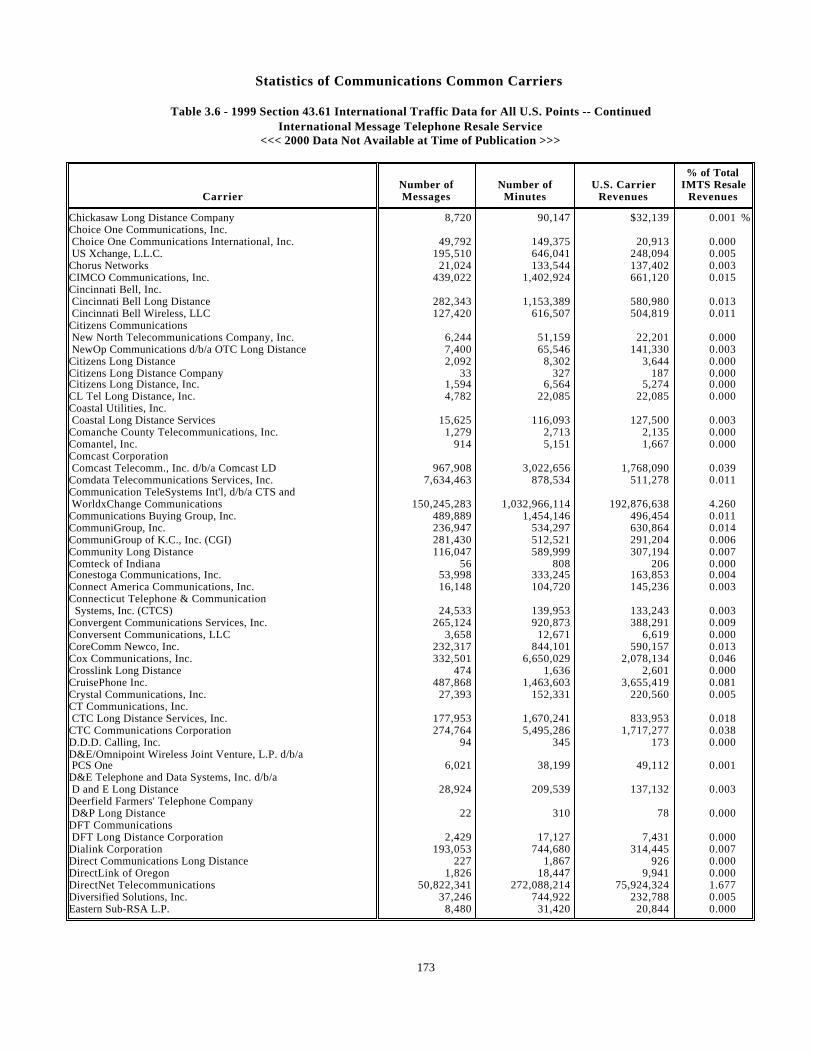
Statistics of Communications Common Carriers
Table 3.6 - 1999 Section 43.61 International Traffic Data for All U.S. Points -- ContinuedInternational Message Telephone Resale Service
<<< 2000 Data Not Available at Time of Publication >>>
% of Total Number of Number of U.S. Carrier IMTS Resale
Carrier Messages Minutes Revenues Revenues
Chickasaw Long Distance Company 8,720 90,147 $32,139 0.001 %Choice One Communications, Inc. Choice One Communications International, Inc. 49,792 149,375 20,913 0.000 US Xchange, L.L.C. 195,510 646,041 248,094 0.005Chorus Networks 21,024 133,544 137,402 0.003CIMCO Communications, Inc. 439,022 1,402,924 661,120 0.015Cincinnati Bell, Inc. Cincinnati Bell Long Distance 282,343 1,153,389 580,980 0.013 Cincinnati Bell Wireless, LLC 127,420 616,507 504,819 0.011Citizens Communications New North Telecommunications Company, Inc. 6,244 51,159 22,201 0.000 NewOp Communications d/b/a OTC Long Distance 7,400 65,546 141,330 0.003Citizens Long Distance 2,092 8,302 3,644 0.000Citizens Long Distance Company 33 327 187 0.000Citizens Long Distance, Inc. 1,594 6,564 5,274 0.000CL Tel Long Distance, Inc. 4,782 22,085 22,085 0.000Coastal Utilities, Inc. Coastal Long Distance Services 15,625 116,093 127,500 0.003Comanche County Telecommunications, Inc. 1,279 2,713 2,135 0.000Comantel, Inc. 914 5,151 1,667 0.000Comcast Corporation Comcast Telecomm., Inc. d/b/a Comcast LD 967,908 3,022,656 1,768,090 0.039Comdata Telecommunications Services, Inc. 7,634,463 878,534 511,278 0.011Communication TeleSystems Int'l, d/b/a CTS and WorldxChange Communications 150,245,283 1,032,966,114 192,876,638 4.260Communications Buying Group, Inc. 489,889 1,454,146 496,454 0.011CommuniGroup, Inc. 236,947 534,297 630,864 0.014CommuniGroup of K.C., Inc. (CGI) 281,430 512,521 291,204 0.006Community Long Distance 116,047 589,999 307,194 0.007Comteck of Indiana 56 808 206 0.000Conestoga Communications, Inc. 53,998 333,245 163,853 0.004Connect America Communications, Inc. 16,148 104,720 145,236 0.003Connecticut Telephone & Communication Systems, Inc. (CTCS) 24,533 139,953 133,243 0.003Convergent Communications Services, Inc. 265,124 920,873 388,291 0.009Conversent Communications, LLC 3,658 12,671 6,619 0.000CoreComm Newco, Inc. 232,317 844,101 590,157 0.013Cox Communications, Inc. 332,501 6,650,029 2,078,134 0.046Crosslink Long Distance 474 1,636 2,601 0.000CruisePhone Inc. 487,868 1,463,603 3,655,419 0.081Crystal Communications, Inc. 27,393 152,331 220,560 0.005CT Communications, Inc. CTC Long Distance Services, Inc. 177,953 1,670,241 833,953 0.018CTC Communications Corporation 274,764 5,495,286 1,717,277 0.038D.D.D. Calling, Inc. 94 345 173 0.000D&E/Omnipoint Wireless Joint Venture, L.P. d/b/a PCS One 6,021 38,199 49,112 0.001D&E Telephone and Data Systems, Inc. d/b/a D and E Long Distance 28,924 209,539 137,132 0.003Deerfield Farmers' Telephone Company D&P Long Distance 22 310 78 0.000DFT Communications DFT Long Distance Corporation 2,429 17,127 7,431 0.000Dialink Corporation 193,053 744,680 314,445 0.007Direct Communications Long Distance 227 1,867 926 0.000DirectLink of Oregon 1,826 18,447 9,941 0.000DirectNet Telecommunications 50,822,341 272,088,214 75,924,324 1.677Diversified Solutions, Inc. 37,246 744,922 232,788 0.005Eastern Sub-RSA L.P. 8,480 31,420 20,844 0.000
173
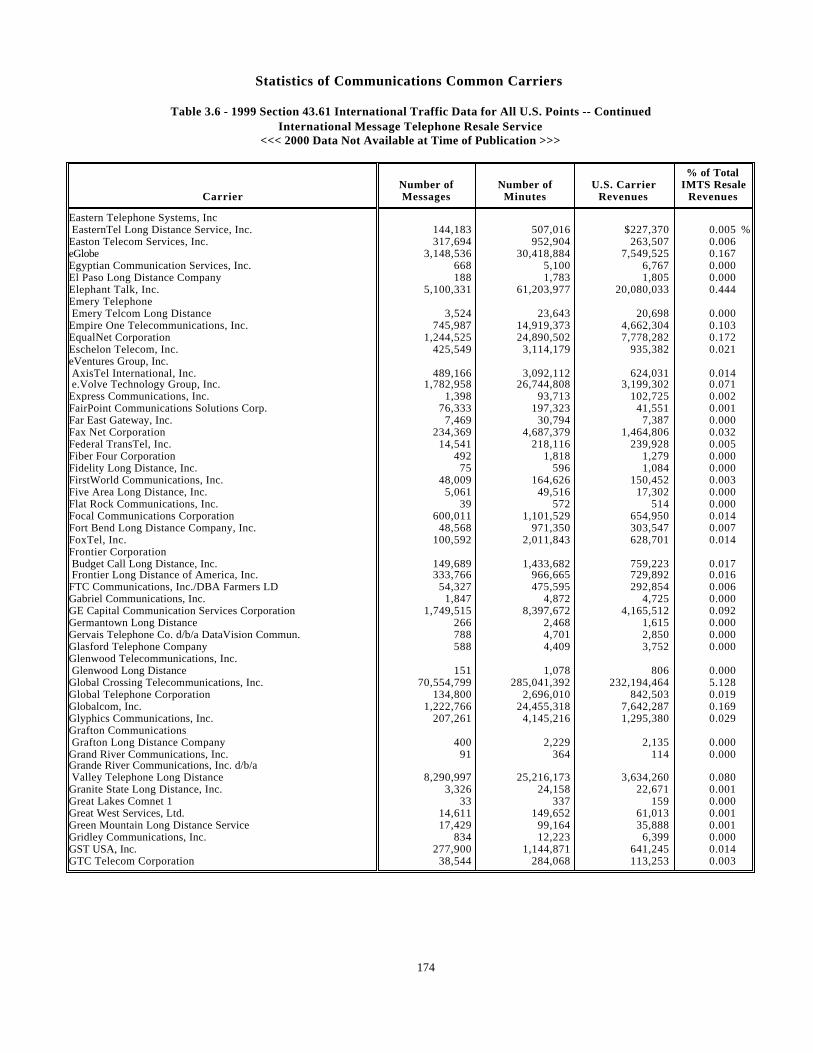
Statistics of Communications Common Carriers
Table 3.6 - 1999 Section 43.61 International Traffic Data for All U.S. Points -- ContinuedInternational Message Telephone Resale Service
<<< 2000 Data Not Available at Time of Publication >>>
% of Total Number of Number of U.S. Carrier IMTS Resale
Carrier Messages Minutes Revenues Revenues
Eastern Telephone Systems, Inc EasternTel Long Distance Service, Inc. 144,183 507,016 $227,370 0.005 %Easton Telecom Services, Inc. 317,694 952,904 263,507 0.006eGlobe 3,148,536 30,418,884 7,549,525 0.167Egyptian Communication Services, Inc. 668 5,100 6,767 0.000El Paso Long Distance Company 188 1,783 1,805 0.000Elephant Talk, Inc. 5,100,331 61,203,977 20,080,033 0.444Emery Telephone Emery Telcom Long Distance 3,524 23,643 20,698 0.000Empire One Telecommunications, Inc. 745,987 14,919,373 4,662,304 0.103EqualNet Corporation 1,244,525 24,890,502 7,778,282 0.172Eschelon Telecom, Inc. 425,549 3,114,179 935,382 0.021eVentures Group, Inc. AxisTel International, Inc. 489,166 3,092,112 624,031 0.014 e.Volve Technology Group, Inc. 1,782,958 26,744,808 3,199,302 0.071Express Communications, Inc. 1,398 93,713 102,725 0.002FairPoint Communications Solutions Corp. 76,333 197,323 41,551 0.001Far East Gateway, Inc. 7,469 30,794 7,387 0.000Fax Net Corporation 234,369 4,687,379 1,464,806 0.032Federal TransTel, Inc. 14,541 218,116 239,928 0.005Fiber Four Corporation 492 1,818 1,279 0.000Fidelity Long Distance, Inc. 75 596 1,084 0.000FirstWorld Communications, Inc. 48,009 164,626 150,452 0.003Five Area Long Distance, Inc. 5,061 49,516 17,302 0.000Flat Rock Communications, Inc. 39 572 514 0.000Focal Communications Corporation 600,011 1,101,529 654,950 0.014Fort Bend Long Distance Company, Inc. 48,568 971,350 303,547 0.007FoxTel, Inc. 100,592 2,011,843 628,701 0.014Frontier Corporation Budget Call Long Distance, Inc. 149,689 1,433,682 759,223 0.017 Frontier Long Distance of America, Inc. 333,766 966,665 729,892 0.016FTC Communications, Inc./DBA Farmers LD 54,327 475,595 292,854 0.006Gabriel Communications, Inc. 1,847 4,872 4,725 0.000GE Capital Communication Services Corporation 1,749,515 8,397,672 4,165,512 0.092Germantown Long Distance 266 2,468 1,615 0.000Gervais Telephone Co. d/b/a DataVision Commun. 788 4,701 2,850 0.000Glasford Telephone Company 588 4,409 3,752 0.000Glenwood Telecommunications, Inc. Glenwood Long Distance 151 1,078 806 0.000Global Crossing Telecommunications, Inc. 70,554,799 285,041,392 232,194,464 5.128Global Telephone Corporation 134,800 2,696,010 842,503 0.019Globalcom, Inc. 1,222,766 24,455,318 7,642,287 0.169Glyphics Communications, Inc. 207,261 4,145,216 1,295,380 0.029Grafton Communications Grafton Long Distance Company 400 2,229 2,135 0.000Grand River Communications, Inc. 91 364 114 0.000Grande River Communications, Inc. d/b/a Valley Telephone Long Distance 8,290,997 25,216,173 3,634,260 0.080Granite State Long Distance, Inc. 3,326 24,158 22,671 0.001Great Lakes Comnet 1 33 337 159 0.000Great West Services, Ltd. 14,611 149,652 61,013 0.001Green Mountain Long Distance Service 17,429 99,164 35,888 0.001Gridley Communications, Inc. 834 12,223 6,399 0.000GST USA, Inc. 277,900 1,144,871 641,245 0.014GTC Telecom Corporation 38,544 284,068 113,253 0.003
174
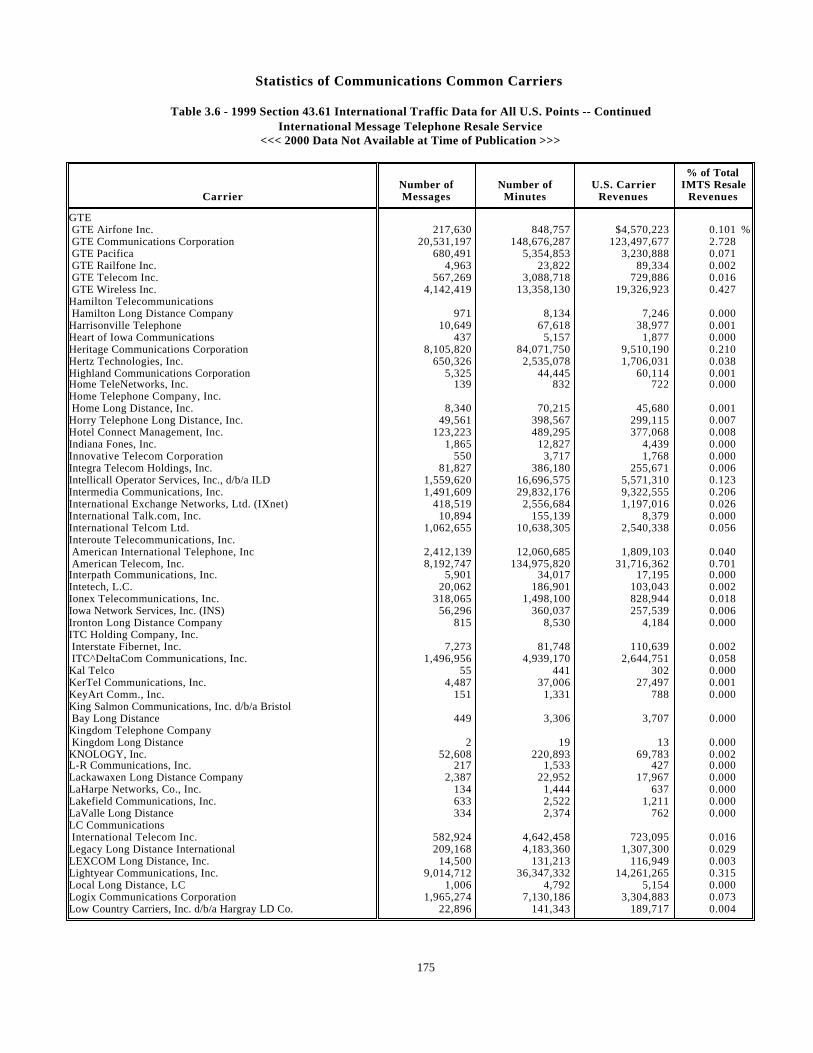
Statistics of Communications Common Carriers
Table 3.6 - 1999 Section 43.61 International Traffic Data for All U.S. Points -- ContinuedInternational Message Telephone Resale Service
<<< 2000 Data Not Available at Time of Publication >>>
% of Total Number of Number of U.S. Carrier IMTS Resale
Carrier Messages Minutes Revenues Revenues
GTE GTE Airfone Inc. 217,630 848,757 $4,570,223 0.101 % GTE Communications Corporation 20,531,197 148,676,287 123,497,677 2.728 GTE Pacifica 680,491 5,354,853 3,230,888 0.071 GTE Railfone Inc. 4,963 23,822 89,334 0.002 GTE Telecom Inc. 567,269 3,088,718 729,886 0.016 GTE Wireless Inc. 4,142,419 13,358,130 19,326,923 0.427Hamilton Telecommunications Hamilton Long Distance Company 971 8,134 7,246 0.000Harrisonville Telephone 10,649 67,618 38,977 0.001Heart of Iowa Communications 437 5,157 1,877 0.000Heritage Communications Corporation 8,105,820 84,071,750 9,510,190 0.210Hertz Technologies, Inc. 650,326 2,535,078 1,706,031 0.038Highland Communications Corporation 5,325 44,445 60,114 0.001Home TeleNetworks, Inc. 139 832 722 0.000Home Telephone Company, Inc. Home Long Distance, Inc. 8,340 70,215 45,680 0.001Horry Telephone Long Distance, Inc. 49,561 398,567 299,115 0.007Hotel Connect Management, Inc. 123,223 489,295 377,068 0.008Indiana Fones, Inc. 1,865 12,827 4,439 0.000Innovative Telecom Corporation 550 3,717 1,768 0.000Integra Telecom Holdings, Inc. 81,827 386,180 255,671 0.006Intellicall Operator Services, Inc., d/b/a ILD 1,559,620 16,696,575 5,571,310 0.123Intermedia Communications, Inc. 1,491,609 29,832,176 9,322,555 0.206International Exchange Networks, Ltd. (IXnet) 418,519 2,556,684 1,197,016 0.026International Talk.com, Inc. 10,894 155,139 8,379 0.000International Telcom Ltd. 1,062,655 10,638,305 2,540,338 0.056Interoute Telecommunications, Inc. American International Telephone, Inc 2,412,139 12,060,685 1,809,103 0.040 American Telecom, Inc. 8,192,747 134,975,820 31,716,362 0.701Interpath Communications, Inc. 5,901 34,017 17,195 0.000Intetech, L.C. 20,062 186,901 103,043 0.002Ionex Telecommunications, Inc. 318,065 1,498,100 828,944 0.018Iowa Network Services, Inc. (INS) 56,296 360,037 257,539 0.006Ironton Long Distance Company 815 8,530 4,184 0.000ITC Holding Company, Inc. Interstate Fibernet, Inc. 7,273 81,748 110,639 0.002 ITC^DeltaCom Communications, Inc. 1,496,956 4,939,170 2,644,751 0.058Kal Telco 55 441 302 0.000KerTel Communications, Inc. 4,487 37,006 27,497 0.001KeyArt Comm., Inc. 151 1,331 788 0.000King Salmon Communications, Inc. d/b/a Bristol Bay Long Distance 449 3,306 3,707 0.000Kingdom Telephone Company Kingdom Long Distance 2 19 13 0.000KNOLOGY, Inc. 52,608 220,893 69,783 0.002L-R Communications, Inc. 217 1,533 427 0.000Lackawaxen Long Distance Company 2,387 22,952 17,967 0.000LaHarpe Networks, Co., Inc. 134 1,444 637 0.000Lakefield Communications, Inc. 633 2,522 1,211 0.000LaValle Long Distance 334 2,374 762 0.000LC Communications International Telecom Inc. 582,924 4,642,458 723,095 0.016Legacy Long Distance International 209,168 4,183,360 1,307,300 0.029LEXCOM Long Distance, Inc. 14,500 131,213 116,949 0.003Lightyear Communications, Inc. 9,014,712 36,347,332 14,261,265 0.315Local Long Distance, LC 1,006 4,792 5,154 0.000Logix Communications Corporation 1,965,274 7,130,186 3,304,883 0.073Low Country Carriers, Inc. d/b/a Hargray LD Co. 22,896 141,343 189,717 0.004
175
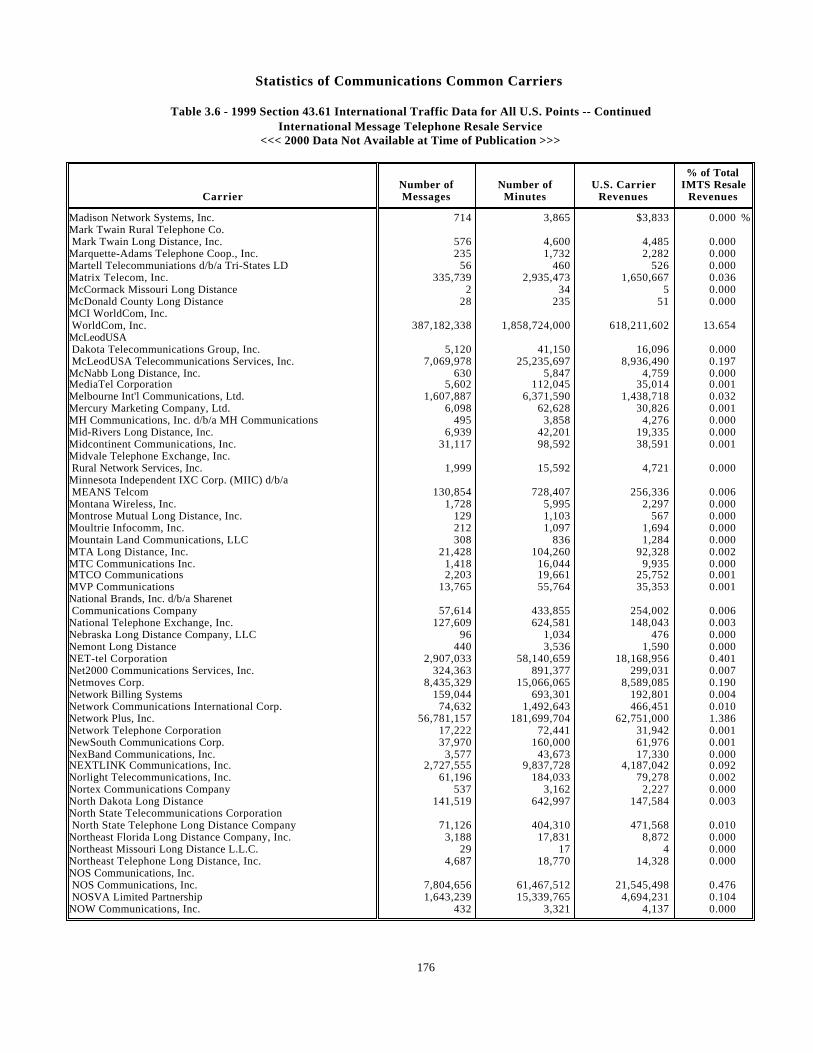
Statistics of Communications Common Carriers
Table 3.6 - 1999 Section 43.61 International Traffic Data for All U.S. Points -- ContinuedInternational Message Telephone Resale Service
<<< 2000 Data Not Available at Time of Publication >>>
% of Total Number of Number of U.S. Carrier IMTS Resale
Carrier Messages Minutes Revenues Revenues
Madison Network Systems, Inc. 714 3,865 $3,833 0.000 %Mark Twain Rural Telephone Co. Mark Twain Long Distance, Inc. 576 4,600 4,485 0.000Marquette-Adams Telephone Coop., Inc. 235 1,732 2,282 0.000Martell Telecommuniations d/b/a Tri-States LD 56 460 526 0.000Matrix Telecom, Inc. 335,739 2,935,473 1,650,667 0.036McCormack Missouri Long Distance 2 34 5 0.000McDonald County Long Distance 28 235 51 0.000MCI WorldCom, Inc. WorldCom, Inc. 387,182,338 1,858,724,000 618,211,602 13.654McLeodUSA Dakota Telecommunications Group, Inc. 5,120 41,150 16,096 0.000 McLeodUSA Telecommunications Services, Inc. 7,069,978 25,235,697 8,936,490 0.197McNabb Long Distance, Inc. 630 5,847 4,759 0.000MediaTel Corporation 5,602 112,045 35,014 0.001Melbourne Int'l Communications, Ltd. 1,607,887 6,371,590 1,438,718 0.032Mercury Marketing Company, Ltd. 6,098 62,628 30,826 0.001MH Communications, Inc. d/b/a MH Communications 495 3,858 4,276 0.000Mid-Rivers Long Distance, Inc. 6,939 42,201 19,335 0.000Midcontinent Communications, Inc. 31,117 98,592 38,591 0.001Midvale Telephone Exchange, Inc. Rural Network Services, Inc. 1,999 15,592 4,721 0.000Minnesota Independent IXC Corp. (MIIC) d/b/a MEANS Telcom 130,854 728,407 256,336 0.006Montana Wireless, Inc. 1,728 5,995 2,297 0.000Montrose Mutual Long Distance, Inc. 129 1,103 567 0.000Moultrie Infocomm, Inc. 212 1,097 1,694 0.000Mountain Land Communications, LLC 308 836 1,284 0.000MTA Long Distance, Inc. 21,428 104,260 92,328 0.002MTC Communications Inc. 1,418 16,044 9,935 0.000MTCO Communications 2,203 19,661 25,752 0.001MVP Communications 13,765 55,764 35,353 0.001National Brands, Inc. d/b/a Sharenet Communications Company 57,614 433,855 254,002 0.006National Telephone Exchange, Inc. 127,609 624,581 148,043 0.003Nebraska Long Distance Company, LLC 96 1,034 476 0.000Nemont Long Distance 440 3,536 1,590 0.000NET-tel Corporation 2,907,033 58,140,659 18,168,956 0.401Net2000 Communications Services, Inc. 324,363 891,377 299,031 0.007Netmoves Corp. 8,435,329 15,066,065 8,589,085 0.190Network Billing Systems 159,044 693,301 192,801 0.004Network Communications International Corp. 74,632 1,492,643 466,451 0.010Network Plus, Inc. 56,781,157 181,699,704 62,751,000 1.386Network Telephone Corporation 17,222 72,441 31,942 0.001NewSouth Communications Corp. 37,970 160,000 61,976 0.001NexBand Communications, Inc. 3,577 43,673 17,330 0.000NEXTLINK Communications, Inc. 2,727,555 9,837,728 4,187,042 0.092Norlight Telecommunications, Inc. 61,196 184,033 79,278 0.002Nortex Communications Company 537 3,162 2,227 0.000North Dakota Long Distance 141,519 642,997 147,584 0.003North State Telecommunications Corporation North State Telephone Long Distance Company 71,126 404,310 471,568 0.010Northeast Florida Long Distance Company, Inc. 3,188 17,831 8,872 0.000Northeast Missouri Long Distance L.L.C. 29 17 4 0.000Northeast Telephone Long Distance, Inc. 4,687 18,770 14,328 0.000NOS Communications, Inc. NOS Communications, Inc. 7,804,656 61,467,512 21,545,498 0.476 NOSVA Limited Partnership 1,643,239 15,339,765 4,694,231 0.104NOW Communications, Inc. 432 3,321 4,137 0.000
176
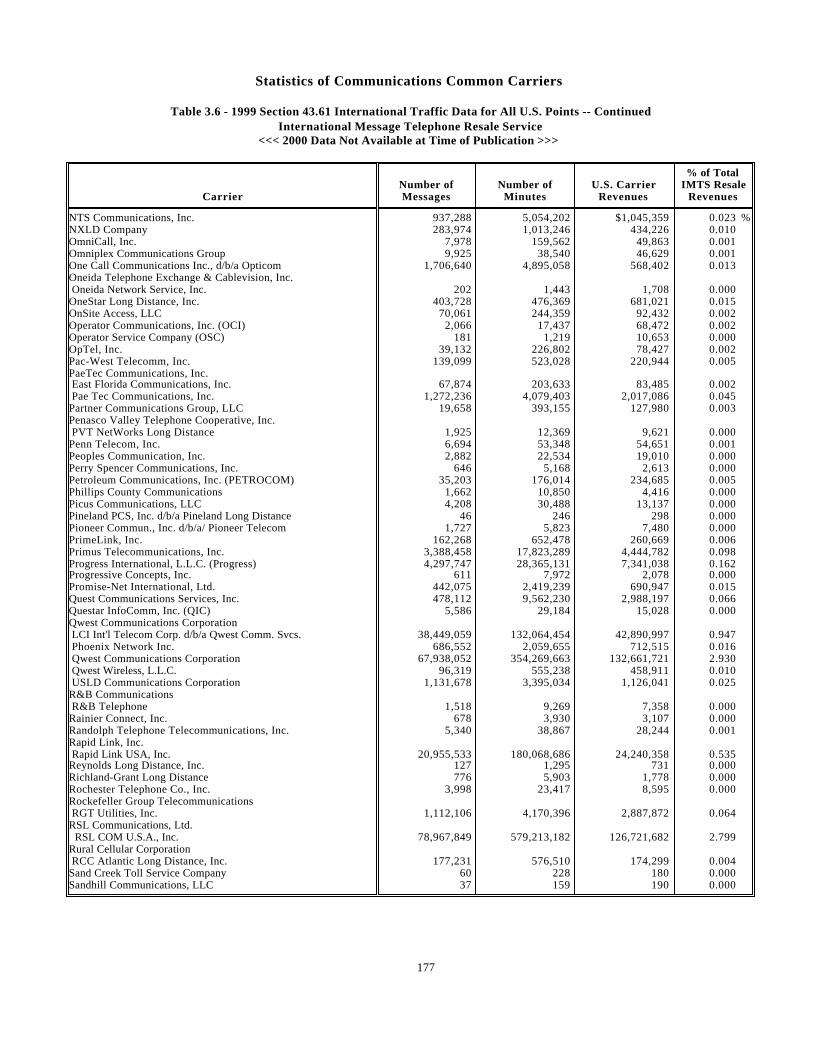
Statistics of Communications Common Carriers
Table 3.6 - 1999 Section 43.61 International Traffic Data for All U.S. Points -- ContinuedInternational Message Telephone Resale Service
<<< 2000 Data Not Available at Time of Publication >>>
% of Total Number of Number of U.S. Carrier IMTS Resale
Carrier Messages Minutes Revenues Revenues
NTS Communications, Inc. 937,288 5,054,202 $1,045,359 0.023 %NXLD Company 283,974 1,013,246 434,226 0.010OmniCall, Inc. 7,978 159,562 49,863 0.001Omniplex Communications Group 9,925 38,540 46,629 0.001One Call Communications Inc., d/b/a Opticom 1,706,640 4,895,058 568,402 0.013Oneida Telephone Exchange & Cablevision, Inc. Oneida Network Service, Inc. 202 1,443 1,708 0.000OneStar Long Distance, Inc. 403,728 476,369 681,021 0.015OnSite Access, LLC 70,061 244,359 92,432 0.002Operator Communications, Inc. (OCI) 2,066 17,437 68,472 0.002Operator Service Company (OSC) 181 1,219 10,653 0.000OpTel, Inc. 39,132 226,802 78,427 0.002Pac-West Telecomm, Inc. 139,099 523,028 220,944 0.005PaeTec Communications, Inc. East Florida Communications, Inc. 67,874 203,633 83,485 0.002 Pae Tec Communications, Inc. 1,272,236 4,079,403 2,017,086 0.045Partner Communications Group, LLC 19,658 393,155 127,980 0.003Penasco Valley Telephone Cooperative, Inc. PVT NetWorks Long Distance 1,925 12,369 9,621 0.000Penn Telecom, Inc. 6,694 53,348 54,651 0.001Peoples Communication, Inc. 2,882 22,534 19,010 0.000Perry Spencer Communications, Inc. 646 5,168 2,613 0.000Petroleum Communications, Inc. (PETROCOM) 35,203 176,014 234,685 0.005Phillips County Communications 1,662 10,850 4,416 0.000Picus Communications, LLC 4,208 30,488 13,137 0.000Pineland PCS, Inc. d/b/a Pineland Long Distance 46 246 298 0.000Pioneer Commun., Inc. d/b/a/ Pioneer Telecom 1,727 5,823 7,480 0.000PrimeLink, Inc. 162,268 652,478 260,669 0.006Primus Telecommunications, Inc. 3,388,458 17,823,289 4,444,782 0.098Progress International, L.L.C. (Progress) 4,297,747 28,365,131 7,341,038 0.162Progressive Concepts, Inc. 611 7,972 2,078 0.000Promise-Net International, Ltd. 442,075 2,419,239 690,947 0.015Quest Communications Services, Inc. 478,112 9,562,230 2,988,197 0.066Questar InfoComm, Inc. (QIC) 5,586 29,184 15,028 0.000Qwest Communications Corporation LCI Int'l Telecom Corp. d/b/a Qwest Comm. Svcs. 38,449,059 132,064,454 42,890,997 0.947 Phoenix Network Inc. 686,552 2,059,655 712,515 0.016 Qwest Communications Corporation 67,938,052 354,269,663 132,661,721 2.930 Qwest Wireless, L.L.C. 96,319 555,238 458,911 0.010 USLD Communications Corporation 1,131,678 3,395,034 1,126,041 0.025R&B Communications R&B Telephone 1,518 9,269 7,358 0.000Rainier Connect, Inc. 678 3,930 3,107 0.000Randolph Telephone Telecommunications, Inc. 5,340 38,867 28,244 0.001Rapid Link, Inc. Rapid Link USA, Inc. 20,955,533 180,068,686 24,240,358 0.535Reynolds Long Distance, Inc. 127 1,295 731 0.000Richland-Grant Long Distance 776 5,903 1,778 0.000Rochester Telephone Co., Inc. 3,998 23,417 8,595 0.000Rockefeller Group Telecommunications RGT Utilities, Inc. 1,112,106 4,170,396 2,887,872 0.064RSL Communications, Ltd. RSL COM U.S.A., Inc. 78,967,849 579,213,182 126,721,682 2.799Rural Cellular Corporation RCC Atlantic Long Distance, Inc. 177,231 576,510 174,299 0.004Sand Creek Toll Service Company 60 228 180 0.000Sandhill Communications, LLC 37 159 190 0.000
177
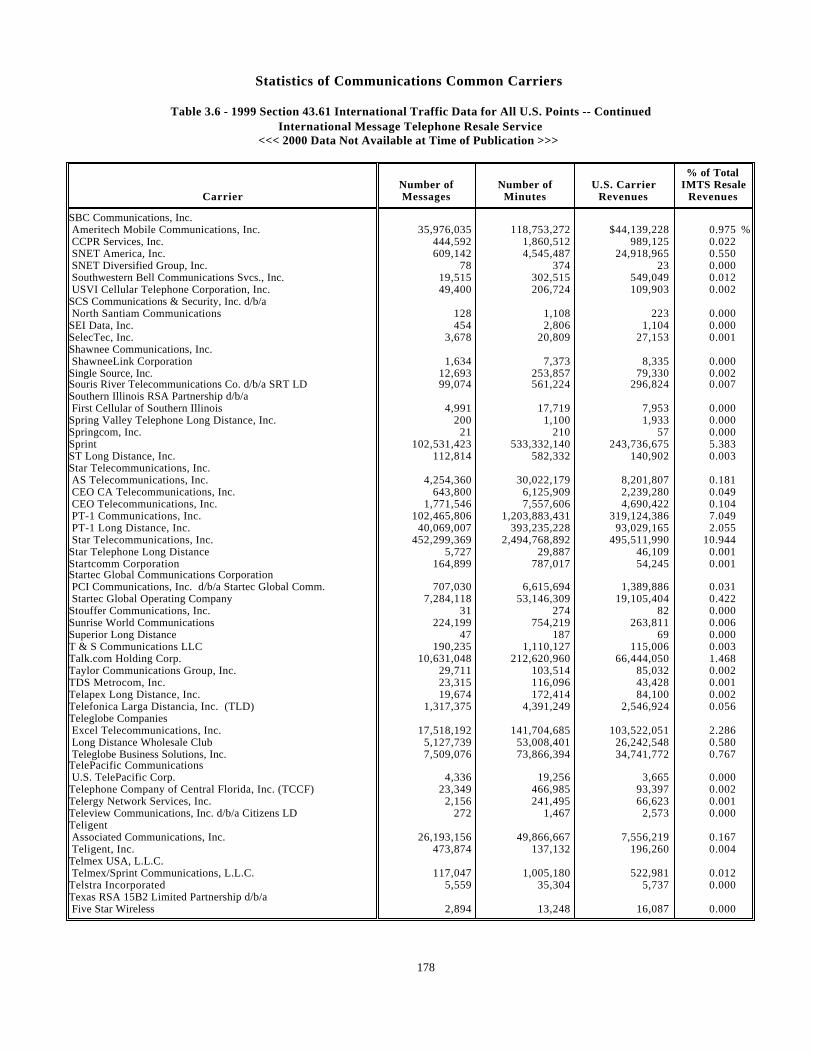
Statistics of Communications Common Carriers
Table 3.6 - 1999 Section 43.61 International Traffic Data for All U.S. Points -- ContinuedInternational Message Telephone Resale Service
<<< 2000 Data Not Available at Time of Publication >>>
% of Total Number of Number of U.S. Carrier IMTS Resale
Carrier Messages Minutes Revenues Revenues
SBC Communications, Inc. Ameritech Mobile Communications, Inc. 35,976,035 118,753,272 $44,139,228 0.975 % CCPR Services, Inc. 444,592 1,860,512 989,125 0.022 SNET America, Inc. 609,142 4,545,487 24,918,965 0.550 SNET Diversified Group, Inc. 78 374 23 0.000 Southwestern Bell Communications Svcs., Inc. 19,515 302,515 549,049 0.012 USVI Cellular Telephone Corporation, Inc. 49,400 206,724 109,903 0.002SCS Communications & Security, Inc. d/b/a North Santiam Communications 128 1,108 223 0.000SEI Data, Inc. 454 2,806 1,104 0.000SelecTec, Inc. 3,678 20,809 27,153 0.001Shawnee Communications, Inc. ShawneeLink Corporation 1,634 7,373 8,335 0.000Single Source, Inc. 12,693 253,857 79,330 0.002Souris River Telecommunications Co. d/b/a SRT LD 99,074 561,224 296,824 0.007Southern Illinois RSA Partnership d/b/a First Cellular of Southern Illinois 4,991 17,719 7,953 0.000Spring Valley Telephone Long Distance, Inc. 200 1,100 1,933 0.000Springcom, Inc. 21 210 57 0.000Sprint 102,531,423 533,332,140 243,736,675 5.383ST Long Distance, Inc. 112,814 582,332 140,902 0.003Star Telecommunications, Inc. AS Telecommunications, Inc. 4,254,360 30,022,179 8,201,807 0.181 CEO CA Telecommunications, Inc. 643,800 6,125,909 2,239,280 0.049 CEO Telecommunications, Inc. 1,771,546 7,557,606 4,690,422 0.104 PT-1 Communications, Inc. 102,465,806 1,203,883,431 319,124,386 7.049 PT-1 Long Distance, Inc. 40,069,007 393,235,228 93,029,165 2.055 Star Telecommunications, Inc. 452,299,369 2,494,768,892 495,511,990 10.944Star Telephone Long Distance 5,727 29,887 46,109 0.001Startcomm Corporation 164,899 787,017 54,245 0.001Startec Global Communications Corporation PCI Communications, Inc. d/b/a Startec Global Comm. 707,030 6,615,694 1,389,886 0.031 Startec Global Operating Company 7,284,118 53,146,309 19,105,404 0.422Stouffer Communications, Inc. 31 274 82 0.000Sunrise World Communications 224,199 754,219 263,811 0.006Superior Long Distance 47 187 69 0.000T & S Communications LLC 190,235 1,110,127 115,006 0.003Talk.com Holding Corp. 10,631,048 212,620,960 66,444,050 1.468Taylor Communications Group, Inc. 29,711 103,514 85,032 0.002TDS Metrocom, Inc. 23,315 116,096 43,428 0.001Telapex Long Distance, Inc. 19,674 172,414 84,100 0.002Telefonica Larga Distancia, Inc. (TLD) 1,317,375 4,391,249 2,546,924 0.056Teleglobe Companies Excel Telecommunications, Inc. 17,518,192 141,704,685 103,522,051 2.286 Long Distance Wholesale Club 5,127,739 53,008,401 26,242,548 0.580 Teleglobe Business Solutions, Inc. 7,509,076 73,866,394 34,741,772 0.767TelePacific Communications U.S. TelePacific Corp. 4,336 19,256 3,665 0.000Telephone Company of Central Florida, Inc. (TCCF) 23,349 466,985 93,397 0.002Telergy Network Services, Inc. 2,156 241,495 66,623 0.001Teleview Communications, Inc. d/b/a Citizens LD 272 1,467 2,573 0.000Teligent Associated Communications, Inc. 26,193,156 49,866,667 7,556,219 0.167 Teligent, Inc. 473,874 137,132 196,260 0.004Telmex USA, L.L.C. Telmex/Sprint Communications, L.L.C. 117,047 1,005,180 522,981 0.012Telstra Incorporated 5,559 35,304 5,737 0.000Texas RSA 15B2 Limited Partnership d/b/a Five Star Wireless 2,894 13,248 16,087 0.000
178
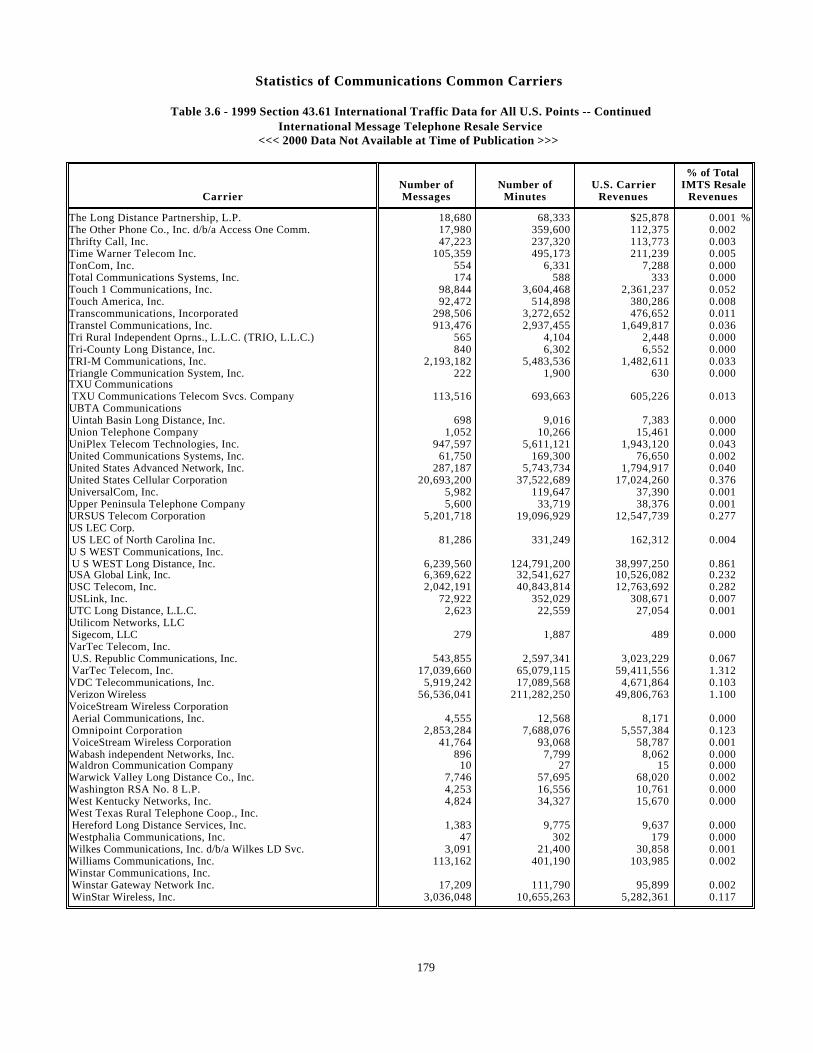
Statistics of Communications Common Carriers
Table 3.6 - 1999 Section 43.61 International Traffic Data for All U.S. Points -- ContinuedInternational Message Telephone Resale Service
<<< 2000 Data Not Available at Time of Publication >>>
% of Total Number of Number of U.S. Carrier IMTS Resale
Carrier Messages Minutes Revenues Revenues
The Long Distance Partnership, L.P. 18,680 68,333 $25,878 0.001 %The Other Phone Co., Inc. d/b/a Access One Comm. 17,980 359,600 112,375 0.002Thrifty Call, Inc. 47,223 237,320 113,773 0.003Time Warner Telecom Inc. 105,359 495,173 211,239 0.005TonCom, Inc. 554 6,331 7,288 0.000Total Communications Systems, Inc. 174 588 333 0.000Touch 1 Communications, Inc. 98,844 3,604,468 2,361,237 0.052Touch America, Inc. 92,472 514,898 380,286 0.008Transcommunications, Incorporated 298,506 3,272,652 476,652 0.011Transtel Communications, Inc. 913,476 2,937,455 1,649,817 0.036Tri Rural Independent Oprns., L.L.C. (TRIO, L.L.C.) 565 4,104 2,448 0.000Tri-County Long Distance, Inc. 840 6,302 6,552 0.000TRI-M Communications, Inc. 2,193,182 5,483,536 1,482,611 0.033Triangle Communication System, Inc. 222 1,900 630 0.000TXU Communications TXU Communications Telecom Svcs. Company 113,516 693,663 605,226 0.013UBTA Communications Uintah Basin Long Distance, Inc. 698 9,016 7,383 0.000Union Telephone Company 1,052 10,266 15,461 0.000UniPlex Telecom Technologies, Inc. 947,597 5,611,121 1,943,120 0.043United Communications Systems, Inc. 61,750 169,300 76,650 0.002United States Advanced Network, Inc. 287,187 5,743,734 1,794,917 0.040United States Cellular Corporation 20,693,200 37,522,689 17,024,260 0.376UniversalCom, Inc. 5,982 119,647 37,390 0.001Upper Peninsula Telephone Company 5,600 33,719 38,376 0.001URSUS Telecom Corporation 5,201,718 19,096,929 12,547,739 0.277US LEC Corp. US LEC of North Carolina Inc. 81,286 331,249 162,312 0.004U S WEST Communications, Inc. U S WEST Long Distance, Inc. 6,239,560 124,791,200 38,997,250 0.861USA Global Link, Inc. 6,369,622 32,541,627 10,526,082 0.232USC Telecom, Inc. 2,042,191 40,843,814 12,763,692 0.282USLink, Inc. 72,922 352,029 308,671 0.007UTC Long Distance, L.L.C. 2,623 22,559 27,054 0.001Utilicom Networks, LLC Sigecom, LLC 279 1,887 489 0.000VarTec Telecom, Inc. U.S. Republic Communications, Inc. 543,855 2,597,341 3,023,229 0.067 VarTec Telecom, Inc. 17,039,660 65,079,115 59,411,556 1.312VDC Telecommunications, Inc. 5,919,242 17,089,568 4,671,864 0.103Verizon Wireless 56,536,041 211,282,250 49,806,763 1.100VoiceStream Wireless Corporation Aerial Communications, Inc. 4,555 12,568 8,171 0.000 Omnipoint Corporation 2,853,284 7,688,076 5,557,384 0.123 VoiceStream Wireless Corporation 41,764 93,068 58,787 0.001Wabash independent Networks, Inc. 896 7,799 8,062 0.000Waldron Communication Company 10 27 15 0.000Warwick Valley Long Distance Co., Inc. 7,746 57,695 68,020 0.002Washington RSA No. 8 L.P. 4,253 16,556 10,761 0.000West Kentucky Networks, Inc. 4,824 34,327 15,670 0.000West Texas Rural Telephone Coop., Inc. Hereford Long Distance Services, Inc. 1,383 9,775 9,637 0.000Westphalia Communications, Inc. 47 302 179 0.000Wilkes Communications, Inc. d/b/a Wilkes LD Svc. 3,091 21,400 30,858 0.001Williams Communications, Inc. 113,162 401,190 103,985 0.002Winstar Communications, Inc. Winstar Gateway Network Inc. 17,209 111,790 95,899 0.002 WinStar Wireless, Inc. 3,036,048 10,655,263 5,282,361 0.117
179
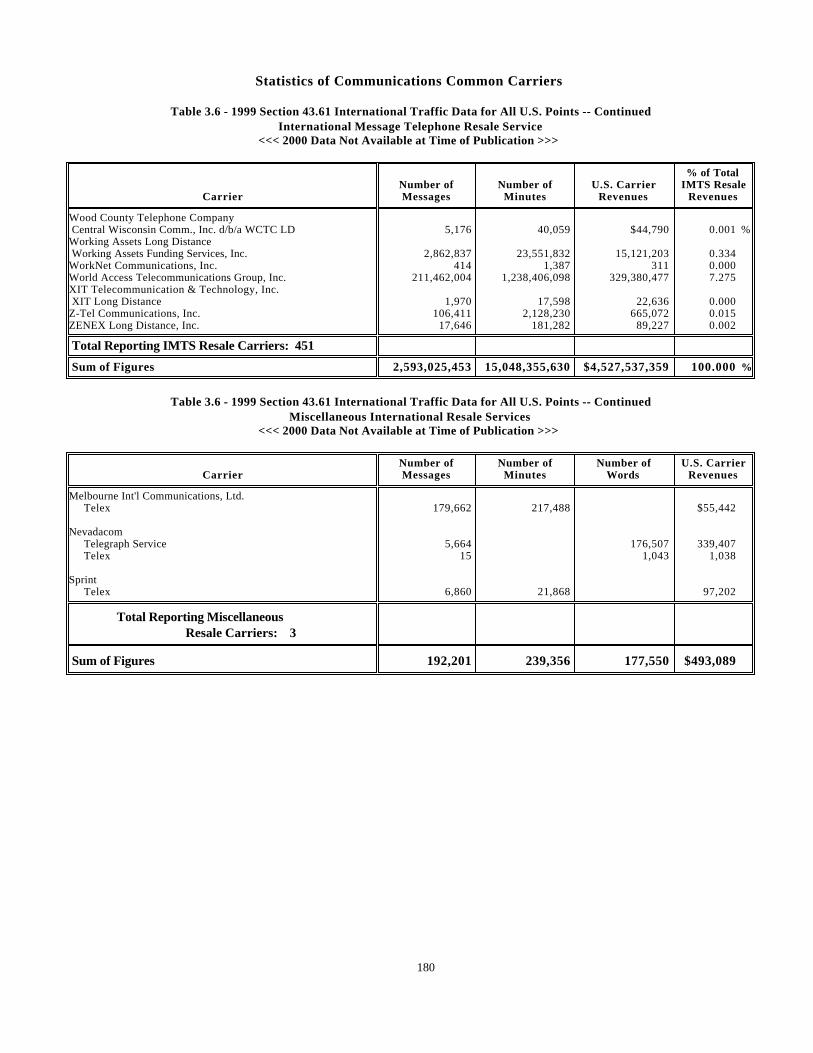
Statistics of Communications Common Carriers
Table 3.6 - 1999 Section 43.61 International Traffic Data for All U.S. Points -- ContinuedInternational Message Telephone Resale Service
<<< 2000 Data Not Available at Time of Publication >>>
% of Total Number of Number of U.S. Carrier IMTS Resale
Carrier Messages Minutes Revenues Revenues
Wood County Telephone Company Central Wisconsin Comm., Inc. d/b/a WCTC LD 5,176 40,059 $44,790 0.001 %Working Assets Long Distance Working Assets Funding Services, Inc. 2,862,837 23,551,832 15,121,203 0.334WorkNet Communications, Inc. 414 1,387 311 0.000World Access Telecommunications Group, Inc. 211,462,004 1,238,406,098 329,380,477 7.275XIT Telecommunication & Technology, Inc. XIT Long Distance 1,970 17,598 22,636 0.000Z-Tel Communications, Inc. 106,411 2,128,230 665,072 0.015ZENEX Long Distance, Inc. 17,646 181,282 89,227 0.002
Total Reporting IMTS Resale Carriers: 451
Sum of Figures 2,593,025,453 15,048,355,630 $4,527,537,359 100.000 %
Table 3.6 - 1999 Section 43.61 International Traffic Data for All U.S. Points -- ContinuedMiscellaneous International Resale Services
<<< 2000 Data Not Available at Time of Publication >>>
Number of Number of Number of U.S. CarrierCarrier Messages Minutes Words Revenues
Melbourne Int'l Communications, Ltd. Telex 179,662 217,488 $55,442
Nevadacom Telegraph Service 5,664 176,507 339,407 Telex 15 1,043 1,038
Sprint Telex 6,860 21,868 97,202
Total Reporting Miscellaneous Resale Carriers: 3
Sum of Figures 192,201 239,356 177,550 $493,089
180
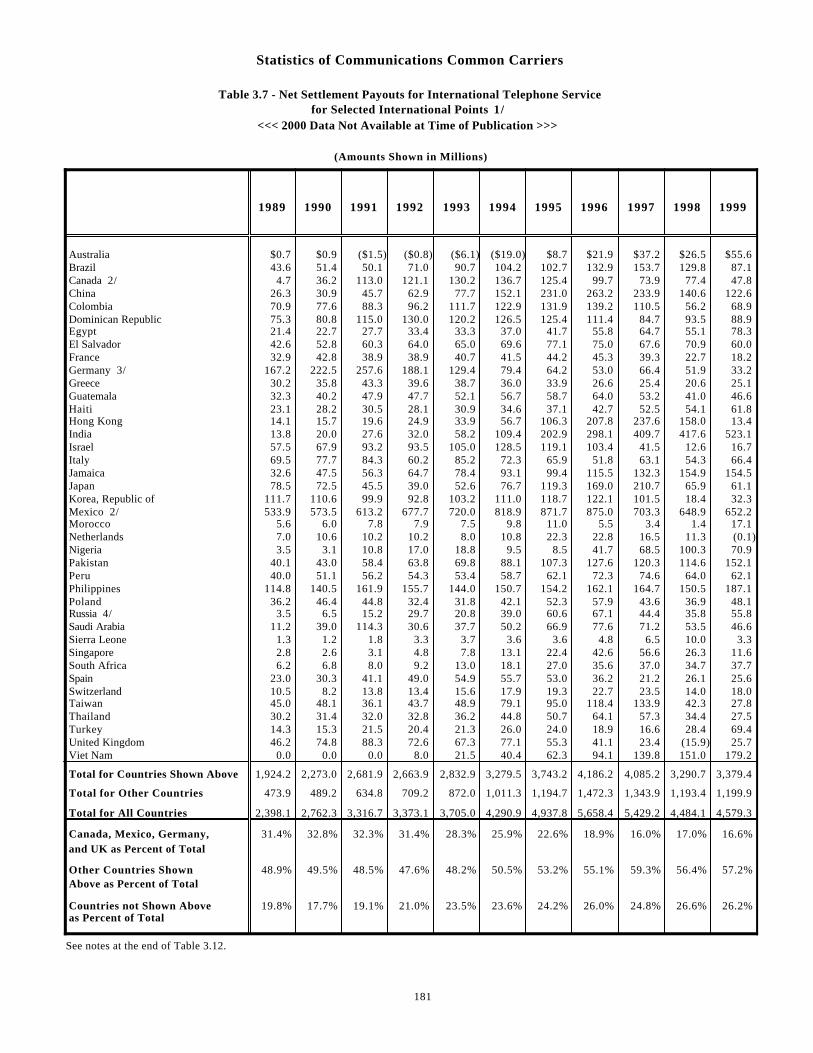
Statistics of Communications Common Carriers
Table 3.7 - Net Settlement Payouts for International Telephone Service for Selected International Points 1/
<<< 2000 Data Not Available at Time of Publication >>>
(Amounts Shown in Millions)
1989 1990 1991 1992 1993 1994 1995 1996 1997 1998 1999
Australia $0.7 $0.9 ($1.5) ($0.8) ($6.1) ($19.0) $8.7 $21.9 $37.2 $26.5 $55.6 Brazil 43.6 51.4 50.1 71.0 90.7 104.2 102.7 132.9 153.7 129.8 87.1 Canada 2/ 4.7 36.2 113.0 121.1 130.2 136.7 125.4 99.7 73.9 77.4 47.8 China 26.3 30.9 45.7 62.9 77.7 152.1 231.0 263.2 233.9 140.6 122.6 Colombia 70.9 77.6 88.3 96.2 111.7 122.9 131.9 139.2 110.5 56.2 68.9 Dominican Republic 75.3 80.8 115.0 130.0 120.2 126.5 125.4 111.4 84.7 93.5 88.9 Egypt 21.4 22.7 27.7 33.4 33.3 37.0 41.7 55.8 64.7 55.1 78.3 El Salvador 42.6 52.8 60.3 64.0 65.0 69.6 77.1 75.0 67.6 70.9 60.0 France 32.9 42.8 38.9 38.9 40.7 41.5 44.2 45.3 39.3 22.7 18.2 Germany 3/ 167.2 222.5 257.6 188.1 129.4 79.4 64.2 53.0 66.4 51.9 33.2 Greece 30.2 35.8 43.3 39.6 38.7 36.0 33.9 26.6 25.4 20.6 25.1 Guatemala 32.3 40.2 47.9 47.7 52.1 56.7 58.7 64.0 53.2 41.0 46.6 Haiti 23.1 28.2 30.5 28.1 30.9 34.6 37.1 42.7 52.5 54.1 61.8 Hong Kong 14.1 15.7 19.6 24.9 33.9 56.7 106.3 207.8 237.6 158.0 13.4 India 13.8 20.0 27.6 32.0 58.2 109.4 202.9 298.1 409.7 417.6 523.1 Israel 57.5 67.9 93.2 93.5 105.0 128.5 119.1 103.4 41.5 12.6 16.7 Italy 69.5 77.7 84.3 60.2 85.2 72.3 65.9 51.8 63.1 54.3 66.4 Jamaica 32.6 47.5 56.3 64.7 78.4 93.1 99.4 115.5 132.3 154.9 154.5 Japan 78.5 72.5 45.5 39.0 52.6 76.7 119.3 169.0 210.7 65.9 61.1 Korea, Republic of 111.7 110.6 99.9 92.8 103.2 111.0 118.7 122.1 101.5 18.4 32.3 Mexico 2/ 533.9 573.5 613.2 677.7 720.0 818.9 871.7 875.0 703.3 648.9 652.2 Morocco 5.6 6.0 7.8 7.9 7.5 9.8 11.0 5.5 3.4 1.4 17.1 Netherlands 7.0 10.6 10.2 10.2 8.0 10.8 22.3 22.8 16.5 11.3 (0.1) Nigeria 3.5 3.1 10.8 17.0 18.8 9.5 8.5 41.7 68.5 100.3 70.9 Pakistan 40.1 43.0 58.4 63.8 69.8 88.1 107.3 127.6 120.3 114.6 152.1 Peru 40.0 51.1 56.2 54.3 53.4 58.7 62.1 72.3 74.6 64.0 62.1 Philippines 114.8 140.5 161.9 155.7 144.0 150.7 154.2 162.1 164.7 150.5 187.1 Poland 36.2 46.4 44.8 32.4 31.8 42.1 52.3 57.9 43.6 36.9 48.1 Russia 4/ 3.5 6.5 15.2 29.7 20.8 39.0 60.6 67.1 44.4 35.8 55.8 Saudi Arabia 11.2 39.0 114.3 30.6 37.7 50.2 66.9 77.6 71.2 53.5 46.6 Sierra Leone 1.3 1.2 1.8 3.3 3.7 3.6 3.6 4.8 6.5 10.0 3.3 Singapore 2.8 2.6 3.1 4.8 7.8 13.1 22.4 42.6 56.6 26.3 11.6 South Africa 6.2 6.8 8.0 9.2 13.0 18.1 27.0 35.6 37.0 34.7 37.7 Spain 23.0 30.3 41.1 49.0 54.9 55.7 53.0 36.2 21.2 26.1 25.6 Switzerland 10.5 8.2 13.8 13.4 15.6 17.9 19.3 22.7 23.5 14.0 18.0 Taiwan 45.0 48.1 36.1 43.7 48.9 79.1 95.0 118.4 133.9 42.3 27.8 Thailand 30.2 31.4 32.0 32.8 36.2 44.8 50.7 64.1 57.3 34.4 27.5 Turkey 14.3 15.3 21.5 20.4 21.3 26.0 24.0 18.9 16.6 28.4 69.4 United Kingdom 46.2 74.8 88.3 72.6 67.3 77.1 55.3 41.1 23.4 (15.9) 25.7 Viet Nam 0.0 0.0 0.0 8.0 21.5 40.4 62.3 94.1 139.8 151.0 179.2
Total for Countries Shown Above 1,924.2 2,273.0 2,681.9 2,663.9 2,832.9 3,279.5 3,743.2 4,186.2 4,085.2 3,290.7 3,379.4
Total for Other Countries 473.9 489.2 634.8 709.2 872.0 1,011.3 1,194.7 1,472.3 1,343.9 1,193.4 1,199.9
Total for All Countries 2,398.1 2,762.3 3,316.7 3,373.1 3,705.0 4,290.9 4,937.8 5,658.4 5,429.2 4,484.1 4,579.3
Canada, Mexico, Germany, 31.4% 32.8% 32.3% 31.4% 28.3% 25.9% 22.6% 18.9% 16.0% 17.0% 16.6% and UK as Percent of Total
Other Countries Shown 48.9% 49.5% 48.5% 47.6% 48.2% 50.5% 53.2% 55.1% 59.3% 56.4% 57.2% Above as Percent of Total
Countries not Shown Above 19.8% 17.7% 19.1% 21.0% 23.5% 23.6% 24.2% 26.0% 24.8% 26.6% 26.2% as Percent of Total
See notes at the end of Table 3.12.
181
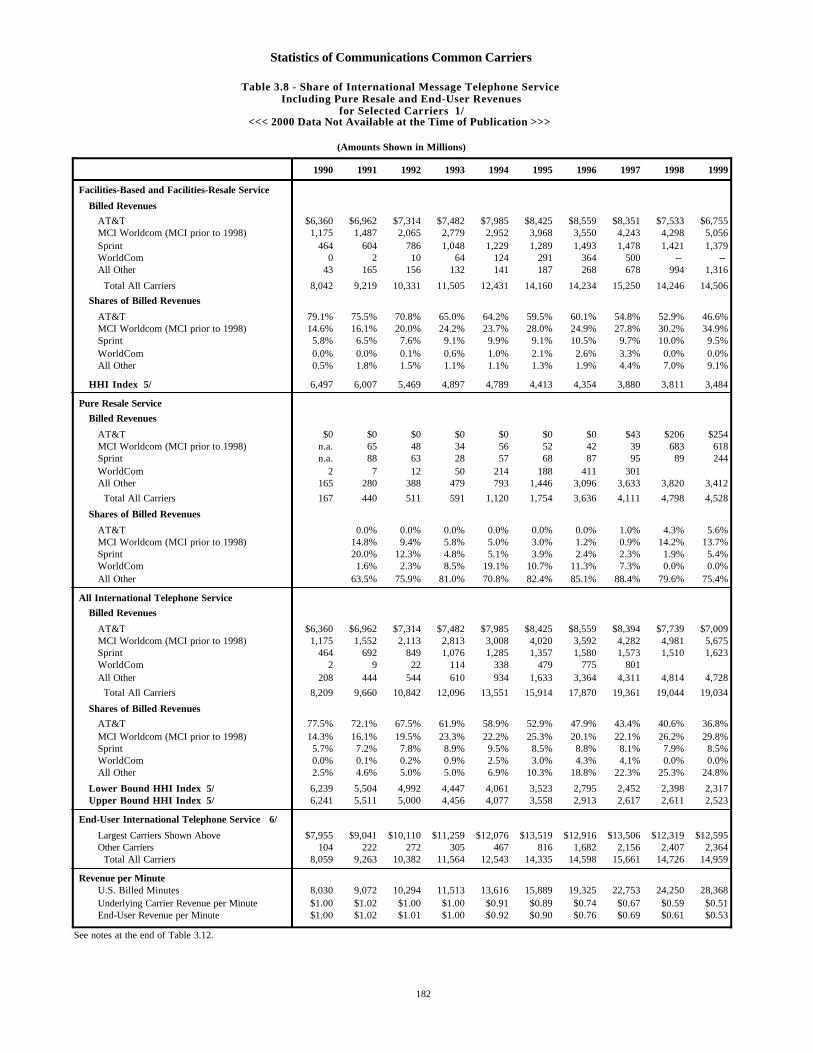
Statistics of Communications Common Carriers
Table 3.8 - Share of International Message Telephone Service Including Pure Resale and End-User Revenues
for Selected Carriers 1/<<< 2000 Data Not Available at the Time of Publication >>>
(Amounts Shown in Millions)
1990 1991 1992 1993 1994 1995 1996 1997 1998 1999
Facilities-Based and Facilities-Resale Service
Billed Revenues
AT&T $6,360 $6,962 $7,314 $7,482 $7,985 $8,425 $8,559 $8,351 $7,533 $6,755MCI Worldcom (MCI prior to 1998) 1,175 1,487 2,065 2,779 2,952 3,968 3,550 4,243 4,298 5,056Sprint 464 604 786 1,048 1,229 1,289 1,493 1,478 1,421 1,379WorldCom 0 2 10 64 124 291 364 500 -- -- All Other 43 165 156 132 141 187 268 678 994 1,316
Total All Carriers 8,042 9,219 10,331 11,505 12,431 14,160 14,234 15,250 14,246 14,506
Shares of Billed Revenues
AT&T 79.1% 75.5% 70.8% 65.0% 64.2% 59.5% 60.1% 54.8% 52.9% 46.6%MCI Worldcom (MCI prior to 1998) 14.6% 16.1% 20.0% 24.2% 23.7% 28.0% 24.9% 27.8% 30.2% 34.9%Sprint 5.8% 6.5% 7.6% 9.1% 9.9% 9.1% 10.5% 9.7% 10.0% 9.5%WorldCom 0.0% 0.0% 0.1% 0.6% 1.0% 2.1% 2.6% 3.3% 0.0% 0.0%All Other 0.5% 1.8% 1.5% 1.1% 1.1% 1.3% 1.9% 4.4% 7.0% 9.1%
HHI Index 5/ 6,497 6,007 5,469 4,897 4,789 4,413 4,354 3,880 3,811 3,484
Pure Resale Service
Billed Revenues
AT&T $0 $0 $0 $0 $0 $0 $0 $43 $206 $254MCI Worldcom (MCI prior to 1998) n.a. 65 48 34 56 52 42 39 683 618Sprint n.a. 88 63 28 57 68 87 95 89 244WorldCom 2 7 12 50 214 188 411 301All Other 165 280 388 479 793 1,446 3,096 3,633 3,820 3,412
Total All Carriers 167 440 511 591 1,120 1,754 3,636 4,111 4,798 4,528
Shares of Billed Revenues
AT&T 0.0% 0.0% 0.0% 0.0% 0.0% 0.0% 1.0% 4.3% 5.6%MCI Worldcom (MCI prior to 1998) 14.8% 9.4% 5.8% 5.0% 3.0% 1.2% 0.9% 14.2% 13.7%Sprint 20.0% 12.3% 4.8% 5.1% 3.9% 2.4% 2.3% 1.9% 5.4%WorldCom 1.6% 2.3% 8.5% 19.1% 10.7% 11.3% 7.3% 0.0% 0.0%All Other 63.5% 75.9% 81.0% 70.8% 82.4% 85.1% 88.4% 79.6% 75.4%
All International Telephone Service
Billed Revenues
AT&T $6,360 $6,962 $7,314 $7,482 $7,985 $8,425 $8,559 $8,394 $7,739 $7,009MCI Worldcom (MCI prior to 1998) 1,175 1,552 2,113 2,813 3,008 4,020 3,592 4,282 4,981 5,675Sprint 464 692 849 1,076 1,285 1,357 1,580 1,573 1,510 1,623WorldCom 2 9 22 114 338 479 775 801 All Other 208 444 544 610 934 1,633 3,364 4,311 4,814 4,728
Total All Carriers 8,209 9,660 10,842 12,096 13,551 15,914 17,870 19,361 19,044 19,034
Shares of Billed Revenues
AT&T 77.5% 72.1% 67.5% 61.9% 58.9% 52.9% 47.9% 43.4% 40.6% 36.8%MCI Worldcom (MCI prior to 1998) 14.3% 16.1% 19.5% 23.3% 22.2% 25.3% 20.1% 22.1% 26.2% 29.8%Sprint 5.7% 7.2% 7.8% 8.9% 9.5% 8.5% 8.8% 8.1% 7.9% 8.5%WorldCom 0.0% 0.1% 0.2% 0.9% 2.5% 3.0% 4.3% 4.1% 0.0% 0.0%All Other 2.5% 4.6% 5.0% 5.0% 6.9% 10.3% 18.8% 22.3% 25.3% 24.8%
Lower Bound HHI Index 5/ 6,239 5,504 4,992 4,447 4,061 3,523 2,795 2,452 2,398 2,317Upper Bound HHI Index 5/ 6,241 5,511 5,000 4,456 4,077 3,558 2,913 2,617 2,611 2,523
End-User International Telephone Service 6/
Largest Carriers Shown Above $7,955 $9,041 $10,110 $11,259 $12,076 $13,519 $12,916 $13,506 $12,319 $12,595Other Carriers 104 222 272 305 467 816 1,682 2,156 2,407 2,364 Total All Carriers 8,059 9,263 10,382 11,564 12,543 14,335 14,598 15,661 14,726 14,959
Revenue per Minute U.S. Billed Minutes 8,030 9,072 10,294 11,513 13,616 15,889 19,325 22,753 24,250 28,368Underlying Carrier Revenue per Minute $1.00 $1.02 $1.00 $1.00 $0.91 $0.89 $0.74 $0.67 $0.59 $0.51End-User Revenue per Minute $1.00 $1.02 $1.01 $1.00 $0.92 $0.90 $0.76 $0.69 $0.61 $0.53
See notes at the end of Table 3.12.
182
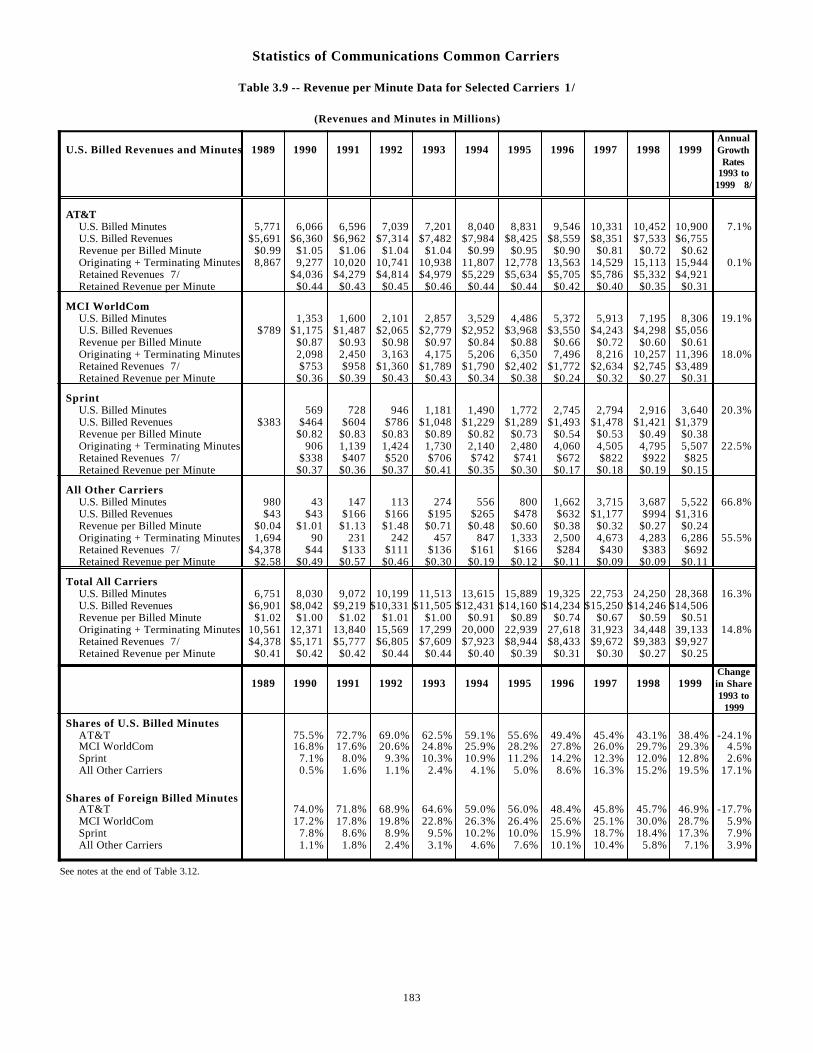
Statistics of Communications Common Carriers
Table 3.9 -- Revenue per Minute Data for Selected Carriers 1/
(Revenues and Minutes in Millions)
Annual U.S. Billed Revenues and Minutes 1989 1990 1991 1992 1993 1994 1995 1996 1997 1998 1999 Growth
Rates1993 to
1999 8/
AT&TU.S. Billed Minutes 5,771 6,066 6,596 7,039 7,201 8,040 8,831 9,546 10,331 10,452 10,900 7.1%U.S. Billed Revenues $5,691 $6,360 $6,962 $7,314 $7,482 $7,984 $8,425 $8,559 $8,351 $7,533 $6,755Revenue per Billed Minute $0.99 $1.05 $1.06 $1.04 $1.04 $0.99 $0.95 $0.90 $0.81 $0.72 $0.62Originating + Terminating Minutes 8,867 9,277 10,020 10,741 10,938 11,807 12,778 13,563 14,529 15,113 15,944 0.1%Retained Revenues 7/ $4,036 $4,279 $4,814 $4,979 $5,229 $5,634 $5,705 $5,786 $5,332 $4,921Retained Revenue per Minute $0.44 $0.43 $0.45 $0.46 $0.44 $0.44 $0.42 $0.40 $0.35 $0.31
MCI WorldCom U.S. Billed Minutes 1,353 1,600 2,101 2,857 3,529 4,486 5,372 5,913 7,195 8,306 19.1% U.S. Billed Revenues $789 $1,175 $1,487 $2,065 $2,779 $2,952 $3,968 $3,550 $4,243 $4,298 $5,056 Revenue per Billed Minute $0.87 $0.93 $0.98 $0.97 $0.84 $0.88 $0.66 $0.72 $0.60 $0.61 Originating + Terminating Minutes 2,098 2,450 3,163 4,175 5,206 6,350 7,496 8,216 10,257 11,396 18.0% Retained Revenues 7/ $753 $958 $1,360 $1,789 $1,790 $2,402 $1,772 $2,634 $2,745 $3,489 Retained Revenue per Minute $0.36 $0.39 $0.43 $0.43 $0.34 $0.38 $0.24 $0.32 $0.27 $0.31
Sprint U.S. Billed Minutes 569 728 946 1,181 1,490 1,772 2,745 2,794 2,916 3,640 20.3% U.S. Billed Revenues $383 $464 $604 $786 $1,048 $1,229 $1,289 $1,493 $1,478 $1,421 $1,379 Revenue per Billed Minute $0.82 $0.83 $0.83 $0.89 $0.82 $0.73 $0.54 $0.53 $0.49 $0.38 Originating + Terminating Minutes 906 1,139 1,424 1,730 2,140 2,480 4,060 4,505 4,795 5,507 22.5% Retained Revenues 7/ $338 $407 $520 $706 $742 $741 $672 $822 $922 $825 Retained Revenue per Minute $0.37 $0.36 $0.37 $0.41 $0.35 $0.30 $0.17 $0.18 $0.19 $0.15
All Other Carriers U.S. Billed Minutes 980 43 147 113 274 556 800 1,662 3,715 3,687 5,522 66.8% U.S. Billed Revenues $43 $43 $166 $166 $195 $265 $478 $632 $1,177 $994 $1,316 Revenue per Billed Minute $0.04 $1.01 $1.13 $1.48 $0.71 $0.48 $0.60 $0.38 $0.32 $0.27 $0.24 Originating + Terminating Minutes 1,694 90 231 242 457 847 1,333 2,500 4,673 4,283 6,286 55.5% Retained Revenues 7/ $4,378 $44 $133 $111 $136 $161 $166 $284 $430 $383 $692 Retained Revenue per Minute $2.58 $0.49 $0.57 $0.46 $0.30 $0.19 $0.12 $0.11 $0.09 $0.09 $0.11
Total All Carriers U.S. Billed Minutes 6,751 8,030 9,072 10,199 11,513 13,615 15,889 19,325 22,753 24,250 28,368 16.3% U.S. Billed Revenues $6,901 $8,042 $9,219 $10,331 $11,505 $12,431 $14,160 $14,234 $15,250 $14,246 $14,506 Revenue per Billed Minute $1.02 $1.00 $1.02 $1.01 $1.00 $0.91 $0.89 $0.74 $0.67 $0.59 $0.51 Originating + Terminating Minutes 10,561 12,371 13,840 15,569 17,299 20,000 22,939 27,618 31,923 34,448 39,133 14.8% Retained Revenues 7/ $4,378 $5,171 $5,777 $6,805 $7,609 $7,923 $8,944 $8,433 $9,672 $9,383 $9,927 Retained Revenue per Minute $0.41 $0.42 $0.42 $0.44 $0.44 $0.40 $0.39 $0.31 $0.30 $0.27 $0.25
Change1989 1990 1991 1992 1993 1994 1995 1996 1997 1998 1999 in Share
1993 to1999
Shares of U.S. Billed MinutesAT&T 75.5% 72.7% 69.0% 62.5% 59.1% 55.6% 49.4% 45.4% 43.1% 38.4% -24.1%MCI WorldCom 16.8% 17.6% 20.6% 24.8% 25.9% 28.2% 27.8% 26.0% 29.7% 29.3% 4.5%Sprint 7.1% 8.0% 9.3% 10.3% 10.9% 11.2% 14.2% 12.3% 12.0% 12.8% 2.6%All Other Carriers 0.5% 1.6% 1.1% 2.4% 4.1% 5.0% 8.6% 16.3% 15.2% 19.5% 17.1%
Shares of Foreign Billed MinutesAT&T 74.0% 71.8% 68.9% 64.6% 59.0% 56.0% 48.4% 45.8% 45.7% 46.9% -17.7%MCI WorldCom 17.2% 17.8% 19.8% 22.8% 26.3% 26.4% 25.6% 25.1% 30.0% 28.7% 5.9%Sprint 7.8% 8.6% 8.9% 9.5% 10.2% 10.0% 15.9% 18.7% 18.4% 17.3% 7.9%All Other Carriers 1.1% 1.8% 2.4% 3.1% 4.6% 7.6% 10.1% 10.4% 5.8% 7.1% 3.9%
See notes at the end of Table 3.12.
183
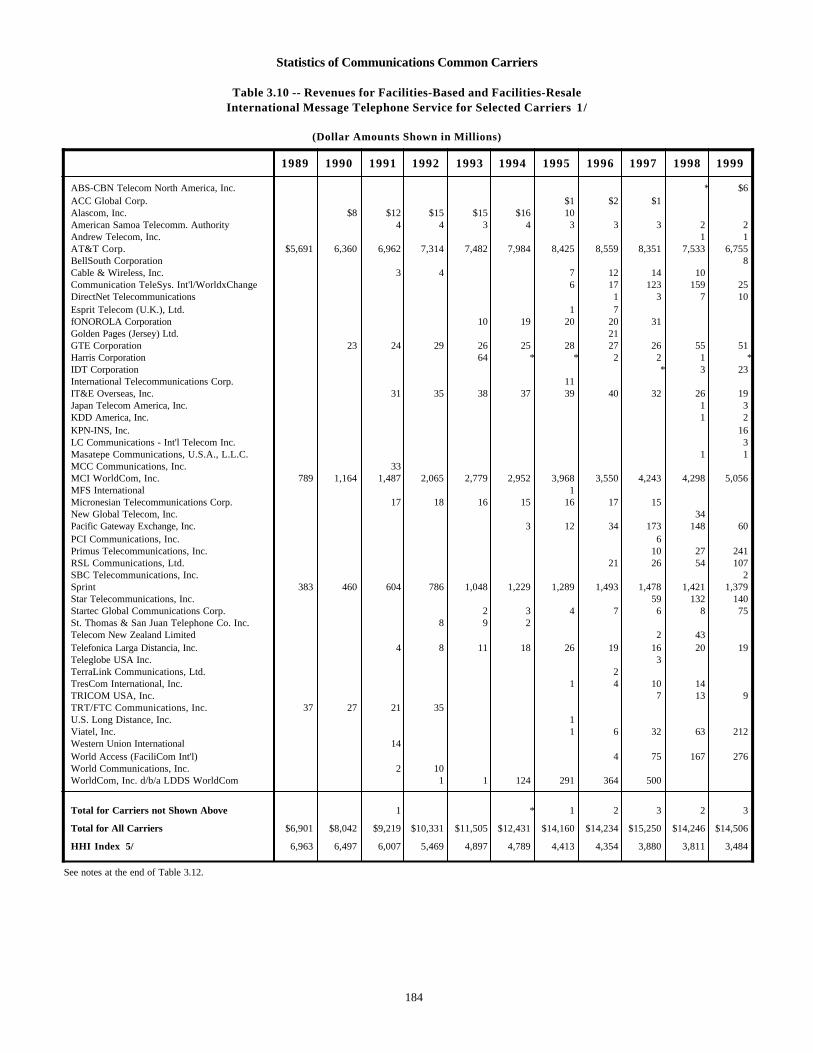
Statistics of Communications Common Carriers
Table 3.10 -- Revenues for Facilities-Based and Facilities-ResaleInternational Message Telephone Service for Selected Carriers 1/
(Dollar Amounts Shown in Millions)
1989 1990 1991 1992 1993 1994 1995 1996 1997 1998 1999
ABS-CBN Telecom North America, Inc. * $6ACC Global Corp. $1 $2 $1Alascom, Inc. $8 $12 $15 $15 $16 10American Samoa Telecomm. Authority 4 4 3 4 3 3 3 2 2Andrew Telecom, Inc. 1 1AT&T Corp. $5,691 6,360 6,962 7,314 7,482 7,984 8,425 8,559 8,351 7,533 6,755BellSouth Corporation 8Cable & Wireless, Inc. 3 4 7 12 14 10Communication TeleSys. Int'l/WorldxChange 6 17 123 159 25DirectNet Telecommunications 1 3 7 10Esprit Telecom (U.K.), Ltd. 1 7fONOROLA Corporation 10 19 20 20 31Golden Pages (Jersey) Ltd. 21GTE Corporation 23 24 29 26 25 28 27 26 55 51Harris Corporation 64 * * 2 2 1 *IDT Corporation * 3 23International Telecommunications Corp. 11IT&E Overseas, Inc. 31 35 38 37 39 40 32 26 19Japan Telecom America, Inc. 1 3KDD America, Inc. 1 2KPN-INS, Inc. 16LC Communications - Int'l Telecom Inc. 3Masatepe Communications, U.S.A., L.L.C. 1 1MCC Communications, Inc. 33MCI WorldCom, Inc. 789 1,164 1,487 2,065 2,779 2,952 3,968 3,550 4,243 4,298 5,056MFS International 1Micronesian Telecommunications Corp. 17 18 16 15 16 17 15New Global Telecom, Inc. 34Pacific Gateway Exchange, Inc. 3 12 34 173 148 60PCI Communications, Inc. 6Primus Telecommunications, Inc. 10 27 241RSL Communications, Ltd. 21 26 54 107SBC Telecommunications, Inc. 2Sprint 383 460 604 786 1,048 1,229 1,289 1,493 1,478 1,421 1,379Star Telecommunications, Inc. 59 132 140Startec Global Communications Corp. 2 3 4 7 6 8 75St. Thomas & San Juan Telephone Co. Inc. 8 9 2Telecom New Zealand Limited 2 43Telefonica Larga Distancia, Inc. 4 8 11 18 26 19 16 20 19Teleglobe USA Inc. 3TerraLink Communications, Ltd. 2TresCom International, Inc. 1 4 10 14TRICOM USA, Inc. 7 13 9TRT/FTC Communications, Inc. 37 27 21 35U.S. Long Distance, Inc. 1Viatel, Inc. 1 6 32 63 212Western Union International 14World Access (FaciliCom Int'l) 4 75 167 276World Communications, Inc. 2 10WorldCom, Inc. d/b/a LDDS WorldCom 1 1 124 291 364 500
Total for Carriers not Shown Above 1 * 1 2 3 2 3
Total for All Carriers $6,901 $8,042 $9,219 $10,331 $11,505 $12,431 $14,160 $14,234 $15,250 $14,246 $14,506
HHI Index 5/ 6,963 6,497 6,007 5,469 4,897 4,789 4,413 4,354 3,880 3,811 3,484
See notes at the end of Table 3.12.
184
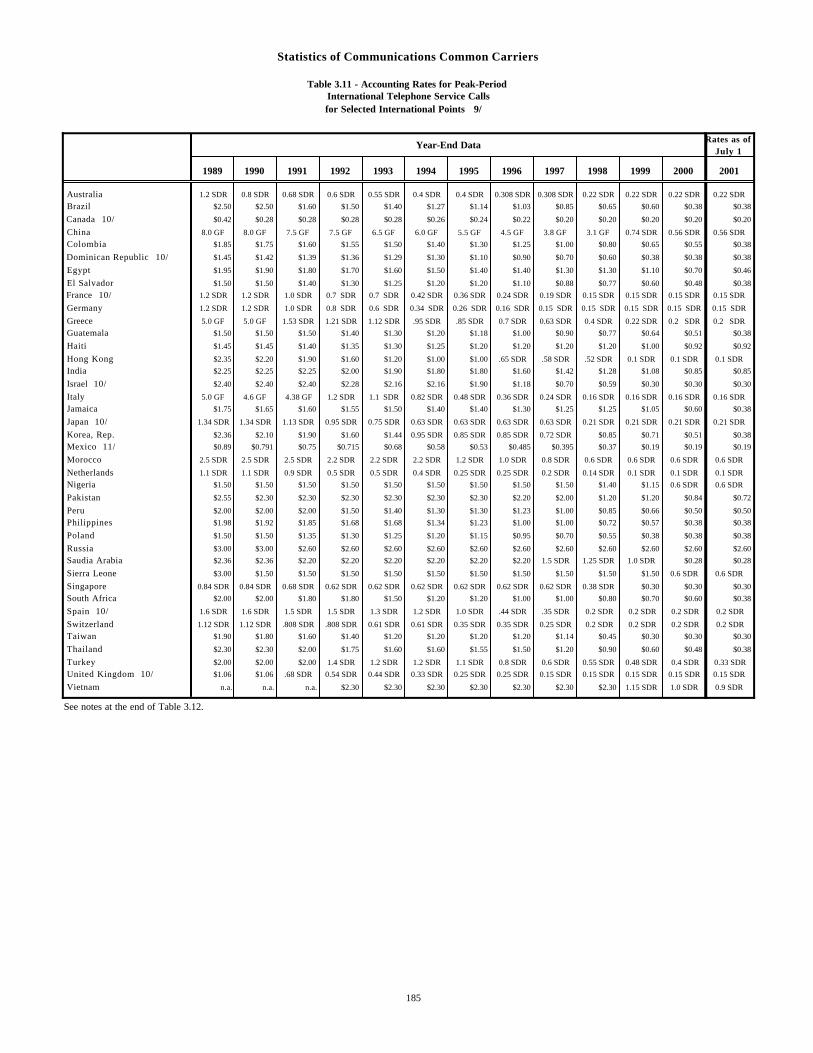
Statistics of Communications Common Carriers
Table 3.11 - Accounting Rates for Peak-Period International Telephone Service Callsfor Selected International Points 9/
Year-End DataRates as of
July 1
1989 1990 1991 1992 1993 1994 1995 1996 1997 1998 1999 2000 2001
Australia 1.2 SDR 0.8 SDR 0.68 SDR 0.6 SDR 0.55 SDR 0.4 SDR 0.4 SDR 0.308 SDR 0.308 SDR 0.22 SDR 0.22 SDR 0.22 SDR 0.22 SDR
Brazil $2.50 $2.50 $1.60 $1.50 $1.40 $1.27 $1.14 $1.03 $0.85 $0.65 $0.60 $0.38 $0.38
Canada 10/ $0.42 $0.28 $0.28 $0.28 $0.28 $0.26 $0.24 $0.22 $0.20 $0.20 $0.20 $0.20 $0.20
China 8.0 GF 8.0 GF 7.5 GF 7.5 GF 6.5 GF 6.0 GF 5.5 GF 4.5 GF 3.8 GF 3.1 GF 0.74 SDR 0.56 SDR 0.56 SDR
Colombia $1.85 $1.75 $1.60 $1.55 $1.50 $1.40 $1.30 $1.25 $1.00 $0.80 $0.65 $0.55 $0.38
Dominican Republic 10/ $1.45 $1.42 $1.39 $1.36 $1.29 $1.30 $1.10 $0.90 $0.70 $0.60 $0.38 $0.38 $0.38
Egypt $1.95 $1.90 $1.80 $1.70 $1.60 $1.50 $1.40 $1.40 $1.30 $1.30 $1.10 $0.70 $0.46
El Salvador $1.50 $1.50 $1.40 $1.30 $1.25 $1.20 $1.20 $1.10 $0.88 $0.77 $0.60 $0.48 $0.38
France 10/ 1.2 SDR 1.2 SDR 1.0 SDR 0.7 SDR 0.7 SDR 0.42 SDR 0.36 SDR 0.24 SDR 0.19 SDR 0.15 SDR 0.15 SDR 0.15 SDR 0.15 SDR
Germany 1.2 SDR 1.2 SDR 1.0 SDR 0.8 SDR 0.6 SDR 0.34 SDR 0.26 SDR 0.16 SDR 0.15 SDR 0.15 SDR 0.15 SDR 0.15 SDR 0.15 SDR
Greece 5.0 GF 5.0 GF 1.53 SDR 1.21 SDR 1.12 SDR .95 SDR .85 SDR 0.7 SDR 0.63 SDR 0.4 SDR 0.22 SDR 0.2 SDR 0.2 SDR
Guatemala $1.50 $1.50 $1.50 $1.40 $1.30 $1.20 $1.18 $1.00 $0.90 $0.77 $0.64 $0.51 $0.38
Haiti $1.45 $1.45 $1.40 $1.35 $1.30 $1.25 $1.20 $1.20 $1.20 $1.20 $1.00 $0.92 $0.92
Hong Kong $2.35 $2.20 $1.90 $1.60 $1.20 $1.00 $1.00 .65 SDR .58 SDR .52 SDR 0.1 SDR 0.1 SDR 0.1 SDR
India $2.25 $2.25 $2.25 $2.00 $1.90 $1.80 $1.80 $1.60 $1.42 $1.28 $1.08 $0.85 $0.85
Israel 10/ $2.40 $2.40 $2.40 $2.28 $2.16 $2.16 $1.90 $1.18 $0.70 $0.59 $0.30 $0.30 $0.30
Italy 5.0 GF 4.6 GF 4.38 GF 1.2 SDR 1.1 SDR 0.82 SDR 0.48 SDR 0.36 SDR 0.24 SDR 0.16 SDR 0.16 SDR 0.16 SDR 0.16 SDR
Jamaica $1.75 $1.65 $1.60 $1.55 $1.50 $1.40 $1.40 $1.30 $1.25 $1.25 $1.05 $0.60 $0.38
Japan 10/ 1.34 SDR 1.34 SDR 1.13 SDR 0.95 SDR 0.75 SDR 0.63 SDR 0.63 SDR 0.63 SDR 0.63 SDR 0.21 SDR 0.21 SDR 0.21 SDR 0.21 SDR
Korea, Rep. $2.36 $2.10 $1.90 $1.60 $1.44 0.95 SDR 0.85 SDR 0.85 SDR 0.72 SDR $0.85 $0.71 $0.51 $0.38
Mexico 11/ $0.89 $0.791 $0.75 $0.715 $0.68 $0.58 $0.53 $0.485 $0.395 $0.37 $0.19 $0.19 $0.19
Morocco 2.5 SDR 2.5 SDR 2.5 SDR 2.2 SDR 2.2 SDR 2.2 SDR 1.2 SDR 1.0 SDR 0.8 SDR 0.6 SDR 0.6 SDR 0.6 SDR 0.6 SDR
Netherlands 1.1 SDR 1.1 SDR 0.9 SDR 0.5 SDR 0.5 SDR 0.4 SDR 0.25 SDR 0.25 SDR 0.2 SDR 0.14 SDR 0.1 SDR 0.1 SDR 0.1 SDR
Nigeria $1.50 $1.50 $1.50 $1.50 $1.50 $1.50 $1.50 $1.50 $1.50 $1.40 $1.15 0.6 SDR 0.6 SDR
Pakistan $2.55 $2.30 $2.30 $2.30 $2.30 $2.30 $2.30 $2.20 $2.00 $1.20 $1.20 $0.84 $0.72
Peru $2.00 $2.00 $2.00 $1.50 $1.40 $1.30 $1.30 $1.23 $1.00 $0.85 $0.66 $0.50 $0.50
Philippines $1.98 $1.92 $1.85 $1.68 $1.68 $1.34 $1.23 $1.00 $1.00 $0.72 $0.57 $0.38 $0.38
Poland $1.50 $1.50 $1.35 $1.30 $1.25 $1.20 $1.15 $0.95 $0.70 $0.55 $0.38 $0.38 $0.38
Russia $3.00 $3.00 $2.60 $2.60 $2.60 $2.60 $2.60 $2.60 $2.60 $2.60 $2.60 $2.60 $2.60
Saudia Arabia $2.36 $2.36 $2.20 $2.20 $2.20 $2.20 $2.20 $2.20 1.5 SDR 1.25 SDR 1.0 SDR $0.28 $0.28
Sierra Leone $3.00 $1.50 $1.50 $1.50 $1.50 $1.50 $1.50 $1.50 $1.50 $1.50 $1.50 0.6 SDR 0.6 SDR
Singapore 0.84 SDR 0.84 SDR 0.68 SDR 0.62 SDR 0.62 SDR 0.62 SDR 0.62 SDR 0.62 SDR 0.62 SDR 0.38 SDR $0.30 $0.30 $0.30
South Africa $2.00 $2.00 $1.80 $1.80 $1.50 $1.20 $1.20 $1.00 $1.00 $0.80 $0.70 $0.60 $0.38
Spain 10/ 1.6 SDR 1.6 SDR 1.5 SDR 1.5 SDR 1.3 SDR 1.2 SDR 1.0 SDR .44 SDR .35 SDR 0.2 SDR 0.2 SDR 0.2 SDR 0.2 SDR
Switzerland 1.12 SDR 1.12 SDR .808 SDR .808 SDR 0.61 SDR 0.61 SDR 0.35 SDR 0.35 SDR 0.25 SDR 0.2 SDR 0.2 SDR 0.2 SDR 0.2 SDR
Taiwan $1.90 $1.80 $1.60 $1.40 $1.20 $1.20 $1.20 $1.20 $1.14 $0.45 $0.30 $0.30 $0.30
Thailand $2.30 $2.30 $2.00 $1.75 $1.60 $1.60 $1.55 $1.50 $1.20 $0.90 $0.60 $0.48 $0.38
Turkey $2.00 $2.00 $2.00 1.4 SDR 1.2 SDR 1.2 SDR 1.1 SDR 0.8 SDR 0.6 SDR 0.55 SDR 0.48 SDR 0.4 SDR 0.33 SDR
United Kingdom 10/ $1.06 $1.06 .68 SDR 0.54 SDR 0.44 SDR 0.33 SDR 0.25 SDR 0.25 SDR 0.15 SDR 0.15 SDR 0.15 SDR 0.15 SDR 0.15 SDR
Vietnam n.a. n.a. n.a. $2.30 $2.30 $2.30 $2.30 $2.30 $2.30 $2.30 1.15 SDR 1.0 SDR 0.9 SDR
See notes at the end of Table 3.12.
185
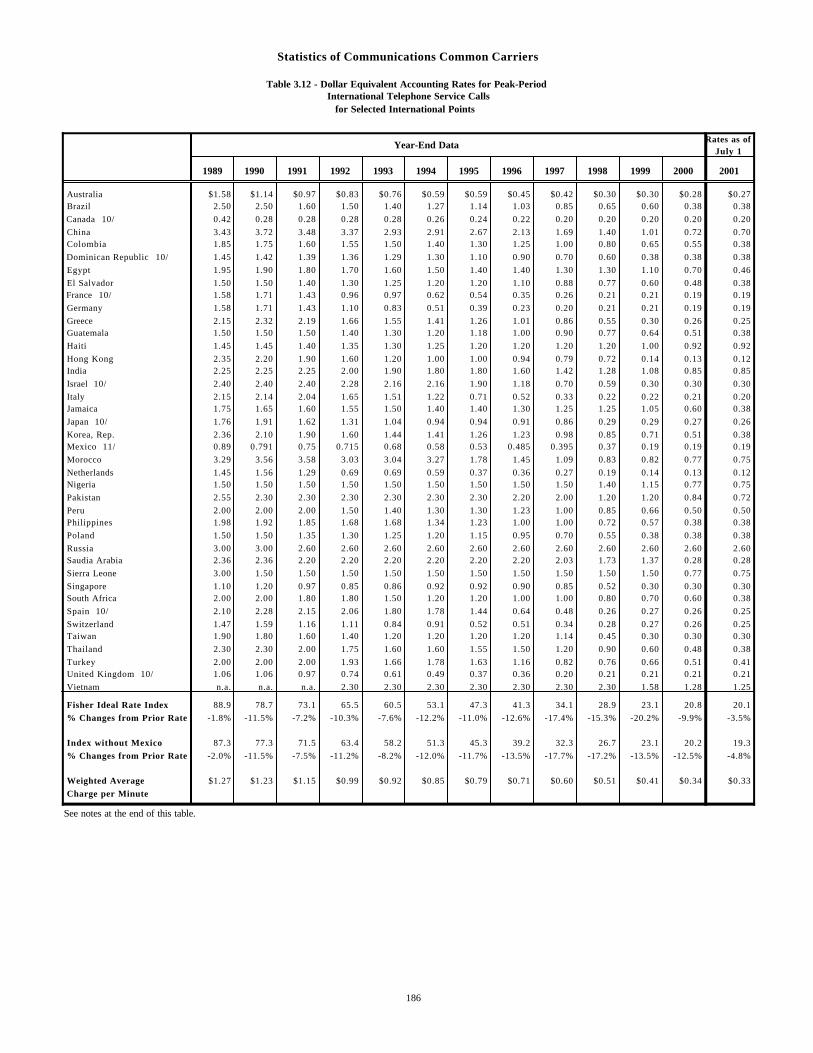
Statistics of Communications Common Carriers
Table 3.12 - Dollar Equivalent Accounting Rates for Peak-Period International Telephone Service Calls
for Selected International Points
Year-End DataRates as of
July 1
1989 1990 1991 1992 1993 1994 1995 1996 1997 1998 1999 2000 2001
Australia $1.58 $1.14 $0.97 $0.83 $0.76 $0.59 $0.59 $0.45 $0.42 $0.30 $0.30 $0.28 $0.27 Brazil 2.50 2.50 1.60 1.50 1.40 1.27 1.14 1.03 0.85 0.65 0.60 0.38 0.38
Canada 10/ 0.42 0.28 0.28 0.28 0.28 0.26 0.24 0.22 0.20 0.20 0.20 0.20 0.20
China 3.43 3.72 3.48 3.37 2.93 2.91 2.67 2.13 1.69 1.40 1.01 0.72 0.70 Colombia 1.85 1.75 1.60 1.55 1.50 1.40 1.30 1.25 1.00 0.80 0.65 0.55 0.38
Dominican Republic 10/ 1.45 1.42 1.39 1.36 1.29 1.30 1.10 0.90 0.70 0.60 0.38 0.38 0.38
Egypt 1.95 1.90 1.80 1.70 1.60 1.50 1.40 1.40 1.30 1.30 1.10 0.70 0.46
El Salvador 1.50 1.50 1.40 1.30 1.25 1.20 1.20 1.10 0.88 0.77 0.60 0.48 0.38 France 10/ 1.58 1.71 1.43 0.96 0.97 0.62 0.54 0.35 0.26 0.21 0.21 0.19 0.19
Germany 1.58 1.71 1.43 1.10 0.83 0.51 0.39 0.23 0.20 0.21 0.21 0.19 0.19
Greece 2.15 2.32 2.19 1.66 1.55 1.41 1.26 1.01 0.86 0.55 0.30 0.26 0.25 Guatemala 1.50 1.50 1.50 1.40 1.30 1.20 1.18 1.00 0.90 0.77 0.64 0.51 0.38
Haiti 1.45 1.45 1.40 1.35 1.30 1.25 1.20 1.20 1.20 1.20 1.00 0.92 0.92
Hong Kong 2.35 2.20 1.90 1.60 1.20 1.00 1.00 0.94 0.79 0.72 0.14 0.13 0.12 India 2.25 2.25 2.25 2.00 1.90 1.80 1.80 1.60 1.42 1.28 1.08 0.85 0.85
Israel 10/ 2.40 2.40 2.40 2.28 2.16 2.16 1.90 1.18 0.70 0.59 0.30 0.30 0.30
Italy 2.15 2.14 2.04 1.65 1.51 1.22 0.71 0.52 0.33 0.22 0.22 0.21 0.20 Jamaica 1.75 1.65 1.60 1.55 1.50 1.40 1.40 1.30 1.25 1.25 1.05 0.60 0.38
Japan 10/ 1.76 1.91 1.62 1.31 1.04 0.94 0.94 0.91 0.86 0.29 0.29 0.27 0.26
Korea, Rep. 2.36 2.10 1.90 1.60 1.44 1.41 1.26 1.23 0.98 0.85 0.71 0.51 0.38 Mexico 11/ 0.89 0.791 0.75 0.715 0.68 0.58 0.53 0.485 0.395 0.37 0.19 0.19 0.19
Morocco 3.29 3.56 3.58 3.03 3.04 3.27 1.78 1.45 1.09 0.83 0.82 0.77 0.75
Netherlands 1.45 1.56 1.29 0.69 0.69 0.59 0.37 0.36 0.27 0.19 0.14 0.13 0.12 Nigeria 1.50 1.50 1.50 1.50 1.50 1.50 1.50 1.50 1.50 1.40 1.15 0.77 0.75
Pakistan 2.55 2.30 2.30 2.30 2.30 2.30 2.30 2.20 2.00 1.20 1.20 0.84 0.72
Peru 2.00 2.00 2.00 1.50 1.40 1.30 1.30 1.23 1.00 0.85 0.66 0.50 0.50 Philippines 1.98 1.92 1.85 1.68 1.68 1.34 1.23 1.00 1.00 0.72 0.57 0.38 0.38
Poland 1.50 1.50 1.35 1.30 1.25 1.20 1.15 0.95 0.70 0.55 0.38 0.38 0.38
Russia 3.00 3.00 2.60 2.60 2.60 2.60 2.60 2.60 2.60 2.60 2.60 2.60 2.60 Saudia Arabia 2.36 2.36 2.20 2.20 2.20 2.20 2.20 2.20 2.03 1.73 1.37 0.28 0.28
Sierra Leone 3.00 1.50 1.50 1.50 1.50 1.50 1.50 1.50 1.50 1.50 1.50 0.77 0.75
Singapore 1.10 1.20 0.97 0.85 0.86 0.92 0.92 0.90 0.85 0.52 0.30 0.30 0.30 South Africa 2.00 2.00 1.80 1.80 1.50 1.20 1.20 1.00 1.00 0.80 0.70 0.60 0.38
Spain 10/ 2.10 2.28 2.15 2.06 1.80 1.78 1.44 0.64 0.48 0.26 0.27 0.26 0.25
Switzerland 1.47 1.59 1.16 1.11 0.84 0.91 0.52 0.51 0.34 0.28 0.27 0.26 0.25 Taiwan 1.90 1.80 1.60 1.40 1.20 1.20 1.20 1.20 1.14 0.45 0.30 0.30 0.30
Thailand 2.30 2.30 2.00 1.75 1.60 1.60 1.55 1.50 1.20 0.90 0.60 0.48 0.38
Turkey 2.00 2.00 2.00 1.93 1.66 1.78 1.63 1.16 0.82 0.76 0.66 0.51 0.41 United Kingdom 10/ 1.06 1.06 0.97 0.74 0.61 0.49 0.37 0.36 0.20 0.21 0.21 0.21 0.21
Vietnam n.a. n.a. n.a. 2.30 2.30 2.30 2.30 2.30 2.30 2.30 1.58 1.28 1.25
Fisher Ideal Rate Index 88.9 78.7 73.1 65.5 60.5 53.1 47.3 41.3 34.1 28.9 23.1 20.8 20.1
% Changes from Prior Rate -1.8% -11.5% -7.2% -10.3% -7.6% -12.2% -11.0% -12.6% -17.4% -15.3% -20.2% -9.9% -3.5%
Index without Mexico 87.3 77.3 71.5 63.4 58.2 51.3 45.3 39.2 32.3 26.7 23.1 20.2 19.3
% Changes from Prior Rate -2.0% -11.5% -7.5% -11.2% -8.2% -12.0% -11.7% -13.5% -17.7% -17.2% -13.5% -12.5% -4.8%
Weighted Average $1.27 $1.23 $1.15 $0.99 $0.92 $0.85 $0.79 $0.71 $0.60 $0.51 $0.41 $0.34 $0.33
Charge per Minute
See notes at the end of this table.
186
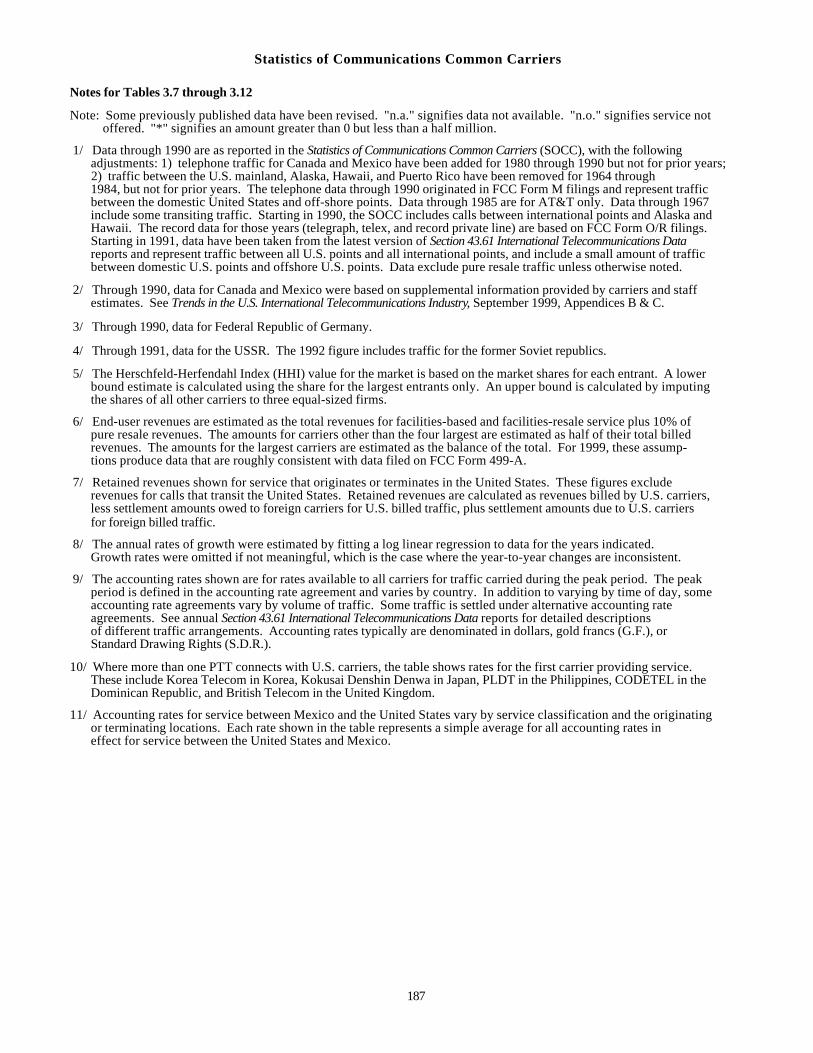
Statistics of Communications Common Carriers
Notes for Tables 3.7 through 3.12
Note: Some previously published data have been revised. "n.a." signifies data not available. "n.o." signifies service not offered. "*" signifies an amount greater than 0 but less than a half million.
1/ Data through 1990 are as reported in the Statistics of Communications Common Carriers (SOCC), with the following adjustments: 1) telephone traffic for Canada and Mexico have been added for 1980 through 1990 but not for prior years; 2) traffic between the U.S. mainland, Alaska, Hawaii, and Puerto Rico have been removed for 1964 through 1984, but not for prior years. The telephone data through 1990 originated in FCC Form M filings and represent traffic between the domestic United States and off-shore points. Data through 1985 are for AT&T only. Data through 1967 include some transiting traffic. Starting in 1990, the SOCC includes calls between international points and Alaska and Hawaii. The record data for those years (telegraph, telex, and record private line) are based on FCC Form O/R filings. Starting in 1991, data have been taken from the latest version of Section 43.61 International Telecommunications Data reports and represent traffic between all U.S. points and all international points, and include a small amount of traffic between domestic U.S. points and offshore U.S. points. Data exclude pure resale traffic unless otherwise noted.
2/ Through 1990, data for Canada and Mexico were based on supplemental information provided by carriers and staff estimates. See Trends in the U.S. International Telecommunications Industry, September 1999, Appendices B & C.
3/ Through 1990, data for Federal Republic of Germany.
4/ Through 1991, data for the USSR. The 1992 figure includes traffic for the former Soviet republics.
5/ The Herschfeld-Herfendahl Index (HHI) value for the market is based on the market shares for each entrant. A lower bound estimate is calculated using the share for the largest entrants only. An upper bound is calculated by imputing the shares of all other carriers to three equal-sized firms.
6/ End-user revenues are estimated as the total revenues for facilities-based and facilities-resale service plus 10% of pure resale revenues. The amounts for carriers other than the four largest are estimated as half of their total billed revenues. The amounts for the largest carriers are estimated as the balance of the total. For 1999, these assump- tions produce data that are roughly consistent with data filed on FCC Form 499-A.
7/ Retained revenues shown for service that originates or terminates in the United States. These figures exclude revenues for calls that transit the United States. Retained revenues are calculated as revenues billed by U.S. carriers, less settlement amounts owed to foreign carriers for U.S. billed traffic, plus settlement amounts due to U.S. carriers for foreign billed traffic.
8/ The annual rates of growth were estimated by fitting a log linear regression to data for the years indicated. Growth rates were omitted if not meaningful, which is the case where the year-to-year changes are inconsistent.
9/ The accounting rates shown are for rates available to all carriers for traffic carried during the peak period. The peak period is defined in the accounting rate agreement and varies by country. In addition to varying by time of day, some accounting rate agreements vary by volume of traffic. Some traffic is settled under alternative accounting rate agreements. See annual Section 43.61 International Telecommunications Data reports for detailed descriptions of different traffic arrangements. Accounting rates typically are denominated in dollars, gold francs (G.F.), or Standard Drawing Rights (S.D.R.).
10/ Where more than one PTT connects with U.S. carriers, the table shows rates for the first carrier providing service. These include Korea Telecom in Korea, Kokusai Denshin Denwa in Japan, PLDT in the Philippines, CODETEL in the Dominican Republic, and British Telecom in the United Kingdom.
11/ Accounting rates for service between Mexico and the United States vary by service classification and the originating or terminating locations. Each rate shown in the table represents a simple average for all accounting rates in effect for service between the United States and Mexico.
187

Part 4
Historical Financial,Operational, and Rate Tables
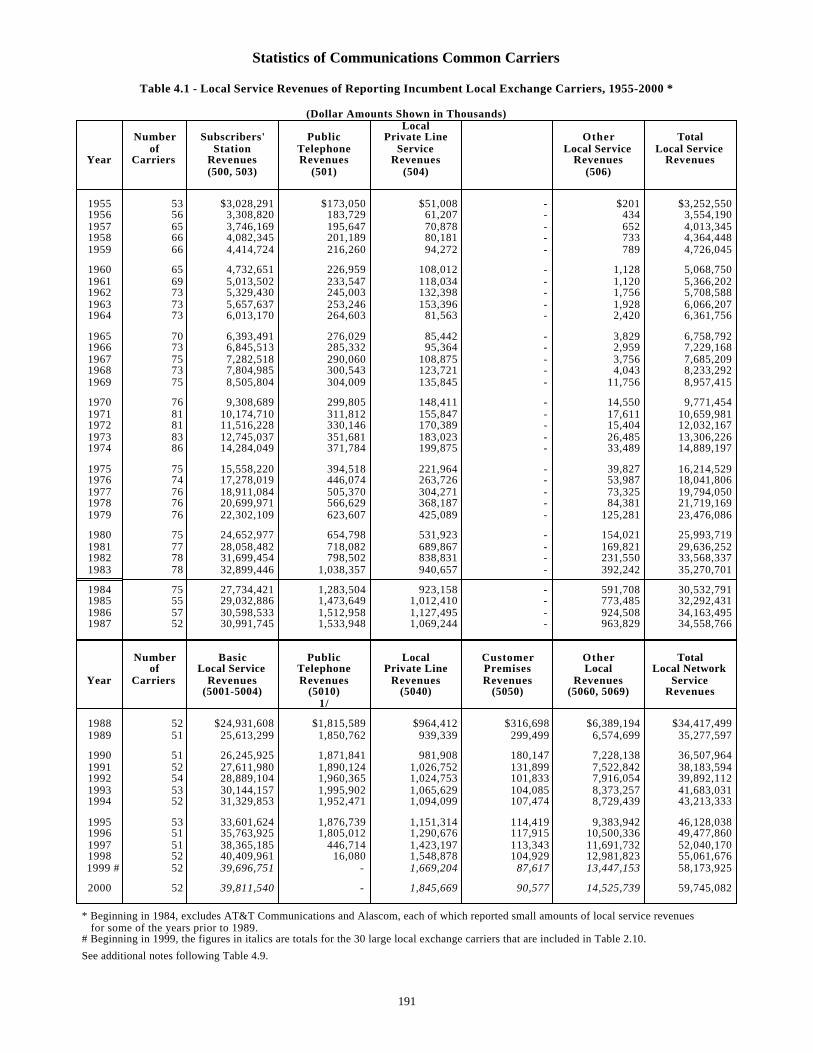
Statistics of Communications Common Carriers
Table 4.1 - Local Service Revenues of Reporting Incumbent Local Exchange Carriers, 1955-2000 *
(Dollar Amounts Shown in Thousands)Local
Number Subscribers' Public Private Line Other Totalof Station Telephone Service Local Service Local Service
Year Carriers Revenues Revenues Revenues Revenues Revenues(500, 503) (501) (504) (506)
1955 53 $3,028,291 $173,050 $51,008 - $201 $3,252,5501956 56 3,308,820 183,729 61,207 - 434 3,554,1901957 65 3,746,169 195,647 70,878 - 652 4,013,3451958 66 4,082,345 201,189 80,181 - 733 4,364,4481959 66 4,414,724 216,260 94,272 - 789 4,726,045
1960 65 4,732,651 226,959 108,012 - 1,128 5,068,7501961 69 5,013,502 233,547 118,034 - 1,120 5,366,2021962 73 5,329,430 245,003 132,398 - 1,756 5,708,5881963 73 5,657,637 253,246 153,396 - 1,928 6,066,2071964 73 6,013,170 264,603 81,563 - 2,420 6,361,756
1965 70 6,393,491 276,029 85,442 - 3,829 6,758,7921966 73 6,845,513 285,332 95,364 - 2,959 7,229,1681967 75 7,282,518 290,060 108,875 - 3,756 7,685,2091968 73 7,804,985 300,543 123,721 - 4,043 8,233,2921969 75 8,505,804 304,009 135,845 - 11,756 8,957,415
1970 76 9,308,689 299,805 148,411 - 14,550 9,771,4541971 81 10,174,710 311,812 155,847 - 17,611 10,659,9811972 81 11,516,228 330,146 170,389 - 15,404 12,032,1671973 83 12,745,037 351,681 183,023 - 26,485 13,306,2261974 86 14,284,049 371,784 199,875 - 33,489 14,889,197
1975 75 15,558,220 394,518 221,964 - 39,827 16,214,5291976 74 17,278,019 446,074 263,726 - 53,987 18,041,8061977 76 18,911,084 505,370 304,271 - 73,325 19,794,0501978 76 20,699,971 566,629 368,187 - 84,381 21,719,1691979 76 22,302,109 623,607 425,089 - 125,281 23,476,086
1980 75 24,652,977 654,798 531,923 - 154,021 25,993,7191981 77 28,058,482 718,082 689,867 - 169,821 29,636,2521982 78 31,699,454 798,502 838,831 - 231,550 33,568,3371983 78 32,899,446 1,038,357 940,657 - 392,242 35,270,701
1984 75 27,734,421 1,283,504 923,158 - 591,708 30,532,7911985 55 29,032,886 1,473,649 1,012,410 - 773,485 32,292,4311986 57 30,598,533 1,512,958 1,127,495 - 924,508 34,163,4951987 52 30,991,745 1,533,948 1,069,244 - 963,829 34,558,766
Number Basic Public Local Customer Other Totalof Local Service Telephone Private Line Premises Local Local Network
Year Carriers Revenues Revenues Revenues Revenues Revenues Service(5001-5004) (5010) (5040) (5050) (5060, 5069) Revenues
1/
1988 52 $24,931,608 $1,815,589 $964,412 $316,698 $6,389,194 $34,417,4991989 51 25,613,299 1,850,762 939,339 299,499 6,574,699 35,277,597
1990 51 26,245,925 1,871,841 981,908 180,147 7,228,138 36,507,9641991 52 27,611,980 1,890,124 1,026,752 131,899 7,522,842 38,183,5941992 54 28,889,104 1,960,365 1,024,753 101,833 7,916,054 39,892,1121993 53 30,144,157 1,995,902 1,065,629 104,085 8,373,257 41,683,0311994 52 31,329,853 1,952,471 1,094,099 107,474 8,729,439 43,213,333
1995 53 33,601,624 1,876,739 1,151,314 114,419 9,383,942 46,128,0381996 51 35,763,925 1,805,012 1,290,676 117,915 10,500,336 49,477,8601997 51 38,365,185 446,714 1,423,197 113,343 11,691,732 52,040,1701998 52 40,409,961 16,080 1,548,878 104,929 12,981,823 55,061,6761999 # 52 39,696,751 - 1,669,204 87,617 13,447,153 58,173,925
2000 52 39,811,540 - 1,845,669 90,577 14,525,739 59,745,082
* Beginning in 1984, excludes AT&T Communications and Alascom, each of which reported small amounts of local service revenues for some of the years prior to 1989. # Beginning in 1999, the figures in italics are totals for the 30 large local exchange carriers that are included in Table 2.10.
See additional notes following Table 4.9.
191
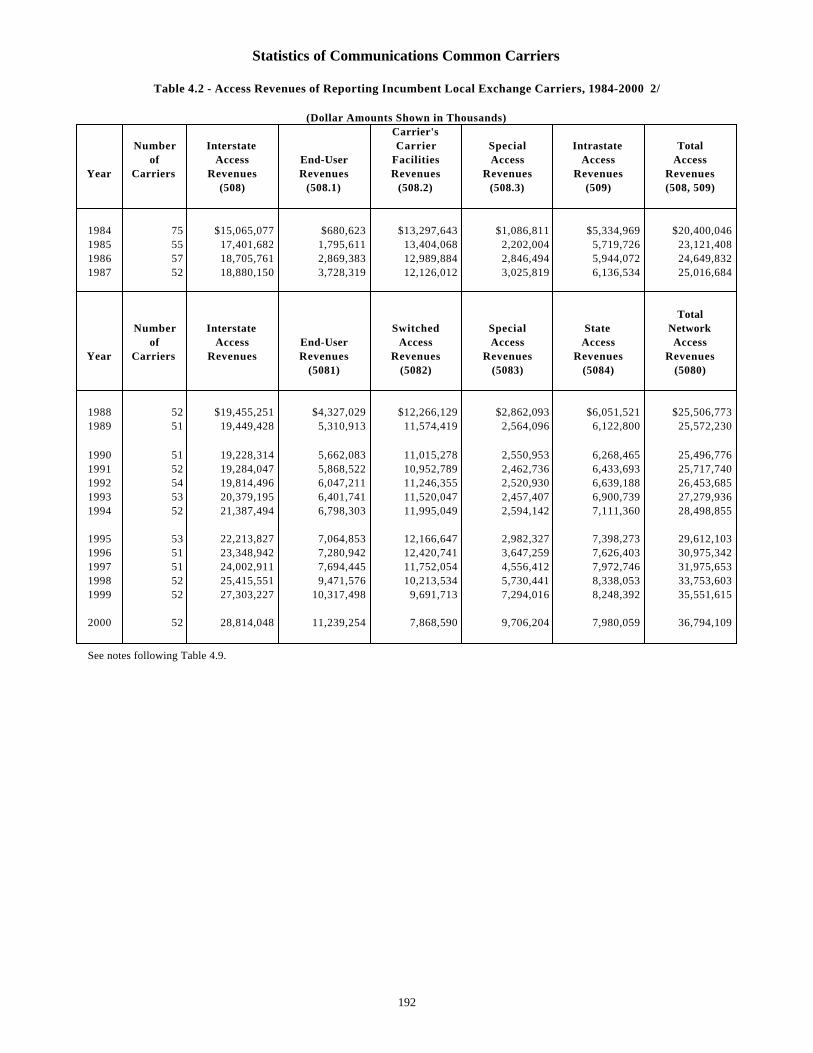
Statistics of Communications Common Carriers
Table 4.2 - Access Revenues of Reporting Incumbent Local Exchange Carriers, 1984-2000 2/
(Dollar Amounts Shown in Thousands)Carrier's
Number Interstate Carrier Special Intrastate Totalof Access End-User Facilities Access Access Access
Year Carriers Revenues Revenues Revenues Revenues Revenues Revenues(508) (508.1) (508.2) (508.3) (509) (508, 509)
1984 75 $15,065,077 $680,623 $13,297,643 $1,086,811 $5,334,969 $20,400,0461985 55 17,401,682 1,795,611 13,404,068 2,202,004 5,719,726 23,121,4081986 57 18,705,761 2,869,383 12,989,884 2,846,494 5,944,072 24,649,8321987 52 18,880,150 3,728,319 12,126,012 3,025,819 6,136,534 25,016,684
TotalNumber Interstate Switched Special State Network
of Access End-User Access Access Access AccessYear Carriers Revenues Revenues Revenues Revenues Revenues Revenues
(5081) (5082) (5083) (5084) (5080)
1988 52 $19,455,251 $4,327,029 $12,266,129 $2,862,093 $6,051,521 $25,506,7731989 51 19,449,428 5,310,913 11,574,419 2,564,096 6,122,800 25,572,230
1990 51 19,228,314 5,662,083 11,015,278 2,550,953 6,268,465 25,496,7761991 52 19,284,047 5,868,522 10,952,789 2,462,736 6,433,693 25,717,7401992 54 19,814,496 6,047,211 11,246,355 2,520,930 6,639,188 26,453,6851993 53 20,379,195 6,401,741 11,520,047 2,457,407 6,900,739 27,279,9361994 52 21,387,494 6,798,303 11,995,049 2,594,142 7,111,360 28,498,855
1995 53 22,213,827 7,064,853 12,166,647 2,982,327 7,398,273 29,612,1031996 51 23,348,942 7,280,942 12,420,741 3,647,259 7,626,403 30,975,3421997 51 24,002,911 7,694,445 11,752,054 4,556,412 7,972,746 31,975,6531998 52 25,415,551 9,471,576 10,213,534 5,730,441 8,338,053 33,753,6031999 52 27,303,227 10,317,498 9,691,713 7,294,016 8,248,392 35,551,615
2000 52 28,814,048 11,239,254 7,868,590 9,706,204 7,980,059 36,794,109
See notes following Table 4.9.
192
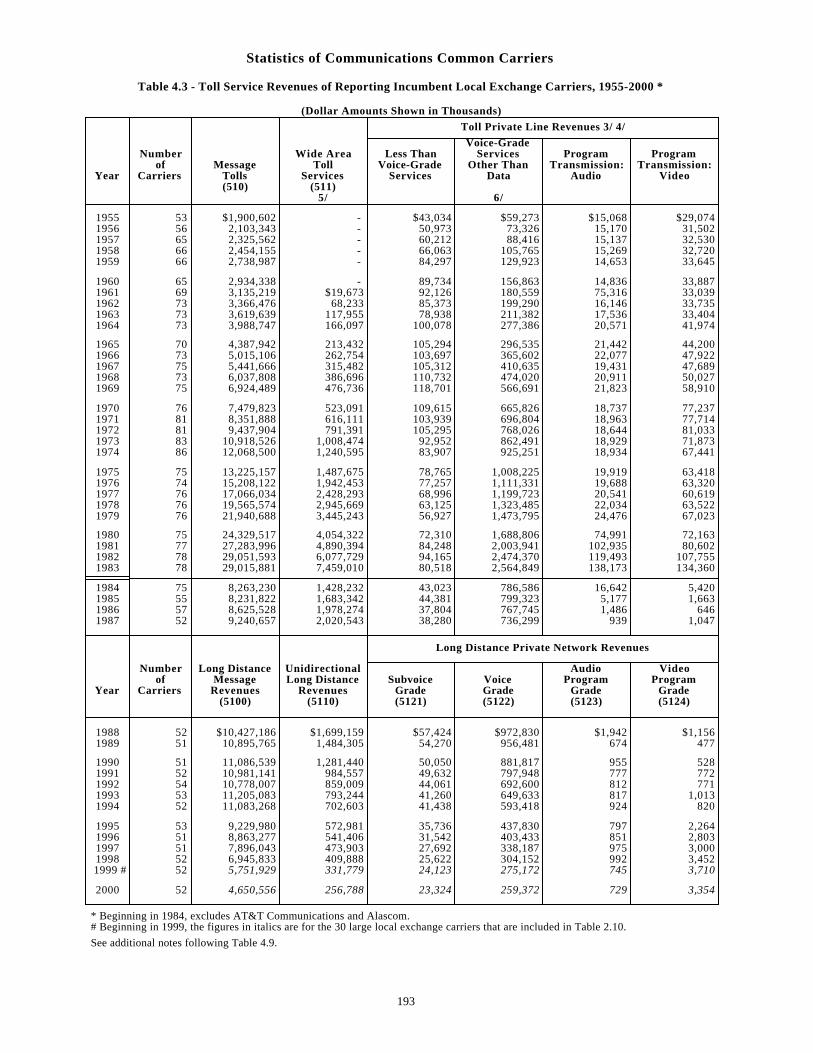
Statistics of Communications Common Carriers
Table 4.3 - Toll Service Revenues of Reporting Incumbent Local Exchange Carriers, 1955-2000 *
(Dollar Amounts Shown in Thousands)
Toll Private Line Revenues 3/ 4/
Voice-GradeNumber Wide Area Less Than Services Program Program
of Message Toll Voice-Grade Other Than Transmission: Transmission:Year Carriers Tolls Services Services Data Audio Video
(510) (511)5/ 6/
1955 53 $1,900,602 - $43,034 $59,273 $15,068 $29,0741956 56 2,103,343 - 50,973 73,326 15,170 31,5021957 65 2,325,562 - 60,212 88,416 15,137 32,5301958 66 2,454,155 - 66,063 105,765 15,269 32,7201959 66 2,738,987 - 84,297 129,923 14,653 33,645
1960 65 2,934,338 - 89,734 156,863 14,836 33,8871961 69 3,135,219 $19,673 92,126 180,559 75,316 33,0391962 73 3,366,476 68,233 85,373 199,290 16,146 33,7351963 73 3,619,639 117,955 78,938 211,382 17,536 33,4041964 73 3,988,747 166,097 100,078 277,386 20,571 41,974
1965 70 4,387,942 213,432 105,294 296,535 21,442 44,2001966 73 5,015,106 262,754 103,697 365,602 22,077 47,9221967 75 5,441,666 315,482 105,312 410,635 19,431 47,6891968 73 6,037,808 386,696 110,732 474,020 20,911 50,0271969 75 6,924,489 476,736 118,701 566,691 21,823 58,910
1970 76 7,479,823 523,091 109,615 665,826 18,737 77,2371971 81 8,351,888 616,111 103,939 696,804 18,963 77,7141972 81 9,437,904 791,391 105,295 768,026 18,644 81,0331973 83 10,918,526 1,008,474 92,952 862,491 18,929 71,8731974 86 12,068,500 1,240,595 83,907 925,251 18,934 67,441
1975 75 13,225,157 1,487,675 78,765 1,008,225 19,919 63,4181976 74 15,208,122 1,942,453 77,257 1,111,331 19,688 63,3201977 76 17,066,034 2,428,293 68,996 1,199,723 20,541 60,6191978 76 19,565,574 2,945,669 63,125 1,323,485 22,034 63,5221979 76 21,940,688 3,445,243 56,927 1,473,795 24,476 67,023
1980 75 24,329,517 4,054,322 72,310 1,688,806 74,991 72,1631981 77 27,283,996 4,890,394 84,248 2,003,941 102,935 80,6021982 78 29,051,593 6,077,729 94,165 2,474,370 119,493 107,7551983 78 29,015,881 7,459,010 80,518 2,564,849 138,173 134,360
1984 75 8,263,230 1,428,232 43,023 786,586 16,642 5,4201985 55 8,231,822 1,683,342 44,381 799,323 5,177 1,6631986 57 8,625,528 1,978,274 37,804 767,745 1,486 6461987 52 9,240,657 2,020,543 38,280 736,299 939 1,047
Long Distance Private Network Revenues
Number Long Distance Unidirectional Audio Videoof Message Long Distance Subvoice Voice Program Program
Year Carriers Revenues Revenues Grade Grade Grade Grade(5100) (5110) (5121) (5122) (5123) (5124)
1988 52 $10,427,186 $1,699,159 $57,424 $972,830 $1,942 $1,1561989 51 10,895,765 1,484,305 54,270 956,481 674 477
1990 51 11,086,539 1,281,440 50,050 881,817 955 5281991 52 10,981,141 984,557 49,632 797,948 777 7721992 54 10,778,007 859,009 44,061 692,600 812 7711993 53 11,205,083 793,244 41,260 649,633 817 1,0131994 52 11,083,268 702,603 41,438 593,418 924 820
1995 53 9,229,980 572,981 35,736 437,830 797 2,2641996 51 8,863,277 541,406 31,542 403,433 851 2,8031997 51 7,896,043 473,903 27,692 338,187 975 3,0001998 52 6,945,833 409,888 25,622 304,152 992 3,4521999 # 52 5,751,929 331,779 24,123 275,172 745 3,710
2000 52 4,650,556 256,788 23,324 259,372 729 3,354
* Beginning in 1984, excludes AT&T Communications and Alascom. # Beginning in 1999, the figures in italics are for the 30 large local exchange carriers that are included in Table 2.10.
See additional notes following Table 4.9.
193
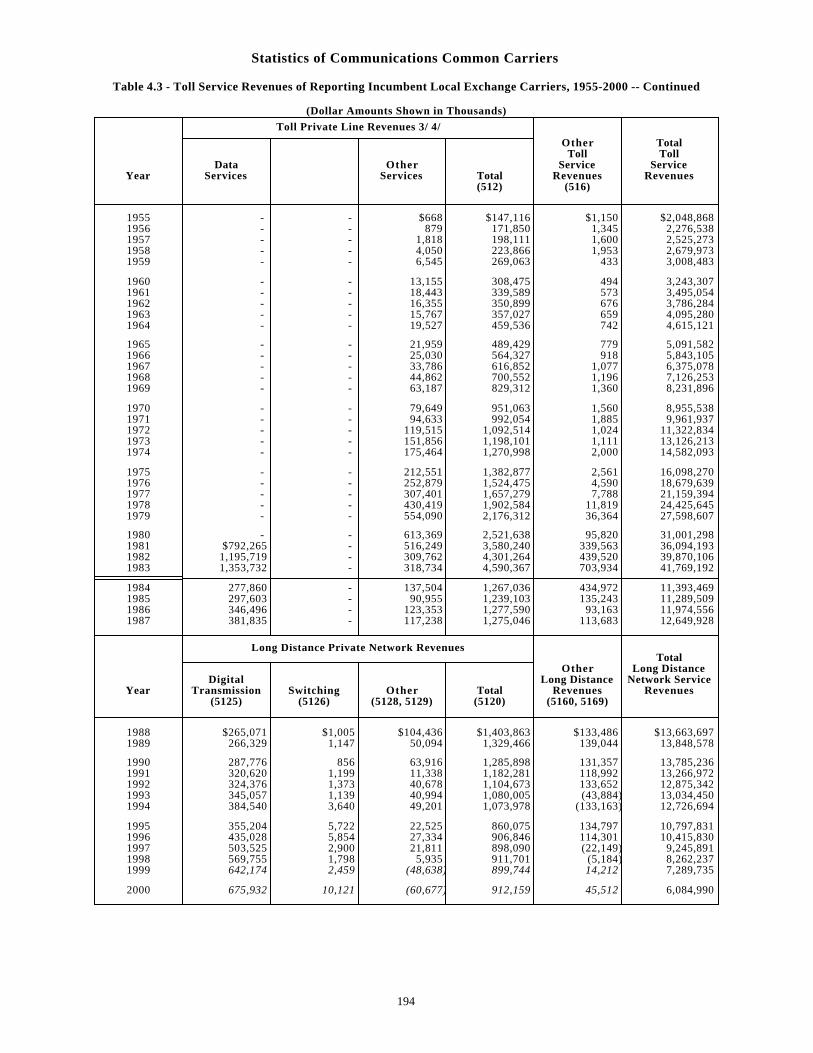
Statistics of Communications Common Carriers
Table 4.3 - Toll Service Revenues of Reporting Incumbent Local Exchange Carriers, 1955-2000 -- Continued
(Dollar Amounts Shown in Thousands)
Toll Private Line Revenues 3/ 4/
Other TotalToll Toll
Data Other Service ServiceYear Services Services Total Revenues Revenues
(512) (516)
1955 - - $668 $147,116 $1,150 $2,048,8681956 - - 879 171,850 1,345 2,276,5381957 - - 1,818 198,111 1,600 2,525,2731958 - - 4,050 223,866 1,953 2,679,9731959 - - 6,545 269,063 433 3,008,483
1960 - - 13,155 308,475 494 3,243,3071961 - - 18,443 339,589 573 3,495,0541962 - - 16,355 350,899 676 3,786,2841963 - - 15,767 357,027 659 4,095,2801964 - - 19,527 459,536 742 4,615,121
1965 - - 21,959 489,429 779 5,091,5821966 - - 25,030 564,327 918 5,843,1051967 - - 33,786 616,852 1,077 6,375,0781968 - - 44,862 700,552 1,196 7,126,2531969 - - 63,187 829,312 1,360 8,231,896
1970 - - 79,649 951,063 1,560 8,955,5381971 - - 94,633 992,054 1,885 9,961,9371972 - - 119,515 1,092,514 1,024 11,322,8341973 - - 151,856 1,198,101 1,111 13,126,2131974 - - 175,464 1,270,998 2,000 14,582,093
1975 - - 212,551 1,382,877 2,561 16,098,2701976 - - 252,879 1,524,475 4,590 18,679,6391977 - - 307,401 1,657,279 7,788 21,159,3941978 - - 430,419 1,902,584 11,819 24,425,6451979 - - 554,090 2,176,312 36,364 27,598,607
1980 - - 613,369 2,521,638 95,820 31,001,2981981 $792,265 - 516,249 3,580,240 339,563 36,094,1931982 1,195,719 - 309,762 4,301,264 439,520 39,870,1061983 1,353,732 - 318,734 4,590,367 703,934 41,769,192
1984 277,860 - 137,504 1,267,036 434,972 11,393,4691985 297,603 - 90,955 1,239,103 135,243 11,289,5091986 346,496 - 123,353 1,277,590 93,163 11,974,5561987 381,835 - 117,238 1,275,046 113,683 12,649,928
Long Distance Private Network RevenuesTotal
Other Long DistanceDigital Long Distance Network Service
Year Transmission Switching Other Total Revenues Revenues(5125) (5126) (5128, 5129) (5120) (5160, 5169)
1988 $265,071 $1,005 $104,436 $1,403,863 $133,486 $13,663,6971989 266,329 1,147 50,094 1,329,466 139,044 13,848,578
1990 287,776 856 63,916 1,285,898 131,357 13,785,2361991 320,620 1,199 11,338 1,182,281 118,992 13,266,9721992 324,376 1,373 40,678 1,104,673 133,652 12,875,3421993 345,057 1,139 40,994 1,080,005 (43,884) 13,034,4501994 384,540 3,640 49,201 1,073,978 (133,163) 12,726,694
1995 355,204 5,722 22,525 860,075 134,797 10,797,8311996 435,028 5,854 27,334 906,846 114,301 10,415,8301997 503,525 2,900 21,811 898,090 (22,149) 9,245,8911998 569,755 1,798 5,935 911,701 (5,184) 8,262,2371999 642,174 2,459 (48,638) 899,744 14,212 7,289,735
2000 675,932 10,121 (60,677) 912,159 45,512 6,084,990
194
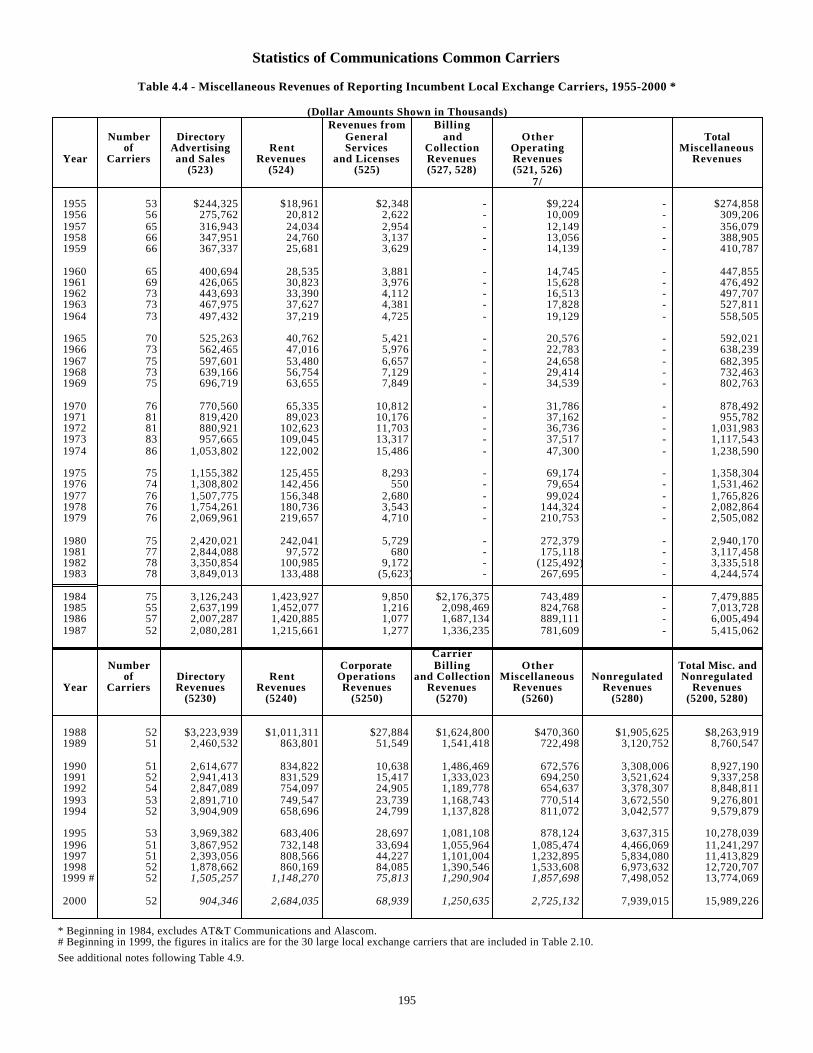
Statistics of Communications Common Carriers
Table 4.4 - Miscellaneous Revenues of Reporting Incumbent Local Exchange Carriers, 1955-2000 *
(Dollar Amounts Shown in Thousands)Revenues from Billing
Number Directory General and Other Totalof Advertising Rent Services Collection Operating Miscellaneous
Year Carriers and Sales Revenues and Licenses Revenues Revenues Revenues(523) (524) (525) (527, 528) (521, 526)
7/
1955 53 $244,325 $18,961 $2,348 - $9,224 - $274,8581956 56 275,762 20,812 2,622 - 10,009 - 309,2061957 65 316,943 24,034 2,954 - 12,149 - 356,0791958 66 347,951 24,760 3,137 - 13,056 - 388,9051959 66 367,337 25,681 3,629 - 14,139 - 410,787
1960 65 400,694 28,535 3,881 - 14,745 - 447,8551961 69 426,065 30,823 3,976 - 15,628 - 476,4921962 73 443,693 33,390 4,112 - 16,513 - 497,7071963 73 467,975 37,627 4,381 - 17,828 - 527,8111964 73 497,432 37,219 4,725 - 19,129 - 558,505
1965 70 525,263 40,762 5,421 - 20,576 - 592,0211966 73 562,465 47,016 5,976 - 22,783 - 638,2391967 75 597,601 53,480 6,657 - 24,658 - 682,3951968 73 639,166 56,754 7,129 - 29,414 - 732,4631969 75 696,719 63,655 7,849 - 34,539 - 802,763
1970 76 770,560 65,335 10,812 - 31,786 - 878,4921971 81 819,420 89,023 10,176 - 37,162 - 955,7821972 81 880,921 102,623 11,703 - 36,736 - 1,031,9831973 83 957,665 109,045 13,317 - 37,517 - 1,117,5431974 86 1,053,802 122,002 15,486 - 47,300 - 1,238,590
1975 75 1,155,382 125,455 8,293 - 69,174 - 1,358,3041976 74 1,308,802 142,456 550 - 79,654 - 1,531,4621977 76 1,507,775 156,348 2,680 - 99,024 - 1,765,8261978 76 1,754,261 180,736 3,543 - 144,324 - 2,082,8641979 76 2,069,961 219,657 4,710 - 210,753 - 2,505,082
1980 75 2,420,021 242,041 5,729 - 272,379 - 2,940,1701981 77 2,844,088 97,572 680 - 175,118 - 3,117,4581982 78 3,350,854 100,985 9,172 - (125,492) - 3,335,5181983 78 3,849,013 133,488 (5,623) - 267,695 - 4,244,574
1984 75 3,126,243 1,423,927 9,850 $2,176,375 743,489 - 7,479,8851985 55 2,637,199 1,452,077 1,216 2,098,469 824,768 - 7,013,7281986 57 2,007,287 1,420,885 1,077 1,687,134 889,111 - 6,005,4941987 52 2,080,281 1,215,661 1,277 1,336,235 781,609 - 5,415,062
CarrierNumber Corporate Billing Other Total Misc. and
of Directory Rent Operations and Collection Miscellaneous Nonregulated NonregulatedYear Carriers Revenues Revenues Revenues Revenues Revenues Revenues Revenues
(5230) (5240) (5250) (5270) (5260) (5280) (5200, 5280)
1988 52 $3,223,939 $1,011,311 $27,884 $1,624,800 $470,360 $1,905,625 $8,263,9191989 51 2,460,532 863,801 51,549 1,541,418 722,498 3,120,752 8,760,547
1990 51 2,614,677 834,822 10,638 1,486,469 672,576 3,308,006 8,927,1901991 52 2,941,413 831,529 15,417 1,333,023 694,250 3,521,624 9,337,2581992 54 2,847,089 754,097 24,905 1,189,778 654,637 3,378,307 8,848,8111993 53 2,891,710 749,547 23,739 1,168,743 770,514 3,672,550 9,276,8011994 52 3,904,909 658,696 24,799 1,137,828 811,072 3,042,577 9,579,879
1995 53 3,969,382 683,406 28,697 1,081,108 878,124 3,637,315 10,278,0391996 51 3,867,952 732,148 33,694 1,055,964 1,085,474 4,466,069 11,241,2971997 51 2,393,056 808,566 44,227 1,101,004 1,232,895 5,834,080 11,413,8291998 52 1,878,662 860,169 84,085 1,390,546 1,533,608 6,973,632 12,720,7071999 # 52 1,505,257 1,148,270 75,813 1,290,904 1,857,698 7,498,052 13,774,069
2000 52 904,346 2,684,035 68,939 1,250,635 2,725,132 7,939,015 15,989,226
* Beginning in 1984, excludes AT&T Communications and Alascom. # Beginning in 1999, the figures in italics are for the 30 large local exchange carriers that are included in Table 2.10.
See additional notes following Table 4.9.
195
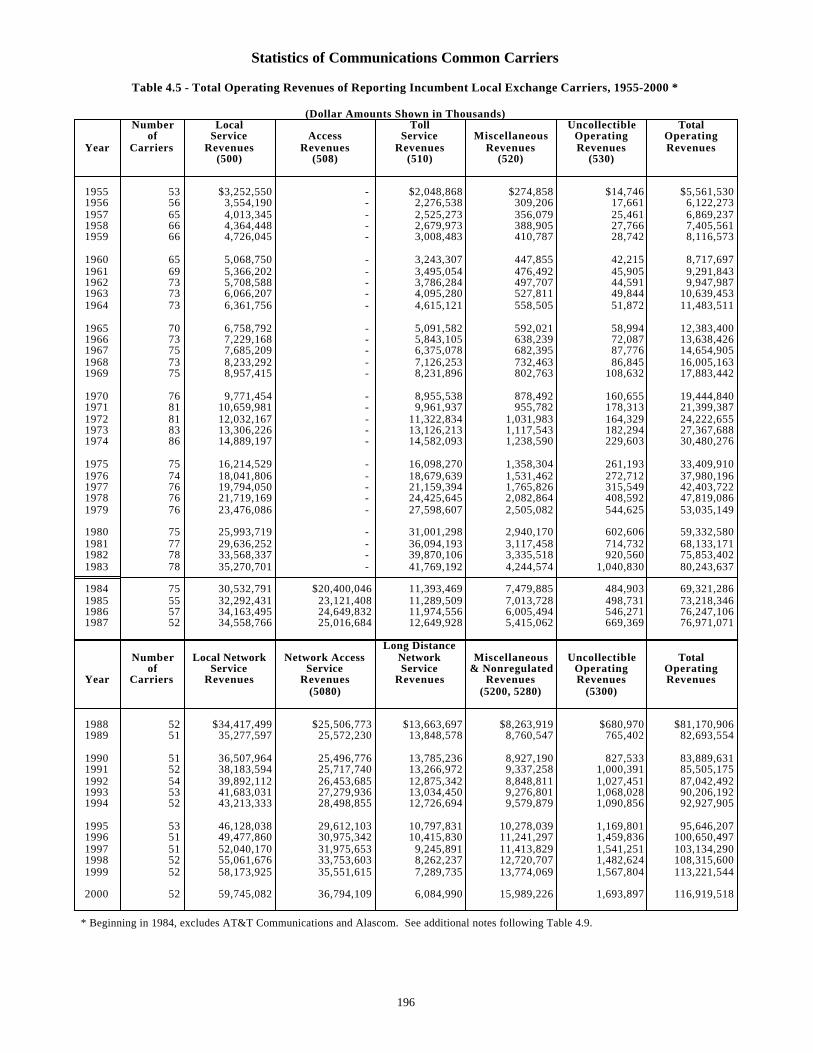
Statistics of Communications Common Carriers
Table 4.5 - Total Operating Revenues of Reporting Incumbent Local Exchange Carriers, 1955-2000 *
(Dollar Amounts Shown in Thousands)Number Local Toll Uncollectible Total
of Service Access Service Miscellaneous Operating OperatingYear Carriers Revenues Revenues Revenues Revenues Revenues Revenues
(500) (508) (510) (520) (530)
1955 53 $3,252,550 - $2,048,868 $274,858 $14,746 $5,561,5301956 56 3,554,190 - 2,276,538 309,206 17,661 6,122,2731957 65 4,013,345 - 2,525,273 356,079 25,461 6,869,2371958 66 4,364,448 - 2,679,973 388,905 27,766 7,405,5611959 66 4,726,045 - 3,008,483 410,787 28,742 8,116,573
1960 65 5,068,750 - 3,243,307 447,855 42,215 8,717,6971961 69 5,366,202 - 3,495,054 476,492 45,905 9,291,8431962 73 5,708,588 - 3,786,284 497,707 44,591 9,947,9871963 73 6,066,207 - 4,095,280 527,811 49,844 10,639,4531964 73 6,361,756 - 4,615,121 558,505 51,872 11,483,511
1965 70 6,758,792 - 5,091,582 592,021 58,994 12,383,4001966 73 7,229,168 - 5,843,105 638,239 72,087 13,638,4261967 75 7,685,209 - 6,375,078 682,395 87,776 14,654,9051968 73 8,233,292 - 7,126,253 732,463 86,845 16,005,1631969 75 8,957,415 - 8,231,896 802,763 108,632 17,883,442
1970 76 9,771,454 - 8,955,538 878,492 160,655 19,444,8401971 81 10,659,981 - 9,961,937 955,782 178,313 21,399,3871972 81 12,032,167 - 11,322,834 1,031,983 164,329 24,222,6551973 83 13,306,226 - 13,126,213 1,117,543 182,294 27,367,6881974 86 14,889,197 - 14,582,093 1,238,590 229,603 30,480,276
1975 75 16,214,529 - 16,098,270 1,358,304 261,193 33,409,9101976 74 18,041,806 - 18,679,639 1,531,462 272,712 37,980,1961977 76 19,794,050 - 21,159,394 1,765,826 315,549 42,403,7221978 76 21,719,169 - 24,425,645 2,082,864 408,592 47,819,0861979 76 23,476,086 - 27,598,607 2,505,082 544,625 53,035,149
1980 75 25,993,719 - 31,001,298 2,940,170 602,606 59,332,5801981 77 29,636,252 - 36,094,193 3,117,458 714,732 68,133,1711982 78 33,568,337 - 39,870,106 3,335,518 920,560 75,853,4021983 78 35,270,701 - 41,769,192 4,244,574 1,040,830 80,243,637
1984 75 30,532,791 $20,400,046 11,393,469 7,479,885 484,903 69,321,2861985 55 32,292,431 23,121,408 11,289,509 7,013,728 498,731 73,218,3461986 57 34,163,495 24,649,832 11,974,556 6,005,494 546,271 76,247,1061987 52 34,558,766 25,016,684 12,649,928 5,415,062 669,369 76,971,071
Long DistanceNumber Local Network Network Access Network Miscellaneous Uncollectible Total
of Service Service Service & Nonregulated Operating OperatingYear Carriers Revenues Revenues Revenues Revenues Revenues Revenues
(5080) (5200, 5280) (5300)
1988 52 $34,417,499 $25,506,773 $13,663,697 $8,263,919 $680,970 $81,170,9061989 51 35,277,597 25,572,230 13,848,578 8,760,547 765,402 82,693,554
1990 51 36,507,964 25,496,776 13,785,236 8,927,190 827,533 83,889,6311991 52 38,183,594 25,717,740 13,266,972 9,337,258 1,000,391 85,505,1751992 54 39,892,112 26,453,685 12,875,342 8,848,811 1,027,451 87,042,4921993 53 41,683,031 27,279,936 13,034,450 9,276,801 1,068,028 90,206,1921994 52 43,213,333 28,498,855 12,726,694 9,579,879 1,090,856 92,927,905
1995 53 46,128,038 29,612,103 10,797,831 10,278,039 1,169,801 95,646,2071996 51 49,477,860 30,975,342 10,415,830 11,241,297 1,459,836 100,650,4971997 51 52,040,170 31,975,653 9,245,891 11,413,829 1,541,251 103,134,2901998 52 55,061,676 33,753,603 8,262,237 12,720,707 1,482,624 108,315,6001999 52 58,173,925 35,551,615 7,289,735 13,774,069 1,567,804 113,221,544
2000 52 59,745,082 36,794,109 6,084,990 15,989,226 1,693,897 116,919,518
* Beginning in 1984, excludes AT&T Communications and Alascom. See additional notes following Table 4.9.
196
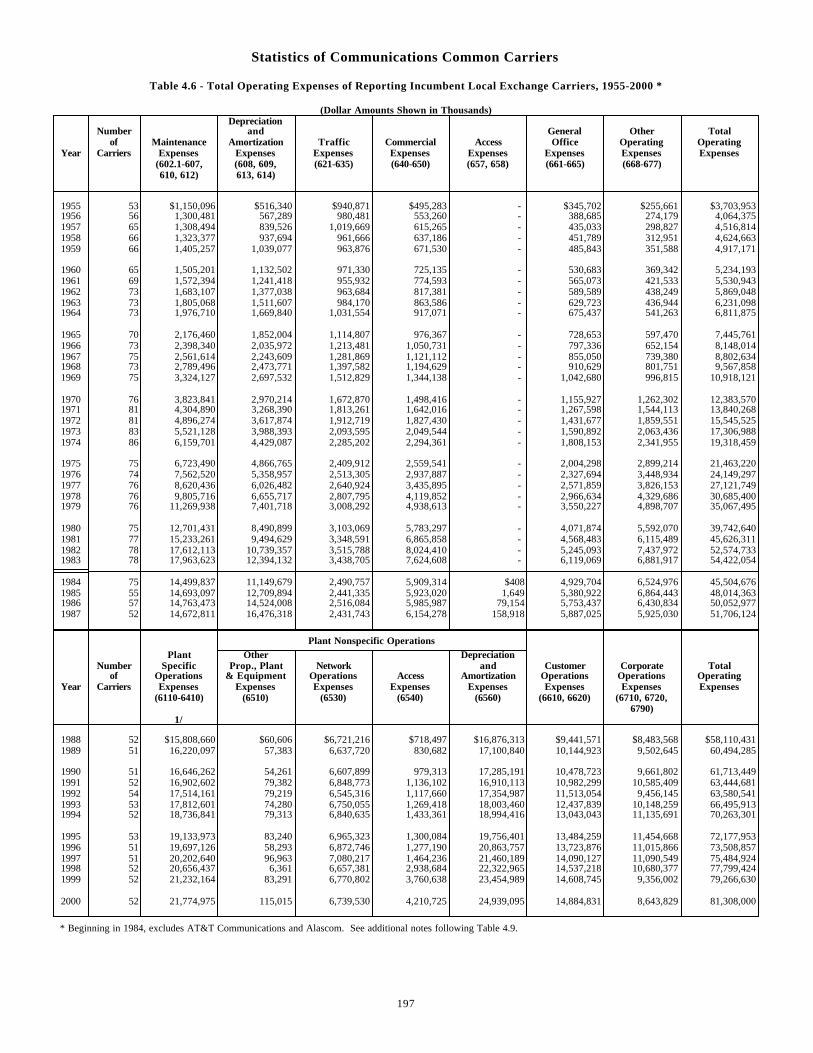
Statistics of Communications Common Carriers
Table 4.6 - Total Operating Expenses of Reporting Incumbent Local Exchange Carriers, 1955-2000 *
(Dollar Amounts Shown in Thousands)Depreciation
Number and General Other Totalof Maintenance Amortization Traffic Commercial Access Office Operating Operating
Year Carriers Expenses Expenses Expenses Expenses Expenses Expenses Expenses Expenses(602.1-607, (608, 609, (621-635) (640-650) (657, 658) (661-665) (668-677)610, 612) 613, 614)
1955 53 $1,150,096 $516,340 $940,871 $495,283 - $345,702 $255,661 $3,703,9531956 56 1,300,481 567,289 980,481 553,260 - 388,685 274,179 4,064,3751957 65 1,308,494 839,526 1,019,669 615,265 - 435,033 298,827 4,516,8141958 66 1,323,377 937,694 961,666 637,186 - 451,789 312,951 4,624,6631959 66 1,405,257 1,039,077 963,876 671,530 - 485,843 351,588 4,917,171
1960 65 1,505,201 1,132,502 971,330 725,135 - 530,683 369,342 5,234,1931961 69 1,572,394 1,241,418 955,932 774,593 - 565,073 421,533 5,530,9431962 73 1,683,107 1,377,038 963,684 817,381 - 589,589 438,249 5,869,0481963 73 1,805,068 1,511,607 984,170 863,586 - 629,723 436,944 6,231,0981964 73 1,976,710 1,669,840 1,031,554 917,071 - 675,437 541,263 6,811,875
1965 70 2,176,460 1,852,004 1,114,807 976,367 - 728,653 597,470 7,445,7611966 73 2,398,340 2,035,972 1,213,481 1,050,731 - 797,336 652,154 8,148,0141967 75 2,561,614 2,243,609 1,281,869 1,121,112 - 855,050 739,380 8,802,6341968 73 2,789,496 2,473,771 1,397,582 1,194,629 - 910,629 801,751 9,567,8581969 75 3,324,127 2,697,532 1,512,829 1,344,138 - 1,042,680 996,815 10,918,121
1970 76 3,823,841 2,970,214 1,672,870 1,498,416 - 1,155,927 1,262,302 12,383,5701971 81 4,304,890 3,268,390 1,813,261 1,642,016 - 1,267,598 1,544,113 13,840,2681972 81 4,896,274 3,617,874 1,912,719 1,827,430 - 1,431,677 1,859,551 15,545,5251973 83 5,521,128 3,988,393 2,093,595 2,049,544 - 1,590,892 2,063,436 17,306,9881974 86 6,159,701 4,429,087 2,285,202 2,294,361 - 1,808,153 2,341,955 19,318,459
1975 75 6,723,490 4,866,765 2,409,912 2,559,541 - 2,004,298 2,899,214 21,463,2201976 74 7,562,520 5,358,957 2,513,305 2,937,887 - 2,327,694 3,448,934 24,149,2971977 76 8,620,436 6,026,482 2,640,924 3,435,895 - 2,571,859 3,826,153 27,121,7491978 76 9,805,716 6,655,717 2,807,795 4,119,852 - 2,966,634 4,329,686 30,685,4001979 76 11,269,938 7,401,718 3,008,292 4,938,613 - 3,550,227 4,898,707 35,067,495
1980 75 12,701,431 8,490,899 3,103,069 5,783,297 - 4,071,874 5,592,070 39,742,6401981 77 15,233,261 9,494,629 3,348,591 6,865,858 - 4,568,483 6,115,489 45,626,3111982 78 17,612,113 10,739,357 3,515,788 8,024,410 - 5,245,093 7,437,972 52,574,7331983 78 17,963,623 12,394,132 3,438,705 7,624,608 - 6,119,069 6,881,917 54,422,054
1984 75 14,499,837 11,149,679 2,490,757 5,909,314 $408 4,929,704 6,524,976 45,504,6761985 55 14,693,097 12,709,894 2,441,335 5,923,020 1,649 5,380,922 6,864,443 48,014,3631986 57 14,763,473 14,524,008 2,516,084 5,985,987 79,154 5,753,437 6,430,834 50,052,9771987 52 14,672,811 16,476,318 2,431,743 6,154,278 158,918 5,887,025 5,925,030 51,706,124
Plant Nonspecific OperationsPlant Other Depreciation
Number Specific Prop., Plant Network and Customer Corporate Totalof Operations & Equipment Operations Access Amortization Operations Operations Operating
Year Carriers Expenses Expenses Expenses Expenses Expenses Expenses Expenses Expenses(6110-6410) (6510) (6530) (6540) (6560) (6610, 6620) (6710, 6720,
6790)1/
1988 52 $15,808,660 $60,606 $6,721,216 $718,497 $16,876,313 $9,441,571 $8,483,568 $58,110,4311989 51 16,220,097 57,383 6,637,720 830,682 17,100,840 10,144,923 9,502,645 60,494,285
1990 51 16,646,262 54,261 6,607,899 979,313 17,285,191 10,478,723 9,661,802 61,713,4491991 52 16,902,602 79,382 6,848,773 1,136,102 16,910,113 10,982,299 10,585,409 63,444,6811992 54 17,514,161 79,219 6,545,316 1,117,660 17,354,987 11,513,054 9,456,145 63,580,5411993 53 17,812,601 74,280 6,750,055 1,269,418 18,003,460 12,437,839 10,148,259 66,495,9131994 52 18,736,841 79,313 6,840,635 1,433,361 18,994,416 13,043,043 11,135,691 70,263,301
1995 53 19,133,973 83,240 6,965,323 1,300,084 19,756,401 13,484,259 11,454,668 72,177,9531996 51 19,697,126 58,293 6,872,746 1,277,190 20,863,757 13,723,876 11,015,866 73,508,8571997 51 20,202,640 96,963 7,080,217 1,464,236 21,460,189 14,090,127 11,090,549 75,484,9241998 52 20,656,437 6,361 6,657,381 2,938,684 22,322,965 14,537,218 10,680,377 77,799,4241999 52 21,232,164 83,291 6,770,802 3,760,638 23,454,989 14,608,745 9,356,002 79,266,630
2000 52 21,774,975 115,015 6,739,530 4,210,725 24,939,095 14,884,831 8,643,829 81,308,000
* Beginning in 1984, excludes AT&T Communications and Alascom. See additional notes following Table 4.9.
197
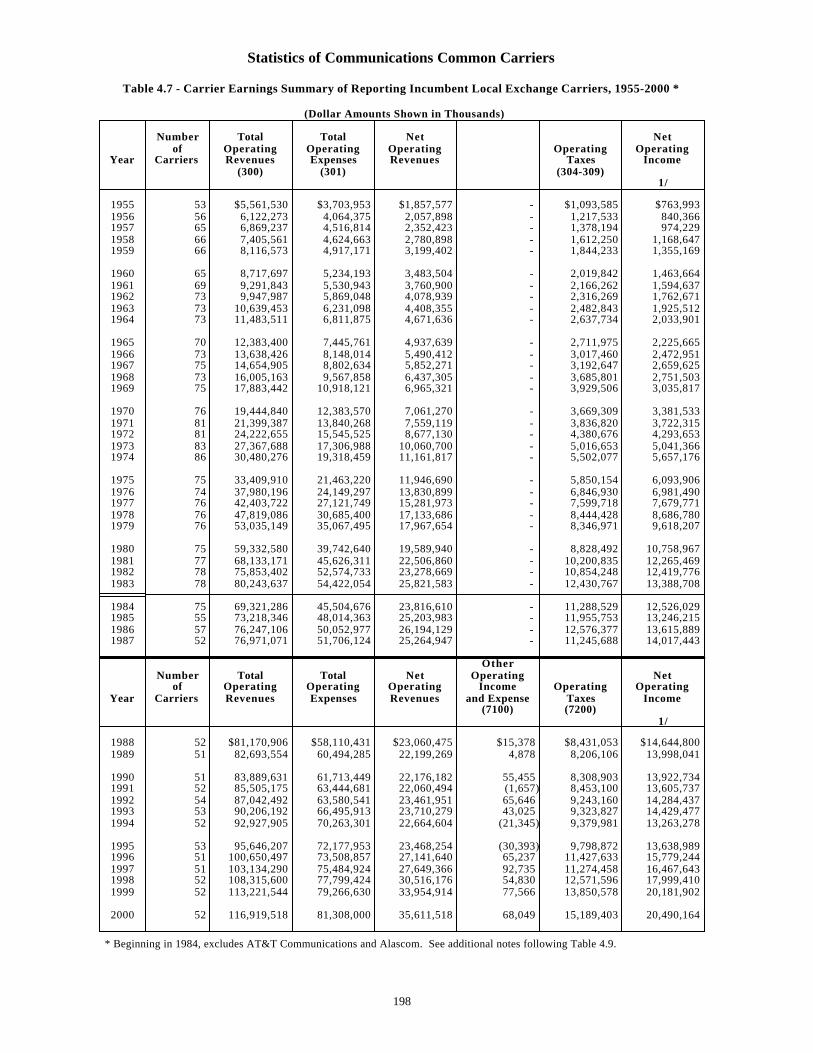
Statistics of Communications Common Carriers
Table 4.7 - Carrier Earnings Summary of Reporting Incumbent Local Exchange Carriers, 1955-2000 *
(Dollar Amounts Shown in Thousands)
Number Total Total Net Netof Operating Operating Operating Operating Operating
Year Carriers Revenues Expenses Revenues Taxes Income(300) (301) (304-309)
1/
1955 53 $5,561,530 $3,703,953 $1,857,577 - $1,093,585 $763,9931956 56 6,122,273 4,064,375 2,057,898 - 1,217,533 840,3661957 65 6,869,237 4,516,814 2,352,423 - 1,378,194 974,2291958 66 7,405,561 4,624,663 2,780,898 - 1,612,250 1,168,6471959 66 8,116,573 4,917,171 3,199,402 - 1,844,233 1,355,169
1960 65 8,717,697 5,234,193 3,483,504 - 2,019,842 1,463,6641961 69 9,291,843 5,530,943 3,760,900 - 2,166,262 1,594,6371962 73 9,947,987 5,869,048 4,078,939 - 2,316,269 1,762,6711963 73 10,639,453 6,231,098 4,408,355 - 2,482,843 1,925,5121964 73 11,483,511 6,811,875 4,671,636 - 2,637,734 2,033,901
1965 70 12,383,400 7,445,761 4,937,639 - 2,711,975 2,225,6651966 73 13,638,426 8,148,014 5,490,412 - 3,017,460 2,472,9511967 75 14,654,905 8,802,634 5,852,271 - 3,192,647 2,659,6251968 73 16,005,163 9,567,858 6,437,305 - 3,685,801 2,751,5031969 75 17,883,442 10,918,121 6,965,321 - 3,929,506 3,035,817
1970 76 19,444,840 12,383,570 7,061,270 - 3,669,309 3,381,5331971 81 21,399,387 13,840,268 7,559,119 - 3,836,820 3,722,3151972 81 24,222,655 15,545,525 8,677,130 - 4,380,676 4,293,6531973 83 27,367,688 17,306,988 10,060,700 - 5,016,653 5,041,3661974 86 30,480,276 19,318,459 11,161,817 - 5,502,077 5,657,176
1975 75 33,409,910 21,463,220 11,946,690 - 5,850,154 6,093,9061976 74 37,980,196 24,149,297 13,830,899 - 6,846,930 6,981,4901977 76 42,403,722 27,121,749 15,281,973 - 7,599,718 7,679,7711978 76 47,819,086 30,685,400 17,133,686 - 8,444,428 8,686,7801979 76 53,035,149 35,067,495 17,967,654 - 8,346,971 9,618,207
1980 75 59,332,580 39,742,640 19,589,940 - 8,828,492 10,758,9671981 77 68,133,171 45,626,311 22,506,860 - 10,200,835 12,265,4691982 78 75,853,402 52,574,733 23,278,669 - 10,854,248 12,419,7761983 78 80,243,637 54,422,054 25,821,583 - 12,430,767 13,388,708
1984 75 69,321,286 45,504,676 23,816,610 - 11,288,529 12,526,0291985 55 73,218,346 48,014,363 25,203,983 - 11,955,753 13,246,2151986 57 76,247,106 50,052,977 26,194,129 - 12,576,377 13,615,8891987 52 76,971,071 51,706,124 25,264,947 - 11,245,688 14,017,443
OtherNumber Total Total Net Operating Net
of Operating Operating Operating Income Operating OperatingYear Carriers Revenues Expenses Revenues and Expense Taxes Income
(7100) (7200)1/
1988 52 $81,170,906 $58,110,431 $23,060,475 $15,378 $8,431,053 $14,644,8001989 51 82,693,554 60,494,285 22,199,269 4,878 8,206,106 13,998,041
1990 51 83,889,631 61,713,449 22,176,182 55,455 8,308,903 13,922,7341991 52 85,505,175 63,444,681 22,060,494 (1,657) 8,453,100 13,605,7371992 54 87,042,492 63,580,541 23,461,951 65,646 9,243,160 14,284,4371993 53 90,206,192 66,495,913 23,710,279 43,025 9,323,827 14,429,4771994 52 92,927,905 70,263,301 22,664,604 (21,345) 9,379,981 13,263,278
1995 53 95,646,207 72,177,953 23,468,254 (30,393) 9,798,872 13,638,9891996 51 100,650,497 73,508,857 27,141,640 65,237 11,427,633 15,779,2441997 51 103,134,290 75,484,924 27,649,366 92,735 11,274,458 16,467,6431998 52 108,315,600 77,799,424 30,516,176 54,830 12,571,596 17,999,4101999 52 113,221,544 79,266,630 33,954,914 77,566 13,850,578 20,181,902
2000 52 116,919,518 81,308,000 35,611,518 68,049 15,189,403 20,490,164
* Beginning in 1984, excludes AT&T Communications and Alascom. See additional notes following Table 4.9.
198
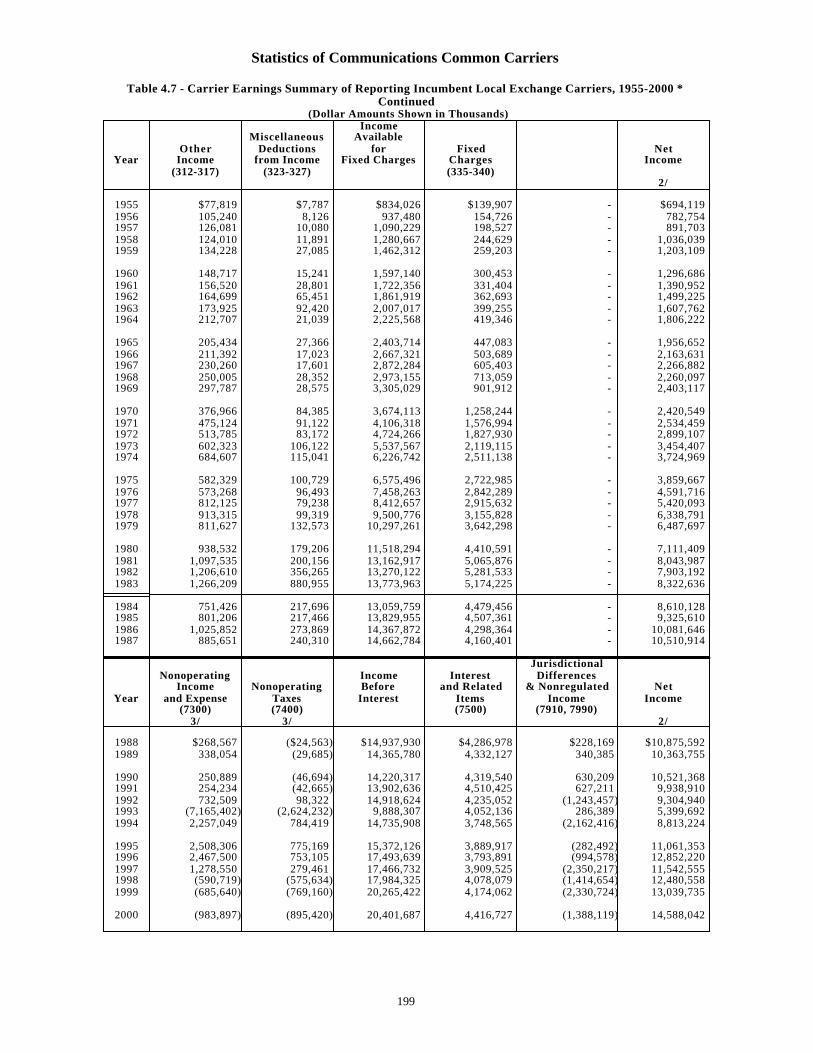
Statistics of Communications Common Carriers
Table 4.7 - Carrier Earnings Summary of Reporting Incumbent Local Exchange Carriers, 1955-2000 *Continued
(Dollar Amounts Shown in Thousands)Income
Miscellaneous AvailableOther Deductions for Fixed Net
Year Income from Income Fixed Charges Charges Income(312-317) (323-327) (335-340)
2/
1955 $77,819 $7,787 $834,026 $139,907 - $694,1191956 105,240 8,126 937,480 154,726 - 782,7541957 126,081 10,080 1,090,229 198,527 - 891,7031958 124,010 11,891 1,280,667 244,629 - 1,036,0391959 134,228 27,085 1,462,312 259,203 - 1,203,109
1960 148,717 15,241 1,597,140 300,453 - 1,296,6861961 156,520 28,801 1,722,356 331,404 - 1,390,9521962 164,699 65,451 1,861,919 362,693 - 1,499,2251963 173,925 92,420 2,007,017 399,255 - 1,607,7621964 212,707 21,039 2,225,568 419,346 - 1,806,222
1965 205,434 27,366 2,403,714 447,083 - 1,956,6521966 211,392 17,023 2,667,321 503,689 - 2,163,6311967 230,260 17,601 2,872,284 605,403 - 2,266,8821968 250,005 28,352 2,973,155 713,059 - 2,260,0971969 297,787 28,575 3,305,029 901,912 - 2,403,117
1970 376,966 84,385 3,674,113 1,258,244 - 2,420,5491971 475,124 91,122 4,106,318 1,576,994 - 2,534,4591972 513,785 83,172 4,724,266 1,827,930 - 2,899,1071973 602,323 106,122 5,537,567 2,119,115 - 3,454,4071974 684,607 115,041 6,226,742 2,511,138 - 3,724,969
1975 582,329 100,729 6,575,496 2,722,985 - 3,859,6671976 573,268 96,493 7,458,263 2,842,289 - 4,591,7161977 812,125 79,238 8,412,657 2,915,632 - 5,420,0931978 913,315 99,319 9,500,776 3,155,828 - 6,338,7911979 811,627 132,573 10,297,261 3,642,298 - 6,487,697
1980 938,532 179,206 11,518,294 4,410,591 - 7,111,4091981 1,097,535 200,156 13,162,917 5,065,876 - 8,043,9871982 1,206,610 356,265 13,270,122 5,281,533 - 7,903,1921983 1,266,209 880,955 13,773,963 5,174,225 - 8,322,636
1984 751,426 217,696 13,059,759 4,479,456 - 8,610,1281985 801,206 217,466 13,829,955 4,507,361 - 9,325,6101986 1,025,852 273,869 14,367,872 4,298,364 - 10,081,6461987 885,651 240,310 14,662,784 4,160,401 - 10,510,914
JurisdictionalNonoperating Income Interest Differences
Income Nonoperating Before and Related & Nonregulated NetYear and Expense Taxes Interest Items Income Income
(7300) (7400) (7500) (7910, 7990)3/ 3/ 2/
1988 $268,567 ($24,563) $14,937,930 $4,286,978 $228,169 $10,875,5921989 338,054 (29,685) 14,365,780 4,332,127 340,385 10,363,755
1990 250,889 (46,694) 14,220,317 4,319,540 630,209 10,521,3681991 254,234 (42,665) 13,902,636 4,510,425 627,211 9,938,9101992 732,509 98,322 14,918,624 4,235,052 (1,243,457) 9,304,9401993 (7,165,402) (2,624,232) 9,888,307 4,052,136 286,389 5,399,6921994 2,257,049 784,419 14,735,908 3,748,565 (2,162,416) 8,813,224
1995 2,508,306 775,169 15,372,126 3,889,917 (282,492) 11,061,3531996 2,467,500 753,105 17,493,639 3,793,891 (994,578) 12,852,2201997 1,278,550 279,461 17,466,732 3,909,525 (2,350,217) 11,542,5551998 (590,719) (575,634) 17,984,325 4,078,079 (1,414,654) 12,480,5581999 (685,640) (769,160) 20,265,422 4,174,062 (2,330,724) 13,039,735
2000 (983,897) (895,420) 20,401,687 4,416,727 (1,388,119) 14,588,042
199
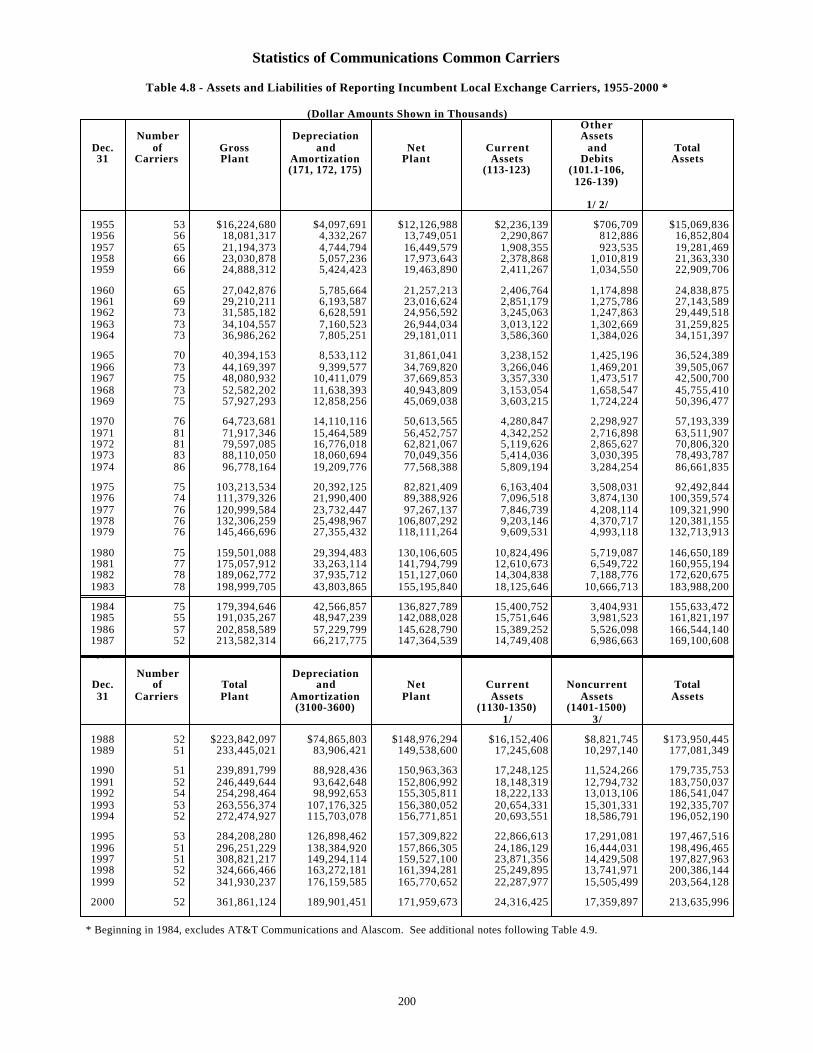
Statistics of Communications Common Carriers
Table 4.8 - Assets and Liabilities of Reporting Incumbent Local Exchange Carriers, 1955-2000 *
(Dollar Amounts Shown in Thousands)Other
Number Depreciation AssetsDec. of Gross and Net Current and Total31 Carriers Plant Amortization Plant Assets Debits Assets
(171, 172, 175) (113-123) (101.1-106,126-139)
1/ 2/
1955 53 $16,224,680 $4,097,691 $12,126,988 $2,236,139 $706,709 $15,069,8361956 56 18,081,317 4,332,267 13,749,051 2,290,867 812,886 16,852,8041957 65 21,194,373 4,744,794 16,449,579 1,908,355 923,535 19,281,4691958 66 23,030,878 5,057,236 17,973,643 2,378,868 1,010,819 21,363,3301959 66 24,888,312 5,424,423 19,463,890 2,411,267 1,034,550 22,909,706
1960 65 27,042,876 5,785,664 21,257,213 2,406,764 1,174,898 24,838,8751961 69 29,210,211 6,193,587 23,016,624 2,851,179 1,275,786 27,143,5891962 73 31,585,182 6,628,591 24,956,592 3,245,063 1,247,863 29,449,5181963 73 34,104,557 7,160,523 26,944,034 3,013,122 1,302,669 31,259,8251964 73 36,986,262 7,805,251 29,181,011 3,586,360 1,384,026 34,151,397
1965 70 40,394,153 8,533,112 31,861,041 3,238,152 1,425,196 36,524,3891966 73 44,169,397 9,399,577 34,769,820 3,266,046 1,469,201 39,505,0671967 75 48,080,932 10,411,079 37,669,853 3,357,330 1,473,517 42,500,7001968 73 52,582,202 11,638,393 40,943,809 3,153,054 1,658,547 45,755,4101969 75 57,927,293 12,858,256 45,069,038 3,603,215 1,724,224 50,396,477
1970 76 64,723,681 14,110,116 50,613,565 4,280,847 2,298,927 57,193,3391971 81 71,917,346 15,464,589 56,452,757 4,342,252 2,716,898 63,511,9071972 81 79,597,085 16,776,018 62,821,067 5,119,626 2,865,627 70,806,3201973 83 88,110,050 18,060,694 70,049,356 5,414,036 3,030,395 78,493,7871974 86 96,778,164 19,209,776 77,568,388 5,809,194 3,284,254 86,661,835
1975 75 103,213,534 20,392,125 82,821,409 6,163,404 3,508,031 92,492,8441976 74 111,379,326 21,990,400 89,388,926 7,096,518 3,874,130 100,359,5741977 76 120,999,584 23,732,447 97,267,137 7,846,739 4,208,114 109,321,9901978 76 132,306,259 25,498,967 106,807,292 9,203,146 4,370,717 120,381,1551979 76 145,466,696 27,355,432 118,111,264 9,609,531 4,993,118 132,713,913
1980 75 159,501,088 29,394,483 130,106,605 10,824,496 5,719,087 146,650,1891981 77 175,057,912 33,263,114 141,794,799 12,610,673 6,549,722 160,955,1941982 78 189,062,772 37,935,712 151,127,060 14,304,838 7,188,776 172,620,6751983 78 198,999,705 43,803,865 155,195,840 18,125,646 10,666,713 183,988,200
1984 75 179,394,646 42,566,857 136,827,789 15,400,752 3,404,931 155,633,4721985 55 191,035,267 48,947,239 142,088,028 15,751,646 3,981,523 161,821,1971986 57 202,858,589 57,229,799 145,628,790 15,389,252 5,526,098 166,544,1401987 52 213,582,314 66,217,775 147,364,539 14,749,408 6,986,663 169,100,608
b'//Number Depreciation
Dec. of Total and Net Current Noncurrent Total31 Carriers Plant Amortization Plant Assets Assets Assets
(3100-3600) (1130-1350) (1401-1500)1/ 3/
1988 52 $223,842,097 $74,865,803 $148,976,294 $16,152,406 $8,821,745 $173,950,4451989 51 233,445,021 83,906,421 149,538,600 17,245,608 10,297,140 177,081,349
1990 51 239,891,799 88,928,436 150,963,363 17,248,125 11,524,266 179,735,7531991 52 246,449,644 93,642,648 152,806,992 18,148,319 12,794,732 183,750,0371992 54 254,298,464 98,992,653 155,305,811 18,222,133 13,013,106 186,541,0471993 53 263,556,374 107,176,325 156,380,052 20,654,331 15,301,331 192,335,7071994 52 272,474,927 115,703,078 156,771,851 20,693,551 18,586,791 196,052,190
1995 53 284,208,280 126,898,462 157,309,822 22,866,613 17,291,081 197,467,5161996 51 296,251,229 138,384,920 157,866,305 24,186,129 16,444,031 198,496,4651997 51 308,821,217 149,294,114 159,527,100 23,871,356 14,429,508 197,827,9631998 52 324,666,466 163,272,181 161,394,281 25,249,895 13,741,971 200,386,1441999 52 341,930,237 176,159,585 165,770,652 22,287,977 15,505,499 203,564,128
2000 52 361,861,124 189,901,451 171,959,673 24,316,425 17,359,897 213,635,996
* Beginning in 1984, excludes AT&T Communications and Alascom. See additional notes following Table 4.9.
200
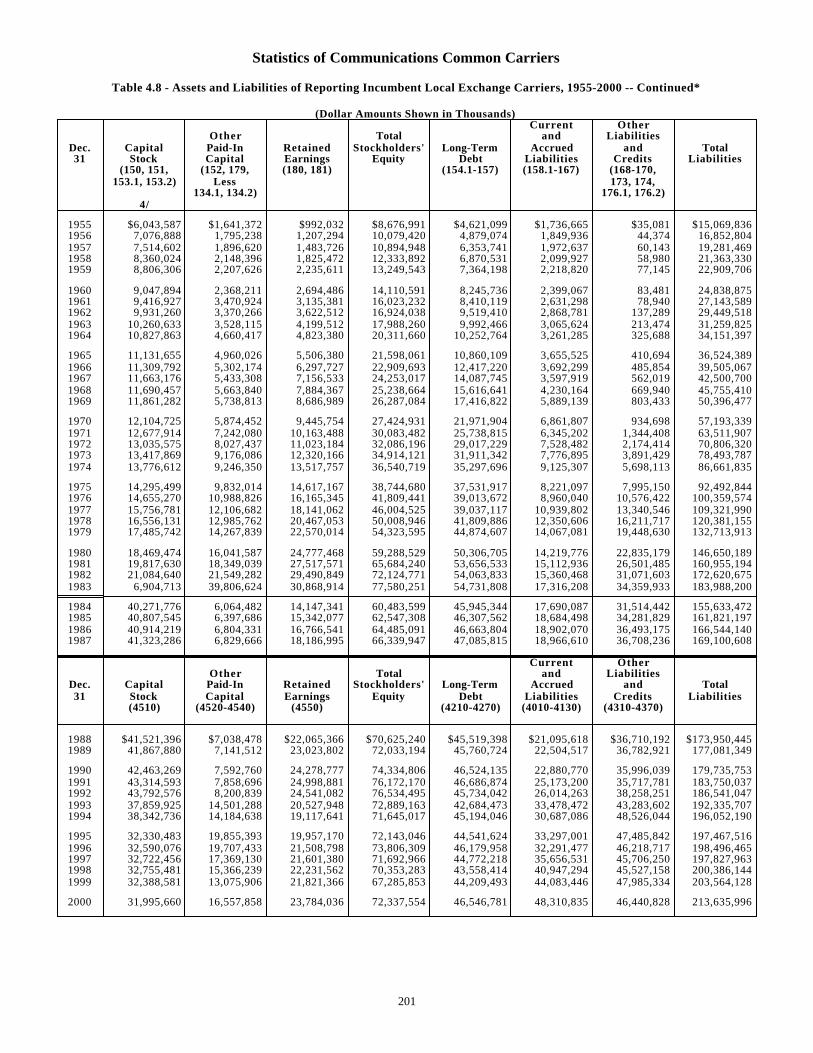
Statistics of Communications Common Carriers
Table 4.8 - Assets and Liabilities of Reporting Incumbent Local Exchange Carriers, 1955-2000 -- Continued*
(Dollar Amounts Shown in Thousands)Current Other
Other Total and LiabilitiesDec. Capital Paid-In Retained Stockholders' Long-Term Accrued and Total31 Stock Capital Earnings Equity Debt Liabilities Credits Liabilities
(150, 151, (152, 179, (180, 181) (154.1-157) (158.1-167) (168-170,153.1, 153.2) Less 173, 174,
134.1, 134.2) 176.1, 176.2)4/
1955 $6,043,587 $1,641,372 $992,032 $8,676,991 $4,621,099 $1,736,665 $35,081 $15,069,8361956 7,076,888 1,795,238 1,207,294 10,079,420 4,879,074 1,849,936 44,374 16,852,8041957 7,514,602 1,896,620 1,483,726 10,894,948 6,353,741 1,972,637 60,143 19,281,4691958 8,360,024 2,148,396 1,825,472 12,333,892 6,870,531 2,099,927 58,980 21,363,3301959 8,806,306 2,207,626 2,235,611 13,249,543 7,364,198 2,218,820 77,145 22,909,706
1960 9,047,894 2,368,211 2,694,486 14,110,591 8,245,736 2,399,067 83,481 24,838,8751961 9,416,927 3,470,924 3,135,381 16,023,232 8,410,119 2,631,298 78,940 27,143,5891962 9,931,260 3,370,266 3,622,512 16,924,038 9,519,410 2,868,781 137,289 29,449,5181963 10,260,633 3,528,115 4,199,512 17,988,260 9,992,466 3,065,624 213,474 31,259,8251964 10,827,863 4,660,417 4,823,380 20,311,660 10,252,764 3,261,285 325,688 34,151,397
1965 11,131,655 4,960,026 5,506,380 21,598,061 10,860,109 3,655,525 410,694 36,524,3891966 11,309,792 5,302,174 6,297,727 22,909,693 12,417,220 3,692,299 485,854 39,505,0671967 11,663,176 5,433,308 7,156,533 24,253,017 14,087,745 3,597,919 562,019 42,500,7001968 11,690,457 5,663,840 7,884,367 25,238,664 15,616,641 4,230,164 669,940 45,755,4101969 11,861,282 5,738,813 8,686,989 26,287,084 17,416,822 5,889,139 803,433 50,396,477
1970 12,104,725 5,874,452 9,445,754 27,424,931 21,971,904 6,861,807 934,698 57,193,3391971 12,677,914 7,242,080 10,163,488 30,083,482 25,738,815 6,345,202 1,344,408 63,511,9071972 13,035,575 8,027,437 11,023,184 32,086,196 29,017,229 7,528,482 2,174,414 70,806,3201973 13,417,869 9,176,086 12,320,166 34,914,121 31,911,342 7,776,895 3,891,429 78,493,7871974 13,776,612 9,246,350 13,517,757 36,540,719 35,297,696 9,125,307 5,698,113 86,661,835
1975 14,295,499 9,832,014 14,617,167 38,744,680 37,531,917 8,221,097 7,995,150 92,492,8441976 14,655,270 10,988,826 16,165,345 41,809,441 39,013,672 8,960,040 10,576,422 100,359,5741977 15,756,781 12,106,682 18,141,062 46,004,525 39,037,117 10,939,802 13,340,546 109,321,9901978 16,556,131 12,985,762 20,467,053 50,008,946 41,809,886 12,350,606 16,211,717 120,381,1551979 17,485,742 14,267,839 22,570,014 54,323,595 44,874,607 14,067,081 19,448,630 132,713,913
1980 18,469,474 16,041,587 24,777,468 59,288,529 50,306,705 14,219,776 22,835,179 146,650,1891981 19,817,630 18,349,039 27,517,571 65,684,240 53,656,533 15,112,936 26,501,485 160,955,1941982 21,084,640 21,549,282 29,490,849 72,124,771 54,063,833 15,360,468 31,071,603 172,620,6751983 6,904,713 39,806,624 30,868,914 77,580,251 54,731,808 17,316,208 34,359,933 183,988,200
1984 40,271,776 6,064,482 14,147,341 60,483,599 45,945,344 17,690,087 31,514,442 155,633,4721985 40,807,545 6,397,686 15,342,077 62,547,308 46,307,562 18,684,498 34,281,829 161,821,1971986 40,914,219 6,804,331 16,766,541 64,485,091 46,663,804 18,902,070 36,493,175 166,544,1401987 41,323,286 6,829,666 18,186,995 66,339,947 47,085,815 18,966,610 36,708,236 169,100,608
Current OtherOther Total and Liabilities
Dec. Capital Paid-In Retained Stockholders' Long-Term Accrued and Total31 Stock Capital Earnings Equity Debt Liabilities Credits Liabilities
(4510) (4520-4540) (4550) (4210-4270) (4010-4130) (4310-4370)
1988 $41,521,396 $7,038,478 $22,065,366 $70,625,240 $45,519,398 $21,095,618 $36,710,192 $173,950,4451989 41,867,880 7,141,512 23,023,802 72,033,194 45,760,724 22,504,517 36,782,921 177,081,349
1990 42,463,269 7,592,760 24,278,777 74,334,806 46,524,135 22,880,770 35,996,039 179,735,7531991 43,314,593 7,858,696 24,998,881 76,172,170 46,686,874 25,173,200 35,717,781 183,750,0371992 43,792,576 8,200,839 24,541,082 76,534,495 45,734,042 26,014,263 38,258,251 186,541,0471993 37,859,925 14,501,288 20,527,948 72,889,163 42,684,473 33,478,472 43,283,602 192,335,7071994 38,342,736 14,184,638 19,117,641 71,645,017 45,194,046 30,687,086 48,526,044 196,052,190
1995 32,330,483 19,855,393 19,957,170 72,143,046 44,541,624 33,297,001 47,485,842 197,467,5161996 32,590,076 19,707,433 21,508,798 73,806,309 46,179,958 32,291,477 46,218,717 198,496,4651997 32,722,456 17,369,130 21,601,380 71,692,966 44,772,218 35,656,531 45,706,250 197,827,9631998 32,755,481 15,366,239 22,231,562 70,353,283 43,558,414 40,947,294 45,527,158 200,386,1441999 32,388,581 13,075,906 21,821,366 67,285,853 44,209,493 44,083,446 47,985,334 203,564,128
2000 31,995,660 16,557,858 23,784,036 72,337,554 46,546,781 48,310,835 46,440,828 213,635,996
201
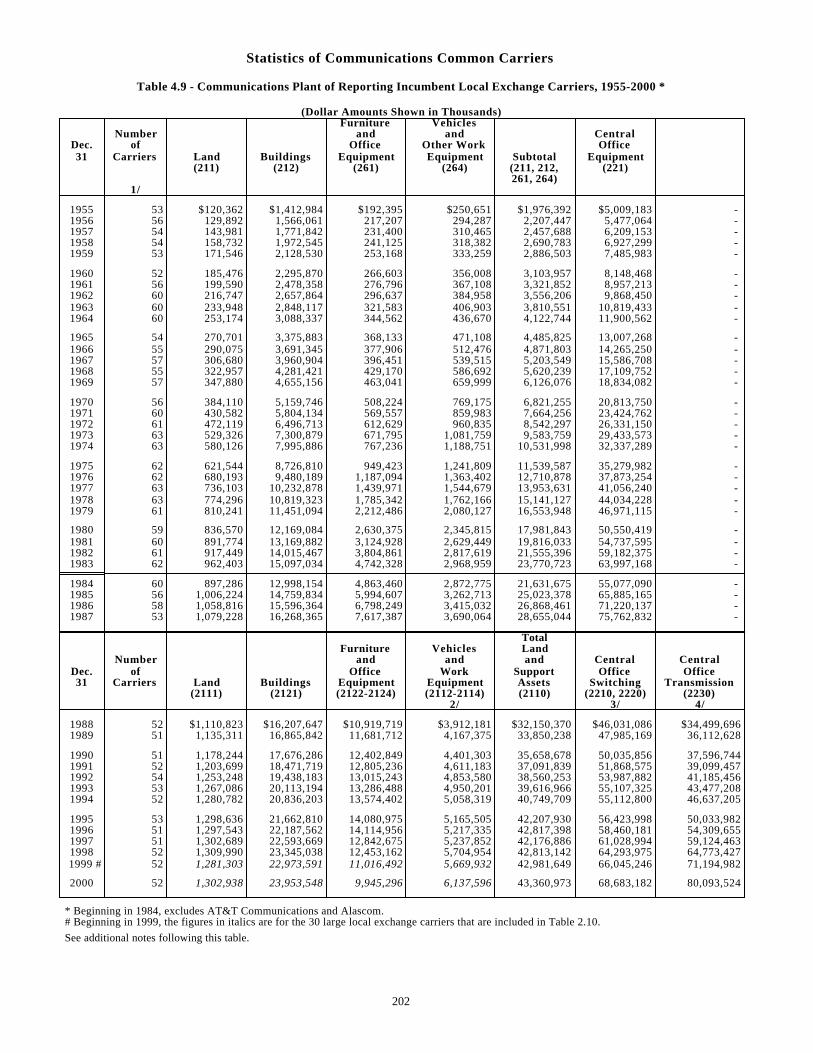
Statistics of Communications Common Carriers
Table 4.9 - Communications Plant of Reporting Incumbent Local Exchange Carriers, 1955-2000 *
(Dollar Amounts Shown in Thousands)Furniture Vehicles
Number and and CentralDec. of Office Other Work Office31 Carriers Land Buildings Equipment Equipment Subtotal Equipment
(211) (212) (261) (264) (211, 212, (221)261, 264)
1/
1955 53 $120,362 $1,412,984 $192,395 $250,651 $1,976,392 $5,009,183 - 1956 56 129,892 1,566,061 217,207 294,287 2,207,447 5,477,064 - 1957 54 143,981 1,771,842 231,400 310,465 2,457,688 6,209,153 - 1958 54 158,732 1,972,545 241,125 318,382 2,690,783 6,927,299 - 1959 53 171,546 2,128,530 253,168 333,259 2,886,503 7,485,983 -
1960 52 185,476 2,295,870 266,603 356,008 3,103,957 8,148,468 - 1961 56 199,590 2,478,358 276,796 367,108 3,321,852 8,957,213 - 1962 60 216,747 2,657,864 296,637 384,958 3,556,206 9,868,450 - 1963 60 233,948 2,848,117 321,583 406,903 3,810,551 10,819,433 - 1964 60 253,174 3,088,337 344,562 436,670 4,122,744 11,900,562 -
1965 54 270,701 3,375,883 368,133 471,108 4,485,825 13,007,268 - 1966 55 290,075 3,691,345 377,906 512,476 4,871,803 14,265,250 - 1967 57 306,680 3,960,904 396,451 539,515 5,203,549 15,586,708 - 1968 55 322,957 4,281,421 429,170 586,692 5,620,239 17,109,752 - 1969 57 347,880 4,655,156 463,041 659,999 6,126,076 18,834,082 -
1970 56 384,110 5,159,746 508,224 769,175 6,821,255 20,813,750 - 1971 60 430,582 5,804,134 569,557 859,983 7,664,256 23,424,762 - 1972 61 472,119 6,496,713 612,629 960,835 8,542,297 26,331,150 - 1973 63 529,326 7,300,879 671,795 1,081,759 9,583,759 29,433,573 - 1974 63 580,126 7,995,886 767,236 1,188,751 10,531,998 32,337,289 -
1975 62 621,544 8,726,810 949,423 1,241,809 11,539,587 35,279,982 - 1976 62 680,193 9,480,189 1,187,094 1,363,402 12,710,878 37,873,254 - 1977 63 736,103 10,232,878 1,439,971 1,544,679 13,953,631 41,056,240 - 1978 63 774,296 10,819,323 1,785,342 1,762,166 15,141,127 44,034,228 - 1979 61 810,241 11,451,094 2,212,486 2,080,127 16,553,948 46,971,115 -
1980 59 836,570 12,169,084 2,630,375 2,345,815 17,981,843 50,550,419 - 1981 60 891,774 13,169,882 3,124,928 2,629,449 19,816,033 54,737,595 - 1982 61 917,449 14,015,467 3,804,861 2,817,619 21,555,396 59,182,375 - 1983 62 962,403 15,097,034 4,742,328 2,968,959 23,770,723 63,997,168 -
1984 60 897,286 12,998,154 4,863,460 2,872,775 21,631,675 55,077,090 - 1985 56 1,006,224 14,759,834 5,994,607 3,262,713 25,023,378 65,885,165 - 1986 58 1,058,816 15,596,364 6,798,249 3,415,032 26,868,461 71,220,137 - 1987 53 1,079,228 16,268,365 7,617,387 3,690,064 28,655,044 75,762,832 -
TotalFurniture Vehicles Land
Number and and and Central CentralDec. of Office Work Support Office Office31 Carriers Land Buildings Equipment Equipment Assets Switching Transmission
(2111) (2121) (2122-2124) (2112-2114) (2110) (2210, 2220) (2230)2/ 3/ 4/
1988 52 $1,110,823 $16,207,647 $10,919,719 $3,912,181 $32,150,370 $46,031,086 $34,499,6961989 51 1,135,311 16,865,842 11,681,712 4,167,375 33,850,238 47,985,169 36,112,628
1990 51 1,178,244 17,676,286 12,402,849 4,401,303 35,658,678 50,035,856 37,596,7441991 52 1,203,699 18,471,719 12,805,236 4,611,183 37,091,839 51,868,575 39,099,4571992 54 1,253,248 19,438,183 13,015,243 4,853,580 38,560,253 53,987,882 41,185,4561993 53 1,267,086 20,113,194 13,286,488 4,950,201 39,616,966 55,107,325 43,477,2081994 52 1,280,782 20,836,203 13,574,402 5,058,319 40,749,709 55,112,800 46,637,205
1995 53 1,298,636 21,662,810 14,080,975 5,165,505 42,207,930 56,423,998 50,033,9821996 51 1,297,543 22,187,562 14,114,956 5,217,335 42,817,398 58,460,181 54,309,6551997 51 1,302,689 22,593,669 12,842,675 5,237,852 42,176,886 61,028,994 59,124,4631998 52 1,309,990 23,345,038 12,453,162 5,704,954 42,813,142 64,293,975 64,773,4271999 # 52 1,281,303 22,973,591 11,016,492 5,669,932 42,981,649 66,045,246 71,194,982
2000 52 1,302,938 23,953,548 9,945,296 6,137,596 43,360,973 68,683,182 80,093,524
* Beginning in 1984, excludes AT&T Communications and Alascom. # Beginning in 1999, the figures in italics are for the 30 large local exchange carriers that are included in Table 2.10.
See additional notes following this table.
202
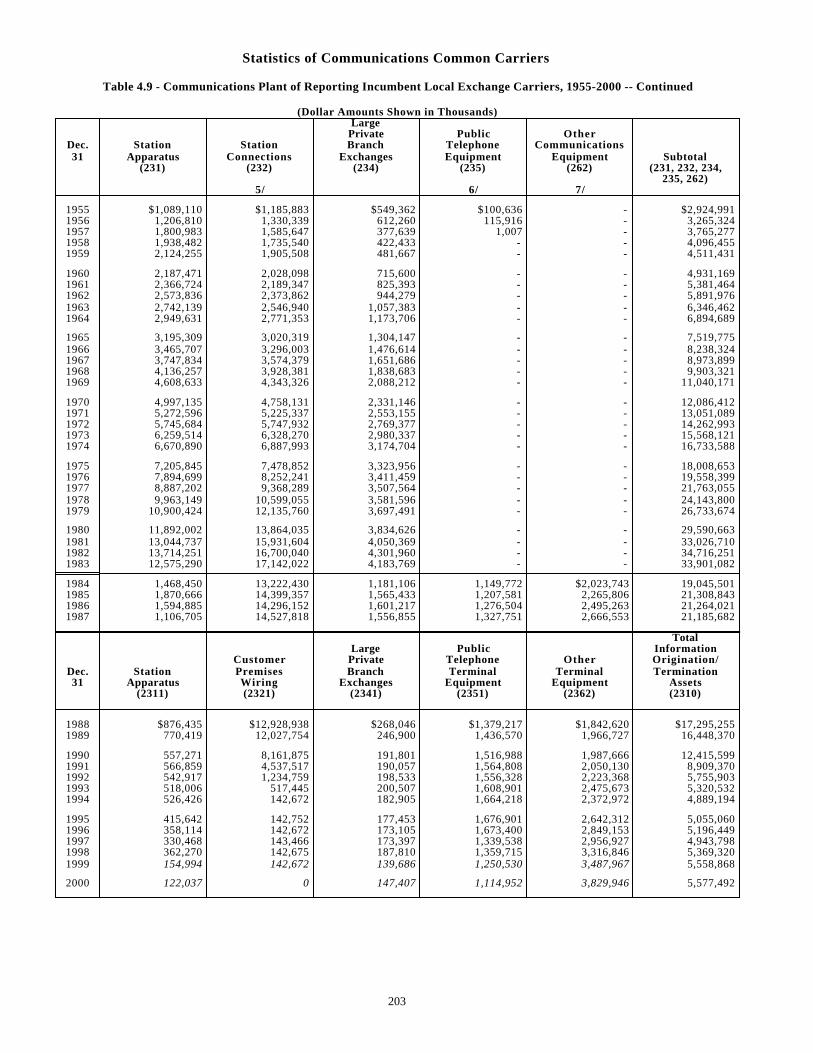
Statistics of Communications Common Carriers
Table 4.9 - Communications Plant of Reporting Incumbent Local Exchange Carriers, 1955-2000 -- Continued
(Dollar Amounts Shown in Thousands)Large
Private Public OtherDec. Station Station Branch Telephone Communications31 Apparatus Connections Exchanges Equipment Equipment Subtotal
(231) (232) (234) (235) (262) (231, 232, 234,235, 262)
5/ 6/ 7/
1955 $1,089,110 $1,185,883 $549,362 $100,636 - $2,924,9911956 1,206,810 1,330,339 612,260 115,916 - 3,265,3241957 1,800,983 1,585,647 377,639 1,007 - 3,765,2771958 1,938,482 1,735,540 422,433 - - 4,096,4551959 2,124,255 1,905,508 481,667 - - 4,511,431
1960 2,187,471 2,028,098 715,600 - - 4,931,1691961 2,366,724 2,189,347 825,393 - - 5,381,4641962 2,573,836 2,373,862 944,279 - - 5,891,9761963 2,742,139 2,546,940 1,057,383 - - 6,346,4621964 2,949,631 2,771,353 1,173,706 - - 6,894,689
1965 3,195,309 3,020,319 1,304,147 - - 7,519,7751966 3,465,707 3,296,003 1,476,614 - - 8,238,3241967 3,747,834 3,574,379 1,651,686 - - 8,973,8991968 4,136,257 3,928,381 1,838,683 - - 9,903,3211969 4,608,633 4,343,326 2,088,212 - - 11,040,171
1970 4,997,135 4,758,131 2,331,146 - - 12,086,4121971 5,272,596 5,225,337 2,553,155 - - 13,051,0891972 5,745,684 5,747,932 2,769,377 - - 14,262,9931973 6,259,514 6,328,270 2,980,337 - - 15,568,1211974 6,670,890 6,887,993 3,174,704 - - 16,733,588
1975 7,205,845 7,478,852 3,323,956 - - 18,008,6531976 7,894,699 8,252,241 3,411,459 - - 19,558,3991977 8,887,202 9,368,289 3,507,564 - - 21,763,0551978 9,963,149 10,599,055 3,581,596 - - 24,143,8001979 10,900,424 12,135,760 3,697,491 - - 26,733,674
1980 11,892,002 13,864,035 3,834,626 - - 29,590,6631981 13,044,737 15,931,604 4,050,369 - - 33,026,7101982 13,714,251 16,700,040 4,301,960 - - 34,716,2511983 12,575,290 17,142,022 4,183,769 - - 33,901,082
1984 1,468,450 13,222,430 1,181,106 1,149,772 $2,023,743 19,045,5011985 1,870,666 14,399,357 1,565,433 1,207,581 2,265,806 21,308,8431986 1,594,885 14,296,152 1,601,217 1,276,504 2,495,263 21,264,0211987 1,106,705 14,527,818 1,556,855 1,327,751 2,666,553 21,185,682
TotalLarge Public Information
Customer Private Telephone Other Origination/Dec. Station Premises Branch Terminal Terminal Termination31 Apparatus Wiring Exchanges Equipment Equipment Assets
(2311) (2321) (2341) (2351) (2362) (2310)
1988 $876,435 $12,928,938 $268,046 $1,379,217 $1,842,620 $17,295,2551989 770,419 12,027,754 246,900 1,436,570 1,966,727 16,448,370
1990 557,271 8,161,875 191,801 1,516,988 1,987,666 12,415,5991991 566,859 4,537,517 190,057 1,564,808 2,050,130 8,909,3701992 542,917 1,234,759 198,533 1,556,328 2,223,368 5,755,9031993 518,006 517,445 200,507 1,608,901 2,475,673 5,320,5321994 526,426 142,672 182,905 1,664,218 2,372,972 4,889,194
1995 415,642 142,752 177,453 1,676,901 2,642,312 5,055,0601996 358,114 142,672 173,105 1,673,400 2,849,153 5,196,4491997 330,468 143,466 173,397 1,339,538 2,956,927 4,943,7981998 362,270 142,675 187,810 1,359,715 3,316,846 5,369,3201999 154,994 142,672 139,686 1,250,530 3,487,967 5,558,868
2000 122,037 0 147,407 1,114,952 3,829,946 5,577,492
203
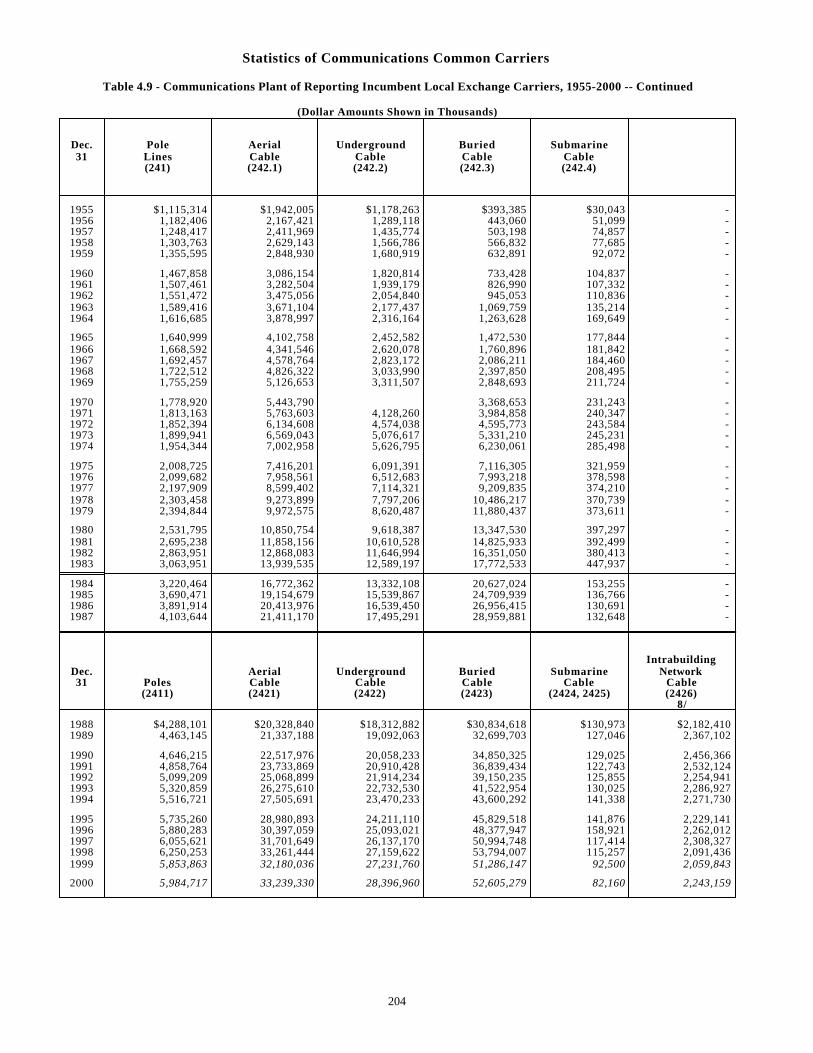
Statistics of Communications Common Carriers
Table 4.9 - Communications Plant of Reporting Incumbent Local Exchange Carriers, 1955-2000 -- Continued
(Dollar Amounts Shown in Thousands)
Dec. Pole Aerial Underground Buried Submarine31 Lines Cable Cable Cable Cable
(241) (242.1) (242.2) (242.3) (242.4)
1955 $1,115,314 $1,942,005 $1,178,263 $393,385 $30,043 - 1956 1,182,406 2,167,421 1,289,118 443,060 51,099 - 1957 1,248,417 2,411,969 1,435,774 503,198 74,857 - 1958 1,303,763 2,629,143 1,566,786 566,832 77,685 - 1959 1,355,595 2,848,930 1,680,919 632,891 92,072 -
1960 1,467,858 3,086,154 1,820,814 733,428 104,837 - 1961 1,507,461 3,282,504 1,939,179 826,990 107,332 - 1962 1,551,472 3,475,056 2,054,840 945,053 110,836 - 1963 1,589,416 3,671,104 2,177,437 1,069,759 135,214 - 1964 1,616,685 3,878,997 2,316,164 1,263,628 169,649 -
1965 1,640,999 4,102,758 2,452,582 1,472,530 177,844 - 1966 1,668,592 4,341,546 2,620,078 1,760,896 181,842 - 1967 1,692,457 4,578,764 2,823,172 2,086,211 184,460 - 1968 1,722,512 4,826,322 3,033,990 2,397,850 208,495 - 1969 1,755,259 5,126,653 3,311,507 2,848,693 211,724 -
1970 1,778,920 5,443,790 3,368,653 231,243 - 1971 1,813,163 5,763,603 4,128,260 3,984,858 240,347 - 1972 1,852,394 6,134,608 4,574,038 4,595,773 243,584 - 1973 1,899,941 6,569,043 5,076,617 5,331,210 245,231 - 1974 1,954,344 7,002,958 5,626,795 6,230,061 285,498 -
1975 2,008,725 7,416,201 6,091,391 7,116,305 321,959 - 1976 2,099,682 7,958,561 6,512,683 7,993,218 378,598 - 1977 2,197,909 8,599,402 7,114,321 9,209,835 374,210 - 1978 2,303,458 9,273,899 7,797,206 10,486,217 370,739 - 1979 2,394,844 9,972,575 8,620,487 11,880,437 373,611 -
1980 2,531,795 10,850,754 9,618,387 13,347,530 397,297 - 1981 2,695,238 11,858,156 10,610,528 14,825,933 392,499 - 1982 2,863,951 12,868,083 11,646,994 16,351,050 380,413 - 1983 3,063,951 13,939,535 12,589,197 17,772,533 447,937 -
1984 3,220,464 16,772,362 13,332,108 20,627,024 153,255 - 1985 3,690,471 19,154,679 15,539,867 24,709,939 136,766 - 1986 3,891,914 20,413,976 16,539,450 26,956,415 130,691 - 1987 4,103,644 21,411,170 17,495,291 28,959,881 132,648 -
IntrabuildingDec. Aerial Underground Buried Submarine Network31 Poles Cable Cable Cable Cable Cable
(2411) (2421) (2422) (2423) (2424, 2425) (2426)8/
1988 $4,288,101 $20,328,840 $18,312,882 $30,834,618 $130,973 $2,182,4101989 4,463,145 21,337,188 19,092,063 32,699,703 127,046 2,367,102
1990 4,646,215 22,517,976 20,058,233 34,850,325 129,025 2,456,3661991 4,858,764 23,733,869 20,910,428 36,839,434 122,743 2,532,1241992 5,099,209 25,068,899 21,914,234 39,150,235 125,855 2,254,9411993 5,320,859 26,275,610 22,732,530 41,522,954 130,025 2,286,9271994 5,516,721 27,505,691 23,470,233 43,600,292 141,338 2,271,730
1995 5,735,260 28,980,893 24,211,110 45,829,518 141,876 2,229,1411996 5,880,283 30,397,059 25,093,021 48,377,947 158,921 2,262,0121997 6,055,621 31,701,649 26,137,170 50,994,748 117,414 2,308,3271998 6,250,253 33,261,444 27,159,622 53,794,007 115,257 2,091,4361999 5,853,863 32,180,036 27,231,760 51,286,147 92,500 2,059,843
2000 5,984,717 33,239,330 28,396,960 52,605,279 82,160 2,243,159
204
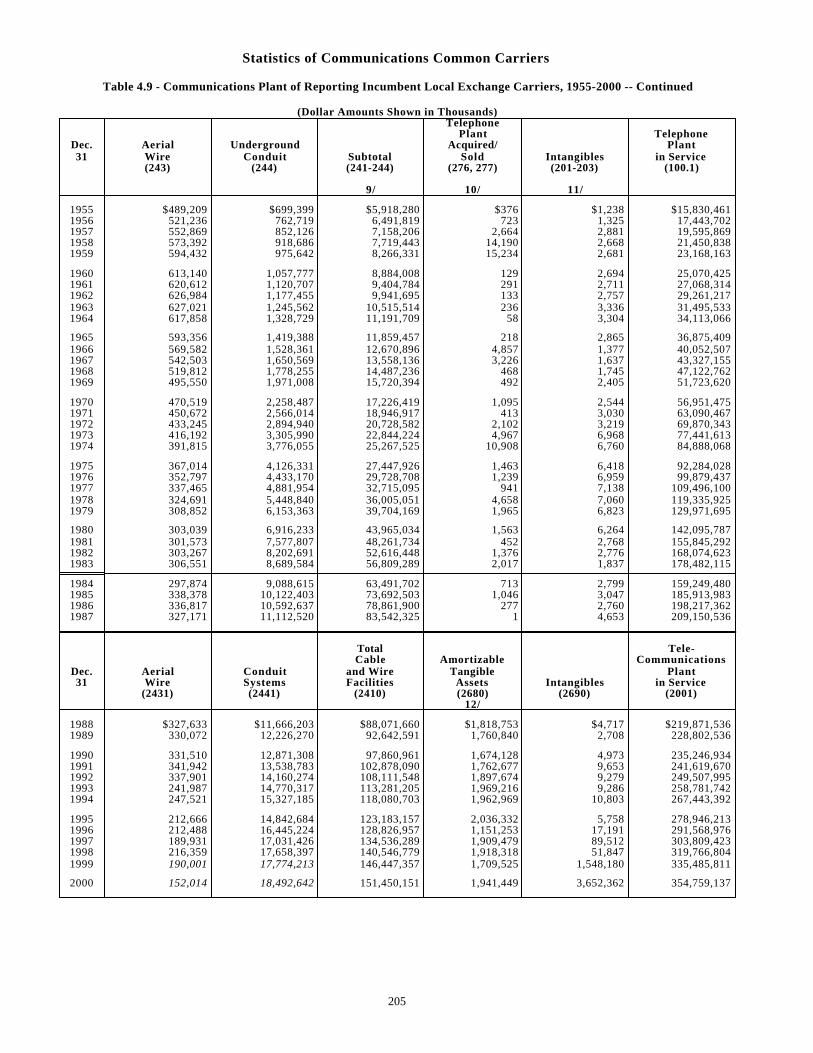
Statistics of Communications Common Carriers
Table 4.9 - Communications Plant of Reporting Incumbent Local Exchange Carriers, 1955-2000 -- Continued
(Dollar Amounts Shown in Thousands)Telephone
Plant TelephoneDec. Aerial Underground Acquired/ Plant31 Wire Conduit Subtotal Sold Intangibles in Service
(243) (244) (241-244) (276, 277) (201-203) (100.1)
9/ 10/ 11/
1955 $489,209 $699,399 $5,918,280 $376 $1,238 $15,830,4611956 521,236 762,719 6,491,819 723 1,325 17,443,7021957 552,869 852,126 7,158,206 2,664 2,881 19,595,8691958 573,392 918,686 7,719,443 14,190 2,668 21,450,8381959 594,432 975,642 8,266,331 15,234 2,681 23,168,163
1960 613,140 1,057,777 8,884,008 129 2,694 25,070,4251961 620,612 1,120,707 9,404,784 291 2,711 27,068,3141962 626,984 1,177,455 9,941,695 133 2,757 29,261,2171963 627,021 1,245,562 10,515,514 236 3,336 31,495,5331964 617,858 1,328,729 11,191,709 58 3,304 34,113,066
1965 593,356 1,419,388 11,859,457 218 2,865 36,875,4091966 569,582 1,528,361 12,670,896 4,857 1,377 40,052,5071967 542,503 1,650,569 13,558,136 3,226 1,637 43,327,1551968 519,812 1,778,255 14,487,236 468 1,745 47,122,7621969 495,550 1,971,008 15,720,394 492 2,405 51,723,620
1970 470,519 2,258,487 17,226,419 1,095 2,544 56,951,4751971 450,672 2,566,014 18,946,917 413 3,030 63,090,4671972 433,245 2,894,940 20,728,582 2,102 3,219 69,870,3431973 416,192 3,305,990 22,844,224 4,967 6,968 77,441,6131974 391,815 3,776,055 25,267,525 10,908 6,760 84,888,068
1975 367,014 4,126,331 27,447,926 1,463 6,418 92,284,0281976 352,797 4,433,170 29,728,708 1,239 6,959 99,879,4371977 337,465 4,881,954 32,715,095 941 7,138 109,496,1001978 324,691 5,448,840 36,005,051 4,658 7,060 119,335,9251979 308,852 6,153,363 39,704,169 1,965 6,823 129,971,695
1980 303,039 6,916,233 43,965,034 1,563 6,264 142,095,7871981 301,573 7,577,807 48,261,734 452 2,768 155,845,2921982 303,267 8,202,691 52,616,448 1,376 2,776 168,074,6231983 306,551 8,689,584 56,809,289 2,017 1,837 178,482,115
1984 297,874 9,088,615 63,491,702 713 2,799 159,249,4801985 338,378 10,122,403 73,692,503 1,046 3,047 185,913,9831986 336,817 10,592,637 78,861,900 277 2,760 198,217,3621987 327,171 11,112,520 83,542,325 1 4,653 209,150,536
Total Tele-Cable Amortizable Communications
Dec. Aerial Conduit and Wire Tangible Plant31 Wire Systems Facilities Assets Intangibles in Service
(2431) (2441) (2410) (2680) (2690) (2001)12/
1988 $327,633 $11,666,203 $88,071,660 $1,818,753 $4,717 $219,871,5361989 330,072 12,226,270 92,642,591 1,760,840 2,708 228,802,536
1990 331,510 12,871,308 97,860,961 1,674,128 4,973 235,246,9341991 341,942 13,538,783 102,878,090 1,762,677 9,653 241,619,6701992 337,901 14,160,274 108,111,548 1,897,674 9,279 249,507,9951993 241,987 14,770,317 113,281,205 1,969,216 9,286 258,781,7421994 247,521 15,327,185 118,080,703 1,962,969 10,803 267,443,392
1995 212,666 14,842,684 123,183,157 2,036,332 5,758 278,946,2131996 212,488 16,445,224 128,826,957 1,151,253 17,191 291,568,9761997 189,931 17,031,426 134,536,289 1,909,479 89,512 303,809,4231998 216,359 17,658,397 140,546,779 1,918,318 51,847 319,766,8041999 190,001 17,774,213 146,447,357 1,709,525 1,548,180 335,485,811
2000 152,014 18,492,642 151,450,151 1,941,449 3,652,362 354,759,137
205
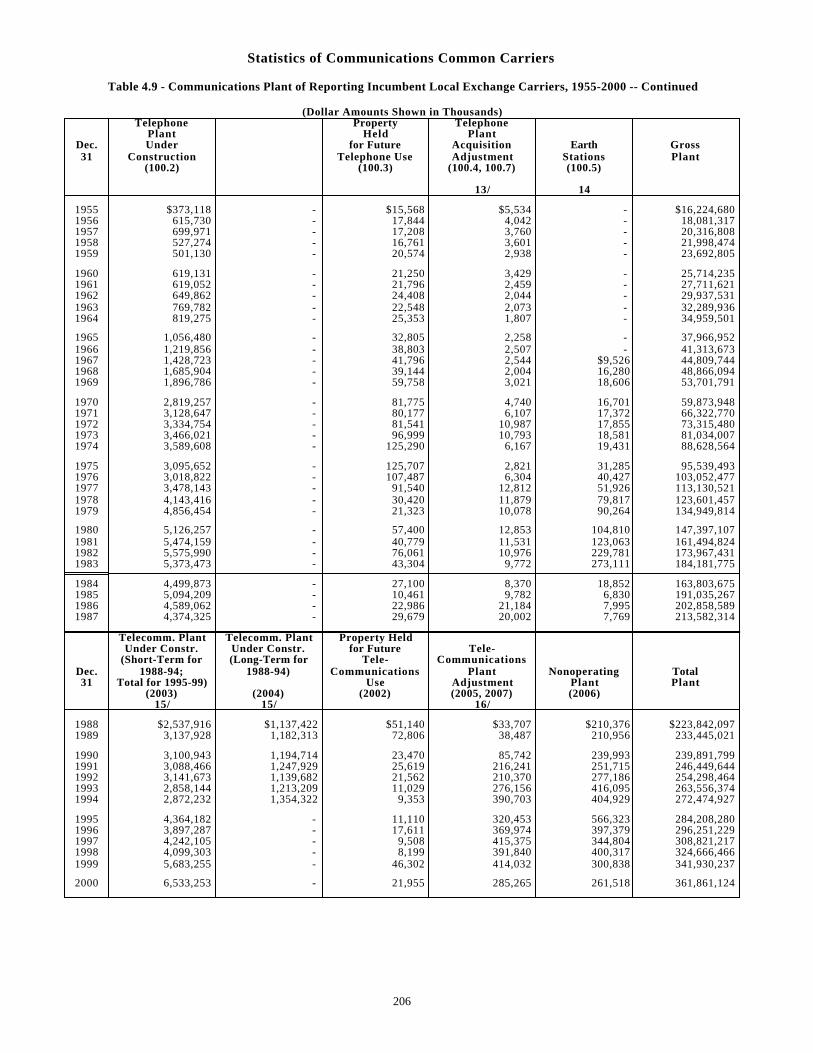
Statistics of Communications Common Carriers
Table 4.9 - Communications Plant of Reporting Incumbent Local Exchange Carriers, 1955-2000 -- Continued
(Dollar Amounts Shown in Thousands)Telephone Property Telephone
Plant Held PlantDec. Under for Future Acquisition Earth Gross31 Construction Telephone Use Adjustment Stations Plant
(100.2) (100.3) (100.4, 100.7) (100.5)
13/ 14
1955 $373,118 - $15,568 $5,534 - $16,224,6801956 615,730 - 17,844 4,042 - 18,081,3171957 699,971 - 17,208 3,760 - 20,316,8081958 527,274 - 16,761 3,601 - 21,998,4741959 501,130 - 20,574 2,938 - 23,692,805
1960 619,131 - 21,250 3,429 - 25,714,2351961 619,052 - 21,796 2,459 - 27,711,6211962 649,862 - 24,408 2,044 - 29,937,5311963 769,782 - 22,548 2,073 - 32,289,9361964 819,275 - 25,353 1,807 - 34,959,501
1965 1,056,480 - 32,805 2,258 - 37,966,9521966 1,219,856 - 38,803 2,507 - 41,313,6731967 1,428,723 - 41,796 2,544 $9,526 44,809,7441968 1,685,904 - 39,144 2,004 16,280 48,866,0941969 1,896,786 - 59,758 3,021 18,606 53,701,791
1970 2,819,257 - 81,775 4,740 16,701 59,873,9481971 3,128,647 - 80,177 6,107 17,372 66,322,7701972 3,334,754 - 81,541 10,987 17,855 73,315,4801973 3,466,021 - 96,999 10,793 18,581 81,034,0071974 3,589,608 - 125,290 6,167 19,431 88,628,564
1975 3,095,652 - 125,707 2,821 31,285 95,539,4931976 3,018,822 - 107,487 6,304 40,427 103,052,4771977 3,478,143 - 91,540 12,812 51,926 113,130,5211978 4,143,416 - 30,420 11,879 79,817 123,601,4571979 4,856,454 - 21,323 10,078 90,264 134,949,814
1980 5,126,257 - 57,400 12,853 104,810 147,397,1071981 5,474,159 - 40,779 11,531 123,063 161,494,8241982 5,575,990 - 76,061 10,976 229,781 173,967,4311983 5,373,473 - 43,304 9,772 273,111 184,181,775
1984 4,499,873 - 27,100 8,370 18,852 163,803,6751985 5,094,209 - 10,461 9,782 6,830 191,035,2671986 4,589,062 - 22,986 21,184 7,995 202,858,5891987 4,374,325 - 29,679 20,002 7,769 213,582,314
Telecomm. Plant Telecomm. Plant Property HeldUnder Constr. Under Constr. for Future Tele-
(Short-Term for (Long-Term for Tele- CommunicationsDec. 1988-94; 1988-94) Communications Plant Nonoperating Total31 Total for 1995-99) Use Adjustment Plant Plant
(2003) (2004) (2002) (2005, 2007) (2006)15/ 15/ 16/
1988 $2,537,916 $1,137,422 $51,140 $33,707 $210,376 $223,842,0971989 3,137,928 1,182,313 72,806 38,487 210,956 233,445,021
1990 3,100,943 1,194,714 23,470 85,742 239,993 239,891,7991991 3,088,466 1,247,929 25,619 216,241 251,715 246,449,6441992 3,141,673 1,139,682 21,562 210,370 277,186 254,298,4641993 2,858,144 1,213,209 11,029 276,156 416,095 263,556,3741994 2,872,232 1,354,322 9,353 390,703 404,929 272,474,927
1995 4,364,182 - 11,110 320,453 566,323 284,208,2801996 3,897,287 - 17,611 369,974 397,379 296,251,2291997 4,242,105 - 9,508 415,375 344,804 308,821,2171998 4,099,303 - 8,199 391,840 400,317 324,666,4661999 5,683,255 - 46,302 414,032 300,838 341,930,237
2000 6,533,253 - 21,955 285,265 261,518 361,861,124
206
Statistics of Communications Common Carriers
Notes to Tables 4.1 through 4.9
The historical data presented in these tables were compiled from previous editions of Statistics of Communi-cations Common Carriers (SOCC), formerly known as Statistics of the Communications Industry in the United States. For the most part, the original data were gathered from the annual reports of Class A telephone carriersand, beginning in 1957, include the voluntary submissions of selected large telephone companies not subject to theCommission's reporting requirements. The 1950 data include information submitted by Class B carriers, which aresmaller companies that have less detailed accounting requirements than Class A carriers.
Over the years, the number of carriers reporting to the Commission has varied because of mergers, carrierreclassification, and changes in the reporting criteria. In 1985, the annual operating revenue requirement for tele-phone carrier reporting was changed from $1 million to $100 million. As a result, twenty-one companies that hadfiled a report for 1984 were relieved of this requirement the following year. These carriers accounted for about $440million in total operating revenues in 1984, with two-thirds of them reporting less than $20 million.
On Jan. 1, 1988, a revised Uniform System of Accounts (USOA) went into effect. As a result of these revisions,data submitted under the new rules may not be comparable on a one-to-one basis with data filed for previous years.In these tables, USOA account numbers are given for each column heading (where applicable). The three-digitnumbers refer to Part 31 of the Commission's rules, whereas those with four digits refer to Part 32, the revised USOAthat superseded Part 31.
In the 1995/96 edition of this publication, the 1995 data did not include AT&T Communications or Alascomwhich had been acquired by AT&T Corp.) because the detailed reporting requirements for these carriers were elimi-nated after the Commission had decided that AT&T would no longer be considered a dominant carrier. In the 1996/1997 book, these tables were revised to exclude data for the aforementioned carriers for 1984 and subsequent years--the period since AT&T's divestiture of the Bell operating companies. (The double line in the year column of eachtable marks the time of divestiture, which was effective Jan. 1, 1984.) Therefore, the data for 1984 to the present arenot comparable to the data for 1950-83. Historical data that include AT&T Communications and Alascom appear inthe 1994/1995 and earlier editions of this publication.
Beginning with the reports filed for 1999, new and revised accounting rules that were adopted by the Commis-sion on May 18, 1999 (14 FCC Rcd 11396) streamlined the reporting requirements for certain mid-sized incumbentlocal exchange carriers. As a result of these changes, only the large reporting carriers included in Table 2.10 ofthis publication continue to report certain categories of revenues and plant that are presented in these historicaltables. Such items are indicated by the italicized figures in tables 4.1, 4.3, 4.4, and 4.9.
Revenues In Table 4.3, the toll private line revenue categories used for the 1950-87 period were introduced in the 1981 annual reports, and are not completely comparable to the categories listed in the reports for 1980 and prior years.The revenue breakdown before 1981 was as follows: telephone, teletypewriter, other telegraph, Telpak (beginningin 1961), program transmission - audio, program transmission - video, and other private line services.
1/ Effective Nov. 15, 1999, account 5010, public telephone revenues, was eliminated.
2/ Access revenues were first reported in 1984 following the AT&T divestiture.
3/ In the 1957 through 1973 SOCC books, details of private line revenues were not totaled for carriers that had filed reports on a voluntary basis. In this tabulation, aggregate data for those carriers are included in the other services category of toll private line service revenues.
4/ In 1982 through 1987, some of the non-Bell companies did not provide a breakdown of their toll private line revenues. These revenues were reported as either voice-grade service revenues or other private line service revenues.
5/ Wide area toll service (WATS) began in 1961. During the 1961-75 period, some of the non-Bell companies included WATS revenues in their message toll service revenues. The WATS figures for 1961-65 include reve- nues for wide area data service, which was offered on a limited developmental basis during that period.
6/ For 1961 through 1980, includes Telpak.
7/ Beginning in 1961, includes earth station revenues.
Expenses 1/ The plant specific operations expense accounts are used to record the expenses associated with particular kinds of telecommunications plant. For details, see Table 2.8.
207
Statistics of Communications Common Carriers
Notes to Tables 4.1 through 4.9 -- Continued
Earnings
1/ Net operating income for 1950-87 is after the addition and subtraction of rents from and for the lease of operating property from net operating revenues. Beginning in 1988, these rents are included in operating revenues and expenses.
2/ Beginning in 1970, net income is after extraordinary and delayed items. In earlier years, these items were charged or credited to retained earnings.
3/ The significant change in nonoperating income and expense and nonoperating taxes that occurred in 1993 is primarily attributable to business restructuring and the adoption of new accounting standards.
Assets and Liabilities
1/ Includes prepaid accounts.
2/ Includes miscellaneous physical property (account 103), which is reported as nonoperating plant (account 2006) under the revised USOA.
3/ Includes other jurisdictional assets (account 1500), which were not reported before 1988.
4/ In 1983, AT&T changed the par value of its common stock from $16.67 to $1 per share.
Plant
1/ During the 1957-84 period, detailed plant account data for those carriers that reported to the Commission on a voluntary basis were not included in the SOCC tabulations. Accordingly, the number of carriers included in this table for that period differs from the number included in Tables 4.1 through 4.8.
2/ In 1999, accounts 2114, 2115, and 2116 (special purpose vehicles, garage work equipment, and other work equipment, respectively) were combined into a single new account 2114, tools and other work equipment.
3/ Includes operator systems (account 2220).
4/ Includes satellite and earth station facilities (account 2231.1).
5/ This column includes drop and block wires (account 233) for the 1950-56 period. Following the elimination of this account in 1957, drop and block wires were included in account 242.1 or 242.3, as appropriate.
6/ Account 235 was called "booths and special fittings" during the 1950-57 period. Beginning in 1957 and continuing through 1983, public telephone equipment was included in account 231, station apparatus.
7/ Account 262 includes PBX and station equipment installed for official company use. Under the new rules, such plant is included in account 2123, office equipment.
8/ Intrabuilding network cable was called "house cable" under the old rules and was included in the aerial cable account (242.1).
9/ Includes account 207, right-of-way, which was eliminated as a separate account effective Jan.1, 1960. From 1960 through 1987, right-of-way was included primarily in the appropriate outside plant account.
10/ Includes unclassified plant (reported in 1969, 1974, 1975, and 1984).
11/ Consists of organization, franchises, and patent rights.
12/ Consists of capital leases (account 2681) and leasehold improvements (account 2682).
13/ Includes telephone plant adjustment (account 100.7), an account that was not used by any of the reporting carriers after 1955. In the 1951 through 1955 reports, this adjustment was made to net plant rather than to telephone plant in service.
14/ Under the revised USOA, satellite earth stations are included in central office transmission facilities.
15/ Beginning in 1995, the distinction between short-term and long-term plant under construction was eliminated. Account 2003 now comprises total plant under construction; account 2004 was deleted.
16/ Includes goodwill (account 2007).
208
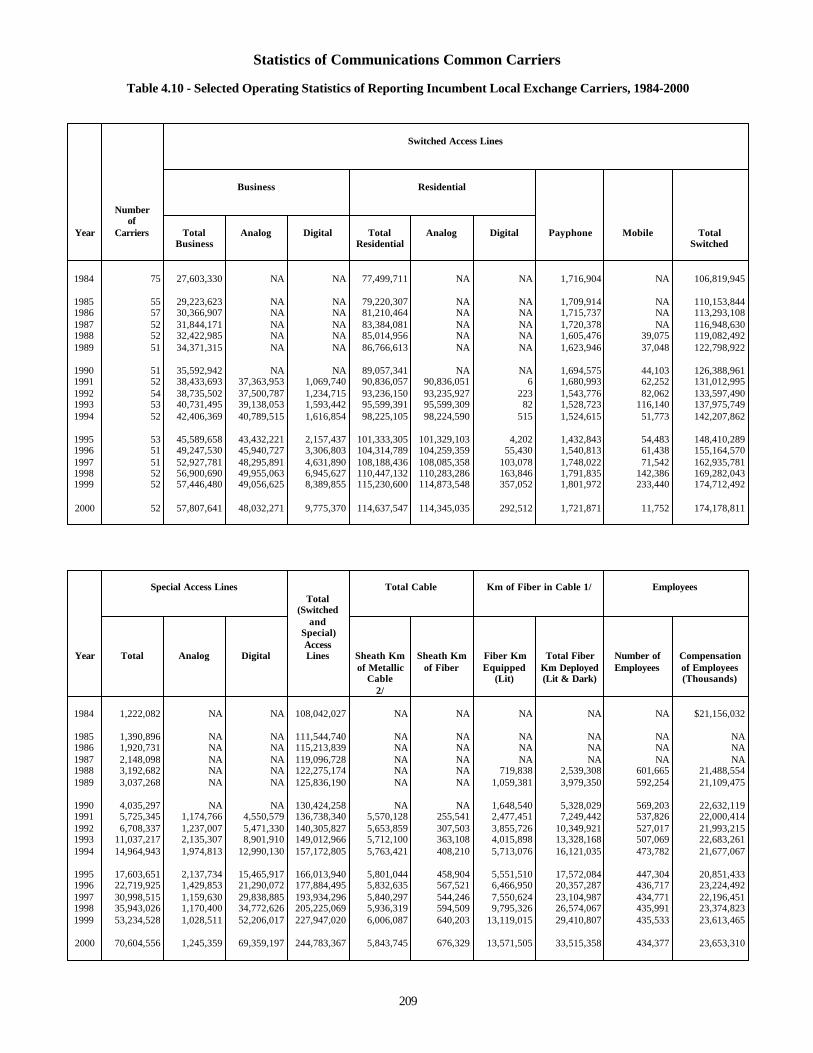
Statistics of Communications Common Carriers
Table 4.10 - Selected Operating Statistics of Reporting Incumbent Local Exchange Carriers, 1984-2000
Switched Access Lines
Business Residential
Numberof
Year Carriers Total Analog Digital Total Analog Digital Payphone Mobile TotalBusiness Residential Switched
1984 75 27,603,330 NA NA 77,499,711 NA NA 1,716,904 NA 106,819,945
1985 55 29,223,623 NA NA 79,220,307 NA NA 1,709,914 NA 110,153,8441986 57 30,366,907 NA NA 81,210,464 NA NA 1,715,737 NA 113,293,1081987 52 31,844,171 NA NA 83,384,081 NA NA 1,720,378 NA 116,948,6301988 52 32,422,985 NA NA 85,014,956 NA NA 1,605,476 39,075 119,082,4921989 51 34,371,315 NA NA 86,766,613 NA NA 1,623,946 37,048 122,798,922
1990 51 35,592,942 NA NA 89,057,341 NA NA 1,694,575 44,103 126,388,9611991 52 38,433,693 37,363,953 1,069,740 90,836,057 90,836,051 6 1,680,993 62,252 131,012,9951992 54 38,735,502 37,500,787 1,234,715 93,236,150 93,235,927 223 1,543,776 82,062 133,597,4901993 53 40,731,495 39,138,053 1,593,442 95,599,391 95,599,309 82 1,528,723 116,140 137,975,7491994 52 42,406,369 40,789,515 1,616,854 98,225,105 98,224,590 515 1,524,615 51,773 142,207,862
1995 53 45,589,658 43,432,221 2,157,437 101,333,305 101,329,103 4,202 1,432,843 54,483 148,410,2891996 51 49,247,530 45,940,727 3,306,803 104,314,789 104,259,359 55,430 1,540,813 61,438 155,164,5701997 51 52,927,781 48,295,891 4,631,890 108,188,436 108,085,358 103,078 1,748,022 71,542 162,935,7811998 52 56,900,690 49,955,063 6,945,627 110,447,132 110,283,286 163,846 1,791,835 142,386 169,282,0431999 52 57,446,480 49,056,625 8,389,855 115,230,600 114,873,548 357,052 1,801,972 233,440 174,712,492
2000 52 57,807,641 48,032,271 9,775,370 114,637,547 114,345,035 292,512 1,721,871 11,752 174,178,811
Special Access Lines Total Cable Km of Fiber in Cable 1/ EmployeesTotal
(Switchedand
Special)Access
Year Total Analog Digital Lines Sheath Km Sheath Km Fiber Km Total Fiber Number of Compensationof Metallic of Fiber Equipped Km Deployed Employees of Employees
Cable (Lit) (Lit & Dark) (Thousands)2/
1984 1,222,082 NA NA 108,042,027 NA NA NA NA NA $21,156,032
1985 1,390,896 NA NA 111,544,740 NA NA NA NA NA NA 1986 1,920,731 NA NA 115,213,839 NA NA NA NA NA NA 1987 2,148,098 NA NA 119,096,728 NA NA NA NA NA NA 1988 3,192,682 NA NA 122,275,174 NA NA 719,838 2,539,308 601,665 21,488,5541989 3,037,268 NA NA 125,836,190 NA NA 1,059,381 3,979,350 592,254 21,109,475
1990 4,035,297 NA NA 130,424,258 NA NA 1,648,540 5,328,029 569,203 22,632,1191991 5,725,345 1,174,766 4,550,579 136,738,340 5,570,128 255,541 2,477,451 7,249,442 537,826 22,000,4141992 6,708,337 1,237,007 5,471,330 140,305,827 5,653,859 307,503 3,855,726 10,349,921 527,017 21,993,2151993 11,037,217 2,135,307 8,901,910 149,012,966 5,712,100 363,108 4,015,898 13,328,168 507,069 22,683,2611994 14,964,943 1,974,813 12,990,130 157,172,805 5,763,421 408,210 5,713,076 16,121,035 473,782 21,677,067
1995 17,603,651 2,137,734 15,465,917 166,013,940 5,801,044 458,904 5,551,510 17,572,084 447,304 20,851,4331996 22,719,925 1,429,853 21,290,072 177,884,495 5,832,635 567,521 6,466,950 20,357,287 436,717 23,224,4921997 30,998,515 1,159,630 29,838,885 193,934,296 5,840,297 544,246 7,550,624 23,104,987 434,771 22,196,4511998 35,943,026 1,170,400 34,772,626 205,225,069 5,936,319 594,509 9,795,326 26,574,067 435,991 23,374,8231999 53,234,528 1,028,511 52,206,017 227,947,020 6,006,087 640,203 13,119,015 29,410,807 435,533 23,613,465
2000 70,604,556 1,245,359 69,359,197 244,783,367 5,843,745 676,329 13,571,505 33,515,358 434,377 23,653,310
209
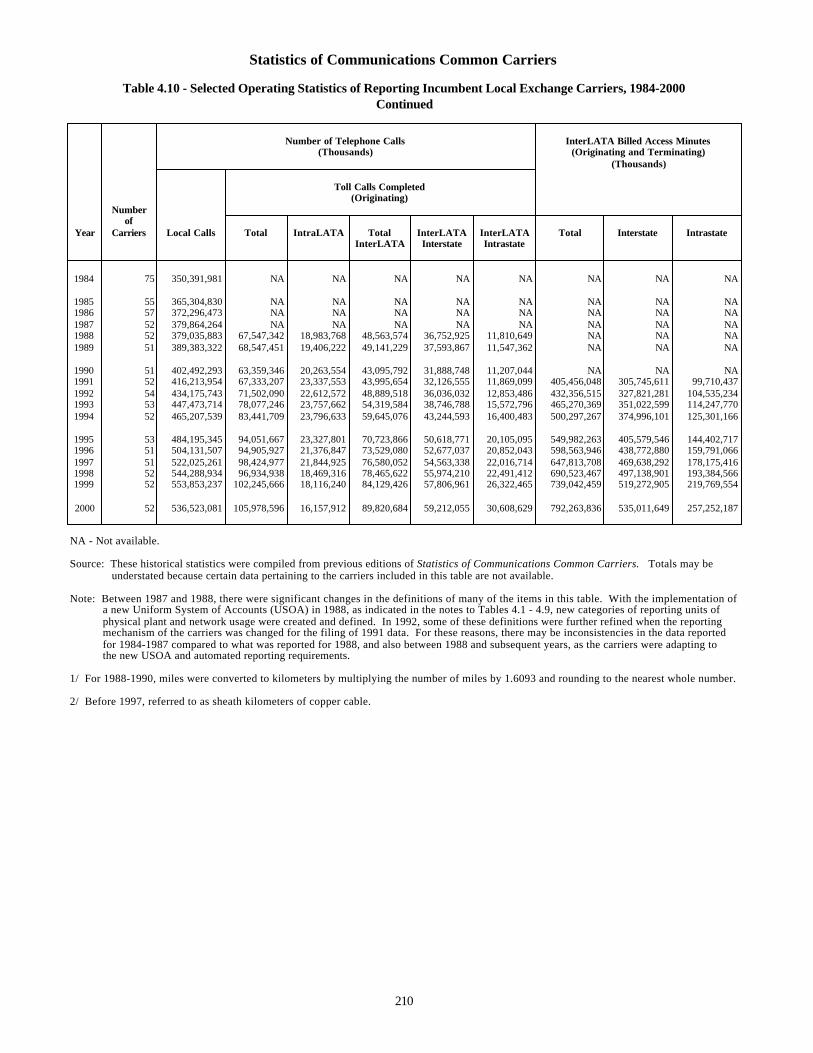
Statistics of Communications Common Carriers
Table 4.10 - Selected Operating Statistics of Reporting Incumbent Local Exchange Carriers, 1984-2000Continued
Number of Telephone Calls InterLATA Billed Access Minutes(Thousands) (Originating and Terminating)
(Thousands)
Toll Calls Completed(Originating)
Numberof
Year Carriers Local Calls Total IntraLATA Total InterLATA InterLATA Total Interstate IntrastateInterLATA Interstate Intrastate
1984 75 350,391,981 NA NA NA NA NA NA NA NA
1985 55 365,304,830 NA NA NA NA NA NA NA NA 1986 57 372,296,473 NA NA NA NA NA NA NA NA 1987 52 379,864,264 NA NA NA NA NA NA NA NA 1988 52 379,035,883 67,547,342 18,983,768 48,563,574 36,752,925 11,810,649 NA NA NA 1989 51 389,383,322 68,547,451 19,406,222 49,141,229 37,593,867 11,547,362 NA NA NA
1990 51 402,492,293 63,359,346 20,263,554 43,095,792 31,888,748 11,207,044 NA NA NA 1991 52 416,213,954 67,333,207 23,337,553 43,995,654 32,126,555 11,869,099 405,456,048 305,745,611 99,710,4371992 54 434,175,743 71,502,090 22,612,572 48,889,518 36,036,032 12,853,486 432,356,515 327,821,281 104,535,2341993 53 447,473,714 78,077,246 23,757,662 54,319,584 38,746,788 15,572,796 465,270,369 351,022,599 114,247,7701994 52 465,207,539 83,441,709 23,796,633 59,645,076 43,244,593 16,400,483 500,297,267 374,996,101 125,301,166
1995 53 484,195,345 94,051,667 23,327,801 70,723,866 50,618,771 20,105,095 549,982,263 405,579,546 144,402,7171996 51 504,131,507 94,905,927 21,376,847 73,529,080 52,677,037 20,852,043 598,563,946 438,772,880 159,791,0661997 51 522,025,261 98,424,977 21,844,925 76,580,052 54,563,338 22,016,714 647,813,708 469,638,292 178,175,4161998 52 544,288,934 96,934,938 18,469,316 78,465,622 55,974,210 22,491,412 690,523,467 497,138,901 193,384,5661999 52 553,853,237 102,245,666 18,116,240 84,129,426 57,806,961 26,322,465 739,042,459 519,272,905 219,769,554
2000 52 536,523,081 105,978,596 16,157,912 89,820,684 59,212,055 30,608,629 792,263,836 535,011,649 257,252,187
NA - Not available.
Source: These historical statistics were compiled from previous editions of Statistics of Communications Common Carriers. Totals may be understated because certain data pertaining to the carriers included in this table are not available.
Note: Between 1987 and 1988, there were significant changes in the definitions of many of the items in this table. With the implementation of a new Uniform System of Accounts (USOA) in 1988, as indicated in the notes to Tables 4.1 - 4.9, new categories of reporting units of physical plant and network usage were created and defined. In 1992, some of these definitions were further refined when the reporting mechanism of the carriers was changed for the filing of 1991 data. For these reasons, there may be inconsistencies in the data reported for 1984-1987 compared to what was reported for 1988, and also between 1988 and subsequent years, as the carriers were adapting to the new USOA and automated reporting requirements.
1/ For 1988-1990, miles were converted to kilometers by multiplying the number of miles by 1.6093 and rounding to the nearest whole number.
2/ Before 1997, referred to as sheath kilometers of copper cable.
210
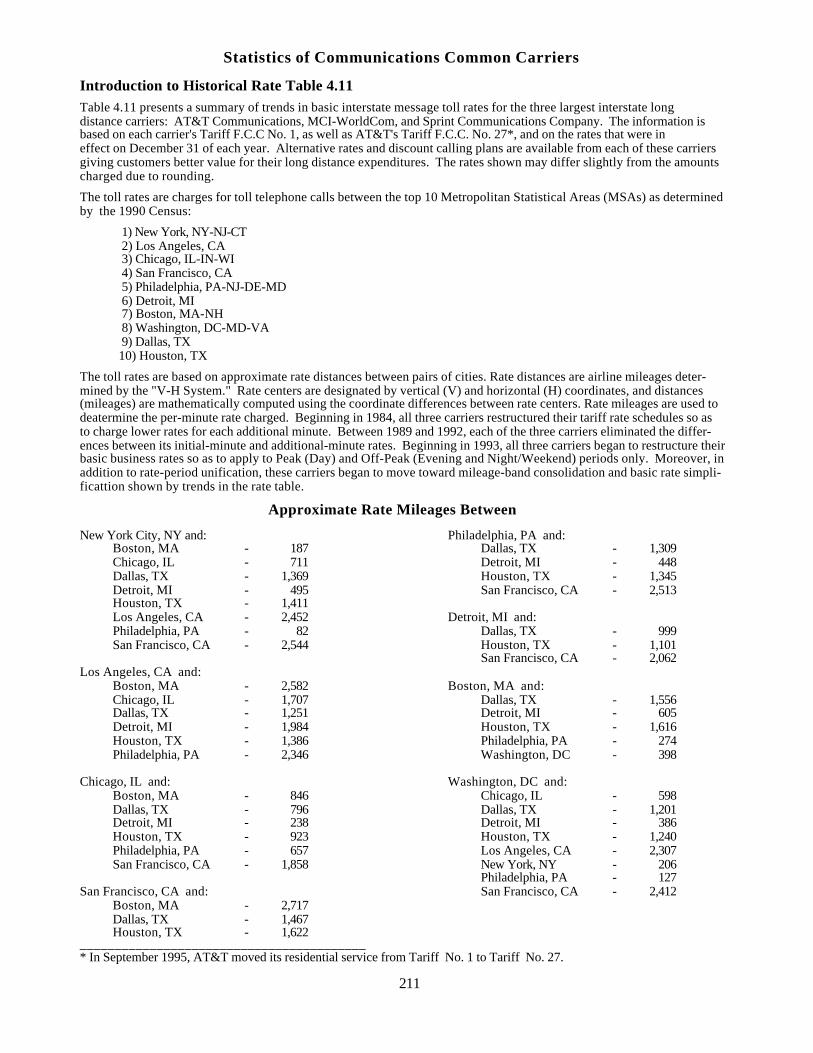
Statistics of Communications Common Carriers
Introduction to Historical Rate Table 4.11Table 4.11 presents a summary of trends in basic interstate message toll rates for the three largest interstate longdistance carriers: AT&T Communications, MCI-WorldCom, and Sprint Communications Company. The information isbased on each carrier's Tariff F.C.C No. 1, as well as AT&T's Tariff F.C.C. No. 27*, and on the rates that were ineffect on December 31 of each year. Alternative rates and discount calling plans are available from each of these carriersgiving customers better value for their long distance expenditures. The rates shown may differ slightly from the amountscharged due to rounding.
The toll rates are charges for toll telephone calls between the top 10 Metropolitan Statistical Areas (MSAs) as determinedby the 1990 Census:
1) New York, NY-NJ-CT 2) Los Angeles, CA 3) Chicago, IL-IN-WI 4) San Francisco, CA 5) Philadelphia, PA-NJ-DE-MD 6) Detroit, MI 7) Boston, MA-NH 8) Washington, DC-MD-VA 9) Dallas, TX 10) Houston, TX
The toll rates are based on approximate rate distances between pairs of cities. Rate distances are airline mileages deter-mined by the "V-H System." Rate centers are designated by vertical (V) and horizontal (H) coordinates, and distances(mileages) are mathematically computed using the coordinate differences between rate centers. Rate mileages are used todeatermine the per-minute rate charged. Beginning in 1984, all three carriers restructured their tariff rate schedules so asto charge lower rates for each additional minute. Between 1989 and 1992, each of the three carriers eliminated the differ-ences between its initial-minute and additional-minute rates. Beginning in 1993, all three carriers began to restructure theirbasic business rates so as to apply to Peak (Day) and Off-Peak (Evening and Night/Weekend) periods only. Moreover, inaddition to rate-period unification, these carriers began to move toward mileage-band consolidation and basic rate simpli-ficattion shown by trends in the rate table.
Approximate Rate Mileages Between
New York City, NY and: Philadelphia, PA and: Boston, MA - 187 Dallas, TX - 1,309 Chicago, IL - 711 Detroit, MI - 448 Dallas, TX - 1,369 Houston, TX - 1,345 Detroit, MI - 495 San Francisco, CA - 2,513 Houston, TX - 1,411 Los Angeles, CA - 2,452 Detroit, MI and: Philadelphia, PA - 82 Dallas, TX - 999 San Francisco, CA - 2,544 Houston, TX - 1,101
San Francisco, CA - 2,062Los Angeles, CA and: Boston, MA - 2,582 Boston, MA and: Chicago, IL - 1,707 Dallas, TX - 1,556 Dallas, TX - 1,251 Detroit, MI - 605 Detroit, MI - 1,984 Houston, TX - 1,616 Houston, TX - 1,386 Philadelphia, PA - 274 Philadelphia, PA - 2,346 Washington, DC - 398
Chicago, IL and: Washington, DC and: Boston, MA - 846 Chicago, IL - 598 Dallas, TX - 796 Dallas, TX - 1,201 Detroit, MI - 238 Detroit, MI - 386 Houston, TX - 923 Houston, TX - 1,240 Philadelphia, PA - 657 Los Angeles, CA - 2,307 San Francisco, CA - 1,858 New York, NY - 206
Philadelphia, PA - 127San Francisco, CA and: San Francisco, CA - 2,412 Boston, MA - 2,717 Dallas, TX - 1,467 Houston, TX - 1,622_________________________________________* In September 1995, AT&T moved its residential service from Tariff No. 1 to Tariff No. 27.
211

Statistics of Communications Common CarriersTable 4.11 - Comparative Historical Rates at Year End, 1985 through 2000
Interstate Message Toll Telephone Rates (Five and Ten Minute Calls)Between New York City, NY and
San Francisco and Los Angeles, CA Chicago, IL Philadelphia, PADay Evening Night/Weekend Day Evening Night/Weekend Day Evening Night/Weekend
Dec 31 Five Ten Five Ten Five Ten Five Ten Five Ten Five Ten Five Ten Five Ten Five Ten
1985AT&T 2.33 4.43 1.40 2.66 0.93 1.77 2.07 3.97 1.24 2.38 0.83 1.59 1.83 3.48 1.10 2.09 0.73 1.39
MCI 2.20 4.28 1.34 2.59 0.88 1.71 1.97 3.84 1.19 2.32 0.79 1.55 1.66 3.29 1.00 1.98 0.67 1.32Sprint 2.17 4.10 1.34 2.56 0.91 1.73 1.93 3.70 1.20 2.30 0.81 1.56 1.76 3.34 1.07 2.05 0.71 1.36
1986AT&T 1.99 3.79 1.19 2.27 0.88 1.67 1.79 3.44 1.07 2.06 0.79 1.51 1.55 2.95 0.93 1.77 0.68 1.30
MCI 1.89 3.68 1.16 2.24 0.84 1.62 1.72 3.35 1.04 2.03 0.76 1.48 1.46 2.85 0.86 1.70 0.62 1.23Sprint 1.88 3.67 1.15 2.23 0.83 1.61 1.71 3.34 1.03 2.02 0.75 1.47 1.45 2.84 0.85 1.68 0.61 1.22
1987AT&T 1.58 3.08 0.98 1.91 0.74 1.45 1.50 2.95 0.93 1.83 0.71 1.39 1.23 2.38 0.76 1.48 0.58 1.12
MCI 1.53 3.02 0.96 1.89 0.71 1.42 1.46 2.90 0.90 1.80 0.69 1.37 1.17 2.32 0.71 1.43 0.55 1.09Sprint 1.54 3.04 0.96 1.89 0.73 1.43 1.37 2.92 0.92 1.81 0.69 1.37 1.19 2.34 0.74 1.45 0.52 1.04
1988AT&T 1.40 2.75 0.91 1.79 0.70 1.38 1.34 2.64 0.87 1.72 0.67 1.32 1.11 2.16 0.72 1.40 0.56 1.08
MCI 1.41 2.80 0.94 1.85 0.71 1.41 1.35 2.69 0.88 1.75 0.68 1.35 1.07 2.12 0.69 1.37 0.53 1.06Sprint 1.44 2.84 0.95 1.86 0.72 1.42 1.37 2.71 0.89 1.77 0.68 1.36 1.08 2.13 0.72 1.40 0.52 1.04
1989AT&T 1.25 2.50 0.84 1.68 0.67 1.33 1.20 2.40 0.80 1.61 0.63 1.26 1.11 2.21 0.74 1.48 0.60 1.20
MCI 1.22 2.45 0.77 1.55 0.62 1.25 1.17 2.35 0.77 1.55 0.61 1.22 1.07 2.15 0.72 1.45 0.57 1.15Sprint 1.22 2.45 0.77 1.55 0.62 1.25 1.17 2.35 0.77 1.55 0.61 1.22 1.10 2.20 0.72 1.45 0.57 1.15
1990AT&T 1.25 2.49 0.75 1.50 0.68 1.36 1.20 2.39 0.75 1.49 0.65 1.31 1.08 2.15 0.73 1.45 0.60 1.21
MCI 1.20 2.40 0.70 1.40 0.62 1.25 1.15 2.30 0.70 1.40 0.61 1.22 1.05 2.10 0.69 1.38 0.57 1.15Sprint 1.20 2.40 0.70 1.40 0.65 1.30 1.15 2.30 0.70 1.40 0.62 1.25 1.05 2.10 0.70 1.40 0.60 1.20
1991AT&T 1.23 2.46 0.75 1.50 0.68 1.36 1.15 2.30 0.75 1.50 0.65 1.31 1.05 2.10 0.73 1.45 0.60 1.21
MCI 1.20 2.40 0.70 1.40 0.65 1.30 1.15 2.30 0.70 1.40 0.65 1.30 1.05 2.10 0.67 1.35 0.60 1.20Sprint 1.20 2.40 0.70 1.40 0.65 1.30 1.15 2.30 0.70 1.40 0.65 1.30 1.05 2.10 0.70 1.40 0.60 1.20
1992AT&T 1.25 2.50 0.75 1.50 0.65 1.30 1.15 2.30 0.70 1.40 0.65 1.30 1.10 2.20 0.70 1.40 0.60 1.20
MCI 1.24 2.48 0.74 1.48 0.63 1.25 1.15 2.30 0.70 1.40 0.63 1.25 1.10 2.20 0.67 1.34 0.59 1.17Sprint 1.25 2.50 0.75 1.50 0.65 1.30 1.15 2.30 0.70 1.40 0.65 1.30 1.10 2.20 0.70 1.40 0.60 1.20
1993AT&T Bus 1.29 2.58 0.80 1.60 0.80 1.60 1.20 2.40 0.75 1.50 0.75 1.50 1.20 2.40 0.75 1.50 0.75 1.50
MCI Bus 1.27 2.53 0.80 1.60 0.80 1.60 1.18 2.36 0.75 1.50 0.75 1.50 1.18 2.36 0.75 1.50 0.75 1.50Sprint Bus 1.27 2.53 0.80 1.60 0.80 1.60 1.18 2.36 0.75 1.50 0.75 1.50 1.18 2.36 0.75 1.50 0.75 1.50AT&T Res 1.25 2.50 0.75 1.50 0.65 1.30 1.20 2.40 0.75 1.50 0.65 1.30 1.15 2.30 0.70 1.40 0.60 1.20
MCI Res 1.25 2.50 0.74 1.49 0.64 1.29 1.20 2.40 0.74 1.48 0.64 1.29 1.15 2.30 0.70 1.40 0.59 1.17Sprint Res 1.25 2.50 0.75 1.50 0.65 1.30 1.20 2.40 0.75 1.50 0.65 1.30 1.15 2.30 0.70 1.40 0.60 1.201994AT&T Bus 1.49 2.98 0.92 1.85 0.92 1.85 1.38 2.77 0.87 1.73 0.87 1.73 1.38 2.77 0.87 1.73 0.87 1.73
MCI Bus 1.31 2.63 0.91 1.82 0.91 1.82 1.25 2.51 0.87 1.74 0.87 1.74 1.23 2.45 0.82 1.65 0.82 1.65Sprint Bus 1.31 2.63 0.91 1.82 0.91 1.82 1.25 2.51 0.87 1.74 0.87 1.74 1.23 2.45 0.82 1.65 0.82 1.65AT&T Res 1.40 2.80 0.85 1.70 0.75 1.50 1.35 2.70 0.85 1.70 0.70 1.40 1.30 2.60 0.80 1.60 0.70 1.40
MCI Res 1.40 2.80 0.85 1.70 0.75 1.50 1.35 2.70 0.85 1.70 0.70 1.40 1.30 2.60 0.80 1.60 0.70 1.40Sprint Res 1.40 2.80 0.85 1.70 0.75 1.50 1.35 2.70 0.85 1.70 0.70 1.40 1.30 2.60 0.80 1.60 0.70 1.401995AT&T Bus 1.59 3.19 1.00 1.99 1.00 1.99 1.52 3.04 0.95 1.91 0.95 1.91 1.52 3.04 0.95 1.91 0.95 1.91
MCI Bus 1.47 2.95 0.92 1.84 0.92 1.84 1.41 2.82 0.88 1.77 0.88 1.77 1.41 2.82 0.88 1.77 0.88 1.77Sprint Bus 1.40 2.80 0.85 1.70 0.75 1.50 1.35 2.70 0.85 1.70 0.70 1.40 1.30 2.60 0.80 1.60 0.70 1.40AT&T Res 1.40 2.80 0.85 1.70 0.75 1.50 1.35 2.70 0.85 1.70 0.70 1.40 1.30 2.60 0.80 1.60 0.70 1.40
MCI Res 1.40 2.80 0.85 1.70 0.75 1.50 1.35 2.70 0.85 1.70 0.70 1.40 1.30 2.60 0.80 1.60 0.70 1.40Sprint Res 1.40 2.80 0.85 1.70 0.75 1.50 1.35 2.70 0.85 1.70 0.70 1.40 1.30 2.60 0.80 1.60 0.70 1.401996AT&T Bus 1.75 3.51 1.10 2.19 1.10 2.19 1.67 3.35 1.05 2.10 1.05 2.10 1.67 3.35 1.05 2.10 1.05 2.10
MCI Bus 1.74 3.50 1.08 2.18 1.08 2.18 1.66 3.34 1.04 2.09 1.04 2.09 1.66 3.34 1.04 2.09 1.04 2.09Sprint Bus 1.55 3.10 0.95 1.90 0.80 1.60 1.50 3.00 0.95 1.90 0.80 1.60 1.40 2.80 0.85 1.70 0.75 1.50AT&T Res 1.55 3.10 0.95 1.90 0.80 1.60 1.50 3.00 0.95 1.90 0.80 1.60 1.40 2.80 0.85 1.70 0.75 1.50
MCI Res 1.55 3.10 0.95 1.90 0.80 1.60 1.45 2.90 0.95 1.90 0.80 1.60 1.40 2.80 0.85 1.70 0.75 1.50Sprint Res 1.55 3.10 0.95 1.90 0.80 1.60 1.50 3.00 0.95 1.90 0.80 1.60 1.40 2.80 0.85 1.70 0.75 1.501997AT&T Bus 1.82 3.64 1.82 3.64 1.82 3.64 1.82 3.64 1.82 3.64 1.82 3.64 1.82 3.64 1.82 3.64 1.82 3.64
MCI Bus 1.89 3.78 1.42 2.84 1.42 2.84 1.89 3.78 1.42 2.84 1.42 2.84 1.89 3.78 1.42 2.84 1.42 2.84Sprint Bus 1.55 3.10 0.95 1.90 0.80 1.60 1.50 3.00 0.95 1.90 0.80 1.60 1.40 2.80 0.85 1.70 0.75 1.50AT&T Res 1.40 2.80 0.80 1.60 0.65 1.30 1.40 2.80 0.80 1.60 0.65 1.30 1.40 2.80 0.80 1.60 0.65 1.30
MCI Res 1.45 2.90 0.90 1.80 0.90 1.80 1.45 2.90 0.90 1.80 0.90 1.80 1.30 2.60 0.65 1.30 0.65 1.30Sprint Res 1.55 3.10 0.95 1.90 0.80 1.60 1.50 3.00 0.95 1.90 0.80 1.60 1.40 2.80 0.85 1.70 0.75 1.501998AT&T Bus 1.82 3.64 1.82 3.64 1.82 3.64 1.82 3.64 1.82 3.64 1.82 3.64 1.82 3.64 1.82 3.64 1.82 3.64
MCI Bus 1.94 3.87 1.45 2.90 1.45 2.90 1.94 3.87 1.45 2.90 1.45 2.90 1.94 3.87 1.45 2.90 1.45 2.90Sprint Bus 1.55 3.10 0.95 1.90 0.80 1.60 1.50 3.00 0.95 1.90 0.80 1.60 1.40 2.80 0.85 1.70 0.75 1.50AT&T Res 1.40 2.80 0.80 1.60 0.65 1.30 1.40 2.80 0.80 1.60 0.65 1.30 1.40 2.80 0.80 1.60 0.65 1.30
MCI Res 1.45 2.90 0.90 1.80 0.90 1.80 1.45 2.90 0.90 1.80 0.90 1.80 1.30 2.60 0.65 1.30 0.65 1.30Sprint Res 1.55 3.10 0.95 1.90 0.80 1.60 1.50 3.00 0.95 1.90 0.80 1.60 1.40 2.80 0.85 1.70 0.75 1.501999AT&T Bus 2.02 4.04 2.02 4.04 2.02 4.04 2.02 4.04 2.02 4.04 2.02 4.04 2.02 4.04 2.02 4.04 2.02 4.04
MCI Bus 2.15 4.30 1.61 3.22 1.61 3.22 2.15 4.30 1.61 3.22 1.61 3.22 2.15 4.30 1.61 3.22 1.61 3.22Sprint Bus 1.55 3.10 0.95 1.90 0.80 1.60 1.50 3.00 0.95 1.90 0.80 1.60 1.40 2.80 0.85 1.70 0.75 1.50AT&T Res 1.30 2.60 0.80 1.60 0.58 1.15 1.30 2.60 0.80 1.60 0.58 1.15 1.30 2.60 0.80 1.60 0.58 1.15
MCI Res 1.45 2.90 0.90 1.80 0.90 1.80 1.45 2.90 0.90 1.80 0.90 1.80 1.30 2.60 0.65 1.30 0.65 1.30Sprint Res 1.55 3.10 0.95 1.90 0.80 1.60 1.50 3.00 0.95 1.90 0.80 1.60 1.40 2.80 0.85 1.70 0.75 1.502000AT&T Bus 2.31 4.61 2.31 4.61 2.31 4.61 2.31 4.61 2.31 4.61 2.31 4.61 2.31 4.61 2.31 4.61 2.31 4.61
MCI Bus 2.35 4.70 1.76 3.52 1.76 3.52 2.35 4.70 1.76 3.52 1.76 3.52 2.35 4.70 1.76 3.52 1.76 3.52Sprint Bus 1.98 3.96 1.24 2.47 1.24 2.47 1.89 3.78 1.19 2.37 1.19 2.37 1.89 3.78 1.19 2.37 1.19 2.37AT&T Res 1.48 2.95 1.13 2.25 0.73 1.45 1.48 2.95 1.13 2.25 0.73 1.45 1.48 2.95 1.13 2.25 0.73 1.45
MCI Res 1.50 3.00 1.25 2.50 1.25 2.50 1.50 3.00 1.25 2.50 1.25 2.50 1.50 3.00 1.25 2.50 1.25 2.50Sprint Res 1.85 3.70 1.25 2.50 0.80 1.60 1.80 3.60 1.25 2.50 0.80 1.60 1.75 3.50 1.15 2.30 0.65 1.30
212
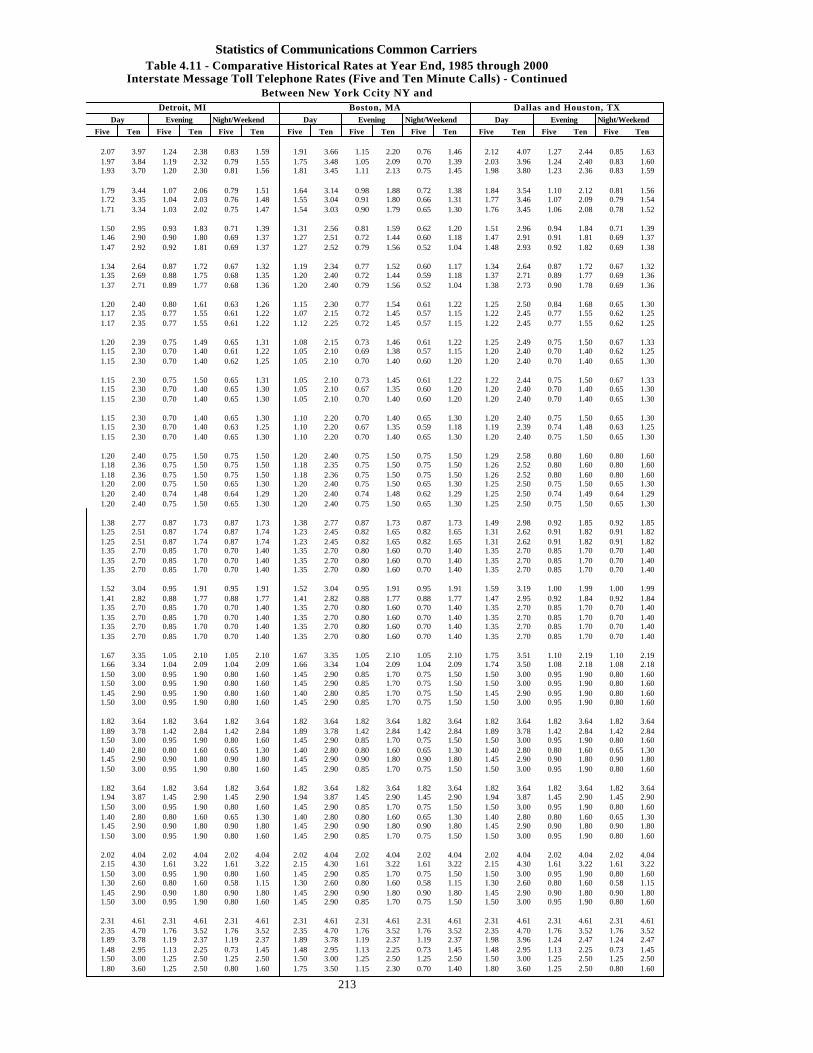
Statistics of Communications Common CarriersTable 4.11 - Comparative Historical Rates at Year End, 1985 through 2000
Interstate Message Toll Telephone Rates (Five and Ten Minute Calls) - ContinuedBetween New York Ccity NY and
Detroit, MI Boston, MA Dallas and Houston, TXDay Evening Night/Weekend Day Evening Night/Weekend Day Evening Night/Weekend
Five Ten Five Ten Five Ten Five Ten Five Ten Five Ten Five Ten Five Ten Five Ten
2.07 3.97 1.24 2.38 0.83 1.59 1.91 3.66 1.15 2.20 0.76 1.46 2.12 4.07 1.27 2.44 0.85 1.631.97 3.84 1.19 2.32 0.79 1.55 1.75 3.48 1.05 2.09 0.70 1.39 2.03 3.96 1.24 2.40 0.83 1.601.93 3.70 1.20 2.30 0.81 1.56 1.81 3.45 1.11 2.13 0.75 1.45 1.98 3.80 1.23 2.36 0.83 1.59
1.79 3.44 1.07 2.06 0.79 1.51 1.64 3.14 0.98 1.88 0.72 1.38 1.84 3.54 1.10 2.12 0.81 1.561.72 3.35 1.04 2.03 0.76 1.48 1.55 3.04 0.91 1.80 0.66 1.31 1.77 3.46 1.07 2.09 0.79 1.541.71 3.34 1.03 2.02 0.75 1.47 1.54 3.03 0.90 1.79 0.65 1.30 1.76 3.45 1.06 2.08 0.78 1.52
1.50 2.95 0.93 1.83 0.71 1.39 1.31 2.56 0.81 1.59 0.62 1.20 1.51 2.96 0.94 1.84 0.71 1.391.46 2.90 0.90 1.80 0.69 1.37 1.27 2.51 0.72 1.44 0.60 1.18 1.47 2.91 0.91 1.81 0.69 1.371.47 2.92 0.92 1.81 0.69 1.37 1.27 2.52 0.79 1.56 0.52 1.04 1.48 2.93 0.92 1.82 0.69 1.38
1.34 2.64 0.87 1.72 0.67 1.32 1.19 2.34 0.77 1.52 0.60 1.17 1.34 2.64 0.87 1.72 0.67 1.321.35 2.69 0.88 1.75 0.68 1.35 1.20 2.40 0.72 1.44 0.59 1.18 1.37 2.71 0.89 1.77 0.69 1.361.37 2.71 0.89 1.77 0.68 1.36 1.20 2.40 0.79 1.56 0.52 1.04 1.38 2.73 0.90 1.78 0.69 1.36
1.20 2.40 0.80 1.61 0.63 1.26 1.15 2.30 0.77 1.54 0.61 1.22 1.25 2.50 0.84 1.68 0.65 1.301.17 2.35 0.77 1.55 0.61 1.22 1.07 2.15 0.72 1.45 0.57 1.15 1.22 2.45 0.77 1.55 0.62 1.251.17 2.35 0.77 1.55 0.61 1.22 1.12 2.25 0.72 1.45 0.57 1.15 1.22 2.45 0.77 1.55 0.62 1.25
1.20 2.39 0.75 1.49 0.65 1.31 1.08 2.15 0.73 1.46 0.61 1.22 1.25 2.49 0.75 1.50 0.67 1.331.15 2.30 0.70 1.40 0.61 1.22 1.05 2.10 0.69 1.38 0.57 1.15 1.20 2.40 0.70 1.40 0.62 1.251.15 2.30 0.70 1.40 0.62 1.25 1.05 2.10 0.70 1.40 0.60 1.20 1.20 2.40 0.70 1.40 0.65 1.30
1.15 2.30 0.75 1.50 0.65 1.31 1.05 2.10 0.73 1.45 0.61 1.22 1.22 2.44 0.75 1.50 0.67 1.331.15 2.30 0.70 1.40 0.65 1.30 1.05 2.10 0.67 1.35 0.60 1.20 1.20 2.40 0.70 1.40 0.65 1.301.15 2.30 0.70 1.40 0.65 1.30 1.05 2.10 0.70 1.40 0.60 1.20 1.20 2.40 0.70 1.40 0.65 1.30
1.15 2.30 0.70 1.40 0.65 1.30 1.10 2.20 0.70 1.40 0.65 1.30 1.20 2.40 0.75 1.50 0.65 1.301.15 2.30 0.70 1.40 0.63 1.25 1.10 2.20 0.67 1.35 0.59 1.18 1.19 2.39 0.74 1.48 0.63 1.251.15 2.30 0.70 1.40 0.65 1.30 1.10 2.20 0.70 1.40 0.65 1.30 1.20 2.40 0.75 1.50 0.65 1.30
1.20 2.40 0.75 1.50 0.75 1.50 1.20 2.40 0.75 1.50 0.75 1.50 1.29 2.58 0.80 1.60 0.80 1.601.18 2.36 0.75 1.50 0.75 1.50 1.18 2.35 0.75 1.50 0.75 1.50 1.26 2.52 0.80 1.60 0.80 1.601.18 2.36 0.75 1.50 0.75 1.50 1.18 2.36 0.75 1.50 0.75 1.50 1.26 2.52 0.80 1.60 0.80 1.601.20 2.00 0.75 1.50 0.65 1.30 1.20 2.40 0.75 1.50 0.65 1.30 1.25 2.50 0.75 1.50 0.65 1.301.20 2.40 0.74 1.48 0.64 1.29 1.20 2.40 0.74 1.48 0.62 1.29 1.25 2.50 0.74 1.49 0.64 1.291.20 2.40 0.75 1.50 0.65 1.30 1.20 2.40 0.75 1.50 0.65 1.30 1.25 2.50 0.75 1.50 0.65 1.30
1.38 2.77 0.87 1.73 0.87 1.73 1.38 2.77 0.87 1.73 0.87 1.73 1.49 2.98 0.92 1.85 0.92 1.851.25 2.51 0.87 1.74 0.87 1.74 1.23 2.45 0.82 1.65 0.82 1.65 1.31 2.62 0.91 1.82 0.91 1.821.25 2.51 0.87 1.74 0.87 1.74 1.23 2.45 0.82 1.65 0.82 1.65 1.31 2.62 0.91 1.82 0.91 1.821.35 2.70 0.85 1.70 0.70 1.40 1.35 2.70 0.80 1.60 0.70 1.40 1.35 2.70 0.85 1.70 0.70 1.401.35 2.70 0.85 1.70 0.70 1.40 1.35 2.70 0.80 1.60 0.70 1.40 1.35 2.70 0.85 1.70 0.70 1.401.35 2.70 0.85 1.70 0.70 1.40 1.35 2.70 0.80 1.60 0.70 1.40 1.35 2.70 0.85 1.70 0.70 1.40
1.52 3.04 0.95 1.91 0.95 1.91 1.52 3.04 0.95 1.91 0.95 1.91 1.59 3.19 1.00 1.99 1.00 1.991.41 2.82 0.88 1.77 0.88 1.77 1.41 2.82 0.88 1.77 0.88 1.77 1.47 2.95 0.92 1.84 0.92 1.841.35 2.70 0.85 1.70 0.70 1.40 1.35 2.70 0.80 1.60 0.70 1.40 1.35 2.70 0.85 1.70 0.70 1.401.35 2.70 0.85 1.70 0.70 1.40 1.35 2.70 0.80 1.60 0.70 1.40 1.35 2.70 0.85 1.70 0.70 1.401.35 2.70 0.85 1.70 0.70 1.40 1.35 2.70 0.80 1.60 0.70 1.40 1.35 2.70 0.85 1.70 0.70 1.401.35 2.70 0.85 1.70 0.70 1.40 1.35 2.70 0.80 1.60 0.70 1.40 1.35 2.70 0.85 1.70 0.70 1.40
1.67 3.35 1.05 2.10 1.05 2.10 1.67 3.35 1.05 2.10 1.05 2.10 1.75 3.51 1.10 2.19 1.10 2.191.66 3.34 1.04 2.09 1.04 2.09 1.66 3.34 1.04 2.09 1.04 2.09 1.74 3.50 1.08 2.18 1.08 2.181.50 3.00 0.95 1.90 0.80 1.60 1.45 2.90 0.85 1.70 0.75 1.50 1.50 3.00 0.95 1.90 0.80 1.601.50 3.00 0.95 1.90 0.80 1.60 1.45 2.90 0.85 1.70 0.75 1.50 1.50 3.00 0.95 1.90 0.80 1.601.45 2.90 0.95 1.90 0.80 1.60 1.40 2.80 0.85 1.70 0.75 1.50 1.45 2.90 0.95 1.90 0.80 1.601.50 3.00 0.95 1.90 0.80 1.60 1.45 2.90 0.85 1.70 0.75 1.50 1.50 3.00 0.95 1.90 0.80 1.60
1.82 3.64 1.82 3.64 1.82 3.64 1.82 3.64 1.82 3.64 1.82 3.64 1.82 3.64 1.82 3.64 1.82 3.641.89 3.78 1.42 2.84 1.42 2.84 1.89 3.78 1.42 2.84 1.42 2.84 1.89 3.78 1.42 2.84 1.42 2.841.50 3.00 0.95 1.90 0.80 1.60 1.45 2.90 0.85 1.70 0.75 1.50 1.50 3.00 0.95 1.90 0.80 1.601.40 2.80 0.80 1.60 0.65 1.30 1.40 2.80 0.80 1.60 0.65 1.30 1.40 2.80 0.80 1.60 0.65 1.301.45 2.90 0.90 1.80 0.90 1.80 1.45 2.90 0.90 1.80 0.90 1.80 1.45 2.90 0.90 1.80 0.90 1.801.50 3.00 0.95 1.90 0.80 1.60 1.45 2.90 0.85 1.70 0.75 1.50 1.50 3.00 0.95 1.90 0.80 1.60
1.82 3.64 1.82 3.64 1.82 3.64 1.82 3.64 1.82 3.64 1.82 3.64 1.82 3.64 1.82 3.64 1.82 3.641.94 3.87 1.45 2.90 1.45 2.90 1.94 3.87 1.45 2.90 1.45 2.90 1.94 3.87 1.45 2.90 1.45 2.901.50 3.00 0.95 1.90 0.80 1.60 1.45 2.90 0.85 1.70 0.75 1.50 1.50 3.00 0.95 1.90 0.80 1.601.40 2.80 0.80 1.60 0.65 1.30 1.40 2.80 0.80 1.60 0.65 1.30 1.40 2.80 0.80 1.60 0.65 1.301.45 2.90 0.90 1.80 0.90 1.80 1.45 2.90 0.90 1.80 0.90 1.80 1.45 2.90 0.90 1.80 0.90 1.801.50 3.00 0.95 1.90 0.80 1.60 1.45 2.90 0.85 1.70 0.75 1.50 1.50 3.00 0.95 1.90 0.80 1.60
2.02 4.04 2.02 4.04 2.02 4.04 2.02 4.04 2.02 4.04 2.02 4.04 2.02 4.04 2.02 4.04 2.02 4.042.15 4.30 1.61 3.22 1.61 3.22 2.15 4.30 1.61 3.22 1.61 3.22 2.15 4.30 1.61 3.22 1.61 3.221.50 3.00 0.95 1.90 0.80 1.60 1.45 2.90 0.85 1.70 0.75 1.50 1.50 3.00 0.95 1.90 0.80 1.601.30 2.60 0.80 1.60 0.58 1.15 1.30 2.60 0.80 1.60 0.58 1.15 1.30 2.60 0.80 1.60 0.58 1.151.45 2.90 0.90 1.80 0.90 1.80 1.45 2.90 0.90 1.80 0.90 1.80 1.45 2.90 0.90 1.80 0.90 1.801.50 3.00 0.95 1.90 0.80 1.60 1.45 2.90 0.85 1.70 0.75 1.50 1.50 3.00 0.95 1.90 0.80 1.60
2.31 4.61 2.31 4.61 2.31 4.61 2.31 4.61 2.31 4.61 2.31 4.61 2.31 4.61 2.31 4.61 2.31 4.612.35 4.70 1.76 3.52 1.76 3.52 2.35 4.70 1.76 3.52 1.76 3.52 2.35 4.70 1.76 3.52 1.76 3.521.89 3.78 1.19 2.37 1.19 2.37 1.89 3.78 1.19 2.37 1.19 2.37 1.98 3.96 1.24 2.47 1.24 2.471.48 2.95 1.13 2.25 0.73 1.45 1.48 2.95 1.13 2.25 0.73 1.45 1.48 2.95 1.13 2.25 0.73 1.451.50 3.00 1.25 2.50 1.25 2.50 1.50 3.00 1.25 2.50 1.25 2.50 1.50 3.00 1.25 2.50 1.25 2.501.80 3.60 1.25 2.50 0.80 1.60 1.75 3.50 1.15 2.30 0.70 1.40 1.80 3.60 1.25 2.50 0.80 1.60
213
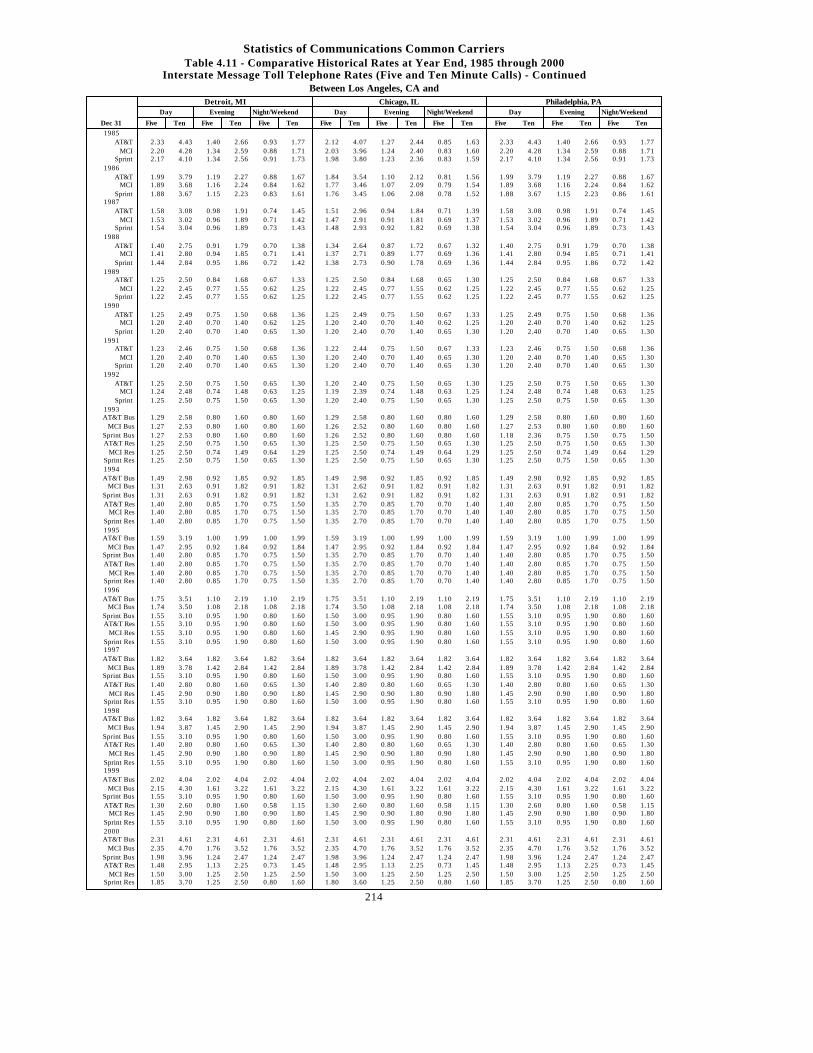
Statistics of Communications Common CarriersTable 4.11 - Comparative Historical Rates at Year End, 1985 through 2000
Interstate Message Toll Telephone Rates (Five and Ten Minute Calls) - ContinuedBetween Los Angeles, CA and
Detroit, MI Chicago, IL Philadelphia, PADay Evening Night/Weekend Day Evening Night/Weekend Day Evening Night/Weekend
Dec 31 Five Ten Five Ten Five Ten Five Ten Five Ten Five Ten Five Ten Five Ten Five Ten
1985AT&T 2.33 4.43 1.40 2.66 0.93 1.77 2.12 4.07 1.27 2.44 0.85 1.63 2.33 4.43 1.40 2.66 0.93 1.77
MCI 2.20 4.28 1.34 2.59 0.88 1.71 2.03 3.96 1.24 2.40 0.83 1.60 2.20 4.28 1.34 2.59 0.88 1.71Sprint 2.17 4.10 1.34 2.56 0.91 1.73 1.98 3.80 1.23 2.36 0.83 1.59 2.17 4.10 1.34 2.56 0.91 1.73
1986AT&T 1.99 3.79 1.19 2.27 0.88 1.67 1.84 3.54 1.10 2.12 0.81 1.56 1.99 3.79 1.19 2.27 0.88 1.67
MCI 1.89 3.68 1.16 2.24 0.84 1.62 1.77 3.46 1.07 2.09 0.79 1.54 1.89 3.68 1.16 2.24 0.84 1.62Sprint 1.88 3.67 1.15 2.23 0.83 1.61 1.76 3.45 1.06 2.08 0.78 1.52 1.88 3.67 1.15 2.23 0.86 1.61
1987AT&T 1.58 3.08 0.98 1.91 0.74 1.45 1.51 2.96 0.94 1.84 0.71 1.39 1.58 3.08 0.98 1.91 0.74 1.45
MCI 1.53 3.02 0.96 1.89 0.71 1.42 1.47 2.91 0.91 1.81 0.69 1.37 1.53 3.02 0.96 1.89 0.71 1.42Sprint 1.54 3.04 0.96 1.89 0.73 1.43 1.48 2.93 0.92 1.82 0.69 1.38 1.54 3.04 0.96 1.89 0.73 1.43
1988AT&T 1.40 2.75 0.91 1.79 0.70 1.38 1.34 2.64 0.87 1.72 0.67 1.32 1.40 2.75 0.91 1.79 0.70 1.38
MCI 1.41 2.80 0.94 1.85 0.71 1.41 1.37 2.71 0.89 1.77 0.69 1.36 1.41 2.80 0.94 1.85 0.71 1.41Sprint 1.44 2.84 0.95 1.86 0.72 1.42 1.38 2.73 0.90 1.78 0.69 1.36 1.44 2.84 0.95 1.86 0.72 1.42
1989AT&T 1.25 2.50 0.84 1.68 0.67 1.33 1.25 2.50 0.84 1.68 0.65 1.30 1.25 2.50 0.84 1.68 0.67 1.33
MCI 1.22 2.45 0.77 1.55 0.62 1.25 1.22 2.45 0.77 1.55 0.62 1.25 1.22 2.45 0.77 1.55 0.62 1.25Sprint 1.22 2.45 0.77 1.55 0.62 1.25 1.22 2.45 0.77 1.55 0.62 1.25 1.22 2.45 0.77 1.55 0.62 1.25
1990AT&T 1.25 2.49 0.75 1.50 0.68 1.36 1.25 2.49 0.75 1.50 0.67 1.33 1.25 2.49 0.75 1.50 0.68 1.36
MCI 1.20 2.40 0.70 1.40 0.62 1.25 1.20 2.40 0.70 1.40 0.62 1.25 1.20 2.40 0.70 1.40 0.62 1.25Sprint 1.20 2.40 0.70 1.40 0.65 1.30 1.20 2.40 0.70 1.40 0.65 1.30 1.20 2.40 0.70 1.40 0.65 1.30
1991AT&T 1.23 2.46 0.75 1.50 0.68 1.36 1.22 2.44 0.75 1.50 0.67 1.33 1.23 2.46 0.75 1.50 0.68 1.36
MCI 1.20 2.40 0.70 1.40 0.65 1.30 1.20 2.40 0.70 1.40 0.65 1.30 1.20 2.40 0.70 1.40 0.65 1.30Sprint 1.20 2.40 0.70 1.40 0.65 1.30 1.20 2.40 0.70 1.40 0.65 1.30 1.20 2.40 0.70 1.40 0.65 1.30
1992AT&T 1.25 2.50 0.75 1.50 0.65 1.30 1.20 2.40 0.75 1.50 0.65 1.30 1.25 2.50 0.75 1.50 0.65 1.30
MCI 1.24 2.48 0.74 1.48 0.63 1.25 1.19 2.39 0.74 1.48 0.63 1.25 1.24 2.48 0.74 1.48 0.63 1.25Sprint 1.25 2.50 0.75 1.50 0.65 1.30 1.20 2.40 0.75 1.50 0.65 1.30 1.25 2.50 0.75 1.50 0.65 1.30
1993AT&T Bus 1.29 2.58 0.80 1.60 0.80 1.60 1.29 2.58 0.80 1.60 0.80 1.60 1.29 2.58 0.80 1.60 0.80 1.60
MCI Bus 1.27 2.53 0.80 1.60 0.80 1.60 1.26 2.52 0.80 1.60 0.80 1.60 1.27 2.53 0.80 1.60 0.80 1.60Sprint Bus 1.27 2.53 0.80 1.60 0.80 1.60 1.26 2.52 0.80 1.60 0.80 1.60 1.18 2.36 0.75 1.50 0.75 1.50AT&T Res 1.25 2.50 0.75 1.50 0.65 1.30 1.25 2.50 0.75 1.50 0.65 1.30 1.25 2.50 0.75 1.50 0.65 1.30
MCI Res 1.25 2.50 0.74 1.49 0.64 1.29 1.25 2.50 0.74 1.49 0.64 1.29 1.25 2.50 0.74 1.49 0.64 1.29Sprint Res 1.25 2.50 0.75 1.50 0.65 1.30 1.25 2.50 0.75 1.50 0.65 1.30 1.25 2.50 0.75 1.50 0.65 1.301994AT&T Bus 1.49 2.98 0.92 1.85 0.92 1.85 1.49 2.98 0.92 1.85 0.92 1.85 1.49 2.98 0.92 1.85 0.92 1.85
MCI Bus 1.31 2.63 0.91 1.82 0.91 1.82 1.31 2.62 0.91 1.82 0.91 1.82 1.31 2.63 0.91 1.82 0.91 1.82Sprint Bus 1.31 2.63 0.91 1.82 0.91 1.82 1.31 2.62 0.91 1.82 0.91 1.82 1.31 2.63 0.91 1.82 0.91 1.82AT&T Res 1.40 2.80 0.85 1.70 0.75 1.50 1.35 2.70 0.85 1.70 0.70 1.40 1.40 2.80 0.85 1.70 0.75 1.50
MCI Res 1.40 2.80 0.85 1.70 0.75 1.50 1.35 2.70 0.85 1.70 0.70 1.40 1.40 2.80 0.85 1.70 0.75 1.50Sprint Res 1.40 2.80 0.85 1.70 0.75 1.50 1.35 2.70 0.85 1.70 0.70 1.40 1.40 2.80 0.85 1.70 0.75 1.501995AT&T Bus 1.59 3.19 1.00 1.99 1.00 1.99 1.59 3.19 1.00 1.99 1.00 1.99 1.59 3.19 1.00 1.99 1.00 1.99
MCI Bus 1.47 2.95 0.92 1.84 0.92 1.84 1.47 2.95 0.92 1.84 0.92 1.84 1.47 2.95 0.92 1.84 0.92 1.84Sprint Bus 1.40 2.80 0.85 1.70 0.75 1.50 1.35 2.70 0.85 1.70 0.70 1.40 1.40 2.80 0.85 1.70 0.75 1.50AT&T Res 1.40 2.80 0.85 1.70 0.75 1.50 1.35 2.70 0.85 1.70 0.70 1.40 1.40 2.80 0.85 1.70 0.75 1.50
MCI Res 1.40 2.80 0.85 1.70 0.75 1.50 1.35 2.70 0.85 1.70 0.70 1.40 1.40 2.80 0.85 1.70 0.75 1.50Sprint Res 1.40 2.80 0.85 1.70 0.75 1.50 1.35 2.70 0.85 1.70 0.70 1.40 1.40 2.80 0.85 1.70 0.75 1.501996AT&T Bus 1.75 3.51 1.10 2.19 1.10 2.19 1.75 3.51 1.10 2.19 1.10 2.19 1.75 3.51 1.10 2.19 1.10 2.19
MCI Bus 1.74 3.50 1.08 2.18 1.08 2.18 1.74 3.50 1.08 2.18 1.08 2.18 1.74 3.50 1.08 2.18 1.08 2.18Sprint Bus 1.55 3.10 0.95 1.90 0.80 1.60 1.50 3.00 0.95 1.90 0.80 1.60 1.55 3.10 0.95 1.90 0.80 1.60AT&T Res 1.55 3.10 0.95 1.90 0.80 1.60 1.50 3.00 0.95 1.90 0.80 1.60 1.55 3.10 0.95 1.90 0.80 1.60
MCI Res 1.55 3.10 0.95 1.90 0.80 1.60 1.45 2.90 0.95 1.90 0.80 1.60 1.55 3.10 0.95 1.90 0.80 1.60Sprint Res 1.55 3.10 0.95 1.90 0.80 1.60 1.50 3.00 0.95 1.90 0.80 1.60 1.55 3.10 0.95 1.90 0.80 1.601997AT&T Bus 1.82 3.64 1.82 3.64 1.82 3.64 1.82 3.64 1.82 3.64 1.82 3.64 1.82 3.64 1.82 3.64 1.82 3.64
MCI Bus 1.89 3.78 1.42 2.84 1.42 2.84 1.89 3.78 1.42 2.84 1.42 2.84 1.89 3.78 1.42 2.84 1.42 2.84Sprint Bus 1.55 3.10 0.95 1.90 0.80 1.60 1.50 3.00 0.95 1.90 0.80 1.60 1.55 3.10 0.95 1.90 0.80 1.60AT&T Res 1.40 2.80 0.80 1.60 0.65 1.30 1.40 2.80 0.80 1.60 0.65 1.30 1.40 2.80 0.80 1.60 0.65 1.30
MCI Res 1.45 2.90 0.90 1.80 0.90 1.80 1.45 2.90 0.90 1.80 0.90 1.80 1.45 2.90 0.90 1.80 0.90 1.80Sprint Res 1.55 3.10 0.95 1.90 0.80 1.60 1.50 3.00 0.95 1.90 0.80 1.60 1.55 3.10 0.95 1.90 0.80 1.601998AT&T Bus 1.82 3.64 1.82 3.64 1.82 3.64 1.82 3.64 1.82 3.64 1.82 3.64 1.82 3.64 1.82 3.64 1.82 3.64
MCI Bus 1.94 3.87 1.45 2.90 1.45 2.90 1.94 3.87 1.45 2.90 1.45 2.90 1.94 3.87 1.45 2.90 1.45 2.90Sprint Bus 1.55 3.10 0.95 1.90 0.80 1.60 1.50 3.00 0.95 1.90 0.80 1.60 1.55 3.10 0.95 1.90 0.80 1.60AT&T Res 1.40 2.80 0.80 1.60 0.65 1.30 1.40 2.80 0.80 1.60 0.65 1.30 1.40 2.80 0.80 1.60 0.65 1.30
MCI Res 1.45 2.90 0.90 1.80 0.90 1.80 1.45 2.90 0.90 1.80 0.90 1.80 1.45 2.90 0.90 1.80 0.90 1.80Sprint Res 1.55 3.10 0.95 1.90 0.80 1.60 1.50 3.00 0.95 1.90 0.80 1.60 1.55 3.10 0.95 1.90 0.80 1.601999AT&T Bus 2.02 4.04 2.02 4.04 2.02 4.04 2.02 4.04 2.02 4.04 2.02 4.04 2.02 4.04 2.02 4.04 2.02 4.04
MCI Bus 2.15 4.30 1.61 3.22 1.61 3.22 2.15 4.30 1.61 3.22 1.61 3.22 2.15 4.30 1.61 3.22 1.61 3.22Sprint Bus 1.55 3.10 0.95 1.90 0.80 1.60 1.50 3.00 0.95 1.90 0.80 1.60 1.55 3.10 0.95 1.90 0.80 1.60AT&T Res 1.30 2.60 0.80 1.60 0.58 1.15 1.30 2.60 0.80 1.60 0.58 1.15 1.30 2.60 0.80 1.60 0.58 1.15
MCI Res 1.45 2.90 0.90 1.80 0.90 1.80 1.45 2.90 0.90 1.80 0.90 1.80 1.45 2.90 0.90 1.80 0.90 1.80Sprint Res 1.55 3.10 0.95 1.90 0.80 1.60 1.50 3.00 0.95 1.90 0.80 1.60 1.55 3.10 0.95 1.90 0.80 1.602000AT&T Bus 2.31 4.61 2.31 4.61 2.31 4.61 2.31 4.61 2.31 4.61 2.31 4.61 2.31 4.61 2.31 4.61 2.31 4.61
MCI Bus 2.35 4.70 1.76 3.52 1.76 3.52 2.35 4.70 1.76 3.52 1.76 3.52 2.35 4.70 1.76 3.52 1.76 3.52Sprint Bus 1.98 3.96 1.24 2.47 1.24 2.47 1.98 3.96 1.24 2.47 1.24 2.47 1.98 3.96 1.24 2.47 1.24 2.47AT&T Res 1.48 2.95 1.13 2.25 0.73 1.45 1.48 2.95 1.13 2.25 0.73 1.45 1.48 2.95 1.13 2.25 0.73 1.45
MCI Res 1.50 3.00 1.25 2.50 1.25 2.50 1.50 3.00 1.25 2.50 1.25 2.50 1.50 3.00 1.25 2.50 1.25 2.50Sprint Res 1.85 3.70 1.25 2.50 0.80 1.60 1.80 3.60 1.25 2.50 0.80 1.60 1.85 3.70 1.25 2.50 0.80 1.60
214

Statistics of Communications Common CarriersTable 4.11 - Comparative Historical Rates at Year End, 1985 through 2000
Interstate Message Toll Telephone Rates (Five and Ten Minute Calls) - ContinuedBetween Los Angeles, CA and
Dallas and Houston TX Boston, MADay Evening Night/Weekend Day Evening Night/Weekend
Dec 31 Five Ten Five Ten Five Ten Five Ten Five Ten Five Ten1985
AT&T 2.12 4.07 1.27 2.44 0.85 1.63 2.33 4.43 1.40 2.66 0.93 1.77MCI 2.03 3.96 1.24 2.40 0.83 1.60 2.20 4.28 1.34 2.59 0.88 1.71
Sprint 1.98 3.80 1.23 2.36 0.83 1.59 2.17 4.10 1.34 2.56 0.91 1.731986
AT&T 1.84 3.54 1.10 2.12 0.81 1.56 1.99 3.79 1.19 2.27 0.88 1.67MCI 1.77 3.46 1.07 2.09 0.79 1.54 1.89 3.68 1.16 2.24 0.84 1.62
Sprint 1.76 3.45 1.06 2.08 0.78 1.52 1.88 3.67 1.15 2.23 0.83 1.611987
AT&T 1.51 2.96 0.94 1.84 0.71 1.39 1.58 3.08 0.98 1.91 0.74 1.45MCI 1.47 2.91 0.91 1.81 0.69 1.37 1.53 3.02 0.96 1.89 0.71 1.42
Sprint 1.48 2.93 0.92 1.82 0.69 1.38 1.54 3.04 0.96 1.89 0.73 1.431988
AT&T 1.34 2.64 0.87 1.72 0.67 1.32 1.40 2.75 0.91 1.79 0.70 1.38MCI 1.37 2.71 0.89 1.77 0.69 1.36 1.41 2.80 0.94 1.85 0.71 1.41
Sprint 1.38 2.73 0.90 1.78 0.69 1.36 1.44 2.84 0.95 1.86 0.72 1.421989
AT&T 1.25 2.50 0.84 1.68 0.65 1.30 1.25 2.50 0.84 1.68 0.67 1.33MCI 1.22 2.45 0.77 1.55 0.62 1.25 1.22 2.45 0.77 1.55 0.62 1.25
Sprint 1.22 2.45 0.77 1.55 0.62 1.25 1.22 2.45 0.77 1.55 0.62 1.251990
AT&T 1.25 2.49 0.75 1.50 0.67 1.33 1.25 2.49 0.75 1.50 0.68 1.36MCI 1.20 2.40 0.70 1.40 0.62 1.25 1.20 2.40 0.70 1.40 0.62 1.25
Sprint 1.20 2.40 0.70 1.40 0.65 1.30 1.20 2.40 0.70 1.40 0.65 1.301991
AT&T 1.22 2.44 0.75 1.50 0.67 1.33 1.23 2.46 0.75 1.50 0.68 1.36MCI 1.20 2.40 0.70 1.40 0.65 1.30 1.20 2.40 0.70 1.40 0.65 1.30
Sprint 1.20 2.40 0.70 1.40 0.65 1.30 1.20 2.40 0.70 1.40 0.65 1.301992
AT&T 1.20 2.40 0.75 1.50 0.65 1.30 1.25 2.50 0.75 1.50 0.65 1.30MCI 1.19 2.39 0.74 1.48 0.63 1.25 1.24 2.48 0.74 1.48 0.63 1.25
Sprint 1.20 2.40 0.75 1.50 0.65 1.30 1.25 2.50 0.75 1.50 0.65 1.301993
AT&T Bus 1.29 2.58 0.80 1.60 0.80 1.60 1.29 2.58 0.80 1.60 0.80 1.60MCI Bus 1.26 2.52 0.80 1.60 0.80 1.60 1.27 2.53 0.80 1.60 0.80 1.60
Sprint Bus 1.26 2.52 0.80 1.60 0.80 1.60 1.27 2.53 0.80 1.60 0.80 1.60AT&T Res 1.25 2.50 0.75 1.50 0.65 1.30 1.25 2.50 0.75 1.50 0.65 1.30
MCI Res 1.20 2.40 0.74 1.48 0.64 1.29 1.20 2.40 0.74 1.48 0.64 1.29Sprint Res 1.25 2.50 0.75 1.50 0.65 1.30 1.20 2.40 0.75 1.50 0.65 1.301994
AT&T Bus 1.49 2.98 0.92 1.85 0.92 1.85 1.49 2.98 0.92 1.85 0.92 1.85MCI Bus 1.31 2.62 0.91 1.82 0.91 1.82 1.31 2.63 0.91 1.82 0.91 1.82
Sprint Bus 1.31 2.62 0.91 1.82 0.91 1.82 1.31 2.63 0.91 1.82 0.91 1.82AT&T Res 1.35 2.70 0.85 1.70 0.70 1.40 1.40 2.80 0.85 1.70 0.75 1.50
MCI Res 1.35 2.70 0.85 1.70 0.70 1.40 1.40 2.80 0.85 1.70 0.75 1.50Sprint Res 1.35 2.70 0.85 1.70 0.70 1.40 1.40 2.80 0.85 1.70 0.75 1.501995
AT&T Bus 1.59 3.19 1.00 1.99 1.00 1.99 1.59 3.19 1.00 1.99 1.00 1.99MCI Bus 1.47 2.95 0.92 1.84 0.92 1.84 1.47 2.95 0.92 1.84 0.92 1.84
Sprint Bus 1.35 2.70 0.85 1.70 0.70 1.40 1.40 2.80 0.85 1.70 0.75 1.50AT&T Res 1.35 2.70 0.85 1.70 0.70 1.40 1.40 2.80 0.85 1.70 0.75 1.50
MCI Res 1.35 2.70 0.85 1.70 0.70 1.40 1.40 2.80 0.85 1.70 0.75 1.50Sprint Res 1.35 2.70 0.85 1.70 0.70 1.40 1.40 2.80 0.85 1.70 0.75 1.501996
AT&T Bus 1.75 3.51 1.10 2.19 1.10 2.19 1.75 3.51 1.10 2.19 1.10 2.19MCI Bus 1.74 3.50 1.08 2.18 1.08 2.18 1.74 3.50 1.08 2.18 1.08 2.18
Sprint Bus 1.50 3.00 0.95 1.90 0.80 1.60 1.55 3.10 0.95 1.90 0.80 1.60AT&T Res 1.50 3.00 0.95 1.90 0.80 1.60 1.55 3.10 0.95 1.90 0.80 1.60
MCI Res 1.45 2.90 0.95 1.90 0.80 1.60 1.55 3.10 0.95 1.90 0.80 1.60Sprint Res 1.50 3.00 0.95 1.90 0.80 1.60 1.55 3.10 0.95 1.90 0.80 1.601997
AT&T Bus 1.82 3.64 1.82 3.64 1.82 3.64 1.82 3.64 1.82 3.64 1.82 3.64MCI Bus 1.89 3.78 1.42 2.84 1.42 2.84 1.89 3.78 1.42 2.84 1.42 2.84
Sprint Bus 1.50 3.00 0.95 1.90 0.80 1.60 1.55 3.10 0.95 1.90 0.80 1.60AT&T Res 1.40 2.80 0.80 1.60 0.65 1.30 1.40 2.80 0.80 1.60 0.65 1.30
MCI Res 1.45 2.90 0.90 1.80 0.90 1.80 1.45 2.90 0.90 1.80 0.90 1.80Sprint Res 1.50 3.00 0.95 1.90 0.80 1.60 1.55 3.10 0.95 1.90 0.80 1.601998
AT&T Bus 1.82 3.64 1.82 3.64 1.82 3.64 1.82 3.64 1.82 3.64 1.82 3.64MCI Bus 1.94 3.87 1.45 2.90 1.45 2.90 1.94 3.87 1.45 2.90 1.45 2.90
Sprint Bus 1.50 3.00 0.95 1.90 0.80 1.60 1.55 3.10 0.95 1.90 0.80 1.60AT&T Res 1.40 2.80 0.80 1.60 0.65 1.30 1.40 2.80 0.80 1.60 0.65 1.30
MCI Res 1.45 2.90 0.90 1.80 0.90 1.80 1.45 2.90 0.90 1.80 0.90 1.80Sprint Res 1.50 3.00 0.95 1.90 0.80 1.60 1.55 3.10 0.95 1.90 0.80 1.601999
AT&T Bus 2.02 4.04 2.02 4.04 2.02 4.04 2.02 4.04 2.02 4.04 2.02 4.04MCI Bus 2.15 4.30 1.61 3.22 1.61 3.22 2.15 4.30 1.61 3.22 1.61 3.22
Sprint Bus 1.50 3.00 0.95 1.90 0.80 1.60 1.55 3.10 0.95 1.90 0.80 1.60AT&T Res 1.30 2.60 0.80 1.60 0.58 1.15 1.30 2.60 0.80 1.60 0.58 1.15
MCI Res 1.45 2.90 0.90 1.80 0.90 1.80 1.45 2.90 0.90 1.80 0.90 1.80Sprint Res 1.50 3.00 0.95 1.90 0.80 1.60 1.55 3.10 0.95 1.90 0.80 1.602000
AT&T Bus 2.31 4.61 2.31 4.61 2.31 4.61 2.31 4.61 2.31 4.61 2.31 4.61MCI Bus 2.35 4.70 1.76 3.52 1.76 3.52 2.35 4.70 1.76 3.52 1.76 3.52
Sprint Bus 1.98 3.96 1.24 2.47 1.24 2.47 1.98 3.96 1.24 2.47 1.24 2.47AT&T Res 1.48 2.95 1.13 2.25 0.73 1.45 1.48 2.95 1.13 2.25 0.73 1.45
MCI Res 1.50 3.00 1.25 2.50 1.25 2.50 1.50 3.00 1.25 2.50 1.25 2.50Sprint Res 1.80 3.60 1.25 2.50 0.80 1.60 1.85 3.70 1.25 2.50 0.80 1.60
215

Statistics of Communications Common CarriersTable 4.11 - Comparative Historical Rates at Year End, 1985 through 2000
Interstate Message Toll Telephone Rates (Five and Ten Minute Calls) - ContinuedBetween Chicago, IL and
Detroit, MI San Francisco, CA Philadelphia, PADay Evening Night/Weekend Day Evening Night/Weekend Day Evening Night/Weekend
Dec 31 Five Ten Five Ten Five Ten Five Ten Five Ten Five Ten Five Ten Five Ten Five Ten
1985AT&T 1.91 3.66 1.15 2.20 0.76 1.46 2.12 4.07 1.27 2.44 0.85 1.63 2.07 3.97 1.24 2.38 0.83 1.59
MCI 1.75 3.48 1.05 2.09 0.70 1.39 2.03 3.96 1.24 2.40 0.83 1.60 1.97 3.84 1.19 2.32 0.79 1.55Sprint 1.81 3.45 1.11 2.13 0.75 1.45 1.98 3.80 1.23 2.36 0.83 1.59 1.93 3.70 1.20 2.30 0.81 1.56
1986AT&T 1.64 3.14 0.98 1.88 0.72 1.38 1.84 3.54 1.10 2.12 0.81 1.56 1.79 3.44 1.07 2.06 0.79 1.51
MCI 1.55 3.04 0.91 1.80 0.66 1.31 1.77 3.46 1.07 2.09 0.79 1.54 1.72 3.35 1.04 2.03 0.76 1.48Sprint 1.54 3.03 0.90 1.79 0.65 1.30 1.76 3.45 1.06 2.08 0.78 1.52 1.71 3.34 1.03 2.02 0.75 1.47
1987AT&T 1.31 2.56 0.81 1.59 0.62 1.20 1.51 2.96 0.94 1.84 0.71 1.39 1.50 2.95 0.93 1.83 0.71 1.39
MCI 1.27 2.51 0.72 1.44 0.60 1.18 1.47 2.91 0.91 1.81 0.69 1.37 1.46 2.90 0.90 1.80 0.69 1.37Sprint 1.27 2.52 0.79 1.56 0.52 1.04 1.48 2.93 0.92 1.82 0.69 1.38 1.37 2.92 0.92 1.81 0.69 1.37
1988AT&T 1.19 2.34 0.77 1.52 0.60 1.17 1.34 2.64 0.87 1.72 0.67 1.32 1.34 2.64 0.87 1.72 0.67 1.32
MCI 1.20 2.40 0.72 1.44 0.59 1.35 1.37 2.71 0.89 1.77 0.69 1.36 1.35 2.69 0.88 1.75 0.68 1.35Sprint 1.20 2.40 0.79 1.56 0.52 1.04 1.38 2.73 0.90 1.78 0.69 1.36 1.37 2.71 0.89 1.77 0.68 1.36
1989AT&T 1.15 2.30 0.77 1.54 0.61 1.22 1.25 2.50 0.84 1.68 0.65 1.30 1.20 2.40 0.80 1.61 0.63 1.26
MCI 1.07 2.15 0.72 1.45 0.57 1.15 1.22 2.45 0.77 1.55 0.62 1.25 1.17 2.35 0.77 1.55 0.61 1.22Sprint 1.12 2.25 0.72 1.45 0.57 1.15 1.22 2.45 0.77 1.55 0.62 1.25 1.17 2.35 0.77 1.55 0.61 1.22
1990AT&T 1.08 2.15 0.73 1.46 0.61 1.22 1.25 2.49 0.75 1.50 0.67 1.33 1.20 2.39 0.75 1.49 0.65 1.31
MCI 1.05 2.10 0.69 1.38 0.57 1.15 1.20 2.40 0.70 1.40 0.62 1.25 1.15 2.30 0.70 1.40 0.61 1.22Sprint 1.05 2.10 0.70 1.40 0.60 1.20 1.20 2.40 0.70 1.40 0.65 1.30 1.15 2.30 0.70 1.40 0.62 1.25
1991AT&T 1.05 2.10 0.73 1.45 0.61 1.22 1.22 2.44 0.75 1.50 0.67 1.33 1.15 2.30 0.75 1.50 0.65 1.31
MCI 1.05 2.10 0.67 1.35 0.60 1.20 1.20 2.40 0.70 1.40 0.65 1.30 1.15 2.30 0.70 1.40 0.65 1.30Sprint 1.05 2.10 0.70 1.40 0.60 1.20 1.20 2.40 0.70 1.40 0.65 1.30 1.15 2.30 0.70 1.40 0.65 1.30
1992AT&T 1.10 2.20 0.70 1.40 0.65 1.30 1.20 2.40 0.75 1.50 0.65 1.30 1.15 2.30 0.70 1.40 0.65 1.30
MCI 1.10 2.20 0.67 1.35 0.59 1.18 1.19 2.39 0.74 1.48 0.63 1.25 1.15 2.30 0.70 1.40 0.63 1.25Sprint 1.10 2.20 0.70 1.40 0.65 1.30 1.20 2.40 0.75 1.50 0.65 1.30 1.15 2.30 0.70 1.40 0.65 1.30
1993AT&T Bus 1.20 2.40 0.75 1.50 0.75 1.50 1.29 2.58 0.80 1.60 0.80 1.60 1.20 2.40 0.75 1.50 0.75 1.50
MCI Bus 1.18 2.36 0.75 1.50 0.75 1.50 1.26 2.52 0.80 1.60 0.80 1.60 1.18 2.36 0.75 1.50 0.75 1.50Sprint Bus 1.18 2.36 0.75 1.50 0.75 1.50 1.26 2.52 0.80 1.60 0.80 1.60 1.18 2.36 0.75 1.50 0.75 1.50AT&T Res 1.20 2.40 0.75 1.50 0.65 1.30 1.25 2.50 0.75 1.50 0.65 1.30 1.20 2.40 0.75 1.50 0.65 1.30
MCI Res 1.20 2.40 0.74 1.48 0.62 1.18 1.25 2.50 0.74 1.49 0.64 1.29 1.20 2.40 0.74 1.48 0.64 1.29Sprint Res 1.20 2.40 0.75 1.50 0.65 1.30 1.25 2.50 0.75 1.50 0.65 1.30 1.20 2.40 0.75 1.50 0.65 1.301994AT&T Bus 1.38 2.77 0.87 1.73 0.87 1.73 1.49 2.98 0.92 1.85 0.92 1.85 1.38 2.77 0.87 1.73 0.87 1.73
MCI Bus 1.23 2.45 0.82 1.65 0.82 1.65 1.31 2.62 0.91 1.82 0.91 1.82 1.25 2.51 0.87 1.74 0.87 1.74Sprint Bus 1.23 2.45 0.82 1.65 0.82 1.65 1.31 2.62 0.91 1.82 0.91 1.82 1.25 2.51 0.87 1.74 0.87 1.74AT&T Res 1.35 2.70 0.80 1.60 0.70 1.40 1.35 2.70 0.85 1.70 0.70 1.40 1.35 2.70 0.85 1.70 0.70 1.40
MCI Res 1.35 2.70 0.80 1.60 0.70 1.40 1.35 2.70 0.85 1.70 0.70 1.40 1.35 2.70 0.85 1.70 0.70 1.40Sprint Res 1.35 2.70 0.80 1.60 0.70 1.40 1.35 2.70 0.85 1.70 0.70 1.40 1.35 2.70 0.85 1.70 0.70 1.401995AT&T Bus 1.52 3.04 0.95 1.91 0.95 1.91 1.59 3.19 1.00 1.99 1.00 1.99 1.52 3.04 0.95 1.91 0.95 1.91
MCI Bus 1.41 2.82 0.88 1.77 0.88 1.77 1.47 2.95 0.92 1.84 0.92 1.84 1.41 2.82 0.88 1.77 0.88 1.77Sprint Bus 1.35 2.70 0.80 1.60 0.70 1.40 1.35 2.70 0.85 1.70 0.70 1.40 1.35 2.70 0.85 1.70 0.70 1.40AT&T Res 1.35 2.70 0.80 1.60 0.70 1.40 1.35 2.70 0.85 1.70 0.70 1.40 1.35 2.70 0.85 1.70 0.70 1.40
MCI Res 1.35 2.70 0.80 1.60 0.70 1.40 1.35 2.70 0.85 1.70 0.70 1.40 1.35 2.70 0.85 1.70 0.70 1.40Sprint Res 1.35 2.70 0.80 1.60 0.70 1.40 1.35 2.70 0.85 1.70 0.70 1.40 1.35 2.70 0.85 1.70 0.70 1.401996AT&T Bus 1.67 3.35 1.05 2.10 1.05 2.10 1.75 3.51 1.10 2.19 1.10 2.19 1.67 3.35 1.05 2.10 1.05 2.10
MCI Bus 1.66 3.34 1.04 2.09 1.04 2.09 1.74 3.50 1.08 2.18 1.08 2.18 1.66 3.34 1.04 2.09 1.04 2.09Sprint Bus 1.45 2.90 0.85 1.70 0.75 1.50 1.50 3.00 0.95 1.90 0.80 1.60 1.50 3.00 0.95 1.90 0.80 1.60AT&T Res 1.45 2.90 0.85 1.70 0.75 1.50 1.50 3.00 0.95 1.90 0.80 1.60 1.50 3.00 0.95 1.90 0.80 1.60
MCI Res 1.40 2.80 0.85 1.70 0.75 1.50 1.45 2.90 0.95 1.90 0.80 1.60 1.45 2.90 0.95 1.90 0.80 1.60Sprint Res 1.45 2.90 0.85 1.70 0.75 1.50 1.50 3.00 0.95 1.90 0.80 1.60 1.50 3.00 0.95 1.90 0.80 1.601997AT&T Bus 1.82 3.64 1.82 3.64 1.82 3.64 1.82 3.64 1.82 3.64 1.82 3.64 1.82 3.64 1.82 3.64 1.82 3.64
MCI Bus 1.89 3.78 1.42 2.84 1.42 2.84 1.89 3.78 1.42 2.84 1.42 2.84 1.89 3.78 1.42 2.84 1.42 2.84Sprint Bus 1.45 2.90 0.85 1.70 0.75 1.50 1.50 3.00 0.95 1.90 0.80 1.60 1.50 3.00 0.95 1.90 0.80 1.60AT&T Res 1.40 2.80 0.80 1.60 0.65 1.30 1.40 2.80 0.80 1.60 0.65 1.30 1.40 2.80 0.80 1.60 0.65 1.30
MCI Res 1.45 2.90 0.90 1.80 0.90 1.80 1.45 2.90 0.90 1.80 0.90 1.80 1.45 2.90 0.90 1.80 0.90 1.80Sprint Res 1.45 2.90 0.85 1.70 0.75 1.50 1.50 3.00 0.95 1.90 0.80 1.60 1.50 3.00 0.95 1.90 0.80 1.601998AT&T Bus 1.82 3.64 1.82 3.64 1.82 3.64 1.82 3.64 1.82 3.64 1.82 3.64 1.82 3.64 1.82 3.64 1.82 3.64
MCI Bus 1.94 3.87 1.45 2.90 1.45 2.90 1.94 3.87 1.45 2.90 1.45 2.90 1.94 3.87 1.45 2.90 1.45 2.90Sprint Bus 1.45 2.90 0.85 1.70 0.75 1.50 1.50 3.00 0.95 1.90 0.80 1.60 1.50 3.00 0.95 1.90 0.80 1.60AT&T Res 1.40 2.80 0.80 1.60 0.65 1.30 1.40 2.80 0.80 1.60 0.65 1.30 1.40 2.80 0.80 1.60 0.65 1.30
MCI Res 1.45 2.90 0.90 1.80 0.90 1.80 1.45 2.90 0.90 1.80 0.90 1.80 1.45 2.90 0.90 1.80 0.90 1.80Sprint Res 1.45 2.90 0.85 1.70 0.75 1.50 1.50 3.00 0.95 1.90 0.80 1.60 1.50 3.00 0.95 1.90 0.80 1.601999AT&T Bus 2.02 4.04 2.02 4.04 2.02 4.04 2.02 4.04 2.02 4.04 2.02 4.04 2.02 4.04 2.02 4.04 2.02 4.04
MCI Bus 2.15 4.30 1.61 3.22 1.61 3.22 2.15 4.30 1.61 3.22 1.61 3.22 2.15 4.30 1.61 3.22 1.61 3.22Sprint Bus 1.45 2.90 0.85 1.70 0.75 1.50 1.50 3.00 0.95 1.90 0.80 1.60 1.50 3.00 0.95 1.90 0.80 1.60AT&T Res 1.30 2.60 0.80 1.60 0.58 1.15 1.30 2.60 0.80 1.60 0.58 1.15 1.30 2.60 0.80 1.60 0.58 1.15
MCI Res 1.45 2.90 0.90 1.80 0.90 1.80 1.45 2.90 0.90 1.80 0.90 1.80 1.45 2.90 0.90 1.80 0.90 1.80Sprint Res 1.45 2.90 0.85 1.70 0.75 1.50 1.50 3.00 0.95 1.90 0.80 1.60 1.50 3.00 0.95 1.90 0.80 1.602000AT&T Bus 2.31 4.61 2.31 4.61 2.31 4.61 2.31 4.61 2.31 4.61 2.31 4.61 2.31 4.61 2.31 4.61 2.31 4.61
MCI Bus 2.35 4.70 1.76 3.52 1.76 3.52 2.35 4.70 1.76 3.52 1.76 3.52 2.35 4.70 1.76 3.52 1.76 3.52Sprint Bus 1.89 3.78 1.19 2.37 1.19 2.37 1.98 3.96 1.24 2.47 1.24 2.47 1.89 3.78 1.19 2.37 1.19 2.37AT&T Res 1.48 2.95 1.13 2.25 0.73 1.45 1.48 2.95 1.13 2.25 0.73 1.45 1.48 2.95 1.13 2.25 0.73 1.45
MCI Res 1.50 3.00 1.25 2.50 1.25 2.50 1.50 3.00 1.25 2.50 1.25 2.50 1.50 3.00 1.25 2.50 1.25 2.50Sprint Res 1.75 3.50 1.15 2.30 0.70 1.40 1.80 3.60 1.25 2.50 0.80 1.60 1.80 3.60 1.25 2.50 0.80 1.60
216

Statistics of Communications Common CarriersTable 4.11 - Comparative Historical Rates at Year End, 1985 through 2000
Interstate Message Toll Telephone Rates (Five and Ten Minute Calls) - ContinuedBetween Chicago IL and
Dallas and Houston, TX Boston, MADay Evening Night/Weekend Day Evening Night/Weekend
Dec 31 Five Ten Five Ten Five Ten Five Ten Five Ten Five Ten1985
AT&T 2.07 3.97 1.24 2.38 0.83 1.59 2.07 3.97 1.24 2.38 0.83 1.59MCI 1.97 3.84 1.19 2.32 0.79 1.55 1.97 3.84 1.19 2.32 0.79 1.55
Sprint 1.93 3.70 1.20 2.30 0.81 1.56 1.93 3.70 1.20 2.30 0.81 1.561986
AT&T 1.79 3.44 1.07 2.06 0.79 1.51 1.79 3.44 1.07 2.06 0.79 1.51MCI 1.72 3.35 1.04 2.03 0.76 1.48 1.72 3.35 1.04 2.03 0.76 1.48
Sprint 1.71 3.34 1.03 2.02 0.75 1.47 1.71 3.34 1.03 2.02 0.75 1.471987
AT&T 1.50 2.95 0.93 1.83 0.71 1.39 1.50 2.95 0.93 1.83 0.71 1.39MCI 1.46 2.90 0.90 1.80 0.69 1.37 1.46 2.90 0.90 1.80 0.69 1.37
Sprint 1.37 2.92 0.92 1.81 0.69 1.37 1.37 2.92 0.92 1.81 0.69 1.371988
AT&T 1.34 2.64 0.87 1.72 0.67 1.32 1.34 2.64 0.87 1.72 0.67 1.32MCI 1.35 2.69 0.88 1.75 0.68 1.35 1.35 0.69 0.88 1.75 0.68 1.35
Sprint 1.37 2.71 0.89 1.77 0.68 1.36 1.37 2.71 0.89 1.77 0.68 1.361989
AT&T 1.20 2.40 0.80 1.61 0.63 1.26 1.20 2.40 0.80 1.61 0.63 1.26MCI 1.17 2.35 0.77 1.55 0.61 1.22 1.17 2.35 0.77 1.55 0.61 1.22
Sprint 1.17 2.35 0.77 1.55 0.61 1.22 1.17 2.35 0.77 1.55 0.61 1.221990
AT&T 1.20 2.39 0.75 1.49 0.65 1.31 1.20 2.39 0.75 1.49 0.65 1.31MCI 1.15 2.30 0.70 1.40 0.61 1.22 1.15 2.30 0.70 1.40 0.61 1.22
Sprint 1.15 2.30 0.70 1.40 0.62 1.25 1.15 2.30 0.70 1.40 0.62 1.251991
AT&T 1.15 2.30 0.75 1.50 0.65 1.31 1.15 2.30 0.75 1.50 0.65 1.31MCI 1.15 2.30 0.70 1.40 0.65 1.30 1.15 2.30 0.70 1.40 0.65 1.30
Sprint 1.15 2.30 0.70 1.40 0.65 1.30 1.15 2.30 0.70 1.40 0.65 1.301992
AT&T 1.15 2.30 0.70 1.40 0.65 1.30 1.15 2.30 0.70 1.40 0.65 1.30MCI 1.15 2.30 0.70 1.40 0.63 1.25 1.15 2.30 0.70 1.40 0.63 1.25
Sprint 1.15 2.30 0.70 1.40 0.65 1.30 1.15 2.30 0.70 1.40 0.65 1.301993
AT&T Bus 1.20 2.40 0.75 1.50 0.75 1.50 1.20 2.40 0.75 1.50 0.75 1.50MCI Bus 1.18 2.36 0.75 1.50 0.75 1.50 1.18 2.36 0.75 1.50 0.75 1.50
Sprint Bus 1.18 2.36 0.75 1.50 0.75 1.50 1.18 2.36 0.75 1.50 0.75 1.50AT&T Res 1.20 2.40 0.75 1.50 0.65 1.30 1.20 2.40 0.75 1.50 0.65 1.30
MCI Res 1.20 2.40 0.74 1.48 0.64 1.29 1.20 2.40 0.74 1.48 0.64 1.29Sprint Res 1.20 2.40 0.75 1.50 0.65 1.30 1.25 2.40 0.75 1.50 0.65 1.301994
AT&T Bus 1.38 2.77 0.87 1.73 0.87 1.73 1.38 2.77 0.87 1.73 0.87 1.73MCI Bus 1.25 2.51 0.87 1.74 0.87 1.74 1.25 2.51 0.87 1.74 0.87 1.74
Sprint Bus 1.25 2.51 0.87 1.74 0.87 1.74 1.25 2.51 0.87 1.74 0.87 1.74AT&T Res 1.35 2.70 0.85 1.70 0.70 1.40 1.35 2.70 0.85 1.70 0.70 1.40
MCI Res 1.35 2.70 0.85 1.70 0.70 1.40 1.35 2.70 0.85 1.70 0.70 1.40Sprint Res 1.35 2.70 0.85 1.70 0.70 1.40 1.35 2.70 0.85 1.70 0.70 1.401995
AT&T Bus 1.52 3.04 0.95 1.91 0.95 1.91 1.52 3.04 0.95 1.91 0.95 1.91MCI Bus 1.41 2.82 0.88 1.77 0.88 1.77 1.41 2.82 0.88 1.77 0.88 1.77
Sprint Bus 1.35 2.70 0.85 1.70 0.70 1.40 1.35 2.70 0.85 1.70 0.70 1.40AT&T Res 1.35 2.70 0.85 1.70 0.70 1.40 1.35 2.70 0.85 1.70 0.70 1.40
MCI Res 1.35 2.70 0.85 1.70 0.70 1.40 1.35 2.70 0.85 1.70 0.70 1.40Sprint Res 1.35 2.70 0.85 1.70 0.70 1.40 1.35 2.70 0.85 1.70 0.70 1.401996
AT&T Bus 1.67 3.35 1.05 2.10 1.05 2.10 1.67 3.35 1.05 2.10 1.05 2.10MCI Bus 1.66 3.34 1.04 2.09 1.04 2.09 1.66 3.34 1.04 2.09 1.04 2.09
Sprint Bus 1.50 3.00 0.95 1.90 0.80 1.60 1.50 3.00 0.95 1.90 0.80 1.60AT&T Res 1.50 3.00 0.95 1.90 0.80 1.60 1.50 3.00 0.95 1.90 0.80 1.60
MCI Res 1.45 2.90 0.95 1.90 0.80 1.60 1.45 2.90 0.95 1.90 0.80 1.60Sprint Res 1.50 3.00 0.95 1.90 0.80 1.60 1.50 3.00 0.95 1.90 0.80 1.601997
AT&T Bus 1.82 3.64 1.82 3.64 1.82 3.64 1.82 3.64 1.82 3.64 1.82 3.64MCI Bus 1.89 3.78 1.42 2.84 1.42 2.84 1.89 3.78 1.42 2.84 1.42 2.84
Sprint Bus 1.50 3.00 0.95 1.90 0.80 1.60 1.50 3.00 0.95 1.90 0.80 1.60AT&T Res 1.40 2.80 0.80 1.60 0.65 1.30 1.40 2.80 0.80 1.60 0.65 1.30
MCI Res 1.45 2.90 0.90 1.80 0.90 1.80 1.45 2.90 0.90 1.80 0.90 1.80Sprint Res 1.50 3.00 0.95 1.90 0.80 1.60 1.50 3.00 0.95 1.90 0.80 1.601998
AT&T Bus 1.82 3.64 1.82 3.64 1.82 3.64 1.82 3.64 1.82 3.64 1.82 3.64MCI Bus 1.94 3.87 1.45 2.90 1.45 2.90 1.94 3.87 1.45 2.90 1.45 2.90
Sprint Bus 1.50 3.00 0.95 1.90 0.80 1.60 1.50 3.00 0.95 1.90 0.80 1.60AT&T Res 1.40 2.80 0.80 1.60 0.65 1.30 1.40 2.80 0.80 1.60 0.65 1.30
MCI Res 1.45 2.90 0.90 1.80 0.90 1.80 1.45 2.90 0.90 1.80 0.90 1.80Sprint Res 1.50 3.00 0.95 1.90 0.80 1.60 1.50 3.00 0.95 1.90 0.80 1.601999
AT&T Bus 2.02 4.04 2.02 4.04 2.02 4.04 2.02 4.04 2.02 4.04 2.02 4.04MCI Bus 2.15 4.30 1.61 3.22 1.61 3.22 2.15 4.30 1.61 3.22 1.61 3.22
Sprint Bus 1.50 3.00 0.95 1.90 0.80 1.60 1.50 3.00 0.95 1.90 0.80 1.60AT&T Res 1.30 2.60 0.80 1.60 0.58 1.15 1.30 2.60 0.80 1.60 0.58 1.15
MCI Res 1.45 2.90 0.90 1.80 0.90 1.80 1.45 2.90 0.90 1.80 0.90 1.80Sprint Res 1.50 3.00 0.95 1.90 0.80 1.60 1.50 3.00 0.95 1.90 0.80 1.602000
AT&T Bus 2.31 4.61 2.31 4.61 2.31 4.61 2.31 4.61 2.31 4.61 2.31 4.61MCI Bus 2.35 4.70 1.76 3.52 1.76 3.52 2.35 4.70 1.76 3.52 1.76 3.52
Sprint Bus 1.89 3.78 1.19 2.37 1.19 2.37 1.89 3.78 1.19 2.37 1.19 2.37AT&T Res 1.48 2.95 1.13 2.25 0.73 1.45 1.48 2.95 1.13 2.25 0.73 1.45
MCI Res 1.50 3.00 1.25 2.50 1.25 2.50 1.50 3.00 1.25 2.50 1.25 2.50Sprint Res 1.80 3.60 1.25 2.50 0.80 1.60 1.80 3.60 1.25 2.50 0.80 1.60
217

Statistics of Communications Common CarriersTable 4.11 - Comparative Historical Rates at Year End, 1985 through 2000
Interstate Message Toll Telephone Rates (Five and Ten Minute Calls) - ContinuedBetween Philadelphia, PA and
Detroit, MI San Francisco, CA Dallas and Houston, TXDay Evening Night/Weekend Day Evening Night/Weekend Day Evening Night/Weekend
Dec 31 Five Ten Five Ten Five Ten Five Ten Five Ten Five Ten Five Ten Five Ten Five Ten
1985AT&T 2.07 3.97 1.24 2.38 0.83 1.59 2.33 4.43 1.40 2.66 0.93 1.77 2.12 4.07 1.27 2.44 0.85 1.63
MCI 1.97 3.84 1.19 2.32 0.79 1.55 2.20 4.28 1.34 2.59 0.88 1.71 2.03 3.96 1.24 2.40 0.83 1.60Sprint 1.93 3.70 1.20 2.30 0.81 1.56 2.17 4.10 1.34 2.56 0.91 1.73 1.98 3.80 1.23 2.36 0.83 1.59
1986AT&T 1.79 3.44 1.07 2.06 0.79 1.51 1.99 3.79 1.19 2.27 0.88 1.67 1.84 3.54 1.10 2.12 0.81 1.56
MCI 1.72 3.35 1.04 2.03 0.76 1.48 1.89 3.68 1.16 2.24 0.84 1.62 1.77 3.46 1.07 2.09 0.79 1.54Sprint 1.71 3.34 1.03 2.02 0.75 1.47 1.88 3.67 1.15 2.23 0.83 1.61 1.76 3.45 1.06 2.08 0.78 1.52
1987AT&T 1.50 2.95 0.93 1.83 0.71 1.39 1.58 3.08 0.98 1.91 0.74 1.45 1.51 2.96 0.94 1.84 0.71 1.39
MCI 1.46 2.90 0.90 1.80 0.69 1.37 1.53 3.02 0.96 1.89 0.71 1.42 1.47 2.91 0.91 1.81 0.69 1.37Sprint 1.37 2.92 0.92 1.81 0.69 1.37 1.54 3.04 0.96 1.89 0.73 1.43 1.48 2.93 0.92 1.82 0.69 1.38
1988AT&T 1.34 2.64 0.87 1.72 0.67 1.32 1.40 2.75 0.91 1.79 0.70 1.38 1.34 2.64 0.87 1.72 0.67 1.32
MCI 1.35 2.69 0.88 1.75 0.68 1.35 1.41 2.80 0.94 1.85 0.71 1.41 1.37 2.71 0.89 1.77 0.69 1.36Sprint 1.37 2.71 0.89 1.77 0.68 1.36 1.44 2.84 0.95 1.86 0.72 1.42 1.38 2.73 0.90 1.78 0.68 1.36
1989AT&T 1.20 2.40 0.80 1.61 0.63 1.26 1.25 2.50 0.84 1.68 0.67 1.33 1.25 2.50 0.84 1.68 0.65 1.30
MCI 1.17 2.35 0.77 1.55 0.61 1.22 1.22 2.45 0.77 1.55 0.62 1.25 1.22 2.45 0.77 1.55 0.62 1.25Sprint 1.17 2.35 0.77 1.55 0.61 1.22 1.22 2.45 0.77 1.55 0.62 1.25 1.22 2.45 0.77 1.55 0.62 1.25
1990AT&T 1.20 2.39 0.75 1.49 0.65 1.31 1.25 2.49 0.75 1.50 0.68 1.36 1.25 2.49 0.75 1.50 0.67 1.33
MCI 1.15 2.30 0.70 1.40 0.61 1.22 1.20 2.40 0.70 1.40 0.62 1.25 1.20 2.40 0.70 1.40 0.62 1.25Sprint 1.15 2.30 0.70 1.40 0.62 1.25 1.20 2.40 0.70 1.40 0.65 1.30 1.20 2.40 0.70 1.40 0.65 1.30
1991AT&T 1.15 2.30 0.75 1.50 0.65 1.31 1.23 2.46 0.75 1.50 0.68 1.36 1.22 2.44 0.75 1.50 0.67 1.33
MCI 1.15 2.30 0.70 1.40 0.65 1.30 1.20 2.40 0.70 1.40 0.65 1.30 1.20 2.40 0.70 1.40 0.65 1.30Sprint 1.15 2.30 0.70 1.40 0.65 1.30 1.20 2.40 0.70 1.40 0.65 1.30 1.20 2.40 0.70 1.40 0.65 1.30
1992AT&T 1.15 2.30 0.70 1.40 0.65 1.30 1.25 2.50 0.75 1.50 0.65 1.30 1.20 2.40 0.75 1.50 0.65 1.30
MCI 1.15 2.30 0.70 1.40 0.63 1.25 1.24 2.48 0.74 1.48 0.63 1.25 1.19 2.39 0.74 1.48 0.63 1.25Sprint 1.15 2.30 0.70 1.40 0.65 1.30 1.25 2.50 0.75 1.50 0.65 1.30 1.20 2.40 0.75 1.50 0.65 1.30
1993AT&T Bus 1.20 2.40 0.75 1.50 0.75 1.50 1.29 2.58 0.80 1.60 0.80 1.60 1.29 2.58 0.80 1.60 0.80 1.60
MCI Bus 1.18 2.36 0.75 1.50 0.75 1.50 1.27 2.53 0.80 1.60 0.80 1.60 1.26 2.52 0.80 1.60 0.80 1.60Sprint Bus 1.18 2.36 0.75 1.50 0.75 1.50 1.26 2.52 0.80 1.60 0.80 1.60 1.80 2.36 0.75 1.50 0.75 1.50AT&T Res 1.20 2.40 0.75 1.50 0.65 1.30 1.25 2.50 0.75 1.50 0.65 1.30 1.25 2.50 0.75 1.50 0.65 1.30
MCI Res 1.20 2.40 0.74 1.48 0.64 1.29 1.25 2.50 0.74 1.49 0.64 1.29 1.25 2.50 0.74 1.49 0.64 1.29Sprint Res 1.20 2.40 0.75 1.50 0.65 1.30 1.25 2.50 0.75 1.50 0.65 1.30 1.25 2.50 0.75 1.50 0.65 1.301994AT&T Bus 1.38 2.77 0.87 1.73 0.87 1.73 1.49 2.98 0.92 1.85 0.92 1.85 1.49 2.98 0.92 1.85 0.92 1.85
MCI Bus 1.25 2.51 0.87 1.74 0.87 1.74 1.31 2.63 0.91 1.82 0.91 1.82 1.31 2.62 0.91 1.82 0.91 1.82Sprint Bus 1.25 2.51 0.87 1.74 0.87 1.74 1.31 2.63 0.91 1.82 0.91 1.82 1.31 2.62 0.91 1.82 0.91 1.82AT&T Res 1.35 2.70 0.85 1.70 0.70 1.40 1.40 2.80 0.85 1.70 0.75 1.50 1.35 2.70 0.85 1.70 0.70 1.40
MCI Res 1.35 2.70 0.85 1.70 0.70 1.40 1.40 2.80 0.85 1.70 0.75 1.50 1.35 2.70 0.85 1.70 0.70 1.40Sprint Res 1.35 2.70 0.85 1.70 0.70 1.40 1.40 2.80 0.85 1.70 0.75 1.50 1.35 2.70 0.85 1.70 0.70 1.401995AT&T Bus 1.52 3.04 0.95 1.91 0.95 1.91 1.59 3.19 1.00 1.99 1.00 1.99 1.59 3.19 1.00 1.99 1.00 1.99
MCI Bus 1.41 2.82 0.88 1.77 0.88 1.77 1.47 2.95 0.92 1.84 0.92 1.84 1.47 2.95 0.92 1.84 0.92 1.84Sprint Bus 1.35 2.70 0.85 1.70 0.70 1.40 1.40 2.80 0.85 1.70 0.75 1.50 1.35 2.70 0.85 1.70 0.70 1.40AT&T Res 1.35 2.70 0.85 1.70 0.70 1.40 1.40 2.80 0.85 1.70 0.75 1.50 1.35 2.70 0.85 1.70 0.70 1.40
MCI Res 1.35 2.70 0.85 1.70 0.70 1.40 1.40 2.80 0.85 1.70 0.75 1.50 1.35 2.70 0.85 1.70 0.70 1.40Sprint Res 1.35 2.70 0.85 1.70 0.70 1.40 1.40 2.80 0.85 1.70 0.75 1.50 1.35 2.70 0.85 1.70 0.70 1.401996AT&T Bus 1.67 3.35 1.05 2.10 1.05 2.10 1.75 3.51 1.10 2.19 1.10 2.19 1.75 3.51 1.10 2.19 1.10 2.19
MCI Bus 1.66 3.34 1.04 2.09 1.04 2.09 1.74 3.50 1.08 2.18 1.08 2.18 1.74 3.50 1.08 2.18 1.08 2.18Sprint Bus 1.50 3.00 0.95 1.90 0.80 1.60 1.55 3.10 0.95 1.90 0.80 1.60 1.50 3.00 0.95 1.90 0.80 1.60AT&T Res 1.50 3.00 0.95 1.90 0.80 1.60 1.55 3.10 0.95 1.90 0.80 1.60 1.50 3.00 0.95 1.90 0.80 1.60
MCI Res 1.45 2.90 0.95 1.90 0.80 1.60 1.55 3.10 0.95 1.90 0.80 1.60 1.45 2.90 0.95 1.90 0.80 1.60Sprint Res 1.50 3.00 0.95 1.90 0.80 1.60 1.55 3.10 0.95 1.90 0.80 1.60 1.50 3.00 0.95 1.90 0.80 1.601997AT&T Bus 1.82 3.64 1.82 3.64 1.82 3.64 1.82 3.64 1.82 3.64 1.82 3.64 1.82 3.64 1.82 3.64 1.82 3.64
MCI Bus 1.89 3.78 1.42 2.84 1.42 2.84 1.89 3.78 1.42 2.84 1.42 2.84 1.89 3.78 1.42 2.84 1.42 2.84Sprint Bus 1.50 3.00 0.95 1.90 0.80 1.60 1.55 3.10 0.95 1.90 0.80 1.60 1.50 3.00 0.95 1.90 0.80 1.60AT&T Res 1.40 2.80 0.80 1.60 0.65 1.30 1.40 2.80 0.80 1.60 0.65 1.30 1.40 2.80 0.80 1.60 0.65 1.30
MCI Res 1.45 2.90 0.90 1.80 0.90 1.80 1.45 2.90 0.90 1.80 0.90 1.80 1.45 2.90 0.90 1.80 0.90 1.80Sprint Res 1.50 3.00 0.95 1.90 0.80 1.60 1.55 3.10 0.95 1.90 0.80 1.60 1.50 3.00 0.95 1.90 0.80 1.601998AT&T Bus 1.82 3.64 1.82 3.64 1.82 3.64 1.82 3.64 1.82 3.64 1.82 3.64 1.82 3.64 1.82 3.64 1.82 3.64
MCI Bus 1.94 3.87 1.45 2.90 1.45 2.90 1.94 3.87 1.45 2.90 1.45 2.90 1.94 3.87 1.45 2.90 1.45 2.90Sprint Bus 1.50 3.00 0.95 1.90 0.80 1.60 1.55 3.10 0.95 1.90 0.80 1.60 1.50 3.00 0.95 1.90 0.80 1.60AT&T Res 1.40 2.80 0.80 1.60 0.65 1.30 1.40 2.80 0.80 1.60 0.65 1.30 1.40 2.80 0.80 1.60 0.65 1.30
MCI Res 1.45 2.90 0.90 1.80 0.90 1.80 1.45 2.90 0.90 1.80 0.90 1.80 1.45 2.90 0.90 1.80 0.90 1.80Sprint Res 1.50 3.00 0.95 1.90 0.80 1.60 1.55 3.10 0.95 1.90 0.80 1.60 1.50 3.00 0.95 1.90 0.80 1.601999AT&T Bus 2.02 4.04 2.02 4.04 2.02 4.04 2.02 4.04 2.02 4.04 2.02 4.04 2.02 4.04 2.02 4.04 2.02 4.04
MCI Bus 2.15 4.30 1.61 3.22 1.61 3.22 2.15 4.30 1.61 3.22 1.61 3.22 2.15 4.30 1.61 3.22 1.61 3.22Sprint Bus 1.50 3.00 0.95 1.90 0.80 1.60 1.55 3.10 0.95 1.90 0.80 1.60 1.50 3.00 0.95 1.90 0.80 1.60AT&T Res 1.30 2.60 0.80 1.60 0.58 1.15 1.30 2.60 0.80 1.60 0.58 1.15 1.30 2.60 0.80 1.60 0.58 1.15
MCI Res 1.45 2.90 0.90 1.80 0.90 1.80 1.45 2.90 0.90 1.80 0.90 1.80 1.45 2.90 0.90 1.80 0.90 1.80Sprint Res 1.50 3.00 0.95 1.90 0.80 1.60 1.55 3.10 0.95 1.90 0.80 1.60 1.50 3.00 0.95 1.90 0.80 1.602000AT&T Bus 2.31 4.61 2.31 4.61 2.31 4.61 2.31 4.61 2.31 4.61 2.31 4.61 2.31 4.61 2.31 4.61 2.31 4.61
MCI Bus 2.35 4.70 1.76 3.52 1.76 3.52 2.35 4.70 1.76 3.52 1.76 3.52 2.35 4.70 1.76 3.52 1.76 3.52Sprint Bus 1.89 3.78 1.19 2.37 1.19 2.37 1.98 3.96 1.24 2.47 1.24 2.47 1.98 3.96 1.24 2.47 1.24 2.47AT&T Res 1.48 2.95 1.13 2.25 0.73 1.45 1.48 2.95 1.13 2.25 0.73 1.45 1.48 2.95 1.13 2.25 0.73 1.45
MCI Res 1.50 3.00 1.25 2.50 1.25 2.50 1.50 3.00 1.25 2.50 1.25 2.50 1.50 3.00 1.25 2.50 1.25 2.50Sprint Res 1.80 3.60 1.25 2.50 0.80 1.60 1.85 3.70 1.25 2.50 0.80 1.60 1.80 3.60 1.25 2.50 0.80 1.60
218
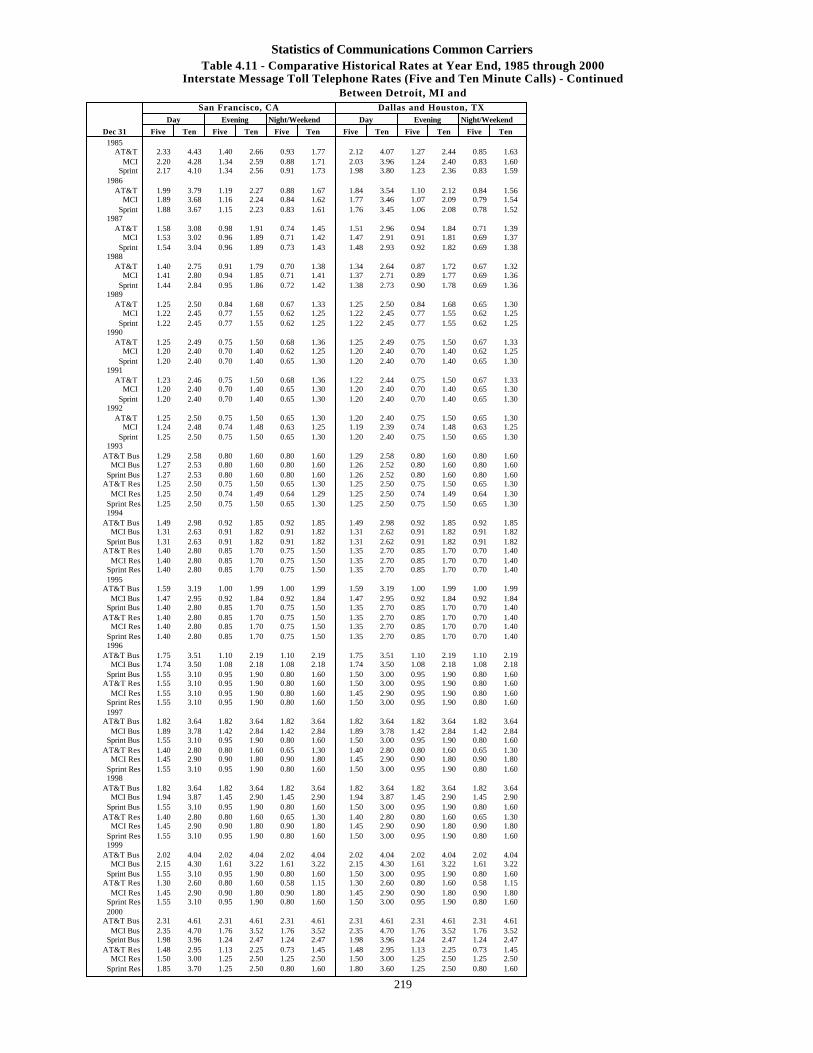
Statistics of Communications Common CarriersTable 4.11 - Comparative Historical Rates at Year End, 1985 through 2000
Interstate Message Toll Telephone Rates (Five and Ten Minute Calls) - ContinuedBetween Detroit, MI and
San Francisco, CA Dallas and Houston, TXDay Evening Night/Weekend Day Evening Night/Weekend
Dec 31 Five Ten Five Ten Five Ten Five Ten Five Ten Five Ten1985
AT&T 2.33 4.43 1.40 2.66 0.93 1.77 2.12 4.07 1.27 2.44 0.85 1.63MCI 2.20 4.28 1.34 2.59 0.88 1.71 2.03 3.96 1.24 2.40 0.83 1.60
Sprint 2.17 4.10 1.34 2.56 0.91 1.73 1.98 3.80 1.23 2.36 0.83 1.591986
AT&T 1.99 3.79 1.19 2.27 0.88 1.67 1.84 3.54 1.10 2.12 0.84 1.56MCI 1.89 3.68 1.16 2.24 0.84 1.62 1.77 3.46 1.07 2.09 0.79 1.54
Sprint 1.88 3.67 1.15 2.23 0.83 1.61 1.76 3.45 1.06 2.08 0.78 1.521987
AT&T 1.58 3.08 0.98 1.91 0.74 1.45 1.51 2.96 0.94 1.84 0.71 1.39MCI 1.53 3.02 0.96 1.89 0.71 1.42 1.47 2.91 0.91 1.81 0.69 1.37
Sprint 1.54 3.04 0.96 1.89 0.73 1.43 1.48 2.93 0.92 1.82 0.69 1.381988
AT&T 1.40 2.75 0.91 1.79 0.70 1.38 1.34 2.64 0.87 1.72 0.67 1.32MCI 1.41 2.80 0.94 1.85 0.71 1.41 1.37 2.71 0.89 1.77 0.69 1.36
Sprint 1.44 2.84 0.95 1.86 0.72 1.42 1.38 2.73 0.90 1.78 0.69 1.361989
AT&T 1.25 2.50 0.84 1.68 0.67 1.33 1.25 2.50 0.84 1.68 0.65 1.30MCI 1.22 2.45 0.77 1.55 0.62 1.25 1.22 2.45 0.77 1.55 0.62 1.25
Sprint 1.22 2.45 0.77 1.55 0.62 1.25 1.22 2.45 0.77 1.55 0.62 1.251990
AT&T 1.25 2.49 0.75 1.50 0.68 1.36 1.25 2.49 0.75 1.50 0.67 1.33MCI 1.20 2.40 0.70 1.40 0.62 1.25 1.20 2.40 0.70 1.40 0.62 1.25
Sprint 1.20 2.40 0.70 1.40 0.65 1.30 1.20 2.40 0.70 1.40 0.65 1.301991
AT&T 1.23 2.46 0.75 1.50 0.68 1.36 1.22 2.44 0.75 1.50 0.67 1.33MCI 1.20 2.40 0.70 1.40 0.65 1.30 1.20 2.40 0.70 1.40 0.65 1.30
Sprint 1.20 2.40 0.70 1.40 0.65 1.30 1.20 2.40 0.70 1.40 0.65 1.301992
AT&T 1.25 2.50 0.75 1.50 0.65 1.30 1.20 2.40 0.75 1.50 0.65 1.30MCI 1.24 2.48 0.74 1.48 0.63 1.25 1.19 2.39 0.74 1.48 0.63 1.25
Sprint 1.25 2.50 0.75 1.50 0.65 1.30 1.20 2.40 0.75 1.50 0.65 1.301993
AT&T Bus 1.29 2.58 0.80 1.60 0.80 1.60 1.29 2.58 0.80 1.60 0.80 1.60MCI Bus 1.27 2.53 0.80 1.60 0.80 1.60 1.26 2.52 0.80 1.60 0.80 1.60
Sprint Bus 1.27 2.53 0.80 1.60 0.80 1.60 1.26 2.52 0.80 1.60 0.80 1.60AT&T Res 1.25 2.50 0.75 1.50 0.65 1.30 1.25 2.50 0.75 1.50 0.65 1.30
MCI Res 1.25 2.50 0.74 1.49 0.64 1.29 1.25 2.50 0.74 1.49 0.64 1.30Sprint Res 1.25 2.50 0.75 1.50 0.65 1.30 1.25 2.50 0.75 1.50 0.65 1.301994
AT&T Bus 1.49 2.98 0.92 1.85 0.92 1.85 1.49 2.98 0.92 1.85 0.92 1.85MCI Bus 1.31 2.63 0.91 1.82 0.91 1.82 1.31 2.62 0.91 1.82 0.91 1.82
Sprint Bus 1.31 2.63 0.91 1.82 0.91 1.82 1.31 2.62 0.91 1.82 0.91 1.82AT&T Res 1.40 2.80 0.85 1.70 0.75 1.50 1.35 2.70 0.85 1.70 0.70 1.40
MCI Res 1.40 2.80 0.85 1.70 0.75 1.50 1.35 2.70 0.85 1.70 0.70 1.40Sprint Res 1.40 2.80 0.85 1.70 0.75 1.50 1.35 2.70 0.85 1.70 0.70 1.401995
AT&T Bus 1.59 3.19 1.00 1.99 1.00 1.99 1.59 3.19 1.00 1.99 1.00 1.99MCI Bus 1.47 2.95 0.92 1.84 0.92 1.84 1.47 2.95 0.92 1.84 0.92 1.84
Sprint Bus 1.40 2.80 0.85 1.70 0.75 1.50 1.35 2.70 0.85 1.70 0.70 1.40AT&T Res 1.40 2.80 0.85 1.70 0.75 1.50 1.35 2.70 0.85 1.70 0.70 1.40
MCI Res 1.40 2.80 0.85 1.70 0.75 1.50 1.35 2.70 0.85 1.70 0.70 1.40Sprint Res 1.40 2.80 0.85 1.70 0.75 1.50 1.35 2.70 0.85 1.70 0.70 1.401996
AT&T Bus 1.75 3.51 1.10 2.19 1.10 2.19 1.75 3.51 1.10 2.19 1.10 2.19MCI Bus 1.74 3.50 1.08 2.18 1.08 2.18 1.74 3.50 1.08 2.18 1.08 2.18
Sprint Bus 1.55 3.10 0.95 1.90 0.80 1.60 1.50 3.00 0.95 1.90 0.80 1.60AT&T Res 1.55 3.10 0.95 1.90 0.80 1.60 1.50 3.00 0.95 1.90 0.80 1.60
MCI Res 1.55 3.10 0.95 1.90 0.80 1.60 1.45 2.90 0.95 1.90 0.80 1.60Sprint Res 1.55 3.10 0.95 1.90 0.80 1.60 1.50 3.00 0.95 1.90 0.80 1.601997
AT&T Bus 1.82 3.64 1.82 3.64 1.82 3.64 1.82 3.64 1.82 3.64 1.82 3.64MCI Bus 1.89 3.78 1.42 2.84 1.42 2.84 1.89 3.78 1.42 2.84 1.42 2.84
Sprint Bus 1.55 3.10 0.95 1.90 0.80 1.60 1.50 3.00 0.95 1.90 0.80 1.60AT&T Res 1.40 2.80 0.80 1.60 0.65 1.30 1.40 2.80 0.80 1.60 0.65 1.30
MCI Res 1.45 2.90 0.90 1.80 0.90 1.80 1.45 2.90 0.90 1.80 0.90 1.80Sprint Res 1.55 3.10 0.95 1.90 0.80 1.60 1.50 3.00 0.95 1.90 0.80 1.601998
AT&T Bus 1.82 3.64 1.82 3.64 1.82 3.64 1.82 3.64 1.82 3.64 1.82 3.64MCI Bus 1.94 3.87 1.45 2.90 1.45 2.90 1.94 3.87 1.45 2.90 1.45 2.90
Sprint Bus 1.55 3.10 0.95 1.90 0.80 1.60 1.50 3.00 0.95 1.90 0.80 1.60AT&T Res 1.40 2.80 0.80 1.60 0.65 1.30 1.40 2.80 0.80 1.60 0.65 1.30
MCI Res 1.45 2.90 0.90 1.80 0.90 1.80 1.45 2.90 0.90 1.80 0.90 1.80Sprint Res 1.55 3.10 0.95 1.90 0.80 1.60 1.50 3.00 0.95 1.90 0.80 1.601999
AT&T Bus 2.02 4.04 2.02 4.04 2.02 4.04 2.02 4.04 2.02 4.04 2.02 4.04MCI Bus 2.15 4.30 1.61 3.22 1.61 3.22 2.15 4.30 1.61 3.22 1.61 3.22
Sprint Bus 1.55 3.10 0.95 1.90 0.80 1.60 1.50 3.00 0.95 1.90 0.80 1.60AT&T Res 1.30 2.60 0.80 1.60 0.58 1.15 1.30 2.60 0.80 1.60 0.58 1.15
MCI Res 1.45 2.90 0.90 1.80 0.90 1.80 1.45 2.90 0.90 1.80 0.90 1.80Sprint Res 1.55 3.10 0.95 1.90 0.80 1.60 1.50 3.00 0.95 1.90 0.80 1.602000
AT&T Bus 2.31 4.61 2.31 4.61 2.31 4.61 2.31 4.61 2.31 4.61 2.31 4.61MCI Bus 2.35 4.70 1.76 3.52 1.76 3.52 2.35 4.70 1.76 3.52 1.76 3.52
Sprint Bus 1.98 3.96 1.24 2.47 1.24 2.47 1.98 3.96 1.24 2.47 1.24 2.47AT&T Res 1.48 2.95 1.13 2.25 0.73 1.45 1.48 2.95 1.13 2.25 0.73 1.45
MCI Res 1.50 3.00 1.25 2.50 1.25 2.50 1.50 3.00 1.25 2.50 1.25 2.50Sprint Res 1.85 3.70 1.25 2.50 0.80 1.60 1.80 3.60 1.25 2.50 0.80 1.60
219
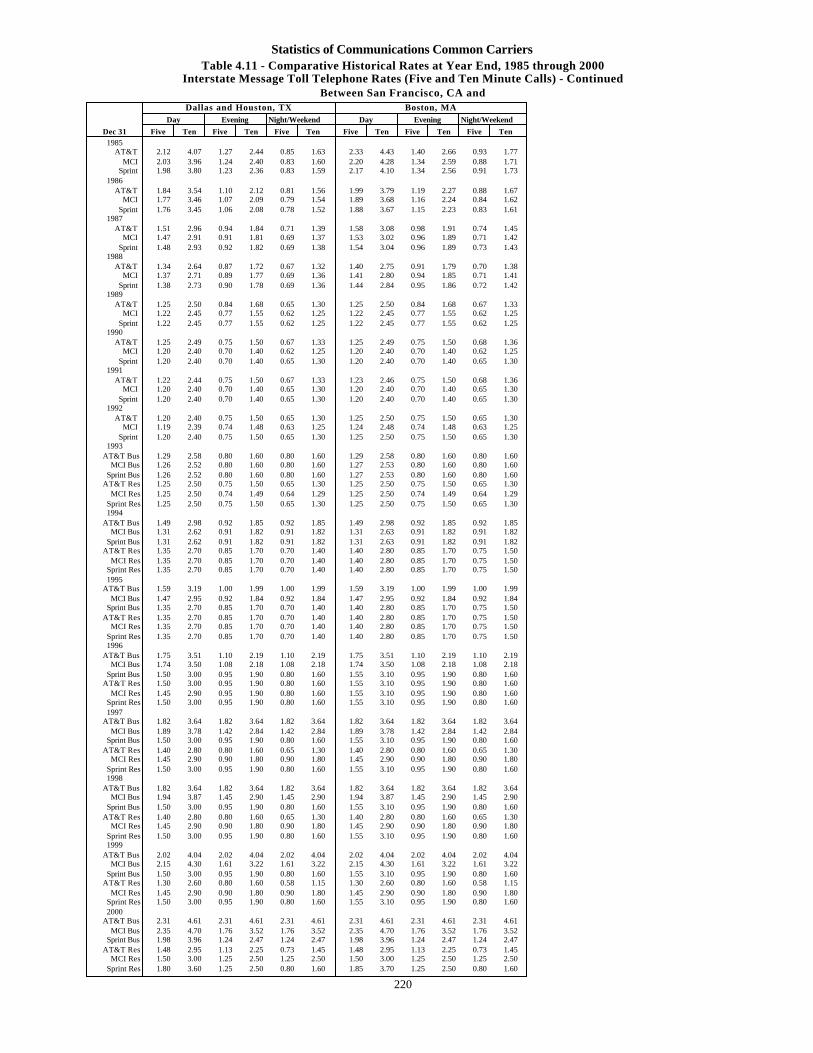
Statistics of Communications Common CarriersTable 4.11 - Comparative Historical Rates at Year End, 1985 through 2000
Interstate Message Toll Telephone Rates (Five and Ten Minute Calls) - ContinuedBetween San Francisco, CA and
Dallas and Houston, TX Boston, MADay Evening Night/Weekend Day Evening Night/Weekend
Dec 31 Five Ten Five Ten Five Ten Five Ten Five Ten Five Ten1985
AT&T 2.12 4.07 1.27 2.44 0.85 1.63 2.33 4.43 1.40 2.66 0.93 1.77MCI 2.03 3.96 1.24 2.40 0.83 1.60 2.20 4.28 1.34 2.59 0.88 1.71
Sprint 1.98 3.80 1.23 2.36 0.83 1.59 2.17 4.10 1.34 2.56 0.91 1.731986
AT&T 1.84 3.54 1.10 2.12 0.81 1.56 1.99 3.79 1.19 2.27 0.88 1.67MCI 1.77 3.46 1.07 2.09 0.79 1.54 1.89 3.68 1.16 2.24 0.84 1.62
Sprint 1.76 3.45 1.06 2.08 0.78 1.52 1.88 3.67 1.15 2.23 0.83 1.611987
AT&T 1.51 2.96 0.94 1.84 0.71 1.39 1.58 3.08 0.98 1.91 0.74 1.45MCI 1.47 2.91 0.91 1.81 0.69 1.37 1.53 3.02 0.96 1.89 0.71 1.42
Sprint 1.48 2.93 0.92 1.82 0.69 1.38 1.54 3.04 0.96 1.89 0.73 1.431988
AT&T 1.34 2.64 0.87 1.72 0.67 1.32 1.40 2.75 0.91 1.79 0.70 1.38MCI 1.37 2.71 0.89 1.77 0.69 1.36 1.41 2.80 0.94 1.85 0.71 1.41
Sprint 1.38 2.73 0.90 1.78 0.69 1.36 1.44 2.84 0.95 1.86 0.72 1.421989
AT&T 1.25 2.50 0.84 1.68 0.65 1.30 1.25 2.50 0.84 1.68 0.67 1.33MCI 1.22 2.45 0.77 1.55 0.62 1.25 1.22 2.45 0.77 1.55 0.62 1.25
Sprint 1.22 2.45 0.77 1.55 0.62 1.25 1.22 2.45 0.77 1.55 0.62 1.251990
AT&T 1.25 2.49 0.75 1.50 0.67 1.33 1.25 2.49 0.75 1.50 0.68 1.36MCI 1.20 2.40 0.70 1.40 0.62 1.25 1.20 2.40 0.70 1.40 0.62 1.25
Sprint 1.20 2.40 0.70 1.40 0.65 1.30 1.20 2.40 0.70 1.40 0.65 1.301991
AT&T 1.22 2.44 0.75 1.50 0.67 1.33 1.23 2.46 0.75 1.50 0.68 1.36MCI 1.20 2.40 0.70 1.40 0.65 1.30 1.20 2.40 0.70 1.40 0.65 1.30
Sprint 1.20 2.40 0.70 1.40 0.65 1.30 1.20 2.40 0.70 1.40 0.65 1.301992
AT&T 1.20 2.40 0.75 1.50 0.65 1.30 1.25 2.50 0.75 1.50 0.65 1.30MCI 1.19 2.39 0.74 1.48 0.63 1.25 1.24 2.48 0.74 1.48 0.63 1.25
Sprint 1.20 2.40 0.75 1.50 0.65 1.30 1.25 2.50 0.75 1.50 0.65 1.301993
AT&T Bus 1.29 2.58 0.80 1.60 0.80 1.60 1.29 2.58 0.80 1.60 0.80 1.60MCI Bus 1.26 2.52 0.80 1.60 0.80 1.60 1.27 2.53 0.80 1.60 0.80 1.60
Sprint Bus 1.26 2.52 0.80 1.60 0.80 1.60 1.27 2.53 0.80 1.60 0.80 1.60AT&T Res 1.25 2.50 0.75 1.50 0.65 1.30 1.25 2.50 0.75 1.50 0.65 1.30
MCI Res 1.25 2.50 0.74 1.49 0.64 1.29 1.25 2.50 0.74 1.49 0.64 1.29Sprint Res 1.25 2.50 0.75 1.50 0.65 1.30 1.25 2.50 0.75 1.50 0.65 1.301994
AT&T Bus 1.49 2.98 0.92 1.85 0.92 1.85 1.49 2.98 0.92 1.85 0.92 1.85MCI Bus 1.31 2.62 0.91 1.82 0.91 1.82 1.31 2.63 0.91 1.82 0.91 1.82
Sprint Bus 1.31 2.62 0.91 1.82 0.91 1.82 1.31 2.63 0.91 1.82 0.91 1.82AT&T Res 1.35 2.70 0.85 1.70 0.70 1.40 1.40 2.80 0.85 1.70 0.75 1.50
MCI Res 1.35 2.70 0.85 1.70 0.70 1.40 1.40 2.80 0.85 1.70 0.75 1.50Sprint Res 1.35 2.70 0.85 1.70 0.70 1.40 1.40 2.80 0.85 1.70 0.75 1.501995
AT&T Bus 1.59 3.19 1.00 1.99 1.00 1.99 1.59 3.19 1.00 1.99 1.00 1.99MCI Bus 1.47 2.95 0.92 1.84 0.92 1.84 1.47 2.95 0.92 1.84 0.92 1.84
Sprint Bus 1.35 2.70 0.85 1.70 0.70 1.40 1.40 2.80 0.85 1.70 0.75 1.50AT&T Res 1.35 2.70 0.85 1.70 0.70 1.40 1.40 2.80 0.85 1.70 0.75 1.50
MCI Res 1.35 2.70 0.85 1.70 0.70 1.40 1.40 2.80 0.85 1.70 0.75 1.50Sprint Res 1.35 2.70 0.85 1.70 0.70 1.40 1.40 2.80 0.85 1.70 0.75 1.501996
AT&T Bus 1.75 3.51 1.10 2.19 1.10 2.19 1.75 3.51 1.10 2.19 1.10 2.19MCI Bus 1.74 3.50 1.08 2.18 1.08 2.18 1.74 3.50 1.08 2.18 1.08 2.18
Sprint Bus 1.50 3.00 0.95 1.90 0.80 1.60 1.55 3.10 0.95 1.90 0.80 1.60AT&T Res 1.50 3.00 0.95 1.90 0.80 1.60 1.55 3.10 0.95 1.90 0.80 1.60
MCI Res 1.45 2.90 0.95 1.90 0.80 1.60 1.55 3.10 0.95 1.90 0.80 1.60Sprint Res 1.50 3.00 0.95 1.90 0.80 1.60 1.55 3.10 0.95 1.90 0.80 1.601997
AT&T Bus 1.82 3.64 1.82 3.64 1.82 3.64 1.82 3.64 1.82 3.64 1.82 3.64MCI Bus 1.89 3.78 1.42 2.84 1.42 2.84 1.89 3.78 1.42 2.84 1.42 2.84
Sprint Bus 1.50 3.00 0.95 1.90 0.80 1.60 1.55 3.10 0.95 1.90 0.80 1.60AT&T Res 1.40 2.80 0.80 1.60 0.65 1.30 1.40 2.80 0.80 1.60 0.65 1.30
MCI Res 1.45 2.90 0.90 1.80 0.90 1.80 1.45 2.90 0.90 1.80 0.90 1.80Sprint Res 1.50 3.00 0.95 1.90 0.80 1.60 1.55 3.10 0.95 1.90 0.80 1.601998
AT&T Bus 1.82 3.64 1.82 3.64 1.82 3.64 1.82 3.64 1.82 3.64 1.82 3.64MCI Bus 1.94 3.87 1.45 2.90 1.45 2.90 1.94 3.87 1.45 2.90 1.45 2.90
Sprint Bus 1.50 3.00 0.95 1.90 0.80 1.60 1.55 3.10 0.95 1.90 0.80 1.60AT&T Res 1.40 2.80 0.80 1.60 0.65 1.30 1.40 2.80 0.80 1.60 0.65 1.30
MCI Res 1.45 2.90 0.90 1.80 0.90 1.80 1.45 2.90 0.90 1.80 0.90 1.80Sprint Res 1.50 3.00 0.95 1.90 0.80 1.60 1.55 3.10 0.95 1.90 0.80 1.601999
AT&T Bus 2.02 4.04 2.02 4.04 2.02 4.04 2.02 4.04 2.02 4.04 2.02 4.04MCI Bus 2.15 4.30 1.61 3.22 1.61 3.22 2.15 4.30 1.61 3.22 1.61 3.22
Sprint Bus 1.50 3.00 0.95 1.90 0.80 1.60 1.55 3.10 0.95 1.90 0.80 1.60AT&T Res 1.30 2.60 0.80 1.60 0.58 1.15 1.30 2.60 0.80 1.60 0.58 1.15
MCI Res 1.45 2.90 0.90 1.80 0.90 1.80 1.45 2.90 0.90 1.80 0.90 1.80Sprint Res 1.50 3.00 0.95 1.90 0.80 1.60 1.55 3.10 0.95 1.90 0.80 1.602000
AT&T Bus 2.31 4.61 2.31 4.61 2.31 4.61 2.31 4.61 2.31 4.61 2.31 4.61MCI Bus 2.35 4.70 1.76 3.52 1.76 3.52 2.35 4.70 1.76 3.52 1.76 3.52
Sprint Bus 1.98 3.96 1.24 2.47 1.24 2.47 1.98 3.96 1.24 2.47 1.24 2.47AT&T Res 1.48 2.95 1.13 2.25 0.73 1.45 1.48 2.95 1.13 2.25 0.73 1.45
MCI Res 1.50 3.00 1.25 2.50 1.25 2.50 1.50 3.00 1.25 2.50 1.25 2.50Sprint Res 1.80 3.60 1.25 2.50 0.80 1.60 1.85 3.70 1.25 2.50 0.80 1.60
220
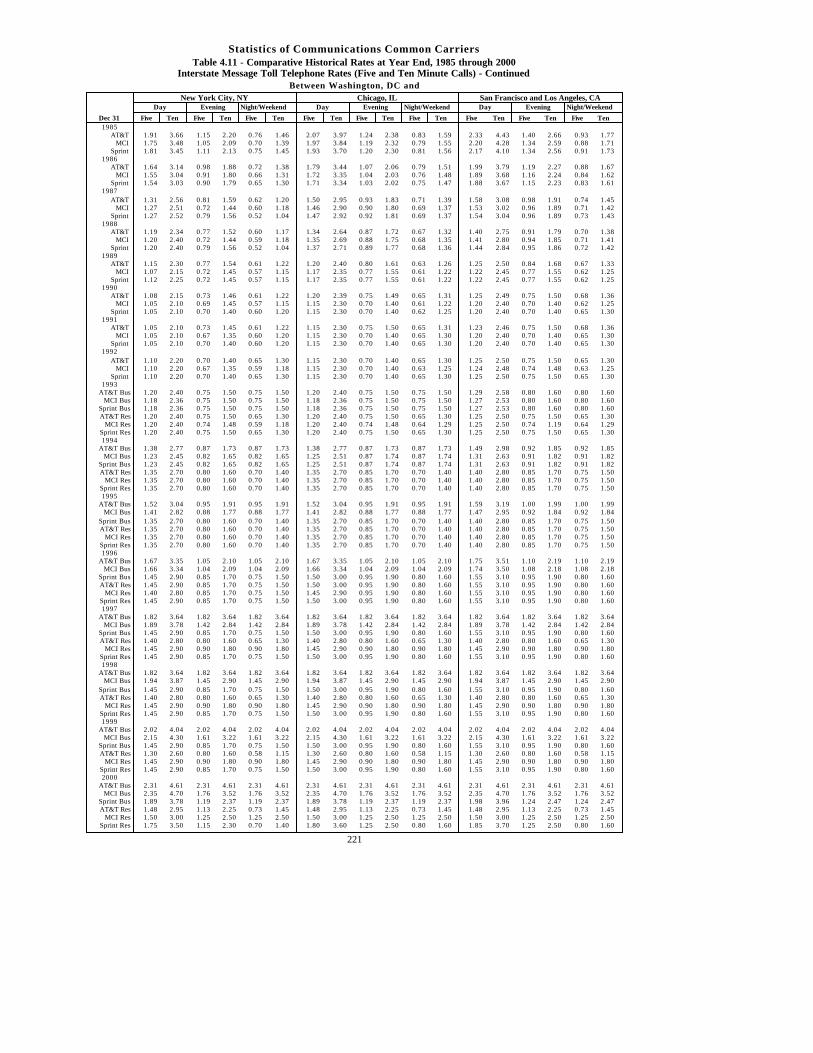
Statistics of Communications Common CarriersTable 4.11 - Comparative Historical Rates at Year End, 1985 through 2000
Interstate Message Toll Telephone Rates (Five and Ten Minute Calls) - ContinuedBetween Washington, DC and
New York City, NY Chicago, IL San Francisco and Los Angeles, CADay Evening Night/Weekend Day Evening Night/Weekend Day Evening Night/Weekend
Dec 31 Five Ten Five Ten Five Ten Five Ten Five Ten Five Ten Five Ten Five Ten Five Ten1985
AT&T 1.91 3.66 1.15 2.20 0.76 1.46 2.07 3.97 1.24 2.38 0.83 1.59 2.33 4.43 1.40 2.66 0.93 1.77MCI 1.75 3.48 1.05 2.09 0.70 1.39 1.97 3.84 1.19 2.32 0.79 1.55 2.20 4.28 1.34 2.59 0.88 1.71
Sprint 1.81 3.45 1.11 2.13 0.75 1.45 1.93 3.70 1.20 2.30 0.81 1.56 2.17 4.10 1.34 2.56 0.91 1.731986
AT&T 1.64 3.14 0.98 1.88 0.72 1.38 1.79 3.44 1.07 2.06 0.79 1.51 1.99 3.79 1.19 2.27 0.88 1.67MCI 1.55 3.04 0.91 1.80 0.66 1.31 1.72 3.35 1.04 2.03 0.76 1.48 1.89 3.68 1.16 2.24 0.84 1.62
Sprint 1.54 3.03 0.90 1.79 0.65 1.30 1.71 3.34 1.03 2.02 0.75 1.47 1.88 3.67 1.15 2.23 0.83 1.611987
AT&T 1.31 2.56 0.81 1.59 0.62 1.20 1.50 2.95 0.93 1.83 0.71 1.39 1.58 3.08 0.98 1.91 0.74 1.45MCI 1.27 2.51 0.72 1.44 0.60 1.18 1.46 2.90 0.90 1.80 0.69 1.37 1.53 3.02 0.96 1.89 0.71 1.42
Sprint 1.27 2.52 0.79 1.56 0.52 1.04 1.47 2.92 0.92 1.81 0.69 1.37 1.54 3.04 0.96 1.89 0.73 1.431988
AT&T 1.19 2.34 0.77 1.52 0.60 1.17 1.34 2.64 0.87 1.72 0.67 1.32 1.40 2.75 0.91 1.79 0.70 1.38MCI 1.20 2.40 0.72 1.44 0.59 1.18 1.35 2.69 0.88 1.75 0.68 1.35 1.41 2.80 0.94 1.85 0.71 1.41
Sprint 1.20 2.40 0.79 1.56 0.52 1.04 1.37 2.71 0.89 1.77 0.68 1.36 1.44 2.84 0.95 1.86 0.72 1.421989
AT&T 1.15 2.30 0.77 1.54 0.61 1.22 1.20 2.40 0.80 1.61 0.63 1.26 1.25 2.50 0.84 1.68 0.67 1.33MCI 1.07 2.15 0.72 1.45 0.57 1.15 1.17 2.35 0.77 1.55 0.61 1.22 1.22 2.45 0.77 1.55 0.62 1.25
Sprint 1.12 2.25 0.72 1.45 0.57 1.15 1.17 2.35 0.77 1.55 0.61 1.22 1.22 2.45 0.77 1.55 0.62 1.251990
AT&T 1.08 2.15 0.73 1.46 0.61 1.22 1.20 2.39 0.75 1.49 0.65 1.31 1.25 2.49 0.75 1.50 0.68 1.36MCI 1.05 2.10 0.69 1.45 0.57 1.15 1.15 2.30 0.70 1.40 0.61 1.22 1.20 2.40 0.70 1.40 0.62 1.25
Sprint 1.05 2.10 0.70 1.40 0.60 1.20 1.15 2.30 0.70 1.40 0.62 1.25 1.20 2.40 0.70 1.40 0.65 1.301991
AT&T 1.05 2.10 0.73 1.45 0.61 1.22 1.15 2.30 0.75 1.50 0.65 1.31 1.23 2.46 0.75 1.50 0.68 1.36MCI 1.05 2.10 0.67 1.35 0.60 1.20 1.15 2.30 0.70 1.40 0.65 1.30 1.20 2.40 0.70 1.40 0.65 1.30
Sprint 1.05 2.10 0.70 1.40 0.60 1.20 1.15 2.30 0.70 1.40 0.65 1.30 1.20 2.40 0.70 1.40 0.65 1.301992
AT&T 1.10 2.20 0.70 1.40 0.65 1.30 1.15 2.30 0.70 1.40 0.65 1.30 1.25 2.50 0.75 1.50 0.65 1.30MCI 1.10 2.20 0.67 1.35 0.59 1.18 1.15 2.30 0.70 1.40 0.63 1.25 1.24 2.48 0.74 1.48 0.63 1.25
Sprint 1.10 2.20 0.70 1.40 0.65 1.30 1.15 2.30 0.70 1.40 0.65 1.30 1.25 2.50 0.75 1.50 0.65 1.301993
AT&T Bus 1.20 2.40 0.75 1.50 0.75 1.50 1.20 2.40 0.75 1.50 0.75 1.50 1.29 2.58 0.80 1.60 0.80 1.60MCI Bus 1.18 2.36 0.75 1.50 0.75 1.50 1.18 2.36 0.75 1.50 0.75 1.50 1.27 2.53 0.80 1.60 0.80 1.60
Sprint Bus 1.18 2.36 0.75 1.50 0.75 1.50 1.18 2.36 0.75 1.50 0.75 1.50 1.27 2.53 0.80 1.60 0.80 1.60AT&T Res 1.20 2.40 0.75 1.50 0.65 1.30 1.20 2.40 0.75 1.50 0.65 1.30 1.25 2.50 0.75 1.50 0.65 1.30
MCI Res 1.20 2.40 0.74 1.48 0.59 1.18 1.20 2.40 0.74 1.48 0.64 1.29 1.25 2.50 0.74 1.19 0.64 1.29Sprint Res 1.20 2.40 0.75 1.50 0.65 1.30 1.20 2.40 0.75 1.50 0.65 1.30 1.25 2.50 0.75 1.50 0.65 1.301994
AT&T Bus 1.38 2.77 0.87 1.73 0.87 1.73 1.38 2.77 0.87 1.73 0.87 1.73 1.49 2.98 0.92 1.85 0.92 1.85MCI Bus 1.23 2.45 0.82 1.65 0.82 1.65 1.25 2.51 0.87 1.74 0.87 1.74 1.31 2.63 0.91 1.82 0.91 1.82
Sprint Bus 1.23 2.45 0.82 1.65 0.82 1.65 1.25 2.51 0.87 1.74 0.87 1.74 1.31 2.63 0.91 1.82 0.91 1.82AT&T Res 1.35 2.70 0.80 1.60 0.70 1.40 1.35 2.70 0.85 1.70 0.70 1.40 1.40 2.80 0.85 1.70 0.75 1.50
MCI Res 1.35 2.70 0.80 1.60 0.70 1.40 1.35 2.70 0.85 1.70 0.70 1.40 1.40 2.80 0.85 1.70 0.75 1.50Sprint Res 1.35 2.70 0.80 1.60 0.70 1.40 1.35 2.70 0.85 1.70 0.70 1.40 1.40 2.80 0.85 1.70 0.75 1.501995
AT&T Bus 1.52 3.04 0.95 1.91 0.95 1.91 1.52 3.04 0.95 1.91 0.95 1.91 1.59 3.19 1.00 1.99 1.00 1.99MCI Bus 1.41 2.82 0.88 1.77 0.88 1.77 1.41 2.82 0.88 1.77 0.88 1.77 1.47 2.95 0.92 1.84 0.92 1.84
Sprint Bus 1.35 2.70 0.80 1.60 0.70 1.40 1.35 2.70 0.85 1.70 0.70 1.40 1.40 2.80 0.85 1.70 0.75 1.50AT&T Res 1.35 2.70 0.80 1.60 0.70 1.40 1.35 2.70 0.85 1.70 0.70 1.40 1.40 2.80 0.85 1.70 0.75 1.50
MCI Res 1.35 2.70 0.80 1.60 0.70 1.40 1.35 2.70 0.85 1.70 0.70 1.40 1.40 2.80 0.85 1.70 0.75 1.50Sprint Res 1.35 2.70 0.80 1.60 0.70 1.40 1.35 2.70 0.85 1.70 0.70 1.40 1.40 2.80 0.85 1.70 0.75 1.501996
AT&T Bus 1.67 3.35 1.05 2.10 1.05 2.10 1.67 3.35 1.05 2.10 1.05 2.10 1.75 3.51 1.10 2.19 1.10 2.19MCI Bus 1.66 3.34 1.04 2.09 1.04 2.09 1.66 3.34 1.04 2.09 1.04 2.09 1.74 3.50 1.08 2.18 1.08 2.18
Sprint Bus 1.45 2.90 0.85 1.70 0.75 1.50 1.50 3.00 0.95 1.90 0.80 1.60 1.55 3.10 0.95 1.90 0.80 1.60AT&T Res 1.45 2.90 0.85 1.70 0.75 1.50 1.50 3.00 0.95 1.90 0.80 1.60 1.55 3.10 0.95 1.90 0.80 1.60
MCI Res 1.40 2.80 0.85 1.70 0.75 1.50 1.45 2.90 0.95 1.90 0.80 1.60 1.55 3.10 0.95 1.90 0.80 1.60Sprint Res 1.45 2.90 0.85 1.70 0.75 1.50 1.50 3.00 0.95 1.90 0.80 1.60 1.55 3.10 0.95 1.90 0.80 1.601997
AT&T Bus 1.82 3.64 1.82 3.64 1.82 3.64 1.82 3.64 1.82 3.64 1.82 3.64 1.82 3.64 1.82 3.64 1.82 3.64MCI Bus 1.89 3.78 1.42 2.84 1.42 2.84 1.89 3.78 1.42 2.84 1.42 2.84 1.89 3.78 1.42 2.84 1.42 2.84
Sprint Bus 1.45 2.90 0.85 1.70 0.75 1.50 1.50 3.00 0.95 1.90 0.80 1.60 1.55 3.10 0.95 1.90 0.80 1.60AT&T Res 1.40 2.80 0.80 1.60 0.65 1.30 1.40 2.80 0.80 1.60 0.65 1.30 1.40 2.80 0.80 1.60 0.65 1.30
MCI Res 1.45 2.90 0.90 1.80 0.90 1.80 1.45 2.90 0.90 1.80 0.90 1.80 1.45 2.90 0.90 1.80 0.90 1.80Sprint Res 1.45 2.90 0.85 1.70 0.75 1.50 1.50 3.00 0.95 1.90 0.80 1.60 1.55 3.10 0.95 1.90 0.80 1.601998
AT&T Bus 1.82 3.64 1.82 3.64 1.82 3.64 1.82 3.64 1.82 3.64 1.82 3.64 1.82 3.64 1.82 3.64 1.82 3.64MCI Bus 1.94 3.87 1.45 2.90 1.45 2.90 1.94 3.87 1.45 2.90 1.45 2.90 1.94 3.87 1.45 2.90 1.45 2.90
Sprint Bus 1.45 2.90 0.85 1.70 0.75 1.50 1.50 3.00 0.95 1.90 0.80 1.60 1.55 3.10 0.95 1.90 0.80 1.60AT&T Res 1.40 2.80 0.80 1.60 0.65 1.30 1.40 2.80 0.80 1.60 0.65 1.30 1.40 2.80 0.80 1.60 0.65 1.30
MCI Res 1.45 2.90 0.90 1.80 0.90 1.80 1.45 2.90 0.90 1.80 0.90 1.80 1.45 2.90 0.90 1.80 0.90 1.80Sprint Res 1.45 2.90 0.85 1.70 0.75 1.50 1.50 3.00 0.95 1.90 0.80 1.60 1.55 3.10 0.95 1.90 0.80 1.601999
AT&T Bus 2.02 4.04 2.02 4.04 2.02 4.04 2.02 4.04 2.02 4.04 2.02 4.04 2.02 4.04 2.02 4.04 2.02 4.04MCI Bus 2.15 4.30 1.61 3.22 1.61 3.22 2.15 4.30 1.61 3.22 1.61 3.22 2.15 4.30 1.61 3.22 1.61 3.22
Sprint Bus 1.45 2.90 0.85 1.70 0.75 1.50 1.50 3.00 0.95 1.90 0.80 1.60 1.55 3.10 0.95 1.90 0.80 1.60AT&T Res 1.30 2.60 0.80 1.60 0.58 1.15 1.30 2.60 0.80 1.60 0.58 1.15 1.30 2.60 0.80 1.60 0.58 1.15
MCI Res 1.45 2.90 0.90 1.80 0.90 1.80 1.45 2.90 0.90 1.80 0.90 1.80 1.45 2.90 0.90 1.80 0.90 1.80Sprint Res 1.45 2.90 0.85 1.70 0.75 1.50 1.50 3.00 0.95 1.90 0.80 1.60 1.55 3.10 0.95 1.90 0.80 1.602000
AT&T Bus 2.31 4.61 2.31 4.61 2.31 4.61 2.31 4.61 2.31 4.61 2.31 4.61 2.31 4.61 2.31 4.61 2.31 4.61MCI Bus 2.35 4.70 1.76 3.52 1.76 3.52 2.35 4.70 1.76 3.52 1.76 3.52 2.35 4.70 1.76 3.52 1.76 3.52
Sprint Bus 1.89 3.78 1.19 2.37 1.19 2.37 1.89 3.78 1.19 2.37 1.19 2.37 1.98 3.96 1.24 2.47 1.24 2.47AT&T Res 1.48 2.95 1.13 2.25 0.73 1.45 1.48 2.95 1.13 2.25 0.73 1.45 1.48 2.95 1.13 2.25 0.73 1.45
MCI Res 1.50 3.00 1.25 2.50 1.25 2.50 1.50 3.00 1.25 2.50 1.25 2.50 1.50 3.00 1.25 2.50 1.25 2.50Sprint Res 1.75 3.50 1.15 2.30 0.70 1.40 1.80 3.60 1.25 2.50 0.80 1.60 1.85 3.70 1.25 2.50 0.80 1.60
221
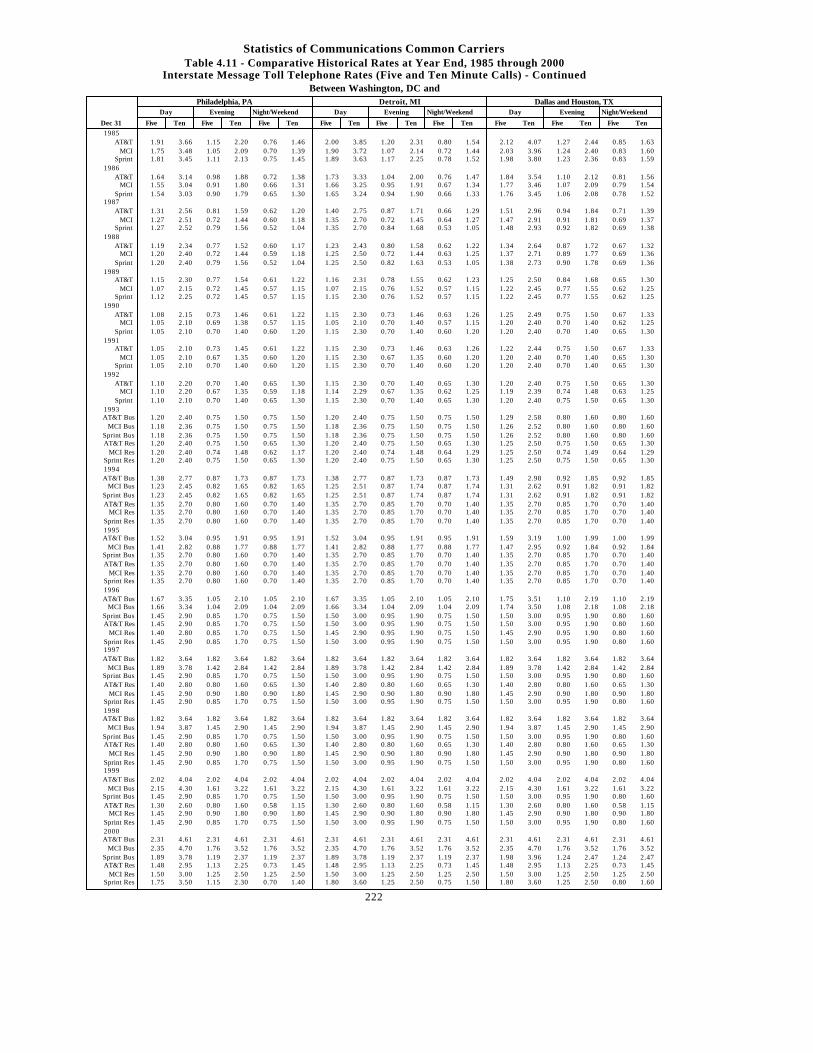
Statistics of Communications Common CarriersTable 4.11 - Comparative Historical Rates at Year End, 1985 through 2000
Interstate Message Toll Telephone Rates (Five and Ten Minute Calls) - ContinuedBetween Washington, DC and
Philadelphia, PA Detroit, MI Dallas and Houston, TXDay Evening Night/Weekend Day Evening Night/Weekend Day Evening Night/Weekend
Dec 31 Five Ten Five Ten Five Ten Five Ten Five Ten Five Ten Five Ten Five Ten Five Ten
1985AT&T 1.91 3.66 1.15 2.20 0.76 1.46 2.00 3.85 1.20 2.31 0.80 1.54 2.12 4.07 1.27 2.44 0.85 1.63
MCI 1.75 3.48 1.05 2.09 0.70 1.39 1.90 3.72 1.07 2.14 0.72 1.44 2.03 3.96 1.24 2.40 0.83 1.60Sprint 1.81 3.45 1.11 2.13 0.75 1.45 1.89 3.63 1.17 2.25 0.78 1.52 1.98 3.80 1.23 2.36 0.83 1.59
1986AT&T 1.64 3.14 0.98 1.88 0.72 1.38 1.73 3.33 1.04 2.00 0.76 1.47 1.84 3.54 1.10 2.12 0.81 1.56
MCI 1.55 3.04 0.91 1.80 0.66 1.31 1.66 3.25 0.95 1.91 0.67 1.34 1.77 3.46 1.07 2.09 0.79 1.54Sprint 1.54 3.03 0.90 1.79 0.65 1.30 1.65 3.24 0.94 1.90 0.66 1.33 1.76 3.45 1.06 2.08 0.78 1.52
1987AT&T 1.31 2.56 0.81 1.59 0.62 1.20 1.40 2.75 0.87 1.71 0.66 1.29 1.51 2.96 0.94 1.84 0.71 1.39
MCI 1.27 2.51 0.72 1.44 0.60 1.18 1.35 2.70 0.72 1.45 0.64 1.27 1.47 2.91 0.91 1.81 0.69 1.37Sprint 1.27 2.52 0.79 1.56 0.52 1.04 1.35 2.70 0.84 1.68 0.53 1.05 1.48 2.93 0.92 1.82 0.69 1.38
1988AT&T 1.19 2.34 0.77 1.52 0.60 1.17 1.23 2.43 0.80 1.58 0.62 1.22 1.34 2.64 0.87 1.72 0.67 1.32
MCI 1.20 2.40 0.72 1.44 0.59 1.18 1.25 2.50 0.72 1.44 0.63 1.25 1.37 2.71 0.89 1.77 0.69 1.36Sprint 1.20 2.40 0.79 1.56 0.52 1.04 1.25 2.50 0.82 1.63 0.53 1.05 1.38 2.73 0.90 1.78 0.69 1.36
1989AT&T 1.15 2.30 0.77 1.54 0.61 1.22 1.16 2.31 0.78 1.55 0.62 1.23 1.25 2.50 0.84 1.68 0.65 1.30
MCI 1.07 2.15 0.72 1.45 0.57 1.15 1.07 2.15 0.76 1.52 0.57 1.15 1.22 2.45 0.77 1.55 0.62 1.25Sprint 1.12 2.25 0.72 1.45 0.57 1.15 1.15 2.30 0.76 1.52 0.57 1.15 1.22 2.45 0.77 1.55 0.62 1.25
1990AT&T 1.08 2.15 0.73 1.46 0.61 1.22 1.15 2.30 0.73 1.46 0.63 1.26 1.25 2.49 0.75 1.50 0.67 1.33
MCI 1.05 2.10 0.69 1.38 0.57 1.15 1.05 2.10 0.70 1.40 0.57 1.15 1.20 2.40 0.70 1.40 0.62 1.25Sprint 1.05 2.10 0.70 1.40 0.60 1.20 1.15 2.30 0.70 1.40 0.60 1.20 1.20 2.40 0.70 1.40 0.65 1.30
1991AT&T 1.05 2.10 0.73 1.45 0.61 1.22 1.15 2.30 0.73 1.46 0.63 1.26 1.22 2.44 0.75 1.50 0.67 1.33
MCI 1.05 2.10 0.67 1.35 0.60 1.20 1.15 2.30 0.67 1.35 0.60 1.20 1.20 2.40 0.70 1.40 0.65 1.30Sprint 1.05 2.10 0.70 1.40 0.60 1.20 1.15 2.30 0.70 1.40 0.60 1.20 1.20 2.40 0.70 1.40 0.65 1.30
1992AT&T 1.10 2.20 0.70 1.40 0.65 1.30 1.15 2.30 0.70 1.40 0.65 1.30 1.20 2.40 0.75 1.50 0.65 1.30
MCI 1.10 2.20 0.67 1.35 0.59 1.18 1.14 2.29 0.67 1.35 0.62 1.25 1.19 2.39 0.74 1.48 0.63 1.25Sprint 1.10 2.10 0.70 1.40 0.65 1.30 1.15 2.30 0.70 1.40 0.65 1.30 1.20 2.40 0.75 1.50 0.65 1.30
1993AT&T Bus 1.20 2.40 0.75 1.50 0.75 1.50 1.20 2.40 0.75 1.50 0.75 1.50 1.29 2.58 0.80 1.60 0.80 1.60
MCI Bus 1.18 2.36 0.75 1.50 0.75 1.50 1.18 2.36 0.75 1.50 0.75 1.50 1.26 2.52 0.80 1.60 0.80 1.60Sprint Bus 1.18 2.36 0.75 1.50 0.75 1.50 1.18 2.36 0.75 1.50 0.75 1.50 1.26 2.52 0.80 1.60 0.80 1.60AT&T Res 1.20 2.40 0.75 1.50 0.65 1.30 1.20 2.40 0.75 1.50 0.65 1.30 1.25 2.50 0.75 1.50 0.65 1.30
MCI Res 1.20 2.40 0.74 1.48 0.62 1.17 1.20 2.40 0.74 1.48 0.64 1.29 1.25 2.50 0.74 1.49 0.64 1.29Sprint Res 1.20 2.40 0.75 1.50 0.65 1.30 1.20 2.40 0.75 1.50 0.65 1.30 1.25 2.50 0.75 1.50 0.65 1.301994AT&T Bus 1.38 2.77 0.87 1.73 0.87 1.73 1.38 2.77 0.87 1.73 0.87 1.73 1.49 2.98 0.92 1.85 0.92 1.85
MCI Bus 1.23 2.45 0.82 1.65 0.82 1.65 1.25 2.51 0.87 1.74 0.87 1.74 1.31 2.62 0.91 1.82 0.91 1.82Sprint Bus 1.23 2.45 0.82 1.65 0.82 1.65 1.25 2.51 0.87 1.74 0.87 1.74 1.31 2.62 0.91 1.82 0.91 1.82AT&T Res 1.35 2.70 0.80 1.60 0.70 1.40 1.35 2.70 0.85 1.70 0.70 1.40 1.35 2.70 0.85 1.70 0.70 1.40
MCI Res 1.35 2.70 0.80 1.60 0.70 1.40 1.35 2.70 0.85 1.70 0.70 1.40 1.35 2.70 0.85 1.70 0.70 1.40Sprint Res 1.35 2.70 0.80 1.60 0.70 1.40 1.35 2.70 0.85 1.70 0.70 1.40 1.35 2.70 0.85 1.70 0.70 1.401995AT&T Bus 1.52 3.04 0.95 1.91 0.95 1.91 1.52 3.04 0.95 1.91 0.95 1.91 1.59 3.19 1.00 1.99 1.00 1.99
MCI Bus 1.41 2.82 0.88 1.77 0.88 1.77 1.41 2.82 0.88 1.77 0.88 1.77 1.47 2.95 0.92 1.84 0.92 1.84Sprint Bus 1.35 2.70 0.80 1.60 0.70 1.40 1.35 2.70 0.85 1.70 0.70 1.40 1.35 2.70 0.85 1.70 0.70 1.40AT&T Res 1.35 2.70 0.80 1.60 0.70 1.40 1.35 2.70 0.85 1.70 0.70 1.40 1.35 2.70 0.85 1.70 0.70 1.40
MCI Res 1.35 2.70 0.80 1.60 0.70 1.40 1.35 2.70 0.85 1.70 0.70 1.40 1.35 2.70 0.85 1.70 0.70 1.40Sprint Res 1.35 2.70 0.80 1.60 0.70 1.40 1.35 2.70 0.85 1.70 0.70 1.40 1.35 2.70 0.85 1.70 0.70 1.401996AT&T Bus 1.67 3.35 1.05 2.10 1.05 2.10 1.67 3.35 1.05 2.10 1.05 2.10 1.75 3.51 1.10 2.19 1.10 2.19
MCI Bus 1.66 3.34 1.04 2.09 1.04 2.09 1.66 3.34 1.04 2.09 1.04 2.09 1.74 3.50 1.08 2.18 1.08 2.18Sprint Bus 1.45 2.90 0.85 1.70 0.75 1.50 1.50 3.00 0.95 1.90 0.75 1.50 1.50 3.00 0.95 1.90 0.80 1.60AT&T Res 1.45 2.90 0.85 1.70 0.75 1.50 1.50 3.00 0.95 1.90 0.75 1.50 1.50 3.00 0.95 1.90 0.80 1.60
MCI Res 1.40 2.80 0.85 1.70 0.75 1.50 1.45 2.90 0.95 1.90 0.75 1.50 1.45 2.90 0.95 1.90 0.80 1.60Sprint Res 1.45 2.90 0.85 1.70 0.75 1.50 1.50 3.00 0.95 1.90 0.75 1.50 1.50 3.00 0.95 1.90 0.80 1.601997AT&T Bus 1.82 3.64 1.82 3.64 1.82 3.64 1.82 3.64 1.82 3.64 1.82 3.64 1.82 3.64 1.82 3.64 1.82 3.64
MCI Bus 1.89 3.78 1.42 2.84 1.42 2.84 1.89 3.78 1.42 2.84 1.42 2.84 1.89 3.78 1.42 2.84 1.42 2.84Sprint Bus 1.45 2.90 0.85 1.70 0.75 1.50 1.50 3.00 0.95 1.90 0.75 1.50 1.50 3.00 0.95 1.90 0.80 1.60AT&T Res 1.40 2.80 0.80 1.60 0.65 1.30 1.40 2.80 0.80 1.60 0.65 1.30 1.40 2.80 0.80 1.60 0.65 1.30
MCI Res 1.45 2.90 0.90 1.80 0.90 1.80 1.45 2.90 0.90 1.80 0.90 1.80 1.45 2.90 0.90 1.80 0.90 1.80Sprint Res 1.45 2.90 0.85 1.70 0.75 1.50 1.50 3.00 0.95 1.90 0.75 1.50 1.50 3.00 0.95 1.90 0.80 1.601998AT&T Bus 1.82 3.64 1.82 3.64 1.82 3.64 1.82 3.64 1.82 3.64 1.82 3.64 1.82 3.64 1.82 3.64 1.82 3.64
MCI Bus 1.94 3.87 1.45 2.90 1.45 2.90 1.94 3.87 1.45 2.90 1.45 2.90 1.94 3.87 1.45 2.90 1.45 2.90Sprint Bus 1.45 2.90 0.85 1.70 0.75 1.50 1.50 3.00 0.95 1.90 0.75 1.50 1.50 3.00 0.95 1.90 0.80 1.60AT&T Res 1.40 2.80 0.80 1.60 0.65 1.30 1.40 2.80 0.80 1.60 0.65 1.30 1.40 2.80 0.80 1.60 0.65 1.30
MCI Res 1.45 2.90 0.90 1.80 0.90 1.80 1.45 2.90 0.90 1.80 0.90 1.80 1.45 2.90 0.90 1.80 0.90 1.80Sprint Res 1.45 2.90 0.85 1.70 0.75 1.50 1.50 3.00 0.95 1.90 0.75 1.50 1.50 3.00 0.95 1.90 0.80 1.601999AT&T Bus 2.02 4.04 2.02 4.04 2.02 4.04 2.02 4.04 2.02 4.04 2.02 4.04 2.02 4.04 2.02 4.04 2.02 4.04
MCI Bus 2.15 4.30 1.61 3.22 1.61 3.22 2.15 4.30 1.61 3.22 1.61 3.22 2.15 4.30 1.61 3.22 1.61 3.22Sprint Bus 1.45 2.90 0.85 1.70 0.75 1.50 1.50 3.00 0.95 1.90 0.75 1.50 1.50 3.00 0.95 1.90 0.80 1.60AT&T Res 1.30 2.60 0.80 1.60 0.58 1.15 1.30 2.60 0.80 1.60 0.58 1.15 1.30 2.60 0.80 1.60 0.58 1.15
MCI Res 1.45 2.90 0.90 1.80 0.90 1.80 1.45 2.90 0.90 1.80 0.90 1.80 1.45 2.90 0.90 1.80 0.90 1.80Sprint Res 1.45 2.90 0.85 1.70 0.75 1.50 1.50 3.00 0.95 1.90 0.75 1.50 1.50 3.00 0.95 1.90 0.80 1.602000AT&T Bus 2.31 4.61 2.31 4.61 2.31 4.61 2.31 4.61 2.31 4.61 2.31 4.61 2.31 4.61 2.31 4.61 2.31 4.61
MCI Bus 2.35 4.70 1.76 3.52 1.76 3.52 2.35 4.70 1.76 3.52 1.76 3.52 2.35 4.70 1.76 3.52 1.76 3.52Sprint Bus 1.89 3.78 1.19 2.37 1.19 2.37 1.89 3.78 1.19 2.37 1.19 2.37 1.98 3.96 1.24 2.47 1.24 2.47AT&T Res 1.48 2.95 1.13 2.25 0.73 1.45 1.48 2.95 1.13 2.25 0.73 1.45 1.48 2.95 1.13 2.25 0.73 1.45
MCI Res 1.50 3.00 1.25 2.50 1.25 2.50 1.50 3.00 1.25 2.50 1.25 2.50 1.50 3.00 1.25 2.50 1.25 2.50Sprint Res 1.75 3.50 1.15 2.30 0.70 1.40 1.80 3.60 1.25 2.50 0.75 1.50 1.80 3.60 1.25 2.50 0.80 1.60
222

Statistics of Communications Common CarriersTable 4.11 - Comparative Historical Rates at Year End, 1985 through 2000
Interstate Message Toll Telephone Rates (Five and Ten Minute Calls) - ContinuedBetween Boston, MA and
Detroit, MI Washington, DC Philadelphia, PADay Evening Night/Weekend Day Evening Night/Weekend Day Evening Night/Weekend
Dec 31 Five Ten Five Ten Five Ten Five Ten Five Ten Five Ten Five Ten Five Ten Five Ten
1985AT&T 2.07 3.97 1.24 2.38 0.83 1.59 2.00 3.85 1.20 2.31 0.80 1.54 2.12 4.07 1.27 2.44 0.85 1.63
MCI 1.97 3.84 1.19 2.32 0.79 1.55 1.75 3.48 1.05 2.09 0.70 1.39 1.75 3.48 1.05 2.09 0.70 1.39Sprint 1.93 3.70 1.20 2.30 0.81 1.56 1.89 3.63 1.17 2.25 0.78 1.52 1.81 3.45 1.11 2.13 0.75 1.45
1986AT&T 1.79 3.44 1.07 2.06 0.79 1.51 1.73 3.33 1.04 2.00 0.76 1.47 1.84 3.54 1.10 2.12 0.81 1.56
MCI 1.72 3.35 1.04 2.03 0.76 1.48 1.55 3.04 0.91 1.80 0.66 1.31 1.55 0.04 0.91 1.80 0.66 1.31Sprint 1.71 3.34 1.03 2.02 0.75 1.47 1.65 3.24 0.94 1.90 0.66 1.33 1.54 3.03 0.90 1.79 0.65 1.30
1987AT&T 1.50 2.95 0.93 1.83 0.71 1.39 1.40 2.75 0.87 1.71 0.66 1.29 1.51 2.96 0.94 1.84 0.74 1.39
MCI 1.46 2.90 0.90 1.80 0.69 1.37 1.27 2.51 0.72 1.44 0.60 1.18 1.27 2.51 0.72 1.44 0.59 1.18Sprint 1.37 2.92 0.92 1.81 0.69 1.37 1.35 2.70 0.84 1.68 0.53 1.05 1.27 2.52 0.79 1.56 0.52 1.40
1988AT&T 1.34 2.64 0.87 1.72 0.67 1.32 1.23 2.43 0.80 1.58 0.62 1.22 1.34 2.64 0.87 1.72 0.67 1.32
MCI 1.65 2.69 0.88 1.75 0.68 1.35 1.20 2.40 0.72 1.44 0.59 1.18 1.20 2.40 0.72 1.44 0.59 1.18Sprint 1.37 2.71 0.89 1.77 0.68 1.36 1.25 2.50 0.82 1.63 0.53 1.05 1.20 2.40 0.79 1.56 0.52 1.04
1989AT&T 1.20 2.40 0.80 1.61 0.63 1.26 1.16 2.31 0.78 1.55 0.62 1.23 1.15 2.30 0.77 1.54 0.61 1.22
MCI 1.17 2.35 0.77 1.55 0.61 1.22 1.07 2.15 0.76 1.52 0.57 1.15 1.07 2.15 0.72 1.45 0.57 1.15Sprint 1.17 2.35 0.77 1.55 0.61 1.22 1.15 2.30 0.76 1.52 0.57 1.15 1.12 2.25 0.72 1.45 0.57 1.15
1990AT&T 1.20 2.39 0.75 1.49 0.65 1.31 1.15 2.30 0.73 1.46 0.63 1.26 1.08 2.15 0.73 1.46 0.61 1.22
MCI 1.15 2.30 0.70 1.40 0.61 1.22 1.05 2.10 0.70 1.40 0.57 1.15 1.05 2.10 0.69 1.38 0.57 1.15Sprint 1.15 2.30 0.70 1.40 0.62 1.25 1.15 2.30 0.70 1.40 0.60 1.20 1.05 2.10 0.70 1.40 0.60 1.20
1991AT&T 1.15 2.30 0.75 1.50 0.65 1.31 1.15 2.30 0.73 1.46 0.63 1.26 1.05 2.10 0.73 1.45 0.61 1.22
MCI 1.15 2.30 0.70 1.40 0.65 1.30 1.15 2.30 0.67 1.35 0.60 1.20 1.05 2.10 0.67 1.35 0.60 1.20Sprint 1.15 2.30 0.70 1.40 0.65 1.30 1.15 2.30 0.70 1.40 0.60 1.20 1.05 2.10 0.70 1.40 0.60 1.20
1992AT&T 1.15 2.30 0.70 1.40 0.65 1.30 1.15 2.30 0.70 1.40 0.65 1.30 1.10 2.20 0.70 1.40 0.65 1.30
MCI 1.15 2.30 0.70 1.40 0.63 1.25 1.14 2.29 0.67 1.35 0.62 1.25 1.10 2.20 0.67 1.35 0.59 1.18Sprint 1.15 2.30 0.70 1.40 0.65 1.30 1.15 2.30 0.70 1.40 0.65 1.30 1.10 2.20 0.70 1.40 0.65 1.30
1993AT&T Bus 1.20 2.40 0.75 1.50 0.75 1.50 1.20 2.40 0.75 1.50 0.75 1.50 1.20 2.40 0.75 1.50 0.75 1.50
MCI Bus 1.18 2.36 0.75 1.50 0.75 1.50 1.18 2.36 0.75 1.50 0.75 1.50 1.18 2.36 0.75 1.50 0.75 1.50Sprint Bus 1.18 2.36 0.75 1.50 0.75 1.50 1.18 2.36 0.75 1.50 0.75 1.50 1.18 2.36 0.75 1.50 0.75 1.50AT&T Res 1.20 2.40 0.75 1.50 0.65 1.30 1.20 2.40 0.75 1.50 0.65 1.30 1.20 2.40 0.75 1.50 0.65 1.30
MCI Res 1.20 2.40 0.74 1.48 0.64 1.29 1.20 2.40 0.74 1.48 0.64 1.29 1.20 2.40 0.74 1.48 0.62 1.17Sprint Res 1.20 2.40 0.75 1.50 0.65 1.30 1.20 2.40 0.75 1.50 0.65 1.30 1.20 2.40 0.75 1.50 0.65 1.301994AT&T Bus 1.38 2.77 0.87 1.73 0.87 1.73 1.38 2.77 0.87 1.73 0.87 1.73 1.38 2.77 0.87 1.73 0.87 1.73
MCI Bus 1.25 2.51 0.87 1.74 0.87 1.74 1.25 2.51 0.87 1.74 0.87 1.74 1.23 2.45 0.82 1.65 0.82 1.65Sprint Bus 1.25 2.51 0.87 1.74 0.87 1.74 1.25 2.51 0.87 1.74 0.87 1.74 1.23 2.45 0.82 1.65 0.82 1.65AT&T Res 1.35 2.70 0.85 1.70 0.70 1.40 1.35 2.70 0.85 1.70 0.70 1.40 1.35 2.70 0.80 1.60 0.70 1.40
MCI Res 1.35 2.70 0.85 1.70 0.70 1.40 1.35 2.70 0.85 1.70 0.70 1.40 1.35 2.70 0.80 1.60 0.70 1.40Sprint Res 1.35 2.70 0.85 1.70 0.70 1.40 1.35 2.70 0.85 1.70 0.70 1.40 1.35 2.70 0.80 1.60 0.70 1.401995AT&T Bus 1.52 3.04 0.95 1.91 0.95 1.91 1.52 3.04 0.95 1.91 0.95 1.91 1.52 3.04 0.95 1.91 0.95 1.91
MCI Bus 1.41 2.82 0.88 1.77 0.88 1.77 1.41 2.82 0.88 1.77 0.88 1.77 1.41 2.82 0.88 1.77 0.88 1.77Sprint Bus 1.35 2.70 0.85 1.70 0.70 1.40 1.35 2.70 0.85 1.70 0.70 1.40 1.35 2.70 0.80 1.60 0.70 1.40AT&T Res 1.35 2.70 0.85 1.70 0.70 1.40 1.35 2.70 0.85 1.70 0.70 1.40 1.35 2.70 0.80 1.60 0.70 1.40
MCI Res 1.35 2.70 0.85 1.70 0.70 1.40 1.35 2.70 0.85 1.70 0.70 1.40 1.35 2.70 0.80 1.60 0.70 1.40Sprint Res 1.35 2.70 0.85 1.70 0.70 1.40 1.35 2.70 0.85 1.70 0.70 1.40 1.35 2.70 0.80 1.60 0.70 1.401996AT&T Bus 1.67 3.35 1.05 2.10 1.05 2.10 1.67 3.35 1.05 2.10 1.05 2.10 1.67 3.35 1.05 2.10 1.05 2.10
MCI Bus 1.66 3.34 1.04 2.09 1.04 2.09 1.66 3.34 1.04 2.09 1.04 2.09 1.66 3.34 1.04 2.09 1.04 2.09Sprint Bus 1.50 3.00 0.95 1.90 0.80 1.60 1.50 3.00 0.95 1.90 0.75 1.50 1.45 2.90 0.85 1.70 0.75 1.50AT&T Res 1.50 3.00 0.95 1.90 0.80 1.60 1.50 3.00 0.95 1.90 0.75 1.50 1.45 2.90 0.85 1.70 0.75 1.50
MCI Res 1.45 2.90 0.95 1.90 0.80 1.60 1.45 2.90 0.95 1.90 0.75 1.50 1.40 2.80 0.85 1.70 0.75 1.50Sprint Res 1.50 3.00 0.95 1.90 0.80 1.60 1.50 3.00 0.95 1.90 0.75 1.50 1.45 2.90 0.85 1.70 0.75 1.501997AT&T Bus 1.82 3.64 1.82 3.64 1.82 3.64 1.82 3.64 1.82 3.64 1.82 3.64 1.82 3.64 1.82 3.64 1.82 3.64
MCI Bus 1.89 3.78 1.42 2.84 1.42 2.84 1.89 3.78 1.42 2.84 1.42 2.84 1.89 3.78 1.42 2.84 1.42 2.84Sprint Bus 1.50 3.00 0.95 1.90 0.80 1.60 1.50 3.00 0.95 1.90 0.75 1.50 1.45 2.90 0.85 1.70 0.75 1.50AT&T Res 1.40 2.80 0.80 1.60 0.65 1.30 1.40 2.80 0.80 1.60 0.65 1.30 1.40 2.80 0.80 1.60 0.65 1.30
MCI Res 1.45 2.90 0.90 1.80 0.90 1.80 1.45 2.90 0.90 1.80 0.90 1.80 1.45 2.90 0.90 1.80 0.90 1.80Sprint Res 1.50 3.00 0.95 1.90 0.80 1.60 1.50 3.00 0.95 1.90 0.75 1.50 1.45 2.90 0.85 1.70 0.75 1.501998AT&T Bus 1.82 3.64 1.82 3.64 1.82 3.64 1.82 3.64 1.82 3.64 1.82 3.64 1.82 3.64 1.82 3.64 1.82 3.64
MCI Bus 1.94 3.87 1.45 2.90 1.45 2.90 1.94 3.87 1.45 2.90 1.45 2.90 1.94 3.87 1.45 2.90 1.45 2.90Sprint Bus 1.50 3.00 0.95 1.90 0.80 1.60 1.50 3.00 0.95 1.90 0.75 1.50 1.45 2.90 0.85 1.70 0.75 1.50AT&T Res 1.40 2.80 0.80 1.60 0.65 1.30 1.40 2.80 0.80 1.60 0.65 1.30 1.40 2.80 0.80 1.60 0.65 1.30
MCI Res 1.45 2.90 0.90 1.80 0.90 1.80 1.45 2.90 0.90 1.80 0.90 1.80 1.45 2.90 0.90 1.80 0.90 1.80Sprint Res 1.50 3.00 0.95 1.90 0.80 1.60 1.50 3.00 0.95 1.90 0.75 1.50 1.45 2.90 0.85 1.70 0.75 1.501999AT&T Bus 2.02 4.04 2.02 4.04 2.02 4.04 2.02 4.04 2.02 4.04 2.02 4.04 2.02 4.04 2.02 4.04 2.02 4.04
MCI Bus 2.15 4.30 1.61 3.22 1.61 3.22 2.15 4.30 1.61 3.22 1.61 3.22 2.15 4.30 1.61 3.22 1.61 3.22Sprint Bus 1.50 3.00 0.95 1.90 0.80 1.60 1.50 3.00 0.95 1.90 0.75 1.50 1.45 2.90 0.85 1.70 0.75 1.50AT&T Res 1.30 2.60 0.80 1.60 0.58 1.15 1.30 2.60 0.80 1.60 0.58 1.15 1.30 2.60 0.80 1.60 0.58 1.15
MCI Res 1.45 2.90 0.90 1.80 0.90 1.80 1.45 2.90 0.90 1.80 0.90 1.80 1.45 2.90 0.90 1.80 0.90 1.80Sprint Res 1.50 3.00 0.95 1.90 0.80 1.60 1.50 3.00 0.95 1.90 0.75 1.50 1.45 2.90 0.85 1.70 0.75 1.502000AT&T Bus 2.31 4.61 2.31 4.61 2.31 4.61 2.31 4.61 2.31 4.61 2.31 4.61 2.31 4.61 2.31 4.61 2.31 4.61
MCI Bus 2.35 4.70 1.76 3.52 1.76 3.52 2.35 4.70 1.76 3.52 1.76 3.52 2.35 4.70 1.76 3.52 1.76 3.52Sprint Bus 1.89 3.78 1.19 2.37 1.19 2.37 1.89 3.78 1.19 2.37 1.19 2.37 1.89 3.78 1.19 2.37 1.19 2.37AT&T Res 1.48 2.95 1.13 2.25 0.73 1.45 1.48 2.95 1.13 2.25 0.73 1.45 1.48 2.95 1.13 2.25 0.73 1.45
MCI Res 1.50 3.00 1.25 2.50 1.25 2.50 1.50 3.00 1.25 2.50 1.25 2.50 1.50 3.00 1.25 2.50 1.25 2.50Sprint Res 1.80 3.60 1.25 2.50 0.80 1.60 1.80 3.60 1.25 2.50 0.75 1.50 1.75 3.50 1.15 2.30 0.70 1.40
223
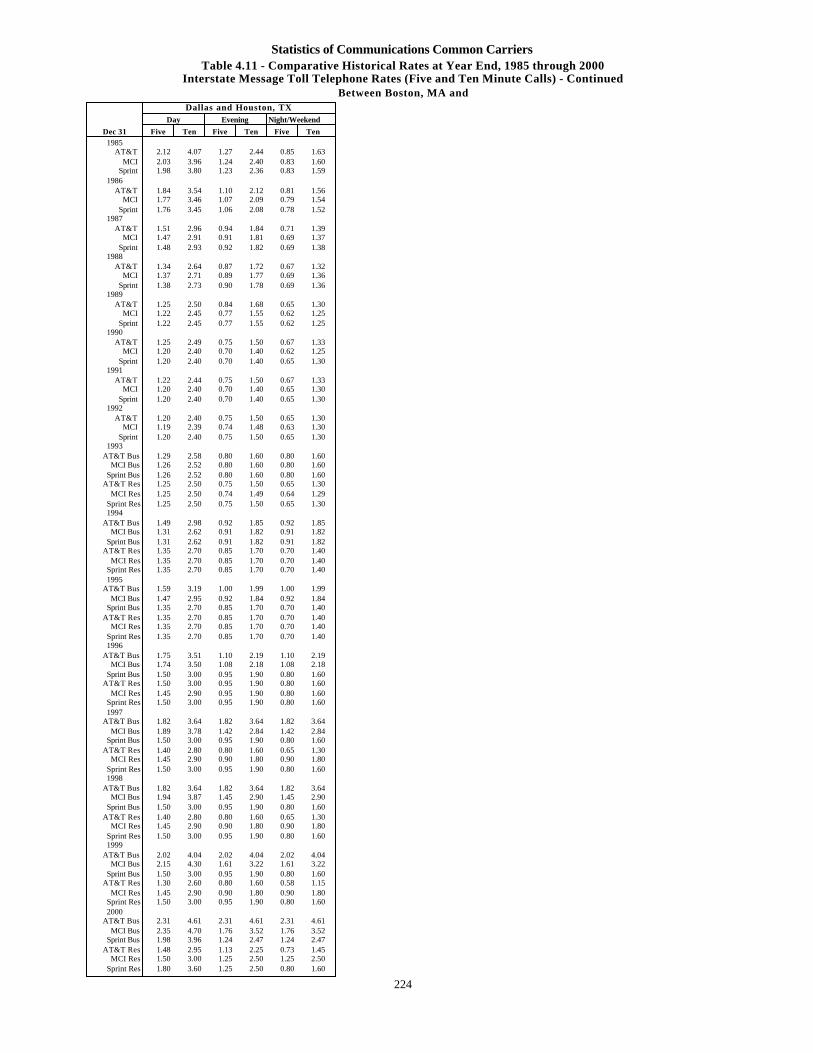
Statistics of Communications Common CarriersTable 4.11 - Comparative Historical Rates at Year End, 1985 through 2000
Interstate Message Toll Telephone Rates (Five and Ten Minute Calls) - ContinuedBetween Boston, MA and
Dallas and Houston, TXDay Evening Night/Weekend
Dec 31 Five Ten Five Ten Five Ten1985
AT&T 2.12 4.07 1.27 2.44 0.85 1.63MCI 2.03 3.96 1.24 2.40 0.83 1.60
Sprint 1.98 3.80 1.23 2.36 0.83 1.591986
AT&T 1.84 3.54 1.10 2.12 0.81 1.56MCI 1.77 3.46 1.07 2.09 0.79 1.54
Sprint 1.76 3.45 1.06 2.08 0.78 1.521987
AT&T 1.51 2.96 0.94 1.84 0.71 1.39MCI 1.47 2.91 0.91 1.81 0.69 1.37
Sprint 1.48 2.93 0.92 1.82 0.69 1.381988
AT&T 1.34 2.64 0.87 1.72 0.67 1.32MCI 1.37 2.71 0.89 1.77 0.69 1.36
Sprint 1.38 2.73 0.90 1.78 0.69 1.361989
AT&T 1.25 2.50 0.84 1.68 0.65 1.30MCI 1.22 2.45 0.77 1.55 0.62 1.25
Sprint 1.22 2.45 0.77 1.55 0.62 1.251990
AT&T 1.25 2.49 0.75 1.50 0.67 1.33MCI 1.20 2.40 0.70 1.40 0.62 1.25
Sprint 1.20 2.40 0.70 1.40 0.65 1.301991
AT&T 1.22 2.44 0.75 1.50 0.67 1.33MCI 1.20 2.40 0.70 1.40 0.65 1.30
Sprint 1.20 2.40 0.70 1.40 0.65 1.301992
AT&T 1.20 2.40 0.75 1.50 0.65 1.30MCI 1.19 2.39 0.74 1.48 0.63 1.30
Sprint 1.20 2.40 0.75 1.50 0.65 1.301993
AT&T Bus 1.29 2.58 0.80 1.60 0.80 1.60MCI Bus 1.26 2.52 0.80 1.60 0.80 1.60
Sprint Bus 1.26 2.52 0.80 1.60 0.80 1.60AT&T Res 1.25 2.50 0.75 1.50 0.65 1.30
MCI Res 1.25 2.50 0.74 1.49 0.64 1.29Sprint Res 1.25 2.50 0.75 1.50 0.65 1.301994
AT&T Bus 1.49 2.98 0.92 1.85 0.92 1.85MCI Bus 1.31 2.62 0.91 1.82 0.91 1.82
Sprint Bus 1.31 2.62 0.91 1.82 0.91 1.82AT&T Res 1.35 2.70 0.85 1.70 0.70 1.40
MCI Res 1.35 2.70 0.85 1.70 0.70 1.40Sprint Res 1.35 2.70 0.85 1.70 0.70 1.401995
AT&T Bus 1.59 3.19 1.00 1.99 1.00 1.99MCI Bus 1.47 2.95 0.92 1.84 0.92 1.84
Sprint Bus 1.35 2.70 0.85 1.70 0.70 1.40AT&T Res 1.35 2.70 0.85 1.70 0.70 1.40
MCI Res 1.35 2.70 0.85 1.70 0.70 1.40Sprint Res 1.35 2.70 0.85 1.70 0.70 1.401996
AT&T Bus 1.75 3.51 1.10 2.19 1.10 2.19MCI Bus 1.74 3.50 1.08 2.18 1.08 2.18
Sprint Bus 1.50 3.00 0.95 1.90 0.80 1.60AT&T Res 1.50 3.00 0.95 1.90 0.80 1.60
MCI Res 1.45 2.90 0.95 1.90 0.80 1.60Sprint Res 1.50 3.00 0.95 1.90 0.80 1.601997
AT&T Bus 1.82 3.64 1.82 3.64 1.82 3.64MCI Bus 1.89 3.78 1.42 2.84 1.42 2.84
Sprint Bus 1.50 3.00 0.95 1.90 0.80 1.60AT&T Res 1.40 2.80 0.80 1.60 0.65 1.30
MCI Res 1.45 2.90 0.90 1.80 0.90 1.80Sprint Res 1.50 3.00 0.95 1.90 0.80 1.601998
AT&T Bus 1.82 3.64 1.82 3.64 1.82 3.64MCI Bus 1.94 3.87 1.45 2.90 1.45 2.90
Sprint Bus 1.50 3.00 0.95 1.90 0.80 1.60AT&T Res 1.40 2.80 0.80 1.60 0.65 1.30
MCI Res 1.45 2.90 0.90 1.80 0.90 1.80Sprint Res 1.50 3.00 0.95 1.90 0.80 1.601999
AT&T Bus 2.02 4.04 2.02 4.04 2.02 4.04MCI Bus 2.15 4.30 1.61 3.22 1.61 3.22
Sprint Bus 1.50 3.00 0.95 1.90 0.80 1.60AT&T Res 1.30 2.60 0.80 1.60 0.58 1.15
MCI Res 1.45 2.90 0.90 1.80 0.90 1.80Sprint Res 1.50 3.00 0.95 1.90 0.80 1.602000
AT&T Bus 2.31 4.61 2.31 4.61 2.31 4.61MCI Bus 2.35 4.70 1.76 3.52 1.76 3.52
Sprint Bus 1.98 3.96 1.24 2.47 1.24 2.47AT&T Res 1.48 2.95 1.13 2.25 0.73 1.45
MCI Res 1.50 3.00 1.25 2.50 1.25 2.50Sprint Res 1.80 3.60 1.25 2.50 0.80 1.60
224

Part 5
Trends and Monitoring Tables
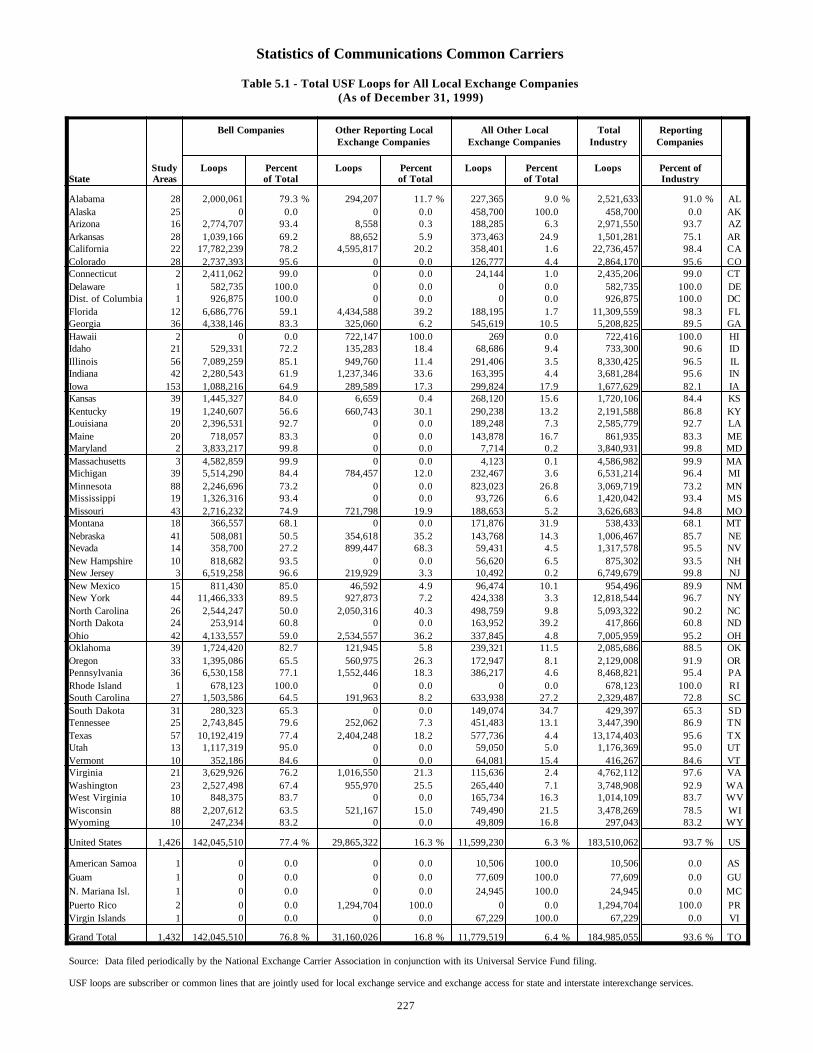
Statistics of Communications Common Carriers
Table 5.1 - Total USF Loops for All Local Exchange Companies(As of December 31, 1999)
Bell Companies Other Reporting Local All Other Local Total ReportingExchange Companies Exchange Companies Industry Companies
Study Loops Percent Loops Percent Loops Percent Loops Percent ofState Areas of Total of Total of Total Industry
Alabama 28 2,000,061 79.3 % 294,207 11.7 % 227,365 9.0 % 2,521,633 91.0 % ALAlaska 25 0 0.0 0 0.0 458,700 100.0 458,700 0.0 AKArizona 16 2,774,707 93.4 8,558 0.3 188,285 6.3 2,971,550 93.7 AZArkansas 28 1,039,166 69.2 88,652 5.9 373,463 24.9 1,501,281 75.1 ARCalifornia 22 17,782,239 78.2 4,595,817 20.2 358,401 1.6 22,736,457 98.4 CAColorado 28 2,737,393 95.6 0 0.0 126,777 4.4 2,864,170 95.6 COConnecticut 2 2,411,062 99.0 0 0.0 24,144 1.0 2,435,206 99.0 CTDelaware 1 582,735 100.0 0 0.0 0 0.0 582,735 100.0 DEDist. of Columbia 1 926,875 100.0 0 0.0 0 0.0 926,875 100.0 DCFlorida 12 6,686,776 59.1 4,434,588 39.2 188,195 1.7 11,309,559 98.3 FLGeorgia 36 4,338,146 83.3 325,060 6.2 545,619 10.5 5,208,825 89.5 GAHawaii 2 0 0.0 722,147 100.0 269 0.0 722,416 100.0 HIIdaho 21 529,331 72.2 135,283 18.4 68,686 9.4 733,300 90.6 IDIllinois 56 7,089,259 85.1 949,760 11.4 291,406 3.5 8,330,425 96.5 ILIndiana 42 2,280,543 61.9 1,237,346 33.6 163,395 4.4 3,681,284 95.6 INIowa 153 1,088,216 64.9 289,589 17.3 299,824 17.9 1,677,629 82.1 IAKansas 39 1,445,327 84.0 6,659 0.4 268,120 15.6 1,720,106 84.4 KSKentucky 19 1,240,607 56.6 660,743 30.1 290,238 13.2 2,191,588 86.8 KYLouisiana 20 2,396,531 92.7 0 0.0 189,248 7.3 2,585,779 92.7 LAMaine 20 718,057 83.3 0 0.0 143,878 16.7 861,935 83.3 MEMaryland 2 3,833,217 99.8 0 0.0 7,714 0.2 3,840,931 99.8 MDMassachusetts 3 4,582,859 99.9 0 0.0 4,123 0.1 4,586,982 99.9 MAMichigan 39 5,514,290 84.4 784,457 12.0 232,467 3.6 6,531,214 96.4 MIMinnesota 88 2,246,696 73.2 0 0.0 823,023 26.8 3,069,719 73.2 MNMississippi 19 1,326,316 93.4 0 0.0 93,726 6.6 1,420,042 93.4 MSMissouri 43 2,716,232 74.9 721,798 19.9 188,653 5.2 3,626,683 94.8 MOMontana 18 366,557 68.1 0 0.0 171,876 31.9 538,433 68.1 MTNebraska 41 508,081 50.5 354,618 35.2 143,768 14.3 1,006,467 85.7 NENevada 14 358,700 27.2 899,447 68.3 59,431 4.5 1,317,578 95.5 NVNew Hampshire 10 818,682 93.5 0 0.0 56,620 6.5 875,302 93.5 NHNew Jersey 3 6,519,258 96.6 219,929 3.3 10,492 0.2 6,749,679 99.8 NJNew Mexico 15 811,430 85.0 46,592 4.9 96,474 10.1 954,496 89.9 NMNew York 44 11,466,333 89.5 927,873 7.2 424,338 3.3 12,818,544 96.7 NYNorth Carolina 26 2,544,247 50.0 2,050,316 40.3 498,759 9.8 5,093,322 90.2 NCNorth Dakota 24 253,914 60.8 0 0.0 163,952 39.2 417,866 60.8 NDOhio 42 4,133,557 59.0 2,534,557 36.2 337,845 4.8 7,005,959 95.2 OHOklahoma 39 1,724,420 82.7 121,945 5.8 239,321 11.5 2,085,686 88.5 OKOregon 33 1,395,086 65.5 560,975 26.3 172,947 8.1 2,129,008 91.9 ORPennsylvania 36 6,530,158 77.1 1,552,446 18.3 386,217 4.6 8,468,821 95.4 PARhode Island 1 678,123 100.0 0 0.0 0 0.0 678,123 100.0 RISouth Carolina 27 1,503,586 64.5 191,963 8.2 633,938 27.2 2,329,487 72.8 SCSouth Dakota 31 280,323 65.3 0 0.0 149,074 34.7 429,397 65.3 SDTennessee 25 2,743,845 79.6 252,062 7.3 451,483 13.1 3,447,390 86.9 TNTexas 57 10,192,419 77.4 2,404,248 18.2 577,736 4.4 13,174,403 95.6 TXUtah 13 1,117,319 95.0 0 0.0 59,050 5.0 1,176,369 95.0 UTVermont 10 352,186 84.6 0 0.0 64,081 15.4 416,267 84.6 VTVirginia 21 3,629,926 76.2 1,016,550 21.3 115,636 2.4 4,762,112 97.6 VAWashington 23 2,527,498 67.4 955,970 25.5 265,440 7.1 3,748,908 92.9 WAWest Virginia 10 848,375 83.7 0 0.0 165,734 16.3 1,014,109 83.7 WVWisconsin 88 2,207,612 63.5 521,167 15.0 749,490 21.5 3,478,269 78.5 WIWyoming 10 247,234 83.2 0 0.0 49,809 16.8 297,043 83.2 WY
United States 1,426 142,045,510 77.4 % 29,865,322 16.3 % 11,599,230 6.3 % 183,510,062 93.7 % US
American Samoa 1 0 0.0 0 0.0 10,506 100.0 10,506 0.0 AS
Guam 1 0 0.0 0 0.0 77,609 100.0 77,609 0.0 GU
N. Mariana Isl. 1 0 0.0 0 0.0 24,945 100.0 24,945 0.0 MC
Puerto Rico 2 0 0.0 1,294,704 100.0 0 0.0 1,294,704 100.0 PRVirgin Islands 1 0 0.0 0 0.0 67,229 100.0 67,229 0.0 VI
Grand Total 1,432 142,045,510 76.8 % 31,160,026 16.8 % 11,779,519 6.4 % 184,985,055 93.6 % TO
Source: Data filed periodically by the National Exchange Carrier Association in conjunction with its Universal Service Fund filing.
USF loops are subscriber or common lines that are jointly used for local exchange service and exchange access for state and interstate interexchange services.
227
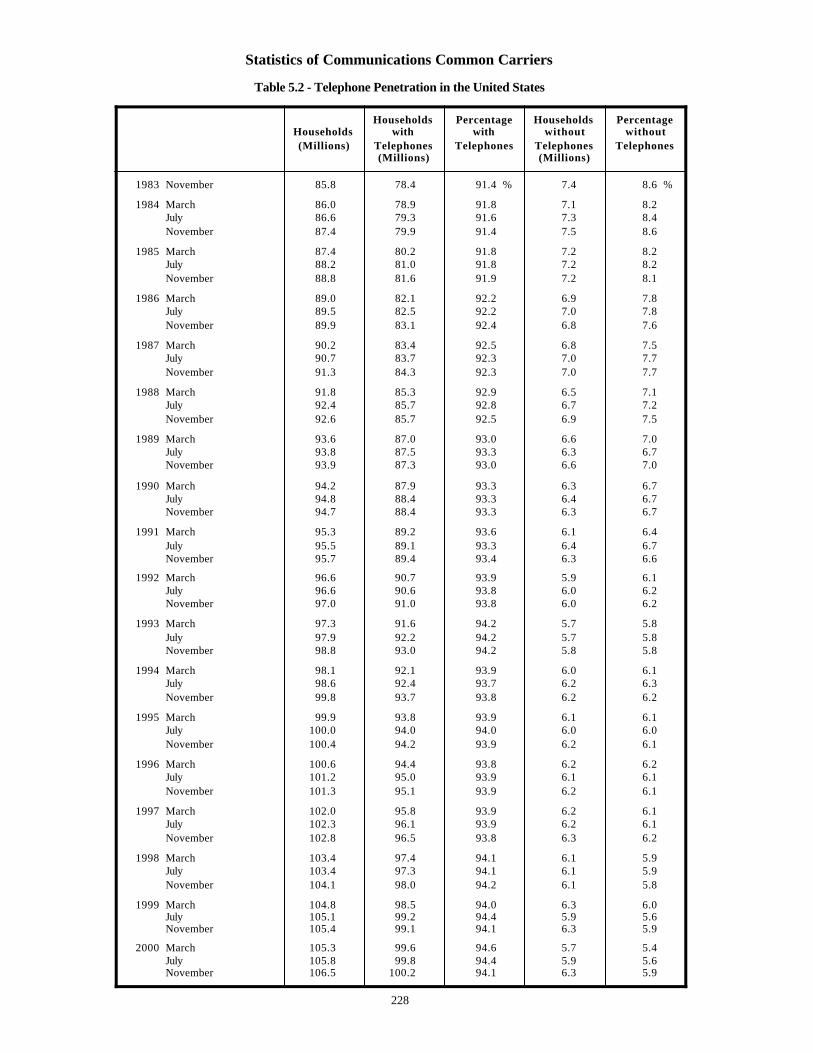
Statistics of Communications Common Carriers
Table 5.2 - Telephone Penetration in the United States
Households Percentage Households PercentageHouseholds with with without without(Millions) Telephones Telephones Telephones Telephones
(Millions) (Millions)
1983 November 85.8 78.4 91.4 % 7.4 8.6 %
1984 March 86.0 78.9 91.8 7.1 8.2July 86.6 79.3 91.6 7.3 8.4November 87.4 79.9 91.4 7.5 8.6
1985 March 87.4 80.2 91.8 7.2 8.2July 88.2 81.0 91.8 7.2 8.2November 88.8 81.6 91.9 7.2 8.1
1986 March 89.0 82.1 92.2 6.9 7.8July 89.5 82.5 92.2 7.0 7.8November 89.9 83.1 92.4 6.8 7.6
1987 March 90.2 83.4 92.5 6.8 7.5July 90.7 83.7 92.3 7.0 7.7November 91.3 84.3 92.3 7.0 7.7
1988 March 91.8 85.3 92.9 6.5 7.1July 92.4 85.7 92.8 6.7 7.2November 92.6 85.7 92.5 6.9 7.5
1989 March 93.6 87.0 93.0 6.6 7.0July 93.8 87.5 93.3 6.3 6.7November 93.9 87.3 93.0 6.6 7.0
1990 March 94.2 87.9 93.3 6.3 6.7July 94.8 88.4 93.3 6.4 6.7November 94.7 88.4 93.3 6.3 6.7
1991 March 95.3 89.2 93.6 6.1 6.4July 95.5 89.1 93.3 6.4 6.7November 95.7 89.4 93.4 6.3 6.6
1992 March 96.6 90.7 93.9 5.9 6.1July 96.6 90.6 93.8 6.0 6.2November 97.0 91.0 93.8 6.0 6.2
1993 March 97.3 91.6 94.2 5.7 5.8July 97.9 92.2 94.2 5.7 5.8November 98.8 93.0 94.2 5.8 5.8
1994 March 98.1 92.1 93.9 6.0 6.1July 98.6 92.4 93.7 6.2 6.3November 99.8 93.7 93.8 6.2 6.2
1995 March 99.9 93.8 93.9 6.1 6.1July 100.0 94.0 94.0 6.0 6.0November 100.4 94.2 93.9 6.2 6.1
1996 March 100.6 94.4 93.8 6.2 6.2July 101.2 95.0 93.9 6.1 6.1November 101.3 95.1 93.9 6.2 6.1
1997 March 102.0 95.8 93.9 6.2 6.1July 102.3 96.1 93.9 6.2 6.1November 102.8 96.5 93.8 6.3 6.2
1998 March 103.4 97.4 94.1 6.1 5.9July 103.4 97.3 94.1 6.1 5.9November 104.1 98.0 94.2 6.1 5.8
1999 March 104.8 98.5 94.0 6.3 6.0July 105.1 99.2 94.4 5.9 5.6November 105.4 99.1 94.1 6.3 5.9
2000 March 105.3 99.6 94.6 5.7 5.4July 105.8 99.8 94.4 5.9 5.6November 106.5 100.2 94.1 6.3 5.9
228
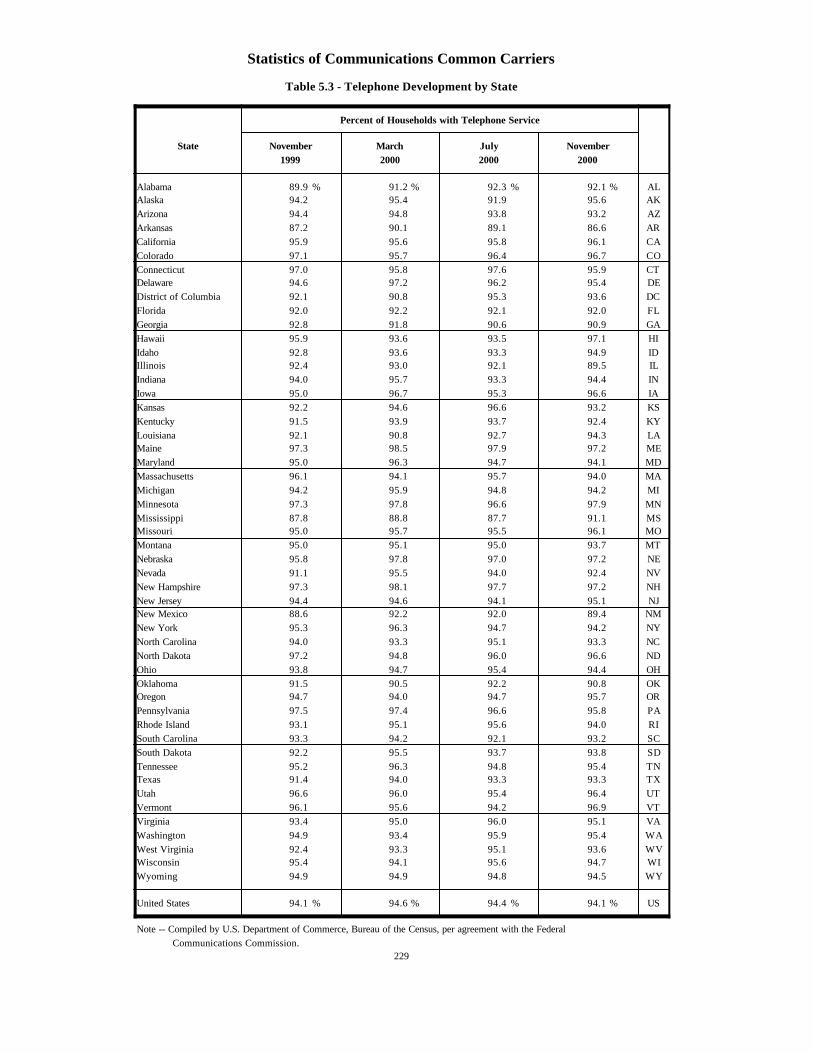
Statistics of Communications Common Carriers
Table 5.3 - Telephone Development by State
Percent of Households with Telephone Service
State November March July November1999 2000 2000 2000
Alabama 89.9 % 91.2 % 92.3 % 92.1 % ALAlaska 94.2 95.4 91.9 95.6 AK
Arizona 94.4 94.8 93.8 93.2 AZ
Arkansas 87.2 90.1 89.1 86.6 AR
California 95.9 95.6 95.8 96.1 CA
Colorado 97.1 95.7 96.4 96.7 CO
Connecticut 97.0 95.8 97.6 95.9 CTDelaware 94.6 97.2 96.2 95.4 DE
District of Columbia 92.1 90.8 95.3 93.6 DC
Florida 92.0 92.2 92.1 92.0 FL
Georgia 92.8 91.8 90.6 90.9 GA
Hawaii 95.9 93.6 93.5 97.1 HI
Idaho 92.8 93.6 93.3 94.9 IDIllinois 92.4 93.0 92.1 89.5 IL
Indiana 94.0 95.7 93.3 94.4 IN
Iowa 95.0 96.7 95.3 96.6 IA
Kansas 92.2 94.6 96.6 93.2 KS
Kentucky 91.5 93.9 93.7 92.4 KY
Louisiana 92.1 90.8 92.7 94.3 LAMaine 97.3 98.5 97.9 97.2 ME
Maryland 95.0 96.3 94.7 94.1 MD
Massachusetts 96.1 94.1 95.7 94.0 MA
Michigan 94.2 95.9 94.8 94.2 MI
Minnesota 97.3 97.8 96.6 97.9 MN
Mississippi 87.8 88.8 87.7 91.1 MSMissouri 95.0 95.7 95.5 96.1 MO
Montana 95.0 95.1 95.0 93.7 MT
Nebraska 95.8 97.8 97.0 97.2 NE
Nevada 91.1 95.5 94.0 92.4 NV
New Hampshire 97.3 98.1 97.7 97.2 NH
New Jersey 94.4 94.6 94.1 95.1 NJNew Mexico 88.6 92.2 92.0 89.4 NM
New York 95.3 96.3 94.7 94.2 NY
North Carolina 94.0 93.3 95.1 93.3 NC
North Dakota 97.2 94.8 96.0 96.6 ND
Ohio 93.8 94.7 95.4 94.4 OH
Oklahoma 91.5 90.5 92.2 90.8 OKOregon 94.7 94.0 94.7 95.7 OR
Pennsylvania 97.5 97.4 96.6 95.8 PA
Rhode Island 93.1 95.1 95.6 94.0 RI
South Carolina 93.3 94.2 92.1 93.2 SC
South Dakota 92.2 95.5 93.7 93.8 SD
Tennessee 95.2 96.3 94.8 95.4 TNTexas 91.4 94.0 93.3 93.3 TX
Utah 96.6 96.0 95.4 96.4 UT
Vermont 96.1 95.6 94.2 96.9 VT
Virginia 93.4 95.0 96.0 95.1 VA
Washington 94.9 93.4 95.9 95.4 WA
West Virginia 92.4 93.3 95.1 93.6 WVWisconsin 95.4 94.1 95.6 94.7 WI
Wyoming 94.9 94.9 94.8 94.5 WY
United States 94.1 % 94.6 % 94.4 % 94.1 % US
Note -- Compiled by U.S. Department of Commerce, Bureau of the Census, per agreement with the Federal
Communications Commission.229
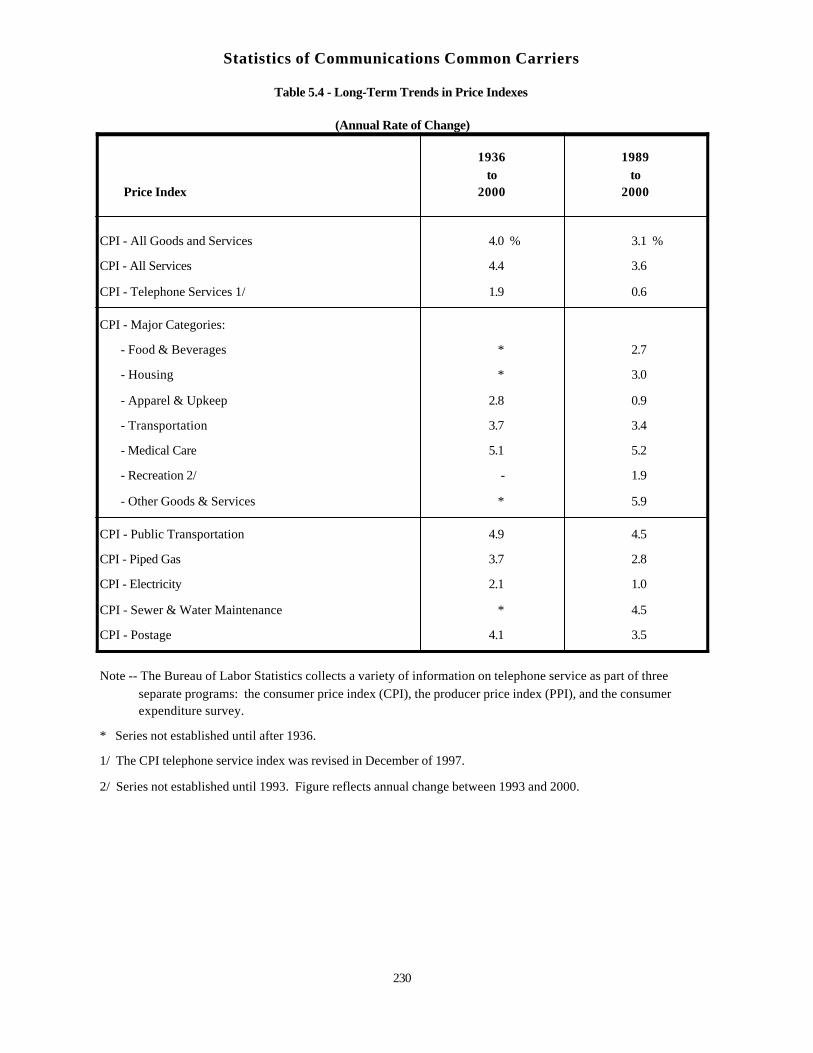
Statistics of Communications Common Carriers
Table 5.4 - Long-Term Trends in Price Indexes
(Annual Rate of Change)
1936 1989to to
Price Index 2000 2000
CPI - All Goods and Services 4.0 % 3.1 %
CPI - All Services 4.4 3.6
CPI - Telephone Services 1/ 1.9 0.6
CPI - Major Categories:
- Food & Beverages * 2.7
- Housing * 3.0
- Apparel & Upkeep 2.8 0.9
- Transportation 3.7 3.4
- Medical Care 5.1 5.2
- Recreation 2/ - 1.9
- Other Goods & Services * 5.9
CPI - Public Transportation 4.9 4.5
CPI - Piped Gas 3.7 2.8
CPI - Electricity 2.1 1.0 CPI - Sewer & Water Maintenance * 4.5
CPI - Postage 4.1 3.5
Note -- The Bureau of Labor Statistics collects a variety of information on telephone service as part of three separate programs: the consumer price index (CPI), the producer price index (PPI), and the consumer expenditure survey.
* Series not established until after 1936.
1/ The CPI telephone service index was revised in December of 1997.
2/ Series not established until 1993. Figure reflects annual change between 1993 and 2000.
230
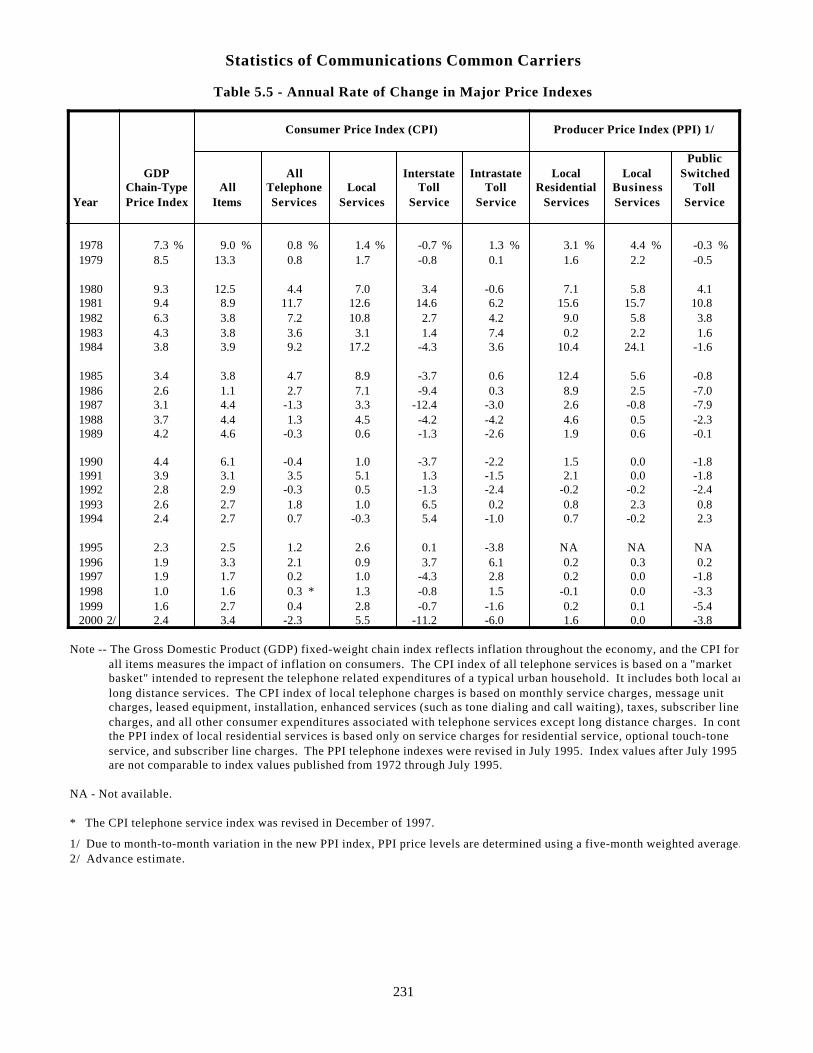
Statistics of Communications Common Carriers
Table 5.5 - Annual Rate of Change in Major Price Indexes
Consumer Price Index (CPI) Producer Price Index (PPI) 1/
PublicGDP All Interstate Intrastate Local Local Switched
Chain-Type All Telephone Local Toll Toll Residential Business TollYear Price Index Items Services Services Service Service Services Services Service
1978 7.3 % 9.0 % 0.8 % 1.4 % -0.7 % 1.3 % 3.1 % 4.4 % -0.3 % 1979 8.5 13.3 0.8 1.7 -0.8 0.1 1.6 2.2 -0.5
1980 9.3 12.5 4.4 7.0 3.4 -0.6 7.1 5.8 4.1 1981 9.4 8.9 11.7 12.6 14.6 6.2 15.6 15.7 10.8 1982 6.3 3.8 7.2 10.8 2.7 4.2 9.0 5.8 3.8 1983 4.3 3.8 3.6 3.1 1.4 7.4 0.2 2.2 1.6 1984 3.8 3.9 9.2 17.2 -4.3 3.6 10.4 24.1 -1.6
1985 3.4 3.8 4.7 8.9 -3.7 0.6 12.4 5.6 -0.8 1986 2.6 1.1 2.7 7.1 -9.4 0.3 8.9 2.5 -7.0 1987 3.1 4.4 -1.3 3.3 -12.4 -3.0 2.6 -0.8 -7.9 1988 3.7 4.4 1.3 4.5 -4.2 -4.2 4.6 0.5 -2.3 1989 4.2 4.6 -0.3 0.6 -1.3 -2.6 1.9 0.6 -0.1
1990 4.4 6.1 -0.4 1.0 -3.7 -2.2 1.5 0.0 -1.8 1991 3.9 3.1 3.5 5.1 1.3 -1.5 2.1 0.0 -1.8 1992 2.8 2.9 -0.3 0.5 -1.3 -2.4 -0.2 -0.2 -2.4 1993 2.6 2.7 1.8 1.0 6.5 0.2 0.8 2.3 0.8 1994 2.4 2.7 0.7 -0.3 5.4 -1.0 0.7 -0.2 2.3
1995 2.3 2.5 1.2 2.6 0.1 -3.8 NA NA NA 1996 1.9 3.3 2.1 0.9 3.7 6.1 0.2 0.3 0.2 1997 1.9 1.7 0.2 1.0 -4.3 2.8 0.2 0.0 -1.8 1998 1.0 1.6 0.3 * 1.3 -0.8 1.5 -0.1 0.0 -3.3 1999 1.6 2.7 0.4 2.8 -0.7 -1.6 0.2 0.1 -5.4 2000 2/ 2.4 3.4 -2.3 5.5 -11.2 -6.0 1.6 0.0 -3.8
Note -- The Gross Domestic Product (GDP) fixed-weight chain index reflects inflation throughout the economy, and the CPI for all items measures the impact of inflation on consumers. The CPI index of all telephone services is based on a "market basket" intended to represent the telephone related expenditures of a typical urban household. It includes both local and long distance services. The CPI index of local telephone charges is based on monthly service charges, message unit charges, leased equipment, installation, enhanced services (such as tone dialing and call waiting), taxes, subscriber line charges, and all other consumer expenditures associated with telephone services except long distance charges. In contrast, the PPI index of local residential services is based only on service charges for residential service, optional touch-tone service, and subscriber line charges. The PPI telephone indexes were revised in July 1995. Index values after July 1995 are not comparable to index values published from 1972 through July 1995.
NA - Not available.
* The CPI telephone service index was revised in December of 1997.
1/ Due to month-to-month variation in the new PPI index, PPI price levels are determined using a five-month weighted average.2/ Advance estimate.
231
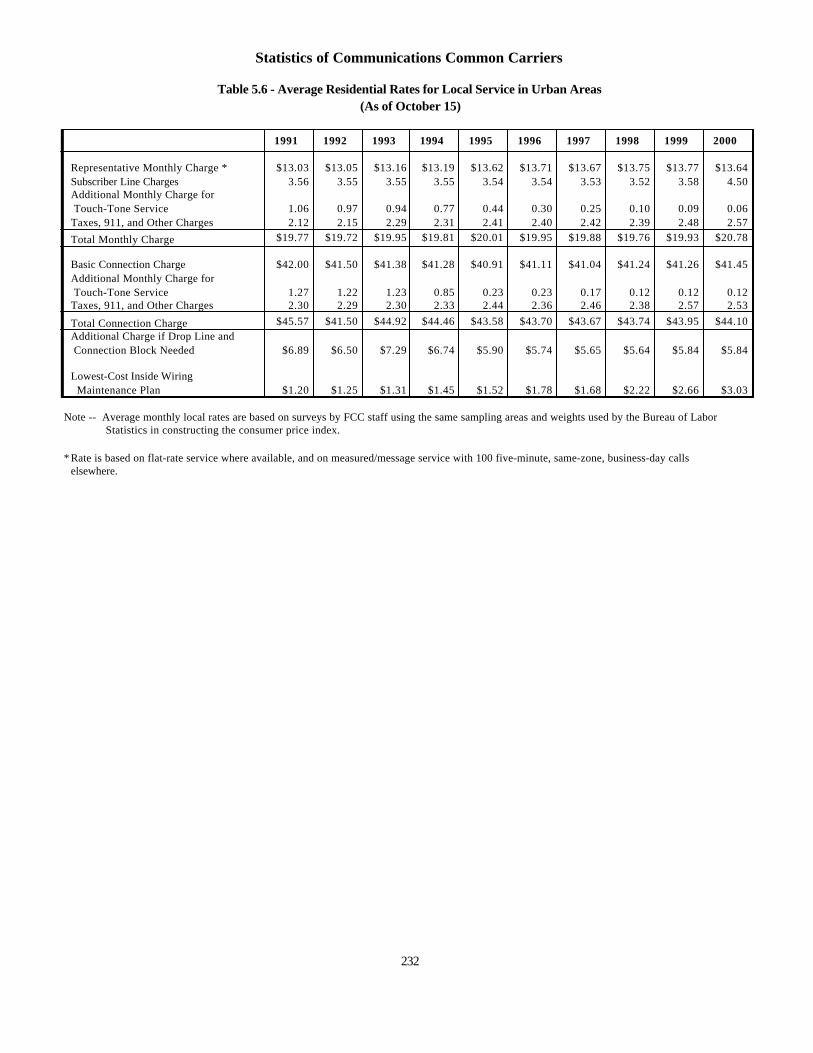
Statistics of Communications Common Carriers
Table 5.6 - Average Residential Rates for Local Service in Urban Areas(As of October 15)
1991 1992 1993 1994 1995 1996 1997 1998 1999 2000
Representative Monthly Charge * $13.03 $13.05 $13.16 $13.19 $13.62 $13.71 $13.67 $13.75 $13.77 $13.64Subscriber Line Charges 3.56 3.55 3.55 3.55 3.54 3.54 3.53 3.52 3.58 4.50Additional Monthly Charge for Touch-Tone Service 1.06 0.97 0.94 0.77 0.44 0.30 0.25 0.10 0.09 0.06Taxes, 911, and Other Charges 2.12 2.15 2.29 2.31 2.41 2.40 2.42 2.39 2.48 2.57
Total Monthly Charge $19.77 $19.72 $19.95 $19.81 $20.01 $19.95 $19.88 $19.76 $19.93 $20.78
Basic Connection Charge $42.00 $41.50 $41.38 $41.28 $40.91 $41.11 $41.04 $41.24 $41.26 $41.45Additional Monthly Charge for Touch-Tone Service 1.27 1.22 1.23 0.85 0.23 0.23 0.17 0.12 0.12 0.12Taxes, 911, and Other Charges 2.30 2.29 2.30 2.33 2.44 2.36 2.46 2.38 2.57 2.53
Total Connection Charge $45.57 $41.50 $44.92 $44.46 $43.58 $43.70 $43.67 $43.74 $43.95 $44.10Additional Charge if Drop Line and Connection Block Needed $6.89 $6.50 $7.29 $6.74 $5.90 $5.74 $5.65 $5.64 $5.84 $5.84
Lowest-Cost Inside Wiring Maintenance Plan $1.20 $1.25 $1.31 $1.45 $1.52 $1.78 $1.68 $2.22 $2.66 $3.03
Note -- Average monthly local rates are based on surveys by FCC staff using the same sampling areas and weights used by the Bureau of Labor Statistics in constructing the consumer price index.
* Rate is based on flat-rate service where available, and on measured/message service with 100 five-minute, same-zone, business-day callselsewhere.
232
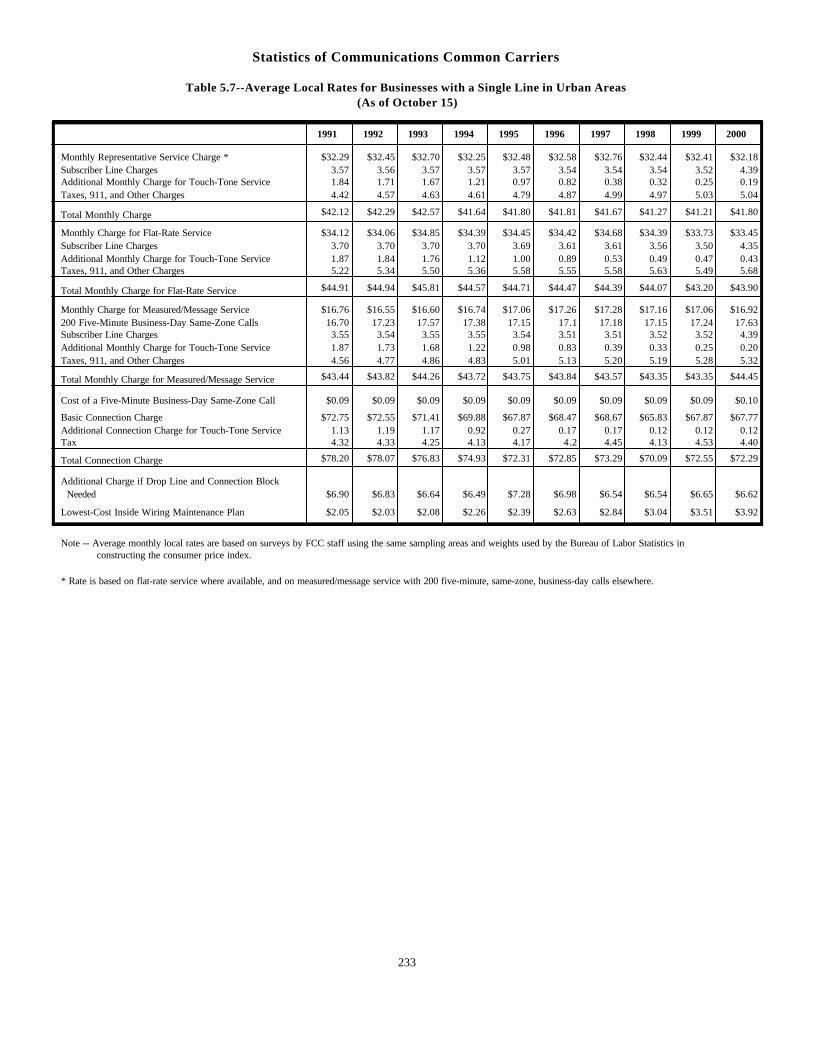
Statistics of Communications Common Carriers
Table 5.7--Average Local Rates for Businesses with a Single Line in Urban Areas(As of October 15)
1991 1992 1993 1994 1995 1996 1997 1998 1999 2000
Monthly Representative Service Charge * $32.29 $32.45 $32.70 $32.25 $32.48 $32.58 $32.76 $32.44 $32.41 $32.18Subscriber Line Charges 3.57 3.56 3.57 3.57 3.57 3.54 3.54 3.54 3.52 4.39Additional Monthly Charge for Touch-Tone Service 1.84 1.71 1.67 1.21 0.97 0.82 0.38 0.32 0.25 0.19Taxes, 911, and Other Charges 4.42 4.57 4.63 4.61 4.79 4.87 4.99 4.97 5.03 5.04
Total Monthly Charge $42.12 $42.29 $42.57 $41.64 $41.80 $41.81 $41.67 $41.27 $41.21 $41.80
Monthly Charge for Flat-Rate Service $34.12 $34.06 $34.85 $34.39 $34.45 $34.42 $34.68 $34.39 $33.73 $33.45Subscriber Line Charges 3.70 3.70 3.70 3.70 3.69 3.61 3.61 3.56 3.50 4.35Additional Monthly Charge for Touch-Tone Service 1.87 1.84 1.76 1.12 1.00 0.89 0.53 0.49 0.47 0.43Taxes, 911, and Other Charges 5.22 5.34 5.50 5.36 5.58 5.55 5.58 5.63 5.49 5.68
Total Monthly Charge for Flat-Rate Service $44.91 $44.94 $45.81 $44.57 $44.71 $44.47 $44.39 $44.07 $43.20 $43.90
Monthly Charge for Measured/Message Service $16.76 $16.55 $16.60 $16.74 $17.06 $17.26 $17.28 $17.16 $17.06 $16.92200 Five-Minute Business-Day Same-Zone Calls 16.70 17.23 17.57 17.38 17.15 17.1 17.18 17.15 17.24 17.63Subscriber Line Charges 3.55 3.54 3.55 3.55 3.54 3.51 3.51 3.52 3.52 4.39Additional Monthly Charge for Touch-Tone Service 1.87 1.73 1.68 1.22 0.98 0.83 0.39 0.33 0.25 0.20Taxes, 911, and Other Charges 4.56 4.77 4.86 4.83 5.01 5.13 5.20 5.19 5.28 5.32
Total Monthly Charge for Measured/Message Service $43.44 $43.82 $44.26 $43.72 $43.75 $43.84 $43.57 $43.35 $43.35 $44.45
Cost of a Five-Minute Business-Day Same-Zone Call $0.09 $0.09 $0.09 $0.09 $0.09 $0.09 $0.09 $0.09 $0.09 $0.10
Basic Connection Charge $72.75 $72.55 $71.41 $69.88 $67.87 $68.47 $68.67 $65.83 $67.87 $67.77Additional Connection Charge for Touch-Tone Service 1.13 1.19 1.17 0.92 0.27 0.17 0.17 0.12 0.12 0.12Tax 4.32 4.33 4.25 4.13 4.17 4.2 4.45 4.13 4.53 4.40
Total Connection Charge $78.20 $78.07 $76.83 $74.93 $72.31 $72.85 $73.29 $70.09 $72.55 $72.29
Additional Charge if Drop Line and Connection Block Needed $6.90 $6.83 $6.64 $6.49 $7.28 $6.98 $6.54 $6.54 $6.65 $6.62
Lowest-Cost Inside Wiring Maintenance Plan $2.05 $2.03 $2.08 $2.26 $2.39 $2.63 $2.84 $3.04 $3.51 $3.92
Note -- Average monthly local rates are based on surveys by FCC staff using the same sampling areas and weights used by the Bureau of Labor Statistics in constructing the consumer price index.
* Rate is based on flat-rate service where available, and on measured/message service with 200 five-minute, same-zone, business-day calls elsewhere.
233
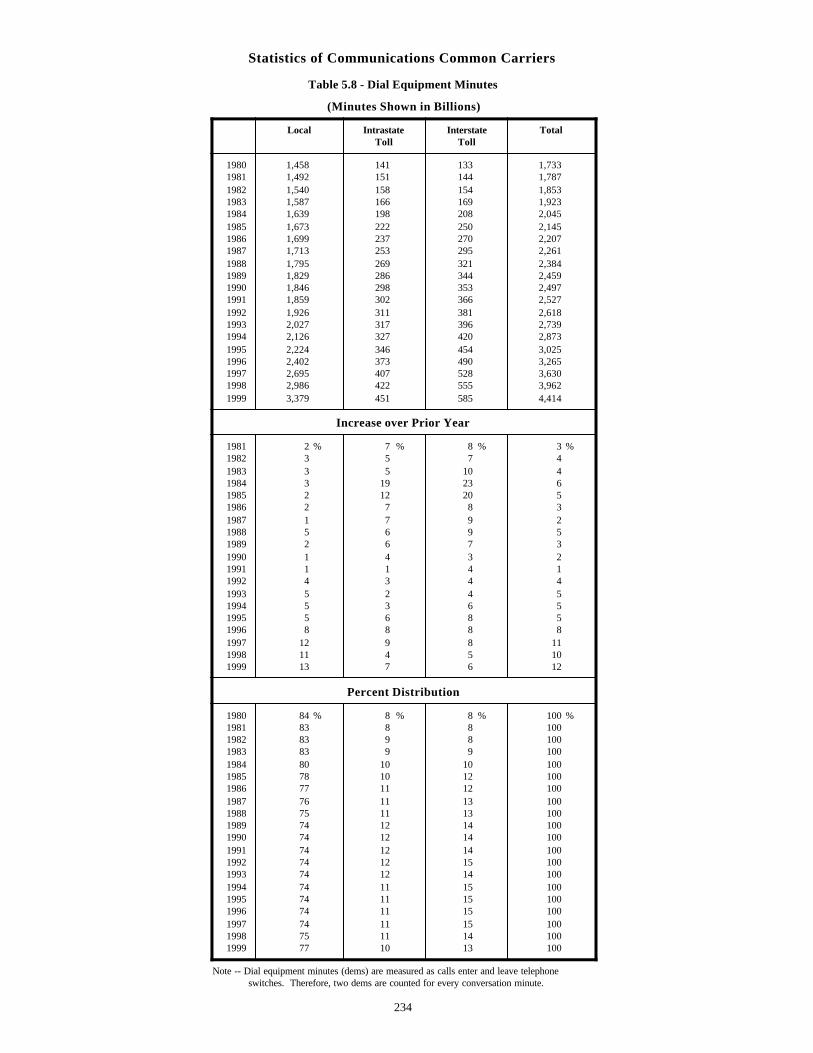
Statistics of Communications Common Carriers
Table 5.8 - Dial Equipment Minutes
(Minutes Shown in Billions)
Local Intrastate Interstate TotalToll Toll
1980 1,458 141 133 1,7331981 1,492 151 144 1,7871982 1,540 158 154 1,8531983 1,587 166 169 1,9231984 1,639 198 208 2,0451985 1,673 222 250 2,1451986 1,699 237 270 2,2071987 1,713 253 295 2,2611988 1,795 269 321 2,3841989 1,829 286 344 2,4591990 1,846 298 353 2,4971991 1,859 302 366 2,5271992 1,926 311 381 2,6181993 2,027 317 396 2,7391994 2,126 327 420 2,8731995 2,224 346 454 3,0251996 2,402 373 490 3,2651997 2,695 407 528 3,6301998 2,986 422 555 3,9621999 3,379 451 585 4,414
Increase over Prior Year
1981 2 % 7 % 8 % 3 %1982 3 5 7 41983 3 5 10 41984 3 19 23 61985 2 12 20 51986 2 7 8 31987 1 7 9 21988 5 6 9 51989 2 6 7 31990 1 4 3 21991 1 1 4 11992 4 3 4 41993 5 2 4 51994 5 3 6 51995 5 6 8 51996 8 8 8 81997 12 9 8 111998 11 4 5 101999 13 7 6 12
Percent Distribution
1980 84 % 8 % 8 % 100 %1981 83 8 8 1001982 83 9 8 1001983 83 9 9 1001984 80 10 10 1001985 78 10 12 1001986 77 11 12 1001987 76 11 13 1001988 75 11 13 1001989 74 12 14 1001990 74 12 14 1001991 74 12 14 1001992 74 12 15 1001993 74 12 14 1001994 74 11 15 1001995 74 11 15 1001996 74 11 15 1001997 74 11 15 1001998 75 11 14 1001999 77 10 13 100
Note -- Dial equipment minutes (dems) are measured as calls enter and leave telephone switches. Therefore, two dems are counted for every conversation minute.
234
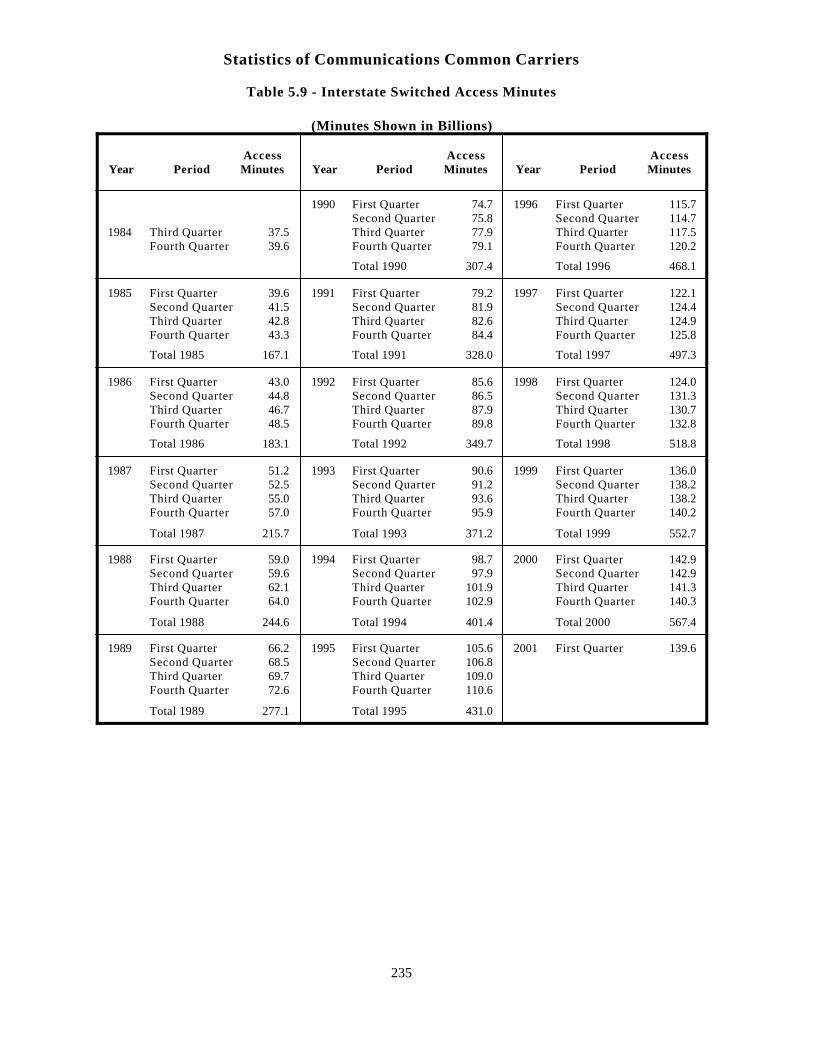
Statistics of Communications Common Carriers
Table 5.9 - Interstate Switched Access Minutes
(Minutes Shown in Billions)
Access Access AccessYear Period Minutes Year Period Minutes Year Period Minutes
1990 First Quarter 74.7 1996 First Quarter 115.7Second Quarter 75.8 Second Quarter 114.7
1984 Third Quarter 37.5 Third Quarter 77.9 Third Quarter 117.5Fourth Quarter 39.6 Fourth Quarter 79.1 Fourth Quarter 120.2
Total 1990 307.4 Total 1996 468.1
1985 First Quarter 39.6 1991 First Quarter 79.2 1997 First Quarter 122.1Second Quarter 41.5 Second Quarter 81.9 Second Quarter 124.4Third Quarter 42.8 Third Quarter 82.6 Third Quarter 124.9Fourth Quarter 43.3 Fourth Quarter 84.4 Fourth Quarter 125.8
Total 1985 167.1 Total 1991 328.0 Total 1997 497.3
1986 First Quarter 43.0 1992 First Quarter 85.6 1998 First Quarter 124.0Second Quarter 44.8 Second Quarter 86.5 Second Quarter 131.3Third Quarter 46.7 Third Quarter 87.9 Third Quarter 130.7Fourth Quarter 48.5 Fourth Quarter 89.8 Fourth Quarter 132.8
Total 1986 183.1 Total 1992 349.7 Total 1998 518.8
1987 First Quarter 51.2 1993 First Quarter 90.6 1999 First Quarter 136.0Second Quarter 52.5 Second Quarter 91.2 Second Quarter 138.2Third Quarter 55.0 Third Quarter 93.6 Third Quarter 138.2Fourth Quarter 57.0 Fourth Quarter 95.9 Fourth Quarter 140.2
Total 1987 215.7 Total 1993 371.2 Total 1999 552.7
1988 First Quarter 59.0 1994 First Quarter 98.7 2000 First Quarter 142.9Second Quarter 59.6 Second Quarter 97.9 Second Quarter 142.9Third Quarter 62.1 Third Quarter 101.9 Third Quarter 141.3Fourth Quarter 64.0 Fourth Quarter 102.9 Fourth Quarter 140.3
Total 1988 244.6 Total 1994 401.4 Total 2000 567.4
1989 First Quarter 66.2 1995 First Quarter 105.6 2001 First Quarter 139.6Second Quarter 68.5 Second Quarter 106.8Third Quarter 69.7 Third Quarter 109.0Fourth Quarter 72.6 Fourth Quarter 110.6
Total 1989 277.1 Total 1995 431.0
235
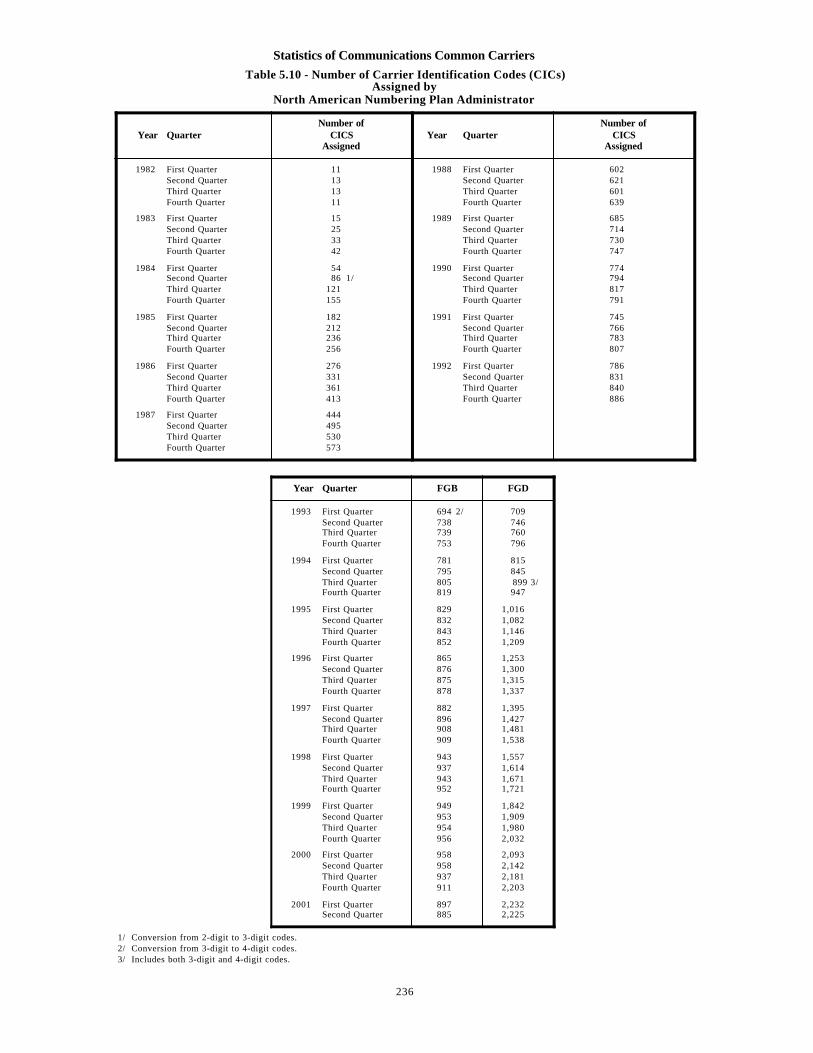
Statistics of Communications Common Carriers
Table 5.10 - Number of Carrier Identification Codes (CICs)Assigned by
North American Numbering Plan Administrator
Number of Number ofYear Quarter CICS Year Quarter CICS
Assigned Assigned
1982 First Quarter 11 1988 First Quarter 602Second Quarter 13 Second Quarter 621Third Quarter 13 Third Quarter 601Fourth Quarter 11 Fourth Quarter 639
1983 First Quarter 15 1989 First Quarter 685Second Quarter 25 Second Quarter 714Third Quarter 33 Third Quarter 730Fourth Quarter 42 Fourth Quarter 747
1984 First Quarter 54 1990 First Quarter 774Second Quarter 86 1/ Second Quarter 794Third Quarter 121 Third Quarter 817Fourth Quarter 155 Fourth Quarter 791
1985 First Quarter 182 1991 First Quarter 745Second Quarter 212 Second Quarter 766Third Quarter 236 Third Quarter 783Fourth Quarter 256 Fourth Quarter 807
1986 First Quarter 276 1992 First Quarter 786Second Quarter 331 Second Quarter 831Third Quarter 361 Third Quarter 840Fourth Quarter 413 Fourth Quarter 886
1987 First Quarter 444Second Quarter 495Third Quarter 530Fourth Quarter 573
Year Quarter FGB FGD
1993 First Quarter 694 2/ 709Second Quarter 738 746Third Quarter 739 760Fourth Quarter 753 796
1994 First Quarter 781 815Second Quarter 795 845Third Quarter 805 899 3/Fourth Quarter 819 947
1995 First Quarter 829 1,016 Second Quarter 832 1,082 Third Quarter 843 1,146 Fourth Quarter 852 1,209
1996 First Quarter 865 1,253 Second Quarter 876 1,300 Third Quarter 875 1,315 Fourth Quarter 878 1,337
1997 First Quarter 882 1,395 Second Quarter 896 1,427 Third Quarter 908 1,481 Fourth Quarter 909 1,538
1998 First Quarter 943 1,557 Second Quarter 937 1,614 Third Quarter 943 1,671 Fourth Quarter 952 1,721
1999 First Quarter 949 1,842 Second Quarter 953 1,909 Third Quarter 954 1,980 Fourth Quarter 956 2,032
2000 First Quarter 958 2,093 Second Quarter 958 2,142 Third Quarter 937 2,181 Fourth Quarter 911 2,203
2001 First Quarter 897 2,232 Second Quarter 885 2,225
1/ Conversion from 2-digit to 3-digit codes.2/ Conversion from 3-digit to 4-digit codes.3/ Includes both 3-digit and 4-digit codes.
236
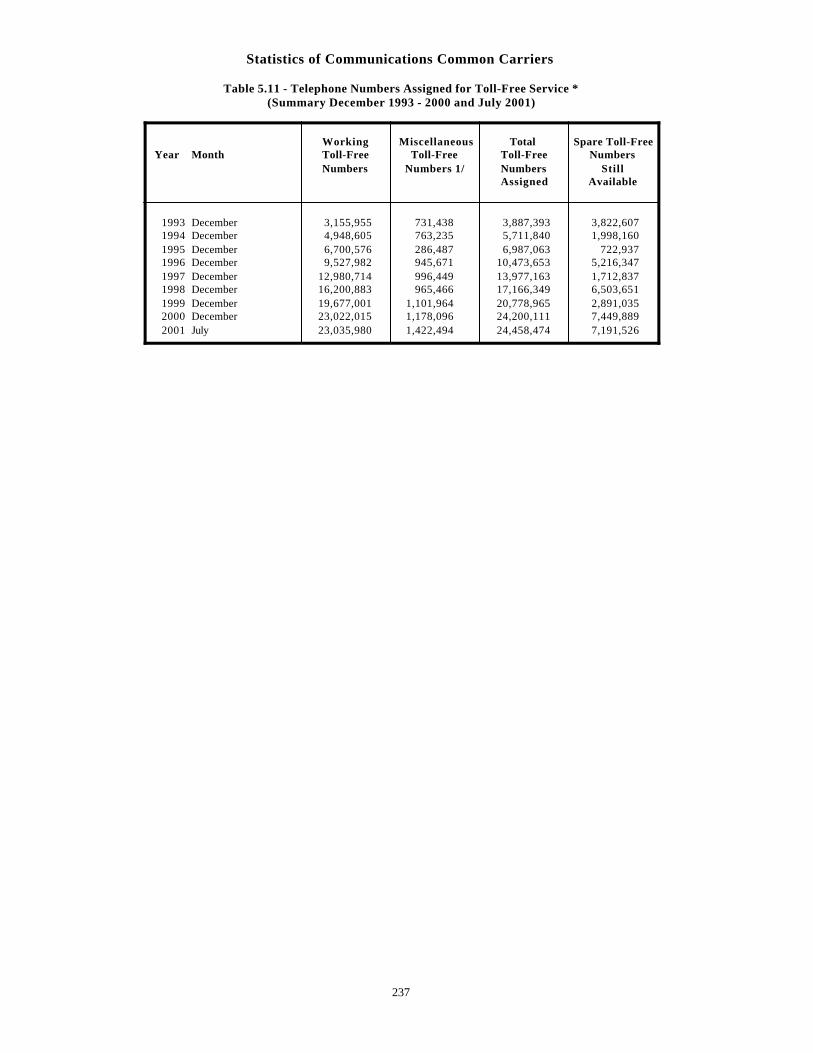
Statistics of Communications Common Carriers
Table 5.11 - Telephone Numbers Assigned for Toll-Free Service *(Summary December 1993 - 2000 and July 2001)
Working Miscellaneous Total Spare Toll-FreeYear Month Toll-Free Toll-Free Toll-Free Numbers
Numbers Numbers 1/ Numbers StillAssigned Available
1993 December 3,155,955 731,438 3,887,393 3,822,6071994 December 4,948,605 763,235 5,711,840 1,998,1601995 December 6,700,576 286,487 6,987,063 722,9371996 December 9,527,982 945,671 10,473,653 5,216,3471997 December 12,980,714 996,449 13,977,163 1,712,8371998 December 16,200,883 965,466 17,166,349 6,503,6511999 December 19,677,001 1,101,964 20,778,965 2,891,0352000 December 23,022,015 1,178,096 24,200,111 7,449,8892001 July 23,035,980 1,422,494 24,458,474 7,191,526
237
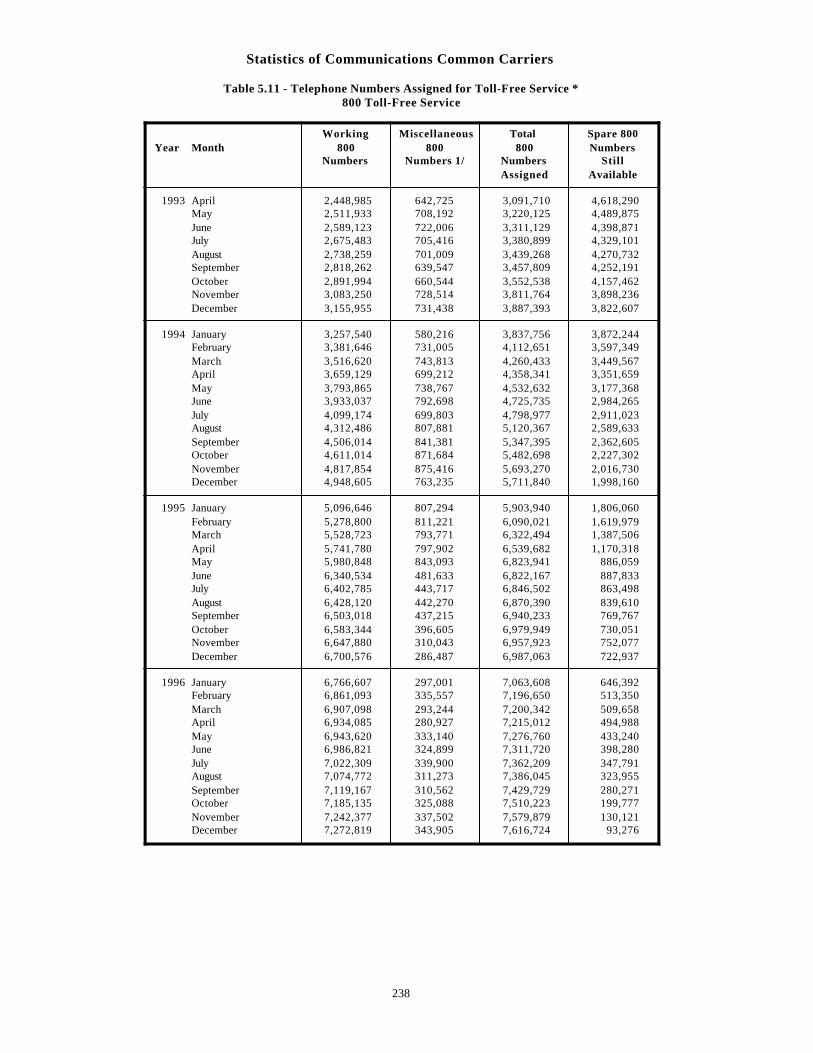
Statistics of Communications Common Carriers
Table 5.11 - Telephone Numbers Assigned for Toll-Free Service *800 Toll-Free Service
Working Miscellaneous Total Spare 800Year Month 800 800 800 Numbers
Numbers Numbers 1/ Numbers StillAssigned Available
1993 April 2,448,985 642,725 3,091,710 4,618,290May 2,511,933 708,192 3,220,125 4,489,875June 2,589,123 722,006 3,311,129 4,398,871July 2,675,483 705,416 3,380,899 4,329,101August 2,738,259 701,009 3,439,268 4,270,732September 2,818,262 639,547 3,457,809 4,252,191October 2,891,994 660,544 3,552,538 4,157,462November 3,083,250 728,514 3,811,764 3,898,236December 3,155,955 731,438 3,887,393 3,822,607
1994 January 3,257,540 580,216 3,837,756 3,872,244February 3,381,646 731,005 4,112,651 3,597,349March 3,516,620 743,813 4,260,433 3,449,567April 3,659,129 699,212 4,358,341 3,351,659May 3,793,865 738,767 4,532,632 3,177,368June 3,933,037 792,698 4,725,735 2,984,265July 4,099,174 699,803 4,798,977 2,911,023August 4,312,486 807,881 5,120,367 2,589,633September 4,506,014 841,381 5,347,395 2,362,605October 4,611,014 871,684 5,482,698 2,227,302November 4,817,854 875,416 5,693,270 2,016,730December 4,948,605 763,235 5,711,840 1,998,160
1995 January 5,096,646 807,294 5,903,940 1,806,060February 5,278,800 811,221 6,090,021 1,619,979March 5,528,723 793,771 6,322,494 1,387,506April 5,741,780 797,902 6,539,682 1,170,318May 5,980,848 843,093 6,823,941 886,059June 6,340,534 481,633 6,822,167 887,833July 6,402,785 443,717 6,846,502 863,498August 6,428,120 442,270 6,870,390 839,610September 6,503,018 437,215 6,940,233 769,767October 6,583,344 396,605 6,979,949 730,051November 6,647,880 310,043 6,957,923 752,077December 6,700,576 286,487 6,987,063 722,937
1996 January 6,766,607 297,001 7,063,608 646,392February 6,861,093 335,557 7,196,650 513,350March 6,907,098 293,244 7,200,342 509,658April 6,934,085 280,927 7,215,012 494,988May 6,943,620 333,140 7,276,760 433,240June 6,986,821 324,899 7,311,720 398,280July 7,022,309 339,900 7,362,209 347,791August 7,074,772 311,273 7,386,045 323,955September 7,119,167 310,562 7,429,729 280,271October 7,185,135 325,088 7,510,223 199,777November 7,242,377 337,502 7,579,879 130,121December 7,272,819 343,905 7,616,724 93,276
238
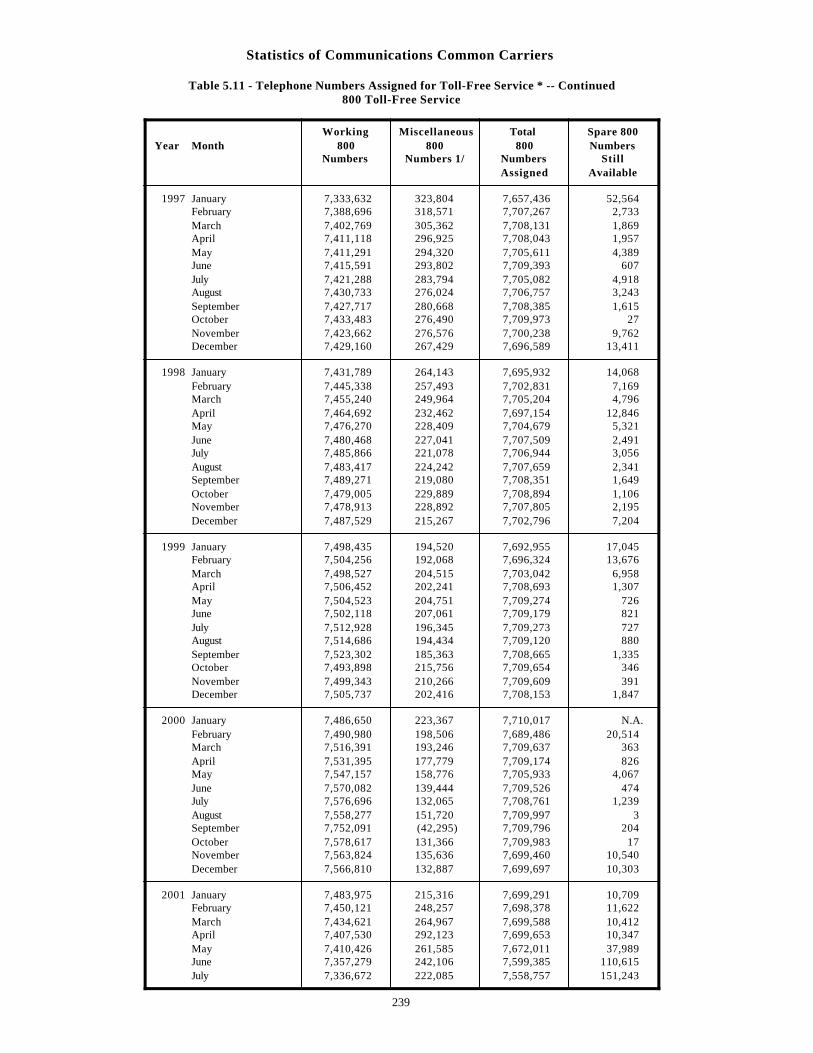
Statistics of Communications Common Carriers
Table 5.11 - Telephone Numbers Assigned for Toll-Free Service * -- Continued800 Toll-Free Service
Working Miscellaneous Total Spare 800Year Month 800 800 800 Numbers
Numbers Numbers 1/ Numbers StillAssigned Available
1997 January 7,333,632 323,804 7,657,436 52,564February 7,388,696 318,571 7,707,267 2,733March 7,402,769 305,362 7,708,131 1,869April 7,411,118 296,925 7,708,043 1,957May 7,411,291 294,320 7,705,611 4,389June 7,415,591 293,802 7,709,393 607July 7,421,288 283,794 7,705,082 4,918August 7,430,733 276,024 7,706,757 3,243September 7,427,717 280,668 7,708,385 1,615October 7,433,483 276,490 7,709,973 27November 7,423,662 276,576 7,700,238 9,762December 7,429,160 267,429 7,696,589 13,411
1998 January 7,431,789 264,143 7,695,932 14,068February 7,445,338 257,493 7,702,831 7,169March 7,455,240 249,964 7,705,204 4,796April 7,464,692 232,462 7,697,154 12,846May 7,476,270 228,409 7,704,679 5,321June 7,480,468 227,041 7,707,509 2,491July 7,485,866 221,078 7,706,944 3,056August 7,483,417 224,242 7,707,659 2,341September 7,489,271 219,080 7,708,351 1,649October 7,479,005 229,889 7,708,894 1,106November 7,478,913 228,892 7,707,805 2,195December 7,487,529 215,267 7,702,796 7,204
1999 January 7,498,435 194,520 7,692,955 17,045February 7,504,256 192,068 7,696,324 13,676March 7,498,527 204,515 7,703,042 6,958April 7,506,452 202,241 7,708,693 1,307May 7,504,523 204,751 7,709,274 726June 7,502,118 207,061 7,709,179 821July 7,512,928 196,345 7,709,273 727August 7,514,686 194,434 7,709,120 880September 7,523,302 185,363 7,708,665 1,335October 7,493,898 215,756 7,709,654 346November 7,499,343 210,266 7,709,609 391December 7,505,737 202,416 7,708,153 1,847
2000 January 7,486,650 223,367 7,710,017 N.A.February 7,490,980 198,506 7,689,486 20,514March 7,516,391 193,246 7,709,637 363April 7,531,395 177,779 7,709,174 826May 7,547,157 158,776 7,705,933 4,067June 7,570,082 139,444 7,709,526 474July 7,576,696 132,065 7,708,761 1,239August 7,558,277 151,720 7,709,997 3September 7,752,091 (42,295) 7,709,796 204October 7,578,617 131,366 7,709,983 17November 7,563,824 135,636 7,699,460 10,540December 7,566,810 132,887 7,699,697 10,303
2001 January 7,483,975 215,316 7,699,291 10,709February 7,450,121 248,257 7,698,378 11,622March 7,434,621 264,967 7,699,588 10,412April 7,407,530 292,123 7,699,653 10,347May 7,410,426 261,585 7,672,011 37,989June 7,357,279 242,106 7,599,385 110,615July 7,336,672 222,085 7,558,757 151,243
239
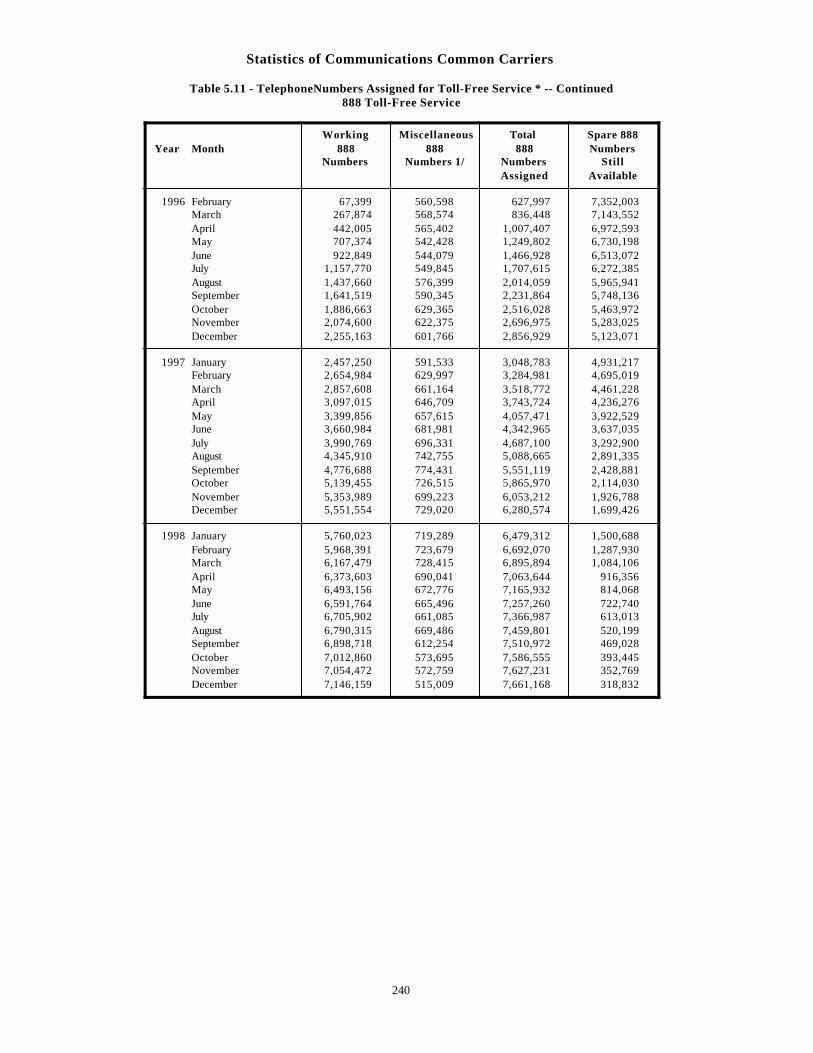
Statistics of Communications Common Carriers
Table 5.11 - TelephoneNumbers Assigned for Toll-Free Service * -- Continued888 Toll-Free Service
Working Miscellaneous Total Spare 888Year Month 888 888 888 Numbers
Numbers Numbers 1/ Numbers StillAssigned Available
1996 February 67,399 560,598 627,997 7,352,003March 267,874 568,574 836,448 7,143,552April 442,005 565,402 1,007,407 6,972,593May 707,374 542,428 1,249,802 6,730,198June 922,849 544,079 1,466,928 6,513,072July 1,157,770 549,845 1,707,615 6,272,385August 1,437,660 576,399 2,014,059 5,965,941September 1,641,519 590,345 2,231,864 5,748,136October 1,886,663 629,365 2,516,028 5,463,972November 2,074,600 622,375 2,696,975 5,283,025December 2,255,163 601,766 2,856,929 5,123,071
1997 January 2,457,250 591,533 3,048,783 4,931,217February 2,654,984 629,997 3,284,981 4,695,019March 2,857,608 661,164 3,518,772 4,461,228April 3,097,015 646,709 3,743,724 4,236,276May 3,399,856 657,615 4,057,471 3,922,529June 3,660,984 681,981 4,342,965 3,637,035July 3,990,769 696,331 4,687,100 3,292,900August 4,345,910 742,755 5,088,665 2,891,335September 4,776,688 774,431 5,551,119 2,428,881October 5,139,455 726,515 5,865,970 2,114,030November 5,353,989 699,223 6,053,212 1,926,788December 5,551,554 729,020 6,280,574 1,699,426
1998 January 5,760,023 719,289 6,479,312 1,500,688February 5,968,391 723,679 6,692,070 1,287,930March 6,167,479 728,415 6,895,894 1,084,106April 6,373,603 690,041 7,063,644 916,356May 6,493,156 672,776 7,165,932 814,068June 6,591,764 665,496 7,257,260 722,740July 6,705,902 661,085 7,366,987 613,013August 6,790,315 669,486 7,459,801 520,199September 6,898,718 612,254 7,510,972 469,028October 7,012,860 573,695 7,586,555 393,445November 7,054,472 572,759 7,627,231 352,769December 7,146,159 515,009 7,661,168 318,832
240
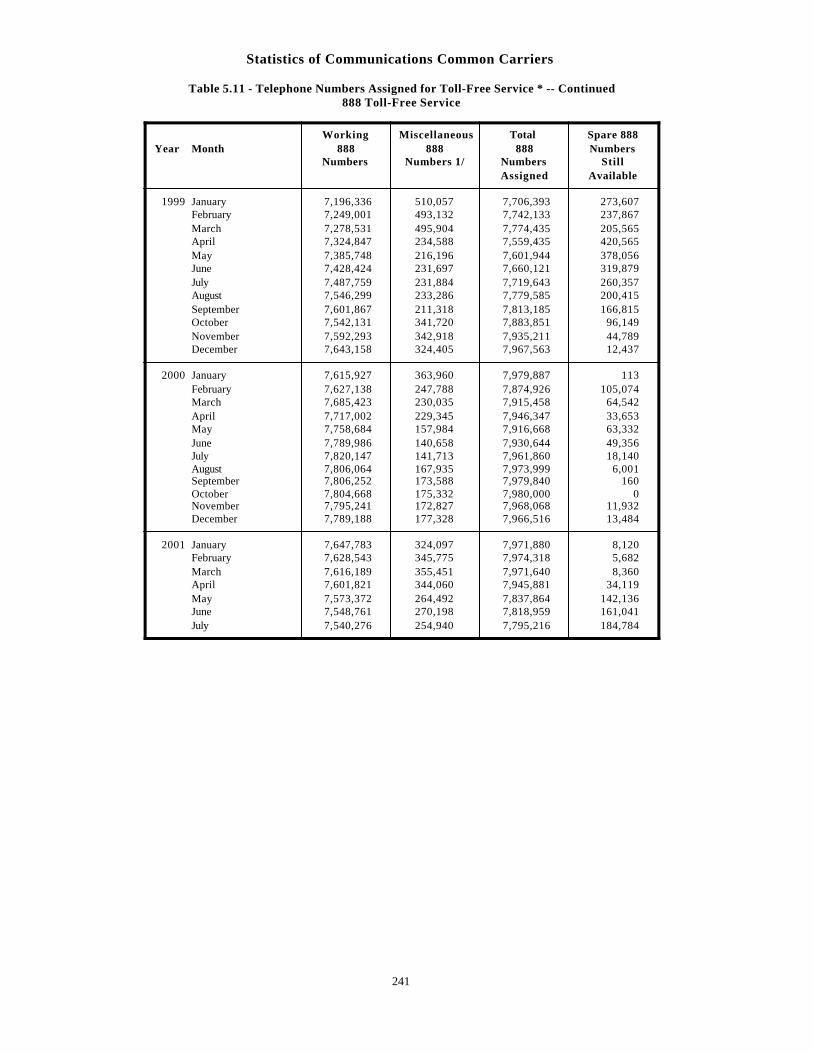
Statistics of Communications Common Carriers
Table 5.11 - Telephone Numbers Assigned for Toll-Free Service * -- Continued888 Toll-Free Service
Working Miscellaneous Total Spare 888Year Month 888 888 888 Numbers
Numbers Numbers 1/ Numbers StillAssigned Available
1999 January 7,196,336 510,057 7,706,393 273,607February 7,249,001 493,132 7,742,133 237,867March 7,278,531 495,904 7,774,435 205,565April 7,324,847 234,588 7,559,435 420,565May 7,385,748 216,196 7,601,944 378,056June 7,428,424 231,697 7,660,121 319,879July 7,487,759 231,884 7,719,643 260,357August 7,546,299 233,286 7,779,585 200,415September 7,601,867 211,318 7,813,185 166,815October 7,542,131 341,720 7,883,851 96,149November 7,592,293 342,918 7,935,211 44,789December 7,643,158 324,405 7,967,563 12,437
2000 January 7,615,927 363,960 7,979,887 113February 7,627,138 247,788 7,874,926 105,074March 7,685,423 230,035 7,915,458 64,542April 7,717,002 229,345 7,946,347 33,653May 7,758,684 157,984 7,916,668 63,332June 7,789,986 140,658 7,930,644 49,356July 7,820,147 141,713 7,961,860 18,140August 7,806,064 167,935 7,973,999 6,001September 7,806,252 173,588 7,979,840 160October 7,804,668 175,332 7,980,000 0November 7,795,241 172,827 7,968,068 11,932December 7,789,188 177,328 7,966,516 13,484
2001 January 7,647,783 324,097 7,971,880 8,120February 7,628,543 345,775 7,974,318 5,682March 7,616,189 355,451 7,971,640 8,360April 7,601,821 344,060 7,945,881 34,119May 7,573,372 264,492 7,837,864 142,136June 7,548,761 270,198 7,818,959 161,041July 7,540,276 254,940 7,795,216 184,784
241
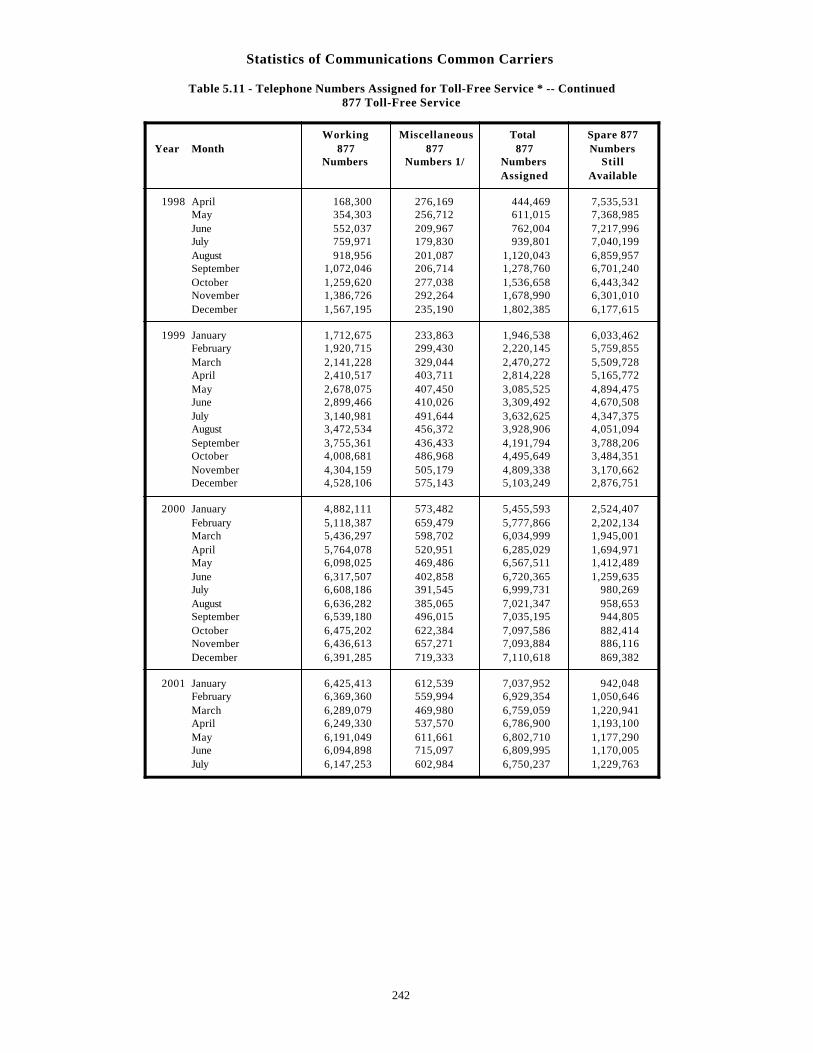
Statistics of Communications Common Carriers
Table 5.11 - Telephone Numbers Assigned for Toll-Free Service * -- Continued877 Toll-Free Service
Working Miscellaneous Total Spare 877Year Month 877 877 877 Numbers
Numbers Numbers 1/ Numbers StillAssigned Available
1998 April 168,300 276,169 444,469 7,535,531May 354,303 256,712 611,015 7,368,985June 552,037 209,967 762,004 7,217,996July 759,971 179,830 939,801 7,040,199August 918,956 201,087 1,120,043 6,859,957September 1,072,046 206,714 1,278,760 6,701,240October 1,259,620 277,038 1,536,658 6,443,342November 1,386,726 292,264 1,678,990 6,301,010December 1,567,195 235,190 1,802,385 6,177,615
1999 January 1,712,675 233,863 1,946,538 6,033,462February 1,920,715 299,430 2,220,145 5,759,855March 2,141,228 329,044 2,470,272 5,509,728April 2,410,517 403,711 2,814,228 5,165,772May 2,678,075 407,450 3,085,525 4,894,475June 2,899,466 410,026 3,309,492 4,670,508July 3,140,981 491,644 3,632,625 4,347,375August 3,472,534 456,372 3,928,906 4,051,094September 3,755,361 436,433 4,191,794 3,788,206October 4,008,681 486,968 4,495,649 3,484,351November 4,304,159 505,179 4,809,338 3,170,662December 4,528,106 575,143 5,103,249 2,876,751
2000 January 4,882,111 573,482 5,455,593 2,524,407February 5,118,387 659,479 5,777,866 2,202,134March 5,436,297 598,702 6,034,999 1,945,001April 5,764,078 520,951 6,285,029 1,694,971May 6,098,025 469,486 6,567,511 1,412,489June 6,317,507 402,858 6,720,365 1,259,635July 6,608,186 391,545 6,999,731 980,269August 6,636,282 385,065 7,021,347 958,653September 6,539,180 496,015 7,035,195 944,805October 6,475,202 622,384 7,097,586 882,414November 6,436,613 657,271 7,093,884 886,116December 6,391,285 719,333 7,110,618 869,382
2001 January 6,425,413 612,539 7,037,952 942,048February 6,369,360 559,994 6,929,354 1,050,646March 6,289,079 469,980 6,759,059 1,220,941April 6,249,330 537,570 6,786,900 1,193,100May 6,191,049 611,661 6,802,710 1,177,290June 6,094,898 715,097 6,809,995 1,170,005July 6,147,253 602,984 6,750,237 1,229,763
242
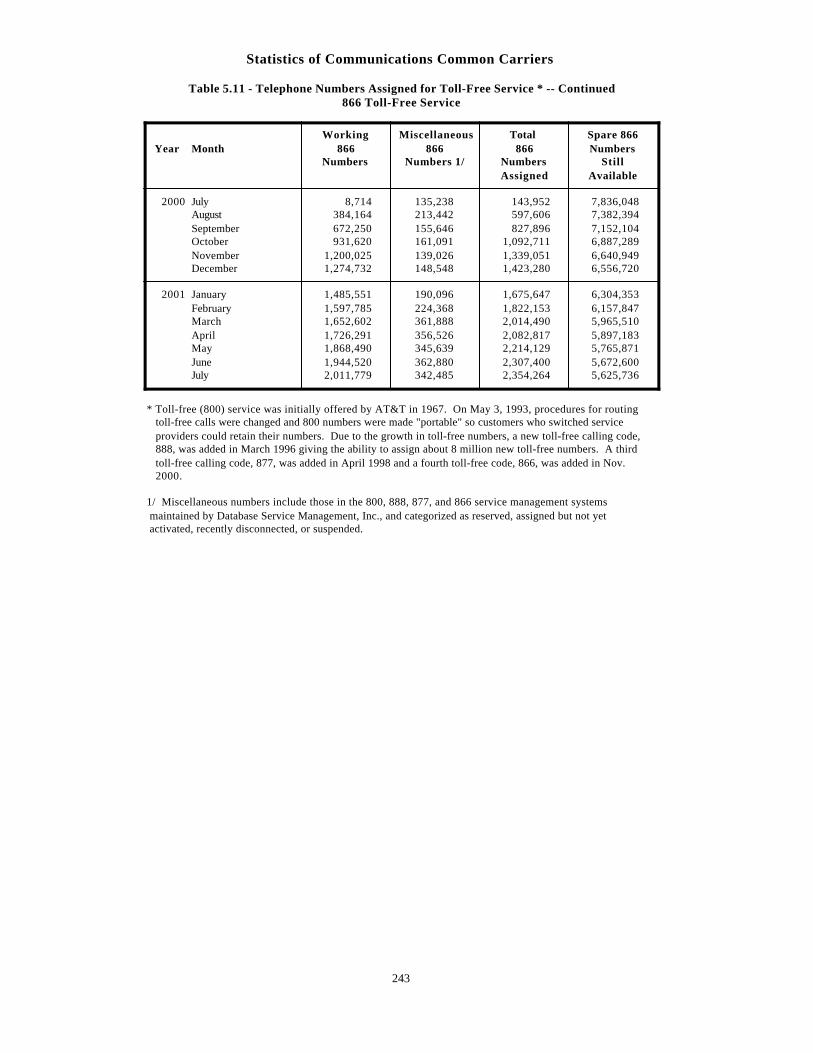
Statistics of Communications Common Carriers
Table 5.11 - Telephone Numbers Assigned for Toll-Free Service * -- Continued866 Toll-Free Service
Working Miscellaneous Total Spare 866Year Month 866 866 866 Numbers
Numbers Numbers 1/ Numbers StillAssigned Available
2000 July 8,714 135,238 143,952 7,836,048August 384,164 213,442 597,606 7,382,394September 672,250 155,646 827,896 7,152,104October 931,620 161,091 1,092,711 6,887,289November 1,200,025 139,026 1,339,051 6,640,949December 1,274,732 148,548 1,423,280 6,556,720
2001 January 1,485,551 190,096 1,675,647 6,304,353February 1,597,785 224,368 1,822,153 6,157,847March 1,652,602 361,888 2,014,490 5,965,510April 1,726,291 356,526 2,082,817 5,897,183May 1,868,490 345,639 2,214,129 5,765,871June 1,944,520 362,880 2,307,400 5,672,600July 2,011,779 342,485 2,354,264 5,625,736
* Toll-free (800) service was initially offered by AT&T in 1967. On May 3, 1993, procedures for routing toll-free calls were changed and 800 numbers were made "portable" so customers who switched service providers could retain their numbers. Due to the growth in toll-free numbers, a new toll-free calling code, 888, was added in March 1996 giving the ability to assign about 8 million new toll-free numbers. A third toll-free calling code, 877, was added in April 1998 and a fourth toll-free code, 866, was added in Nov. 2000.
1/ Miscellaneous numbers include those in the 800, 888, 877, and 866 service management systems maintained by Database Service Management, Inc., and categorized as reserved, assigned but not yet activated, recently disconnected, or suspended.
243
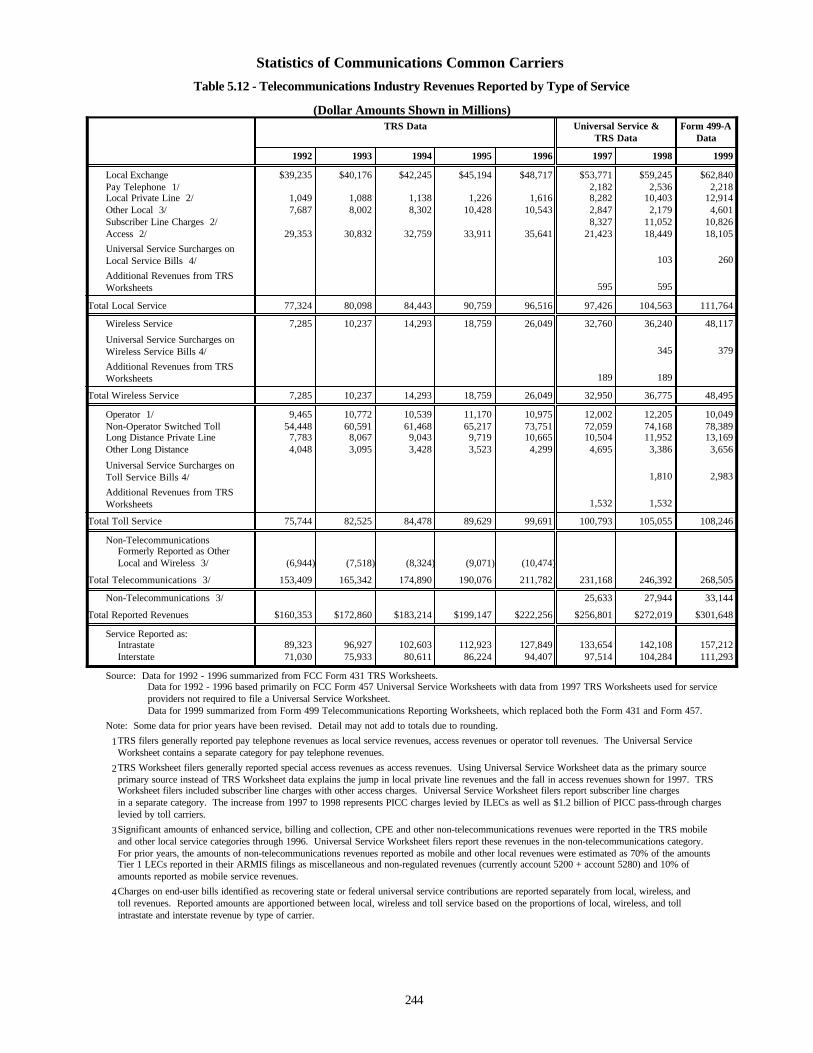
Statistics of Communications Common Carriers
Table 5.12 - Telecommunications Industry Revenues Reported by Type of Service
(Dollar Amounts Shown in Millions)TRS Data Universal Service & Form 499-A
TRS Data Data
1992 1993 1994 1995 1996 1997 1998 1999
Local Exchange $39,235 $40,176 $42,245 $45,194 $48,717 $53,771 $59,245 $62,840Pay Telephone 1/ 2,182 2,536 2,218Local Private Line 2/ 1,049 1,088 1,138 1,226 1,616 8,282 10,403 12,914Other Local 3/ 7,687 8,002 8,302 10,428 10,543 2,847 2,179 4,601Subscriber Line Charges 2/ 8,327 11,052 10,826Access 2/ 29,353 30,832 32,759 33,911 35,641 21,423 18,449 18,105
Universal Service Surcharges onLocal Service Bills 4/ 103 260
Additional Revenues from TRSWorksheets 595 595
Total Local Service 77,324 80,098 84,443 90,759 96,516 97,426 104,563 111,764
Wireless Service 7,285 10,237 14,293 18,759 26,049 32,760 36,240 48,117
Universal Service Surcharges onWireless Service Bills 4/ 345 379
Additional Revenues from TRSWorksheets 189 189
Total Wireless Service 7,285 10,237 14,293 18,759 26,049 32,950 36,775 48,495
Operator 1/ 9,465 10,772 10,539 11,170 10,975 12,002 12,205 10,049Non-Operator Switched Toll 54,448 60,591 61,468 65,217 73,751 72,059 74,168 78,389Long Distance Private Line 7,783 8,067 9,043 9,719 10,665 10,504 11,952 13,169Other Long Distance 4,048 3,095 3,428 3,523 4,299 4,695 3,386 3,656
Universal Service Surcharges onToll Service Bills 4/ 1,810 2,983
Additional Revenues from TRSWorksheets 1,532 1,532
Total Toll Service 75,744 82,525 84,478 89,629 99,691 100,793 105,055 108,246
Non-Telecommunications Formerly Reported as OtherLocal and Wireless 3/ (6,944) (7,518) (8,324) (9,071) (10,474)
Total Telecommunications 3/ 153,409 165,342 174,890 190,076 211,782 231,168 246,392 268,505
Non-Telecommunications 3/ 25,633 27,944 33,144
Total Reported Revenues $160,353 $172,860 $183,214 $199,147 $222,256 $256,801 $272,019 $301,648
Service Reported as:Intrastate 89,323 96,927 102,603 112,923 127,849 133,654 142,108 157,212Interstate 71,030 75,933 80,611 86,224 94,407 97,514 104,284 111,293
Source: Data for 1992 - 1996 summarized from FCC Form 431 TRS Worksheets. Data for 1992 - 1996 based primarily on FCC Form 457 Universal Service Worksheets with data from 1997 TRS Worksheets used for service providers not required to file a Universal Service Worksheet. Data for 1999 summarized from Form 499 Telecommunications Reporting Worksheets, which replaced both the Form 431 and Form 457.
Note: Some data for prior years have been revised. Detail may not add to totals due to rounding.
1/TRS filers generally reported pay telephone revenues as local service revenues, access revenues or operator toll revenues. The Universal ServiceWorksheet contains a separate category for pay telephone revenues.
2/TRS Worksheet filers generally reported special access revenues as access revenues. Using Universal Service Worksheet data as the primary sourceprimary source instead of TRS Worksheet data explains the jump in local private line revenues and the fall in access revenues shown for 1997. TRSWorksheet filers included subscriber line charges with other access charges. Universal Service Worksheet filers report subscriber line chargesin a separate category. The increase from 1997 to 1998 represents PICC charges levied by ILECs as well as $1.2 billion of PICC pass-through chargeslevied by toll carriers.
3/Significant amounts of enhanced service, billing and collection, CPE and other non-telecommunications revenues were reported in the TRS mobileand other local service categories through 1996. Universal Service Worksheet filers report these revenues in the non-telecommunications category.For prior years, the amounts of non-telecommunications revenues reported as mobile and other local revenues were estimated as 70% of the amountsTier 1 LECs reported in their ARMIS filings as miscellaneous and non-regulated revenues (currently account 5200 + account 5280) and 10% of amounts reported as mobile service revenues.
4/Charges on end-user bills identified as recovering state or federal universal service contributions are reported separately from local, wireless, andtoll revenues. Reported amounts are apportioned between local, wireless and toll service based on the proportions of local, wireless, and tollintrastate and interstate revenue by type of carrier.
244
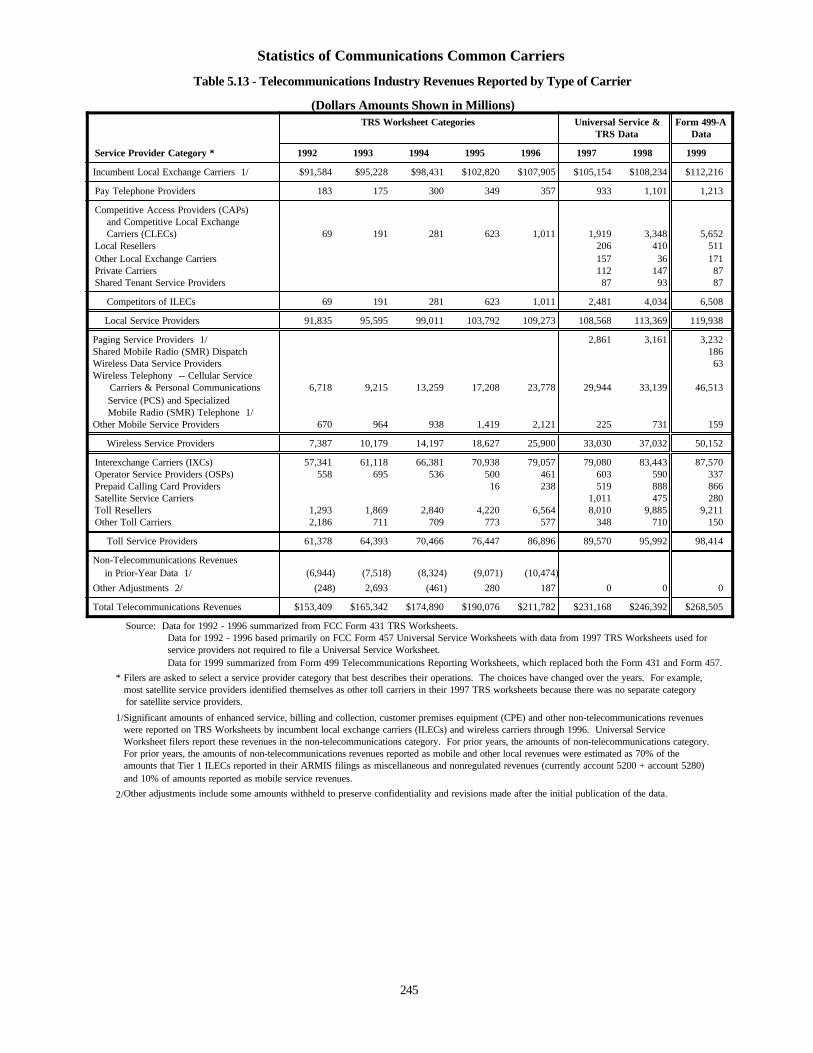
Statistics of Communications Common Carriers
Table 5.13 - Telecommunications Industry Revenues Reported by Type of Carrier
(Dollars Amounts Shown in Millions)TRS Worksheet Categories Universal Service & Form 499-A
TRS Data Data
Service Provider Category * 1992 1993 1994 1995 1996 1997 1998 1999
Incumbent Local Exchange Carriers 1/ $91,584 $95,228 $98,431 $102,820 $107,905 $105,154 $108,234 $112,216
Pay Telephone Providers 183 175 300 349 357 933 1,101 1,213
Competitive Access Providers (CAPs) and Competitive Local Exchange Carriers (CLECs) 69 191 281 623 1,011 1,919 3,348 5,652Local Resellers 206 410 511Other Local Exchange Carriers 157 36 171Private Carriers 112 147 87Shared Tenant Service Providers 87 93 87
Competitors of ILECs 69 191 281 623 1,011 2,481 4,034 6,508
Local Service Providers 91,835 95,595 99,011 103,792 109,273 108,568 113,369 119,938
Paging Service Providers 1/ 2,861 3,161 3,232Shared Mobile Radio (SMR) Dispatch 186Wireless Data Service Providers 63Wireless Telephony -- Cellular Service Carriers & Personal Communications 6,718 9,215 13,259 17,208 23,778 29,944 33,139 46,513 Service (PCS) and Specialized Mobile Radio (SMR) Telephone 1/Other Mobile Service Providers 670 964 938 1,419 2,121 225 731 159
Wireless Service Providers 7,387 10,179 14,197 18,627 25,900 33,030 37,032 50,152
Interexchange Carriers (IXCs) 57,341 61,118 66,381 70,938 79,057 79,080 83,443 87,570Operator Service Providers (OSPs) 558 695 536 500 461 603 590 337Prepaid Calling Card Providers 16 238 519 888 866Satellite Service Carriers 1,011 475 280Toll Resellers 1,293 1,869 2,840 4,220 6,564 8,010 9,885 9,211Other Toll Carriers 2,186 711 709 773 577 348 710 150
Toll Service Providers 61,378 64,393 70,466 76,447 86,896 89,570 95,992 98,414
Non-Telecommunications Revenues in Prior-Year Data 1/ (6,944) (7,518) (8,324) (9,071) (10,474)
Other Adjustments 2/ (248) 2,693 (461) 280 187 0 0 0
Total Telecommunications Revenues $153,409 $165,342 $174,890 $190,076 $211,782 $231,168 $246,392 $268,505
Source: Data for 1992 - 1996 summarized from FCC Form 431 TRS Worksheets. Data for 1992 - 1996 based primarily on FCC Form 457 Universal Service Worksheets with data from 1997 TRS Worksheets used for service providers not required to file a Universal Service Worksheet. Data for 1999 summarized from Form 499 Telecommunications Reporting Worksheets, which replaced both the Form 431 and Form 457.
* Filers are asked to select a service provider category that best describes their operations. The choices have changed over the years. For example,most satellite service providers identified themselves as other toll carriers in their 1997 TRS worksheets because there was no separate categoryfor satellite service providers.
1/Significant amounts of enhanced service, billing and collection, customer premises equipment (CPE) and other non-telecommunications revenueswere reported on TRS Worksheets by incumbent local exchange carriers (ILECs) and wireless carriers through 1996. Universal ServiceWorksheet filers report these revenues in the non-telecommunications category. For prior years, the amounts of non-telecommunications category.For prior years, the amounts of non-telecommunications revenues reported as mobile and other local revenues were estimated as 70% of theamounts that Tier 1 ILECs reported in their ARMIS filings as miscellaneous and nonregulated revenues (currently account 5200 + account 5280)and 10% of amounts reported as mobile service revenues.
2/Other adjustments include some amounts withheld to preserve confidentiality and revisions made after the initial publication of the data.
245
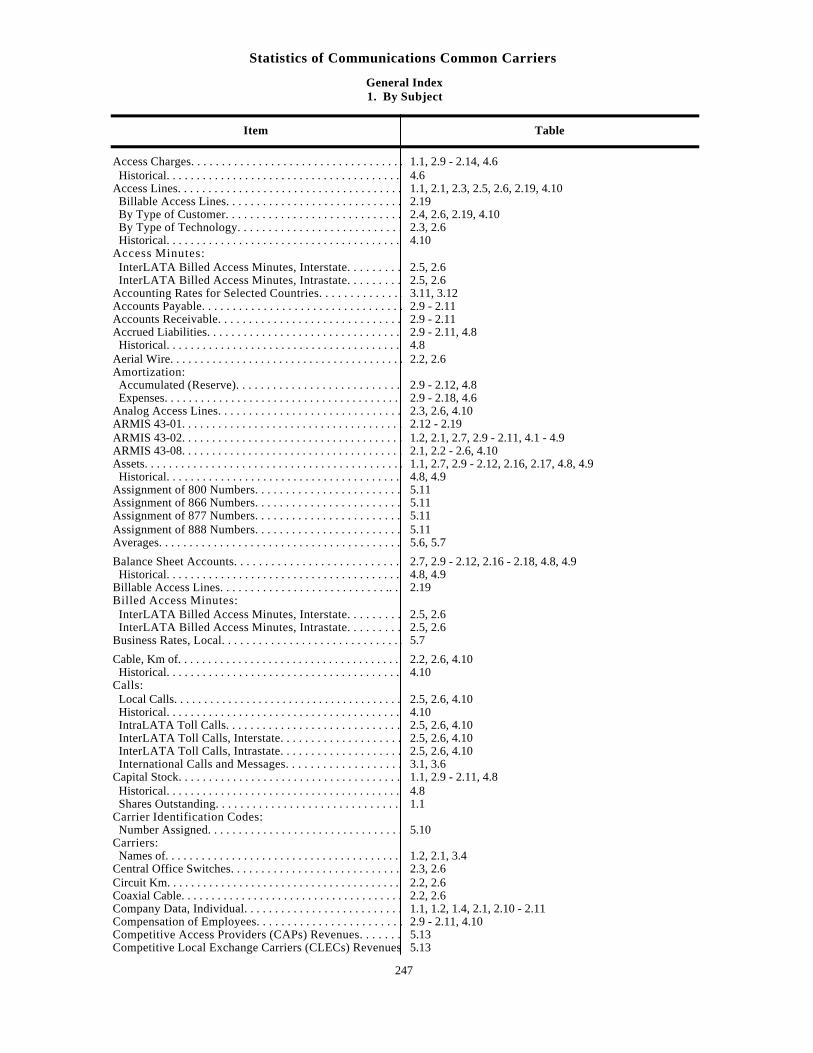
Statistics of Communications Common Carriers
General Index1. By Subject
Item Table
Access Charges. . . . . . . . . . . . . . . . . . . . . . . . . . . . . . . . . . . . . . . . . . . . . . . . . 1.1, 2.9 - 2.14, 4.6 Historical. . . . . . . . . . . . . . . . . . . . . . . . . . . . . . . . . . . . . . . . . . . . . . . . . . . 4.6Access Lines. . . . . . . . . . . . . . . . . . . . . . . . . . . . . . . . . . . . . . . . . . . . . . . . . 1.1, 2.1, 2.3, 2.5, 2.6, 2.19, 4.10 Billable Access Lines. . . . . . . . . . . . . . . . . . . . . . . . . . . . . . . . . . . . . . . . 2.19 By Type of Customer. . . . . . . . . . . . . . . . . . . . . . . . . . . . . . . . . . . . . . . 2.4, 2.6, 2.19, 4.10 By Type of Technology. . . . . . . . . . . . . . . . . . . . . . . . . . . . . . . . . . . . . . . . 2.3, 2.6 Historical. . . . . . . . . . . . . . . . . . . . . . . . . . . . . . . . . . . . . . . . . . . . . . . . . . . 4.10Access Minutes: InterLATA Billed Access Minutes, Interstate. . . . . . . . . . . . . . . . . . . . . . . . . . . . . . . . . . . . . . 2.5, 2.6 InterLATA Billed Access Minutes, Intrastate. . . . . . . . . . . . . . . . . . . . . . . . . . . . . . . . . . . . . . 2.5, 2.6Accounting Rates for Selected Countries. . . . . . . . . . . . . . . . . . . . . . . . . . . . . . . . . . . . 3.11, 3.12Accounts Payable. . . . . . . . . . . . . . . . . . . . . . . . . . . . . . . . . . . . . . . . . . . 2.9 - 2.11Accounts Receivable. . . . . . . . . . . . . . . . . . . . . . . . . . . . . . . . . . . . . . . . 2.9 - 2.11Accrued Liabilities. . . . . . . . . . . . . . . . . . . . . . . . . . . . . . . . . . . . . . . . . . . . 2.9 - 2.11, 4.8 Historical. . . . . . . . . . . . . . . . . . . . . . . . . . . . . . . . . . . . . . . . . . . . . . . . . . . 4.8Aerial Wire. . . . . . . . . . . . . . . . . . . . . . . . . . . . . . . . . . . . . . . . . . . . . . . . . . . 2.2, 2.6Amortization: Accumulated (Reserve). . . . . . . . . . . . . . . . . . . . . . . . . . . . . . . . . . . . . 2.9 - 2.12, 4.8 Expenses. . . . . . . . . . . . . . . . . . . . . . . . . . . . . . . . . . . . . . . . . . . . . . . . . . . . 2.9 - 2.18, 4.6Analog Access Lines. . . . . . . . . . . . . . . . . . . . . . . . . . . . . . . . . . . . . . . . . . . . . 2.3, 2.6, 4.10ARMIS 43-01. . . . . . . . . . . . . . . . . . . . . . . . . . . . . . . . . . . . . . . . . . . . . . . . . . . . 2.12 - 2.19ARMIS 43-02. . . . . . . . . . . . . . . . . . . . . . . . . . . . . . . . . . . . . . . . . . . . . . . . . . . . 1.2, 2.1, 2.7, 2.9 - 2.11, 4.1 - 4.9ARMIS 43-08. . . . . . . . . . . . . . . . . . . . . . . . . . . . . . . . . . . . . . . . . . . . . . . . . . . . 2.1, 2.2 - 2.6, 4.10Assets. . . . . . . . . . . . . . . . . . . . . . . . . . . . . . . . . . . . . . . . . . . . . . . . . . . . . . . . 1.1, 2.7, 2.9 - 2.12, 2.16, 2.17, 4.8, 4.9 Historical. . . . . . . . . . . . . . . . . . . . . . . . . . . . . . . . . . . . . . . . . . . . . . . . . . . 4.8, 4.9Assignment of 800 Numbers. . . . . . . . . . . . . . . . . . . . . . . . . . . . . . . . . . . . . . . . . . 5.11Assignment of 866 Numbers. . . . . . . . . . . . . . . . . . . . . . . . . . . . . . . . . . . . . . . . . . 5.11Assignment of 877 Numbers. . . . . . . . . . . . . . . . . . . . . . . . . . . . . . . . . . . . . . . . . . 5.11Assignment of 888 Numbers. . . . . . . . . . . . . . . . . . . . . . . . . . . . . . . . . . . . . . . . . . 5.11Averages. . . . . . . . . . . . . . . . . . . . . . . . . . . . . . . . . . . . . . . . . . . . . . 5.6, 5.7
Balance Sheet Accounts. . . . . . . . . . . . . . . . . . . . . . . . . . . . . . . . . . . . . . 2.7, 2.9 - 2.12, 2.16 - 2.18, 4.8, 4.9 Historical. . . . . . . . . . . . . . . . . . . . . . . . . . . . . . . . . . . . . . . . . . . . . . . . . . . 4.8, 4.9Billable Access Lines. . . . . . . . . . . . . . . . . . . . . . . . . . . .. . . . . . . . . . . . . 2.19Billed Access Minutes: InterLATA Billed Access Minutes, Interstate. . . . . . . . . . . . . . . . . . . . . . . . . . . . . . . . . . . . . . 2.5, 2.6 InterLATA Billed Access Minutes, Intrastate. . . . . . . . . . . . . . . . . . . . . . . . . . . . . . . . . . . . . . 2.5, 2.6Business Rates, Local. . . . . . . . . . . . . . . . . . . . . . . . . . . . . . . . . . . . . . . . . 5.7 Cable, Km of. . . . . . . . . . . . . . . . . . . . . . . . . . . . . . . . . . . . . . . . . . . . . . . . . . . 2.2, 2.6, 4.10 Historical. . . . . . . . . . . . . . . . . . . . . . . . . . . . . . . . . . . . . . . . . . . . . . . . . . . 4.10Calls: Local Calls. . . . . . . . . . . . . . . . . . . . . . . . . . . . . . . . . . . . . . . . . . . . . . . . . . 2.5, 2.6, 4.10 Historical. . . . . . . . . . . . . . . . . . . . . . . . . . . . . . . . . . . . . . . . . . . . . . . . . . . 4.10 IntraLATA Toll Calls. . . . . . . . . . . . . . . . . . . . . . . . . . . . . . . . . . . . . . . . . . . . 2.5, 2.6, 4.10 InterLATA Toll Calls, Interstate. . . . . . . . . . . . . . . . . . . . . . . . . . . . . . . . . . . . . . 2.5, 2.6, 4.10 InterLATA Toll Calls, Intrastate. . . . . . . . . . . . . . . . . . . . . . . . . . . . . . . . . . . . . . 2.5, 2.6, 4.10 International Calls and Messages. . . . . . . . . . . . . . . . . . . . . . . . . . . . . . . . . . . . . 3.1, 3.6Capital Stock. . . . . . . . . . . . . . . . . . . . . . . . . . . . . . . . . . . . . . . . . . . . . . . . . 1.1, 2.9 - 2.11, 4.8 Historical. . . . . . . . . . . . . . . . . . . . . . . . . . . . . . . . . . . . . . . . . . . . . . . . . . . 4.8 Shares Outstanding. . . . . . . . . . . . . . . . . . . . . . . . . . . . . . . . . . . . . . . . . . . 1.1Carrier Identification Codes: Number Assigned. . . . . . . . . . . . . . . . . . . . . . . . . . . . . . . . . . . . . . . . . . . . 5.10Carriers: Names of. . . . . . . . . . . . . . . . . . . . . . . . . . . . . . . . . . . . . . . . . . . . . . . . . . . 1.2, 2.1, 3.4Central Office Switches. . . . . . . . . . . . . . . . . . . . . . . . . . . . . . . . . . . . . . . 2.3, 2.6Circuit Km. . . . . . . . . . . . . . . . . . . . . . . . . . . . . . . . . . . . . . . . . . . . . . . . . . . 2.2, 2.6Coaxial Cable. . . . . . . . . . . . . . . . . . . . . . . . . . . . . . . . . . . . . . . . . . . . . . . 2.2, 2.6Company Data, Individual. . . . . . . . . . . . . . . . . . . . . . . . . . . . . . . . . . . . . . 1.1, 1.2, 1.4, 2.1, 2.10 - 2.11Compensation of Employees. . . . . . . . . . . . . . . . . . . . . . . . . . . . . . . . . 2.9 - 2.11, 4.10Competitive Access Providers (CAPs) Revenues. . . . . . . . . . . . . . . . . . . . . . . . . . . . .. . . . . 5.13Competitive Local Exchange Carriers (CLECs) Revenues. . . . . . . . . . . . . . . . . . . . . . . . .. . . . . 5.13
247
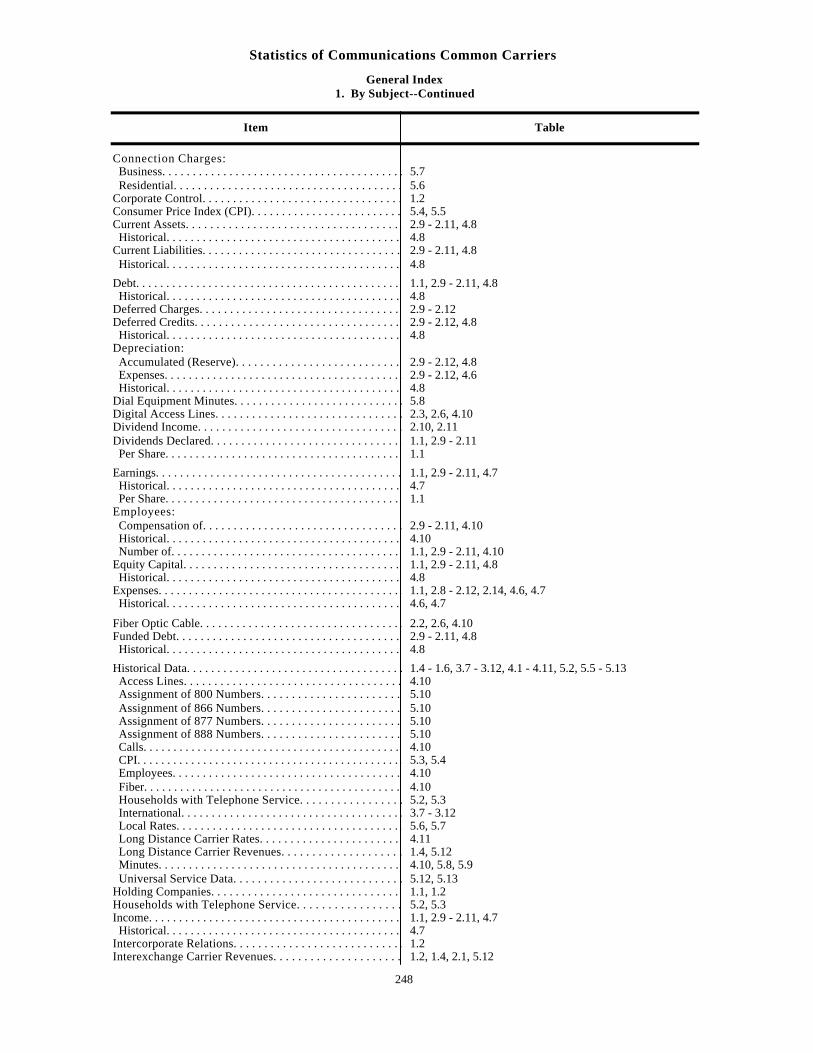
Statistics of Communications Common Carriers
General Index1. By Subject--Continued
Item Table
Connection Charges: Business. . . . . . . . . . . . . . . . . . . . . . . . . . . . . . . . . . . . . . . . . . . . 5.7 Residential. . . . . . . . . . . . . . . . . . . . . . . . . . . . . . . . . . . . . . . . . . 5.6Corporate Control. . . . . . . . . . . . . . . . . . . . . . . . . . . . . . . . . . . . . . . . . 1.2Consumer Price Index (CPI). . . . . . . . . . . . . . . . . . . . . . . . . . . . . . . . . . . . . . . . . . . . . . . . . . . . . . . . . . . . . 5.4, 5.5Current Assets. . . . . . . . . . . . . . . . . . . . . . . . . . . . . . . . . . . . . . . .. . . . . . . 2.9 - 2.11, 4.8 Historical. . . . . . . . . . . . . . . . . . . . . . . . . . . . . . . . . . . . . . . . . . . . . . . . . . . 4.8Current Liabilities. . . . . . . . . . . . . . . . . . . . . . . . . . . . . . . . . . . . . . . . . . . 2.9 - 2.11, 4.8 Historical. . . . . . . . . . . . . . . . . . . . . . . . . . . . . . . . . . . . . . . . . . . . . . . . . . . 4.8
Debt. . . . . . . . . . . . . . . . . . . . . . . . . . . . . . . . . . . . . . . . . . . . . . . . . . . . . . . . . . 1.1, 2.9 - 2.11, 4.8 Historical. . . . . . . . . . . . . . . . . . . . . . . . . . . . . . . . . . . . . . . . . . . . . . . . . . . 4.8Deferred Charges. . . . . . . . . . . . . . . . . . . . . . . . . . . . . . . . . . . . . . . . . . . . 2.9 - 2.12Deferred Credits. . . . . . . . . . . . . . . . . . . . . . . . . . . . . . . . . . . . . . . . . . . 2.9 - 2.12, 4.8 Historical. . . . . . . . . . . . . . . . . . . . . . . . . . . . . . . . . . . . . . . . . . . . . . . . . . . 4.8Depreciation: Accumulated (Reserve). . . . . . . . . . . . . . . . . . . . . . . . . . . . . . . . . . . . . . . . . . 2.9 - 2.12, 4.8 Expenses. . . . . . . . . . . . . . . . . . . . . . . . . . . . . . . . . . . . . . . . . . . . . . . . . . . . 2.9 - 2.12, 4.6 Historical. . . . . . . . . . . . . . . . . . . . . . . . . . . . . . . . . . . . . . . . . . . . . . . . . . . 4.8Dial Equipment Minutes. . . . . . . . . . . . . . . . . . . . . . . . . . . . . . . . . . . . . . . . . . . 5.8Digital Access Lines. . . . . . . . . . . . . . . . . . . . . . . . . . . . . . . . . . . . . . . . . . . . . 2.3, 2.6, 4.10Dividend Income. . . . . . . . . . . . . . . . . . . . . . . . . . . . . . . . . . . . . . . . . . . . . . . 2.10, 2.11Dividends Declared. . . . . . . . . . . . . . . . . . . . . . . . . . . . . . . . . . . . . . . . . . . . 1.1, 2.9 - 2.11 Per Share. . . . . . . . . . . . . . . . . . . . . . . . . . . . . . . . . . . . . . . . . . . . . . . . . . . 1.1
Earnings. . . . . . . . . . . . . . . . . . . . . . . . . . . . . . . . . . . . . . . . . . . . . . . . . . . . . . 1.1, 2.9 - 2.11, 4.7 Historical. . . . . . . . . . . . . . . . . . . . . . . . . . . . . . . . . . . . . . . . . . . . . . . . . . . 4.7 Per Share. . . . . . . . . . . . . . . . . . . . . . . . . . . . . . . . . . . . . . . . . . . . . . . . . . . . 1.1Employees: Compensation of. . . . . . . . . . . . . . . . . . . . . . . . . . . . . . . . . . . . . . . . . . . 2.9 - 2.11, 4.10 Historical. . . . . . . . . . . . . . . . . . . . . . . . . . . . . . . . . . . . . . . . . . . . . . . . . . . 4.10 Number of. . . . . . . . . . . . . . . . . . . . . . . . . . . . . . . . . . . . . . . . . . . . . . . . . . . 1.1, 2.9 - 2.11, 4.10Equity Capital. . . . . . . . . . . . . . . . . . . . . . . . . . . . . . . . . . . . . . . . . . . . . . . . 1.1, 2.9 - 2.11, 4.8 Historical. . . . . . . . . . . . . . . . . . . . . . . . . . . . . . . . . . . . . . . . . . . . . . . . . . . 4.8Expenses. . . . . . . . . . . . . . . . . . . . . . . . . . . . . . . . . . . . . . . . . . . . . . . . . . . . . . 1.1, 2.8 - 2.12, 2.14, 4.6, 4.7 Historical. . . . . . . . . . . . . . . . . . . . . . . . . . . . . . . . . . . . . . . . . . . . . . . . . . . 4.6, 4.7
Fiber Optic Cable. . . . . . . . . . . . . . . . . . . . . . . . . . . . . . . . . . . . . . . . . . . . . . 2.2, 2.6, 4.10Funded Debt. . . . . . . . . . . . . . . . . . . . . . . . . . . . . . . . . . . . . . . . . . . . . . . . . . 2.9 - 2.11, 4.8 Historical. . . . . . . . . . . . . . . . . . . . . . . . . . . . . . . . . . . . . . . . . . . . . . . . . . . 4.8 Historical Data. . . . . . . . . . . . . . . . . . . . . . . . . . . . . . . . . . . . . . . . . . . . . . . 1.4 - 1.6, 3.7 - 3.12, 4.1 - 4.11, 5.2, 5.5 - 5.13 Access Lines. . . . . . . . . . . . . . . . . . . . . . . . . . . . . . . . . . . . . . . . . . . . . . . . . 4.10 Assignment of 800 Numbers. . . . . . . . . . . . . . . . . . . . . . . . . . . . . . . . . . . . . . . . . . 5.10 Assignment of 866 Numbers. . . . . . . . . . . . . . . . . . . . . . . . . . . . . . . . . . . . . . . . . . 5.10 Assignment of 877 Numbers. . . . . . . . . . . . . . . . . . . . . . . . . . . . . . . . . . . . . . . . . . 5.10 Assignment of 888 Numbers. . . . . . . . . . . . . . . . . . . . . . . . . . . . . . . . . . . . . . . . . . 5.10 Calls. . . . . . . . . . . . . . . . . . . . . . . . . . . . . . . . . . . . . . . . . . . . . . . . . . . . . . . . . 4.10 CPI. . . . . . . . . . . . . . . . . . . . . . . . . . . . . . . . . . . . . . . . . . . . . . . . . . . . . . . . . . . 5.3, 5.4 Employees. . . . . . . . . . . . . . . . . . . . . . . . . . . . . . . . . . . . . . . . . . . . . . . . . . . 4.10 Fiber. . . . . . . . . . . . . . . . . . . . . . . . . . . . . . . . . . . . . . . . . . . . . . . . . . . . . . . . . . 4.10 Households with Telephone Service. . . . . . . . . . . . . . . . . . . . . . . . . . . . . . . . . . . . . . . . . . . 5.2, 5.3 International. . . . . . . . . . . . . . . . . . . . . . . . . . . . . . . . . . . . . . . . . . . . . . . . . 3.7 - 3.12 Local Rates. . . . . . . . . . . . . . . . . . . . . . . . . . . . . . . . . . . . . . . . . . . . . . . . . . 5.6, 5.7 Long Distance Carrier Rates. . . . . . . . . . . . . . . . . . . . . . . . . . . . . . . . . . . . . . . . . . 4.11 Long Distance Carrier Revenues. . . . . . . . . . . . . . . . . . . . . . . . . . . . . . . . . . . . . . . . 1.4, 5.12 Minutes. . . . . . . . . . . . . . . . . . . . . . . . . . . . . . . . . . . . . . . . . . . . . . . . . . . . . . 4.10, 5.8, 5.9 Universal Service Data. . . . . . . . . . . . . . . . . . . . . . . . . . . . . . . . . . . 5.12, 5.13Holding Companies. . . . . . . . . . . . . . . . . . . . . . . . . . . . . . . . . . . . . . . . . . . 1.1, 1.2Households with Telephone Service. . . . . . . . . . . . . . . . . . . . . . . . 5.2, 5.3Income. . . . . . . . . . . . . . . . . . . . . . . . . . . . . . . . . . . . . . . . . . . . . . . . . . . . . . . . . 1.1, 2.9 - 2.11, 4.7 Historical. . . . . . . . . . . . . . . . . . . . . . . . . . . . . . . . . . . . . . . . . . . . . . . . . . . 4.7Intercorporate Relations. . . . . . . . . . . . . . . . . . . . . . . . . . . . . . . . . . . . . . 1.2Interexchange Carrier Revenues. . . . . . . . . . . . . . . . . . . . . . . . . . . . . . . . . . . 1.2, 1.4, 2.1, 5.12
248
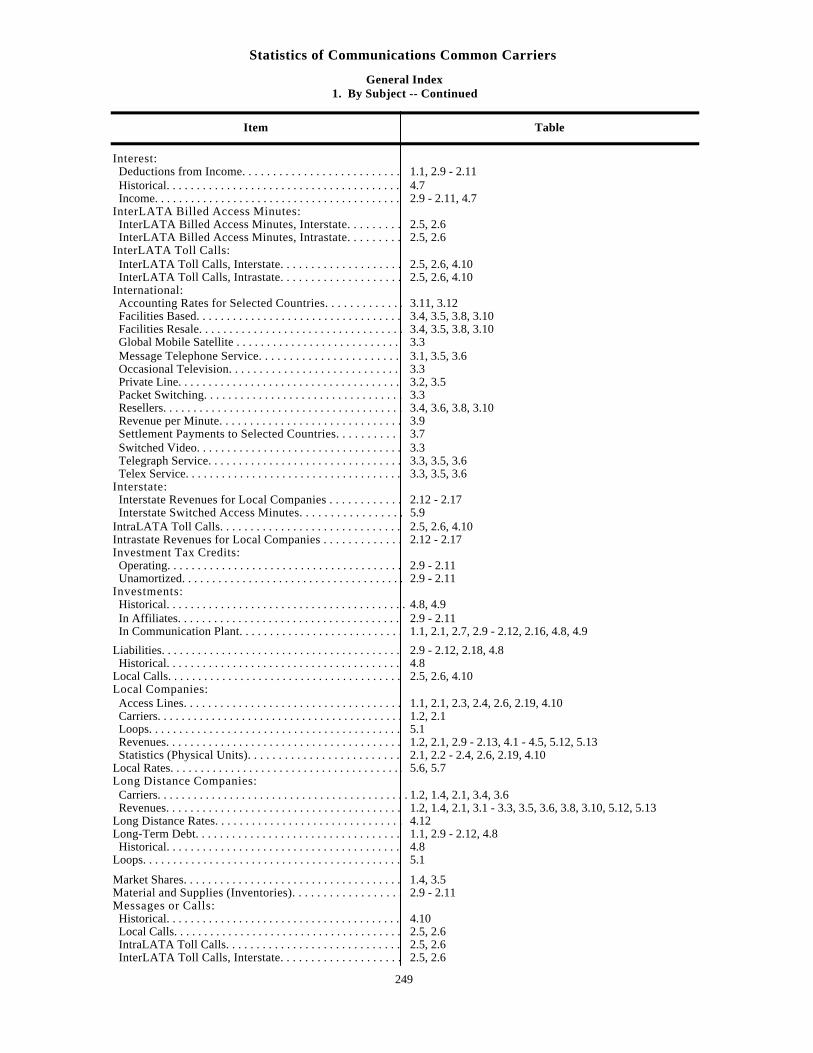
Statistics of Communications Common Carriers
General Index1. By Subject -- Continued
Item Table
Interest: Deductions from Income. . . . . . . . . . . . . . . . . . . . . . . . . . . . . . . . . . . . . 1.1, 2.9 - 2.11 Historical. . . . . . . . . . . . . . . . . . . . . . . . . . . . . . . . . . . . . . . . . . . . . . . . . . . 4.7 Income. . . . . . . . . . . . . . . . . . . . . . . . . . . . . . . . . . . . . . . . . . . . . . . . . . . . . . . 2.9 - 2.11, 4.7InterLATA Billed Access Minutes: InterLATA Billed Access Minutes, Interstate. . . . . . . . . . . . . . . . . . . . . . . . . . . . . . . . . . . . . . 2.5, 2.6 InterLATA Billed Access Minutes, Intrastate. . . . . . . . . . . . . . . . . . . . . . . . . . . . . . . . . . . . . . 2.5, 2.6InterLATA Toll Calls: InterLATA Toll Calls, Interstate. . . . . . . . . . . . . . . . . . . . . . . . . . . . . . . . . . . . . . 2.5, 2.6, 4.10 InterLATA Toll Calls, Intrastate. . . . . . . . . . . . . . . . . . . . . . . . . . . . . . . . . . . . . . 2.5, 2.6, 4.10International: Accounting Rates for Selected Countries. . . . . . . . . . . . . . . . . . . . . . . . . . . . . . . . . . . . 3.11, 3.12 Facilities Based. . . . . . . . . . . . . . . . . . . . . . . . . . . . . . . . . . . . . . . . . . . . . . . . 3.4, 3.5, 3.8, 3.10 Facilities Resale. . . . . . . . . . . . . . . . . . . . . . . . . . . . . . . . . . . . . . . . . . . . . . . 3.4, 3.5, 3.8, 3.10 Global Mobile Satellite . . . . . . . . . . . . . . . . . . . . . . . . . . . . . . . . . . . . . . . . . . . 3.3 Message Telephone Service. . . . . . . . . . . . . . . . . . . . . . . . . . . . . . . . . . . . . . . . . . . 3.1, 3.5, 3.6 Occasional Television. . . . . . . . . . . . . . . . . . . . . . . . . . . . . . . . . . . . . . . . . . . . . 3.3 Private Line. . . . . . . . . . . . . . . . . . . . . . . . . . . . . . . . . . . . . . . . . . . . . . . . . . 3.2, 3.5 Packet Switching. . . . . . . . . . . . . . . . . . . . . . . . . . . . . . . . . . . . . . . . . . . . . . . 3.3 Resellers. . . . . . . . . . . . . . . . . . . . . . . . . . . . . . . . . . . . . . . . . . . . . . . . . . . 3.4, 3.6, 3.8, 3.10 Revenue per Minute. . . . . . . . . . . . . . . . . . . . . . . . . . . . . . . . . . . . . . . . . . . . . . 3.9 Settlement Payments to Selected Countries. . . . . . . . . . . . . . . . . . . . . . . . . . . . . . . . . 3.7 Switched Video. . . . . . . . . . . . . . . . . . . . . . . . . . . . . . . . . . . . . . . . . . . . . . 3.3 Telegraph Service. . . . . . . . . . . . . . . . . . . . . . . . . . . . . . . . . . . . . . . . . . . . . . . 3.3, 3.5, 3.6 Telex Service. . . . . . . . . . . . . . . . . . . . . . . . . . . . . . . . . . . . . . . . . . . . . . . 3.3, 3.5, 3.6Interstate: Interstate Revenues for Local Companies . . . . . . . . . . . . . . . . . . . . . . . . . . . . . . . . . . . . . . . 2.12 - 2.17 Interstate Switched Access Minutes. . . . . . . . . . . . . . . . . . . . . . . . . . . . . . . . . . . . . . . . . . 5.9IntraLATA Toll Calls. . . . . . . . . . . . . . . . . . . . . . . . . . . . . . . . . . . . . . . . . . . . 2.5, 2.6, 4.10Intrastate Revenues for Local Companies . . . . . . . . . . . . . . . . . . . . . . . . . . . . . . . . . . . . . . . 2.12 - 2.17Investment Tax Credits: Operating. . . . . . . . . . . . . . . . . . . . . . . . . . . . . . . . . . . . . . . . . . . . . . . . . . . 2.9 - 2.11 Unamortized. . . . . . . . . . . . . . . . . . . . . . . . . . . . . . . . . . . . . . . . . . . . . . . . 2.9 - 2.11Investments: Historical. . . . . . . . . . . . . . . . . . . . . . . . . . . . . . . . . . . . . . . . . . . . . . . . . . .4.8, 4.9 In Affiliates. . . . . . . . . . . . . . . . . . . . . . . . . . . . . . . . . . . . . . . . . . . . . . . . . . 2.9 - 2.11 In Communication Plant. . . . . . . . . . . . . . . . . . . . . . . . . . . . . . . . . . . . . . . . . 1.1, 2.1, 2.7, 2.9 - 2.12, 2.16, 4.8, 4.9
Liabilities. . . . . . . . . . . . . . . . . . . . . . . . . . . . . . . . . . . . . . . . . . . . . . . . . . . . . . 2.9 - 2.12, 2.18, 4.8 Historical. . . . . . . . . . . . . . . . . . . . . . . . . . . . . . . . . . . . . . . . . . . . . . . . . . . 4.8Local Calls. . . . . . . . . . . . . . . . . . . . . . . . . . . . . . . . . . . . . . . . . . . . . . . . . . . . . . 2.5, 2.6, 4.10Local Companies: Access Lines. . . . . . . . . . . . . . . . . . . . . . . . . . . . . . . . . . . . . . . . . . . . . . . . . . . 1.1, 2.1, 2.3, 2.4, 2.6, 2.19, 4.10 Carriers. . . . . . . . . . . . . . . . . . . . . . . . . . . . . . . . . . . . . . . . . . . . . . . . . . . . . 1.2, 2.1 Loops. . . . . . . . . . . . . . . . . . . . . . . . . . . . . . . . . . . . . . . . . . . . . . . . . . . . . . . . . 5.1 Revenues. . . . . . . . . . . . . . . . . . . . . . . . . . . . . . . . . . . . . . . . . . . . . . . . . . . . . 1.2, 2.1, 2.9 - 2.13, 4.1 - 4.5, 5.12, 5.13 Statistics (Physical Units). . . . . . . . . . . . . . . . . . . . . . . . . . . . . . . . . . . . 2.1, 2.2 - 2.4, 2.6, 2.19, 4.10Local Rates. . . . . . . . . . . . . . . . . . . . . . . . . . . . . . . . . . . . . . . . . . . . . . . . . . . . . . 5.6, 5.7Long Distance Companies: Carriers. . . . . . . . . . . . . . . . . . . . . . . . . . . . . . . . . . . . . . . . . . . . . . . . . . . . .1.2, 1.4, 2.1, 3.4, 3.6 Revenues. . . . . . . . . . . . . . . . . . . . . . . . . . . . . . . . . . . . . . . . . . . . . . . . . . . . . 1.2, 1.4, 2.1, 3.1 - 3.3, 3.5, 3.6, 3.8, 3.10, 5.12, 5.13Long Distance Rates. . . . . . . . . . . . . . . . . . . . . . . . . . . . . . . . . . . . . . . . . . . . . . . . . . . . . . 4.12Long-Term Debt. . . . . . . . . . . . . . . . . . . . . . . . . . . . . . . . . . . . . . . . . . . . . . 1.1, 2.9 - 2.12, 4.8 Historical. . . . . . . . . . . . . . . . . . . . . . . . . . . . . . . . . . . . . . . . . . . . . . . . . . . 4.8Loops. . . . . . . . . . . . . . . . . . . . . . . . . . . . . . . . . . . . . . . . . . . . . . . . . . . . . . . . . 5.1
Market Shares. . . . . . . . . . . . . . . . . . . . . . . . . . . . . . . . . . . . . . . . . . . . . . . . . 1.4, 3.5Material and Supplies (Inventories). . . . . . . . . . . . . . . . . . . . . . . . . . . 2.9 - 2.11Messages or Calls: Historical. . . . . . . . . . . . . . . . . . . . . . . . . . . . . . . . . . . . . . . . . . . . . . . . . . . 4.10 Local Calls. . . . . . . . . . . . . . . . . . . . . . . . . . . . . . . . . . . . . . . . . . . . . . . . . 2.5, 2.6 IntraLATA Toll Calls. . . . . . . . . . . . . . . . . . . . . . . . . . . . . . . . . . . . . . . . . . . . 2.5, 2.6 InterLATA Toll Calls, Interstate. . . . . . . . . . . . . . . . . . . . . . . . . . . . . . . . . . . . . . 2.5, 2.6
249
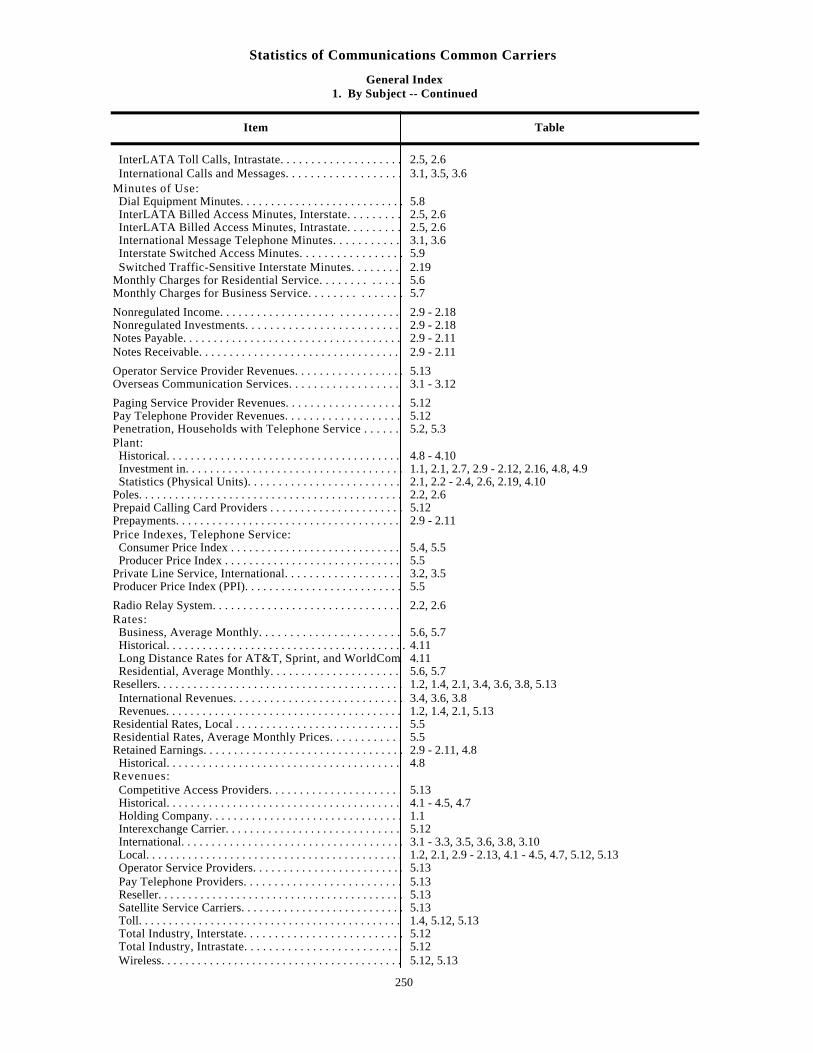
Statistics of Communications Common Carriers
General Index1. By Subject -- Continued
Item Table
InterLATA Toll Calls, Intrastate. . . . . . . . . . . . . . . . . . . . . . . . . . . . . . . . . . . . . . 2.5, 2.6 International Calls and Messages. . . . . . . . . . . . . . . . . . . . . . . . . . . . . . . . . . . . . 3.1, 3.5, 3.6Minutes of Use: Dial Equipment Minutes. . . . . . . . . . . . . . . . . . . . . . . . . . . . . . . . . . . . . . . . . . . 5.8 InterLATA Billed Access Minutes, Interstate. . . . . . . . . . . . . . . . . . . . . . . . . . . . . . . . . . . . . . 2.5, 2.6 InterLATA Billed Access Minutes, Intrastate. . . . . . . . . . . . . . . . . . . . . . . . . . . . . . . . . . . . . . 2.5, 2.6 International Message Telephone Minutes. . . . . . . . . . . . . . . . . . . . . . . . . . . . . . . . . . . . . . 3.1, 3.6 Interstate Switched Access Minutes. . . . . . . . . . . . . . . . . . . . . . . . . . . . . . . . . . . . . . . . . . 5.9 Switched Traffic-Sensitive Interstate Minutes. . . . . . . . . . . . . . . . . . . . . . . . . . 2.19Monthly Charges for Residential Service. . . . . . . . . . . . . . . . . . . . . . . . . . . . . . 5.6Monthly Charges for Business Service. . . . . . . . . . . . . . . . . . . . . . . . . . . . . . 5.7
Nonregulated Income. . . . . . . . . . . . . . . . . . . . . . . . . . . . . . . . . . . . . . . . . 2.9 - 2.18Nonregulated Investments. . . . . . . . . . . . . . . . . . . . . . . . . . . . . . . . . 2.9 - 2.18Notes Payable. . . . . . . . . . . . . . . . . . . . . . . . . . . . . . . . . . . . . . . . . . . . . . . . 2.9 - 2.11Notes Receivable. . . . . . . . . . . . . . . . . . . . . . . . . . . . . . . . . . . . . . . . . . . . . . 2.9 - 2.11
Operator Service Provider Revenues. . . . . . . . . . . . . . . . . . . . . . . . . . . . . . . . . . . . . . . . . . . . .. 5.13Overseas Communication Services. . . . . . . . . . . . . . . . . . . . . . . . . 3.1 - 3.12 Paging Service Provider Revenues. . . . . . . . . . . . . . . . . . . . . . . . . . . . . . . . . . . . . . .. 5.12Pay Telephone Provider Revenues. . . . . . . . . . . . . . . . . . . . . . . . . . . . . . . . . . . . . . . . . . . . .. 5.12Penetration, Households with Telephone Service . . . . . . . . . . . . . . . . . . . . . . . . . . . . . . . . 5.2, 5.3Plant: Historical. . . . . . . . . . . . . . . . . . . . . . . . . . . . . . . . . . . . . . . . . . . . . . . . . . . 4.8 - 4.10 Investment in. . . . . . . . . . . . . . . . . . . . . . . . . . . . . . . . . . . . . . . . . . . . . . . . 1.1, 2.1, 2.7, 2.9 - 2.12, 2.16, 4.8, 4.9 Statistics (Physical Units). . . . . . . . . . . . . . . . . . . . . . . . . . . . . . . . . . . . 2.1, 2.2 - 2.4, 2.6, 2.19, 4.10Poles. . . . . . . . . . . . . . . . . . . . . . . . . . . . . . . . . . . . . . . . . . . . . . . . . . . . . . . . . 2.2, 2.6Prepaid Calling Card Providers . . . . . . . . . . . . . . . . . . . . . . . . . . . . . . . . . . . . . . . . .. 5.12Prepayments. . . . . . . . . . . . . . . . . . . . . . . . . . . . . . . . . . . . . . . . . . . . . . . . . 2.9 - 2.11Price Indexes, Telephone Service: Consumer Price Index . . . . . . . . . . . . . . . . . . . . . . . . . . . . . . . . . . . . . . . . . . . . . 5.4, 5.5 Producer Price Index . . . . . . . . . . . . . . . . . . . . . . . . . . . . . . . . . . . . . . . . . . . . . 5.5Private Line Service, International. . . . . . . . . . . . . . . . . . . . . . . . . . . . . 3.2, 3.5Producer Price Index (PPI). . . . . . . . . . . . . . . . . . . . . . . . . . . . . . . . . . . . . . . . . . . 5.5
Radio Relay System. . . . . . . . . . . . . . . . . . . . . . . . . . . . . . . . . . . . . . . . . . . 2.2, 2.6Rates: Business, Average Monthly. . . . . . . . . . . . . . . . . . . . . . . . . . . . . . . . . . . 5.6, 5.7 Historical. . . . . . . . . . . . . . . . . . . . . . . . . . . . . . . . . . . . . . . . . . . . . . . . . . .4.11 Long Distance Rates for AT&T, Sprint, and WorldCom. . . . . . . . . . . . . . . . . . . . . . . . . . . . . . 4.11 Residential, Average Monthly. . . . . . . . . . . . . . . . . . . . . . . . . . . . . . . . . 5.6, 5.7Resellers. . . . . . . . . . . . . . . . . . . . . . . . . . . . . . . . . . . . . . . . . . . . . . . . . . . . 1.2, 1.4, 2.1, 3.4, 3.6, 3.8, 5.13 International Revenues. . . . . . . . . . . . . . . . . . . . . . . . . . . . . . . . . . . . . . . . . . . . . . . . . . . 3.4, 3.6, 3.8 Revenues. . . . . . . . . . . . . . . . . . . . . . . . . . . . . . . . . . . . . . . . . . . . . . . . . . . 1.2, 1.4, 2.1, 5.13Residential Rates, Local . . . . . . . . . . . . . . . . . . . . . . . . . . . . . . . . . . . . . . . . . . . . 5.5Residential Rates, Average Monthly Prices. . . . . . . . . . . . . . . . . . . . . . . . . . . . . . . . . . . . . . . 5.5Retained Earnings. . . . . . . . . . . . . . . . . . . . . . . . . . . . . . . . . . . . . . . 2.9 - 2.11, 4.8 Historical. . . . . . . . . . . . . . . . . . . . . . . . . . . . . . . . . . . . . . . . . . . . . . . . . . . 4.8Revenues: Competitive Access Providers. . . . . . . . . . . . . . . . . . . . . . . . . . . . . . . . . . . . . . . . . . . . . . . . . . . 5.13 Historical. . . . . . . . . . . . . . . . . . . . . . . . . . . . . . . . . . . . . . . . . . . . . . . . . . . 4.1 - 4.5, 4.7 Holding Company. . . . . . . . . . . . . . . . . . . . . . . . . . . . . . . . . . . . . . . . . . . . . . . . . . . 1.1 Interexchange Carrier. . . . . . . . . . . . . . . . . . . . . . . . . . . . . . . . . . . . . . . . . . . . . . . . . . . 5.12 International. . . . . . . . . . . . . . . . . . . . . . . . . . . . . . . . . . . . . . . . . . . . . . . . . . . 3.1 - 3.3, 3.5, 3.6, 3.8, 3.10 Local. . . . . . . . . . . . . . . . . . . . . . . . . . . . . . . . . . . . . . . . . . . . . . . . . . . 1.2, 2.1, 2.9 - 2.13, 4.1 - 4.5, 4.7, 5.12, 5.13 Operator Service Providers. . . . . . . . . . . . . . . . . . . . . . . . . . . . . . . . . . . . . . . . . . . . . . . . . . . 5.13 Pay Telephone Providers. . . . . . . . . . . . . . . . . . . . . . . . . . . . . . . . . . . . . . . . . . 5.13 Reseller. . . . . . . . . . . . . . . . . . . . . . . . . . . . . . . . . . . . . . . . . . . . . . . . . . . 5.13 Satellite Service Carriers. . . . . . . . . . . . . . . . . . . . . . . . . . . . . . . . . . . . . . . . . . 5.13 Toll. . . . . . . . . . . . . . . . . . . . . . . . . . . . . . . . . . . . . . . . . . . . . . . . . . . 1.4, 5.12, 5.13 Total Industry, Interstate. . . . . . . . . . . . . . . . . . . . . . . . . . . . . . . . . 5.12 Total Industry, Intrastate. . . . . . . . . . . . . . . . . . . . . . . . . . . . . 5.12 Wireless. . . . . . . . . . . . . . . . . . . . . . . . . . . . . . . . . . . . . . . . . . . . . . . . . . . 5.12, 5.13
250
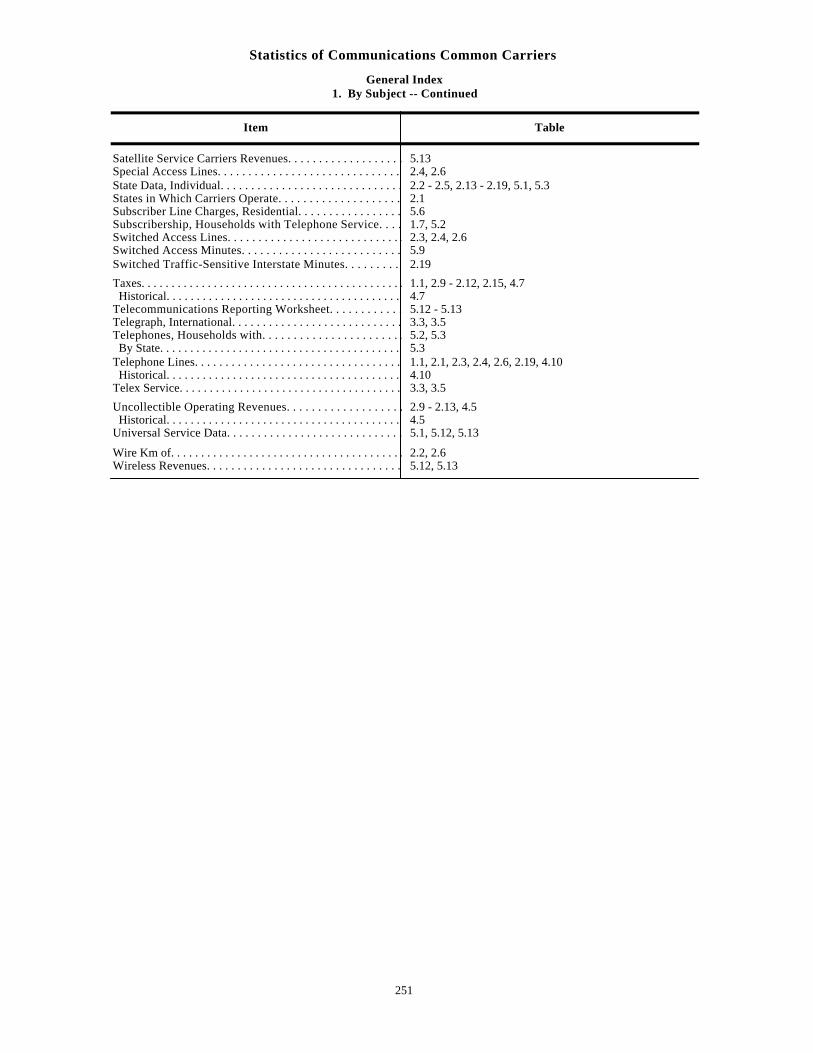
Statistics of Communications Common Carriers
General Index1. By Subject -- Continued
Item Table
Satellite Service Carriers Revenues. . . . . . . . . . . . . . . . . . . . . . . . . . . . . . . . . . . . . . . . . . 5.13Special Access Lines. . . . . . . . . . . . . . . . . . . . . . . . . . . . . . . . . . . . . . . . . . . . 2.4, 2.6State Data, Individual. . . . . . . . . . . . . . . . . . . . . . . . . . . . . . . . . . . . . . . . . . . . 2.2 - 2.5, 2.13 - 2.19, 5.1, 5.3States in Which Carriers Operate. . . . . . . . . . . . . . . . . . . . . . . . . . . . . . 2.1Subscriber Line Charges, Residential. . . . . . . . . . . . . . . . . . . . . . . . . . . . . . . . . . . . . . . . 5.6Subscribership, Households with Telephone Service. . . . . . . . . . . . . . . . . . . . . . . . . . . . . . . . . 1.7, 5.2Switched Access Lines. . . . . . . . . . . . . . . . . . . . . . . . . . . . . . . . . . . . . . . . . . . . 2.3, 2.4, 2.6Switched Access Minutes. . . . . . . . . . . . . . . . . . . . . . . . . . . . . . . . . . . . . . . . . . . 5.9Switched Traffic-Sensitive Interstate Minutes. . . . . . . . . . . . . . . . . . . . . . . . . . . . 2.19
Taxes. . . . . . . . . . . . . . . . . . . . . . . . . . . . . . . . . . . . . . . . . . . . . . . . . . . . . . . . . . 1.1, 2.9 - 2.12, 2.15, 4.7 Historical. . . . . . . . . . . . . . . . . . . . . . . . . . . . . . . . . . . . . . . . . . . . . . . . . . . 4.7Telecommunications Reporting Worksheet. . . . . . . . . . . . . . . . . . . . . . . . . . . . . . . . . . 5.12 - 5.13Telegraph, International. . . . . . . . . . . . . . . . . . . . . . . . . . . . . . . . . . . . . . . . . . . . . . . . . . . 3.3, 3.5Telephones, Households with. . . . . . . . . . . . . . . . . . . . . . . . . . . . . . . . . 5.2, 5.3 By State. . . . . . . . . . . . . . . . . . . . . . . . . . . . . . . . . . . . . . . . . . . . . . . . . . . . 5.3Telephone Lines. . . . . . . . . . . . . . . . . . . . . . . . . . . . . . . . . . . . . . . . . . . . . . 1.1, 2.1, 2.3, 2.4, 2.6, 2.19, 4.10 Historical. . . . . . . . . . . . . . . . . . . . . . . . . . . . . . . . . . . . . . . . . . . . . . . . . . . 4.10Telex Service. . . . . . . . . . . . . . . . . . . . . . . . . . . . . . . . . . . . . . . . . . . . . . . . . 3.3, 3.5 Uncollectible Operating Revenues. . . . . . . . . . . . . . . . . . . . . . . . . 2.9 - 2.13, 4.5 Historical. . . . . . . . . . . . . . . . . . . . . . . . . . . . . . . . . . . . . . . . . . . . . . . . . . . 4.5Universal Service Data. . . . . . . . . . . . . . . . . . . . . . . . . . . . . . . . . . . . . . . 5.1, 5.12, 5.13
Wire Km of. . . . . . . . . . . . . . . . . . . . . . . . . . . . . . . . . . . . . . . . . . . . . . . . . 2.2, 2.6Wireless Revenues. . . . . . . . . . . . . . . . . . . . . . . . . . . . . . . . . . . . . . . . . . . . . . . . . . . . 5.12, 5.13
251
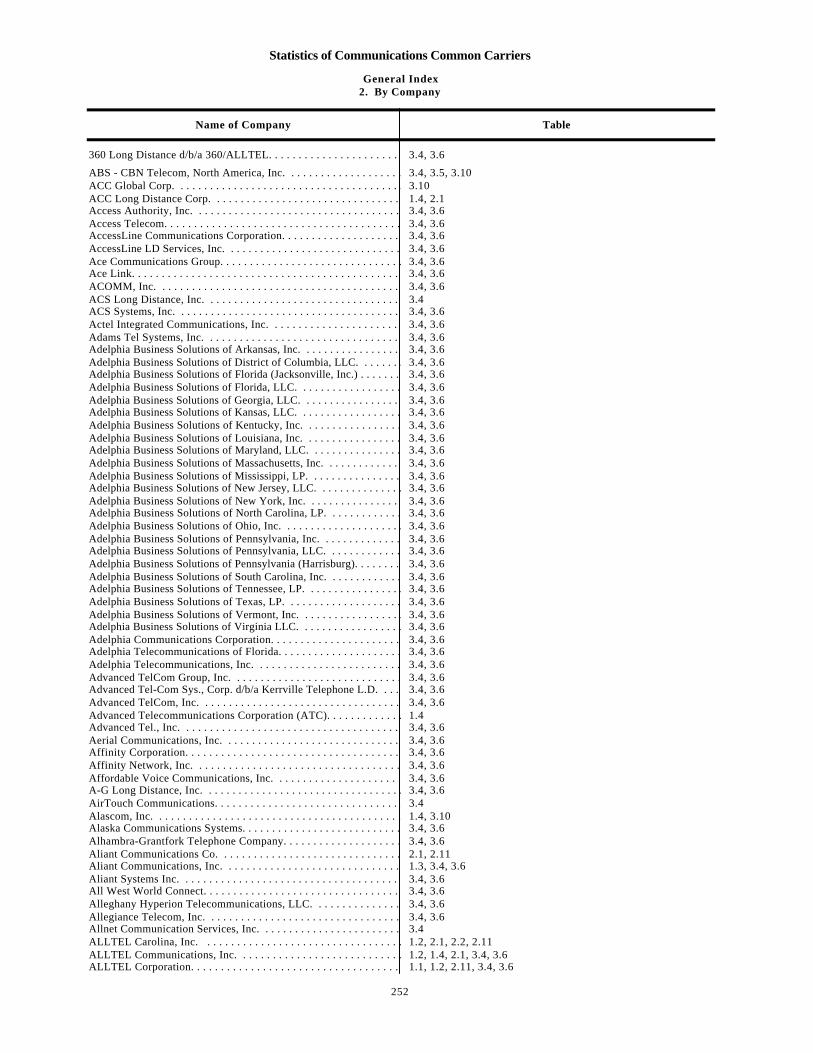
Statistics of Communications Common Carriers
General Index2. By Company
Name of Company Table
360 Long Distance d/b/a 360/ALLTEL. . . . . . . . . . . . . . . . . . . . . . . . . . . . . . . . . . . . . . . . . . . . .3.4, 3.6
ABS - CBN Telecom, North America, Inc. . . . . . . . . . . . . . . . . . . . . . . . . . . . . . . . .3.4, 3.5, 3.10ACC Global Corp. . . . . . . . . . . . . . . . . . . . . . . . . . . . . . . . . . . . . . . . . . . . . . . . . . . . . 3.10ACC Long Distance Corp. . . . . . . . . . . . . . . . . . . . . . . . . . . . . . . . . . . . . . . . . . . . . . . . . . . . . 1.4, 2.1Access Authority, Inc. . . . . . . . . . . . . . . . . . . . . . . . . . . . . . . . . . . . . . . . . . . . . . . . . . . . 3.4, 3.6Access Telecom. . . . . . . . . . . . . . . . . . . . . . . . . . . . . . . . . . . . . . . . . . . . . . . . . . . 3.4, 3.6AccessLine Communications Corporation. . . . . . . . . . . . . . . . . . . . . . . . . . . . . . . . . . . . . . .3.4, 3.6AccessLine LD Services, Inc. . . . . . . . . . . . . . . . . . . . . . . . . . . . . . . . . . . . . . .3.4, 3.6Ace Communications Group. . . . . . . . . . . . . . . . . . . . . . . . . . . . . . . . . . . . . . . . . . . . . . . . . . . . . . . . . .3.4, 3.6Ace Link. . . . . . . . . . . . . . . . . . . . . . . . . . . . . . . . . . . . . . . . . . . . . . . . . . . . . . . . . . . . . . . . . .3.4, 3.6ACOMM, Inc. . . . . . . . . . . . . . . . . . . . . . . . . . . . . . . . . . . . . . . . . . . . . . . . . . . . . . . . . . . . . . . . . . .3.4, 3.6ACS Long Distance, Inc. . . . . . . . . . . . . . . . . . . . . . . . . . . . . . . . . . . . . . . . . . . . . . . . . . . . . . . . . . . . . . .3.4ACS Systems, Inc. . . . . . . . . . . . . . . . . . . . . . . . . . . . . . . . . . . . . . . . . . . . . . . . . . . . . . . . . . . . . . . . . . .3.4, 3.6Actel Integrated Communications, Inc. . . . . . . . . . . . . . . . . . . . . . . . . . . . . . . . . . . . . . . . . . . . . . . . . . . . . . . .3.4, 3.6Adams Tel Systems, Inc. . . . . . . . . . . . . . . . . . . . . . . . . . . . . . . . . . . . . . . . . . . . . . . . . . . . . . . . . . . . . . . . . . .3.4, 3.6Adelphia Business Solutions of Arkansas, Inc. . . . . . . . . . . . . . . . . . . . . . . . . . . . . . . . . . . . . . . . . 3.4, 3.6Adelphia Business Solutions of District of Columbia, LLC. . . . . . . . . . . . . . . . . . . . . . . . . . . . . . . . . . 3.4, 3.6Adelphia Business Solutions of Florida (Jacksonville, Inc.) . . . . . . . . . . . . . . . . . . . . . . . . . . . . . . . . . . . . . . . . 3.4, 3.6Adelphia Business Solutions of Florida, LLC. . . . . . . . . . . . . . . . . . . . . . . . . . . . . . . . . . . . . . . . 3.4, 3.6Adelphia Business Solutions of Georgia, LLC. . . . . . . . . . . . . . . . . . . . . . . . . . . . . . . . . . . . . . . . 3.4, 3.6Adelphia Business Solutions of Kansas, LLC. . . . . . . . . . . . . . . . . . . . . . . . . . . . . . . . . . . . . . . . 3.4, 3.6Adelphia Business Solutions of Kentucky, Inc. . . . . . . . . . . . . . . . . . . . . . . . . . . . . . . . . . . . . . . . . 3.4, 3.6Adelphia Business Solutions of Louisiana, Inc. . . . . . . . . . . . . . . . . . . . . . . . . . . . . . . . . . . . . . . . 3.4, 3.6Adelphia Business Solutions of Maryland, LLC. . . . . . . . . . . . . . . . . . . . . . . . . . . . . . . . . . . . . . . . 3.4, 3.6Adelphia Business Solutions of Massachusetts, Inc. . . . . . . . . . . . . . . . . . . . . . . . . . . . . . . . . . . . . . 3.4, 3.6Adelphia Business Solutions of Mississippi, LP. . . . . . . . . . . . . . . . . . . . . . . . . . . . . . . . . . . . . . . . 3.4, 3.6Adelphia Business Solutions of New Jersey, LLC. . . . . . . . . . . . . . . . . . . . . . . . . . . . . . . . . . . . . . . . 3.4, 3.6Adelphia Business Solutions of New York, Inc. . . . . . . . . . . . . . . . . . . . . . . . . . . . . . . . . . . . . . . . . 3.4, 3.6Adelphia Business Solutions of North Carolina, LP. . . . . . . . . . . . . . . . . . . . . . . . . . . . . . . . . . . . . . . 3.4, 3.6Adelphia Business Solutions of Ohio, Inc. . . . . . . . . . . . . . . . . . . . . . . . . . . . . . . . . . . . . . . . . 3.4, 3.6Adelphia Business Solutions of Pennsylvania, Inc. . . . . . . . . . . . . . . . . . . . . . . . . . . . . . . . . . . . . . . . 3.4, 3.6Adelphia Business Solutions of Pennsylvania, LLC. . . . . . . . . . . . . . . . . . . . . . . . . . . . . . . . . . . . . . . . 3.4, 3.6Adelphia Business Solutions of Pennsylvania (Harrisburg). . . . . . . . . . . . . . . . . . . . . . . . . . . . . . . . . . . . . . . . 3.4, 3.6Adelphia Business Solutions of South Carolina, Inc. . . . . . . . . . . . . . . . . . . . . . . . . . . . . . . . . . . . . . . . . 3.4, 3.6Adelphia Business Solutions of Tennessee, LP. . . . . . . . . . . . . . . . . . . . . . . . . . . . . . . . . . . . . . . . 3.4, 3.6Adelphia Business Solutions of Texas, LP. . . . . . . . . . . . . . . . . . . . . . . . . . . . . . . . . . . . . . . . 3.4, 3.6Adelphia Business Solutions of Vermont, Inc. . . . . . . . . . . . . . . . . . . . . . . . . . . . . . . . . . . . . . . . . 3.4, 3.6Adelphia Business Solutions of Virginia LLC. . . . . . . . . . . . . . . . . . . . . . . . . . . . . . . . . . . . . . . . 3.4, 3.6Adelphia Communications Corporation. . . . . . . . . . . . . . . . . . . . . . . . . . . . . . . . . . . . . . . . . . . . . . 3.4, 3.6Adelphia Telecommunications of Florida. . . . . . . . . . . . . . . . . . . . . . . . . . . . . . . . . . . . . . . . . . . . 3.4, 3.6Adelphia Telecommunications, Inc. . . . . . . . . . . . . . . . . . . . . . . . . . . . . . . . . . . . . . . . . . . . . . . 3.4, 3.6Advanced TelCom Group, Inc. . . . . . . . . . . . . . . . . . . . . . . . . . . . . . . . . . . . . . . . . . . . . . . . . . . . . . . . . 3.4, 3.6Advanced Tel-Com Sys., Corp. d/b/a Kerrville Telephone L.D. . . . . . . . . . . . . . . . . . . . . . . . . . . . . . . . . . . . . . . 3.4, 3.6Advanced TelCom, Inc. . . . . . . . . . . . . . . . . . . . . . . . . . . . . . . . . . . . . . . . . . . . . . . . . . . . . . . . . 3.4, 3.6Advanced Telecommunications Corporation (ATC). . . . . . . . . . . . . . . . . . . . . . . . . . . . . . . . . . . . . . . . . . . 1.4Advanced Tel., Inc. . . . . . . . . . . . . . . . . . . . . . . . . . . . . . . . . . . . . . . . . . . . . . . . . . . . . . . . . 3.4, 3.6Aerial Communications, Inc. . . . . . . . . . . . . . . . . . . . . . . . . . . . . . . . . . . . . . . . . . . . . . . . . . 3.4, 3.6Affinity Corporation. . . . . . . . . . . . . . . . . . . . . . . . . . . . . . . . . . . . . . . . . . . . . . . . . . . . . 3.4, 3.6Affinity Network, Inc. . . . . . . . . . . . . . . . . . . . . . . . . . . . . . . . . . . . . . . . . . . . . . . . . . . . 3.4, 3.6Affordable Voice Communications, Inc. . . . . . . . . . . . . . . . . . . . . . . . . . . . . . . . . . . . . . . . . . . . 3.4, 3.6A-G Long Distance, Inc. . . . . . . . . . . . . . . . . . . . . . . . . . . . . . . . . . . . . . . . . . . . . . . . . . . .3.4, 3.6AirTouch Communications. . . . . . . . . . . . . . . . . . . . . . . . . . . . . . . . . . . . . . . . . . . . . . . . . 3.4Alascom, Inc. . . . . . . . . . . . . . . . . . . . . . . . . . . . . . . . . . . . . . . . . . . . . . . . . . . . . . . . . . . . . . 1.4, 3.10Alaska Communications Systems. . . . . . . . . . . . . . . . . . . . . . . . . . . . . . . . . . . . . . . . . . . . . . . . . . . . . 3.4, 3.6Alhambra-Grantfork Telephone Company. . . . . . . . . . . . . . . . . . . . . . . . . . . . . . . . . . . . . . . . . . . . . . . . . 3.4, 3.6Aliant Communications Co. . . . . . . . . . . . . . . . . . . . . . . . . . . . . . . . . . . . . . . . . . . . . . . . . 2.1, 2.11Aliant Communications, Inc. . . . . . . . . . . . . . . . . . . . . . . . . . . . . . . . . . . . . . . . . . . . . . . . 1.3, 3.4, 3.6Aliant Systems Inc. . . . . . . . . . . . . . . . . . . . . . . . . . . . . . . . . . . . . . . . . . . . 3.4, 3.6All West World Connect. . . . . . . . . . . . . . . . . . . . . . . . . . . . . . . . . . . . . . . . 3.4, 3.6Alleghany Hyperion Telecommunications, LLC. . . . . . . . . . . . . . . . . . . . . . . . . . . . . . . . . . . . . . . 3.4, 3.6Allegiance Telecom, Inc. . . . . . . . . . . . . . . . . . . . . . . . . . . . . . . . . . . . . . . . . . . . . . . . . . . . . . . . . 3.4, 3.6Allnet Communication Services, Inc. . . . . . . . . . . . . . . . . . . . . . . . . . . . . . . . . . 3.4ALLTEL Carolina, Inc. . . . . . . . . . . . . . . . . . . . . . . . . . . . . . . . . . . . . . . . . . . . . . . . . . . . . . 1.2, 2.1, 2.2, 2.11ALLTEL Communications, Inc. . . . . . . . . . . . . . . . . . . . . . . . . . . . . . . . . . . . . . . . . . . . . . . . . . . . 1.2, 1.4, 2.1, 3.4, 3.6ALLTEL Corporation. . . . . . . . . . . . . . . . . . . . . . . . . . . . . . . . . . . . . . . . . . . . . . . . . . . . . . . . 1.1, 1.2, 2.11, 3.4, 3.6
252
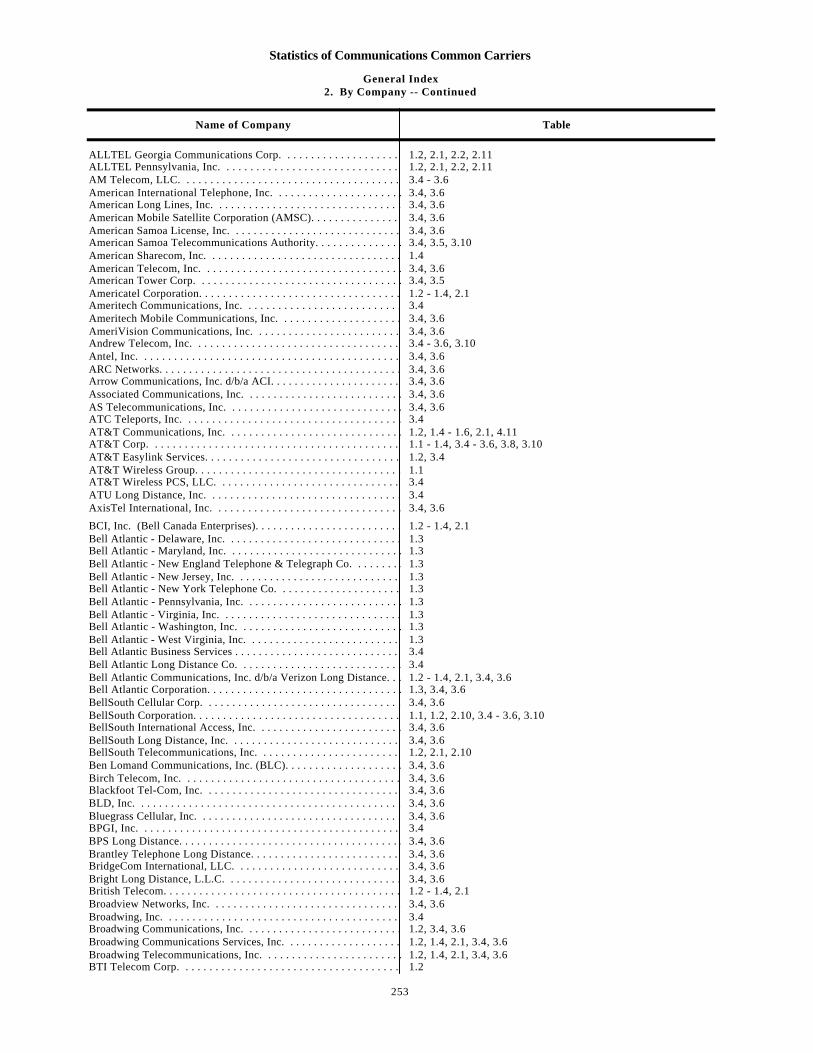
Statistics of Communications Common Carriers
General Index2. By Company -- Continued
Name of Company Table
ALLTEL Georgia Communications Corp. . . . . . . . . . . . . . . . . . . . . . . . . . . . . . . . . . . . . . . . . . . . . . 1.2, 2.1, 2.2, 2.11ALLTEL Pennsylvania, Inc. . . . . . . . . . . . . . . . . . . . . . . . . . . . . . . . . . . . . . . . . . . . . . . . 1.2, 2.1, 2.2, 2.11AM Telecom, LLC. . . . . . . . . . . . . . . . . . . . . . . . . . . . . . . . . . . . . . . . . . . . . . . . . . . . . . . . . . . . . 3.4 - 3.6American International Telephone, Inc. . . . . . . . . . . . . . . . . . . . . . . . . . . . . . . . . . . . . . . . . 3.4, 3.6American Long Lines, Inc. . . . . . . . . . . . . . . . . . . . . . . . . . . . . . . . . . . . . . . . . . . . . . . . 3.4, 3.6American Mobile Satellite Corporation (AMSC). . . . . . . . . . . . . . . . . . . . . . . . . . . . . . . . . . . . . . . . . . 3.4, 3.6American Samoa License, Inc. . . . . . . . . . . . . . . . . . . . . . . . . . . . . . . . . . . . . . . 3.4, 3.6American Samoa Telecommunications Authority. . . . . . . . . . . . . . . . . . . . . . . . . . . . . . . . . . . . . . . 3.4, 3.5, 3.10American Sharecom, Inc. . . . . . . . . . . . . . . . . . . . . . . . . . . . . . . . . . . . . . . . . . . . . . . . . . . . . . . 1.4American Telecom, Inc. . . . . . . . . . . . . . . . . . . . . . . . . . . . . . . . . . . . . . . . . . . . . . 3.4, 3.6American Tower Corp. . . . . . . . . . . . . . . . . . . . . . . . . . . . . . . . . . . . . . . . . . . . . . . 3.4, 3.5Americatel Corporation. . . . . . . . . . . . . . . . . . . . . . . . . . . . . . . . . . . . . . . . . . . . . . . . . . . . . . 1.2 - 1.4, 2.1Ameritech Communications, Inc. . . . . . . . . . . . . . . . . . . . . . . . . . . . . . . . . . . . . . . . . . . . . . . . 3.4Ameritech Mobile Communications, Inc. . . . . . . . . . . . . . . . . . . . . . . . . . . . . . . . . . . . . . . . . . . . . . . . . . . . . . 3.4, 3.6AmeriVision Communications, Inc. . . . . . . . . . . . . . . . . . . . . . . . . . . . . . . . . . . . . . . . . . . . . . . . . . . 3.4, 3.6Andrew Telecom, Inc. . . . . . . . . . . . . . . . . . . . . . . . . . . . . . . . . . . . . . . . . . . . . . . . . . . . . . . . . . . . . . . 3.4 - 3.6, 3.10Antel, Inc. . . . . . . . . . . . . . . . . . . . . . . . . . . . . . . . . . . . . . . . . . . . . . . . . . . . . . . . . . . . . . . 3.4, 3.6ARC Networks. . . . . . . . . . . . . . . . . . . . . . . . . . . . . . . . . . . . . . . . . . . . . . . . . . . . . . . . . . . . . 3.4, 3.6Arrow Communications, Inc. d/b/a ACI. . . . . . . . . . . . . . . . . . . . . . . . . . . . . . . . . . . . . . . . . . . . . . . . 3.4, 3.6Associated Communications, Inc. . . . . . . . . . . . . . . . . . . . . . . . . . . . . . . . . . . . . . . . . . . . . . . . . . . . . . . . . 3.4, 3.6AS Telecommunications, Inc. . . . . . . . . . . . . . . . . . . . . . . . . . . . . . . . . . . . . . . . . . . . . . . . . . . . . . . . . 3.4, 3.6ATC Teleports, Inc. . . . . . . . . . . . . . . . . . . . . . . . . . . . . . . . . . . . . . . . . . . . . . . . . . . . . . . . . 3.4AT&T Communications, Inc. . . . . . . . . . . . . . . . . . . . . . . . . . . . . . . . . . . . . . . . . . . . . . . . . . 1.2, 1.4 - 1.6, 2.1, 4.11AT&T Corp. . . . . . . . . . . . . . . . . . . . . . . . . . . . . . . . . . . . . . . . . . . . . . . . . . . . . . . . . . . . . . . . . . . 1.1 - 1.4, 3.4 - 3.6, 3.8, 3.10AT&T Easylink Services. . . . . . . . . . . . . . . . . . . . . . . . . . . . . . . . . . . . . . . . . . . . . . . . . . . . . . 1.2, 3.4AT&T Wireless Group. . . . . . . . . . . . . . . . . . . . . . . . . . . . . . . . . . . . . . . . . . . . . . . . . . . . . . 1.1AT&T Wireless PCS, LLC. . . . . . . . . . . . . . . . . . . . . . . . . . . . . . . . . . . . . . . . . . . . . . . . . . . . . . . 3.4ATU Long Distance, Inc. . . . . . . . . . . . . . . . . . . . . . . . . . . . . . . . . . . . . . . . . . . . . . . . . . . . . . . . . . . . . . .3.4AxisTel International, Inc. . . . . . . . . . . . . . . . . . . . . . . . . . . . . . . . . . . . . . . . . . . . . . . . . . . . . . . . . . . . .3.4, 3.6
BCI, Inc. (Bell Canada Enterprises). . . . . . . . . . . . . . . . . . . . . . . . . . . . . . . . . . . . . . . . . . . 1.2 - 1.4, 2.1Bell Atlantic - Delaware, Inc. . . . . . . . . . . . . . . . . . . . . . . . . . . . . . . . . . . . . . . . . . . . . . 1.3Bell Atlantic - Maryland, Inc. . . . . . . . . . . . . . . . . . . . . . . . . . . . . . . . . . . . . . . . . . . . . . 1.3Bell Atlantic - New England Telephone & Telegraph Co. . . . . . . . . . . . . . . . . . . . . . . . . . . . . . . . . . . 1.3Bell Atlantic - New Jersey, Inc. . . . . . . . . . . . . . . . . . . . . . . . . . . . . . . . . . . . . . . . . . . . . . 1.3Bell Atlantic - New York Telephone Co. . . . . . . . . . . . . . . . . . . . . . . . . . . . . . . . . . . . . . . . . . . 1.3Bell Atlantic - Pennsylvania, Inc. . . . . . . . . . . . . . . . . . . . . . . . . . . . . . . . . . . . . . . . . . . . . . 1.3Bell Atlantic - Virginia, Inc. . . . . . . . . . . . . . . . . . . . . . . . . . . . . . . . . . . . . . . . . . . . . . 1.3Bell Atlantic - Washington, Inc. . . . . . . . . . . . . . . . . . . . . . . . . . . . . . . . . . . . . . . . . . . . . . 1.3Bell Atlantic - West Virginia, Inc. . . . . . . . . . . . . . . . . . . . . . . . . . . . . . . . . . . . . . . . . . . . . . 1.3Bell Atlantic Business Services . . . . . . . . . . . . . . . . . . . . . . . . . . . . . . . . . . . . . . . . . . . . 3.4Bell Atlantic Long Distance Co. . . . . . . . . . . . . . . . . . . . . . . . . . . . . . . . . . . . . . . . . . . . . 3.4Bell Atlantic Communications, Inc. d/b/a Verizon Long Distance. . . . . . . . . . . . . . . . . . . . . . . . . . . 1.2 - 1.4, 2.1, 3.4, 3.6Bell Atlantic Corporation. . . . . . . . . . . . . . . . . . . . . . . . . . . . . . . . . . . . . . . . . . . . . . . . 1.3, 3.4, 3.6BellSouth Cellular Corp. . . . . . . . . . . . . . . . . . . . . . . . . . . . . . . . . . . . . . . . . . . . . . . . . . . 3.4, 3.6BellSouth Corporation. . . . . . . . . . . . . . . . . . . . . . . . . . . . . . . . . . . . . . . . . . . . . . . . . . . . . 1.1, 1.2, 2.10, 3.4 - 3.6, 3.10BellSouth International Access, Inc. . . . . . . . . . . . . . . . . . . . . . . . . . . . . . . . . . . . . . . . . . . . . 3.4, 3.6BellSouth Long Distance, Inc. . . . . . . . . . . . . . . . . . . . . . . . . . . . . . . . . . . . . . . . . . . . . . . . . 3.4, 3.6BellSouth Telecommunications, Inc. . . . . . . . . . . . . . . . . . . . . . . . . . . . . . . . . . . . . . . . . . . . . . 1.2, 2.1, 2.10Ben Lomand Communications, Inc. (BLC). . . . . . . . . . . . . . . . . . . . . . . . . . . . . . . . . . . . . . . . . . . . . . 3.4, 3.6Birch Telecom, Inc. . . . . . . . . . . . . . . . . . . . . . . . . . . . . . . . . . . . . . . . . . . . . . . . . . . . . . . . . . . . . . . . . 3.4, 3.6Blackfoot Tel-Com, Inc. . . . . . . . . . . . . . . . . . . . . . . . . . . . . . . . . . . . . . . . . . . . . . . . . . . . . . . 3.4, 3.6BLD, Inc. . . . . . . . . . . . . . . . . . . . . . . . . . . . . . . . . . . . . . . . . . . . . . . . . . . . . . . . . . . . . . . . . . . . . . 3.4, 3.6Bluegrass Cellular, Inc. . . . . . . . . . . . . . . . . . . . . . . . . . . . . . . . . . . . . . . . . . . . . . . . . . . . . . . . . . . . . . . 3.4, 3.6BPGI, Inc. . . . . . . . . . . . . . . . . . . . . . . . . . . . . . . . . . . . . . . . . . . . . . . . . . . . . . . . . . . . . . . . . . . . . . 3.4BPS Long Distance. . . . . . . . . . . . . . . . . . . . . . . . . . . . . . . . . . . . . . . . . . . . . . . . . . . . . . . . . . . . . . . . . . 3.4, 3.6Brantley Telephone Long Distance. . . . . . . . . . . . . . . . . . . . . . . . . . . . . . . . . . . . . . . . . . . . . . . . . . . . . . . . . . . 3.4, 3.6BridgeCom International, LLC. . . . . . . . . . . . . . . . . . . . . . . . . . . . . . . . . . . . . . . . . . . . . . . . . . . . . . . . . . . . 3.4, 3.6Bright Long Distance, L.L.C. . . . . . . . . . . . . . . . . . . . . . . . . . . . . . . . . . . . . . . . . . . . . . . . . . . . . . . . . . . . 3.4, 3.6British Telecom. . . . . . . . . . . . . . . . . . . . . . . . . . . . . . . . . . . . . . . . . . . . . . . . . . . . . . . . . . . . 1.2 - 1.4, 2.1Broadview Networks, Inc. . . . . . . . . . . . . . . . . . . . . . . . . . . . . . . . . . . . . . . . . . . . . . . . . . . . . . . . . . . . . . 3.4, 3.6Broadwing, Inc. . . . . . . . . . . . . . . . . . . . . . . . . . . . . . . . . . . . . . . . . . . . . . . . 3.4Broadwing Communications, Inc. . . . . . . . . . . . . . . . . . . . . . . . . . . . . . . . . . . . . . . . . 1.2, 3.4, 3.6Broadwing Communications Services, Inc. . . . . . . . . . . . . . . . . . . . . . . . . . . . . . . . . . . . . . . . . 1.2, 1.4, 2.1, 3.4, 3.6Broadwing Telecommunications, Inc. . . . . . . . . . . . . . . . . . . . . . . . . . . . . . . . . . . . . . . . . . . . . . . . . . . . . . . . . . . . . . . . . . . . . . 1.2, 1.4, 2.1, 3.4, 3.6BTI Telecom Corp. . . . . . . . . . . . . . . . . . . . . . . . . . . . . . . . . . . . . . . . . . . . . . . . . . . . . . . . 1.2
253
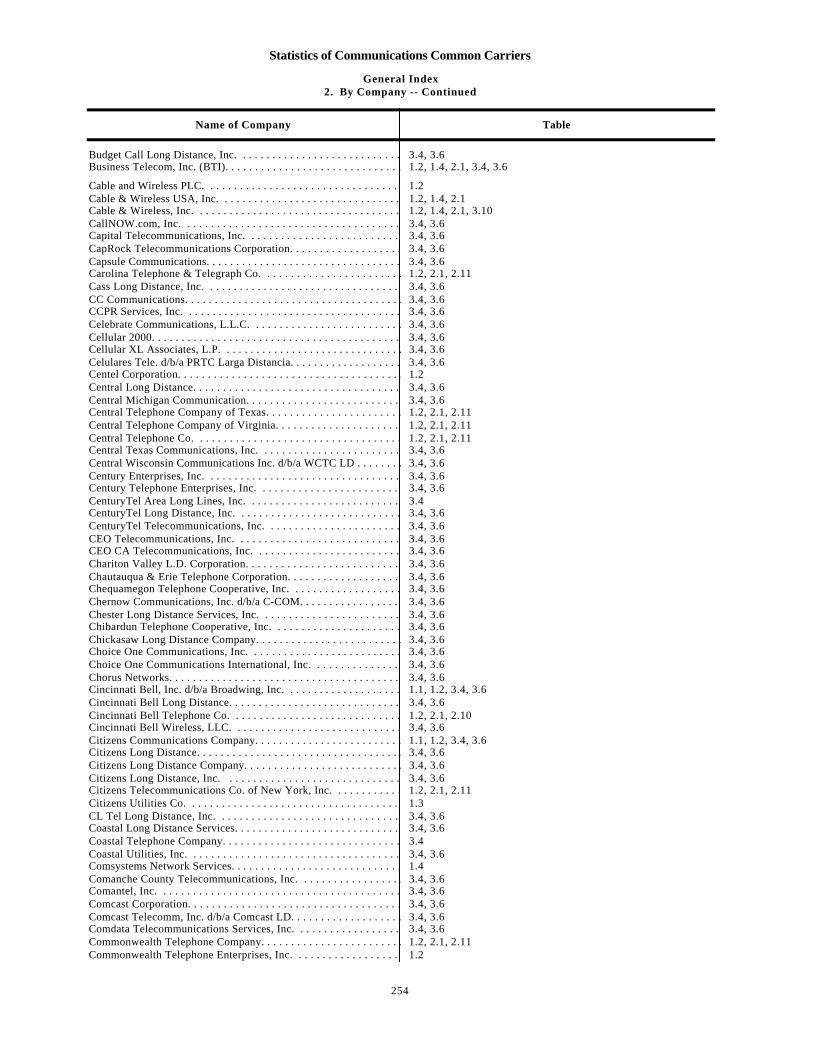
Statistics of Communications Common Carriers
General Index2. By Company -- Continued
Name of Company Table
Budget Call Long Distance, Inc. . . . . . . . . . . . . . . . . . . . . . . . . . . . . . . . . . . . . . . . . 3.4, 3.6Business Telecom, Inc. (BTI). . . . . . . . . . . . . . . . . . . . . . . . . . . . . . . . . . . . . . . . . . . . . . . 1.2, 1.4, 2.1, 3.4, 3.6
Cable and Wireless PLC. . . . . . . . . . . . . . . . . . . . . . . . . . . . . . . . . . . . . . . . . . . . . . . . . . . . . . 1.2Cable & Wireless USA, Inc. . . . . . . . . . . . . . . . . . . . . . . . . . . . . . . . . . . . . . . . . . . . . . . . . . . 1.2, 1.4, 2.1Cable & Wireless, Inc. . . . . . . . . . . . . . . . . . . . . . . . . . . . . . . . . . . . . . . . . . . . . . . . . . . . . . . . . . . . . . . . . . . . 1.2, 1.4, 2.1, 3.10CallNOW.com, Inc. . . . . . . . . . . . . . . . . . . . . . . . . . . . . . . . . . . . . . . . . . . . . . . . . . . . . 3.4, 3.6Capital Telecommunications, Inc. . . . . . . . . . . . . . . . . . . . . . . . . . . . . . . . . . . . . . . . . . . . . 3.4, 3.6CapRock Telecommunications Corporation. . . . . . . . . . . . . . . . . . . . . . . . . . . . . . . . . . . . . . . . . . 3.4, 3.6Capsule Communications. . . . . . . . . . . . . . . . . . . . . . . . . . . . . . . . . . . . . . . . . . . . . . . . . . 3.4, 3.6Carolina Telephone & Telegraph Co. . . . . . . . . . . . . . . . . . . . . . . . . . . . . . . . . . . . . 1.2, 2.1, 2.11Cass Long Distance, Inc. . . . . . . . . . . . . . . . . . . . . . . . . . . . . . . . . . . . . . . . . . . . . . . . . 3.4, 3.6CC Communications. . . . . . . . . . . . . . . . . . . . . . . . . . . . . . . . . . . . . . . . . . . . . . . . . . . . . . 3.4, 3.6CCPR Services, Inc. . . . . . . . . . . . . . . . . . . . . . . . . . . . . . . . . . . . . . . . . . . . . . . . . . . . . 3.4, 3.6Celebrate Communications, L.L.C. . . . . . . . . . . . . . . . . . . . . . . . . . . . . . . . . . . . . . . . . . . . . 3.4, 3.6Cellular 2000. . . . . . . . . . . . . . . . . . . . . . . . . . . . . . . . . . . . . . . . . . . . . . . . . . . . . . . . . . . . . 3.4, 3.6Cellular XL Associates, L.P. . . . . . . . . . . . . . . . . . . . . . . . . . . . . . . . . . . . . . . . . . . . . . . . . . . . . 3.4, 3.6Celulares Tele. d/b/a PRTC Larga Distancia. . . . . . . . . . . . . . . . . . . . . . . . . . . . . . . . . . . . . . . . . . . . . . 3.4, 3.6Centel Corporation. . . . . . . . . . . . . . . . . . . . . . . . . . . . . . . . . . . . . . . . . . . . . . . . . . . . . . . . 1.2Central Long Distance. . . . . . . . . . . . . . . . . . . . . . . . . . . . . . . . . . . . . . . . . . . . . . . . . 3.4, 3.6Central Michigan Communication. . . . . . . . . . . . . . . . . . . . . . . . . . . . . . . . . . . . . . . . . . . . . 3.4, 3.6Central Telephone Company of Texas. . . . . . . . . . . . . . . . . . . . . . . . . . . . . . . . . . . 1.2, 2.1, 2.11Central Telephone Company of Virginia. . . . . . . . . . . . . . . . . . . . . . . . . . . . . . . . . . . . 1.2, 2.1, 2.11Central Telephone Co. . . . . . . . . . . . . . . . . . . . . . . . . . . . . . . . . . . . . . . . . . . . . . . . . . 1.2, 2.1, 2.11Central Texas Communications, Inc. . . . . . . . . . . . . . . . . . . . . . . . . . . . . . . . . . . . . 3.4, 3.6Central Wisconsin Communications Inc. d/b/a WCTC LD . . . . . . . . . . . . . . . . . . . . . . . . . . . . . 3.4, 3.6Century Enterprises, Inc. . . . . . . . . . . . . . . . . . . . . . . . . . . . . . . . . . . . . . . . . . . . . . . . . . . . . 3.4, 3.6Century Telephone Enterprises, Inc. . . . . . . . . . . . . . . . . . . . . . . . . . . . . . . . . . . . . . . . . . . . . . . . . . . . . 3.4, 3.6CenturyTel Area Long Lines, Inc. . . . . . . . . . . . . . . . . . . . . . . . . . . . . . . . . . . . . . . . . . . . . . . . . 3.4CenturyTel Long Distance, Inc. . . . . . . . . . . . . . . . . . . . . . . . . . . . . . . . . . . . . . . . . . . . . . . . . 3.4, 3.6CenturyTel Telecommunications, Inc. . . . . . . . . . . . . . . . . . . . . . . . . . . . . . . . . . . . . . . . . . . . . . . . . 3.4, 3.6CEO Telecommunications, Inc. . . . . . . . . . . . . . . . . . . . . . . . . . . . . . . . . . . . . . . . . . . . . . . . . 3.4, 3.6CEO CA Telecommunications, Inc. . . . . . . . . . . . . . . . . . . . . . . . . . . . . . . . . . . . . . . . . . . . . . . . . 3.4, 3.6Chariton Valley L.D. Corporation. . . . . . . . . . . . . . . . . . . . . . . . . . . . . . . . . . . . . . . . . . . . . 3.4, 3.6Chautauqua & Erie Telephone Corporation. . . . . . . . . . . . . . . . . . . . . . . . . . . . . . . . 3.4, 3.6Chequamegon Telephone Cooperative, Inc. . . . . . . . . . . . . . . . . . . . . . . . . . . . . . . . . . . . . . . . 3.4, 3.6Chernow Communications, Inc. d/b/a C-COM. . . . . . . . . . . . . . . . . . . . . . . . . . . . . . . . . . . . . . . 3.4, 3.6Chester Long Distance Services, Inc. . . . . . . . . . . . . . . . . . . . . . . . . . . . . . . . . . . . . . . . . . . 3.4, 3.6Chibardun Telephone Cooperative, Inc. . . . . . . . . . . . . . . . . . . . . . . . . . . . . . . . . . . . . . . . . . . . . 3.4, 3.6Chickasaw Long Distance Company. . . . . . . . . . . . . . . . . . . . . . . . . . . . . . . . . . . . . . . 3.4, 3.6Choice One Communications, Inc. . . . . . . . . . . . . . . . . . . . . . . . . . . . . . . . . . . . . . . . . . . . . . . . . . . . . . 3.4, 3.6Choice One Communications International, Inc. . . . . . . . . . . . . . . . . . . . . . . . . . . . . . . . . . . . . . . . . . . . . . . . . . . . . . 3.4, 3.6Chorus Networks. . . . . . . . . . . . . . . . . . . . . . . . . . . . . . . . . . . . . . . . . . . . . . . . . . . . . . . . 3.4, 3.6Cincinnati Bell, Inc. d/b/a Broadwing, Inc. . . . . . . . . . . . . . . . . . . . . . . . . . . . . . . . . . . . . . . . . . . . . . . . . . . . . . . . . 1.1, 1.2, 3.4, 3.6Cincinnati Bell Long Distance. . . . . . . . . . . . . . . . . . . . . . . . . . . . . . . . . . . . . . . . . . . . . . . . . . . . . . . . 3.4, 3.6Cincinnati Bell Telephone Co. . . . . . . . . . . . . . . . . . . . . . . . . . . . . . . . . . . . . . . . . . . . 1.2, 2.1, 2.10Cincinnati Bell Wireless, LLC. . . . . . . . . . . . . . . . . . . . . . . . . . . . . . . . . . . . . . . . . . . 3.4, 3.6Citizens Communications Company. . . . . . . . . . . . . . . . . . . . . . . . . . . . . . . . . . . . . . . . . . . . . . . . . . . 1.1, 1.2, 3.4, 3.6Citizens Long Distance. . . . . . . . . . . . . . . . . . . . . . . . . . . . . . . . . . . . . . . . . . . . . . . . . . . . . . . . . . . . . . . . . 3.4, 3.6Citizens Long Distance Company. . . . . . . . . . . . . . . . . . . . . . . . . . . . . . . . . . . . . . . . . . . . . . . . . . . . . . . . . . . . . . . . . 3.4, 3.6Citizens Long Distance, Inc. . . . . . . . . . . . . . . . . . . . . . . . . . . . . . . . . . . . . . . . . . . . . . . . . . . . . . . . . . . . . . . . . 3.4, 3.6Citizens Telecommunications Co. of New York, Inc. . . . . . . . . . . . . . . . . . . . . . . . . . . . . . . . . . . . . . . . . . . . . . . . . 1.2, 2.1, 2.11Citizens Utilities Co. . . . . . . . . . . . . . . . . . . . . . . . . . . . . . . . . . . . . . . . . . . . . . . . . . . . . . . 1.3CL Tel Long Distance, Inc. . . . . . . . . . . . . . . . . . . . . . . . . . . . . . . . . . . . . . . . . . . . . . . . . . . 3.4, 3.6Coastal Long Distance Services. . . . . . . . . . . . . . . . . . . . . . . . . . . . . . . . . . . . . . . . . . . . . . . . . 3.4, 3.6Coastal Telephone Company. . . . . . . . . . . . . . . . . . . . . . . . . . . . . . . . . . . . . . . . . . . . . . . . . . . . 3.4Coastal Utilities, Inc. . . . . . . . . . . . . . . . . . . . . . . . . . . . . . . . . . . . . . . . . . . . . . . . . . . . . . . . 3.4, 3.6Comsystems Network Services. . . . . . . . . . . . . . . . . . . . . . . . . . . . . . . . . . . . . . . . . . . . . . . . . 1.4Comanche County Telecommunications, Inc. . . . . . . . . . . . . . . . . . . . . . . . . . . . . . . . . . . . . . . . . . . . . . . . 3.4, 3.6Comantel, Inc. . . . . . . . . . . . . . . . . . . . . . . . . . . . . . . . . . . . . . . . . . . . . . . . . . . . . . . . . . . . . . . 3.4, 3.6Comcast Corporation. . . . . . . . . . . . . . . . . . . . . . . . . . . . . . . . . . . . . . . . . . . . . . . . . . . . . . . . . . . . 3.4, 3.6Comcast Telecomm, Inc. d/b/a Comcast LD. . . . . . . . . . . . . . . . . . . . . . . . . . . . . . . . . . . . . . . . . . . . 3.4, 3.6Comdata Telecommunications Services, Inc. . . . . . . . . . . . . . . . . . . . . . . . . . . . . . . . . . . . . . . . . . . . . . 3.4, 3.6Commonwealth Telephone Company. . . . . . . . . . . . . . . . . . . . . . . . . . . . . . . . . . . . . . . . . . . . . . . . . . . . . 1.2, 2.1, 2.11Commonwealth Telephone Enterprises, Inc. . . . . . . . . . . . . . . . . . . . . . . . . . . . . . . . . . . . . . . . . . . . . . . . 1.2
254
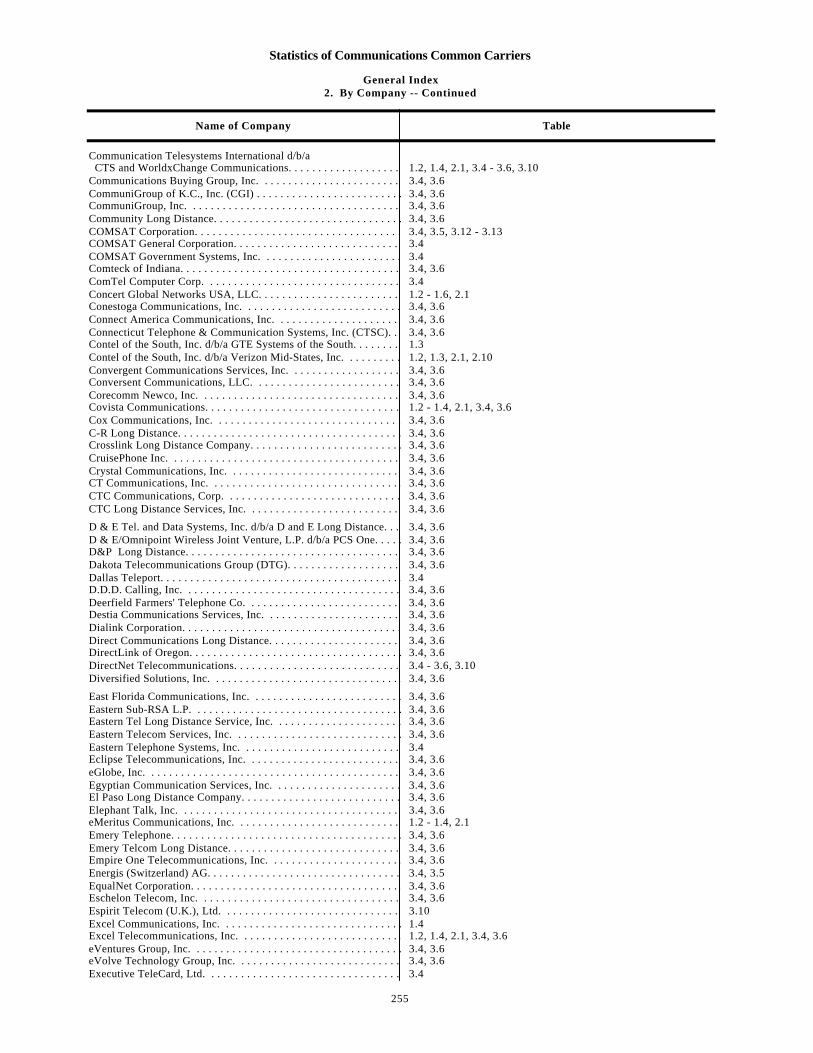
Statistics of Communications Common Carriers
General Index2. By Company -- Continued
Name of Company Table
Communication Telesystems International d/b/a CTS and WorldxChange Communications. . . . . . . . . . . . . . . . . . . . . . . . . . . . . . . . . . . . . . . . . . . . . . . . . . . . . . . . . . . . . . . . 1.2, 1.4, 2.1, 3.4 - 3.6, 3.10Communications Buying Group, Inc. . . . . . . . . . . . . . . . . . . . . . . . . . . . . . . . . . . . . . . . . . . . . . . . . . . . . 3.4, 3.6CommuniGroup of K.C., Inc. (CGI) . . . . . . . . . . . . . . . . . . . . . . . . . . . . . . . . . . . . . . . . . . . . . . . . 3.4, 3.6CommuniGroup, Inc. . . . . . . . . . . . . . . . . . . . . . . . . . . . . . . . . . . . . . . . . . . . . . . . . . . . . . . 3.4, 3.6Community Long Distance. . . . . . . . . . . . . . . . . . . . . . . . . . . . . . . . . . . . . . . . . . . . . . 3.4, 3.6COMSAT Corporation. . . . . . . . . . . . . . . . . . . . . . . . . . . . . . . . . . . . . . . . . . . . . . . . . . . . . . . . 3.4, 3.5, 3.12 - 3.13COMSAT General Corporation. . . . . . . . . . . . . . . . . . . . . . . . . . . . . . . . . . . . . . . . . . . . . . . . . . . . . . 3.4COMSAT Government Systems, Inc. . . . . . . . . . . . . . . . . . . . . . . . . . . . . . . . . . . . . . . . . . . . . . . . . . . . 3.4Comteck of Indiana. . . . . . . . . . . . . . . . . . . . . . . . . . . . . . . . . . . . . . . . . . . . . . . . . . . . . . . . . . . . 3.4, 3.6ComTel Computer Corp. . . . . . . . . . . . . . . . . . . . . . . . . . . . . . . . . . . . . . . . . . . . . . . . . . . . . . . . . . 3.4Concert Global Networks USA, LLC. . . . . . . . . . . . . . . . . . . . . . . . . . . . . . . . . . . . . . . . . . . . . . . . . . . . 1.2 - 1.6, 2.1Conestoga Communications, Inc. . . . . . . . . . . . . . . . . . . . . . . . . . . . . . . . . . . . . . . . . . . . . . . . . . . . . . 3.4, 3.6Connect America Communications, Inc. . . . . . . . . . . . . . . . . . . . . . . . . . . . . . . . . . . . . . . . . . . . . . 3.4, 3.6Connecticut Telephone & Communication Systems, Inc. (CTSC). . . . . . . . . . . . . . 3.4, 3.6Contel of the South, Inc. d/b/a GTE Systems of the South. . . . . . . . . . . . . . . . . . . . . . . . . . . . . . . . 1.3Contel of the South, Inc. d/b/a Verizon Mid-States, Inc. . . . . . . . . . . . . . . . . . . . . . . . . . . . . . . . . 1.2, 1.3, 2.1, 2.10Convergent Communications Services, Inc. . . . . . . . . . . . . . . . . . . . . . . . . . . . . . . . . . . . . . . . . . 3.4, 3.6Conversent Communications, LLC. . . . . . . . . . . . . . . . . . . . . . . . . . . . . . . . . . . . . . . . . 3.4, 3.6Corecomm Newco, Inc. . . . . . . . . . . . . . . . . . . . . . . . . . . . . . . . . . . . . . . . . . . . . . . . . 3.4, 3.6Covista Communications. . . . . . . . . . . . . . . . . . . . . . . . . . . . . . . . . . . . . . . . . . . . . . . . 1.2 - 1.4, 2.1, 3.4, 3.6Cox Communications, Inc. . . . . . . . . . . . . . . . . . . . . . . . . . . . . . . . . . . . . . . . . . . . . . . . . 3.4, 3.6C-R Long Distance. . . . . . . . . . . . . . . . . . . . . . . . . . . . . . . . . . . . . . . . . . . . . . . . . . . . . . . . . 3.4, 3.6Crosslink Long Distance Company. . . . . . . . . . . . . . . . . . . . . . . . . . . . . . . . . . . . . . . . . . . . . . . . . . 3.4, 3.6CruisePhone Inc. . . . . . . . . . . . . . . . . . . . . . . . . . . . . . . . . . . . . . . . . . . . . . . . . . . . . . . . . . 3.4, 3.6Crystal Communications, Inc. . . . . . . . . . . . . . . . . . . . . . . . . . . . . . . . . . . . . . . . . . . . . . . . . . . . 3.4, 3.6CT Communications, Inc. . . . . . . . . . . . . . . . . . . . . . . . . . . . . . . . . . . . . . . . . . . . . . . . . . . 3.4, 3.6CTC Communications, Corp. . . . . . . . . . . . . . . . . . . . . . . . . . . . . . . . . . . . . . . . . . . . . 3.4, 3.6CTC Long Distance Services, Inc. . . . . . . . . . . . . . . . . . . . . . . . . . . . . . . . . . . . . . . . 3.4, 3.6
D & E Tel. and Data Systems, Inc. d/b/a D and E Long Distance. . . . . . . . . . . . . . . . . . . . . . . . . . . . . . . . . . . . . . 3.4, 3.6D & E/Omnipoint Wireless Joint Venture, L.P. d/b/a PCS One. . . . . . . . . . . . . . . . . . . . . . . . . . . . . . . . . . . . . . 3.4, 3.6D&P Long Distance. . . . . . . . . . . . . . . . . . . . . . . . . . . . . . . . . . . . . . . . . . . . . . . . . . 3.4, 3.6Dakota Telecommunications Group (DTG). . . . . . . . . . . . . . . . . . . . . . . . . . . . . . . . . . . . . . . . . . . . 3.4, 3.6Dallas Teleport. . . . . . . . . . . . . . . . . . . . . . . . . . . . . . . . . . . . . . . . . . . . . . . . . . . . 3.4D.D.D. Calling, Inc. . . . . . . . . . . . . . . . . . . . . . . . . . . . . . . . . . . . . . . . . . . . . . . . . 3.4, 3.6Deerfield Farmers' Telephone Co. . . . . . . . . . . . . . . . . . . . . . . . . . . . . . . . . . . . . . . . . . . 3.4, 3.6Destia Communications Services, Inc. . . . . . . . . . . . . . . . . . . . . . . . . . . . . . . . . . . . . . . . . 3.4, 3.6Dialink Corporation. . . . . . . . . . . . . . . . . . . . . . . . . . . . . . . . . . . . . . . . . . . . . . . . . . . . . 3.4, 3.6Direct Communications Long Distance. . . . . . . . . . . . . . . . . . . . . . . . . . . . . . . . . . . . . . . . . . . . . 3.4, 3.6DirectLink of Oregon. . . . . . . . . . . . . . . . . . . . . . . . . . . . . . . . . . . . . . . . . . . . . . . . . . . . 3.4, 3.6DirectNet Telecommunications. . . . . . . . . . . . . . . . . . . . . . . . . . . . . . . . . . . . . . . . . . . . . . . . . 3.4 - 3.6, 3.10Diversified Solutions, Inc. . . . . . . . . . . . . . . . . . . . . . . . . . . . . . . . . . . . . . . . . . . . . . . . . . . . 3.4, 3.6
East Florida Communications, Inc. . . . . . . . . . . . . . . . . . . . . . . . . . . . . . . . . . . . . . . . . . . . . . . 3.4, 3.6Eastern Sub-RSA L.P. . . . . . . . . . . . . . . . . . . . . . . . . . . . . . . . . . . . . . . . . . . . . . . . . . . . . . . 3.4, 3.6Eastern Tel Long Distance Service, Inc. . . . . . . . . . . . . . . . . . . . . . . . . . . . . . . . . . . . . . . . . . . . . . 3.4, 3.6Eastern Telecom Services, Inc. . . . . . . . . . . . . . . . . . . . . . . . . . . . . . . . . . . . . . . . . . . . . . . . . . . . . . . . 3.4, 3.6Eastern Telephone Systems, Inc. . . . . . . . . . . . . . . . . . . . . . . . . . . . . . . . . . . . . . . . . . . . . . . . . 3.4Eclipse Telecommunications, Inc. . . . . . . . . . . . . . . . . . . . . . . . . . . . . . . . . . . . . . . . . . . . . . . . 3.4, 3.6eGlobe, Inc. . . . . . . . . . . . . . . . . . . . . . . . . . . . . . . . . . . . . . . . . . . . . . . . . . . . . . . . . 3.4, 3.6Egyptian Communication Services, Inc. . . . . . . . . . . . . . . . . . . . . . . . . . . . . . . . . . . . 3.4, 3.6El Paso Long Distance Company. . . . . . . . . . . . . . . . . . . . . . . . . . . . . . . . . . . . . . . . . . . . 3.4, 3.6Elephant Talk, Inc. . . . . . . . . . . . . . . . . . . . . . . . . . . . . . . . . . . . . . . . . . . . . . . . . . . . . . . . . 3.4, 3.6eMeritus Communications, Inc. . . . . . . . . . . . . . . . . . . . . . . . . . . . . . . . . . . . . . . . . . . . . . . 1.2 - 1.4, 2.1Emery Telephone. . . . . . . . . . . . . . . . . . . . . . . . . . . . . . . . . . . . . . . . . . . . . . . . . . . . . . . . 3.4, 3.6Emery Telcom Long Distance. . . . . . . . . . . . . . . . . . . . . . . . . . . . . . . . . . . . . . . . . . . . . . . . . . 3.4, 3.6Empire One Telecommunications, Inc. . . . . . . . . . . . . . . . . . . . . . . . . . . . . . . . . . . . . . 3.4, 3.6Energis (Switzerland) AG. . . . . . . . . . . . . . . . . . . . . . . . . . . . . . . . . . . . . . . . . . . . . . . . . . . 3.4, 3.5EqualNet Corporation. . . . . . . . . . . . . . . . . . . . . . . . . . . . . . . . . . . . . . . . . . . . . . . . . 3.4, 3.6Eschelon Telecom, Inc. . . . . . . . . . . . . . . . . . . . . . . . . . . . . . . . . . . . . . . . . . . . . . . . 3.4, 3.6Espirit Telecom (U.K.), Ltd. . . . . . . . . . . . . . . . . . . . . . . . . . . . . . . . . . . . . . . . . . . . 3.10Excel Communications, Inc. . . . . . . . . . . . . . . . . . . . . . . . . . . . . . . . . . . . . . . . . . . . . 1.4Excel Telecommunications, Inc. . . . . . . . . . . . . . . . . . . . . . . . . . . . . . . . . . . . . . . . . . . . . 1.2, 1.4, 2.1, 3.4, 3.6eVentures Group, Inc. . . . . . . . . . . . . . . . . . . . . . . . . . . . . . . . . . . . . . . . . . . . . . . . . . . . . . . . . 3.4, 3.6eVolve Technology Group, Inc. . . . . . . . . . . . . . . . . . . . . . . . . . . . . . . . . . . . . . . . . . . . . . . . . . . . . 3.4, 3.6Executive TeleCard, Ltd. . . . . . . . . . . . . . . . . . . . . . . . . . . . . . . . . . . . . . . . . . . . . . . . . . . . . . . 3.4
255
Statistics of Communications Common Carriers
General Index2. By Company -- Continued
Name of Company Table
Express Communications, Inc. . . . . . . . . . . . . . . . . . . . . . . . . . . . . . . . . . . . . . . . . . . . . . . . . . . . . . . 3.4, 3.6
FaciliCom International, L.L.C. . . . . . . . . . . . . . . . . . . . . . . . . . . . . . . . . . . . . . . . . . . . 1.2 - 1.4, 2.1, 3.4 - 3.6, 3.10FairPoint Communications Solutions Corp. . . . . . . . . . . . . . . . . . . . . . . . . . . . . . . . . . . . . . . . . . . . . . . . . 3.4, 3.6Far East Gateway, Inc. . . . . . . . . . . . . . . . . . . . . . . . . . . . . . . . . . . . . . . . . . . . . . . . . . . . . . 3.4 - 3.6Fax Net Corporation. . . . . . . . . . . . . . . . . . . . . . . . . . . . . . . . . . . . . . . . . . . . . . . . . . . . . 3.4, 3.6Federal TransTel, Inc. . . . . . . . . . . . . . . . . . . . . . . . . . . . . . . . . . . . . . . . . . . . . . . . . . . 3.4, 3.6Fedex International Transmission Corp. . . . . . . . . . . . . . . . . . . . . . . . . . . . . . . 3.4, 3.5Fiber Four Corporation. . . . . . . . . . . . . . . . . . . . . . . . . . . . . . . . . . . . . . . . . . . . . . . . . . . 3.4, 3.6Fidelity Long Distance. . . . . . . . . . . . . . . . . . . . . . . . . . . . . . . . . . . . . . . . . . . . . . . . . . . 3.4, 3.6FirsTel, Inc. . . . . . . . . . . . . . . . . . . . . . . . . . . . . . . . . . . . . . . . . . . . . . . . . . . . . . . . . . . . . . . . 3.4FirstWorld Communications, Inc. . . . . . . . . . . . . . . . . . . . . . . . . . . . . . . . . . . . . . . . . 3.4, 3.6Five Area Long Distance, Inc. . . . . . . . . . . . . . . . . . . . . . . . . . . . . . . . . . . . . . . . . . . . . 3.4, 3.6Flat Rate Communications, Inc. . . . . . . . . . . . . . . . . . . . . . . . . . . . . . . . . . . . . . . . . . . . . 3.4Flat Rock Communications, Inc. . . . . . . . . . . . . . . . . . . . . . . . . . . . . . . . . . . . . . . . . . . . . 3.4, 3.6Focal Communications Corporation. . . . . . . . . . . . . . . . . . . . . . . . . . . . . . . . . . . . . . . . . . 3.4, 3.6fONOROLA Corporation. . . . . . . . . . . . . . . . . . . . . . . . . . . . . . . . . . . . . . . . . . . . . . . . . . . . . . . . . . . 3.10Fort Bend Long Distance Company. . . . . . . . . . . . . . . . . . . . . . . . . . . . . . . . . . . . . 3.4, 3.6FoxTel, Inc. . . . . . . . . . . . . . . . . . . . . . . . . . . . . . . . . . . . . . . . . . . . . . . . . . . . . . . . . . . . . . . 3.4, 3.6Frontier Communications International, Inc. . . . . . . . . . . . . . . . . . . . . . . . . . . . . . . . . . . . . . . . . . . . . . . . 3.4Frontier Communications - North Central Region. . . . . . . . . . . . . . . . . . . . . . . . . . . . . . . . . . . . . . . . . . . . . . 1.4Frontier Communications of the West, Inc. . . . . . . . . . . . . . . . . . . . . . . . . . . . . . . . . . . . . . . . . . . . . . . . . 3.4Frontier Corporation. . . . . . . . . . . . . . . . . . . . . . . . . . . . . . . . . . . . . . . . . . . . . . . . . . . . . . . . . . . . . . 1.2, 3.4, 3.6Frontier Long Distance of America, Inc. . . . . . . . . . . . . . . . . . . . . . . . . . . . . . . . . . . . . . . . . . 3.4, 3.6Frontier Telemanagement, Inc. . . . . . . . . . . . . . . . . . . . . . . . . . . . . . . . . . . . . . . . . . . 3.4Frontier Telephone of Rochester, Inc. . . . . . . . . . . . . . . . . . . . . . . . . . . . . . . . . . . . . 1.2, 2.1, 2.11FTC Communications/dba Farmers Long Distance. . . . . . . . . . . . . . . . . . . . . . . . . . . . . . . . . . . . . . . . 3.4, 3.6
Gabriel Communications, Inc. . . . . . . . . . . . . . . . . . . . . . . . . . . . . . . . . . . . . . . . . . . . . . . 3.4, 3.6GE American Communications, Inc. (GE Americom). . . . . . . . . . . . . . . . . . . . . . . . . . . . . . 3.4, 3.5GE Capital Communication Services Corporation. . . . . . . . . . . . . . . . . . . . . . . . . . . . . . . . . . . . . . . . . . . 3.4, 3.6General Communications, Inc. (GCI). . . . . . . . . . . . . . . . . . . . . . . . . . . . . . . . . . . . . . . . . . . . . . . . . . . . . . 1.2, 1.4, 2.1Genuity Telecom. . . . . . . . . . . . . . . . . . . . . . . . . . . . . . . . . . . . . . . . . . . . . . . . . . . . 3.4Geocomm Corporation. . . . . . . . . . . . . . . . . . . . . . . . . . . . . . . . . . . . . . . . . . . . . . . . . . . . . 3.4, 3.5Germantown Long Distance. . . . . . . . . . . . . . . . . . . . . . . . . . . . . . . . . . . . . . . . . . . . . . . . . . 3.4, 3.6Gervais Telephone Co. d/b/a DataVision Commun. . . . . . . . . . . . . . . . . . . . . . . . . . . . . . . . . . . . . . . 3.4, 3.6Glasford Telephone Company. . . . . . . . . . . . . . . . . . . . . . . . . . . . . . . . . . . . . . . . . . . . . . . . . 3.4, 3.6Glenwood Long Distance. . . . . . . . . . . . . . . . . . . . . . . . . . . . . . . . . . . . . . . . . . . . 3.4, 3.6Glenwood Telecommunications, Inc. . . . . . . . . . . . . . . . . . . . . . . . . . . . . . . . . . . . . . . . . . . . . 3.4, 3.6Global Crossing Bandwith Inc. . . . . . . . . . . . . . . . . . . . . . . . . . . . . . . . . . . 1.2, - 1.4, 2.1Global Crossing Ltd. . . . . . . . . . . . . . . . . . . . . . . . . . . . . . . . . . . . . . . . . . . 1.1, 1.2, 1.4, 2.1Global Crossing North American Networks, Inc. . . . . . . . . . . . . . . . . . . . . . . . . . . 1.2 - 1.4, 2.1Global Crossing Telecommunications, Inc. . . . . . . . . . . . . . . . . . . . . . . . . . . . . . . . 1.2, 1.4, 2.1, 3.4, 3.6Global Crossing Telemanageament, Inc. . . . . . . . . . . . . . . . . . . . . . . . . . . . . . . . 3.4Global Telephone Corporation. . . . . . . . . . . . . . . . . . . . . . . . . . . . . . . . . . . . . . . . . . 3.4, 3.6Globalcom, Inc. . . . . . . . . . . . . . . . . . . . . . . . . . . . . . . . . . . . . . . . . . . . . . . . . . . 3.4, 3.6Glyphics Communications, Inc. . . . . . . . . . . . . . . . . . . . . . . . . . . . . . . . . . . . . . . . . . . . . . . . . . . 3.4, 3.6Golden Pages (Jersey) Ltd. . . . . . . . . . . . . . . . . . . . . . . . . . . . . . . . . . . . . . . . . . . 3.10Grafton Communications. . . . . . . . . . . . . . . . . . . . . . . . . . . . . . . . . . . . . . . . . . . . . . . . 3.4, 3.6Grafton Long Distance Company. . . . . . . . . . . . . . . . . . . . . . . . . . . . . . . . . . . . . . . . . . 3.4, 3.6Grand River Communications, Inc. . . . . . . . . . . . . . . . . . . . . . . . . . . . . . . . . . . . . . . . . 3.4, 3.6Grande River Communications, Inc. d/b/a Valley Telephone Long Distance. . . . . . . . . . . . . . . . . . . . . . . . . . . . . 3.4, 3.6Granite State Long Distance, Inc. . . . . . . . . . . . . . . . . . . . . . . . . . . . . . . . . . . . . . . . 3.4, 3.6Great Lakes Comnet 1. . . . . . . . . . . . . . . . . . . . . . . . . . . . . . . . . . . . . . . . . . . . . . . 3.4, 3.6Great West Services, Ltd. . . . . . . . . . . . . . . . . . . . . . . . . . . . . . . . . . . . . . . . . . . . . . . . 3.4, 3.6Green Mountain Long Distance Service . . . . . . . . . . . . . . . . . . . . . . . . . . . . . . . . . . . . . . . . . . 3.4, 3.6Gridley Communications, Inc. . . . . . . . . . . . . . . . . . . . . . . . . . . . . . . . . . . . . . . . . . 3.4, 3.6Group Long Distance, Inc. . . . . . . . . . . . . . . . . . . . . . . . . . . . . . . . . . . . . . . . . . . . . . 3.4GST Action Telecom . . . . . . . . . . . . . . . . . . . . . . . . . . . . . . . . . . . . . . . . . . . . . . . 3.4GST Call America, Inc. . . . . . . . . . . . . . . . . . . . . . . . . . . . . . . . . . . . . . . . . . . . . 3.4GST Net, Inc. . . . . . . . . . . . . . . . . . . . . . . . . . . . . . . . . . . . . . . . . . . . . . . . 3.4GST Telecom, Inc. . . . . . . . . . . . . . . . . . . . . . . . . . . . . . . . . . . . . . . . . . . . . . . . 3.4GST USA, Inc. . . . . . . . . . . . . . . . . . . . . . . . . . . . . . . . . . . . . . . . . . . . . . . . . . 3.4, 3.6GTC Telecom Corporation. . . . . . . . . . . . . . . . . . . . . . . . . . . . . . . . . . . . . . . . . . . . . . . . . . . . . . . . . . 3.4, 3.6GTE Airfone Incorporated. . . . . . . . . . . . . . . . . . . . . . . . . . . . . . . . . . . . . . . . . . . . . . . . . . 3.4, 3.6GTE California, Inc. . . . . . . . . . . . . . . . . . . . . . . . . . . . . . . . . . . . . . . . . . . . . . . . . . . . . . . . . 1.3
256
Statistics of Communications Common Carriers
General Index2. By Company -- Continued
Name of Company Table
GTE Communications Corporation. . . . . . . . . . . . . . . . . . . . . . . . . . . . . . . . . . . . . . . . . . . . . . . . . . . . 1.3, 2.1, 3.4, 3.6GTE Corporation. . . . . . . . . . . . . . . . . . . . . . . . . . . . . . . . . . . . . . . . . . . . . . . . . . . . . . . . . . . . . 1.3, 3.4 - 3.6, 3.10GTE Florida Inc. . . . . . . . . . . . . . . . . . . . . . . . . . . . . . . . . . . . . . . . . . . . . . . . . . . . . . . . . . . . . . . 1.3GTE Hawaiian Telephone Company, Inc. . . . . . . . . . . . . . . . . . . . . . . . . . . . . . . . . . . . . . . . 1.3, 3.4GTE Holdings (Puerto Rico) LLC . . . . . . . . . . . . . . . . . . . . . . . . . . . . . . . . . . . . . . . . . . . . . . . . . . . . . . . . . . . 1.2GTE Midwest, Inc. . . . . . . . . . . . . . . . . . . . . . . . . . . . . . . . . . . . . . . . . . . . . . . . . . . . . . . . . . . . 1.3GTE Midwest, Inc. dba Verizon Midwest, Inc. . . . . . . . . . . . . . . . . . . . . . . . . . . . . . . . . . . . . . . . . . . . . . . . . . . . . . . . . . . 1.2, 1.3, 2.1, 2.10GTE Northwest, Inc. . . . . . . . . . . . . . . . . . . . . . . . . . . . . . . . . . . . . . . . . . . . . . . . . . . . . . . . . . . . . 1.3GTE North, Inc. . . . . . . . . . . . . . . . . . . . . . . . . . . . . . . . . . . . . . . . . . . . . . . . . . . . . . . . . . . . . . . . . 1.3GTE Pacifica. . . . . . . . . . . . . . . . . . . . . . . . . . . . . . . . . . . . . . . . . . . . . . . . . . . . . . . . . . . . . . . 3.4, 3.6GTE Railfone, Inc. . . . . . . . . . . . . . . . . . . . . . . . . . . . . . . . . . . . . . . . . . . . . . . . . . . . . . . . . 3.4, 3.6GTE Southwest, Inc. d/b/a Verizon Southwest. . . . . . . . . . . . . . . . . . . . . . . . . . . . . . . . . . . . . . . . . . . . . . . . . . . . . . . . . . 1.3GTE South, Inc. . . . . . . . . . . . . . . . . . . . . . . . . . . . . . . . . . . . . . . . . . . . . . . . . . . . . . . . . . . 1.3GTE Sprint. . . . . . . . . . . . . . . . . . . . . . . . . . . . . . . . . . . . . . . . . . . . . . . . . . . . . . . . . . . . . . . . . . . . . . . 1.4GTE Telecom, Inc. . . . . . . . . . . . . . . . . . . . . . . . . . . . . . . . . . . . . . . . . . . . . . . . . . . . . . . . . . . 3.4, 3.6GTE Wireless, Inc. . . . . . . . . . . . . . . . . . . . . . . . . . . . . . . . . . . . . . . . . . . . . . . . . . . . . . . . . . . 3.4, 3.6
Hamilton County Long Distance Company. . . . . . . . . . . . . . . . . . . . . . . . . . . . . . . . . . . . . . . 3.4, 3.6Hamilton Telecommunications. . . . . . . . . . . . . . . . . . . . . . . . . . . . . . . . . . . . . . . 3.4, 3.6Harris Corporation. . . . . . . . . . . . . . . . . . . . . . . . . . . . . . . . . . . . . . . . . . . . . . . . . . . . . . 3.4, 3.5, 3.10Harrisonville Telephone Company. . . . . . . . . . . . . . . . . . . . . . . . . . . . . . . . 3.4, 3.6Heart of Iowa Communications . . . . . . . . . . . . . . . . . . . . . . . . . . . . . . . . . . . . . . . . . . . . . . . . 3.4, 3.6Hereford Long Distance Services, Inc. . . . . . . . . . . . . . . . . . . . . . . . . . . . . . . . . . . . 3.4, 3.6Heritage Communications Corporation. . . . . . . . . . . . . . . . . . . . . . . . . . . . . . . . . . . . 3.4, 3.6Hertz Technologies Inc. . . . . . . . . . . . . . . . . . . . . . . . . . . . . . . . . . . . . . . . . . . . . . . . . . . . . 3.4, 3.6Highland Communications Corporation. . . . . . . . . . . . . . . . . . . . . . . . . . . . . . . . . . . . . . . . . . . . 3.4, 3.6Home Long Distance, Inc. . . . . . . . . . . . . . . . . . . . . . . . . . . . . . . . . . . . . . . . . . . . . . . . . . 3.4, 3.6Home TeleNetworks, Inc. . . . . . . . . . . . . . . . . . . . . . . . . . . . . . . . . . . . . . . . . . . . . . . . . . 3.4, 3.6Home Telephone Company. . . . . . . . . . . . . . . . . . . . . . . . . . . . . . . . . . . . . . . . . . . . . . . . . 3.4, 3.6Horry Telephone Long Distance, Inc. . . . . . . . . . . . . . . . . . . . . . . . . . . . . . . . . . . . . . . . . . 3.4, 3.6Hotel Connect Management, Inc. . . . . . . . . . . . . . . . . . . . . . . . . . . . . . . . . . . . . . . . . . . . . . 3.4, 3.6Hyperion Communications Int'l., L.L.C. . . . . . . . . . . . . . . . . . . . . . . . . . . . . . . . . . . . 3.4Hyperion Susquehanna Telecommunications. . . . . . . . . . . . . . . . . . . . . . . . . . . . . . . . . . . 3.4, 3.6
ICG Communications, Inc./Maritime Telecommunications. . . . . . . . . . . . . . . . . . . . . . . . . . . . . . . . . . . . . . . . . . . . . . . . . . . . . . . . . . . . . . 3.4ICG Satellite Services. . . . . . . . . . . . . . . . . . . . . . . . . . . . . . . . . . . . . . . . . . . . . . . . . . . . . . . . . . . . . . 3.4IDT Corporation. . . . . . . . . . . . . . . . . . . . . . . . . . . . . . . . . . . . . . . . . . . . . . . . . . . . . . . . . . . . . . . . . . . 1.2, 1.4, 2.1, 3.4, 3.5, 3.10Illinois Bell Telephone Co. d/b/a Ameritech Illinois. . . . . . . . . . . . . . . . . . . . . . . . . . . . . . . . . . . . . . . . . . . . . . . 1.2, 2.1, 2.10IMPSAT USA, Inc. . . . . . . . . . . . . . . . . . . . . . . . . . . . . . . . . . . . . . . . . . . . . . . . . . . . . . . . . . . . 3.4, 3.5Indiana Bell Telephone Co., Inc. d/b/a Ameritech Indiana. . . . . . . . . . . . . . . . . . . . . . . . . . . . . . . . . . . . . . . . . 1.2, 2.1, 2.10Indiana Fones, Inc. . . . . . . . . . . . . . . . . . . . . . . . . . . . . . . . . . . . . . . . . . . . . . . . . . . . 3.4, 3.6Infonet Broadband Services Corporation. . . . . . . . . . . . . . . . . . . . . . . . . . . . . . . . . . . . . . . . . . . . . . . . . . . . . . . 3.4Innovative Telecom Corporation. . . . . . . . . . . . . . . . . . . . . . . . . . . . . . . . . . . . . . . . . . . . . . . . . 3.4, 3.6Integra Telecom Holdings, Inc. . . . . . . . . . . . . . . . . . . . . . . . . . . . . . . . . . . . . . . . . . . . . . . 3.4, 3.6Integra Telecom of Oregon. . . . . . . . . . . . . . . . . . . . . . . . . . . . . . . . . . . . . . . . . . . . . . 3.4Intellicall Operator Services, Inc. d/b/a ILD. . . . . . . . . . . . . . . . . . . . . . . . . . . . . . . . . . . . 3.4, 3.6Intermedia Communications, Inc. . . . . . . . . . . . . . . . . . . . . . . . . . . . . . . . . . . . . . . . . . . . 1.2, 1.4, 2.1, 3.4, 3.6International Exchange Networks, Ltd. (IXnet) . . . . . . . . . . . . . . . . . . . . . . . . . . . . . . . . . . . . 1.2 - 1.4, 3.4 - 3.6International Talk.com. . . . . . . . . . . . . . . . . . . . . . . . . . . . . . . . . . . . . . . . . . . . . . . . . . . . . . . . . . 3.4, 3.6International Telcom Ltd. . . . . . . . . . . . . . . . . . . . . . . . . . . . . . . . . . . . . . . . . . . . . . . . . . . . . . . . . . 3.4, 3.6International Telecommunications Corp. . . . . . . . . . . . . . . . . . . . . . . . . . . . . . . . . . . . . . . . . . . . . . . . . . . . 3.10Interoute Telecommunications, Inc. . . . . . . . . . . . . . . . . . . . . . . . . . . . . . . . . . . . . . . . . . . . . . . . . . . . . . . . . . . . . . . 3.4, 3.6Interpath Communications, Inc. . . . . . . . . . . . . . . . . . . . . . . . . . . . . . . . . . . . . . . . . . . . . . . . . . . . . . . . . . . . . . . 3.4, 3.6Interstate Fibernet, Inc. . . . . . . . . . . . . . . . . . . . . . . . . . . . . . . . . . . . . . . . . . . . . . . . . . . . . . . . . . . . . . . 3.4, 3.6Intetech, L.C. . . . . . . . . . . . . . . . . . . . . . . . . . . . . . . . . . . . . . . . . . . . . . . . . . . . . . . . . . . . . . . . . . . . 3.4, 3.6Ionex Communications, Inc. . . . . . . . . . . . . . . . . . . . . . . . . . . . . . . . . . . . . . . . . . . . . . . . . . . . . . . . . 3.4Ionex Communications North, Inc. . . . . . . . . . . . . . . . . . . . . . . . . . . . . . . . . . . . . . . . . . . . . . . . . . . . . . . . . 3.4Ionex Communications South, Inc. . . . . . . . . . . . . . . . . . . . . . . . . . . . . . . . . . . . . . . . . . . . . . . . . . . . . . . . . 3.4Ionex Telecommunications, Inc. . . . . . . . . . . . . . . . . . . . . . . . . . . . . . . . . . . . . . . . . . . . . . . . . . . . . . . . . 3.4, 3.6Iowa Network Services, Inc. (INS). . . . . . . . . . . . . . . . . . . . . . . . . . . . . . . . . . . . . . . . . . . . 3.4, 3.6Iridium North America. . . . . . . . . . . . . . . . . . . . . . . . . . . . . . . . . . . . . . . . . . . . . . . . . . . . . . . . . . . . . . . . 3.4, 3.5Ironton Long Distance Company. . . . . . . . . . . . . . . . . . . . . . . . . . . . . . . . . . . . . . . . . . . . . . . . . . .3.4, 3.6IT&E Overseas, Inc. . . . . . . . . . . . . . . . . . . . . . . . . . . . . . . . . . . . . . . . . . . . . . . . . . . . . . . 3.4, 3.5, 3.10ITC d/b/a NEXTLINK Affinity. . . . . . . . . . . . . . . . . . . . . . . . . . . . . . . . . . . . . . . . . . . . . . . . . 3.4ITC Holding Company, Inc. . . . . . . . . . . . . . . . . . . . . . . . . . . . . . . . . . . . . . . . . . . . . . . . . . 3.4, 3.6ITC^DeltaCom Communications, Inc. . . . . . . . . . . . . . . . . . . . . . . . . . . . . . . . . . . . . . . . . . . . . . . . . . . . . . . . . 1.2, 1.4, 2.1, 3.4, 3.6ITT Communication Services, Inc. . . . . . . . . . . . . . . . . . . . . . . . . . . . . . . . . . . . . . . . . . . . . . . . . 1.4
257
Statistics of Communications Common Carriers
General Index2. By Company -- Continued
Name of Company Table
IXC Communications Services, Inc. . . . . . . . . . . . . . . . . . . . . . . . . . . . . . . . . . . . . . . . . . . . . . . . 3.4IXC Long Distance, Inc. . . . . . . . . . . . . . . . . . . . . . . . . . . . . . . . . . . . . . . . . . . . . . . . 3.4
Japan Telecom America, Inc. . . . . . . . . . . . . . . . . . . . . . . . . . . . . . . . . . . . . . . . . . . . . . 3.4, 3.5, 3.10
Kal Telco. . . . . . . . . . . . . . . . . . . . . . . . . . . . . . . . . . . . . . . . . . . . . . . . . . . . . . 3.4, 3.6KDD America, Inc. . . . . . . . . . . . . . . . . . . . . . . . . . . . . . . . . . . . . . . . . . . . . . . . . . 3.4, 3.5, 3.10KerTel Communications, Inc. . . . . . . . . . . . . . . . . . . . . . . . . . . . . . . . . . . . . . . . . . . . . . . . . . . . 3.4, 3.6KeyArt Comm., Inc. . . . . . . . . . . . . . . . . . . . . . . . . . . . . . . . . . . . . . . . . . . . . . . . . . . . 3.4, 3.6KIN Networks, Inc. . . . . . . . . . . . . . . . . . . . . . . . . . . . . . . . . . . . . . . . . . . . . . . . . . . . 3.4, 3.6King Salmon Communications d/b/a Bristol Bay LD. . . . . . . . . . . . . . . . . . . . . . . . . . . . . . . . . . . 3.4, 3.6Kingdom Long Distance. . . . . . . . . . . . . . . . . . . . . . . . . . . . . . . . . . . . . . . . . . . . . . . . . 3.4, 3.6Kingdom Telephone Co. . . . . . . . . . . . . . . . . . . . . . . . . . . . . . . . . . . . . . . . . . . . . . . . . 3.4, 3.6KNOLOGY, Inc. . . . . . . . . . . . . . . . . . . . . . . . . . . . . . . . . . . . . . . . . . . . . . . . . . 3.4, 3.6KPN-INS, Inc. . . . . . . . . . . . . . . . . . . . . . . . . . . . . . . . . . . . . . . . . . . . . . . . . . . 3.4, 3.5, 3.10
L-R Communications, Inc. . . . . . . . . . . . . . . . . . . . . . . . . . . . . . . . . . . . . . . . . . . . . . . . . . 3.4, 3.6Lackawaxen Long Distance Company. . . . . . . . . . . . . . . . . . . . . . . . . . . . . . . . . . . . . . 3.4, 3.6LaHarpe Networks Company, Inc. . . . . . . . . . . . . . . . . . . . . . . . . . . . . . . . . . . . . . . 3.4, 3.6Lakefield Communications, Inc. . . . . . . . . . . . . . . . . . . . . . . . . . . . . . . . . . . . . . . . . 3.4, 3.6LaValle Long Distance. . . . . . . . . . . . . . . . . . . . . . . . . . . . . . . . . . . . . . . . . . . . . . . . . . . . 3.4, 3.6LC Communications - International Telecom, Inc. . . . . . . . . . . . . . . . . . . . . . . . . . . . . . . . . . . . . . . . . . . . . . . . . . . 3.4 - 3.6, 3.10LCI International Telecom Corp. d/b/a Qwest Comm Svcs. . . . . . . . . . . . . . . . . . . . . . . . . . 1.2, 1.4, 2.1, 3.4, 3.6LD Exchange.com . . . . . . . . . . . . . . . . . . . . . . . . . . . . . . . . . . . . . . . . . . . . . . . . . . . . . . . . . . 3.4, 3.6LDDS Communications, Inc. d/b/a LDDS WorldCom. . . . . . . . . . . . . . . . . . . . . . . . . . . . . . . . . . . . . . . . . . . . . . . . . . . . 1.4Legacy Long Distance International. . . . . . . . . . . . . . . . . . . . . . . . . . . . . . . . . . . . . . . . . . 3.4, 3.6Level 3 Communications, LLC. . . . . . . . . . . . . . . . . . . . . . . . . . . . . . . . . . . . . . . . . 3.4, 3.5LEXCOM Long Distance, Inc. . . . . . . . . . . . . . . . . . . . . . . . . . . . . . . . . . . . . . . . . . . . . . . . . . . . . . . . . 3.4, 3.6Lexitel. . . . . . . . . . . . . . . . . . . . . . . . . . . . . . . . . . . . . . . . . . . . . . . . . . . . . . . . . . . . . . . . . . . . 1.4Liberty Media Group. . . . . . . . . . . . . . . . . . . . . . . . . . . . . . . . . . . . . . . . . . . . . . . . . . . . . . . . . . . . . 1.1Lightyear Communications Inc. . . . . . . . . . . . . . . . . . . . . . . . . . . . . . . . . . . . . . . . . . . . . . . . 1.2 - 1.4, 2.1, 3.4, 3.6Local Communications Network, Inc. . . . . . . . . . . . . . . . . . . . . . . . . . . . . . . . . . . . . . . . . . . . . . . . . . . . 3.4, 3.5Local Long Distance, LC. . . . . . . . . . . . . . . . . . . . . . . . . . . . . . . . . . . . . . . . . . . . . . . . . . 3.4, 3.6Logix Communications Corporation. . . . . . . . . . . . . . . . . . . . . . . . . . . . . . . . . . . . . . . . . . . . . . 3.4, 3.6Long Distance Wholesale Club, Inc. . . . . . . . . . . . . . . . . . . . . . . . . . . . . . . . . . . . . . . . . . . . . 1.3, 1.4, 3.4, 3.6Low Country Carriers, Inc. d/b/a Hargray Long Distance Co. . . . . . . . . . . . . . . . . . . . . . . . . 3.4, 3.6
Madge.web International (C.I.) Limited. . . . . . . . . . . . . . . . . . . . . . . . . . . . . . . . . . . . . . . . 3.4, 3.5Madison Network Systems, Inc. . . . . . . . . . . . . . . . . . . . . . . . . . . . . . . . . . . . . . . . . 3.4, 3.6Maritime Telecommunications Network. . . . . . . . . . . . . . . . . . . . . . . . . . . . . . . . . . . 3.4Mark Twain Long Distance, Inc. . . . . . . . . . . . . . . . . . . . . . . . . . . . . . . . . . . . . . . . . . . . . . . . . . . . . . . 3.4, 3.6Mark Twain Rural Telephone Co. . . . . . . . . . . . . . . . . . . . . . . . . . . . . . . . . . . . . . . . . . . . . . . . . . . . . . . 3.4, 3.6Marquette-Adams Telephone Coop. Inc. . . . . . . . . . . . . . . . . . . . . . . . . . . . . . . . . . . . . . 3.4, 3.6Martell Telecommunications d/b/a Tri-States LD. . . . . . . . . . . . . . . . . . . . . . . . . . . . . . . . . 3.4, 3.6Masatepe Communications, U.S.A., L.L.C. . . . . . . . . . . . . . . . . . . . . . . . . . . . . . . . . . . . . . . . . . . . . . . . . . . . 3.4, 3.5, 3.10Matrix Telecom, Inc. . . . . . . . . . . . . . . . . . . . . . . . . . . . . . . . . . . . . . . . . . . . . . . . . . . . . . . . . . . . . . . . . 3.4, 3.6MCC Communications, Inc. . . . . . . . . . . . . . . . . . . . . . . . . . . . . . . . . . . . . . . . . . . . . . . . . . . . . . . . . . . . . . . . . 3.10McCormack Missouri Long Distance. . . . . . . . . . . . . . . . . . . . . . . . . . . . . . . . . . . . . . . . . . . . . . . . . . . . . . . . . . . 3.4, 3.6McDonald County Long Distance. . . . . . . . . . . . . . . . . . . . . . . . . . . . . . . . . . . . . . . . . . . . . . . . . . . . . . . . . . . 3.4, 3.6MCI Telecommunications Corp. . . . . . . . . . . . . . . . . . . . . . . . . . . . . . . . . . . . . . . . . . . . . . . 1.4, 4.12MCI WorldCom, Inc. . . . . . . . . . . . . . . . . . . . . . . . . . . . . . . . . . . . . . . . . . . . . . . . . . . . . . . . 1.3, 3.4 - 3.6, 3.8, 3.10McLeod USA Telecommunications Services, Inc. . . . . . . . . . . . . . . . . . . . . . . . . . . . . . . . . . . 1.2 - 1.4, 2.1, 3.4, 3.6McLeod USA, Inc. . . . . . . . . . . . . . . . . . . . . . . . . . . . . . . . . . . . . . . . . . . . . . . . . . . . . . . . . . . . . . . . 1.1 - 1.4, 3.4, 3.6McNabb Long Distance, Inc. . . . . . . . . . . . . . . . . . . . . . . . . . . . . . . . . . . . . . . . . . . . . . . 3.4, 3.6MediaTel Corporation. . . . . . . . . . . . . . . . . . . . . . . . . . . . . . . . . . . . . . . . . . . . . . . . . . . . . . . . . . . . 3.4, 3.6Medley International Teleport, Inc. . . . . . . . . . . . . . . . . . . . . . . . . . . . . . . . . . . . . . . . . . . . . . . . . . . 3.4, 3.5Melbourne International Communications, Ltd. . . . . . . . . . . . . . . . . . . . . . . . . . . . . . . . . . . . . . . . . . . . . . . . . . . . 3.4 - 3.6Mercury Marketing Company, Ltd. . . . . . . . . . . . . . . . . . . . . . . . . . . . . . . . . . . . . . . . . . 3.4, 3.6Metromedia Communications Corp. . . . . . . . . . . . . . . . . . . . . . . . . . . . . . . . . . . . . . . . . . . 1.4Metromedia Fiber Network Services, Inc. . . . . . . . . . . . . . . . . . . . . . . . . . . . . . . . . . . . . . 3.4, 3.5MFS Intelenet, Inc. . . . . . . . . . . . . . . . . . . . . . . . . . . . . . . . . . . . . . . . . . . . . . . . . . . . . . . . . . . . . . . 1.4MFS International. . . . . . . . . . . . . . . . . . . . . . . . . . . . . . . . . . . . . . . . . . . . . . . . . . . . . . . . . . . . . . 3.10MH Communications, Inc. d/b/a MH Communications. . . . . . . . . . . . . . . . . . . . . . . . . . . . . . . . . . . . . . 3.4, 3.6Michigan Bell Telephone Co. d/b/a Ameritech Michigan. . . . . . . . . . . . . . . . . . . . . . . . . . . . . . . . . . . . . . . 1.2, 2.1, 2.10Micronesian Telecommunications Corp. . . . . . . . . . . . . . . . . . . . . . . . . . . . . . . . . . . . . . . . . . . . . . 3.10Mid-Rivers Long Distance, Inc. . . . . . . . . . . . . . . . . . . . . . . . . . . . . . . . . . . . . . . . . . . . . . . . . 3.4, 3.6Midcontinent Communications, Inc. . . . . . . . . . . . . . . . . . . . . . . . . . . . . . . . . . . . . . . . . . . . . . . . . 3.4, 3.6Midvale Telephone Exchange. . . . . . . . . . . . . . . . . . . . . . . . . . . . . . . . . . . . . . . . . . . . . . . . . . . . . . . . . . . 3.4, 3.6
258
Statistics of Communications Common Carriers
General Index2. By Company -- Continued
Name of Company Table
Minnesota Independent IXC Corp. (MIIC) d/b/a MEANS Telecom. . . . . . . . . . . . . . . . . . . . . . . . . . . . . . . . . . . . . . . . . . . . . . . . . . . . . . . . . 3.4, 3.6Mobile Satellite Communications Inc., d/b/a Pittsburgh International Telecommunications. . . . . . . . . . . . . . . . . . . . . . . . . . . . . . . . . . . . . . . . . . . . . . . . . . 3.4, 3.5Montana Wireless, Inc. . . . . . . . . . . . . . . . . . . . . . . . . . . . . . . . . . . . . . . . . . . . 3.4, 3.6Montrose Mutual Long Distance, Inc. . . . . . . . . . . . . . . . . . . . . . . . . . . . . . . . . . . 3.4, 3.6Moultrie Infocomm, Inc. . . . . . . . . . . . . . . . . . . . . . . . . . . . . . . . . . . . . . . . . . . . . . . . . . 3.4, 3.6Mountain West Long Distance. . . . . . . . . . . . . . . . . . . . . . . . . . . . . . . . . . . . . . . . . . . . 3.4Mountain Land Communications, Inc. . . . . . . . . . . . . . . . . . . . . . . . . . . . . . . . . . . . . . . . . . . . . . . . 3.4, 3.6MTA Long Distance, Inc. . . . . . . . . . . . . . . . . . . . . . . . . . . . . . . . . . . . . . . . . . . . . . . . . . . . . . . 3.4, 3.6MTC Communications, Inc. . . . . . . . . . . . . . . . . . . . . . . . . . . . . . . . . . . . . . . . . . . . . . . . . . . . 3.4, 3.6MTCO Communications, Inc. . . . . . . . . . . . . . . . . . . . . . . . . . . . . . . . . . . . . . . . . . . . . . . . . . . . . 3.4, 3.6MVP Communications. . . . . . . . . . . . . . . . . . . . . . . . . . . . . . . . . . . . . . . . . . . . . . . . . . . . . . . . . . 3.4, 3.6
National Brands, Inc. d/b/a Sharnet Communications Co. . . . . . . . . . . . . . . . . . . . . . . . . . . . . . . . . . . . . . . . . . . . . . . . . . 3.4, 3.6National Telephone Exchange, Inc. . . . . . . . . . . . . . . . . . . . . . . . . . . . . . . . . . . . . . . . . . . . . . . . . . . 3.4, 3.6Nebraska Long Distance Company, LLC. . . . . . . . . . . . . . . . . . . . . . . . . . . . . . . . . . . . . . . . . . 3.4, 3.6Nemont Long Distance. . . . . . . . . . . . . . . . . . . . . . . . . . . . . . . . . . . . . . . . . . . . . . . . . . 3.4, 3.6NET-tel Corporation. . . . . . . . . . . . . . . . . . . . . . . . . . . . . . . . . . . . . . . . . . . . . . . . . . . . . . . . . . . . . . . . 3.4, 3.6Net2000 Communications Services, Inc. . . . . . . . . . . . . . . . . . . . . . . . . . . . . . . . . . . . . . . . . . . . . . . 3.4, 3.6Netmoves Corp. . . . . . . . . . . . . . . . . . . . . . . . . . . . . . . . . . . . . . . . . . . . . . . . . . . . . . . . . . . 3.4, 3.6Network Billing Systems . . . . . . . . . . . . . . . . . . . . . . . . . . . . . . . . . . . . . . . . . . . . . . 3.4, 3.6Network Communications International Corp. . . . . . . . . . . . . . . . . . . . . . . . . . . . . . . . . . . . . . . . . . . . . . . 3.4, 3.6Network Plus, Inc. . . . . . . . . . . . . . . . . . . . . . . . . . . . . . . . . . . . . . . . . . . . . . . . . . . . . . . . 1.2, 1.4, 2.1, 3.4, 3.6Network Telephone Corporation. . . . . . . . . . . . . . . . . . . . . . . . . . . . . . . . . . . . . . . . . . . 3.4, 3.6Nevada Bell. . . . . . . . . . . . . . . . . . . . . . . . . . . . . . . . . . . . . . . . . . . . . . . . . . . . . . . . . . . . . . . . . . 1.2, 2.1, 2.10Nevadacom. . . . . . . . . . . . . . . . . . . . . . . . . . . . . . . . . . . . . . . . . . . . . . . . . . . . . . . . . . . . . . . . . 3.4, 3.6New England Telephone & Telegraph Co. . . . . . . . . . . . . . . . . . . . . . . . . . . . . . . . . . . . . . . . 1.3New Global Telecom, Inc. . . . . . . . . . . . . . . . . . . . . . . . . . . . . . . . . . . . . . . . . . . . . . . . . . . . . . . . . 1.2, 1.4, 2.1, 3.10New North Telecommunications Company. . . . . . . . . . . . . . . . . . . . . . . . . . . . . . . . . . . . . . . . . . . . . . . 3.4, 3.6New South Communications Corp. . . . . . . . . . . . . . . . . . . . . . . . . . . . . . . . . . . . . . . . . . . . . . . . 3.4, 3.6New York Telephone Co. . . . . . . . . . . . . . . . . . . . . . . . . . . . . . . . . . . . . . . . . . . . . . . . . 1.3NewOp Communications d/b/a OTC Long Distance. . . . . . . . . . . . . . . . . . . . . . . . . . . . . . . . . . . 3.4, 3.6NexBand Communications, Inc. . . . . . . . . . . . . . . . . . . . . . . . . . . . . . . . . . . . 3.4, 3.6NEXTLINK Arizona, Inc. . . . . . . . . . . . . . . . . . . . . . . . . . . . . . . . . . . . . . . . . . . . . . . . . . . . . . . . . . . . . . . . 3.4NEXTLINK California, Inc. . . . . . . . . . . . . . . . . . . . . . . . . . . . . . . . . . . . . . . . . . . . . . . . . . . . . . . . . . . . . . . . 3.4NEXTLINK Colorado, L.L.C. . . . . . . . . . . . . . . . . . . . . . . . . . . . . . . . . . . . . . . . . . . . . . . . . . . . . . . . . . . . . . . 3.4NEXTLINK Communications, Inc. . . . . . . . . . . . . . . . . . . . . . . . . . . . . . . . . . . . . . . . . . . . 3.4, 3.6NEXTLINK D.C., Inc. . . . . . . . . . . . . . . . . . . . . . . . . . . . . . . . . . . . . . . . . . . . . . . . . . . . . . . . . . . . . . . . 3.4NEXTLINK Delaware, Inc. . . . . . . . . . . . . . . . . . . . . . . . . . . . . . . . . . . . . . . . . . . . . . . . . . . . . . . . . . . . . . . . 3.4NEXTLINK Florida, Inc. . . . . . . . . . . . . . . . . . . . . . . . . . . . . . . . . . . . . . . . . . . . . . . . . . . . . . . . . . . . . . . . 3.4NEXTLINK Georgia, Inc. . . . . . . . . . . . . . . . . . . . . . . . . . . . . . . . . . . . . . . . . . . . . . . . . . . . . . . . . . . . . . . . 3.4NEXTLINK Illinois, Inc. . . . . . . . . . . . . . . . . . . . . . . . . . . . . . . . . . . . . . . . . . . . . . . . . . . . . . . . . . . . . . . . 3.4NEXTLINK Massachusetts, Inc. . . . . . . . . . . . . . . . . . . . . . . . . . . . . . . . . . . . . . . . . . . . . . . . . . . . . . . . . . . . . . . . 3.4NEXTLINK Michigan, Inc. . . . . . . . . . . . . . . . . . . . . . . . . . . . . . . . . . . . . . . . . . . . . . . . . . . . . . . . . . . . . . . . 3.4NEXTLINK Missouri, Inc. . . . . . . . . . . . . . . . . . . . . . . . . . . . . . . . . . . . . . . . . . . . . . . . . . . . . . . . . . . . . . . . 3.4NEXTLINK New Jersey, Inc. . . . . . . . . . . . . . . . . . . . . . . . . . . . . . . . . . . . . . . . . . . . . . . . . . . . . . . . . . . . . . . . 3.4NEXTLINK New York, Inc. . . . . . . . . . . . . . . . . . . . . . . . . . . . . . . . . . . . . . . . . . . . . . . . . . . . . . . . . . . . . . . . 3.4NEXTLINK Ohio, Inc. . . . . . . . . . . . . . . . . . . . . . . . . . . . . . . . . . . . . . . . . . . . . . . . . . . . . . . . . . . . . . . . 3.4NEXTLINK Pennsylvania, Inc. . . . . . . . . . . . . . . . . . . . . . . . . . . . . . . . . . . . . . . . . . . . . . . . . . . . . . . . . . . . . . . . 3.4NEXTLINK Pennsylvania Merger Co. II, Inc. . . . . . . . . . . . . . . . . . . . . . . . . . . . . . . . . . . . . . . . . . . . . . . . . . . . . . . . . . . . . . . . 3.4NEXTLINK Tennessee, Inc. . . . . . . . . . . . . . . . . . . . . . . . . . . . . . . . . . . . . . . . . . . . . . . . . . . . . . . . . . . . . . . . 3.4NEXTLINK Utah, Inc. . . . . . . . . . . . . . . . . . . . . . . . . . . . . . . . . . . . . . . . . . . . . . . . . . . . . . . . . . . . . . . . 3.4NEXTLINK Virginia, L.L.C. . . . . . . . . . . . . . . . . . . . . . . . . . . . . . . . . . . . . . . . . . . . . . . . . . . . . . . . . . . . . . . 3.4NEXTLINK Washington, Inc. . . . . . . . . . . . . . . . . . . . . . . . . . . . . . . . . . . . . . . . . . . . . . . . 3.4Norlight Telecommunications, Inc. . . . . . . . . . . . . . . . . . . . . . . . . . . . . . . . . . . . . . . . . . . 1.2 - 1.4, 2.1, 3.4 - 3.6Nortex Communications Company. . . . . . . . . . . . . . . . . . . . . . . . . . . . . . . . . . . . . . . . . . . . . 3.4, 3.6North Dakota Long Distance. . . . . . . . . . . . . . . . . . . . . . . . . . . . . . . . . . . . . . . . . . . . . . . 3.4, 3.6North State Telecommunications Corporation. . . . . . . . . . . . . . . . . . . . . . . . . . . . . . . . . . . . . . . . . . . . . 3.4, 3.6North State Telephone Long Distance Company. . . . . . . . . . . . . . . . . . . . . . . . . . . . . . . . . . . . . . . . . . . . . 3.4, 3.6North Texas Communications Company. . . . . . . . . . . . . . . . . . . . . . . . . . . . . . . . . . . . . . . . . . . . . 3.4Northeast Florida Telephone Company, Inc. . . . . . . . . . . . . . . . . . . . . . . . . . . . . . . . . . . . . . . 3.4, 3.6Northeast Missouri Long Distance, L.L.C. . . . . . . . . . . . . . . . . . . . . . . . . . . . . . . . . . . . . . . 3.4, 3.6Northeast Telephone Long Distance, Inc. . . . . . . . . . . . . . . . . . . . . . . . . . . . . . . . . . . . . . . 3.4, 3.6Northern Communications, Inc. . . . . . . . . . . . . . . . . . . . . . . . . . . . . . . . . . . . . . . . . . . . . 3.4NOS Communications, Inc. . . . . . . . . . . . . . . . . . . . . . . . . . . . . . . . . . . . . . . . . . . . . . . . . . . . . . . . . 1.3, 3.4, 3.6
259
Statistics of Communications Common Carriers
General Index2. By Company -- Continued
Name of Company Table
NOSVA Limited Partnership. . . . . . . . . . . . . . . . . . . . . . . . . . . . . . . . . . . . . . . . . . . . . . . . . . . . . . . . 1.2, 1.4, 2.1, 3.4, 3.6NOW Communications, Inc. . . . . . . . . . . . . . . . . . . . . . . . . . . . . . . . . . . . . . . . . . . . . . . . . . . . . . . . . 3.4, 3.6NTS Communications, Inc. . . . . . . . . . . . . . . . . . . . . . . . . . . . . . . . . . . . . . . . . . . . . . . . . . . . . . . . . 3.4, 3.6ntta.com, inc. . . . . . . . . . . . . . . . . . . . . . . . . . . . . . . . . . . . . . . . . . . . . . . . . . . . . . . . . . . . . . . . . 3.4, 3.5NYNEX Long Distance d/b/a Bell Atlantic Business Services. . . . . . . . . . . . . . . . . . . . . . . . . . . . . . . . . . . . . . . . . . . . . . . . . . 3.4, 3.6NXLD Company. . . . . . . . . . . . . . . . . . . . . . . . . . . . . . . . . . . . . . . . . . . . . . . . . . . . . . . . 3.4, 3.6
OGC Telecom, Ltd. . . . . . . . . . . . . . . . . . . . . . . . . . . . . . . . . . . . . . . . . . . . . . 3.4OGIT General. . . . . . . . . . . . . . . . . . . . . . . . . . . . . . . . . . . . . . . . . . . . . . . . 3.4Ohio Bell Telephone Co., The d/b/a Ameritech Ohio. . . . . . . . . . . . . . . . . . . . . . . . . . . . . . . . . . . . . . . 1.2, 2.1, 2.10Omnicall, Inc. . . . . . . . . . . . . . . . . . . . . . . . . . . . . . . . . . . . . . . . . . . . . . . . 3.4, 3.6Omniplex Communications Group, LLC. . . . . . . . . . . . . . . . . . . . . . . . . . . . . . . . . . . . . . . . . . . . . . . 3.4, 3.6Omnipoint Corporation. . . . . . . . . . . . . . . . . . . . . . . . . . . . . . . . . . . . . . . . . . . . . . 3.4, 3.6One Call Communications, Inc. d/b/a Opticom. . . . . . . . . . . . . . . . . . . . . . . . . . . . . . . . . 3.4, 3.6Oneida Network Service, Inc. . . . . . . . . . . . . . . . . . . . . . . . . . . . . . . . . . . . . . . . . . . . . . . . 3.4, 3.6Oneida Telephone Exchange & Cablevision, Inc. . . . . . . . . . . . . . . . . . . . . . . . . . . . . . . . . . . . . . . . . 3.4, 3.6OneStar Long Distance, Inc. . . . . . . . . . . . . . . . . . . . . . . . . . . . . . . . . . . . . . . . . . . . . . . . 3.4, 3.6OnSite Access, LLC. . . . . . . . . . . . . . . . . . . . . . . . . . . . . . . . . . . . . . . . . . . . . . . . 3.4, 3.6Operator Communications, Inc. . . . . . . . . . . . . . . . . . . . . . . . . . . . . . . . . . 3.4, 3.6Operator Service Company (OSC). . . . . . . . . . . . . . . . . . . . . . . . . . . . . . . . . . . . . . . . . . . . . . . 3.4, 3.6OpTel, Inc. . . . . . . . . . . . . . . . . . . . . . . . . . . . . . . . . . . . . . . . . . . . . . . . . . . . . 3.4, 3.6Overseas Telecommunications, Inc. . . . . . . . . . . . . . . . . . . . . . . . . . . . . . . . . . . . . . . 3.4
Pacific Bell. . . . . . . . . . . . . . . . . . . . . . . . . . . . . . . . . . . . . . . . . . . . . . . . . . . . . . . . . . . . . . . 1.2, 2.1, 2.10Pac-West Telecomm., Inc. . . . . . . . . . . . . . . . . . . . . . . . . . . . . . . . . . . . . . . . . . . . . . . . . . . . . . . . . . . . . . . . 3.4, 3.6Pacific Gateway Exchange, Inc. . . . . . . . . . . . . . . . . . . . . . . . . . . . . . . . . . . . . . . . . . . . . . . . . . . . . . 1.2, 1.4, 2.1, 3.4, 3.5, 3.10Pacific Telesis Group. . . . . . . . . . . . . . . . . . . . . . . . . . . . . . . . . . . . . . . . . . . . . . . . . . . . 1.2PaeTec Communications, Inc. . . . . . . . . . . . . . . . . . . . . . . . . . . . . . . . . . . . . . . . . . . . . . . . . . . . . . . . . . . . . . 3.4, 3.6PanAmSat Communications Carrier Services, Inc. . . . . . . . . . . . . . . . . . . . . . . . . . . . . . . . . . . . . . . . . . . . . . . . . . . . 3.4, 3.5Partner Communications Group, LLC. . . . . . . . . . . . . . . . . . . . . . . . . . . . . . . . . . . . . . . . . . . . . . . . . . . . . . . . . . . 3.4, 3.6PCI Communications, Inc. d/b/a Startec Global Communications. . . . . . . . . . . . . . . . . . . . . . . . . . . . . . . . . . . . . . . . . . . . . . . . . . 3.4, 3.6, 3.10PECO Hyperion. . . . . . . . . . . . . . . . . . . . . . . . . . . . . . . . . . . . . . . . . . . . . . . . . . . . . . 3.4, 3.6Penasco Valley Telephone Cooperative, Inc. . . . . . . . . . . . . . . . . . . . . . . . . . . . . . . . . . . . . . . . . . . 3.4, 3.6Penn Telecom, Inc. . . . . . . . . . . . . . . . . . . . . . . . . . . . . . . . . . . . . . . . . . . . . . . . . . . . . . . 3.4, 3.6Peoples Communication, Inc. . . . . . . . . . . . . . . . . . . . . . . . . . . . . . . . . . . . . . . . . . . . . . . . 3.4, 3.6Perry Spencer Communications, Inc. . . . . . . . . . . . . . . . . . . . . . . . . . . . . . . . . . . . . . . . . . . . . . . . . . . . . 3.4, 3.6Petroleum Communications, Inc. (PETROCOM). . . . . . . . . . . . . . . . . . . . . . . . . . . . . . . . . . . . . . . . . . . . . . . . . 3.4, 3.6Phillips County Communications. . . . . . . . . . . . . . . . . . . . . . . . . . . . . . . . . . . . . . . . . . . . . . . . 3.4, 3.6Phoenix Network, Inc. . . . . . . . . . . . . . . . . . . . . . . . . . . . . . . . . . . . . . . . . . . . . . . . . 3.4, 3.6Picus Communications LLC. . . . . . . . . . . . . . . . . . . . . . . . . . . . . . . . . . . . . . . . . . . . . . . . 3.4, 3.6Pineland PCS, Inc. d/b/a Pineland Long Distance. . . . . . . . . . . . . . . . . . . . . . . . . . . . . . . . . . . . 3.4, 3.6Pioneer Commun., Inc. d/b/a Pioneer Telecom. . . . . . . . . . . . . . . . . . . . . . . . . . . . . . . . . . . . . . 3.4, 3.6PrimeLink, Inc. . . . . . . . . . . . . . . . . . . . . . . . . . . . . . . . . . . . . . . . . . . . . . . . . . . . . . . . . . . . 3.4, 3.6Primus Telecommunications, Inc. . . . . . . . . . . . . . . . . . . . . . . . . . . . . . . . . . . . . . . . . . . . . . . . . . . . . . . . . . 1.2, 1.4, 2.1, 3.4 - 3.6, 3.10Progress International, L.L.C. (Progress). . . . . . . . . . . . . . . . . . . . . . . . . . . . . . . . . . . . . . . . . . . . . . 3.4, 3.6Progress Concepts, Inc. . . . . . . . . . . . . . . . . . . . . . . . . . . . . . . . . . . . . . . . . . . . . . . 3.4, 3.6Promise-Net International, Ltd. . . . . . . . . . . . . . . . . . . . . . . . . . . . . . . . . . . . . . . . . 3.4, 3.6PSO, Inc. d/b/a Canal Uno. . . . . . . . . . . . . . . . . . . . . . . . . . . . . . . . . . . . . . . . . . . . . . . . . . . . 3.4, 3.5PT-1 Communications, Inc. . . . . . . . . . . . . . . . . . . . . . . . . . . . . . . . . . . . . . . . . . . . . . . . . . . 1.2, 1.4, 2.1, 3.4, 3.6PT-1 Long Distance, Inc. . . . . . . . . . . . . . . . . . . . . . . . . . . . . . . . . . . . . . . . . . . . . . . . . . . 1.2 - 1.4, 2.1, 3.4, 3.6Puerto Rico Telephone Co. . . . . . . . . . . . . . . . . . . . . . . . . . . . . . . . . . . . . . . . . . . . . 1.2, 2.1, 2.10PVT NetWorks Long Distance. . . . . . . . . . . . . . . . . . . . . . . . . . . . . . . . . . . . . . . . . . . . . . . . . . 3.4, 3.6
Q Telecommunications International Corporation. . . . . . . . . . . . . . . . . . . . . . . . . . . . . . . . . . . . . . . . . . . . . . . . . . . . 3.4, 3.6Quest Communications Services, Inc. . . . . . . . . . . . . . . . . . . . . . . . . . . . . . . . . . . . . . . . . . . . . . . . . . . . . . . . . . 3.4, 3.6Questar Infocomm, Inc. (QIC). . . . . . . . . . . . . . . . . . . . . . . . . . . . . . . . . . . . . . . . . . . . . . . . . . . . . . . . . . . . . . . 3.4, 3.6Qwest Communications Corporation. . . . . . . . . . . . . . . . . . . . . . . . . . . . . . . . . . . . . . . . . . . . . . . . . . . . . . . 1.2, 1.4, 2.1, 2.10, 3.4, 3.6Qwest Communications International, Inc. . . . . . . . . . . . . . . . . . . . . . . . . . . . . . . . . . . . . . . . . . . . . . . . . . . 1.1, 1.2Qwest Wireless, LLC. . . . . . . . . . . . . . . . . . . . . . . . . . . . . . . . . . . . . . . . . . . . . . . . . . . . . . . . . . . . . . . 3.4, 3.6
R&B Communications. . . . . . . . . . . . . . . . . . . . . . . . . . . . . . . . . . . . . . . . . . . . . . . . . . . . . . . . . 3.4, 3.6R&B Telephone. . . . . . . . . . . . . . . . . . . . . . . . . . . . . . . . . . . . . . . . . . . . . . . . . . . . . . . . . 3.4, 3.6Rainier Connect, Inc. . . . . . . . . . . . . . . . . . . . . . . . . . . . . . . . . . . . . . . . . . . . . . . . . . . . . 3.4, 3.6Randolph Telephone Telecommunications, Inc. . . . . . . . . . . . . . . . . . . . . . . . . . . . . . . . . . . . . . . . . . . . . . 3.4, 3.6Rapid Link, Inc. . . . . . . . . . . . . . . . . . . . . . . . . . . . . . . . . . . . . . . . . . . . . . . . . . . . . . . . . . 3.4, 3.6Rapid Link USA, Inc. . . . . . . . . . . . . . . . . . . . . . . . . . . . . . . . . . . . . . . . . . . . . . . . . . . . . . . . . . 3.4, 3.6RCC Atlantic Long Distance, Inc. . . . . . . . . . . . . . . . . . . . . . . . . . . . . . . . . . . . . . . . . . . . . . . . . . 3.4, 3.6Reynolds Long Distance, Inc. . . . . . . . . . . . . . . . . . . . . . . . . . . . . . . . . . . . . . . . . . . . . . . . 3.4, 3.6
260
Statistics of Communications Common Carriers
General Index2. By Company -- Continued
Name of Company Table
RGT Utilities, Inc. . . . . . . . . . . . . . . . . . . . . . . . . . . . . . . . . . . . . . . . . . . . . . . . . . . . . . . . . . 3.4, 3.6Richland-Grant Long Distance. . . . . . . . . . . . . . . . . . . . . . . . . . . . . . . . . . . . . . . . . . . . . . . . . . . . . 3.4, 3.6Rochester Telephone Co. . . . . . . . . . . . . . . . . . . . . . . . . . . . . . . . . . . . . . . . . . . . . . . . . . 3.4, 3.6Rockefeller Group Telecommunications. . . . . . . . . . . . . . . . . . . . . . . . . . . . . . . . . . . . . . . . . . . . . . . . . 3.4, 3.6RSL Communications Ltd. . . . . . . . . . . . . . . . . . . . . . . . . . . . . . . . . . . . . . . . . . . . . . . . . . . . . . . . . . . 1.2, 1.4, 3.4 - 3.6, 3.10RSL COM Primecall, Inc. . . . . . . . . . . . . . . . . . . . . . . . . . . . . . . . . . . . . . . . . . . . . . . . . . . . . . . . . . . 1.3, 1.4RSL COM U.S.A., Inc. . . . . . . . . . . . . . . . . . . . . . . . . . . . . . . . . . . . . . . . . . . . . . . . . . . . . . . . . . . 1.2, 1.4, 2.1, 3.4 - 3.6Rural Cellular Corporation. . . . . . . . . . . . . . . . . . . . . . . . . . . . . . . . . . . . . . . . . . . . . . . . . . . . . . 3.4, 3.6Rural Network Services. . . . . . . . . . . . . . . . . . . . . . . . . . . . . . . . . . . . . . . . . . . . . . . . . . . . . 3.4, 3.6
Sand Creek Toll Service Company. . . . . . . . . . . . . . . . . . . . . . . . . . . . . . . . . . . . . . . . . . . . . . . . . . . . . 3.4, 3.6Sandhill Communications, LLC. . . . . . . . . . . . . . . . . . . . . . . . . . . . . . . . . . . . . . . . . . . . . . . . . . . . 3.4, 3.6Satellite Communication Systems, Inc. . . . . . . . . . . . . . . . . . . . . . . . . . . . . . . . . . . . . . . . . . . . . . . . 3.4, 3.5SBC Communications, Inc. . . . . . . . . . . . . . . . . . . . . . . . . . . . . . . . . . . . . . . . . . . . . . . . 1.1, 1.2, 2.10, 3.4 - 3.6, 3.10SCS Communications & Security, Inc. d/b/a North Santiam Comm . . . . . . . . . . . . . . . . . . . . . . . . . . . . . . . . . . . 3.4, 3.6SEI Data, Inc. . . . . . . . . . . . . . . . . . . . . . . . . . . . . . . . . . . . . . . . . . . . . . . . . . . . . . . . . . . . . . 3.4, 3.6SelecTec, Inc. . . . . . . . . . . . . . . . . . . . . . . . . . . . . . . . . . . . . . . . . . . . . . . . . . . . . . . . . . . . . . 3.4, 3.6Shared Communications, Inc. . . . . . . . . . . . . . . . . . . . . . . . . . . . . . . . . . . . . . . . . . . . . . . . . . . . . . . 3.4, 3.6Shawnee Communications, Inc. . . . . . . . . . . . . . . . . . . . . . . . . . . . . . . . . . . . . . . . . . . . . . . . . . . . . . 3.4, 3.6ShawneeLink Corporation. . . . . . . . . . . . . . . . . . . . . . . . . . . . . . . . . . . . . . . . . . . . . . . . . . . . . . . . . 3.4, 3.6Sigecom, LLC. . . . . . . . . . . . . . . . . . . . . . . . . . . . . . . . . . . . . . . . . . . . . . . . . . . . . . . . . . . . . 3.4, 3.6Single Source, Inc. . . . . . . . . . . . . . . . . . . . . . . . . . . . . . . . . . . . . . . . . . . . . . . . . . . . . . . . . 3.4, 3.6SNET America, Inc. . . . . . . . . . . . . . . . . . . . . . . . . . . . . . . . . . . . . . . . . . . . . . . . . . . . . . . . 1.2, 1.4, 2.1, 3.4, 3.6SNET Diversified Group, Inc. . . . . . . . . . . . . . . . . . . . . . . . . . . . . . . . . . . . . . . . . . . . . . . . . . . . . . . . 3.4, 3.6Souris River Telecomm. Co. d/b/a SRT Long Distance. . . . . . . . . . . . . . . . . . . . . . . . . . . . . . . . . . . . . . . . . . . . . . . . 3.4, 3.6Southern Illinois RSA Partnership d/b/a First Cellular of Southern Illinois. . . . . . . . . . . . . . . . . . . . . . . . . . . . . . . . . . . 3.4, 3.6Southern New England Telecommunications Corp. . . . . . . . . . . . . . . . . . . . . . 1.2Southern New England Telephone Co., The. . . . . . . . . . . . . . . . . . . . . . . . . . . . . 1.2, 2.1, 2.9, 2.10Southwestern Bell Comm. Services, Inc. . . . . . . . . . . . . . . . . . . . . . . . . . . . . . . . . . . . . . . . . . . . . . . . . 3.4, 3.6Southwestern Bell Telephone Co. . . . . . . . . . . . . . . . . . . . . . . . . . . . . . . . . . . . . . . . 1.2, 2.1, 2.10Spring Valley Telephone Long Distance, Inc. . . . . . . . . . . . . . . . . . . . . . . . . . . . . . . . . . . . . . . . . . . . 3.4, 3.6Springcom, Inc. . . . . . . . . . . . . . . . . . . . . . . . . . . . . . . . . . . . . . . . . . . . . . . . . . . . 3.4, 3.6Sprint Communications Company. . . . . . . . . . . . . . . . . . . . . . . . . . . . . . . . . . . . . . . . . 1.2, 1.4, 2.1, 3.4 - 3.6, 4.11Sprint Corp. . . . . . . . . . . . . . . . . . . . . . . . . . . . . . . . . . . . . . . . . . . . . . . . . . . . . . . . . . . . . . . . . . 1.1, 1.2, 2.11, 3.4 - 3.6, 3.8, 3.10Sprint FON Group/PCS Group. . . . . . . . . . . . . . . . . . . . . . . . . . . . . . . . . . . . . . . . . . . . . . . . . . . . . . . . . . . . . . . . 1.1Sprint Missouri, Inc. . . . . . . . . . . . . . . . . . . . . . . . . . . . . . . . . . . . . . . . . . . . . . . . . . . . . 1.2, 2.1, 2.11Sprint-Florida, Inc. . . . . . . . . . . . . . . . . . . . . . . . . . . . . . . . . . . . . . . . . . . . . . . . . . . . . . . 1.2, 2.1, 2.11ST Long Distance, Inc. . . . . . . . . . . . . . . . . . . . . . . . . . . . . . . . . . . . . . . . . . . . . . . . . . . . 3.4, 3.6St. Thomas & San Juan Telephone Co., Inc. . . . . . . . . . . . . . . . . . . . . . . . . . . . . . . . . . . . 3.10Star Telecommunications, Inc. . . . . . . . . . . . . . . . . . . . . . . . . . . . . . . . . . . . . . . . . . 1.2, 1.4, 2.1, 3.4 - 3.6, 3.10Star Telephone Long Distance. . . . . . . . . . . . . . . . . . . . . . . . . . . . . . . . . . . . . . . . . . . . . . . . . . . . 3.4, 3.6Startcomm Corporation. . . . . . . . . . . . . . . . . . . . . . . . . . . . . . . . . . . . . . . . . . . . . . . . . . . . 3.4 - 3.6Startec Global Communications Corporation. . . . . . . . . . . . . . . . . . . . . . . . . . . . . . . . . . . . . . . . . . . . . . . . . . 1.2, 1.4, 2.1, 3.4 - 3.6, 3.10Stouffer Communications, Inc. . . . . . . . . . . . . . . . . . . . . . . . . . . . . . . . . . . . . . . . . . . . . . . . . . . . . 3.4, 3.6Sunrise World Communications. . . . . . . . . . . . . . . . . . . . . . . . . . . . . . . . . . . . . . . . . . . . . . . . . . . . . 3.4, 3.6Superior Long Distance. . . . . . . . . . . . . . . . . . . . . . . . . . . . . . . . . . . . . . . . . . . . . . . . . . . . . . 3.4, 3.6
T&S Communications LLC. . . . . . . . . . . . . . . . . . . . . . . . . . . . . . . . . . . . . . . . . . . . . . . . 3.4, 3.6Talk.com Holding Corp. . . . . . . . . . . . . . . . . . . . . . . . . . . . . . . . . . . . . . . . . . . . . . . .1.2, 1.4, 2.1, 3.4, 3.6Taylor Communications Group, Inc. . . . . . . . . . . . . . . . . . . . . . . . . . . . . . . . . . . . . . . . . . . . . . . . . 3.4, 3.6TDS Metrocom, Inc. . . . . . . . . . . . . . . . . . . . . . . . . . . . . . . . . . . . . . . . . . . . . . . . . 3.4, 3.6Tel-Save, Inc. . . . . . . . . . . . . . . . . . . . . . . . . . . . . . . . . . . . . . . . . . . . . . . . . . . . . . . . . . . . . . . 1.3, 3.4Telapex Long Distance, Inc. . . . . . . . . . . . . . . . . . . . . . . . . . . . . . . . . . . . . . . . . . . . . . . . . 3.4, 3.6Telco Communications Group, Inc. . . . . . . . . . . . . . . . . . . . . . . . . . . . . . . . . . . . . . . . . . . . . . . . . . . . . 1.4Telco Holdings, Inc. . . . . . . . . . . . . . . . . . . . . . . . . . . . . . . . . . . . . . . . . . . . . . . . . . . . . 3.4Telecom*USA, Inc. . . . . . . . . . . . . . . . . . . . . . . . . . . . . . . . . . . . . . . . . . . . . . . . . . . . . . . 1.4Telecom One, Inc. . . . . . . . . . . . . . . . . . . . . . . . . . . . . . . . . . . . . . . . . . . . . . . . . . . . . 3.4Telecom New Zealand Limited. . . . . . . . . . . . . . . . . . . . . . . . . . . . . . . . . . . . . . . . . . . . . . . . . 3.10Telecom Resources, Inc. . . . . . . . . . . . . . . . . . . . . . . . . . . . . . . . . . . . . . . . . . . . . . . . . . . 3.4Telecomunicaciones de Puerto Rico, Inc. . . . . . . . . . . . . . . . . . . . . . . . . . . . . . . . . . . . . . . . . 1.2Telecomunicaciones Ultramarianas de Puerto Rico. . . . . . . . . . . . . . . . . . . . . . . . . . . . . . . . . . . . . . . . 3.4, 3.5Telecommunications of Nevada, L.L.C. d/b/a NEXTLINK Nevada. . . . . . . . . . . . . . . . . . . . . . . . . . . . . . . . . . . . . . . . . . . . . 3.4Telefonica Larga Distancia, Inc. (TLD). . . . . . . . . . . . . . . . . . . . . . . . . . . . . . . . . . . . . . . . 3.4 - 3.6, 3.10Teleglobe Business Solutions, Inc. . . . . . . . . . . . . . . . . . . . . . . . . . . . . . . . . . . . . . . . . . . . . . . . . . . 1.3, 3.4, 3.6Teleglobe, Inc. . . . . . . . . . . . . . . . . . . . . . . . . . . . . . . . . . . . . . . . . . . . . . . . . . . . . . . . . . . . . . 1.2, 1.4, 3.4, 3.6
261
Statistics of Communications Common Carriers
General Index2. By Company -- Continued
Name of Company Table
Teleglobe USA, Inc. . . . . . . . . . . . . . . . . . . . . . . . . . . . . . . . . . . . . . . . . . . . . . . . . . . . . . . . . 1.2 - 1.4, 2.1, 3.10Telegroup, Inc. . . . . . . . . . . . . . . . . . . . . . . . . . . . . . . . . . . . . . . . . . . . . . . . . . . . . . . . . . . . . 1.4TelePacific Communications. . . . . . . . . . . . . . . . . . . . . . . . . . . . . . . . . . . . . . . . . . . . 3.4, 3.6Telephone Company of Central Florida, Inc. (TCCF). . . . . . . . . . . . . . . . . . . . . . . . . . . . . . . . . . . . . . 3.4, 3.6Teleport Communications Group, Inc.. . . . . . . . . . . . . . . . . . . . . . . . . . . . . . . . . . . . . . . . . . . . . . . . . . . . . . . . . 1.2, 1.4, 2.1, 3.4Telergy Network Services, Inc. . . . . . . . . . . . . . . . . . . . . . . . . . . . . . . . . . . . . . . . . . 3.4, 3.6Teleview Communications, Inc. d/b/a Citizens LD. . . . . . . . . . . . . . . . . . . . . . . . . . . . . . . .3.4, 3.6Teligent, Inc. . . . . . . . . . . . . . . . . . . . . . . . . . . . . . . . . . . . . . . . . . . . . . . . . . . . . . . . . . . . . . . 3.4, 3.6Telmex/Sprint Communications, L.L.C. . . . . . . . . . . . . . . . . . . . . . . . . . . . . . . . . . . . . . . 3.4, 3.6Telmex USA, L.L.C. . . . . . . . . . . . . . . . . . . . . . . . . . . . . . . . . . . . . . . . . . . . 3.4, 3.6Telstra Incorporated. . . . . . . . . . . . . . . . . . . . . . . . . . . . . . . . . . . . . . . . . . 3.4 - 3.6TerraLink Communications, Ltd. . . . . . . . . . . . . . . . . . . . . . . . . . . . . . . . . . 3.10Texas RSA 15B2 Limited Partnership d/b/a Five Star Wireless. . . . . . . . . . . . . . . . . . . . . . . . . . 3.4, 3.6The Furst Group, Inc. . . . . . . . . . . . . . . . . . . . . . . . . . . . . . . . . . . . . . . . . . . . . . . . . . . . . . . . . . . 3.4, 3.6The Long Distance Partnership, L.P. . . . . . . . . . . . . . . . . . . . . . . . . . . . . . . . . . . . . . . . . . . . . . . . .3.4, 3.6The Other Phone Company, Inc. d/b/a Access One Comm. . . . . . . . . . . . . . . . . . . . . . . . . . . . . . . . . . . .3.4, 3.6Thrifty Call, Inc. . . . . . . . . . . . . . . . . . . . . . . . . . . . . . . . . . . . . . . . . . . . . . . . . . . . . . . . . . .3.4, 3.6Time Warner Telecom Inc. . . . . . . . . . . . . . . . . . . . . . . . . . . . . . . . . . . . . . . . . . . . . . . . . . . . . . . . . . . . . . .3.4, 3.6TonCom, Inc. . . . . . . . . . . . . . . . . . . . . . . . . . . . . . . . . . . . . . . . . . . . . . . . . . . . . . . . . . .3.4, 3.6TotalNet Communications, Inc. . . . . . . . . . . . . . . . . . . . . . . . . . . . . . . . . . . . . . . . . . . . . . . . . . . . . . . . .3.4Total-Tel USA Communications, Inc. . . . . . . . . . . . . . . . . . . . . . . . . . . . . . . . . . . . . . . . . . . . . . . . . . . .1.3Total Communications Systems, Inc. . . . . . . . . . . . . . . . . . . . . . . . . . . . . . . . . . . . . . . . . . . . . . . . . . . . .3.4, 3.6Touch 1 Communications, Inc. . . . . . . . . . . . . . . . . . . . . . . . . . . . . . . . . . . . . . . . . . . . . . . . . . . . . . . . .3.4, 3.6Touch America, Inc. . . . . . . . . . . . . . . . . . . . . . . . . . . . . . . . . . . . . . . . . . . . . . . . . . . . . . .3.4, 3.6Transcommunications, Incorporated. . . . . . . . . . . . . . . . . . . . . . . . . . . . . . . . . . . . . . . . . . . . .3.4, 3.6Transtel Communications, Inc. . . . . . . . . . . . . . . . . . . . . . . . . . . . . . . . . . . . . . . . . . . . .3.4, 3.6TresCom International, Inc. . . . . . . . . . . . . . . . . . . . . . . . . . . . . . . . . . . . . . . . . . . . . . . . . . . . . . .1.4, 3.4, 3.10Tri-County Long Distance. . . . . . . . . . . . . . . . . . . . . . . . . . . . . . . . . . . . . . . . . . . . . . . . . . . . . . . .3.4, 3.6TRI-M Communications, Inc. . . . . . . . . . . . . . . . . . . . . . . . . . . . . . . . . . . . . . . . . . . . . . . . . . . .3.4, 3.6Tri Rural Independent Operations, L.L.C. (TRIO, L.L.C.). . . . . . . . . . . . . . . . . . . . . . . . . . . . . . . . . . . . . . . . . . . . . . . .3.4, 3.6TRICOM USA, Inc. . . . . . . . . . . . . . . . . . . . . . . . . . . . . . . . . . . . . . . . . . . . . . . . . . . . . . . . . . .3.4, 3.5, 3.10Trinet, Inc. . . . . . . . . . . . . . . . . . . . . . . . . . . . . . . . . . . . . . . . . . . . . . . . . . . . . . . . . . .3.4Triangle Communication System, Inc. . . . . . . . . . . . . . . . . . . . . . . . . . . . . . . . . . . . . . . . . . . . . . . .3.4, 3.6TRT/FTC Communications, Inc. . . . . . . . . . . . . . . . . . . . . . . . . . . . . . . . . . . . . . . . . . . . . . . . .3.10TXU Communications Telecom Services Co. . . . . . . . . . . . . . . . . . . . . . . . . . . . . . . . . . . . . . . . . . . . . . . .3.4, 3.6
U S Telecom. . . . . . . . . . . . . . . . . . . . . . . . . . . . . . . . . . . . . . . . . . . . . . . . . . . . . . . . . . . . . . 1.4U S WEST Communications Group, Inc. . . . . . . . . . . . . . . . . . . . . . . . . . . . . . . . . . . . . 1.3U S WEST Communications, Inc. . . . . . . . . . . . . . . . . . . . . . . . . . . . . . . . . . . . . . . . . . . . . . 3.4, 3.6U S WEST Wireless, L.L.C. . . . . . . . . . . . . . . . . . . . . . . . . . . . . . . . . . . . . . . . . . . . . . . . . . . . . . . . 3.4U S WEST, Inc. . . . . . . . . . . . . . . . . . . . . . . . . . . . . . . . . . . . . . . . . . . . . . . . . . . . . . . . . . . . . . 1.3UBTA Communications . . . . . . . . . . . . . . . . . . . . . . . . . . . . . . . . . . . . . . . . . . . . . . . . . . . . . . . . . . . . . . . 3.4, 3.6UniDial Communications, Inc. . . . . . . . . . . . . . . . . . . . . . . . . . . . . . . . . . . . . . . . . . . . . . . . . . . . . . . . . . . . . . . . 1.3, 3.4Union Telephone Co. . . . . . . . . . . . . . . . . . . . . . . . . . . . . . . . . . . . . . . . . . . . . . . . . . . . . . . . . . . . . . . . . 3.4, 3.6UniPlex Telecom Technologies, Inc. . . . . . . . . . . . . . . . . . . . . . . . . . . . . . . . . . . . . . . . . . . . . . . . . . . . . . . . . 3.4, 3.6Unisource Carrier Services AG. . . . . . . . . . . . . . . . . . . . . . . . . . . . . . . . . . . . . . . . . . . . . . . . . . . . . . . . . . . . 3.4Unitah Basin Long Distance. . . . . . . . . . . . . . . . . . . . . . . . . . . . . . . . . . . . . . . . . . . . . . . . . . . . . . . . . . . . . 3.4, 3.6United Communications Systems, Inc. . . . . . . . . . . . . . . . . . . . . . . . . . . . . . . . . . . . . . . . . . . . . . . . . . . . . . . . . . 3.4, 3.6United States Advanced Network, Inc. . . . . . . . . . . . . . . . . . . . . . . . . . . . . . . . . . . . . . . . . . . . . . . . . . . . . . . . 3.4, 3.6United States Cellular Corporation. . . . . . . . . . . . . . . . . . . . . . . . . . . . . . . . . . . . . . . . . . . . . . . . . . . . . . . . . 3.4, 3.6United Telecommunications, Inc. . . . . . . . . . . . . . . . . . . . . . . . . . . . . . . . . . . . . . . . . . . 1.4United Telephone - Southeast, Inc. . . . . . . . . . . . . . . . . . . . . . . . . . . . . . . . . . . . . . . . . . 1.2, 2.1, 2.11United Telephone Co. of Indiana, Inc. . . . . . . . . . . . . . . . . . . . . . . . . . . . . . . . . . . 1.2, 2.1, 2.11United Telephone Co. of New Jersey, Inc. . . . . . . . . . . . . . . . . . . . . . . . . . . . . . . . . . . . . . 1.2, 2.1, 2.11United Telephone Co. of Ohio. . . . . . . . . . . . . . . . . . . . . . . . . . . . . . . . . . . . . . . . . . . . . . . . . 1.2, 2.1, 2.11United Telephone Co. of Pennsylvania, The. . . . . . . . . . . . . . . . . . . . . . . . . . . . . . . . . . . 1.2, 2.1, 2.11United Telephone Co. of Texas. . . . . . . . . . . . . . . . . . . . . . . . . . . . . . . . . . . . . . . . . . . . . 1.2, 2.1, 2.11United Telephone Co. of the Northwest. . . . . . . . . . . . . . . . . . . . . . . . . . . . . . . . . . . . . . . . . 1.2, 2.1, 2.11UniversalCom, Inc. . . . . . . . . . . . . . . . . . . . . . . . . . . . . . . . . . . . . . . . . . . . . . . . . . . . . . . . . . . . . 3.4, 3.6Upper Peninsula Telephone Company. . . . . . . . . . . . . . . . . . . . . . . . . . . . . . . . . . . . . . . . . . . . . . . . . . . . . 3.4, 3.6URSUS Telecom Corporation. . . . . . . . . . . . . . . . . . . . . . . . . . . . . . . . . . . . . . . . . . . . . . . . . . . . . . . . . . . . . 3.4, 3.6US LEC Corp. . . . . . . . . . . . . . . . . . . . . . . . . . . . . . . . . . . . . . . . . . . . . . . . . . . . . . . . . . . . . . . . 3.4, 3.6US LEC of North Carolina, Inc. . . . . . . . . . . . . . . . . . . . . . . . . . . . . . . . . . . . . . . . . . . . . . . . . . . . . 3.4, 3.6US Link, Inc. . . . . . . . . . . . . . . . . . . . . . . . . . . . . . . . . . . . . . . . . . . . . . . . . . . . . . . . . . . . . . . . . . . 3.4, 3.6US Sprint. . . . . . . . . . . . . . . . . . . . . . . . . . . . . . . . . . . . . . . . . . . . . . . . . . . . . . . . . . . . . . . . . . 1.4US Telecom. . . . . . . . . . . . . . . . . . . . . . . . . . . . . . . . . . . . . . . . . . . . . . . . . . . . . . . . . . . . . . . . . 1.4
262
Statistics of Communications Common Carriers
General Index2. By Company -- Continued
Name of Company Table
US WATS, Inc. . . . . . . . . . . . . . . . . . . . . . . . . . . . . . . . . . . . . . . . . . . . . . . . . . . . . . . . . . . . . . . 3.4, 3.6US Xchange, L.L.C. . . . . . . . . . . . . . . . . . . . . . . . . . . . . . . . . . . . . . . . . . . . . . . . . . . . . . . . . 3.4, 3.6U.S. Electrodynamics, Inc. . . . . . . . . . . . . . . . . . . . . . . . . . . . . . . . . . . . . . . . . . . . . . . . . . . . . . . . . . . . . . 3.4U.S. Long Distance, Inc. . . . . . . . . . . . . . . . . . . . . . . . . . . . . . . . . . . . . . . . . . . . . . . . . . . . . . . . . . 1.2, 1.4, 2.1, 3.10U.S. TelePacific Corp. . . . . . . . . . . . . . . . . . . . . . . . . . . . . . . . . . . . . . . . . . . . . . . . . . . . . . . . 3.4, 3.6U.S. Republic Communications, Inc. . . . . . . . . . . . . . . . . . . . . . . . . . . . . . . . . . . . . . . . . . . . . . . . . . . . . . . . . 3.4, 3.6U.S. TelePacific Corp. . . . . . . . . . . . . . . . . . . . . . . . . . . . . . . . . . . . . . . . . . . . . . . . . . . . . . . . . . . . . . . 3.4, 3.6USA Global Link, Inc. . . . . . . . . . . . . . . . . . . . . . . . . . . . . . . . . . . . . . . . . . . . . . . . . . . . . . . 3.4, 3.6USC Telecom, Inc. . . . . . . . . . . . . . . . . . . . . . . . . . . . . . . . . . . . . . . . . . . . . . . . . . . . . . . 3.4, 3.6USLD Communications, Inc. . . . . . . . . . . . . . . . . . . . . . . . . . . . . . . . . . . . . . . . . . . . . . . . . . . . . . . . . . . . . 1.3, 1.4, 3.4, 3.6USN Communications Midwest, Inc. . . . . . . . . . . . . . . . . . . . . . . . . . . . . . . . . . . . . . . . . . . . . . . . . . . . . . . . . 3.4USVI Cellular Telephone Corporation, Inc. . . . . . . . . . . . . . . . . . . . . . . . . . . . . . . . . . . . . . . . . . . . . . . . . . . . . . . . . 3.4, 3.6USX Consultants, Inc. . . . . . . . . . . . . . . . . . . . . . . . . . . . . . . . . . . . . . . . . . . . . . . . . . . . . . . 3.4UTC Long Distance L.L.C. . . . . . . . . . . . . . . . . . . . . . . . . . . . . . . . . . . . . . . . . . . . . . . . . . . . . . 3.4, 3.6Utilicom Networks LLC. . . . . . . . . . . . . . . . . . . . . . . . . . . . . . . . . . . . . . . . . . . . . . . . . . . . . 3.4, 3.6
V-SAT Telecom, Inc. . . . . . . . . . . . . . . . . . . . . . . . . . . . . . . . . . . . . . . . . . . . . . . . . . . . . . . . . . . . . . . 3.4, 3.5VarTec Telecom, Inc. . . . . . . . . . . . . . . . . . . . . . . . . . . . . . . . . . . . . . . . . . . . . . . . . . . . . . . . . 1.2, 1.4, 2.1, 3.4, 3.6VDC Telecommunications, Inc. . . . . . . . . . . . . . . . . . . . . . . . . . . . . . . . . . . . . . . . . . . . . . . . . . . . . . . . . 3.4, 3.6Verizon California, Inc. . . . . . . . . . . . . . . . . . . . . . . . . . . . . . . . . . . . . . . . . . . . . . 1.2, 1.3, 2.1, 2.10Verizon Corporation. . . . . . . . . . . . . . . . . . . . . . . . . . . . . . . . . . . . . . . . . . . . . . . . . . . . . . . . . . . . . . 1.1 - 1.4, 2.6, 2.10Verizon Delaware, Inc. . . . . . . . . . . . . . . . . . . . . . . . . . . . . . . . . . . . . . . . . . . . . . 1.2, 1.3, 2.1, 2.10Verizon Florida, Inc. . . . . . . . . . . . . . . . . . . . . . . . . . . . . . . . . . . . . . . . . . . . . . 1.2, 1.3, 2.1, 2.10Verizon Hawaii, Inc. . . . . . . . . . . . . . . . . . . . . . . . . . . . . . . . . . . . . . . . . . . . . . 1.2, 1.3, 2.1, 2.10Verizon Maryland, Inc. . . . . . . . . . . . . . . . . . . . . . . . . . . . . . . . . . . . . . . . . . . . . . 1.2, 1.3, 2.1, 2.10Verizon New England, Inc. . . . . . . . . . . . . . . . . . . . . . . . . . . . . . . . . . . 1.2, 1.3, 2.1, 2.10Verizon New Jersey, Inc. . . . . . . . . . . . . . . . . . . . . . . . . . . . . . . . . . . . . . . . . . . . . . 1.2, 1.3, 2.1, 2.10Verizon New York, Inc. . . . . . . . . . . . . . . . . . . . . . . . . . . . . . . . . . . . . . . . . . . 1.2, 1.3, 2.1, 2.10Verizon North, Inc. . . . . . . . . . . . . . . . . . . . . . . . . . . . . . . . . . . . . . . . . . . . . . 1.2, 1.3, 2.1, 2.10Verizon Northwest, Inc. . . . . . . . . . . . . . . . . . . . . . . . . . . . . . . . . . . . . . . . . . . . . . 1.2, 1.3, 2.1, 2.10Verizon Pennsylvania, Inc. . . . . . . . . . . . . . . . . . . . . . . . . . . . . . . . . . . . . . . . . . . . . . 1.2, 1.3, 2.1, 2.10Verizon Select Services, Inc. . . . . . . . . . . . . . . . . . . . . . . . . . . . . . . . . . . . . . . . . . . . . . . . . . . . . . . . . . 1.2 - 1.4, 2.1Verizon South, Inc. . . . . . . . . . . . . . . . . . . . . . . . . . . . . . . . . . . . . . . . . . . . . . 1.2, 1.3, 2.1, 2.10Verizon Virginia, Inc. . . . . . . . . . . . . . . . . . . . . . . . . . . . . . . . . . . . . . . . . . . . . . 1.2, 1.3, 2.1, 2.10Verizon Washington, D.C., Inc. . . . . . . . . . . . . . . . . . . . . . . . . . . . . . . . . . . . . . . . . . . . . . 1.2, 1.3, 2.1, 2.10Verizon West Virginia, Inc. . . . . . . . . . . . . . . . . . . . . . . . . . . . . . . . . . . . . . . . . . . . . . 1.2, 1.3, 2.1, 2.10Verizon Wireless. . . . . . . . . . . . . . . . . . . . . . . . . . . . . . . . . . . . . . . . . . . . . . . . . . . . . . . . . . . . . . 3.4, 3.6Viatel, Inc. . . . . . . . . . . . . . . . . . . . . . . . . . . . . . . . . . . . . . . . . . . . . . . . . . . . . . . . . . . . . . . . . . 1.2 - 1.4, 2.1, 3.4 , 3.5, 3.10Viatel Services, Inc. . . . . . . . . . . . . . . . . . . . . . . . . . . . . . . . . . . . . . . . . . . . 1.2, 1.4, 2.1VoCall Communications Corp. . . . . . . . . . . . . . . . . . . . . . . . . . . . . . . . . . . . . . . . . . . . . . . . . . . . . . . . . 3.4, 3.6VoiceStream Wireless Corporation. . . . . . . . . . . . . . . . . . . . . . . . . . . . . . . . . . . . . . . . . . . . . . . . . . . . . . 3.4, 3.6
Wabash Independent Networks, Inc. . . . . . . . . . . . . . . . . . . . . . . . . . . . . . . . . . . . . . . . . . . . . 3.4, 3.6Waldron Communications Company. . . . . . . . . . . . . . . . . . . . . . . . . . . . . . . . . . . . . . . . . . . . . 3.4, 3.6Warwick Valley Long Distance Co., Inc. . . . . . . . . . . . . . . . . . . . . . . . . . . . . . . . . . . . . . . . . . . . . . 3.4, 3.6Washington Int'l Teleport. . . . . . . . . . . . . . . . . . . . . . . . . . . . . . . . . . . . . . . . . . . . . 3.4Washington RSA No. 8 L.P. . . . . . . . . . . . . . . . . . . . . . . . . . . . . . . . . . . . . . . . . . . . . . . . . 3.4, 3.6West Kentucky Networks, Inc. . . . . . . . . . . . . . . . . . . . . . . . . . . . . . . . . . . . . . . . . . . . . . . 3.4, 3.6West Texas Rural Telephone Coop., Inc. . . . . . . . . . . . . . . . . . . . . . . . . . . . . . . . . . . . . . . . . . 3.4, 3.6Western Reserve Telephone Co., The. . . . . . . . . . . . . . . . . . . . . . . . . . . . . . . . . . . . . . . . . . . . . . . 1.2, 2.1, 2.2, 2.11Western Union International. . . . . . . . . . . . . . . . . . . . . . . . . . . . . . . . . . . . . . . . . . . . . . 3.10Westinghouse Communications. . . . . . . . . . . . . . . . . . . . . . . . . . . . . . . . . . . . . . . . . . . . . . . . . . 1.4Westphalia Communications, Inc. . . . . . . . . . . . . . . . . . . . . . . . . . . . . . . . . . . . . . . . . . . 3.4, 3.6Wilkes Comm., Inc. d/b/a Wilkes Long Distance Services. . . . . . . . . . . . . . . . . . . . . . . . . . . . . . . . . . . . . . . . . . . . . . . . . . . 3.4, 3.6Williams Communications Group, Inc. . . . . . . . . . . . . . . . . . . . . . . . . . . . . . . . . . . . . . . . . . . . . 1.2Williams Communications, Inc. . . . . . . . . . . . . . . . . . . . . . . . . . . . . . . . . . . . . . . . . . . . . 1.2, 1.4, 2.1, 3.4 - 3.6Williams Companies, Inc., The. . . . . . . . . . . . . . . . . . . . . . . . . . . . . . . . . . . . . . . . . . . . . . . . . . . 1.2Wiltel, Inc. . . . . . . . . . . . . . . . . . . . . . . . . . . . . . . . . . . . . . . . . . . . . . . . . . . . . . . . . . . . . . . . . . . 1.4WinStar Communications, Inc. . . . . . . . . . . . . . . . . . . . . . . . . . . . . . . . . . . . . . . . . . . . . . . . . . . . . . . . . 3.4, 3.6WinStar Gateway Network, Inc. (WGN). . . . . . . . . . . . . . . . . . . . . . . . . . . . . . . . . . . . . . . . . . . . . . . . . . . 3.4, 3.6WinStar Midcom. . . . . . . . . . . . . . . . . . . . . . . . . . . . . . . . . . . . . . . . . . . . . . . . . . . . . . . . . 3.4WinStar Wireless, Inc. . . . . . . . . . . . . . . . . . . . . . . . . . . . . . . . . . . . . . . . . . . . . . . . . . . . . 3.4, 3.6Wisconsin Bell, Inc. d/b/a Ameritech Wisconsin. . . . . . . . . . . . . . . . . . . . . . . . . . . . . . . . . . . . . . . . 1.2, 2.1, 2.10Wood County Telephone Company. . . . . . . . . . . . . . . . . . . . . . . . . . . . . . . . . . . . . . . . . . . . . . . 3.4, 3.6Working Assets Funding Service, Inc. . . . . . . . . . . . . . . . . . . . . . . . . . . . . . . . . . . . . . . . . . . 1.2, 1.4, 2.1, 3.4, 3.6Working Assets Long Distance. . . . . . . . . . . . . . . . . . . . . . . . . . . . . . . . . . . . . . . . . . . . . . . . 3.4, 3.6WorkNet Communications, Inc. . . . . . . . . . . . . . . . . . . . . . . . . . . . . . . . . . . . . . . . . . . . . 3.4, 3.6
263
Statistics of Communications Common Carriers
General Index2. By Company -- Continued
Name of Company Table
World Access, Inc. . . . . . . . . . . . . . . . . . . . . . . . . . . . . . . . . . . . . . . . . . . . 1.2 - 1.4, 2.1World Access Telecommunications Group, Inc. . . . . . . . . . . . . . . . . . . . . . . . . . . . . . . . . 3.4 - 3.6, 3.10WorldCom, Inc. . . . . . . . . . . . . . . . . . . . . . . . . . . . . . . . . . . . . . . . . . . . . . . . . . . . . . . . . . . 1.1 - 1.6, 2.1, 3.4, 3.6, 3.8, 3.10World Communications, Inc. . . . . . . . . . . . . . . . . . . . . . . . . . . . . . . . . . . . . . . . . . . . . . . . . . . . . . . . . . . 3.10
XIT Long Distance. . . . . . . . . . . . . . . . . . . . . . . . . . . . . . . . . . . . . . . . . . . . 3.4, 3.6XIT Telecommunication & Technology, Inc. . . . . . . . . . . . . . . . . . . . . . . . . . . . . . . . . . . . . . . . . . . . . 3.4, 3.6
YYC Communications, Inc. . . . . . . . . . . . . . . . . . . . . . . . . . . . . . . . . . . . . . . . . . . . . . . . . . . . . . . . . . . . . 3.4
Z-Tel, Inc. . . . . . . . . . . . . . . . . . . . . . . . . . . . . . . . . . . . . . . . . . . . . . . . . . . . . . . . . . . . . . . . . . . 3.4ZENEX Long Distance, Inc. . . . . . . . . . . . . . . . . . . . . . . . . . . . . . . . . . . . . . . . . . . . . . . . . . . . 3.4, 3.6
264