Embed Size (px)
Citation preview

VII–1
CHAPTER VII
STATISTICS OF CATTLE, HOGS, AND SHEEP
This chapter contains information about most kinds of farm livestock and livestock products, with the exception of dairy and poultry. The information relates to inventories, production, disposition, prices, and income for farm animals, and to livestock slaughter, meat production, and market statistics for meat animals.
Table 7-1.—All cattle and calves: Operations, inventory, and value, United States, Jan. 1, 2006–2015
Year Inventory Value
Per head Total
Thousands Dollars 1,000 dollars
2006 ............................. 96,342 1,009 97,230,415 2007 ............................. 96,573 922 89,063,310 2008 ............................. 96,035 990 95,112,820 2009 ............................. 94,721 872 82,628,170 2010 ............................. 94,081 833 78,335,410 2011 ............................. 92,887 947 87,988,337 2012 ............................. 91,160 1,111 101,252,540 2013 ............................. 90,095 1,139 101,731,742 2014 ............................. 88,526 1,223 108,255,950 2015 ............................. 89,143 1,584 141,211,070
NASS, Livestock Branch, (202) 720–3570.istiller
Table 7-2.—All cattle and calves: Number by class, United States, Jan. 1, 2006–2015
Year All cattle
and calves 1
Cows and heifers that have calved
500 pounds and over
Calves under 500
pounds Beef cows Milk cows
Heifers
Steers Bulls Beef cow replace-ments
Milk cow replace-ments
Other
Thou- Thou- Thou- Thou- Thou- Thou- Thou- Thou- Thou- sands sands sands sands sands sands sands sands sands
2006 ............ 96,342 32,703 9,104 5,864 4,298 9,788 16,988 2,258 15,339 2007 ............ 96,573 32,644 9,145 5,835 4,325 9,914 17,185 2,214 15,311 2008 ............ 96,035 32,435 9,257 5,647 4,415 9,793 17,163 2,207 15,118 2009 ............ 94,721 31,794 9,333 5,550 4,410 9,644 16,809 2,188 14,994 2010 ............ 94,081 31,440 9,087 5,443 4,551 9,784 16,568 2,190 15,019 2011 ............ 92,887 30,913 9,156 5,135 4,577 9,938 16,394 2,165 14,610 2012 ............ 91,160 30,282 9,236 5,281 4,618 9,546 15,957 2,100 14,141 2013 ............ 90,095 29,631 9,221 5,429 4,546 9,281 15,931 2,074 13,983 2014 ............ 88,526 29,085 9,208 5,551 4,549 8,869 15,668 2,038 13,558 2015 ............ 89,143 29,302 9,307 6,086 4,710 8,464 15,630 2,109 13,534
1Totals may not add due to rounding. NASS, Livestock Branch, (202) 720–3570.
VII–2 STATISTICS OF CATTLE, HOGS, AND SHEEP
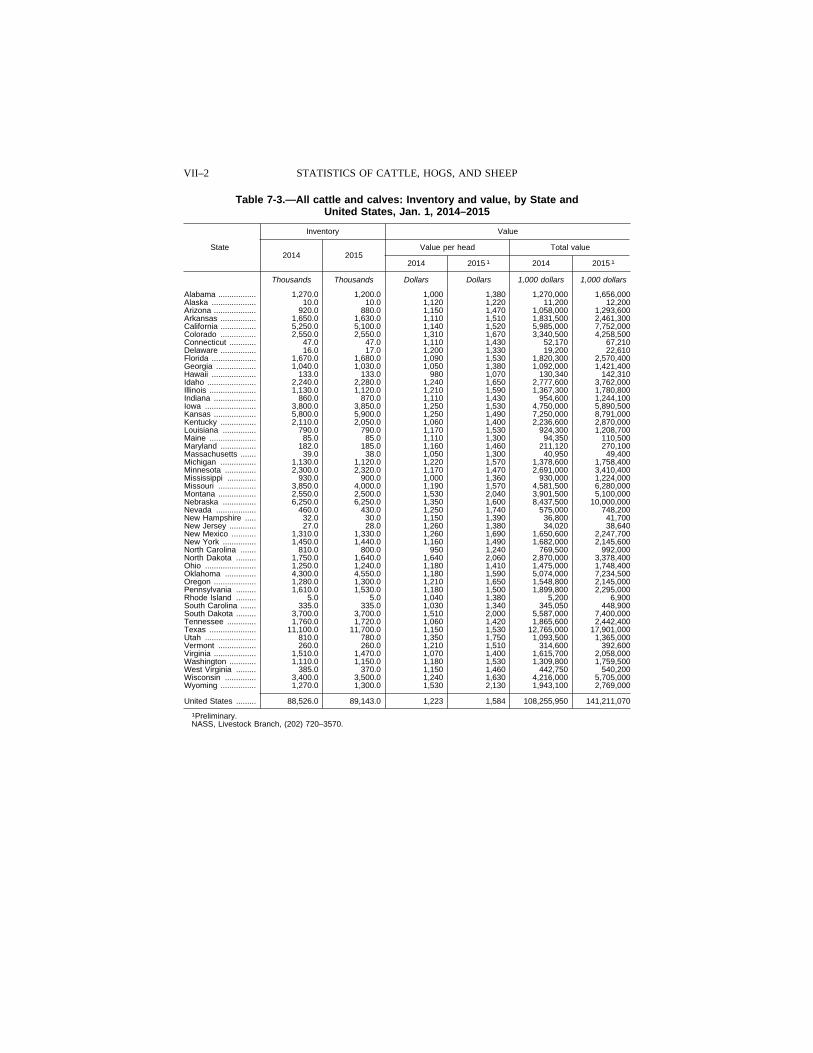
Table 7-3.—All cattle and calves: Inventory and value, by State and United States, Jan. 1, 2014–2015
State
Inventory Value
2014 2015 Value per head Total value
2014 2015 1 2014 2015 1
Thousands Thousands Dollars Dollars 1,000 dollars 1,000 dollars
Alabama ................. 1,270.0 1,200.0 1,000 1,380 1,270,000 1,656,000 Alaska .................... 10.0 10.0 1,120 1,220 11,200 12,200 Arizona ................... 920.0 880.0 1,150 1,470 1,058,000 1,293,600 Arkansas ................ 1,650.0 1,630.0 1,110 1,510 1,831,500 2,461,300 California ................ 5,250.0 5,100.0 1,140 1,520 5,985,000 7,752,000 Colorado ................ 2,550.0 2,550.0 1,310 1,670 3,340,500 4,258,500 Connecticut ............ 47.0 47.0 1,110 1,430 52,170 67,210 Delaware ................ 16.0 17.0 1,200 1,330 19,200 22,610 Florida .................... 1,670.0 1,680.0 1,090 1,530 1,820,300 2,570,400 Georgia .................. 1,040.0 1,030.0 1,050 1,380 1,092,000 1,421,400 Hawaii .................... 133.0 133.0 980 1,070 130,340 142,310 Idaho ...................... 2,240.0 2,280.0 1,240 1,650 2,777,600 3,762,000 Illinois ..................... 1,130.0 1,120.0 1,210 1,590 1,367,300 1,780,800 Indiana ................... 860.0 870.0 1,110 1,430 954,600 1,244,100 Iowa ....................... 3,800.0 3,850.0 1,250 1,530 4,750,000 5,890,500 Kansas ................... 5,800.0 5,900.0 1,250 1,490 7,250,000 8,791,000 Kentucky ................ 2,110.0 2,050.0 1,060 1,400 2,236,600 2,870,000 Louisiana ............... 790.0 790.0 1,170 1,530 924,300 1,208,700 Maine ..................... 85.0 85.0 1,110 1,300 94,350 110,500 Maryland ................ 182.0 185.0 1,160 1,460 211,120 270,100 Massachusetts ....... 39.0 38.0 1,050 1,300 40,950 49,400 Michigan ................ 1,130.0 1,120.0 1,220 1,570 1,378,600 1,758,400 Minnesota .............. 2,300.0 2,320.0 1,170 1,470 2,691,000 3,410,400 Mississippi ............. 930.0 900.0 1,000 1,360 930,000 1,224,000 Missouri ................. 3,850.0 4,000.0 1,190 1,570 4,581,500 6,280,000 Montana ................. 2,550.0 2,500.0 1,530 2,040 3,901,500 5,100,000 Nebraska ............... 6,250.0 6,250.0 1,350 1,600 8,437,500 10,000,000 Nevada .................. 460.0 430.0 1,250 1,740 575,000 748,200 New Hampshire ..... 32.0 30.0 1,150 1,390 36,800 41,700 New Jersey ............ 27.0 28.0 1,260 1,380 34,020 38,640 New Mexico ........... 1,310.0 1,330.0 1,260 1,690 1,650,600 2,247,700 New York ............... 1,450.0 1,440.0 1,160 1,490 1,682,000 2,145,600 North Carolina ....... 810.0 800.0 950 1,240 769,500 992,000 North Dakota ......... 1,750.0 1,640.0 1,640 2,060 2,870,000 3,378,400 Ohio ....................... 1,250.0 1,240.0 1,180 1,410 1,475,000 1,748,400 Oklahoma .............. 4,300.0 4,550.0 1,180 1,590 5,074,000 7,234,500 Oregon ................... 1,280.0 1,300.0 1,210 1,650 1,548,800 2,145,000 Pennsylvania ......... 1,610.0 1,530.0 1,180 1,500 1,899,800 2,295,000 Rhode Island ......... 5.0 5.0 1,040 1,380 5,200 6,900 South Carolina ....... 335.0 335.0 1,030 1,340 345,050 448,900 South Dakota ......... 3,700.0 3,700.0 1,510 2,000 5,587,000 7,400,000 Tennessee ............. 1,760.0 1,720.0 1,060 1,420 1,865,600 2,442,400 Texas ..................... 11,100.0 11,700.0 1,150 1,530 12,765,000 17,901,000 Utah ....................... 810.0 780.0 1,350 1,750 1,093,500 1,365,000 Vermont ................. 260.0 260.0 1,210 1,510 314,600 392,600 Virginia ................... 1,510.0 1,470.0 1,070 1,400 1,615,700 2,058,000 Washington ............ 1,110.0 1,150.0 1,180 1,530 1,309,800 1,759,500 West Virginia ......... 385.0 370.0 1,150 1,460 442,750 540,200 Wisconsin .............. 3,400.0 3,500.0 1,240 1,630 4,216,000 5,705,000 Wyoming ................ 1,270.0 1,300.0 1,530 2,130 1,943,100 2,769,000
United States ......... 88,526.0 89,143.0 1,223 1,584 108,255,950 141,211,070
1Preliminary. NASS, Livestock Branch, (202) 720–3570.

VII–3 AGRICULTURAL STATISTICS 2016
Table 7-4.—Cattle and calves, Jan. 1: Number by class, State and United States, 2014–2015
State
Cows and heifers that have calved Heifers, 500 pounds and over
Beef cows
Milk cows
Beef cow replacements
Milk cow replacements Other
2014 2015 2014 2015 2014 2015 2014 2015 2014 2015
1,000 1,000 1,000 1,000 1,000 1,000 1,000 1,000 1,000 1,000 head head head head head head head head head head
Alabama ............ 681.0 652.0 9.0 8.0 110.0 112.0 4.0 3.0 31.0 30.0 Alaska ............... 4.3 4.3 0.3 0.3 0.8 0.9 0.1 0.1 0.1 0.1 Arizona .............. 178.0 175.0 192.0 195.0 30.0 34.0 74.0 65.0 21.0 21.0 Arkansas ........... 862.0 863.0 8.0 7.0 137.0 150.0 5.0 4.0 78.0 51.0 California ........... 600.0 590.0 1,780.0 1,780.0 110.0 130.0 750.0 770.0 230.0 140.0 Colorado ............ 710.0 725.0 140.0 145.0 150.0 170.0 100.0 100.0 490.0 470.0 Connecticut ....... 4.0 5.0 19.0 19.0 1.5 2.5 9.0 8.0 0.5 0.5 Delaware ........... 2.8 2.5 4.7 5.0 0.5 0.7 2.6 2.5 0.6 0.7 Florida ............... 907.0 906.0 123.0 124.0 115.0 130.0 35.0 35.0 30.0 30.0 Georgia ............. 500.0 479.0 80.0 81.0 82.0 90.0 25.0 27.0 29.0 30.0 Hawaii ............... 71.8 68.8 2.2 2.2 9.0 11.0 1.0 1.0 4.0 5.0 Idaho ................. 465.0 461.0 565.0 579.0 110.0 120.0 270.0 320.0 190.0 170.0 Illinois ................ 355.0 366.0 95.0 94.0 63.0 64.0 45.0 52.0 102.0 99.0 Indiana .............. 187.0 199.0 178.0 181.0 39.0 50.0 68.0 80.0 53.0 44.0 Iowa ................... 895.0 900.0 205.0 210.0 160.0 180.0 120.0 130.0 640.0 630.0 Kansas .............. 1,414.0 1,427.0 136.0 143.0 240.0 290.0 100.0 90.0 1,400.0 1,330.0 Kentucky ........... 992.0 997.0 68.0 63.0 150.0 140.0 45.0 45.0 125.0 105.0 Louisiana ........... 450.0 466.0 15.0 14.0 84.0 74.0 5.0 5.0 21.0 23.0 Maine ................ 11.0 11.0 30.0 30.0 3.0 4.5 17.0 16.0 2.0 2.5 Maryland ........... 38.0 42.0 50.0 49.0 9.5 9.0 25.0 25.0 7.5 9.0 Massachusetts .. 6.0 5.5 12.0 12.5 2.0 2.0 7.5 7.0 0.5 1.0 Michigan ............ 119.0 107.0 381.0 403.0 29.0 23.0 164.0 167.0 47.0 35.0 Minnesota .......... 340.0 340.0 460.0 460.0 80.0 90.0 280.0 280.0 170.0 160.0 Mississippi ......... 477.0 468.0 13.0 12.0 91.0 97.0 6.0 6.0 43.0 33.0 Missouri ............. 1,820.0 1,851.0 90.0 89.0 305.0 345.0 50.0 60.0 215.0 225.0 Montana ............ 1,476.0 1,496.0 14.0 14.0 430.0 435.0 9.0 7.0 211.0 198.0 Nebraska ........... 1,807.0 1,756.0 53.0 54.0 400.0 420.0 20.0 20.0 1,280.0 1,280.0 Nevada .............. 231.0 212.0 29.0 28.0 36.0 37.0 9.0 9.0 31.0 29.0 New Hampshire 3.0 3.0 13.5 14.0 1.0 1.0 7.0 5.5 0.5 0.5 New Jersey ....... 7.0 7.5 7.0 7.0 1.0 1.3 3.0 3.8 1.0 0.9 New Mexico ...... 407.0 407.0 323.0 323.0 70.0 85.0 120.0 110.0 70.0 70.0 New York .......... 105.0 105.0 615.0 615.0 45.0 41.0 355.0 350.0 40.0 44.0 North Carolina ... 355.0 363.0 45.0 47.0 72.0 70.0 20.0 18.0 24.0 27.0 North Dakota ..... 923.0 894.0 17.0 16.0 170.0 169.0 10.0 6.0 210.0 185.0 Ohio ................... 293.0 282.0 267.0 268.0 55.0 50.0 130.0 125.0 60.0 50.0 Oklahoma .......... 1,795.0 1,880.0 45.0 40.0 325.0 420.0 20.0 25.0 340.0 365.0 Oregon .............. 516.0 525.0 124.0 125.0 105.0 110.0 60.0 60.0 120.0 105.0 Pennsylvania ..... 160.0 150.0 530.0 530.0 50.0 55.0 315.0 305.0 70.0 55.0 Rhode Island ..... 1.5 1.5 0.9 0.9 0.5 0.5 0.5 0.5 0.2 0.2 South Carolina .. 169.0 170.0 16.0 15.0 30.0 30.0 6.0 5.0 12.0 12.0 South Dakota .... 1,635.0 1,611.0 95.0 99.0 340.0 405.0 50.0 65.0 490.0 490.0 Tennessee ........ 864.0 873.0 46.0 47.0 130.0 140.0 30.0 25.0 85.0 65.0 Texas ................ 3,910.0 4,130.0 440.0 470.0 660.0 750.0 220.0 250.0 1,420.0 1,390.0 Utah ................... 340.0 324.0 95.0 96.0 70.0 78.0 46.0 48.0 69.0 64.0 Vermont ............. 12.0 12.0 132.0 132.0 4.5 4.0 56.0 56.0 5.5 5.0 Virginia .............. 637.0 637.0 93.0 93.0 115.0 110.0 40.0 43.0 70.0 42.0 Washington ....... 214.0 198.0 266.0 277.0 50.0 54.0 125.0 136.0 130.0 135.0 West Virginia ..... 191.0 185.0 9.0 9.0 35.0 33.0 5.0 4.0 24.0 20.0 Wisconsin .......... 250.0 275.0 1,270.0 1,275.0 70.0 75.0 680.0 730.0 70.0 45.0 Wyoming ........... 694.0 694.0 6.0 6.0 175.0 193.0 4.0 5.0 106.0 142.0
United States .... 29,085.4 29,302.1 9,207.6 9,306.9 5,551.3 6,086.4 4,548.7 4,710.4 8,869.4 8,464.4
See footnote(s) at end of table.
VII–4 STATISTICS OF CATTLE, HOGS, AND SHEEP
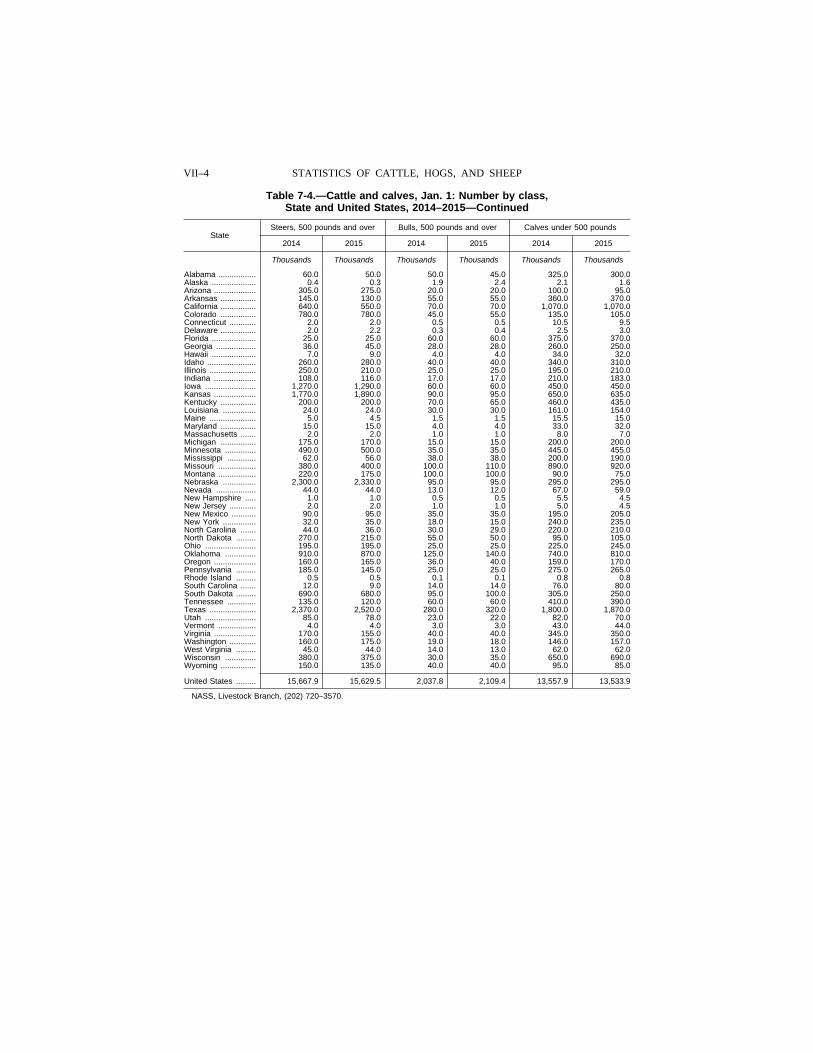
Table 7-4.—Cattle and calves, Jan. 1: Number by class, State and United States, 2014–2015—Continued
State Steers, 500 pounds and over Bulls, 500 pounds and over Calves under 500 pounds
2014 2015 2014 2015 2014 2015
Thousands Thousands Thousands Thousands Thousands Thousands
Alabama ................. 60.0 50.0 50.0 45.0 325.0 300.0 Alaska .................... 0.4 0.3 1.9 2.4 2.1 1.6 Arizona ................... 305.0 275.0 20.0 20.0 100.0 95.0 Arkansas ................ 145.0 130.0 55.0 55.0 360.0 370.0 California ................ 640.0 550.0 70.0 70.0 1,070.0 1,070.0 Colorado ................ 780.0 780.0 45.0 55.0 135.0 105.0 Connecticut ............ 2.0 2.0 0.5 0.5 10.5 9.5 Delaware ................ 2.0 2.2 0.3 0.4 2.5 3.0 Florida .................... 25.0 25.0 60.0 60.0 375.0 370.0 Georgia .................. 36.0 45.0 28.0 28.0 260.0 250.0 Hawaii .................... 7.0 9.0 4.0 4.0 34.0 32.0 Idaho ...................... 260.0 280.0 40.0 40.0 340.0 310.0 Illinois ..................... 250.0 210.0 25.0 25.0 195.0 210.0 Indiana ................... 108.0 116.0 17.0 17.0 210.0 183.0 Iowa ....................... 1,270.0 1,290.0 60.0 60.0 450.0 450.0 Kansas ................... 1,770.0 1,890.0 90.0 95.0 650.0 635.0 Kentucky ................ 200.0 200.0 70.0 65.0 460.0 435.0 Louisiana ............... 24.0 24.0 30.0 30.0 161.0 154.0 Maine ..................... 5.0 4.5 1.5 1.5 15.5 15.0 Maryland ................ 15.0 15.0 4.0 4.0 33.0 32.0 Massachusetts ....... 2.0 2.0 1.0 1.0 8.0 7.0 Michigan ................ 175.0 170.0 15.0 15.0 200.0 200.0 Minnesota .............. 490.0 500.0 35.0 35.0 445.0 455.0 Mississippi ............. 62.0 56.0 38.0 38.0 200.0 190.0 Missouri ................. 380.0 400.0 100.0 110.0 890.0 920.0 Montana ................. 220.0 175.0 100.0 100.0 90.0 75.0 Nebraska ............... 2,300.0 2,330.0 95.0 95.0 295.0 295.0 Nevada .................. 44.0 44.0 13.0 12.0 67.0 59.0 New Hampshire ..... 1.0 1.0 0.5 0.5 5.5 4.5 New Jersey ............ 2.0 2.0 1.0 1.0 5.0 4.5 New Mexico ........... 90.0 95.0 35.0 35.0 195.0 205.0 New York ............... 32.0 35.0 18.0 15.0 240.0 235.0 North Carolina ....... 44.0 36.0 30.0 29.0 220.0 210.0 North Dakota ......... 270.0 215.0 55.0 50.0 95.0 105.0 Ohio ....................... 195.0 195.0 25.0 25.0 225.0 245.0 Oklahoma .............. 910.0 870.0 125.0 140.0 740.0 810.0 Oregon ................... 160.0 165.0 36.0 40.0 159.0 170.0 Pennsylvania ......... 185.0 145.0 25.0 25.0 275.0 265.0 Rhode Island ......... 0.5 0.5 0.1 0.1 0.8 0.8 South Carolina ....... 12.0 9.0 14.0 14.0 76.0 80.0 South Dakota ......... 690.0 680.0 95.0 100.0 305.0 250.0 Tennessee ............. 135.0 120.0 60.0 60.0 410.0 390.0 Texas ..................... 2,370.0 2,520.0 280.0 320.0 1,800.0 1,870.0 Utah ....................... 85.0 78.0 23.0 22.0 82.0 70.0 Vermont ................. 4.0 4.0 3.0 3.0 43.0 44.0 Virginia ................... 170.0 155.0 40.0 40.0 345.0 350.0 Washington ............ 160.0 175.0 19.0 18.0 146.0 157.0 West Virginia ......... 45.0 44.0 14.0 13.0 62.0 62.0 Wisconsin .............. 380.0 375.0 30.0 35.0 650.0 690.0 Wyoming ................ 150.0 135.0 40.0 40.0 95.0 85.0
United States ......... 15,667.9 15,629.5 2,037.8 2,109.4 13,557.9 13,533.9
NASS, Livestock Branch, (202) 720–3570.
VII–5 AGRICULTURAL STATISTICS 2016
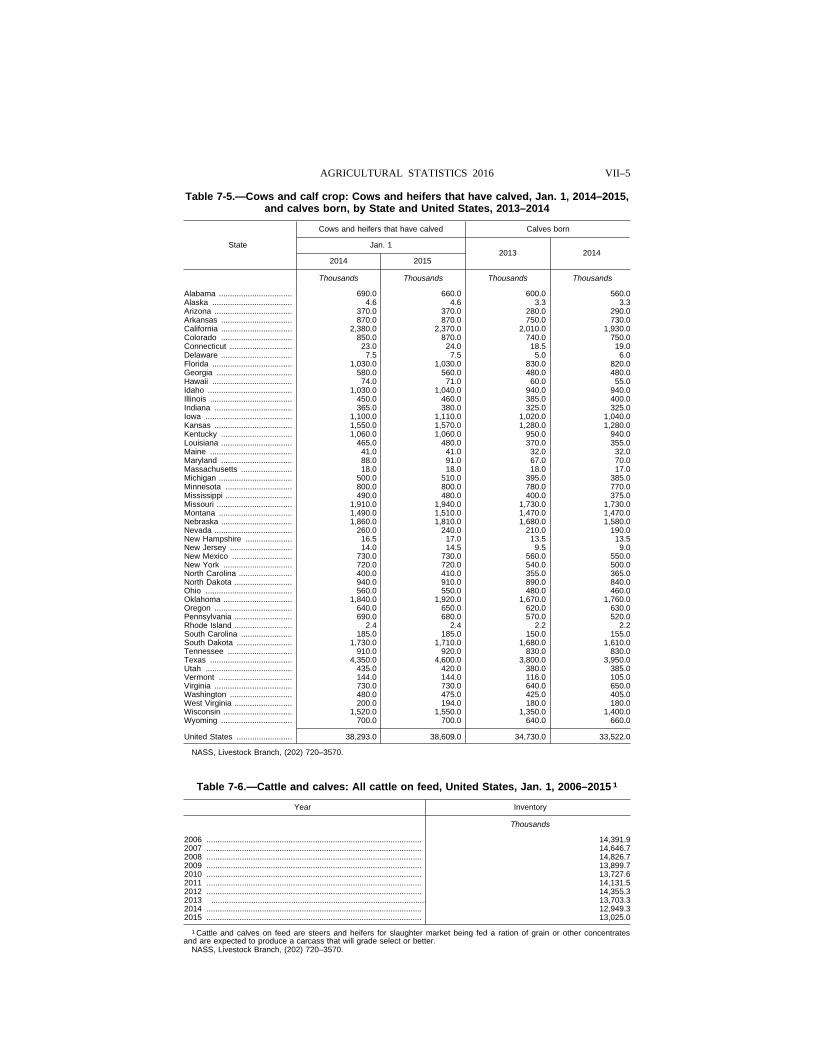
Table 7-5.—Cows and calf crop: Cows and heifers that have calved, Jan. 1, 2014–2015, and calves born, by State and United States, 2013–2014
State
Cows and heifers that have calved Calves born
Jan. 1 2013 2014
2014 2015
Thousands Thousands Thousands Thousands
Alabama ................................. 690.0 660.0 600.0 560.0 Alaska .................................... 4.6 4.6 3.3 3.3 Arizona ................................... 370.0 370.0 280.0 290.0 Arkansas ................................ 870.0 870.0 750.0 730.0 California ................................ 2,380.0 2,370.0 2,010.0 1,930.0 Colorado ................................ 850.0 870.0 740.0 750.0 Connecticut ............................ 23.0 24.0 18.5 19.0 Delaware ................................ 7.5 7.5 5.0 6.0 Florida .................................... 1,030.0 1,030.0 830.0 820.0 Georgia .................................. 580.0 560.0 480.0 480.0 Hawaii .................................... 74.0 71.0 60.0 55.0 Idaho ...................................... 1,030.0 1,040.0 940.0 940.0 Illinois ..................................... 450.0 460.0 385.0 400.0 Indiana ................................... 365.0 380.0 325.0 325.0 Iowa ....................................... 1,100.0 1,110.0 1,020.0 1,040.0 Kansas ................................... 1,550.0 1,570.0 1,280.0 1,280.0 Kentucky ................................ 1,060.0 1,060.0 950.0 940.0 Louisiana ................................ 465.0 480.0 370.0 355.0 Maine ..................................... 41.0 41.0 32.0 32.0 Maryland ................................ 88.0 91.0 67.0 70.0 Massachusetts ....................... 18.0 18.0 18.0 17.0 Michigan ................................. 500.0 510.0 395.0 385.0 Minnesota .............................. 800.0 800.0 780.0 770.0 Mississippi .............................. 490.0 480.0 400.0 375.0 Missouri .................................. 1,910.0 1,940.0 1,730.0 1,730.0 Montana ................................. 1,490.0 1,510.0 1,470.0 1,470.0 Nebraska ................................ 1,860.0 1,810.0 1,680.0 1,580.0 Nevada ................................... 260.0 240.0 210.0 190.0 New Hampshire ..................... 16.5 17.0 13.5 13.5 New Jersey ............................ 14.0 14.5 9.5 9.0 New Mexico ........................... 730.0 730.0 560.0 550.0 New York ............................... 720.0 720.0 540.0 500.0 North Carolina ........................ 400.0 410.0 355.0 365.0 North Dakota .......................... 940.0 910.0 890.0 840.0 Ohio ....................................... 560.0 550.0 480.0 460.0 Oklahoma ............................... 1,840.0 1,920.0 1,670.0 1,760.0 Oregon ................................... 640.0 650.0 620.0 630.0 Pennsylvania .......................... 690.0 680.0 570.0 520.0 Rhode Island .......................... 2.4 2.4 2.2 2.2 South Carolina ....................... 185.0 185.0 150.0 155.0 South Dakota ......................... 1,730.0 1,710.0 1,680.0 1,610.0 Tennessee ............................. 910.0 920.0 830.0 830.0 Texas ..................................... 4,350.0 4,600.0 3,800.0 3,950.0 Utah ....................................... 435.0 420.0 380.0 385.0 Vermont ................................. 144.0 144.0 116.0 105.0 Virginia ................................... 730.0 730.0 640.0 650.0 Washington ............................ 480.0 475.0 425.0 405.0 West Virginia .......................... 200.0 194.0 180.0 180.0 Wisconsin ............................... 1,520.0 1,550.0 1,350.0 1,400.0 Wyoming ................................ 700.0 700.0 640.0 660.0
United States ......................... 38,293.0 38,609.0 34,730.0 33,522.0
NASS, Livestock Branch, (202) 720–3570.
Table 7-6.—Cattle and calves: All cattle on feed, United States, Jan. 1, 2006–2015 1
Year Inventory
Thousands
2006 ................................................................................................. 14,391.9 2007 ................................................................................................. 14,646.7 2008 ................................................................................................. 14,826.7 2009 ................................................................................................. 13,899.7 2010 ................................................................................................. 13,727.6 2011 ................................................................................................. 14,131.5 2012 ................................................................................................. 14,355.3 2013 ................................................................................................. 13,703.3 2014 ................................................................................................. 12,949.3 2015 ................................................................................................. 13,025.0
1 Cattle and calves on feed are steers and heifers for slaughter market being fed a ration of grain or other concentrates and are expected to produce a carcass that will grade select or better.
NASS, Livestock Branch, (202) 720–3570.
VII–6 STATISTICS OF CATTLE, HOGS, AND SHEEP
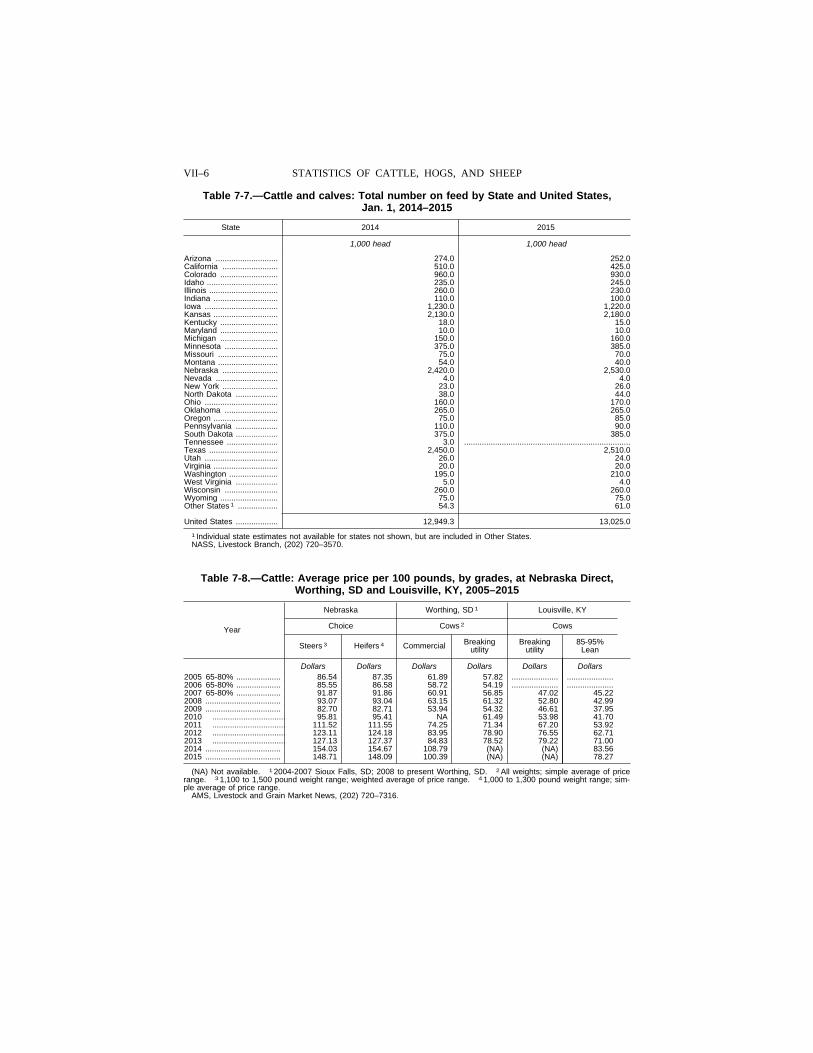
Table 7-7.—Cattle and calves: Total number on feed by State and United States, Jan. 1, 2014–2015
State 2014 2015
1,000 head 1,000 head
Arizona ............................ 274.0 252.0 California ......................... 510.0 425.0 Colorado .......................... 960.0 930.0 Idaho ................................ 235.0 245.0 Illinois ............................... 260.0 230.0 Indiana ............................. 110.0 100.0 Iowa ................................. 1,230.0 1,220.0 Kansas ............................. 2,130.0 2,180.0 Kentucky .......................... 18.0 15.0 Maryland .......................... 10.0 10.0 Michigan .......................... 150.0 160.0 Minnesota ........................ 375.0 385.0 Missouri ........................... 75.0 70.0 Montana ........................... 54.0 40.0 Nebraska ......................... 2,420.0 2,530.0 Nevada ............................ 4.0 4.0 New York ......................... 23.0 26.0 North Dakota ................... 38.0 44.0 Ohio ................................. 160.0 170.0 Oklahoma ........................ 265.0 265.0 Oregon ............................. 75.0 85.0 Pennsylvania ................... 110.0 90.0 South Dakota ................... 375.0 385.0 Tennessee ....................... 3.0 ...........................................................................Texas ............................... 2,450.0 2,510.0 Utah ................................. 26.0 24.0 Virginia ............................. 20.0 20.0 Washington ...................... 195.0 210.0 West Virginia ................... 5.0 4.0 Wisconsin ........................ 260.0 260.0 Wyoming .......................... 75.0 75.0 Other States 1 .................. 54.3 61.0
United States ................... 12,949.3 13,025.0
1 Individual state estimates not available for states not shown, but are included in Other States. NASS, Livestock Branch, (202) 720–3570.
Table 7-8.—Cattle: Average price per 100 pounds, by grades, at Nebraska Direct, Worthing, SD and Louisville, KY, 2005–2015
Year
Nebraska Worthing, SD 1 Louisville, KY
Choice Cows 2 Cows
Steers 3 Heifers 4 Commercial Breaking utility
Breaking utility
85-95% Lean
Dollars Dollars Dollars Dollars Dollars Dollars 2005 65-80% .................... 86.54 87.35 61.89 57.82 ..................... .....................2006 65-80% .................... 85.55 86.58 58.72 54.19 ..................... .....................2007 65-80% .................... 91.87 91.86 60.91 56.85 47.02 45.22 2008 .................................. 93.07 93.04 63.15 61.32 52.80 42.99 2009 .................................. 82.70 82.71 53.94 54.32 46.61 37.95 2010 ................................. 95.81 95.41 NA 61.49 53.98 41.70 2011 ................................. 111.52 111.55 74.25 71.34 67.20 53.92 2012 ................................. 123.11 124.18 83.95 78.90 76.55 62.71 2013 ................................. 127.13 127.37 84.83 78.52 79.22 71.00 2014 .................................. 154.03 154.67 108.79 (NA) (NA) 83.56 2015 .................................. 148.71 148.09 100.39 (NA) (NA) 78.27
(NA) Not available. 1 2004-2007 Sioux Falls, SD; 2008 to present Worthing, SD. 2 All weights; simple average of price range. 3 1,100 to 1,500 pound weight range; weighted average of price range. 4 1,000 to 1,300 pound weight range; sim-ple average of price range.
AMS, Livestock and Grain Market News, (202) 720–7316.

VII–7 AGRICULTURAL STATISTICS 2016
Table 7-9.—Cattle and calves: Production, disposition, cash receipts, and gross income, United States, 2006–2015
Year Calf crop 1
Death loss Marketings 2
Inshipments 3
Farm slaughter
Cattle Calves Cattle Calves Cattle and calves
1,000 head 1,000 head 1,000 head 1,000 head 1,000 head 1,000 head 1,000 head
2006 ......... 37,016 1,818 2,348 44,789 8,856 21,213 187 2007 ......... 36,759 1,856 2,394 45,008 8,956 21,104 188 2008 ......... 36,158 1,760 2,314 44,238 8,752 19,769 176 2009 ......... 35,939 1,741 2,323 43,369 8,530 19,550 167 2010 ......... 35,740 1,736 2,265 44,658 8,874 20,757 157 2011 ......... 35,357 1,787 2,230 44,875 8,401 20,357 148 2012 ......... 34,469 1,752 2,171 43,578 8,337 20,443 139 2013 ......... 33,730 1,730 2,140 43,259 8,007 19,965 128 2014 ........ 33,522 1,720 2,130 41,526 7,849 20,443 124 2015 ......... 34,087 1,736 2,144 40,605 7,454 20,599 115
Year Production (live weight) 4
Value of production
Cash receipts 5
Value of home
consumption
Gross income 6
Average price per 100 pounds received by farmers
Cattle Calves
1,000 1,000 1,000 1,000 1,000 pounds dollars dollars dollars dollars Dollars Dollars
2006 ......... 41,824,568 35,490,732 49,110,330 447,857 49,558,187 87.20 133.00 2007 ......... 41,437,021 35,973,068 49,843,322 441,051 50,284,373 89.90 119.00 2008 ......... 41,586,134 35,597,898 48,394,131 404,745 48,798,876 89.10 110.00 2009 ......... 41,033,359 31,897,074 43,720,324 368,285 44,088,609 80.30 105.00 2010 ......... 41,379,839 36,850,474 51,246,136 405,789 51,651,925 92.20 117.00 2011 ......... 41,483,945 45,059,200 62,321,217 478,871 62,800,088 113.00 142.00 2012 ......... 40,920,479 48,059,904 66,090,126 525,630 66,615,756 121.00 172.00 2013 ......... 40,695,232 48,478,687 67,457,442 509,175 67,966,617 125,00 181.00 2014 ........ 40,171,339 59,921,694 81,478,368 610,809 82,089,177 152.00 261.00 2015 ......... 41,456,124 59,857,570 78,228,639 587,013 78,815,652 147.00 247.00
1 Calves born during the year. 2 Includes custom slaughter for use on farms where produced and State outshipments, but excludes interfarm sales within the State. 3 Includes cattle shipped in from other States, but excludes cattle for imme-diate slaughter. 4 Adjustments made for changes in inventory and for inshipments. 5 Receipts from marketings and sale of farm slaughter. 6 Cash receipts from sales of cattle, calves, beef, and veal plus value of cattle and calves slaughtered for home consumption.
NASS, Livestock Branch, (202) 720–3570.
Table 7-10.—Cattle: Weighted average weight and price per 100 pounds, Texas- Oklahoma, Kansas, Colorado, Nebraska, Iowa-So. Minnesota Feedlots, 2005–2015 1
Year Steers SE/CH 65-80% Steers SE/CH 35-65%
Price Average Weight Number of Head Price Average Weight Number of Head
Dollars Pounds Dollars Pounds
2005 ... 86.28 1,336 326,751 87.66 1,265 2,492,108 2006 ... 85.51 1,358 317,732 85.75 1,282 2,319,896 2007 ... 92.21 1,366 359,511 92.10 1,289 2,081,144 2008 ... 93.37 1,360 344,633 93.16 1,294 1,757,049 2009 ... 82.81 1,376 476,823 83.59 1,314 1,474,925 2010 ... 95.00 1,359 561,173 95.95 1,301 1,329,021 2011 ... 114.45 1,364 518,689 114.92 1,304 1,101,808 2012 ... 122.84 1,402 458,382 123.06 1,312 743,859 2013 ... 126.27 1,408 384,642 126.35 1,338 517,782 2014 ... 154.25 1,410 548,667 152.15 1,339 386,051 2015 ... 147.64 1,432 314,078 149.00 1,366 228,126
Year Heifers SE/CH 65-80% Heifers SE/CH 35-65%
Price Average Weight Number of Head Price Average Weight Number of Head
Dollars Pounds Dollars Pounds
2005 ... 87.23 1,219 313,240 87.90 1,145 1,901,730 2006 ... 86.57 1,245 247,902 86.06 1,165 1,781,077 2007 ... 92.01 1,241 357,880 93.09 1,165 1,582,183 2008 ... 92.95 1,229 342,547 93.22 1,170 1,317,211 2009 ... 82.88 1,252 498,481 83.63 1,180 1,136,234 2010 ... 95.41 1,227 562,788 96.22 1,166 1,159,191 2011 ... 114.05 1,222 508,487 114.64 1,167 928,633 2012 ... 123.38 1,255 412,483 123.31 1,173 577,535 2013 ... 126.09 1,266 320,285 126.36 1,198 335,205 2014 ... 154.37 1,279 322,272 152.18 1,204 218,658 2015 ... 148.20 1,289 220,073 147.73 1,235 97,078
1 Sales FOB the feedyard. Estimated net weights after 3-4% shrink. AMS, Livestock and Grain Market News, (202) 720–7316.
VII–8 STATISTICS OF CATTLE, HOGS, AND SHEEP
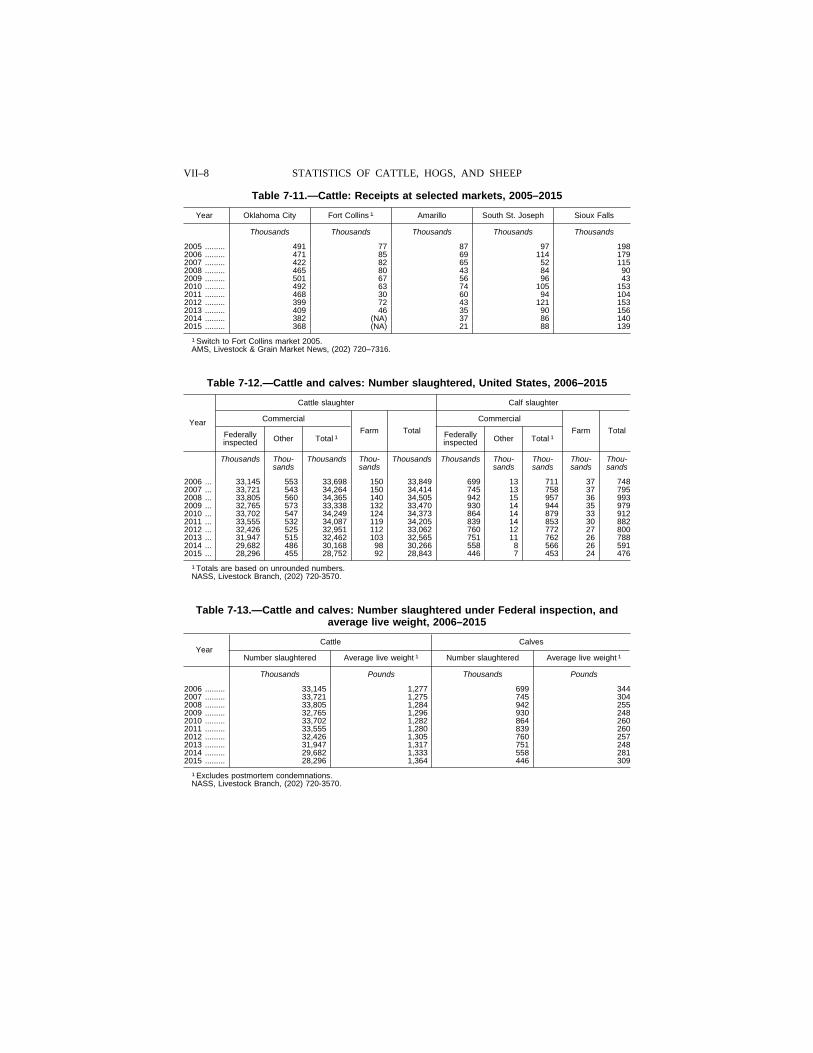
Table 7-11.—Cattle: Receipts at selected markets, 2005–2015
Year Oklahoma City Fort Collins 1 Amarillo South St. Joseph Sioux Falls
Thousands Thousands Thousands Thousands Thousands
2005 ......... 491 77 87 97 198 2006 ......... 471 85 69 114 179 2007 ......... 422 82 65 52 115 2008 ......... 465 80 43 84 90 2009 ......... 501 67 56 96 43 2010 ......... 492 63 74 105 153 2011 ......... 468 30 60 94 104 2012 ......... 399 72 43 121 153 2013 ......... 409 46 35 90 156 2014 ......... 382 (NA) 37 86 140 2015 ......... 368 (NA) 21 88 139
1 Switch to Fort Collins market 2005. AMS, Livestock & Grain Market News, (202) 720–7316.
Table 7-12.—Cattle and calves: Number slaughtered, United States, 2006–2015
Year
Cattle slaughter Calf slaughter
Commercial
Farm Total
Commercial
Farm Total Federally inspected Other Total 1 Federally
inspected Other Total 1
Thousands Thou- Thousands Thou- Thousands Thousands Thou- Thou- Thou- Thou- sands sands sands sands sands sands
2006 ... 33,145 553 33,698 150 33,849 699 13 711 37 748 2007 ... 33,721 543 34,264 150 34,414 745 13 758 37 795 2008 ... 33,805 560 34,365 140 34,505 942 15 957 36 993 2009 ... 32,765 573 33,338 132 33,470 930 14 944 35 979 2010 ... 33,702 547 34,249 124 34,373 864 14 879 33 912 2011 ... 33,555 532 34,087 119 34,205 839 14 853 30 882 2012 ... 32,426 525 32,951 112 33,062 760 12 772 27 800 2013 ... 31,947 515 32,462 103 32,565 751 11 762 26 788 2014 ... 29,682 486 30,168 98 30,266 558 8 566 26 591 2015 ... 28,296 455 28,752 92 28,843 446 7 453 24 476
1 Totals are based on unrounded numbers. NASS, Livestock Branch, (202) 720-3570.
Table 7-13.—Cattle and calves: Number slaughtered under Federal inspection, and average live weight, 2006–2015
Year Cattle Calves
Number slaughtered Average live weight 1 Number slaughtered Average live weight 1
Thousands Pounds Thousands Pounds
2006 ......... 33,145 1,277 699 344 2007 ......... 33,721 1,275 745 304 2008 ......... 33,805 1,284 942 255 2009 ......... 32,765 1,296 930 248 2010 ......... 33,702 1,282 864 260 2011 ......... 33,555 1,280 839 260 2012 ......... 32,426 1,305 760 257 2013 ......... 31,947 1,317 751 248 2014 ......... 29,682 1,333 558 281 2015 ......... 28,296 1,364 446 309
1 Excludes postmortem condemnations. NASS, Livestock Branch, (202) 720-3570.
VII–9 AGRICULTURAL STATISTICS 2016
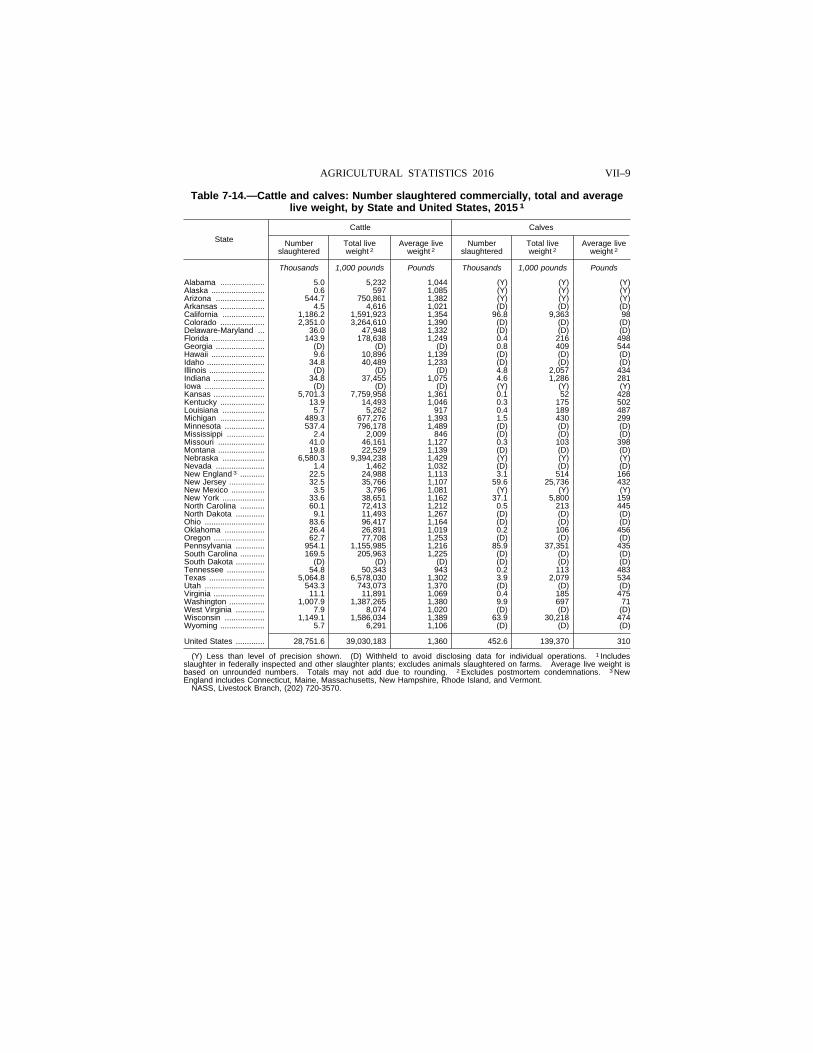
Table 7-14.—Cattle and calves: Number slaughtered commercially, total and average live weight, by State and United States, 2015 1
State
Cattle Calves
Number slaughtered
Total live weight 2
Average live weight 2
Number slaughtered
Total live weight 2
Average live weight 2
Thousands 1,000 pounds Pounds Thousands 1,000 pounds Pounds
Alabama .................... 5.0 5,232 1,044 (Y) (Y) (Y) Alaska ........................ 0.6 597 1,085 (Y) (Y) (Y) Arizona ...................... 544.7 750,861 1,382 (Y) (Y) (Y) Arkansas .................... 4.5 4,616 1,021 (D) (D) (D) California ................... 1,186.2 1,591,923 1,354 96.8 9,363 98 Colorado .................... 2,351.0 3,264,610 1,390 (D) (D) (D) Delaware-Maryland ... 36.0 47,948 1,332 (D) (D) (D) Florida ........................ 143.9 178,638 1,249 0.4 216 498 Georgia ...................... (D) (D) (D) 0.8 409 544 Hawaii ........................ 9.6 10,896 1,139 (D) (D) (D) Idaho .......................... 34.8 40,489 1,233 (D) (D) (D) Illinois ......................... (D) (D) (D) 4.8 2,057 434 Indiana ....................... 34.8 37,455 1,075 4.6 1,286 281 Iowa ........................... (D) (D) (D) (Y) (Y) (Y) Kansas ....................... 5,701.3 7,759,958 1,361 0.1 52 428 Kentucky .................... 13.9 14,493 1,046 0.3 175 502 Louisiana ................... 5.7 5,262 917 0.4 189 487 Michigan .................... 489.3 677,276 1,393 1.5 430 299 Minnesota .................. 537.4 796,178 1,489 (D) (D) (D) Mississippi ................. 2.4 2,009 846 (D) (D) (D) Missouri ..................... 41.0 46,161 1,127 0.3 103 398 Montana ..................... 19.8 22,529 1,139 (D) (D) (D) Nebraska ................... 6,580.3 9,394,238 1,429 (Y) (Y) (Y) Nevada ...................... 1.4 1,462 1,032 (D) (D) (D) New England 3 ........... 22.5 24,988 1,113 3.1 514 166 New Jersey ................ 32.5 35,766 1,107 59.6 25,736 432 New Mexico ............... 3.5 3,796 1,081 (Y) (Y) (Y) New York ................... 33.6 38,651 1,162 37.1 5,800 159 North Carolina ........... 60.1 72,413 1,212 0.5 213 445 North Dakota ............. 9.1 11,493 1,267 (D) (D) (D) Ohio ........................... 83.6 96,417 1,164 (D) (D) (D) Oklahoma .................. 26.4 26,891 1,019 0.2 106 456 Oregon ....................... 62.7 77,708 1,253 (D) (D) (D) Pennsylvania ............. 954.1 1,155,985 1,216 85.9 37,351 435 South Carolina ........... 169.5 205,963 1,225 (D) (D) (D) South Dakota ............. (D) (D) (D) (D) (D) (D) Tennessee ................. 54.8 50,343 943 0.2 113 483 Texas ......................... 5,064.8 6,578,030 1,302 3.9 2,079 534 Utah ........................... 543.3 743,073 1,370 (D) (D) (D) Virginia ....................... 11.1 11,891 1,069 0.4 185 475 Washington ................ 1,007.9 1,387,265 1,380 9.9 697 71 West Virginia ............. 7.9 8,074 1,020 (D) (D) (D) Wisconsin .................. 1,149.1 1,586,034 1,389 63.9 30,218 474 Wyoming .................... 5.7 6,291 1,106 (D) (D) (D)
United States ............. 28,751.6 39,030,183 1,360 452.6 139,370 310
(Y) Less than level of precision shown. (D) Withheld to avoid disclosing data for individual operations. 1 Includes slaughter in federally inspected and other slaughter plants; excludes animals slaughtered on farms. Average live weight is based on unrounded numbers. Totals may not add due to rounding. 2 Excludes postmortem condemnations. 3 New England includes Connecticut, Maine, Massachusetts, New Hampshire, Rhode Island, and Vermont.
NASS, Livestock Branch, (202) 720-3570.
VII–10 STATISTICS OF CATTLE, HOGS, AND SHEEP
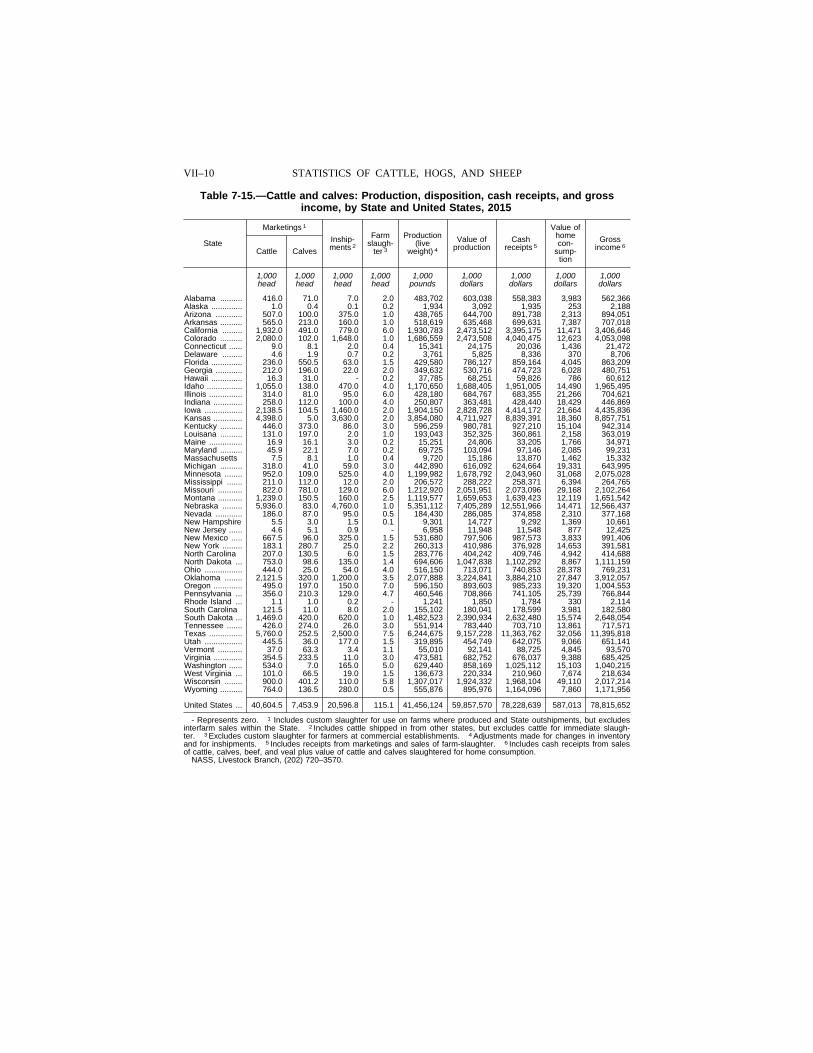
Table 7-15.—Cattle and calves: Production, disposition, cash receipts, and gross income, by State and United States, 2015
State
Marketings 1
Inship- ments 2
Farm slaugh-
ter 3
Production (live
weight) 4
Value of production
Cash receipts 5
Value of home con-
sump-tion
Gross income 6 Cattle Calves
1,000 head
1,000 head
1,000 head
1,000 head
1,000 pounds
1,000 dollars
1,000 dollars
1,000 dollars
1,000 dollars
Alabama .......... 416.0 71.0 7.0 2.0 483,702 603,038 558,383 3,983 562,366 Alaska .............. 1.0 0.4 0.1 0.2 1,934 3,092 1,935 253 2,188 Arizona ............ 507.0 100.0 375.0 1.0 438,765 644,700 891,738 2,313 894,051 Arkansas .......... 565.0 213.0 160.0 1.0 518,619 635,468 699,631 7,387 707,018 California ......... 1,932.0 491.0 779.0 6.0 1,930,783 2,473,512 3,395,175 11,471 3,406,646 Colorado .......... 2,080.0 102.0 1,648.0 1.0 1,686,559 2,473,508 4,040,475 12,623 4,053,098 Connecticut ...... 9.0 8.1 2.0 0.4 15,341 24,175 20,036 1,436 21,472 Delaware ......... 4.6 1.9 0.7 0.2 3,761 5,825 8,336 370 8,706 Florida .............. 236.0 550.5 63.0 1.5 429,580 786,127 859,164 4,045 863,209 Georgia ............ 212.0 196.0 22.0 2.0 349,632 530,716 474,723 6,028 480,751 Hawaii .............. 16.3 31.0 - 0.2 37,785 68,251 59,826 786 60,612 Idaho ................ 1,055.0 138.0 470.0 4.0 1,170,650 1,688,405 1,951,005 14,490 1,965,495 Illinois ............... 314.0 81.0 95.0 6.0 428,180 684,767 683,355 21,266 704,621 Indiana ............. 258.0 112.0 100.0 4.0 250,807 363,481 428,440 18,429 446,869 Iowa ................. 2,138.5 104.5 1,460.0 2.0 1,904,150 2,828,728 4,414,172 21,664 4,435,836 Kansas ............. 4,398.0 5.0 3,630.0 2.0 3,854,080 4,711,927 8,839,391 18,360 8,857,751 Kentucky .......... 446.0 373.0 86.0 3.0 596,259 980,781 927,210 15,104 942,314 Louisana .......... 131.0 197.0 2.0 1.0 193,043 352,325 360,861 2,158 363,019 Maine ............... 16.9 16.1 3.0 0.2 15,251 24,806 33,205 1,766 34,971 Maryland .......... 45.9 22.1 7.0 0.2 69,725 103,094 97,146 2,085 99,231 Massachusetts 7.5 8.1 1.0 0.4 9,720 15,186 13,870 1,462 15,332 Michigan .......... 318.0 41.0 59.0 3.0 442,890 616,092 624,664 19,331 643,995 Minnesota ........ 952.0 109.0 525.0 4.0 1,199,982 1,678,792 2,043,960 31,068 2,075,028 Mississippi ....... 211.0 112.0 12.0 2.0 206,572 288,222 258,371 6,394 264,765 Missouri ........... 822.0 781.0 129.0 6.0 1,212,920 2,051,951 2,073,096 29,168 2,102,264 Montana ........... 1,239.0 150.5 160.0 2.5 1,119,577 1,659,653 1,639,423 12,119 1,651,542 Nebraska ......... 5,936.0 83.0 4,760.0 1.0 5,351,112 7,405,289 12,551,966 14,471 12,566,437 Nevada ............ 186.0 87.0 95.0 0.5 184,430 286,085 374,858 2,310 377,168 New Hampshire 5.5 3.0 1.5 0.1 9,301 14,727 9,292 1,369 10,661 New Jersey ...... 4.6 5.1 0.9 - 6,958 11,948 11,548 877 12,425 New Mexico ..... 667.5 96.0 325.0 1.5 531,680 797,506 987,573 3,833 991,406 New York ......... 183.1 280.7 25.0 2.2 260,313 410,986 376,928 14,653 391,581 North Carolina 207.0 130.5 6.0 1.5 283,776 404,242 409,746 4,942 414,688 North Dakota ... 753.0 98.6 135.0 1.4 694,606 1,047,838 1,102,292 8,867 1,111,159 Ohio ................. 444.0 25.0 54.0 4.0 516,150 713,071 740,853 28,378 769,231 Oklahoma ........ 2,121.5 320.0 1,200.0 3.5 2,077,888 3,224,841 3,884,210 27,847 3,912,057 Oregon ............. 495.0 197.0 150.0 7.0 596,150 893,603 985,233 19,320 1,004,553 Pennsylvania ... 356.0 210.3 129.0 4.7 460,546 708,866 741,105 25,739 766,844 Rhode Island ... 1.1 1.0 0.2 - 1,241 1,850 1,784 330 2,114 South Carolina 121.5 11.0 8.0 2.0 155,102 180,041 178,599 3,981 182,580 South Dakota ... 1,469.0 420.0 620.0 1.0 1,482,523 2,390,934 2,632,480 15,574 2,648,054 Tennessee ....... 426.0 274.0 26.0 3.0 551,914 783,440 703,710 13,861 717,571 Texas ............... 5,760.0 252.5 2,500.0 7.5 6,244,675 9,157,228 11,363,762 32,056 11,395,818 Utah ................. 445.5 36.0 177.0 1.5 319,895 454,749 642,075 9,066 651,141 Vermont ........... 37.0 63.3 3.4 1.1 55,010 92,141 88,725 4,845 93,570 Virginia ............. 354.5 233.5 11.0 3.0 473,581 682,752 676,037 9,388 685,425 Washington ...... 534.0 7.0 165.0 5.0 629,440 858,169 1,025,112 15,103 1,040,215 West Virginia ... 101.0 66.5 19.0 1.5 136,673 220,334 210,960 7,674 218,634 Wisconsin ........ 900.0 401.2 110.0 5.8 1,307,017 1,924,332 1,968,104 49,110 2,017,214 Wyoming .......... 764.0 136.5 280.0 0.5 555,876 895,976 1,164,096 7,860 1,171,956
United States ... 40,604.5 7,453.9 20,596.8 115.1 41,456,124 59,857,570 78,228,639 587,013 78,815,652
- Represents zero. 1 Includes custom slaughter for use on farms where produced and State outshipments, but excludes interfarm sales within the State. 2 Includes cattle shipped in from other states, but excludes cattle for immediate slaugh-ter. 3 Excludes custom slaughter for farmers at commercial establishments. 4 Adjustments made for changes in inventory and for inshipments. 5 Includes receipts from marketings and sales of farm-slaughter. 6 Includes cash receipts from sales of cattle, calves, beef, and veal plus value of cattle and calves slaughtered for home consumption.
NASS, Livestock Branch, (202) 720–3570.
VII–11 AGRICULTURAL STATISTICS 2016
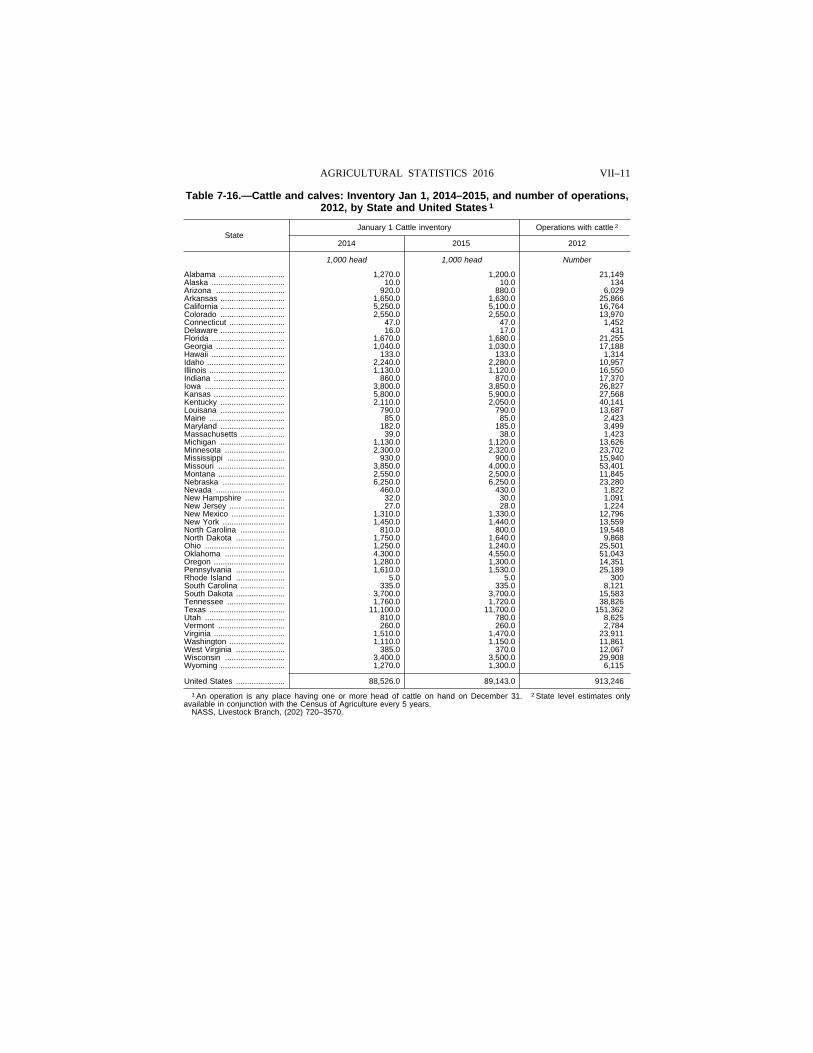
Table 7-16.—Cattle and calves: Inventory Jan 1, 2014–2015, and number of operations, 2012, by State and United States 1
State January 1 Cattle inventory Operations with cattle 2
2014 2015 2012
1,000 head 1,000 head Number
Alabama .............................. 1,270 .0 1,200 .0 21,149 Alaska ................................. 10 .0 10 .0 134 Arizona ............................... 920 .0 880 .0 6,029 Arkansas ............................. 1,650 .0 1,630 .0 25,866 California ............................. 5,250 .0 5,100 .0 16,764 Colorado ............................. 2,550 .0 2,550 .0 13,970 Connecticut ......................... 47 .0 47 .0 1,452 Delaware ............................. 16 .0 17 .0 431 Florida ................................. 1,670 .0 1,680 .0 21,255 Georgia ............................... 1,040 .0 1,030 .0 17,188 Hawaii ................................. 133 .0 133 .0 1,314 Idaho ................................... 2,240 .0 2,280 .0 10,957 Illinois .................................. 1,130 .0 1,120 .0 16,550 Indiana ................................ 860 .0 870 .0 17,370 Iowa .................................... 3,800 .0 3,850 .0 26,827 Kansas ................................ 5,800 .0 5,900 .0 27,568 Kentucky ............................. 2,110 .0 2,050 .0 40,141 Louisana ............................. 790 .0 790 .0 13,687 Maine .................................. 85 .0 85 .0 2,423 Maryland ............................. 182 .0 185 .0 3,499 Massachusetts .................... 39 .0 38 .0 1,423 Michigan ............................. 1,130 .0 1,120 .0 13,626 Minnesota ........................... 2,300 .0 2,320 .0 23,702 Mississippi .......................... 930 .0 900 .0 15,940 Missouri .............................. 3,850 .0 4,000 .0 53,401 Montana .............................. 2,550 .0 2,500 .0 11,845 Nebraska ............................ 6,250 .0 6,250 .0 23,280 Nevada ............................... 460 .0 430 .0 1,822 New Hampshire .................. 32 .0 30 .0 1,091 New Jersey ......................... 27 .0 28 .0 1,224 New Mexico ........................ 1,310 .0 1,330 .0 12,796 New York ............................ 1,450 .0 1,440 .0 13,559 North Carolina .................... 810 .0 800 .0 19,548 North Dakota ...................... 1,750 .0 1,640 .0 9,868 Ohio .................................... 1,250 .0 1,240 .0 25,501 Oklahoma ........................... 4,300 .0 4,550 .0 51,043 Oregon ................................ 1,280 .0 1,300 .0 14,351 Pennsylvania ...................... 1,610 .0 1,530 .0 25,189 Rhode Island ...................... 5 .0 5 .0 300 South Carolina .................... 335 .0 335 .0 8,121 South Dakota ...................... 3,700 .0 3,700 .0 15,583 Tennessee .......................... 1,760 .0 1,720 .0 38,826 Texas .................................. 11,100 .0 11,700 .0 151,362 Utah .................................... 810 .0 780 .0 8,625 Vermont .............................. 260 .0 260 .0 2,784 Virginia ................................ 1,510 .0 1,470 .0 23,911 Washington ......................... 1,110 .0 1,150 .0 11,861 West Virginia ...................... 385 .0 370 .0 12,067 Wisconsin ........................... 3,400 .0 3,500 .0 29,908 Wyoming ............................. 1,270 .0 1,300 .0 6,115
United States ...................... 88,526 .0 89,143 .0 913,246
1 An operation is any place having one or more head of cattle on hand on December 31. 2 State level estimates only available in conjunction with the Census of Agriculture every 5 years.
NASS, Livestock Branch, (202) 720–3570.
VII–12 STATISTICS OF CATTLE, HOGS, AND SHEEP
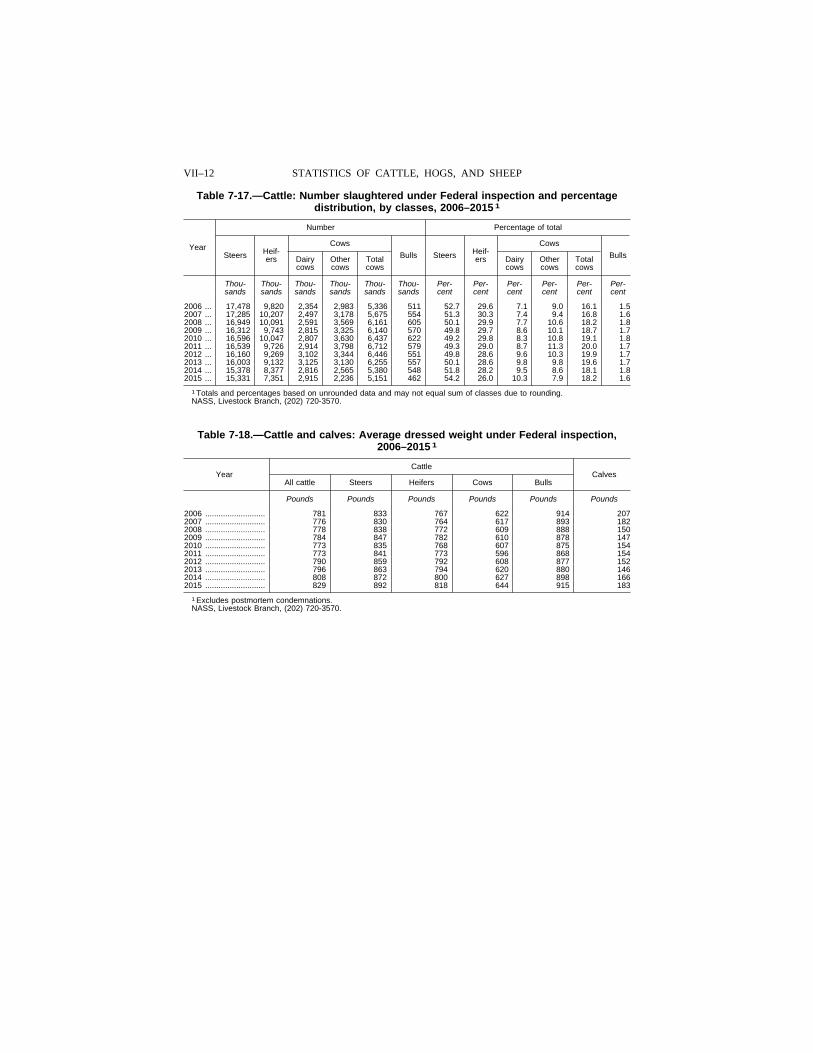
Table 7-17.—Cattle: Number slaughtered under Federal inspection and percentage distribution, by classes, 2006–2015 1
Year
Number Percentage of total
Steers Heif-ers
Cows
Bulls Steers Heif-ers
Cows
Bulls Dairy cows
Other cows
Total cows
Dairy cows
Other cows
Total cows
Thou- Thou- Thou- Thou- Thou- Thou- Per- Per- Per- Per- Per- Per- sands sands sands sands sands sands cent cent cent cent cent cent
2006 ... 17,478 9,820 2,354 2,983 5,336 511 52.7 29.6 7.1 9.0 16.1 1.5 2007 ... 17,285 10,207 2,497 3,178 5,675 554 51.3 30.3 7.4 9.4 16.8 1.6 2008 ... 16,949 10,091 2,591 3,569 6,161 605 50.1 29.9 7.7 10.6 18.2 1.8 2009 ... 16,312 9,743 2,815 3,325 6,140 570 49.8 29.7 8.6 10.1 18.7 1.7 2010 ... 16,596 10,047 2,807 3,630 6,437 622 49.2 29.8 8.3 10.8 19.1 1.8 2011 ... 16,539 9,726 2,914 3,798 6,712 579 49.3 29.0 8.7 11.3 20.0 1.7 2012 ... 16,160 9,269 3,102 3,344 6,446 551 49.8 28.6 9.6 10.3 19.9 1.7 2013 ... 16,003 9,132 3,125 3,130 6,255 557 50.1 28.6 9.8 9.8 19.6 1.7 2014 ... 15,378 8,377 2,816 2,565 5,380 548 51.8 28.2 9.5 8.6 18.1 1.8 2015 ... 15,331 7,351 2,915 2,236 5,151 462 54.2 26.0 10.3 7.9 18.2 1.6
1 Totals and percentages based on unrounded data and may not equal sum of classes due to rounding. NASS, Livestock Branch, (202) 720-3570.
Table 7-18.—Cattle and calves: Average dressed weight under Federal inspection, 2006–2015 1
Year Cattle
Calves All cattle Steers Heifers Cows Bulls
Pounds Pounds Pounds Pounds Pounds Pounds
2006 ........................... 781 833 767 622 914 207 2007 ........................... 776 830 764 617 893 182 2008 ........................... 778 838 772 609 888 150 2009 ........................... 784 847 782 610 878 147 2010 ........................... 773 835 768 607 875 154 2011 ........................... 773 841 773 596 868 154 2012 ........................... 790 859 792 608 877 152 2013 ........................... 796 863 794 620 880 146 2014 ........................... 808 872 800 627 898 166 2015 ........................... 829 892 818 644 915 183
1 Excludes postmortem condemnations. NASS, Livestock Branch, (202) 720-3570.
VII–13 AGRICULTURAL STATISTICS 2016
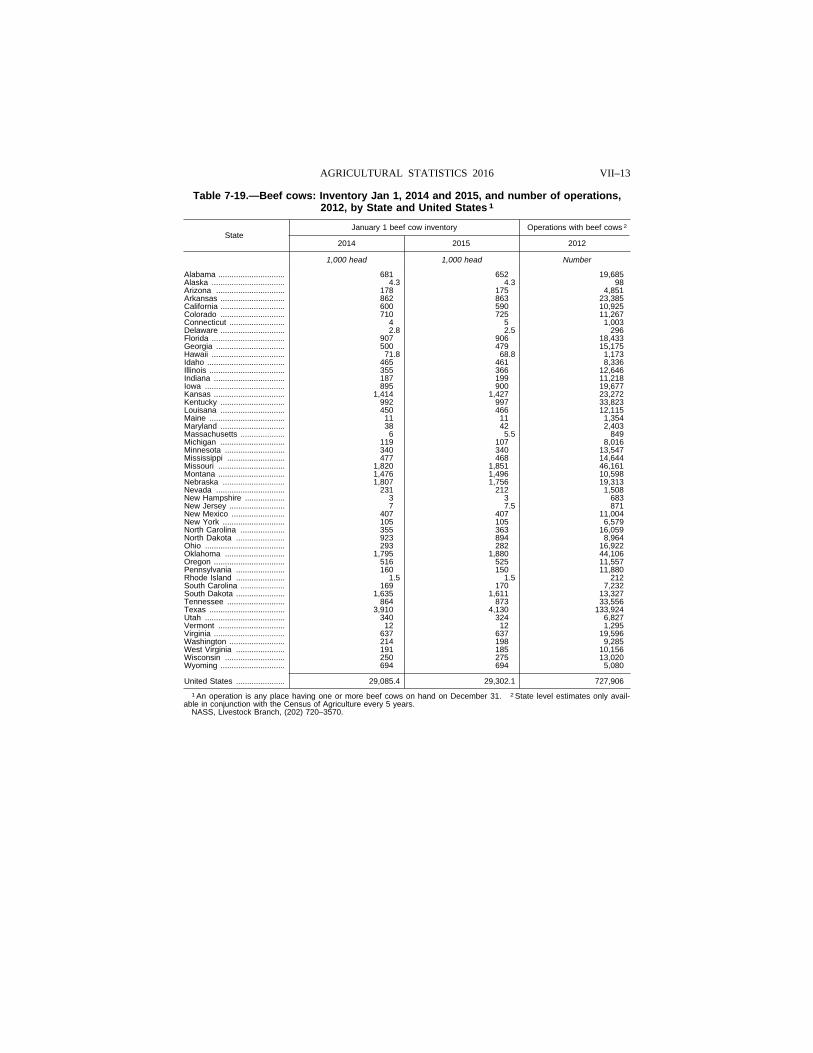
Table 7-19.—Beef cows: Inventory Jan 1, 2014 and 2015, and number of operations, 2012, by State and United States 1
State January 1 beef cow inventory Operations with beef cows 2
2014 2015 2012
1,000 head 1,000 head Number
Alabama .............................. 681 652 19,685 Alaska ................................. 4 .3 4 .3 98 Arizona ............................... 178 175 4,851 Arkansas ............................. 862 863 23,385 California ............................. 600 590 10,925 Colorado ............................. 710 725 11,267 Connecticut ......................... 4 5 1,003 Delaware ............................. 2 .8 2 .5 296 Florida ................................. 907 906 18,433 Georgia ............................... 500 479 15,175 Hawaii ................................. 71 .8 68 .8 1,173 Idaho ................................... 465 461 8,336 Illinois .................................. 355 366 12,646 Indiana ................................ 187 199 11,218 Iowa .................................... 895 900 19,677 Kansas ................................ 1,414 1,427 23,272 Kentucky ............................. 992 997 33,823 Louisana ............................. 450 466 12,115 Maine .................................. 11 11 1,354 Maryland ............................. 38 42 2,403 Massachusetts .................... 6 5 .5 849 Michigan ............................. 119 107 8,016 Minnesota ........................... 340 340 13,547 Mississippi .......................... 477 468 14,644 Missouri .............................. 1,820 1,851 46,161 Montana .............................. 1,476 1,496 10,598 Nebraska ............................ 1,807 1,756 19,313 Nevada ............................... 231 212 1,508 New Hampshire .................. 3 3 683 New Jersey ......................... 7 7 .5 871 New Mexico ........................ 407 407 11,004 New York ............................ 105 105 6,579 North Carolina .................... 355 363 16,059 North Dakota ...................... 923 894 8,964 Ohio .................................... 293 282 16,922 Oklahoma ........................... 1,795 1,880 44,106 Oregon ................................ 516 525 11,557 Pennsylvania ...................... 160 150 11,880 Rhode Island ...................... 1 .5 1 .5 212 South Carolina .................... 169 170 7,232 South Dakota ...................... 1,635 1,611 13,327 Tennessee .......................... 864 873 33,556 Texas .................................. 3,910 4,130 133,924 Utah .................................... 340 324 6,827 Vermont .............................. 12 12 1,295 Virginia ................................ 637 637 19,596 Washington ......................... 214 198 9,285 West Virginia ...................... 191 185 10,156 Wisconsin ........................... 250 275 13,020 Wyoming ............................. 694 694 5,080
United States ...................... 29,085 .4 29,302 .1 727,906
1 An operation is any place having one or more beef cows on hand on December 31. 2 State level estimates only avail-able in conjunction with the Census of Agriculture every 5 years.
NASS, Livestock Branch, (202) 720–3570.

VII–14 STATISTICS OF CATTLE, HOGS, AND SHEEP
Table 7-20.—Hogs and pigs: Inventory and value, Dec. 1, 2014–2015, and number of operations, 2012, by State and United States
State
Inventory Value Operations 1
2014 2015 Value per head Total value
2012 2014 2015 2014 2015
1,000 1,000 Thousands Thousands Dollars Dollars dollars dollars Number
Alabama ............................ 110.0 100.00 150 100 16,500 10,000 689 Alaska ................................ 1.2 1.40 205 195 246 273 37 Arizona .............................. 139.0 132.00 150 100 20,850 13,200 509 Arkansas ............................ 115.0 166.00 165 90 18,975 14,940 752 California ........................... 110.0 95.00 185 125 20,350 11,875 1,437 Colorado ............................ 700.0 700.00 140 99 98,000 69,300 1,001 Connecticut ........................ 2.6 2.50 185 125 481 313 318 Delaware ........................... 4.0 3.00 150 100 600 300 59 Florida ................................ 17.0 16.00 150 100 2,550 1,600 1,642 Georgia .............................. 155.0 160.00 120 82 18,600 13,120 866 Hawaii ................................ 9.0 9.00 170 150 1,530 1,350 231 Idaho .................................. (D) (D) (D) (D) (D) (D) 680 Illinois ................................. 4,700.0 5,100.00 140 99 658,000 504,900 2,045 Indiana ............................... 3,700.0 3,850.00 145 98 536,500 377,300 2,757 Iowa ................................... 21,300.0 20,900.00 150 98 3,195,000 2,048,200 6,266 Kansas ............................... 1,840.0 1,940.00 125 87 230,000 168,780 1,010 Kentucky ............................ 340.0 425.00 105 79 35,700 33,575 1,284 Louisiana ........................... 8.0 8.00 150 100 1,200 800 658 Maine ................................. 4.5 4.50 150 100 675 450 752 Maryland ............................ 21.0 21.00 150 100 3,150 2,100 333 Massachusetts ................... 9.0 11.00 150 100 1,350 1,100 478 Michigan ............................ 1,170.0 1,120.00 155 110 181,350 123,200 2,198 Minnesota .......................... 8,100.0 8,100.00 170 110 1,377,000 891,000 3,355 Mississippi ......................... 575.0 515.00 150 100 86,250 51,500 540 Missouri ............................. 2,850.0 3,050.00 125 87 356,250 265,350 2,128 Montana ............................. 176.0 175.00 150 100 26,400 17,500 406 Nebraska ........................... 3,200.0 3,300.00 145 100 464,000 330,000 1,476 Nevada .............................. 2.0 1.00 185 125 370 125 81 New Hampshire ................. 3.6 3.90 160 105 576 410 359 New Jersey ........................ 10.0 12.00 160 105 1,600 1,260 298 New Mexico ....................... 1.3 1.50 150 100 195 150 211 New York ........................... 70.0 76.00 130 87 9,100 6,612 1,912 North Carolina ................... 8,800.0 8,900.00 120 77 1,056,000 685,300 2,217 North Dakota ..................... 140.0 137.00 150 100 21,000 13,700 218 Ohio ................................... 2,230.0 2,500.00 155 105 345,650 262,500 3,494 Oklahoma .......................... 2,120.0 2,110.00 130 100 275,600 211,000 1,947 Oregon ............................... 9.0 10.00 150 100 1,350 1,000 1,124 Pennsylvania ..................... 1,140.0 1,160.00 130 91 148,200 105,560 3,097 Rhode Island ..................... 1.6 1.50 150 100 240 150 77 South Carolina ................... 255.0 235.00 125 81 31,875 19,035 838 South Dakota ..................... 1,270.0 1,360.00 155 105 196,850 142,800 681 Tennessee ......................... 210.0 220.00 130 87 27,300 19,140 1,297 Texas ................................. 810.0 860.00 125 82 101,250 70,520 4,905 Utah ................................... 610.0 680.00 150 100 91,500 68,000 669 Vermont ............................. 3.5 4.00 185 125 648 500 450 Virginia ............................... 280.0 270.00 115 80 32,200 21,600 1,265 Washington ........................ (D) (D) (D) (D) (D) (D) 934 West Virginia ..................... 4.0 5.00 150 100 600 500 725 Wisconsin .......................... 310.0 320.00 125 92 38,750 29,440 2,270 Wyoming ............................ 83.0 96.00 160 105 13,280 10,080 270 Idaho and Washington ...... 57.0 52.00 150 100 8,550 5,200 ....................
United States ..................... 67,776.3 68,919.30 144 96 9,754,191 6,626,607 63,246
(D) Withheld to avoid disclosing data for individual operations. 1 State level estimates only available in conjunction with the Census of Agriculture every 5 years. An operation is any place having one or more hogs and pigs on hand December 31. Totals may not add due to rounding.
NASS, Livestock Branch, (202) 720–3570.
VII–15 AGRICULTURAL STATISTICS 2016
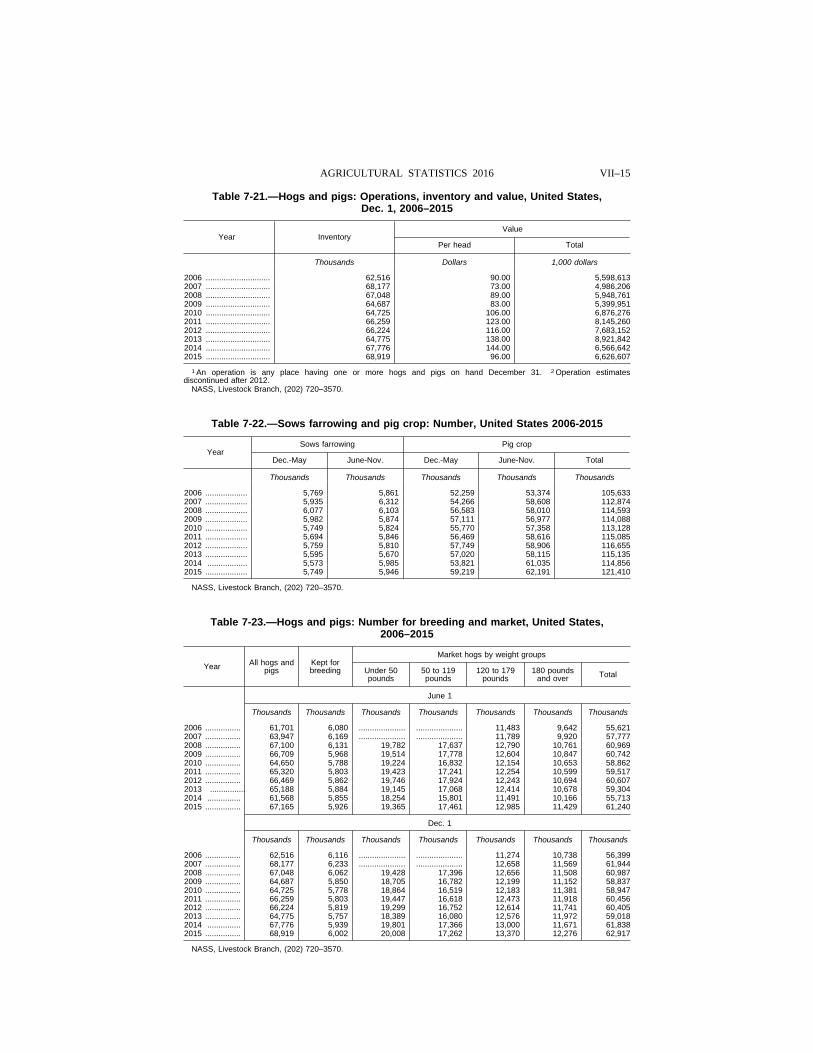
Table 7-21.—Hogs and pigs: Operations, inventory and value, United States, Dec. 1, 2006–2015
Year Inventory Value
Per head Total
Thousands Dollars 1,000 dollars
2006 ............................. 62,516 90.00 5,598,613 2007 ............................. 68,177 73.00 4,986,206 2008 ............................. 67,048 89.00 5,948,761 2009 ............................. 64,687 83.00 5,399,951 2010 ............................. 64,725 106.00 6,876,276 2011 ............................. 66,259 123.00 8,145,260 2012 ............................. 66,224 116.00 7,683,152 2013 ............................. 64,775 138.00 8,921,842 2014 ............................. 67,776 144.00 6,566,642 2015 ............................. 68,919 96.00 6,626,607
1 An operation is any place having one or more hogs and pigs on hand December 31. 2 Operation estimates discontinued after 2012.
NASS, Livestock Branch, (202) 720–3570.
Table 7-22.—Sows farrowing and pig crop: Number, United States 2006-2015
Year Sows farrowing Pig crop
Dec.-May June-Nov. Dec.-May June-Nov. Total
Thousands Thousands Thousands Thousands Thousands
2006 ................... 5,769 5,861 52,259 53,374 105,633 2007 ................... 5,935 6,312 54,266 58,608 112,874 2008 ................... 6,077 6,103 56,583 58,010 114,593 2009 ................... 5,982 5,874 57,111 56,977 114,088 2010 ................... 5,749 5,824 55,770 57,358 113,128 2011 ................... 5,694 5,846 56,469 58,616 115,085 2012 ................... 5,759 5,810 57,749 58,906 116,655 2013 ................... 5,595 5,670 57,020 58,115 115,135 2014 .................. 5,573 5,985 53,821 61,035 114,856 2015 ................... 5,749 5,946 59,219 62,191 121,410
NASS, Livestock Branch, (202) 720–3570.
Table 7-23.—Hogs and pigs: Number for breeding and market, United States, 2006–2015
Year All hogs and pigs
Kept for breeding
Market hogs by weight groups
Under 50 pounds
50 to 119 pounds
120 to 179 pounds
180 pounds and over Total
June 1
Thousands Thousands Thousands Thousands Thousands Thousands Thousands
2006 ................ 61,701 6,080 ..................... ..................... 11,483 9,642 55,621 2007 ................ 63,947 6,169 ..................... ..................... 11,789 9,920 57,777 2008 ................ 67,100 6,131 19,782 17,637 12,790 10,761 60,969 2009 ................ 66,709 5,968 19,514 17,778 12,604 10,847 60,742 2010 ................ 64,650 5,788 19,224 16,832 12,154 10,653 58,862 2011 ................ 65,320 5,803 19,423 17,241 12,254 10,599 59,517 2012 ................ 66,469 5,862 19,746 17,924 12,243 10,694 60,607 2013 ................ 65,188 5,884 19,145 17,068 12,414 10,678 59,304 2014 ............... 61,568 5,855 18,254 15,801 11,491 10,166 55,713 2015 ................ 67,165 5,926 19,365 17,461 12,985 11,429 61,240
Dec. 1
Thousands Thousands Thousands Thousands Thousands Thousands Thousands
2006 ................ 62,516 6,116 ..................... ..................... 11,274 10,738 56,399 2007 ................ 68,177 6,233 ..................... ..................... 12,658 11,569 61,944 2008 ................ 67,048 6,062 19,428 17,396 12,656 11,508 60,987 2009 ................ 64,687 5,850 18,705 16,782 12,199 11,152 58,837 2010 ................ 64,725 5,778 18,864 16,519 12,183 11,381 58,947 2011 ................ 66,259 5,803 19,447 16,618 12,473 11,918 60,456 2012 ................ 66,224 5,819 19,299 16,752 12,614 11,741 60,405 2013 ................ 64,775 5,757 18,389 16,080 12,576 11,972 59,018 2014 ............... 67,776 5,939 19,801 17,366 13,000 11,671 61,838 2015 ................ 68,919 6,002 20,008 17,262 13,370 12,276 62,917
NASS, Livestock Branch, (202) 720–3570.
VII–16 STATISTICS OF CATTLE, HOGS, AND SHEEP
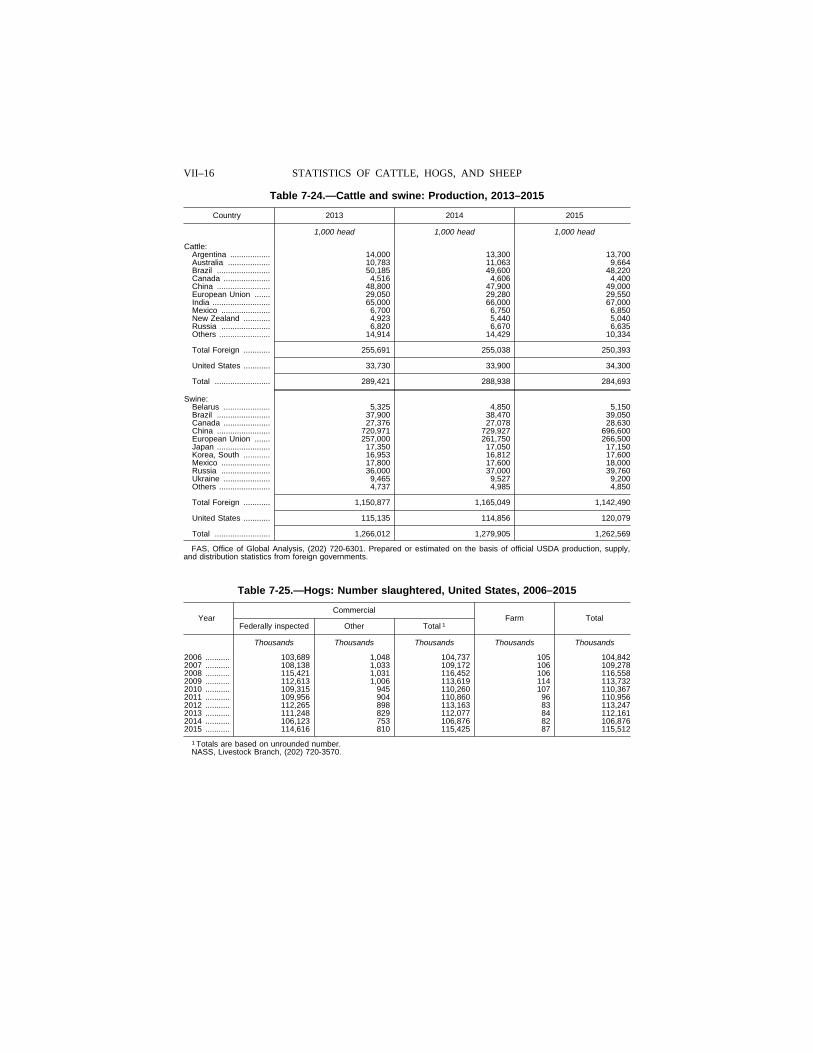
Table 7-24.—Cattle and swine: Production, 2013–2015
Country 2013 2014 2015
1,000 head 1,000 head 1,000 head
Cattle: Argentina .................. 14,000 13,300 13,700 Australia ................... 10,783 11,063 9,664 Brazil ........................ 50,185 49,600 48,220 Canada ..................... 4,516 4,606 4,400 China ........................ 48,800 47,900 49,000 European Union ....... 29,050 29,280 29,550 India .......................... 65,000 66,000 67,000 Mexico ...................... 6,700 6,750 6,850 New Zealand ............ 4,923 5,440 5,040 Russia ...................... 6,820 6,670 6,635 Others ....................... 14,914 14,429 10,334
Total Foreign ............ 255,691 255,038 250,393
United States ............ 33,730 33,900 34,300
Total ......................... 289,421 288,938 284,693
Swine: Belarus ..................... 5,325 4,850 5,150 Brazil ........................ 37,900 38,470 39,050 Canada ..................... 27,376 27,078 28,630 China ........................ 720,971 729,927 696,600 European Union ....... 257,000 261,750 266,500 Japan ........................ 17,350 17,050 17,150 Korea, South ............ 16,953 16,812 17,600 Mexico ...................... 17,800 17,600 18,000 Russia ...................... 36,000 37,000 39,760 Ukraine ..................... 9,465 9,527 9,200 Others ....................... 4,737 4,985 4,850
Total Foreign ............ 1,150,877 1,165,049 1,142,490
United States ............ 115,135 114,856 120,079
Total ......................... 1,266,012 1,279,905 1,262,569
FAS, Office of Global Analysis, (202) 720-6301. Prepared or estimated on the basis of official USDA production, supply, and distribution statistics from foreign governments.
Table 7-25.—Hogs: Number slaughtered, United States, 2006–2015
Year Commercial
Farm Total Federally inspected Other Total 1
Thousands Thousands Thousands Thousands Thousands
2006 ........... 103,689 1,048 104,737 105 104,842 2007 ........... 108,138 1,033 109,172 106 109,278 2008 ........... 115,421 1,031 116,452 106 116,558 2009 ........... 112,613 1,006 113,619 114 113,732 2010 ........... 109,315 945 110,260 107 110,367 2011 ........... 109,956 904 110,860 96 110,956 2012 ........... 112,265 898 113,163 83 113,247 2013 ........... 111,248 829 112,077 84 112,161 2014 ........... 106,123 753 106,876 82 106,876 2015 ........... 114,616 810 115,425 87 115,512
1 Totals are based on unrounded number. NASS, Livestock Branch, (202) 720-3570.
VII–17 AGRICULTURAL STATISTICS 2016
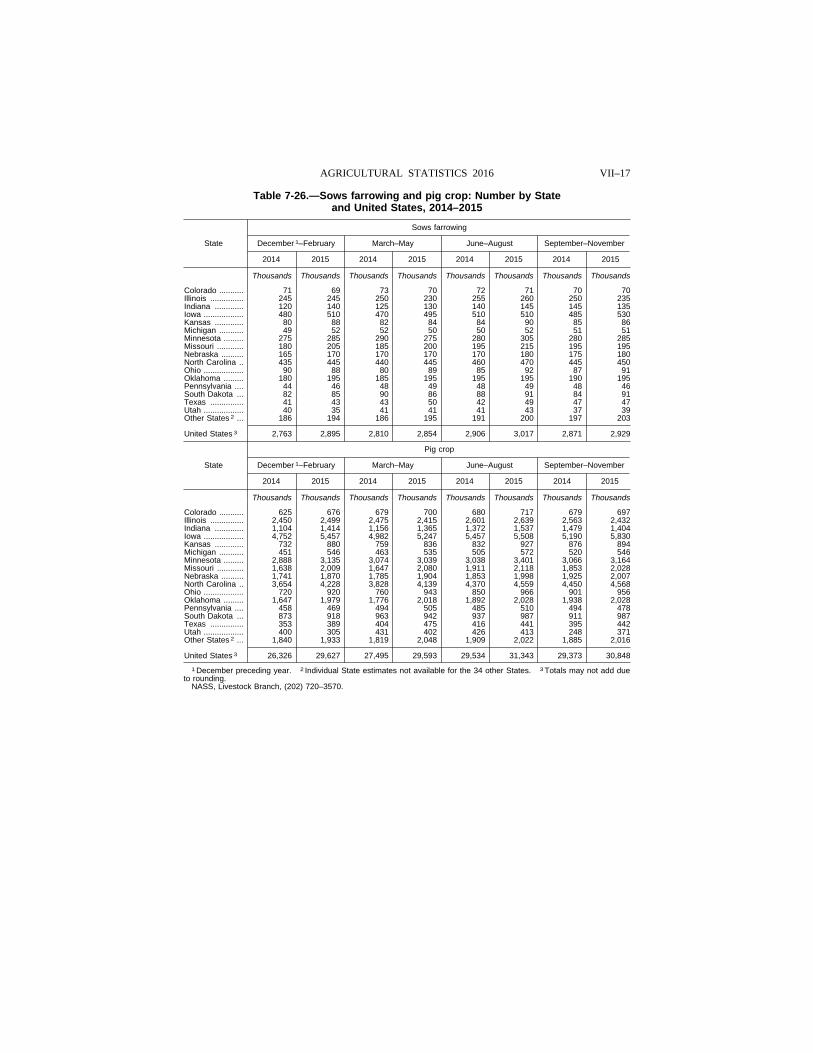
Table 7-26.—Sows farrowing and pig crop: Number by State and United States, 2014–2015
State
Sows farrowing
December 1–February March–May June–August September–November
2014 2015 2014 2015 2014 2015 2014 2015
Thousands Thousands Thousands Thousands Thousands Thousands Thousands Thousands
Colorado ........... 71 69 73 70 72 71 70 70 Illinois ............... 245 245 250 230 255 260 250 235 Indiana ............. 120 140 125 130 140 145 145 135 Iowa .................. 480 510 470 495 510 510 485 530 Kansas ............. 80 88 82 84 84 90 85 86 Michigan ........... 49 52 52 50 50 52 51 51 Minnesota ......... 275 285 290 275 280 305 280 285 Missouri ............ 180 205 185 200 195 215 195 195 Nebraska .......... 165 170 170 170 170 180 175 180 North Carolina .. 435 445 440 445 460 470 445 450 Ohio .................. 90 88 80 89 85 92 87 91 Oklahoma ......... 180 195 185 195 195 195 190 195 Pennsylvania .... 44 46 48 49 48 49 48 46 South Dakota ... 82 85 90 86 88 91 84 91 Texas ............... 41 43 43 50 42 49 47 47 Utah .................. 40 35 41 41 41 43 37 39 Other States 2 ... 186 194 186 195 191 200 197 203
United States 3 2,763 2,895 2,810 2,854 2,906 3,017 2,871 2,929
State
Pig crop
December 1–February March–May June–August September–November
2014 2015 2014 2015 2014 2015 2014 2015
Thousands Thousands Thousands Thousands Thousands Thousands Thousands Thousands
Colorado ........... 625 676 679 700 680 717 679 697 Illinois ............... 2,450 2,499 2,475 2,415 2,601 2,639 2,563 2,432 Indiana ............. 1,104 1,414 1,156 1,365 1,372 1,537 1,479 1,404 Iowa .................. 4,752 5,457 4,982 5,247 5,457 5,508 5,190 5,830 Kansas ............. 732 880 759 836 832 927 876 894 Michigan ........... 451 546 463 535 505 572 520 546 Minnesota ......... 2,888 3,135 3,074 3,039 3,038 3,401 3,066 3,164 Missouri ............ 1,638 2,009 1,647 2,080 1,911 2,118 1,853 2,028 Nebraska .......... 1,741 1,870 1,785 1,904 1,853 1,998 1,925 2,007 North Carolina .. 3,654 4,228 3,828 4,139 4,370 4,559 4,450 4,568 Ohio .................. 720 920 760 943 850 966 901 956 Oklahoma ......... 1,647 1,979 1,776 2,018 1,892 2,028 1,938 2,028 Pennsylvania .... 458 469 494 505 485 510 494 478 South Dakota ... 873 918 963 942 937 987 911 987 Texas ............... 353 389 404 475 416 441 395 442 Utah .................. 400 305 431 402 426 413 248 371 Other States 2 ... 1,840 1,933 1,819 2,048 1,909 2,022 1,885 2,016
United States 3 26,326 29,627 27,495 29,593 29,534 31,343 29,373 30,848
1 December preceding year. 2 Individual State estimates not available for the 34 other States. 3 Totals may not add due to rounding.
NASS, Livestock Branch, (202) 720–3570.
VII–18 STATISTICS OF CATTLE, HOGS, AND SHEEP
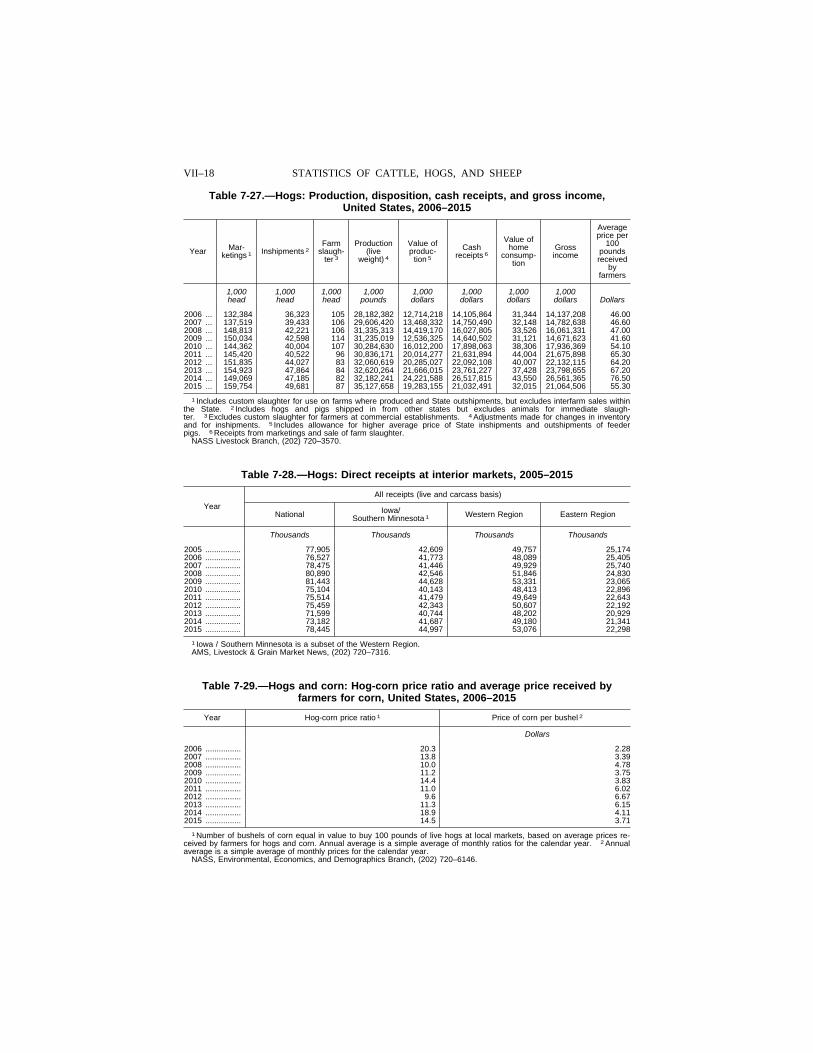
Table 7-27.—Hogs: Production, disposition, cash receipts, and gross income, United States, 2006–2015
Year Mar-ketings 1 Inshipments 2
Farm slaugh-
ter 3
Production (live
weight) 4
Value of produc-
tion 5
Cash receipts 6
Value of home
consump-tion
Gross income
Average price per
100 pounds received
by farmers
1,000 1,000 1,000 1,000 1,000 1,000 1,000 1,000 head head head pounds dollars dollars dollars dollars Dollars
2006 ... 132,384 36,323 105 28,182,382 12,714,218 14,105,864 31,344 14,137,208 46.00 2007 ... 137,519 39,433 106 29,606,420 13,468,332 14,750,490 32,148 14,782,638 46.60 2008 ... 148,813 42,221 106 31,335,313 14,419,170 16,027,805 33,526 16,061,331 47.00 2009 ... 150,034 42,598 114 31,235,019 12,536,325 14,640,502 31,121 14,671,623 41.60 2010 ... 144,362 40,004 107 30,284,630 16,012,200 17,898,063 38,306 17,936,369 54.10 2011 ... 145,420 40,522 96 30,836,171 20,014,277 21,631,894 44,004 21,675,898 65.30 2012 ... 151,835 44,027 83 32,060,619 20,285,027 22,092,108 40,007 22,132,115 64.20 2013 ... 154,923 47,864 84 32,620,264 21,666,015 23,761,227 37,428 23,798,655 67.20 2014 ... 149,069 47,185 82 32,182,241 24,221,588 26,517,815 43,550 26,561,365 76.50 2015 ... 159,754 49,681 87 35,127,658 19,283,155 21,032,491 32,015 21,064,506 55.30
1 Includes custom slaughter for use on farms where produced and State outshipments, but excludes interfarm sales within the State. 2 Includes hogs and pigs shipped in from other states but excludes animals for immediate slaugh-ter. 3 Excludes custom slaughter for farmers at commercial establishments. 4 Adjustments made for changes in inventory and for inshipments. 5 Includes allowance for higher average price of State inshipments and outshipments of feeder pigs. 6 Receipts from marketings and sale of farm slaughter.
NASS Livestock Branch, (202) 720–3570.
Table 7-28.—Hogs: Direct receipts at interior markets, 2005–2015
Year
All receipts (live and carcass basis)
National Iowa/ Southern Minnesota 1 Western Region Eastern Region
Thousands Thousands Thousands Thousands
2005 ................ 77,905 42,609 49,757 25,174 2006 ................ 76,527 41,773 48,089 25,405 2007 ................ 78,475 41,446 49,929 25,740 2008 ................ 80,890 42,546 51,846 24,830 2009 ................ 81,443 44,628 53,331 23,065 2010 ................ 75,104 40,143 48,413 22,896 2011 ................ 75,514 41,479 49,649 22,643 2012 ................ 75,459 42,343 50,607 22,192 2013 ................ 71,599 40,744 48,202 20,929 2014 ................ 73,182 41,687 49,180 21,341 2015 ................ 78,445 44,997 53,076 22,298
1 Iowa / Southern Minnesota is a subset of the Western Region. AMS, Livestock & Grain Market News, (202) 720–7316.
Table 7-29.—Hogs and corn: Hog-corn price ratio and average price received by farmers for corn, United States, 2006–2015
Year Hog-corn price ratio 1 Price of corn per bushel 2
Dollars
2006 ................ 20.3 2.28 2007 ................ 13.8 3.39 2008 ................ 10.0 4.78 2009 ................ 11.2 3.75 2010 ................ 14.4 3.83 2011 ................ 11.0 6.02 2012 ................ 9.6 6.67 2013 ................ 11.3 6.15 2014 ................ 18.9 4.11 2015 ................ 14.5 3.71
1 Number of bushels of corn equal in value to buy 100 pounds of live hogs at local markets, based on average prices re-ceived by farmers for hogs and corn. Annual average is a simple average of monthly ratios for the calendar year. 2 Annual average is a simple average of monthly prices for the calendar year.
NASS, Environmental, Economics, and Demographics Branch, (202) 720–6146.
VII–19 AGRICULTURAL STATISTICS 2016
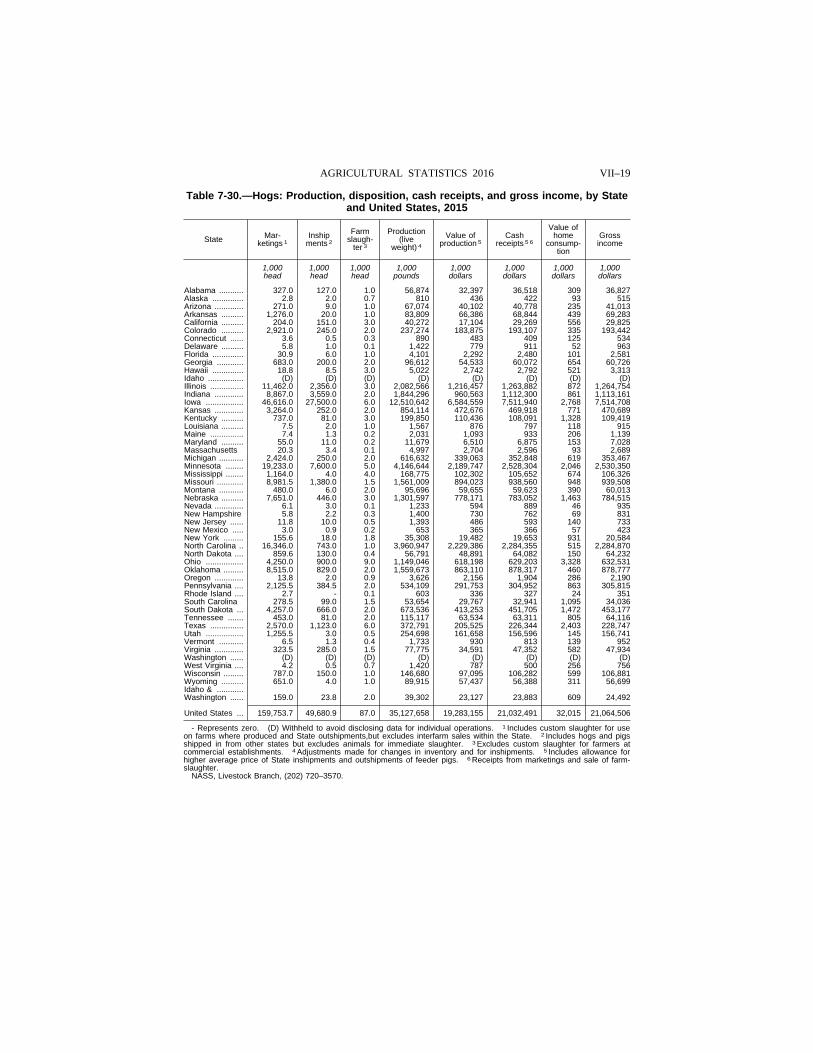
Table 7-30.—Hogs: Production, disposition, cash receipts, and gross income, by State and United States, 2015
State Mar-ketings 1
Inship ments 2
Farm slaugh-
ter 3
Production (live
weight) 4
Value of production 5
Cash receipts 5 6
Value of home
consump-tion
Gross income
1,000 1,000 1,000 1,000 1,000 1,000 1,000 1,000 head head head pounds dollars dollars dollars dollars
Alabama ........... 327.0 127.0 1.0 56,874 32,397 36,518 309 36,827 Alaska .............. 2.8 2.0 0.7 810 436 422 93 515 Arizona ............. 271.0 9.0 1.0 67,074 40,102 40,778 235 41,013 Arkansas .......... 1,276.0 20.0 1.0 83,809 66,386 68,844 439 69,283 California .......... 204.0 151.0 3.0 40,272 17,104 29,269 556 29,825 Colorado .......... 2,921.0 245.0 2.0 237,274 183,875 193,107 335 193,442 Connecticut ...... 3.6 0.5 0.3 890 483 409 125 534 Delaware .......... 5.8 1.0 0.1 1,422 779 911 52 963 Florida .............. 30.9 6.0 1.0 4,101 2,292 2,480 101 2,581 Georgia ............ 683.0 200.0 2.0 96,612 54,533 60,072 654 60,726 Hawaii .............. 18.8 8.5 3.0 5,022 2,742 2,792 521 3,313 Idaho ................ (D) (D) (D) (D) (D) (D) (D) (D) Illinois ............... 11,462.0 2,356.0 3.0 2,082,566 1,216,457 1,263,882 872 1,264,754 Indiana ............. 8,867.0 3,559.0 2.0 1,844,296 960,563 1,112,300 861 1,113,161 Iowa ................. 46,616.0 27,500.0 6.0 12,510,642 6,584,559 7,511,940 2,768 7,514,708 Kansas ............. 3,264.0 252.0 2.0 854,114 472,676 469,918 771 470,689 Kentucky .......... 737.0 81.0 3.0 199,850 110,436 108,091 1,328 109,419 Louisiana .......... 7.5 2.0 1.0 1,567 876 797 118 915 Maine ............... 7.4 1.3 0.2 2,031 1,093 933 206 1,139 Maryland .......... 55.0 11.0 0.2 11,679 6,510 6,875 153 7,028 Massachusetts 20.3 3.4 0.1 4,997 2,704 2,596 93 2,689 Michigan ........... 2,424.0 250.0 2.0 616,632 339,063 352,848 619 353,467 Minnesota ........ 19,233.0 7,600.0 5.0 4,146,644 2,189,747 2,528,304 2,046 2,530,350 Mississippi ........ 1,164.0 4.0 4.0 168,775 102,302 105,652 674 106,326 Missouri ............ 8,981.5 1,380.0 1.5 1,561,009 894,023 938,560 948 939,508 Montana ........... 480.0 6.0 2.0 95,696 59,655 59,623 390 60,013 Nebraska .......... 7,651.0 446.0 3.0 1,301,597 778,171 783,052 1,463 784,515 Nevada ............. 6.1 3.0 0.1 1,233 594 889 46 935 New Hampshire 5.8 2.2 0.3 1,400 730 762 69 831 New Jersey ...... 11.8 10.0 0.5 1,393 486 593 140 733 New Mexico ..... 3.0 0.9 0.2 653 365 366 57 423 New York ......... 155.6 18.0 1.8 35,308 19,482 19,653 931 20,584 North Carolina .. 16,346.0 743.0 1.0 3,960,947 2,229,386 2,284,355 515 2,284,870 North Dakota .... 859.6 130.0 0.4 56,791 48,891 64,082 150 64,232 Ohio ................. 4,250.0 900.0 9.0 1,149,046 618,198 629,203 3,328 632,531 Oklahoma ......... 8,515.0 829.0 2.0 1,559,673 863,110 878,317 460 878,777 Oregon ............. 13.8 2.0 0.9 3,626 2,156 1,904 286 2,190 Pennsylvania .... 2,125.5 384.5 2.0 534,109 291,753 304,952 863 305,815 Rhode Island .... 2.7 - 0.1 603 336 327 24 351 South Carolina 278.5 99.0 1.5 53,654 29,767 32,941 1,095 34,036 South Dakota ... 4,257.0 666.0 2.0 673,536 413,253 451,705 1,472 453,177 Tennessee ....... 453.0 81.0 2.0 115,117 63,534 63,311 805 64,116 Texas ............... 2,570.0 1,123.0 6.0 372,791 205,525 226,344 2,403 228,747 Utah ................. 1,255.5 3.0 0.5 254,698 161,658 156,596 145 156,741 Vermont ........... 6.5 1.3 0.4 1,733 930 813 139 952 Virginia ............. 323.5 285.0 1.5 77,775 34,591 47,352 582 47,934 Washington ...... (D) (D) (D) (D) (D) (D) (D) (D) West Virginia .... 4.2 0.5 0.7 1,420 787 500 256 756 Wisconsin ......... 787.0 150.0 1.0 146,680 97,095 106,282 599 106,881 Wyoming .......... 651.0 4.0 1.0 89,915 57,437 56,388 311 56,699 Idaho & ............Washington ...... 159.0 23.8 2.0 39,302 23,127 23,883 609 24,492
United States ... 159,753.7 49,680.9 87.0 35,127,658 19,283,155 21,032,491 32,015 21,064,506
- Represents zero. (D) Withheld to avoid disclosing data for individual operations. 1 Includes custom slaughter for use on farms where produced and State outshipments,but excludes interfarm sales within the State. 2 Includes hogs and pigs shipped in from other states but excludes animals for immediate slaughter. 3 Excludes custom slaughter for farmers at commercial establishments. 4 Adjustments made for changes in inventory and for inshipments. 5 Includes allowance for higher average price of State inshipments and outshipments of feeder pigs. 6 Receipts from marketings and sale of farm- slaughter.
NASS, Livestock Branch, (202) 720–3570.
VII–20 STATISTICS OF CATTLE, HOGS, AND SHEEP
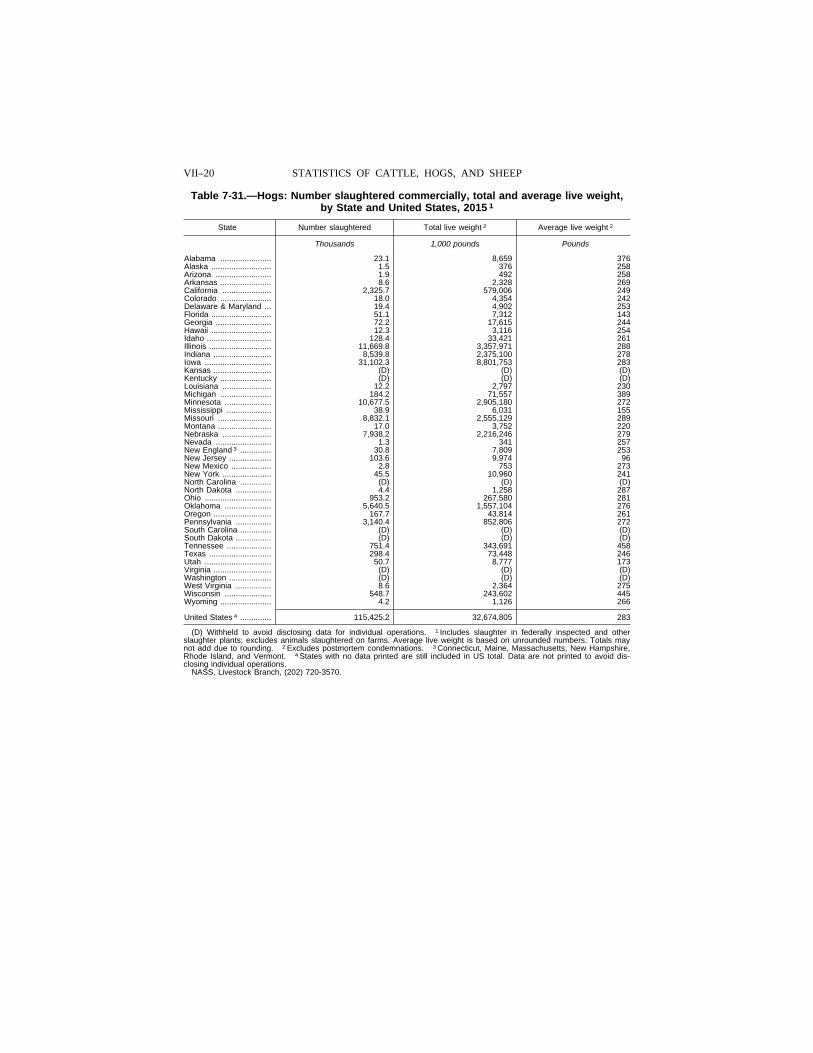
Table 7-31.—Hogs: Number slaughtered commercially, total and average live weight, by State and United States, 2015 1
State Number slaughtered Total live weight 2 Average live weight 2
Thousands 1,000 pounds Pounds
Alabama ....................... 23.1 8,659 376 Alaska ........................... 1.5 376 258 Arizona ......................... 1.9 492 258 Arkansas ....................... 8.6 2,328 269 California ...................... 2,325.7 579,006 249 Colorado ....................... 18.0 4,354 242 Delaware & Maryland ... 19.4 4,902 253 Florida ........................... 51.1 7,312 143 Georgia ......................... 72.2 17,615 244 Hawaii ........................... 12.3 3,116 254 Idaho ............................. 128.4 33,421 261 Illinois ............................ 11,669.8 3,357,971 288 Indiana .......................... 8,539.8 2,375,100 278 Iowa .............................. 31,102.3 8,801,753 283 Kansas .......................... (D) (D) (D) Kentucky ....................... (D) (D) (D) Louisiana ...................... 12.2 2,797 230 Michigan ....................... 184.2 71,557 389 Minnesota ..................... 10,677.5 2,905,180 272 Mississippi .................... 38.9 6,031 155 Missouri ........................ 8,832.1 2,555,129 289 Montana ........................ 17.0 3,752 220 Nebraska ...................... 7,938.2 2,216,246 279 Nevada ......................... 1.3 341 257 New England 3 .............. 30.8 7,809 253 New Jersey ................... 103.6 9,974 96 New Mexico .................. 2.8 753 273 New York ...................... 45.5 10,960 241 North Carolina .............. (D) (D) (D) North Dakota ................ 4.4 1,258 287 Ohio .............................. 953.2 267,580 281 Oklahoma ..................... 5,640.5 1,557,104 276 Oregon .......................... 167.7 43,814 261 Pennsylvania ................ 3,140.4 852,806 272 South Carolina .............. (D) (D) (D) South Dakota ................ (D) (D) (D) Tennessee .................... 751.4 343,691 458 Texas ............................ 298.4 73,448 246 Utah .............................. 50.7 8,777 173 Virginia .......................... (D) (D) (D) Washington ................... (D) (D) (D) West Virginia ................ 8.6 2,364 275 Wisconsin ..................... 548.7 243,602 445 Wyoming ....................... 4.2 1,126 266
United States 4 .............. 115,425.2 32,674,805 283
(D) Withheld to avoid disclosing data for individual operations. 1 Includes slaughter in federally inspected and other slaughter plants; excludes animals slaughtered on farms. Average live weight is based on unrounded numbers. Totals may not add due to rounding. 2 Excludes postmortem condemnations. 3 Connecticut, Maine, Massachusetts, New Hampshire, Rhode Island, and Vermont. 4 States with no data printed are still included in US total. Data are not printed to avoid dis-closing individual operations.
NASS, Livestock Branch, (202) 720-3570.
VII–21 AGRICULTURAL STATISTICS 2016
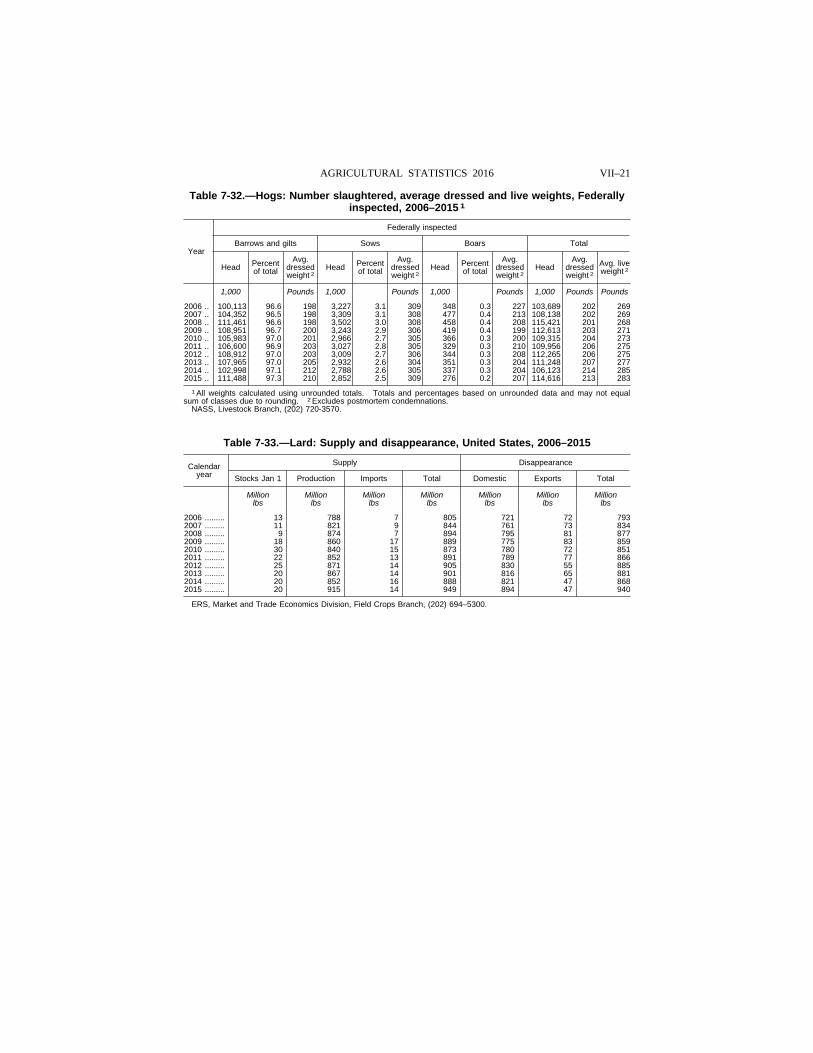
Table 7-32.—Hogs: Number slaughtered, average dressed and live weights, Federally inspected, 2006–2015 1
Year
Federally inspected
Barrows and gilts Sows Boars Total
Head Percent of total
Avg. dressed weight 2
Head Percent of total
Avg. dressed weight 2
Head Percent of total
Avg. dressed weight 2
Head Avg.
dressed weight 2
Avg. live weight 2
1,000 Pounds 1,000 Pounds 1,000 Pounds 1,000 Pounds Pounds
2006 .. 100,113 96.6 198 3,227 3.1 309 348 0.3 227 103,689 202 269 2007 .. 104,352 96.5 198 3,309 3.1 308 477 0.4 213 108,138 202 269 2008 .. 111,461 96.6 198 3,502 3.0 308 458 0.4 208 115,421 201 268 2009 .. 108,951 96.7 200 3,243 2.9 306 419 0.4 199 112,613 203 271 2010 .. 105,983 97.0 201 2,966 2.7 305 366 0.3 200 109,315 204 273 2011 .. 106,600 96.9 203 3,027 2.8 305 329 0.3 210 109,956 206 275 2012 .. 108,912 97.0 203 3,009 2.7 306 344 0.3 208 112,265 206 275 2013 .. 107,965 97.0 205 2,932 2.6 304 351 0.3 204 111,248 207 277 2014 .. 102,998 97.1 212 2,788 2.6 305 337 0.3 204 106,123 214 285 2015 .. 111,488 97.3 210 2,852 2.5 309 276 0.2 207 114,616 213 283
1 All weights calculated using unrounded totals. Totals and percentages based on unrounded data and may not equal sum of classes due to rounding. 2 Excludes postmortem condemnations.
NASS, Livestock Branch, (202) 720-3570.
Table 7-33.—Lard: Supply and disappearance, United States, 2006–2015
Calendar year
Supply Disappearance
Stocks Jan 1 Production Imports Total Domestic Exports Total
Million Million Million Million Million Million Million lbs lbs lbs lbs lbs lbs lbs
2006 ......... 13 788 7 805 721 72 793 2007 ......... 11 821 9 844 761 73 834 2008 ......... 9 874 7 894 795 81 877 2009 ......... 18 860 17 889 775 83 859 2010 ......... 30 840 15 873 780 72 851 2011 ......... 22 852 13 891 789 77 866 2012 ......... 25 871 14 905 830 55 885 2013 ......... 20 867 14 901 816 65 881 2014 ......... 20 852 16 888 821 47 868 2015 ......... 20 915 14 949 894 47 940
ERS, Market and Trade Economics Division, Field Crops Branch, (202) 694–5300.
VII–22 STATISTICS OF CATTLE, HOGS, AND SHEEP
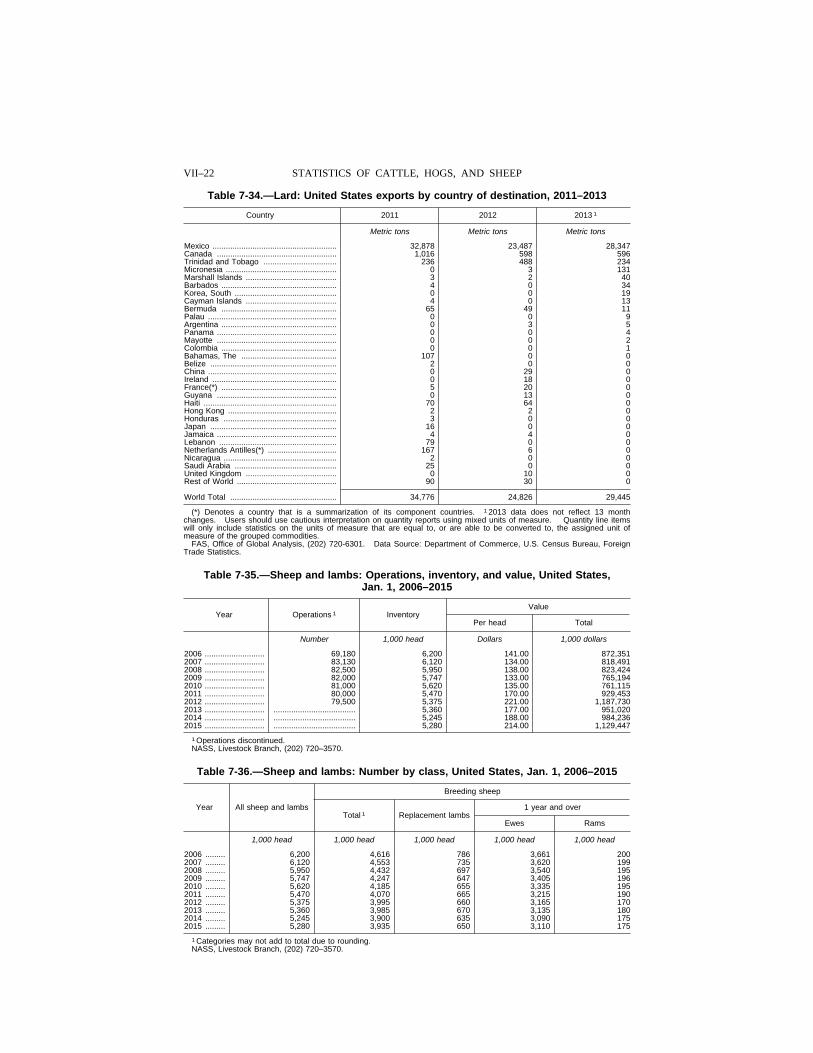
Table 7-34.—Lard: United States exports by country of destination, 2011–2013
Country 2011 2012 2013 1
Metric tons Metric tons Metric tons
Mexico ........................................................ 32,878 23,487 28,347 Canada ...................................................... 1,016 598 596 Trinidad and Tobago ................................. 236 488 234 Micronesia .................................................. 0 3 131 Marshall Islands ......................................... 3 2 40 Barbados .................................................... 4 0 34 Korea, South .............................................. 0 0 19 Cayman Islands ......................................... 4 0 13 Bermuda .................................................... 65 49 11 Palau .......................................................... 0 0 9 Argentina .................................................... 0 3 5 Panama ...................................................... 0 0 4 Mayotte ...................................................... 0 0 2 Colombia .................................................... 0 0 1 Bahamas, The ........................................... 107 0 0 Belize ......................................................... 2 0 0 China .......................................................... 0 29 0 Ireland ........................................................ 0 18 0 France(*) .................................................... 5 20 0 Guyana ...................................................... 0 13 0 Haiti ............................................................ 70 64 0 Hong Kong ................................................. 2 2 0 Honduras ................................................... 3 0 0 Japan ......................................................... 16 0 0 Jamaica ...................................................... 4 4 0 Lebanon ..................................................... 79 0 0 Netherlands Antilles(*) ............................... 167 6 0 Nicaragua ................................................... 2 0 0 Saudi Arabia .............................................. 25 0 0 United Kingdom ......................................... 0 10 0 Rest of World ............................................. 90 30 0
World Total ................................................ 34,776 24,826 29,445
(*) Denotes a country that is a summarization of its component countries. 1 2013 data does not reflect 13 month changes. Users should use cautious interpretation on quantity reports using mixed units of measure. Quantity line items will only include statistics on the units of measure that are equal to, or are able to be converted to, the assigned unit of measure of the grouped commodities.
FAS, Office of Global Analysis, (202) 720-6301. Data Source: Department of Commerce, U.S. Census Bureau, Foreign Trade Statistics.
Table 7-35.—Sheep and lambs: Operations, inventory, and value, United States, Jan. 1, 2006–2015
Year Operations 1 Inventory Value
Per head Total
Number 1,000 head Dollars 1,000 dollars
2006 ........................... 69,180 6,200 141.00 872,351 2007 ........................... 83,130 6,120 134.00 818,491 2008 ........................... 82,500 5,950 138.00 823,424 2009 ........................... 82,000 5,747 133.00 765,194 2010 ........................... 81,000 5,620 135.00 761,115 2011 ........................... 80,000 5,470 170.00 929,453 2012 ........................... 79,500 5,375 221.00 1,187,730 2013 ........................... ..................................... 5,360 177.00 951,020 2014 ........................... ..................................... 5,245 188.00 984,236 2015 ........................... ..................................... 5,280 214.00 1,129,447
1 Operations discontinued. NASS, Livestock Branch, (202) 720–3570.
Table 7-36.—Sheep and lambs: Number by class, United States, Jan. 1, 2006–2015
Year All sheep and lambs
Breeding sheep
Total 1 Replacement lambs 1 year and over
Ewes Rams
1,000 head 1,000 head 1,000 head 1,000 head 1,000 head
2006 ......... 6,200 4,616 786 3,661 200 2007 ......... 6,120 4,553 735 3,620 199 2008 ......... 5,950 4,432 697 3,540 195 2009 ......... 5,747 4,247 647 3,405 196 2010 ......... 5,620 4,185 655 3,335 195 2011 ......... 5,470 4,070 665 3,215 190 2012 ......... 5,375 3,995 660 3,165 170 2013 ......... 5,360 3,985 670 3,135 180 2014 ......... 5,245 3,900 635 3,090 175 2015 ......... 5,280 3,935 650 3,110 175
1 Categories may not add to total due to rounding. NASS, Livestock Branch, (202) 720–3570.
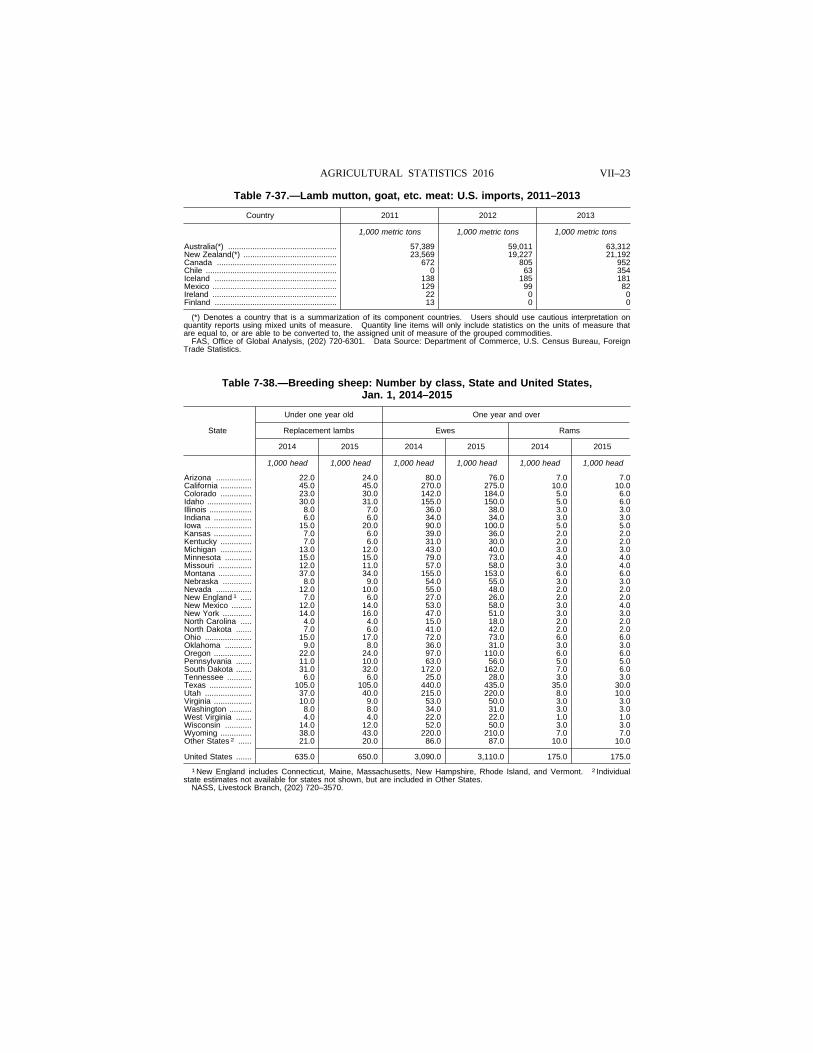
VII–23 AGRICULTURAL STATISTICS 2016
Table 7-37.—Lamb mutton, goat, etc. meat: U.S. imports, 2011–2013
Country 2011 2012 2013
1,000 metric tons 1,000 metric tons 1,000 metric tons
Australia(*) ................................................. 57,389 59,011 63,312 New Zealand(*) .......................................... 23,569 19,227 21,192 Canada ...................................................... 672 805 952 Chile ........................................................... 0 63 354 Iceland ....................................................... 138 185 181 Mexico ........................................................ 129 99 82 Ireland ........................................................ 22 0 0 Finland ....................................................... 13 0 0
(*) Denotes a country that is a summarization of its component countries. Users should use cautious interpretation on quantity reports using mixed units of measure. Quantity line items will only include statistics on the units of measure that are equal to, or are able to be converted to, the assigned unit of measure of the grouped commodities.
FAS, Office of Global Analysis, (202) 720-6301. Data Source: Department of Commerce, U.S. Census Bureau, Foreign Trade Statistics.
Table 7-38.—Breeding sheep: Number by class, State and United States, Jan. 1, 2014–2015
State
Under one year old One year and over
Replacement lambs Ewes Rams
2014 2015 2014 2015 2014 2015
1,000 head 1,000 head 1,000 head 1,000 head 1,000 head 1,000 head
Arizona ................ 22.0 24.0 80.0 76.0 7.0 7.0 California .............. 45.0 45.0 270.0 275.0 10.0 10.0 Colorado .............. 23.0 30.0 142.0 184.0 5.0 6.0 Idaho .................... 30.0 31.0 155.0 150.0 5.0 6.0 Illinois ................... 8.0 7.0 36.0 38.0 3.0 3.0 Indiana ................. 6.0 6.0 34.0 34.0 3.0 3.0 Iowa ..................... 15.0 20.0 90.0 100.0 5.0 5.0 Kansas ................. 7.0 6.0 39.0 36.0 2.0 2.0 Kentucky .............. 7.0 6.0 31.0 30.0 2.0 2.0 Michigan .............. 13.0 12.0 43.0 40.0 3.0 3.0 Minnesota ............ 15.0 15.0 79.0 73.0 4.0 4.0 Missouri ............... 12.0 11.0 57.0 58.0 3.0 4.0 Montana ............... 37.0 34.0 155.0 153.0 6.0 6.0 Nebraska ............. 8.0 9.0 54.0 55.0 3.0 3.0 Nevada ................ 12.0 10.0 55.0 48.0 2.0 2.0 New England 1 ..... 7.0 6.0 27.0 26.0 2.0 2.0 New Mexico ......... 12.0 14.0 53.0 58.0 3.0 4.0 New York ............. 14.0 16.0 47.0 51.0 3.0 3.0 North Carolina ..... 4.0 4.0 15.0 18.0 2.0 2.0 North Dakota ....... 7.0 6.0 41.0 42.0 2.0 2.0 Ohio ..................... 15.0 17.0 72.0 73.0 6.0 6.0 Oklahoma ............ 9.0 8.0 36.0 31.0 3.0 3.0 Oregon ................. 22.0 24.0 97.0 110.0 6.0 6.0 Pennsylvania ....... 11.0 10.0 63.0 56.0 5.0 5.0 South Dakota ....... 31.0 32.0 172.0 162.0 7.0 6.0 Tennessee ........... 6.0 6.0 25.0 28.0 3.0 3.0 Texas ................... 105.0 105.0 440.0 435.0 35.0 30.0 Utah ..................... 37.0 40.0 215.0 220.0 8.0 10.0 Virginia ................. 10.0 9.0 53.0 50.0 3.0 3.0 Washington .......... 8.0 8.0 34.0 31.0 3.0 3.0 West Virginia ....... 4.0 4.0 22.0 22.0 1.0 1.0 Wisconsin ............ 14.0 12.0 52.0 50.0 3.0 3.0 Wyoming .............. 38.0 43.0 220.0 210.0 7.0 7.0 Other States 2 ...... 21.0 20.0 86.0 87.0 10.0 10.0
United States ....... 635.0 650.0 3,090.0 3,110.0 175.0 175.0
1 New England includes Connecticut, Maine, Massachusetts, New Hampshire, Rhode Island, and Vermont. 2 Individual state estimates not available for states not shown, but are included in Other States.
NASS, Livestock Branch, (202) 720–3570.
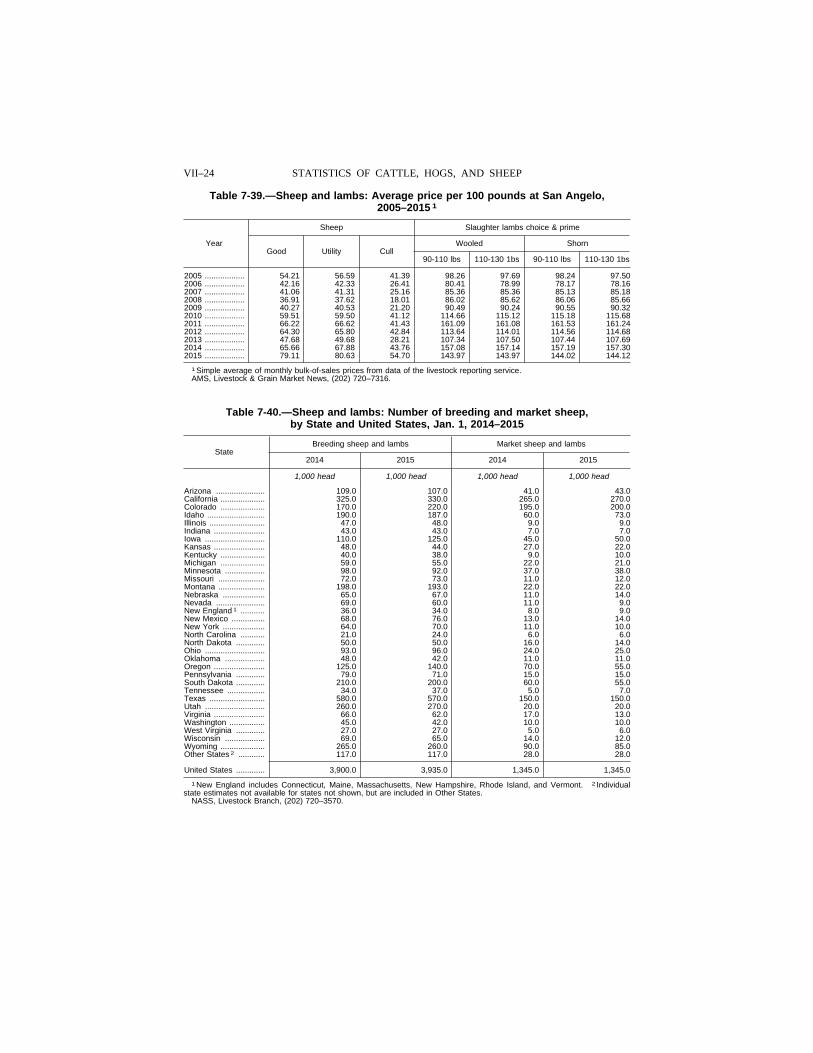
VII–24 STATISTICS OF CATTLE, HOGS, AND SHEEP
Table 7-39.—Sheep and lambs: Average price per 100 pounds at San Angelo, 2005–2015 1
Year
Sheep Slaughter lambs choice & prime
Good Utility Cull Wooled Shorn
90-110 lbs 110-130 1bs 90-110 lbs 110-130 1bs
2005 .................. 54.21 56.59 41.39 98.26 97.69 98.24 97.50 2006 .................. 42.16 42.33 26.41 80.41 78.99 78.17 78.16 2007 .................. 41.06 41.31 25.16 85.36 85.36 85.13 85.18 2008 .................. 36.91 37.62 18.01 86.02 85.62 86.06 85.66 2009 .................. 40.27 40.53 21.20 90.49 90.24 90.55 90.32 2010 .................. 59.51 59.50 41.12 114.66 115.12 115.18 115.68 2011 .................. 66.22 66.62 41.43 161.09 161.08 161.53 161.24 2012 .................. 64.30 65.80 42.84 113.64 114.01 114.56 114.68 2013 .................. 47.68 49.68 28.21 107.34 107.50 107.44 107.69 2014 .................. 65.66 67.88 43.76 157.08 157.14 157.19 157.30 2015 .................. 79.11 80.63 54.70 143.97 143.97 144.02 144.12
1 Simple average of monthly bulk-of-sales prices from data of the livestock reporting service. AMS, Livestock & Grain Market News, (202) 720–7316.
Table 7-40.—Sheep and lambs: Number of breeding and market sheep, by State and United States, Jan. 1, 2014–2015
State Breeding sheep and lambs Market sheep and lambs
2014 2015 2014 2015
1,000 head 1,000 head 1,000 head 1,000 head
Arizona ...................... 109.0 107.0 41.0 43.0 California .................... 325.0 330.0 265.0 270.0 Colorado .................... 170.0 220.0 195.0 200.0 Idaho .......................... 190.0 187.0 60.0 73.0 Illinois ......................... 47.0 48.0 9.0 9.0 Indiana ....................... 43.0 43.0 7.0 7.0 Iowa ........................... 110.0 125.0 45.0 50.0 Kansas ....................... 48.0 44.0 27.0 22.0 Kentucky .................... 40.0 38.0 9.0 10.0 Michigan .................... 59.0 55.0 22.0 21.0 Minnesota .................. 98.0 92.0 37.0 38.0 Missouri ..................... 72.0 73.0 11.0 12.0 Montana ..................... 198.0 193.0 22.0 22.0 Nebraska ................... 65.0 67.0 11.0 14.0 Nevada ...................... 69.0 60.0 11.0 9.0 New England 1 ........... 36.0 34.0 8.0 9.0 New Mexico ............... 68.0 76.0 13.0 14.0 New York ................... 64.0 70.0 11.0 10.0 North Carolina ........... 21.0 24.0 6.0 6.0 North Dakota ............. 50.0 50.0 16.0 14.0 Ohio ........................... 93.0 96.0 24.0 25.0 Oklahoma .................. 48.0 42.0 11.0 11.0 Oregon ....................... 125.0 140.0 70.0 55.0 Pennsylvania ............. 79.0 71.0 15.0 15.0 South Dakota ............. 210.0 200.0 60.0 55.0 Tennessee ................. 34.0 37.0 5.0 7.0 Texas ......................... 580.0 570.0 150.0 150.0 Utah ........................... 260.0 270.0 20.0 20.0 Virginia ....................... 66.0 62.0 17.0 13.0 Washington ................ 45.0 42.0 10.0 10.0 West Virginia ............. 27.0 27.0 5.0 6.0 Wisconsin .................. 69.0 65.0 14.0 12.0 Wyoming .................... 265.0 260.0 90.0 85.0 Other States 2 ............ 117.0 117.0 28.0 28.0
United States ............. 3,900.0 3,935.0 1,345.0 1,345.0
1 New England includes Connecticut, Maine, Massachusetts, New Hampshire, Rhode Island, and Vermont. 2 Individual state estimates not available for states not shown, but are included in Other States.
NASS, Livestock Branch, (202) 720–3570.
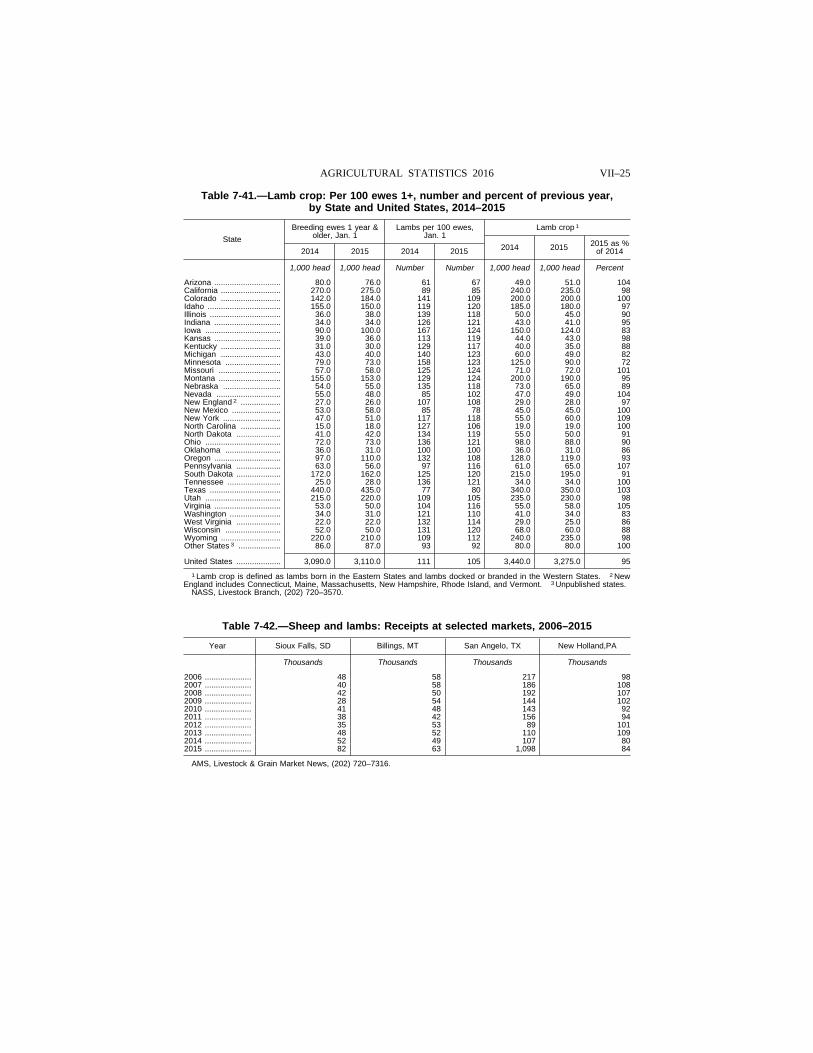
VII–25 AGRICULTURAL STATISTICS 2016
Table 7-41.—Lamb crop: Per 100 ewes 1+, number and percent of previous year, by State and United States, 2014–2015
State
Breeding ewes 1 year & older, Jan. 1
Lambs per 100 ewes, Jan. 1
Lamb crop 1
2014 2015 2014 2015 2014 2015 2015 as % of 2014
1,000 head 1,000 head Number Number 1,000 head 1,000 head Percent
Arizona .............................. 80.0 76.0 61 67 49.0 51.0 104 California ........................... 270.0 275.0 89 85 240.0 235.0 98 Colorado ........................... 142.0 184.0 141 109 200.0 200.0 100 Idaho ................................. 155.0 150.0 119 120 185.0 180.0 97 Illinois ................................ 36.0 38.0 139 118 50.0 45.0 90 Indiana .............................. 34.0 34.0 126 121 43.0 41.0 95 Iowa .................................. 90.0 100.0 167 124 150.0 124.0 83 Kansas .............................. 39.0 36.0 113 119 44.0 43.0 98 Kentucky ........................... 31.0 30.0 129 117 40.0 35.0 88 Michigan ........................... 43.0 40.0 140 123 60.0 49.0 82 Minnesota ......................... 79.0 73.0 158 123 125.0 90.0 72 Missouri ............................ 57.0 58.0 125 124 71.0 72.0 101 Montana ............................ 155.0 153.0 129 124 200.0 190.0 95 Nebraska .......................... 54.0 55.0 135 118 73.0 65.0 89 Nevada ............................. 55.0 48.0 85 102 47.0 49.0 104 New England 2 .................. 27.0 26.0 107 108 29.0 28.0 97 New Mexico ...................... 53.0 58.0 85 78 45.0 45.0 100 New York .......................... 47.0 51.0 117 118 55.0 60.0 109 North Carolina .................. 15.0 18.0 127 106 19.0 19.0 100 North Dakota .................... 41.0 42.0 134 119 55.0 50.0 91 Ohio .................................. 72.0 73.0 136 121 98.0 88.0 90 Oklahoma ......................... 36.0 31.0 100 100 36.0 31.0 86 Oregon .............................. 97.0 110.0 132 108 128.0 119.0 93 Pennsylvania .................... 63.0 56.0 97 116 61.0 65.0 107 South Dakota .................... 172.0 162.0 125 120 215.0 195.0 91 Tennessee ........................ 25.0 28.0 136 121 34.0 34.0 100 Texas ................................ 440.0 435.0 77 80 340.0 350.0 103 Utah .................................. 215.0 220.0 109 105 235.0 230.0 98 Virginia .............................. 53.0 50.0 104 116 55.0 58.0 105 Washington ....................... 34.0 31.0 121 110 41.0 34.0 83 West Virginia .................... 22.0 22.0 132 114 29.0 25.0 86 Wisconsin ......................... 52.0 50.0 131 120 68.0 60.0 88 Wyoming ........................... 220.0 210.0 109 112 240.0 235.0 98 Other States 3 ................... 86.0 87.0 93 92 80.0 80.0 100
United States .................... 3,090.0 3,110.0 111 105 3,440.0 3,275.0 95
1 Lamb crop is defined as lambs born in the Eastern States and lambs docked or branded in the Western States. 2 New England includes Connecticut, Maine, Massachusetts, New Hampshire, Rhode Island, and Vermont. 3 Unpublished states.
NASS, Livestock Branch, (202) 720–3570.
Table 7-42.—Sheep and lambs: Receipts at selected markets, 2006–2015
Year Sioux Falls, SD Billings, MT San Angelo, TX New Holland,PA
Thousands Thousands Thousands Thousands
2006 ..................... 48 58 217 98 2007 ..................... 40 58 186 108 2008 ..................... 42 50 192 107 2009 ..................... 28 54 144 102 2010 ..................... 41 48 143 92 2011 ..................... 38 42 156 94 2012 ..................... 35 53 89 101 2013 ..................... 48 52 110 109 2014 ..................... 52 49 107 80 2015 ..................... 82 63 1,098 84
AMS, Livestock & Grain Market News, (202) 720–7316.
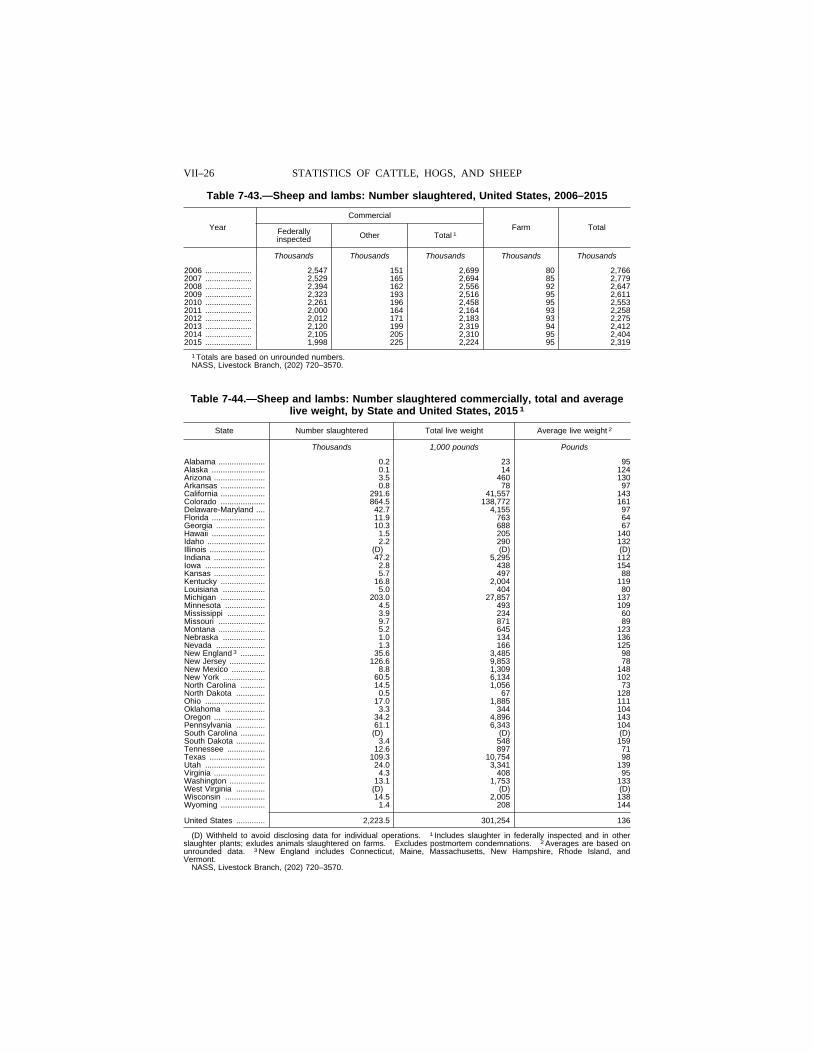
VII–26 STATISTICS OF CATTLE, HOGS, AND SHEEP
Table 7-43.—Sheep and lambs: Number slaughtered, United States, 2006–2015
Year
Commercial
Farm Total Federally inspected Other Total 1
Thousands Thousands Thousands Thousands Thousands
2006 ..................... 2,547 151 2,699 80 2,766 2007 ..................... 2,529 165 2,694 85 2,779 2008 ..................... 2,394 162 2,556 92 2,647 2009 ..................... 2,323 193 2,516 95 2,611 2010 ..................... 2,261 196 2,458 95 2,553 2011 ..................... 2,000 164 2,164 93 2,258 2012 ..................... 2,012 171 2,183 93 2,275 2013 ..................... 2,120 199 2,319 94 2,412 2014 ..................... 2,105 205 2,310 95 2,404 2015 ..................... 1,998 225 2,224 95 2,319
1 Totals are based on unrounded numbers. NASS, Livestock Branch, (202) 720–3570.
Table 7-44.—Sheep and lambs: Number slaughtered commercially, total and average live weight, by State and United States, 2015 1
State Number slaughtered Total live weight Average live weight 2
Thousands 1,000 pounds Pounds
Alabama ..................... 0 .2 23 95 Alaska ........................ 0 .1 14 124 Arizona ....................... 3 .5 460 130 Arkansas .................... 0 .8 78 97 California .................... 291 .6 41,557 143 Colorado .................... 864 .5 138,772 161 Delaware-Maryland .... 42 .7 4,155 97 Florida ........................ 11 .9 763 64 Georgia ...................... 10 .3 688 67 Hawaii ........................ 1 .5 205 140 Idaho .......................... 2 .2 290 132 Illinois ......................... (D) (D) (D) Indiana ....................... 47 .2 5,295 112 Iowa ........................... 2 .8 438 154 Kansas ....................... 5 .7 497 88 Kentucky .................... 16 .8 2,004 119 Louisiana ................... 5 .0 404 80 Michigan .................... 203 .0 27,857 137 Minnesota .................. 4 .5 493 109 Mississippi ................. 3 .9 234 60 Missouri ..................... 9 .7 871 89 Montana ..................... 5 .2 645 123 Nebraska ................... 1 .0 134 136 Nevada ...................... 1 .3 166 125 New England 3 ........... 35 .6 3,485 98 New Jersey ................ 126 .6 9,853 78 New Mexico ............... 8 .8 1,309 148 New York ................... 60 .5 6,134 102 North Carolina ........... 14 .5 1,056 73 North Dakota ............. 0 .5 67 128 Ohio ........................... 17 .0 1,885 111 Oklahoma .................. 3 .3 344 104 Oregon ....................... 34 .2 4,896 143 Pennsylvania ............. 61 .1 6,343 104 South Carolina ........... (D) (D) (D) South Dakota ............. 3 .4 548 159 Tennessee ................. 12 .6 897 71 Texas ......................... 109 .3 10,754 98 Utah ........................... 24 .0 3,341 139 Virginia ....................... 4 .3 408 95 Washington ................ 13 .1 1,753 133 West Virginia ............. (D) (D) (D) Wisconsin .................. 14 .5 2,005 138 Wyoming .................... 1 .4 208 144
United States ............. 2,223 .5 301,254 136
(D) Withheld to avoid disclosing data for individual operations. 1 Includes slaughter in federally inspected and in other slaughter plants; exludes animals slaughtered on farms. Excludes postmortem condemnations. 2 Averages are based on unrounded data. 3 New England includes Connecticut, Maine, Massachusetts, New Hampshire, Rhode Island, and Vermont.
NASS, Livestock Branch, (202) 720–3570.
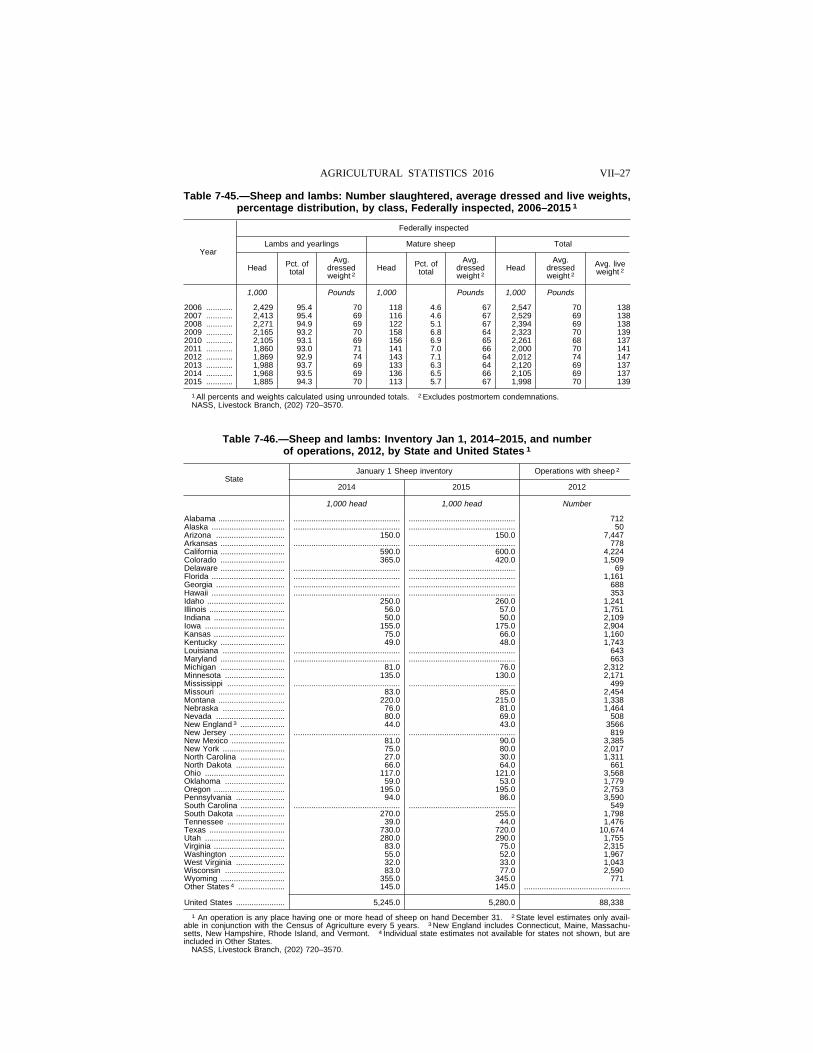
VII–27 AGRICULTURAL STATISTICS 2016
Table 7-45.—Sheep and lambs: Number slaughtered, average dressed and live weights, percentage distribution, by class, Federally inspected, 2006–2015 1
Year
Federally inspected
Lambs and yearlings Mature sheep Total
Head Pct. of total
Avg. dressed weight 2
Head Pct. of total
Avg. dressed weight 2
Head Avg.
dressed weight 2
Avg. live weight 2
1,000 Pounds 1,000 Pounds 1,000 Pounds
2006 ............ 2,429 95.4 70 118 4.6 67 2,547 70 138 2007 ............ 2,413 95.4 69 116 4.6 67 2,529 69 138 2008 ............ 2,271 94.9 69 122 5.1 67 2,394 69 138 2009 ............ 2,165 93.2 70 158 6.8 64 2,323 70 139 2010 ............ 2,105 93.1 69 156 6.9 65 2,261 68 137 2011 ............ 1,860 93.0 71 141 7.0 66 2,000 70 141 2012 ............ 1,869 92.9 74 143 7.1 64 2,012 74 147 2013 ............ 1,988 93.7 69 133 6.3 64 2,120 69 137 2014 ............ 1,968 93.5 69 136 6.5 66 2,105 69 137 2015 ............ 1,885 94.3 70 113 5.7 67 1,998 70 139
1 All percents and weights calculated using unrounded totals. 2 Excludes postmortem condemnations. NASS, Livestock Branch, (202) 720–3570.
Table 7-46.—Sheep and lambs: Inventory Jan 1, 2014–2015, and number of operations, 2012, by State and United States 1
State January 1 Sheep inventory Operations with sheep 2
2014 2015 2012
1,000 head 1,000 head Number
Alabama .............................. ................................................ ................................................ 712 Alaska ................................. ................................................ ................................................ 50 Arizona ............................... 150 .0 150 .0 7,447 Arkansas ............................. ................................................ ................................................ 778 California ............................. 590 .0 600 .0 4,224 Colorado ............................. 365 .0 420 .0 1,509 Delaware ............................. ................................................ ................................................ 69 Florida ................................. ................................................ ................................................ 1,161 Georgia ............................... ................................................ ................................................ 688 Hawaii ................................. ................................................ ................................................ 353 Idaho ................................... 250 .0 260 .0 1,241 Illinois .................................. 56 .0 57 .0 1,751 Indiana ................................ 50 .0 50 .0 2,109 Iowa .................................... 155 .0 175 .0 2,904 Kansas ................................ 75 .0 66 .0 1,160 Kentucky ............................. 49 .0 48 .0 1,743 Louisiana ............................ ................................................ ................................................ 643 Maryland ............................. ................................................ ................................................ 663 Michigan ............................. 81 .0 76 .0 2,312 Minnesota ........................... 135 .0 130 .0 2,171 Mississippi .......................... ................................................ ................................................ 499 Missouri .............................. 83 .0 85 .0 2,454 Montana .............................. 220 .0 215 .0 1,338 Nebraska ............................ 76 .0 81 .0 1,464 Nevada ............................... 80 .0 69 .0 508 New England 3 .................... 44 .0 43 .0 3566 New Jersey ......................... ................................................ ................................................ 819 New Mexico ........................ 81 .0 90 .0 3,385 New York ............................ 75 .0 80 .0 2,017 North Carolina .................... 27 .0 30 .0 1,311 North Dakota ...................... 66 .0 64 .0 661 Ohio .................................... 117 .0 121 .0 3,568 Oklahoma ........................... 59 .0 53 .0 1,779 Oregon ................................ 195 .0 195 .0 2,753 Pennsylvania ...................... 94 .0 86 .0 3,590 South Carolina .................... ................................................ ................................................ 549 South Dakota ...................... 270 .0 255 .0 1,798 Tennessee .......................... 39 .0 44 .0 1,476 Texas .................................. 730 .0 720 .0 10,674 Utah .................................... 280 .0 290 .0 1,755 Virginia ................................ 83 .0 75 .0 2,315 Washington ......................... 55 .0 52 .0 1,967 West Virginia ...................... 32 .0 33 .0 1,043 Wisconsin ........................... 83 .0 77 .0 2,590 Wyoming ............................. 355 .0 345 .0 771 Other States 4 ..................... 145 .0 145 .0 ................................................
United States ...................... 5,245 .0 5,280 .0 88,338
1 An operation is any place having one or more head of sheep on hand December 31. 2 State level estimates only avail-able in conjunction with the Census of Agriculture every 5 years. 3 New England includes Connecticut, Maine, Massachu-setts, New Hampshire, Rhode Island, and Vermont. 4 Individual state estimates not available for states not shown, but are included in Other States.
NASS, Livestock Branch, (202) 720–3570.
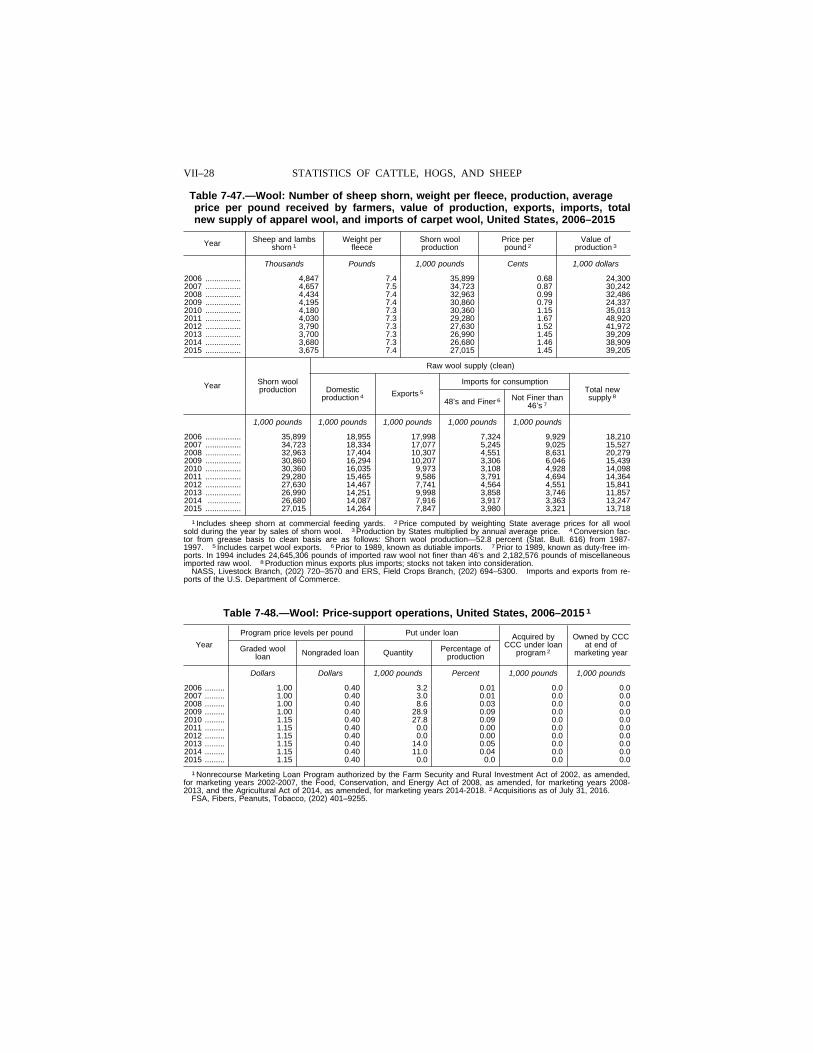
VII–28 STATISTICS OF CATTLE, HOGS, AND SHEEP
Table 7-47.—Wool: Number of sheep shorn, weight per fleece, production, average price per pound received by farmers, value of production, exports, imports, total new supply of apparel wool, and imports of carpet wool, United States, 2006–2015
Year Sheep and lambs shorn 1
Weight per fleece
Shorn wool production
Price per pound 2
Value of production 3
Thousands Pounds 1,000 pounds Cents 1,000 dollars
2006 ................ 4,847 7.4 35,899 0.68 24,300 2007 ................ 4,657 7.5 34,723 0.87 30,242 2008 ................ 4,434 7.4 32,963 0.99 32,486 2009 ................ 4,195 7.4 30,860 0.79 24,337 2010 ................ 4,180 7.3 30,360 1.15 35,013 2011 ................ 4,030 7.3 29,280 1.67 48,920 2012 ................ 3,790 7.3 27,630 1.52 41,972 2013 ................ 3,700 7.3 26,990 1.45 39,209 2014 ................ 3,680 7.3 26,680 1.46 38,909 2015 ................ 3,675 7.4 27,015 1.45 39,205
Year Shorn wool production
Raw wool supply (clean)
Domestic production 4 Exports 5
Imports for consumption Total new supply 8 48’s and Finer 6 Not Finer than
46’s 7
1,000 pounds 1,000 pounds 1,000 pounds 1,000 pounds 1,000 pounds
2006 ................ 35,899 18,955 17,998 7,324 9,929 18,210 2007 ................ 34,723 18,334 17,077 5,245 9,025 15,527 2008 ................ 32,963 17,404 10,307 4,551 8,631 20,279 2009 ................ 30,860 16,294 10,207 3,306 6,046 15,439 2010 ................ 30,360 16,035 9,973 3,108 4,928 14,098 2011 ................ 29,280 15,465 9,586 3,791 4,694 14,364 2012 ................ 27,630 14,467 7,741 4,564 4,551 15,841 2013 ................ 26,990 14,251 9,998 3,858 3,746 11,857 2014 ............... 26,680 14,087 7,916 3,917 3,363 13,247 2015 ................ 27,015 14,264 7,847 3,980 3,321 13,718
1 Includes sheep shorn at commercial feeding yards. 2 Price computed by weighting State average prices for all wool sold during the year by sales of shorn wool. 3 Production by States multiplied by annual average price. 4 Conversion fac-tor from grease basis to clean basis are as follows: Shorn wool production—52.8 percent (Stat. Bull. 616) from 1987- 1997. 5 Includes carpet wool exports. 6 Prior to 1989, known as dutiable imports. 7 Prior to 1989, known as duty-free im-ports. In 1994 includes 24,645,306 pounds of imported raw wool not finer than 46’s and 2,182,576 pounds of miscellaneous imported raw wool. 8 Production minus exports plus imports; stocks not taken into consideration.
NASS, Livestock Branch, (202) 720–3570 and ERS, Field Crops Branch, (202) 694–5300. Imports and exports from re-ports of the U.S. Department of Commerce.
Table 7-48.—Wool: Price-support operations, United States, 2006–2015 1
Year
Program price levels per pound Put under loan Acquired by CCC under loan
program 2
Owned by CCC at end of
marketing year Graded wool loan Nongraded loan Quantity Percentage of
production
Dollars Dollars 1,000 pounds Percent 1,000 pounds 1,000 pounds
2006 ......... 1.00 0.40 3.2 0.01 0.0 0.0 2007 ......... 1.00 0.40 3.0 0.01 0.0 0.0 2008 ......... 1.00 0.40 8.6 0.03 0.0 0.0 2009 ......... 1.00 0.40 28.9 0.09 0.0 0.0 2010 ......... 1.15 0.40 27.8 0.09 0.0 0.0 2011 ......... 1.15 0.40 0.0 0.00 0.0 0.0 2012 ......... 1.15 0.40 0.0 0.00 0.0 0.0 2013 ......... 1.15 0.40 14.0 0.05 0.0 0.0 2014 ......... 1.15 0.40 11.0 0.04 0.0 0.0 2015 ......... 1.15 0.40 0.0 0.0 0.0 0.0
1 Nonrecourse Marketing Loan Program authorized by the Farm Security and Rural Investment Act of 2002, as amended, for marketing years 2002-2007, the Food, Conservation, and Energy Act of 2008, as amended, for marketing years 2008- 2013, and the Agricultural Act of 2014, as amended, for marketing years 2014-2018. 2 Acquisitions as of July 31, 2016.
FSA, Fibers, Peanuts, Tobacco, (202) 401–9255.
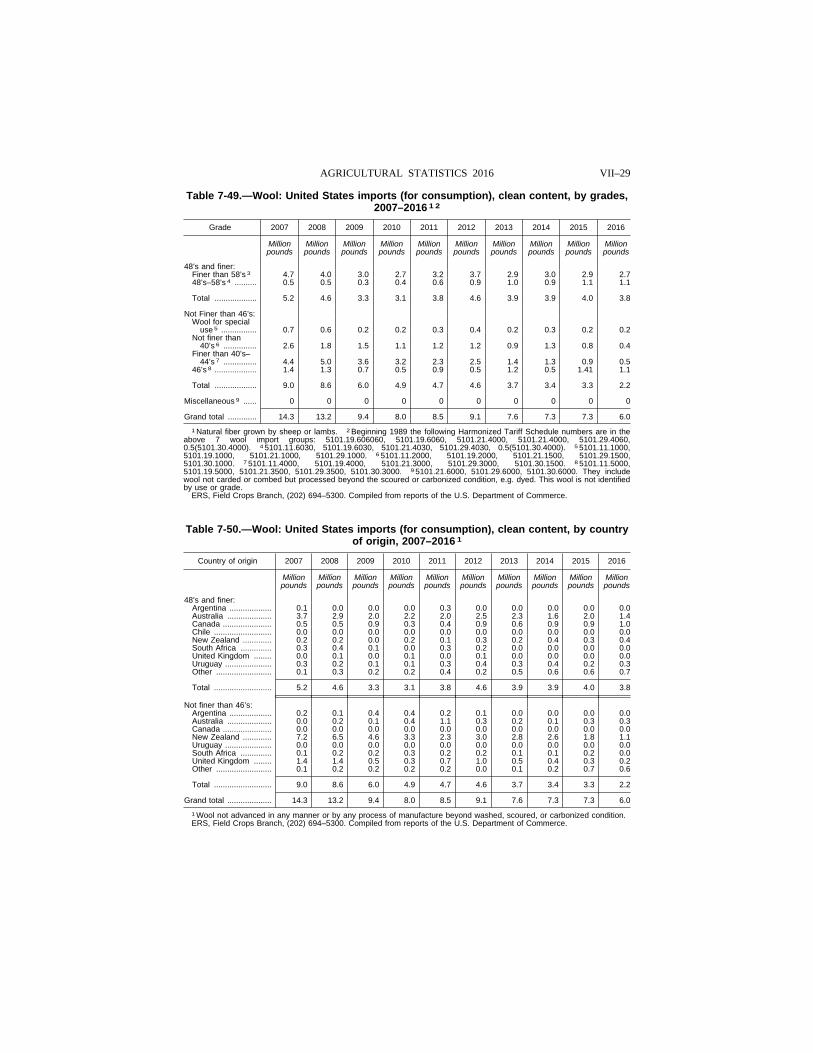
VII–29 AGRICULTURAL STATISTICS 2016
Table 7-49.—Wool: United States imports (for consumption), clean content, by grades, 2007–2016 1 2
Grade 2007 2008 2009 2010 2011 2012 2013 2014 2015 2016
Million pounds
Million pounds
Million pounds
Million pounds
Million pounds
Million pounds
Million pounds
Million pounds
Million pounds
Million pounds
48’s and finer: Finer than 58’s 3 4.7 4.0 3.0 2.7 3.2 3.7 2.9 3.0 2.9 2.7 48’s–58’s 4 .......... 0.5 0.5 0.3 0.4 0.6 0.9 1.0 0.9 1.1 1.1
Total ................... 5.2 4.6 3.3 3.1 3.8 4.6 3.9 3.9 4.0 3.8
Not Finer than 46’s: Wool for special
use 5 ................ 0.7 0.6 0.2 0.2 0.3 0.4 0.2 0.3 0.2 0.2 Not finer than
40’s 6 ............... 2.6 1.8 1.5 1.1 1.2 1.2 0.9 1.3 0.8 0.4 Finer than 40’s–
44’s 7 ............... 4.4 5.0 3.6 3.2 2.3 2.5 1.4 1.3 0.9 0.5 46’s 8 ................... 1.4 1.3 0.7 0.5 0.9 0.5 1.2 0.5 1.41 1.1
Total ................... 9.0 8.6 6.0 4.9 4.7 4.6 3.7 3.4 3.3 2.2
Miscellaneous 9 ...... 0 0 0 0 0 0 0 0 0 0
Grand total ............. 14.3 13.2 9.4 8.0 8.5 9.1 7.6 7.3 7.3 6.0
1 Natural fiber grown by sheep or lambs. 2 Beginning 1989 the following Harmonized Tariff Schedule numbers are in the above 7 wool import groups: 5101.19.606060, 5101.19.6060, 5101.21.4000, 5101.21.4000, 5101.29.4060, 0.5(5101.30.4000). 4 5101.11.6030, 5101.19.6030, 5101.21.4030, 5101.29.4030, 0.5(5101.30.4000). 5 5101.11.1000, 5101.19.1000, 5101.21.1000, 5101.29.1000. 6 5101.11.2000, 5101.19.2000, 5101.21.1500, 5101.29.1500, 5101.30.1000. 7 5101.11.4000, 5101.19.4000, 5101.21.3000, 5101.29.3000, 5101.30.1500. 8 5101.11.5000, 5101.19.5000, 5101.21.3500, 5101.29.3500, 5101.30.3000. 9 5101.21.6000, 5101.29.6000, 5101.30.6000. They include wool not carded or combed but processed beyond the scoured or carbonized condition, e.g. dyed. This wool is not identified by use or grade.
ERS, Field Crops Branch, (202) 694–5300. Compiled from reports of the U.S. Department of Commerce.
Table 7-50.—Wool: United States imports (for consumption), clean content, by country of origin, 2007–2016 1
Country of origin 2007 2008 2009 2010 2011 2012 2013 2014 2015 2016
Million pounds
Million pounds
Million pounds
Million pounds
Million pounds
Million pounds
Million pounds
Million pounds
Million pounds
Million pounds
48’s and finer: Argentina ................... 0.1 0.0 0.0 0.0 0.3 0.0 0.0 0.0 0.0 0.0 Australia .................... 3.7 2.9 2.0 2.2 2.0 2.5 2.3 1.6 2.0 1.4 Canada ...................... 0.5 0.5 0.9 0.3 0.4 0.9 0.6 0.9 0.9 1.0 Chile .......................... 0.0 0.0 0.0 0.0 0.0 0.0 0.0 0.0 0.0 0.0 New Zealand ............. 0.2 0.2 0.0 0.2 0.1 0.3 0.2 0.4 0.3 0.4 South Africa .............. 0.3 0.4 0.1 0.0 0.3 0.2 0.0 0.0 0.0 0.0 United Kingdom ........ 0.0 0.1 0.0 0.1 0.0 0.1 0.0 0.0 0.0 0.0 Uruguay ..................... 0.3 0.2 0.1 0.1 0.3 0.4 0.3 0.4 0.2 0.3 Other ......................... 0.1 0.3 0.2 0.2 0.4 0.2 0.5 0.6 0.6 0.7
Total .......................... 5.2 4.6 3.3 3.1 3.8 4.6 3.9 3.9 4.0 3.8
Not finer than 46’s: Argentina ................... 0.2 0.1 0.4 0.4 0.2 0.1 0.0 0.0 0.0 0.0 Australia .................... 0.0 0.2 0.1 0.4 1.1 0.3 0.2 0.1 0.3 0.3 Canada ...................... 0.0 0.0 0.0 0.0 0.0 0.0 0.0 0.0 0.0 0.0 New Zealand ............. 7.2 6.5 4.6 3.3 2.3 3.0 2.8 2.6 1.8 1.1 Uruguay ..................... 0.0 0.0 0.0 0.0 0.0 0.0 0.0 0.0 0.0 0.0 South Africa .............. 0.1 0.2 0.2 0.3 0.2 0.2 0.1 0.1 0.2 0.0 United Kingdom ........ 1.4 1.4 0.5 0.3 0.7 1.0 0.5 0.4 0.3 0.2 Other ......................... 0.1 0.2 0.2 0.2 0.2 0.0 0.1 0.2 0.7 0.6
Total .......................... 9.0 8.6 6.0 4.9 4.7 4.6 3.7 3.4 3.3 2.2
Grand total .................... 14.3 13.2 9.4 8.0 8.5 9.1 7.6 7.3 7.3 6.0
1 Wool not advanced in any manner or by any process of manufacture beyond washed, scoured, or carbonized condition. ERS, Field Crops Branch, (202) 694–5300. Compiled from reports of the U.S. Department of Commerce.
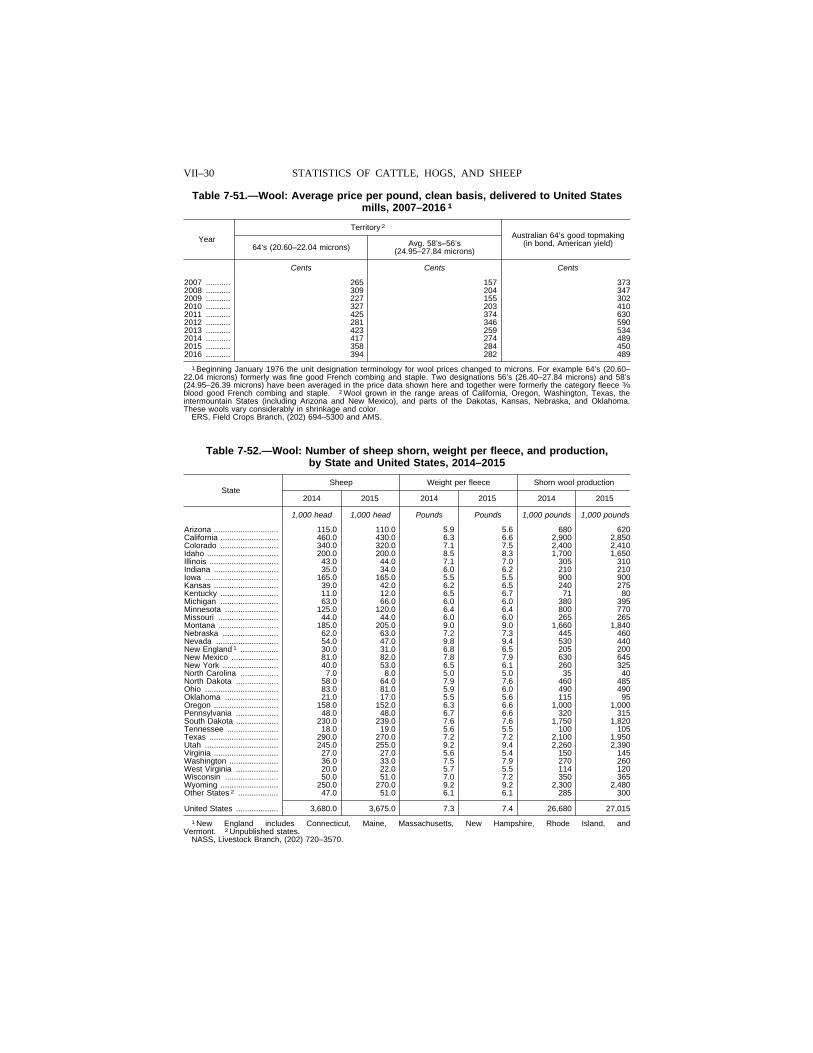
VII–30 STATISTICS OF CATTLE, HOGS, AND SHEEP
Table 7-51.—Wool: Average price per pound, clean basis, delivered to United States mills, 2007–2016 1
Year
Territory 2 Australian 64’s good topmaking
(in bond, American yield) 64’s (20.60–22.04 microns) Avg. 58’s–56’s (24.95–27.84 microns)
Cents Cents Cents
2007 ........... 265 157 373 2008 ........... 309 204 347 2009 ........... 227 155 302 2010 ........... 327 203 410 2011 ........... 425 374 630 2012 ........... 281 346 590 2013 ........... 423 259 534 2014 ........... 417 274 489 2015 ........... 358 284 450 2016 ........... 394 282 489
1 Beginning January 1976 the unit designation terminology for wool prices changed to microns. For example 64’s (20.60– 22.04 microns) formerly was fine good French combing and staple. Two designations 56’s (26.40–27.84 microns) and 58’s (24.95–26.39 microns) have been averaged in the price data shown here and together were formerly the category fleece 3⁄8 blood good French combing and staple. 2 Wool grown in the range areas of California, Oregon, Washington, Texas, the intermountain States (including Arizona and New Mexico), and parts of the Dakotas, Kansas, Nebraska, and Oklahoma. These wools vary considerably in shrinkage and color.
ERS, Field Crops Branch, (202) 694–5300 and AMS.
Table 7-52.—Wool: Number of sheep shorn, weight per fleece, and production, by State and United States, 2014–2015
State Sheep Weight per fleece Shorn wool production
2014 2015 2014 2015 2014 2015
1,000 head 1,000 head Pounds Pounds 1,000 pounds 1,000 pounds
Arizona ............................. 115.0 110.0 5.9 5.6 680 620 California .......................... 460.0 430.0 6.3 6.6 2,900 2,850 Colorado .......................... 340.0 320.0 7.1 7.5 2,400 2,410 Idaho ................................ 200.0 200.0 8.5 8.3 1,700 1,650 Illinois ............................... 43.0 44.0 7.1 7.0 305 310 Indiana ............................. 35.0 34.0 6.0 6.2 210 210 Iowa ................................. 165.0 165.0 5.5 5.5 900 900 Kansas ............................. 39.0 42.0 6.2 6.5 240 275 Kentucky .......................... 11.0 12.0 6.5 6.7 71 80 Michigan .......................... 63.0 66.0 6.0 6.0 380 395 Minnesota ........................ 125.0 120.0 6.4 6.4 800 770 Missouri ........................... 44.0 44.0 6.0 6.0 265 265 Montana ........................... 185.0 205.0 9.0 9.0 1,660 1,840 Nebraska ......................... 62.0 63.0 7.2 7.3 445 460 Nevada ............................ 54.0 47.0 9.8 9.4 530 440 New England 1 ................. 30.0 31.0 6.8 6.5 205 200 New Mexico ..................... 81.0 82.0 7.8 7.9 630 645 New York ......................... 40.0 53.0 6.5 6.1 260 325 North Carolina ................. 7.0 8.0 5.0 5.0 35 40 North Dakota ................... 58.0 64.0 7.9 7.6 460 485 Ohio ................................. 83.0 81.0 5.9 6.0 490 490 Oklahoma ........................ 21.0 17.0 5.5 5.6 115 95 Oregon ............................. 158.0 152.0 6.3 6.6 1,000 1,000 Pennsylvania ................... 48.0 48.0 6.7 6.6 320 315 South Dakota ................... 230.0 239.0 7.6 7.6 1,750 1,820 Tennessee ....................... 18.0 19.0 5.6 5.5 100 105 Texas ............................... 290.0 270.0 7.2 7.2 2,100 1,950 Utah ................................. 245.0 255.0 9.2 9.4 2,260 2,390 Virginia ............................. 27.0 27.0 5.6 5.4 150 145 Washington ...................... 36.0 33.0 7.5 7.9 270 260 West Virginia ................... 20.0 22.0 5.7 5.5 114 120 Wisconsin ........................ 50.0 51.0 7.0 7.2 350 365 Wyoming .......................... 250.0 270.0 9.2 9.2 2,300 2,480 Other States 2 .................. 47.0 51.0 6.1 6.1 285 300
United States ................... 3,680.0 3,675.0 7.3 7.4 26,680 27,015
1 New England includes Connecticut, Maine, Massachusetts, New Hampshire, Rhode Island, and Vermont. 2 Unpublished states.
NASS, Livestock Branch, (202) 720–3570.
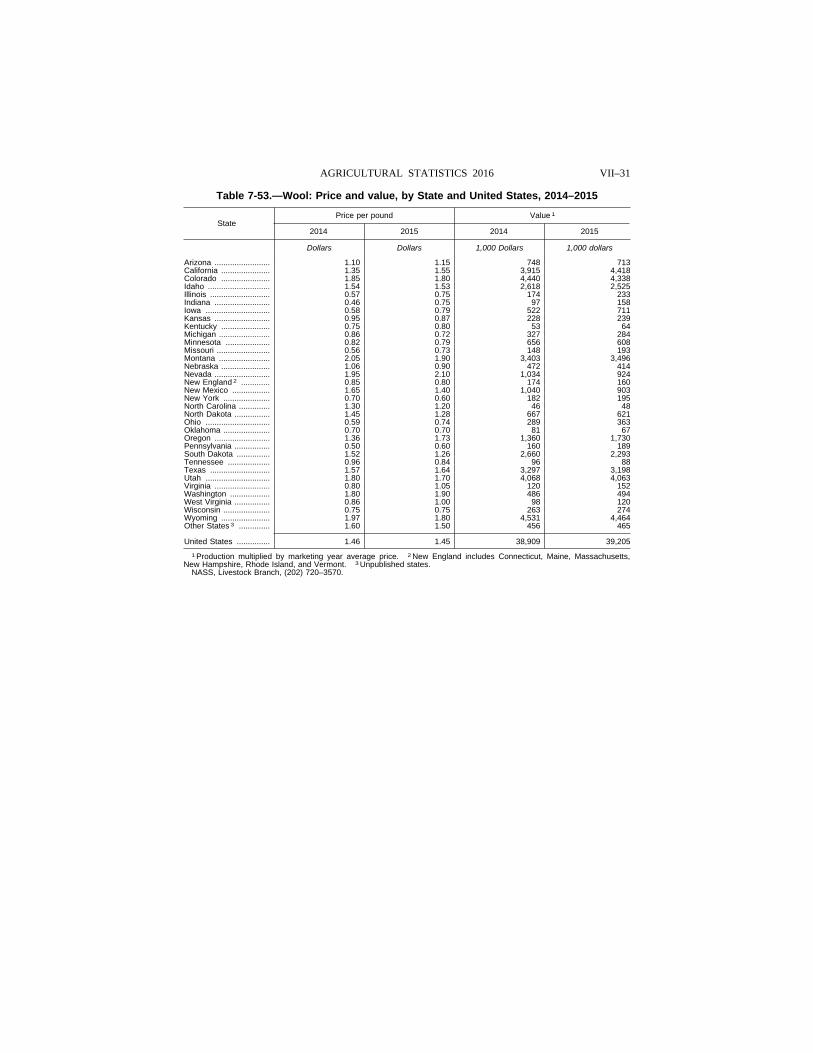
VII–31 AGRICULTURAL STATISTICS 2016
Table 7-53.—Wool: Price and value, by State and United States, 2014–2015
State Price per pound Value 1
2014 2015 2014 2015
Dollars Dollars 1,000 Dollars 1,000 dollars
Arizona ......................... 1.10 1.15 748 713 California ...................... 1.35 1.55 3,915 4,418 Colorado ...................... 1.85 1.80 4,440 4,338 Idaho ............................ 1.54 1.53 2,618 2,525 Illinois ........................... 0.57 0.75 174 233 Indiana ......................... 0.46 0.75 97 158 Iowa ............................. 0.58 0.79 522 711 Kansas ......................... 0.95 0.87 228 239 Kentucky ...................... 0.75 0.80 53 64 Michigan ....................... 0.86 0.72 327 284 Minnesota .................... 0.82 0.79 656 608 Missouri ........................ 0.56 0.73 148 193 Montana ....................... 2.05 1.90 3,403 3,496 Nebraska ...................... 1.06 0.90 472 414 Nevada ......................... 1.95 2.10 1,034 924 New England 2 ............. 0.85 0.80 174 160 New Mexico ................. 1.65 1.40 1,040 903 New York ..................... 0.70 0.60 182 195 North Carolina .............. 1.30 1.20 46 48 North Dakota ................ 1.45 1.28 667 621 Ohio ............................. 0.59 0.74 289 363 Oklahoma ..................... 0.70 0.70 81 67 Oregon ......................... 1.36 1.73 1,360 1,730 Pennsylvania ................ 0.50 0.60 160 189 South Dakota ............... 1.52 1.26 2,660 2,293 Tennessee ................... 0.96 0.84 96 88 Texas ........................... 1.57 1.64 3,297 3,198 Utah ............................. 1.80 1.70 4,068 4,063 Virginia ......................... 0.80 1.05 120 152 Washington .................. 1.80 1.90 486 494 West Virginia ................ 0.86 1.00 98 120 Wisconsin ..................... 0.75 0.75 263 274 Wyoming ...................... 1.97 1.80 4,531 4,464 Other States 3 .............. 1.60 1.50 456 465
United States ............... 1.46 1.45 38,909 39,205
1 Production multiplied by marketing year average price. 2 New England includes Connecticut, Maine, Massachusetts, New Hampshire, Rhode Island, and Vermont. 3 Unpublished states.
NASS, Livestock Branch, (202) 720–3570.
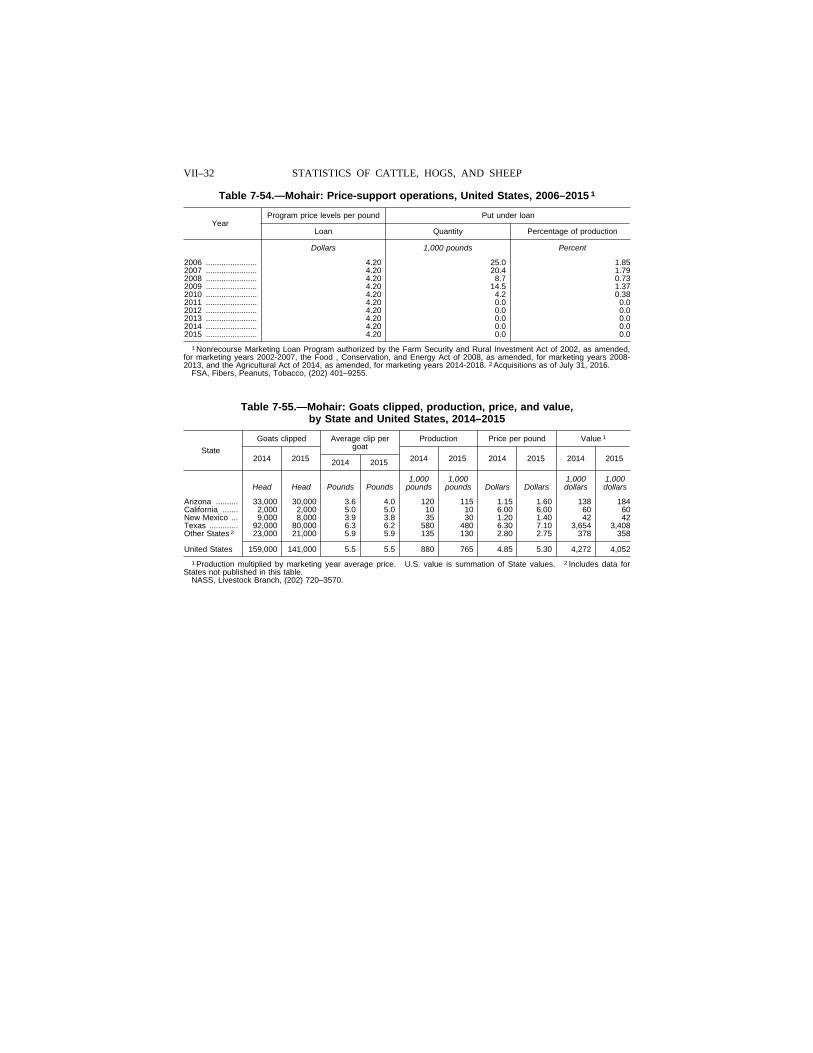
VII–32 STATISTICS OF CATTLE, HOGS, AND SHEEP
Table 7-54.—Mohair: Price-support operations, United States, 2006–2015 1
Year Program price levels per pound Put under loan
Loan Quantity Percentage of production
Dollars 1,000 pounds Percent
2006 ....................... 4.20 25.0 1.85 2007 ....................... 4.20 20.4 1.79 2008 ....................... 4.20 8.7 0.73 2009 ....................... 4.20 14.5 1.37 2010 ....................... 4.20 4.2 0.38 2011 ....................... 4.20 0.0 0.0 2012 ....................... 4.20 0.0 0.0 2013 ....................... 4.20 0.0 0.0 2014 ....................... 4.20 0.0 0.0 2015 ....................... 4.20 0.0 0.0
1 Nonrecourse Marketing Loan Program authorized by the Farm Security and Rural Investment Act of 2002, as amended, for marketing years 2002-2007, the Food , Conservation, and Energy Act of 2008, as amended, for marketing years 2008- 2013, and the Agricultural Act of 2014, as amended, for marketing years 2014-2018. 2 Acquisitions as of July 31, 2016.
FSA, Fibers, Peanuts, Tobacco, (202) 401–9255.
Table 7-55.—Mohair: Goats clipped, production, price, and value, by State and United States, 2014–2015
State
Goats clipped Average clip per goat
Production Price per pound Value 1
2014 2015 2014 2015 2014 2015 2014 2015 2014 2015
1,000 1,000 1,000 1,000 Head Head Pounds Pounds pounds pounds Dollars Dollars dollars dollars
Arizona .......... 33,000 30,000 3.6 4.0 120 115 1.15 1.60 138 184 California ....... 2,000 2,000 5.0 5.0 10 10 6.00 6.00 60 60 New Mexico ... 9,000 8,000 3.9 3.8 35 30 1.20 1.40 42 42 Texas ............. 92,000 80,000 6.3 6.2 580 480 6.30 7.10 3,654 3,408 Other States 2 23,000 21,000 5.9 5.9 135 130 2.80 2.75 378 358
United States 159,000 141,000 5.5 5.5 880 765 4.85 5.30 4,272 4,052
1 Production multiplied by marketing year average price. U.S. value is summation of State values. 2 Includes data for States not published in this table.
NASS, Livestock Branch, (202) 720–3570.

VII–33 AGRICULTURAL STATISTICS 2016
Table 7-56—Angora goats: Inventory Jan 1, 2014–2015, and number of operations, 2012, by State and United States 1
State January 1 angora goats inventory Operations with angora goats 2
2014 2015 2012
Head Head Number
Alabama ....................... .................................................. .................................................. 152 Alaska .......................... .................................................. .................................................. 5 Arizona ......................... 33,000 36,000 3,218 Arkansas ...................... .................................................. .................................................. 25 California ...................... 3,600 3,400 314 Colorado ...................... .................................................. .................................................. 182 Delaware ...................... .................................................. .................................................. 3 Florida .......................... .................................................. .................................................. 165 Georgia ........................ .................................................. .................................................. 140 Hawaii .......................... .................................................. .................................................. 23 Idaho ............................ .................................................. .................................................. 70 Illinois ........................... .................................................. .................................................. 84 Indiana ......................... .................................................. .................................................. 85 Iowa ............................. .................................................. .................................................. 67 Kansas ......................... .................................................. .................................................. 45 Kentucky ...................... .................................................. .................................................. 143 Louisiana ...................... .................................................. .................................................. 49 Maryland ...................... .................................................. .................................................. 59 Michigan ....................... .................................................. .................................................. 177 Minnesota .................... 1,000 (NA) 125 Mississippi .................... .................................................. .................................................. 77 Missouri ........................ 1,500 (NA) 152 Montana ....................... .................................................. .................................................. 59 Nebraska ...................... .................................................. .................................................. 47 Nevada ......................... .................................................. .................................................. 27 New England 3 ............. .................................................. .................................................. 664 New Jersey .................. .................................................. .................................................. 75 New Mexico ................. 10,000 11,000 904 New York ..................... .................................................. .................................................. 176 North Carolina .............. .................................................. .................................................. 195 North Dakota ................ .................................................. .................................................. 24 Ohio ............................. .................................................. .................................................. 189 Oklahoma ..................... .................................................. .................................................. 61 Oregon ......................... 2,500 (NA) 166 Pennsylvania ................ .................................................. .................................................. 268 South Carolina ............. .................................................. .................................................. 121 South Dakota ............... .................................................. .................................................. 22 Tennessee ................... .................................................. .................................................. 28 Texas ........................... 76,000 85,000 629 Utah ............................. .................................................. .................................................. 275 Virginia ......................... .................................................. .................................................. 169 Washington .................. .................................................. .................................................. 151 Wisconsin ..................... 900 (NA) 75 West Virginia ................ .................................................. .................................................. 158 Wyoming ...................... .................................................. .................................................. 16 Other States 4 ............... 19,500 24,600 ..................................................
United States ............... 148,000 160,000 9,859
(NA) Not Available. 1 An operation is any place having one or more head of angora goats on hand December 31. 2 State level estimates only available in conjunction with the Census of Agriculture every 5 years. 3 New England in-cludes Connecticut, Maine, Massachusetts, New Hampshire, Rhode Island, and Vermont. 4 Unpublished states.
NASS, Livestock Branch, (202) 720–3570.
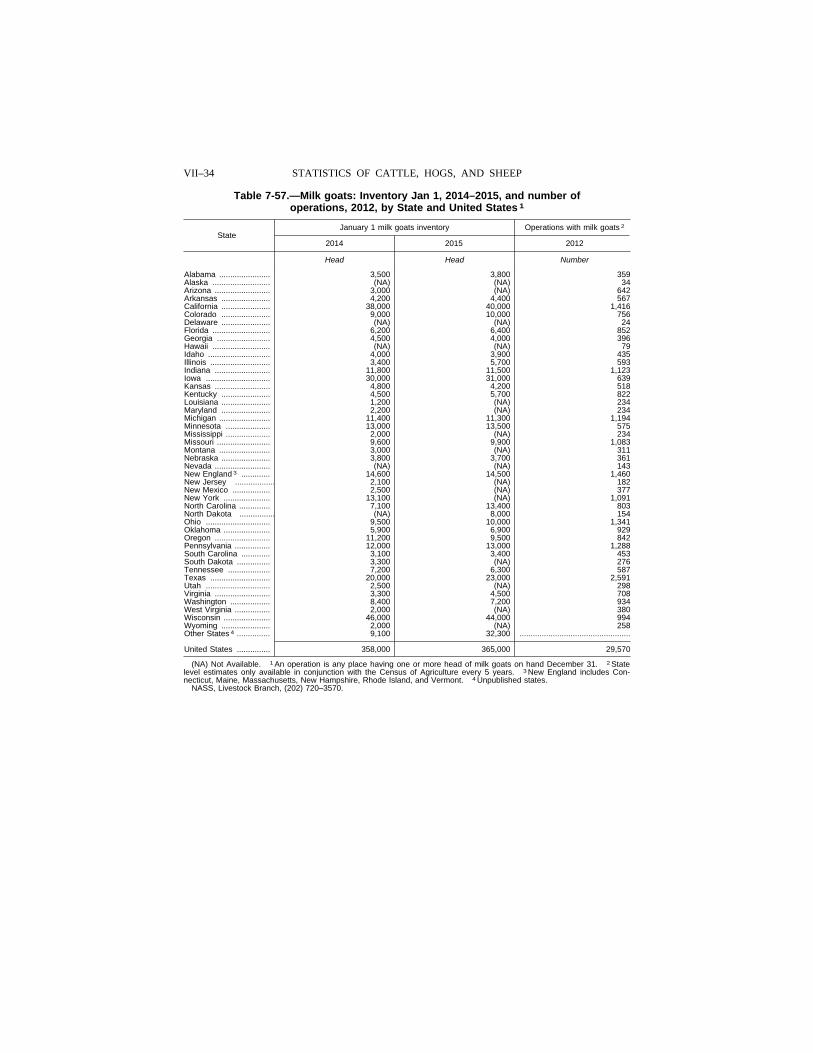
VII–34 STATISTICS OF CATTLE, HOGS, AND SHEEP
Table 7-57.—Milk goats: Inventory Jan 1, 2014–2015, and number of operations, 2012, by State and United States 1
State January 1 milk goats inventory Operations with milk goats 2
2014 2015 2012
Head Head Number
Alabama ....................... 3,500 3,800 359 Alaska .......................... (NA) (NA) 34 Arizona ......................... 3,000 (NA) 642 Arkansas ...................... 4,200 4,400 567 California ...................... 38,000 40,000 1,416 Colorado ...................... 9,000 10,000 756 Delaware ...................... (NA) (NA) 24 Florida .......................... 6,200 6,400 852 Georgia ........................ 4,500 4,000 396 Hawaii .......................... (NA) (NA) 79 Idaho ............................ 4,000 3,900 435 Illinois ........................... 3,400 5,700 593 Indiana ......................... 11,800 11,500 1,123 Iowa ............................. 30,000 31,000 639 Kansas ......................... 4,800 4,200 518 Kentucky ...................... 4,500 5,700 822 Louisiana ...................... 1,200 (NA) 234 Maryland ...................... 2,200 (NA) 234 Michigan ....................... 11,400 11,300 1,194 Minnesota .................... 13,000 13,500 575 Mississippi .................... 2,000 (NA) 234 Missouri ........................ 9,600 9,900 1,083 Montana ....................... 3,000 (NA) 311 Nebraska ...................... 3,800 3,700 361 Nevada ......................... (NA) (NA) 143 New England 3 ............. 14,600 14,500 1,460 New Jersey .................. 2,100 (NA) 182 New Mexico ................. 2,500 (NA) 377 New York ..................... 13,100 (NA) 1,091 North Carolina .............. 7,100 13,400 803 North Dakota ................ (NA) 8,000 154 Ohio ............................. 9,500 10,000 1,341 Oklahoma ..................... 5,900 6,900 929 Oregon ......................... 11,200 9,500 842 Pennsylvania ................ 12,000 13,000 1,288 South Carolina ............. 3,100 3,400 453 South Dakota ............... 3,300 (NA) 276 Tennessee ................... 7,200 6,300 587 Texas ........................... 20,000 23,000 2,591 Utah ............................. 2,500 (NA) 298 Virginia ......................... 3,300 4,500 708 Washington .................. 8,400 7,200 934 West Virginia ................ 2,000 (NA) 380 Wisconsin ..................... 46,000 44,000 994 Wyoming ...................... 2,000 (NA) 258 Other States 4 ............... 9,100 32,300 ..................................................
United States ............... 358,000 365,000 29,570
(NA) Not Available. 1 An operation is any place having one or more head of milk goats on hand December 31. 2 State level estimates only available in conjunction with the Census of Agriculture every 5 years. 3 New England includes Con-necticut, Maine, Massachusetts, New Hampshire, Rhode Island, and Vermont. 4 Unpublished states.
NASS, Livestock Branch, (202) 720–3570.
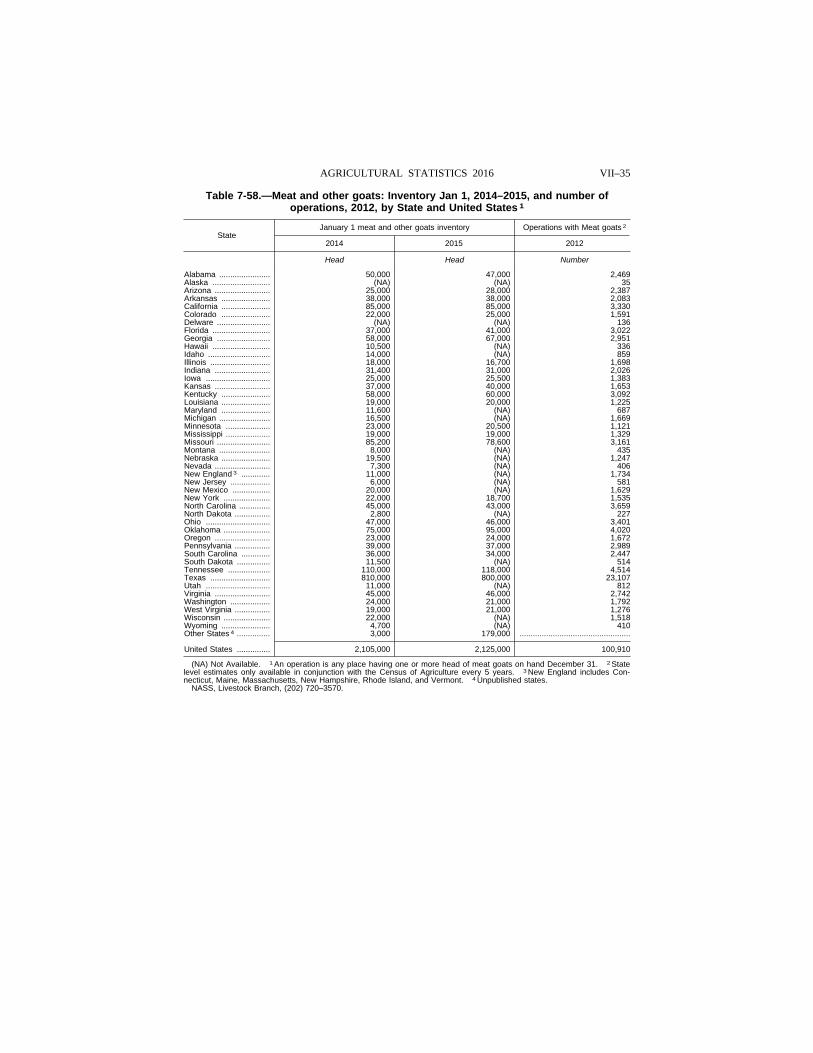
VII–35 AGRICULTURAL STATISTICS 2016
Table 7-58.—Meat and other goats: Inventory Jan 1, 2014–2015, and number of operations, 2012, by State and United States 1
State January 1 meat and other goats inventory Operations with Meat goats 2
2014 2015 2012
Head Head Number
Alabama ....................... 50,000 47,000 2,469 Alaska .......................... (NA) (NA) 35 Arizona ......................... 25,000 28,000 2,387 Arkansas ...................... 38,000 38,000 2,083 California ...................... 85,000 85,000 3,330 Colorado ...................... 22,000 25,000 1,591 Delware ........................ (NA) (NA) 136 Florida .......................... 37,000 41,000 3,022 Georgia ........................ 58,000 67,000 2,951 Hawaii .......................... 10,500 (NA) 336 Idaho ............................ 14,000 (NA) 859 Illinois ........................... 18,000 16,700 1,698 Indiana ......................... 31,400 31,000 2,026 Iowa ............................. 25,000 25,500 1,383 Kansas ......................... 37,000 40,000 1,653 Kentucky ...................... 58,000 60,000 3,092 Louisiana ...................... 19,000 20,000 1,225 Maryland ...................... 11,600 (NA) 687 Michigan ....................... 16,500 (NA) 1,669 Minnesota .................... 23,000 20,500 1,121 Mississippi .................... 19,000 19,000 1,329 Missouri ........................ 85,200 78,600 3,161 Montana ....................... 8,000 (NA) 435 Nebraska ...................... 19,500 (NA) 1,247 Nevada ......................... 7,300 (NA) 406 New England 3 ............. 11,000 (NA) 1,734 New Jersey .................. 6,000 (NA) 581 New Mexico ................. 20,000 (NA) 1,629 New York ..................... 22,000 18,700 1,535 North Carolina .............. 45,000 43,000 3,659 North Dakota ................ 2,800 (NA) 227 Ohio ............................. 47,000 46,000 3,401 Oklahoma ..................... 75,000 95,000 4,020 Oregon ......................... 23,000 24,000 1,672 Pennsylvania ................ 39,000 37,000 2,989 South Carolina ............. 36,000 34,000 2,447 South Dakota ............... 11,500 (NA) 514 Tennessee ................... 110,000 118,000 4,514 Texas ........................... 810,000 800,000 23,107 Utah ............................. 11,000 (NA) 812 Virginia ......................... 45,000 46,000 2,742 Washington .................. 24,000 21,000 1,792 West Virginia ................ 19,000 21,000 1,276 Wisconsin ..................... 22,000 (NA) 1,518 Wyoming ...................... 4,700 (NA) 410 Other States 4 ............... 3,000 179,000 ..................................................
United States ............... 2,105,000 2,125,000 100,910
(NA) Not Available. 1 An operation is any place having one or more head of meat goats on hand December 31. 2 State level estimates only available in conjunction with the Census of Agriculture every 5 years. 3 New England includes Con-necticut, Maine, Massachusetts, New Hampshire, Rhode Island, and Vermont. 4 Unpublished states.
NASS, Livestock Branch, (202) 720–3570.
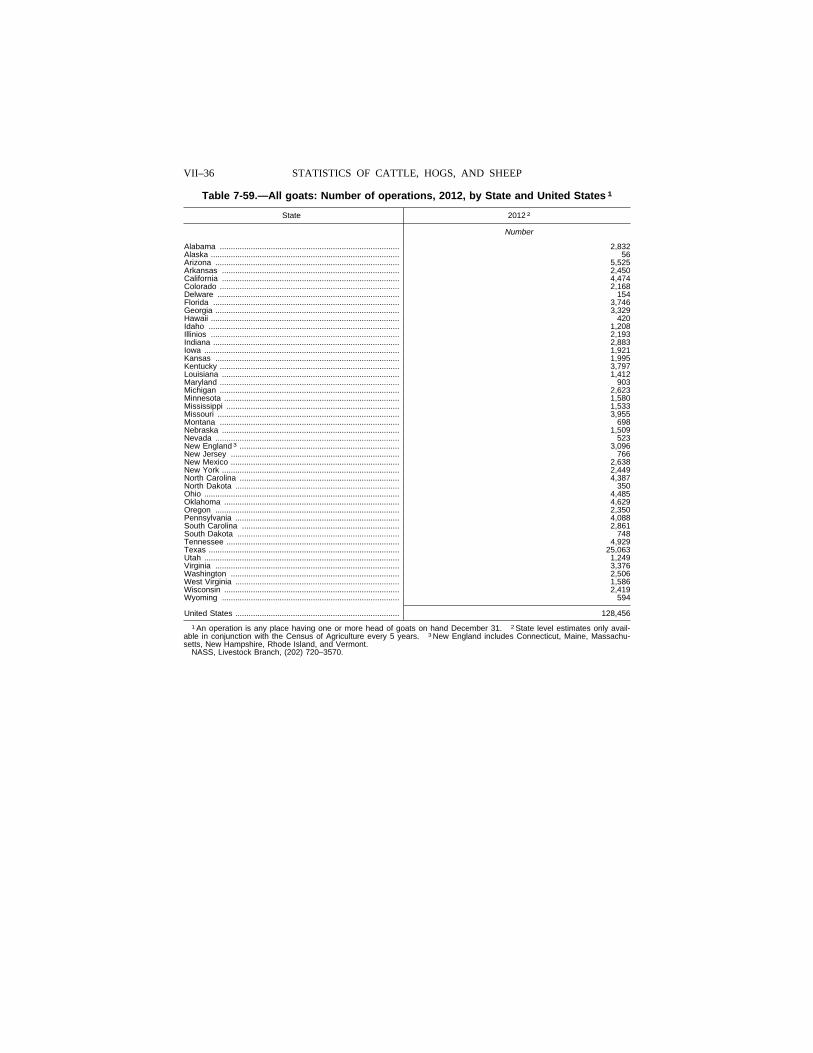
VII–36 STATISTICS OF CATTLE, HOGS, AND SHEEP
Table 7-59.—All goats: Number of operations, 2012, by State and United States 1
State 2012 2
Number
Alabama ................................................................................. 2,832 Alaska ..................................................................................... 56 Arizona ................................................................................... 5,525 Arkansas ................................................................................ 2,450 California ................................................................................ 4,474 Colorado ................................................................................. 2,168 Delware .................................................................................. 154 Florida .................................................................................... 3,746 Georgia ................................................................................... 3,329 Hawaii ..................................................................................... 420 Idaho ...................................................................................... 1,208 Illinios ..................................................................................... 2,193 Indiana .................................................................................... 2,883 Iowa ........................................................................................ 1,921 Kansas ................................................................................... 1,995 Kentucky ................................................................................. 3,797 Louisiana ................................................................................ 1,412 Maryland ................................................................................. 903 Michigan ................................................................................. 2,623 Minnesota ............................................................................... 1,580 Mississippi .............................................................................. 1,533 Missouri .................................................................................. 3,955 Montana ................................................................................. 698 Nebraska ................................................................................ 1,509 Nevada ................................................................................... 523 New England 3 ........................................................................ 3,096 New Jersey ............................................................................ 766 New Mexico ............................................................................ 2,638 New York ................................................................................ 2,449 North Carolina ........................................................................ 4,387 North Dakota .......................................................................... 350 Ohio ........................................................................................ 4,485 Oklahoma ............................................................................... 4,629 Oregon ................................................................................... 2,350 Pennsylvania .......................................................................... 4,088 South Carolina ....................................................................... 2,861 South Dakota ......................................................................... 748 Tennessee .............................................................................. 4,929 Texas ...................................................................................... 25,063 Utah ........................................................................................ 1,249 Virginia ................................................................................... 3,376 Washington ............................................................................ 2,506 West Virginia .......................................................................... 1,586 Wisconsin ............................................................................... 2,419 Wyoming ................................................................................ 594
United States .......................................................................... 128,456
1 An operation is any place having one or more head of goats on hand December 31. 2 State level estimates only avail-able in conjunction with the Census of Agriculture every 5 years. 3 New England includes Connecticut, Maine, Massachu-setts, New Hampshire, Rhode Island, and Vermont.
NASS, Livestock Branch, (202) 720–3570.
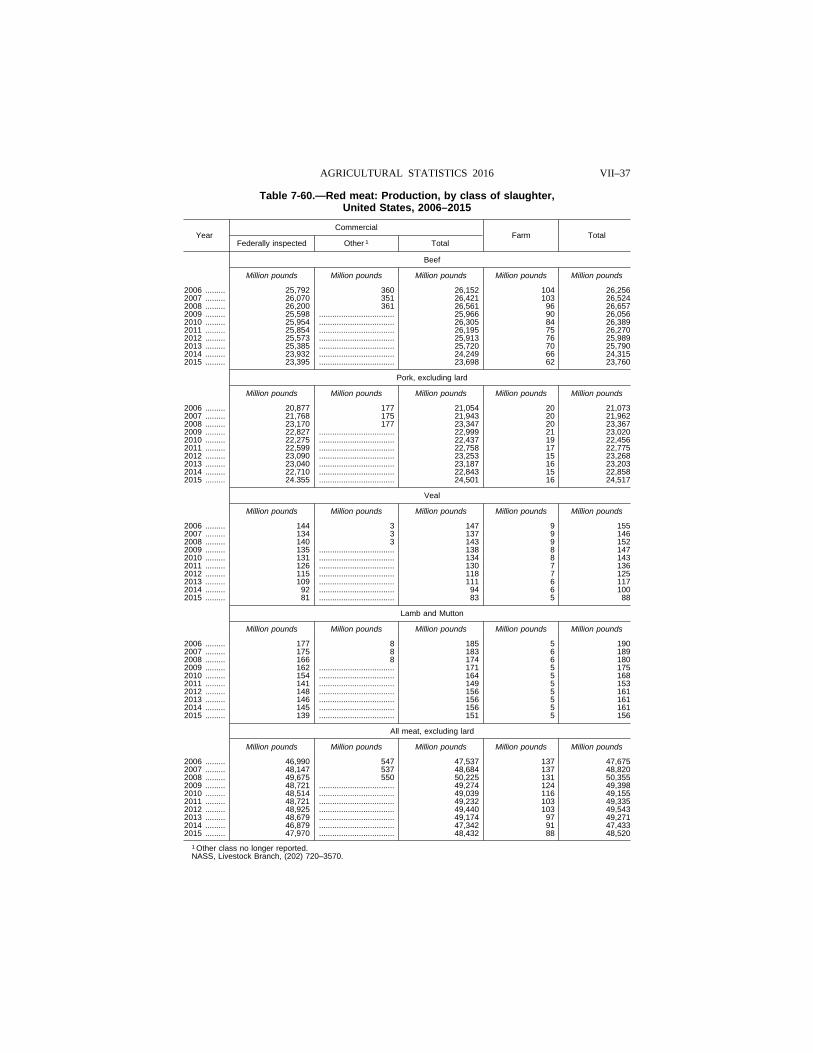
VII–37 AGRICULTURAL STATISTICS 2016
Table 7-60.—Red meat: Production, by class of slaughter, United States, 2006–2015
Year Commercial
Farm Total Federally inspected Other 1 Total
Beef
Million pounds Million pounds Million pounds Million pounds Million pounds
2006 ......... 25,792 360 26,152 104 26,256 2007 ......... 26,070 351 26,421 103 26,524 2008 ......... 26,200 361 26,561 96 26,657 2009 ......... 25,598 .................................. 25,966 90 26,056 2010 ......... 25,954 .................................. 26,305 84 26,389 2011 ......... 25,854 .................................. 26,195 75 26,270 2012 ......... 25,573 .................................. 25,913 76 25,989 2013 ......... 25,385 .................................. 25,720 70 25,790 2014 ......... 23,932 .................................. 24,249 66 24,315 2015 ......... 23,395 .................................. 23,698 62 23,760
Pork, excluding lard
Million pounds Million pounds Million pounds Million pounds Million pounds
2006 ......... 20,877 177 21,054 20 21,073 2007 ......... 21,768 175 21,943 20 21,962 2008 ......... 23,170 177 23,347 20 23,367 2009 ......... 22,827 .................................. 22,999 21 23,020 2010 ......... 22,275 .................................. 22,437 19 22,456 2011 ......... 22,599 .................................. 22,758 17 22,775 2012 ......... 23,090 .................................. 23,253 15 23,268 2013 ......... 23,040 .................................. 23,187 16 23,203 2014 ......... 22,710 .................................. 22,843 15 22,858 2015 ......... 24.355 .................................. 24,501 16 24,517
Veal
Million pounds Million pounds Million pounds Million pounds Million pounds
2006 ......... 144 3 147 9 155 2007 ......... 134 3 137 9 146 2008 ......... 140 3 143 9 152 2009 ......... 135 .................................. 138 8 147 2010 ......... 131 .................................. 134 8 143 2011 ......... 126 .................................. 130 7 136 2012 ......... 115 .................................. 118 7 125 2013 ......... 109 .................................. 111 6 117 2014 ......... 92 .................................. 94 6 100 2015 ......... 81 .................................. 83 5 88
Lamb and Mutton
Million pounds Million pounds Million pounds Million pounds Million pounds
2006 ......... 177 8 185 5 190 2007 ......... 175 8 183 6 189 2008 ......... 166 8 174 6 180 2009 ......... 162 .................................. 171 5 175 2010 ......... 154 .................................. 164 5 168 2011 ......... 141 .................................. 149 5 153 2012 ......... 148 .................................. 156 5 161 2013 ......... 146 .................................. 156 5 161 2014 ......... 145 .................................. 156 5 161 2015 ......... 139 .................................. 151 5 156
All meat, excluding lard
Million pounds Million pounds Million pounds Million pounds Million pounds
2006 ......... 46,990 547 47,537 137 47,675 2007 ......... 48,147 537 48,684 137 48,820 2008 ......... 49,675 550 50,225 131 50,355 2009 ......... 48,721 .................................. 49,274 124 49,398 2010 ......... 48,514 .................................. 49,039 116 49,155 2011 ......... 48,721 .................................. 49,232 103 49,335 2012 ......... 48,925 .................................. 49,440 103 49,543 2013 ......... 48,679 .................................. 49,174 97 49,271 2014 ......... 46,879 .................................. 47,342 91 47,433 2015 ......... 47,970 .................................. 48,432 88 48,520
1 Other class no longer reported. NASS, Livestock Branch, (202) 720–3570.
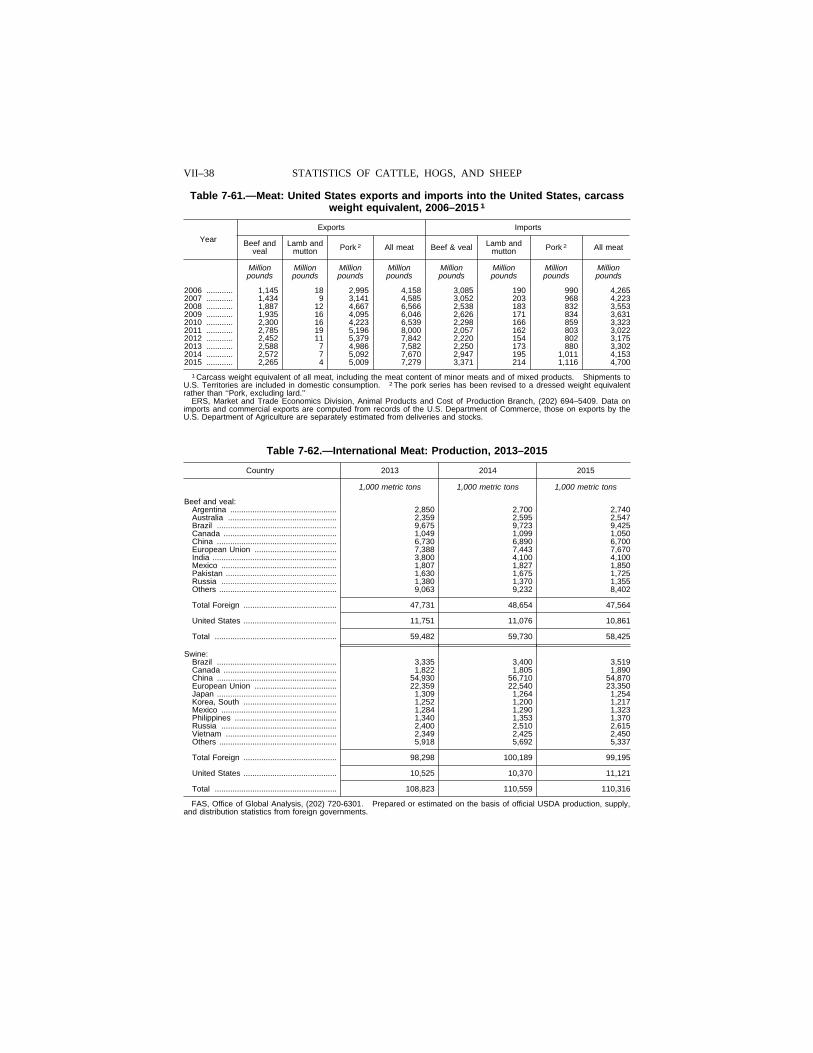
VII–38 STATISTICS OF CATTLE, HOGS, AND SHEEP
Table 7-61.—Meat: United States exports and imports into the United States, carcass weight equivalent, 2006–2015 1
Year
Exports Imports
Beef and veal
Lamb and mutton Pork 2 All meat Beef & veal Lamb and
mutton Pork 2 All meat
Million Million Million Million Million Million Million Million pounds pounds pounds pounds pounds pounds pounds pounds
2006 ............ 1,145 18 2,995 4,158 3,085 190 990 4,265 2007 ............ 1,434 9 3,141 4,585 3,052 203 968 4,223 2008 ............ 1,887 12 4,667 6,566 2,538 183 832 3,553 2009 ............ 1,935 16 4,095 6,046 2,626 171 834 3,631 2010 ............ 2,300 16 4,223 6,539 2,298 166 859 3,323 2011 ............ 2,785 19 5,196 8,000 2,057 162 803 3,022 2012 ............ 2,452 11 5,379 7,842 2,220 154 802 3,175 2013 ............ 2,588 7 4,986 7,582 2,250 173 880 3,302 2014 ............ 2,572 7 5,092 7,670 2,947 195 1,011 4,153 2015 ............ 2,265 4 5,009 7,279 3,371 214 1,116 4,700
1 Carcass weight equivalent of all meat, including the meat content of minor meats and of mixed products. Shipments to U.S. Territories are included in domestic consumption. 2 The pork series has been revised to a dressed weight equivalent rather than ‘‘Pork, excluding lard.’’
ERS, Market and Trade Economics Division, Animal Products and Cost of Production Branch, (202) 694–5409. Data on imports and commercial exports are computed from records of the U.S. Department of Commerce, those on exports by the U.S. Department of Agriculture are separately estimated from deliveries and stocks.
Table 7-62.—International Meat: Production, 2013–2015
Country 2013 2014 2015
1,000 metric tons 1,000 metric tons 1,000 metric tons
Beef and veal: Argentina ................................................ 2,850 2,700 2,740 Australia ................................................. 2,359 2,595 2,547 Brazil ...................................................... 9,675 9,723 9,425 Canada ................................................... 1,049 1,099 1,050 China ...................................................... 6,730 6,890 6,700 European Union ..................................... 7,388 7,443 7,670 India ........................................................ 3,800 4,100 4,100 Mexico .................................................... 1,807 1,827 1,850 Pakistan .................................................. 1,630 1,675 1,725 Russia .................................................... 1,380 1,370 1,355 Others ..................................................... 9,063 9,232 8,402
Total Foreign .......................................... 47,731 48,654 47,564
United States .......................................... 11,751 11,076 10,861
Total ....................................................... 59,482 59,730 58,425
Swine: Brazil ...................................................... 3,335 3,400 3,519 Canada ................................................... 1,822 1,805 1,890 China ...................................................... 54,930 56,710 54,870 European Union ..................................... 22,359 22,540 23,350 Japan ...................................................... 1,309 1,264 1,254 Korea, South .......................................... 1,252 1,200 1,217 Mexico .................................................... 1,284 1,290 1,323 Philippines .............................................. 1,340 1,353 1,370 Russia .................................................... 2,400 2,510 2,615 Vietnam .................................................. 2,349 2,425 2,450 Others ..................................................... 5,918 5,692 5,337
Total Foreign .......................................... 98,298 100,189 99,195
United States .......................................... 10,525 10,370 11,121
Total ....................................................... 108,823 110,559 110,316
FAS, Office of Global Analysis, (202) 720-6301. Prepared or estimated on the basis of official USDA production, supply, and distribution statistics from foreign governments.
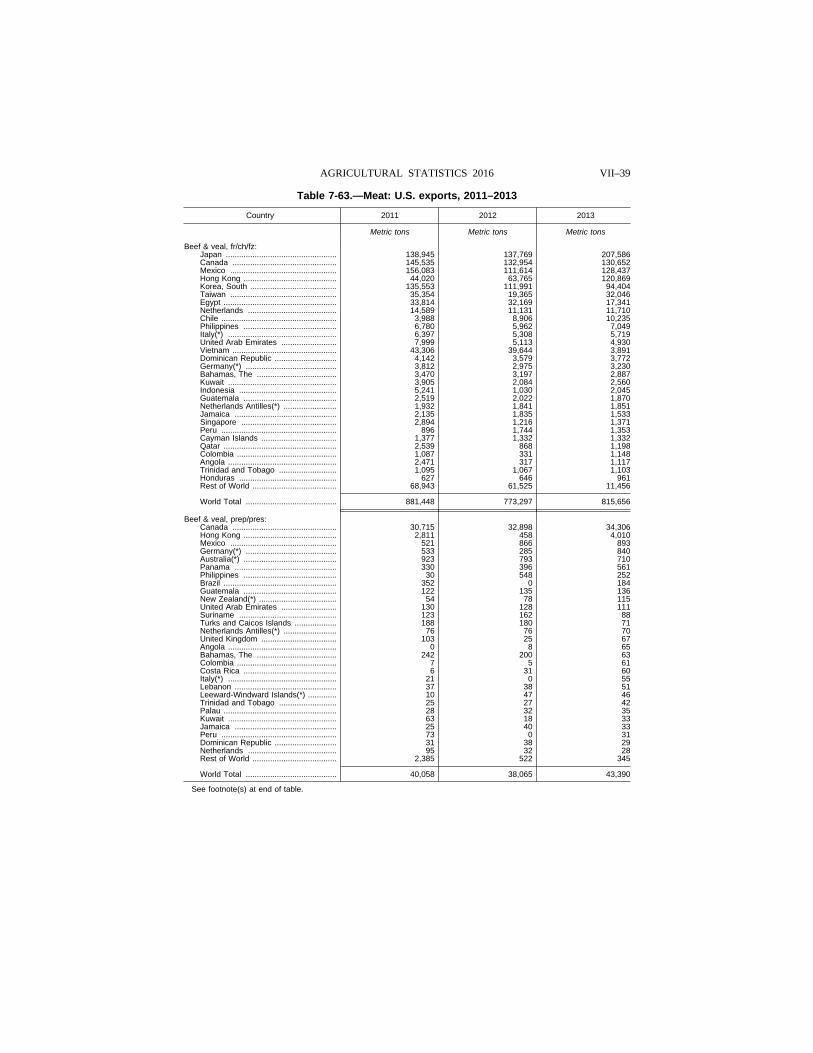
VII–39 AGRICULTURAL STATISTICS 2016
Table 7-63.—Meat: U.S. exports, 2011–2013
Country 2011 2012 2013
Metric tons Metric tons Metric tons
Beef & veal, fr/ch/fz: Japan .................................................. 138,945 137,769 207,586 Canada ............................................... 145,535 132,954 130,652 Mexico ................................................ 156,083 111,614 128,437 Hong Kong .......................................... 44,020 63,765 120,869 Korea, South ....................................... 135,553 111,991 94,404 Taiwan ................................................ 35,354 19,365 32,046 Egypt ................................................... 33,814 32,169 17,341 Netherlands ........................................ 14,589 11,131 11,710 Chile .................................................... 3,988 8,906 10,235 Philippines .......................................... 6,780 5,962 7,049 Italy(*) ................................................. 6,397 5,308 5,719 United Arab Emirates ......................... 7,999 5,113 4,930 Vietnam ............................................... 43,306 39,644 3,891 Dominican Republic ............................ 4,142 3,579 3,772 Germany(*) ......................................... 3,812 2,975 3,230 Bahamas, The .................................... 3,470 3,197 2,887 Kuwait ................................................. 3,905 2,084 2,560 Indonesia ............................................ 5,241 1,030 2,045 Guatemala .......................................... 2,519 2,022 1,870 Netherlands Antilles(*) ........................ 1,932 1,841 1,851 Jamaica .............................................. 2,135 1,835 1,533 Singapore ........................................... 2,894 1,216 1,371 Peru .................................................... 896 1,744 1,353 Cayman Islands .................................. 1,377 1,332 1,332 Qatar ................................................... 2,539 868 1,198 Colombia ............................................. 1,087 331 1,148 Angola ................................................. 2,471 317 1,117 Trinidad and Tobago .......................... 1,095 1,067 1,103 Honduras ............................................ 627 646 961 Rest of World ...................................... 68,943 61,525 11,456
World Total ......................................... 881,448 773,297 815,656
Beef & veal, prep/pres: Canada ............................................... 30,715 32,898 34,306 Hong Kong .......................................... 2,811 458 4,010 Mexico ................................................ 521 866 893 Germany(*) ......................................... 533 285 840 Australia(*) .......................................... 923 793 710 Panama .............................................. 330 396 561 Philippines .......................................... 30 548 252 Brazil ................................................... 352 0 184 Guatemala .......................................... 122 135 136 New Zealand(*) ................................... 54 78 115 United Arab Emirates ......................... 130 128 111 Suriname ............................................ 123 162 88 Turks and Caicos Islands ................... 188 180 71 Netherlands Antilles(*) ........................ 76 76 70 United Kingdom .................................. 103 25 67 Angola ................................................. 0 8 65 Bahamas, The .................................... 242 200 63 Colombia ............................................. 7 5 61 Costa Rica .......................................... 6 31 60 Italy(*) ................................................. 21 0 55 Lebanon .............................................. 37 38 51 Leeward-Windward Islands(*) ............. 10 47 46 Trinidad and Tobago .......................... 25 27 42 Palau ................................................... 28 32 35 Kuwait ................................................. 63 18 33 Jamaica .............................................. 25 40 33 Peru .................................................... 73 0 31 Dominican Republic ............................ 31 38 29 Netherlands ........................................ 95 32 28 Rest of World ...................................... 2,385 522 345
World Total ......................................... 40,058 38,065 43,390
See footnote(s) at end of table.
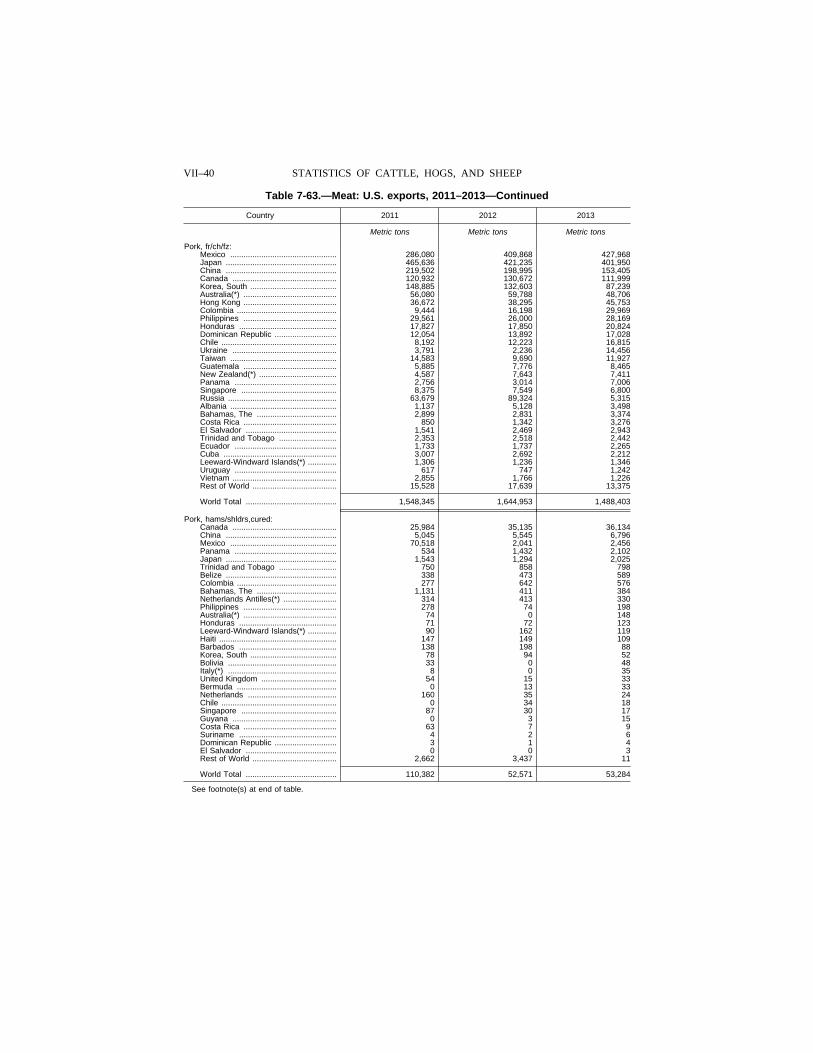
VII–40 STATISTICS OF CATTLE, HOGS, AND SHEEP
Table 7-63.—Meat: U.S. exports, 2011–2013—Continued
Country 2011 2012 2013
Metric tons Metric tons Metric tons
Pork, fr/ch/fz: Mexico ................................................ 286,080 409,868 427,968 Japan .................................................. 465,636 421,235 401,950 China .................................................. 219,502 198,995 153,405 Canada ............................................... 120,932 130,672 111,999 Korea, South ....................................... 148,885 132,603 87,239 Australia(*) .......................................... 56,080 59,788 48,706 Hong Kong .......................................... 36,672 38,295 45,753 Colombia ............................................. 9,444 16,198 29,969 Philippines .......................................... 29,561 26,000 28,169 Honduras ............................................ 17,827 17,850 20,824 Dominican Republic ............................ 12,054 13,892 17,028 Chile .................................................... 8,192 12,223 16,815 Ukraine ............................................... 3,791 2,236 14,456 Taiwan ................................................ 14,583 9,690 11,927 Guatemala .......................................... 5,885 7,776 8,465 New Zealand(*) ................................... 4,587 7,643 7,411 Panama .............................................. 2,756 3,014 7,006 Singapore ........................................... 8,375 7,549 6,800 Russia ................................................. 63,679 89,324 5,315 Albania ................................................ 1,137 5,128 3,498 Bahamas, The .................................... 2,899 2,831 3,374 Costa Rica .......................................... 850 1,342 3,276 El Salvador ......................................... 1,541 2,469 2,943 Trinidad and Tobago .......................... 2,353 2,518 2,442 Ecuador .............................................. 1,733 1,737 2,265 Cuba ................................................... 3,007 2,692 2,212 Leeward-Windward Islands(*) ............. 1,306 1,236 1,346 Uruguay .............................................. 617 747 1,242 Vietnam ............................................... 2,855 1,766 1,226 Rest of World ...................................... 15,528 17,639 13,375
World Total ......................................... 1,548,345 1,644,953 1,488,403
Pork, hams/shldrs,cured: Canada ............................................... 25,984 35,135 36,134 China .................................................. 5,045 5,545 6,796 Mexico ................................................ 70,518 2,041 2,456 Panama .............................................. 534 1,432 2,102 Japan .................................................. 1,543 1,294 2,025 Trinidad and Tobago .......................... 750 858 798 Belize .................................................. 338 473 589 Colombia ............................................. 277 642 576 Bahamas, The .................................... 1,131 411 384 Netherlands Antilles(*) ........................ 314 413 330 Philippines .......................................... 278 74 198 Australia(*) .......................................... 74 0 148 Honduras ............................................ 71 72 123 Leeward-Windward Islands(*) ............. 90 162 119 Haiti ..................................................... 147 149 109 Barbados ............................................ 138 198 88 Korea, South ....................................... 78 94 52 Bolivia ................................................. 33 0 48 Italy(*) ................................................. 8 0 35 United Kingdom .................................. 54 15 33 Bermuda ............................................. 0 13 33 Netherlands ........................................ 160 35 24 Chile .................................................... 0 34 18 Singapore ........................................... 87 30 17 Guyana ............................................... 0 3 15 Costa Rica .......................................... 63 7 9 Suriname ............................................ 4 2 6 Dominican Republic ............................ 3 1 4 El Salvador ......................................... 0 0 3 Rest of World ...................................... 2,662 3,437 11
World Total ......................................... 110,382 52,571 53,284
See footnote(s) at end of table.
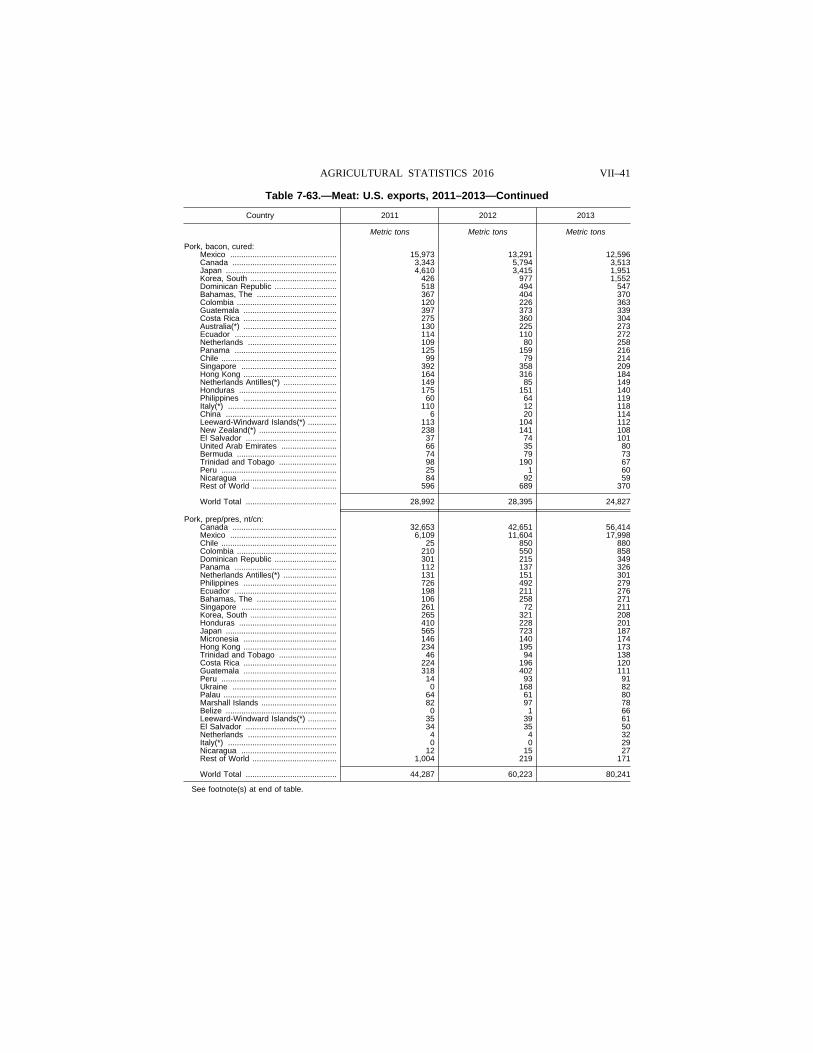
VII–41 AGRICULTURAL STATISTICS 2016
Table 7-63.—Meat: U.S. exports, 2011–2013—Continued
Country 2011 2012 2013
Metric tons Metric tons Metric tons
Pork, bacon, cured: Mexico ................................................ 15,973 13,291 12,596 Canada ............................................... 3,343 5,794 3,513 Japan .................................................. 4,610 3,415 1,951 Korea, South ....................................... 426 977 1,552 Dominican Republic ............................ 518 494 547 Bahamas, The .................................... 367 404 370 Colombia ............................................. 120 226 363 Guatemala .......................................... 397 373 339 Costa Rica .......................................... 275 360 304 Australia(*) .......................................... 130 225 273 Ecuador .............................................. 114 110 272 Netherlands ........................................ 109 80 258 Panama .............................................. 125 159 216 Chile .................................................... 99 79 214 Singapore ........................................... 392 358 209 Hong Kong .......................................... 164 316 184 Netherlands Antilles(*) ........................ 149 85 149 Honduras ............................................ 175 151 140 Philippines .......................................... 60 64 119 Italy(*) ................................................. 110 12 118 China .................................................. 6 20 114 Leeward-Windward Islands(*) ............. 113 104 112 New Zealand(*) ................................... 238 141 108 El Salvador ......................................... 37 74 101 United Arab Emirates ......................... 66 35 80 Bermuda ............................................. 74 79 73 Trinidad and Tobago .......................... 98 190 67 Peru .................................................... 25 1 60 Nicaragua ........................................... 84 92 59 Rest of World ...................................... 596 689 370
World Total ......................................... 28,992 28,395 24,827
Pork, prep/pres, nt/cn: Canada ............................................... 32,653 42,651 56,414 Mexico ................................................ 6,109 11,604 17,998 Chile .................................................... 25 850 880 Colombia ............................................. 210 550 858 Dominican Republic ............................ 301 215 349 Panama .............................................. 112 137 326 Netherlands Antilles(*) ........................ 131 151 301 Philippines .......................................... 726 492 279 Ecuador .............................................. 198 211 276 Bahamas, The .................................... 106 258 271 Singapore ........................................... 261 72 211 Korea, South ....................................... 265 321 208 Honduras ............................................ 410 228 201 Japan .................................................. 565 723 187 Micronesia .......................................... 146 140 174 Hong Kong .......................................... 234 195 173 Trinidad and Tobago .......................... 46 94 138 Costa Rica .......................................... 224 196 120 Guatemala .......................................... 318 402 111 Peru .................................................... 14 93 91 Ukraine ............................................... 0 168 82 Palau ................................................... 64 61 80 Marshall Islands .................................. 82 97 78 Belize .................................................. 0 1 66 Leeward-Windward Islands(*) ............. 35 39 61 El Salvador ......................................... 34 35 50 Netherlands ........................................ 4 4 32 Italy(*) ................................................. 0 0 29 Nicaragua ........................................... 12 15 27 Rest of World ...................................... 1,004 219 171
World Total ......................................... 44,287 60,223 80,241
See footnote(s) at end of table.
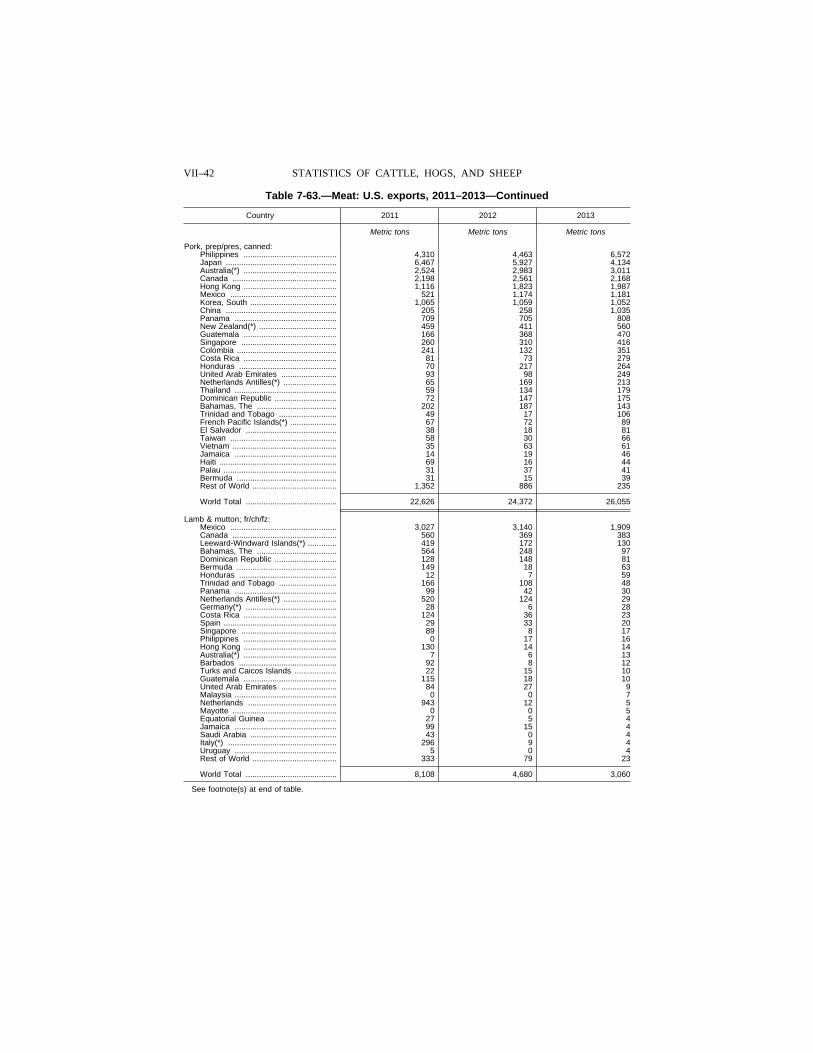
VII–42 STATISTICS OF CATTLE, HOGS, AND SHEEP
Table 7-63.—Meat: U.S. exports, 2011–2013—Continued
Country 2011 2012 2013
Metric tons Metric tons Metric tons
Pork, prep/pres, canned: Philippines .......................................... 4,310 4,463 6,572 Japan .................................................. 6,467 5,927 4,134 Australia(*) .......................................... 2,524 2,983 3,011 Canada ............................................... 2,198 2,561 2,168 Hong Kong .......................................... 1,116 1,823 1,987 Mexico ................................................ 521 1,174 1,181 Korea, South ....................................... 1,065 1,059 1,052 China .................................................. 205 258 1,035 Panama .............................................. 709 705 808 New Zealand(*) ................................... 459 411 560 Guatemala .......................................... 166 368 470 Singapore ........................................... 260 310 416 Colombia ............................................. 241 132 351 Costa Rica .......................................... 81 73 279 Honduras ............................................ 70 217 264 United Arab Emirates ......................... 93 98 249 Netherlands Antilles(*) ........................ 65 169 213 Thailand .............................................. 59 134 179 Dominican Republic ............................ 72 147 175 Bahamas, The .................................... 202 187 143 Trinidad and Tobago .......................... 49 17 106 French Pacific Islands(*) ..................... 67 72 89 El Salvador ......................................... 38 18 81 Taiwan ................................................ 58 30 66 Vietnam ............................................... 35 63 61 Jamaica .............................................. 14 19 46 Haiti ..................................................... 69 16 44 Palau ................................................... 31 37 41 Bermuda ............................................. 31 15 39 Rest of World ...................................... 1,352 886 235
World Total ......................................... 22,626 24,372 26,055
Lamb & mutton; fr/ch/fz: Mexico ................................................ 3,027 3,140 1,909 Canada ............................................... 560 369 383 Leeward-Windward Islands(*) ............. 419 172 130 Bahamas, The .................................... 564 248 97 Dominican Republic ............................ 128 148 81 Bermuda ............................................. 149 18 63 Honduras ............................................ 12 7 59 Trinidad and Tobago .......................... 166 108 48 Panama .............................................. 99 42 30 Netherlands Antilles(*) ........................ 520 124 29 Germany(*) ......................................... 28 6 28 Costa Rica .......................................... 124 36 23 Spain ................................................... 29 33 20 Singapore ........................................... 89 8 17 Philippines .......................................... 0 17 16 Hong Kong .......................................... 130 14 14 Australia(*) .......................................... 7 6 13 Barbados ............................................ 92 8 12 Turks and Caicos Islands ................... 22 15 10 Guatemala .......................................... 115 18 10 United Arab Emirates ......................... 84 27 9 Malaysia .............................................. 0 0 7 Netherlands ........................................ 943 12 5 Mayotte ............................................... 0 0 5 Equatorial Guinea ............................... 27 5 4 Jamaica .............................................. 99 15 4 Saudi Arabia ....................................... 43 0 4 Italy(*) ................................................. 296 9 4 Uruguay .............................................. 5 0 4 Rest of World ...................................... 333 79 23
World Total ......................................... 8,108 4,680 3,060
See footnote(s) at end of table.
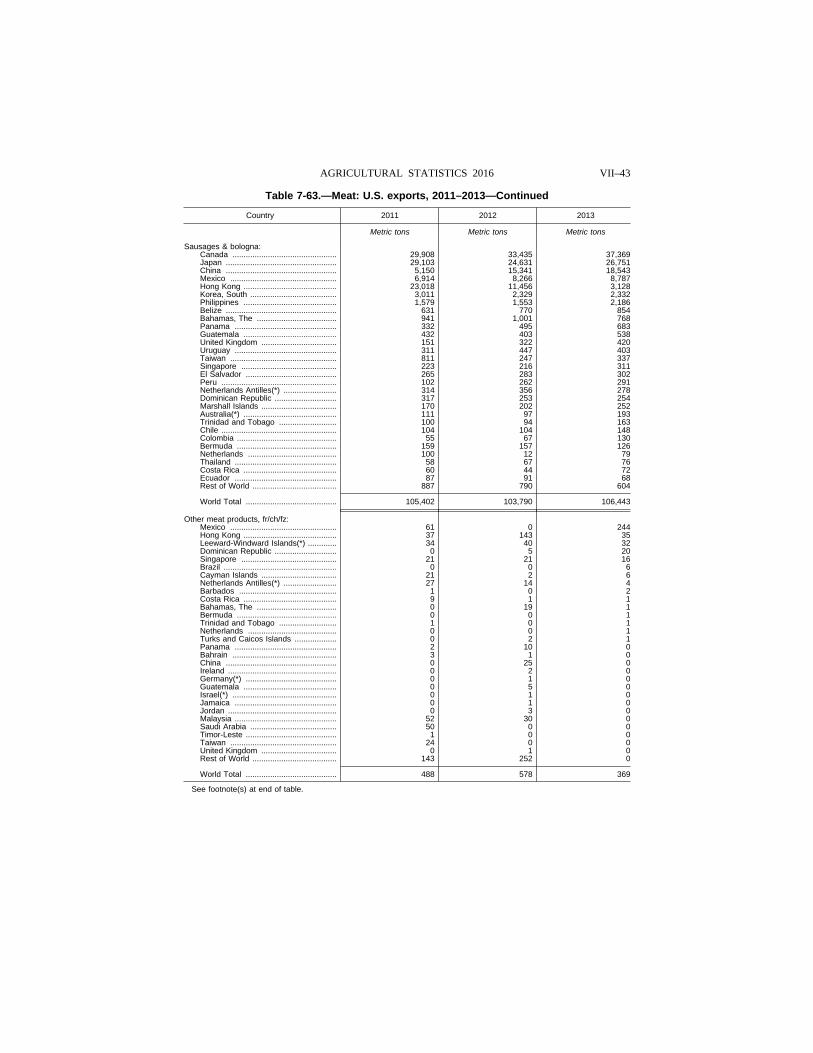
VII–43 AGRICULTURAL STATISTICS 2016
Table 7-63.—Meat: U.S. exports, 2011–2013—Continued
Country 2011 2012 2013
Metric tons Metric tons Metric tons
Sausages & bologna: Canada ............................................... 29,908 33,435 37,369 Japan .................................................. 29,103 24,631 26,751 China .................................................. 5,150 15,341 18,543 Mexico ................................................ 6,914 8,266 8,787 Hong Kong .......................................... 23,018 11,456 3,128 Korea, South ....................................... 3,011 2,329 2,332 Philippines .......................................... 1,579 1,553 2,186 Belize .................................................. 631 770 854 Bahamas, The .................................... 941 1,001 768 Panama .............................................. 332 495 683 Guatemala .......................................... 432 403 538 United Kingdom .................................. 151 322 420 Uruguay .............................................. 311 447 403 Taiwan ................................................ 811 247 337 Singapore ........................................... 223 216 311 El Salvador ......................................... 265 283 302 Peru .................................................... 102 262 291 Netherlands Antilles(*) ........................ 314 356 278 Dominican Republic ............................ 317 253 254 Marshall Islands .................................. 170 202 252 Australia(*) .......................................... 111 97 193 Trinidad and Tobago .......................... 100 94 163 Chile .................................................... 104 104 148 Colombia ............................................. 55 67 130 Bermuda ............................................. 159 157 126 Netherlands ........................................ 100 12 79 Thailand .............................................. 58 67 76 Costa Rica .......................................... 60 44 72 Ecuador .............................................. 87 91 68 Rest of World ...................................... 887 790 604
World Total ......................................... 105,402 103,790 106,443
Other meat products, fr/ch/fz: Mexico ................................................ 61 0 244 Hong Kong .......................................... 37 143 35 Leeward-Windward Islands(*) ............. 34 40 32 Dominican Republic ............................ 0 5 20 Singapore ........................................... 21 21 16 Brazil ................................................... 0 0 6 Cayman Islands .................................. 21 2 6 Netherlands Antilles(*) ........................ 27 14 4 Barbados ............................................ 1 0 2 Costa Rica .......................................... 9 1 1 Bahamas, The .................................... 0 19 1 Bermuda ............................................. 0 0 1 Trinidad and Tobago .......................... 1 0 1 Netherlands ........................................ 0 0 1 Turks and Caicos Islands ................... 0 2 1 Panama .............................................. 2 10 0 Bahrain ............................................... 3 1 0 China .................................................. 0 25 0 Ireland ................................................. 0 2 0 Germany(*) ......................................... 0 1 0 Guatemala .......................................... 0 5 0 Israel(*) ............................................... 0 1 0 Jamaica .............................................. 0 1 0 Jordan ................................................. 0 3 0 Malaysia .............................................. 52 30 0 Saudi Arabia ....................................... 50 0 0 Timor-Leste ......................................... 1 0 0 Taiwan ................................................ 24 0 0 United Kingdom .................................. 0 1 0 Rest of World ...................................... 143 252 0
World Total ......................................... 488 578 369
See footnote(s) at end of table.
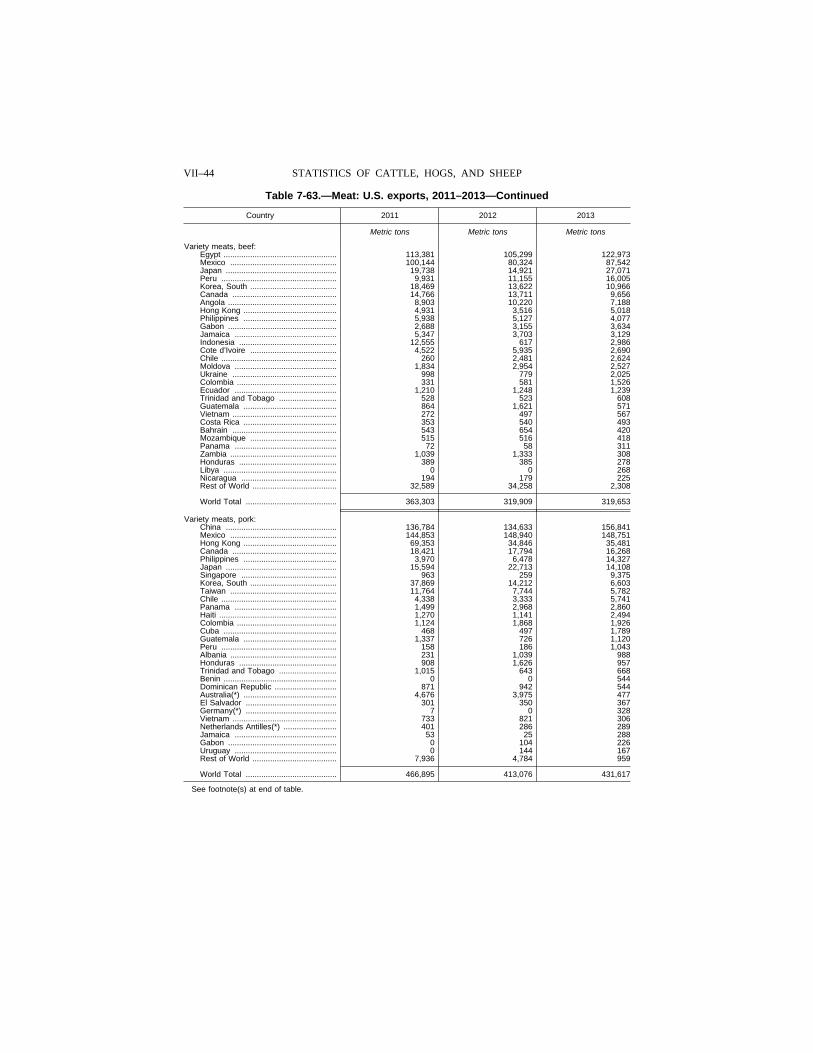
VII–44 STATISTICS OF CATTLE, HOGS, AND SHEEP
Table 7-63.—Meat: U.S. exports, 2011–2013—Continued
Country 2011 2012 2013
Metric tons Metric tons Metric tons
Variety meats, beef: Egypt ................................................... 113,381 105,299 122,973 Mexico ................................................ 100,144 80,324 87,542 Japan .................................................. 19,738 14,921 27,071 Peru .................................................... 9,931 11,155 16,005 Korea, South ....................................... 18,469 13,622 10,966 Canada ............................................... 14,766 13,711 9,656 Angola ................................................. 8,903 10,220 7,188 Hong Kong .......................................... 4,931 3,516 5,018 Philippines .......................................... 5,938 5,127 4,077 Gabon ................................................. 2,688 3,155 3,634 Jamaica .............................................. 5,347 3,703 3,129 Indonesia ............................................ 12,555 617 2,986 Cote d’Ivoire ....................................... 4,522 5,935 2,690 Chile .................................................... 260 2,481 2,624 Moldova .............................................. 1,834 2,954 2,527 Ukraine ............................................... 998 779 2,025 Colombia ............................................. 331 581 1,526 Ecuador .............................................. 1,210 1,248 1,239 Trinidad and Tobago .......................... 528 523 608 Guatemala .......................................... 864 1,621 571 Vietnam ............................................... 272 497 567 Costa Rica .......................................... 353 540 493 Bahrain ............................................... 543 654 420 Mozambique ....................................... 515 516 418 Panama .............................................. 72 58 311 Zambia ................................................ 1,039 1,333 308 Honduras ............................................ 389 385 278 Libya ................................................... 0 0 268 Nicaragua ........................................... 194 179 225 Rest of World ...................................... 32,589 34,258 2,308
World Total ......................................... 363,303 319,909 319,653
Variety meats, pork: China .................................................. 136,784 134,633 156,841 Mexico ................................................ 144,853 148,940 148,751 Hong Kong .......................................... 69,353 34,846 35,481 Canada ............................................... 18,421 17,794 16,268 Philippines .......................................... 3,970 6,478 14,327 Japan .................................................. 15,594 22,713 14,108 Singapore ........................................... 963 259 9,375 Korea, South ....................................... 37,869 14,212 6,603 Taiwan ................................................ 11,764 7,744 5,782 Chile .................................................... 4,338 3,333 5,741 Panama .............................................. 1,499 2,968 2,860 Haiti ..................................................... 1,270 1,141 2,494 Colombia ............................................. 1,124 1,868 1,926 Cuba ................................................... 468 497 1,789 Guatemala .......................................... 1,337 726 1,120 Peru .................................................... 158 186 1,043 Albania ................................................ 231 1,039 988 Honduras ............................................ 908 1,626 957 Trinidad and Tobago .......................... 1,015 643 668 Benin ................................................... 0 0 544 Dominican Republic ............................ 871 942 544 Australia(*) .......................................... 4,676 3,975 477 El Salvador ......................................... 301 350 367 Germany(*) ......................................... 7 0 328 Vietnam ............................................... 733 821 306 Netherlands Antilles(*) ........................ 401 286 289 Jamaica .............................................. 53 25 288 Gabon ................................................. 0 104 226 Uruguay .............................................. 0 144 167 Rest of World ...................................... 7,936 4,784 959
World Total ......................................... 466,895 413,076 431,617
See footnote(s) at end of table.

VII–45 AGRICULTURAL STATISTICS 2016
Table 7-63.—Meat: U.S. exports, 2011–2013—Continued
Country 2011 2012 2013
Metric tons Metric tons Metric tons
Variety meats, other: Mexico .................................................... 11,405 11,836 12,129 Netherlands ............................................ 568 2,780 3,340 Canada ................................................... 2,974 2,302 3,169 Hong Kong ............................................. 3,159 2,526 2,045 Korea, South .......................................... 572 1,149 1,092 Venezuela .............................................. 0 38 699 Taiwan .................................................... 9 0 330 Vietnam .................................................. 0 59 282 Peru ........................................................ 13 0 264 China ...................................................... 219 360 221 Saudi Arabia ........................................... 1 8 209 Japan ...................................................... 4 34 171 Trinidad and Tobago .............................. 12 0 163 Dominican Republic ............................... 283 31 140 Colombia ................................................ 67 25 89 Philippines .............................................. 13 40 74 Netherlands Antilles(*) ........................... 280 111 68 Germany(*) ............................................. 180 248 68 Nigeria .................................................... 24 51 49 Brazil ...................................................... 1 0 41 Barbados ................................................ 15 21 26 Leeward-Windward Islands(*) ................ 66 26 25 Singapore ............................................... 14 17 22 Bahamas, The ........................................ 43 21 21 Denmark(*) ............................................. 127 15 21 Uruguay .................................................. 28 12 20 Bermuda ................................................. 39 37 19 United Arab Emirates ............................. 75 48 19 Australia(*) .............................................. 20 3 16 Rest of World ......................................... 834 158 93
World Total ............................................. 21,042 21,954 24,922
(*) Denotes a country that is a summarization of its component countries. Users should use cautious interpretation on quantity reports using mixed units of measure. Quantity line items will only include statistics on the units of measure that are equal to, or are able to be converted to, the assigned unit of measure of the grouped commodities.
FAS, Office of Global Analysis, (202) 720-6301. Data Source: Department of Commerce, U.S. Census Bureau, Foreign Trade Statistics.
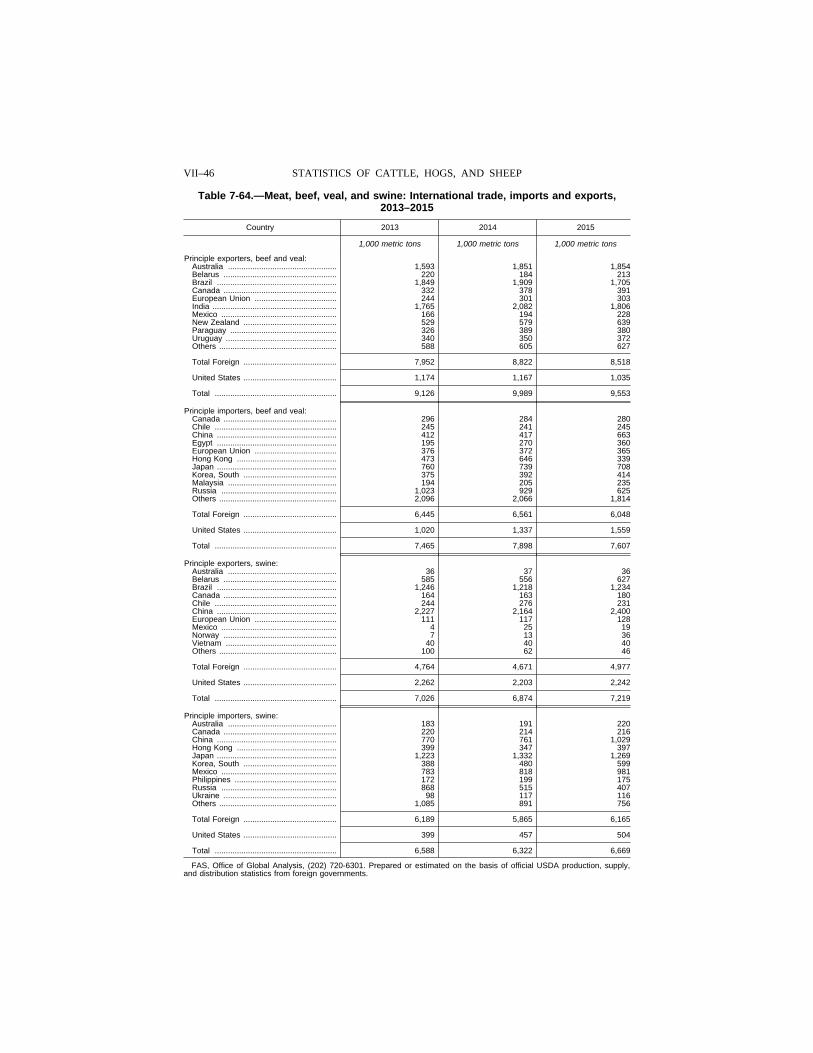
VII–46 STATISTICS OF CATTLE, HOGS, AND SHEEP
Table 7-64.—Meat, beef, veal, and swine: International trade, imports and exports, 2013–2015
Country 2013 2014 2015
1,000 metric tons 1,000 metric tons 1,000 metric tons
Principle exporters, beef and veal: Australia ................................................. 1,593 1,851 1,854 Belarus ................................................... 220 184 213 Brazil ...................................................... 1,849 1,909 1,705 Canada ................................................... 332 378 391 European Union ..................................... 244 301 303 India ........................................................ 1,765 2,082 1,806 Mexico .................................................... 166 194 228 New Zealand .......................................... 529 579 639 Paraguay ................................................ 326 389 380 Uruguay .................................................. 340 350 372 Others ..................................................... 588 605 627
Total Foreign .......................................... 7,952 8,822 8,518
United States .......................................... 1,174 1,167 1,035
Total ....................................................... 9,126 9,989 9,553
Principle importers, beef and veal: Canada ................................................... 296 284 280 Chile ....................................................... 245 241 245 China ...................................................... 412 417 663 Egypt ...................................................... 195 270 360 European Union ..................................... 376 372 365 Hong Kong ............................................. 473 646 339 Japan ...................................................... 760 739 708 Korea, South .......................................... 375 392 414 Malaysia ................................................. 194 205 235 Russia .................................................... 1,023 929 625 Others ..................................................... 2,096 2,066 1,814
Total Foreign .......................................... 6,445 6,561 6,048
United States .......................................... 1,020 1,337 1,559
Total ....................................................... 7,465 7,898 7,607
Principle exporters, swine: Australia ................................................. 36 37 36 Belarus ................................................... 585 556 627 Brazil ...................................................... 1,246 1,218 1,234 Canada ................................................... 164 163 180 Chile ....................................................... 244 276 231 China ...................................................... 2,227 2,164 2,400 European Union ..................................... 111 117 128 Mexico .................................................... 4 25 19 Norway ................................................... 7 13 36 Vietnam .................................................. 40 40 40 Others ..................................................... 100 62 46
Total Foreign .......................................... 4,764 4,671 4,977
United States .......................................... 2,262 2,203 2,242
Total ....................................................... 7,026 6,874 7,219
Principle importers, swine: Australia ................................................. 183 191 220 Canada ................................................... 220 214 216 China ...................................................... 770 761 1,029 Hong Kong ............................................. 399 347 397 Japan ...................................................... 1,223 1,332 1,269 Korea, South .......................................... 388 480 599 Mexico .................................................... 783 818 981 Philippines .............................................. 172 199 175 Russia .................................................... 868 515 407 Ukraine ................................................... 98 117 116 Others ..................................................... 1,085 891 756
Total Foreign .......................................... 6,189 5,865 6,165
United States .......................................... 399 457 504
Total ....................................................... 6,588 6,322 6,669
FAS, Office of Global Analysis, (202) 720-6301. Prepared or estimated on the basis of official USDA production, supply, and distribution statistics from foreign governments.

VII–47 AGRICULTURAL STATISTICS 2016
Table 7-65.—Meats and lard: Production and consumption, United States, 2006–2015 1
Year
Beef Veal Lamb and mutton
Production
Consumption Produc-
tion
Consumption Produc-
tion
Consumption
Total Per capita Total Per
capita Total Per capita
Million Million Million Million Million Million pounds pounds Pounds pounds pounds Pounds pounds pounds Pounds
2006 ...... 26,256 28,137 94.2 156 155 0.5 190 356 1.2 2007 ...... 26,523 28,141 93.3 146 145 0.5 189 385 1.3 2008 ...... 26,664 27,303 89.6 152 150 0.5 180 343 1.1 2009 ...... 26,068 26,836 87.3 147 147 0.5 177 338 1.1 2010 ...... 26,412 26,390 85.2 145 150 0.5 168 318 1.0 2011 ...... 26,281 25,538 81.8 136 137 0.4 153 295 0.8 2012 ...... 25,995 25,755 81.9 125 123 0.4 161 299 0.8 2013 ...... 25,790 25,476 80.5 117 119 0.4 161 324 0.9 2014 ...... 24,316 24,683 77.4 100 98 0.3 161 340 0.9 2015 ...... 23,760 24,773 77.1 88 88 0.3 155 357 1.0
Year
Pork All meats
Production
Consumption
Production
Consumption
Total Per capita Total Per
capita
Million Million Million Million pounds pounds Pounds pounds pounds Pounds
2006 ...... 21,074 19,055 63.8 47,675 47,703 160 2007 ...... 21,962 19,763 65.5 48,817 48,434 160 2008 ...... 23,367 19,415 63.8 50,362 47,211 155 2009 ...... 23,020 19,870 64.7 49,412 47,191 154 2010 ...... 22,456 19,076 61.6 49,181 45,934 148 2011 ...... 22,775 18,382 58.9 49,232 44,351 142 2012 ...... 23,268 18,607 59.2 49,439 44,784 143 2013 ...... 23,204 19,195 60.4 49,174 45,024 142 2014 ...... 22,858 18,836 59.1 47,344 43,957 139 2015 ...... 24,517 20,593 64.1 48,432 45,811 142
1 Carcass weight equivalent or dressed weight. Beginning 1977, pork production was no longer reported as ‘‘pork, exclud-ing lard.’’ This series has been revised to reflect pork production in prior years on a dressed weight basis that is comparable with the method used to report beef, veal, and lamb and mutton. Edible offals are excluded. Shipments to the U.S. terri-tories are included in domestic consumption.
ERS, Animal Products and Cost of Production Branch, (202) 694–5409.
Table 7-66.—Hides, packer: Average price per piece, Central U.S., 2004–2013
Year
Steers Heifers
Heavy native Heavy Texas Butt branded Colorado branded Heavy native Branded
Dollars Dollars Dollars Dollars Dollars Dollars
2004 ....................... 67.09 64.91 64.39 61.48 57.07 54.02 2005 ....................... 65.64 63.50 63.53 60.90 57.89 54.20 2006 ....................... 68.87 67.76 67.79 65.99 60.30 57.52 2007 ....................... 72.01 70.51 70.72 67.79 65.70 61.85 2008 ....................... 63.94 63.22 62.62 59.35 58.35 57.18 2009 ....................... 45.29 44.10 42.70 31.84 29.00 31.86 2010 ....................... 71.93 72.30 70.77 67.31 63.44 67.57 2011 ....................... 82.17 81.70 80.77 76.42 74.39 71.17 2012 ....................... 84.53 84.23 84.28 79.83 71.77 70.19 2013 ....................... 98.73 95.74 98.56 94.38 84.68 82.90
AMS, Livestock & Grain Market News, (202) 720–7316.
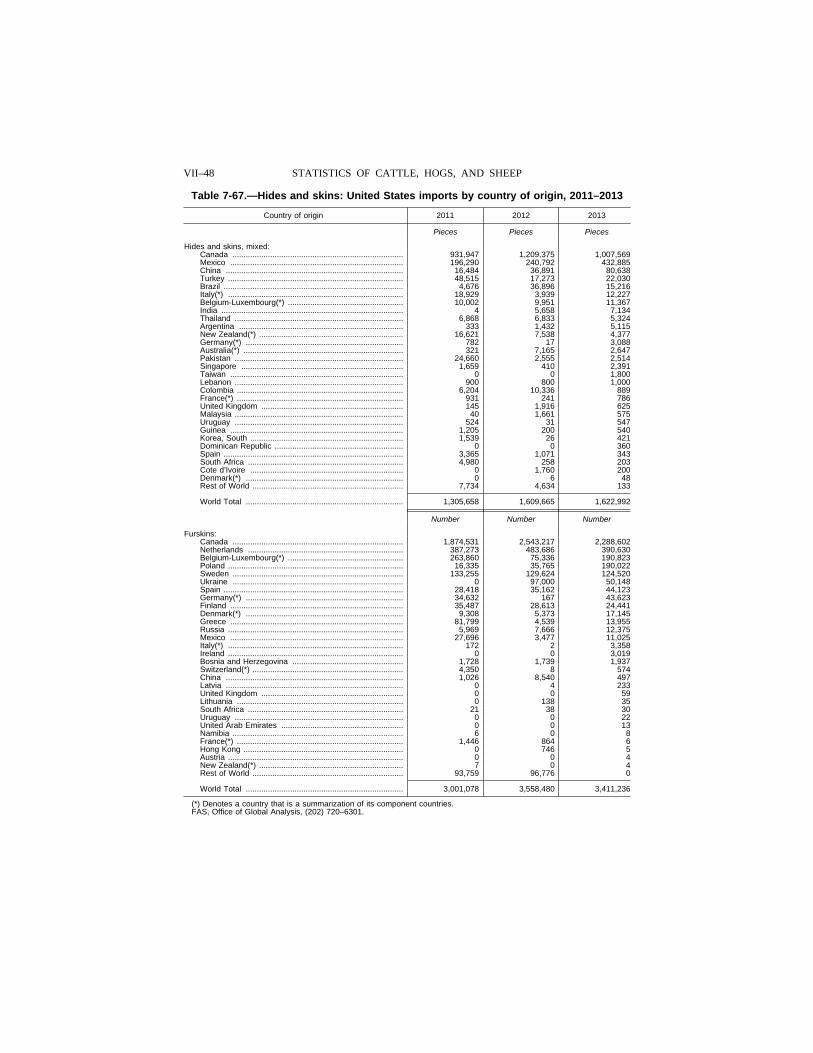
VII–48 STATISTICS OF CATTLE, HOGS, AND SHEEP
Table 7-67.—Hides and skins: United States imports by country of origin, 2011–2013
Country of origin 2011 2012 2013
Pieces Pieces Pieces
Hides and skins, mixed: Canada ............................................................................. 931,947 1,209,375 1,007,569 Mexico .............................................................................. 196,290 240,792 432,885 China ................................................................................ 16,484 36,891 80,638 Turkey ............................................................................... 48,515 17,273 22,030 Brazil ................................................................................. 4,676 36,896 15,216 Italy(*) ............................................................................... 18,929 3,939 12,227 Belgium-Luxembourg(*) .................................................... 10,002 9,951 11,367 India .................................................................................. 4 5,658 7,134 Thailand ............................................................................ 6,868 6,833 5,324 Argentina .......................................................................... 333 1,432 5,115 New Zealand(*) ................................................................. 16,621 7,538 4,377 Germany(*) ....................................................................... 782 17 3,088 Australia(*) ........................................................................ 321 7,165 2,647 Pakistan ............................................................................ 24,660 2,555 2,514 Singapore ......................................................................... 1,659 410 2,391 Taiwan .............................................................................. 0 0 1,800 Lebanon ............................................................................ 900 800 1,000 Colombia ........................................................................... 6,204 10,336 889 France(*) ........................................................................... 931 241 786 United Kingdom ................................................................ 145 1,916 625 Malaysia ............................................................................ 40 1,661 575 Uruguay ............................................................................ 524 31 547 Guinea .............................................................................. 1,205 200 540 Korea, South ..................................................................... 1,539 26 421 Dominican Republic .......................................................... 0 0 360 Spain ................................................................................. 3,365 1,071 343 South Africa ...................................................................... 4,980 258 203 Cote d’Ivoire ..................................................................... 0 1,760 200 Denmark(*) ....................................................................... 0 6 48 Rest of World .................................................................... 7,734 4,634 133
World Total ....................................................................... 1,305,658 1,609,665 1,622,992
Number Number Number
Furskins: Canada ............................................................................. 1,874,531 2,543,217 2,288,602 Netherlands ...................................................................... 387,273 483,686 390,630 Belgium-Luxembourg(*) .................................................... 263,860 75,336 190,823 Poland ............................................................................... 16,335 35,765 190,022 Sweden ............................................................................. 133,255 129,624 124,520 Ukraine ............................................................................. 0 97,000 50,148 Spain ................................................................................. 28,418 35,162 44,123 Germany(*) ....................................................................... 34,632 167 43,623 Finland .............................................................................. 35,487 28,613 24,441 Denmark(*) ....................................................................... 9,308 5,373 17,145 Greece .............................................................................. 81,799 4,539 13,955 Russia ............................................................................... 5,969 7,666 12,375 Mexico .............................................................................. 27,696 3,477 11,025 Italy(*) ............................................................................... 172 2 3,358 Ireland ............................................................................... 0 0 3,019 Bosnia and Herzegovina .................................................. 1,728 1,739 1,937 Switzerland(*) .................................................................... 4,350 8 574 China ................................................................................ 1,026 8,540 497 Latvia ................................................................................ 0 4 233 United Kingdom ................................................................ 0 0 59 Lithuania ........................................................................... 0 138 35 South Africa ...................................................................... 21 38 30 Uruguay ............................................................................ 0 0 22 United Arab Emirates ....................................................... 0 0 13 Namibia ............................................................................. 6 0 8 France(*) ........................................................................... 1,446 864 6 Hong Kong ........................................................................ 0 746 5 Austria ............................................................................... 0 0 4 New Zealand(*) ................................................................. 7 0 4 Rest of World .................................................................... 93,759 96,776 0
World Total ....................................................................... 3,001,078 3,558,480 3,411,236
(*) Denotes a country that is a summarization of its component countries. FAS, Office of Global Analysis, (202) 720–6301.
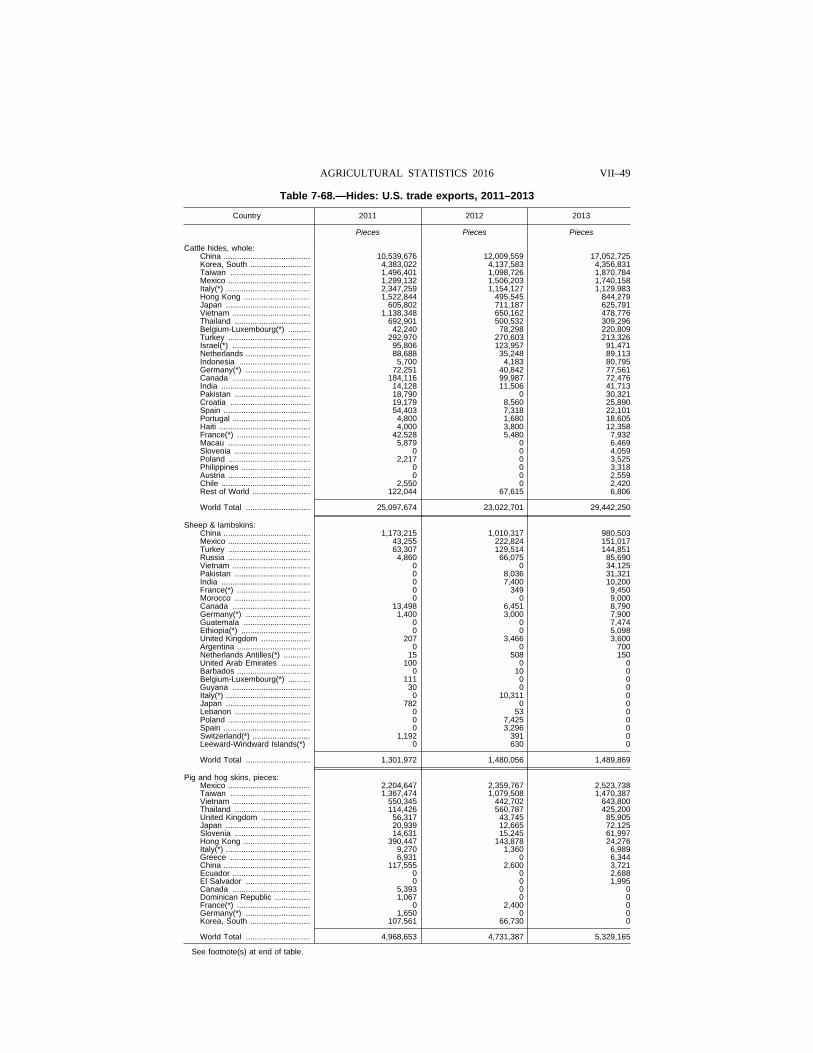
VII–49 AGRICULTURAL STATISTICS 2016
Table 7-68.—Hides: U.S. trade exports, 2011–2013
Country 2011 2012 2013
Pieces Pieces Pieces
Cattle hides, whole: China ....................................... 10,539,676 12,009,559 17,052,725 Korea, South ........................... 4,383,022 4,137,583 4,356,831 Taiwan .................................... 1,496,401 1,098,726 1,870,784 Mexico ..................................... 1,299,132 1,506,203 1,740,158 Italy(*) ...................................... 2,347,259 1,154,127 1,129,983 Hong Kong .............................. 1,522,844 495,545 844,279 Japan ...................................... 605,802 711,187 625,791 Vietnam ................................... 1,138,348 650,162 478,776 Thailand .................................. 692,901 500,532 309,296 Belgium-Luxembourg(*) .......... 42,240 78,298 220,809 Turkey ..................................... 292,970 270,603 213,326 Israel(*) ................................... 95,806 123,957 91,471 Netherlands ............................. 88,688 35,248 89,113 Indonesia ................................ 5,700 4,183 80,795 Germany(*) ............................. 72,251 40,842 77,561 Canada ................................... 184,116 99,987 72,476 India ........................................ 14,128 11,506 41,713 Pakistan .................................. 18,790 0 30,321 Croatia .................................... 19,179 8,560 25,890 Spain ....................................... 54,403 7,318 22,101 Portugal ................................... 4,800 1,680 18,605 Haiti ......................................... 4,000 3,800 12,358 France(*) ................................. 42,528 5,480 7,932 Macau ..................................... 5,879 0 6,469 Slovenia .................................. 0 0 4,059 Poland ..................................... 2,217 0 3,525 Philippines ............................... 0 0 3,318 Austria ..................................... 0 0 2,559 Chile ........................................ 2,550 0 2,420 Rest of World .......................... 122,044 67,615 6,806
World Total ............................. 25,097,674 23,022,701 29,442,250
Sheep & lambskins: China ....................................... 1,173,215 1,010,317 980,503 Mexico ..................................... 43,255 222,824 151,017 Turkey ..................................... 63,307 129,514 144,851 Russia ..................................... 4,860 66,075 85,690 Vietnam ................................... 0 0 34,125 Pakistan .................................. 0 8,036 31,321 India ........................................ 0 7,400 10,200 France(*) ................................. 0 349 9,450 Morocco .................................. 0 0 9,000 Canada ................................... 13,498 6,451 8,790 Germany(*) ............................. 1,400 3,000 7,900 Guatemala .............................. 0 0 7,474 Ethiopia(*) ............................... 0 0 5,098 United Kingdom ...................... 207 3,466 3,600 Argentina ................................. 0 0 700 Netherlands Antilles(*) ............ 15 508 150 United Arab Emirates ............. 100 0 0 Barbados ................................. 0 10 0 Belgium-Luxembourg(*) .......... 111 0 0 Guyana ................................... 30 0 0 Italy(*) ...................................... 0 10,311 0 Japan ...................................... 782 0 0 Lebanon .................................. 0 53 0 Poland ..................................... 0 7,425 0 Spain ....................................... 0 3,296 0 Switzerland(*) .......................... 1,192 391 0 Leeward-Windward Islands(*) 0 630 0
World Total ............................. 1,301,972 1,480,056 1,489,869
Pig and hog skins, pieces: Mexico ..................................... 2,204,647 2,359,767 2,523,738 Taiwan .................................... 1,367,474 1,079,508 1,470,387 Vietnam ................................... 550,345 442,702 643,800 Thailand .................................. 114,426 560,787 425,200 United Kingdom ...................... 56,317 43,745 85,905 Japan ...................................... 20,939 12,665 72,125 Slovenia .................................. 14,631 15,245 61,997 Hong Kong .............................. 390,447 143,878 24,276 Italy(*) ...................................... 9,270 1,360 6,989 Greece .................................... 6,931 0 6,344 China ....................................... 117,555 2,600 3,721 Ecuador ................................... 0 0 2,688 El Salvador ............................. 0 0 1,995 Canada ................................... 5,393 0 0 Dominican Republic ................ 1,067 0 0 France(*) ................................. 0 2,400 0 Germany(*) ............................. 1,650 0 0 Korea, South ........................... 107,561 66,730 0
World Total ............................. 4,968,653 4,731,387 5,329,165
See footnote(s) at end of table.
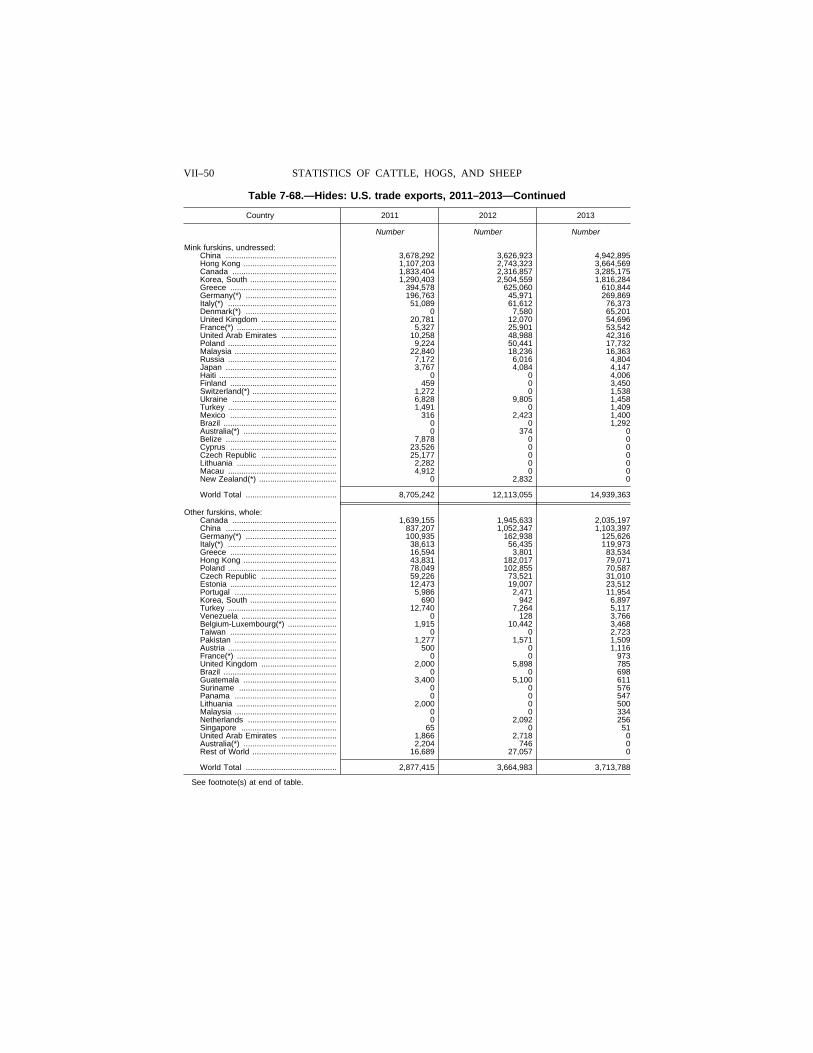
VII–50 STATISTICS OF CATTLE, HOGS, AND SHEEP
Table 7-68.—Hides: U.S. trade exports, 2011–2013—Continued
Country 2011 2012 2013
Number Number Number
Mink furskins, undressed: China .................................................. 3,678,292 3,626,923 4,942,895 Hong Kong .......................................... 1,107,203 2,743,323 3,664,569 Canada ............................................... 1,833,404 2,316,857 3,285,175 Korea, South ....................................... 1,290,403 2,504,559 1,816,284 Greece ................................................ 394,578 625,060 610,844 Germany(*) ......................................... 196,763 45,971 269,869 Italy(*) ................................................. 51,089 61,612 76,373 Denmark(*) ......................................... 0 7,580 65,201 United Kingdom .................................. 20,781 12,070 54,696 France(*) ............................................. 5,327 25,901 53,542 United Arab Emirates ......................... 10,258 48,988 42,316 Poland ................................................. 9,224 50,441 17,732 Malaysia .............................................. 22,840 18,236 16,363 Russia ................................................. 7,172 6,016 4,804 Japan .................................................. 3,767 4,084 4,147 Haiti ..................................................... 0 0 4,006 Finland ................................................ 459 0 3,450 Switzerland(*) ...................................... 1,272 0 1,538 Ukraine ............................................... 6,828 9,805 1,458 Turkey ................................................. 1,491 0 1,409 Mexico ................................................ 316 2,423 1,400 Brazil ................................................... 0 0 1,292 Australia(*) .......................................... 0 374 0 Belize .................................................. 7,878 0 0 Cyprus ................................................ 23,526 0 0 Czech Republic .................................. 25,177 0 0 Lithuania ............................................. 2,282 0 0 Macau ................................................. 4,912 0 0 New Zealand(*) ................................... 0 2,832 0
World Total ......................................... 8,705,242 12,113,055 14,939,363
Other furskins, whole: Canada ............................................... 1,639,155 1,945,633 2,035,197 China .................................................. 837,207 1,052,347 1,103,397 Germany(*) ......................................... 100,935 162,938 125,626 Italy(*) ................................................. 38,613 56,435 119,973 Greece ................................................ 16,594 3,801 83,534 Hong Kong .......................................... 43,831 182,017 79,071 Poland ................................................. 78,049 102,855 70,587 Czech Republic .................................. 59,226 73,521 31,010 Estonia ................................................ 12,473 19,007 23,512 Portugal .............................................. 5,986 2,471 11,954 Korea, South ....................................... 690 942 6,897 Turkey ................................................. 12,740 7,264 5,117 Venezuela ........................................... 0 128 3,766 Belgium-Luxembourg(*) ...................... 1,915 10,442 3,468 Taiwan ................................................ 0 0 2,723 Pakistan .............................................. 1,277 1,571 1,509 Austria ................................................. 500 0 1,116 France(*) ............................................. 0 0 973 United Kingdom .................................. 2,000 5,898 785 Brazil ................................................... 0 0 698 Guatemala .......................................... 3,400 5,100 611 Suriname ............................................ 0 0 576 Panama .............................................. 0 0 547 Lithuania ............................................. 2,000 0 500 Malaysia .............................................. 0 0 334 Netherlands ........................................ 0 2,092 256 Singapore ........................................... 65 0 51 United Arab Emirates ......................... 1,866 2,718 0 Australia(*) .......................................... 2,204 746 0 Rest of World ...................................... 16,689 27,057 0
World Total ......................................... 2,877,415 3,664,983 3,713,788
See footnote(s) at end of table.
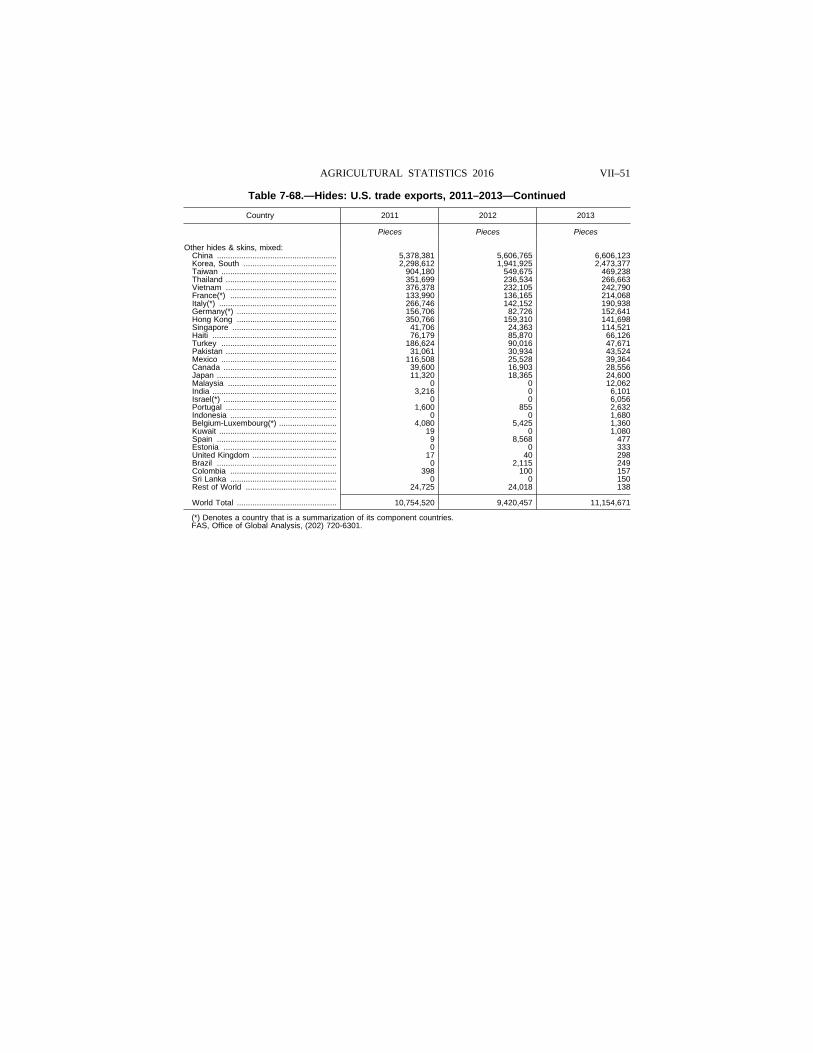
VII–51 AGRICULTURAL STATISTICS 2016
Table 7-68.—Hides: U.S. trade exports, 2011–2013—Continued
Country 2011 2012 2013
Pieces Pieces Pieces
Other hides & skins, mixed: China ...................................................... 5,378,381 5,606,765 6,606,123 Korea, South .......................................... 2,298,612 1,941,925 2,473,377 Taiwan .................................................... 904,180 549,675 469,238 Thailand .................................................. 351,699 236,534 266,663 Vietnam .................................................. 376,378 232,105 242,790 France(*) ................................................ 133,990 136,165 214,068 Italy(*) ..................................................... 266,746 142,152 190,938 Germany(*) ............................................. 156,706 82,726 152,641 Hong Kong ............................................. 350,766 159,310 141,698 Singapore ............................................... 41,706 24,363 114,521 Haiti ........................................................ 76,179 85,870 66,126 Turkey .................................................... 186,624 90,016 47,671 Pakistan .................................................. 31,061 30,934 43,524 Mexico .................................................... 116,508 25,528 39,364 Canada ................................................... 39,600 16,903 28,556 Japan ...................................................... 11,320 18,365 24,600 Malaysia ................................................. 0 0 12,062 India ........................................................ 3,216 0 6,101 Israel(*) ................................................... 0 0 6,056 Portugal .................................................. 1,600 855 2,632 Indonesia ................................................ 0 0 1,680 Belgium-Luxembourg(*) .......................... 4,080 5,425 1,360 Kuwait ..................................................... 19 0 1,080 Spain ...................................................... 9 8,568 477 Estonia ................................................... 0 0 333 United Kingdom ...................................... 17 40 298 Brazil ...................................................... 0 2,115 249 Colombia ................................................ 398 100 157 Sri Lanka ................................................ 0 0 150 Rest of World ......................................... 24,725 24,018 138
World Total ............................................. 10,754,520 9,420,457 11,154,671
(*) Denotes a country that is a summarization of its component countries. FAS, Office of Global Analysis, (202) 720-6301.

VII–52 STATISTICS OF CATTLE, HOGS, AND SHEEP
Table 7-69.—Mink: Farms, pelts produced, average price, and value, United States, 2006–2015
Year Mink farms Pelts produced Average marketing price Value of mink pelts
Number Number Dollars Dollars
2006 ............... 279 2,858,800 48.40 138,365,920 2007 ............... 283 2,828,200 65.70 185,812,740 2008 ............... 274 2,820,700 41.60 117,341,120 2009 ............... 278 2,866,700 65.10 186,622,170 2010 ............... 265 2,840,200 81.90 232,612,380 2011 ............... 268 3,091,470 94.30 291,525,621 2012 1 ............. (NA) (NA) (NA) (NA) 2013 ............... (NA) 3,544,610 56.30 199,561,543 2014 ............... (NA) 3,741,150 57.70 215,864,355 2015 ............... (NA) 3,749,450 31.10 116,607,895
(NA) Not available. 1 Due to sequestration the Mink report was suspended. NASS, Livestock Branch, (202) 720–3570.
Table 7-70.—Mink pelts: Pelts produced by color class, selected States, and United States, 2015
State Black Demi/Wild Pastel Sapphire Blue Iris Mahogany
Number Number Number Number Number Number
Idaho ....................... 129,000 10,000 8,000 14,500 (D) 193,000 Illinois ...................... 68,000 - - (D) - (D) Iowa ......................... 50,000 (D) (D) (D) (D) 37,000 Michigan .................. 44,000 - (D) - (D) (D) Minnesota ................ 100,000 27,000 (D) (D) (D) 78,000 Montana .................. 3,700 (D) (D) (D) (D) (D) Ohio ......................... 57,000 (D) - (D) (D) (D) Oregon .................... 220,000 - (D) (D) 77,000 (D) Pennsylvania ........... 35,000 (D) (D) 9,000 17,000 (D) Utah ......................... 310,000 34,000 (D) 41,000 2,200 395,000 Washington ............. 58,000 - (D) (D) (D) (D) Wisconsin ................ 780,000 (D) 34,000 33,000 129,000 135,000 Other States 1 .......... 9,000 8,280 68,900 17,980 53,220 58,840
United States ........... 1,863,700 79,280 110,900 115,480 278,420 896,840
State Pearl Lavender Violet White Other Total 2
Number Number Number Number Number Number
Idaho ....................... - (D) (D) (D) (D) 372,700 Illinois ...................... (D) - - (D) - 98,700 Iowa ......................... - - - (D) - 96,300 Michigan .................. - (D) (D) 8,000 - 60,250 Minnesota ................ - - - 11,500 - 265,520 Montana .................. - - - (D) (D) 14,900 Ohio ......................... - - - (D) - 77,800 Oregon .................... - - (D) - - 332,900 Pennsylvania ........... (D) (D) (D) (D) (D) 86,770 Utah ......................... (D) (D) (D) (D) (D) 933,880 Washington ............. - - - - - 71,800 Wisconsin ................ (D) 14,500 26,000 158,000 6,000 1,316,610 Other States 1 .......... 95,700 7,960 33,250 28,410 15,510 21,320
United States ........... 95,700 22,460 59,250 205,910 21,510 3,749,450
- Represents zero. (D) Withheld to avoid disclosing data for individual operations. 1 Other States include New Hamp-shire, New Jersey, New York, North Carolina, South Dakota, Virginia, and some pelts from the above listed States that were not published to avoid disclosing individual operations. 2 Published color classes may not add to the State total to avoid disclosing individual operations.
NASS, Livestock Branch, (202) 720–3570.

VII–53 AGRICULTURAL STATISTICS 2016
Table 7-71.—Livestock: Number of animals slaughtered under Federal inspection and number of whole carcasses condemned, 2006–2015 1
Year Cattle Calves Sheep and lambs
Total head Condemned Total head Condemned Total head Condemned
1,000 1,000 1,000 1,000 1,000 1,000 2006 ......... 32,861 143.1 682 11.1 2,534 4.7 2007 ......... 33,473 141.5 769 13.6 2,497 4.1 2008 ......... 34,220 146.8 866 24.0 2,447 5.2 2009 ......... 32,714 143.1 951 23.0 2,297 3.3 2010 ......... 33,295 149.4 908 22.7 2,285 3.5 2011 ......... 29,530 143.2 740 33.0 1.684 3.1 2012 ......... 32,062 142.3 742 26.7 1,978 4.2 2013 ......... 31,631 154.0 761 36.7 2,129 5.0 2014 ......... 30,721 157.9 645 36.7 2,171 4.1 2015 ......... 27,738 161.2 395 21.9 1,994 2.9
Year Goats Hogs Horses 2
Total head Condemned Total head Condemned Total head Condemned
1,000 1,000 1,000 1,000 1,000 1,000 2006 ......... 561 0.9 103,600 417.0 102 0.9 2007 ......... 613 0.7 105,611 404.8 58 0.4 2008 ......... 654 0.9 115,600 393.0 0 0 2009 ......... 660 0.8 113,395 333.6 0 0 2010 ......... 617 0.7 109,346 316.6 0 0 2011 ......... 509 0.5 91,541 266.2 0 0 2012 ......... 576 0.5 111,440 256.7 0 0 2013 ......... 540 0.5 111,935 296.3 0 0 2014 ......... 499 0.7 108,650 320.5 0 0 2015 ......... 448 0.5 113,259 307.2 0 0
1 Data are reported by the Food Safety and Inspection Service, USDA for the fiscal year ending September 30. Condemnations include ante-mortem and post-mortem inspection. 2 Equine slaughter was discontinued during the week of September 22, 2007.
NASS, Livestock Branch, (202) 720–3570.
Table 7-72.—Livestock: Inventory and value, United States, Jan. 1, 2013–2015
Class of livestock and poultry
Inventory Value
2013 2014 2015 Per head 1 Total
2013 2014 2015 2013 2014 2015
1,000 1,000 1,000 1,000 1,000 1,000 Dollars Dollars Dollars Dollars Dollars Dollars
Angora goats 2 ..... 136 148 160 87.70 105 124 12,694 12,807 16,850 Cattle ................... 90,095 88,526 89,143 1,139.00 1,223.00 1,584.00 102,671,904 108,255,950 141,211,070 Chickens 3 ............ 474,902 483,530 470,915 4.15 4.11 4.36 1,971,590 1,989,495 2,055,503 Hogs 3 .................. 64,775 67,776 68,299 138 144 96 8,921,822 9,754,191 6,566,642 Sheep and lambs 5,360 5,245 5,280 221.00 188 214 946,194 984,236 1,129,447
1 Based on reporters’ estimates of average price per head in their localities. 2 Four state total for angora goats (Arizona, California, New Mexico, Texas). 3 Dec. 1 of preceding year.
NASS, Livestock Branch, (202) 720–3570.
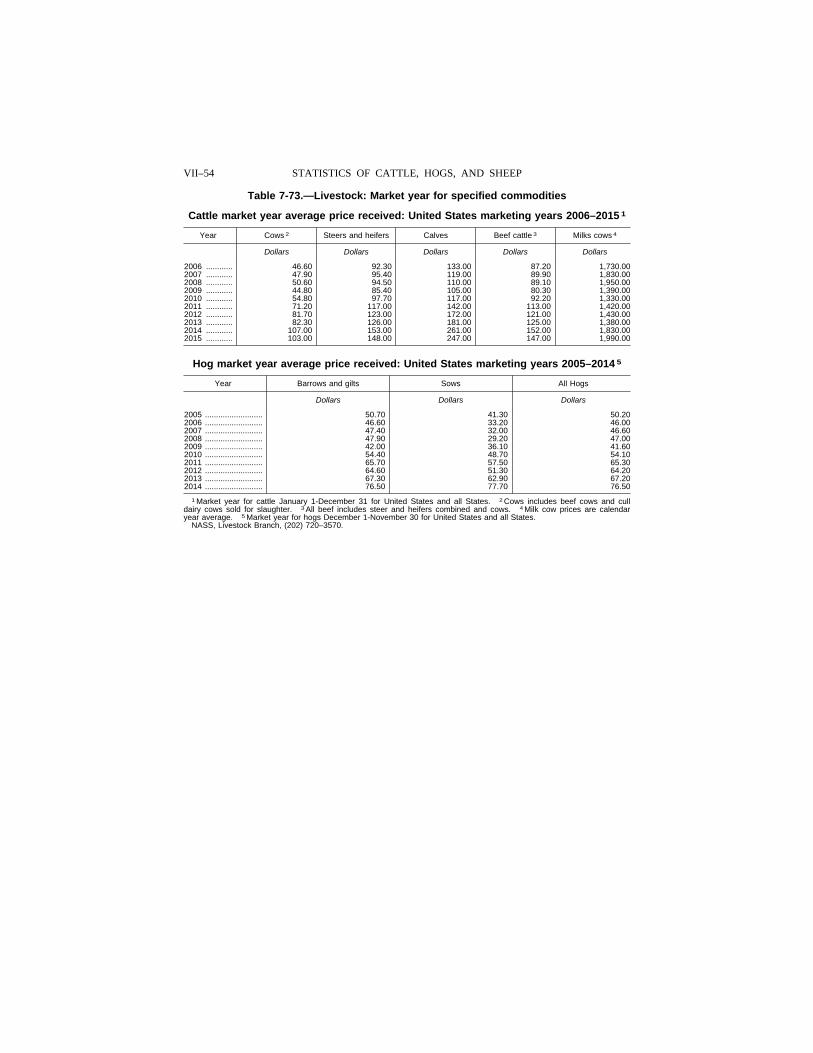
VII–54 STATISTICS OF CATTLE, HOGS, AND SHEEP
Table 7-73.—Livestock: Market year for specified commodities
Cattle market year average price received: United States marketing years 2006–2015 1
Year Cows 2 Steers and heifers Calves Beef cattle 3 Milks cows 4
Dollars Dollars Dollars Dollars Dollars
2006 ............ 46.60 92.30 133.00 87.20 1,730.00 2007 ............ 47.90 95.40 119.00 89.90 1,830.00 2008 ............ 50.60 94.50 110.00 89.10 1,950.00 2009 ............ 44.80 85.40 105.00 80.30 1,390.00 2010 ............ 54.80 97.70 117.00 92.20 1,330.00 2011 ............ 71.20 117.00 142.00 113.00 1,420.00 2012 ............ 81.70 123.00 172.00 121.00 1,430.00 2013 ............ 82.30 126.00 181.00 125.00 1,380.00 2014 ............ 107.00 153.00 261.00 152.00 1,830.00 2015 ............ 103.00 148.00 247.00 147.00 1,990.00
Hog market year average price received: United States marketing years 2005–2014 5
Year Barrows and gilts Sows All Hogs
Dollars Dollars Dollars
2005 .......................... 50.70 41.30 50.20 2006 .......................... 46.60 33.20 46.00 2007 .......................... 47.40 32.00 46.60 2008 .......................... 47.90 29.20 47.00 2009 .......................... 42.00 36.10 41.60 2010 .......................... 54.40 48.70 54.10 2011 .......................... 65.70 57.50 65.30 2012 .......................... 64.60 51.30 64.20 2013 .......................... 67.30 62.90 67.20 2014 .......................... 76.50 77.70 76.50
1 Market year for cattle January 1-December 31 for United States and all States. 2 Cows includes beef cows and cull dairy cows sold for slaughter. 3 All beef includes steer and heifers combined and cows. 4 Milk cow prices are calendar year average. 5 Market year for hogs December 1-November 30 for United States and all States.
NASS, Livestock Branch, (202) 720–3570.

VII–55 AGRICULTURAL STATISTICS 2016
Table 7-74.—Frozen meat: Cold storage holdings, end of month, United States, 2014–2015
Month Boneless beef Beef cuts Total beef
2014 2015 2014 2015 2014 2015
1,000 pounds 1,000 pounds 1,000 pounds 1,000 pounds 1,000 pounds 1,000 pounds
January ....... 389,031 446,120 40,266 45,877 429,297 491,997 February ...... 365,804 450,530 43,703 41,346 409,507 491,876 March .......... 364,771 440,402 41,016 41,071 405,787 481,473 April ............. 360,079 444,422 42,202 39,872 402,281 484,294 May ............. 336,099 435,436 41,544 39,171 377,643 474,607 June ............ 320,350 436,811 37,819 37,463 358,169 474,274 July .............. 328,572 421,179 39,370 38,914 367,942 460,093 August ......... 308,350 429,885 38,206 40,434 346,556 470,319 September ... 337,357 459,080 40,813 39,266 378,170 498,346 October ....... 342,898 470,891 38,030 38,243 380,928 509,134 November .... 365,351 472,272 35,474 38,364 400,825 510,636 December .... 406,484 473,967 37,892 38,557 444,376 512,524
Month Picnics Bellies Butts
2014 2015 2014 2015 2014 2015
1,000 pounds 1,000 pounds 1,000 pounds 1,000 pounds 1,000 pounds 1,000 pounds
January ....... 9,920 12,811 87,171 53,507 21,179 25,104 February ...... 11,716 19,339 87,675 67,794 26,094 35,641 March .......... 9,080 19,582 79,721 68,297 20,163 33,656 April ............. 13,204 16,239 83,579 70,412 19,771 25,234 May ............. 9,413 10,867 85,888 64,805 21,732 20,177 June ............ 7,638 8,757 83,936 44,432 19,999 22,018 July .............. 6,909 9,680 64,644 23,634 21,116 22,876 August ......... 8,505 11,767 45,562 13,738 23,778 20,053 September ... 10,513 10,490 34,311 10,872 22,035 18,793 October ....... 10,893 8,816 29,006 17,853 23,458 19,648 November .... 10,860 10,972 35,894 41,160 22,549 18,897 December .... 8,827 10,634 47,455 53,392 19,567 15,029
Month
Hams
Bone-in Boneless Total
2014 2015 2014 2015 2014 2015
1,000 pounds 1,000 pounds 1,000 pounds 1,000 pounds 1,000 pounds 1,000 pounds
January ....... 42,570 43,432 63,613 66,972 106,183 110,404 February ...... 48,511 46,630 68,953 81,082 117,464 127,712 March .......... 37,661 41,669 51,791 56,362 89,452 98,031 April ............. 34,580 59,102 47,205 77,120 81,785 136,222 May ............. 44,989 63,780 65,010 95,102 109,999 158,882 June ............ 56,394 78,663 70,099 101,810 126,493 180,473 July .............. 69,161 98,547 79,744 107,002 148,905 205,549 August ......... 86,106 123,713 93,377 112,818 179,483 236,531 September ... 96,916 132,723 97,161 114,422 194,077 247,145 October ....... 83,095 104,303 78,940 92,157 162,035 196,460 November .... 49,067 54,527 47,330 54,515 96,397 109,042 December .... 26,898 26,780 39,451 41,033 66,349 67,813
Month
Loins
Bone-in Boneless Total
2014 2015 2014 2015 2014 2015
1,000 pounds 1,000 pounds 1,000 pounds 1,000 pounds 1,000 pounds 1,000 pounds
January ....... 16,424 16,612 26,372 23,163 42,796 39,775 February ...... 16,290 18,456 29,083 27,428 45,373 45,884 March .......... 15,218 14,676 26,252 27,822 41,470 42,498 April ............. 16,239 17,013 29,711 27,621 45,950 44,634 May ............. 12,788 14,488 26,674 24,872 39,462 39,360 June ............ 9,327 13,668 18,264 23,740 27,591 37,408 July .............. 7,908 11,734 16,367 22,234 24,275 33,968 August ......... 6,859 11,125 14,054 20,274 20,913 31,399 September ... 7,508 12,059 12,759 17,953 20,267 30,012 October ....... 10,006 10,726 13,519 18,179 23,525 28,905 November .... 15,310 18,477 18,059 25,556 33,369 44,033 December .... 16,543 17,419 21,256 28,802 37,799 46,221
See end of table.

VII–56 STATISTICS OF CATTLE, HOGS, AND SHEEP
Table 7-74.—Frozen meat: Cold storage holdings, end of month, United States, 2014–2015—Continued
Month Ribs Trimmings Other frozen pork
2014 2015 2014 2015 2014 2015
1,000 pounds 1,000 pounds 1,000 pounds 1,000 pounds 1,000 pounds 1,000 pounds
January ....... 112,246 94,863 41,577 59,328 110,199 102,072 February ...... 122,859 106,781 37,448 67,454 110,102 105,917 March .......... 120,606 115,372 36,871 69,262 94,722 102,269 April ............. 115,957 113,832 42,023 64,853 97,321 107,884 May ............. 89,596 89,290 47,940 50,740 91,231 98,086 June ............ 59,943 73,022 43,581 47,263 86,547 101,562 July .............. 55,140 75,533 42,413 44,202 87,745 98,703 August ......... 49,621 72,626 40,440 42,321 90,271 109,803 September ... 53,957 85,335 35,143 39,951 90,627 106,304 October ....... 69,374 98,871 37,337 36,666 97,433 100,310 November .... 76,897 117,148 41,110 36,932 98,139 91,917 December .... 87,020 134,777 50,943 42,655 100,625 89,434
Month Variety meats Unclassified pork Total pork
2014 2015 2014 2015 2014 2015
1,000 pounds 1,000 pounds 1,000 pounds 1,000 pounds 1,000 pounds 1,000 pounds
January ....... 32,442 41,834 55,033 55,975 618,746 595,673 February ...... 36,807 44,124 59,174 65,417 654,712 686,063 March .......... 35,427 45,365 48,027 78,099 575,539 672,431 April ............. 38,733 47,153 45,568 74,620 583,891 701,083 May ............. 35,819 45,409 44,738 77,685 575,818 655,301 June ............ 32,170 44,251 49,549 75,339 537,447 634,525 July .............. 31,906 48,157 50,206 70,912 533,259 633,214 August ......... 33,587 49,939 51,506 65,583 543,666 653,760 September ... 35,068 40,126 54,624 66,902 550,622 655,930 October ....... 28,769 43,045 51,246 52,880 533,076 603,454 November .... 32,769 41,313 44,768 49,501 492,752 560,915 December .... 39,177 43,170 46,030 42,571 503,792 545,696
Month Veal Lamb & mutton Total red meat
2014 2015 2014 2015 2014 2015
1,000 pounds 1,000 pounds 1,000 pounds 1,000 pounds 1,000 pounds 1,000 pounds
January ....... 3,285 8,289 25,658 35,206 1,076,986 1,131,165 February ...... 3,190 9,614 26,191 36,771 1,093,600 1,224,324 March .......... 2,921 8,159 28,076 34,250 1,012,323 1,196,313 April ............. 3,212 6,576 26,536 37,004 1,015,920 1,228,957 May ............. 2,752 4,676 25,208 38,360 981,421 1,172,944 June ............ 3,324 3,291 31,119 35,470 930,059 1,147,560 July .............. 3,952 3,850 33,968 39,064 939,121 1,136,221 August ......... 3,581 4,072 40,157 41,883 933,960 1,170,034 September ... 2,326 5,924 39,693 41,921 970,811 1,202,121 October ....... 3,797 6,172 38,686 40,742 956,487 1,159,502 November .... 5,315 6,576 31,366 44,693 930,258 1,122,820 December .... 6,435 6,235 33,942 41,452 988,545 1,105,907
NASS, Livestock Branch, (202) 720–3570.