Embed Size (px)
Citation preview
Statistics for the Social Sciences
Psychology 340Fall 2006
Introductions
Statistics for the Social Sciences
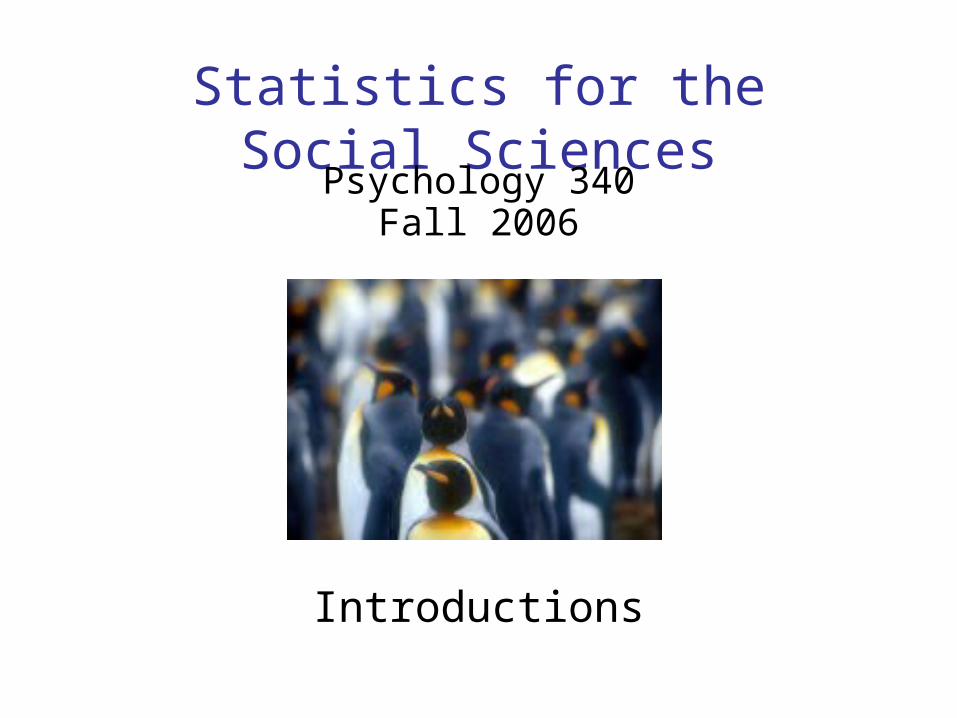
Outline (for week)
• Variables: IV, DV, scales of measurement– Discuss each variable and it’s scale of measurement
• Characteristics of Distributions– Using graphs– Using numbers (center and variability)
• Descriptive statistics decision tree
• Locating scores: z-scores and other transformations

Statistics for the Social Sciences
Outline (for week)
• Variables: IV, DV, scales of measurement– Discuss each variable and it’s scale of measurement
• Characteristics of Distributions– Using graphs– Using numbers (center and variability)
• Descriptive statistics decision tree
• Locating scores: z-scores and other transformations
Statistics for the Social Sciences
Describing distributions
• Distributions are typically described with three properties:– Shape: unimodal, symmetric, skewed, etc.
– Center: mean, median, mode– Spread (variability): standard deviation, variance

Statistics for the Social Sciences
Describing distributions
• Distributions are typically described with three properties:– Shape: unimodal, symmetric, skewed, etc.
– Center: mean, median, mode– Spread (variability): standard deviation, variance
Statistics for the Social Sciences
Which center when?
• Depends on a number of factors, like scale of measurement and shape.– The mean is the most preferred measure and it is closely related to measures of variability
– However, there are times when the mean isn’t the appropriate measure.

Statistics for the Social Sciences
Which center when?
• Use the median if:•The distribution is skewed•The distribution is ‘open-ended’
– (e.g. your top answer on your questionnaire is ‘5 or more’)
•Data are on an ordinal scale (rankings)
• Use the mode if the data are on a nominal scale

Statistics for the Social Sciences
The Mean
• The most commonly used measure of center • The arithmetic average
– Computing the mean
€
μ =∑X
N
– The formula for the population mean is (a parameter):
– The formula for the sample mean is (a statistic):
€
X =∑ X
n
Add up all of the X’s
Divide by the total number in the population
Divide by the total number in the sample
• Note: your book uses ‘M’ to denote the mean in formulas
Statistics for the Social Sciences
The Mean
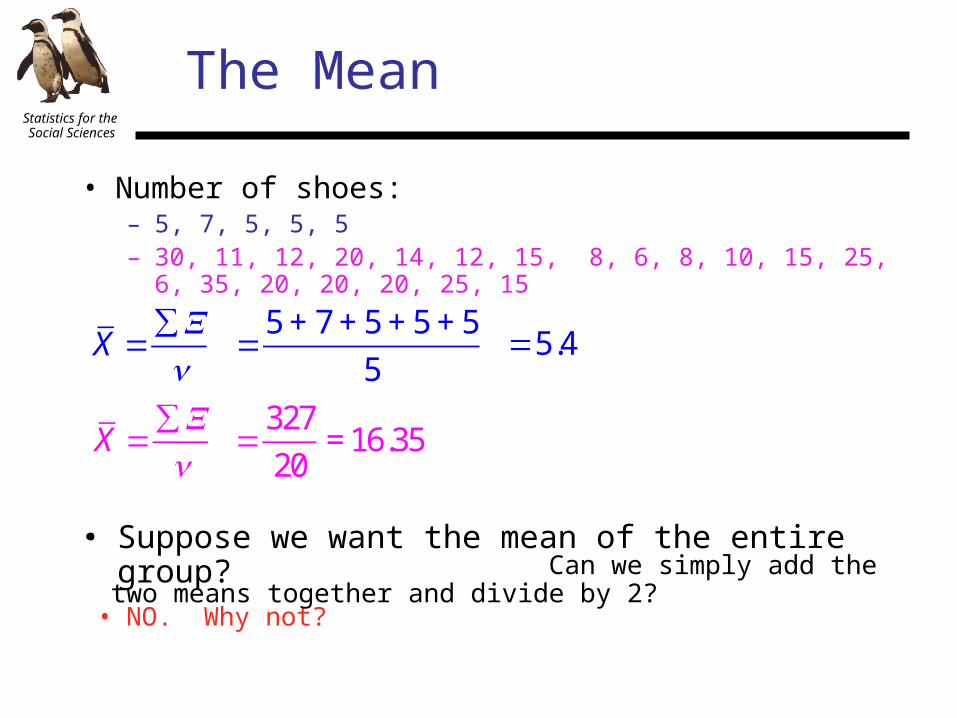
• Number of shoes:– 5, 7, 5, 5, 5– 30, 11, 12, 20, 14, 12, 15, 8, 6, 8, 10, 15, 25, 6, 35, 20, 20, 20, 25, 15
X =∑Xn
X =∑Xn
=5 + 7 + 5 + 5 + 5
5=5.4
=327
20= 16.35
• Suppose we want the mean of the entire group?
• NO. Why not?
• Can we simply add the two means together and divide by 2?
Statistics for the Social Sciences
The Weighted Mean
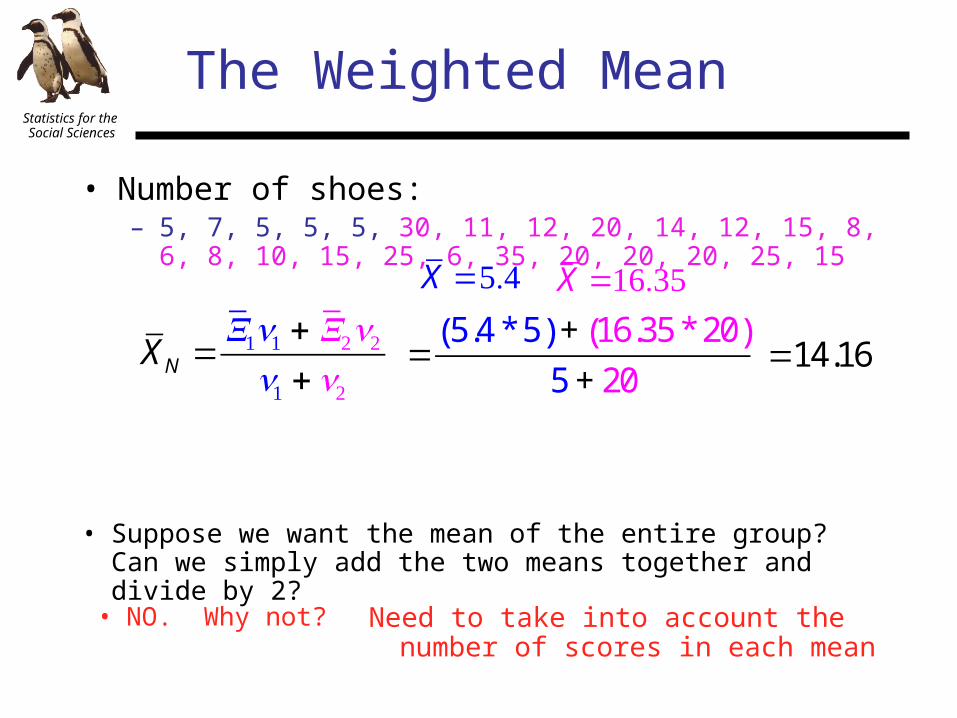
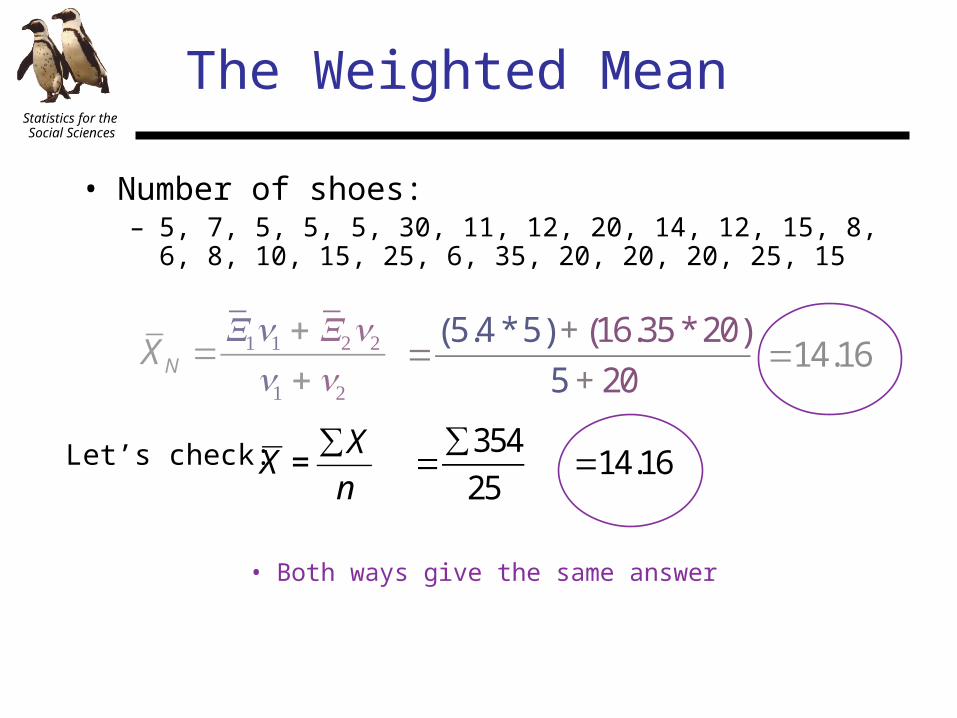
• Number of shoes:– 5, 7, 5, 5, 5, 30, 11, 12, 20, 14, 12, 15, 8, 6, 8, 10, 15, 25, 6, 35, 20, 20, 20, 25, 15 X =5.4 X =16.35
• Suppose we want the mean of the entire group? Can we simply add the two means together and divide by 2?
XN =X1n1 + X2n2n1 +n2
=5.4 * 5( ) + 16.35 * 20( )
5 + 20=14.16
• NO. Why not? Need to take into account the number of scores in each mean
Statistics for the Social Sciences
The Weighted Mean
• Number of shoes:– 5, 7, 5, 5, 5, 30, 11, 12, 20, 14, 12, 15, 8, 6, 8, 10, 15, 25, 6, 35, 20, 20, 20, 25, 15
XN =X1n1 + X2n2n1 +n2
=5.4 * 5( ) + 16.35 * 20( )
5 + 20=14.16
Let’s check:
€
X =∑ X
n=∑354
25=14.16
• Both ways give the same answer

Statistics for the Social Sciences
The median
• The median is the score that divides a distribution exactly in half. Exactly 50% of the individuals in a distribution have scores at or below the median.– Case1: Odd number of scores in the distributionStep1: put the
scores in order Step2: find the middle score
Step1: put the scores in order Step2: find the middle two scores Step3: find the arithmetic average of the two middle scores
– Case2: Even number of scores in the distribution

Statistics for the Social Sciences
The mode
• The mode is the score or category that has the greatest frequency. – So look at your frequency table or graph and pick the variable that has the highest frequency.
1
2
3
1 2 3 4 5 6 7 8 9
1
2
3
1 2 3 4 5 6 7 8 9
so the mode is 5 so the modes are 2 and 8
Note: if one were bigger than the other it would be called the major mode and the other would be the minor mode
1
2
3
1 2 3 4 5 6 7 8 9
4
major modeminor mode

Statistics for the Social Sciences
Describing distributions
• Distributions are typically described with three properties:– Shape: unimodal, symmetric, skewed, etc.
– Center: mean, median, mode– Spread (variability): standard deviation, variance

Statistics for the Social Sciences
Variability of a distribution
• Variability provides a quantitative measure of the degree to which scores in a distribution are spread out or clustered together.– In other words variabilility refers to the degree of “differentness” of the scores in the distribution.
• High variability means that the scores differ by a lot
• Low variability means that the scores are all similar
Statistics for the Social Sciences
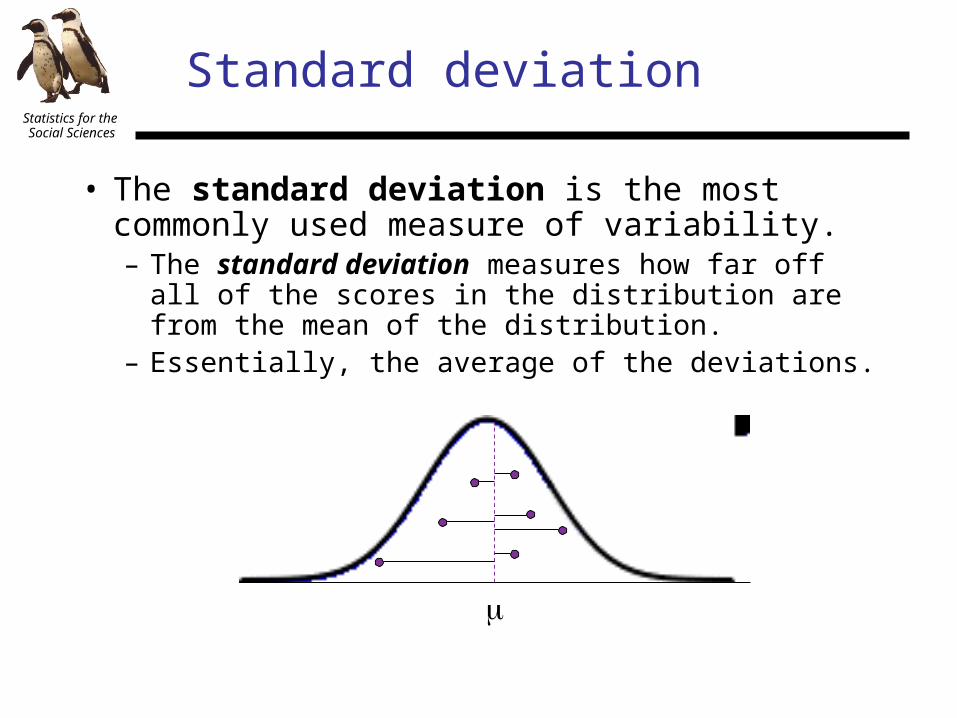
Standard deviation
• The standard deviation is the most commonly used measure of variability.– The standard deviation measures how far off all of the scores in the distribution are from the mean of the distribution.
– Essentially, the average of the deviations.
μ

Statistics for the Social Sciences
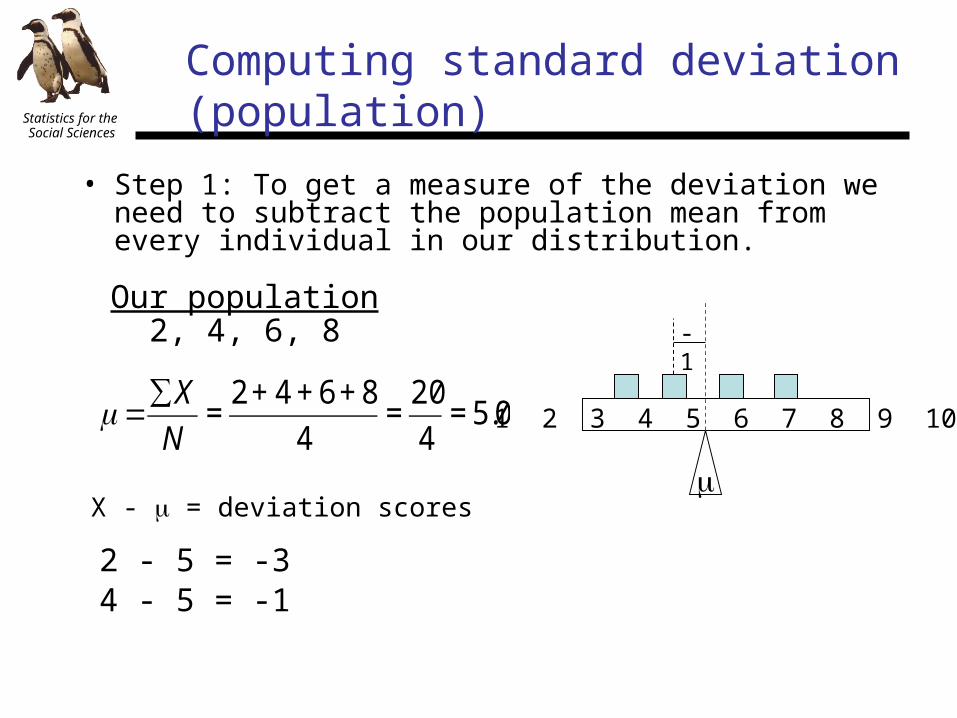
Computing standard deviation (population)
• Step 1: To get a measure of the deviation we need to subtract the population mean from every individual in our distribution.
Our population2, 4, 6, 8
1 2 3 4 5 6 7 8 9 10
€
μ =∑X
N=
2 + 4 + 6 + 8
4=
20
4= 5.0
2 - 5 = -3
μX - μ = deviation scores
-3
Statistics for the Social Sciences
• Step 1: To get a measure of the deviation we need to subtract the population mean from every individual in our distribution.
Our population2, 4, 6, 8
1 2 3 4 5 6 7 8 9 10
€
μ =∑X
N=
2 + 4 + 6 + 8
4=
20
4= 5.0
2 - 5 = -34 - 5 = -1
μX - μ = deviation scores
-1
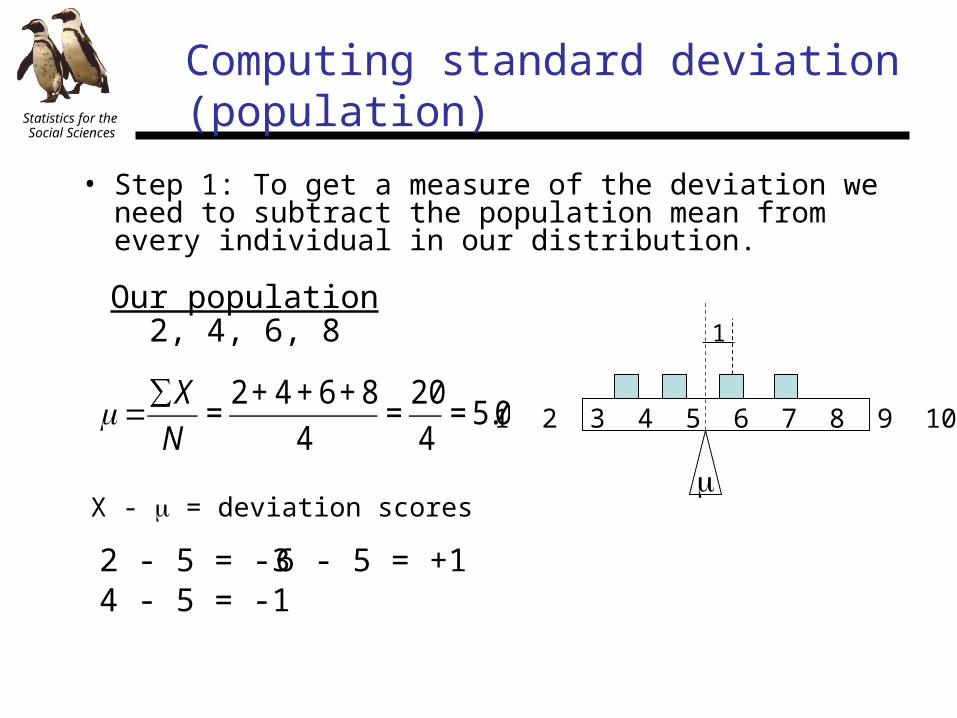
Computing standard deviation (population)
Statistics for the Social Sciences
• Step 1: To get a measure of the deviation we need to subtract the population mean from every individual in our distribution.
Our population2, 4, 6, 8
1 2 3 4 5 6 7 8 9 10
€
μ =∑X
N=
2 + 4 + 6 + 8
4=
20
4= 5.0
2 - 5 = -34 - 5 = -1
6 - 5 = +1
μX - μ = deviation scores
1
Computing standard deviation (population)

Statistics for the Social Sciences
• Step 1: Compute the deviation scores: Subtract the population mean from every score in the distribution.
Our population2, 4, 6, 8
1 2 3 4 5 6 7 8 9 10
€
μ =∑X
N=
2 + 4 + 6 + 8
4=
20
4= 5.0
2 - 5 = -34 - 5 = -1
6 - 5 = +18 - 5 = +3
μX - μ = deviation scores
3
Notice that if you add up all of the deviations they must equal 0.
Computing standard deviation (population)
Statistics for the Social Sciences
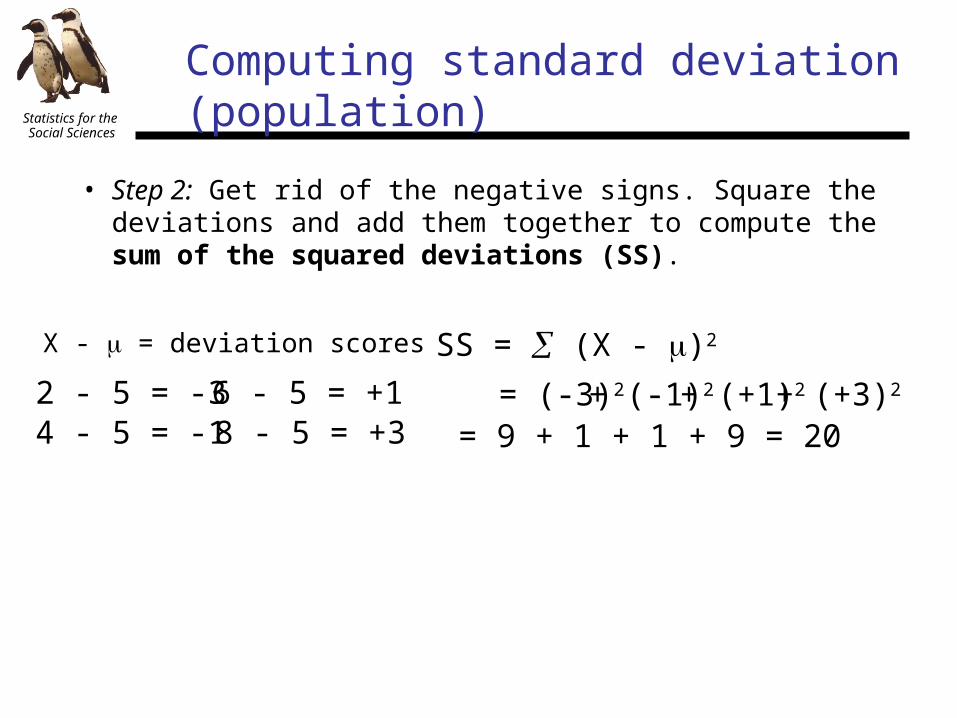
• Step 2: Get rid of the negative signs. Square the deviations and add them together to compute the sum of the squared deviations (SS).
SS = (X - μ)2
2 - 5 = -34 - 5 = -1
6 - 5 = +18 - 5 = +3
X - μ = deviation scores
= (-3)2+ (-1)2+ (+1)2+ (+3)2
= 9 + 1 + 1 + 9 = 20
Computing standard deviation (population)
Statistics for the Social Sciences
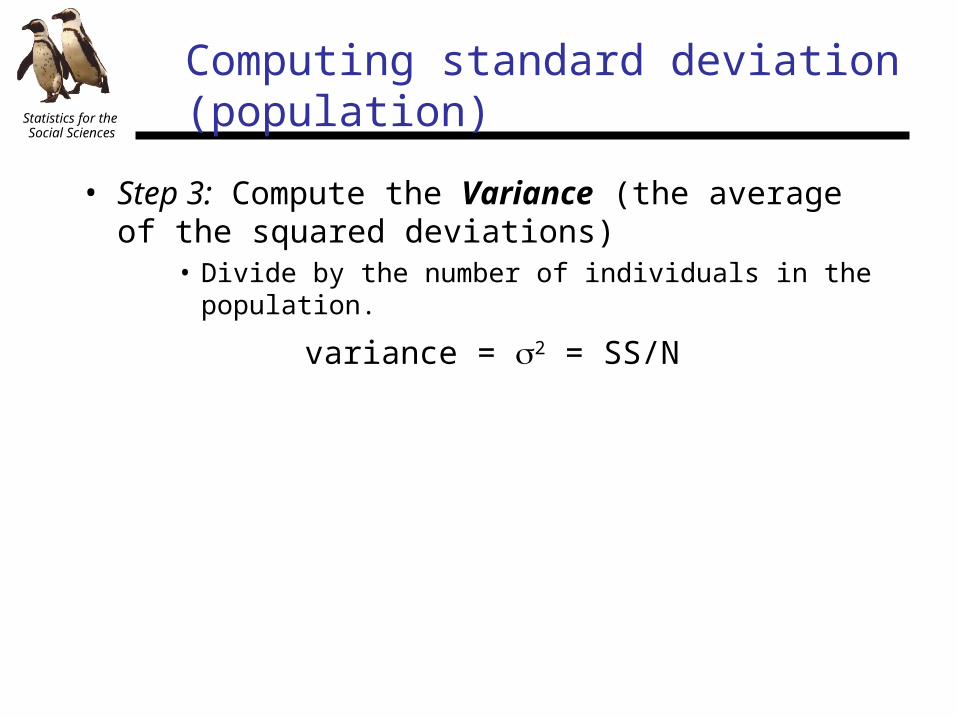
• Step 3: Compute the Variance (the average of the squared deviations)
• Divide by the number of individuals in the population.
variance = 2 = SS/N
Computing standard deviation (population)
Statistics for the Social Sciences
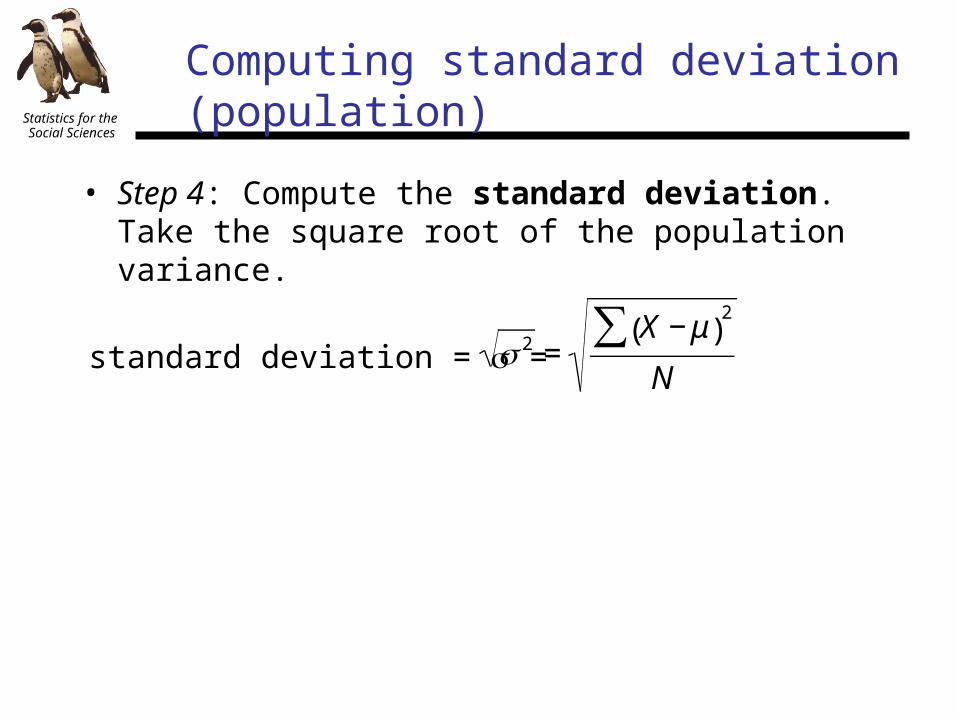
• Step 4: Compute the standard deviation. Take the square root of the population variance.
€
2 =X − μ( )
2∑N
standard deviation = =
Computing standard deviation (population)
Statistics for the Social Sciences
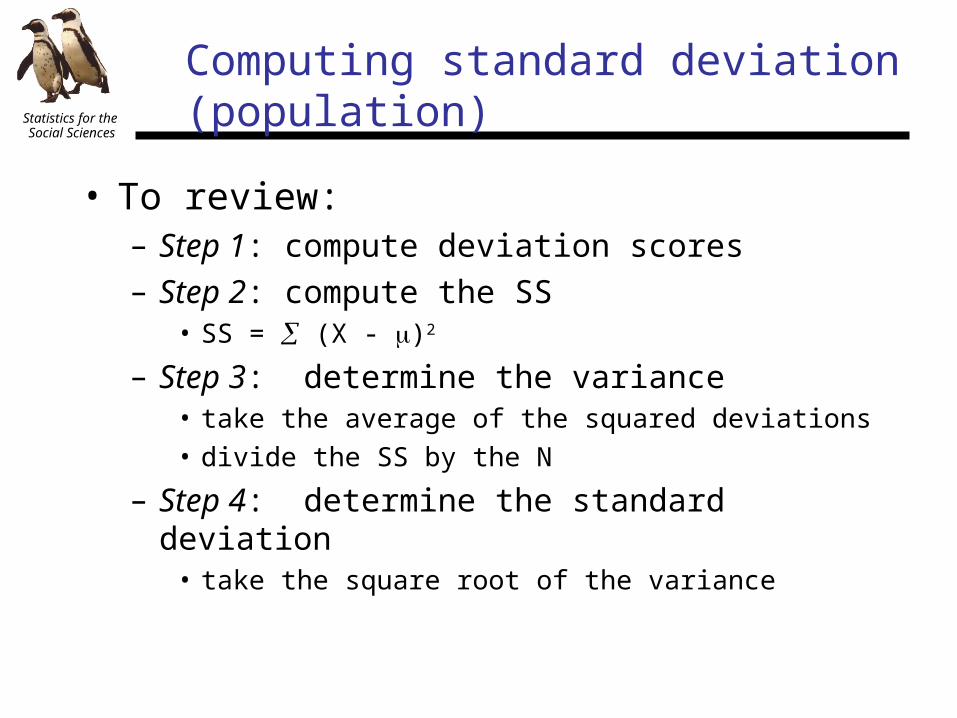
• To review:– Step 1: compute deviation scores– Step 2: compute the SS
• SS = (X - μ)2
– Step 3: determine the variance• take the average of the squared deviations• divide the SS by the N
– Step 4: determine the standard deviation• take the square root of the variance
Computing standard deviation (population)
Statistics for the Social Sciences
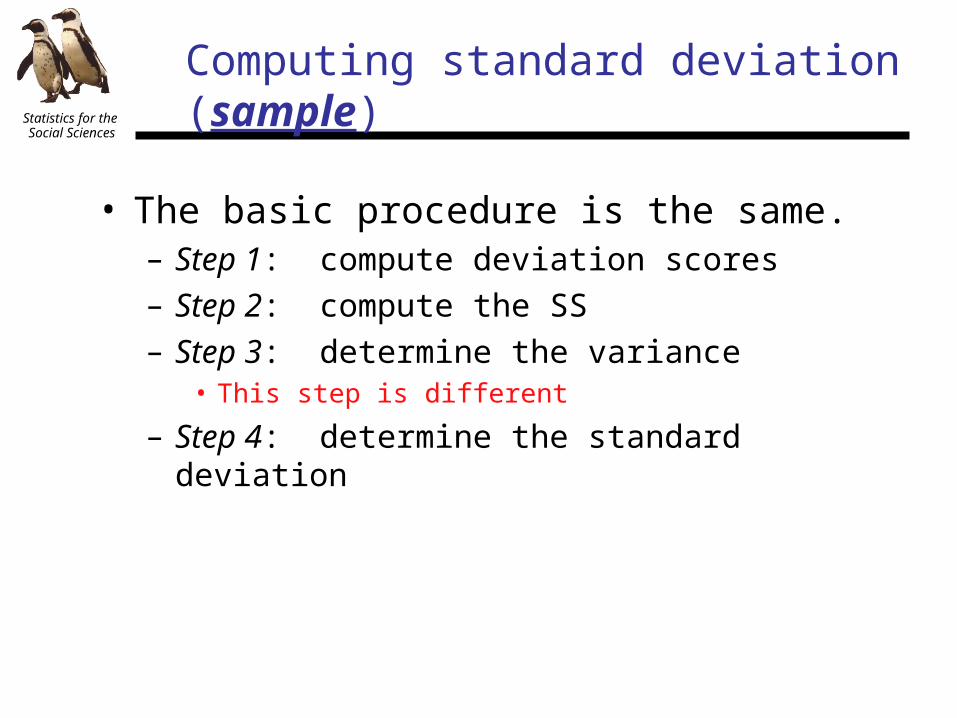
• The basic procedure is the same.– Step 1: compute deviation scores– Step 2: compute the SS– Step 3: determine the variance
• This step is different
– Step 4: determine the standard deviation
Computing standard deviation (sample)
Statistics for the Social Sciences
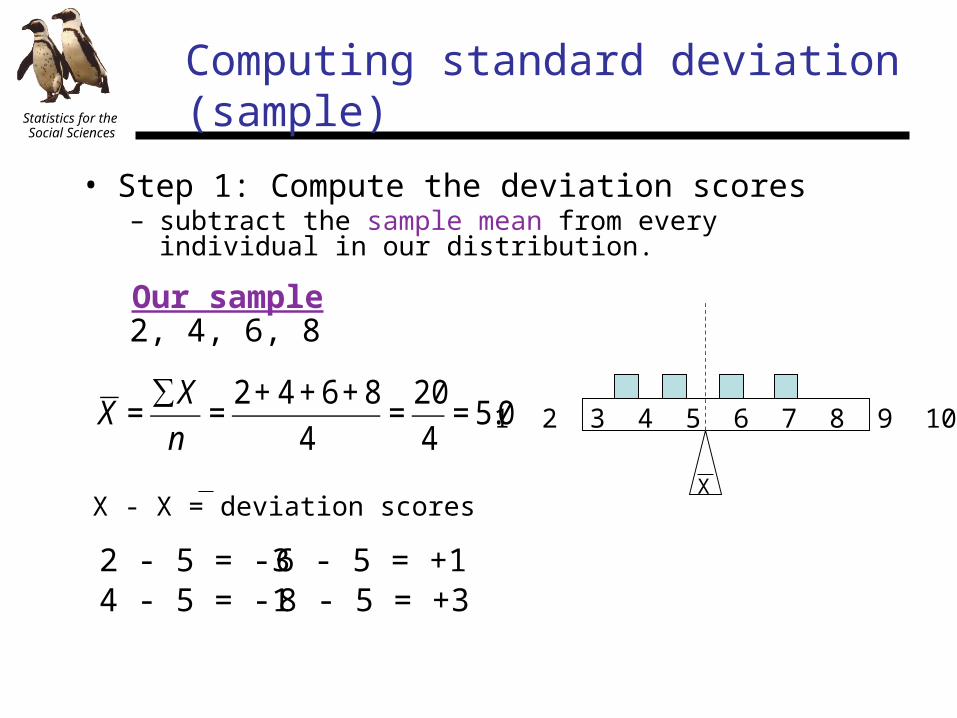
Computing standard deviation (sample)
• Step 1: Compute the deviation scores– subtract the sample mean from every individual in our distribution.
Our sample2, 4, 6, 8
1 2 3 4 5 6 7 8 9 10
€
X =∑ X
n=
2 + 4 + 6 + 8
4=
20
4= 5.0
X - X = deviation scores
2 - 5 = -34 - 5 = -1
6 - 5 = +18 - 5 = +3
X
Statistics for the Social Sciences
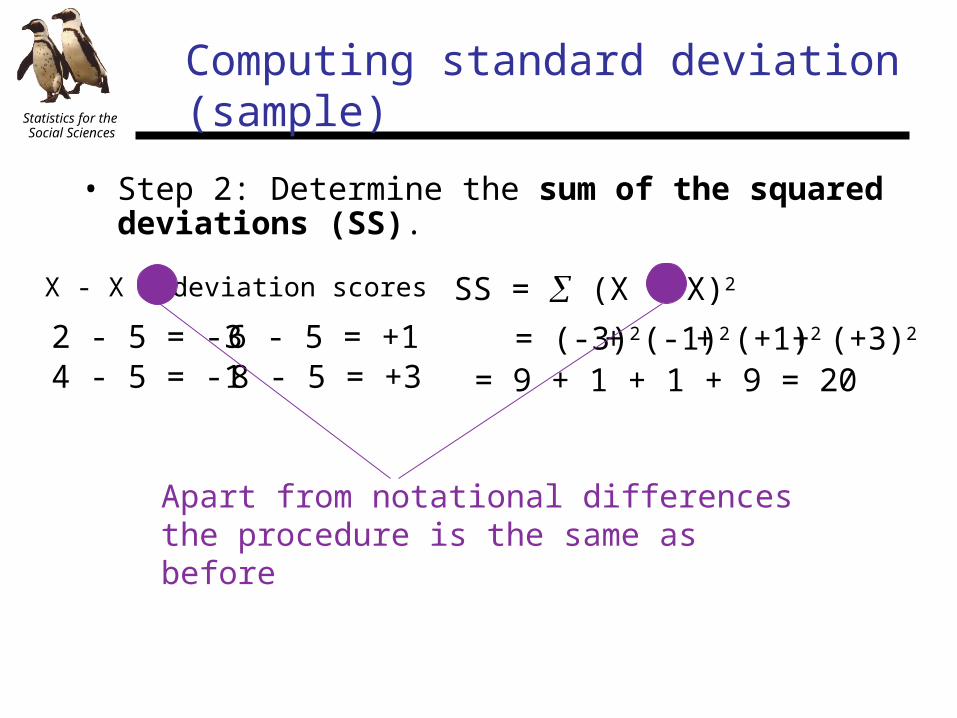
• Step 2: Determine the sum of the squared deviations (SS).
Computing standard deviation (sample)
2 - 5 = -34 - 5 = -1
6 - 5 = +18 - 5 = +3
= (-3)2+ (-1)2+ (+1)2+ (+3)2
= 9 + 1 + 1 + 9 = 20
X - X = deviation scores SS = (X - X)2
Apart from notational differences the procedure is the same as before

Statistics for the Social Sciences
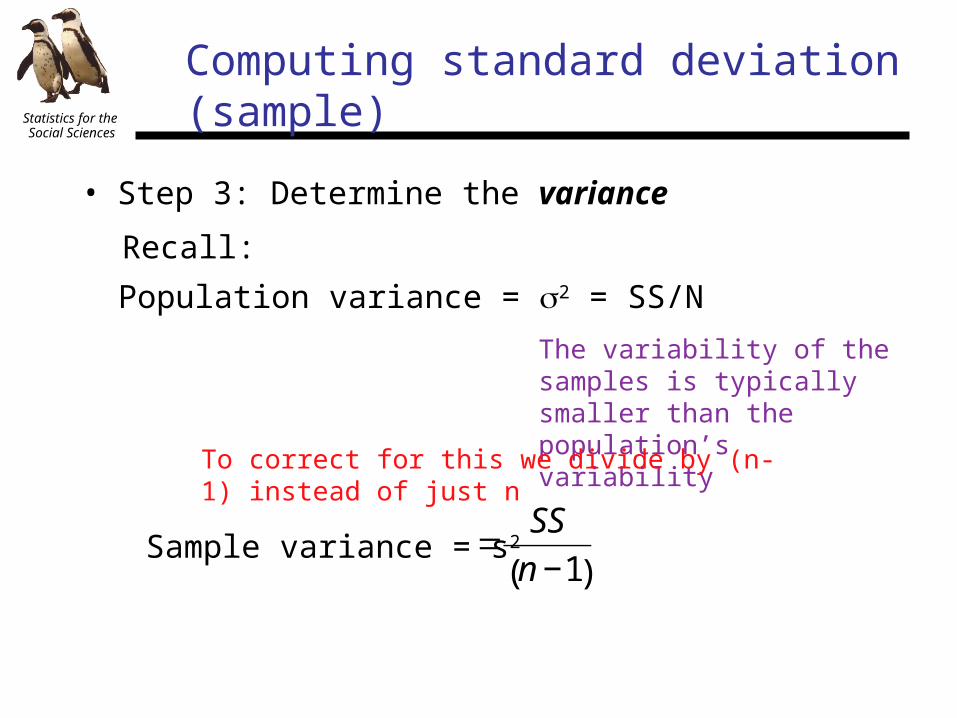
• Step 3: Determine the variance
Computing standard deviation (sample)
Population variance = 2 = SS/N
Recall:
μX1 X2X3X4
The variability of the samples is typically smaller than the population’s variability
Statistics for the Social Sciences
• Step 3: Determine the variance
Computing standard deviation (sample)
Population variance = 2 = SS/N
Recall:
The variability of the samples is typically smaller than the population’s variability
Sample variance = s2
€
=SS
n −1( )
To correct for this we divide by (n-1) instead of just n
Statistics for the Social Sciences
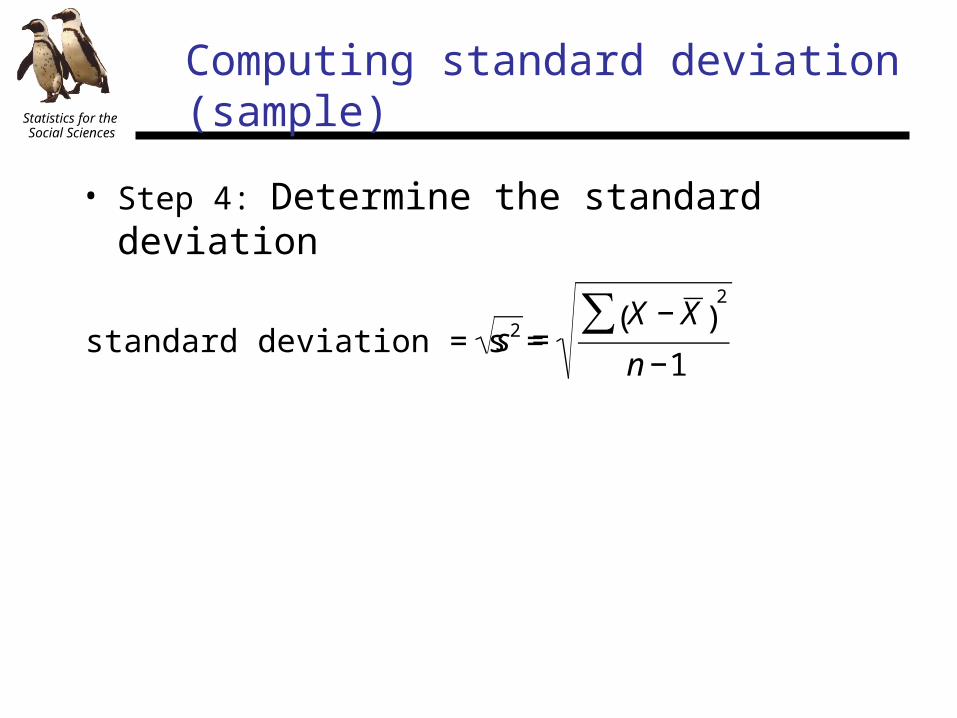
• Step 4: Determine the standard deviation
€
s2 =X − X ( )
2∑n −1
standard deviation = s =
Computing standard deviation (sample)
Statistics for the Social Sciences
Properties of means and standard deviations
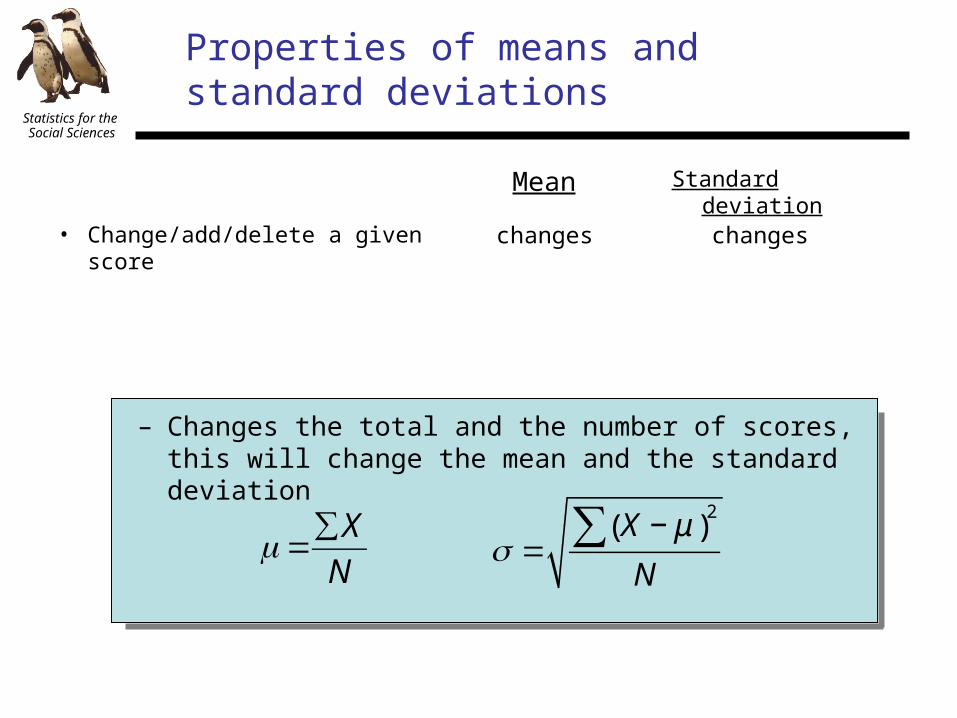
• Change/add/delete a given score
Mean Standard deviation
changes changes
– Changes the total and the number of scores, this will change the mean and the standard deviation
€
μ =∑X
N =
X − μ( )2∑
N

Statistics for the Social Sciences
Properties of means and standard deviations
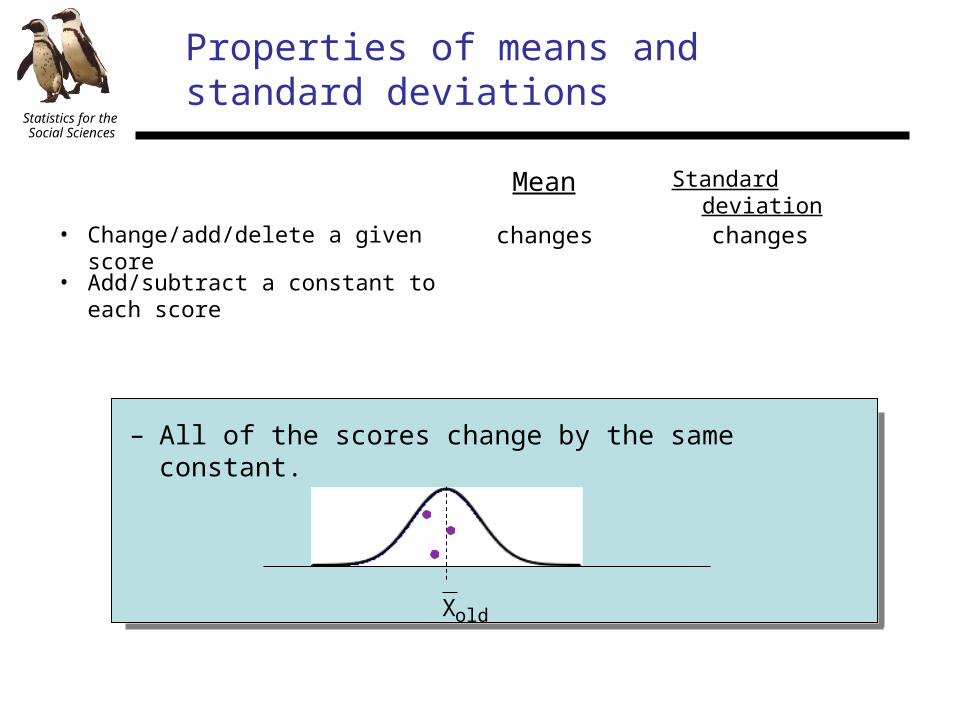
– All of the scores change by the same constant.
Xold
• Change/add/delete a given score
Mean Standard deviation
• Add/subtract a constant to each score
changes changes
Statistics for the Social Sciences
Properties of means and standard deviations
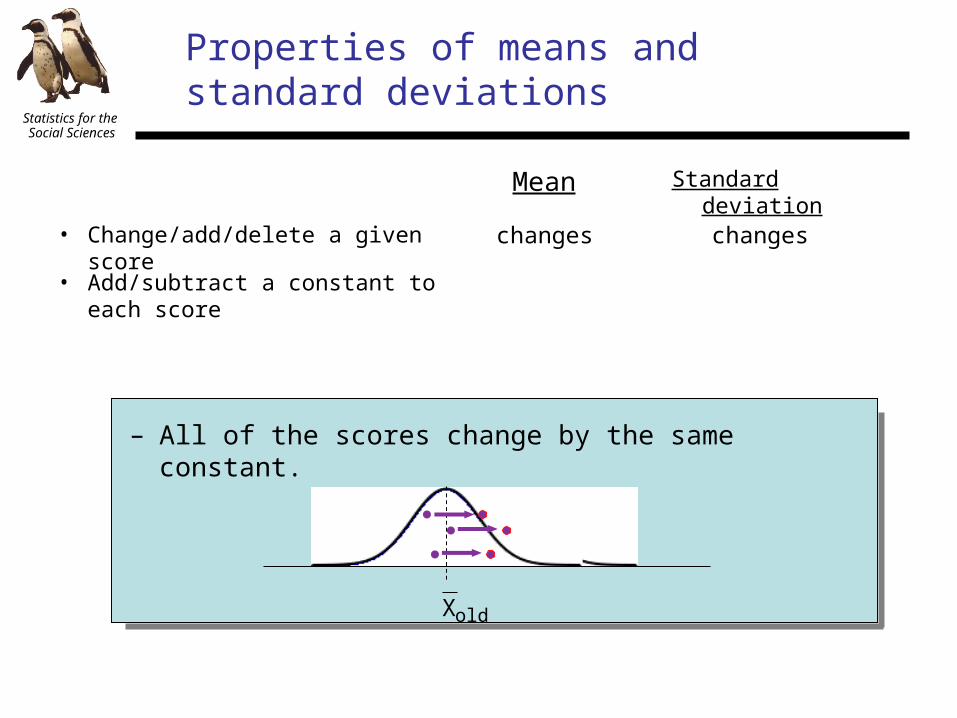
– All of the scores change by the same constant.
Xold
• Change/add/delete a given score
Mean Standard deviation
changes changes
• Add/subtract a constant to each score

Statistics for the Social Sciences
Properties of means and standard deviations
– All of the scores change by the same constant.
Xold
• Change/add/delete a given score
Mean Standard deviation
changes changes
• Add/subtract a constant to each score
Statistics for the Social Sciences
Properties of means and standard deviations
– All of the scores change by the same constant.
Xold
• Change/add/delete a given score
Mean Standard deviation
changes changes
• Add/subtract a constant to each score

Statistics for the Social Sciences
Properties of means and standard deviations
– All of the scores change by the same constant.
– But so does the mean
Xnew
• Change/add/delete a given score
Mean Standard deviation
changes changes
• Add/subtract a constant to each score
changes
Statistics for the Social Sciences
Properties of means and standard deviations
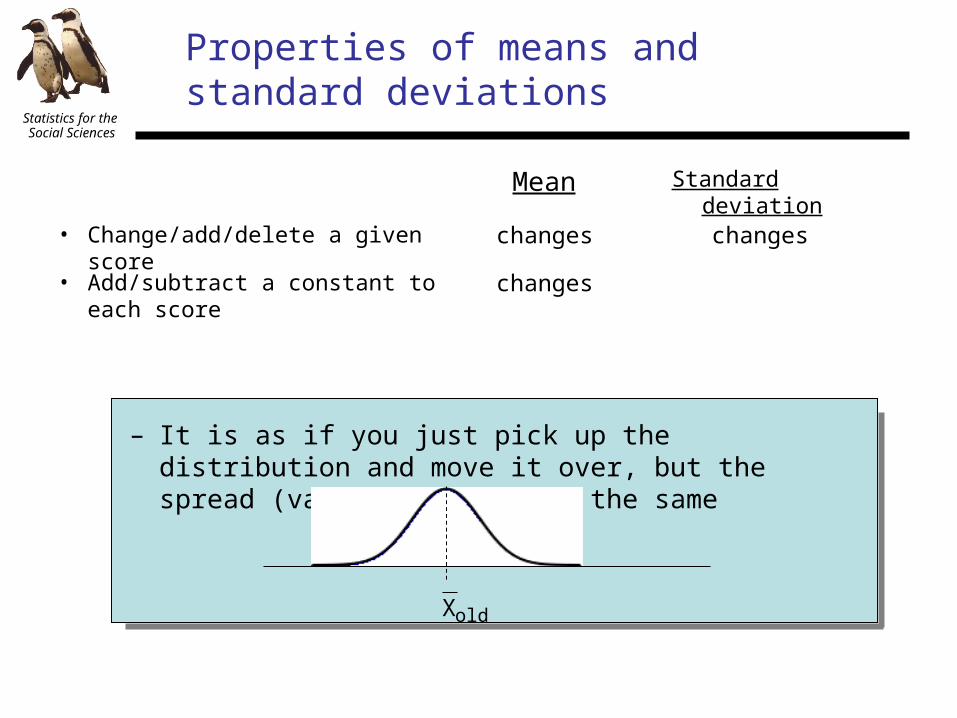
– It is as if you just pick up the distribution and move it over, but the spread (variability) stays the same
Xold
• Change/add/delete a given score
Mean Standard deviation
changes changes
• Add/subtract a constant to each score
changes
Statistics for the Social Sciences
Properties of means and standard deviations
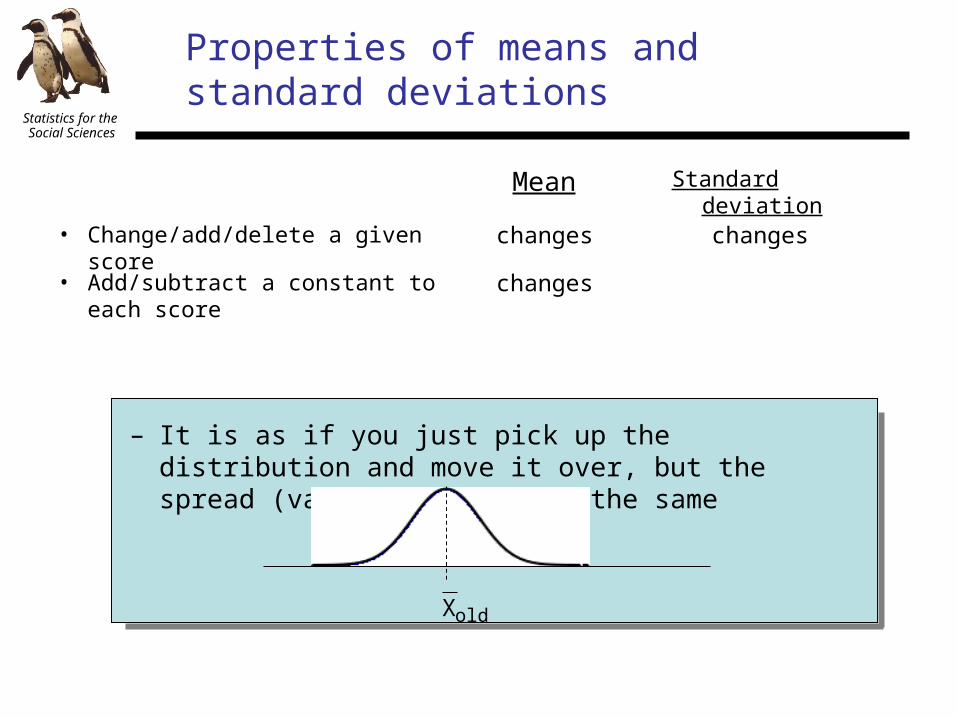
– It is as if you just pick up the distribution and move it over, but the spread (variability) stays the same
Xold
• Change/add/delete a given score
Mean Standard deviation
changes changes
• Add/subtract a constant to each score
changes

Statistics for the Social Sciences
Properties of means and standard deviations
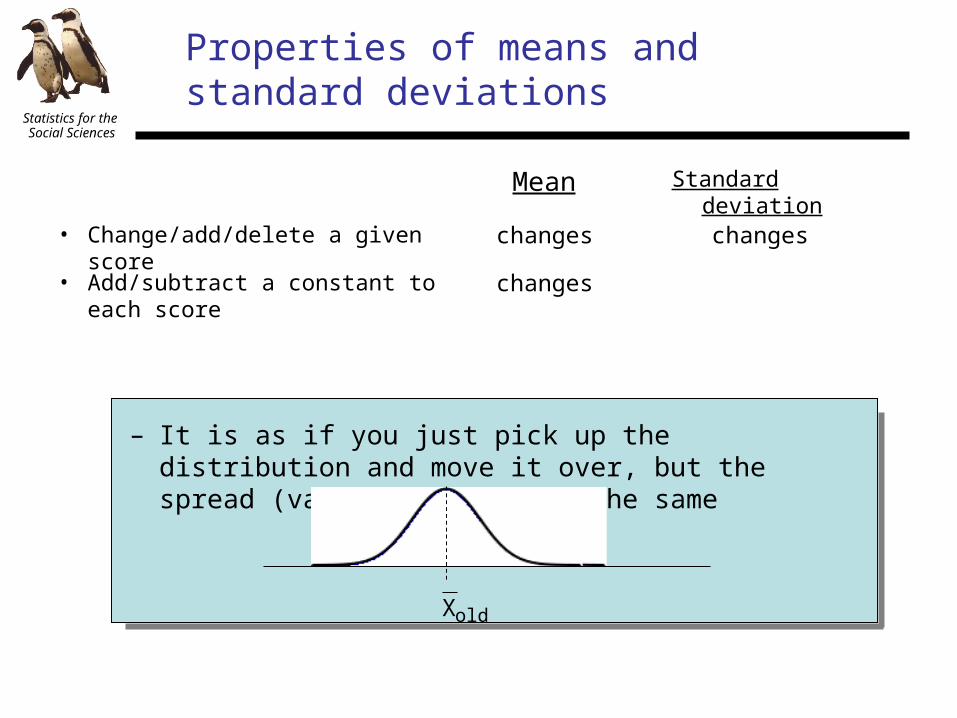
– It is as if you just pick up the distribution and move it over, but the spread (variability) stays the same
Xold
• Change/add/delete a given score
Mean Standard deviation
changes changes
• Add/subtract a constant to each score
changes
Statistics for the Social Sciences
Properties of means and standard deviations
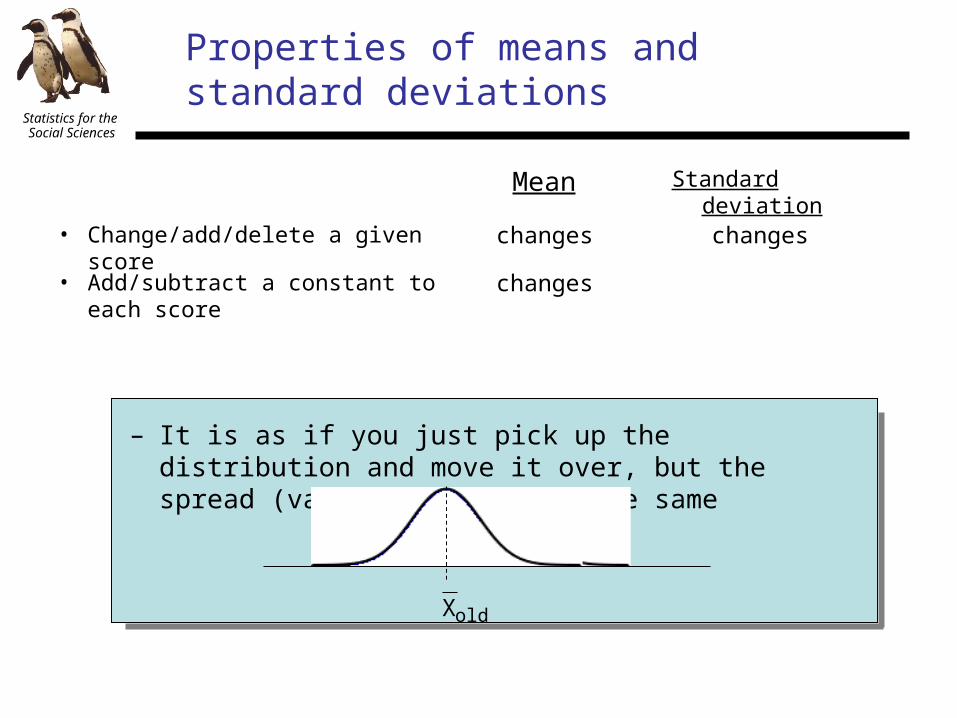
– It is as if you just pick up the distribution and move it over, but the spread (variability) stays the same
Xold
• Change/add/delete a given score
Mean Standard deviation
changes changes
• Add/subtract a constant to each score
changes

Statistics for the Social Sciences
Properties of means and standard deviations
– It is as if you just pick up the distribution and move it over, but the spread (variability) stays the same
Xold
• Change/add/delete a given score
Mean Standard deviation
changes changes
• Add/subtract a constant to each score
changes

Statistics for the Social Sciences
Properties of means and standard deviations
– It is as if you just pick up the distribution and move it over, but the spread (variability) stays the same
XnewXold
• Change/add/delete a given score
Mean Standard deviation
changes changes
No changechanges• Add/subtract a constant to each score
Statistics for the Social Sciences
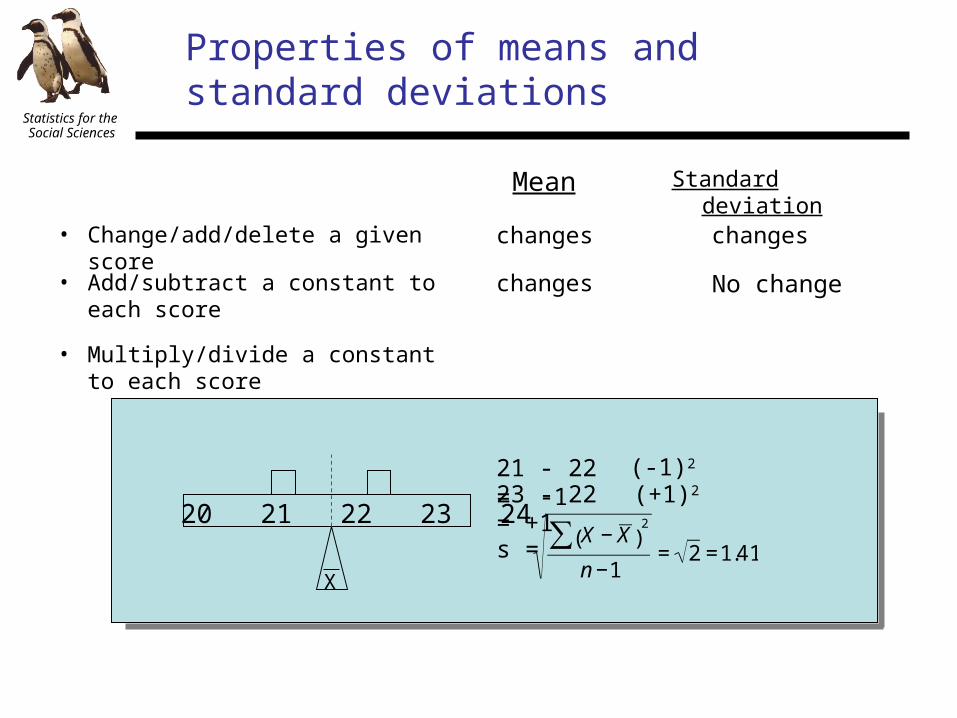
Properties of means and standard deviations
• Change/add/delete a given score
Mean Standard deviation
• Multiply/divide a constant to each score
changes changes
No changechanges• Add/subtract a constant to each score
20 21 22 23 24
X
21 - 22 = -123 - 22 = +1
(-1)2
(+1)2
s =
€
X − X ( )2∑
n −1= 2 =1.41

Statistics for the Social Sciences
Properties of means and standard deviations
– Multiply scores by 2
• Change/add/delete a given score
Mean Standard deviation
• Multiply/divide a constant to each score
changes changes
No changechanges
changes changes
• Add/subtract a constant to each score
42 - 44 = -246 - 44 = +2
(-2)2
(+2)2
s =
€
X − X ( )2∑
n −1= 8 = 2.82
40 42 44 46 48
X
Sold=1.41
Statistics for the Social Sciences
Locating a score
• Where is our raw score within the distribution?– The natural choice of reference is the mean (since it is usually easy to find).• So we’ll subtract the mean from the score (find
the deviation score).
€
X − μ– The direction will be given to us by the negative or positive sign on the deviation score
– The distance is the value of the deviation score

Statistics for the Social Sciences
Locating a score
€
X − μ
μ
€
μ =100
X1 = 162X2 = 57
X1 - 100 = +62X2 - 100 = -43
Reference point
Direction

Statistics for the Social Sciences
Locating a score
€
X − μ
μ
€
μ =100
X1 = 162X2 = 57
X1 - 100 = +62X2 - 100 = -43
Reference point
BelowAbove

Statistics for the Social Sciences
Transforming a score
€
z =X − μ
σ
– The distance is the value of the deviation score• However, this distance is measured with the units of measurement of the score.
• Convert the score to a standard (neutral) score. In this case a z-score.
Raw score
Population meanPopulation standard deviation

Statistics for the Social Sciences
Transforming scores
μ
€
μ =100
X1 = 162
X2 = 57
€
=50
€
z =X − μ
σ
X1 - 100 = +1.2050
X2 - 100 = -0.8650
A z-score specifies the precise location of each X value within a distribution. • Direction: The sign of the z-score (+ or -) signifies whether the score is above the mean or below the mean. • Distance: The numerical value of the z-score specifies the distance from the mean by counting the number of standard deviations between X and μ.
Statistics for the Social Sciences
Transforming a distribution
• We can transform all of the scores in a distribution– We can transform any & all observations to z-scores if we know either the distribution mean and standard deviation.
– We call this transformed distribution a standardized distribution. • Standardized distributions are used to make dissimilar distributions comparable.– e.g., your height and weight
• One of the most common standardized distributions is the Z-distribution.

Statistics for the Social Sciences
Properties of the z-score distribution
μ
€
μ =0
μ
transformation
€
z =X − μ
σ
15050
€
zmean =100 −100
50= 0
€
=50
€
μ =100
Xmean = 100

Statistics for the Social Sciences
Properties of the z-score distribution
μ
€
μ =0
μ
€
=50
transformation
€
z =X − μ
σ
15050
Xmean = 100
€
zmean =100 −100
50
€
z+1std =150 −100
50
= 0
= +1
€
μ =100
X+1std = 150
+1

Statistics for the Social Sciences
Properties of the z-score distribution
μ
€
=1
€
μ =0
μ
€
=50
transformation
€
z =X − μ
σ
15050
Xmean = 100
X+1std = 150
€
zmean =100 −100
50
€
z+1std =150 −100
50
€
z−1std =50 −100
50
= 0
= +1
= -1
€
μ =100
X-1std = 50
+1-1

Statistics for the Social Sciences
Properties of the z-score distribution
• Shape - the shape of the z-score distribution will be exactly the same as the original distribution of raw scores. Every score stays in the exact same position relative to every other score in the distribution.
• Mean - when raw scores are transformed into z-scores, the mean will always = 0.
• The standard deviation - when any distribution of raw scores is transformed into z-scores the standard deviation will always = 1.

Statistics for the Social Sciences
μ 15050 μ€
=1
€
μ =0
+1-1
From z to raw score
• We can also transform a z-score back into a raw score if we know the mean and standard deviation information of the original distribution.
transformation
€
X = Zσ + μ
€
=50
€
μ =100
Z = -0.60X = (-0.60)( 50) + 100X = 70
Z =X−μ( )
Z( ) ( ) = X−μ( ) X = Z( ) ( ) + μ