Embed Size (px)
Citation preview
Statistics for Managers Using Microsoft Excel® 7e Copyright ©2014 Pearson Education, Inc. Chap 12-1
Chapter 12
Chi-Square Tests and Nonparametric Tests
Statistics for Managers Using Microsoft Excel
7th Edition

Statistics for Managers Using Microsoft Excel® 7e Copyright ©2014 Pearson Education, Inc. Chap 12-2
Learning Objectives
In this chapter, you learn: How and when to use the chi-square test for
contingency tables How to use the Marascuilo procedure for
determining pairwise differences when evaluating more than two proportions How and when to use nonparametric tests

Statistics for Managers Using Microsoft Excel® 7e Copyright ©2014 Pearson Education, Inc. Chap 12-3
Contingency Tables
Contingency Tables
Useful in situations comparing multiple population proportions
Used to classify sample observations according to two or more characteristics
Also called a cross-classification table.
DCOVA

Statistics for Managers Using Microsoft Excel® 7e Copyright ©2014 Pearson Education, Inc. Chap 12-4
Contingency Table Example
Left-Handed vs. Gender
Dominant Hand: Left vs. Right
Gender: Male vs. Female
2 categories for each variable, so this is called a 2 x 2 table
Suppose we examine a sample of300 children
DCOVA

Statistics for Managers Using Microsoft Excel® 7e Copyright ©2014 Pearson Education, Inc. Chap 12-5
Contingency Table Example
Sample results organized in a contingency table:
(continued)
Gender
Hand Preference
Left Right
Female 12 108 120
Male 24 156 180
36 264 300
120 Females, 12 were left handed
180 Males, 24 were left handed
sample size = n = 300:
DCOVA

Statistics for Managers Using Microsoft Excel® 7e Copyright ©2014 Pearson Education, Inc. Chap 12-6
χ2 Test for the Difference Between Two Proportions
If H0 is true, then the proportion of left-handed females should be the same as the proportion of left-handed males
The two proportions above should be the same as the proportion of left-handed people overall
H0: π1 = π2 (Proportion of females who are lefthanded is equal to the proportion ofmales who are left handed)
H1: π1 ≠ π2 (The two proportions are not the same –hand preference is not independent of gender)
DCOVA

Statistics for Managers Using Microsoft Excel® 7e Copyright ©2014 Pearson Education, Inc. Chap 12-7
The Chi-Square Test Statistic
where:fo = observed frequency in a particular cellfe = expected frequency in a particular cell if H0 is true
(Assumed: each cell in the contingency table has expectedfrequency of at least 5)
∑−
=cells
22 )(
all e
eoSTAT f
ffχ
The Chi-square test statistic is:
freedom of degree 1 has case 2x 2 thefor 2STATχ
DCOVA

Statistics for Managers Using Microsoft Excel® 7e Copyright ©2014 Pearson Education, Inc. Chap 12-8
Decision Rule
χ2χ2
α
Decision Rule:If , reject H0, otherwise, do not reject H0
The test statistic approximately follows a chi-squared distribution with one degree of freedom
0
α
Reject H0Do not reject H0
2STATχ
22αSTAT χ χ >
DCOVA
Statistics for Managers Using Microsoft Excel® 7e Copyright ©2014 Pearson Education, Inc. Chap 12-9
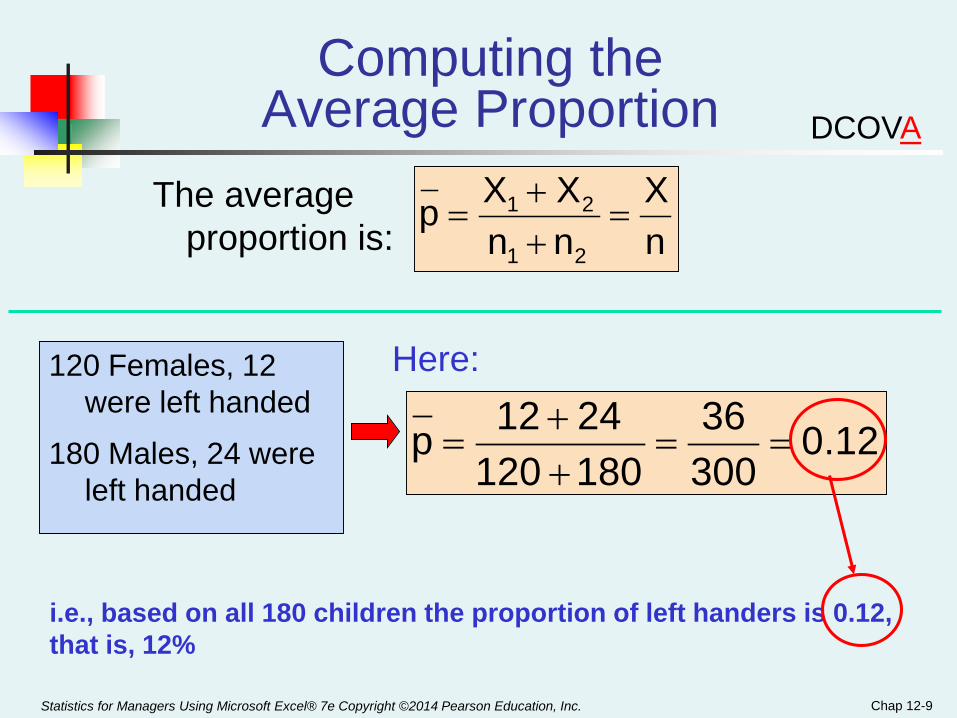
Computing the Average Proportion
Here:120 Females, 12 were left handed
180 Males, 24 were left handed
i.e., based on all 180 children the proportion of left handers is 0.12, that is, 12%
nX
nnXXp
21
21 =++
=
12.030036
1801202412p ==
++
=
The average proportion is:
DCOVA

Statistics for Managers Using Microsoft Excel® 7e Copyright ©2014 Pearson Education, Inc. Chap 12-10
Finding Expected Frequencies
To obtain the expected frequency for left handed females, multiply the average proportion left handed (p) by the total number of females
To obtain the expected frequency for left handed males, multiply the average proportion left handed (p) by the total number of males
If the two proportions are equal, then
P(Left Handed | Female) = P(Left Handed | Male) = .12
i.e., we would expect (.12)(120) = 14.4 females to be left handed(.12)(180) = 21.6 males to be left handed
DCOVA

Statistics for Managers Using Microsoft Excel® 7e Copyright ©2014 Pearson Education, Inc. Chap 12-11
Observed vs. Expected Frequencies
GenderHand Preference
Left Right
FemaleObserved = 12
Expected = 14.4Observed = 108
Expected = 105.6120
MaleObserved = 24
Expected = 21.6Observed = 156
Expected = 158.4180
36 264 300
DCOVA

Statistics for Managers Using Microsoft Excel® 7e Copyright ©2014 Pearson Education, Inc. Chap 12-12
GenderHand Preference
Left Right
FemaleObserved = 12
Expected = 14.4Observed = 108
Expected = 105.6120
MaleObserved = 24
Expected = 21.6Observed = 156
Expected = 158.4180
36 264 300
0.7576158.4
158.4)(15621.6
21.6)(24105.6
105.6)(10814.4
14.4)(12
f
)f(fχ
2222cells all e
2eo2
=−
+−
+−
+−
=
−= ∑STAT
The Chi-Square Test Statistic
The test statistic is:
DCOVA

Statistics for Managers Using Microsoft Excel® 7e Copyright ©2014 Pearson Education, Inc. Chap 12-13
Decision Rule
Decision Rule:If > 3.841, reject H0, otherwise, do not reject H0
3.841 d.f. 1 with ; 0.7576 is statistic test The 205.0
2 == χχ STAT
Here, = 0.7576< = 3.841,
so we do not reject H0 and conclude that there is not sufficient evidence that the two proportions are different at α = 0.05
χ2
χ20.05 = 3.841
0
0.05
Reject H0Do not reject H0
2STATχ
2STATχ 2
05.0χ
DCOVA

Statistics for Managers Using Microsoft Excel® 7e Copyright ©2014 Pearson Education, Inc. Chap 12-14
Extend the χ2 test to the case with more than two independent populations:
χ2 Test for Differences Among More Than Two Proportions
H0: π1 = π2 = … = πc
H1: Not all of the πj are equal (j = 1, 2, …, c)
DCOVA

Statistics for Managers Using Microsoft Excel® 7e Copyright ©2014 Pearson Education, Inc. Chap 12-15
The Chi-Square Test Statistic
Where:fo = observed frequency in a particular cell of the 2 x c tablefe = expected frequency in a particular cell if H0 is true
(Assumed: each cell in the contingency table has expectedfrequency of at least 1)
∑−
=cells
22 )(
all e
eoSTAT f
ffχ
The Chi-square test statistic is:
freedom of degrees 1-c 1)-1)(c-(2 has case cx 2 thefor χ 2 =STAT
DCOVA

Statistics for Managers Using Microsoft Excel® 7e Copyright ©2014 Pearson Education, Inc. Chap 12-16
Computing the Overall Proportion
nX
nnnXXXp
c21
c21 =++++++
=
The overall proportion is:
Expected cell frequencies for the c categories are calculated as in the 2 x 2 case, and the decision rule is the same:
Where is from the chi-squared distribution with c – 1 degrees of freedom
Decision Rule:If , reject H0, otherwise, do not reject H0
22αSTAT χ χ >
2αχ
DCOVA

Statistics for Managers Using Microsoft Excel® 7e Copyright ©2014 Pearson Education, Inc. Chap 12-17
The Marascuilo Procedure
Used when the null hypothesis of equal proportions is rejected
Enables you to make comparisons between all pairs
Start with the observed differences, pj – pj’, for all pairs (for j ≠ j’) then compare the absolute difference to a calculated critical range
DCOVA
Statistics for Managers Using Microsoft Excel® 7e Copyright ©2014 Pearson Education, Inc. Chap 12-18
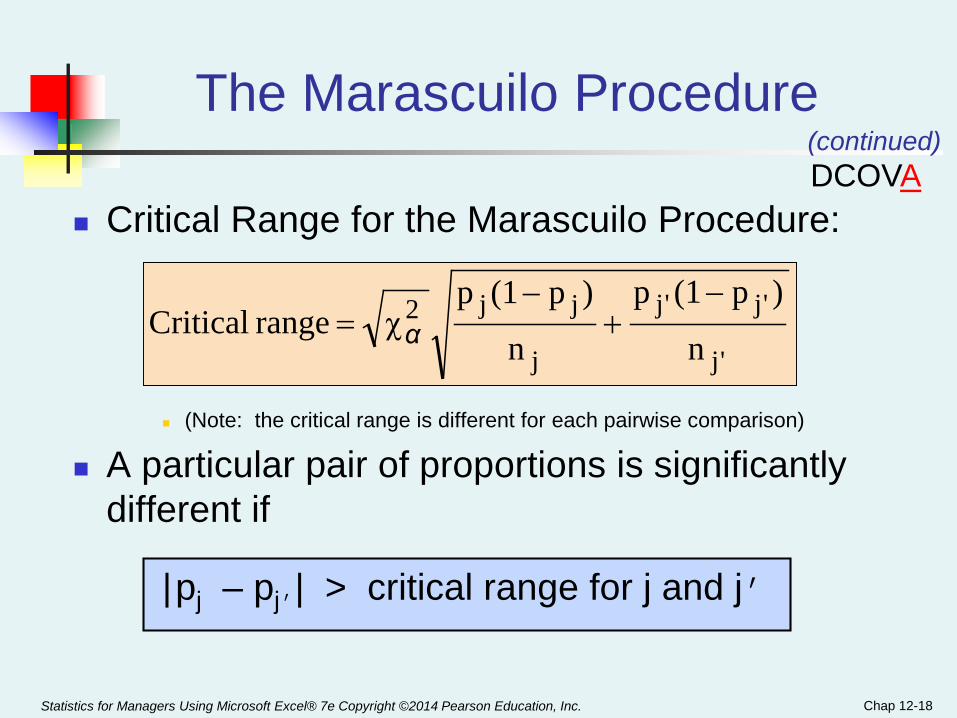
The Marascuilo Procedure
Critical Range for the Marascuilo Procedure:
(Note: the critical range is different for each pairwise comparison)
A particular pair of proportions is significantly different if
|pj – pj’| > critical range for j and j’
(continued)
'j
'j'j
j
jj2n
)p(1p
n
)p(1pχrange Critical
−+
−= α
DCOVA

Statistics for Managers Using Microsoft Excel® 7e Copyright ©2014 Pearson Education, Inc. Chap 12-19
Marascuilo Procedure Example
A University is thinking of switching to a trimester academic calendar. A random sample of 100 administrators, 50 students, and 50 faculty members were surveyed
Opinion Administrators Students Faculty
Favor 63 20 37
Oppose 37 30 13
Totals 100 50 50
Using a 1% level of significance, which groups have a different attitude?
DCOVA

Statistics for Managers Using Microsoft Excel® 7e Copyright ©2014 Pearson Education, Inc. Chap 12-20
Chi-Square Test Results
Chi-Square Test: Administrators, Students, FacultyAdmin Students Faculty Total
Favor 63 20 37 120
60 30 30
Oppose 37 30 13 80
40 20 20
Total 100 50 50 200
ObservedExpected
H0: π1 = π2 = π3
H1: Not all of the πj are equal (j = 1, 2, 3)
02
0102 Hreject so 9.2103 79212 =>= .STAT χ.χ
DCOVA

Statistics for Managers Using Microsoft Excel® 7e Copyright ©2014 Pearson Education, Inc. Chap 12-21
Marascuilo Procedure: Solution
Marascuilo Procedure
Sample Sample Absolute Std. Error CriticalGroup Proportion Size ComparisonDifferenceof Difference Range Results
1 0.63 100 1 to 2 0.23 0.084445249 0.2563 Means are not different2 0.4 50 1 to 3 0.11 0.078606615 0.2386 Means are not different3 0.74 50 2 to 3 0.34 0.092994624 0.2822 Means are different
0.01 9.21032
3.034854
Chi-sq Critical ValueOther Data
d.fQ Statistic
Level of significance
Excel Output:compare
At 1% level of significance, there is evidence of a difference in attitude between students and faculty
DCOVA

Statistics for Managers Using Microsoft Excel® 7e Copyright ©2014 Pearson Education, Inc. Chap 12-22
χ2 Test of Independence
Similar to the χ2 test for equality of more than two proportions, but extends the concept to contingency tables with r rows and c columns
H0: The two categorical variables are independent(i.e., there is no relationship between them)
H1: The two categorical variables are dependent(i.e., there is a relationship between them)
DCOVA

Statistics for Managers Using Microsoft Excel® 7e Copyright ©2014 Pearson Education, Inc. Chap 12-23
χ2 Test of Independence
where:fo = observed frequency in a particular cell of the r x c tablefe = expected frequency in a particular cell if H0 is true
(Assumed: each cell in the contingency table has expectedfrequency of at least 1)
∑−
=cells
22 )(
all e
eoSTAT f
ffχ
The Chi-square test statistic is:(continued)
freedom of degrees 1)-1)(c-(r has case cr x for the χ 2STAT
DCOVA

Statistics for Managers Using Microsoft Excel® 7e Copyright ©2014 Pearson Education, Inc. Chap 12-24
Expected Cell Frequencies
Expected cell frequencies:
ntotal columntotalrow fe
×=
Where:row total = sum of all frequencies in the rowcolumn total = sum of all frequencies in the columnn = overall sample size
DCOVA

Statistics for Managers Using Microsoft Excel® 7e Copyright ©2014 Pearson Education, Inc. Chap 12-25
Decision Rule
The decision rule is
Where is from the chi-squared distribution with (r – 1)(c – 1) degrees of freedom
If , reject H0,
otherwise, do not reject H0
22αSTAT χ χ >
2αχ
DCOVA

Statistics for Managers Using Microsoft Excel® 7e Copyright ©2014 Pearson Education, Inc. Chap 12-26
Example
The meal plan selected by 200 students is shown below:
ClassStanding
Number of meals per weekTotal20/week 10/week none
Fresh. 24 32 14 70
Soph. 22 26 12 60
Junior 10 14 6 30
Senior 14 16 10 40
Total 70 88 42 200
DCOVA

Statistics for Managers Using Microsoft Excel® 7e Copyright ©2014 Pearson Education, Inc. Chap 12-27
Example
The hypothesis to be tested is:
(continued)
H0: Meal plan and class standing are independent(i.e., there is no relationship between them)
H1: Meal plan and class standing are dependent(i.e., there is a relationship between them)
DCOVA

Statistics for Managers Using Microsoft Excel® 7e Copyright ©2014 Pearson Education, Inc. Chap 12-28
ClassStanding
Number of meals per week
Total20/wk 10/wk noneFresh. 24 32 14 70Soph. 22 26 12 60Junior 10 14 6 30Senior 14 16 10 40
Total 70 88 42 200
ClassStanding
Number of meals per week
Total20/wk 10/wk noneFresh. 24.5 30.8 14.7 70
Soph. 21.0 26.4 12.6 60
Junior 10.5 13.2 6.3 30
Senior 14.0 17.6 8.4 40
Total 70 88 42 200
Observed:
Expected cell frequencies if H0 is true:
5.10200
7030
ntotal columntotalrow fe
=×
=
×=
Example for one cell:
Example: Expected Cell Frequencies
(continued)
DCOVA

Statistics for Managers Using Microsoft Excel® 7e Copyright ©2014 Pearson Education, Inc. Chap 12-29
Example: The Test Statistic
The test statistic value is:
709048
4810830
83032524
52424 222cells
22
..
).(.
).(.
).(
f
)ff(χ
all e
eoSTAT
=−
++−
+−
=
−= ∑
(continued)
= 12.592 from the chi-squared distribution with (4 – 1)(3 – 1) = 6 degrees of freedom
2050.χ
DCOVA

Statistics for Managers Using Microsoft Excel® 7e Copyright ©2014 Pearson Education, Inc. Chap 12-30
Example: Decision and Interpretation
(continued)
Decision Rule:If > 12.592, reject H0, otherwise, do not reject H0
12.592 d.f. 6 with ; 7090 is statistictest The 2050
2 == .STAT χ.χ
Here, = 0.709 < = 12.592,
so do not reject H0Conclusion: there is not sufficient evidence that meal plan and class standing are related at α = 0.05
χ2
χ20.05=12.592
0
0.05
Reject H0Do not reject H0
2STATχ
2STATχ 2
050.χ
DCOVA