Embed Size (px)
Citation preview
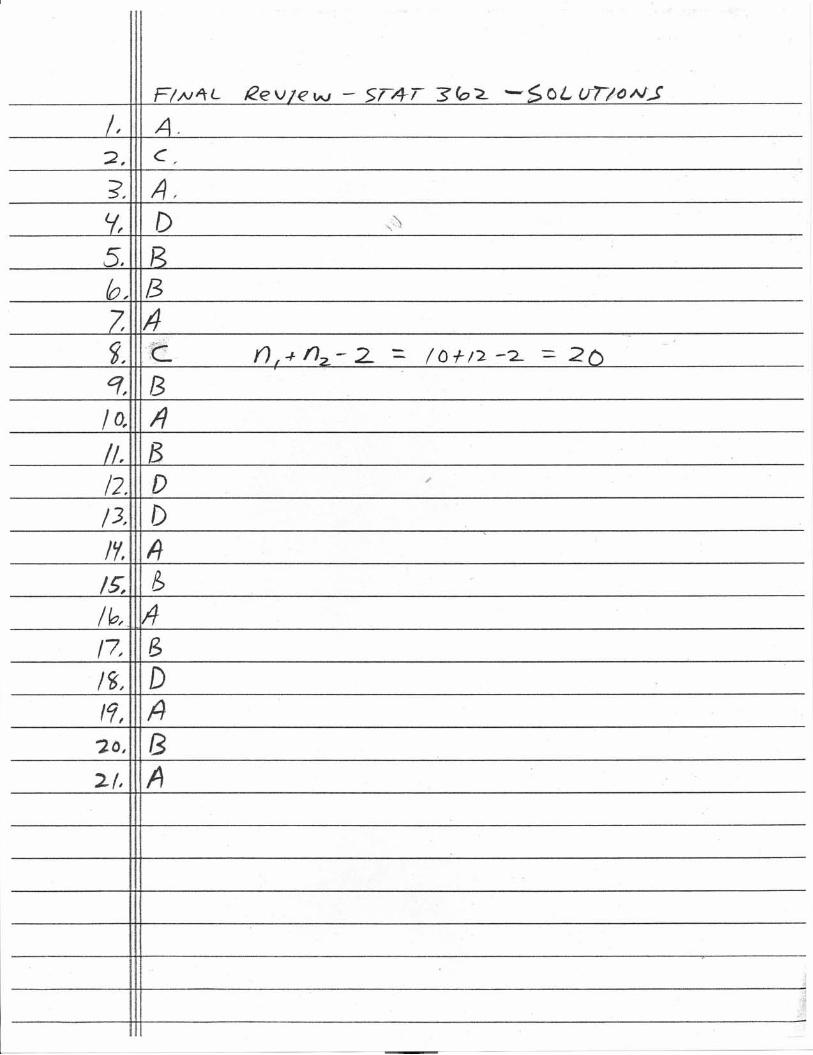
STAT 362 Statistics for Management II - Final Review Worksheet
6
Statistics for Management II-STAT 362-Final Review
Multiple ChoiceIdentify the letter of the choice that best completes the statement or answers the question.
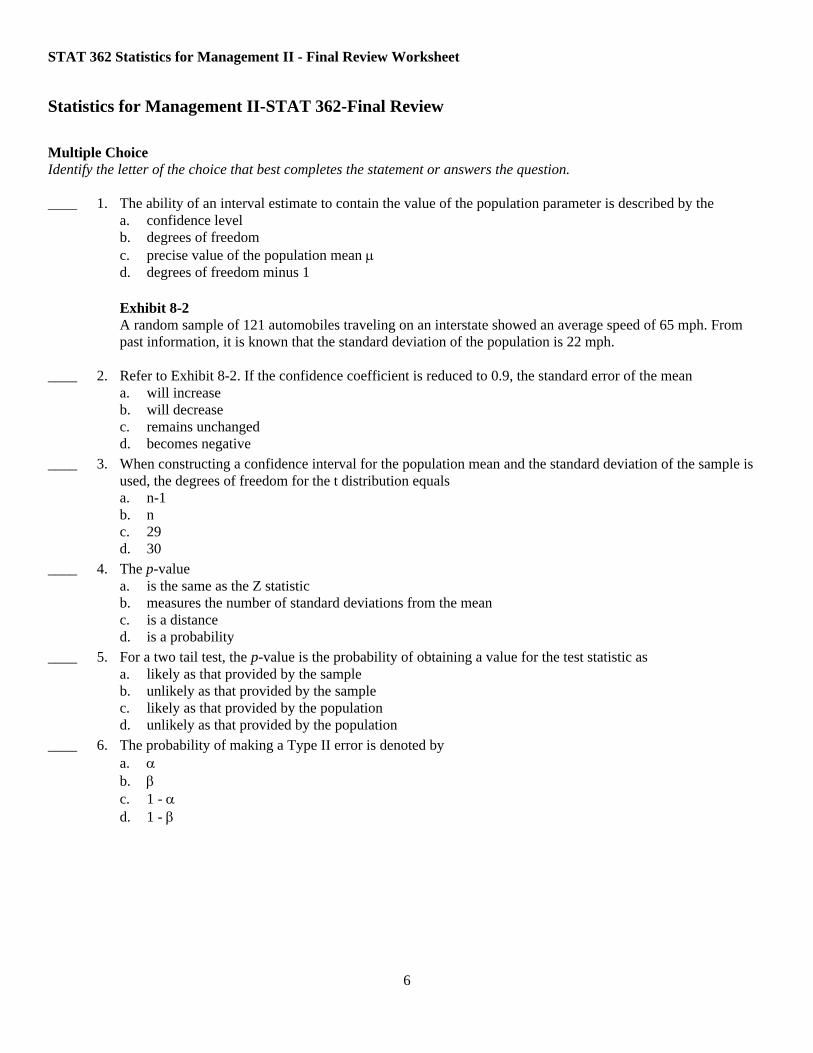
____ 1. The ability of an interval estimate to contain the value of the population parameter is described by thea. confidence levelb. degrees of freedomc. precise value of the population mean µd. degrees of freedom minus 1
Exhibit 8-2A random sample of 121 automobiles traveling on an interstate showed an average speed of 65 mph. From past information, it is known that the standard deviation of the population is 22 mph.
____ 2. Refer to Exhibit 8-2. If the confidence coefficient is reduced to 0.9, the standard error of the meana. will increaseb. will decreasec. remains unchangedd. becomes negative
____ 3. When constructing a confidence interval for the population mean and the standard deviation of the sample is used, the degrees of freedom for the t distribution equalsa. n-1b. nc. 29d. 30
____ 4. The p-valuea. is the same as the Z statisticb. measures the number of standard deviations from the meanc. is a distanced. is a probability
____ 5. For a two tail test, the p-value is the probability of obtaining a value for the test statistic asa. likely as that provided by the sampleb. unlikely as that provided by the samplec. likely as that provided by the populationd. unlikely as that provided by the population
____ 6. The probability of making a Type II error is denoted bya. αb. βc. 1 - αd. 1 - β
STAT 362 Final Review Worksheet
2
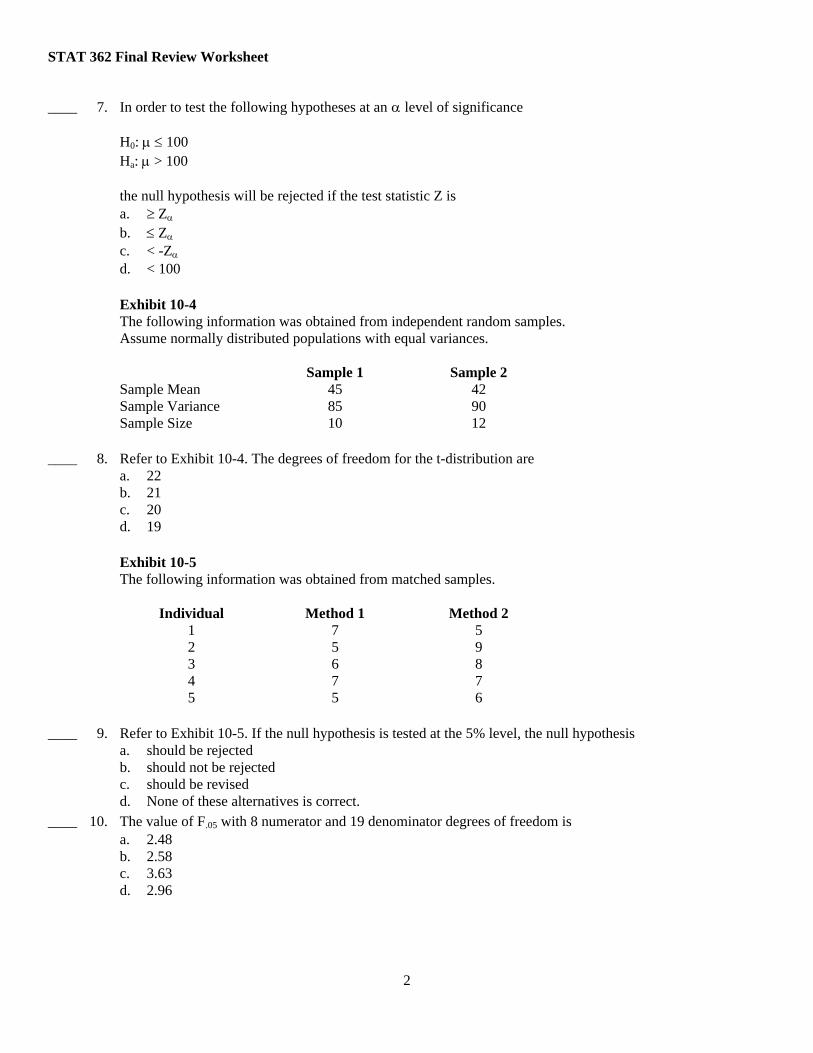
____ 7. In order to test the following hypotheses at an α level of significance
H0: µ ≤ 100Ha: µ > 100
the null hypothesis will be rejected if the test statistic Z isa. ≥ Zα
b. ≤ Zα
c. < -Zα
d. < 100
Exhibit 10-4The following information was obtained from independent random samples.Assume normally distributed populations with equal variances.
Sample 1 Sample 2Sample Mean 45 42Sample Variance 85 90Sample Size 10 12
____ 8. Refer to Exhibit 10-4. The degrees of freedom for the t-distribution area. 22b. 21c. 20d. 19
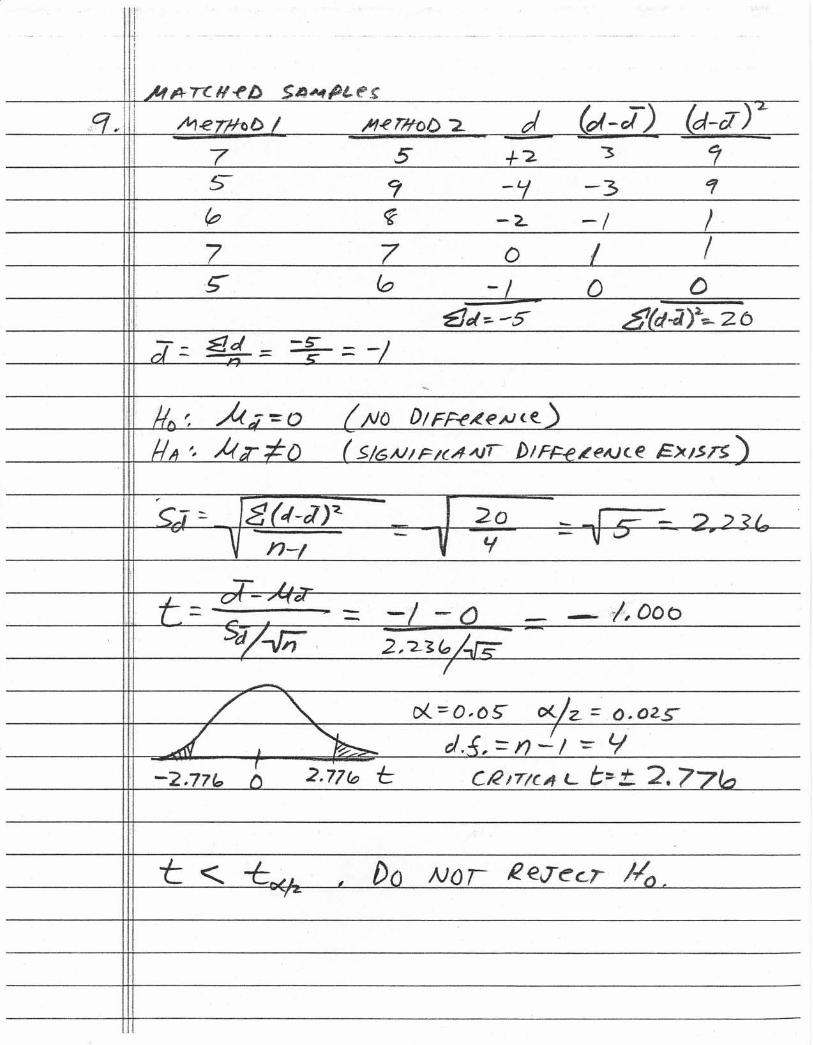
Exhibit 10-5The following information was obtained from matched samples.
Individual Method 1 Method 21 7 52 5 93 6 84 7 75 5 6
____ 9. Refer to Exhibit 10-5. If the null hypothesis is tested at the 5% level, the null hypothesisa. should be rejectedb. should not be rejectedc. should be revisedd. None of these alternatives is correct.
____ 10. The value of F.05 with 8 numerator and 19 denominator degrees of freedom isa. 2.48b. 2.58c. 3.63d. 2.96
STAT 362 Final Review Worksheet
3
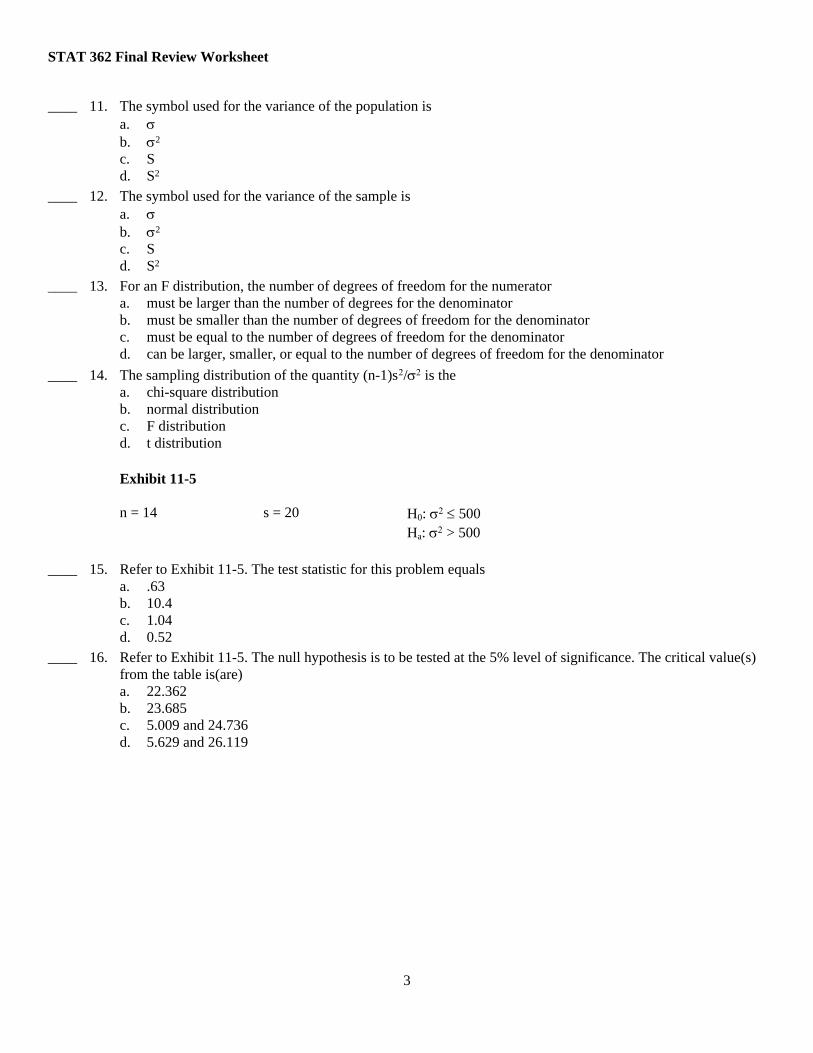
____ 11. The symbol used for the variance of the population isa. σb. σ2
c. Sd. S2
____ 12. The symbol used for the variance of the sample isa. σb. σ2
c. Sd. S2
____ 13. For an F distribution, the number of degrees of freedom for the numeratora. must be larger than the number of degrees for the denominatorb. must be smaller than the number of degrees of freedom for the denominatorc. must be equal to the number of degrees of freedom for the denominatord. can be larger, smaller, or equal to the number of degrees of freedom for the denominator
____ 14. The sampling distribution of the quantity (n-1)s2/σ2 is thea. chi-square distributionb. normal distributionc. F distributiond. t distribution
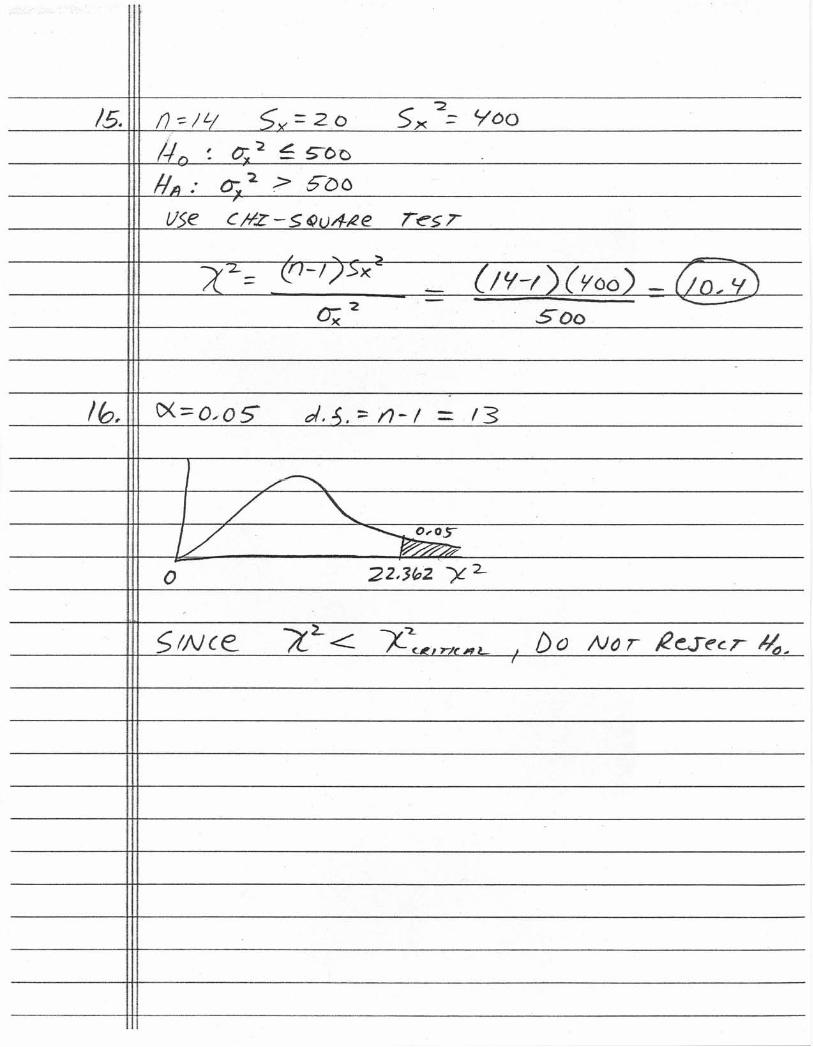
Exhibit 11-5
n = 14 s = 20 H0: σ2 ≤ 500Ha: σ2 > 500
____ 15. Refer to Exhibit 11-5. The test statistic for this problem equalsa. .63b. 10.4c. 1.04d. 0.52
____ 16. Refer to Exhibit 11-5. The null hypothesis is to be tested at the 5% level of significance. The critical value(s) from the table is(are)a. 22.362b. 23.685c. 5.009 and 24.736d. 5.629 and 26.119
STAT 362 Final Review Worksheet
4
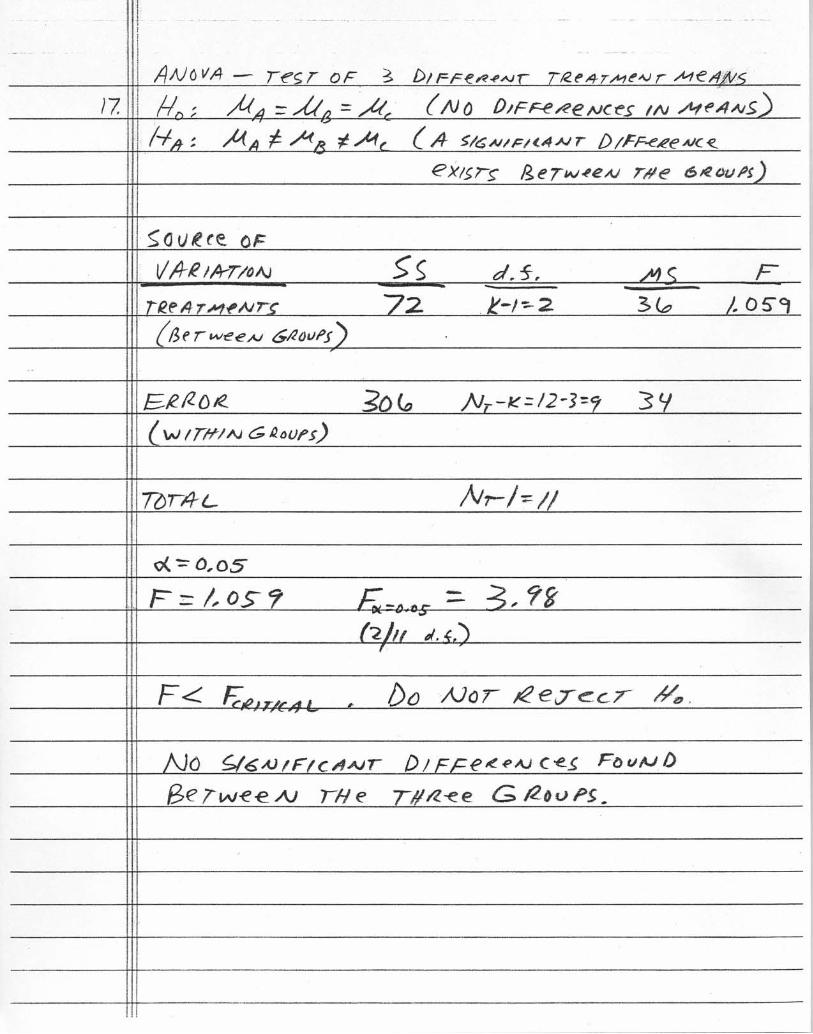
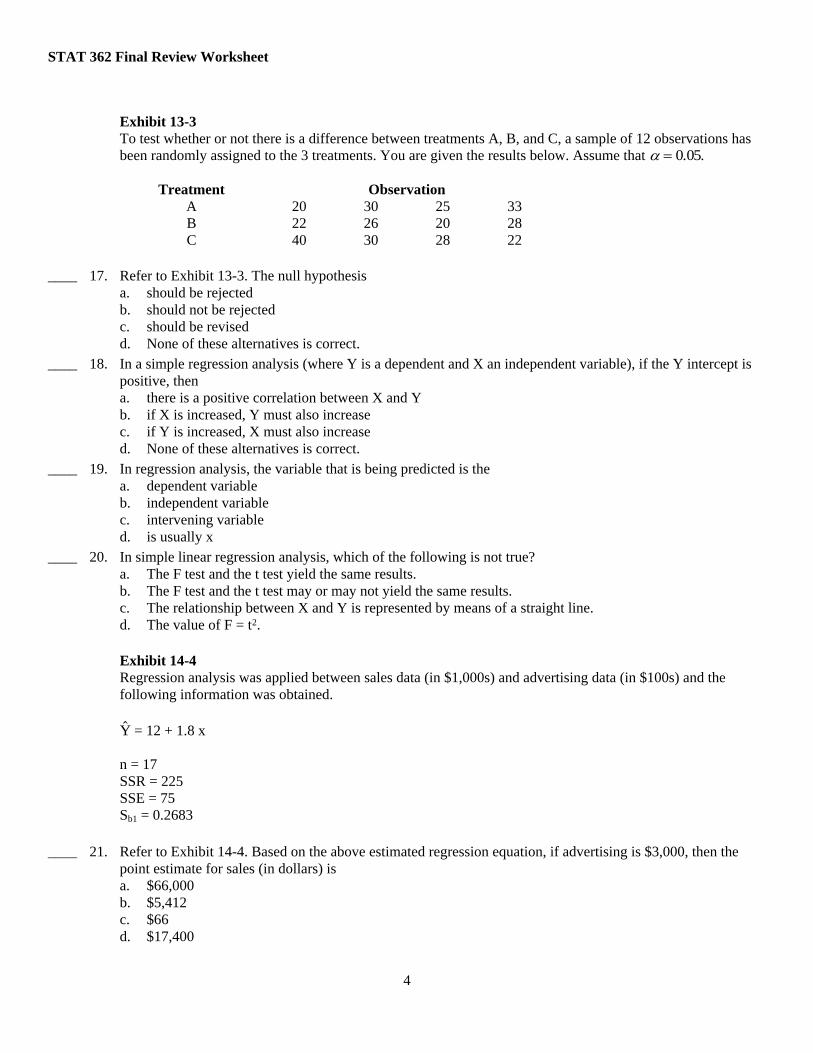
Exhibit 13-3To test whether or not there is a difference between treatments A, B, and C, a sample of 12 observations has been randomly assigned to the 3 treatments. You are given the results below. Assume that α = 0.05.
Treatment ObservationA 20 30 25 33B 22 26 20 28C 40 30 28 22
____ 17. Refer to Exhibit 13-3. The null hypothesisa. should be rejectedb. should not be rejectedc. should be revisedd. None of these alternatives is correct.
____ 18. In a simple regression analysis (where Y is a dependent and X an independent variable), if the Y intercept is positive, thena. there is a positive correlation between X and Yb. if X is increased, Y must also increasec. if Y is increased, X must also increased. None of these alternatives is correct.
____ 19. In regression analysis, the variable that is being predicted is thea. dependent variableb. independent variablec. intervening variabled. is usually x
____ 20. In simple linear regression analysis, which of the following is not true?a. The F test and the t test yield the same results.b. The F test and the t test may or may not yield the same results.c. The relationship between X and Y is represented by means of a straight line.d. The value of F = t2.
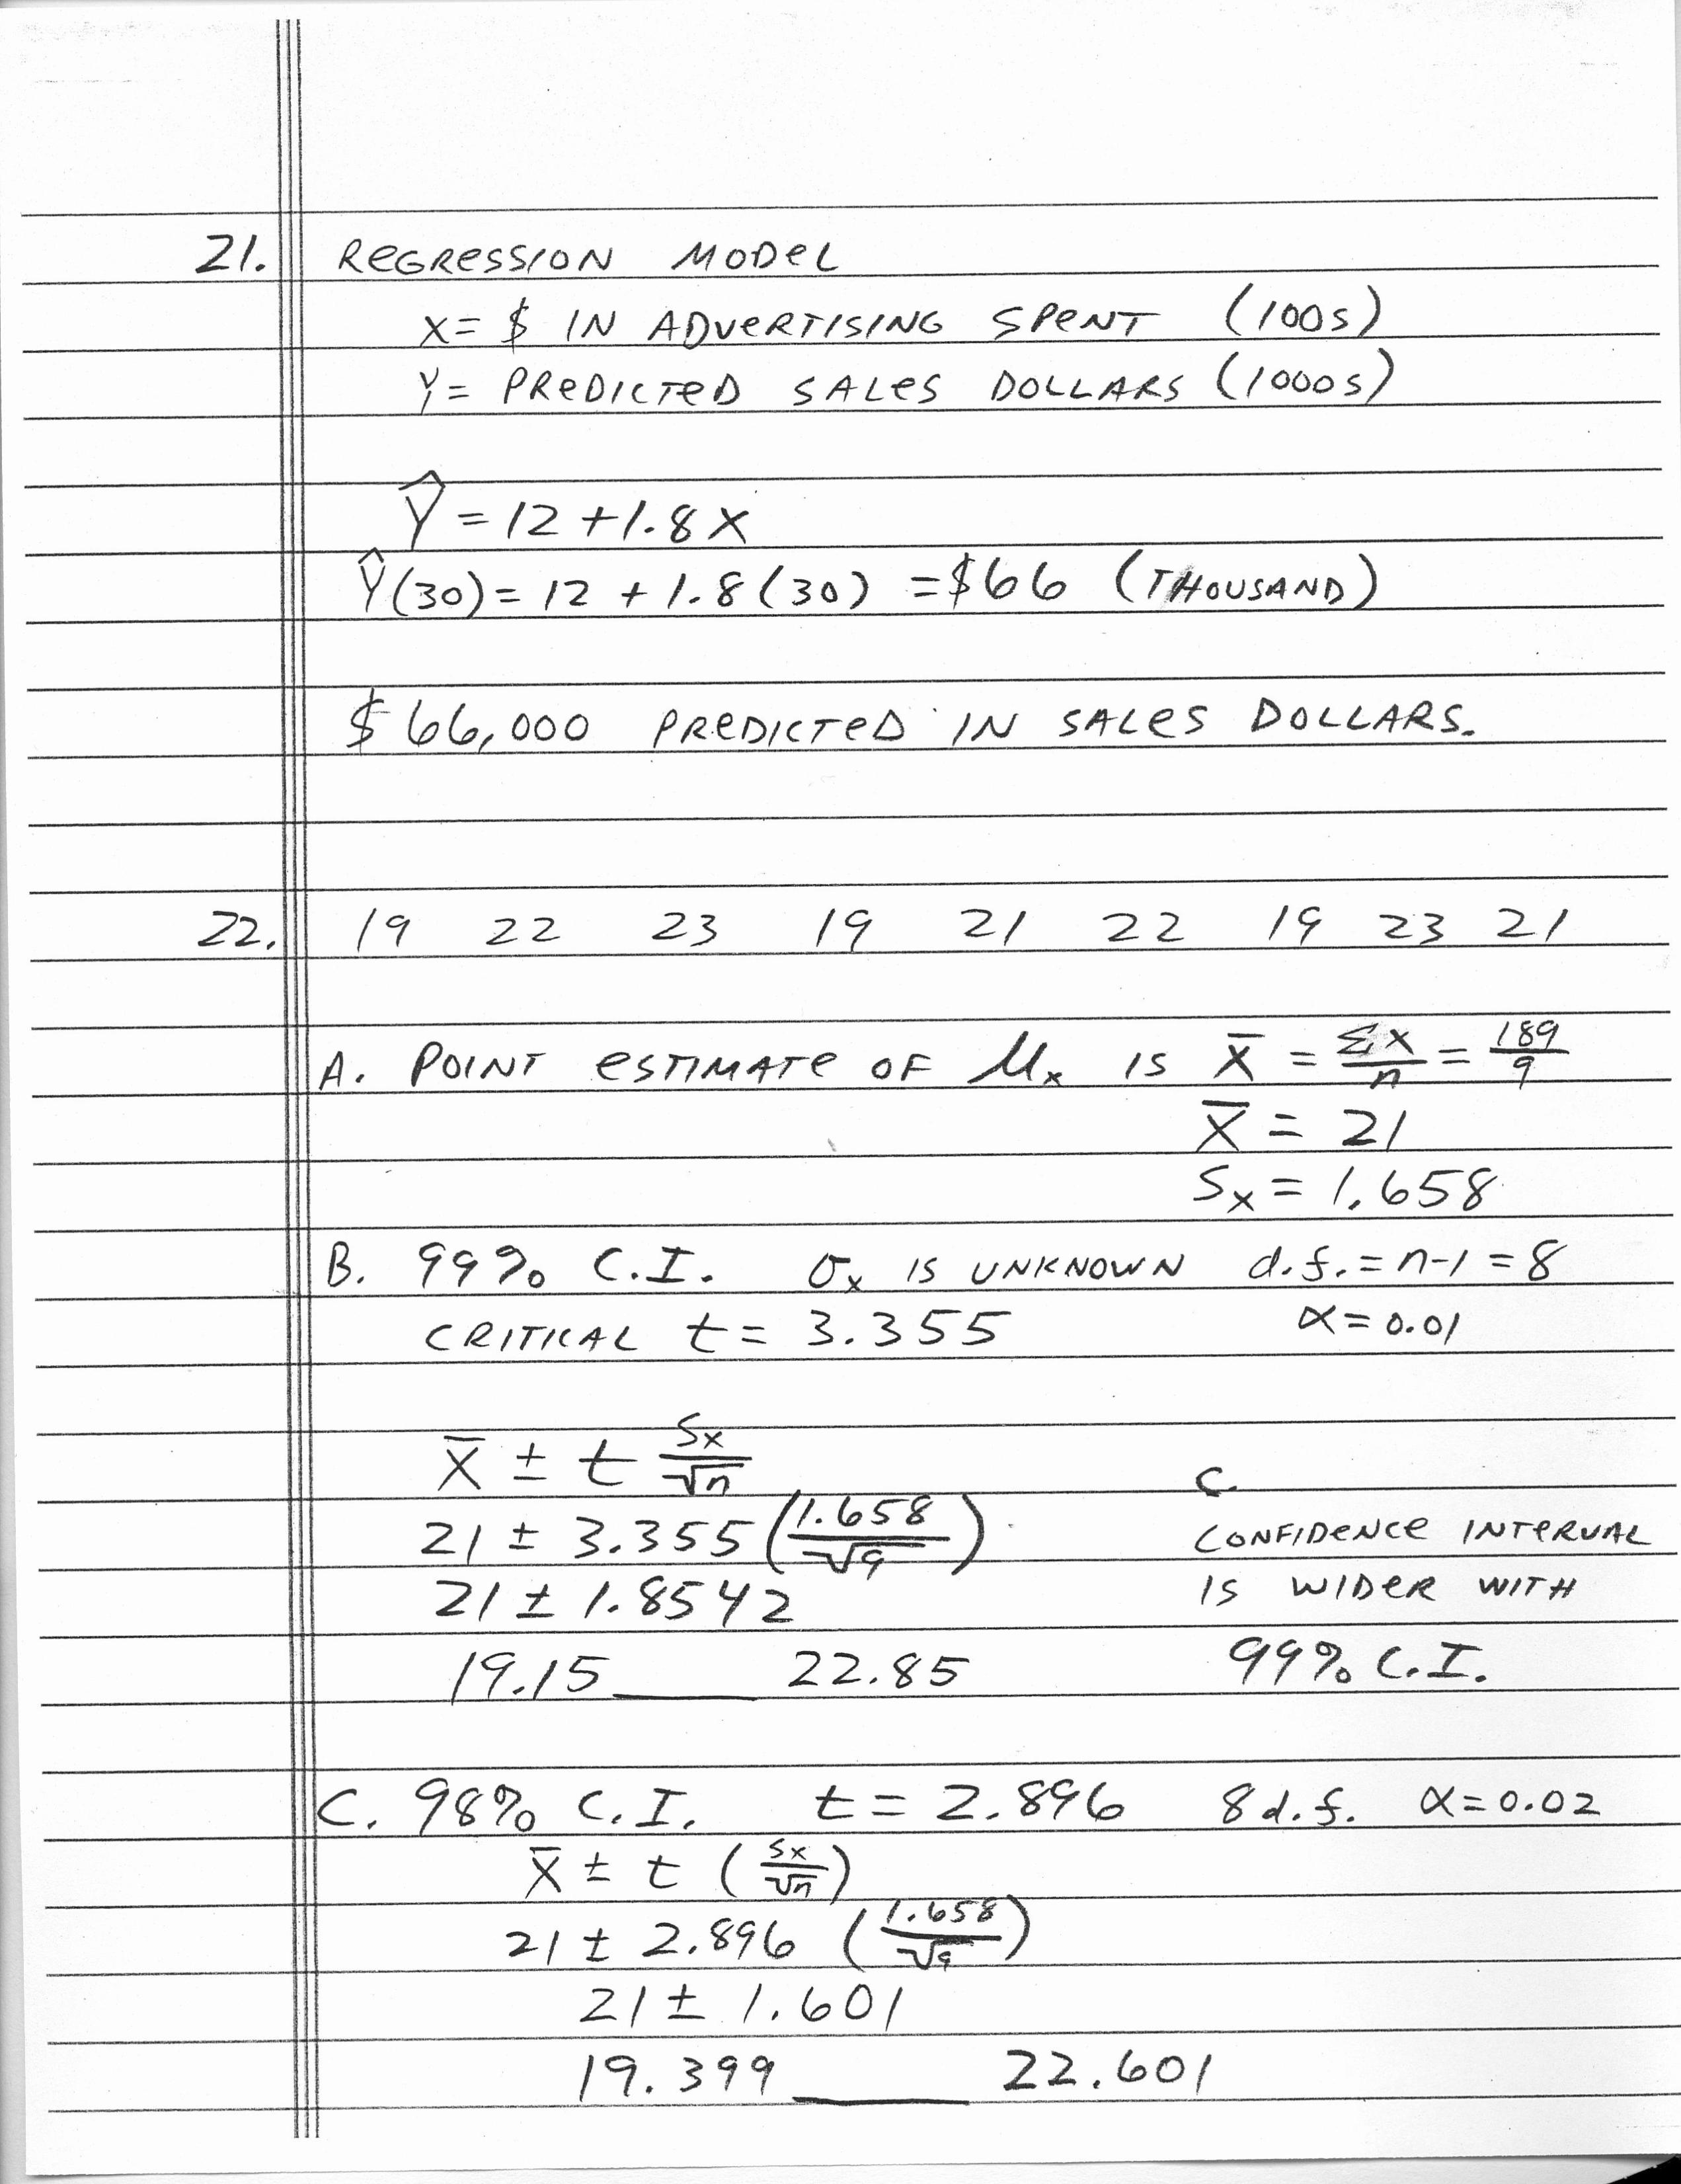
Exhibit 14-4Regression analysis was applied between sales data (in $1,000s) and advertising data (in $100s) and the following information was obtained.
Y8 = 12 + 1.8 x
n = 17SSR = 225SSE = 75Sb1 = 0.2683
____ 21. Refer to Exhibit 14-4. Based on the above estimated regression equation, if advertising is $3,000, then the point estimate for sales (in dollars) isa. $66,000b. $5,412c. $66d. $17,400
STAT 362 Final Review Worksheet
5
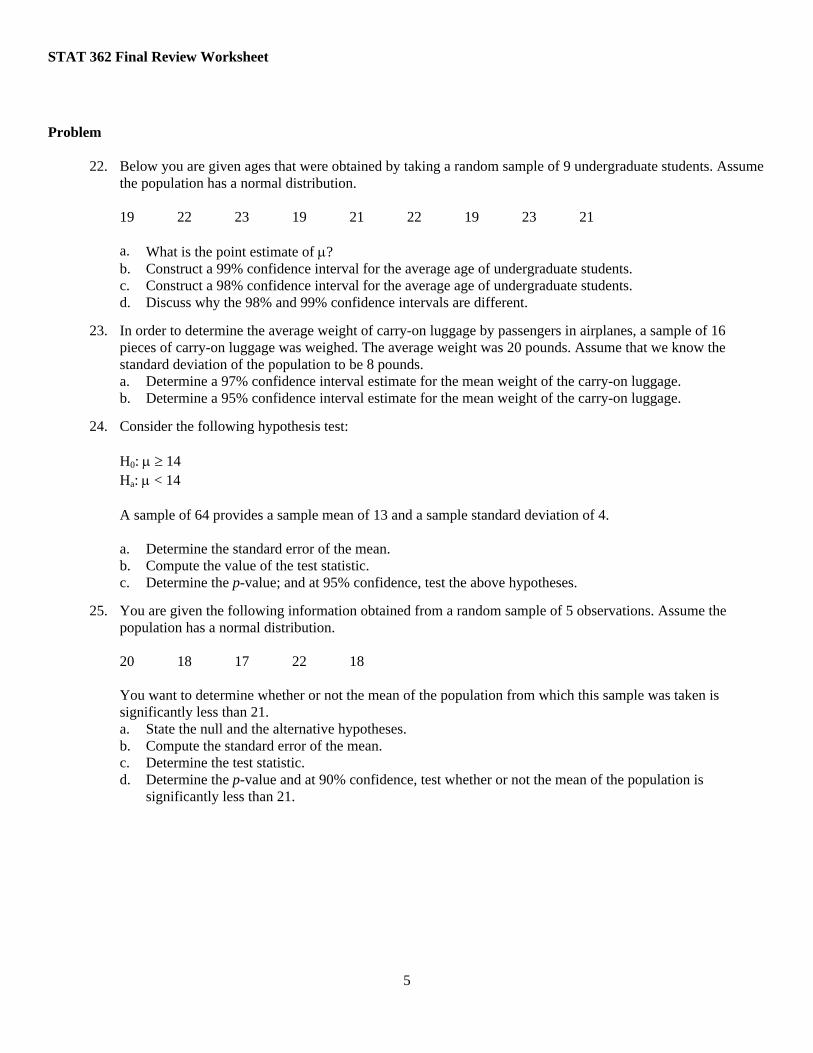
Problem
22. Below you are given ages that were obtained by taking a random sample of 9 undergraduate students. Assume the population has a normal distribution.
19 22 23 19 21 22 19 23 21
a. What is the point estimate of µ?b. Construct a 99% confidence interval for the average age of undergraduate students.c. Construct a 98% confidence interval for the average age of undergraduate students.d. Discuss why the 98% and 99% confidence intervals are different.
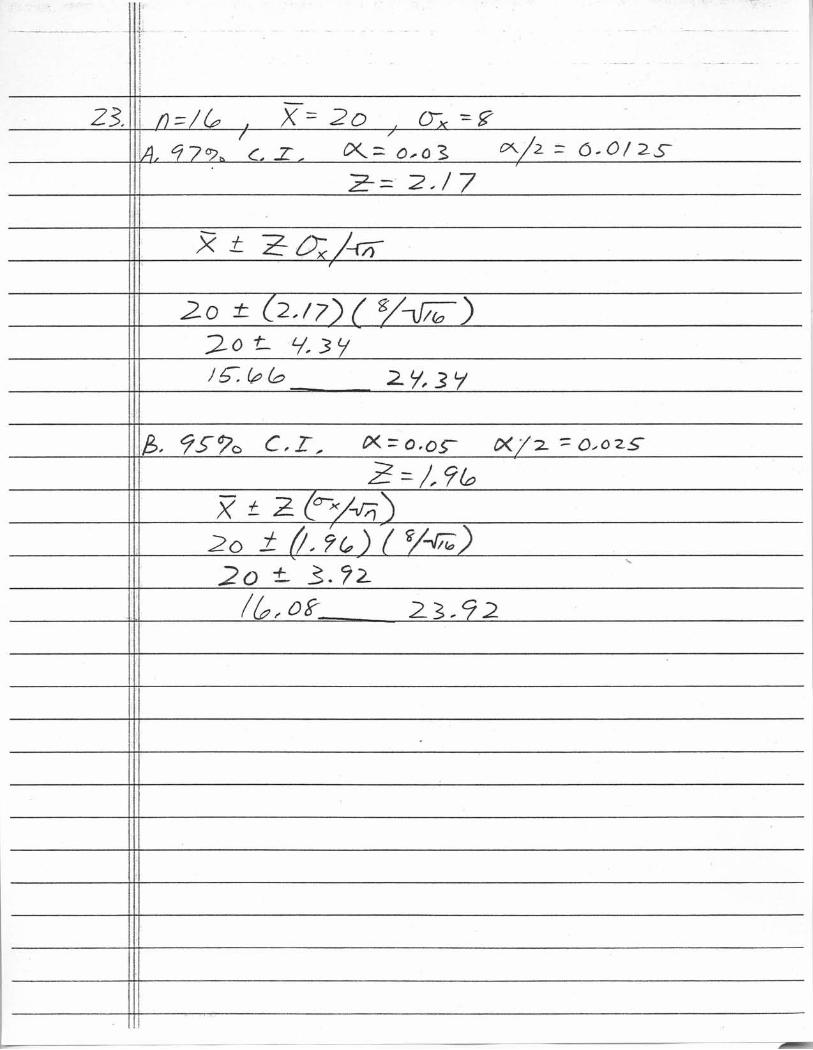
23. In order to determine the average weight of carry-on luggage by passengers in airplanes, a sample of 16 pieces of carry-on luggage was weighed. The average weight was 20 pounds. Assume that we know the standard deviation of the population to be 8 pounds.a. Determine a 97% confidence interval estimate for the mean weight of the carry-on luggage.b. Determine a 95% confidence interval estimate for the mean weight of the carry-on luggage.
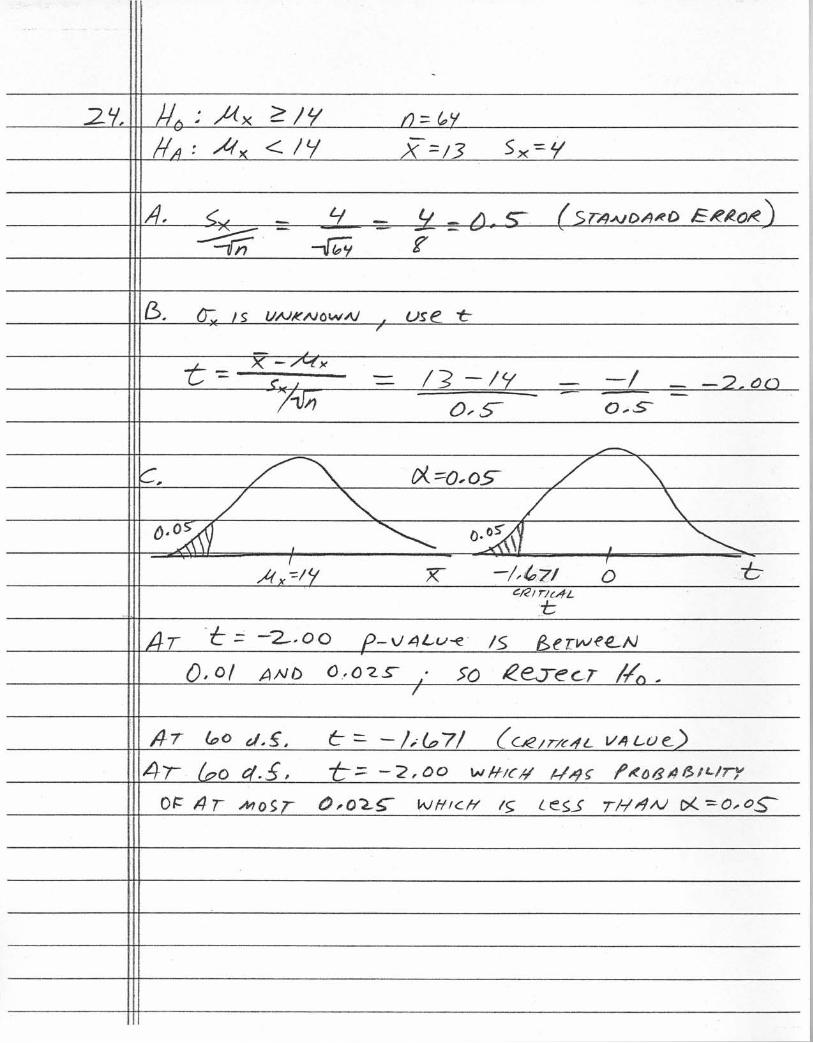
24. Consider the following hypothesis test:
H0: µ ≥ 14Ha: µ < 14
A sample of 64 provides a sample mean of 13 and a sample standard deviation of 4.
a. Determine the standard error of the mean.b. Compute the value of the test statistic.c. Determine the p-value; and at 95% confidence, test the above hypotheses.
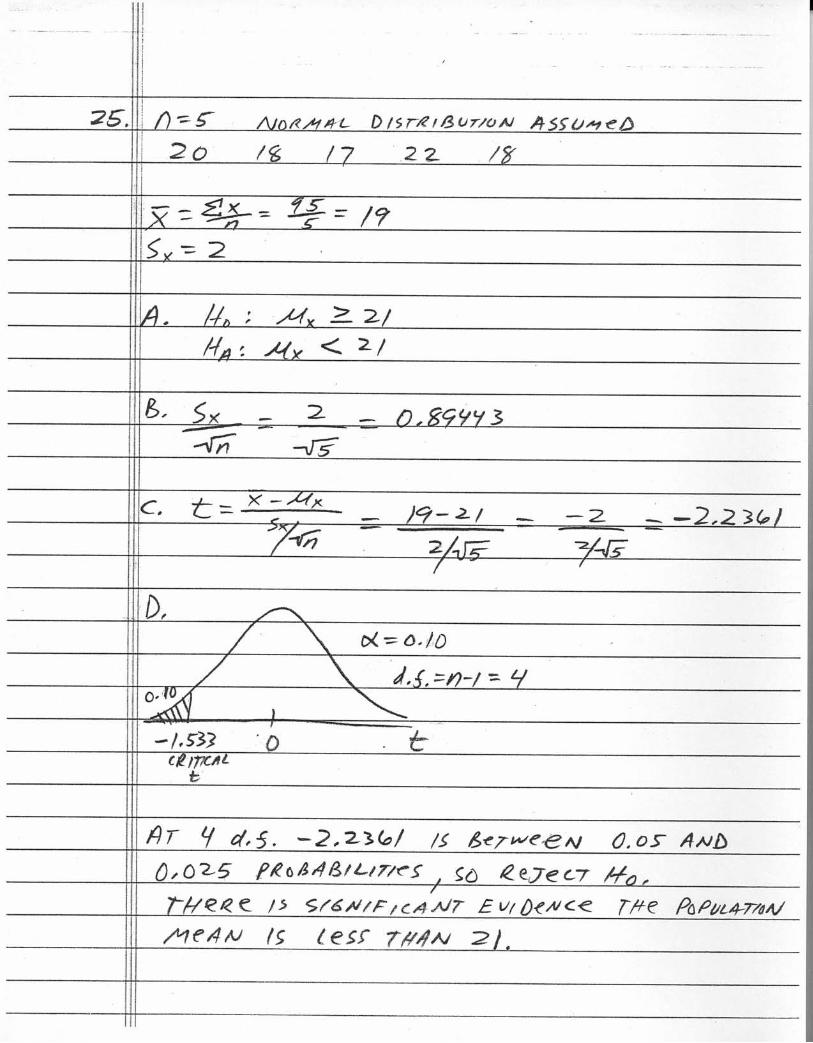
25. You are given the following information obtained from a random sample of 5 observations. Assume the population has a normal distribution.
20 18 17 22 18
You want to determine whether or not the mean of the population from which this sample was taken is significantly less than 21.a. State the null and the alternative hypotheses.b. Compute the standard error of the mean.c. Determine the test statistic.d. Determine the p-value and at 90% confidence, test whether or not the mean of the population is
significantly less than 21.
STAT 362 Final Review Worksheet
6
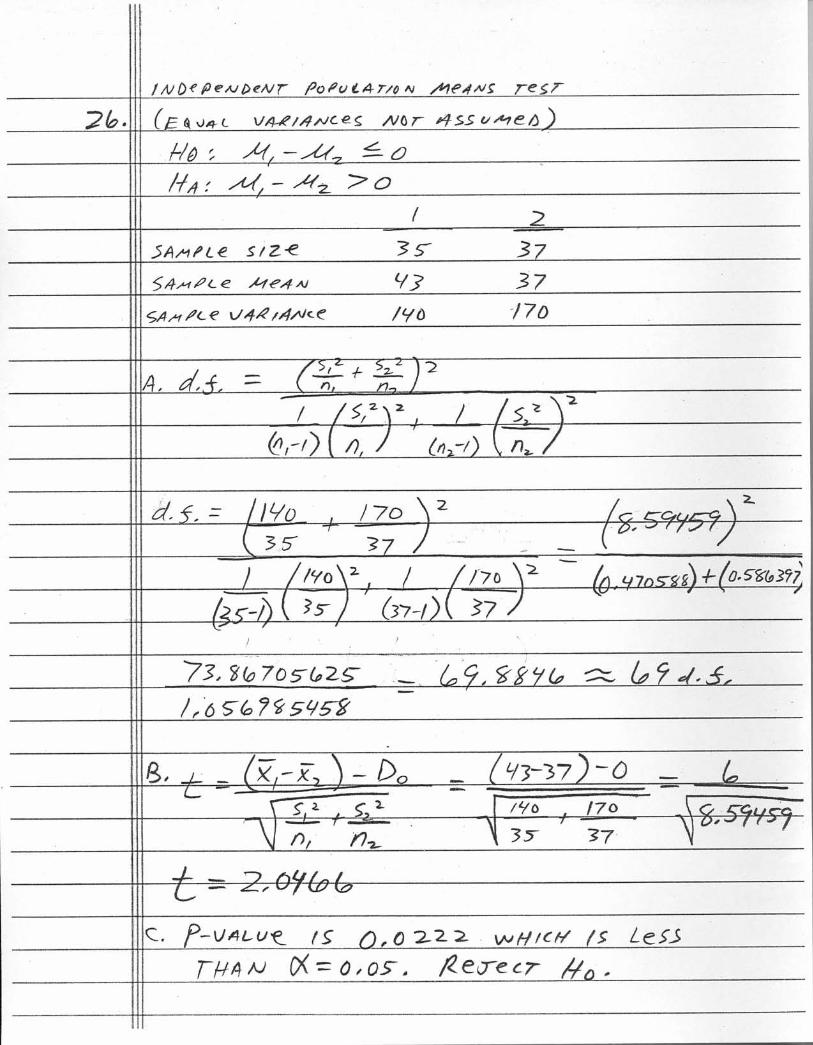
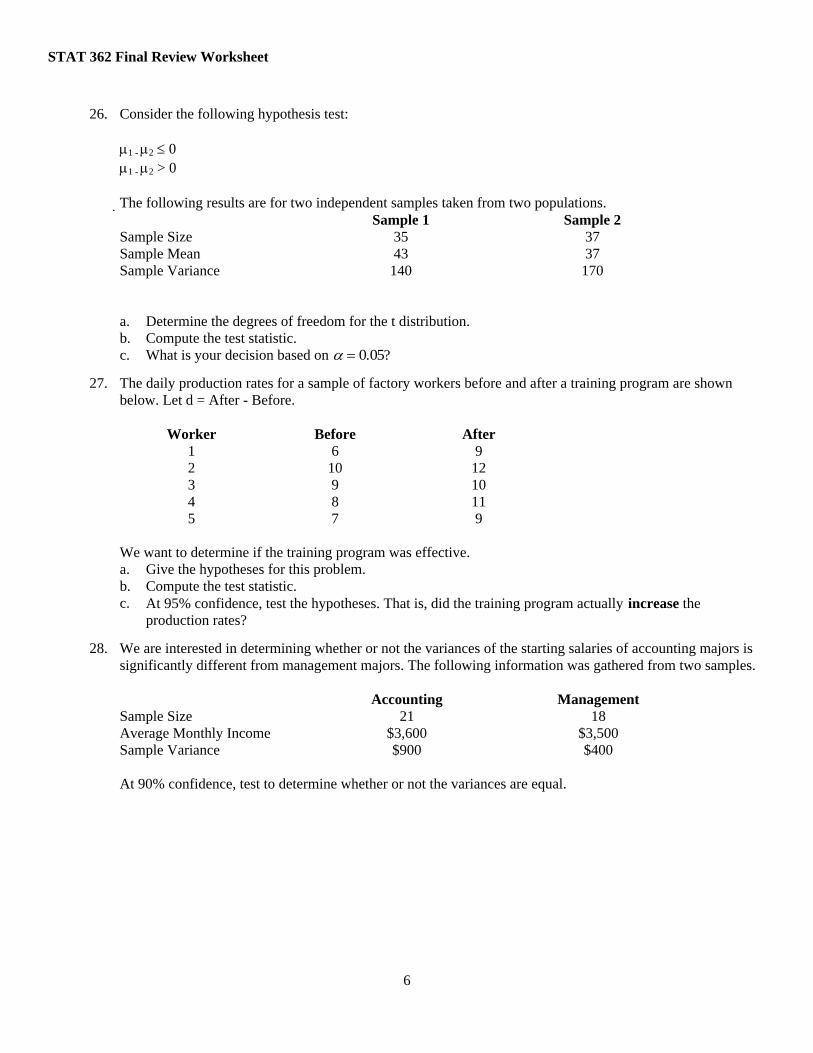
26. Consider the following hypothesis test:
µ1 - µ2 ≤ 0µ1 - µ2 > 0
The following results are for two independent samples taken from two populations.Sample 1 Sample 2
Sample Size 35 37Sample Mean 43 37Sample Variance 140 170
a. Determine the degrees of freedom for the t distribution.b. Compute the test statistic.c. What is your decision based on α = 0.05?
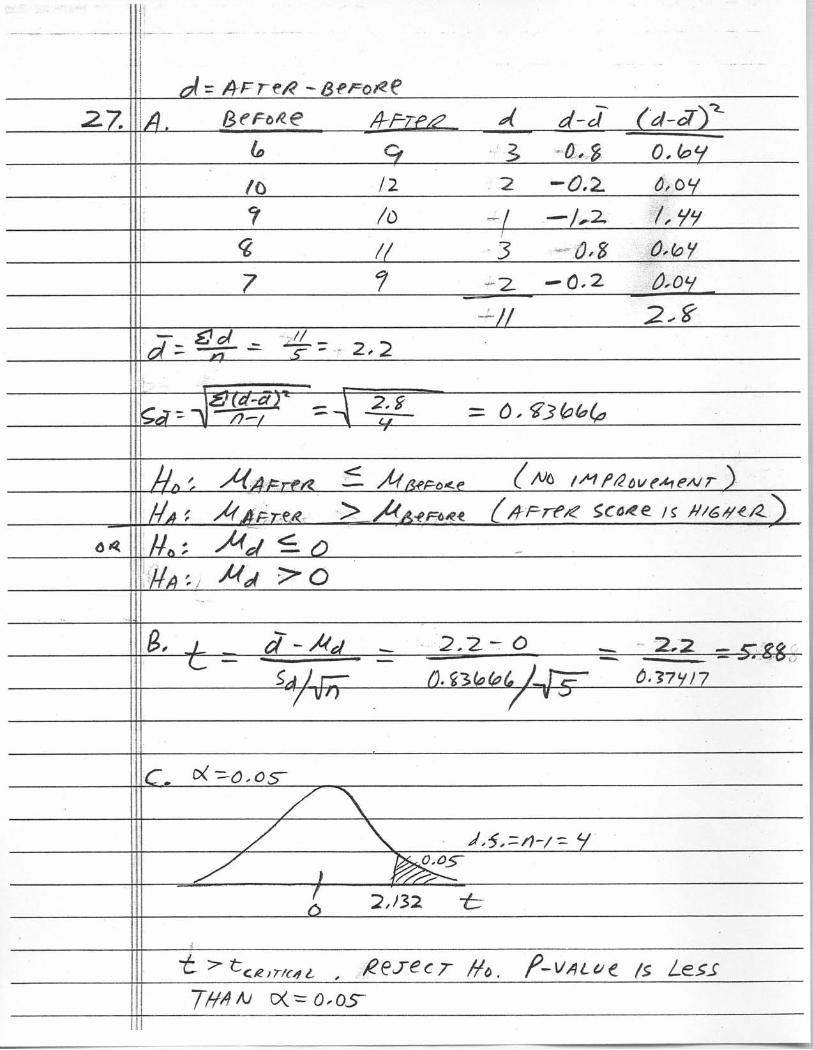
27. The daily production rates for a sample of factory workers before and after a training program are shown below. Let d = After - Before.
Worker Before After1 6 92 10 123 9 104 8 115 7 9
We want to determine if the training program was effective.a. Give the hypotheses for this problem.b. Compute the test statistic.c. At 95% confidence, test the hypotheses. That is, did the training program actually increase the
production rates?
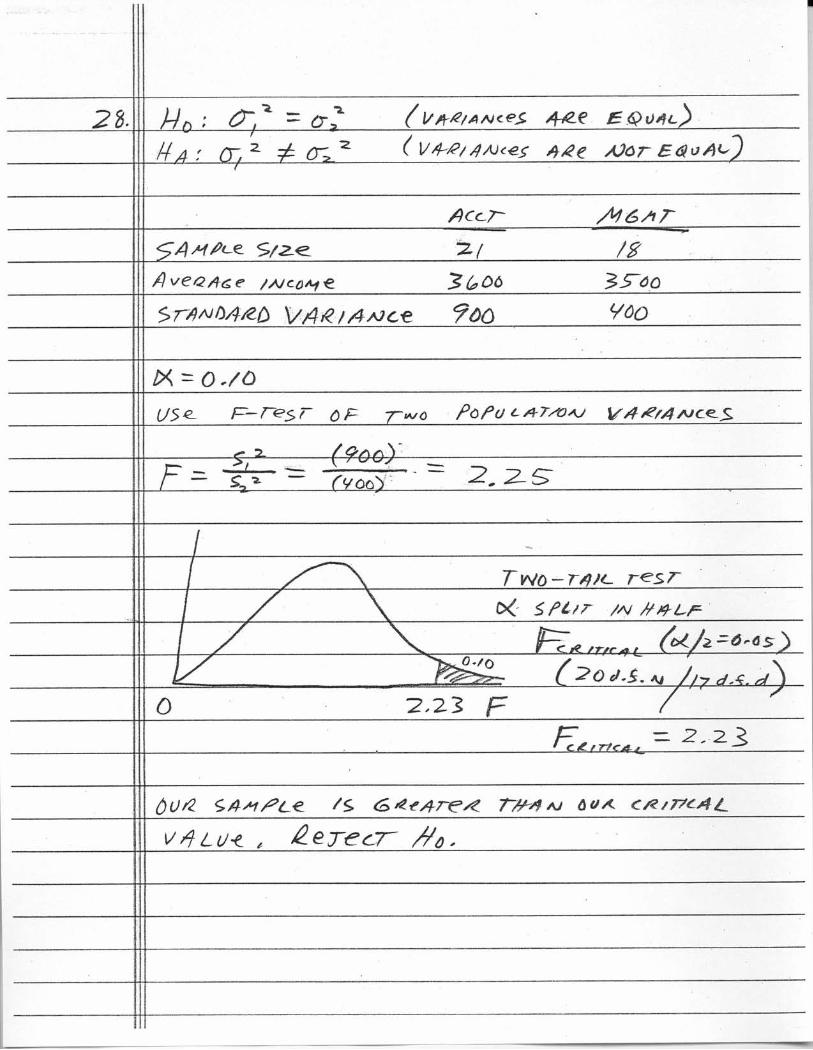
28. We are interested in determining whether or not the variances of the starting salaries of accounting majors is significantly different from management majors. The following information was gathered from two samples.
Accounting ManagementSample Size 21 18Average Monthly Income $3,600 $3,500Sample Variance $900 $400
At 90% confidence, test to determine whether or not the variances are equal.
STAT 362 Final Review Worksheet
7
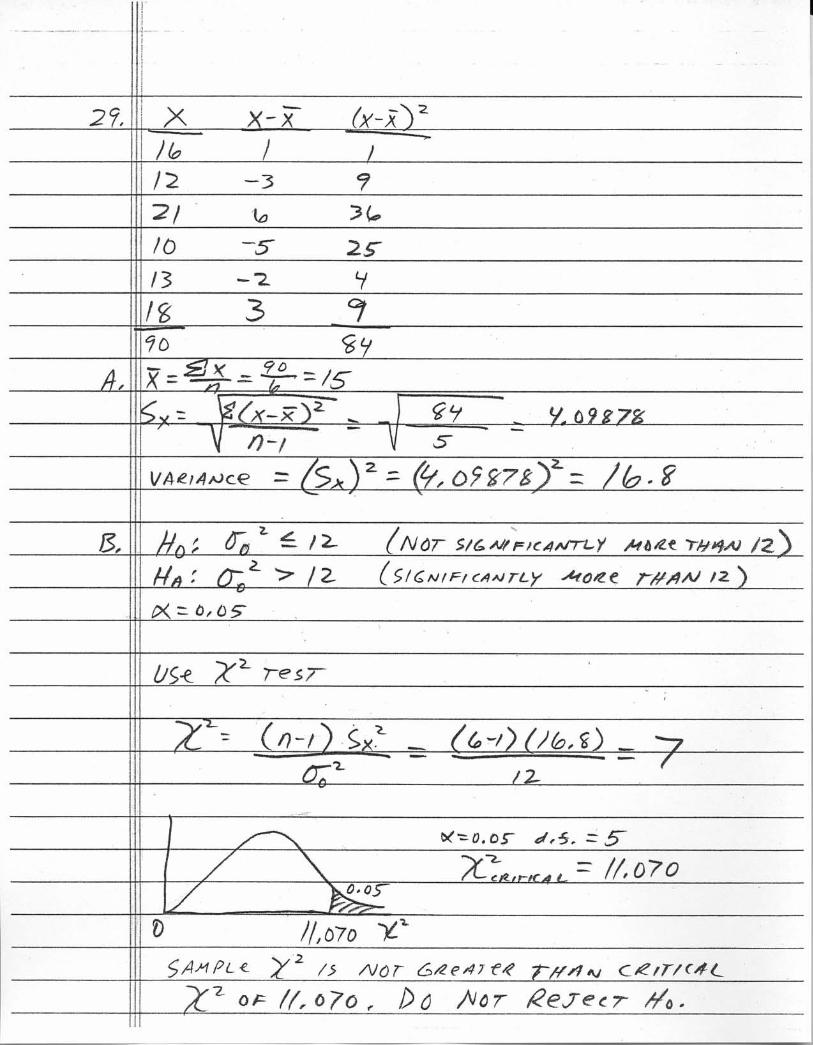
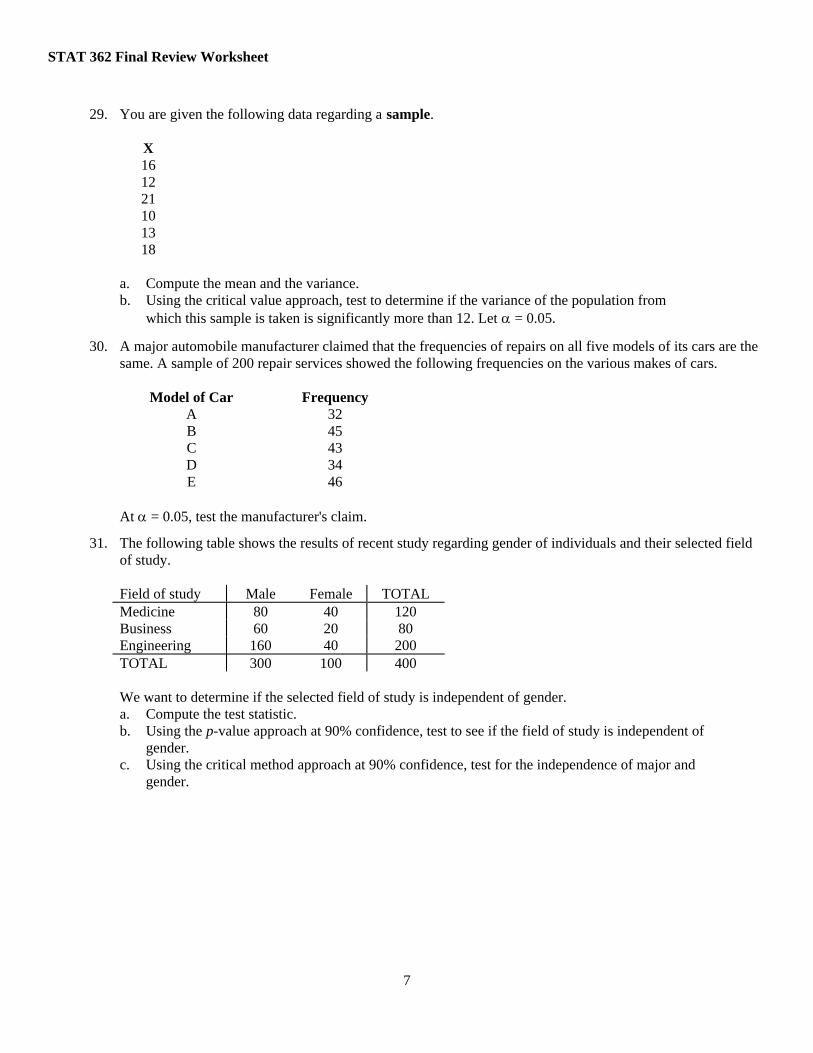
29. You are given the following data regarding a sample.
X161221101318
a. Compute the mean and the variance.b. Using the critical value approach, test to determine if the variance of the population from
which this sample is taken is significantly more than 12. Let α = 0.05.
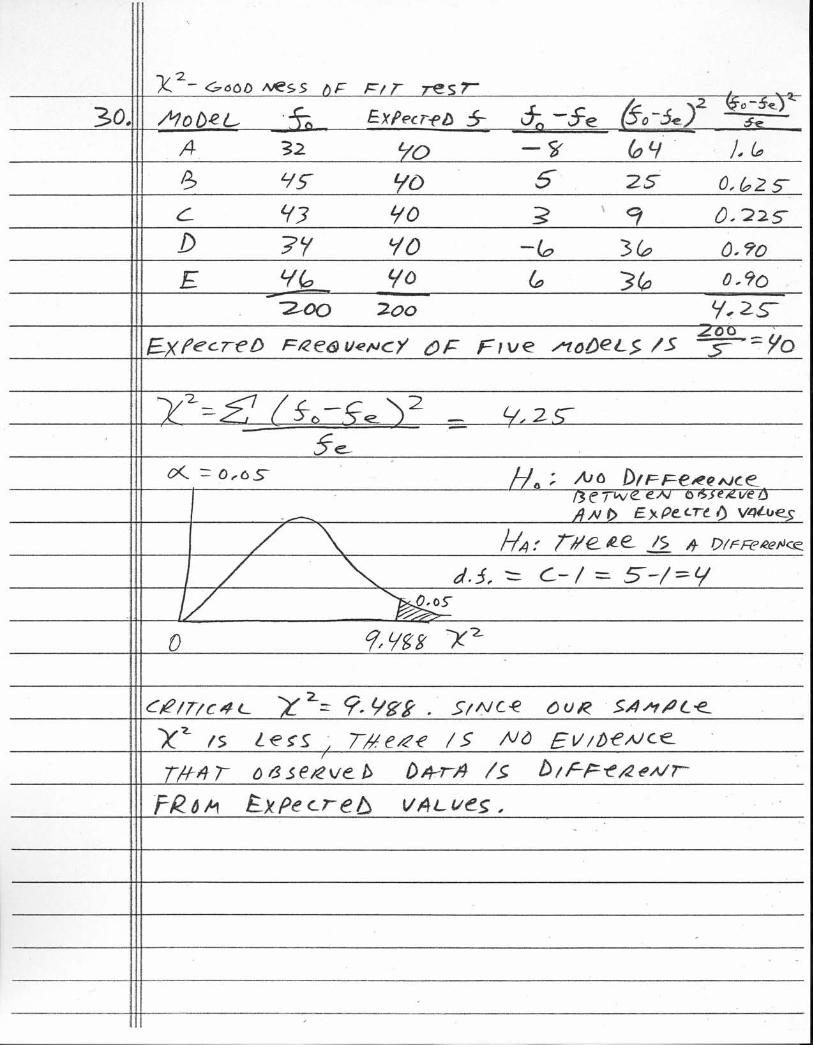
30. A major automobile manufacturer claimed that the frequencies of repairs on all five models of its cars are the same. A sample of 200 repair services showed the following frequencies on the various makes of cars.
Model of Car FrequencyA 32B 45C 43D 34E 46
At α = 0.05, test the manufacturer's claim.
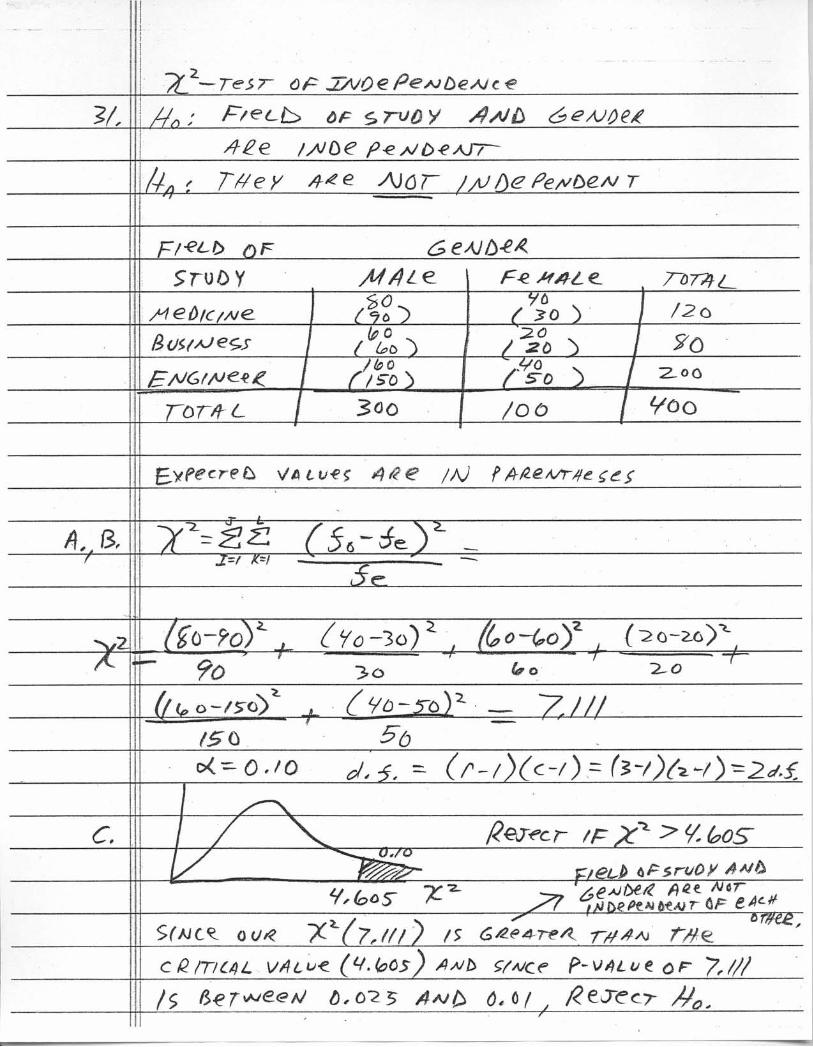
31. The following table shows the results of recent study regarding gender of individuals and their selected field of study.
Field of study Male Female TOTALMedicine 80 40 120Business 60 20 80Engineering 160 40 200TOTAL 300 100 400
We want to determine if the selected field of study is independent of gender.a. Compute the test statistic.b. Using the p-value approach at 90% confidence, test to see if the field of study is independent of
gender.c. Using the critical method approach at 90% confidence, test for the independence of major and
gender.
STAT 362 Final Review Worksheet
8
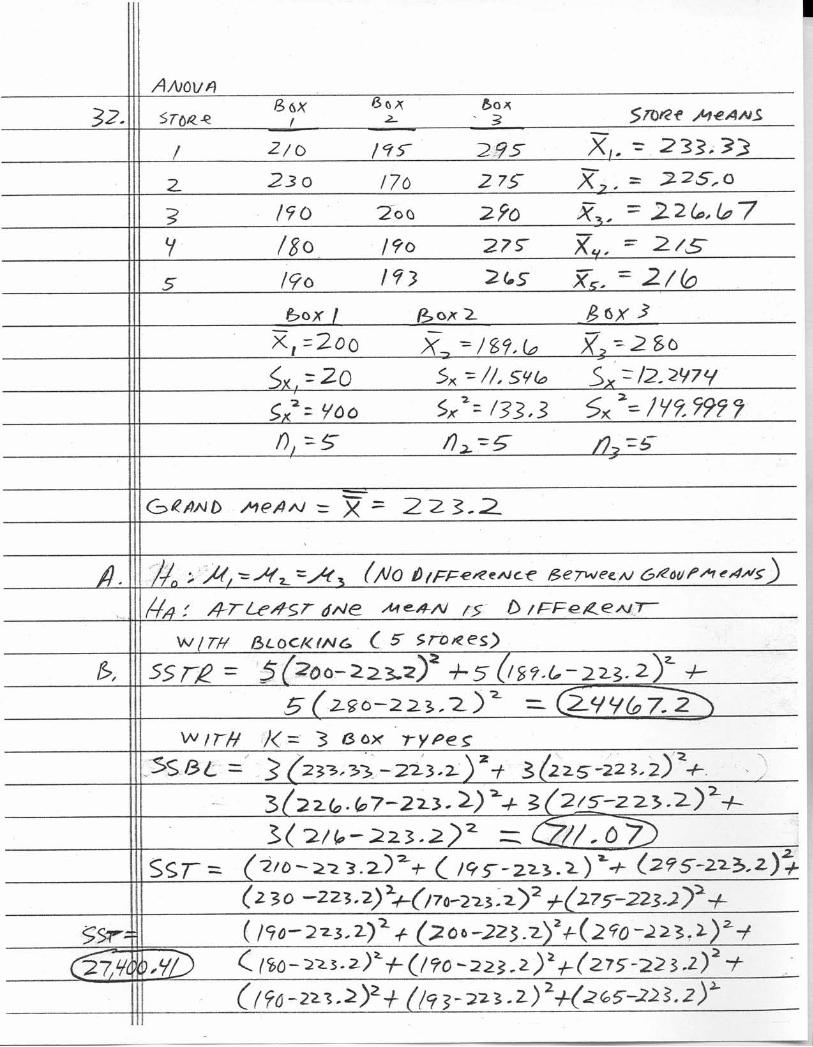
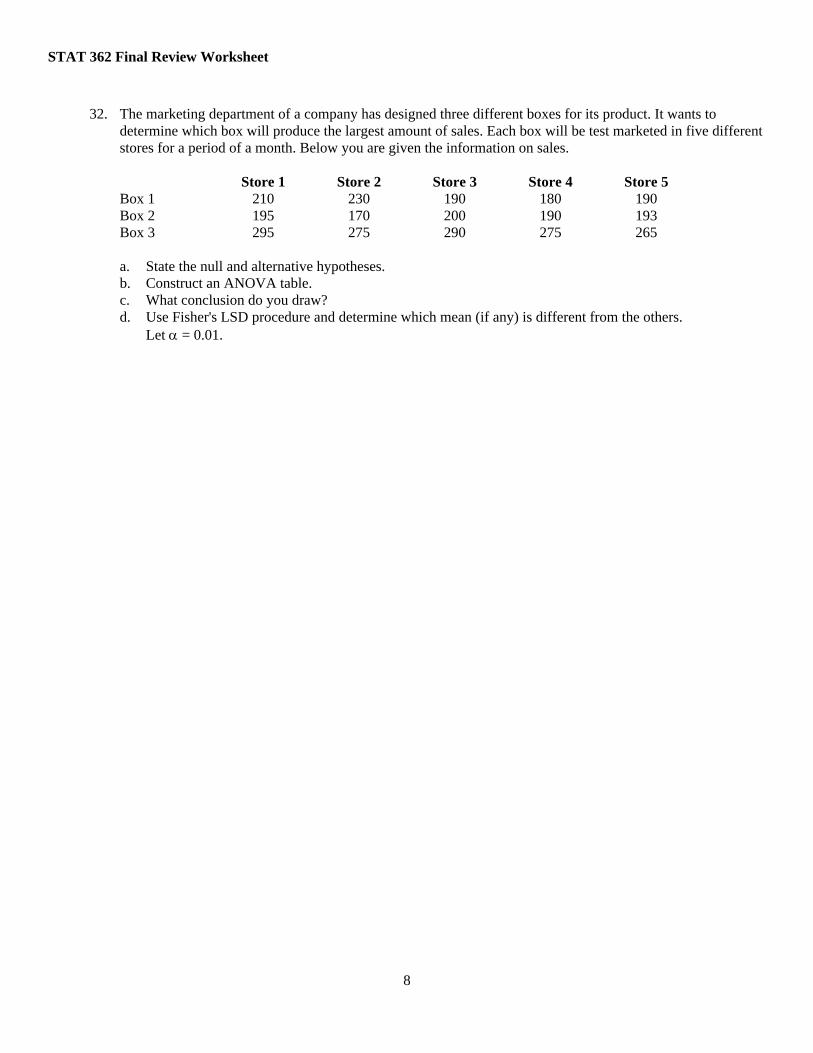
32. The marketing department of a company has designed three different boxes for its product. It wants to determine which box will produce the largest amount of sales. Each box will be test marketed in five different stores for a period of a month. Below you are given the information on sales.
Store 1 Store 2 Store 3 Store 4 Store 5Box 1 210 230 190 180 190Box 2 195 170 200 190 193Box 3 295 275 290 275 265
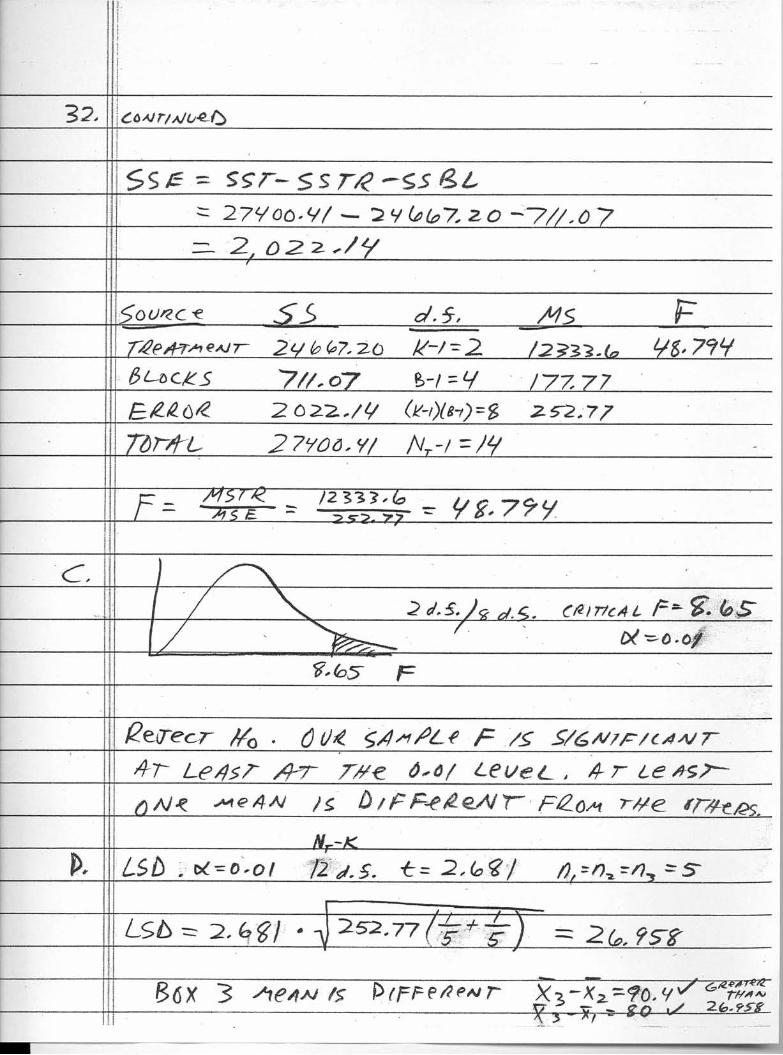
a. State the null and alternative hypotheses.b. Construct an ANOVA table.c. What conclusion do you draw?d. Use Fisher's LSD procedure and determine which mean (if any) is different from the others.
Let α = 0.01.