Embed Size (px)
Citation preview
Statistical thinking: aims and school practice
Ivan Vysotskiy
Moscow Center for Continuous Mathematical Education,
National Unvt ‘Higher School of Economics’
KKU, 18 Nov 2019
29
.11
.20
19
1
Introduction. What is statistics and how is it related to probability theory
It is impossible to manage a state, a city, a company, and even a school, if there is no reliable statistical information.
A pilot who ignores his dashboard does live happily but not long.
29
.11
.20
19
2
The science that deals with the methods of collecting, processing and presenting of data is called statistics. This name was first used by the German scientist Gottfried Aachenwal. The word "statistics" itself comes from the Latin word status means state, state of affairs.
.
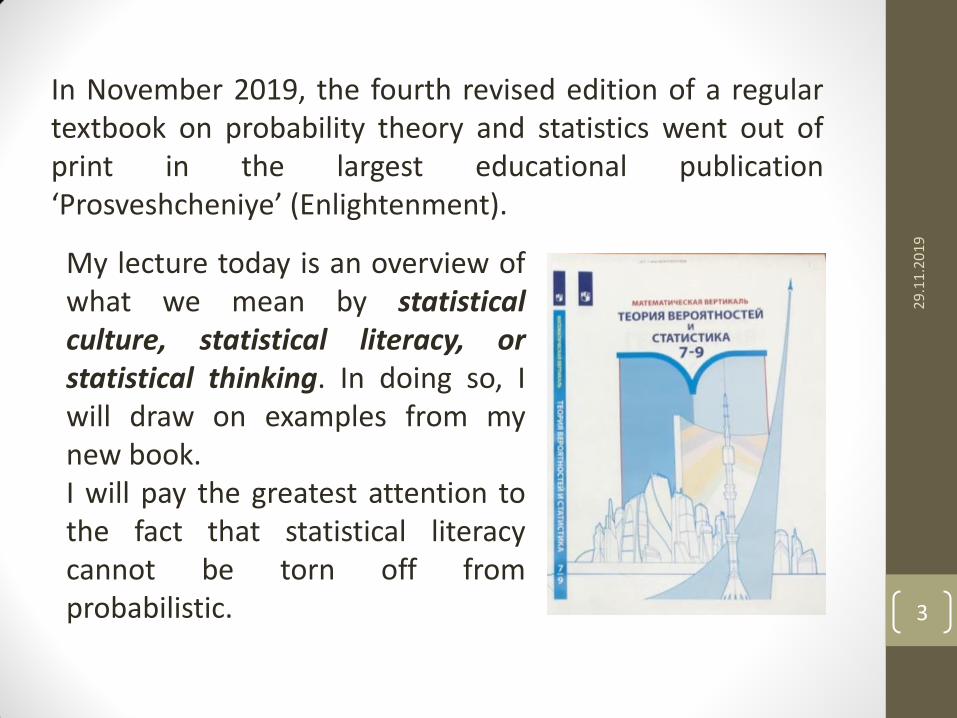
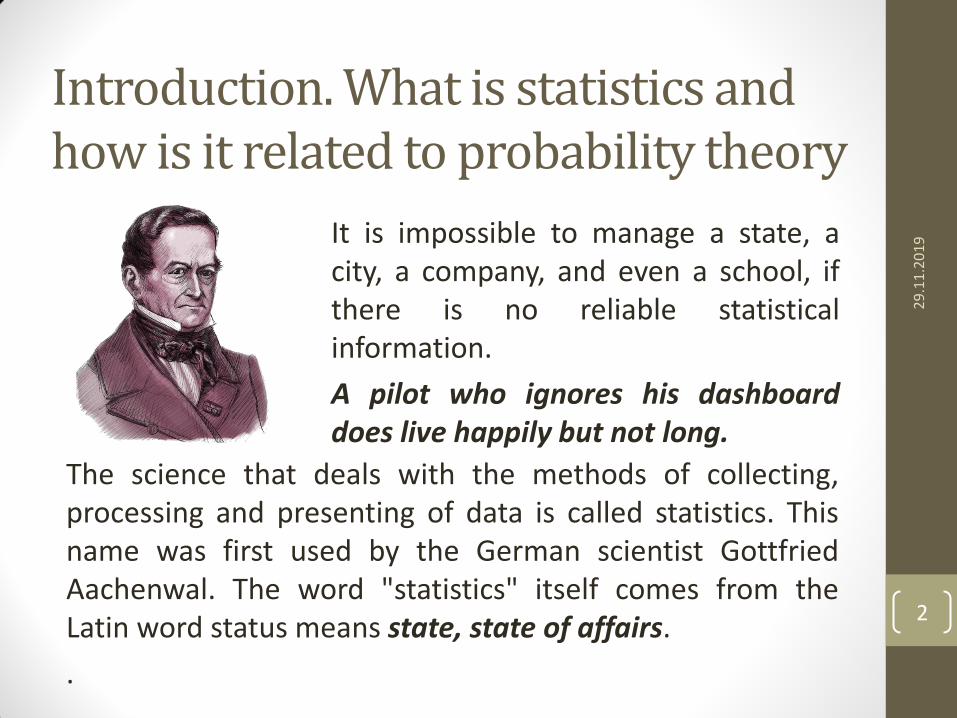
In November 2019, the fourth revised edition of a regular textbook on probability theory and statistics went out of print in the largest educational publication ‘Prosveshcheniye’ (Enlightenment).
29
.11
.20
19
3
My lecture today is an overview of what we mean by statistical culture, statistical literacy, or statistical thinking. In doing so, I will draw on examples from my new book. I will pay the greatest attention to the fact that statistical literacy cannot be torn off from probabilistic.
29
.11
.20
19
4
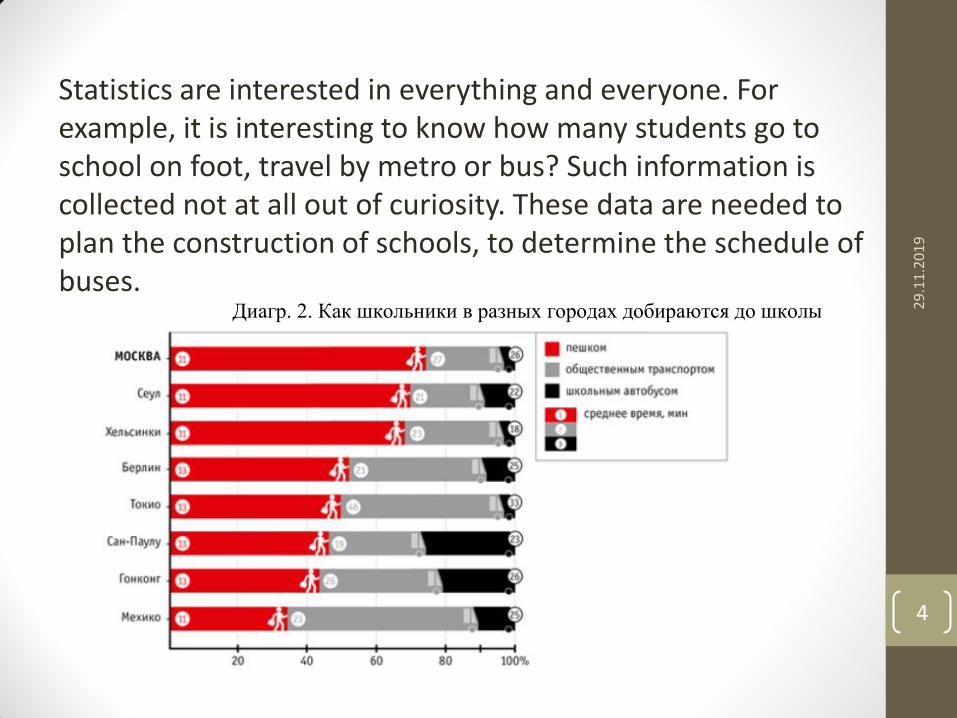
Statistics are interested in everything and everyone. For example, it is interesting to know how many students go to school on foot, travel by metro or bus? Such information is collected not at all out of curiosity. These data are needed to plan the construction of schools, to determine the schedule of buses.
Диагр. 2. Как школьники в разных городах добираются до школы

For a long time, the idea of determinism prevailed in schools: all quantities obey strict laws and are interconnected by formulas: Ohm's law, universal gravitation law, etc. Even the history course is often designed so that it has no place for random events.
In fact, there are very few constant values in the world, and one has to live and put up with this. The values that statistics studies are volatile — subject to random fluctuations. For example, the number of students in different classes of a school is different. Every day, the same student spends different time for his way from home to school - a bit more or a bit less than the day before. Even the gravitational constant is unstable - it is different in different places and at different times.
29
.11
.20
19
5

To successfully describe, explain and predict variable phenomena, to become a real science, statistics need the help of mathematics.
The branch of mathematics that studies random phenomena is called probability theory.
In many countries we observe serious attempts to introduce the study of statistics and probability into school. Last year, we analyzed the approach to school statistics and probability using the educational standard of Malaysia - and, in part, the Philippines. I think that the picture that we saw, in general, is common for Southeast Asia.
So now, I’d like to start discussing a phenomenon of ‘Statistical Thinking’ basing on curricula we’ve observed and analyzed.
29
.11
.20
19
6

School program in statistics and probability theory for grades 7-10 Philippines.
Sources:
• The presentation by Soledad A. Ulep, University of the Philippines, National Institute for Science and Mathematics. Education development.
• Website https://lrmds.deped.gov.ph/
Program Content: Numbers, Measurements, Geometry, Patterns and Algebra, as well as Statistics and Probability Theory.
29
.11
.20
19
7
Our dear Soledad A. Ulep
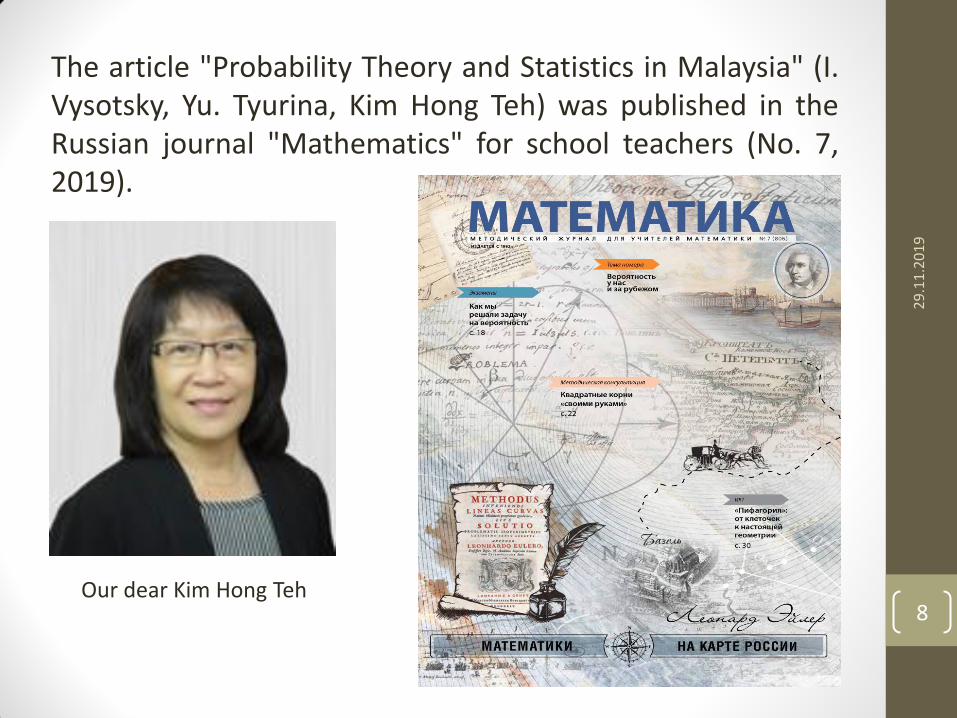
The article "Probability Theory and Statistics in Malaysia" (I. Vysotsky, Yu. Tyurina, Kim Hong Teh) was published in the Russian journal "Mathematics" for school teachers (No. 7, 2019).
29
.11
.20
19
8 Our dear Kim Hong Teh
The authors of training programs in the Philippines and Malaysia try to cover a practically significant range of tasks. Data skills are considered the most important. The practical orientation of the programs is obvious. This is a strong point.
Another important feature - the program has a clear focus on the development of statistical culture. This can be seen in the description of the skills that schoolchildren should possess.
But in the examples of tasks, much less attention is paid to statistical thinking. Tasks are mostly reduced to the technical side of the matter.
29
.11
.20
19
9

It is evident that the authors of the curricula are trying to cover a practically significant range of topics, while, unfortunately, they are not very aware of the real relationship between statistics and probability.
In pursuit of practical orientation, the authors miss a systematic look at the subject of statistics and probability theory. The appearance of elements of the theory is often spontaneous - at the level of individual formulas and facts.
This often happens when curriculum and textbooks are created by educators in isolation from the scientific community.
In our analysis, we studied the available examples of the tasks of final certification after secondary and high school.
29
.11
.20
19
10
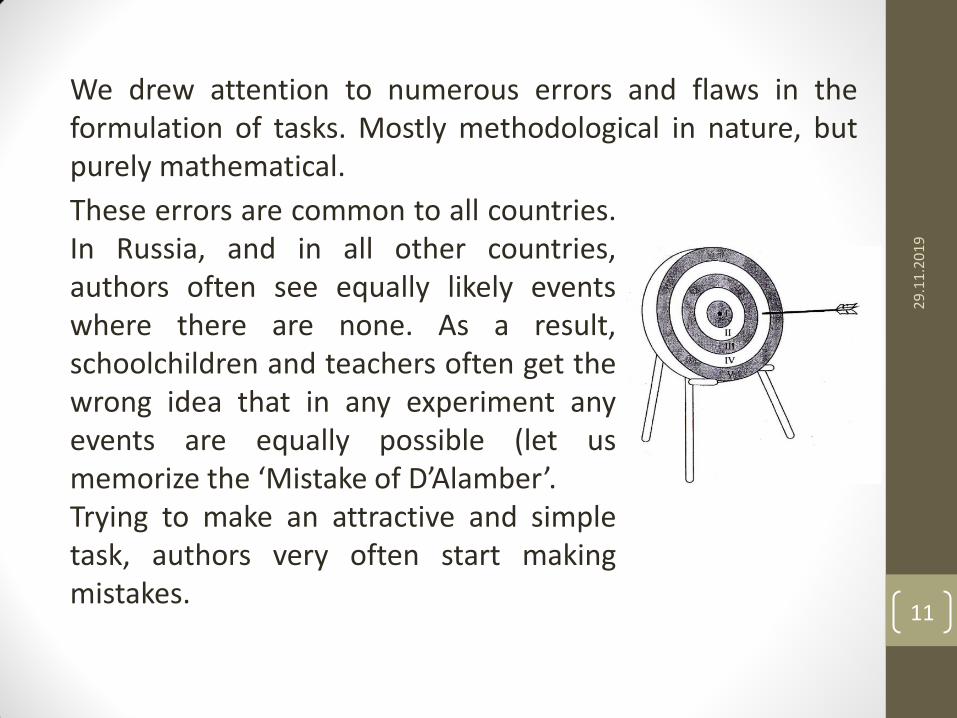
We drew attention to numerous errors and flaws in the formulation of tasks. Mostly methodological in nature, but purely mathematical.
29
.11
.20
19
11
These errors are common to all countries. In Russia, and in all other countries, authors often see equally likely events where there are none. As a result, schoolchildren and teachers often get the wrong idea that in any experiment any events are equally possible (let us memorize the ‘Mistake of D’Alamber’. Trying to make an attractive and simple task, authors very often start making mistakes.
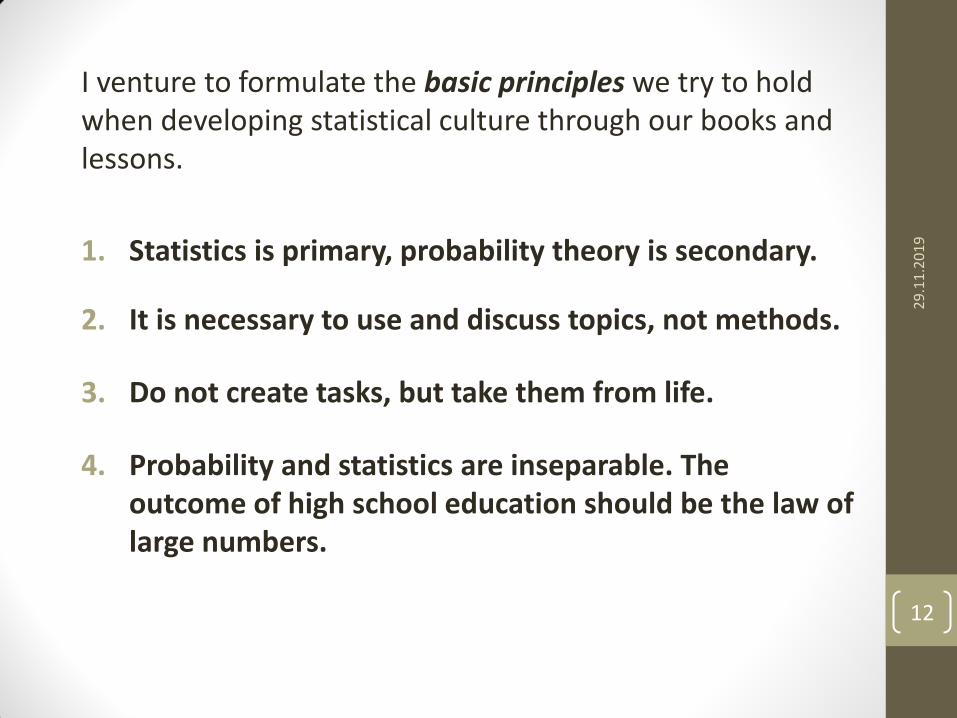
I venture to formulate the basic principles we try to hold when developing statistical culture through our books and lessons.
1. Statistics is primary, probability theory is secondary.
2. It is necessary to use and discuss topics, not methods.
3. Do not create tasks, but take them from life.
4. Probability and statistics are inseparable. The outcome of high school education should be the law of large numbers.
29
.11
.20
19
12
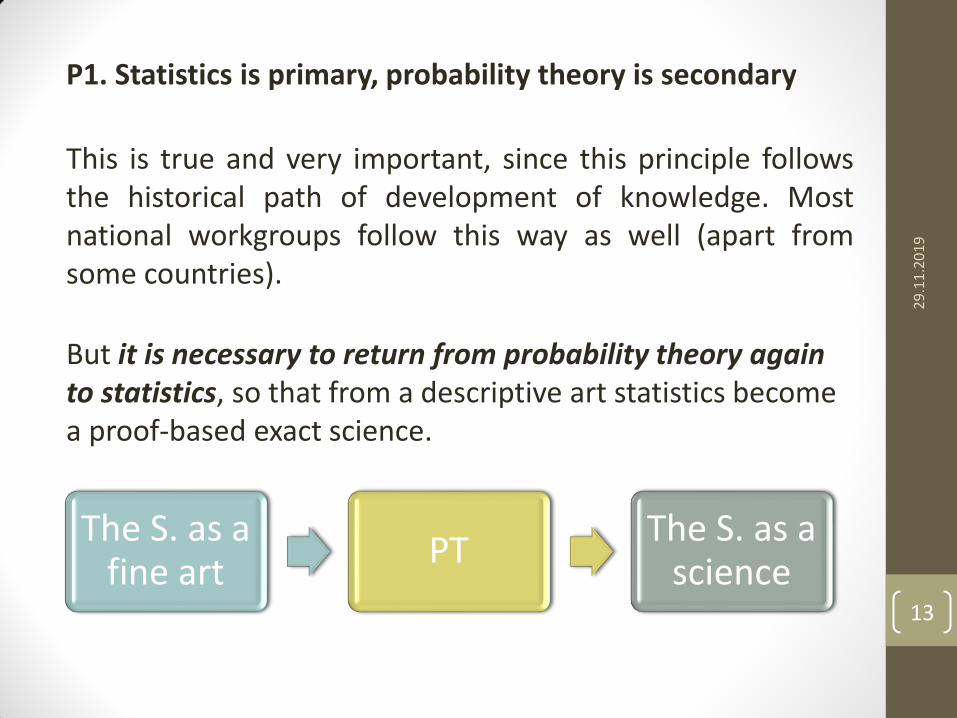
P1. Statistics is primary, probability theory is secondary
This is true and very important, since this principle follows the historical path of development of knowledge. Most national workgroups follow this way as well (apart from some countries).
But it is necessary to return from probability theory again to statistics, so that from a descriptive art statistics become a proof-based exact science.
29
.11
.20
19
13
The S. as a fine art
PT The S. as a
science

1. P2. Discuss relevant topics, not methods
29
.11
.20
19
14
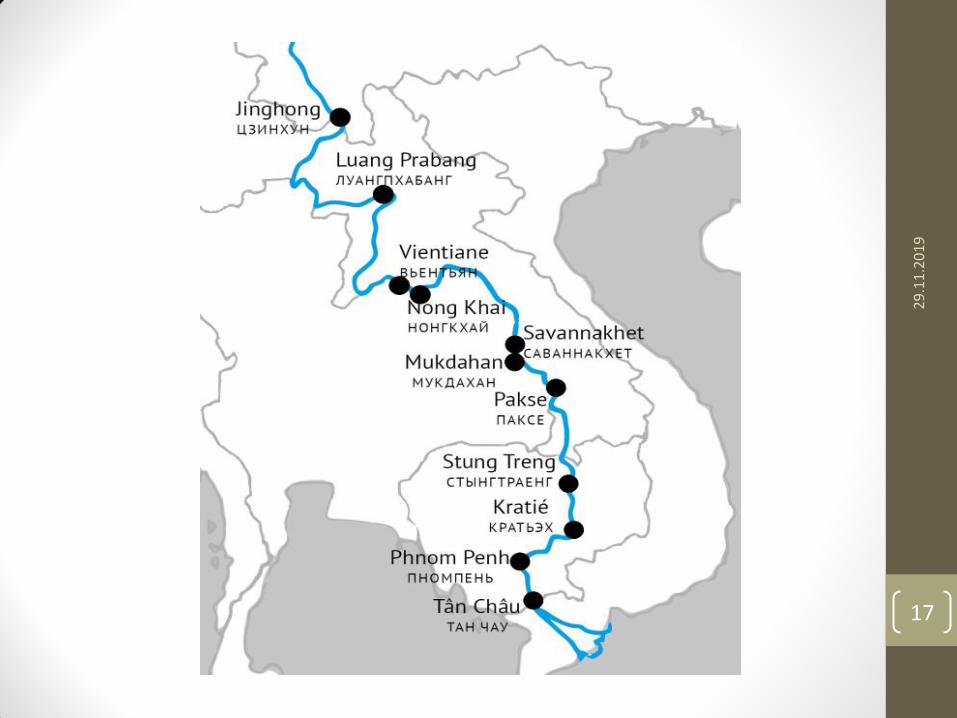
Mekong (Laos. ປະ ເທດ ລາວ, Khong — “Mother of the Waters of the Ganges”, Khmer. មេ គុ ង; Vietna-mese —- Sông Cửu Long “River of the Nine Dragons”) is the largest river on the Indochina Peninsula. It carries its waters through part of China, Myanmar, Laos, Thailand, Cambodia and Vietnam.

The length of the river is about 4,500 km, the basin area is 810 thousand km.
Water is a necessary condition for our existence. Therefore, from the ancient times, many cities were founded along the banks of the Mekong.
During rainfall periods in Indochina, it is very important to observe and control the water level. Floods form fertile soil, but at the same time they bring death and destruction. Special joint hydrological commission of six countries is monitoring the condition of the Nine Dragons River day and night.
29
.11
.20
19
15
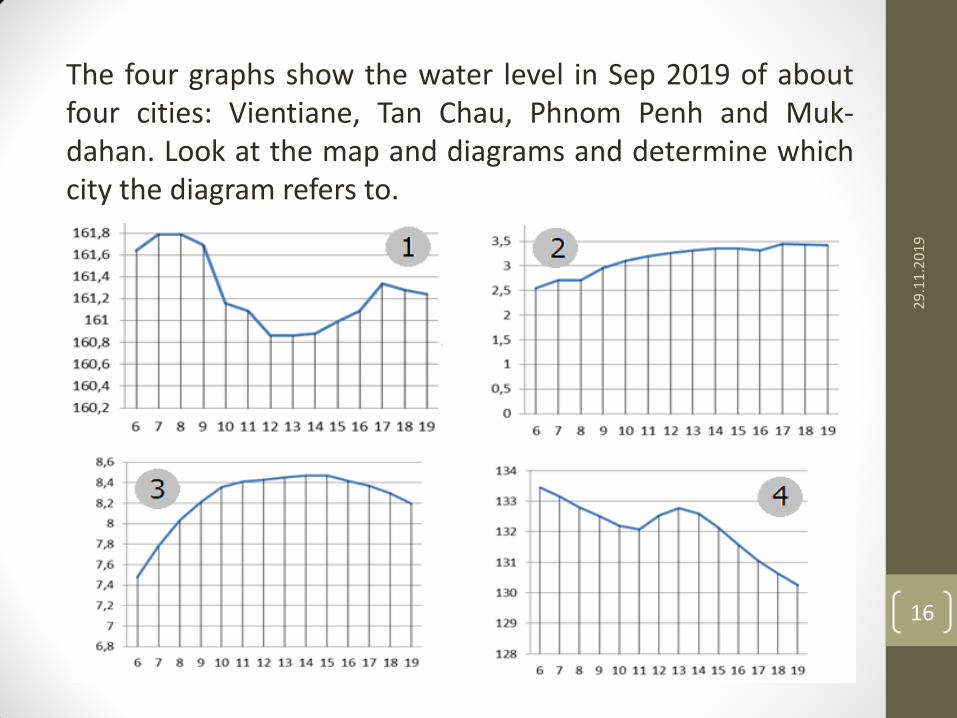
The four graphs show the water level in Sep 2019 of about four cities: Vientiane, Tan Chau, Phnom Penh and Muk-dahan. Look at the map and diagrams and determine which city the diagram refers to.
29
.11
.20
19
16
29
.11
.20
19
17
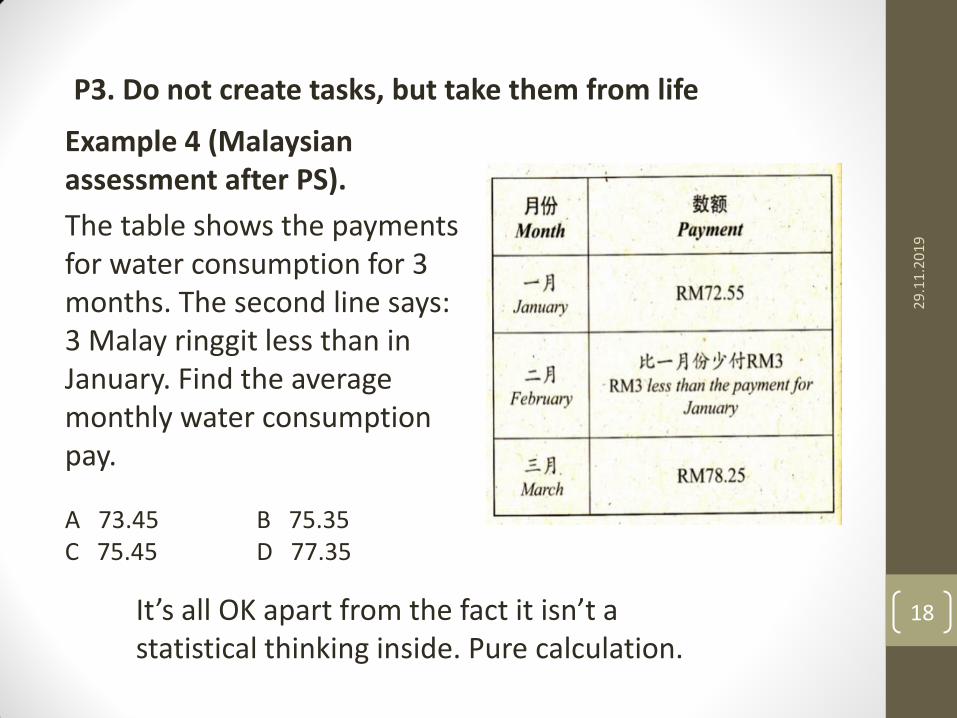
Example 4 (Malaysian assessment after PS).
The table shows the payments for water consumption for 3 months. The second line says: 3 Malay ringgit less than in January. Find the average monthly water consumption pay.
А 73.45 B 75.35 C 75.45 D 77.35
29
.11
.20
19
18 It’s all OK apart from the fact it isn’t a statistical thinking inside. Pure calculation.
P3. Do not create tasks, but take them from life
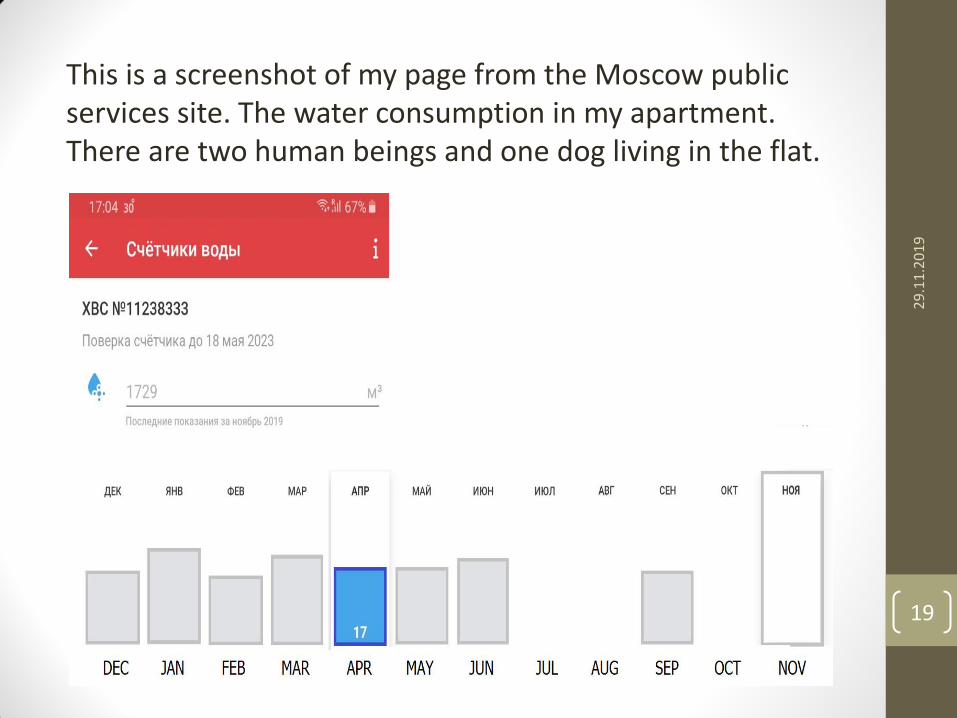
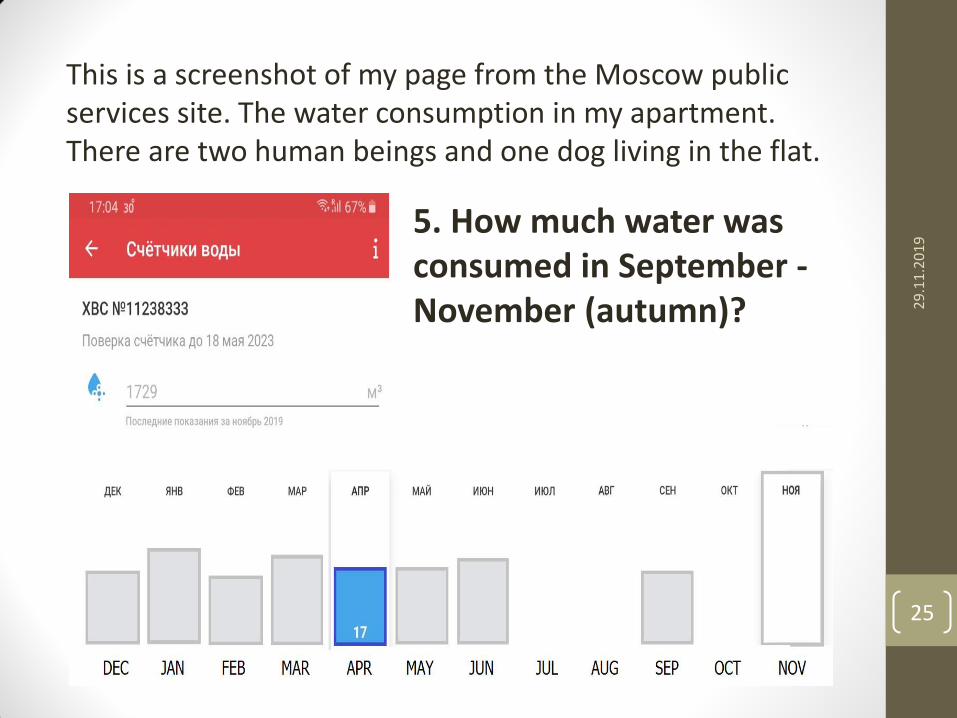
This is a screenshot of my page from the Moscow public services site. The water consumption in my apartment. There are two human beings and one dog living in the flat.
29
.11
.20
19
19
The lower and upper deadlines for taking data and payment is monthly from 15 to 26 of the month. We run tipycally Russian way of living.
Try to answer the questions or merely put a suggestions.
1. When are Christmas holidays in Russia - in December or January?
2. Are Russians more likely to take a shower or bath?
3. In what time did the Russian professor has his vacation and how long?
4. What happened in Oct? Why no payment?
5. How much water was consumed in September - November (autumn)?
6. What is the average water consumption per month?
29
.11
.20
19
20

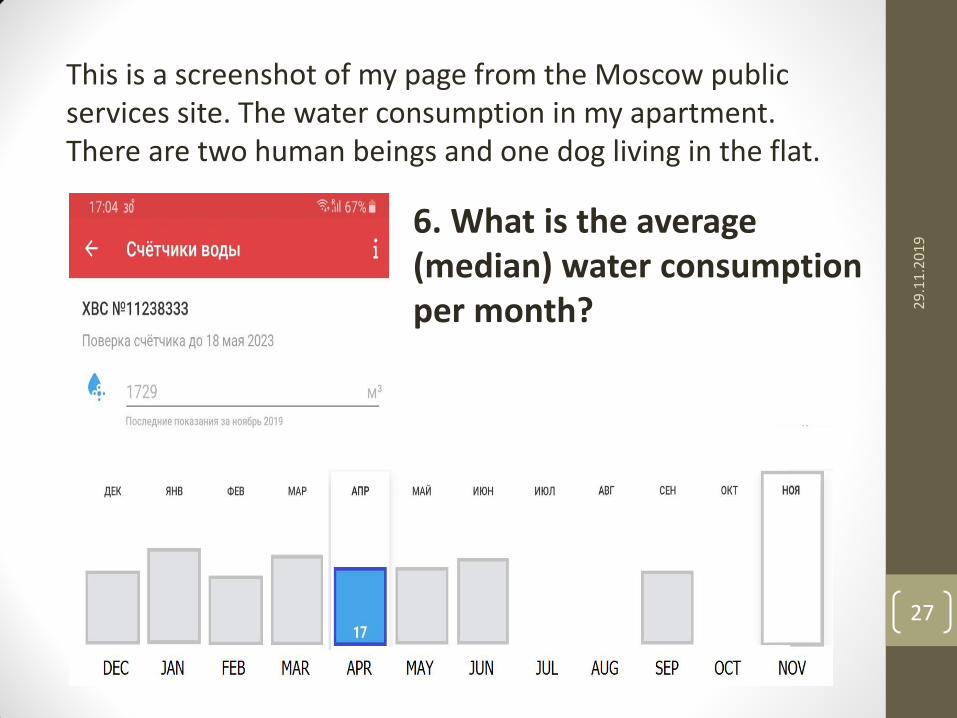
This is a screenshot of my page from the Moscow public services site. The water consumption in my apartment. There are two human beings and one dog living in the flat.
29
.11
.20
19
21
1. When are Christmas holidays in Russia - in December or January?
This is a screenshot of my page from the Moscow public services site. The water consumption in my apartment. There are two human beings and one dog living in the flat.
29
.11
.20
19
22
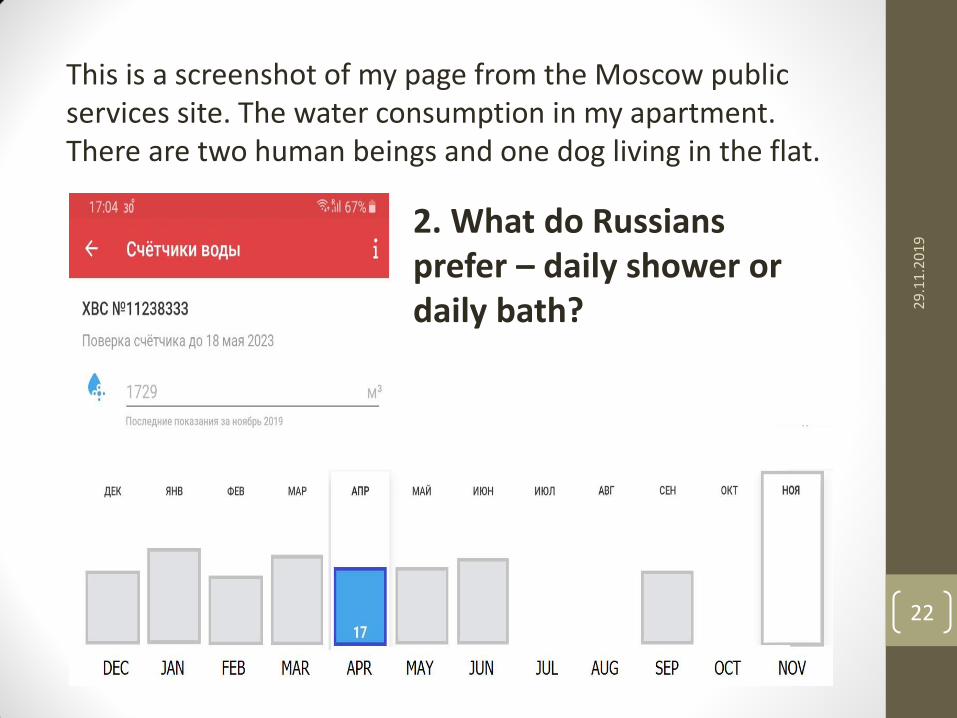
2. What do Russians prefer – daily shower or daily bath?

This is a screenshot of my page from the Moscow public services site. The water consumption in my apartment. There are two human beings and one dog living in the flat.
29
.11
.20
19
23
3. In what period did the Russian professor has his vacation and how long?

This is a screenshot of my page from the Moscow public services site. The water consumption in my apartment. There are two human beings and one dog living in the flat.
29
.11
.20
19
24
4. What happened in Oct? Why no payment? Just forgot?
This is a screenshot of my page from the Moscow public services site. The water consumption in my apartment. There are two human beings and one dog living in the flat.
29
.11
.20
19
25
5. How much water was consumed in September - November (autumn)?

This is a screenshot of my page from the Moscow public services site. The water consumption in my apartment. There are two human beings and one dog living in the flat.
29
.11
.20
19
26
1. When are Christmas holidays in Russia - in December or January?
This is a screenshot of my page from the Moscow public services site. The water consumption in my apartment. There are two human beings and one dog living in the flat.
29
.11
.20
19
27
6. What is the average (median) water consumption per month?
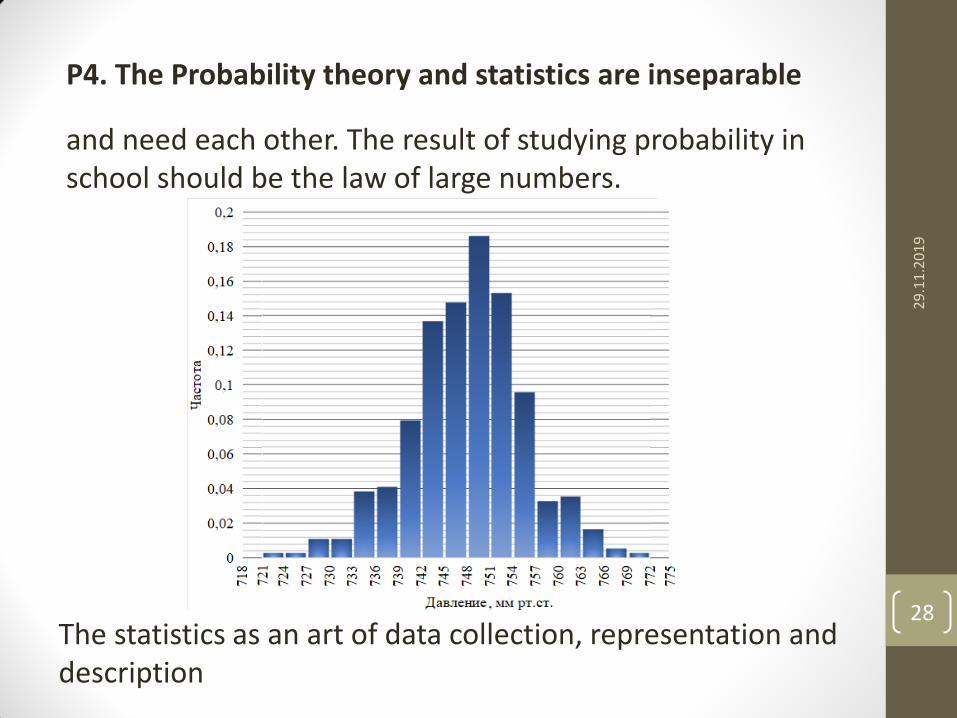
P4. The Probability theory and statistics are inseparable
and need each other. The result of studying probability in school should be the law of large numbers.
29
.11
.20
19
28 The statistics as an art of data collection, representation and description
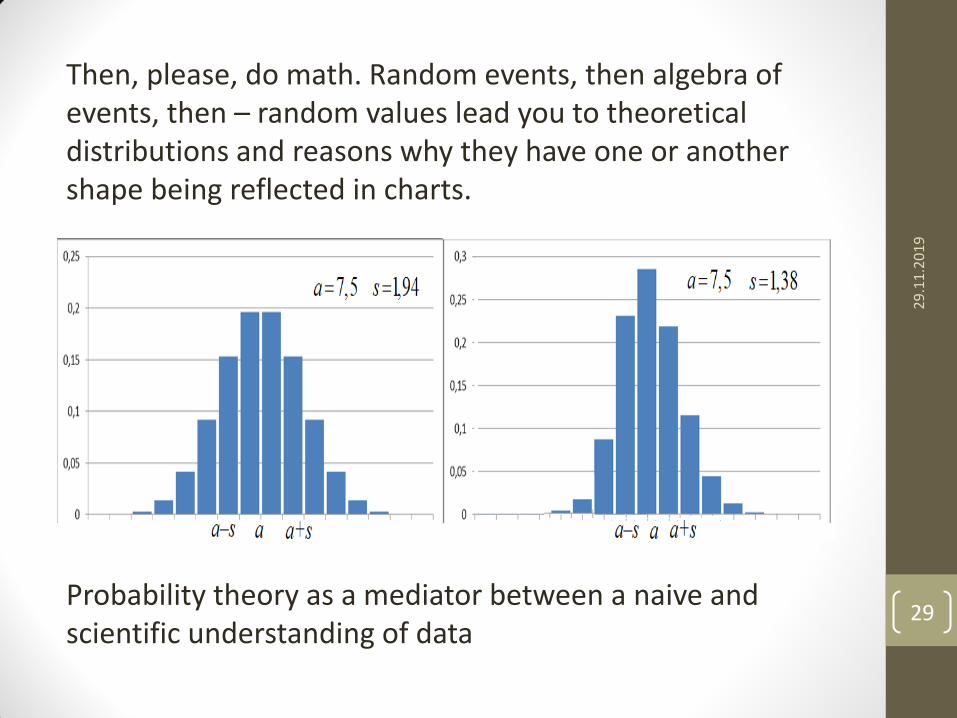
Then, please, do math. Random events, then algebra of events, then – random values lead you to theoretical distributions and reasons why they have one or another shape being reflected in charts.
29
.11
.20
19
29 Probability theory as a mediator between a naive and scientific understanding of data
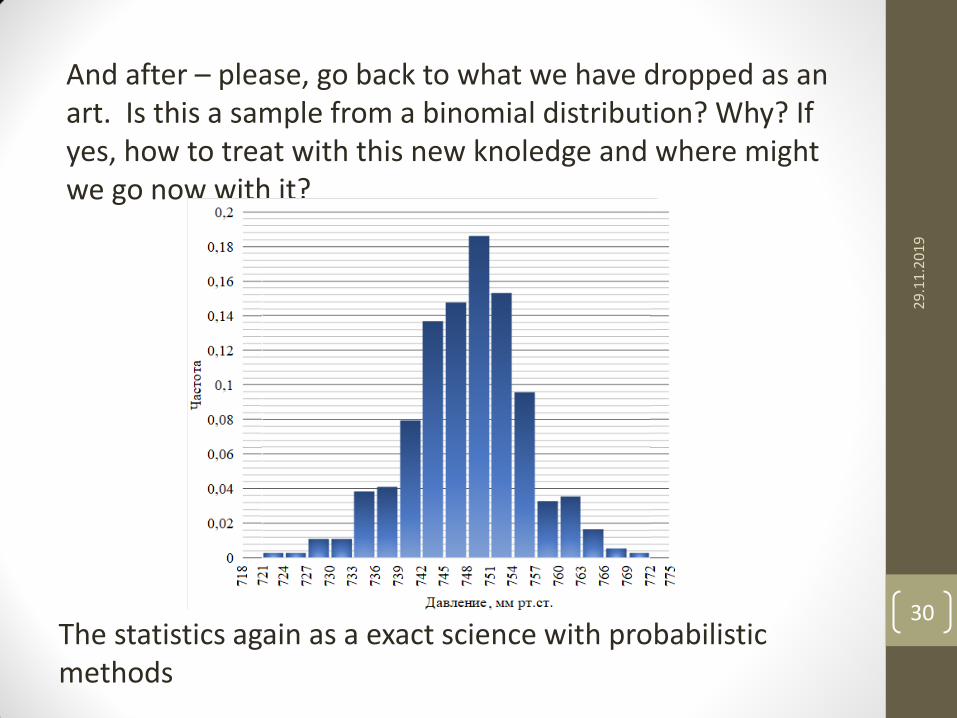
And after – please, go back to what we have dropped as an art. Is this a sample from a binomial distribution? Why? If yes, how to treat with this new knoledge and where might we go now with it?
29
.11
.20
19
30 The statistics again as a exact science with probabilistic methods
Topics and subjects for studying statistics
Grade 7
Children feel very good when we fool them. No need to invent tasks from your head. It's impossible. Tasks need to be taken from the life around us. First of all, we ourselves need to develop our mathematical and statistical thinking in order to better see the mathematics around us.
In our textbook we offer several topics around which the whole story is built, but this is only a small part of what we suggest to use in lessons. Much more should be included in the task books and in the practice of teaching. You need to be patient. It is better to spend time on a good task than to quickly come up with ten bad ones.
29
.11
.20
19
31
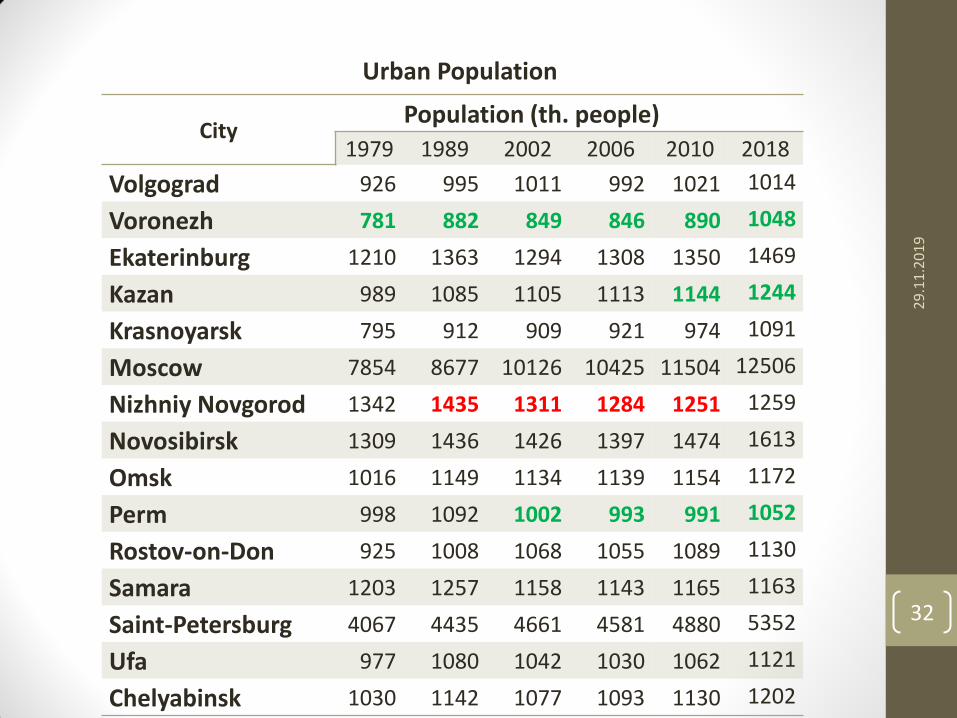
Urban Population
29
.11
.20
19
32
City Population (th. people)
1979 1989 2002 2006 2010 2018
Volgograd 926 995 1011 992 1021 1014
Voronezh 781 882 849 846 890 1048
Ekaterinburg 1210 1363 1294 1308 1350 1469
Kazan 989 1085 1105 1113 1144 1244
Krasnoyarsk 795 912 909 921 974 1091
Moscow 7854 8677 10126 10425 11504 12506
Nizhniy Novgorod 1342 1435 1311 1284 1251 1259
Novosibirsk 1309 1436 1426 1397 1474 1613
Omsk 1016 1149 1134 1139 1154 1172
Perm 998 1092 1002 993 991 1052
Rostov-on-Don 925 1008 1068 1055 1089 1130
Samara 1203 1257 1158 1143 1165 1163
Saint-Petersburg 4067 4435 4661 4581 4880 5352
Ufa 977 1080 1042 1030 1062 1121
Chelyabinsk 1030 1142 1077 1093 1130 1202
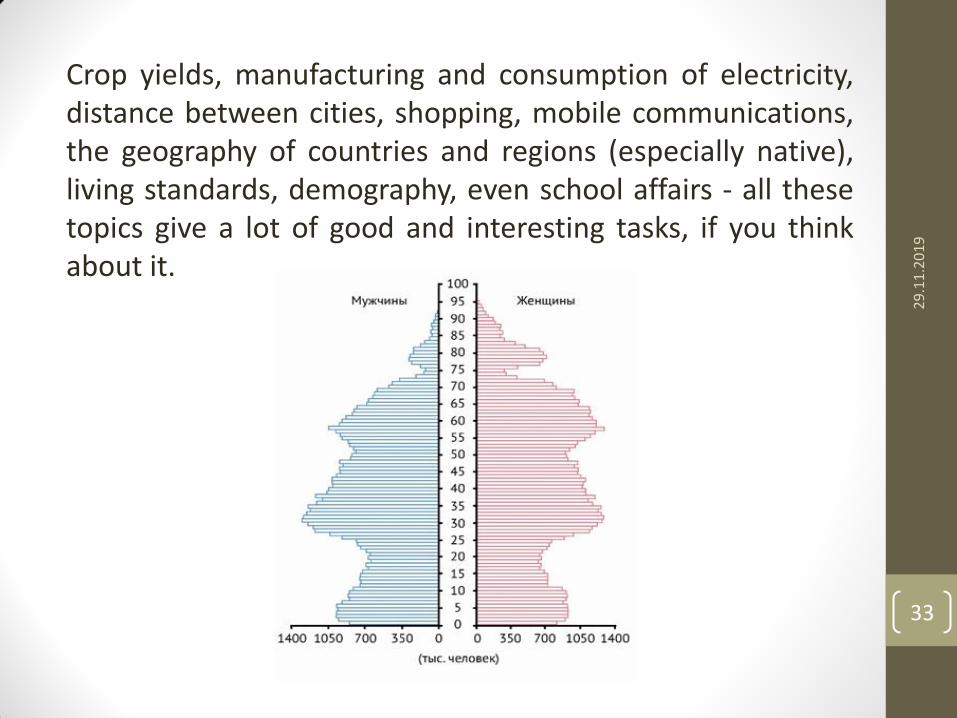
Crop yields, manufacturing and consumption of electricity, distance between cities, shopping, mobile communications, the geography of countries and regions (especially native), living standards, demography, even school affairs - all these topics give a lot of good and interesting tasks, if you think about it.
29
.11
.20
19
33
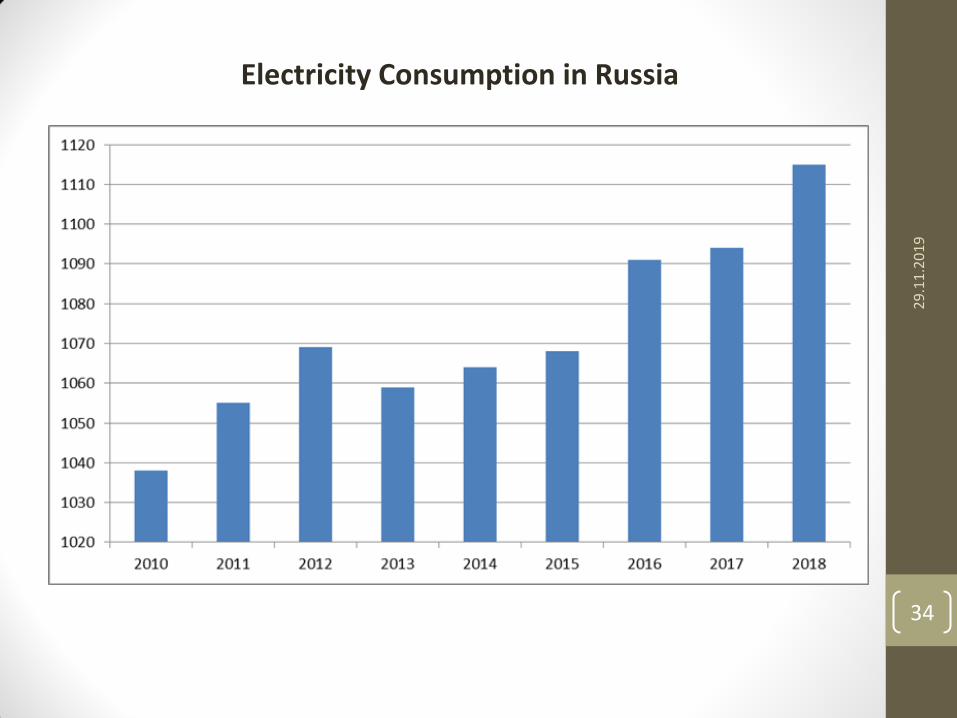
Electricity Consumption in Russia
29
.11
.20
19
34
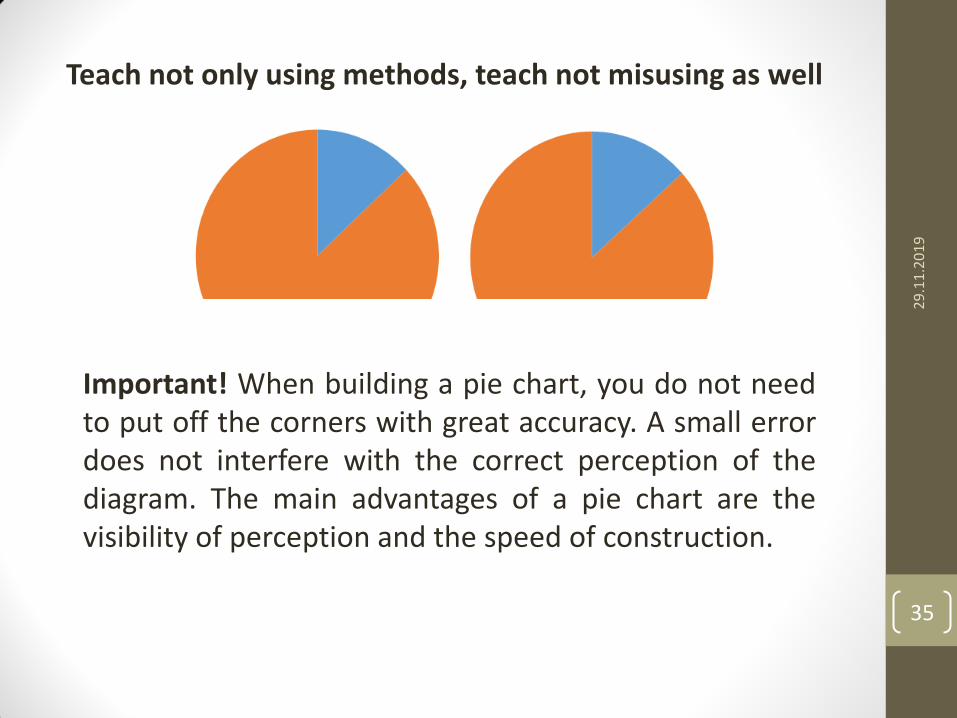
Teach not only using methods, teach not misusing as well
29
.11
.20
19
35
Important! When building a pie chart, you do not need to put off the corners with great accuracy. A small error does not interfere with the correct perception of the diagram. The main advantages of a pie chart are the visibility of perception and the speed of construction.
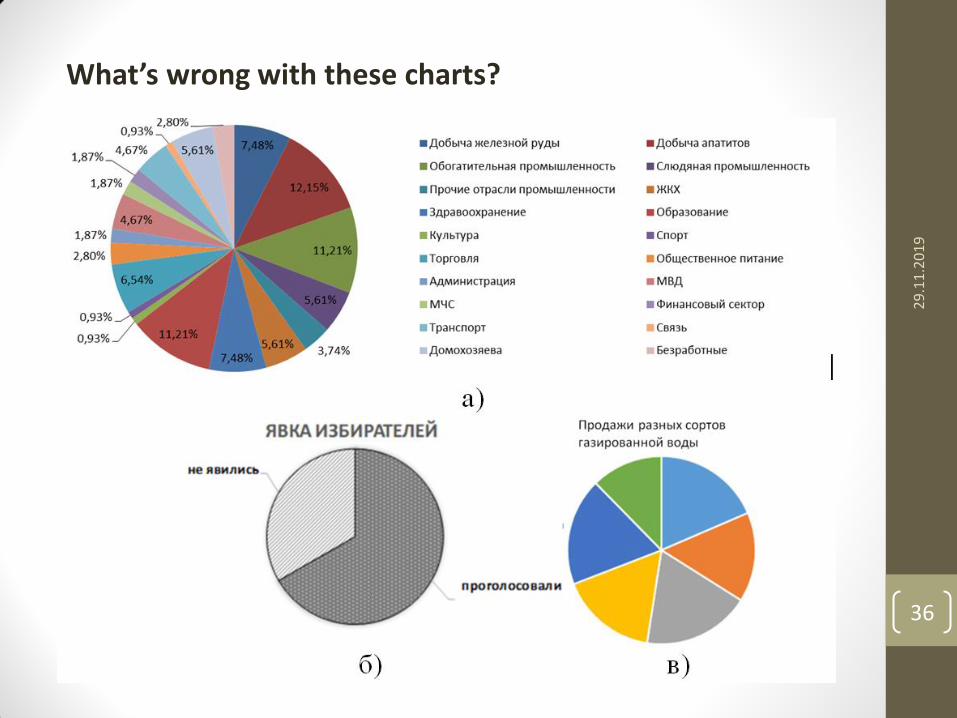
What’s wrong with these charts?
29
.11
.20
19
36
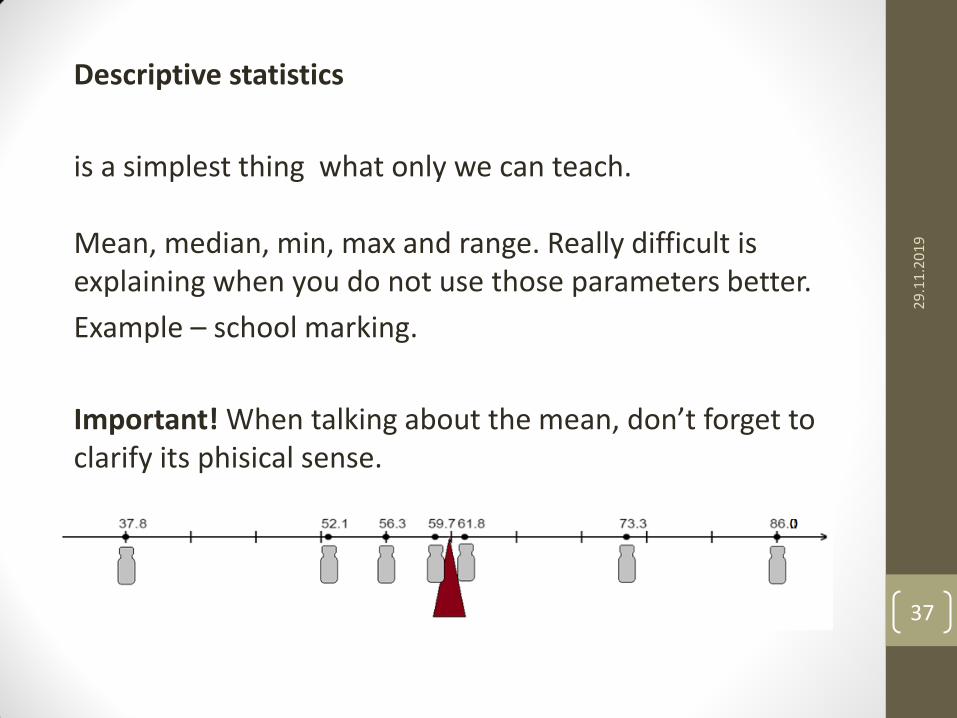
Descriptive statistics
is a simplest thing what only we can teach.
Mean, median, min, max and range. Really difficult is explaining when you do not use those parameters better.
Example – school marking.
Important! When talking about the mean, don’t forget to clarify its phisical sense.
29
.11
.20
19
37
Frequencies
Do we really want to entangle everybody with so many types of probabilities?
Important! There are no ‘experimental probabiliti-es’ or ‘statistical probabilities’. Better tald about frequencies as random values depending on a sample we have here and now. Change the sample causes change the frequency. The frequency will serve as an estimator but not probability itself.
Calling frequency a ‘statistical probability’ origins from ‘ancient’ times when the very concept of probability wasn’t clear.
29
.11
.20
19
38
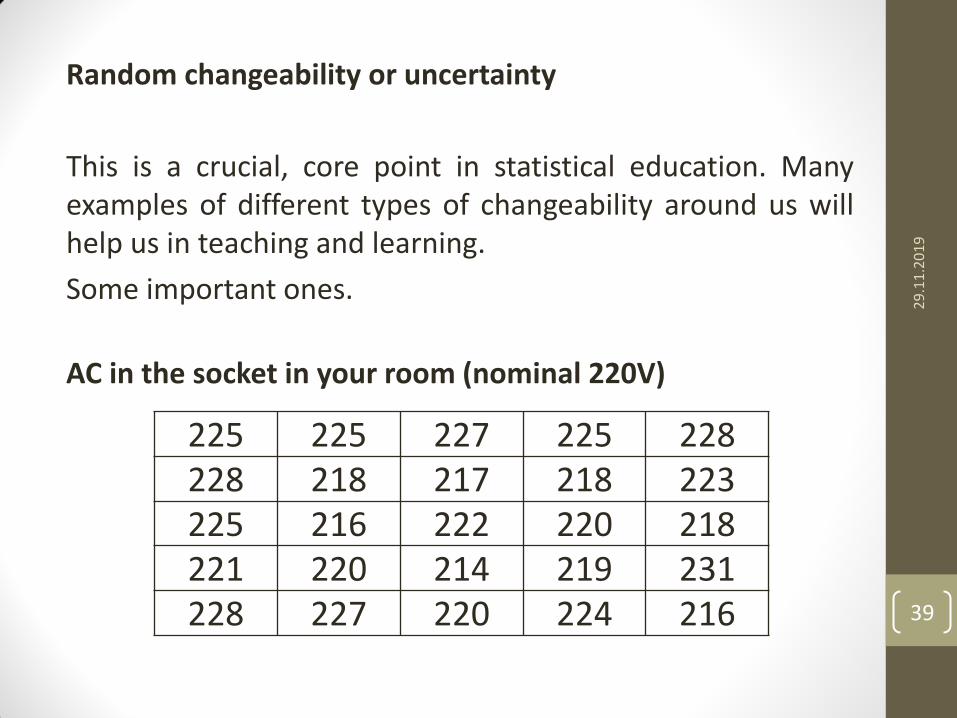
Random changeability or uncertainty
This is a crucial, core point in statistical education. Many examples of different types of changeability around us will help us in teaching and learning.
Some important ones.
AC in the socket in your room (nominal 220V)
29
.11
.20
19
39
225 225 227 225 228 228 218 217 218 223 225 216 222 220 218 221 220 214 219 231 228 227 220 224 216
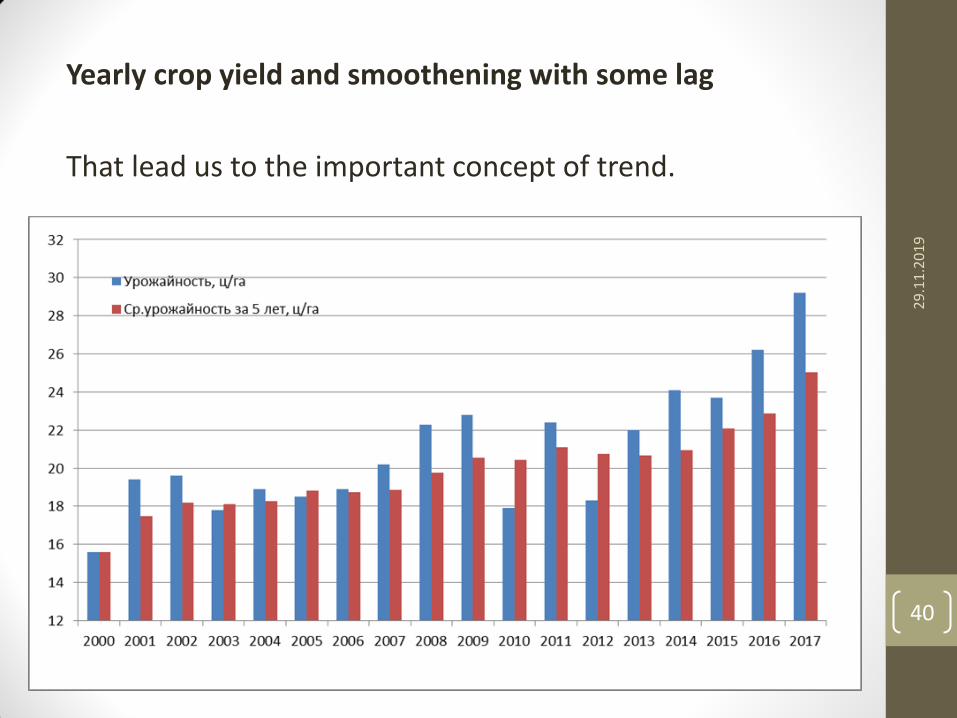
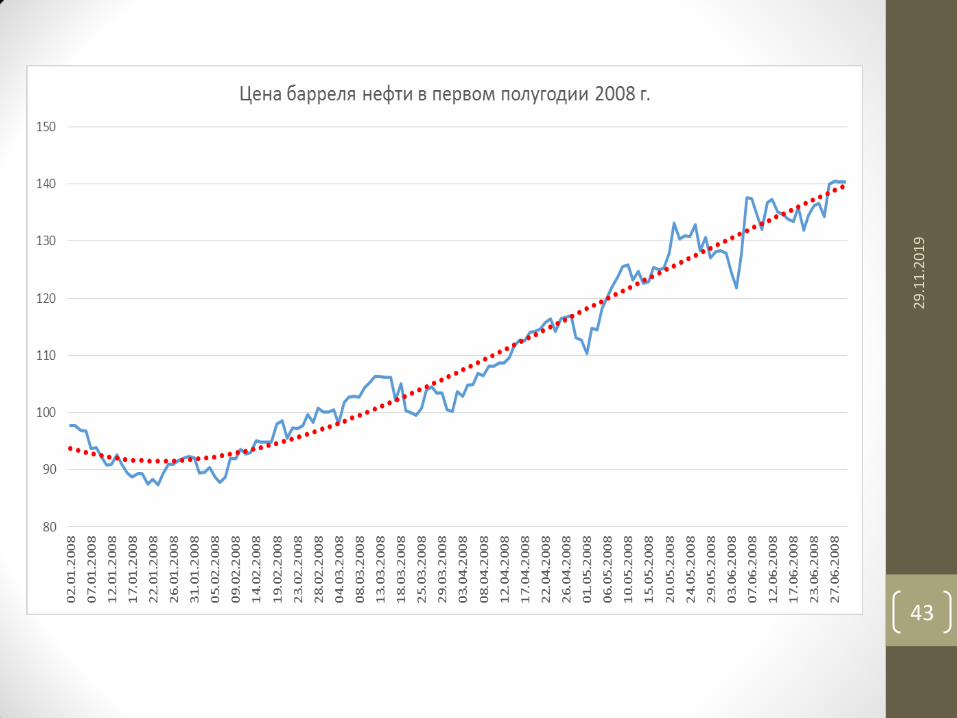
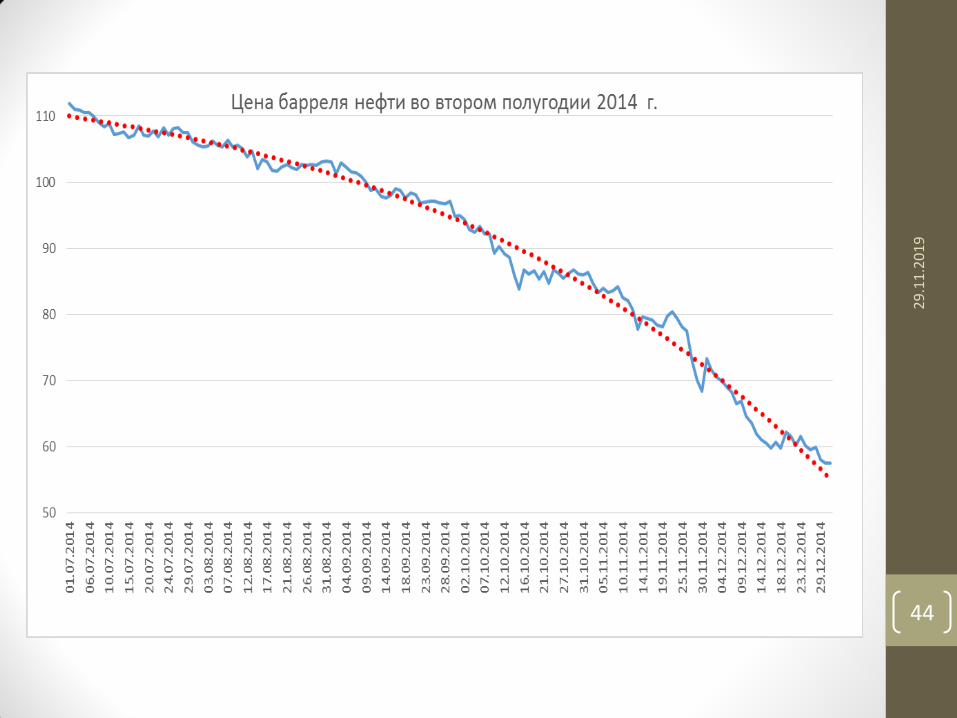
Yearly crop yield and smoothening with some lag
That lead us to the important concept of trend.
29
.11
.20
19
40
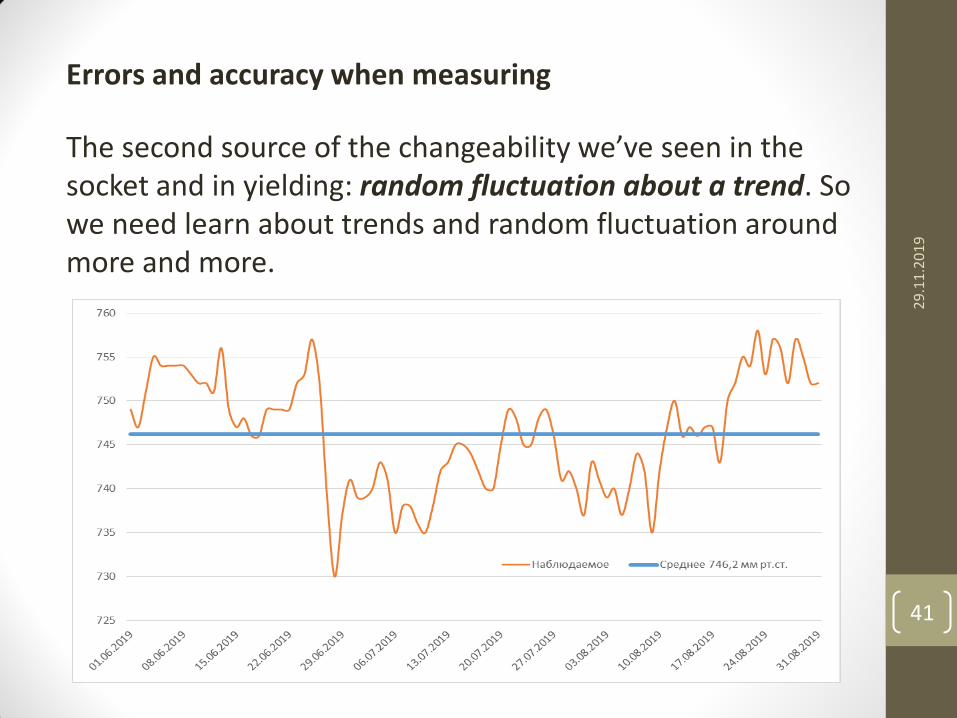
Errors and accuracy when measuring
The second source of the changeability we’ve seen in the socket and in yielding: random fluctuation about a trend. So we need learn about trends and random fluctuation around more and more.
29
.11
.20
19
41
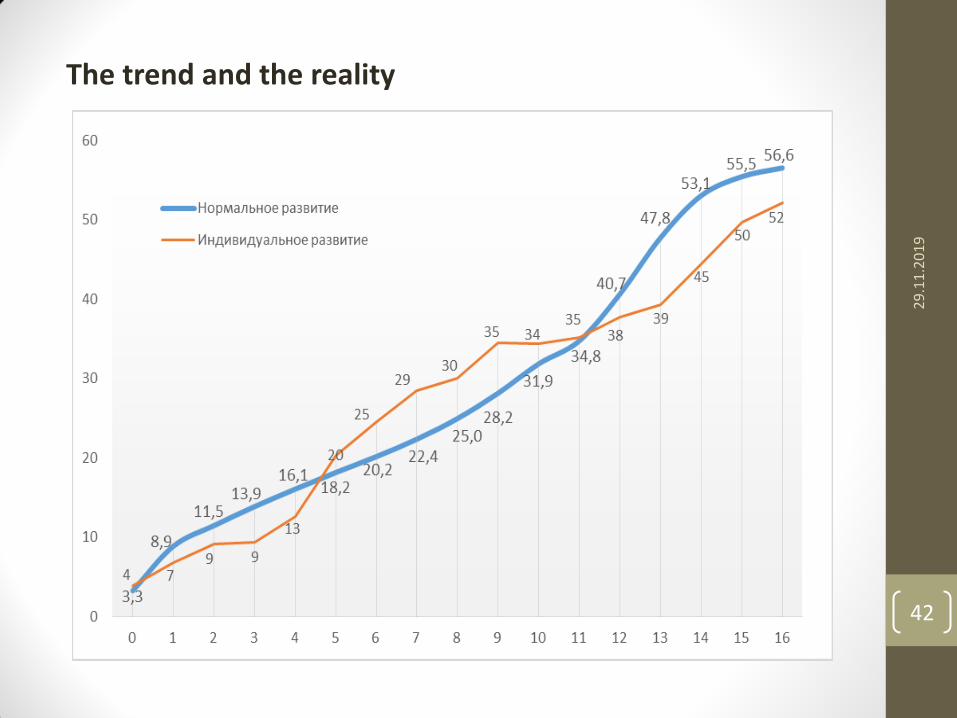
The trend and the reality
29
.11
.20
19
42
29
.11
.20
19
43
29
.11
.20
19
44

Common mistake
All is normal? Do all random values in nature obey a two-sloped distributions like below?
Atm. pressure
29
.11
.20
19
45
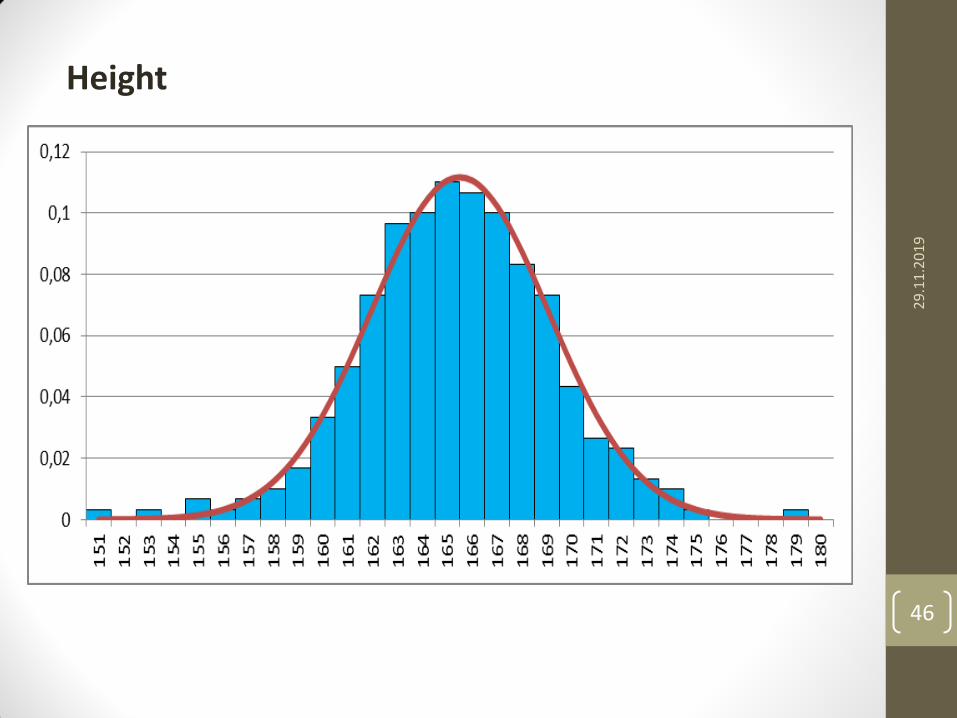
Height
29
.11
.20
19
46
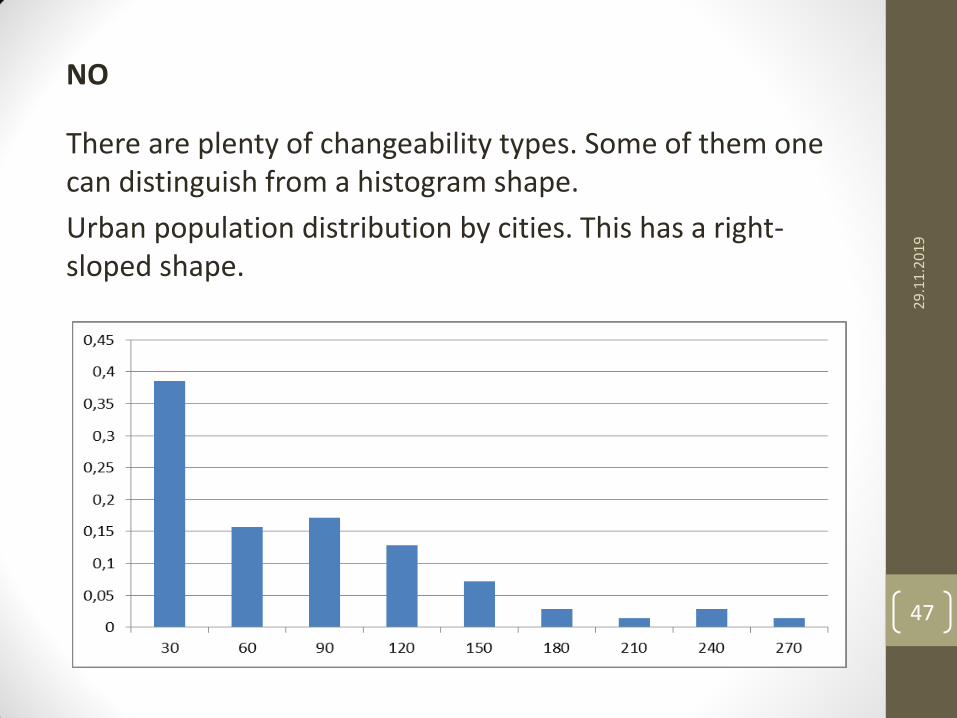
NO
There are plenty of changeability types. Some of them one can distinguish from a histogram shape.
Urban population distribution by cities. This has a right-sloped shape.
29
.11
.20
19
47
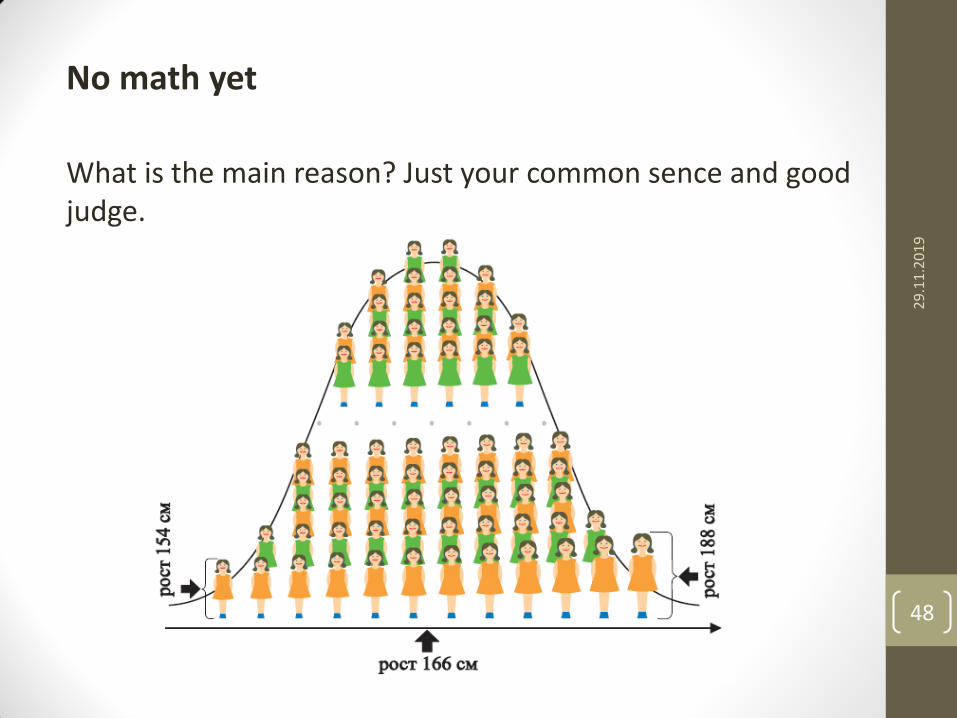
No math yet
What is the main reason? Just your common sence and good judge.
29
.11
.20
19
48
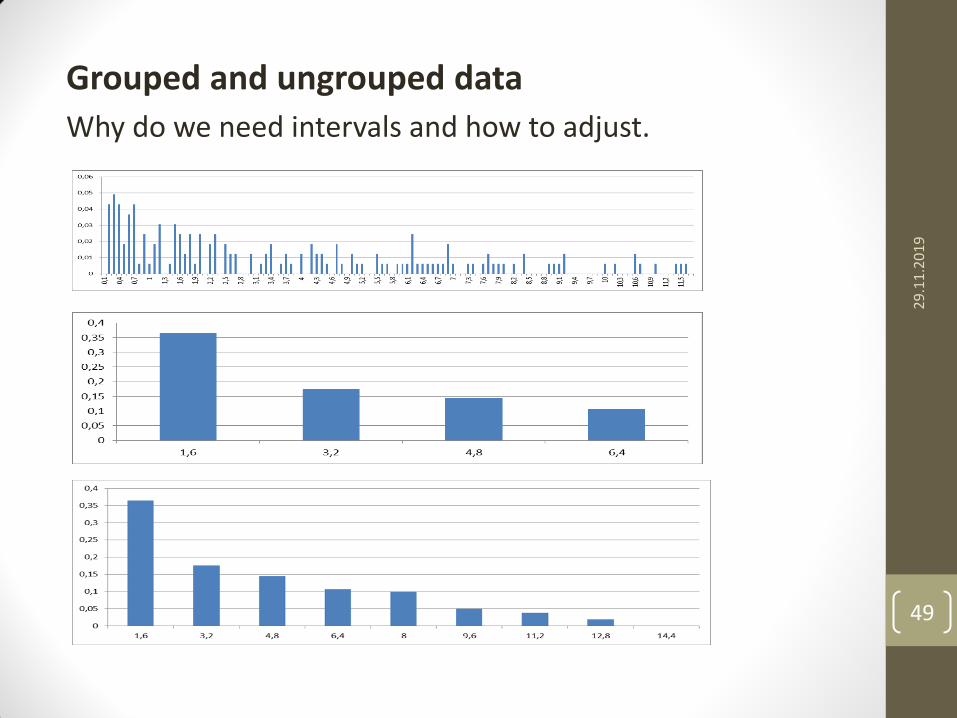
Grouped and ungrouped data
Why do we need intervals and how to adjust.
29
.11
.20
19
49
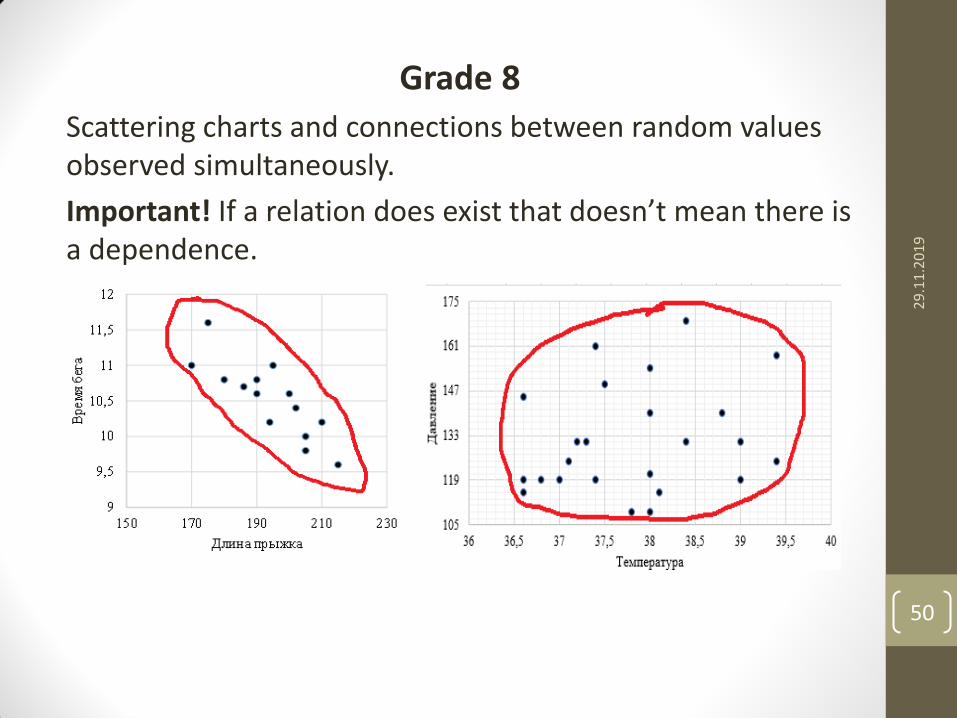
Grade 8
Scattering charts and connections between random values observed simultaneously.
Important! If a relation does exist that doesn’t mean there is a dependence.
29
.11
.20
19
50
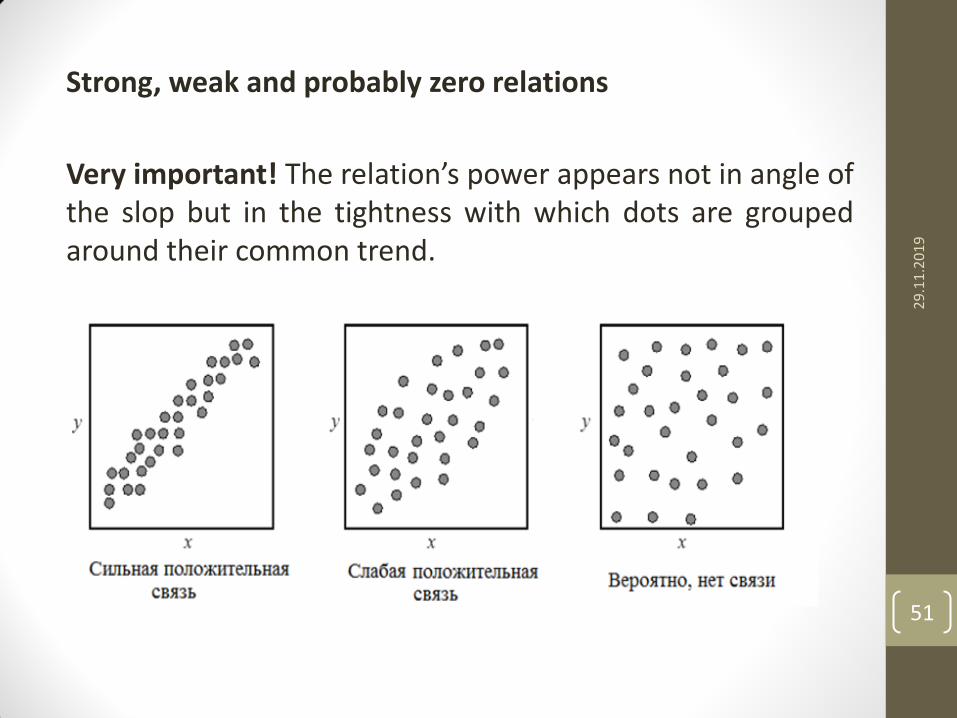
Strong, weak and probably zero relations
Very important! The relation’s power appears not in angle of the slop but in the tightness with which dots are grouped around their common trend.
29
.11
.20
19
51
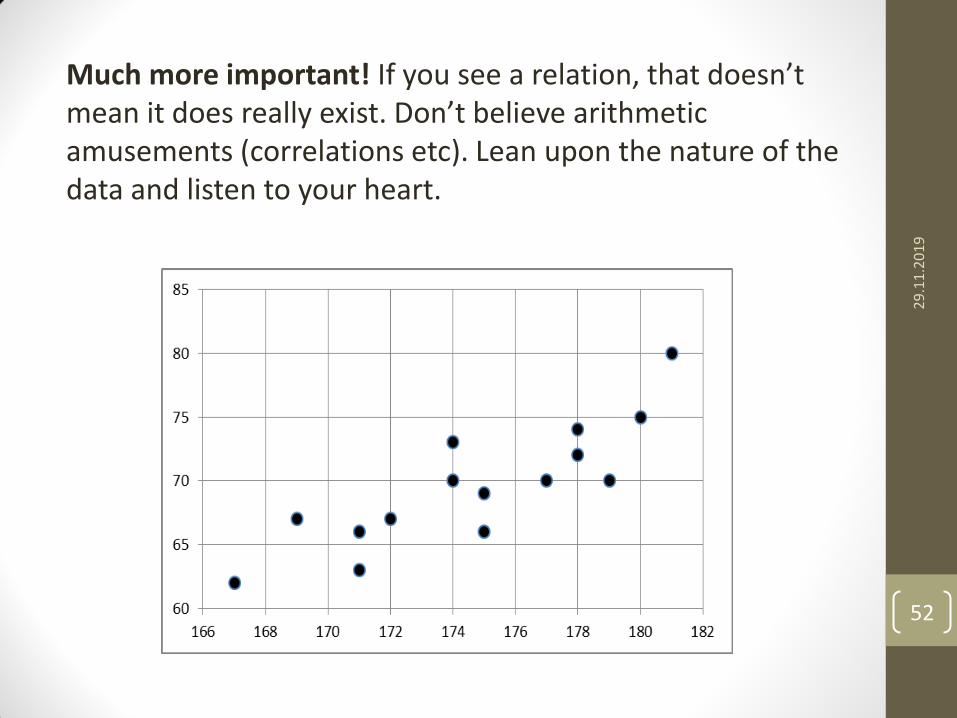
Much more important! If you see a relation, that doesn’t mean it does really exist. Don’t believe arithmetic amusements (correlations etc). Lean upon the nature of the data and listen to your heart.
29
.11
.20
19
52
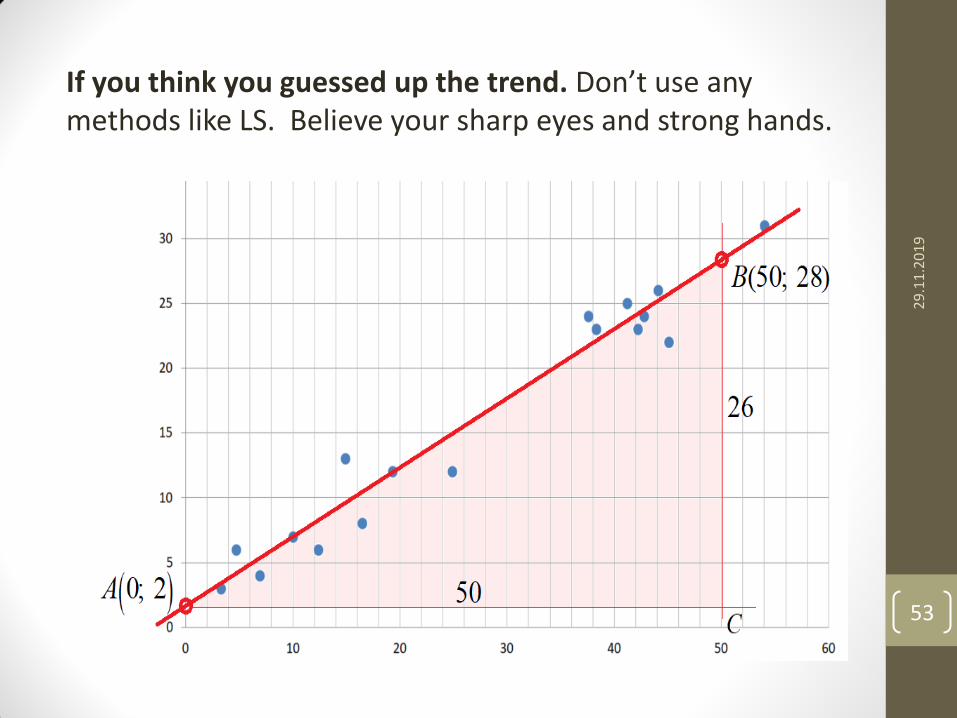
If you think you guessed up the trend. Don’t use any methods like LS. Believe your sharp eyes and strong hands.
29
.11
.20
19
53
Grades 8 and 9. Probability
We need to get through all the way from simple describing events in simple experiments with coins and dice to random values, their characteristics (ME and variation) to make step-by-step all the way to statistics back.
If done that gives a satisfaction, because now we can understand what and why gives two-sloped shapes, or charts with only right slope.
Now we can proceed to a fundamental low of being: law of large numbers which provides a bit of stability in our uncertain world we ventured to appear in.
29
.11
.20
19
s
54
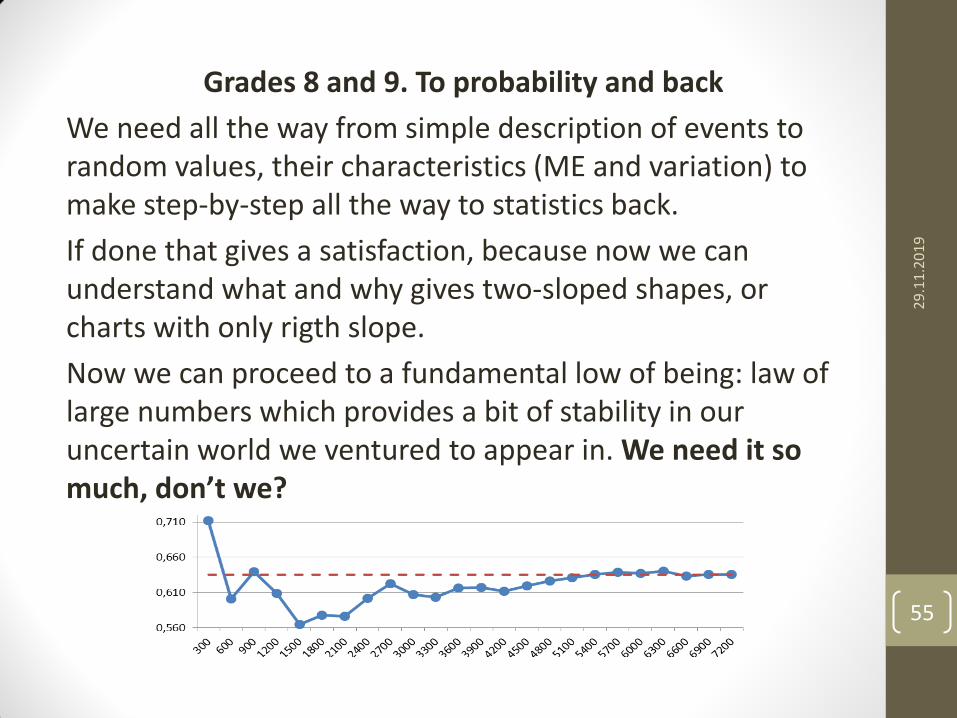
Grades 8 and 9. To probability and back
We need all the way from simple description of events to random values, their characteristics (ME and variation) to make step-by-step all the way to statistics back.
If done that gives a satisfaction, because now we can understand what and why gives two-sloped shapes, or charts with only rigth slope.
Now we can proceed to a fundamental low of being: law of large numbers which provides a bit of stability in our uncertain world we ventured to appear in. We need it so much, don’t we?
29
.11
.20
19
55
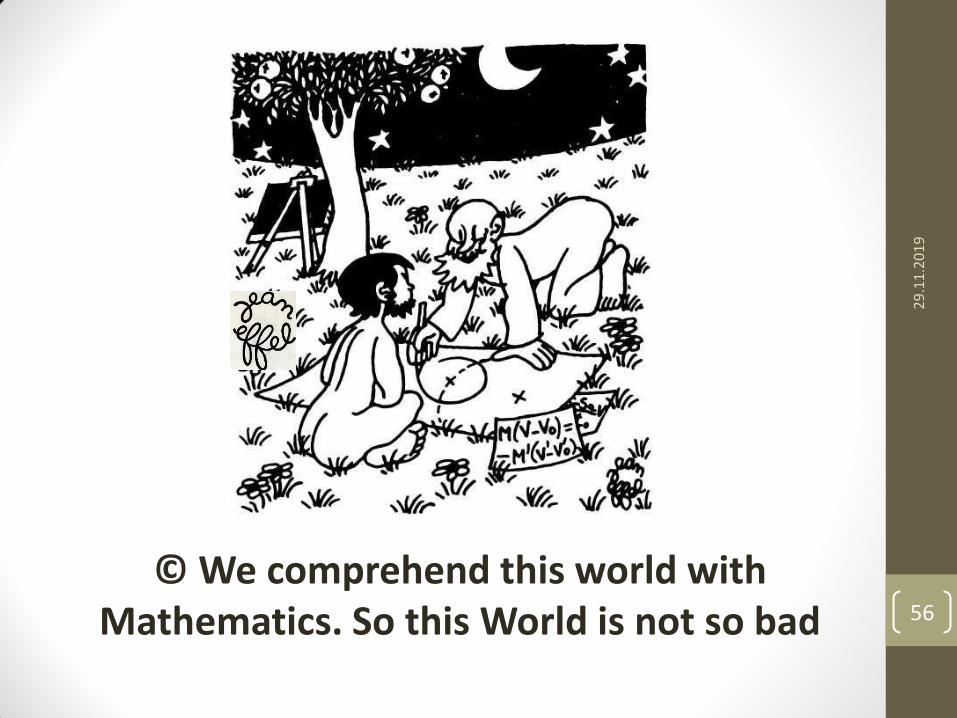
© We comprehend this world with Mathematics. So this World is not so bad
29
.11
.20
19
56

Ivan Vysotskiy, [email protected], +7(916)1545798
29
.11
.20
19
57
Thank you very much, dear colleagues.
Dixi