Embed Size (px)
Citation preview
Ann. Inst. Statist. Math. Vol. 45, No. 4, 773-786 (1993)
STATISTICAL TESTS INVOLVING SEVERAL INDEPENDENT GAMMA DISTRIBUTIONS
RAM C. TRIPATHI 1, RAMESH C. GUPTA 2 AND ROBERT K. PAIR 3
1Division of Mathematics, Computer Science and Statistics, University of Texas, San Antonio, TX Y82~9, U.S.A.
2Department of Mathematics and Statistics, University of Maine, Orono, ME 0~69-5752, U.S.A.
3IBM Federal Systems Co., Houston, TX 77058, U.S.A.
(Received February 26, 1992; revised October 12, 1992)
A b s t r a c t . Statistical tests are developed regarding linear combinations of the parameters of several independent gamma populations. The tests are based on a generalized minimum chi-square procedure. On utilizing these, one can test hypotheses regarding the means or the scale parameters when the shape parameters are unknown. In these tests there is no need to assume the equality of the shape parameters of the underlying populations. Tests for comparing coefficients of variation of several gamma populations have also been developed. For the two population case, a power comparison of these tests with some existing tests is also presented. Two examples are provided to explain the procedure.
Key words and phrases: Gamma distribution, test of hypotheses, scale pa- rameters, coefficient of variation, minimum chi-square, power of a test, test statistic.
1. Introduction
The g a m m a dis t r ibut ion is a general izat ion of the exponent ia l d is t r ibut ion which has been widely used as a model in reliability studies and life tes t ing ex- per iments . The g a m m a dis t r ibut ion fits a wide var ie ty of lifetime da t a adequa te ly and there are failure processes t ha t le/~d to it. The g a m m a dis t r ibut ion also arises ma thema t i ca l l y in cer tain s i tuat ions in which the exponent ia l d is t r ibut ion is being used, in consequence of the well known result t ha t the sum of independent , iden- t ically d is t r ibuted exponent ia l r a n d o m variables has a g a m m a distr ibut ion. This fact justifies its use in wait ing t ime problems and in the theory of queues wi th Poisson arrivals and exponent ia l service t imes. Other appl icat ions of the g a m m a dis t r ibut ion are found in industr ial engineering and qual i ty control, see Drenick (1960), G u p t a and Groll (1961), in cloud seeding exper iment , see Crow (1977) and in survival analysis~ see Gross and Clark (1975) and Lawless (1982). For fur ther details on g a m m a dis t r ibut ion see Johnson and Kotz (1970).
The p a r a m e t e r s of the g a m m a dis t r ibut ion are often es t imated by the me thod of m a x i m u m likelihood which involves solving nonlinear equations, see B o w m a n
Y73
774 RAM C. TRIPATHI ET AL.
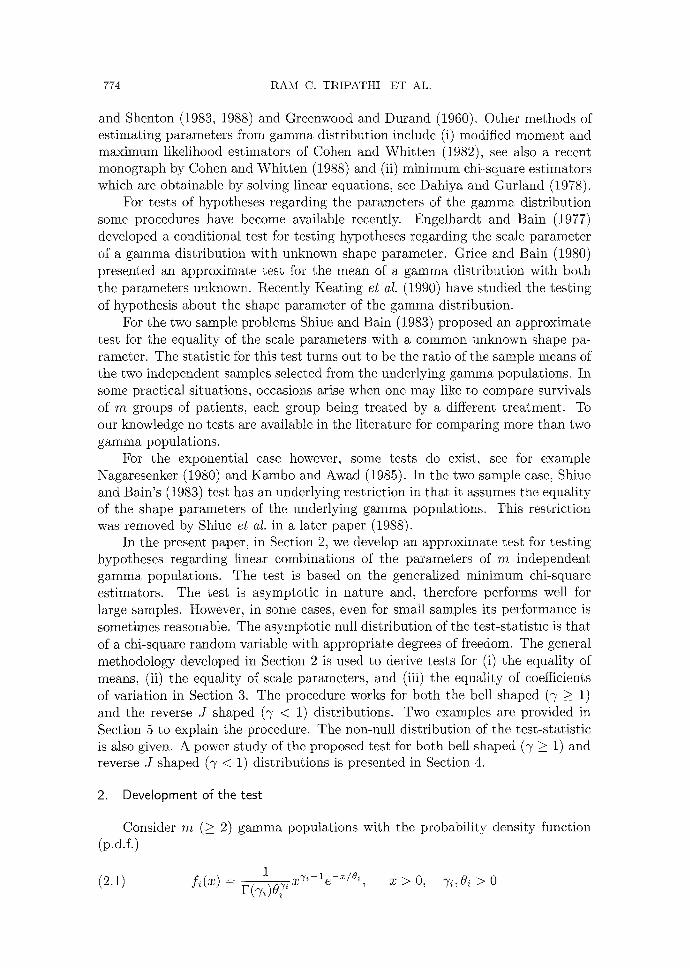
and Shenton (1983, 1988) and Greenwood and Durand (1960). Other methods of estimating parameters from gamma distribution include (i) modified moment and maximum likelihood estimators of Cohen and Whitten (1982), see also a recent monograph by Cohen and Whitten (1988) and (ii) minimum chi-square estimators which are obtainable by solving linear equations, see Dahiya and Gurland (1978).
For tests of hypotheses regarding the parameters of the gamma distribution some procedures have become available recently. Engelhardt and Bain (1977) developed a conditional test for testing hypotheses regarding the scale parameter of a gamma distribution with unknown shape parameter. Grice and Bain (1980) presented an approximate test for the mean of a gamma distribution with both the parameters unknown. Recently Keating ef al. (1990) have studied the testing of hypothesis about the shape parameter of the gamma distribution.
For the two sample problems Shiue and Bain (1983) proposed an approximate test for the equality of the scale parameters with a common unknown shape pa- rameter. The statistic for this test turns out to be the ratio of the sample means of the two independent samples selected from the underlying gamma populations. In some practical situations, occasions arise when one may like to compare survivals of m groups of patients, each group being treated by a different treatment. To our knowledge no tests are available in the literature for comparing more than two gamma populations.
For the exponential case however, some tests do exist, see for example Nagaresenker (1980) and Kambo and Awad (1985). In the two sample case, Shiue and Bain's (1983) test has an underlying restriction in that it assumes the equality of the shape parameters of the underlying gamma populations. This restriction was removed by Shiue st al. in a later paper (1988).
In the present paper, in Section 2, we develop an approximate test for testing hypotheses regarding linear combinations of the parameters of m independent gamma populations. The test is based on the generalized minimum chi-square estimators. The test is asymptotic in nature and, therefore performs well for large samples. However, in some eases, even for small samples its performance is sometimes reasonable. The asymptotic null distribution of the test-statistic is that of a chi-square random variable with appropriate degrees of freedom. The general methodology developed in Section 2 is used to derive tests for (i) the equality of means, (ii) the equality of scale parameters, and (iii) the equality of coefficients of variation in Section 3. The procedure works for both the bell shaped (7 >- 1) and the reverse J shaped (7 < 1) distributions. Two examples are provided in Section 5 to explain the procedure. The non-null distribution of the test-statistic is also given. A power study of the proposed test for both bell shaped (7 >- 1) and reverse J shaped (7 < 1) distributions is presented in Section 4.
2. Development of the test
Consider m (>_ 2) gamma populations with the probability density function (p.d.f.)
1 x ~ - l e -~/6~, x > O , 7 i , 0 i > 0 (2.1) f ~ ( x ) - r(7~)0{~
TESTS FOR INDEPENDENT GAMMA DISTRIBUTIONS 775
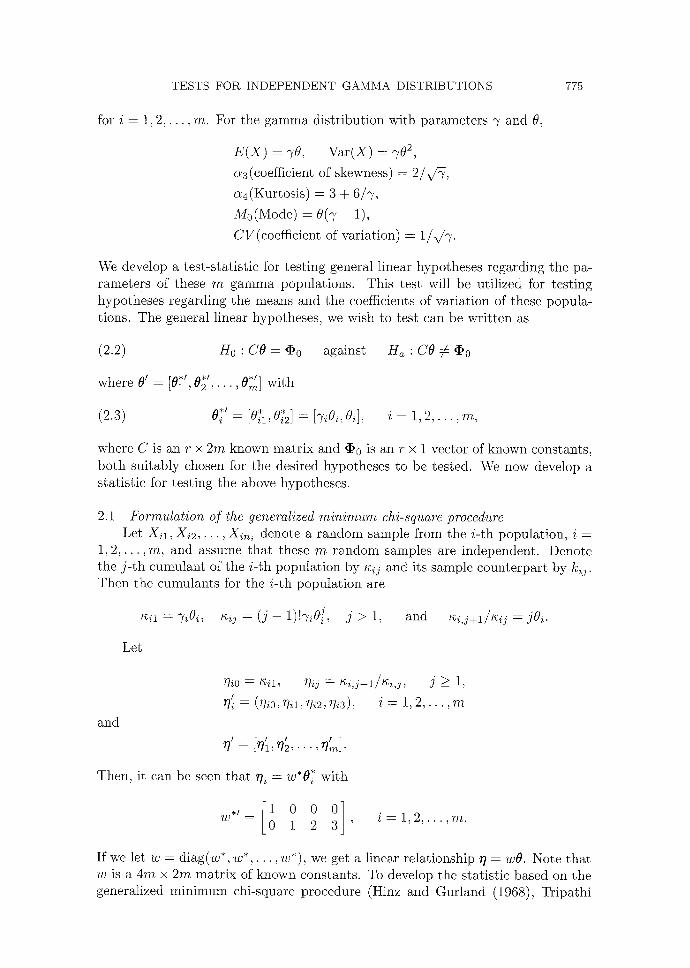
for i = 1, 2 , . . . , m. For the gamma distr ibut ion with parameters ? and 0,
E ( x ) = 70, Vat(X) = 7o ~, a3 (coefficient of skewness) = 2 / , / ~ ,
ct4(Kurtosis) = 3 + 6/7,
Mo(Mode) : 0(7 - 1),
CV(coefficient of variation) = 1/x/~.
We develop a test-stat is t ic for test ing general linear hypotheses regarding the pa- rameters of these m gamma populations. This test will be utilized for test ing hypotheses regarding the means and the coefficients of variat ion of these popula- tions. The general linear hypotheses, we wish to test can be wri t ten as
(2.2) H0 : CO = as0 against
where 0 ' = [011 , 0 ; / , . . . , 0 ~ ] with
(2.3) 01' = [0~, %] = [~,0~, 0d,
H~ : C0 ¢ ¢o
i = 1 , 2 , . . . , m ,
where C is an r × 2m known mat r ix and ¢0 is an r × 1 vector of known constants, bo th sui tably chosen for the desired hypotheses to be tested. We now develop a statist ic for testing the above hypotheses.
2.1 Formula t ion of the generalized m i n i m u m chi-square procedure Let Xil , X i 2 , . . . , X i ~ denote a random sample from the i - th populat ion, i -
1, 2 , . . . , m, and assume tha t these m random samples are independent . Denote the j - t h cumulant of the i- th popula t ion by I~ij and its sample counterpar t by kij. Then the cumulants for the i- th popula t ion are
~cil 7t0i, ~ij (j 1)T J = = - .?~Oi, j > 1, and ~ i , j + l / ~ j = jOi.
Let
and
~ i 0 = t ~ i l , ?~ij = t ~ i , j + l / t ~ i , j , j > 1,
771i = (rli0, r]im, ~]i2, Ui3), i = 1, 2 , . . . , m
! 7' = [~i, ~;,..., ~£.
Then, it can be seen that ~i = w*O~ with
°° 1 2 , i = 1 , 2 , . . . , m .
If we let w -- diag(w*, w * , . . . , w*), we get a linear relationship rl = wO. Note tha t w is a 4m × 2m mat r ix of known constants. To develop the statist ic based on the generalized minimum chi-square procedure (Hinz and Gur land (1968), Tr ipathi
776 RAM C. TRIPATHI ET AL.
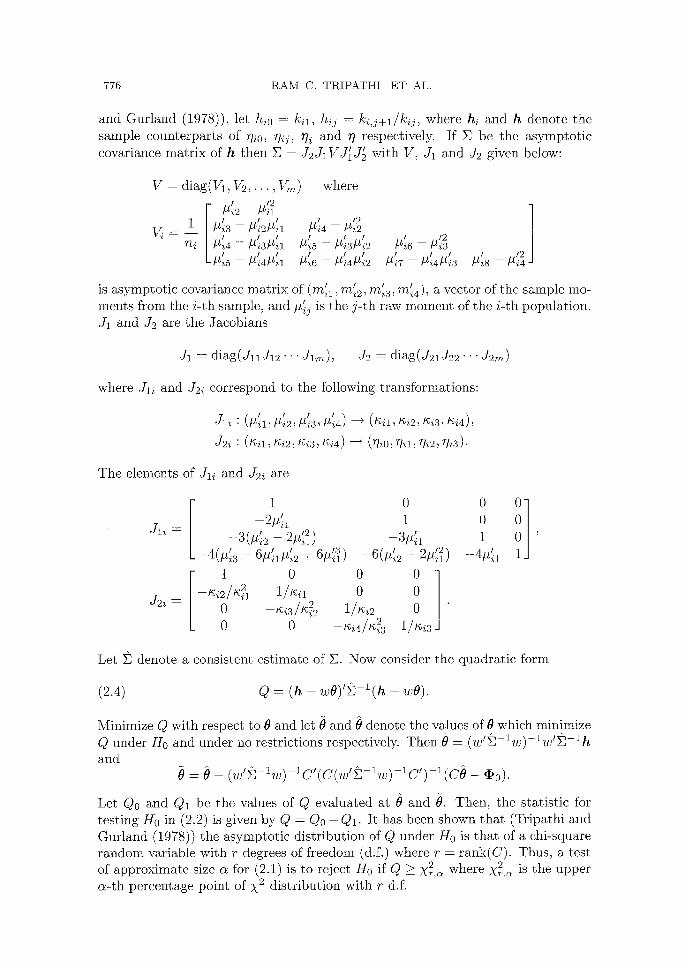
and Gurland (1978)), let h/o = k/,, h/j = k i , j + l / k i j , where h/ and h denote the sample counterparts of 77io, ?7/j, rh and r/ respectively. If E be the asymptot ic covariance matr ix of h then E = J2JIVJ~J£ with V, J1 and J2 given below:
V = diag(V1, V2, . . . , V~) where - t 12 . / ,u'/2 - ] 1 [ ~ , ~ t ,2
_ _ P i 3 - - P i 2 ] ~ i l ]~i4 - - P i 2 l l l I I l l 12
~ i : n i I / ' t i 4 - - P i 3 / ' t i l / Z i 5 - - P i 3 ~ i 2 / ~ i 6 - - / ~ i 3 1 1 I I I I 1 / l l 12
L - ~ i 4 ~ i l p i 6 - # i 4 ~ i 2 ]£i7 - ~ i 4 ~ i 3 ~ i 8 - p i 4
1 / / is asymptotic covariance matr ix of (ra{s, m/2 , m/3 , mi4), a vector of the sample too- is the j - t h raw moment of the i-th population. ments from the i-th sample, and #/j
J1 and if2 are the Jacobians
J1 = d iag(J l~J12. . . Jlm), ./2 = diag(J21J22- '- J2,~)
where J 1 / a n d J2/correspond to the following transformations:
J1/:(///1, ' ' ' /~i2, ]~i3,/~i4) ----+ (/gil, /~i2,/~i3,/g/4),
J 2 i : (/gil,/gi2,/%i3,/gi4) ----+ (?7/0, ?7/1, 77/2, ?7/3).
The elements of Jl i and J2/ are
J l i =
J 2 i =
I 1 --2p{1
1 I 2 / - -3(1~i2 -- 2 /~/1) I 1 I I3 L-4 (# /3 - 6#/1,u/2 + 6#/1)
1 0
0 0 0
0 1
0 0 0 0
1/~;/2 0 -- /gi4//gi23 1 / I g i 3
0 0 1
0 0 0 ' 1
Let E denote a consistent estimate of E. Now consider the quadratic form
(2.4) (~ ~- ( h -- w 0 ) / ~ - l ( h - w0) .
Minimize Q with respect to 0 and let 0 and 0 denote the values of 0 which minimize Q under Ho and under no restrictions respectively. Then 0 = (w'E l w ) - l w ' E - l h and
: 0 - - ( ~ ' ~ - % ) - ~ C ' ( C ( ~ ' ~ - % ) - ~ C ' ) - ~ ( C O - - ' ~ o ) .
Let Qo and Q1 be the values of Q evaluated at 0 and 0. Then, the statistic for testing H0 in (2.2) is given by Q = Qo - Q1. It has been shown tha t (Tripathi and Gurland (1978)) the asymptotic distribution of Q under H0 is tha t of a chi-square random variable with r degrees of freedom (d.f.) where r = rank(C). Thus, a test of approximate size c~ for (2.1) is to reject Ho if Q > x 2 where 2 X~-.~ is the upper a - th percentage point of ;V 2 distribution with r d.f.
T E S T S F O R I N D E P E N D E N T G A M M A D I S T R I B U T I O N S 777
3. Derivation of the tests
3.1 Test for equality of means In order to test the equali ty of means of the rn gamma populat ions, we need
to test (see equat ion (2.3))
(3.1) H o : 0~1 = 0~1 . . . . . 0* 1.
We can write the Ho in (3.1) as rn - 1 independent contrasts given by
{ 0 h - 0 Z x = 0
0~1 - - 0~n 1 = 0 (3.2) H o : .
0 ' _ 1 , 1 - - 0 * 1 ~ - - O .
By choosing
and
C =
i 0 0 0 0 0 0 1 0 0 0 0 0 0 1 0
0 0 0 0 0
0011] • .. 0 0 - 1 • .. 0 0 - 1
1 0 - 1
• ; = [ o o . . . o], l x m - 1
we can write (3.2) and hence (3.1) in the form of Ho : CO = ~I'o. In this case rank(C) rn 1. hence the asymptot ic distr ibution of Q under (3.1) is 2 = - - , ~ m - - l '
3.2 Test for equality of the scale parameters On utilizing the formulat ion presented above it is possible to test the equali ty
of the scale parameters of the rn gamma populat ions wi thout having to assume the equali ty of the shape parameters as in Shiue and Bain (1983). Again from equat ion (2.3), we wish to test
(3.3) Ho: 0{2 = % = % . . . . . 0 , 2
which can be wri t ten as rn - 1 linear contrast
012 - 0m2 - 0 0~2 - 0Z2 = 0
(3.4) H o : .
0 ' _ 1 , 2 - - 0 * 2 = 0.
By choosing
C z
0
i X ( m - - l )
0 1 0 0 . . . 0 0 0 - 1 0 0 0 1 . . . 0 0 0 - 1
0 0 0 . . . 0 1 0 - 1
= [ 0 0 - . . 0],
and
778 RAM C. TRIPATHI ET AL.
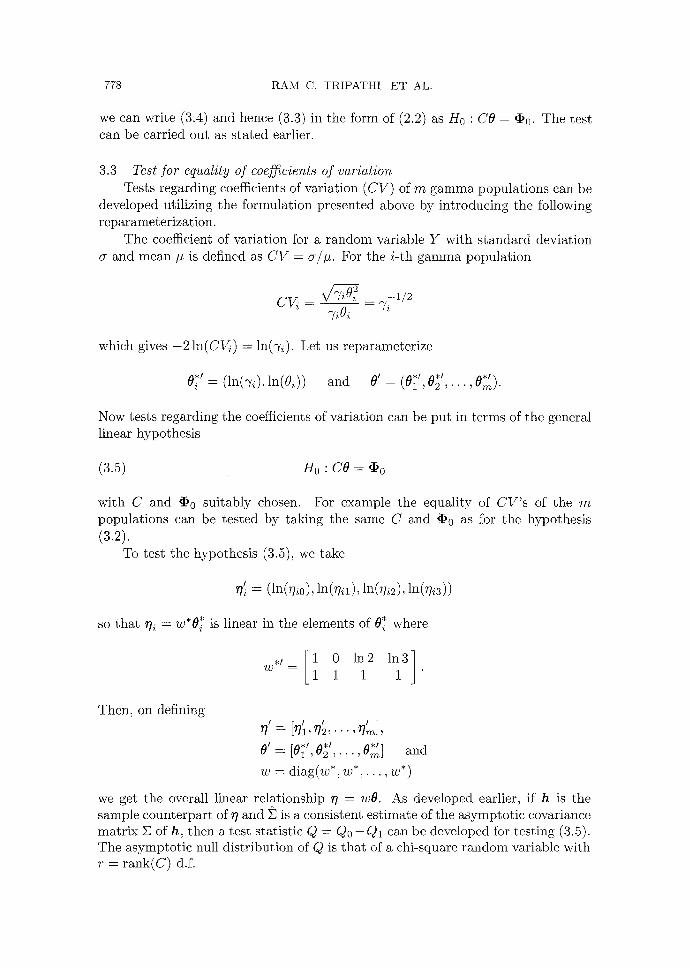
we can write (3.4) and hence (3.3) in the form of (2.2) as H0 : CO = ~0. The test can be carried out as stated earlier.
3.3 Test for equality of coefficients of variation Tests regarding coefficients of variation (CV) of m gamma populations can be
developed utilizing the formulation presented above by introducing the following reparameterization.
The coefficient of variation for a random variable Y with s tandard deviation and mean # is defined as C V = trip. For the i-th gamma population
cv - -1 /2 "/iOi -- 7i
which gives - 2 ln(CVi) = ln('yi). Let us reparameterize
0" (ln(~i) ln(Oi)) and O' g~*' A*' *' = , = \ v I , v 2 , . . . , 0 m ) .
Now tests regarding the coefficients of variation can be put in terms of the general linear hypothesis
(3.5) H0 : CO = Oo
with C and O0 suitably chosen. For example the equality of CV's of the m populations can be tested by taking the same C and (I)o as for the hypothesis (3.2).
To test the hypothesis (3.5), we take
~/~ = (in(rim), ln(77~1), ln(wi2), ln(wi3))
so tha t r h = w*O~ is linear in the elements of 0~ where
w , ~ = [1 0 ln2 ln3] 1 1 1 1 "
Then, on defining 7' =
= [el ,e2 ,...,e~'~] and
w = diag(w*, w*,..., w*)
we get the overall linear relationship ~7 = wO. As developed earlier, if h is the sample counterpart of r} and E is a consistent est imate of the asymptot ic covariance matr ix E of h, then a test statistic Q = Q0 - Q 1 can be developed for testing (3.5). The asymptot ic null distribution of Q is tha t of a chi-square random variable with r = rank(C) d.f.
TESTS FOR INDEPENDENT GAMMA DISTRIBUTIONS 779
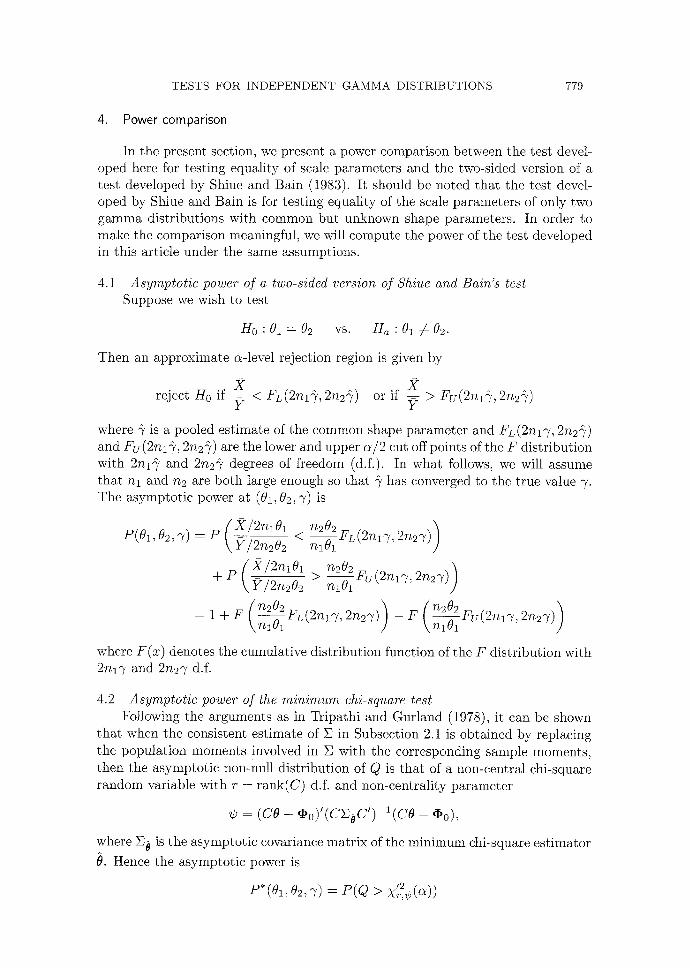
4. Power comparison
In the present section, we present a power comparison between the test devel- oped here for testing equality of scale parameters and the two-sided version of a test developed by Shiue and Bain (1983). It should be noted that the test devel- oped by Shiue and Bain is for testing equality of the scale parameters of only two gamma distributions with common but unknown shape parameters. In order to make the comparison meaningful, we will compute the power of the test developed in this article under the same assumptions.
4.1 Asymptotic power of a two-sided version of Shiue and Bain's test Suppose we wish to test
H0 : 01 = 02 vs. Ha : 01 ¢ 02.
Then an approximate a-level rejection region is given by
2 reject H0 if ~- < FL(2nl"~, 2n2@) or if ~ > Fu(2nl@, 2n2"~)
where @ is a pooled estimate of the common shape parameter and Fc(2n17, 2n2"~) and For (2n1@, 2n2~) are the lower and upper a/2 cut off points of the F distribution with 2n1~ and 2n2% degrees of freedom (d.f.). In what follows, we will assume that nl and n2 are both large enough so that ~/has converged to the true value 7. The asymptotic power at (01,02, 7) is
\Y/2n202(X/2n101 _ _n202 ~ ) P(01,02,~) = P < ~ L ( 2 n l ~ 2n2~)
< 2/2n101 _ _n~02 ~ ) -t- P > n ~ - e u ( 2 n l T , 2n27)
/ ~ 0 ~ ,~ ) / n ~ 0 ~ , ~ ) = 1 + F ~n--1-0~-1 rL[ZnlT, 2nzT) - F <n--~-1yg[Znx% 2n27)
where F(z) denotes the cmnulative distribution function of the F distribution with 2n17 and 2nz7 d.f.
4.2 Asymptotic power of the minimum chi-square test Following the arguments as in Tripathi and Gurland (1978), it can be shown
that when the consistent estimate of E in Subsection 2.1 is obtained by replacing the population moments involved in E with the corresponding sample moments, then the asymptotic non-null distribution of Q is that of a non-central chi-square random variable with r = rank(C) d.f. and non-centrality parameter
= (ce - ~o)'(cxoc')-l(ce - ~0),
where E0 is the asymptotic covariance matrix of the minimum chi-square estimator
0. Hence the asymptotic power is
780 RAM C. TRIPATHI ET AL.
0
0
0
©
,~
~)
.~
C"
.~
. ~
.~
~:~
. ~ ©
? .~
M
,.~
¢
~ ~ 0 ~ ~ ~ ~ ~ ~ 0 ~ ~ ~ 0 ~ ~ ~
~ ~ ~ 0 ~ ~ ~ ~ ~ 0 ~ ~ ~ ~ ~ ~ . . . . . . . . . . . . . . . . . . . .
~ ~ ~ ~ ~ ~ 0 ~ 0 0 ~ 0 ~ 0 ~ ~ 0 ~ 0 ~
~ ~ 0 ~ ~ 0 ~ 0 ~ ~ 0 ~ ~ q q ~ q q ~ q ~ q ~ q
~ ~ ~ ~ ~ L ~ ~ ~ ~ q q ~ ~ q q ~ q q ~ ~ q ~ ~ q ~
~ ~ ~ ~ ~ o ~ 0 ~ ~ o ~ ~ ~ 0 ~ 0 ~ ~
~ ~ ~ 0 ~ ~ ~ ~ ~ o ~ o o ~ 0 ~ ~ ~ 0 ~ ~
~ 0 ~ ~ 0 ~ ~ ~ ~ ~ q ~ ~ q ~ q N q ~ q N q ~ ~ q ~
~ ~
~ 0 ~ ~ ~ ~ ~ ~ ~ ~ O ~ ~ ~ L ~ O ~
TESTS FOR INDEPENDENT GAMMA DISTRIBUTIONS 781
0 ~ 0 ~ 0 ~ 0 ~ 0 ~ 0 ~ 0 ~ 0 ~ 0 ~ 0 ~
q ~ ~ q ~ ~ q ~ R q q ~ q q q ~ q q
b,- 0 b-- 0 0
782 RAM C. TRIPA TH I ET AL.
where X1~2~(a) is the upper a cut off point of a non-central chi-square random variable with r d.f. and non-centrality parameter ~b.
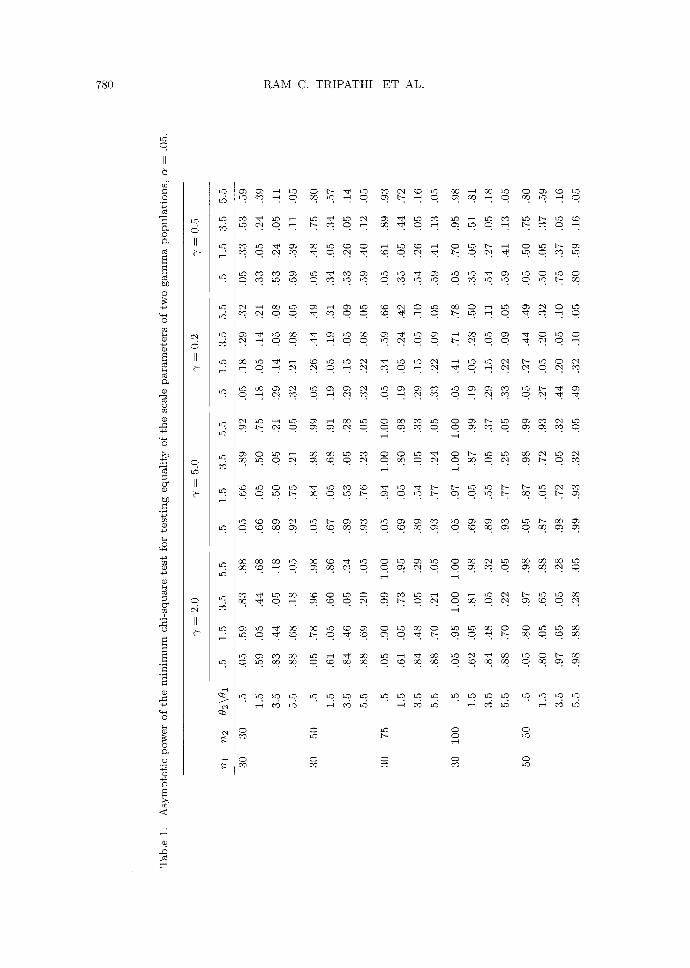
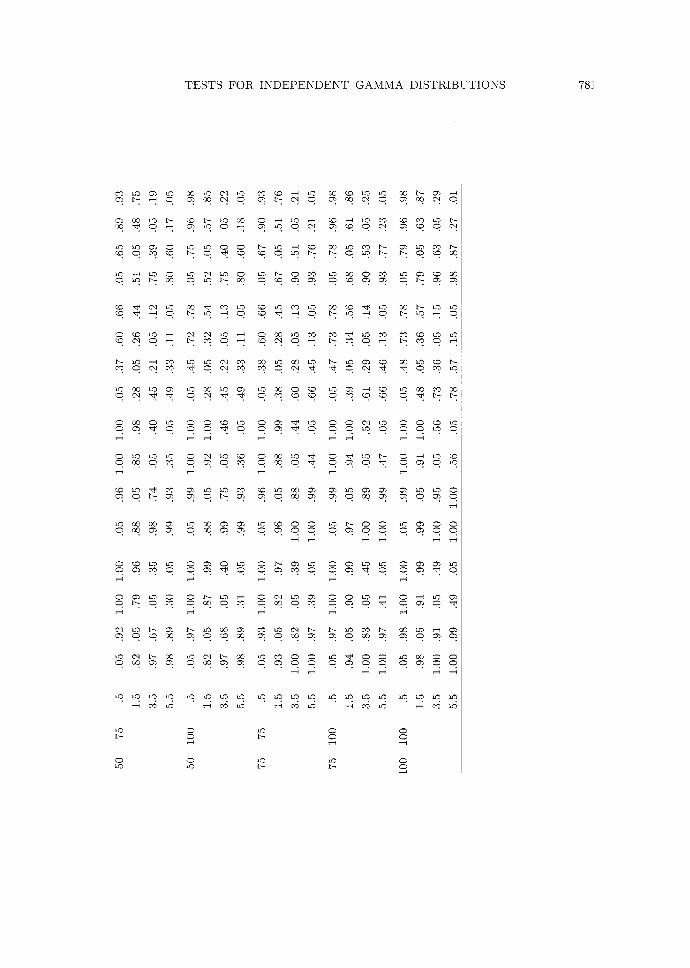
4.3 Comparison of the powers The asymptotic power of the minimum chi-square test is given in Table 1 for
a grid of the parameter values (01,02,7), for various sample size combinations (nl, n2) and for a = .05. This table contains values for both bell shaped (7 -> 1) and reverse J shaped (7 < 1) distributions. From the table it is clear that as the sample sizes increase the power increases, as expected. The powers also increase as 7 increases. The minimum chi-square test has somewhat low power in the vicinity of the 0-values under H0 but as the &values move away from H0, the power increases. For moderate sample sizes, the asymptotic power of the minimum chi- square test is fairly high especially when the 0-values are far from H0. Similar results were obtained for the power of the minimum chi-square test for c~ = .01.
Power calculations for the same grid of parameters and the sample size com- binations were also done on the two-sided version of Shiue and Bain's test. The powers of this test were always higher than the powers of the minimum chi-square test. For this reason, a similar table for the power of their test is not included and it is recommended that for two sample case their procedure should be preferred.
5. Examples
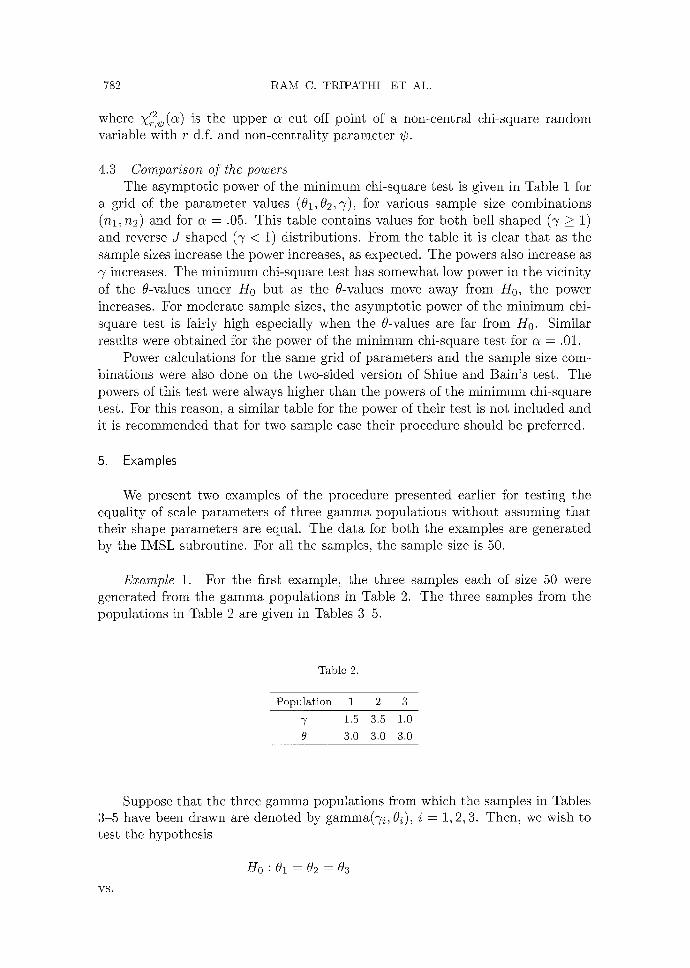
We present two examples of the procedure presented earlier for testing the equality of scale parameters of three gamma populations without assuming that their shape parameters are equal. The data for both the examples are generated by the IMSL subroutine. For all the samples, the sample size is 50.
Eaample 1. For the first example, the three samples each of size 50 were generated from the gamma populations in Table 2. The three samples from the populations in Table 2 are given in Tables 3-5.
Table 2.
Popula t ion 1 2 3
7 1.5 3.5 1.0
0 3.0 3.0 3.0
Suppose that the three gamma populations from which the samples in Tables 3-5 have been drawn are denoted by gamma(7i , 0i), i = 1, 2, 3. Then, we wish to test the hypothesis
H0 : 01 = 02 = 63
VS.
TESTS F O R I N D E P E N D E N T G A M M A D I S T R I B U T I O N S
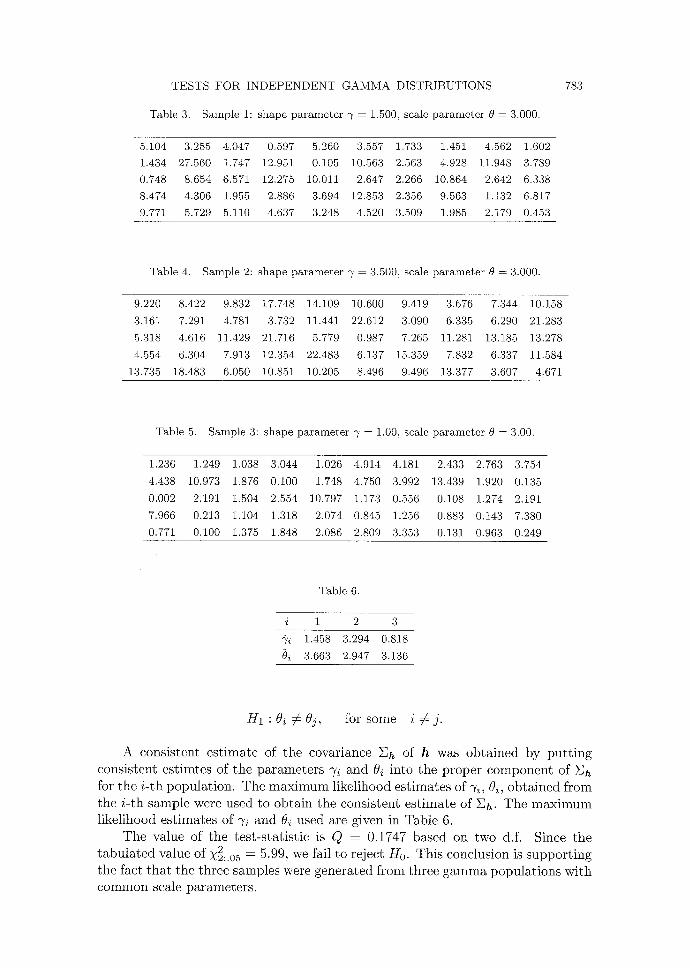
Table 3. Sample 1: shape pa ramete r 3 ̀= 1.500, scale pa ramete r 0 = 3.000.
783
5.104 3.255 4.047 0.597 5.260 3.557 1.733 1.451 4.562 1.602
1.434 27.560 1.747 12.951 0.105 10.563 2.563 4.928 11.948 3.789
0.748 8.654 6.571 12.275 10.011 2.647 2.266 10.864 2.642 6.338
8.474 4.306 1.955 2.886 3.694 12.853 2.356 9.563 1.132 6.817
9.771 5.729 5.110 4.637 3.248 4.520 3.509 1.985 2.179 0.453
Table 4. Sample 2: shape pa ramete r 3' = 3.500, scale pa ramete r 0 = 3.000.
9.220 8.422 9.832 17.748 14.109 10.600 9.419 3.676 7.344 10.158
3.161 7.291 4.781 3.732 11.441 22.612 3.090 6.335 6.290 21.283
5.318 4.616 11.429 21.716 5.779 0.987 7.265 11.281 13.185 13.278
4.554 6.304 7.913 12.354 22.483 6.137 15.359 7.832 6.337 11.584
13.735 18.483 6.050 10.851 10.205 8.496 9.496 13.377 3.607 4.671
Table 5. Sample 3: shape pa ramete r 3 ̀= 1.00, scale pa ramete r 0 = 3.00.
1.236 1.249 1.038 3.044 1.026 4.914 4.181 2.433 2.763 3.754
4.438 10.973 1.876 0.100 1.748 4.750 3.992 13.439 1.920 0.135
0.002 2.191 1.504 2.554 10.797 1.173 0.556 0.108 1.274 2.191
7.966 0.213 1.104 1.318 2.074 0.845 1.256 0.883 0.143 7.380
0.771 0.100 1.375 1.848 2.086 2.809 3.353 0.131 0.963 0.249
Table 6.
i 1 2 3
~ 1.458 3.294 0.818
O~ 3.663 2.947 3.136
Hl:Oi¢Oj, for some i 7 ~j.
A consistent estimate of the covariance Eh of h was obtained by putting consistent estimtes of the parameters 7i and 0i into the proper component of Eh for the i-th population. The maximum likelihood estimates of ~i, Oi, obtained from the i-th sample were used to obtain the consistent estimate of Eh. The maximum likelihood estimates of 7i and 0~ used are given in Table 6.
The value of the test-statistic is Q = 0.1747 based on two d.f. Since the tabulated value of 2 ?42;.05 = 5.99, we fail to reject H0. This conclusion is supporting the fact that the three samples were generated from three gamma populations with common scale parameters.
784 R A M C. T R I P A T H I ET AL.
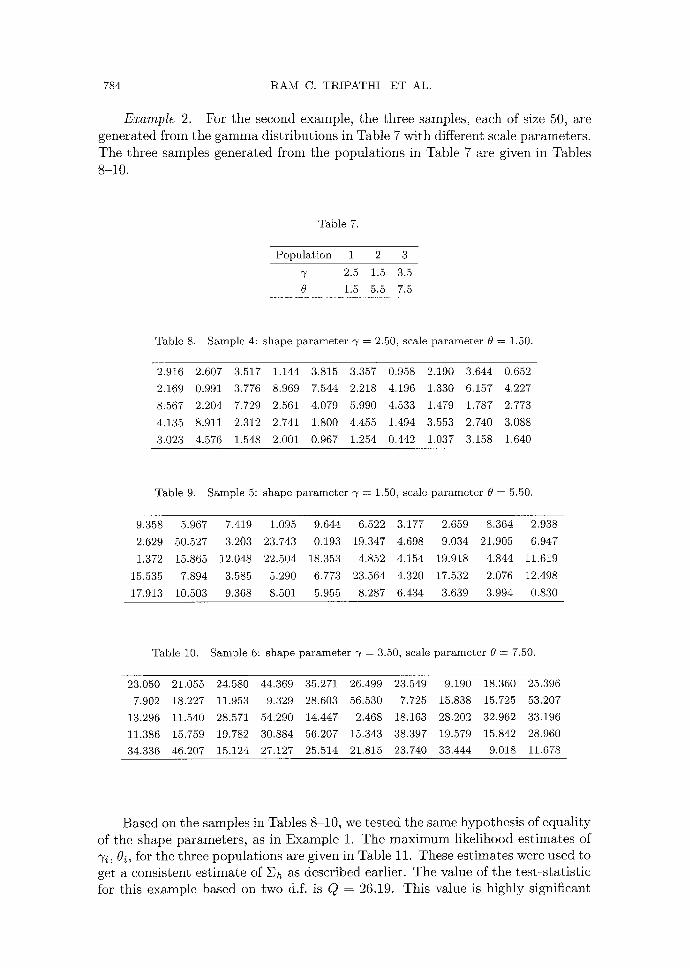
Example 2. For the second example, the three samples, each of size 50, are generated from the gamma distributions in Table 7 with different scale parameters. The three samples generated from the populations in Table 7 are given in Tables 8-10.
Table 7.
Popula t ion 1 2 3
2.5 1.5 3.5
0 1.5 5.5 7.5
Table 8. Sample 4: shape pa ramete r ~ = 2.50, scale pa ramete r 0 = 1.50.
2.916 2.607 3.517 1.144 3.815 3.357 0.958 2.190 3.644 0.652
2.169 0.991 3.776 8.969 7.544 2.218 4.196 1.330 6.157 4.227
8.567 2.204 7.729 2.561 4.079 5.990 4.533 1.479 1.787 2.773
4.135 8.911 2.312 2.741 1.800 4.455 1.494 3.553 2.740 3.088
3.023 4.576 1.548 2.001 0.967 1.254 0.442 1.037 3.158 1.640
Table 9. Sample 5: shape pa ramete r ~ /= 1.50, scale pa ramete r 0 = 5.50.
9.358 5.967 7.419 1.095 9.644 6.522 3.177 2.659 8.364 2.938
2.629 50.527 3.203 23.743 0.193 19.347 4.698 9.034 21.905 6.947
1.372 15.865 12.048 22.504 18.353 4.852 4.154 19.918 4.844 11.619
15.535 7.894 3.585 5.290 6.773 23.564 4.320 17.532 2.076 12.498
17.913 10.503 9.368 8.501 5.955 8.287 6.434 3.639 3.994 0.830
Table 10. Sample 6: shape pa ramete r "~ = 3.50, scale pa ramete r 0 = 7.50.
23.050 21.055 24.580 44.369 35.271 26.499 23.549 9.190 18.360 25.396
7.902 18.227 11.953 9.329 28.603 56.530 7.725 15.838 15.725 53.207
13.296 11.540 28.571 54.290 14.447 2.468 18.163 28.202 32.962 33.196
11.386 15.759 19.782 30.884 56.207 15.343 38.397 19.579 15.842 28.960
34.336 46.207 15.124 27.127 25.514 21.815 23.740 33.444 9.018 11.678
Based on the samples in Tables 8-10, we tested the same hypothesis of equality of the shape parameters, as in Example 1. The maximum likelihood estimates of 7i, 0i, for the three populations are given in Table 11. These estimates were used to get a consistent estimate of Eh as described earlier. The value of the test-statistic for this example based on two d.f. is Q = 26.19. This value is highly significant
T E S T S FO R I N D E P E N D E N T G A M M A D I S T R I B U T I O N S 785
Table 11.
i 1 2 3
x/t 2.505 1.458 3.294
0~ 1.301 6.714 7.368
as it should be because the scale parameters for the three populations from which the samples are generated are quite different.
6. Discussions
The tests based on the generalized minimum chi-square procedure presented here are asymptotic in nature, and, therefore, perform welt for large samples. However, in some cases, even for small samples, their performance is sometimes reasonable. These procedures can be used to test hypotheses regarding the pa- rameters of more than two gamma populations. The tests are general enough to include testing hypotheses regarding means, scale parameters, shape parameters, etc. In order to carry out these tests no restrictions are needed on the nuisance parameters such as the assumption of common shape parameters made for testing equality of the scale parameters. On the other hand, Shiue and Bain's test has the disadvantage that it cannot conveniently be extended for more than two gamma populations. Thus, the tests presented here have some attractive features and hence are useful for certain practical situations.
Acknowledgements
The authors are thankful to the referees and the Editorial Committee for
careful reading of the manuscripts and some useful comments which improved the presentation.
REFERENCES
Bowman, K. O. and Shenton, L. R. (1983). Max imum likelihood es t imators for the g a m m a dis t r ibut ion revisited, Comm. Statist. Simulation Comput., 12, 697 710.
Bowman, K. O. and Shenton, L. R. (1988). Properties of Estimators for the Gamma Distribution, Marcel Dekker, New York.
Cohen, A. C. and Whi t t en , B. J. (1982). Modified moment and max imum likelihood est ima- tors for pa ramete r s of the three pa rame te r g a m m a dis t r ibut ion, Comm. Statist. Simulation Comput., 11, 197 216.
Cohen, A. C. and Whi t t en , B. J. (1988). Parameter Estimation in Reliability and Life Span Models, Marcel Dekker, New York.
Crow, E. L. (1977). Min imum variance unbiased es t imators of the ra t io of means of two log- normal variates and of two g a m m a variates, Comm. Statist. Theory Methods, 6, 96~975 .
Dahiya, R. C. and Gurland, J. (1978). Es t ima t ing the pa ramete r s of a g a m m a dis t r ibut ion, Trabajos Estadistica Investigacion Oper., 29(2), 81-87.
Drenick, R. F. (1960). The failure of complex equipment , Journal for the Society of Industrial and Applied Mathematics, 8, 680-690.
786 RAM C. TRIPATHI ET AL.
Engelhardt, M. and Bain, L. J. (1977). Uniformly most powerful unbiased tests on the scale parameter of a gamma distribution with a nuisance shape parameter, Technometrics, 2, 77-81.
Greenwood, J. A. and Durand, D. (1960). Aids for fitting the gamma distribution by maximum likelihood, Technometrics, 1, 55-65.
Grice, J. V. and Bain, L. J. (1980). Inferences concerning the mean of the gamma distribution, J. Amer. Statist. Assoc., 75, 929-933.
Gross, A. J. and Clark, V. A. (1975). Survival Distribution: Reliability Applications in the Biomedical Sciences, Wiley, New York.
Gupta, S. S. and Groll, P. A. (1961). Gamma distribution in acceptance sampling based on life tests, J. Amer. Statist. Assoc., 56, 942-970.
Hinz, P. N. and Gurland, J. (1968). A method of analyzing untransformed data from the negative binomial and other contagious distributions, Biometrika, 55, 315 322.
Johnson, N. L. and Kotz, S. (1970). Continuous Univariate Distribution, Vol. 1, Wiley, New York.
Kambo, N. S. and Awad, A. M. (1985). Testing equality of location parameters of K exponential distributions, Comm. Statist. Theory Methods, 14, 567-585.
Keating, J. P., Glaser, R. E. and Ketchum, N. S. (1990). Testing hypotheses about the shape parameter of a gamma distribution, Technometrics, 32, 67-82.
Lawless, J. F. (1982). Statistical Models and Methods for Life Time Data, Wiley, New York. Nagaresenker, P. B. (1980). On a test of equality of several exponential distributions, Biometrika,
67, 475 484. Shiue, W. K. and Bain, L. J. (1983). A two sample test of equal gamma distributions scale
parameters with unknown common shape parameter, Technometrics, 25, 377-381. Shiue, W. K., Bain, L. J. and Engelhardt, M. (1988). Test of equal gamma distribution means
with unknown and unequal shape parameters, Technometries, 30, 169 174. Tripathi, R. C. and Gurland, J. (1978). Tests of hypotheses in some families of discrete distri-
butions, Bulletin of the Greek Mathematics Society, 19, 217-239.

![STATISTICAL APPROACH TO TESTS INVOLVING …statweb.stanford.edu/~susan/papers/chapihp04.pdfconfidence regions (and very nicely illustrated in the Cartoon Guide to Statistics [31])](https://img.pdfslide.us/doc/110x75/5ecf3cc15c3fc722990ef060/statistical-approach-to-tests-involving-susanpaperschapihp04pdf-conidence-regions.jpg)