Embed Size (px)
Citation preview
Statistical Supplement
First Quarter 2021
Analyst Coverage and Credit Ratings 1Notes 2Consolidated
Consolidated Statements of Income (Loss) 3Consolidated Balance Sheets 4Earnings, Shares and Return on Equity 5Key Stakeholder Metrics 6Segment and Sources of Earnings 7Select Earnings Drivers By Segment 8Sales By Segment 9Operating Revenues and General and Administrative Expenses By Segment 10Operating Commissions and Other Expenses 11Interest Rate Yields and Spreads By Segment 12
Select Earnings and Operational Data from Business Segments
Annuities 13Retirement Plan Services 14Life Insurance 15Group Protection 16Other Operations 17
DAC & Account Value Rollforwards
Consolidated DAC, VOBA, DSI and DFEL Roll Forwards 18Account Value Roll Forwards:
Annuities 19Retirement Plan Services 20Life Insurance 21
Other Information
Select Investment Data 22Realized Gain (Loss), After-DAC 23Select GAAP to Non-GAAP Reconciliations 24
Lincoln Financial GroupTable of Contents
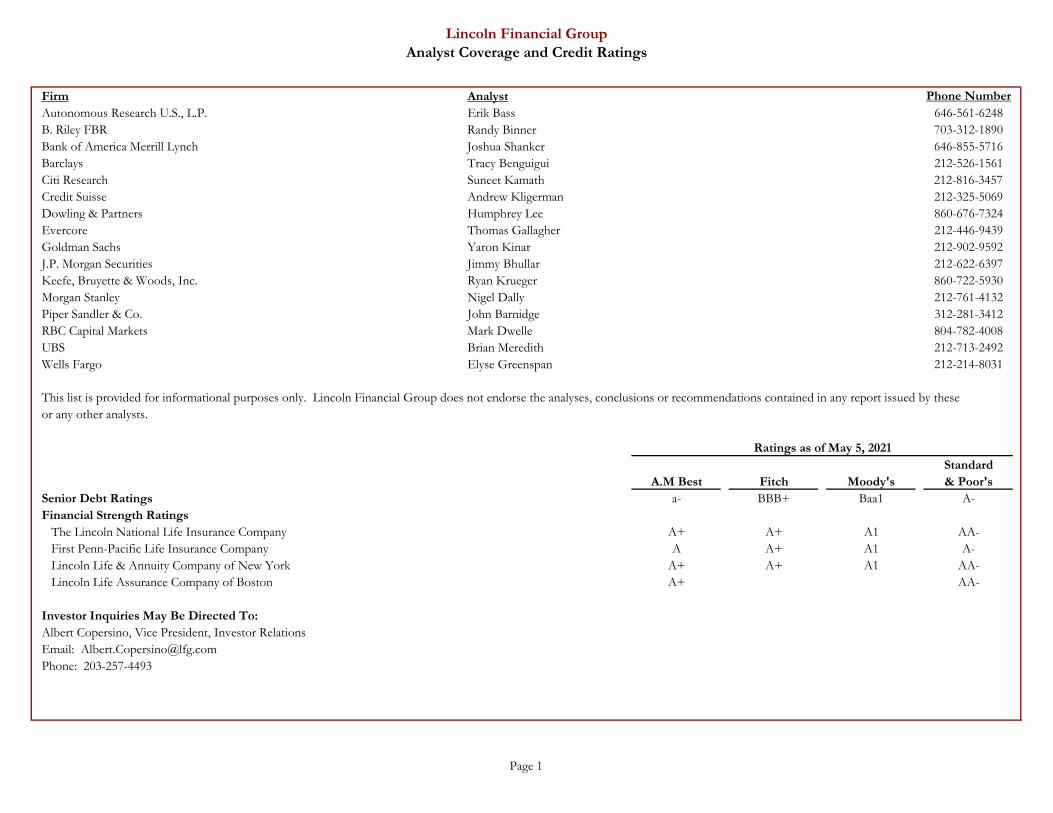
Firm AnalystAutonomous Research U.S., L.P. Erik Bass 646-561-6248B. Riley FBR Randy Binner 703-312-1890Bank of America Merrill Lynch Joshua Shanker 646-855-5716Barclays Tracy Benguigui 212-526-1561Citi Research Suneet Kamath 212-816-3457Credit Suisse Andrew Kligerman 212-325-5069Dowling & Partners Humphrey Lee 860-676-7324Evercore Thomas Gallagher 212-446-9439Goldman Sachs Yaron Kinar 212-902-9592J.P. Morgan Securities Jimmy Bhullar 212-622-6397Keefe, Bruyette & Woods, Inc. Ryan Krueger 860-722-5930Morgan Stanley Nigel Dally 212-761-4132Piper Sandler & Co. John Barnidge 312-281-3412RBC Capital Markets Mark Dwelle 804-782-4008UBS Brian Meredith 212-713-2492Wells Fargo Elyse Greenspan 212-214-8031
StandardA.M Best Fitch Moody's & Poor's
Senior Debt Ratings a- BBB+ Baa1 A-Financial Strength Ratings
The Lincoln National Life Insurance Company A+ A+ A1 AA-First Penn-Pacific Life Insurance Company A A+ A1 A-Lincoln Life & Annuity Company of New York A+ A+ A1 AA-Lincoln Life Assurance Company of Boston A+ AA-
Investor Inquiries May Be Directed To:Albert Copersino, Vice President, Investor RelationsEmail: [email protected]: 203-257-4493
Phone Number
or any other analysts.
Ratings as of May 5, 2021
Lincoln Financial GroupAnalyst Coverage and Credit Ratings
This list is provided for informational purposes only. Lincoln Financial Group does not endorse the analyses, conclusions or recommendations contained in any report issued by these
Page 1
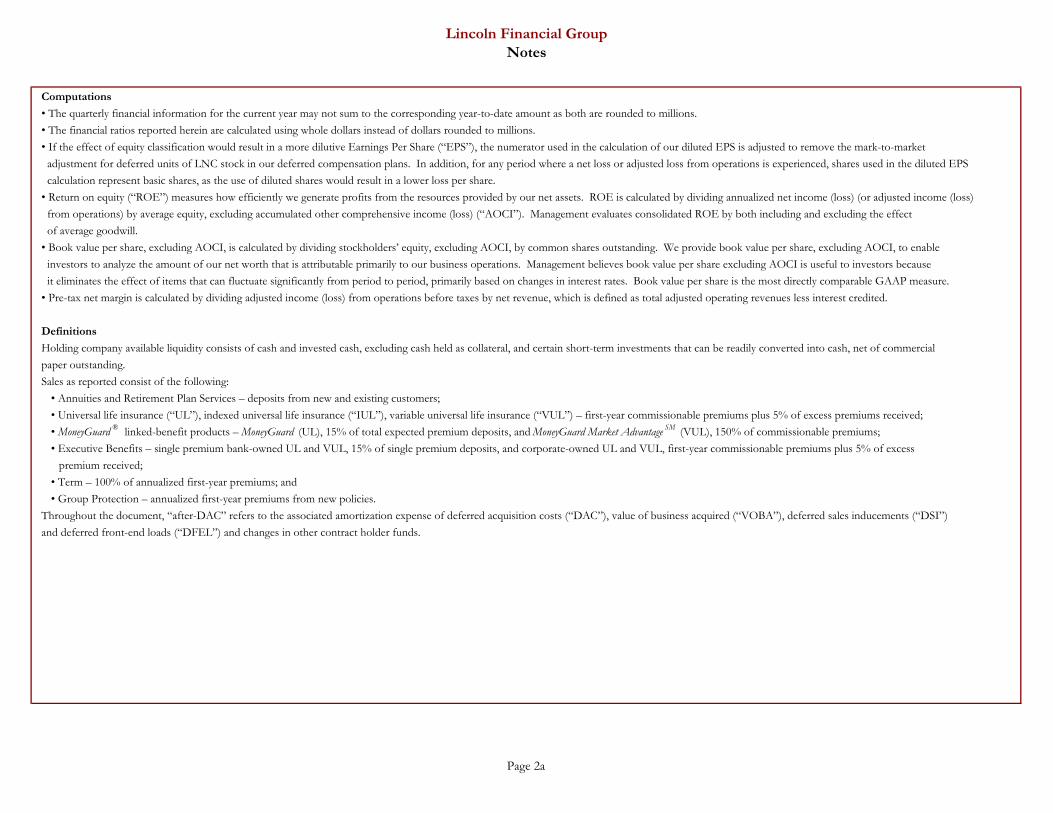
Computations
Definitions
• The quarterly financial information for the current year may not sum to the corresponding year-to-date amount as both are rounded to millions.• The financial ratios reported herein are calculated using whole dollars instead of dollars rounded to millions.• If the effect of equity classification would result in a more dilutive Earnings Per Share (“EPS”), the numerator used in the calculation of our diluted EPS is adjusted to remove the mark-to-market adjustment for deferred units of LNC stock in our deferred compensation plans. In addition, for any period where a net loss or adjusted loss from operations is experienced, shares used in the diluted EPS calculation represent basic shares, as the use of diluted shares would result in a lower loss per share.• Return on equity (“ROE”) measures how efficiently we generate profits from the resources provided by our net assets. ROE is calculated by dividing annualized net income (loss) (or adjusted income (loss) from operations) by average equity, excluding accumulated other comprehensive income (loss) (“AOCI”). Management evaluates consolidated ROE by both including and excluding the effect of average goodwill.• Book value per share, excluding AOCI, is calculated by dividing stockholders’ equity, excluding AOCI, by common shares outstanding. We provide book value per share, excluding AOCI, to enable investors to analyze the amount of our net worth that is attributable primarily to our business operations. Management believes book value per share excluding AOCI is useful to investors because it eliminates the effect of items that can fluctuate significantly from period to period, primarily based on changes in interest rates. Book value per share is the most directly comparable GAAP measure.• Pre-tax net margin is calculated by dividing adjusted income (loss) from operations before taxes by net revenue, which is defined as total adjusted operating revenues less interest credited.
Holding company available liquidity consists of cash and invested cash, excluding cash held as collateral, and certain short-term investments that can be readily converted into cash, net of commercial
and deferred front-end loads (“DFEL”) and changes in other contract holder funds.
• Annuities and Retirement Plan Services – deposits from new and existing customers;Sales as reported consist of the following:
Lincoln Financial GroupNotes
paper outstanding.
Throughout the document, “after-DAC” refers to the associated amortization expense of deferred acquisition costs (“DAC”), value of business acquired (“VOBA”), deferred sales inducements (“DSI”) • Group Protection – annualized first-year premiums from new policies.• Term – 100% of annualized first-year premiums; and
• Universal life insurance (“UL”), indexed universal life insurance (“IUL”), variable universal life insurance (“VUL”) – first-year commissionable premiums plus 5% of excess premiums received;
premium received;
• MoneyGuard ® linked-benefit products – MoneyGuard (UL), 15% of total expected premium deposits, and MoneyGuard Market Advantage SM (VUL), 150% of commissionable premiums;• Executive Benefits – single premium bank-owned UL and VUL, 15% of single premium deposits, and corporate-owned UL and VUL, first-year commissionable premiums plus 5% of excess
Page 2a
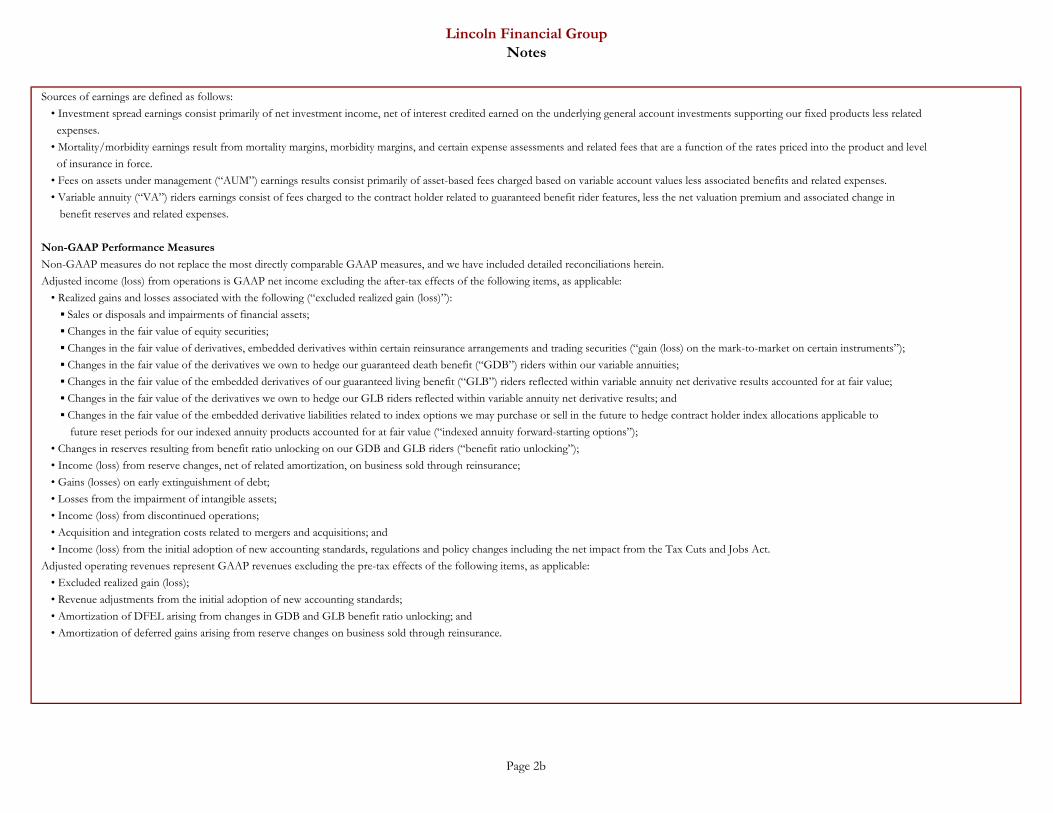
• Acquisition and integration costs related to mergers and acquisitions; and• Income (loss) from the initial adoption of new accounting standards, regulations and policy changes including the net impact from the Tax Cuts and Jobs Act.
▪ Changes in the fair value of equity securities;▪ Changes in the fair value of derivatives, embedded derivatives within certain reinsurance arrangements and trading securities (“gain (loss) on the mark-to-market on certain instruments”);
• Fees on assets under management (“AUM”) earnings results consist primarily of asset-based fees charged based on variable account values less associated benefits and related expenses.• Variable annuity (“VA”) riders earnings consist of fees charged to the contract holder related to guaranteed benefit rider features, less the net valuation premium and associated change in
Adjusted income (loss) from operations is GAAP net income excluding the after-tax effects of the following items, as applicable:
Non-GAAP Performance Measures
• Income (loss) from reserve changes, net of related amortization, on business sold through reinsurance;
• Revenue adjustments from the initial adoption of new accounting standards;• Amortization of DFEL arising from changes in GDB and GLB benefit ratio unlocking; and• Amortization of deferred gains arising from reserve changes on business sold through reinsurance.
▪ Sales or disposals and impairments of financial assets;
• Excluded realized gain (loss);
▪ Changes in the fair value of the derivatives we own to hedge our GLB riders reflected within variable annuity net derivative results; and▪ Changes in the fair value of the embedded derivative liabilities related to index options we may purchase or sell in the future to hedge contract holder index allocations applicable to
future reset periods for our indexed annuity products accounted for at fair value (“indexed annuity forward-starting options”);
Adjusted operating revenues represent GAAP revenues excluding the pre-tax effects of the following items, as applicable:
• Losses from the impairment of intangible assets;• Income (loss) from discontinued operations;
• Gains (losses) on early extinguishment of debt;
▪ Changes in the fair value of the derivatives we own to hedge our guaranteed death benefit (“GDB”) riders within our variable annuities;▪ Changes in the fair value of the embedded derivatives of our guaranteed living benefit (“GLB”) riders reflected within variable annuity net derivative results accounted for at fair value;
• Changes in reserves resulting from benefit ratio unlocking on our GDB and GLB riders (“benefit ratio unlocking”);
Lincoln Financial GroupNotes
Sources of earnings are defined as follows:• Investment spread earnings consist primarily of net investment income, net of interest credited earned on the underlying general account investments supporting our fixed products less related expenses.
of insurance in force.
benefit reserves and related expenses.
• Realized gains and losses associated with the following (“excluded realized gain (loss)”):
Non-GAAP measures do not replace the most directly comparable GAAP measures, and we have included detailed reconciliations herein.
• Mortality/morbidity earnings result from mortality margins, morbidity margins, and certain expense assessments and related fees that are a function of the rates priced into the product and level
Page 2b
Statistical Supplement is Dated
Lincoln Financial GroupNotes
Management believes that the non-GAAP performance measures previously discussed explain the results of our ongoing businesses in a manner that allows for a better understanding of the underlyingtrends in our current business as the excluded items are unpredictable and not necessarily indicative of current operating fundamentals or future performance of the business segments, and, in manyinstances, decisions regarding these items do not necessarily relate to the operations of the individual segments. In addition, we believe that our definitions of adjusted operating revenues and adjusted income from operations provide investors with more valuable measures of our performance as they better reveal trends in our business.
The financial data in this document is dated May 5, 2021, and has not been updated since that date. Lincoln Financial Group does not intend to update this document.
Page 2c

Consolidated
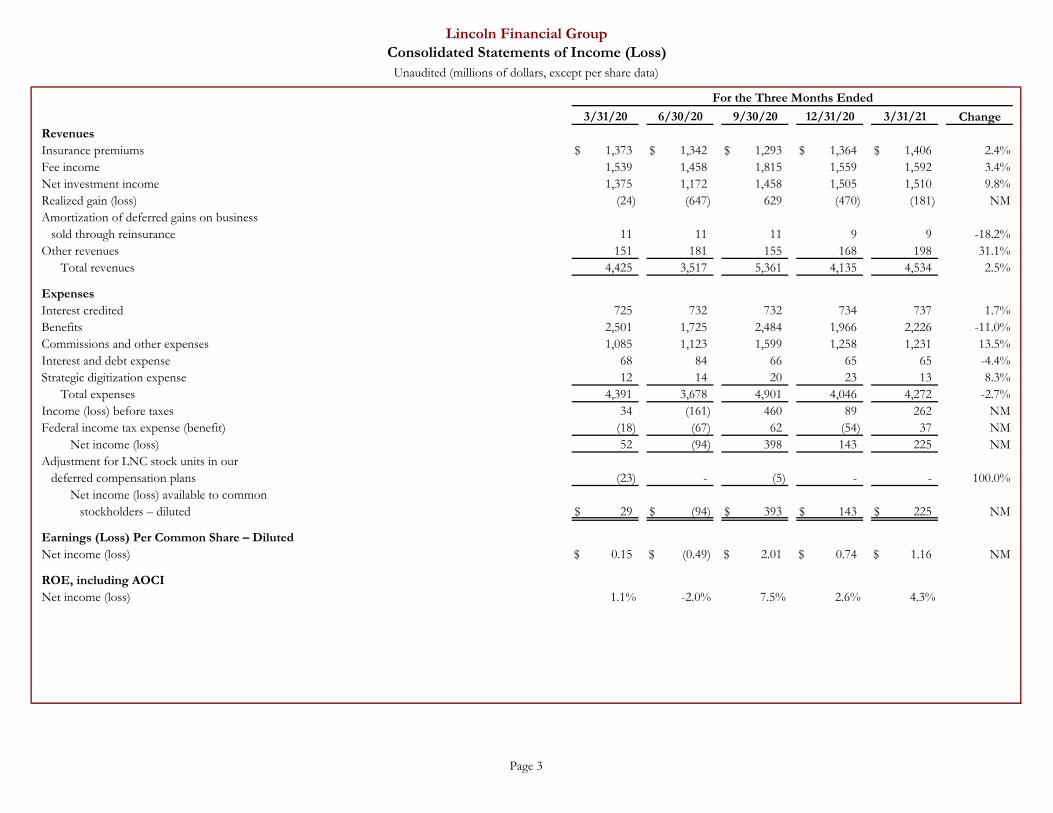
ChangeRevenuesInsurance premiums $ 1,373 $ 1,342 $ 1,293 $ 1,364 $ 1,406 2.4%Fee income 1,539 1,458 1,815 1,559 1,592 3.4%Net investment income 1,375 1,172 1,458 1,505 1,510 9.8%Realized gain (loss) (24) (647) 629 (470) (181) NMAmortization of deferred gains on business
sold through reinsurance 11 11 11 9 9 -18.2%Other revenues 151 181 155 168 198 31.1%
Total revenues 4,425 3,517 5,361 4,135 4,534 2.5%
ExpensesInterest credited 725 732 732 734 737 1.7%Benefits 2,501 1,725 2,484 1,966 2,226 -11.0%Commissions and other expenses 1,085 1,123 1,599 1,258 1,231 13.5%Interest and debt expense 68 84 66 65 65 -4.4%Strategic digitization expense 12 14 20 23 13 8.3%
Total expenses 4,391 3,678 4,901 4,046 4,272 -2.7%Income (loss) before taxes 34 (161) 460 89 262 NMFederal income tax expense (benefit) (18) (67) 62 (54) 37 NM
Net income (loss) 52 (94) 398 143 225 NMAdjustment for LNC stock units in our
deferred compensation plans (23) - (5) - - 100.0%Net income (loss) available to common
stockholders – diluted $ 29 $ (94) $ 393 $ 143 $ 225 NM
Earnings (Loss) Per Common Share – DilutedNet income (loss) $ 0.15 $ (0.49) $ 2.01 $ 0.74 $ 1.16 NM
ROE, including AOCINet income (loss) 1.1% -2.0% 7.5% 2.6% 4.3%
3/31/20 6/30/20 9/30/20 12/31/20 3/31/21
Lincoln Financial GroupConsolidated Statements of Income (Loss)
Unaudited (millions of dollars, except per share data)
For the Three Months Ended
Page 3
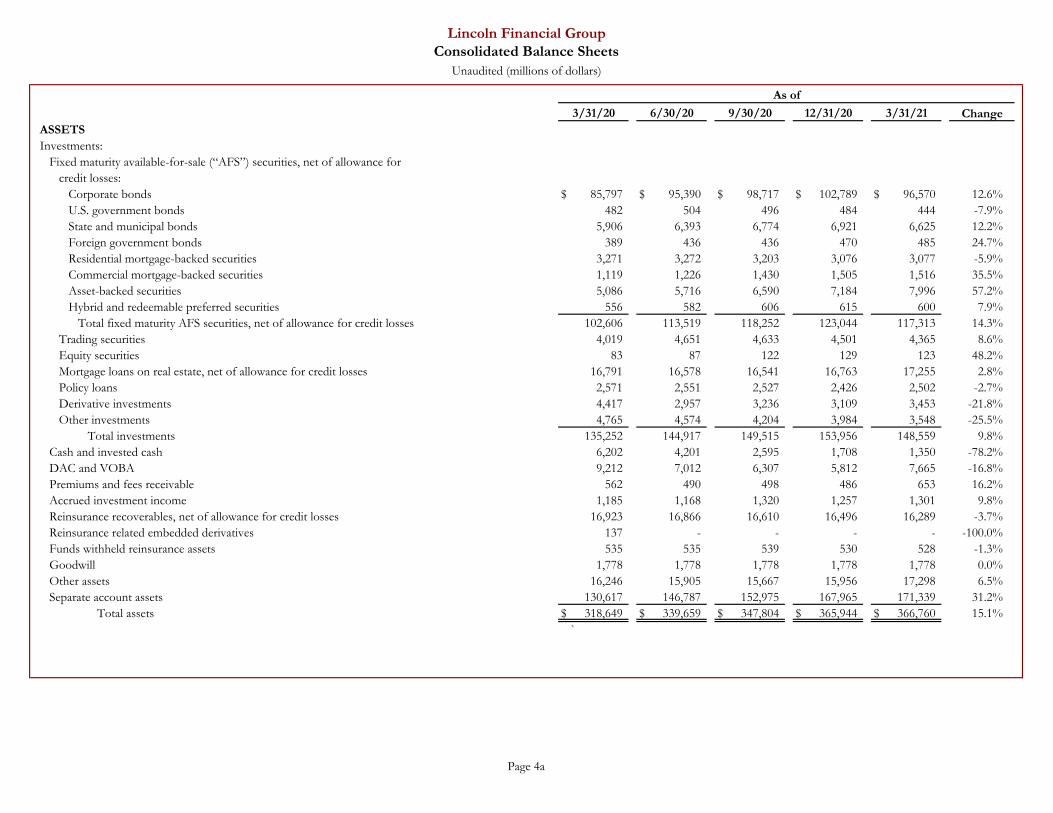
ChangeASSETSInvestments:
Fixed maturity available-for-sale (“AFS”) securities, net of allowance forcredit losses:
Corporate bonds $ 85,797 $ 95,390 $ 98,717 $ 102,789 $ 96,570 12.6%U.S. government bonds 482 504 496 484 444 -7.9%State and municipal bonds 5,906 6,393 6,774 6,921 6,625 12.2%Foreign government bonds 389 436 436 470 485 24.7%Residential mortgage-backed securities 3,271 3,272 3,203 3,076 3,077 -5.9%Commercial mortgage-backed securities 1,119 1,226 1,430 1,505 1,516 35.5%Asset-backed securities 5,086 5,716 6,590 7,184 7,996 57.2%Hybrid and redeemable preferred securities 556 582 606 615 600 7.9%
Total fixed maturity AFS securities, net of allowance for credit losses 102,606 113,519 118,252 123,044 117,313 14.3%Trading securities 4,019 4,651 4,633 4,501 4,365 8.6%Equity securities 83 87 122 129 123 48.2%Mortgage loans on real estate, net of allowance for credit losses 16,791 16,578 16,541 16,763 17,255 2.8%Policy loans 2,571 2,551 2,527 2,426 2,502 -2.7%Derivative investments 4,417 2,957 3,236 3,109 3,453 -21.8%Other investments 4,765 4,574 4,204 3,984 3,548 -25.5%
Total investments 135,252 144,917 149,515 153,956 148,559 9.8%Cash and invested cash 6,202 4,201 2,595 1,708 1,350 -78.2%DAC and VOBA 9,212 7,012 6,307 5,812 7,665 -16.8%Premiums and fees receivable 562 490 498 486 653 16.2%Accrued investment income 1,185 1,168 1,320 1,257 1,301 9.8%Reinsurance recoverables, net of allowance for credit losses 16,923 16,866 16,610 16,496 16,289 -3.7%Reinsurance related embedded derivatives 137 - - - - -100.0%Funds withheld reinsurance assets 535 535 539 530 528 -1.3%Goodwill 1,778 1,778 1,778 1,778 1,778 0.0%Other assets 16,246 15,905 15,667 15,956 17,298 6.5%Separate account assets 130,617 146,787 152,975 167,965 171,339 31.2%
Total assets $ 318,649 $ 339,659 $ 347,804 $ 365,944 $ 366,760 15.1%`
Lincoln Financial GroupConsolidated Balance Sheets
Unaudited (millions of dollars)
As of
3/31/20 6/30/20 9/30/20 12/31/20 3/31/21
Page 4a
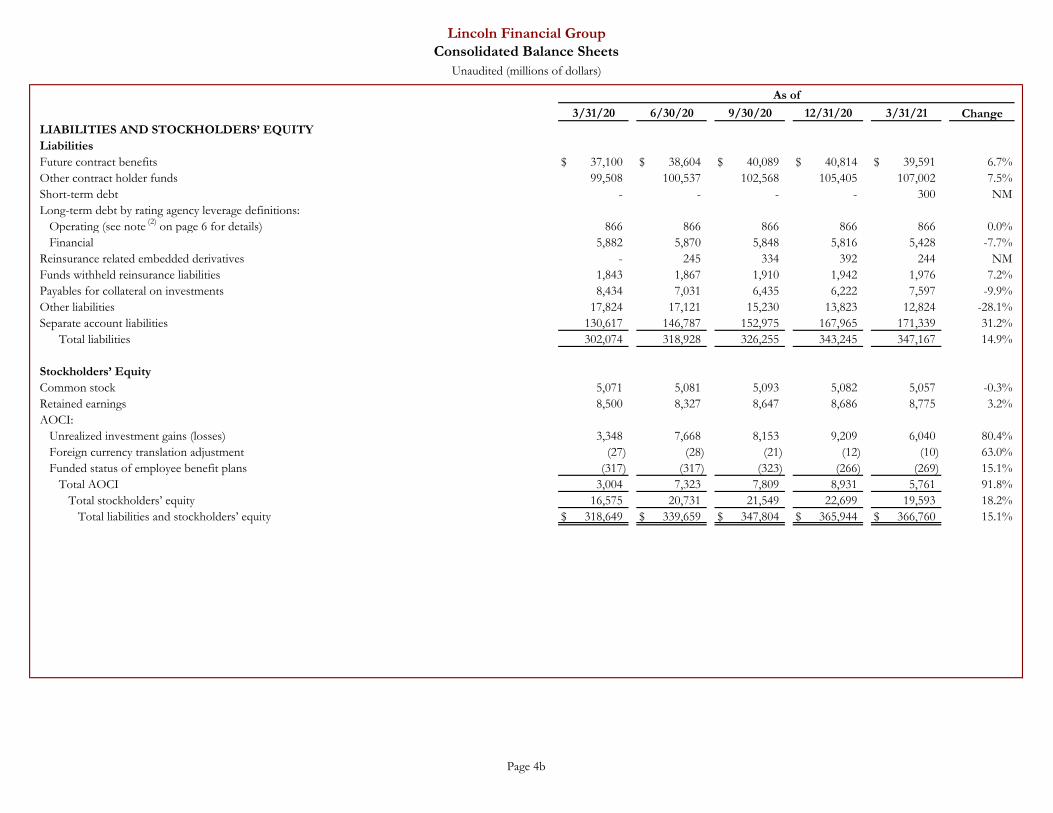
ChangeLIABILITIES AND STOCKHOLDERS’ EQUITYLiabilitiesFuture contract benefits $ 37,100 $ 38,604 $ 40,089 $ 40,814 $ 39,591 6.7%Other contract holder funds 99,508 100,537 102,568 105,405 107,002 7.5%Short-term debt - - - - 300 NMLong-term debt by rating agency leverage definitions:
Operating (see note (2) on page 6 for details) 866 866 866 866 866 0.0%Financial 5,882 5,870 5,848 5,816 5,428 -7.7%
Reinsurance related embedded derivatives - 245 334 392 244 NMFunds withheld reinsurance liabilities 1,843 1,867 1,910 1,942 1,976 7.2%Payables for collateral on investments 8,434 7,031 6,435 6,222 7,597 -9.9%Other liabilities 17,824 17,121 15,230 13,823 12,824 -28.1%Separate account liabilities 130,617 146,787 152,975 167,965 171,339 31.2%
Total liabilities 302,074 318,928 326,255 343,245 347,167 14.9%
Stockholders’ EquityCommon stock 5,071 5,081 5,093 5,082 5,057 -0.3%Retained earnings 8,500 8,327 8,647 8,686 8,775 3.2%AOCI:
Unrealized investment gains (losses) 3,348 7,668 8,153 9,209 6,040 80.4%Foreign currency translation adjustment (27) (28) (21) (12) (10) 63.0%Funded status of employee benefit plans (317) (317) (323) (266) (269) 15.1%
Total AOCI 3,004 7,323 7,809 8,931 5,761 91.8%Total stockholders’ equity 16,575 20,731 21,549 22,699 19,593 18.2%
Total liabilities and stockholders’ equity $ 318,649 $ 339,659 $ 347,804 $ 365,944 $ 366,760 15.1%
Lincoln Financial GroupConsolidated Balance Sheets
Unaudited (millions of dollars)
As of
3/31/20 6/30/20 9/30/20 12/31/20 3/31/21
Page 4b
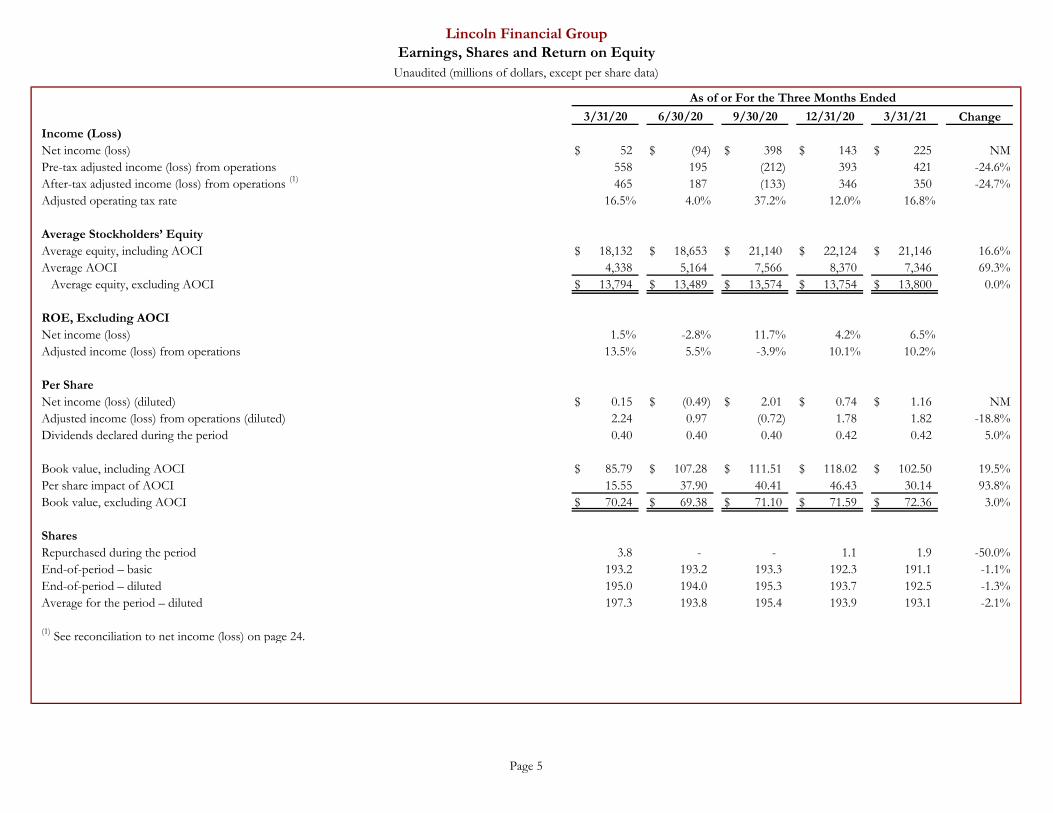
ChangeIncome (Loss)Net income (loss) $ 52 $ (94) $ 398 $ 143 $ 225 NMPre-tax adjusted income (loss) from operations 558 195 (212) 393 421 -24.6%After-tax adjusted income (loss) from operations (1) 465 187 (133) 346 350 -24.7%Adjusted operating tax rate 16.5% 4.0% 37.2% 12.0% 16.8%
Average Stockholders’ EquityAverage equity, including AOCI $ 18,132 $ 18,653 $ 21,140 $ 22,124 $ 21,146 16.6%Average AOCI 4,338 5,164 7,566 8,370 7,346 69.3%
Average equity, excluding AOCI $ 13,794 $ 13,489 $ 13,574 $ 13,754 $ 13,800 0.0%
ROE, Excluding AOCINet income (loss) 1.5% -2.8% 11.7% 4.2% 6.5%Adjusted income (loss) from operations 13.5% 5.5% -3.9% 10.1% 10.2%
Per ShareNet income (loss) (diluted) $ 0.15 $ (0.49) $ 2.01 $ 0.74 $ 1.16 NMAdjusted income (loss) from operations (diluted) 2.24 0.97 (0.72) 1.78 1.82 -18.8%Dividends declared during the period 0.40 0.40 0.40 0.42 0.42 5.0%
Book value, including AOCI $ 85.79 $ 107.28 $ 111.51 $ 118.02 $ 102.50 19.5%Per share impact of AOCI 15.55 37.90 40.41 46.43 30.14 93.8%Book value, excluding AOCI $ 70.24 $ 69.38 $ 71.10 $ 71.59 $ 72.36 3.0%
SharesRepurchased during the period 3.8 - - 1.1 1.9 -50.0%End-of-period – basic 193.2 193.2 193.3 192.3 191.1 -1.1%End-of-period – diluted 195.0 194.0 195.3 193.7 192.5 -1.3%Average for the period – diluted 197.3 193.8 195.4 193.9 193.1 -2.1%
(1) See reconciliation to net income (loss) on page 24.
3/31/20 6/30/20 9/30/20 12/31/20 3/31/21
Lincoln Financial GroupEarnings, Shares and Return on Equity
Unaudited (millions of dollars, except per share data)
As of or For the Three Months Ended
Page 5
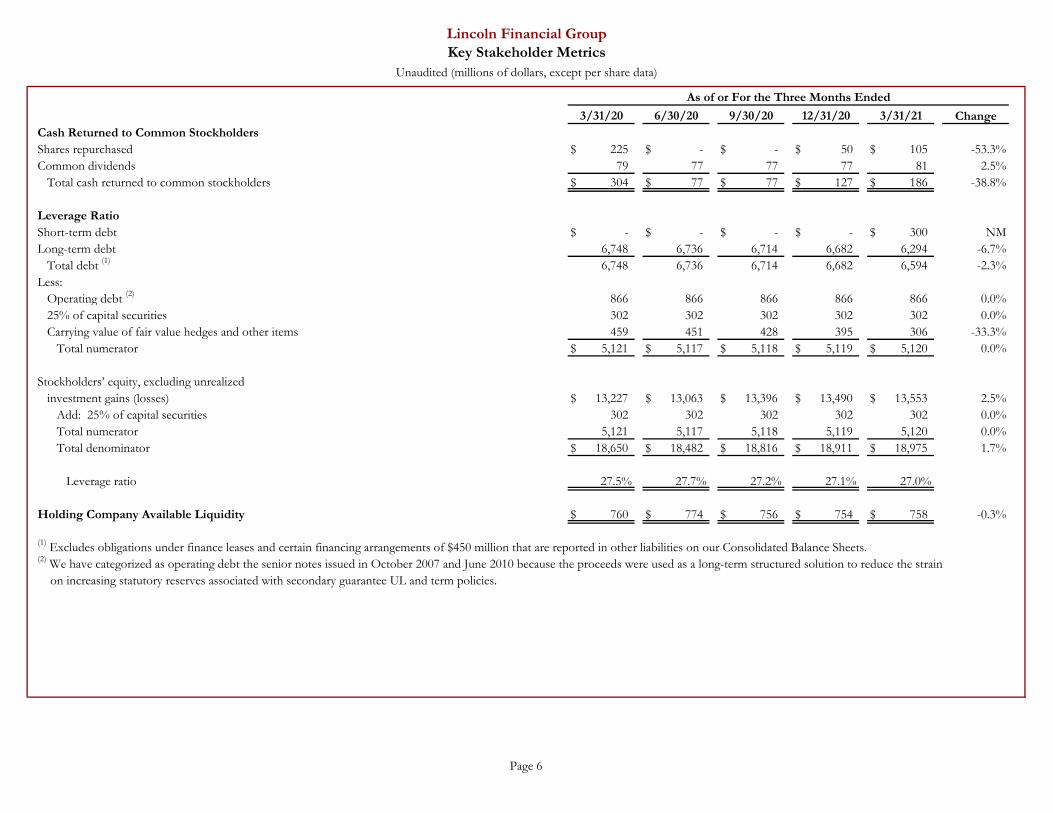
ChangeCash Returned to Common StockholdersShares repurchased $ 225 $ - $ - $ 50 $ 105 -53.3%Common dividends 79 77 77 77 81 2.5%
Total cash returned to common stockholders $ 304 $ 77 $ 77 $ 127 $ 186 -38.8%
Leverage RatioShort-term debt $ - $ - $ - $ - $ 300 NMLong-term debt 6,748 6,736 6,714 6,682 6,294 -6.7%
Total debt (1) 6,748 6,736 6,714 6,682 6,594 -2.3%Less:
Operating debt (2) 866 866 866 866 866 0.0%25% of capital securities 302 302 302 302 302 0.0%Carrying value of fair value hedges and other items 459 451 428 395 306 -33.3%
Total numerator $ 5,121 $ 5,117 $ 5,118 $ 5,119 $ 5,120 0.0%
Stockholders’ equity, excluding unrealized investment gains (losses) $ 13,227 $ 13,063 $ 13,396 $ 13,490 $ 13,553 2.5%
Add: 25% of capital securities 302 302 302 302 302 0.0%Total numerator 5,121 5,117 5,118 5,119 5,120 0.0%Total denominator $ 18,650 $ 18,482 $ 18,816 $ 18,911 $ 18,975 1.7%
Leverage ratio 27.5% 27.7% 27.2% 27.1% 27.0%
Holding Company Available Liquidity $ 760 $ 774 $ 756 $ 754 $ 758 -0.3%
Lincoln Financial GroupKey Stakeholder Metrics
Unaudited (millions of dollars, except per share data)
As of or For the Three Months Ended
3/31/20 6/30/20 9/30/20 12/31/20 3/31/21
(1) Excludes obligations under finance leases and certain financing arrangements of $450 million that are reported in other liabilities on our Consolidated Balance Sheets.(2) We have categorized as operating debt the senior notes issued in October 2007 and June 2010 because the proceeds were used as a long-term structured solution to reduce the strain
on increasing statutory reserves associated with secondary guarantee UL and term policies.
Page 6
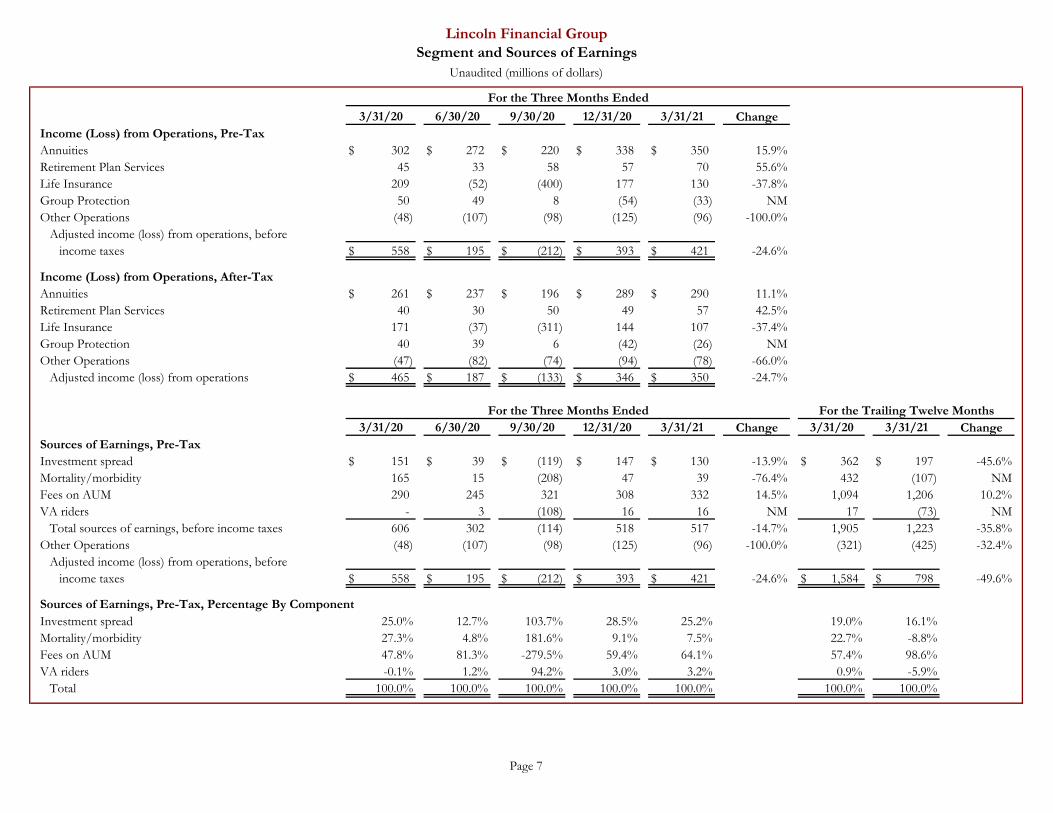
ChangeIncome (Loss) from Operations, Pre-TaxAnnuities $ 302 $ 272 $ 220 $ 338 $ 350 15.9%Retirement Plan Services 45 33 58 57 70 55.6%Life Insurance 209 (52) (400) 177 130 -37.8%Group Protection 50 49 8 (54) (33) NMOther Operations (48) (107) (98) (125) (96) -100.0%
Adjusted income (loss) from operations, before income taxes $ 558 $ 195 $ (212) $ 393 $ 421 -24.6%
Income (Loss) from Operations, After-TaxAnnuities $ 261 $ 237 $ 196 $ 289 $ 290 11.1%Retirement Plan Services 40 30 50 49 57 42.5%Life Insurance 171 (37) (311) 144 107 -37.4%Group Protection 40 39 6 (42) (26) NMOther Operations (47) (82) (74) (94) (78) -66.0%
Adjusted income (loss) from operations $ 465 $ 187 $ (133) $ 346 $ 350 -24.7%
Change ChangeSources of Earnings, Pre-TaxInvestment spread $ 151 $ 39 $ (119) $ 147 $ 130 -13.9% $ 362 $ 197 -45.6%Mortality/morbidity 165 15 (208) 47 39 -76.4% 432 (107) NMFees on AUM 290 245 321 308 332 14.5% 1,094 1,206 10.2%VA riders - 3 (108) 16 16 NM 17 (73) NM
Total sources of earnings, before income taxes 606 302 (114) 518 517 -14.7% 1,905 1,223 -35.8%Other Operations (48) (107) (98) (125) (96) -100.0% (321) (425) -32.4%
Adjusted income (loss) from operations, before income taxes $ 558 $ 195 $ (212) $ 393 $ 421 -24.6% $ 1,584 $ 798 -49.6%
Investment spread 25.0% 12.7% 103.7% 28.5% 25.2% 19.0% 16.1%Mortality/morbidity 27.3% 4.8% 181.6% 9.1% 7.5% 22.7% -8.8%Fees on AUM 47.8% 81.3% -279.5% 59.4% 64.1% 57.4% 98.6%VA riders -0.1% 1.2% 94.2% 3.0% 3.2% 0.9% -5.9%
Total 100.0% 100.0% 100.0% 100.0% 100.0% 100.0% 100.0%
For the Three Months Ended For the Trailing Twelve Months3/31/20
Sources of Earnings, Pre-Tax, Percentage By Component
3/31/216/30/20
Lincoln Financial GroupSegment and Sources of Earnings
Unaudited (millions of dollars)
For the Three Months Ended
3/31/20 6/30/20 9/30/20 12/31/20 3/31/21
9/30/20 12/31/20 3/31/21 3/31/20
Page 7
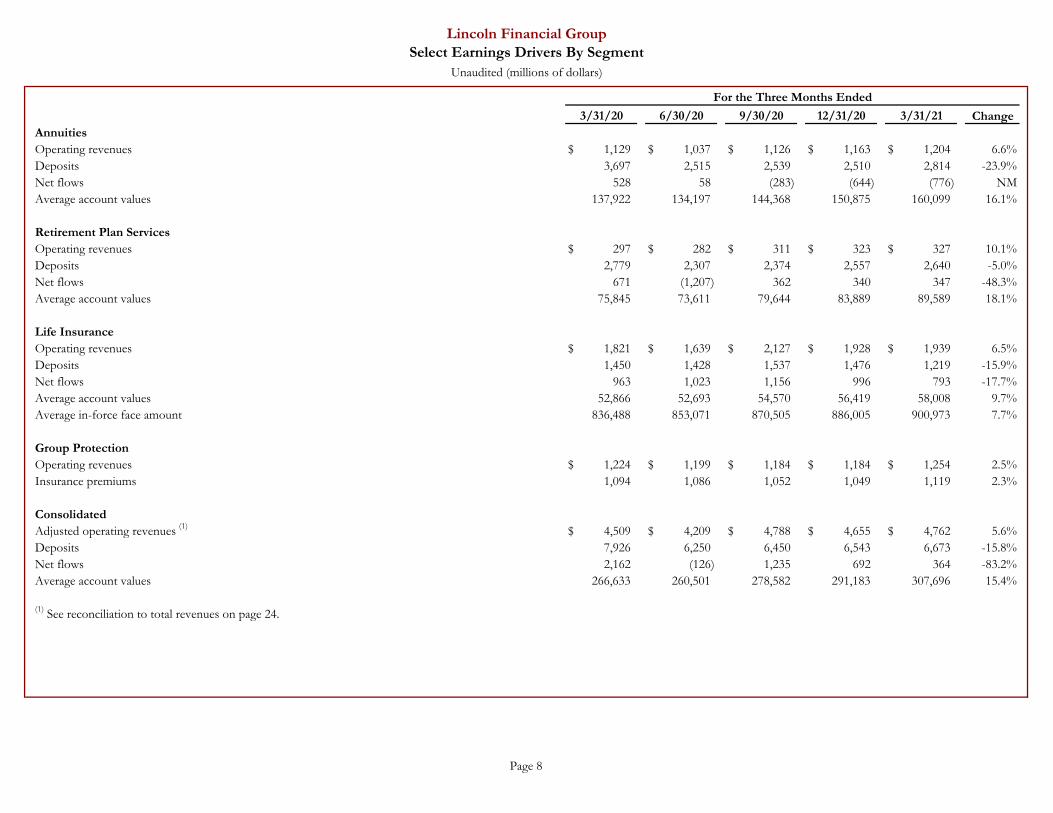
ChangeAnnuitiesOperating revenues $ 1,129 $ 1,037 $ 1,126 $ 1,163 $ 1,204 6.6%Deposits 3,697 2,515 2,539 2,510 2,814 -23.9%Net flows 528 58 (283) (644) (776) NMAverage account values 137,922 134,197 144,368 150,875 160,099 16.1%
Retirement Plan ServicesOperating revenues $ 297 $ 282 $ 311 $ 323 $ 327 10.1%Deposits 2,779 2,307 2,374 2,557 2,640 -5.0%Net flows 671 (1,207) 362 340 347 -48.3%Average account values 75,845 73,611 79,644 83,889 89,589 18.1%
Life InsuranceOperating revenues $ 1,821 $ 1,639 $ 2,127 $ 1,928 $ 1,939 6.5%Deposits 1,450 1,428 1,537 1,476 1,219 -15.9%Net flows 963 1,023 1,156 996 793 -17.7%Average account values 52,866 52,693 54,570 56,419 58,008 9.7%Average in-force face amount 836,488 853,071 870,505 886,005 900,973 7.7%
Group ProtectionOperating revenues $ 1,224 $ 1,199 $ 1,184 $ 1,184 $ 1,254 2.5%Insurance premiums 1,094 1,086 1,052 1,049 1,119 2.3%
ConsolidatedAdjusted operating revenues (1) $ 4,509 $ 4,209 $ 4,788 $ 4,655 $ 4,762 5.6%Deposits 7,926 6,250 6,450 6,543 6,673 -15.8%Net flows 2,162 (126) 1,235 692 364 -83.2%Average account values 266,633 260,501 278,582 291,183 307,696 15.4%
(1) See reconciliation to total revenues on page 24.
Lincoln Financial GroupSelect Earnings Drivers By Segment
Unaudited (millions of dollars)
For the Three Months Ended
3/31/20 6/30/20 9/30/20 12/31/20 3/31/21
Page 8
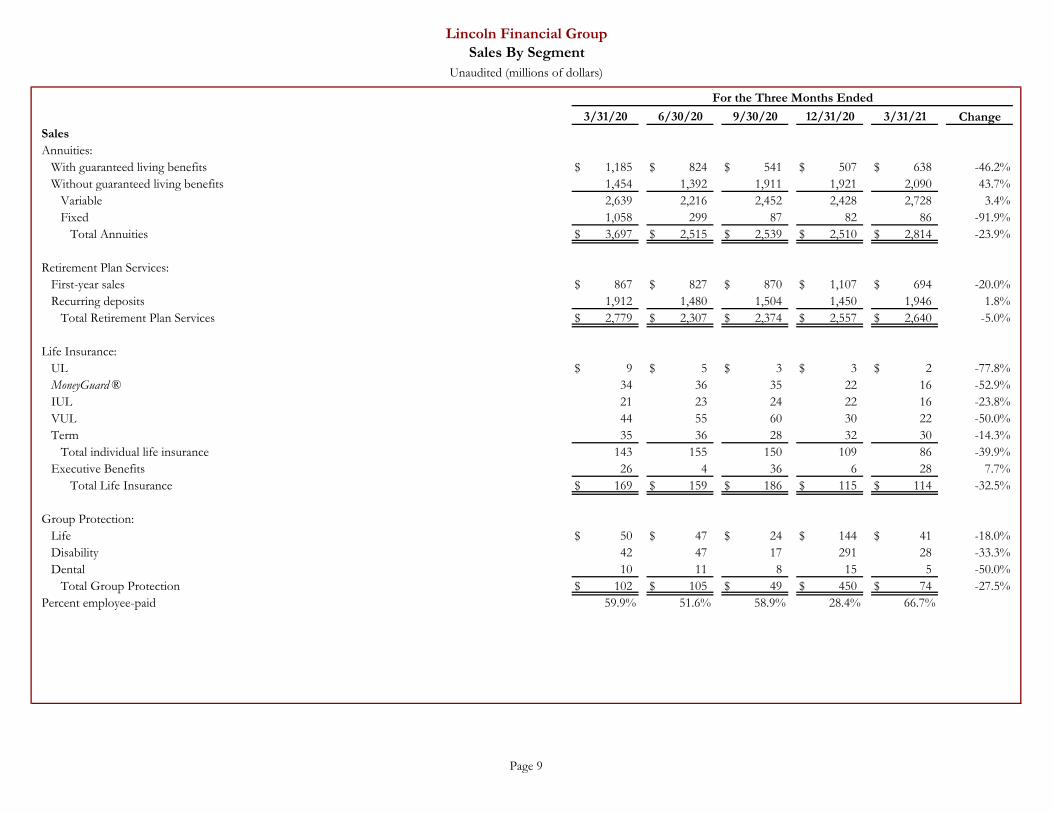
ChangeSalesAnnuities:
With guaranteed living benefits $ 1,185 $ 824 $ 541 $ 507 $ 638 -46.2%Without guaranteed living benefits 1,454 1,392 1,911 1,921 2,090 43.7%
Variable 2,639 2,216 2,452 2,428 2,728 3.4%Fixed 1,058 299 87 82 86 -91.9%
Total Annuities $ 3,697 $ 2,515 $ 2,539 $ 2,510 $ 2,814 -23.9%
Retirement Plan Services:First-year sales $ 867 $ 827 $ 870 $ 1,107 $ 694 -20.0%Recurring deposits 1,912 1,480 1,504 1,450 1,946 1.8%
Total Retirement Plan Services $ 2,779 $ 2,307 $ 2,374 $ 2,557 $ 2,640 -5.0%
Life Insurance:UL $ 9 $ 5 $ 3 $ 3 $ 2 -77.8%MoneyGuard ® 34 36 35 22 16 -52.9%IUL 21 23 24 22 16 -23.8%VUL 44 55 60 30 22 -50.0%Term 35 36 28 32 30 -14.3%
Total individual life insurance 143 155 150 109 86 -39.9%Executive Benefits 26 4 36 6 28 7.7%
Total Life Insurance $ 169 $ 159 $ 186 $ 115 $ 114 -32.5%
Group Protection:Life $ 50 $ 47 $ 24 $ 144 $ 41 -18.0%Disability 42 47 17 291 28 -33.3%Dental 10 11 8 15 5 -50.0%
Total Group Protection $ 102 $ 105 $ 49 $ 450 $ 74 -27.5%Percent employee-paid 59.9% 51.6% 58.9% 28.4% 66.7%
3/31/20 6/30/20 9/30/20 12/31/20 3/31/21
Lincoln Financial GroupSales By Segment
Unaudited (millions of dollars)
For the Three Months Ended
Page 9
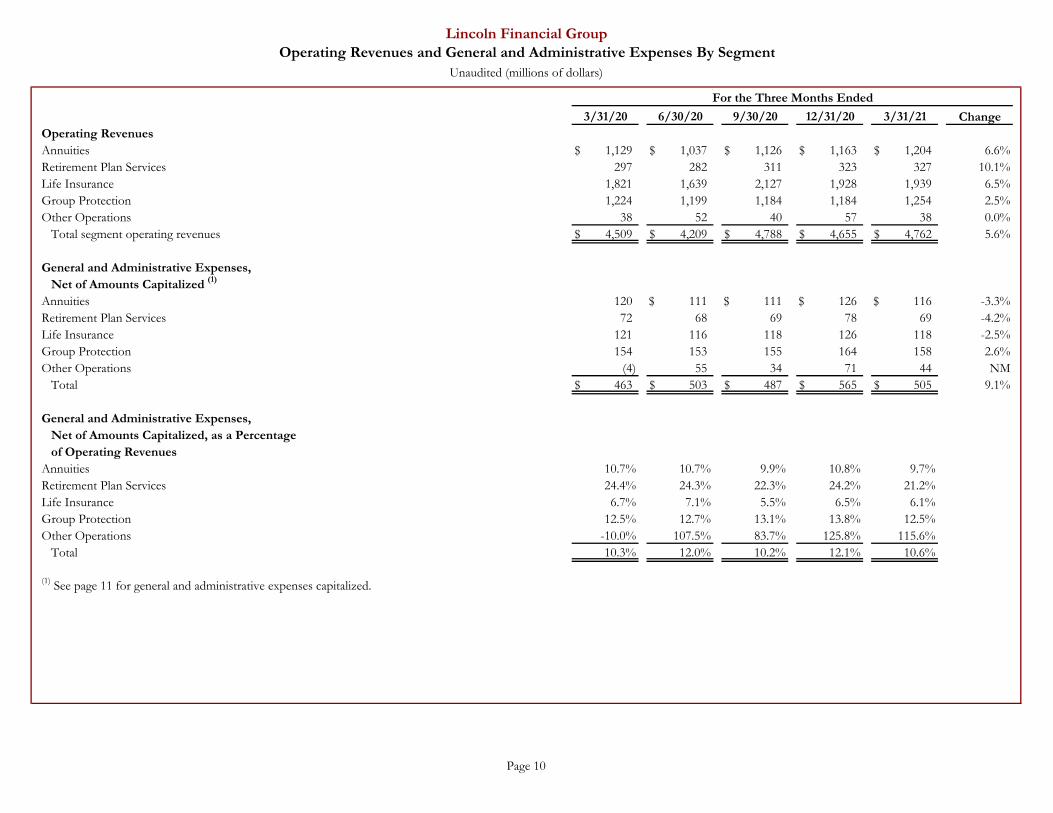
ChangeOperating RevenuesAnnuities $ 1,129 $ 1,037 $ 1,126 $ 1,163 $ 1,204 6.6%Retirement Plan Services 297 282 311 323 327 10.1%Life Insurance 1,821 1,639 2,127 1,928 1,939 6.5%Group Protection 1,224 1,199 1,184 1,184 1,254 2.5%Other Operations 38 52 40 57 38 0.0%
Total segment operating revenues $ 4,509 $ 4,209 $ 4,788 $ 4,655 $ 4,762 5.6%
General and Administrative Expenses,Net of Amounts Capitalized (1)
Annuities 120 $ 111 $ 111 $ 126 $ 116 -3.3%Retirement Plan Services 72 68 69 78 69 -4.2%Life Insurance 121 116 118 126 118 -2.5%Group Protection 154 153 155 164 158 2.6%Other Operations (4) 55 34 71 44 NM
Total $ 463 $ 503 $ 487 $ 565 $ 505 9.1%
General and Administrative Expenses,Net of Amounts Capitalized, as a Percentageof Operating Revenues
Annuities 10.7% 10.7% 9.9% 10.8% 9.7%Retirement Plan Services 24.4% 24.3% 22.3% 24.2% 21.2%Life Insurance 6.7% 7.1% 5.5% 6.5% 6.1%Group Protection 12.5% 12.7% 13.1% 13.8% 12.5%Other Operations -10.0% 107.5% 83.7% 125.8% 115.6%
Total 10.3% 12.0% 10.2% 12.1% 10.6%
3/31/20 6/30/20 9/30/20 12/31/20 3/31/21
(1) See page 11 for general and administrative expenses capitalized.
Lincoln Financial GroupOperating Revenues and General and Administrative Expenses By Segment
Unaudited (millions of dollars)
For the Three Months Ended
Page 10
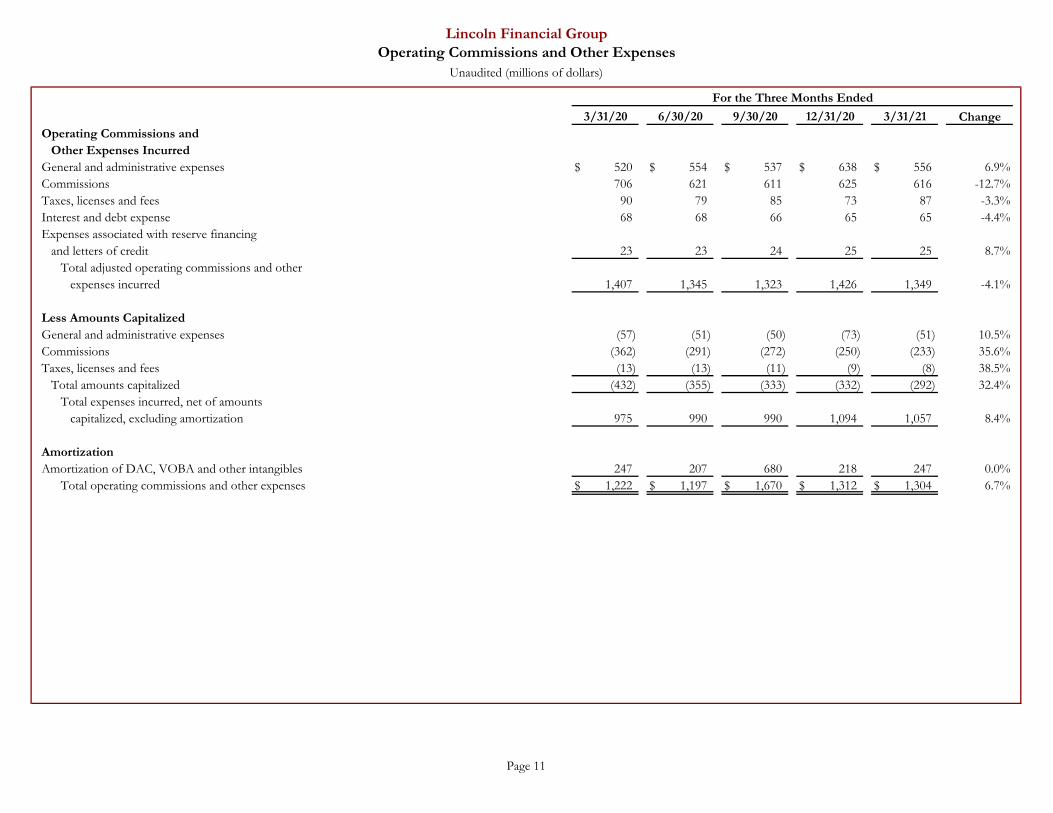
ChangeOperating Commissions and
Other Expenses IncurredGeneral and administrative expenses $ 520 $ 554 $ 537 $ 638 $ 556 6.9%Commissions 706 621 611 625 616 -12.7%Taxes, licenses and fees 90 79 85 73 87 -3.3%Interest and debt expense 68 68 66 65 65 -4.4%Expenses associated with reserve financing
and letters of credit 23 23 24 25 25 8.7%Total adjusted operating commissions and other
expenses incurred 1,407 1,345 1,323 1,426 1,349 -4.1%
Less Amounts CapitalizedGeneral and administrative expenses (57) (51) (50) (73) (51) 10.5%Commissions (362) (291) (272) (250) (233) 35.6%Taxes, licenses and fees (13) (13) (11) (9) (8) 38.5%
Total amounts capitalized (432) (355) (333) (332) (292) 32.4%Total expenses incurred, net of amounts
capitalized, excluding amortization 975 990 990 1,094 1,057 8.4%
AmortizationAmortization of DAC, VOBA and other intangibles 247 207 680 218 247 0.0%
Total operating commissions and other expenses $ 1,222 $ 1,197 $ 1,670 $ 1,312 $ 1,304 6.7%
3/31/20 6/30/20 9/30/20 12/31/20 3/31/21
Lincoln Financial GroupOperating Commissions and Other Expenses
Unaudited (millions of dollars)
For the Three Months Ended
Page 11
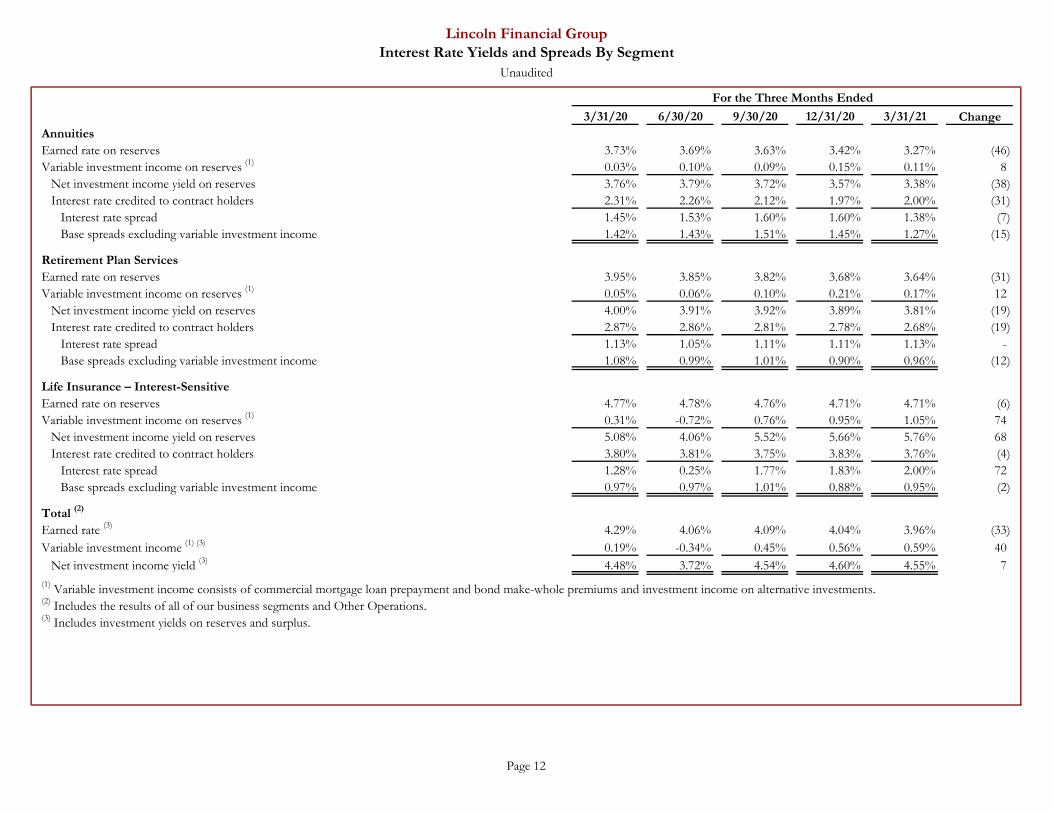
ChangeAnnuitiesEarned rate on reserves 3.73% 3.69% 3.63% 3.42% 3.27% (46) Variable investment income on reserves (1) 0.03% 0.10% 0.09% 0.15% 0.11% 8
Net investment income yield on reserves 3.76% 3.79% 3.72% 3.57% 3.38% (38) Interest rate credited to contract holders 2.31% 2.26% 2.12% 1.97% 2.00% (31)
Interest rate spread 1.45% 1.53% 1.60% 1.60% 1.38% (7) Base spreads excluding variable investment income 1.42% 1.43% 1.51% 1.45% 1.27% (15)
Retirement Plan ServicesEarned rate on reserves 3.95% 3.85% 3.82% 3.68% 3.64% (31) Variable investment income on reserves (1) 0.05% 0.06% 0.10% 0.21% 0.17% 12
Net investment income yield on reserves 4.00% 3.91% 3.92% 3.89% 3.81% (19) Interest rate credited to contract holders 2.87% 2.86% 2.81% 2.78% 2.68% (19)
Interest rate spread 1.13% 1.05% 1.11% 1.11% 1.13% - Base spreads excluding variable investment income 1.08% 0.99% 1.01% 0.90% 0.96% (12)
Life Insurance – Interest-SensitiveEarned rate on reserves 4.77% 4.78% 4.76% 4.71% 4.71% (6) Variable investment income on reserves (1) 0.31% -0.72% 0.76% 0.95% 1.05% 74
Net investment income yield on reserves 5.08% 4.06% 5.52% 5.66% 5.76% 68 Interest rate credited to contract holders 3.80% 3.81% 3.75% 3.83% 3.76% (4)
Interest rate spread 1.28% 0.25% 1.77% 1.83% 2.00% 72 Base spreads excluding variable investment income 0.97% 0.97% 1.01% 0.88% 0.95% (2)
Total (2)
Earned rate (3) 4.29% 4.06% 4.09% 4.04% 3.96% (33) Variable investment income (1) (3) 0.19% -0.34% 0.45% 0.56% 0.59% 40
Net investment income yield (3) 4.48% 3.72% 4.54% 4.60% 4.55% 7
Lincoln Financial GroupInterest Rate Yields and Spreads By Segment
Unaudited
For the Three Months Ended
3/31/20 6/30/20 9/30/20 12/31/20 3/31/21
(1) Variable investment income consists of commercial mortgage loan prepayment and bond make-whole premiums and investment income on alternative investments.(2) Includes the results of all of our business segments and Other Operations.(3) Includes investment yields on reserves and surplus.
Page 12

Select Earnings and Operational
Data from Business Segments
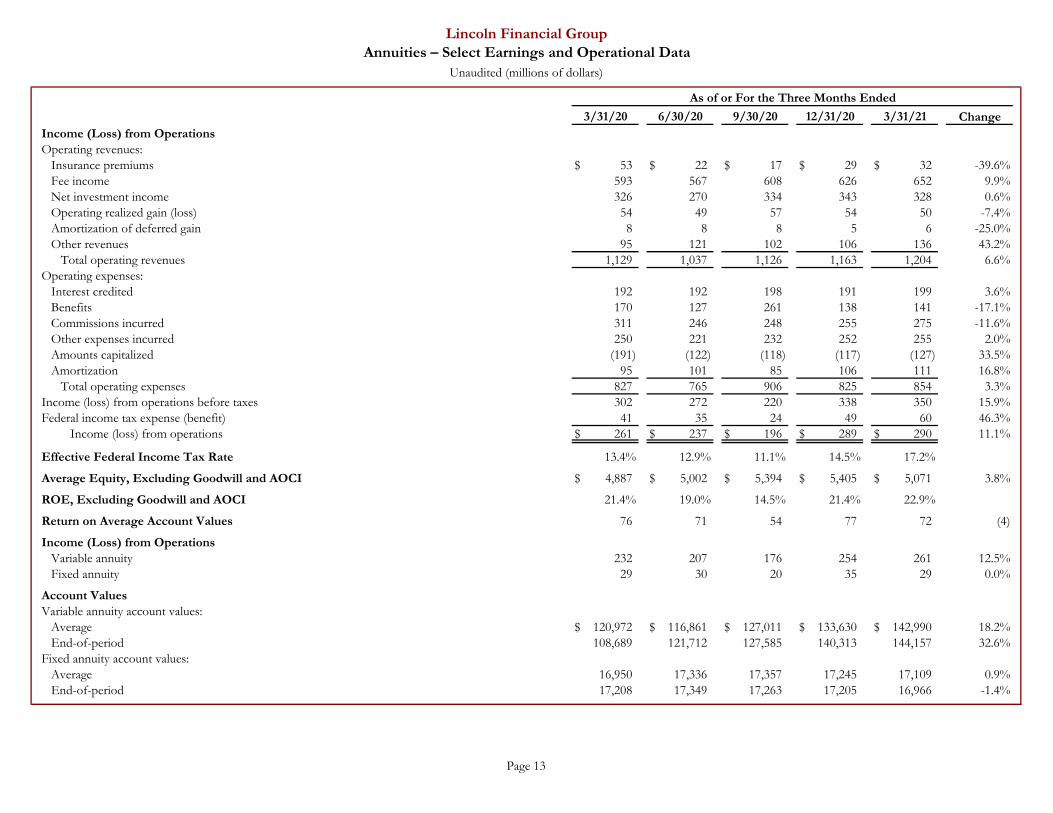
ChangeIncome (Loss) from OperationsOperating revenues:
Insurance premiums $ 53 $ 22 $ 17 $ 29 $ 32 -39.6%Fee income 593 567 608 626 652 9.9%Net investment income 326 270 334 343 328 0.6%Operating realized gain (loss) 54 49 57 54 50 -7.4%Amortization of deferred gain 8 8 8 5 6 -25.0%Other revenues 95 121 102 106 136 43.2%
Total operating revenues 1,129 1,037 1,126 1,163 1,204 6.6%Operating expenses:
Interest credited 192 192 198 191 199 3.6%Benefits 170 127 261 138 141 -17.1%Commissions incurred 311 246 248 255 275 -11.6%Other expenses incurred 250 221 232 252 255 2.0%Amounts capitalized (191) (122) (118) (117) (127) 33.5%Amortization 95 101 85 106 111 16.8%
Total operating expenses 827 765 906 825 854 3.3%Income (loss) from operations before taxes 302 272 220 338 350 15.9%Federal income tax expense (benefit) 41 35 24 49 60 46.3%
Income (loss) from operations $ 261 $ 237 $ 196 $ 289 $ 290 11.1%
Effective Federal Income Tax Rate 13.4% 12.9% 11.1% 14.5% 17.2%
Average Equity, Excluding Goodwill and AOCI $ 4,887 $ 5,002 $ 5,394 $ 5,405 $ 5,071 3.8%
ROE, Excluding Goodwill and AOCI 21.4% 19.0% 14.5% 21.4% 22.9%
Return on Average Account Values 76 71 54 77 72 (4)
Income (Loss) from OperationsVariable annuity 232 207 176 254 261 12.5%Fixed annuity 29 30 20 35 29 0.0%
Account ValuesVariable annuity account values:
Average $ 120,972 $ 116,861 $ 127,011 $ 133,630 $ 142,990 18.2%End-of-period 108,689 121,712 127,585 140,313 144,157 32.6%
Fixed annuity account values:Average 16,950 17,336 17,357 17,245 17,109 0.9%End-of-period 17,208 17,349 17,263 17,205 16,966 -1.4%
3/31/20 6/30/20 9/30/20 12/31/20 3/31/21
Lincoln Financial GroupAnnuities – Select Earnings and Operational Data
Unaudited (millions of dollars)
As of or For the Three Months Ended
Page 13
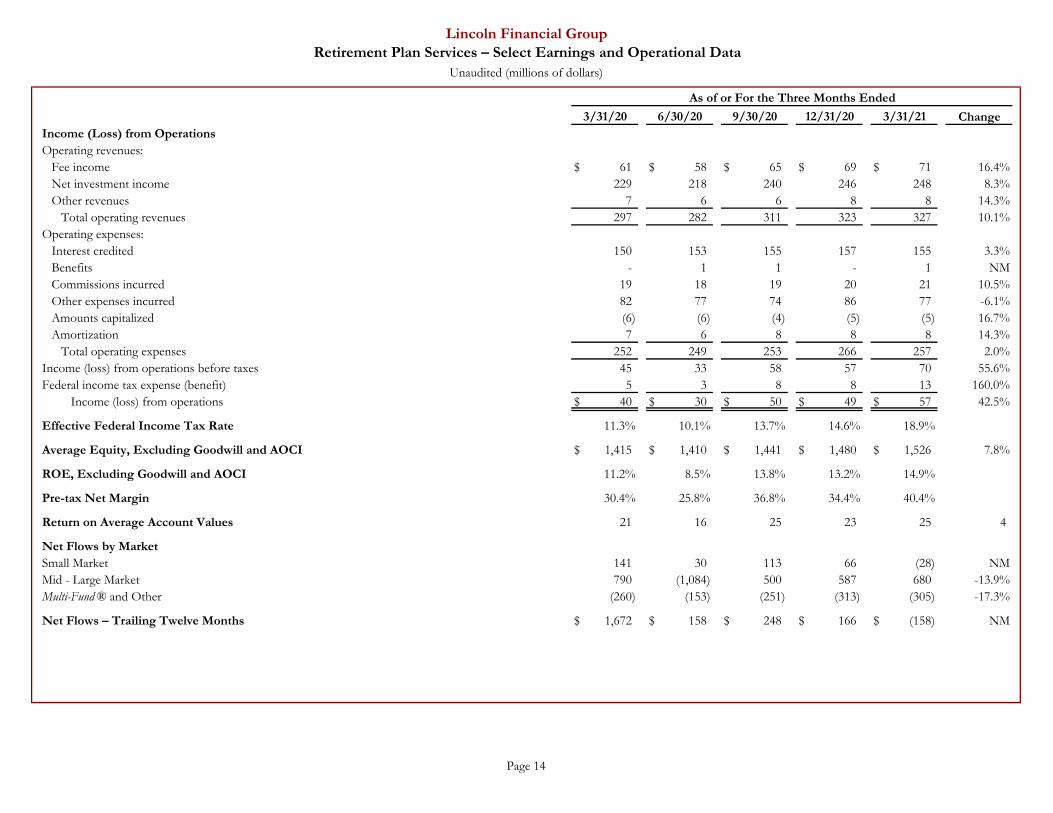
ChangeIncome (Loss) from OperationsOperating revenues:
Fee income $ 61 $ 58 $ 65 $ 69 $ 71 16.4%Net investment income 229 218 240 246 248 8.3%Other revenues 7 6 6 8 8 14.3%
Total operating revenues 297 282 311 323 327 10.1%Operating expenses:
Interest credited 150 153 155 157 155 3.3%Benefits - 1 1 - 1 NMCommissions incurred 19 18 19 20 21 10.5%Other expenses incurred 82 77 74 86 77 -6.1%Amounts capitalized (6) (6) (4) (5) (5) 16.7%Amortization 7 6 8 8 8 14.3%
Total operating expenses 252 249 253 266 257 2.0%Income (loss) from operations before taxes 45 33 58 57 70 55.6%Federal income tax expense (benefit) 5 3 8 8 13 160.0%
Income (loss) from operations $ 40 $ 30 $ 50 $ 49 $ 57 42.5%
Effective Federal Income Tax Rate 11.3% 10.1% 13.7% 14.6% 18.9%
Average Equity, Excluding Goodwill and AOCI $ 1,415 $ 1,410 $ 1,441 $ 1,480 $ 1,526 7.8%
ROE, Excluding Goodwill and AOCI 11.2% 8.5% 13.8% 13.2% 14.9%
Pre-tax Net Margin 30.4% 25.8% 36.8% 34.4% 40.4%
Return on Average Account Values 21 16 25 23 25 4
Net Flows by MarketSmall Market 141 30 113 66 (28) NMMid - Large Market 790 (1,084) 500 587 680 -13.9%Multi-Fund ® and Other (260) (153) (251) (313) (305) -17.3%
Net Flows – Trailing Twelve Months $ 1,672 $ 158 $ 248 $ 166 $ (158) NM
3/31/20 6/30/20 9/30/20 12/31/20 3/31/21
Lincoln Financial GroupRetirement Plan Services – Select Earnings and Operational Data
Unaudited (millions of dollars)
As of or For the Three Months Ended
Page 14

ChangeIncome (Loss) from OperationsOperating revenues:
Insurance premiums $ 224 $ 230 $ 223 $ 274 $ 253 12.9%Fee income 893 830 1,141 861 867 -2.9%Net investment income 697 577 761 787 809 16.1%Operating realized gain (loss) (3) (2) - (1) (2) 33.3%Amortization of deferred gain on
business sold through reinsurance 3 3 3 4 3 0.0%Other revenues 7 1 (1) 3 9 28.6%
Total operating revenues 1,821 1,639 2,127 1,928 1,939 6.5%Operating expenses:
Interest credited 371 375 369 375 370 -0.3%Benefits 954 1,084 1,428 1,120 1,173 23.0%Commissions incurred 191 173 171 152 120 -37.2%Other expenses incurred 209 195 209 204 194 -7.2%Amounts capitalized (216) (202) (202) (168) (138) 36.1%Amortization 103 66 552 68 90 -12.6%
Total operating expenses 1,612 1,691 2,527 1,751 1,809 12.2%Income (loss) from operations before taxes 209 (52) (400) 177 130 -37.8%Federal income tax expense (benefit) 38 (15) (89) 33 23 -39.5%
Income (loss) from operations $ 171 $ (37) $ (311) $ 144 $ 107 -37.4%
Effective Federal Income Tax Rate 18.1% 28.9% 22.2% 18.6% 17.7%
Average Equity, Excluding Goodwill and AOCI $ 8,798 $ 8,977 $ 8,854 $ 8,788 $ 8,909 1.3%
ROE, Excluding Goodwill and AOCI 7.8% -1.6% -14.1% 6.5% 4.8%
Average Account Values $ 52,866 $ 52,693 $ 54,570 $ 56,419 $ 58,008 9.7%
In-Force Face AmountUL and other $ 356,889 $ 357,690 $ 358,897 $ 358,554 $ 358,044 0.3%Term insurance 486,311 505,251 519,173 535,387 549,960 13.1%
Total in-force face amount $ 843,200 $ 862,941 $ 878,070 $ 893,941 $ 908,004 7.7%
3/31/20 6/30/20 9/30/20 12/31/20 3/31/21
Lincoln Financial GroupLife Insurance – Select Earnings and Operational Data
Unaudited (millions of dollars)
As of or For the Three Months Ended
Page 15
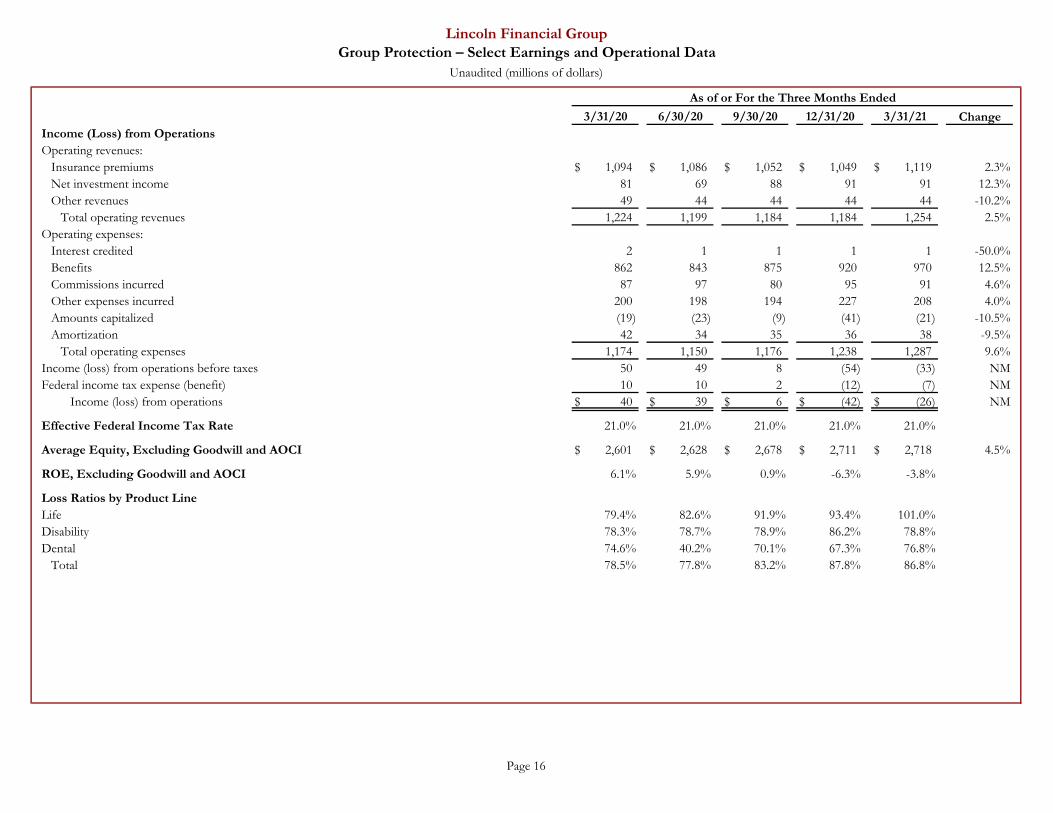
ChangeIncome (Loss) from OperationsOperating revenues:
Insurance premiums $ 1,094 $ 1,086 $ 1,052 $ 1,049 $ 1,119 2.3%Net investment income 81 69 88 91 91 12.3%Other revenues 49 44 44 44 44 -10.2%
Total operating revenues 1,224 1,199 1,184 1,184 1,254 2.5%Operating expenses:
Interest credited 2 1 1 1 1 -50.0%Benefits 862 843 875 920 970 12.5%Commissions incurred 87 97 80 95 91 4.6%Other expenses incurred 200 198 194 227 208 4.0%Amounts capitalized (19) (23) (9) (41) (21) -10.5%Amortization 42 34 35 36 38 -9.5%
Total operating expenses 1,174 1,150 1,176 1,238 1,287 9.6%Income (loss) from operations before taxes 50 49 8 (54) (33) NMFederal income tax expense (benefit) 10 10 2 (12) (7) NM
Income (loss) from operations $ 40 $ 39 $ 6 $ (42) $ (26) NM
Effective Federal Income Tax Rate 21.0% 21.0% 21.0% 21.0% 21.0%
Average Equity, Excluding Goodwill and AOCI $ 2,601 $ 2,628 $ 2,678 $ 2,711 $ 2,718 4.5%
ROE, Excluding Goodwill and AOCI 6.1% 5.9% 0.9% -6.3% -3.8%
Loss Ratios by Product LineLife 79.4% 82.6% 91.9% 93.4% 101.0%Disability 78.3% 78.7% 78.9% 86.2% 78.8%Dental 74.6% 40.2% 70.1% 67.3% 76.8%
Total 78.5% 77.8% 83.2% 87.8% 86.8%
3/31/20 6/30/20 9/30/20 12/31/20 3/31/21
Lincoln Financial GroupGroup Protection – Select Earnings and Operational Data
Unaudited (millions of dollars)
As of or For the Three Months Ended
Page 16
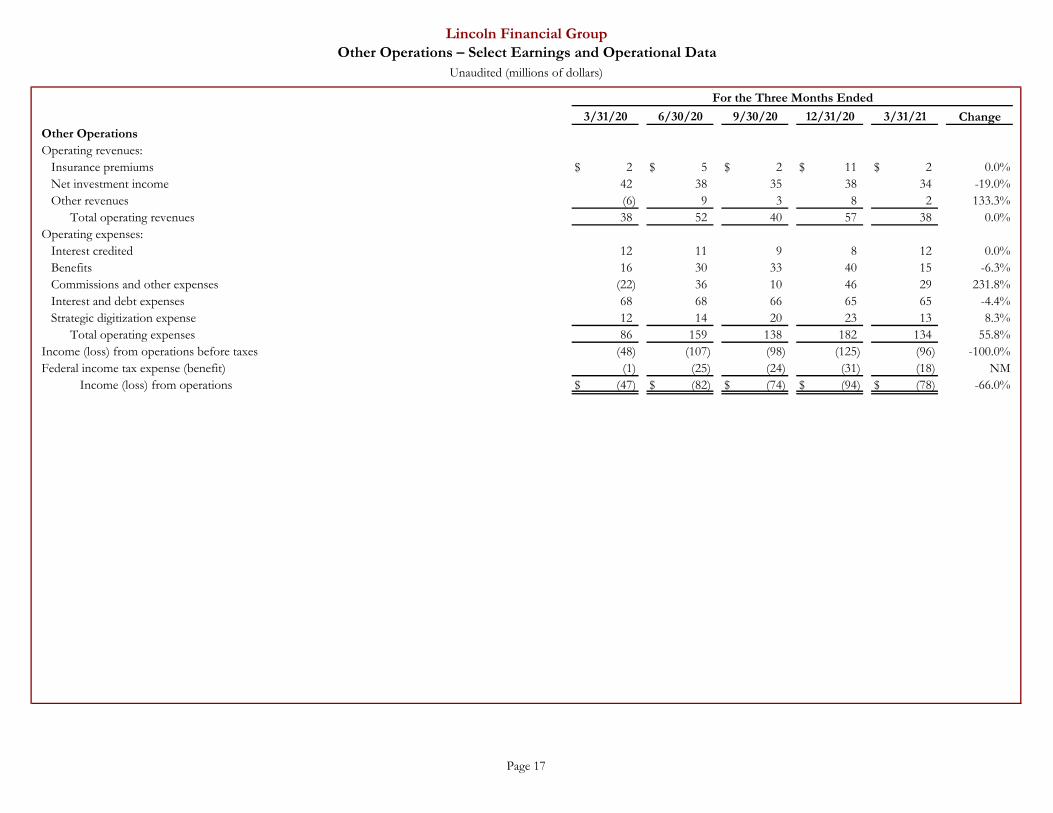
ChangeOther OperationsOperating revenues:
Insurance premiums $ 2 $ 5 $ 2 $ 11 $ 2 0.0%Net investment income 42 38 35 38 34 -19.0%Other revenues (6) 9 3 8 2 133.3%
Total operating revenues 38 52 40 57 38 0.0%Operating expenses:
Interest credited 12 11 9 8 12 0.0%Benefits 16 30 33 40 15 -6.3%Commissions and other expenses (22) 36 10 46 29 231.8%Interest and debt expenses 68 68 66 65 65 -4.4%Strategic digitization expense 12 14 20 23 13 8.3%
Total operating expenses 86 159 138 182 134 55.8%Income (loss) from operations before taxes (48) (107) (98) (125) (96) -100.0%Federal income tax expense (benefit) (1) (25) (24) (31) (18) NM
Income (loss) from operations $ (47) $ (82) $ (74) $ (94) $ (78) -66.0%
3/31/20 6/30/20 9/30/20 12/31/20 3/31/21
Lincoln Financial GroupOther Operations – Select Earnings and Operational Data
Unaudited (millions of dollars)
For the Three Months Ended
Page 17

DAC, VOBA, DSI, DFEL
& Account Value Roll Forwards
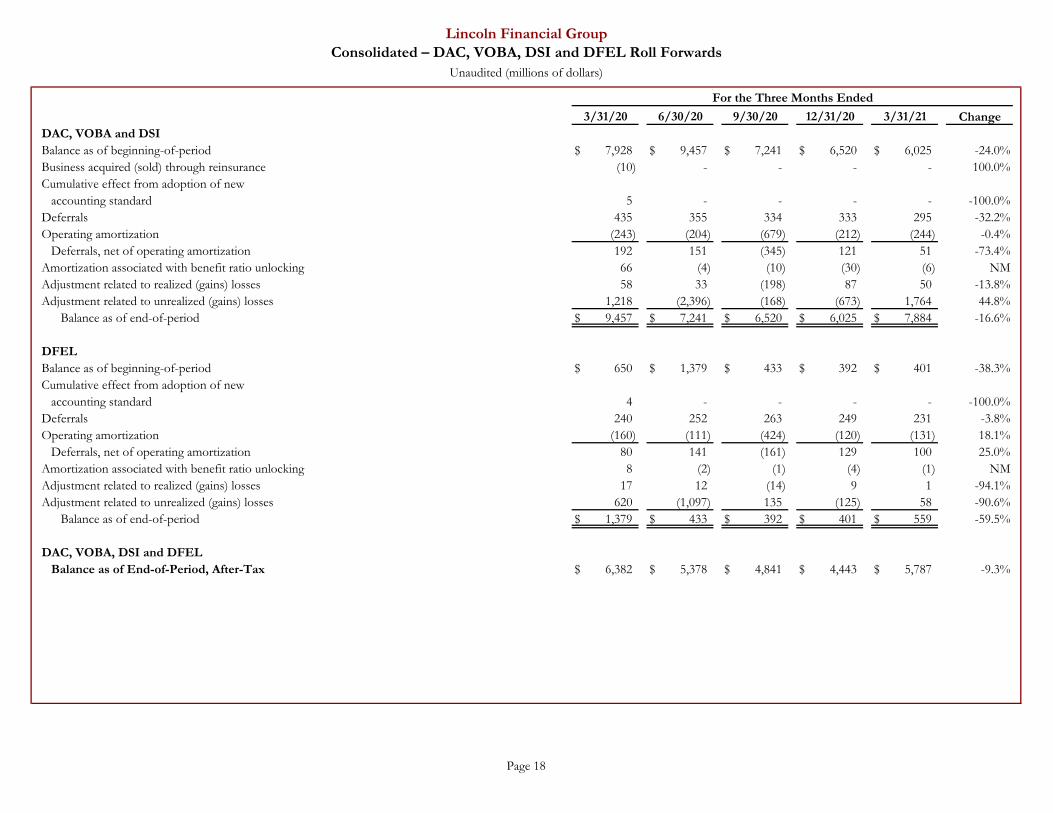
ChangeDAC, VOBA and DSIBalance as of beginning-of-period $ 7,928 $ 9,457 $ 7,241 $ 6,520 $ 6,025 -24.0%Business acquired (sold) through reinsurance (10) - - - - 100.0%Cumulative effect from adoption of new
accounting standard 5 - - - - -100.0%Deferrals 435 355 334 333 295 -32.2%Operating amortization (243) (204) (679) (212) (244) -0.4%
Deferrals, net of operating amortization 192 151 (345) 121 51 -73.4%Amortization associated with benefit ratio unlocking 66 (4) (10) (30) (6) NMAdjustment related to realized (gains) losses 58 33 (198) 87 50 -13.8%Adjustment related to unrealized (gains) losses 1,218 (2,396) (168) (673) 1,764 44.8%
Balance as of end-of-period $ 9,457 $ 7,241 $ 6,520 $ 6,025 $ 7,884 -16.6%
DFELBalance as of beginning-of-period $ 650 $ 1,379 $ 433 $ 392 $ 401 -38.3%Cumulative effect from adoption of new
accounting standard 4 - - - - -100.0%Deferrals 240 252 263 249 231 -3.8%Operating amortization (160) (111) (424) (120) (131) 18.1%
Deferrals, net of operating amortization 80 141 (161) 129 100 25.0%Amortization associated with benefit ratio unlocking 8 (2) (1) (4) (1) NMAdjustment related to realized (gains) losses 17 12 (14) 9 1 -94.1%Adjustment related to unrealized (gains) losses 620 (1,097) 135 (125) 58 -90.6%
Balance as of end-of-period $ 1,379 $ 433 $ 392 $ 401 $ 559 -59.5%
DAC, VOBA, DSI and DFEL Balance as of End-of-Period, After-Tax $ 6,382 $ 5,378 $ 4,841 $ 4,443 $ 5,787 -9.3%
3/31/20 6/30/20 9/30/20 12/31/20 3/31/21
Lincoln Financial GroupConsolidated – DAC, VOBA, DSI and DFEL Roll Forwards
Unaudited (millions of dollars)
For the Three Months Ended
Page 18
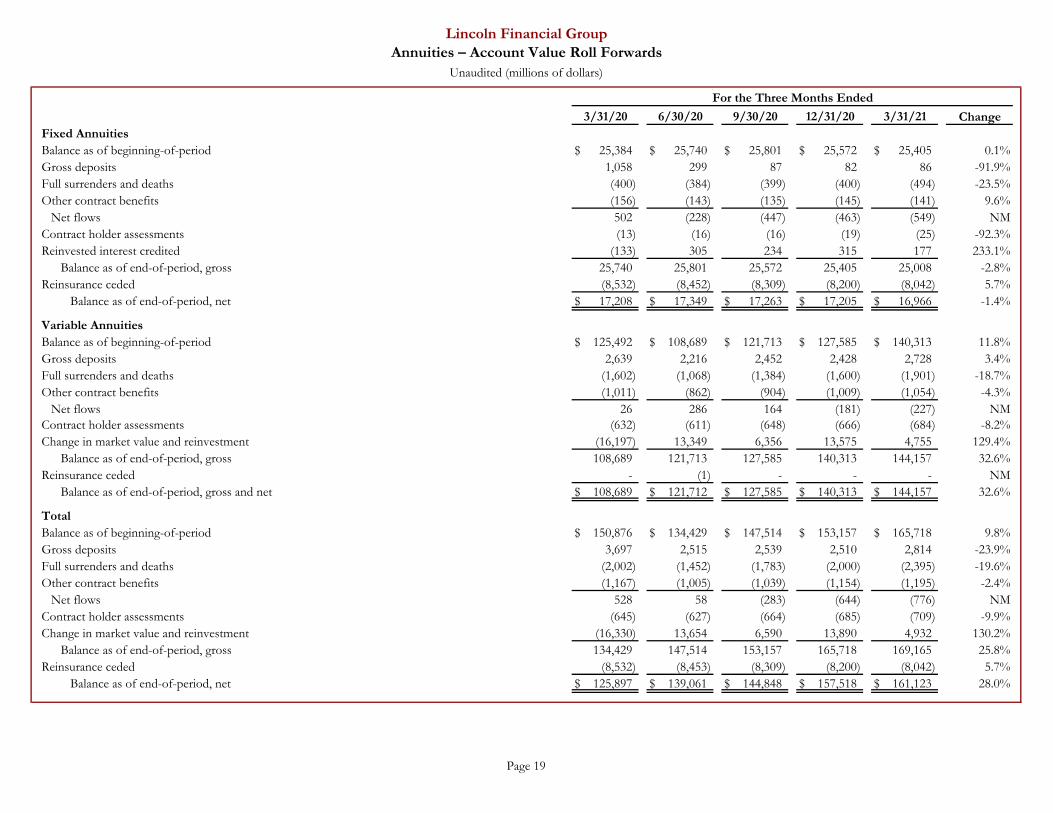
ChangeFixed AnnuitiesBalance as of beginning-of-period $ 25,384 $ 25,740 $ 25,801 $ 25,572 $ 25,405 0.1%Gross deposits 1,058 299 87 82 86 -91.9%Full surrenders and deaths (400) (384) (399) (400) (494) -23.5%Other contract benefits (156) (143) (135) (145) (141) 9.6%
Net flows 502 (228) (447) (463) (549) NMContract holder assessments (13) (16) (16) (19) (25) -92.3%Reinvested interest credited (133) 305 234 315 177 233.1%
Balance as of end-of-period, gross 25,740 25,801 25,572 25,405 25,008 -2.8%Reinsurance ceded (8,532) (8,452) (8,309) (8,200) (8,042) 5.7%
Balance as of end-of-period, net $ 17,208 $ 17,349 $ 17,263 $ 17,205 $ 16,966 -1.4%
Variable AnnuitiesBalance as of beginning-of-period $ 125,492 $ 108,689 $ 121,713 $ 127,585 $ 140,313 11.8%Gross deposits 2,639 2,216 2,452 2,428 2,728 3.4%Full surrenders and deaths (1,602) (1,068) (1,384) (1,600) (1,901) -18.7%Other contract benefits (1,011) (862) (904) (1,009) (1,054) -4.3%
Net flows 26 286 164 (181) (227) NMContract holder assessments (632) (611) (648) (666) (684) -8.2%Change in market value and reinvestment (16,197) 13,349 6,356 13,575 4,755 129.4%
Balance as of end-of-period, gross 108,689 121,713 127,585 140,313 144,157 32.6%Reinsurance ceded - (1) - - - NM
Balance as of end-of-period, gross and net $ 108,689 $ 121,712 $ 127,585 $ 140,313 $ 144,157 32.6%
TotalBalance as of beginning-of-period $ 150,876 $ 134,429 $ 147,514 $ 153,157 $ 165,718 9.8%Gross deposits 3,697 2,515 2,539 2,510 2,814 -23.9%Full surrenders and deaths (2,002) (1,452) (1,783) (2,000) (2,395) -19.6%Other contract benefits (1,167) (1,005) (1,039) (1,154) (1,195) -2.4%
Net flows 528 58 (283) (644) (776) NMContract holder assessments (645) (627) (664) (685) (709) -9.9%Change in market value and reinvestment (16,330) 13,654 6,590 13,890 4,932 130.2%
Balance as of end-of-period, gross 134,429 147,514 153,157 165,718 169,165 25.8%Reinsurance ceded (8,532) (8,453) (8,309) (8,200) (8,042) 5.7%
Balance as of end-of-period, net $ 125,897 $ 139,061 $ 144,848 $ 157,518 $ 161,123 28.0%
3/31/20 6/30/20 9/30/20 12/31/20 3/31/21
Lincoln Financial GroupAnnuities – Account Value Roll Forwards
Unaudited (millions of dollars)
For the Three Months Ended
Page 19
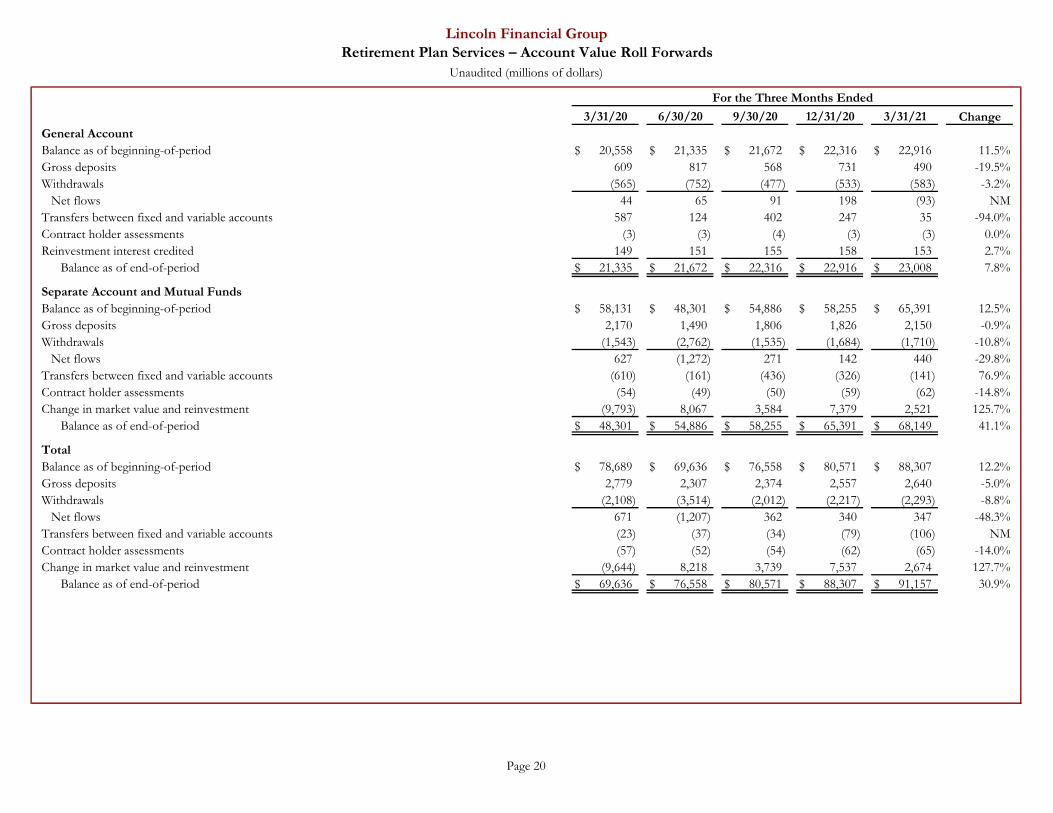
ChangeGeneral AccountBalance as of beginning-of-period $ 20,558 $ 21,335 $ 21,672 $ 22,316 $ 22,916 11.5%Gross deposits 609 817 568 731 490 -19.5%Withdrawals (565) (752) (477) (533) (583) -3.2%
Net flows 44 65 91 198 (93) NMTransfers between fixed and variable accounts 587 124 402 247 35 -94.0%Contract holder assessments (3) (3) (4) (3) (3) 0.0%Reinvestment interest credited 149 151 155 158 153 2.7%
Balance as of end-of-period $ 21,335 $ 21,672 $ 22,316 $ 22,916 $ 23,008 7.8%
Separate Account and Mutual FundsBalance as of beginning-of-period $ 58,131 $ 48,301 $ 54,886 $ 58,255 $ 65,391 12.5%Gross deposits 2,170 1,490 1,806 1,826 2,150 -0.9%Withdrawals (1,543) (2,762) (1,535) (1,684) (1,710) -10.8%
Net flows 627 (1,272) 271 142 440 -29.8%Transfers between fixed and variable accounts (610) (161) (436) (326) (141) 76.9%Contract holder assessments (54) (49) (50) (59) (62) -14.8%Change in market value and reinvestment (9,793) 8,067 3,584 7,379 2,521 125.7%
Balance as of end-of-period $ 48,301 $ 54,886 $ 58,255 $ 65,391 $ 68,149 41.1%
TotalBalance as of beginning-of-period $ 78,689 $ 69,636 $ 76,558 $ 80,571 $ 88,307 12.2%Gross deposits 2,779 2,307 2,374 2,557 2,640 -5.0%Withdrawals (2,108) (3,514) (2,012) (2,217) (2,293) -8.8%
Net flows 671 (1,207) 362 340 347 -48.3%Transfers between fixed and variable accounts (23) (37) (34) (79) (106) NMContract holder assessments (57) (52) (54) (62) (65) -14.0%Change in market value and reinvestment (9,644) 8,218 3,739 7,537 2,674 127.7%
Balance as of end-of-period $ 69,636 $ 76,558 $ 80,571 $ 88,307 $ 91,157 30.9%
3/31/20 6/30/20 9/30/20 12/31/20 3/31/21
Lincoln Financial GroupRetirement Plan Services – Account Value Roll Forwards
Unaudited (millions of dollars)
For the Three Months Ended
Page 20
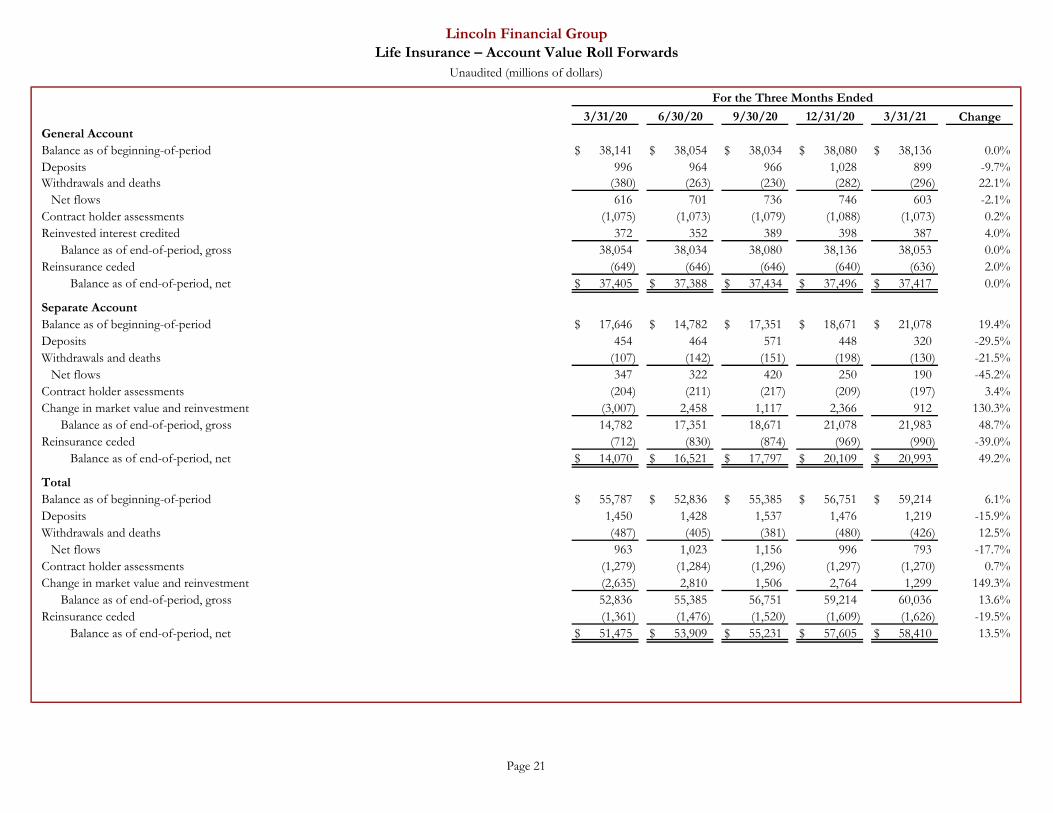
ChangeGeneral AccountBalance as of beginning-of-period $ 38,141 $ 38,054 $ 38,034 $ 38,080 $ 38,136 0.0%Deposits 996 964 966 1,028 899 -9.7%Withdrawals and deaths (380) (263) (230) (282) (296) 22.1%
Net flows 616 701 736 746 603 -2.1%Contract holder assessments (1,075) (1,073) (1,079) (1,088) (1,073) 0.2%Reinvested interest credited 372 352 389 398 387 4.0%
Balance as of end-of-period, gross 38,054 38,034 38,080 38,136 38,053 0.0%Reinsurance ceded (649) (646) (646) (640) (636) 2.0%
Balance as of end-of-period, net $ 37,405 $ 37,388 $ 37,434 $ 37,496 $ 37,417 0.0%
Separate AccountBalance as of beginning-of-period $ 17,646 $ 14,782 $ 17,351 $ 18,671 $ 21,078 19.4%Deposits 454 464 571 448 320 -29.5%Withdrawals and deaths (107) (142) (151) (198) (130) -21.5%
Net flows 347 322 420 250 190 -45.2%Contract holder assessments (204) (211) (217) (209) (197) 3.4%Change in market value and reinvestment (3,007) 2,458 1,117 2,366 912 130.3%
Balance as of end-of-period, gross 14,782 17,351 18,671 21,078 21,983 48.7%Reinsurance ceded (712) (830) (874) (969) (990) -39.0%
Balance as of end-of-period, net $ 14,070 $ 16,521 $ 17,797 $ 20,109 $ 20,993 49.2%
TotalBalance as of beginning-of-period $ 55,787 $ 52,836 $ 55,385 $ 56,751 $ 59,214 6.1%Deposits 1,450 1,428 1,537 1,476 1,219 -15.9%Withdrawals and deaths (487) (405) (381) (480) (426) 12.5%
Net flows 963 1,023 1,156 996 793 -17.7%Contract holder assessments (1,279) (1,284) (1,296) (1,297) (1,270) 0.7%Change in market value and reinvestment (2,635) 2,810 1,506 2,764 1,299 149.3%
Balance as of end-of-period, gross 52,836 55,385 56,751 59,214 60,036 13.6%Reinsurance ceded (1,361) (1,476) (1,520) (1,609) (1,626) -19.5%
Balance as of end-of-period, net $ 51,475 $ 53,909 $ 55,231 $ 57,605 $ 58,410 13.5%
3/31/20 6/30/20 9/30/20 12/31/20 3/31/21
Lincoln Financial GroupLife Insurance – Account Value Roll Forwards
Unaudited (millions of dollars)
For the Three Months Ended
Page 21

Other Information
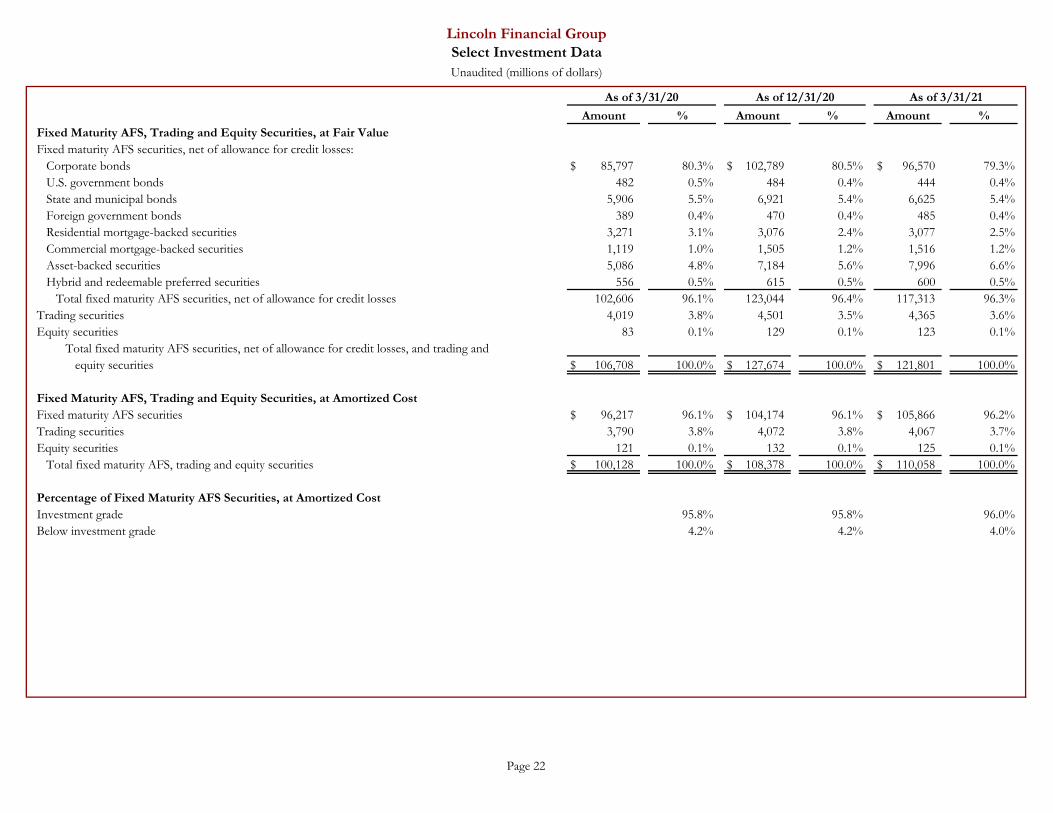
Fixed Maturity AFS, Trading and Equity Securities, at Fair ValueFixed maturity AFS securities, net of allowance for credit losses:
Corporate bonds $ 85,797 80.3% $ 102,789 80.5% $ 96,570 79.3%U.S. government bonds 482 0.5% 484 0.4% 444 0.4%State and municipal bonds 5,906 5.5% 6,921 5.4% 6,625 5.4%Foreign government bonds 389 0.4% 470 0.4% 485 0.4%Residential mortgage-backed securities 3,271 3.1% 3,076 2.4% 3,077 2.5%Commercial mortgage-backed securities 1,119 1.0% 1,505 1.2% 1,516 1.2%Asset-backed securities 5,086 4.8% 7,184 5.6% 7,996 6.6%Hybrid and redeemable preferred securities 556 0.5% 615 0.5% 600 0.5%
Total fixed maturity AFS securities, net of allowance for credit losses 102,606 96.1% 123,044 96.4% 117,313 96.3%Trading securities 4,019 3.8% 4,501 3.5% 4,365 3.6%Equity securities 83 0.1% 129 0.1% 123 0.1%
Total fixed maturity AFS securities, net of allowance for credit losses, and trading andequity securities $ 106,708 100.0% $ 127,674 100.0% $ 121,801 100.0%
Fixed Maturity AFS, Trading and Equity Securities, at Amortized CostFixed maturity AFS securities $ 96,217 96.1% $ 104,174 96.1% $ 105,866 96.2%Trading securities 3,790 3.8% 4,072 3.8% 4,067 3.7%Equity securities 121 0.1% 132 0.1% 125 0.1%
Total fixed maturity AFS, trading and equity securities $ 100,128 100.0% $ 108,378 100.0% $ 110,058 100.0%
Percentage of Fixed Maturity AFS Securities, at Amortized CostInvestment grade 95.8% 95.8% 96.0%Below investment grade 4.2% 4.2% 4.0%
Lincoln Financial GroupSelect Investment DataUnaudited (millions of dollars)
As of 3/31/21
Amount %Amount %
As of 3/31/20 As of 12/31/20
Amount %
Page 22
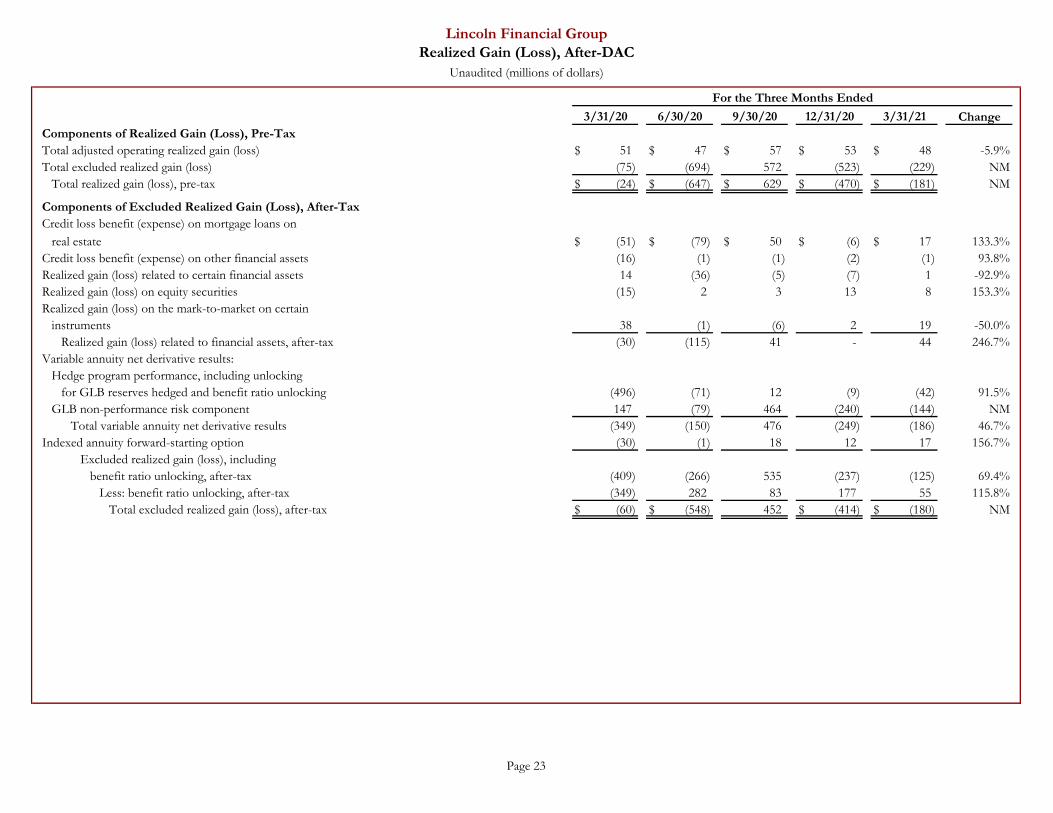
ChangeComponents of Realized Gain (Loss), Pre-TaxTotal adjusted operating realized gain (loss) $ 51 $ 47 $ 57 $ 53 $ 48 -5.9%Total excluded realized gain (loss) (75) (694) 572 (523) (229) NM
Total realized gain (loss), pre-tax $ (24) $ (647) $ 629 $ (470) $ (181) NM
Components of Excluded Realized Gain (Loss), After-TaxCredit loss benefit (expense) on mortgage loans on
real estate $ (51) $ (79) $ 50 $ (6) $ 17 133.3%Credit loss benefit (expense) on other financial assets (16) (1) (1) (2) (1) 93.8%Realized gain (loss) related to certain financial assets 14 (36) (5) (7) 1 -92.9%Realized gain (loss) on equity securities (15) 2 3 13 8 153.3%Realized gain (loss) on the mark-to-market on certain
instruments 38 (1) (6) 2 19 -50.0%Realized gain (loss) related to financial assets, after-tax (30) (115) 41 - 44 246.7%
Variable annuity net derivative results:Hedge program performance, including unlocking
for GLB reserves hedged and benefit ratio unlocking (496) (71) 12 (9) (42) 91.5%GLB non-performance risk component 147 (79) 464 (240) (144) NM
Total variable annuity net derivative results (349) (150) 476 (249) (186) 46.7%Indexed annuity forward-starting option (30) (1) 18 12 17 156.7%
Excluded realized gain (loss), includingbenefit ratio unlocking, after-tax (409) (266) 535 (237) (125) 69.4%
Less: benefit ratio unlocking, after-tax (349) 282 83 177 55 115.8%Total excluded realized gain (loss), after-tax $ (60) $ (548) 452 $ (414) $ (180) NM
3/31/20 6/30/20 9/30/20 12/31/20 3/31/21
Lincoln Financial GroupRealized Gain (Loss), After-DAC
Unaudited (millions of dollars)
For the Three Months Ended
Page 23
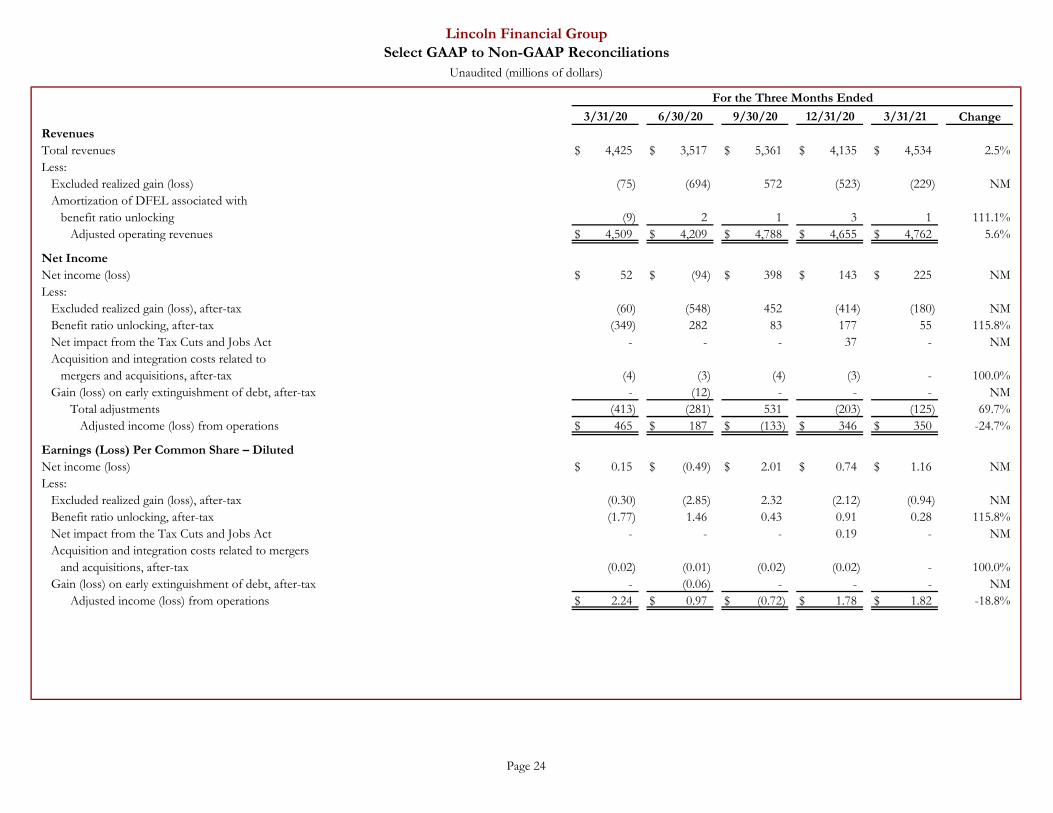
ChangeRevenuesTotal revenues $ 4,425 $ 3,517 $ 5,361 $ 4,135 $ 4,534 2.5%Less:
Excluded realized gain (loss) (75) (694) 572 (523) (229) NMAmortization of DFEL associated with
benefit ratio unlocking (9) 2 1 3 1 111.1%Adjusted operating revenues $ 4,509 $ 4,209 $ 4,788 $ 4,655 $ 4,762 5.6%
Net IncomeNet income (loss) $ 52 $ (94) $ 398 $ 143 $ 225 NMLess:
Excluded realized gain (loss), after-tax (60) (548) 452 (414) (180) NMBenefit ratio unlocking, after-tax (349) 282 83 177 55 115.8%Net impact from the Tax Cuts and Jobs Act - - - 37 - NMAcquisition and integration costs related to
mergers and acquisitions, after-tax (4) (3) (4) (3) - 100.0%Gain (loss) on early extinguishment of debt, after-tax - (12) - - - NM
Total adjustments (413) (281) 531 (203) (125) 69.7%Adjusted income (loss) from operations $ 465 $ 187 $ (133) $ 346 $ 350 -24.7%
Earnings (Loss) Per Common Share – DilutedNet income (loss) $ 0.15 $ (0.49) $ 2.01 $ 0.74 $ 1.16 NMLess:
Excluded realized gain (loss), after-tax (0.30) (2.85) 2.32 (2.12) (0.94) NMBenefit ratio unlocking, after-tax (1.77) 1.46 0.43 0.91 0.28 115.8%Net impact from the Tax Cuts and Jobs Act - - - 0.19 - NMAcquisition and integration costs related to mergers
and acquisitions, after-tax (0.02) (0.01) (0.02) (0.02) - 100.0%Gain (loss) on early extinguishment of debt, after-tax - (0.06) - - - NM
Adjusted income (loss) from operations $ 2.24 $ 0.97 $ (0.72) $ 1.78 $ 1.82 -18.8%
Lincoln Financial GroupSelect GAAP to Non-GAAP Reconciliations
Unaudited (millions of dollars)
For the Three Months Ended
3/31/20 6/30/20 9/30/20 12/31/20 3/31/21
Page 24