Embed Size (px)
Citation preview
STA
TIST
ICA
L SI
GN
AL
PRO
CE
SSIN
G F
OR
UX
O D
ISC
RIM
INA
TIO
N F
OR
ST
ATI
STIC
AL
SIG
NA
L PR
OC
ESS
ING
FO
R U
XO
DIS
CR
IMIN
ATI
ON
FO
R
NE
XT
GE
NE
RA
TIO
N S
EN
SOR
DA
TAN
EX
T-G
EN
ER
ATI
ON
SE
NSO
R D
ATA
Lesl
ie C
ollin
s, S
tacy
Tan
tum
, Cha
ndra
Thr
ockm
orto
n, J
erem
iah
Rem
us,
Did
Wi
ht#
Eik
Gik
*d
LC
iD
avid
Wrig
ht# ,
Erik
a G
aspe
rikov
a*, a
nd L
awre
nce
Car
inD
epar
tmen
tofE
lect
rical
and
Com
pute
rEng
inee
ring
Duk
eU
nive
rsity
;#U
SGS;
*Law
renc
eB
erke
ley
Nat
iona
lLab
orat
ory
Dep
artm
ent o
f Ele
ctric
al a
nd C
ompu
ter E
ngin
eerin
g, D
uke
Uni
vers
ity; #
USG
S; L
awre
nce
Ber
kele
y N
atio
nal L
abor
ator
y (M
M-1
442)
()
INTR
OD
UC
TIO
N1
UX
O C
HA
LLE
NG
ES
2 A
PPR
OA
CH
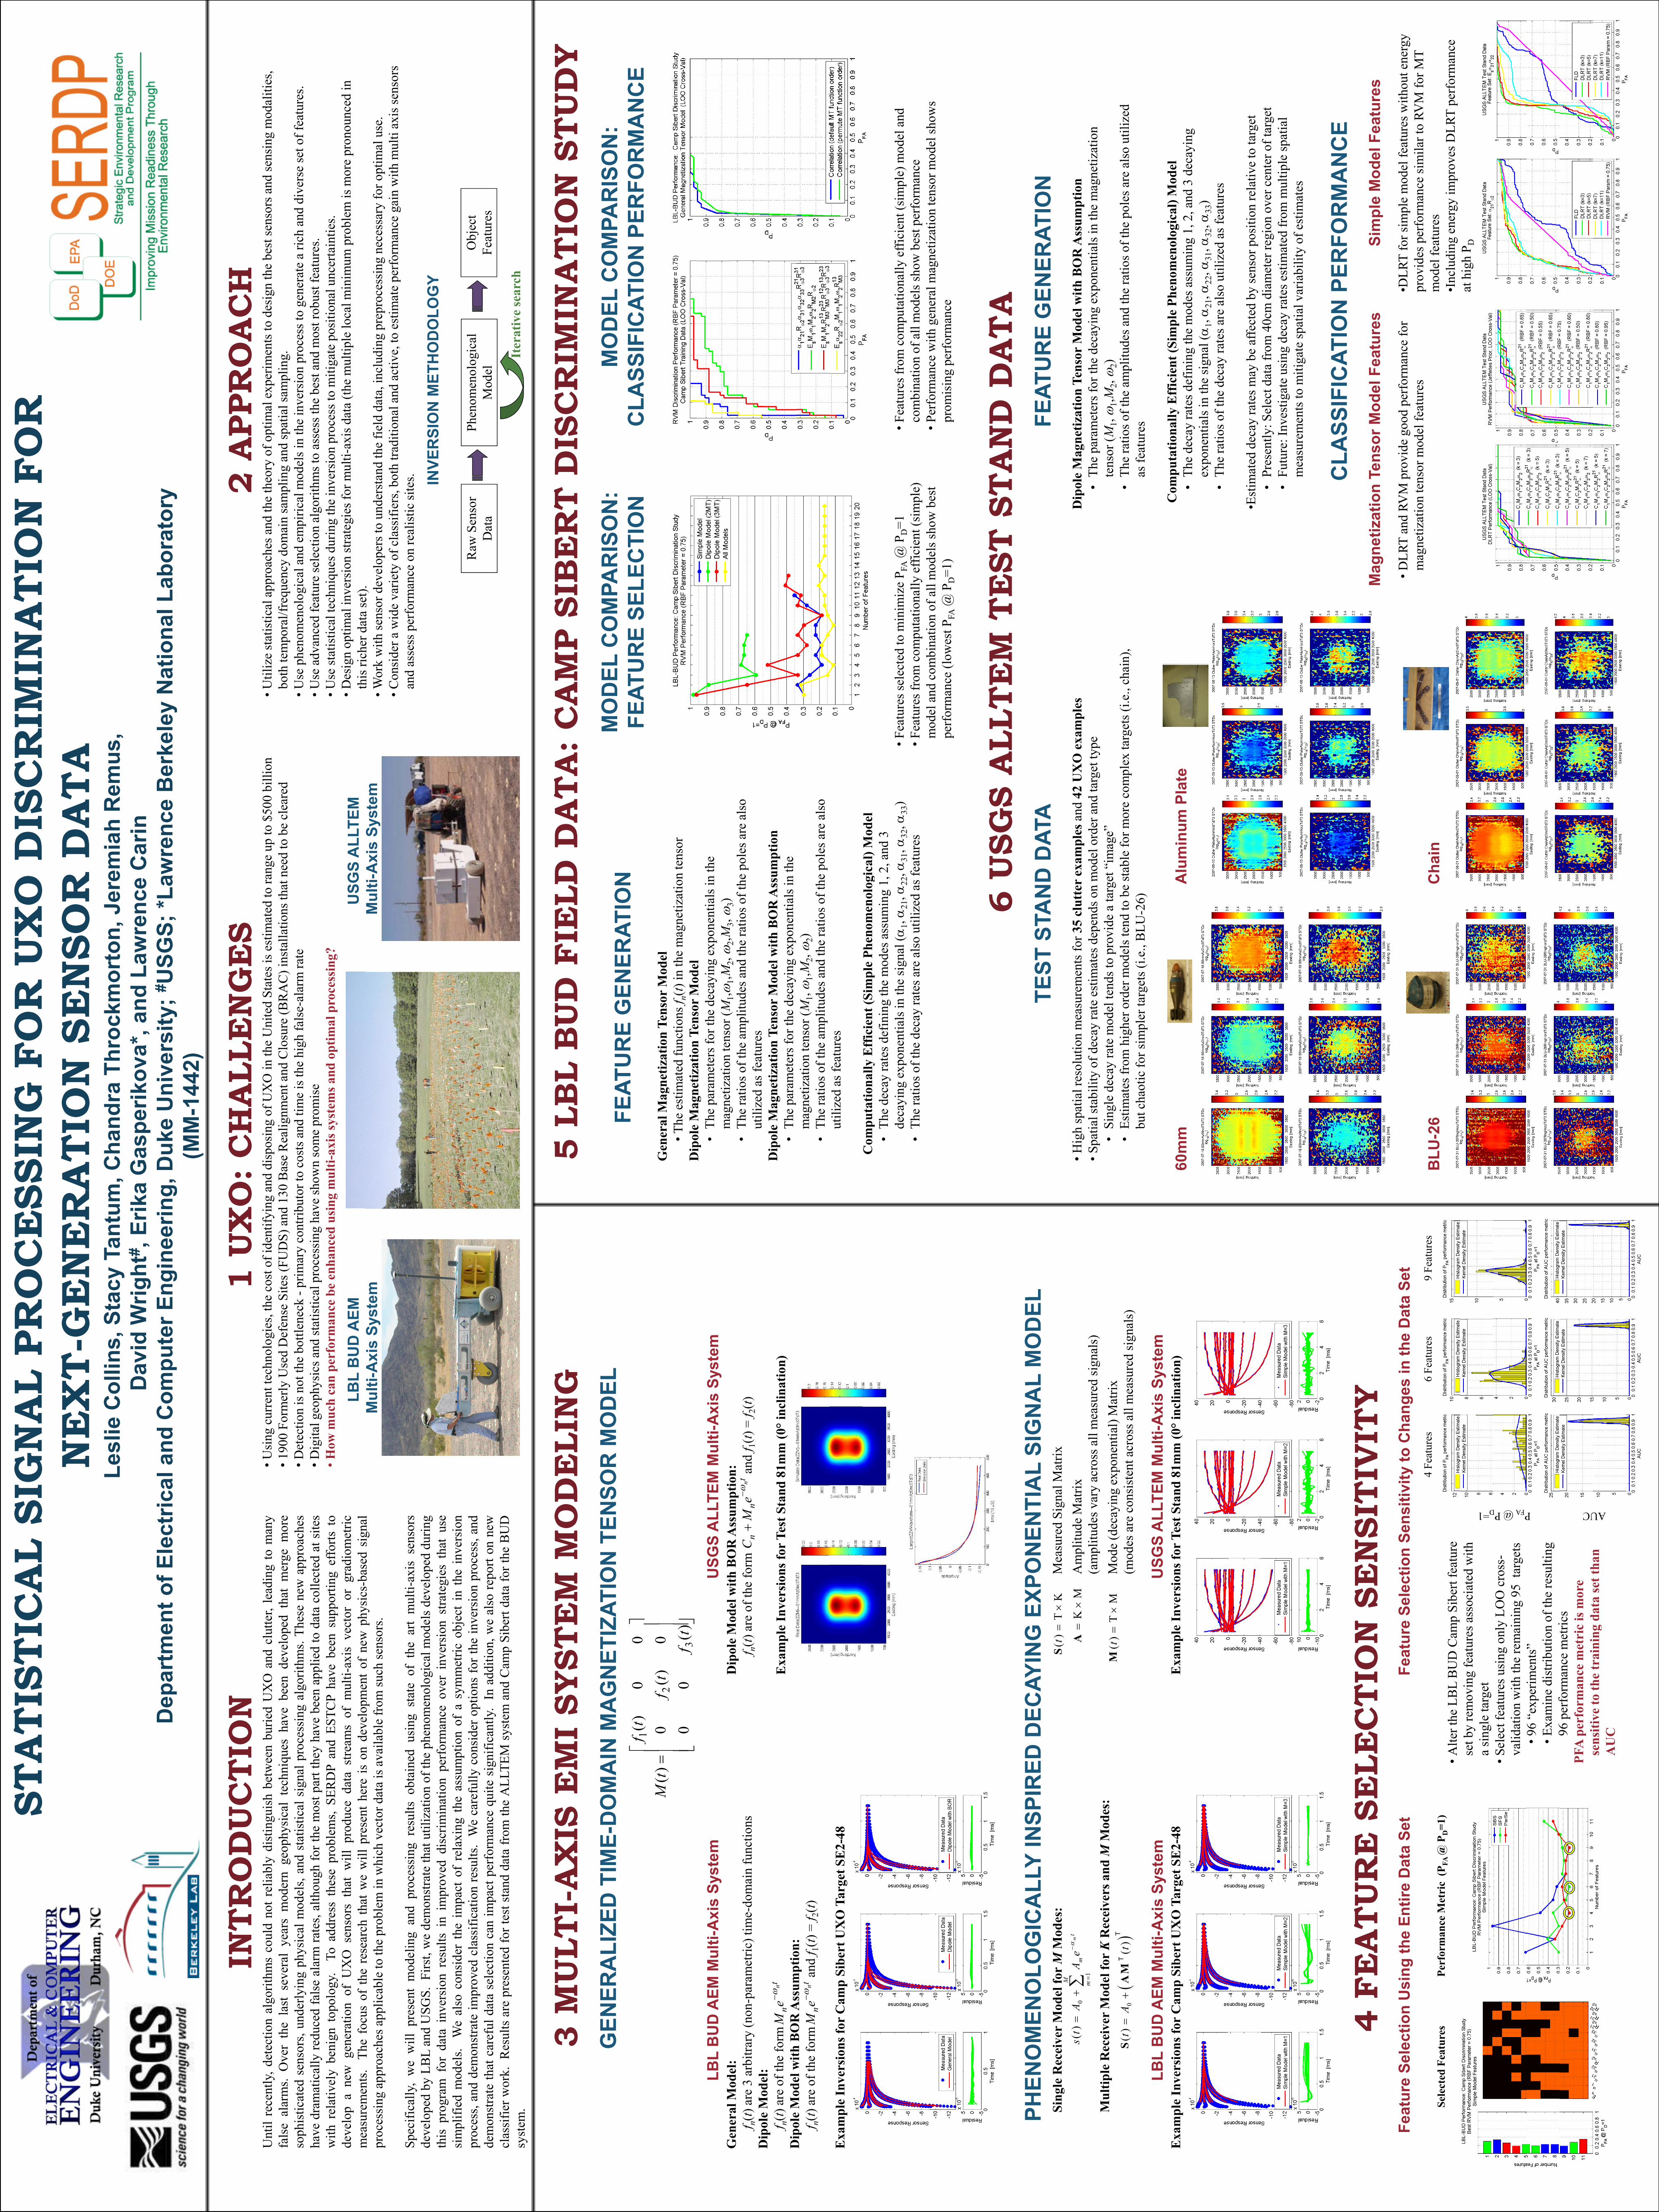
Util
tld
tti
lith
ldt
libl
diti
ih
bt
bi
dU
XO
dl
ttl
dit
INTR
OD
UC
TIO
N1
UX
O: C
HA
LLE
NG
ES
•Usi
ngc
rren
ttec
hnol
ogie
sth
eco
stof
iden
tifin
gan
ddi
spos
ing
ofU
XO
inth
eU
nite
dSt
ates
ises
timat
edto
rang
ep
to$5
00bi
llion
2 A
PPR
OA
CH
Util
ie
stat
istic
alap
proa
ches
and
the
theo
rof
optim
ale
perim
ents
tode
sign
the
best
sens
orsa
ndse
nsin
gm
odal
ities
Unt
ilre
cent
ly,d
etec
tion
algo
rithm
sco
uld
notr
elia
bly
dist
ingu
ish
betw
een
burie
dU
XO
and
clut
ter,
lead
ing
tom
any
fals
eal
arm
s.O
ver
the
last
seve
ral
year
sm
oder
nge
ophy
sica
lte
chni
ques
have
been
deve
lope
dth
atm
erge
mor
eso
phis
ticat
edse
nsor
sun
derly
ing
phys
ical
mod
els
and
stat
istic
alsi
gnal
proc
essi
ngal
gorit
hms
Thes
ene
wap
proa
ches
•Usi
ng c
urre
nt te
chno
logi
es, t
he c
ost o
f ide
ntify
ing
and
disp
osin
g of
UX
O in
the
Uni
ted
Stat
es is
est
imat
ed to
rang
e up
to $
500
billi
on
•190
0 Fo
rmer
ly U
sed
Def
ense
Site
s (FU
DS)
and
130
Bas
e R
ealig
nmen
t and
Clo
sure
(BR
AC
) ins
talla
tions
that
nee
d to
be
clea
red
•Det
ectio
nis
nott
hebo
ttlen
eck
prim
ary
cont
ribut
orto
cost
sand
time
isth
ehi
ghfa
lse
alar
mra
te
•Util
ize
stat
istic
al a
ppro
ache
s and
the
theo
ry o
f opt
imal
exp
erim
ents
to d
esig
n th
e be
st se
nsor
s and
sens
ing
mod
aliti
es,
both
tem
pora
l/fre
quen
cy d
omai
n sa
mpl
ing
and
spat
ial s
ampl
ing.
•Use
phen
omen
olog
ical
and
empi
rical
mod
elsi
nth
ein
vers
ion
proc
esst
oge
nera
tea
rich
and
dive
rse
seto
ffea
ture
sso
phis
ticat
edse
nsor
s,un
derly
ing
phys
ical
mod
els,
and
stat
istic
alsi
gnal
proc
essi
ngal
gorit
hms.
Thes
ene
wap
proa
ches
have
dram
atic
ally
redu
ced
fals
eal
arm
rate
s,al
thou
ghfo
rthe
mos
tpar
tthe
yha
vebe
enap
plie
dto
data
colle
cted
atsi
tes
with
rela
tivel
ybe
nign
topo
logy
Toad
dres
sth
ese
prob
lem
sSE
RD
Pan
dES
TCP
have
been
supp
ortin
gef
forts
to
•Det
ectio
n is
not
the
bottl
enec
k -p
rimar
y co
ntrib
utor
to c
osts
and
tim
e is
the
high
fals
e-al
arm
rate
•Dig
ital g
eoph
ysic
s and
stat
istic
al p
roce
ssin
g ha
ve sh
own
som
e pr
omis
e•H
owm
uch
can
perf
orm
ance
been
hanc
edus
ing
mul
ti-ax
issy
stem
sand
optim
alpr
oces
sing
?
•Use
phe
nom
enol
ogic
al a
nd e
mpi
rical
mod
els i
n th
e in
vers
ion
proc
ess t
o ge
nera
te a
rich
and
div
erse
set o
f fea
ture
s.•U
se a
dvan
ced
feat
ure
sele
ctio
n al
gorit
hms t
o as
sess
the
best
and
mos
t rob
ust f
eatu
res.
•Use
stat
istic
alte
chni
ques
durin
gth
ein
vers
ion
proc
esst
om
itiga
tepo
sitio
nalu
ncer
tain
ties
with
rela
tivel
ybe
nign
topo
logy
.To
addr
ess
thes
epr
oble
ms,
SER
DP
and
ESTC
Pha
vebe
ensu
ppor
ting
effo
rtsto
deve
lop
ane
wge
nera
tion
ofU
XO
sens
ors
that
will
prod
uce
data
stre
ams
ofm
ulti-
axis
vect
oror
grad
iom
etric
mea
sure
men
tsTh
efo
cus
ofth
ere
sear
chth
atw
ew
illpr
esen
the
reis
onde
velo
pmen
tof
new
phys
ics-
base
dsi
gnal
How
muc
h ca
n pe
rfor
man
ce b
e en
hanc
ed u
sing
mul
ti-ax
is sy
stem
s and
opt
imal
pro
cess
ing?
•Use
stat
istic
al te
chni
ques
dur
ing
the
inve
rsio
n pr
oces
s to
miti
gate
pos
ition
al u
ncer
tain
ties.
•Des
ign
optim
al in
vers
ion
stra
tegi
es fo
r mul
ti-ax
is d
ata
(the
mul
tiple
loca
l min
imum
pro
blem
is m
ore
pron
ounc
ed in
th
isric
herd
ata
set)
LBL
BU
D A
EM
USG
S A
LLTE
M
mea
sure
men
ts.
The
focu
sof
the
rese
arch
that
we
will
pres
ent
here
ison
deve
lopm
ent
ofne
wph
ysic
sba
sed
sign
alpr
oces
sing
appr
oach
esap
plic
able
toth
epr
oble
min
whi
chve
ctor
data
isav
aila
ble
from
such
sens
ors.
this
rich
er d
ata
set).
•Wor
k w
ith se
nsor
dev
elop
ers t
o un
ders
tand
the
field
dat
a, in
clud
ing
prep
roce
ssin
g ne
cess
ary
for o
ptim
al u
se.
•Con
side
r a w
ide
varie
ty o
f cla
ssifi
ers,
both
trad
ition
al a
nd a
ctiv
e, to
est
imat
e pe
rfor
man
ce g
ain
with
mul
ti ax
is se
nsor
s M
ulti-
Axi
s Sy
stem
Mul
ti-A
xis
Syst
em
Spec
ifica
lly,
we
will
pres
ent
mod
elin
gan
dpr
oces
sing
resu
ltsob
tain
edus
ing
stat
eof
the
art
mul
ti-ax
isse
nsor
sde
velo
ped
byLB
Lan
dU
SGS.
Firs
t,w
ede
mon
stra
teth
atut
iliza
tion
ofth
eph
enom
enol
ogic
alm
odel
sdev
elop
eddu
ring
INVE
RSI
ON
MET
HO
DO
LOG
Y
y,
,p
gan
d as
sess
per
form
ance
on
real
istic
site
s.p
y,
pg
pg
this
prog
ram
for
data
inve
rsio
nre
sults
inim
prov
eddi
scrim
inat
ion
perf
orm
ance
over
inve
rsio
nst
rate
gies
that
use
sim
plifi
edm
odel
s.W
eal
soco
nsid
erth
eim
pact
ofre
laxi
ngth
eas
sum
ptio
nof
asy
mm
etric
obje
ctin
the
inve
rsio
n
INVE
RSI
ON
MET
HO
DO
LOG
Y
proc
ess,
and
dem
onst
rate
impr
oved
clas
sific
atio
nre
sults
.W
eca
refu
llyco
nsid
erop
tions
fort
hein
vers
ion
proc
ess,
and
dem
onst
rate
that
care
fuld
ata
sele
ctio
nca
nim
pact
perf
orm
ance
quite
sign
ifica
ntly
.In
addi
tion,
we
also
repo
rton
new
Raw
Sen
sor
Dat
aPh
enom
enol
ogic
al
Mod
elO
bjec
t Fe
atur
escl
assi
fierw
ork.
Res
ults
are
pres
ente
dfo
rtes
tsta
ndda
tafr
omth
eA
LLTE
Msy
stem
and
Cam
pSi
bert
data
fort
heB
UD
syst
em.
Iter
ativ
e se
arch
3 M
ULT
IA
XIS
EM
I SY
STE
M M
OD
ELI
NG
5 LB
L B
UD
FIE
LD D
ATA
: CA
MP
SIB
ER
T D
ISC
RIM
INA
TIO
N S
TUD
Y3
MU
LTI-
AX
IS E
MI
SYST
EM
MO
DE
LIN
G5
LBL
BU
D F
IELD
DA
TA: C
AM
P SI
BE
RT
DIS
CR
IMIN
ATI
ON
STU
DY
GEN
ERA
LIZE
D T
IME-
DO
MA
IN M
AG
NET
IZAT
ION
TEN
SOR
MO
DEL
MO
DEL
CO
MPA
RIS
ON
:FE
ATU
RE
SELE
CTI
ON
MO
DEL
CO
MPA
RIS
ON
:C
LASS
IFIC
ATIO
NPE
RFO
RM
AN
CE
FEAT
UR
E G
ENER
ATIO
NFE
ATU
RE
SELE
CTI
ON
=
0)
(0
00
)(
)(
2
1
tf
tf
tM
CLA
SSIF
ICAT
ION
PER
FOR
MA
NC
EU
GO
Gen
eral
Mag
netiz
atio
nTe
nsor
Mod
el
)
(0
00
)(
0)
(
3
2
tf
tf
tM
Gen
eral
Mag
netiz
atio
n Te
nsor
Mod
el•T
he e
stim
ated
func
tions
f n(t)
in th
e m
agne
tizat
ion
tens
orD
ipol
eM
agne
tizat
ion
Tens
orM
odel
LBL
BU
D A
EM M
ulti-
Axi
s Sy
stem
USG
S A
LLTE
M M
ulti-
Axi
s Sy
stem
Gen
eral
Mod
el:
Dip
ole
Mod
elw
ithB
OR
Ass
umpt
ion:
Dip
ole
Mag
netiz
atio
n Te
nsor
Mod
el•
The
para
met
ers f
or th
e de
cayi
ng e
xpon
entia
ls in
the
mag
netiz
atio
n te
nsor
(M1,ω
1,M2,ω
2,M3,ω
3)G
ener
al M
odel
:f n(t)
are
3 ar
bitra
ry (n
on-p
aram
etric
) tim
e-do
mai
n fu
nctio
nsD
ipol
eM
odel
:
Dip
ole
Mod
el w
ith B
OR
Ass
umpt
ion:
f n(t)
are
of th
e fo
rm
an
d f 1(t)
=f 2(t)
tn
nn
eM
Cω−
+
ge
oe
so(
1,ω1,
2,ω
2,3,ω
3)•
The
ratio
s of t
he a
mpl
itude
s and
the
ratio
s of t
he p
oles
are
als
o ut
ilize
d as
feat
ures
Dip
ole
Mod
el:
f n(t)
are
of th
e fo
rmD
ipol
eM
odel
with
BO
RA
ssum
ptio
n:
tn
ne
Mω−
Exa
mpl
e In
vers
ions
for T
est S
tand
81m
m (0
°inc
linat
ion)
Dip
ole
Mag
netiz
atio
n Te
nsor
Mod
el w
ith B
OR
Ass
umpt
ion
•Th
e pa
ram
eter
s for
the
deca
ying
exp
onen
tials
in th
e D
ipol
e M
odel
with
BO
R A
ssum
ptio
n:f n(t)
are
of th
e fo
rm
and f 1(t)
=f 2(t)
tn
ne
Mω−
mag
netiz
atio
n te
nsor
(M1,ω
1,M2,ω
2)•
The
ratio
s of t
he a
mpl
itude
s and
the
ratio
s of t
he p
oles
are
als
o E
xam
ple
Inve
rsio
ns fo
r C
amp
Sibe
rt U
XO
Tar
get S
E2-
48ut
ilize
d as
feat
ures
Ft
lt
dt
ii
iP
@P
1
Com
puta
tiona
lly E
ffic
ient
(Sim
ple
Phen
omen
olog
ical
) Mod
el•
The
deca
y ra
tes d
efin
ing
the
mod
es a
ssum
ing
1, 2
, and
3
di
til
ith
il(
)F
tf
tti
llffi
it(
il
)d
ld
•Fea
ture
s sel
ecte
d to
min
imiz
e P F
A@
PD=1
•Fea
ture
s fro
m c
ompu
tatio
nally
effi
cien
t (si
mpl
e)
mod
elan
dco
mbi
natio
nof
allm
odel
ssho
best
deca
ying
exp
onen
tials
in th
e si
gnal
(α1,α
21,α
22,α
31,α
32,α
33)
•Th
e ra
tios o
f the
dec
ay ra
tes a
re a
lso
utili
zed
as fe
atur
es•F
eatu
res f
rom
com
puta
tiona
lly e
ffici
ent (
sim
ple)
mod
el a
nd
com
bina
tion
of a
ll m
odel
s sho
w b
est p
erfo
rman
ce•P
erfo
rman
ceith
gene
ralm
agne
tiat
ion
tens
orm
odel
sho
sm
odel
and
com
bina
tion
of a
ll m
odel
s sho
w b
est
perf
orm
ance
(low
est P
FA@
PD=1
)•P
erfo
rman
ce w
ith g
ener
al m
agne
tizat
ion
tens
or m
odel
show
s pr
omis
ing
perf
orm
ance
6 U
SGS
ALL
TEM
TE
ST S
TAN
D D
ATA
PHEN
OM
ENO
LOG
ICA
LLY
INSP
IRED
DEC
AYIN
GEX
PON
ENTI
AL
SIG
NA
LM
OD
EL6
USG
S A
LLTE
M T
EST
STA
ND
DA
TAPH
ENO
MEN
OLO
GIC
ALL
Y IN
SPIR
ED D
ECAY
ING
EXP
ON
ENTI
AL
SIG
NA
L M
OD
ELSi
ngle
Rec
eive
r M
odel
for M
Mod
es:
Mea
sure
dSi
gnal
Mat
rixK
T)
(×
=t
STE
ST S
TAN
D D
ATA
FEAT
UR
E G
ENER
ATIO
N0
1(
)m
Mt
mm
st
AAe
α−
=
=+∑
gg
Am
plitu
de M
atrix
(am
plitu
desv
ary
acro
ssal
lmea
sure
dsi
gnal
s)
)(
MK×
=A
•Hig
h sp
atia
l res
olut
ion
mea
sure
men
ts fo
r 35
clut
ter
exam
ples
and
42
UX
O e
xam
ples
•Spa
tials
tabi
lity
ofde
cay
rate
estim
ates
depe
ndso
nm
odel
orde
rand
targ
etty
peD
ipol
e M
agne
tizat
ion
Tens
or M
odel
with
BO
R A
ssum
ptio
n•
The
para
met
ersf
orth
ede
cayi
ngex
pone
ntia
lsin
the
mag
netiz
atio
n
()
0(
)(
)T
Tt
At
=+
SA
M
Mul
tiple
Rec
eive
r M
odel
for K
Rec
eive
rs a
nd M
Mod
es:
(am
plitu
desv
ary
acro
ss a
ll m
easu
red
sign
als)
Mod
e (d
ecay
ing
expo
nent
ial)
Mat
rix(m
odes
are
cons
iste
ntac
ross
allm
easu
red
sign
als)
MT
)(
×=
tM
Spat
ial s
tabi
lity
of d
ecay
rate
est
imat
es d
epen
ds o
n m
odel
ord
er a
nd ta
rget
type
•Si
ngle
dec
ay ra
te m
odel
tend
s to
prov
ide
a ta
rget
“im
age”
•Es
timat
esfr
omhi
gher
orde
rmod
elst
end
tobe
stab
lefo
rmor
eco
mpl
exta
rget
s(i.e
.,ch
ain)
,
The
para
met
ers f
or th
e de
cayi
ng e
xpon
entia
ls in
the
mag
netiz
atio
n te
nsor
(M1,ω
1,M2,ω
2)•
The
ratio
soft
heam
plitu
desa
ndth
era
tioso
fthe
pole
sare
also
utili
zed
()
0(
)(
)t
At
+S
AM
(mod
es a
re c
onsi
sten
t acr
oss a
ll m
easu
red
sign
als)
LBL
BU
DA
EMM
ulti-
Axi
sSy
stem
USG
SA
LLTE
MM
ulti-
Axi
sSy
stem
Estim
ates
from
hig
her o
rder
mod
els t
end
to b
e st
able
for m
ore
com
plex
targ
ets (
i.e.,
chai
n),
but c
haot
ic fo
r sim
pler
targ
ets (
i.e.,
BLU
-26)
The
ratio
s of t
he a
mpl
itude
s and
the
ratio
s of t
he p
oles
are
als
o ut
ilize
d as
feat
ures
LBL
BU
D A
EM M
ulti
Axi
s Sy
stem
USG
S A
LLTE
M M
ulti
Axi
s Sy
stem
Exa
mpl
e In
vers
ions
for
Cam
p Si
bert
UX
O T
arge
t SE
2-48
Exa
mpl
e In
vers
ions
for T
est S
tand
81m
m (0
°inc
linat
ion)
Com
puta
tiona
lly E
ffic
ient
(Sim
ple
Phen
omen
olog
ical
) Mod
el•
The
deca
y ra
tes d
efin
ing
the
mod
es a
ssum
ing
1, 2
, and
3 d
ecay
ing
60m
mA
lum
inum
Pla
tey
gg
yg
expo
nent
ials
in th
e si
gnal
(α1,α
21,α
22,α
31,α
32,α
33)
•Th
e ra
tios o
f the
dec
ay ra
tes a
re a
lso
utili
zed
as fe
atur
es
•Est
imat
ed d
ecay
rate
s may
be
affe
cted
by
sens
or p
ositi
on re
lativ
e to
targ
et•
Pres
ently
: Sel
ect d
ata
from
40c
m d
iam
eter
regi
on o
ver c
ente
r of t
arge
t•
Futu
re: I
nves
tigat
e us
ing
deca
y ra
tes e
stim
ated
from
mul
tiple
spat
ial
iii
li
bili
fi
mea
sure
men
ts to
miti
gate
spat
ial v
aria
bilit
y of
est
imat
es
4 FE
ATU
RE
SE
LEC
TIO
N S
EN
SITI
VIT
YC
LASS
IFIC
ATIO
N P
ERFO
RM
AN
CE
4 FE
ATU
RE
SE
LEC
TIO
N S
EN
SITI
VIT
YM
agne
tizat
ion
Tens
or M
odel
Fea
ture
sSi
mpl
e M
odel
Fea
ture
s
4Fe
atur
es6
Feat
ures
9Fe
atur
es
Feat
ure
Sele
ctio
n U
sing
the
Entir
e D
ata
Set
Feat
ure
Sele
ctio
n Se
nsiti
vity
to C
hang
es in
the
Dat
a Se
t•D
LRT
and
RVM
pro
vide
goo
d pe
rfor
man
ce fo
r m
agne
tizat
ion
tens
or m
odel
feat
ures
•DLR
T fo
r sim
ple
mod
el fe
atur
es w
ithou
t ene
rgy
prov
ides
per
form
ance
sim
ilar t
o RV
M fo
r MT
4 Fe
atur
es6
Feat
ures
9 Fe
atur
es
•Alte
r the
LB
L B
UD
Cam
p Si
bert
feat
ure
Sele
cted
Fea
ture
sPe
rfor
man
ce M
etri
c (P
FA @
PD=1
)B
LU-2
6C
hain
mod
el fe
atur
es•I
nclu
ding
ene
rgy
impr
oves
DLR
T pe
rfor
man
ce
D=1
set b
y re
mov
ing
feat
ures
ass
ocia
ted
with
a
sing
le ta
rget
at h
igh
P D
PFA@ PD
•Sel
ect f
eatu
res u
sing
onl
y LO
O c
ross
-va
lidat
ion
with
the
rem
aini
ng 9
5 ta
rget
s
P
•96
“exp
erim
ents
”•E
xam
ine
dist
ribut
ion
of th
e re
sulti
ng
96f
ti
UC
96 p
erfo
rman
ce m
etric
sPF
A p
erfo
rman
ce m
etri
c is
mor
e se
nsiti
veto
the
trai
ning
data
sett
han
AU
sens
itive
to th
e tr
aini
ng d
ata
set t
han
AU
C


![[Monson H. Hayes] Statistical Digital Signal Processing](https://img.pdfslide.us/doc/110x75/563db7e3550346aa9a8ee680/monson-h-hayes-statistical-digital-signal-processing.jpg)