Embed Size (px)
DESCRIPTION
When applied to bones, statistical shape models (SSM) and statistical appearance models (SAM) respectively de- scribe the mean shape and mean density distribution of bones within a certain population as well as the main modes of variations of shape and density distribution from their mean values. The availability of this quantitative information regarding the detailed anatomy of bones provides new opportunities for diagnosis, evaluation, and treatment of skeletal diseases. The potential of SSM and SAM has been recently recognized within the bone research community. For example, these models have been applied for studying the effects of bone shape on the etiology of osteoarthritis, improving the acc
Citation preview
ARTICLE IN PRESS
Journal of Biomechanics 43 (2010) 1780–1786
Contents lists available at ScienceDirect
journal homepage: www.elsevier.com/locate/jbiomech
Journal of Biomechanics
0021-92
doi:10.1
n Corr
E-m
www.JBiomech.com
Statistical shape modeling describes variation in tibia and femur surfacegeometry between Control and Incidence groups from the OsteoarthritisInitiative database
Todd L. Bredbenner a,n, Travis D. Eliason a, Ryan S. Potter a, Robert L. Mason a, Lorena M. Havill b,Daniel P. Nicolella a
a Southwest Research Institute, 6220 Culebra Road, San Antonio, TX 78238-5166, USAb Southwest Foundation for Biomedical Research, San Antonio, TX, USA
a r t i c l e i n f o
Article history:
Accepted 10 February 2010We hypothesize that variability in knee subchondral bone surface geometry will differentiate between
patients at risk and those not at risk for developing osteoarthritis (OA) and suggest that statistical shape
Keywords:
Osteoarthritis
Knee
Geometry
Alignment
Statistical shape modeling
90/$ - see front matter & 2010 Elsevier Ltd. A
016/j.jbiomech.2010.02.015
esponding author. Tel.: +1 210 522 3565; fax
ail address: [email protected] (T.L. B
Downloaded from http://www.elea
a b s t r a c t
modeling (SSM) methods form the basis for developing a diagnostic tool for predicting the onset of OA.
Using a subset of clinical knee MRI data from the osteoarthritis initiative (OAI), the objectives of this
study were to (1) utilize SSM to compactly and efficiently describe variability in knee subchondral bone
surface geometry and (2) determine the efficacy of SSM and rigid body transformations to distinguish
between patients who are not expected to develop osteoarthritis (i.e. Control group) and those with
clinical risk factors for OA (i.e. Incidence group). Quantitative differences in femur and tibia surface
geometry were demonstrated between groups, although differences in knee joint alignment measures
were not statistically significant, suggesting that variability in individual bone geometry may play a
greater role in determining joint space geometry and mechanics. SSM provides a means of explicitly
describing complete articular surface geometry and allows the complex spatial variation in joint surface
geometry and joint congruence between healthy subjects and those with clinical risk of developing or
existing signs of OA to be statistically demonstrated.
& 2010 Elsevier Ltd. All rights reserved.
1. Introduction
Osteoarthritis (OA) is the most common form of arthritis and isa tremendous public health concern. More than half of theapproximately 41 million people in the United States aged 65 andolder have radiological evidence of OA in at least one joint andalmost all persons over the age of 80 are expected to demonstrateOA symptoms (Bagge et al., 1992; United Nations, 2009; VanSaase et al., 1989). OA causes joint pain, swelling, and reducedmotion due to degradation of the articular cartilage covering thejoint surfaces (Kuettner and Goldberg, 1995).
Current pharmacological treatments target symptoms but notthe cause of OA; there does not appear to be clear evidence thatcurrent treatments inhibit the degenerative changes to jointstructure (cartilage and bone) responsible for disease progression(Courtney and Doherty, 2006; Felson et al., 2000b). Furthermore,understanding disease etiology and clinical testing of newtherapies is complicated by the highly variable path of OA
ll rights reserved.
: +1 210 522 6965.
redbenner).
rnica.ir
progression in individual patients and the multitude of clinicalrisk factors (Pelletier et al., 2007).
It is widely believed that OA results from the local mechanicalenvironment of the joint in general, and in the cartilage inparticular, in combination with systemic susceptibility to thedisease (Andriacchi et al., 2009; Felson et al., 2000b). Threedominant risk factors for early onset development of knee OA aremechanical insult to the joint, ligament damage, and obesity, all ofwhich alter the mechanical environment of the knee joint, and itis thought that this alteration in joint mechanics is in partresponsible for the accelerated degradation of cartilage (Felsonet al., 2000a). However, many individuals without risk factors willdevelop OA later in life (Mow and Ratcliffe, 1997), leading to thehypothesis that slight differences in joint mechanics, driven byvariability in joint anatomy, along with biological predisposition,is responsible for OA onset and progression (Felson et al., 2000a).
Several studies have investigated the role of femoral condyleor tibial plateau geometry in order to understand whether andhow bone geometry is related to the risk and progression of OA inthe knee. Previous efforts have utilized discrete, low fidelitymeasures such as bone volume, surface area, two-dimensionaldistal femur shape, condylar radius of curvature, principal surface
ARTICLE IN PRESS
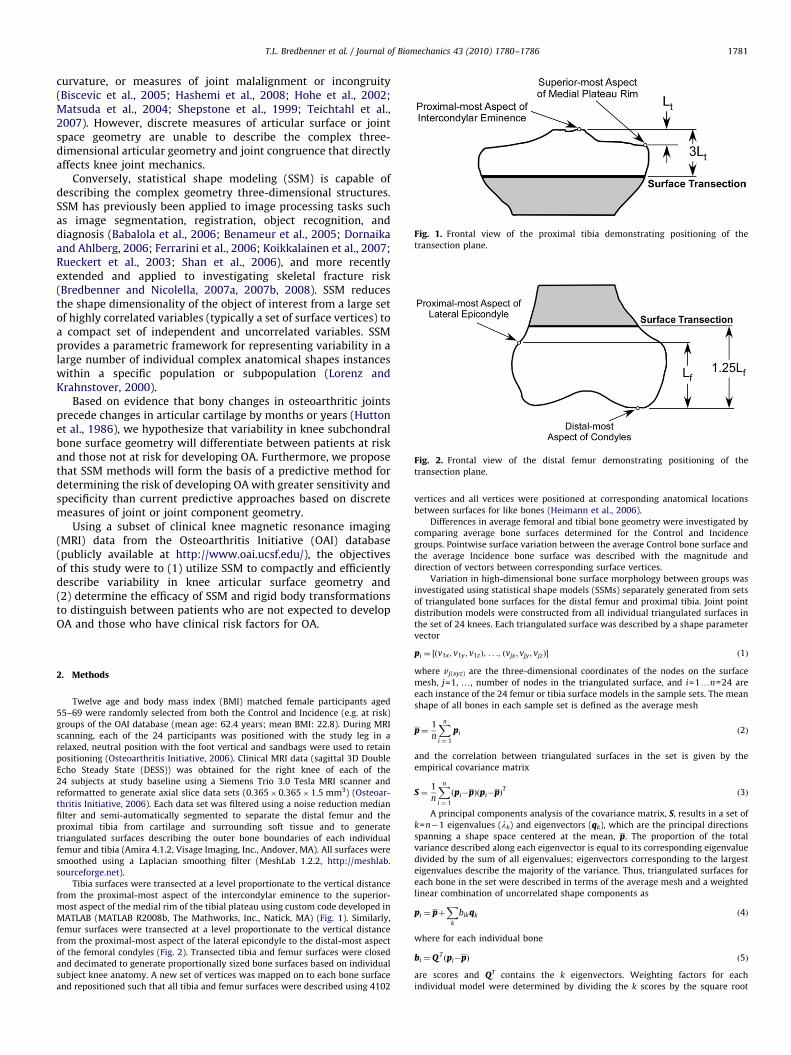
Fig. 1. Frontal view of the proximal tibia demonstrating positioning of the
transection plane.
Fig. 2. Frontal view of the distal femur demonstrating positioning of the
transection plane.
T.L. Bredbenner et al. / Journal of Biomechanics 43 (2010) 1780–1786 1781
curvature, or measures of joint malalignment or incongruity(Biscevic et al., 2005; Hashemi et al., 2008; Hohe et al., 2002;Matsuda et al., 2004; Shepstone et al., 1999; Teichtahl et al.,2007). However, discrete measures of articular surface or jointspace geometry are unable to describe the complex three-dimensional articular geometry and joint congruence that directlyaffects knee joint mechanics.
Conversely, statistical shape modeling (SSM) is capable ofdescribing the complex geometry three-dimensional structures.SSM has previously been applied to image processing tasks suchas image segmentation, registration, object recognition, anddiagnosis (Babalola et al., 2006; Benameur et al., 2005; Dornaikaand Ahlberg, 2006; Ferrarini et al., 2006; Koikkalainen et al., 2007;Rueckert et al., 2003; Shan et al., 2006), and more recentlyextended and applied to investigating skeletal fracture risk(Bredbenner and Nicolella, 2007a, 2007b, 2008). SSM reducesthe shape dimensionality of the object of interest from a large setof highly correlated variables (typically a set of surface vertices) toa compact set of independent and uncorrelated variables. SSMprovides a parametric framework for representing variability in alarge number of individual complex anatomical shapes instanceswithin a specific population or subpopulation (Lorenz andKrahnstover, 2000).
Based on evidence that bony changes in osteoarthritic jointsprecede changes in articular cartilage by months or years (Huttonet al., 1986), we hypothesize that variability in knee subchondralbone surface geometry will differentiate between patients at riskand those not at risk for developing OA. Furthermore, we proposethat SSM methods will form the basis of a predictive method fordetermining the risk of developing OA with greater sensitivity andspecificity than current predictive approaches based on discretemeasures of joint or joint component geometry.
Using a subset of clinical knee magnetic resonance imaging(MRI) data from the Osteoarthritis Initiative (OAI) database(publicly available at http://www.oai.ucsf.edu/), the objectivesof this study were to (1) utilize SSM to compactly and efficientlydescribe variability in knee articular surface geometry and(2) determine the efficacy of SSM and rigid body transformationsto distinguish between patients who are not expected to developOA and those who have clinical risk factors for OA.
2. Methods
Twelve age and body mass index (BMI) matched female participants aged
55–69 were randomly selected from both the Control and Incidence (e.g. at risk)
groups of the OAI database (mean age: 62.4 years; mean BMI: 22.8). During MRI
scanning, each of the 24 participants was positioned with the study leg in a
relaxed, neutral position with the foot vertical and sandbags were used to retain
positioning (Osteoarthritis Initiative, 2006). Clinical MRI data (sagittal 3D Double
Echo Steady State (DESS)) was obtained for the right knee of each of the
24 subjects at study baseline using a Siemens Trio 3.0 Tesla MRI scanner and
reformatted to generate axial slice data sets (0.365�0.365�1.5 mm3) (Osteoar-
thritis Initiative, 2006). Each data set was filtered using a noise reduction median
filter and semi-automatically segmented to separate the distal femur and the
proximal tibia from cartilage and surrounding soft tissue and to generate
triangulated surfaces describing the outer bone boundaries of each individual
femur and tibia (Amira 4.1.2, Visage Imaging, Inc., Andover, MA). All surfaces were
smoothed using a Laplacian smoothing filter (MeshLab 1.2.2, http://meshlab.
sourceforge.net).
Tibia surfaces were transected at a level proportionate to the vertical distance
from the proximal-most aspect of the intercondylar eminence to the superior-
most aspect of the medial rim of the tibial plateau using custom code developed in
MATLAB (MATLAB R2008b, The Mathworks, Inc., Natick, MA) (Fig. 1). Similarly,
femur surfaces were transected at a level proportionate to the vertical distance
from the proximal-most aspect of the lateral epicondyle to the distal-most aspect
of the femoral condyles (Fig. 2). Transected tibia and femur surfaces were closed
and decimated to generate proportionally sized bone surfaces based on individual
subject knee anatomy. A new set of vertices was mapped on to each bone surface
and repositioned such that all tibia and femur surfaces were described using 4102
vertices and all vertices were positioned at corresponding anatomical locations
between surfaces for like bones (Heimann et al., 2006).
Differences in average femoral and tibial bone geometry were investigated by
comparing average bone surfaces determined for the Control and Incidence
groups. Pointwise surface variation between the average Control bone surface and
the average Incidence bone surface was described with the magnitude and
direction of vectors between corresponding surface vertices.
Variation in high-dimensional bone surface morphology between groups was
investigated using statistical shape models (SSMs) separately generated from sets
of triangulated bone surfaces for the distal femur and proximal tibia. Joint point
distribution models were constructed from all individual triangulated surfaces in
the set of 24 knees. Each triangulated surface was described by a shape parameter
vector
pi ¼ ½ðv1x ; v1y ; v1zÞ; . . .; ðvjx ; vjy ; vjzÞ� ð1Þ
where vj(xyz) are the three-dimensional coordinates of the nodes on the surface
mesh, j=1, y, number of nodes in the triangulated surface, and i=1yn=24 are
each instance of the 24 femur or tibia surface models in the sample sets. The mean
shape of all bones in each sample set is defined as the average mesh
p¼1
n
Xn
i ¼ 1
pi ð2Þ
and the correlation between triangulated surfaces in the set is given by the
empirical covariance matrix
S ¼1
n
Xn
i ¼ 1
ðpi�pÞðpi�pÞT ð3Þ
A principal components analysis of the covariance matrix, S, results in a set of
k=n�1 eigenvalues (lk) and eigenvectors (qk), which are the principal directions
spanning a shape space centered at the mean, p. The proportion of the total
variance described along each eigenvector is equal to its corresponding eigenvalue
divided by the sum of all eigenvalues; eigenvectors corresponding to the largest
eigenvalues describe the majority of the variance. Thus, triangulated surfaces for
each bone in the set were described in terms of the average mesh and a weighted
linear combination of uncorrelated shape components as
pi ¼ pþX
k
bikqk ð4Þ
where for each individual bone
bi ¼Q Tðpi�pÞ ð5Þ
are scores and QT contains the k eigenvectors. Weighting factors for each
individual model were determined by dividing the k scores by the square root
ARTICLE IN PRESS
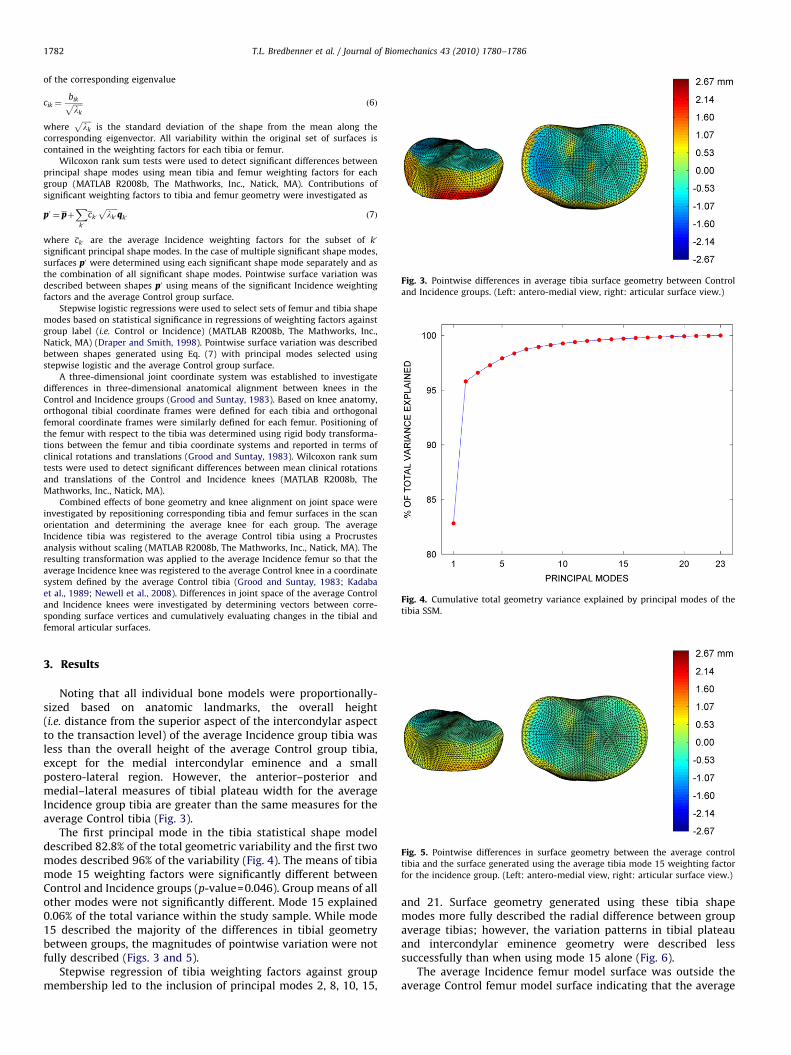
Fig. 3. Pointwise differences in average tibia surface geometry between Control
and Incidence groups. (Left: antero-medial view, right: articular surface view.)
Fig. 4. Cumulative total geometry variance explained by principal modes of the
tibia SSM.
T.L. Bredbenner et al. / Journal of Biomechanics 43 (2010) 1780–17861782
of the corresponding eigenvalue
cik ¼bikffiffiffiffiffilk
p ð6Þ
whereffiffiffiffiffilk
pis the standard deviation of the shape from the mean along the
corresponding eigenvector. All variability within the original set of surfaces is
contained in the weighting factors for each tibia or femur.
Wilcoxon rank sum tests were used to detect significant differences between
principal shape modes using mean tibia and femur weighting factors for each
group (MATLAB R2008b, The Mathworks, Inc., Natick, MA). Contributions of
significant weighting factors to tibia and femur geometry were investigated as
p0 ¼ pþX
k0
ck0
ffiffiffiffiffiffilk0
pqk0 ð7Þ
where ck0 are the average Incidence weighting factors for the subset of k0
significant principal shape modes. In the case of multiple significant shape modes,
surfaces p0 were determined using each significant shape mode separately and as
the combination of all significant shape modes. Pointwise surface variation was
described between shapes p0 using means of the significant Incidence weighting
factors and the average Control group surface.
Stepwise logistic regressions were used to select sets of femur and tibia shape
modes based on statistical significance in regressions of weighting factors against
group label (i.e. Control or Incidence) (MATLAB R2008b, The Mathworks, Inc.,
Natick, MA) (Draper and Smith, 1998). Pointwise surface variation was described
between shapes generated using Eq. (7) with principal modes selected using
stepwise logistic and the average Control group surface.
A three-dimensional joint coordinate system was established to investigate
differences in three-dimensional anatomical alignment between knees in the
Control and Incidence groups (Grood and Suntay, 1983). Based on knee anatomy,
orthogonal tibial coordinate frames were defined for each tibia and orthogonal
femoral coordinate frames were similarly defined for each femur. Positioning of
the femur with respect to the tibia was determined using rigid body transforma-
tions between the femur and tibia coordinate systems and reported in terms of
clinical rotations and translations (Grood and Suntay, 1983). Wilcoxon rank sum
tests were used to detect significant differences between mean clinical rotations
and translations of the Control and Incidence knees (MATLAB R2008b, The
Mathworks, Inc., Natick, MA).
Combined effects of bone geometry and knee alignment on joint space were
investigated by repositioning corresponding tibia and femur surfaces in the scan
orientation and determining the average knee for each group. The average
Incidence tibia was registered to the average Control tibia using a Procrustes
analysis without scaling (MATLAB R2008b, The Mathworks, Inc., Natick, MA). The
resulting transformation was applied to the average Incidence femur so that the
average Incidence knee was registered to the average Control knee in a coordinate
system defined by the average Control tibia (Grood and Suntay, 1983; Kadaba
et al., 1989; Newell et al., 2008). Differences in joint space of the average Control
and Incidence knees were investigated by determining vectors between corre-
sponding surface vertices and cumulatively evaluating changes in the tibial and
femoral articular surfaces.
Fig. 5. Pointwise differences in surface geometry between the average control
tibia and the surface generated using the average tibia mode 15 weighting factor
for the incidence group. (Left: antero-medial view, right: articular surface view.)
3. Results
Noting that all individual bone models were proportionally-sized based on anatomic landmarks, the overall height(i.e. distance from the superior aspect of the intercondylar aspectto the transaction level) of the average Incidence group tibia wasless than the overall height of the average Control group tibia,except for the medial intercondylar eminence and a smallpostero-lateral region. However, the anterior–posterior andmedial–lateral measures of tibial plateau width for the averageIncidence group tibia are greater than the same measures for theaverage Control tibia (Fig. 3).
The first principal mode in the tibia statistical shape modeldescribed 82.8% of the total geometric variability and the first twomodes described 96% of the variability (Fig. 4). The means of tibiamode 15 weighting factors were significantly different betweenControl and Incidence groups (p-value=0.046). Group means of allother modes were not significantly different. Mode 15 explained0.06% of the total variance within the study sample. While mode15 described the majority of the differences in tibial geometrybetween groups, the magnitudes of pointwise variation were notfully described (Figs. 3 and 5).
Stepwise regression of tibia weighting factors against groupmembership led to the inclusion of principal modes 2, 8, 10, 15,
and 21. Surface geometry generated using these tibia shapemodes more fully described the radial difference between groupaverage tibias; however, the variation patterns in tibial plateauand intercondylar eminence geometry were described lesssuccessfully than when using mode 15 alone (Fig. 6).
The average Incidence femur model surface was outside theaverage Control femur model surface indicating that the average
ARTICLE IN PRESS
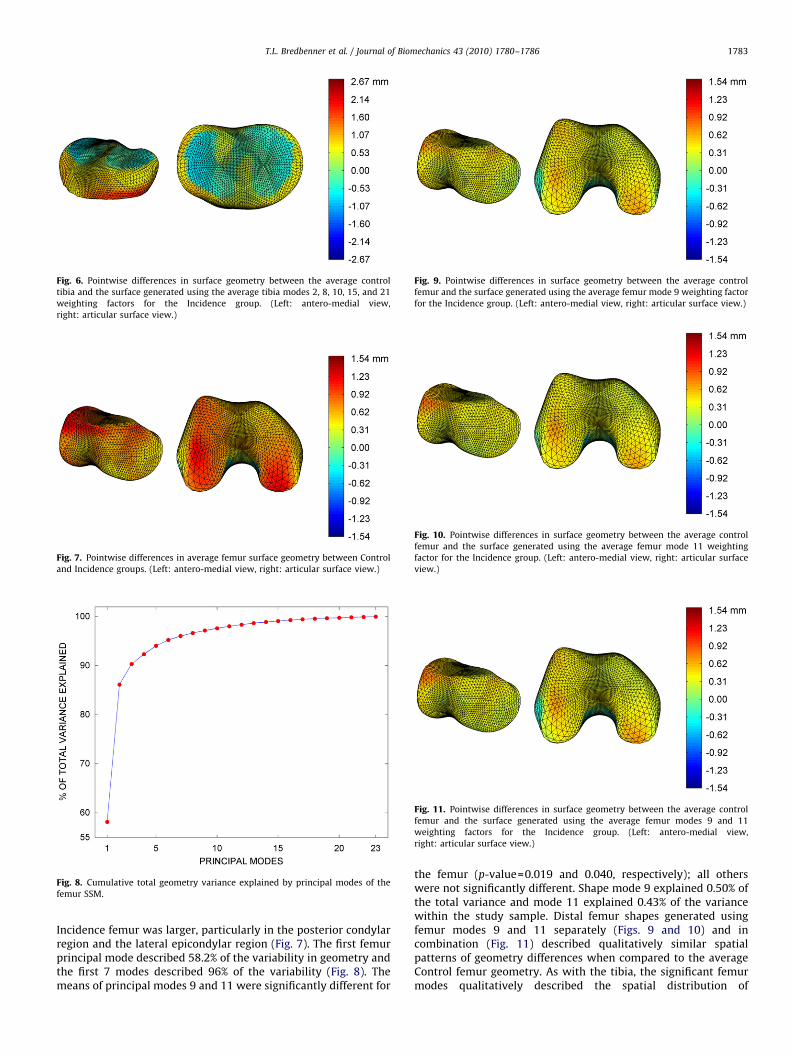
Fig. 6. Pointwise differences in surface geometry between the average control
tibia and the surface generated using the average tibia modes 2, 8, 10, 15, and 21
weighting factors for the Incidence group. (Left: antero-medial view,
right: articular surface view.)
Fig. 7. Pointwise differences in average femur surface geometry between Control
and Incidence groups. (Left: antero-medial view, right: articular surface view.)
Fig. 8. Cumulative total geometry variance explained by principal modes of the
femur SSM.
Fig. 9. Pointwise differences in surface geometry between the average control
femur and the surface generated using the average femur mode 9 weighting factor
for the Incidence group. (Left: antero-medial view, right: articular surface view.)
Fig. 10. Pointwise differences in surface geometry between the average control
femur and the surface generated using the average femur mode 11 weighting
factor for the Incidence group. (Left: antero-medial view, right: articular surface
view.)
Fig. 11. Pointwise differences in surface geometry between the average control
femur and the surface generated using the average femur modes 9 and 11
weighting factors for the Incidence group. (Left: antero-medial view,
right: articular surface view.)
T.L. Bredbenner et al. / Journal of Biomechanics 43 (2010) 1780–1786 1783
Incidence femur was larger, particularly in the posterior condylarregion and the lateral epicondylar region (Fig. 7). The first femurprincipal mode described 58.2% of the variability in geometry andthe first 7 modes described 96% of the variability (Fig. 8). Themeans of principal modes 9 and 11 were significantly different for
the femur (p-value=0.019 and 0.040, respectively); all otherswere not significantly different. Shape mode 9 explained 0.50% ofthe total variance and mode 11 explained 0.43% of the variancewithin the study sample. Distal femur shapes generated usingfemur modes 9 and 11 separately (Figs. 9 and 10) and incombination (Fig. 11) described qualitatively similar spatialpatterns of geometry differences when compared to the averageControl femur geometry. As with the tibia, the significant femurmodes qualitatively described the spatial distribution of
ARTICLE IN PRESS
T.L. Bredbenner et al. / Journal of Biomechanics 43 (2010) 1780–17861784
differences in femur articular surface geometry between groups(Fig. 7), although the variation magnitudes were not fullydescribed.
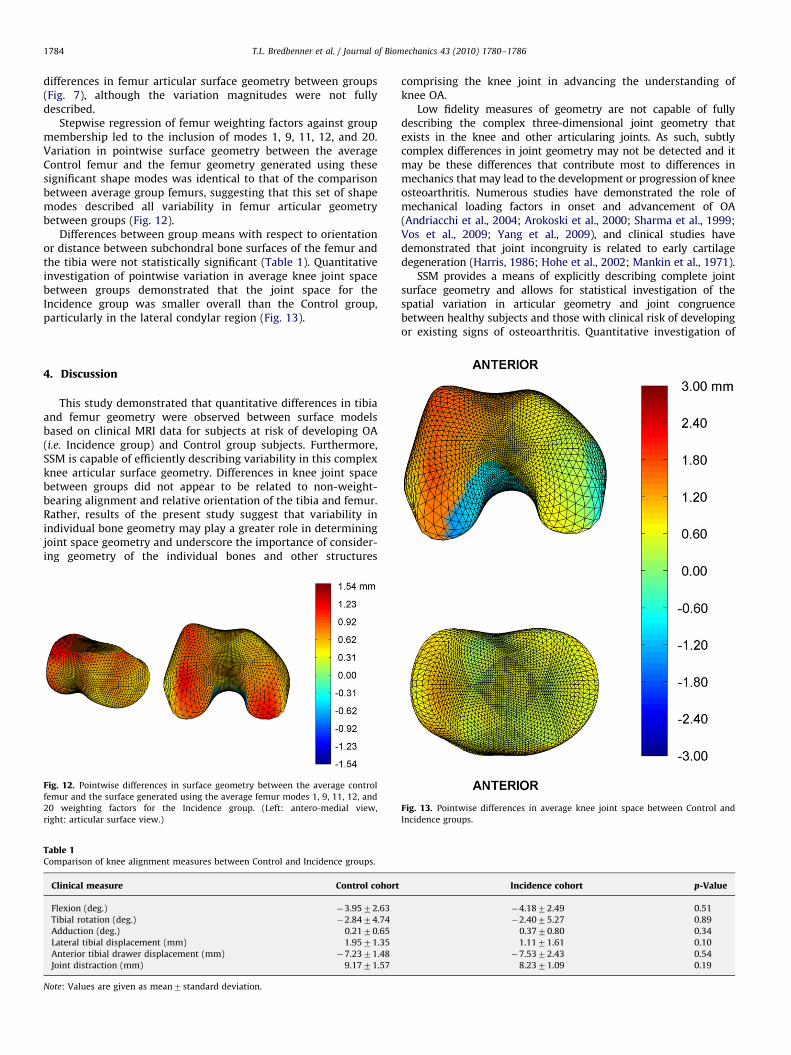
Stepwise regression of femur weighting factors against groupmembership led to the inclusion of modes 1, 9, 11, 12, and 20.Variation in pointwise surface geometry between the averageControl femur and the femur geometry generated using thesesignificant shape modes was identical to that of the comparisonbetween average group femurs, suggesting that this set of shapemodes described all variability in femur articular geometrybetween groups (Fig. 12).
Differences between group means with respect to orientationor distance between subchondral bone surfaces of the femur andthe tibia were not statistically significant (Table 1). Quantitativeinvestigation of pointwise variation in average knee joint spacebetween groups demonstrated that the joint space for theIncidence group was smaller overall than the Control group,particularly in the lateral condylar region (Fig. 13).
4. Discussion
This study demonstrated that quantitative differences in tibiaand femur geometry were observed between surface modelsbased on clinical MRI data for subjects at risk of developing OA(i.e. Incidence group) and Control group subjects. Furthermore,SSM is capable of efficiently describing variability in this complexknee articular surface geometry. Differences in knee joint spacebetween groups did not appear to be related to non-weight-bearing alignment and relative orientation of the tibia and femur.Rather, results of the present study suggest that variability inindividual bone geometry may play a greater role in determiningjoint space geometry and underscore the importance of consider-ing geometry of the individual bones and other structures
Fig. 12. Pointwise differences in surface geometry between the average control
femur and the surface generated using the average femur modes 1, 9, 11, 12, and
20 weighting factors for the Incidence group. (Left: antero-medial view,
right: articular surface view.)
Table 1Comparison of knee alignment measures between Control and Incidence groups.
Clinical measure Control cohort
Flexion (deg.) �3.9572.63
Tibial rotation (deg.) �2.8474.74
Adduction (deg.) 0.2170.65
Lateral tibial displacement (mm) 1.9571.35
Anterior tibial drawer displacement (mm) �7.2371.48
Joint distraction (mm) 9.1771.57
Note: Values are given as mean7standard deviation.
comprising the knee joint in advancing the understanding ofknee OA.
Low fidelity measures of geometry are not capable of fullydescribing the complex three-dimensional joint geometry thatexists in the knee and other articularing joints. As such, subtlycomplex differences in joint geometry may not be detected and itmay be these differences that contribute most to differences inmechanics that may lead to the development or progression of kneeosteoarthritis. Numerous studies have demonstrated the role ofmechanical loading factors in onset and advancement of OA(Andriacchi et al., 2004; Arokoski et al., 2000; Sharma et al., 1999;Vos et al., 2009; Yang et al., 2009), and clinical studies havedemonstrated that joint incongruity is related to early cartilagedegeneration (Harris, 1986; Hohe et al., 2002; Mankin et al., 1971).
SSM provides a means of explicitly describing complete jointsurface geometry and allows for statistical investigation of thespatial variation in articular geometry and joint congruencebetween healthy subjects and those with clinical risk of developingor existing signs of osteoarthritis. Quantitative investigation of
Incidence cohort p-Value
�4.1872.49 0.51
�2.4075.27 0.89
0.3770.80 0.34
1.1171.61 0.10
�7.5372.43 0.54
8.2371.09 0.19
Fig. 13. Pointwise differences in average knee joint space between Control and
Incidence groups.
ARTICLE IN PRESS
T.L. Bredbenner et al. / Journal of Biomechanics 43 (2010) 1780–1786 1785
variation in average bone geometry between subjects in theControl and Incidence groups illustrates the regional nature of thecomplex differences in bone geometry and suggests that spatialgeometry variation may serve to further differentiate betweenpersons developing OA symptoms and those remaining healthy.
The small sample size of knees is an obvious limitation of thepresent study and it remains to be seen whether morphologicaldifferences observed between average Control and Incidencegroups have predictive value in the clinic. Additionally, it isunknown whether differences in knee geometry measures and theability to describe these differences using a small set of principalshape modes will be capable of disease status classification inlongitudinal data. Similarly, the Progression group in the OAIdatabase was not considered in the present study because weexpect that morphological changes between the Progressiongroup and the Control or Incidence groups may reflect effects ofdisease rather than provide predictive capability. Finally, jointalignment measures in the current study were determined fromMRI scan data collected during non-weight-bearing conditions.Although measures of tibia–femur alignment in the current studyprovide a means of comparison between participants, it isunknown how weight-bearing conditions would affect the resultsof this comparison. Work towards a more comprehensivetreatment of the knee anatomy geometry is necessary. Numerousstudies have demonstrated the important role of the meniscus incartilage mechanics and in protecting and preserving cartilageintegrity in both healthy individuals and those demonstratingearly and progressive signs of OA disease (Biswal et al., 2002;Cicuttini et al., 2002; Ding et al., 2007; Hunter et al., 2006;Pelletier et al., 2007). Further description of the structuralgeometry and the accompanying increase in variability of theknee structure will lead to changes in mechanical loading factorsexpected to lead to manifestation of OA and provide improvedpredictive capability. Application of multi-object SSM to compre-hensively describe relevant cartilage, meniscal, ligamentous, andmuscular structures along with the bone surfaces and subsequentanalysis of the kinematic and mechanical loading environment ofthe knee joint will likely provide a direct pathway towardsadvancing the understanding of OA etiology.
In conclusion, SSM provides a means of explicitly describingcomplete articular surface geometry and allows the complexspatial variation in joint surface geometry and joint congruencebetween healthy subjects and those with clinical risk of develop-ing or existing signs of OA to be statistically demonstrated. SSMmethods provide an innovative and important step towardsdescribing differences in knee surface and joint space geometrythat may directly lead to understanding and differentiatingbetween the causes and effects of OA.
Conflict of interest statement
The authors do not have any potential conflicts of interest todisclose.
Acknowledgements
The authors would like to acknowledge the Advisory Committeefor Research at the Southwest Research Institute for funding thiswork.
The OAI is a public-private partnership comprised of fivecontracts (N01-AR-2-2258; N01-AR-2-2259; N01-AR-2-2260;N01-AR-2-2261; N01-AR-2-2262) funded by the National Insti-tutes of Health, a branch of the Department of Health and HumanServices, and conducted by the OAI Study Investigators. Private
funding partners include Merck Research Laboratories; NovartisPharmaceuticals Corporation, GlaxoSmithKline; and Pfizer, Inc.Private sector funding for the OAI is managed by the Foundationfor the National Institutes of Health. This manuscript wasprepared using an OAI public use data set and does not necessarilyreflect the opinions or views of the OAI investigators, the NIH, orthe private funding partners.
References
Andriacchi, T.P., Mundermann, A., Smith, R.L., Alexander, E.J., Dyrby, C.O., Koo, S.,2004. A framework for the in vivo pathomechanics of osteoarthritis at theknee. Ann. Biomed. Eng. 32 (3), 447–457.
Andriacchi, T.P., Koo, S., Scanlan, S.F., 2009. Gait mechanics influence healthycartilage morphology and osteoarthritis of the knee. J. Bone Joint Surg. Am. 91,95–101.
Arokoski, J.P., Jurvelin, J.S., Vaatainen, U., Helminen, H.J., 2000. Normal andpathological adaptations of articular cartilage to joint loading. Scand. J. Med.Sci. Sports 10 (4), 186–198.
Babalola, K.O., Cootes, T.F., Patenaude, B., Rao, A., Jenkinson, M., 2006. Comparingthe similarity of statistical shape models using the Bhattacharya metric. Med.Image Comput. Comput. Assist. Interv. Int. Conf. Med. Image Comput. Comput.Assist. Interv. 9 (Pt 1), 142–150.
Bagge, E., Bjelle, A., Valkenburg, H.A., Svanborg, A., 1992. Prevalence of radio-graphic osteoarthritis in two elderly European populations. Rheumatol. Int. 12,33–38.
Benameur, S., Mignotte, M., Labelle, H., De Guise, J.A., 2005. A hierarchicalstatistical modeling approach for the unsupervised 3-D biplanar reconstruc-tion of the scoliotic spine. IEEE Trans. Biomed. Eng. 52 (12), 2041–2057.
Biscevic, M., Hebibovic, M., Smrke, D., 2005. Variations of femoral condyle shape.Coll. Antropol. 29 (2), 409–414.
Biswal, S., Hastie, T., Andriacchi, T.P., Bergman, G.A., Dillingham, M.F., Lang, P.,2002. Risk factors for progressive cartilage loss in the knee: a longitudinalmagnetic resonance imaging study in forty-three patients. Arthritis Rheum. 46(11), 2884–2892.
Bredbenner, T.L., Nicolella, D.P., 2007a. A methodology for bone strengthprediction using parametric statistical shape and density finite elementmodeling, Annual Meeting of the American Society for Bone and MineralResearch.
Bredbenner, T.L., Nicolella, D.P., 2007b. Simulation of fall loading using aprobabilistic shape-based finite element model of human femurs, SummerBioengineering Conference of the American Society of Mechanical Engineers.
Bredbenner, T.L., Nicolella, D.P., 2008. Statistical shape and density based finiteelement modeling of the human proximal femur, 54th Annual Meeting of theOrthopaedic Research Society.
Cicuttini, F.M., Forbes, A., Yuanyuan, W., Rush, G., Stuckey, S.L., 2002. Rate of kneecartilage loss after partial meniscectomy. J. Rheumatol. 29 (9), 1954–1956.
Courtney, P., Doherty, M., 2006. Current drug treatment of osteoarthritis inprimary care. Prescriber 17 (19), 48–56.
Ding, C., Martel-Pelletier, J., Pelletier, J.P., Abram, F., Raynauld, J.P., Cicuttini, F.,Jones, G., 2007. Meniscal tear as an osteoarthritis risk factor in a largely non-osteoarthritic cohort: a cross-sectional study. J. Rheumatol. 34, 776–784.
Dornaika, F., Ahlberg, J., 2006. Fitting 3D face models for tracking and activeappearance model training. Image Vision Comput. 24 (9), 1010–1024.
Draper, N.R., Smith, H., 1998. Applied Regression Analysis. Wiley-Interscience,Hoboken, NJ.
Felson, D.T., Lawrence, R.C., Hochberg, M.C., McAlindon, T., Dieppe, P.A., Minor,M.A., Blair, S.N., Berman, B.M., Fries, J.F., Weinberger, M., Lorig, K.R., Jacobs, J.J.,Goldberg, V., 2000a. Osteoarthritis: new insights. Part 1: the disease and itsrisk factors. Ann. Int. Med. 133 (8), 635–646.
Felson, D.T., Lawrence, R.C., Hochberg, M.C., McAlindon, T., Dieppe, P.A., Minor,M.A., Blair, S.N., Berman, B.M., Fries, J.F., Weinberger, M., Lorig, K.R., Jacobs, J.J.,Goldberg, V., 2000b. Osteoarthritis: new insights. Part 2: treatmentapproaches. Ann. Int. Med. 133 (9), 726–737.
Ferrarini, L., Palm, W.M., Olofsen, H., van Buchem, M.A., Reiber, J.H., Admiraal-Behloul, F., 2006. Shape differences of the brain ventricles in Alzheimer’sdisease. Neuroimage 32 (3), 1060–1069.
Grood, E.S., Suntay, W.J., 1983. A joint coordinate system for the clinicaldescription of three-dimensional motions: application to the knee. J. Biomech.Eng. 105 (2), 136–144.
Harris, W.H., 1986. Etiology of osteoarthritis of the hip. Clin. Orthop. Relat. Res.213, 20–33.
Hashemi, J., Chandrashekar, N., Gill, B., Beynnon, B.D., Slauterbeck, J.R., Schutt Jr.,R.C., Mansouri, H., Dabezies, E., 2008. The geometry of the tibial plateau and itsinfluence on the biomechanics of the tibiofemoral joint. J. Bone Joint Surg. Am.90 (12), 2724–2734.
Heimann, T., Oguz, I., Wolf, I., Styner, M., Meinzer, H., 2006. Implementing theautomatic generation of 3D statistical shape models with ITK. The InsightJournal—2006 MICCAI Open Science Workshop.
Hohe, J., Ateshian, G., Reiser, M., Englmeier, K.H., Eckstein, F., 2002. Surface size,curvature analysis, and assessment of knee joint incongruity with MRI in vivo.Magn. Reson. Med. 47 (3), 554–561.
ARTICLE IN PRESS
T.L. Bredbenner et al. / Journal of Biomechanics 43 (2010) 1780–17861786
Hunter, D.J., Zhang, Y.Q., Niu, J.B., Tu, X., Amin, S., Clancy, M., Guermazi, A.,Grigorian, M., Gale, D., Felson, D.T., 2006. The association of meniscalpathologic changes with cartilage loss in symptomatic knee osteoarthritis.Arthritis Rheum. 54 (3), 795–801.
Hutton, C.W., Higgs, E.R., Jackson, P.C., Watt, I., Dieppe, P.A., 1986. 99M TcHMDPbone scanning in generalized nodal osteoarthritis. II. The four-hour bone scanimage predicts radiographic change. Ann. Rheum. Dis. 45, 622–626.
Kadaba, M.P., Ramakrishnan, H.K., Wootten, M.E., Gainey, J., Gorton, G., Cochran,G.V., 1989. Repeatability of kinematic, kinetic, and electromyographic data innormal adult gait. J. Orthop. Res. 7 (6), 849–860.
Koikkalainen, J., Hirvonen, J., Nyman, M., Lotjonen, J., Hietala, J., Ruotsalainen, U.,2007. Shape variability of the human striatum—effects of age and gender.Neuroimage 34 (1), 85–93.
Kuettner, K., Goldberg, V.M., 1995. Introduction. In: Kuettner, K., Goldberg, V.M.(Eds.), Osteoarthritic Disorders. American Academy of Orthopaedic Surgeons,Rosemont, IL, pp. xxi–xxv.
Lorenz, C., Krahnstover, N., 2000. Generation of point-based 3D statistical shapemodels for anatomical objects. Comput. Vision Image Understanding 77 (2),175–191.
Mankin, H.J., Dorfman, H., Lippiello, L., Zarins, A., 1971. Biochemical and metabolicabnormalities in articular cartilage from osteo-arthritic human hips. II.Correlation of morphology with biochemical and metabolic data. J. Bone JointSurg. Am. 53 (3), 523–537.
Matsuda, S., Miura, H., Nagamine, R., Mawatari, T., Tokunaga, M., Nabeyama, R.,Iwamoto, Y., 2004. Anatomical analysis of the femoral condyle in normal andosteoarthritic knees. J. Orthop. Res. 22 (1), 104–109.
Mow, V.C., Ratcliffe, A., 1997. Structure and function of articular cartilage andmeniscus. In: Mow, V.C., Hayes, W.C. (Eds.), Basic Orthopaedic Biomechanics.Lippincott Raven, New York.
Newell, R.S., Hubley-Kozey, C.L., Stanish, W.D., Deluzio, K.J., 2008. Detectingdifferences between asymptomatic and osteoarthritic gait is influenced bychanging the knee adduction moment model. Gait Posture 27, 485–492.
Osteoarthritis Initiative, 2006. MRI Procedure Manual for Examinations of theKnee and Thigh. The Osteoarthritis Initiative: A Knee Health Study.
Pelletier, J.P., Raynauld, J.P., Berthiaume, M.J., Abram, F., Choquette, D., Haraoui, B.,Beary, J.F., Cline, G.A., Meyer, J.M., Martel-Pelletier, J., 2007. Risk factorsassociated with the loss of cartilage volume on weight-bearing areas in kneeosteoarthritis patients assessed by quantitative magnetic resonance imaging: alongitudinal study. Arthritis Res. Ther. 9 (4), R74.
Rueckert, D., Frangi, A.F., Schnabel, J.A., 2003. Automatic construction of 3-Dstatistical deformation models of the brain using nonrigid registration. IEEETrans. Med. Imaging 22 (8), 1014–1025.
Shan, Z.Y., Parra, C., Ji, Q., Jain, J., Reddick, W.E., 2006. A knowledge-guided activemodel method of cortical structure segmentation on pediatric MR images.J. Magn. Reson. Imaging 24 (4), 779–789.
Sharma, L., Lou, C., Felson, D.T., Dunlop, D.D., Kirwan-Mellis, G., Hayes, K.W.,Weinrach, D., Buchanan, T.S., 1999. Laxity in healthy and osteoarthritic knees.Arthritis Rheum. 42 (5), 861–870.
Shepstone, L., Rogers, J., Kirwan, J., Silverman, B., 1999. The shape of the distalfemur: a palaeopathological comparison of eburnated and non-eburnatedfemora. Ann. Rheum. Dis. 58 (2), 72–78.
Teichtahl, A.J., Parkins, K., Hanna, F., Wluka, A.E., Urquhart, D.M., English, D.R.,Giles, G.G., Cicuttini, F.M., 2007. The relationship between the angle of thetrochlear groove and patella cartilage and bone morphology—a cross-sectionalstudy of healthy adults. Osteoarthritis Cartilage 15 (10), 1158–1162.
United Nations, 2009. World Population Prospects: The 2008 Revision. PopulationDivision of the Department of Economic and Social Affairs of the UnitedNations.
Van Saase, J.L.C.M., van Romunde, L.K.J., Cats, A., Vandenbroucke, J.P., Valkenburg,H.A., 1989. Epidemiology of osteoarthritis: zoetermeer survey. Comparison ofradiological osteoarthritis in a Dutch population with that in 10 otherpopulations. Ann. Rheum. Dis. 48, 271–280.
Vos, P., Interma, F., van El, B., DeGroot, J., Bijlsma, J.W., Lafeber, F., Mastbergen, S.,2009. Does loading influence the severity of cartilage degeneration in thecanine Groove-model of OA? J Orthop. Res. 27 (10), 1332–1338.
Yang, N., Nayeb-Hashemi, H., Canavan, P.K., 2009. The combined effect of frontalplane tibiofemoral knee angle and meniscectomy on the cartilage contactstresses and strains. Ann. Biomed. Eng. 37 (11), 2360–2372.